Schulenburg, TX Map & Demographics
Schulenburg Map
Schulenburg Overview
$24,189
PER CAPITA INCOME
$71,806
AVG FAMILY INCOME
$49,969
AVG HOUSEHOLD INCOME
6.2%
WAGE / INCOME GAP [ % ]
93.8¢/ $1
WAGE / INCOME GAP [ $ ]
0.43
INEQUALITY / GINI INDEX
2,679
TOTAL POPULATION
1,301
MALE POPULATION
1,378
FEMALE POPULATION
94.41
MALES / 100 FEMALES
105.92
FEMALES / 100 MALES
40.9
MEDIAN AGE
3.7
AVG FAMILY SIZE
2.7
AVG HOUSEHOLD SIZE
1,123
LABOR FORCE [ PEOPLE ]
56.6%
PERCENT IN LABOR FORCE
6.3%
UNEMPLOYMENT RATE
Schulenburg Zip Codes
Schulenburg Area Codes
Income in Schulenburg
Income Overview in Schulenburg
Per Capita Income in Schulenburg is $24,189, while median incomes of families and households are $71,806 and $49,969 respectively.
| Characteristic | Number | Measure |
| Per Capita Income | 2,679 | $24,189 |
| Median Family Income | 556 | $71,806 |
| Mean Family Income | 556 | $73,556 |
| Median Household Income | 901 | $49,969 |
| Mean Household Income | 901 | $63,965 |
| Income Deficit | 556 | $0 |
| Wage / Income Gap (%) | 2,679 | 6.15% |
| Wage / Income Gap ($) | 2,679 | 93.85¢ per $1 |
| Gini / Inequality Index | 2,679 | 0.43 |
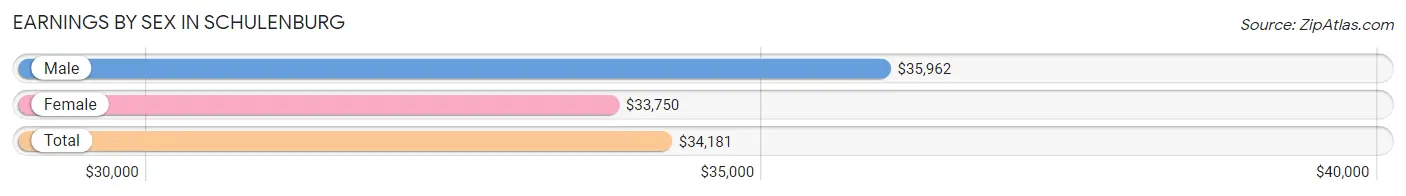
Earnings by Sex in Schulenburg
Average Earnings in Schulenburg are $34,181, $35,962 for men and $33,750 for women, a difference of 6.1%.
| Sex | Number | Average Earnings |
| Male | 604 (52.3%) | $35,962 |
| Female | 550 (47.7%) | $33,750 |
| Total | 1,154 (100.0%) | $34,181 |
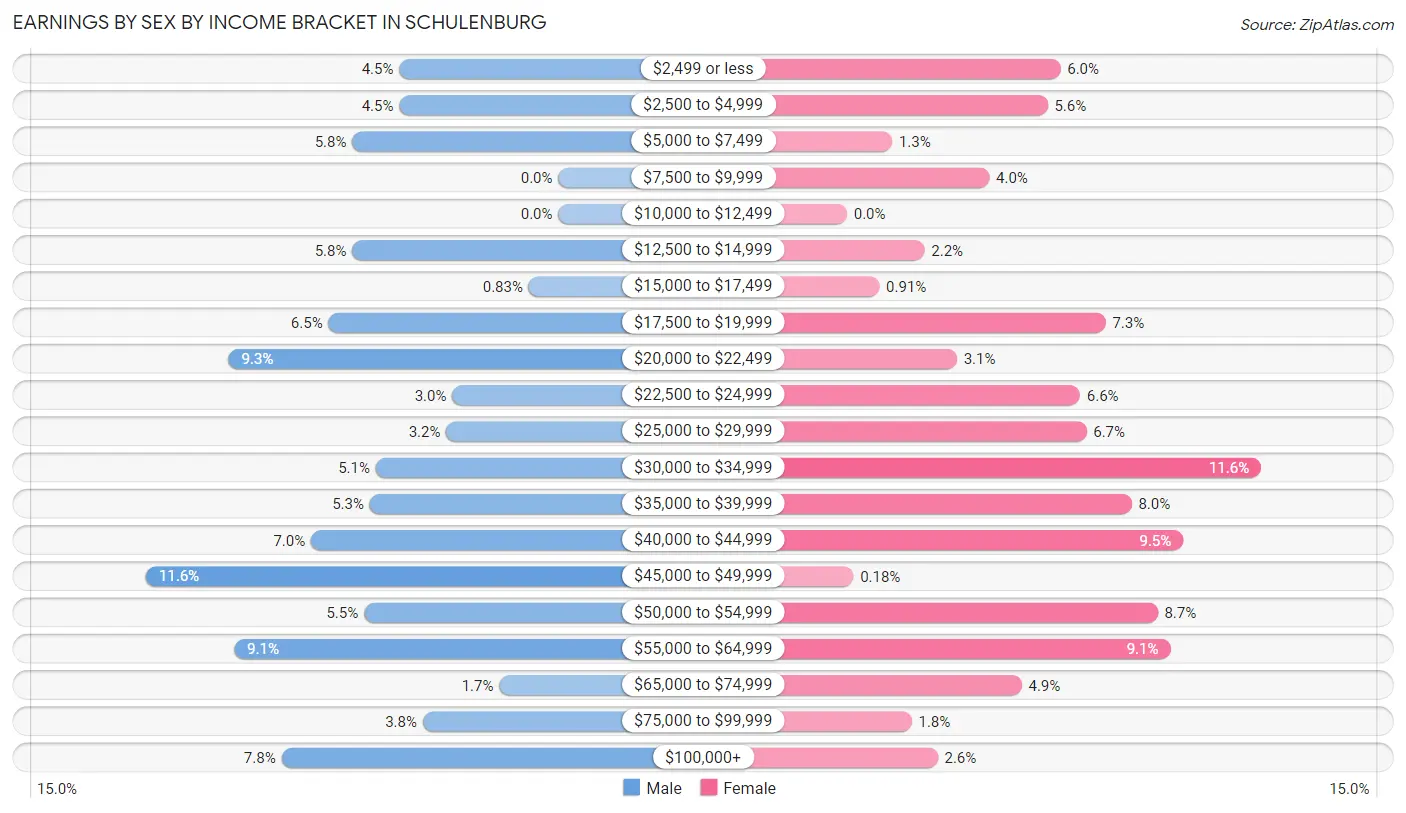
Earnings by Sex by Income Bracket in Schulenburg
The most common earnings brackets in Schulenburg are $45,000 to $49,999 for men (70 | 11.6%) and $30,000 to $34,999 for women (64 | 11.6%).
| Income | Male | Female |
| $2,499 or less | 27 (4.5%) | 33 (6.0%) |
| $2,500 to $4,999 | 27 (4.5%) | 31 (5.6%) |
| $5,000 to $7,499 | 35 (5.8%) | 7 (1.3%) |
| $7,500 to $9,999 | 0 (0.0%) | 22 (4.0%) |
| $10,000 to $12,499 | 0 (0.0%) | 0 (0.0%) |
| $12,500 to $14,999 | 35 (5.8%) | 12 (2.2%) |
| $15,000 to $17,499 | 5 (0.8%) | 5 (0.9%) |
| $17,500 to $19,999 | 39 (6.5%) | 40 (7.3%) |
| $20,000 to $22,499 | 56 (9.3%) | 17 (3.1%) |
| $22,500 to $24,999 | 18 (3.0%) | 36 (6.6%) |
| $25,000 to $29,999 | 19 (3.2%) | 37 (6.7%) |
| $30,000 to $34,999 | 31 (5.1%) | 64 (11.6%) |
| $35,000 to $39,999 | 32 (5.3%) | 44 (8.0%) |
| $40,000 to $44,999 | 42 (7.0%) | 52 (9.5%) |
| $45,000 to $49,999 | 70 (11.6%) | 1 (0.2%) |
| $50,000 to $54,999 | 33 (5.5%) | 48 (8.7%) |
| $55,000 to $64,999 | 55 (9.1%) | 50 (9.1%) |
| $65,000 to $74,999 | 10 (1.7%) | 27 (4.9%) |
| $75,000 to $99,999 | 23 (3.8%) | 10 (1.8%) |
| $100,000+ | 47 (7.8%) | 14 (2.5%) |
| Total | 604 (100.0%) | 550 (100.0%) |
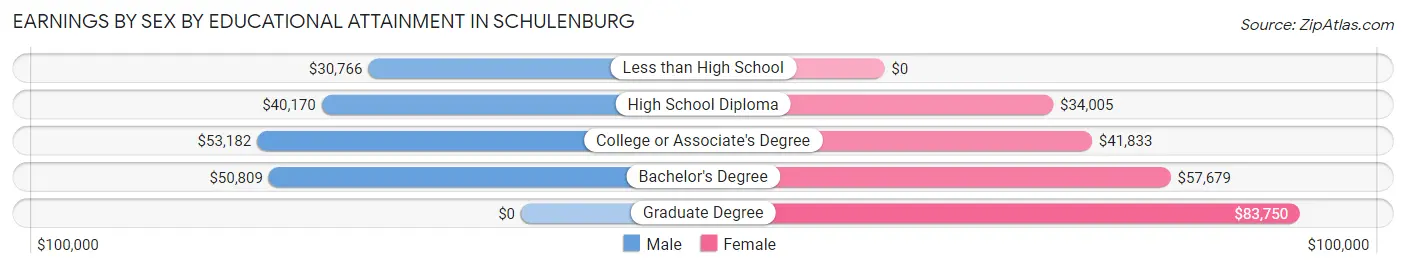
Earnings by Sex by Educational Attainment in Schulenburg
Average earnings in Schulenburg are $41,757 for men and $35,038 for women, a difference of 16.1%. Men with an educational attainment of college or associate's degree enjoy the highest average annual earnings of $53,182, while those with less than high school education earn the least with $30,766. Women with an educational attainment of graduate degree earn the most with the average annual earnings of $83,750, while those with high school diploma education have the smallest earnings of $34,005.
| Educational Attainment | Male Income | Female Income |
| Less than High School | $30,766 | $0 |
| High School Diploma | $40,170 | $34,005 |
| College or Associate's Degree | $53,182 | $41,833 |
| Bachelor's Degree | $50,809 | $57,679 |
| Graduate Degree | - | - |
| Total | $41,757 | $35,038 |
Family Income in Schulenburg
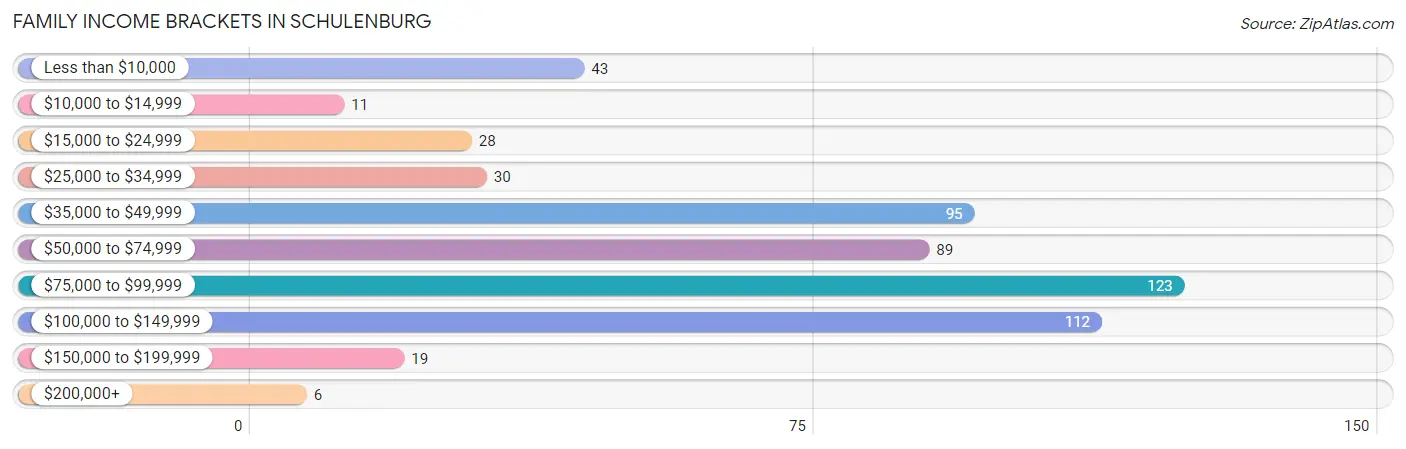
Family Income Brackets in Schulenburg
According to the Schulenburg family income data, there are 123 families falling into the $75,000 to $99,999 income range, which is the most common income bracket and makes up 22.1% of all families. Conversely, the $200,000+ income bracket is the least frequent group with only 6 families (1.1%) belonging to this category.
| Income Bracket | # Families | % Families |
| Less than $10,000 | 43 | 7.7% |
| $10,000 to $14,999 | 11 | 2.0% |
| $15,000 to $24,999 | 28 | 5.0% |
| $25,000 to $34,999 | 30 | 5.4% |
| $35,000 to $49,999 | 95 | 17.1% |
| $50,000 to $74,999 | 89 | 16.0% |
| $75,000 to $99,999 | 123 | 22.1% |
| $100,000 to $149,999 | 112 | 20.1% |
| $150,000 to $199,999 | 19 | 3.4% |
| $200,000+ | 6 | 1.1% |
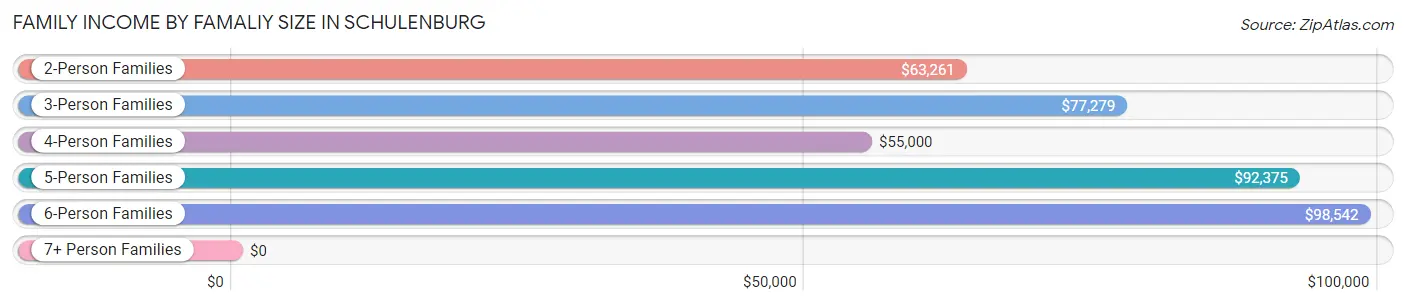
Family Income by Famaliy Size in Schulenburg
6-person families (15 | 2.7%) account for the highest median family income in Schulenburg with $98,542 per family, while 2-person families (268 | 48.2%) have the highest median income of $31,630 per family member.
| Income Bracket | # Families | Median Income |
| 2-Person Families | 268 (48.2%) | $63,261 |
| 3-Person Families | 79 (14.2%) | $77,279 |
| 4-Person Families | 122 (21.9%) | $55,000 |
| 5-Person Families | 72 (13.0%) | $92,375 |
| 6-Person Families | 15 (2.7%) | $98,542 |
| 7+ Person Families | 0 (0.0%) | $0 |
| Total | 556 (100.0%) | $71,806 |
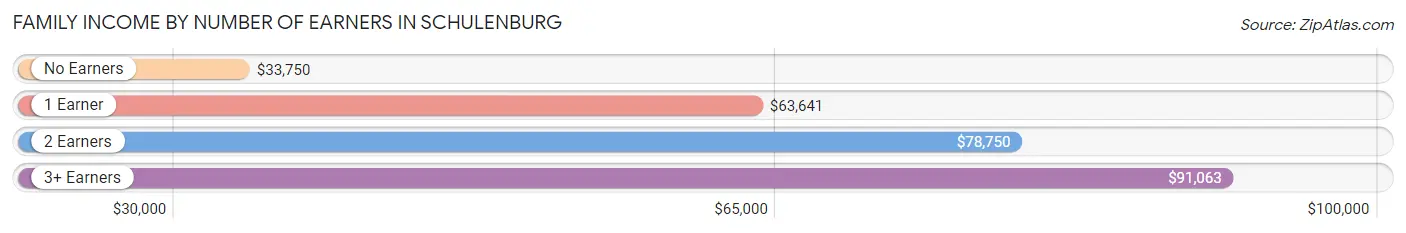
Family Income by Number of Earners in Schulenburg
The median family income in Schulenburg is $71,806, with families comprising 3+ earners (45) having the highest median family income of $91,063, while families with no earners (112) have the lowest median family income of $33,750, accounting for 8.1% and 20.1% of families, respectively.
| Number of Earners | # Families | Median Income |
| No Earners | 112 (20.1%) | $33,750 |
| 1 Earner | 117 (21.0%) | $63,641 |
| 2 Earners | 282 (50.7%) | $78,750 |
| 3+ Earners | 45 (8.1%) | $91,063 |
| Total | 556 (100.0%) | $71,806 |
Household Income in Schulenburg
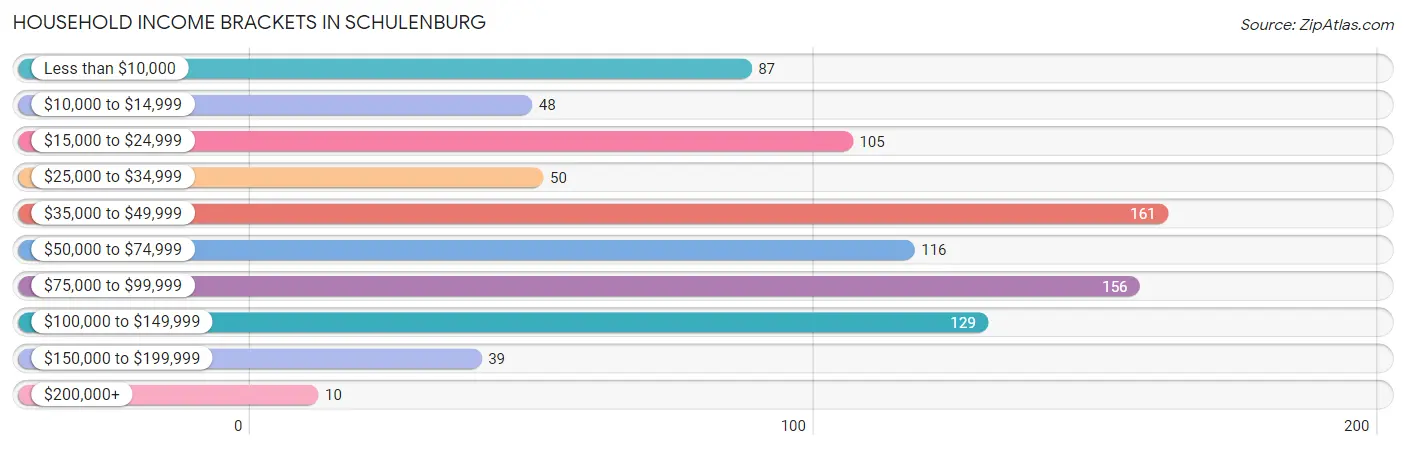
Household Income Brackets in Schulenburg
With 161 households falling in the category, the $35,000 to $49,999 income range is the most frequent in Schulenburg, accounting for 17.9% of all households. In contrast, only 10 households (1.1%) fall into the $200,000+ income bracket, making it the least populous group.
| Income Bracket | # Households | % Households |
| Less than $10,000 | 87 | 9.7% |
| $10,000 to $14,999 | 48 | 5.3% |
| $15,000 to $24,999 | 105 | 11.7% |
| $25,000 to $34,999 | 50 | 5.5% |
| $35,000 to $49,999 | 161 | 17.9% |
| $50,000 to $74,999 | 116 | 12.9% |
| $75,000 to $99,999 | 156 | 17.3% |
| $100,000 to $149,999 | 129 | 14.3% |
| $150,000 to $199,999 | 39 | 4.3% |
| $200,000+ | 10 | 1.1% |
Household Income by Householder Age in Schulenburg
The median household income in Schulenburg is $49,969, with the highest median household income of $90,813 found in the 15 to 24 years age bracket for the primary householder. A total of 61 households (6.8%) fall into this category. Meanwhile, the 65+ years age bracket for the primary householder has the lowest median household income of $35,417, with 300 households (33.3%) in this group.
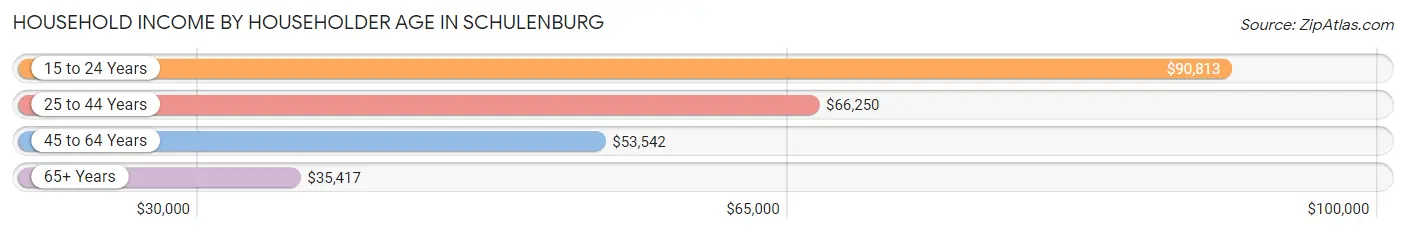
| Income Bracket | # Households | Median Income |
| 15 to 24 Years | 61 (6.8%) | $90,813 |
| 25 to 44 Years | 206 (22.9%) | $66,250 |
| 45 to 64 Years | 334 (37.1%) | $53,542 |
| 65+ Years | 300 (33.3%) | $35,417 |
| Total | 901 (100.0%) | $49,969 |
Poverty in Schulenburg
Income Below Poverty by Sex and Age in Schulenburg
With 12.9% poverty level for males and 19.9% for females among the residents of Schulenburg, 12 to 14 year old males and 6 to 11 year old females are the most vulnerable to poverty, with 17 males (29.8%) and 56 females (55.4%) in their respective age groups living below the poverty level.
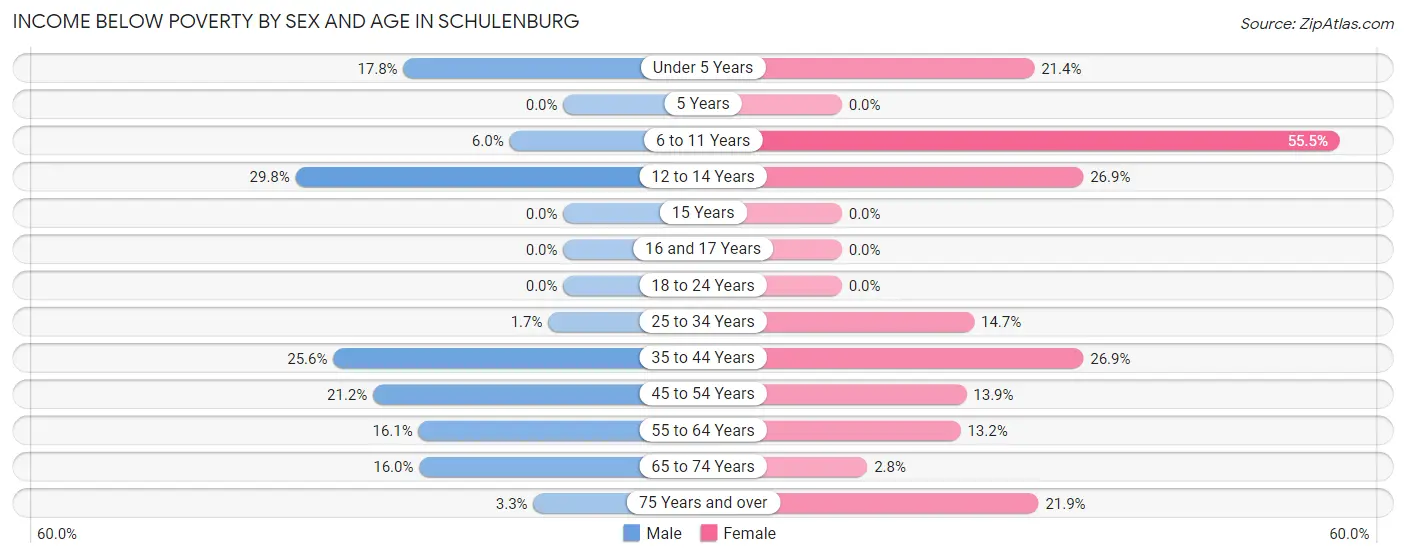
| Age Bracket | Male | Female |
| Under 5 Years | 26 (17.8%) | 24 (21.4%) |
| 5 Years | 0 (0.0%) | 0 (0.0%) |
| 6 to 11 Years | 6 (6.0%) | 56 (55.4%) |
| 12 to 14 Years | 17 (29.8%) | 32 (26.9%) |
| 15 Years | 0 (0.0%) | 0 (0.0%) |
| 16 and 17 Years | 0 (0.0%) | 0 (0.0%) |
| 18 to 24 Years | 0 (0.0%) | 0 (0.0%) |
| 25 to 34 Years | 2 (1.7%) | 19 (14.7%) |
| 35 to 44 Years | 41 (25.6%) | 39 (26.9%) |
| 45 to 54 Years | 25 (21.2%) | 19 (13.9%) |
| 55 to 64 Years | 25 (16.1%) | 23 (13.2%) |
| 65 to 74 Years | 17 (16.0%) | 3 (2.8%) |
| 75 Years and over | 2 (3.3%) | 30 (21.9%) |
| Total | 161 (12.9%) | 245 (19.9%) |
Income Above Poverty by Sex and Age in Schulenburg
According to the poverty statistics in Schulenburg, males aged 5 years and females aged 16 and 17 years are the age groups that are most secure financially, with 100.0% of males and 100.0% of females in these age groups living above the poverty line.
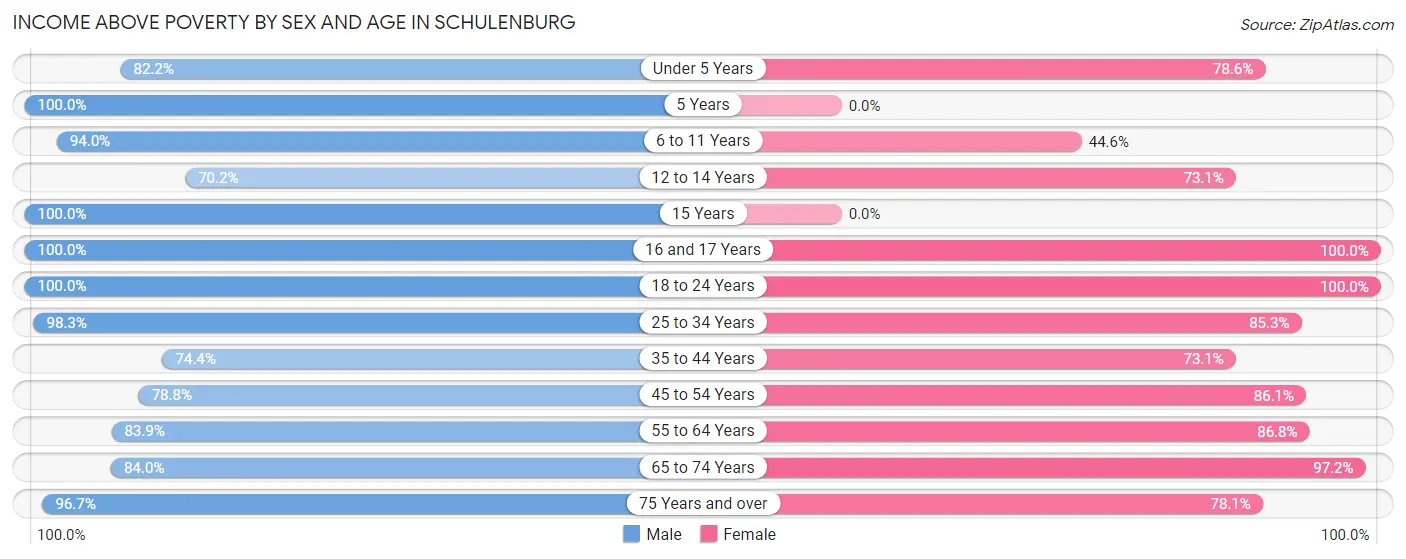
| Age Bracket | Male | Female |
| Under 5 Years | 120 (82.2%) | 88 (78.6%) |
| 5 Years | 42 (100.0%) | 0 (0.0%) |
| 6 to 11 Years | 94 (94.0%) | 45 (44.6%) |
| 12 to 14 Years | 40 (70.2%) | 87 (73.1%) |
| 15 Years | 18 (100.0%) | 0 (0.0%) |
| 16 and 17 Years | 34 (100.0%) | 22 (100.0%) |
| 18 to 24 Years | 132 (100.0%) | 50 (100.0%) |
| 25 to 34 Years | 117 (98.3%) | 110 (85.3%) |
| 35 to 44 Years | 119 (74.4%) | 106 (73.1%) |
| 45 to 54 Years | 93 (78.8%) | 118 (86.1%) |
| 55 to 64 Years | 130 (83.9%) | 151 (86.8%) |
| 65 to 74 Years | 89 (84.0%) | 103 (97.2%) |
| 75 Years and over | 58 (96.7%) | 107 (78.1%) |
| Total | 1,086 (87.1%) | 987 (80.1%) |
Income Below Poverty Among Married-Couple Families in Schulenburg
The poverty statistics for married-couple families in Schulenburg show that 12.0% or 44 of the total 366 families live below the poverty line. Families with 3 or 4 children have the highest poverty rate of 25.4%, comprising of 17 families. On the other hand, families with no children have the lowest poverty rate of 4.3%, which includes 8 families.
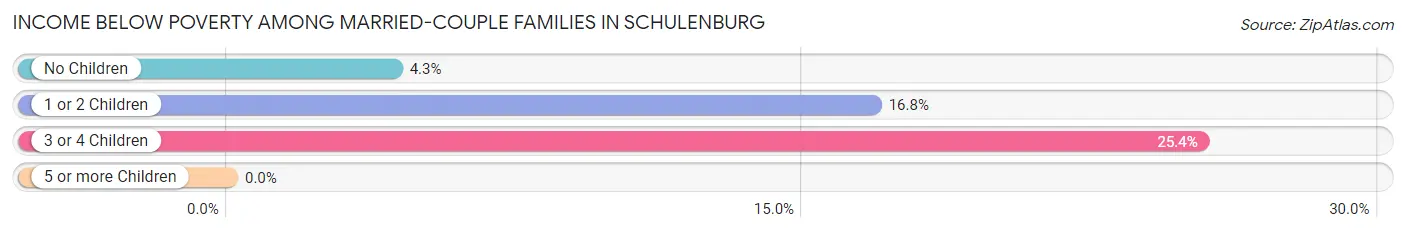
| Children | Above Poverty | Below Poverty |
| No Children | 178 (95.7%) | 8 (4.3%) |
| 1 or 2 Children | 94 (83.2%) | 19 (16.8%) |
| 3 or 4 Children | 50 (74.6%) | 17 (25.4%) |
| 5 or more Children | 0 (0.0%) | 0 (0.0%) |
| Total | 322 (88.0%) | 44 (12.0%) |
Income Below Poverty Among Single-Parent Households in Schulenburg
According to the poverty data in Schulenburg, 9.1% or 6 single-father households and 17.7% or 22 single-mother households are living below the poverty line. Among single-father households, those with no children have the highest poverty rate, with 6 households (26.1%) experiencing poverty. Likewise, among single-mother households, those with 3 or 4 children have the highest poverty rate, with 22 households (100.0%) falling below the poverty line.
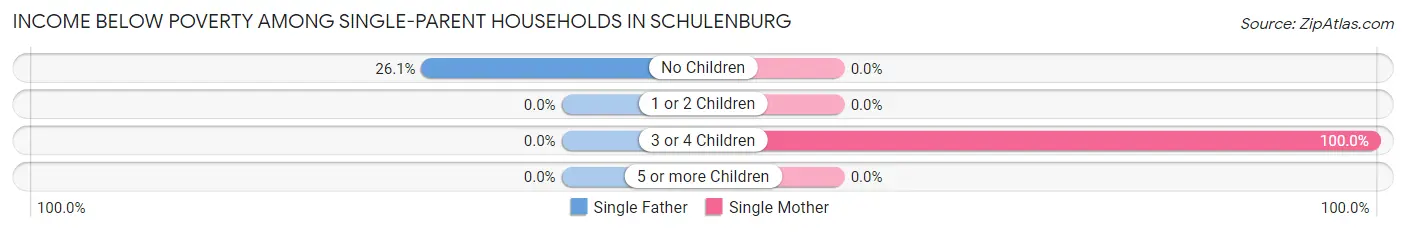
| Children | Single Father | Single Mother |
| No Children | 6 (26.1%) | 0 (0.0%) |
| 1 or 2 Children | 0 (0.0%) | 0 (0.0%) |
| 3 or 4 Children | 0 (0.0%) | 22 (100.0%) |
| 5 or more Children | 0 (0.0%) | 0 (0.0%) |
| Total | 6 (9.1%) | 22 (17.7%) |
Income Below Poverty Among Married-Couple vs Single-Parent Households in Schulenburg
The poverty data for Schulenburg shows that 44 of the married-couple family households (12.0%) and 28 of the single-parent households (14.7%) are living below the poverty level. Within the married-couple family households, those with 3 or 4 children have the highest poverty rate, with 17 households (25.4%) falling below the poverty line. Among the single-parent households, those with 3 or 4 children have the highest poverty rate, with 22 household (100.0%) living below poverty.
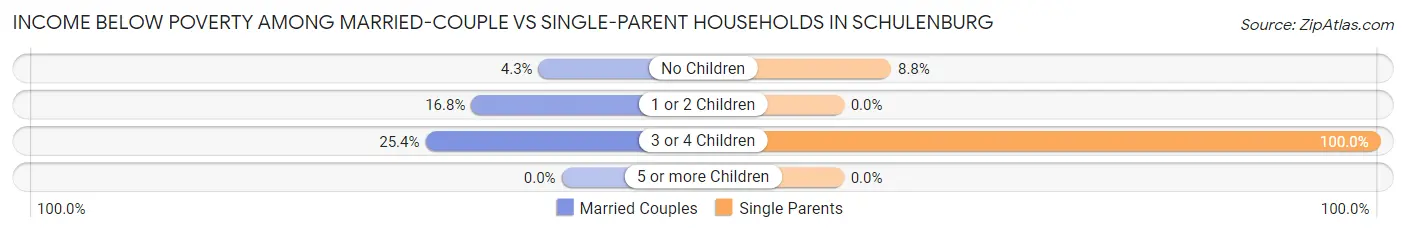
| Children | Married-Couple Families | Single-Parent Households |
| No Children | 8 (4.3%) | 6 (8.8%) |
| 1 or 2 Children | 19 (16.8%) | 0 (0.0%) |
| 3 or 4 Children | 17 (25.4%) | 22 (100.0%) |
| 5 or more Children | 0 (0.0%) | 0 (0.0%) |
| Total | 44 (12.0%) | 28 (14.7%) |
Race in Schulenburg
The most populous races in Schulenburg are White / Caucasian (1,822 | 68.0%), Hispanic or Latino (1,019 | 38.0%), and Black / African American (374 | 14.0%).
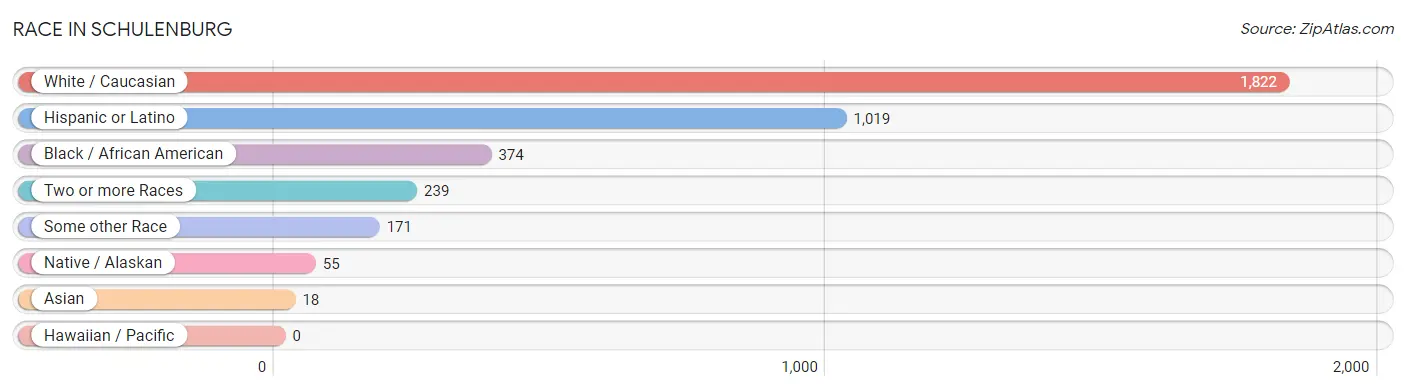
| Race | # Population | % Population |
| Asian | 18 | 0.7% |
| Black / African American | 374 | 14.0% |
| Hawaiian / Pacific | 0 | 0.0% |
| Hispanic or Latino | 1,019 | 38.0% |
| Native / Alaskan | 55 | 2.1% |
| White / Caucasian | 1,822 | 68.0% |
| Two or more Races | 239 | 8.9% |
| Some other Race | 171 | 6.4% |
| Total | 2,679 | 100.0% |
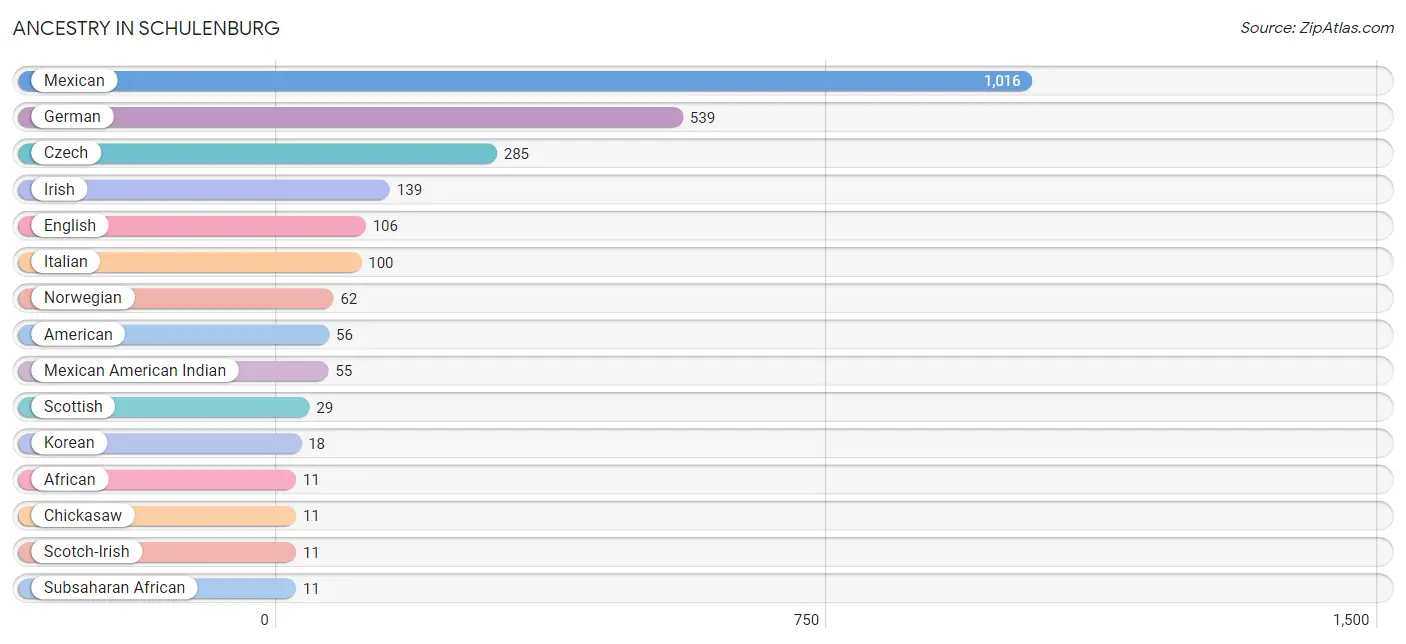
Ancestry in Schulenburg
The most populous ancestries reported in Schulenburg are Mexican (1,016 | 37.9%), German (539 | 20.1%), Czech (285 | 10.6%), Irish (139 | 5.2%), and English (106 | 4.0%), together accounting for 77.8% of all Schulenburg residents.
| Ancestry | # Population | % Population |
| African | 11 | 0.4% |
| American | 56 | 2.1% |
| Austrian | 4 | 0.2% |
| British | 8 | 0.3% |
| Chickasaw | 11 | 0.4% |
| Czech | 285 | 10.6% |
| Czechoslovakian | 4 | 0.2% |
| English | 106 | 4.0% |
| French | 6 | 0.2% |
| German | 539 | 20.1% |
| Irish | 139 | 5.2% |
| Italian | 100 | 3.7% |
| Korean | 18 | 0.7% |
| Mexican | 1,016 | 37.9% |
| Mexican American Indian | 55 | 2.1% |
| Norwegian | 62 | 2.3% |
| Scandinavian | 5 | 0.2% |
| Scotch-Irish | 11 | 0.4% |
| Scottish | 29 | 1.1% |
| Spaniard | 3 | 0.1% |
| Subsaharan African | 11 | 0.4% |
| Yaqui | 8 | 0.3% | View All 22 Rows |
Immigrants in Schulenburg
The most numerous immigrant groups reported in Schulenburg came from Central America (397 | 14.8%), Latin America (397 | 14.8%), Mexico (397 | 14.8%), Canada (14 | 0.5%), and Europe (11 | 0.4%), together accounting for 45.4% of all Schulenburg residents.
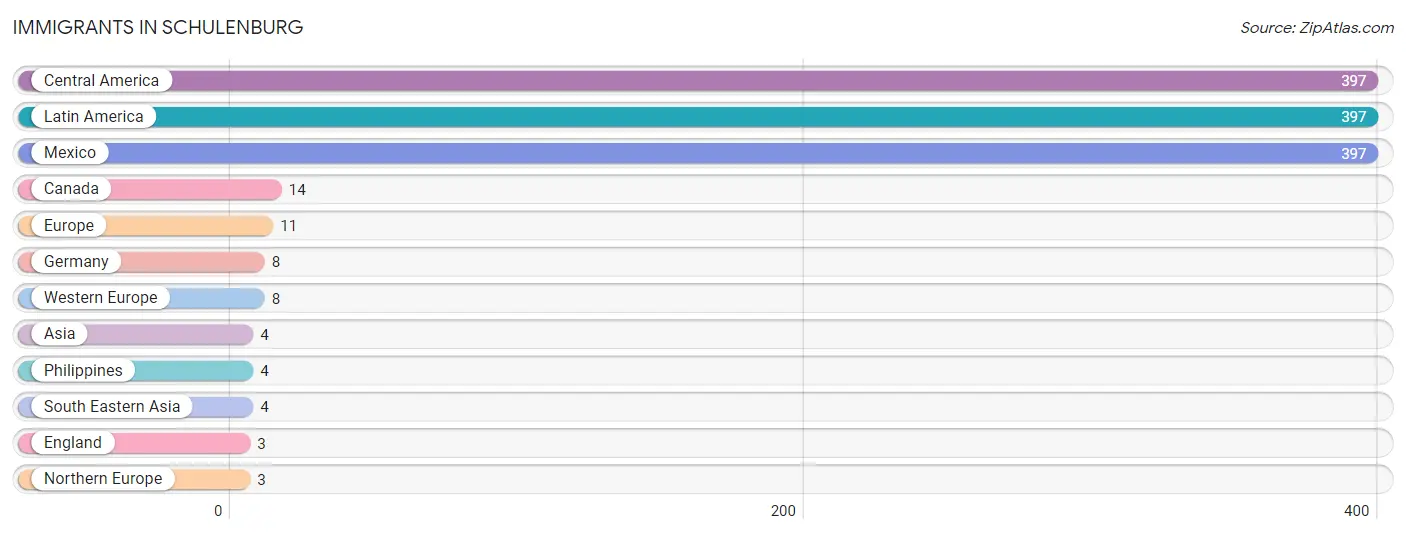
| Immigration Origin | # Population | % Population |
| Asia | 4 | 0.2% |
| Canada | 14 | 0.5% |
| Central America | 397 | 14.8% |
| England | 3 | 0.1% |
| Europe | 11 | 0.4% |
| Germany | 8 | 0.3% |
| Latin America | 397 | 14.8% |
| Mexico | 397 | 14.8% |
| Northern Europe | 3 | 0.1% |
| Philippines | 4 | 0.2% |
| South Eastern Asia | 4 | 0.2% |
| Western Europe | 8 | 0.3% | View All 12 Rows |
Sex and Age in Schulenburg
Sex and Age in Schulenburg
The most populous age groups in Schulenburg are Under 5 Years (146 | 11.2%) for men and 10 to 14 Years (178 | 12.9%) for women.
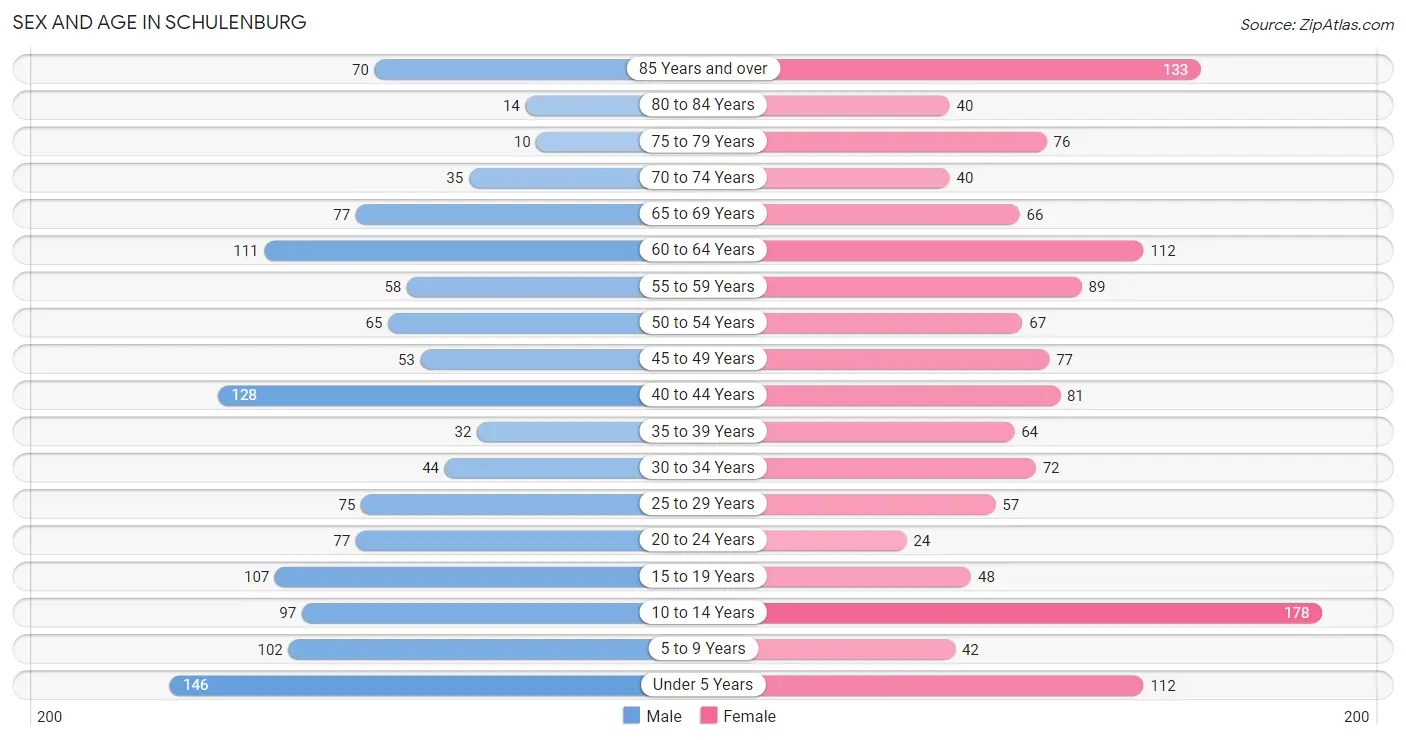
| Age Bracket | Male | Female |
| Under 5 Years | 146 (11.2%) | 112 (8.1%) |
| 5 to 9 Years | 102 (7.8%) | 42 (3.0%) |
| 10 to 14 Years | 97 (7.5%) | 178 (12.9%) |
| 15 to 19 Years | 107 (8.2%) | 48 (3.5%) |
| 20 to 24 Years | 77 (5.9%) | 24 (1.7%) |
| 25 to 29 Years | 75 (5.8%) | 57 (4.1%) |
| 30 to 34 Years | 44 (3.4%) | 72 (5.2%) |
| 35 to 39 Years | 32 (2.5%) | 64 (4.6%) |
| 40 to 44 Years | 128 (9.8%) | 81 (5.9%) |
| 45 to 49 Years | 53 (4.1%) | 77 (5.6%) |
| 50 to 54 Years | 65 (5.0%) | 67 (4.9%) |
| 55 to 59 Years | 58 (4.5%) | 89 (6.5%) |
| 60 to 64 Years | 111 (8.5%) | 112 (8.1%) |
| 65 to 69 Years | 77 (5.9%) | 66 (4.8%) |
| 70 to 74 Years | 35 (2.7%) | 40 (2.9%) |
| 75 to 79 Years | 10 (0.8%) | 76 (5.5%) |
| 80 to 84 Years | 14 (1.1%) | 40 (2.9%) |
| 85 Years and over | 70 (5.4%) | 133 (9.7%) |
| Total | 1,301 (100.0%) | 1,378 (100.0%) |
Families and Households in Schulenburg
Median Family Size in Schulenburg
The median family size in Schulenburg is 3.67 persons per family, with single male/father families (66 | 11.9%) accounting for the largest median family size of 3.82 persons per family. On the other hand, married-couple families (366 | 65.8%) represent the smallest median family size with 3.61 persons per family.
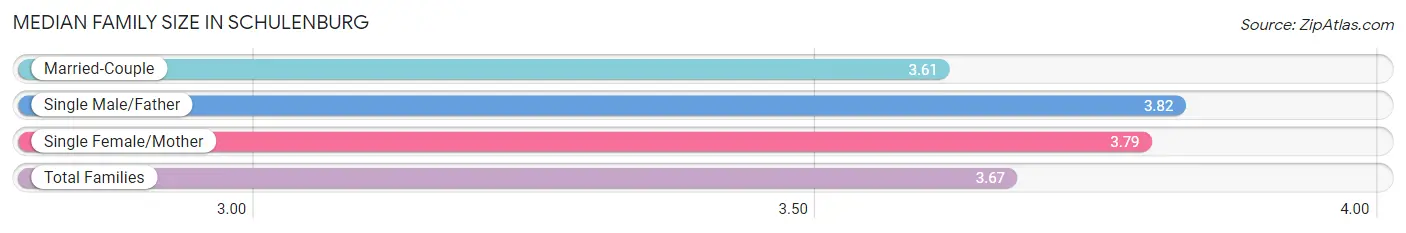
| Family Type | # Families | Family Size |
| Married-Couple | 366 (65.8%) | 3.61 |
| Single Male/Father | 66 (11.9%) | 3.82 |
| Single Female/Mother | 124 (22.3%) | 3.79 |
| Total Families | 556 (100.0%) | 3.67 |
Median Household Size in Schulenburg
The median household size in Schulenburg is 2.73 persons per household, with single male/father households (66 | 7.3%) accounting for the largest median household size of 4.18 persons per household. non-family households (345 | 38.3%) represent the smallest median household size with 1.07 persons per household.
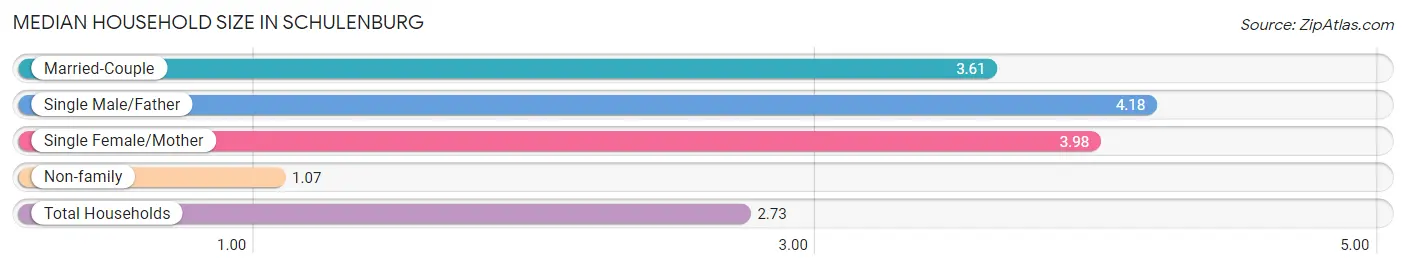
| Household Type | # Households | Household Size |
| Married-Couple | 366 (40.6%) | 3.61 |
| Single Male/Father | 66 (7.3%) | 4.18 |
| Single Female/Mother | 124 (13.8%) | 3.98 |
| Non-family | 345 (38.3%) | 1.07 |
| Total Households | 901 (100.0%) | 2.73 |
Household Size by Marriage Status in Schulenburg
Out of a total of 901 households in Schulenburg, 556 (61.7%) are family households, while 345 (38.3%) are nonfamily households. The most numerous type of family households are 2-person households, comprising 268, and the most common type of nonfamily households are 1-person households, comprising 327.
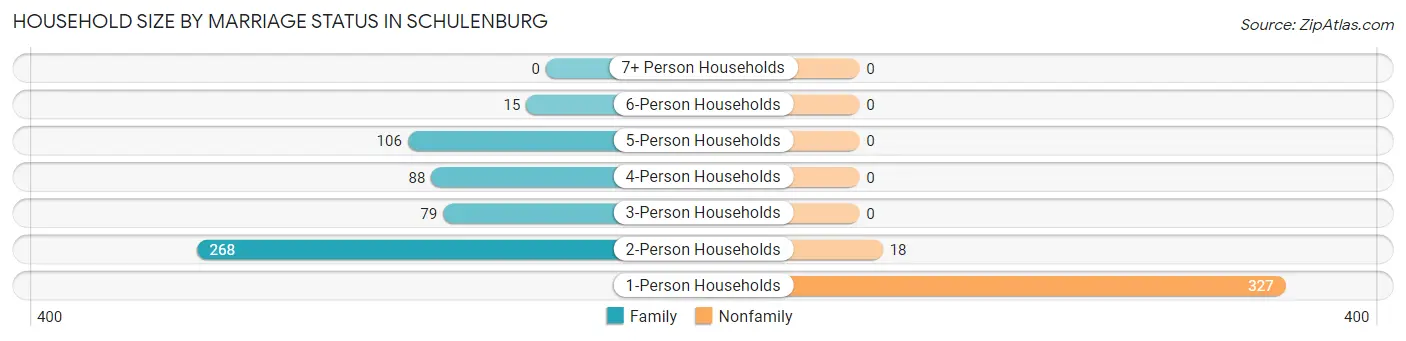
| Household Size | Family Households | Nonfamily Households |
| 1-Person Households | - | 327 (36.3%) |
| 2-Person Households | 268 (29.7%) | 18 (2.0%) |
| 3-Person Households | 79 (8.8%) | 0 (0.0%) |
| 4-Person Households | 88 (9.8%) | 0 (0.0%) |
| 5-Person Households | 106 (11.8%) | 0 (0.0%) |
| 6-Person Households | 15 (1.7%) | 0 (0.0%) |
| 7+ Person Households | 0 (0.0%) | 0 (0.0%) |
| Total | 556 (61.7%) | 345 (38.3%) |
Female Fertility in Schulenburg
Fertility by Age in Schulenburg
Average fertility rate in Schulenburg is 96.0 births per 1,000 women. Women in the age bracket of 20 to 34 years have the highest fertility rate with 124.0 births per 1,000 women. Women in the age bracket of 35 to 50 years acount for 53.7% of all women with births.
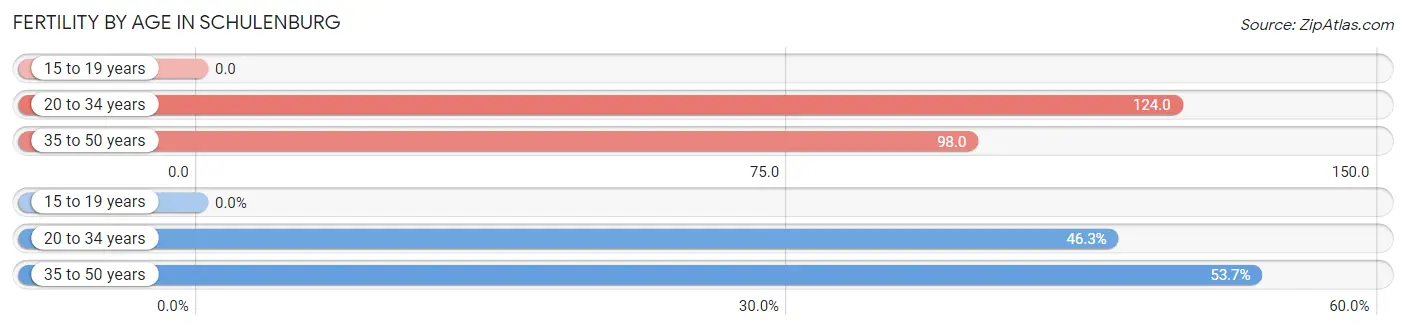
| Age Bracket | Women with Births | Births / 1,000 Women |
| 15 to 19 years | 0 (0.0%) | 0.0 |
| 20 to 34 years | 19 (46.3%) | 124.0 |
| 35 to 50 years | 22 (53.7%) | 98.0 |
| Total | 41 (100.0%) | 96.0 |
Fertility by Age by Marriage Status in Schulenburg
17.1% of women with births (41) in Schulenburg are married. The highest percentage of unmarried women with births falls into 35 to 50 years age bracket with 100.0% of them unmarried at the time of birth, while the lowest percentage of unmarried women with births belong to 20 to 34 years age bracket with 63.2% of them unmarried.
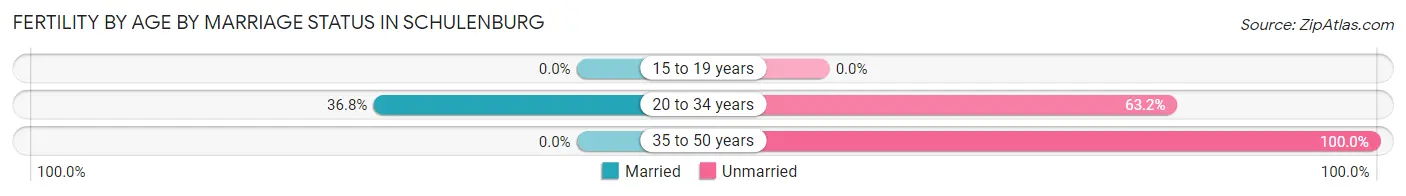
| Age Bracket | Married | Unmarried |
| 15 to 19 years | 0 (0.0%) | 0 (0.0%) |
| 20 to 34 years | 7 (36.8%) | 12 (63.2%) |
| 35 to 50 years | 0 (0.0%) | 22 (100.0%) |
| Total | 7 (17.1%) | 34 (82.9%) |
Fertility by Education in Schulenburg
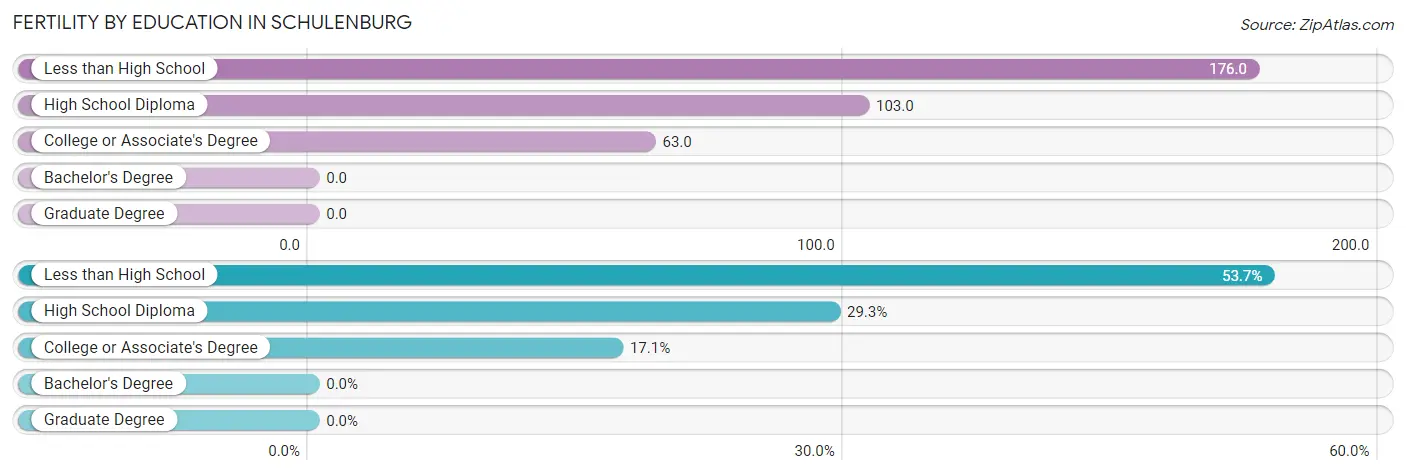
| Educational Attainment | Women with Births | Births / 1,000 Women |
| Less than High School | 22 (53.7%) | 176.0 |
| High School Diploma | 12 (29.3%) | 103.0 |
| College or Associate's Degree | 7 (17.1%) | 63.0 |
| Bachelor's Degree | 0 (0.0%) | 0.0 |
| Graduate Degree | 0 (0.0%) | 0.0 |
| Total | 41 (100.0%) | 96.0 |
Fertility by Education by Marriage Status in Schulenburg
82.9% of women with births in Schulenburg are unmarried. Women with the educational attainment of college or associate's degree are most likely to be married with 100.0% of them married at childbirth, while women with the educational attainment of less than high school are least likely to be married with 100.0% of them unmarried at childbirth.
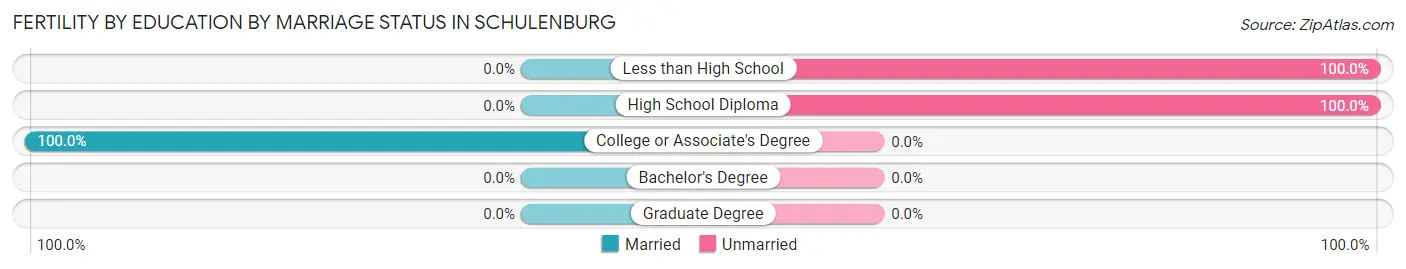
| Educational Attainment | Married | Unmarried |
| Less than High School | 0 (0.0%) | 22 (100.0%) |
| High School Diploma | 0 (0.0%) | 12 (100.0%) |
| College or Associate's Degree | 7 (100.0%) | 0 (0.0%) |
| Bachelor's Degree | 0 (0.0%) | 0 (0.0%) |
| Graduate Degree | 0 (0.0%) | 0 (0.0%) |
| Total | 7 (17.1%) | 34 (82.9%) |
Employment Characteristics in Schulenburg
Employment by Class of Employer in Schulenburg
Among the 1,052 employed individuals in Schulenburg, private company employees (804 | 76.4%), self-employed (not incorporated) (73 | 6.9%), and not-for-profit organizations (72 | 6.8%) make up the most common classes of employment.
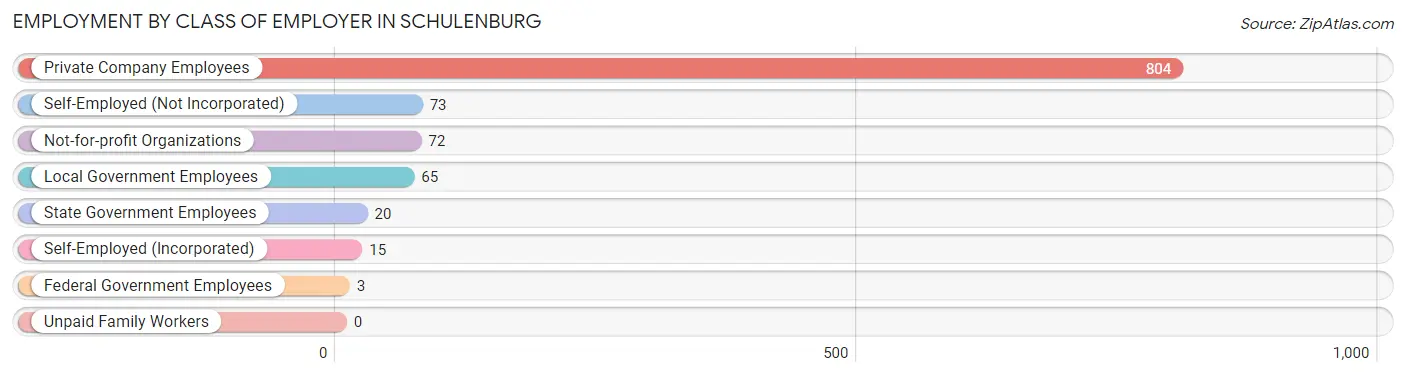
| Employer Class | # Employees | % Employees |
| Private Company Employees | 804 | 76.4% |
| Self-Employed (Incorporated) | 15 | 1.4% |
| Self-Employed (Not Incorporated) | 73 | 6.9% |
| Not-for-profit Organizations | 72 | 6.8% |
| Local Government Employees | 65 | 6.2% |
| State Government Employees | 20 | 1.9% |
| Federal Government Employees | 3 | 0.3% |
| Unpaid Family Workers | 0 | 0.0% |
| Total | 1,052 | 100.0% |
Employment Status by Age in Schulenburg
According to the labor force statistics for Schulenburg, out of the total population over 16 years of age (1,984), 56.6% or 1,123 individuals are in the labor force, with 6.3% or 71 of them unemployed. The age group with the highest labor force participation rate is 20 to 24 years, with 100.0% or 101 individuals in the labor force. Within the labor force, the 20 to 24 years age range has the highest percentage of unemployed individuals, with 20.8% or 21 of them being unemployed.
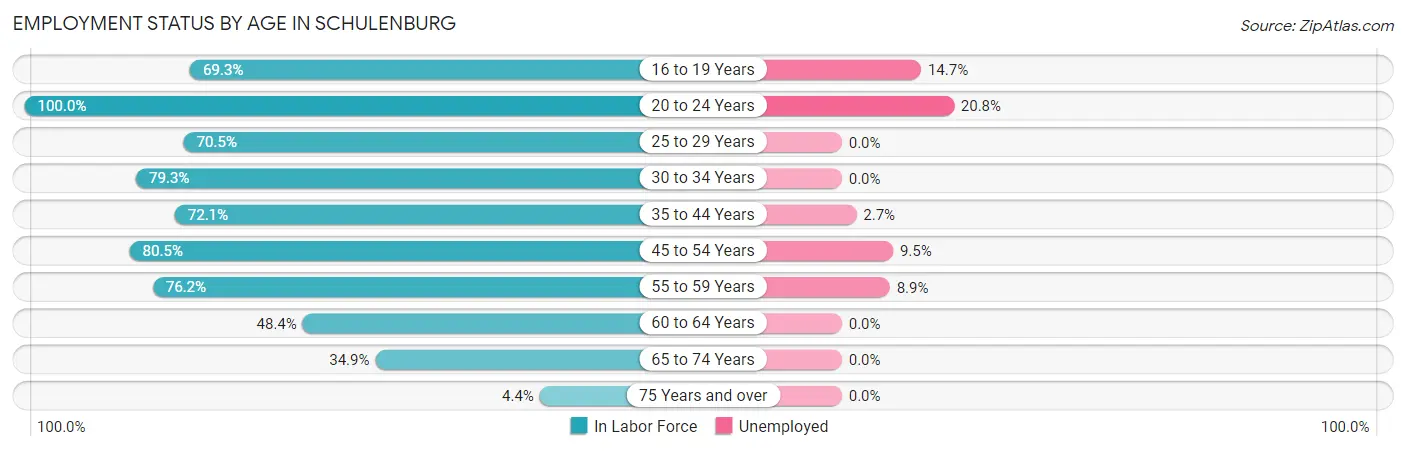
| Age Bracket | In Labor Force | Unemployed |
| 16 to 19 Years | 95 (69.3%) | 14 (14.7%) |
| 20 to 24 Years | 101 (100.0%) | 21 (20.8%) |
| 25 to 29 Years | 93 (70.5%) | 0 (0.0%) |
| 30 to 34 Years | 92 (79.3%) | 0 (0.0%) |
| 35 to 44 Years | 220 (72.1%) | 6 (2.7%) |
| 45 to 54 Years | 211 (80.5%) | 20 (9.5%) |
| 55 to 59 Years | 112 (76.2%) | 10 (8.9%) |
| 60 to 64 Years | 108 (48.4%) | 0 (0.0%) |
| 65 to 74 Years | 76 (34.9%) | 0 (0.0%) |
| 75 Years and over | 15 (4.4%) | 0 (0.0%) |
| Total | 1,123 (56.6%) | 71 (6.3%) |
Employment Status by Educational Attainment in Schulenburg
According to labor force statistics for Schulenburg, 70.5% of individuals (835) out of the total population between 25 and 64 years of age (1,185) are in the labor force, with 4.3% or 36 of them being unemployed. The group with the highest labor force participation rate are those with the educational attainment of bachelor's degree or higher, with 72.2% or 151 individuals in the labor force. Within the labor force, individuals with high school diploma education have the highest percentage of unemployment, with 10.4% or 36 of them being unemployed.
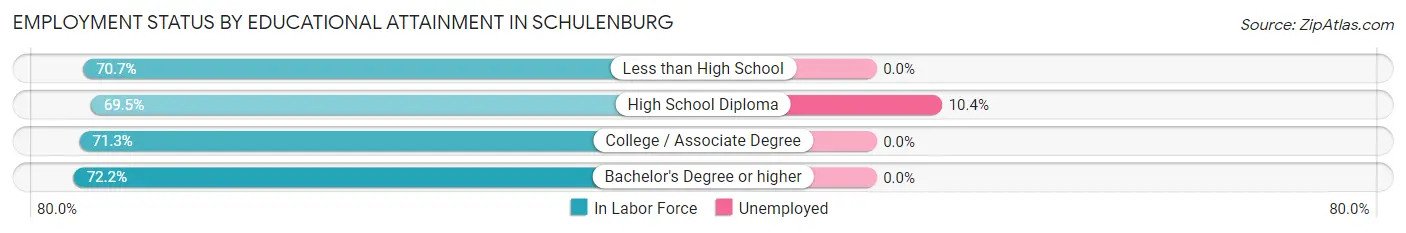
| Educational Attainment | In Labor Force | Unemployed |
| Less than High School | 195 (70.7%) | 0 (0.0%) |
| High School Diploma | 346 (69.5%) | 52 (10.4%) |
| College / Associate Degree | 144 (71.3%) | 0 (0.0%) |
| Bachelor's Degree or higher | 151 (72.2%) | 0 (0.0%) |
| Total | 835 (70.5%) | 51 (4.3%) |
Employment Occupations by Sex in Schulenburg
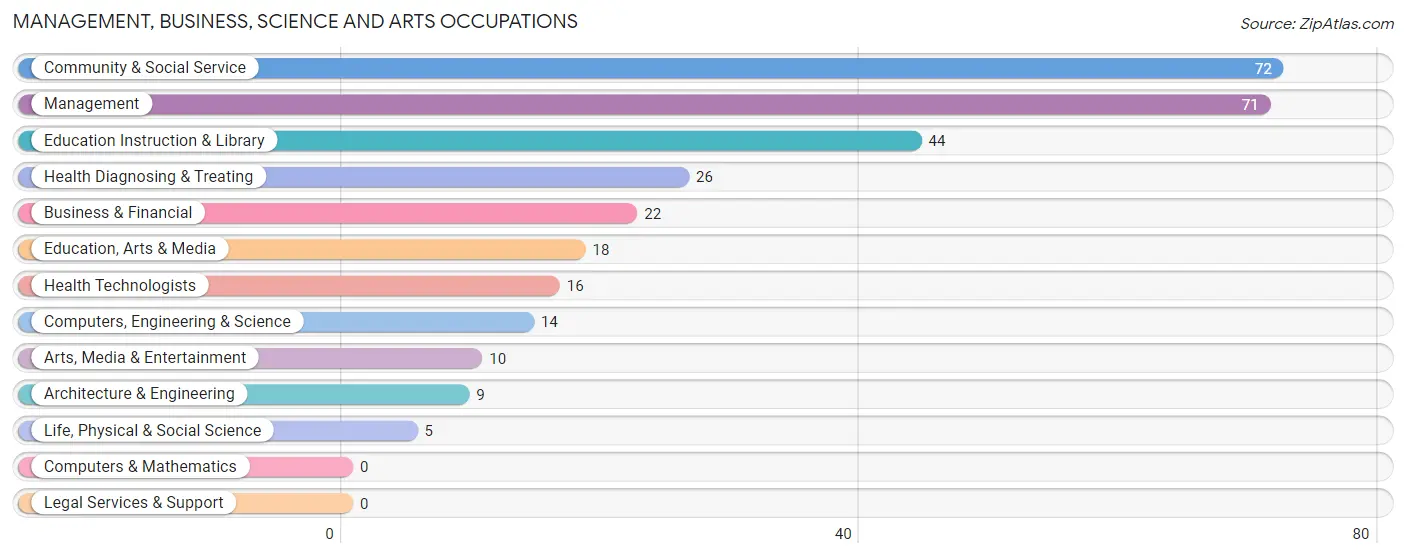
Management, Business, Science and Arts Occupations
The most common Management, Business, Science and Arts occupations in Schulenburg are Community & Social Service (72 | 6.8%), Management (71 | 6.8%), Education Instruction & Library (44 | 4.2%), Health Diagnosing & Treating (26 | 2.5%), and Business & Financial (22 | 2.1%).
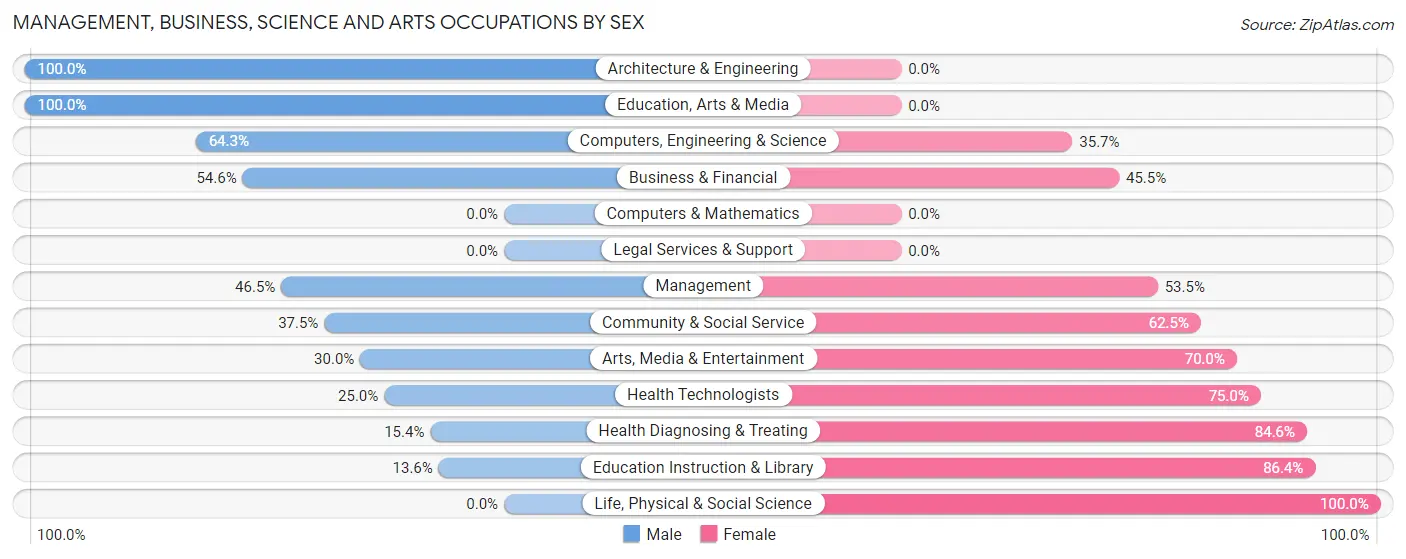
Management, Business, Science and Arts Occupations by Sex
Within the Management, Business, Science and Arts occupations in Schulenburg, the most male-oriented occupations are Architecture & Engineering (100.0%), Education, Arts & Media (100.0%), and Computers, Engineering & Science (64.3%), while the most female-oriented occupations are Life, Physical & Social Science (100.0%), Education Instruction & Library (86.4%), and Health Diagnosing & Treating (84.6%).
| Occupation | Male | Female |
| Management | 33 (46.5%) | 38 (53.5%) |
| Business & Financial | 12 (54.5%) | 10 (45.5%) |
| Computers, Engineering & Science | 9 (64.3%) | 5 (35.7%) |
| Computers & Mathematics | 0 (0.0%) | 0 (0.0%) |
| Architecture & Engineering | 9 (100.0%) | 0 (0.0%) |
| Life, Physical & Social Science | 0 (0.0%) | 5 (100.0%) |
| Community & Social Service | 27 (37.5%) | 45 (62.5%) |
| Education, Arts & Media | 18 (100.0%) | 0 (0.0%) |
| Legal Services & Support | 0 (0.0%) | 0 (0.0%) |
| Education Instruction & Library | 6 (13.6%) | 38 (86.4%) |
| Arts, Media & Entertainment | 3 (30.0%) | 7 (70.0%) |
| Health Diagnosing & Treating | 4 (15.4%) | 22 (84.6%) |
| Health Technologists | 4 (25.0%) | 12 (75.0%) |
| Total (Category) | 85 (41.5%) | 120 (58.5%) |
| Total (Overall) | 568 (54.0%) | 484 (46.0%) |
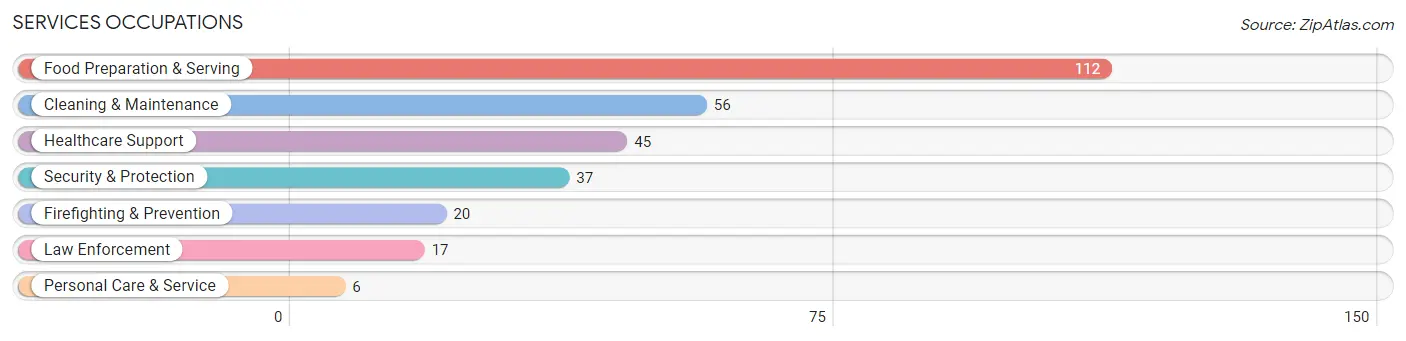
Services Occupations
The most common Services occupations in Schulenburg are Food Preparation & Serving (112 | 10.6%), Cleaning & Maintenance (56 | 5.3%), Healthcare Support (45 | 4.3%), Security & Protection (37 | 3.5%), and Firefighting & Prevention (20 | 1.9%).
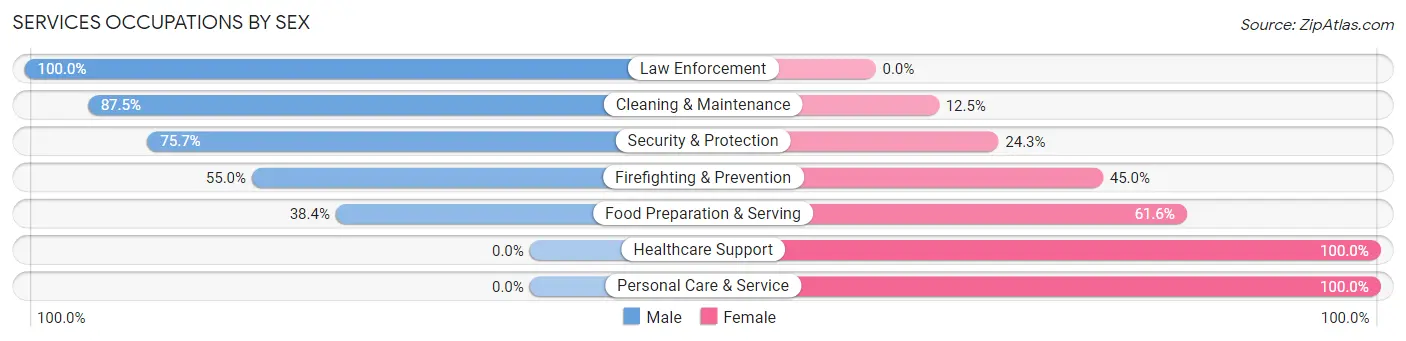
Services Occupations by Sex
Within the Services occupations in Schulenburg, the most male-oriented occupations are Law Enforcement (100.0%), Cleaning & Maintenance (87.5%), and Security & Protection (75.7%), while the most female-oriented occupations are Healthcare Support (100.0%), Personal Care & Service (100.0%), and Food Preparation & Serving (61.6%).
| Occupation | Male | Female |
| Healthcare Support | 0 (0.0%) | 45 (100.0%) |
| Security & Protection | 28 (75.7%) | 9 (24.3%) |
| Firefighting & Prevention | 11 (55.0%) | 9 (45.0%) |
| Law Enforcement | 17 (100.0%) | 0 (0.0%) |
| Food Preparation & Serving | 43 (38.4%) | 69 (61.6%) |
| Cleaning & Maintenance | 49 (87.5%) | 7 (12.5%) |
| Personal Care & Service | 0 (0.0%) | 6 (100.0%) |
| Total (Category) | 120 (46.9%) | 136 (53.1%) |
| Total (Overall) | 568 (54.0%) | 484 (46.0%) |
Sales and Office Occupations
The most common Sales and Office occupations in Schulenburg are Office & Administration (110 | 10.5%), and Sales & Related (97 | 9.2%).

Sales and Office Occupations by Sex

| Occupation | Male | Female |
| Sales & Related | 53 (54.6%) | 44 (45.4%) |
| Office & Administration | 19 (17.3%) | 91 (82.7%) |
| Total (Category) | 72 (34.8%) | 135 (65.2%) |
| Total (Overall) | 568 (54.0%) | 484 (46.0%) |
Natural Resources, Construction and Maintenance Occupations
The most common Natural Resources, Construction and Maintenance occupations in Schulenburg are Installation, Maintenance & Repair (75 | 7.1%), Construction & Extraction (53 | 5.0%), and Farming, Fishing & Forestry (5 | 0.5%).
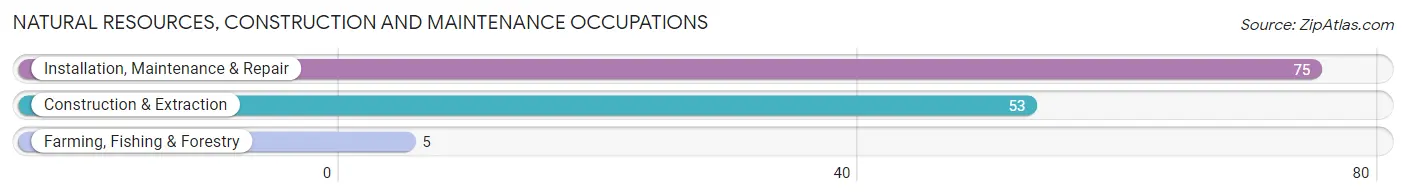
Natural Resources, Construction and Maintenance Occupations by Sex
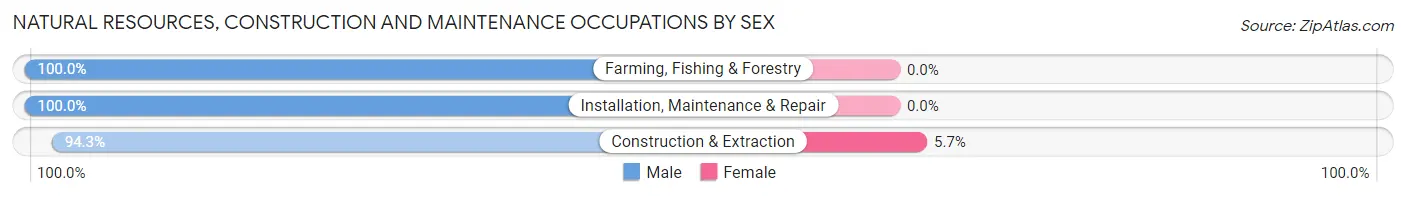
| Occupation | Male | Female |
| Farming, Fishing & Forestry | 5 (100.0%) | 0 (0.0%) |
| Construction & Extraction | 50 (94.3%) | 3 (5.7%) |
| Installation, Maintenance & Repair | 75 (100.0%) | 0 (0.0%) |
| Total (Category) | 130 (97.7%) | 3 (2.3%) |
| Total (Overall) | 568 (54.0%) | 484 (46.0%) |
Production, Transportation and Moving Occupations
The most common Production, Transportation and Moving occupations in Schulenburg are Production (183 | 17.4%), Transportation (48 | 4.6%), and Material Moving (20 | 1.9%).
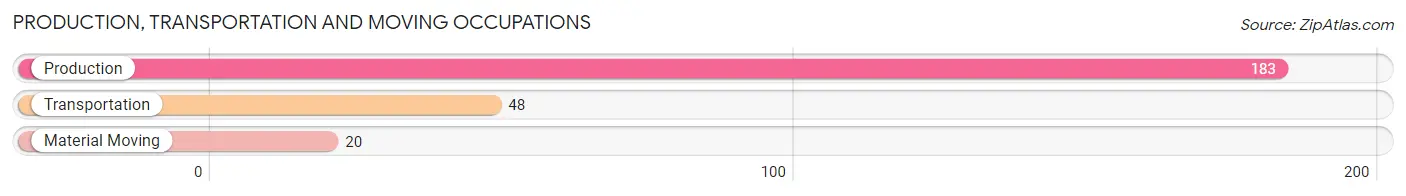
Production, Transportation and Moving Occupations by Sex
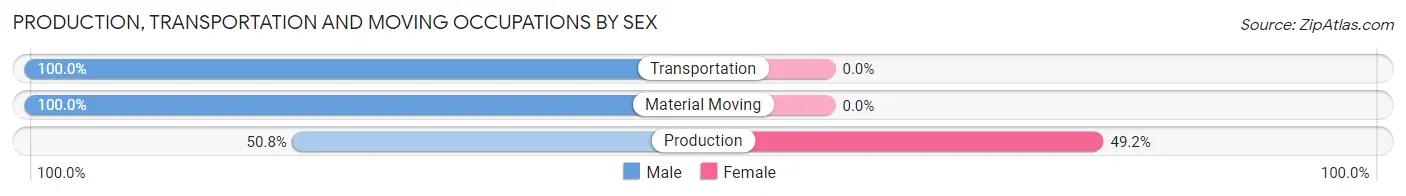
| Occupation | Male | Female |
| Production | 93 (50.8%) | 90 (49.2%) |
| Transportation | 48 (100.0%) | 0 (0.0%) |
| Material Moving | 20 (100.0%) | 0 (0.0%) |
| Total (Category) | 161 (64.1%) | 90 (35.9%) |
| Total (Overall) | 568 (54.0%) | 484 (46.0%) |
Employment Industries by Sex in Schulenburg
Employment Industries in Schulenburg
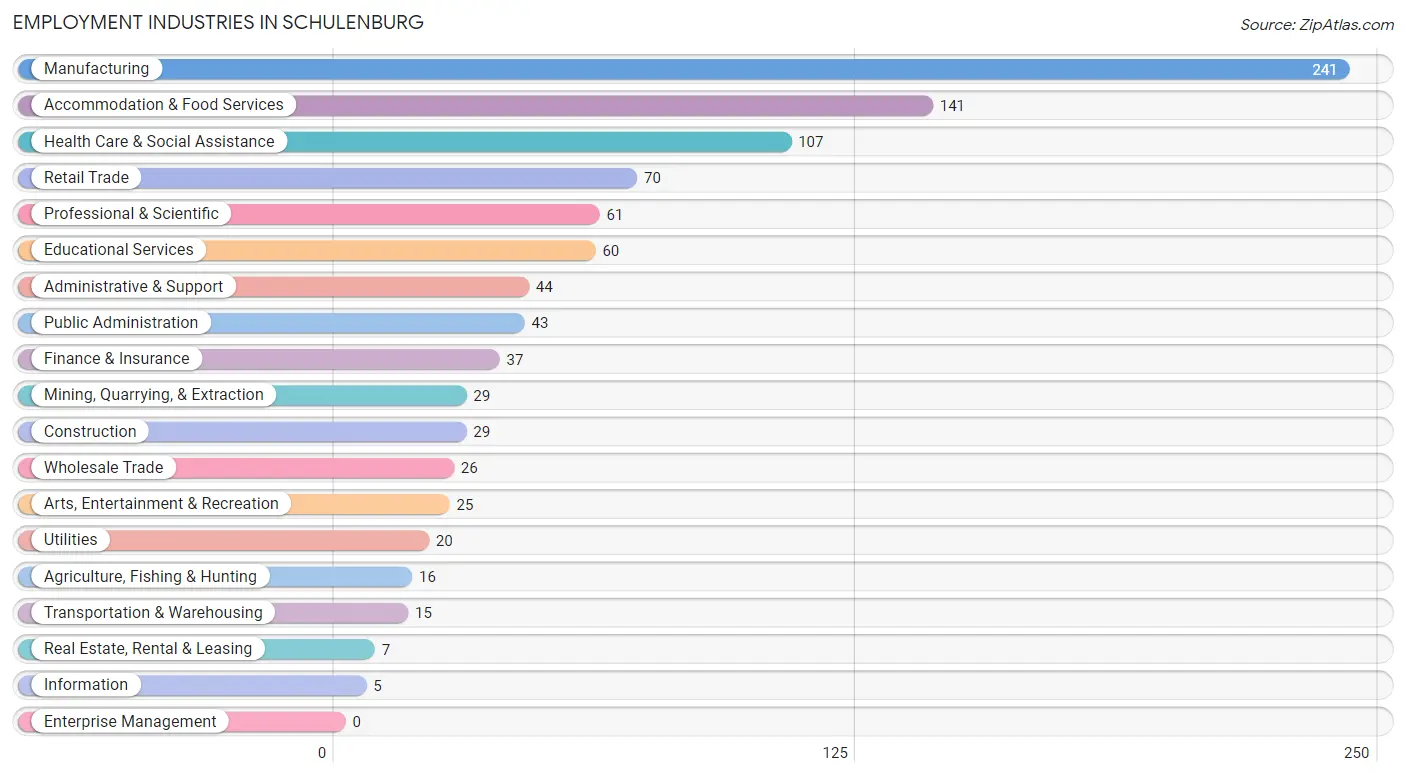
The major employment industries in Schulenburg include Manufacturing (241 | 22.9%), Accommodation & Food Services (141 | 13.4%), Health Care & Social Assistance (107 | 10.2%), Retail Trade (70 | 6.7%), and Professional & Scientific (61 | 5.8%).
Employment Industries by Sex in Schulenburg
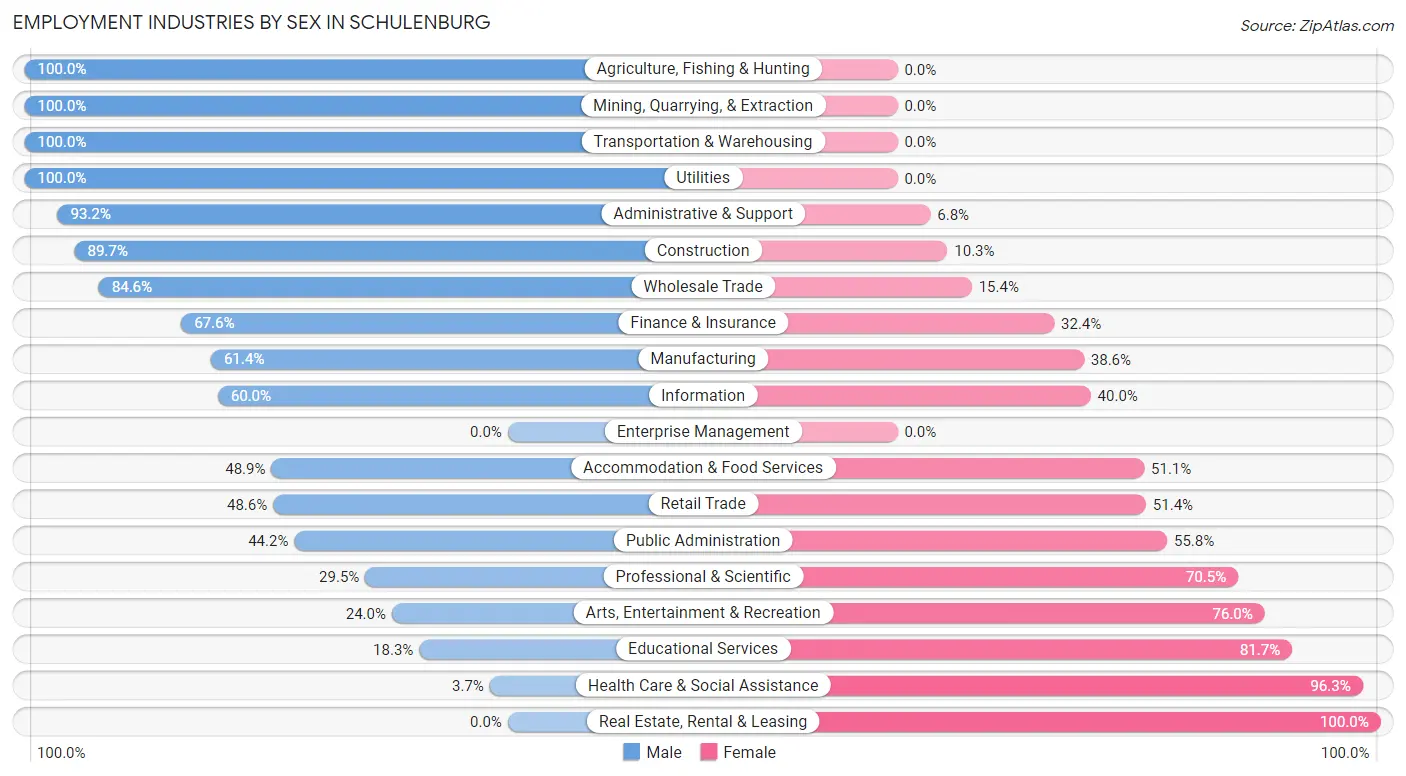
The Schulenburg industries that see more men than women are Agriculture, Fishing & Hunting (100.0%), Mining, Quarrying, & Extraction (100.0%), and Transportation & Warehousing (100.0%), whereas the industries that tend to have a higher number of women are Real Estate, Rental & Leasing (100.0%), Health Care & Social Assistance (96.3%), and Educational Services (81.7%).
| Industry | Male | Female |
| Agriculture, Fishing & Hunting | 16 (100.0%) | 0 (0.0%) |
| Mining, Quarrying, & Extraction | 29 (100.0%) | 0 (0.0%) |
| Construction | 26 (89.7%) | 3 (10.3%) |
| Manufacturing | 148 (61.4%) | 93 (38.6%) |
| Wholesale Trade | 22 (84.6%) | 4 (15.4%) |
| Retail Trade | 34 (48.6%) | 36 (51.4%) |
| Transportation & Warehousing | 15 (100.0%) | 0 (0.0%) |
| Utilities | 20 (100.0%) | 0 (0.0%) |
| Information | 3 (60.0%) | 2 (40.0%) |
| Finance & Insurance | 25 (67.6%) | 12 (32.4%) |
| Real Estate, Rental & Leasing | 0 (0.0%) | 7 (100.0%) |
| Professional & Scientific | 18 (29.5%) | 43 (70.5%) |
| Enterprise Management | 0 (0.0%) | 0 (0.0%) |
| Administrative & Support | 41 (93.2%) | 3 (6.8%) |
| Educational Services | 11 (18.3%) | 49 (81.7%) |
| Health Care & Social Assistance | 4 (3.7%) | 103 (96.3%) |
| Arts, Entertainment & Recreation | 6 (24.0%) | 19 (76.0%) |
| Accommodation & Food Services | 69 (48.9%) | 72 (51.1%) |
| Public Administration | 19 (44.2%) | 24 (55.8%) |
| Total | 568 (54.0%) | 484 (46.0%) |
Education in Schulenburg
School Enrollment in Schulenburg
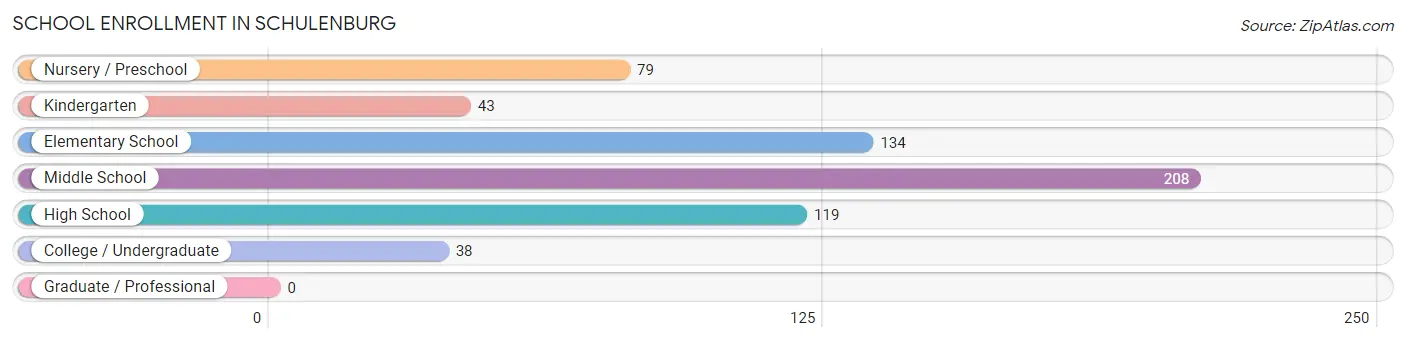
The most common levels of schooling among the 621 students in Schulenburg are middle school (208 | 33.5%), elementary school (134 | 21.6%), and high school (119 | 19.2%).
| School Level | # Students | % Students |
| Nursery / Preschool | 79 | 12.7% |
| Kindergarten | 43 | 6.9% |
| Elementary School | 134 | 21.6% |
| Middle School | 208 | 33.5% |
| High School | 119 | 19.2% |
| College / Undergraduate | 38 | 6.1% |
| Graduate / Professional | 0 | 0.0% |
| Total | 621 | 100.0% |
School Enrollment by Age by Funding Source in Schulenburg
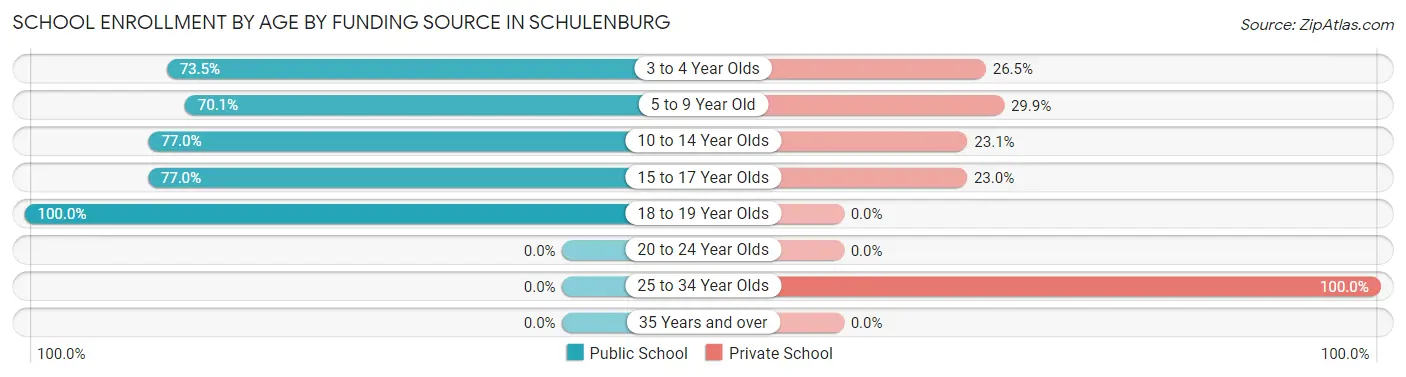
Out of a total of 621 students who are enrolled in schools in Schulenburg, 152 (24.5%) attend a private institution, while the remaining 469 (75.5%) are enrolled in public schools. The age group of 25 to 34 year olds has the highest likelihood of being enrolled in private schools, with 12 (100.0% in the age bracket) enrolled. Conversely, the age group of 18 to 19 year olds has the lowest likelihood of being enrolled in a private school, with 54 (100.0% in the age bracket) attending a public institution.
| Age Bracket | Public School | Private School |
| 3 to 4 Year Olds | 50 (73.5%) | 18 (26.5%) |
| 5 to 9 Year Old | 101 (70.1%) | 43 (29.9%) |
| 10 to 14 Year Olds | 207 (76.9%) | 62 (23.1%) |
| 15 to 17 Year Olds | 57 (77.0%) | 17 (23.0%) |
| 18 to 19 Year Olds | 54 (100.0%) | 0 (0.0%) |
| 20 to 24 Year Olds | 0 (0.0%) | 0 (0.0%) |
| 25 to 34 Year Olds | 0 (0.0%) | 12 (100.0%) |
| 35 Years and over | 0 (0.0%) | 0 (0.0%) |
| Total | 469 (75.5%) | 152 (24.5%) |
Educational Attainment by Field of Study in Schulenburg
Education (65 | 21.2%), business (56 | 18.3%), liberal arts & history (49 | 16.0%), science & technology (27 | 8.8%), and physical & health sciences (18 | 5.9%) are the most common fields of study among 306 individuals in Schulenburg who have obtained a bachelor's degree or higher.
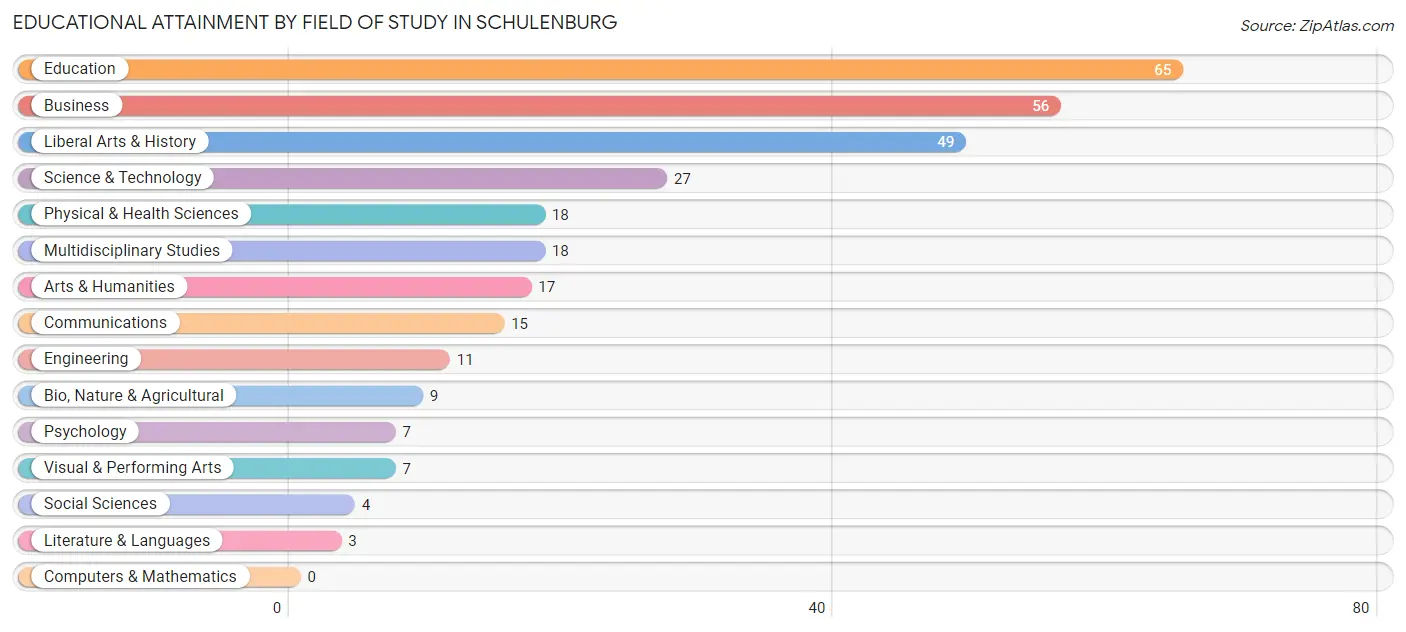
| Field of Study | # Graduates | % Graduates |
| Computers & Mathematics | 0 | 0.0% |
| Bio, Nature & Agricultural | 9 | 2.9% |
| Physical & Health Sciences | 18 | 5.9% |
| Psychology | 7 | 2.3% |
| Social Sciences | 4 | 1.3% |
| Engineering | 11 | 3.6% |
| Multidisciplinary Studies | 18 | 5.9% |
| Science & Technology | 27 | 8.8% |
| Business | 56 | 18.3% |
| Education | 65 | 21.2% |
| Literature & Languages | 3 | 1.0% |
| Liberal Arts & History | 49 | 16.0% |
| Visual & Performing Arts | 7 | 2.3% |
| Communications | 15 | 4.9% |
| Arts & Humanities | 17 | 5.6% |
| Total | 306 | 100.0% |
Transportation & Commute in Schulenburg
Vehicle Availability by Sex in Schulenburg
The most prevalent vehicle ownership categories in Schulenburg are males with 2 vehicles (280, accounting for 49.3%) and females with 2 vehicles (244, making up 57.9%).
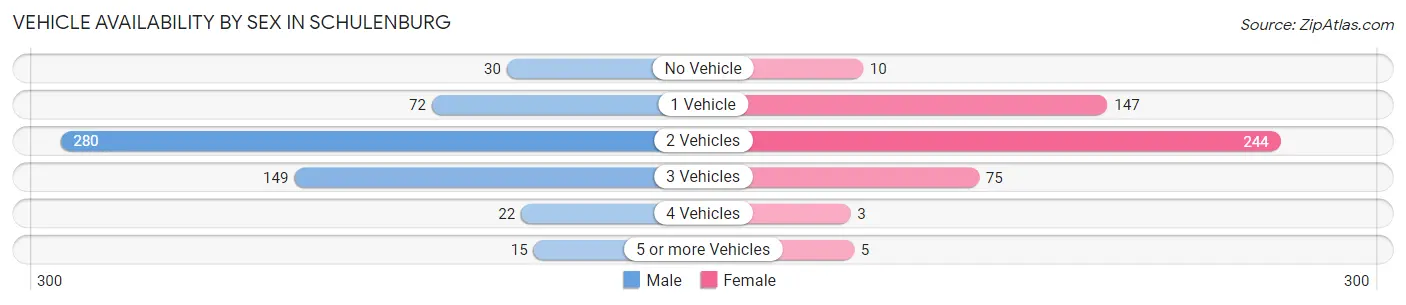
| Vehicles Available | Male | Female |
| No Vehicle | 30 (5.3%) | 10 (2.1%) |
| 1 Vehicle | 72 (12.7%) | 147 (30.4%) |
| 2 Vehicles | 280 (49.3%) | 244 (50.4%) |
| 3 Vehicles | 149 (26.2%) | 75 (15.5%) |
| 4 Vehicles | 22 (3.9%) | 3 (0.6%) |
| 5 or more Vehicles | 15 (2.6%) | 5 (1.0%) |
| Total | 568 (100.0%) | 484 (100.0%) |
Commute Time in Schulenburg
The most frequently occuring commute durations in Schulenburg are 5 to 9 minutes (303 commuters, 31.5%), 10 to 14 minutes (205 commuters, 21.3%), and 20 to 24 minutes (118 commuters, 12.3%).
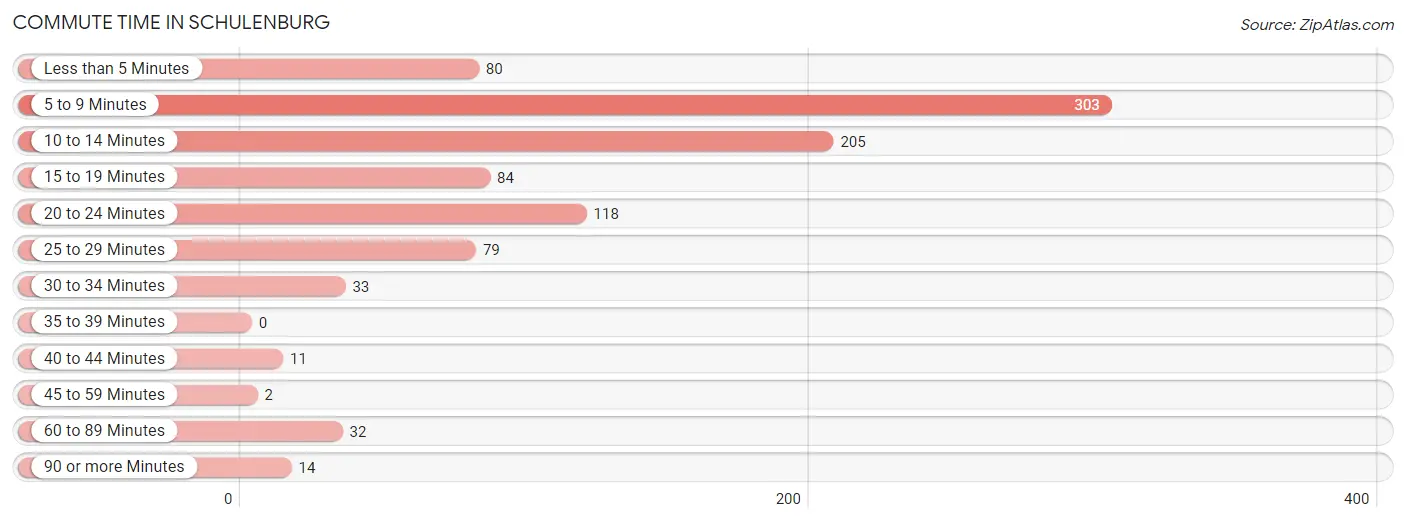
| Commute Time | # Commuters | % Commuters |
| Less than 5 Minutes | 80 | 8.3% |
| 5 to 9 Minutes | 303 | 31.5% |
| 10 to 14 Minutes | 205 | 21.3% |
| 15 to 19 Minutes | 84 | 8.7% |
| 20 to 24 Minutes | 118 | 12.3% |
| 25 to 29 Minutes | 79 | 8.2% |
| 30 to 34 Minutes | 33 | 3.4% |
| 35 to 39 Minutes | 0 | 0.0% |
| 40 to 44 Minutes | 11 | 1.1% |
| 45 to 59 Minutes | 2 | 0.2% |
| 60 to 89 Minutes | 32 | 3.3% |
| 90 or more Minutes | 14 | 1.5% |
Commute Time by Sex in Schulenburg
The most common commute times in Schulenburg are 5 to 9 minutes (197 commuters, 37.1%) for males and 10 to 14 minutes (135 commuters, 31.4%) for females.
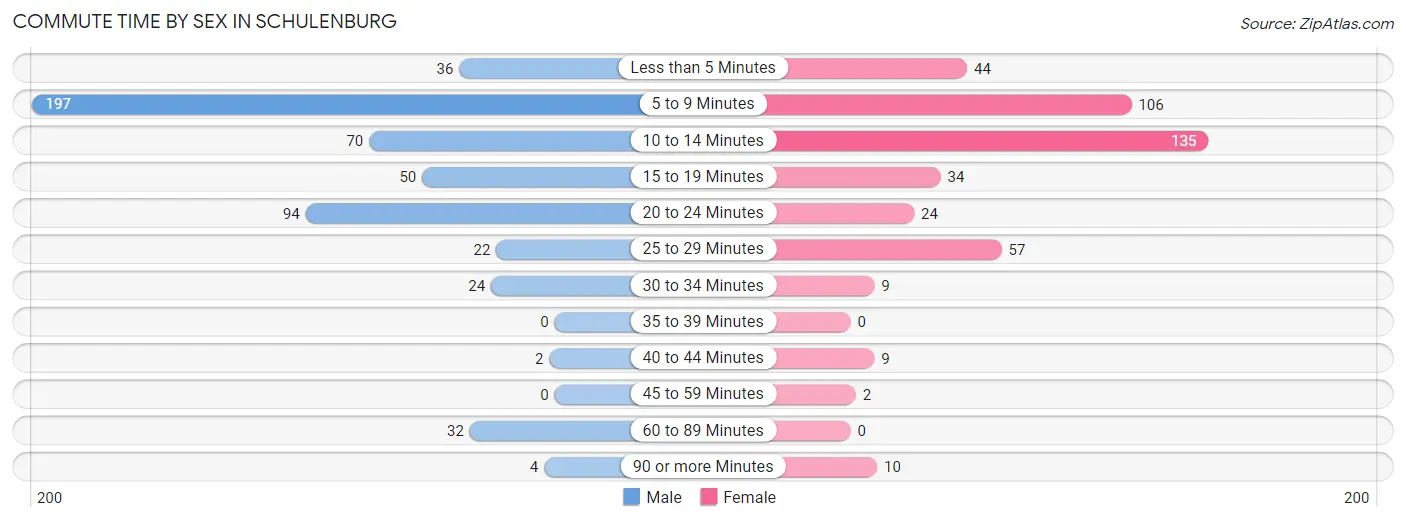
| Commute Time | Male | Female |
| Less than 5 Minutes | 36 (6.8%) | 44 (10.2%) |
| 5 to 9 Minutes | 197 (37.1%) | 106 (24.6%) |
| 10 to 14 Minutes | 70 (13.2%) | 135 (31.4%) |
| 15 to 19 Minutes | 50 (9.4%) | 34 (7.9%) |
| 20 to 24 Minutes | 94 (17.7%) | 24 (5.6%) |
| 25 to 29 Minutes | 22 (4.1%) | 57 (13.3%) |
| 30 to 34 Minutes | 24 (4.5%) | 9 (2.1%) |
| 35 to 39 Minutes | 0 (0.0%) | 0 (0.0%) |
| 40 to 44 Minutes | 2 (0.4%) | 9 (2.1%) |
| 45 to 59 Minutes | 0 (0.0%) | 2 (0.5%) |
| 60 to 89 Minutes | 32 (6.0%) | 0 (0.0%) |
| 90 or more Minutes | 4 (0.7%) | 10 (2.3%) |
Time of Departure to Work by Sex in Schulenburg
The most frequent times of departure to work in Schulenburg are 7:00 AM to 7:29 AM (136, 25.6%) for males and 7:30 AM to 7:59 AM (83, 19.3%) for females.
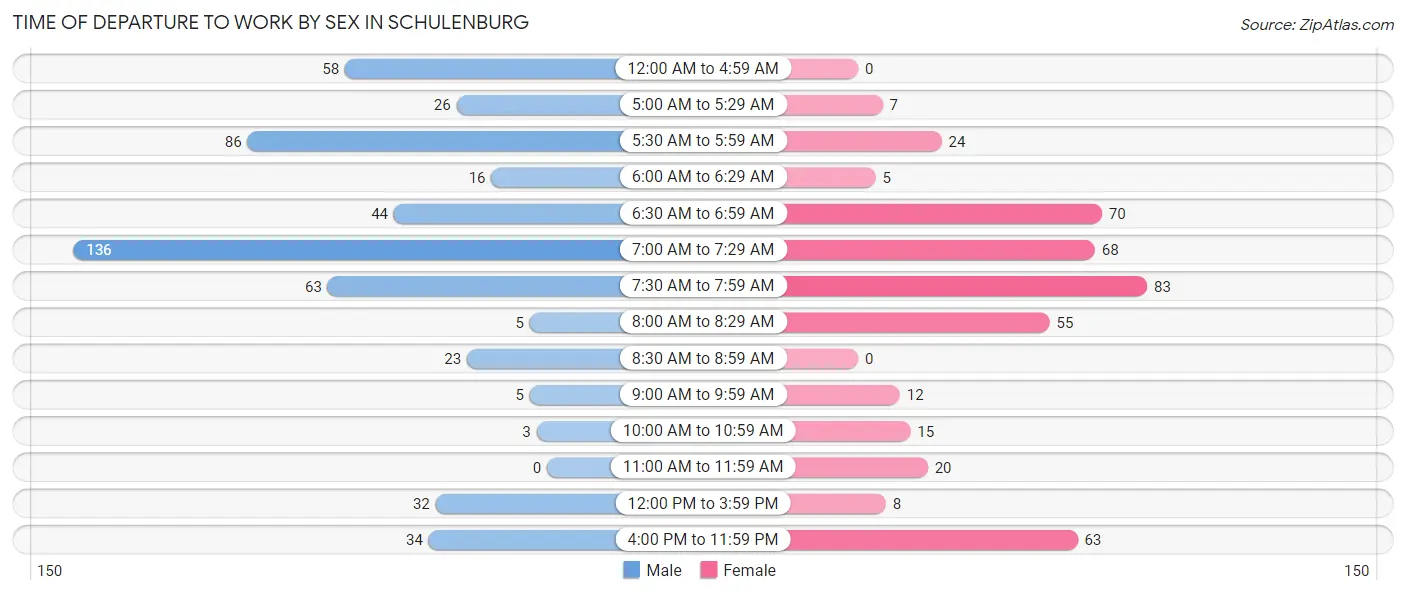
| Time of Departure | Male | Female |
| 12:00 AM to 4:59 AM | 58 (10.9%) | 0 (0.0%) |
| 5:00 AM to 5:29 AM | 26 (4.9%) | 7 (1.6%) |
| 5:30 AM to 5:59 AM | 86 (16.2%) | 24 (5.6%) |
| 6:00 AM to 6:29 AM | 16 (3.0%) | 5 (1.2%) |
| 6:30 AM to 6:59 AM | 44 (8.3%) | 70 (16.3%) |
| 7:00 AM to 7:29 AM | 136 (25.6%) | 68 (15.8%) |
| 7:30 AM to 7:59 AM | 63 (11.9%) | 83 (19.3%) |
| 8:00 AM to 8:29 AM | 5 (0.9%) | 55 (12.8%) |
| 8:30 AM to 8:59 AM | 23 (4.3%) | 0 (0.0%) |
| 9:00 AM to 9:59 AM | 5 (0.9%) | 12 (2.8%) |
| 10:00 AM to 10:59 AM | 3 (0.6%) | 15 (3.5%) |
| 11:00 AM to 11:59 AM | 0 (0.0%) | 20 (4.6%) |
| 12:00 PM to 3:59 PM | 32 (6.0%) | 8 (1.9%) |
| 4:00 PM to 11:59 PM | 34 (6.4%) | 63 (14.6%) |
| Total | 531 (100.0%) | 430 (100.0%) |
Housing Occupancy in Schulenburg
Occupancy by Ownership in Schulenburg
Of the total 901 dwellings in Schulenburg, owner-occupied units account for 562 (62.4%), while renter-occupied units make up 339 (37.6%).
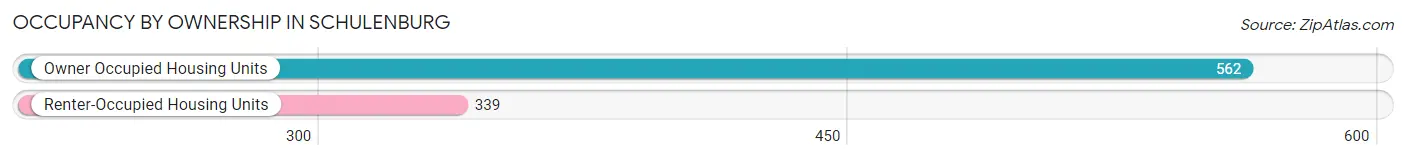
| Occupancy | # Housing Units | % Housing Units |
| Owner Occupied Housing Units | 562 | 62.4% |
| Renter-Occupied Housing Units | 339 | 37.6% |
| Total Occupied Housing Units | 901 | 100.0% |
Occupancy by Household Size in Schulenburg
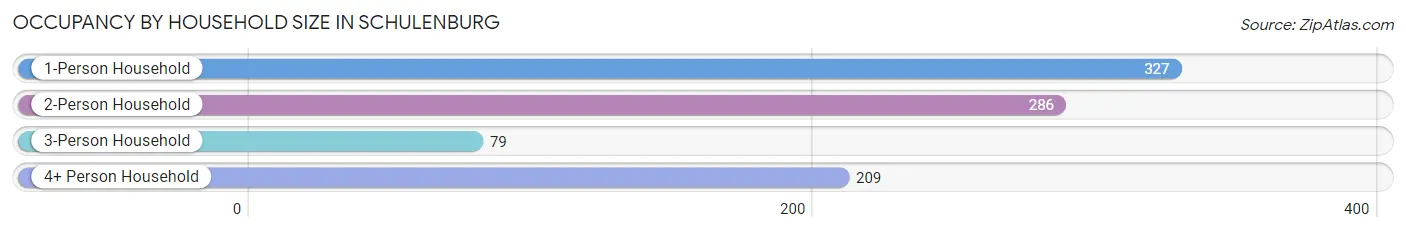
| Household Size | # Housing Units | % Housing Units |
| 1-Person Household | 327 | 36.3% |
| 2-Person Household | 286 | 31.7% |
| 3-Person Household | 79 | 8.8% |
| 4+ Person Household | 209 | 23.2% |
| Total Housing Units | 901 | 100.0% |
Occupancy by Ownership by Household Size in Schulenburg
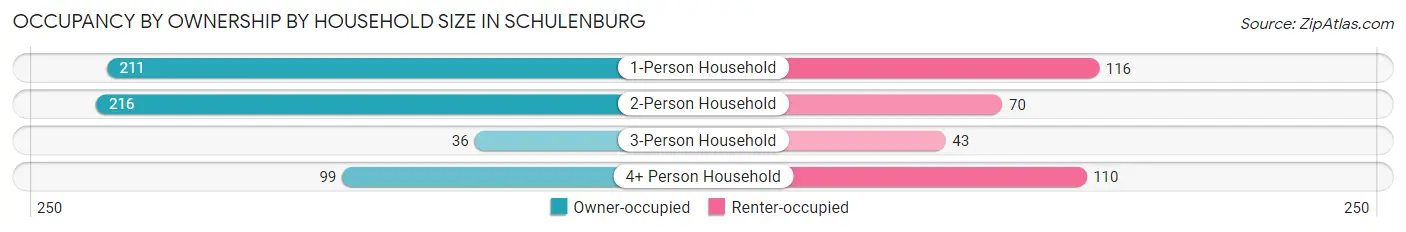
| Household Size | Owner-occupied | Renter-occupied |
| 1-Person Household | 211 (64.5%) | 116 (35.5%) |
| 2-Person Household | 216 (75.5%) | 70 (24.5%) |
| 3-Person Household | 36 (45.6%) | 43 (54.4%) |
| 4+ Person Household | 99 (47.4%) | 110 (52.6%) |
| Total Housing Units | 562 (62.4%) | 339 (37.6%) |
Occupancy by Educational Attainment in Schulenburg
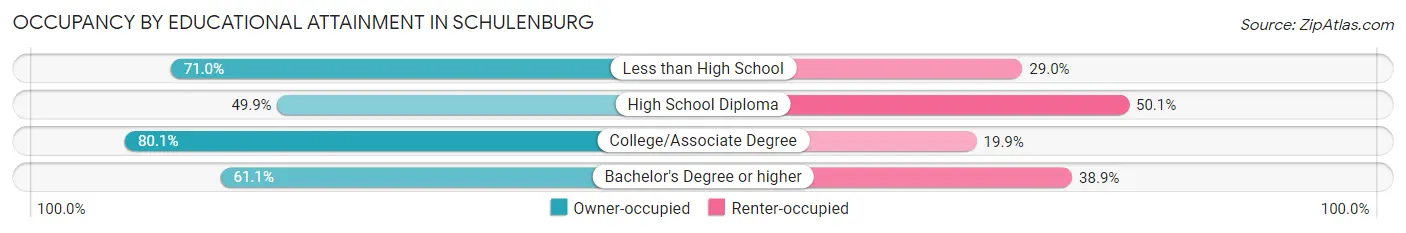
| Household Size | Owner-occupied | Renter-occupied |
| Less than High School | 98 (71.0%) | 40 (29.0%) |
| High School Diploma | 188 (49.9%) | 189 (50.1%) |
| College/Associate Degree | 169 (80.1%) | 42 (19.9%) |
| Bachelor's Degree or higher | 107 (61.1%) | 68 (38.9%) |
Occupancy by Age of Householder in Schulenburg
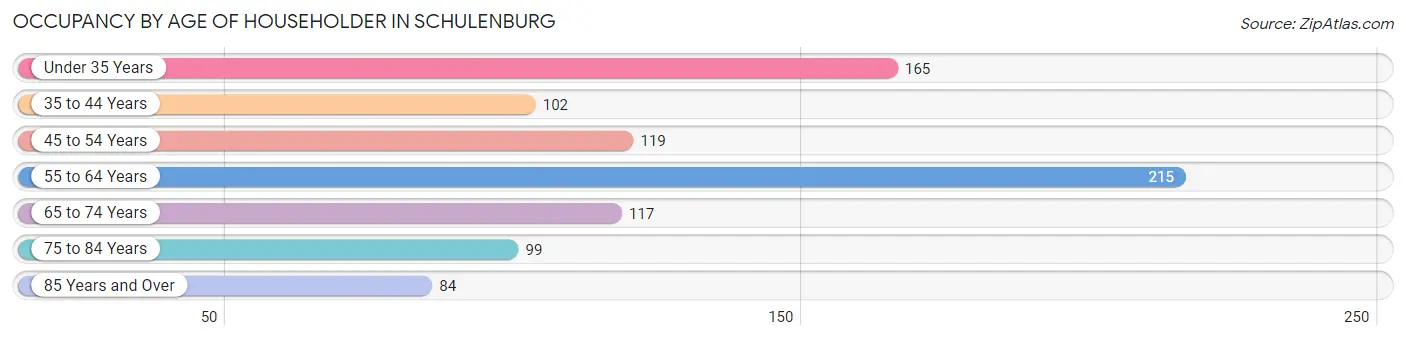
| Age Bracket | # Households | % Households |
| Under 35 Years | 165 | 18.3% |
| 35 to 44 Years | 102 | 11.3% |
| 45 to 54 Years | 119 | 13.2% |
| 55 to 64 Years | 215 | 23.9% |
| 65 to 74 Years | 117 | 13.0% |
| 75 to 84 Years | 99 | 11.0% |
| 85 Years and Over | 84 | 9.3% |
| Total | 901 | 100.0% |
Housing Finances in Schulenburg
Median Income by Occupancy in Schulenburg
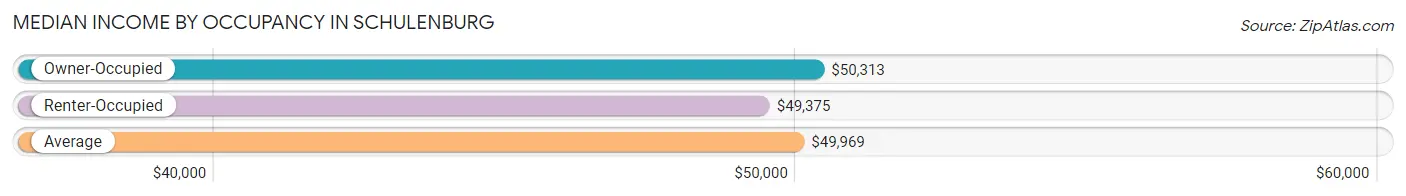
| Occupancy Type | # Households | Median Income |
| Owner-Occupied | 562 (62.4%) | $50,313 |
| Renter-Occupied | 339 (37.6%) | $49,375 |
| Average | 901 (100.0%) | $49,969 |
Occupancy by Householder Income Bracket in Schulenburg
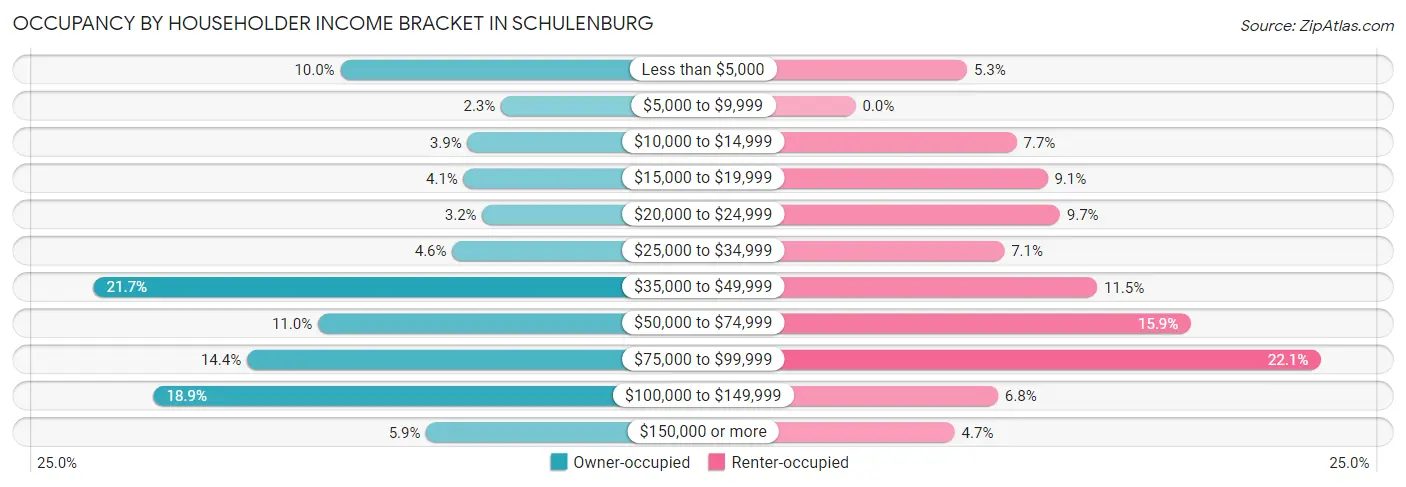
| Income Bracket | Owner-occupied | Renter-occupied |
| Less than $5,000 | 56 (10.0%) | 18 (5.3%) |
| $5,000 to $9,999 | 13 (2.3%) | 0 (0.0%) |
| $10,000 to $14,999 | 22 (3.9%) | 26 (7.7%) |
| $15,000 to $19,999 | 23 (4.1%) | 31 (9.1%) |
| $20,000 to $24,999 | 18 (3.2%) | 33 (9.7%) |
| $25,000 to $34,999 | 26 (4.6%) | 24 (7.1%) |
| $35,000 to $49,999 | 122 (21.7%) | 39 (11.5%) |
| $50,000 to $74,999 | 62 (11.0%) | 54 (15.9%) |
| $75,000 to $99,999 | 81 (14.4%) | 75 (22.1%) |
| $100,000 to $149,999 | 106 (18.9%) | 23 (6.8%) |
| $150,000 or more | 33 (5.9%) | 16 (4.7%) |
| Total | 562 (100.0%) | 339 (100.0%) |
Monthly Housing Cost Tiers in Schulenburg
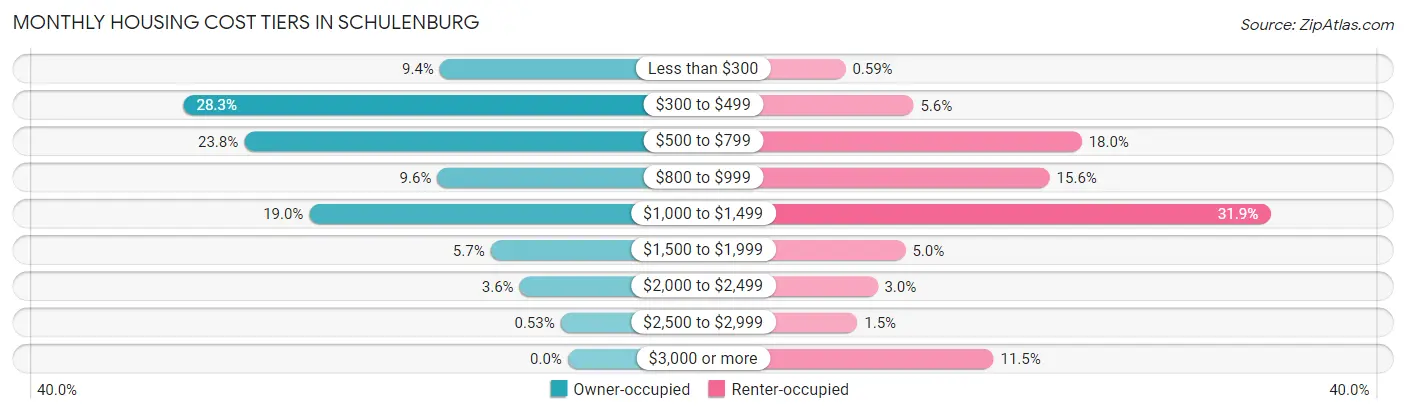
| Monthly Cost | Owner-occupied | Renter-occupied |
| Less than $300 | 53 (9.4%) | 2 (0.6%) |
| $300 to $499 | 159 (28.3%) | 19 (5.6%) |
| $500 to $799 | 134 (23.8%) | 61 (18.0%) |
| $800 to $999 | 54 (9.6%) | 53 (15.6%) |
| $1,000 to $1,499 | 107 (19.0%) | 108 (31.9%) |
| $1,500 to $1,999 | 32 (5.7%) | 17 (5.0%) |
| $2,000 to $2,499 | 20 (3.6%) | 10 (2.9%) |
| $2,500 to $2,999 | 3 (0.5%) | 5 (1.5%) |
| $3,000 or more | 0 (0.0%) | 39 (11.5%) |
| Total | 562 (100.0%) | 339 (100.0%) |
Physical Housing Characteristics in Schulenburg
Housing Structures in Schulenburg
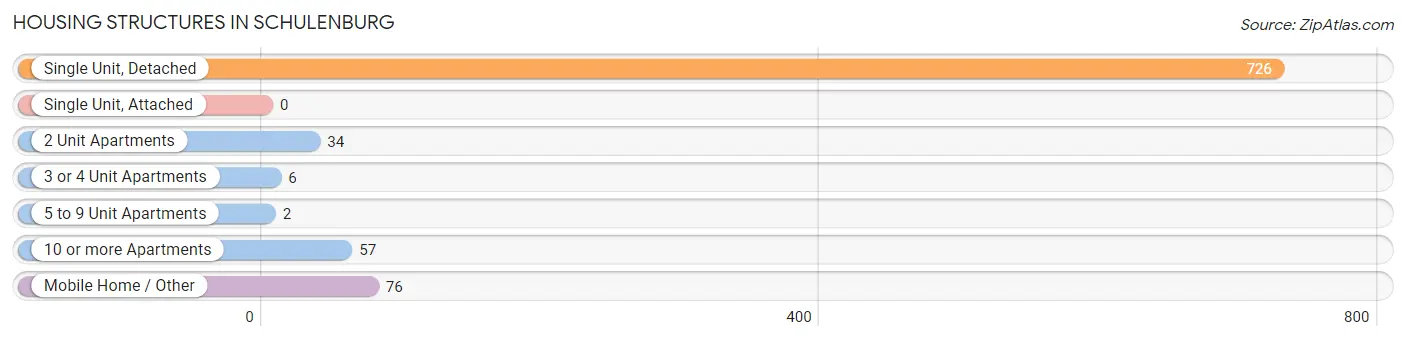
| Structure Type | # Housing Units | % Housing Units |
| Single Unit, Detached | 726 | 80.6% |
| Single Unit, Attached | 0 | 0.0% |
| 2 Unit Apartments | 34 | 3.8% |
| 3 or 4 Unit Apartments | 6 | 0.7% |
| 5 to 9 Unit Apartments | 2 | 0.2% |
| 10 or more Apartments | 57 | 6.3% |
| Mobile Home / Other | 76 | 8.4% |
| Total | 901 | 100.0% |
Housing Structures by Occupancy in Schulenburg
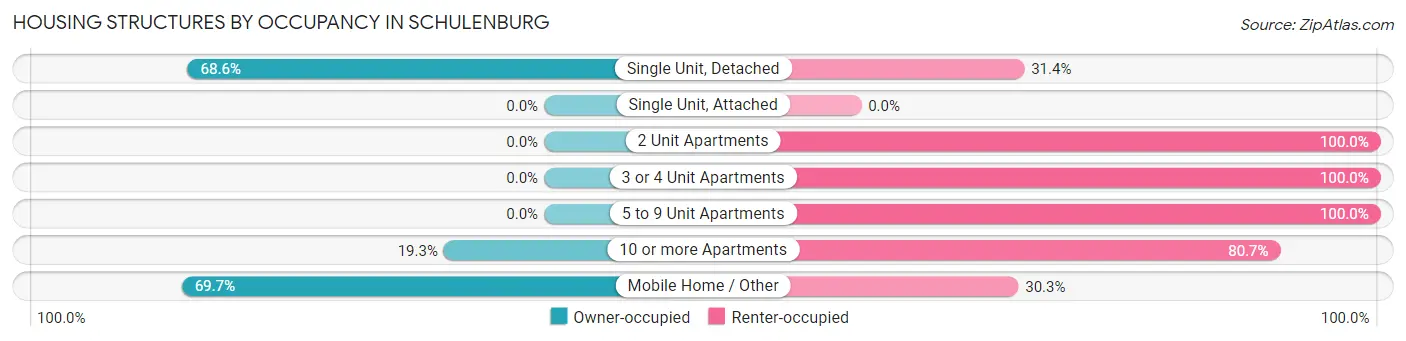
| Structure Type | Owner-occupied | Renter-occupied |
| Single Unit, Detached | 498 (68.6%) | 228 (31.4%) |
| Single Unit, Attached | 0 (0.0%) | 0 (0.0%) |
| 2 Unit Apartments | 0 (0.0%) | 34 (100.0%) |
| 3 or 4 Unit Apartments | 0 (0.0%) | 6 (100.0%) |
| 5 to 9 Unit Apartments | 0 (0.0%) | 2 (100.0%) |
| 10 or more Apartments | 11 (19.3%) | 46 (80.7%) |
| Mobile Home / Other | 53 (69.7%) | 23 (30.3%) |
| Total | 562 (62.4%) | 339 (37.6%) |
Housing Structures by Number of Rooms in Schulenburg
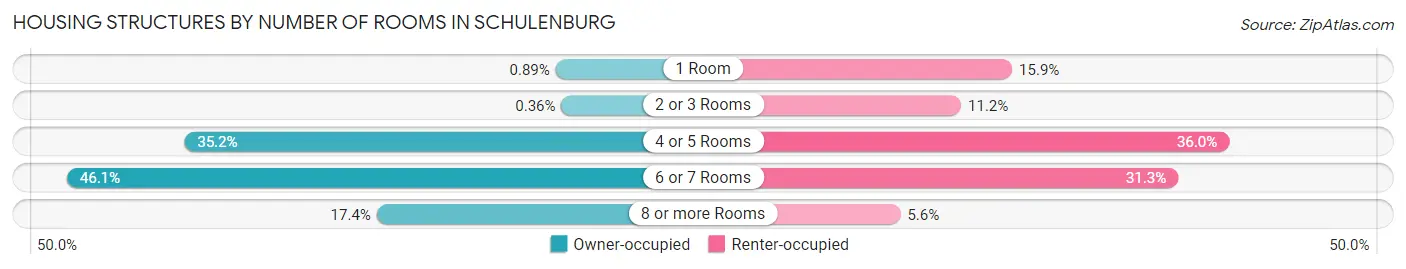
| Number of Rooms | Owner-occupied | Renter-occupied |
| 1 Room | 5 (0.9%) | 54 (15.9%) |
| 2 or 3 Rooms | 2 (0.4%) | 38 (11.2%) |
| 4 or 5 Rooms | 198 (35.2%) | 122 (36.0%) |
| 6 or 7 Rooms | 259 (46.1%) | 106 (31.3%) |
| 8 or more Rooms | 98 (17.4%) | 19 (5.6%) |
| Total | 562 (100.0%) | 339 (100.0%) |
Housing Structure by Heating Type in Schulenburg
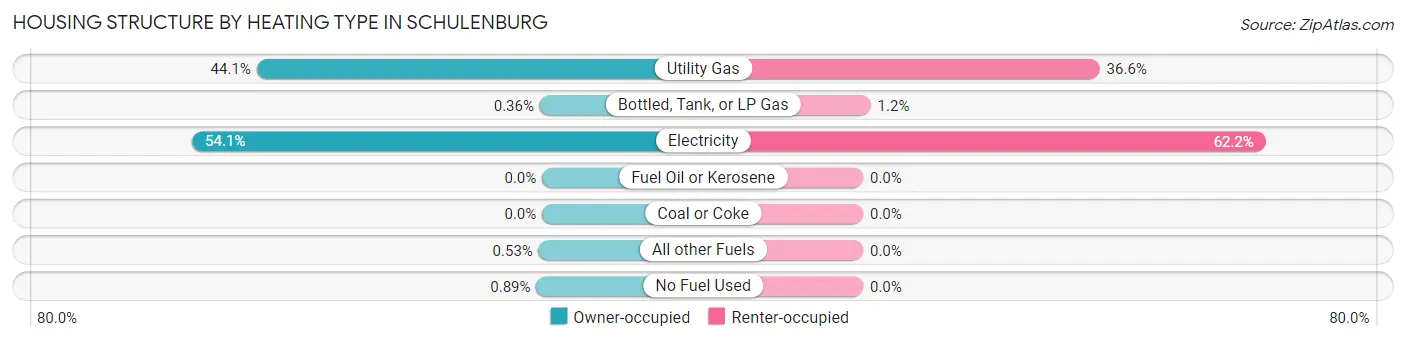
| Heating Type | Owner-occupied | Renter-occupied |
| Utility Gas | 248 (44.1%) | 124 (36.6%) |
| Bottled, Tank, or LP Gas | 2 (0.4%) | 4 (1.2%) |
| Electricity | 304 (54.1%) | 211 (62.2%) |
| Fuel Oil or Kerosene | 0 (0.0%) | 0 (0.0%) |
| Coal or Coke | 0 (0.0%) | 0 (0.0%) |
| All other Fuels | 3 (0.5%) | 0 (0.0%) |
| No Fuel Used | 5 (0.9%) | 0 (0.0%) |
| Total | 562 (100.0%) | 339 (100.0%) |
Household Vehicle Usage in Schulenburg
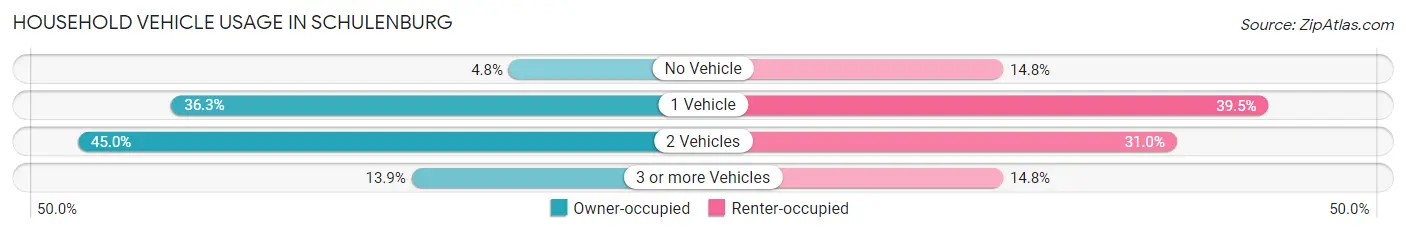
| Vehicles per Household | Owner-occupied | Renter-occupied |
| No Vehicle | 27 (4.8%) | 50 (14.7%) |
| 1 Vehicle | 204 (36.3%) | 134 (39.5%) |
| 2 Vehicles | 253 (45.0%) | 105 (31.0%) |
| 3 or more Vehicles | 78 (13.9%) | 50 (14.7%) |
| Total | 562 (100.0%) | 339 (100.0%) |
Real Estate & Mortgages in Schulenburg
Real Estate and Mortgage Overview in Schulenburg
| Characteristic | Without Mortgage | With Mortgage |
| Housing Units | 386 | 176 |
| Median Property Value | $124,600 | $122,500 |
| Median Household Income | $37,500 | $19 |
| Monthly Housing Costs | $477 | $0 |
| Real Estate Taxes | $1,911 | $14 |
Property Value by Mortgage Status in Schulenburg
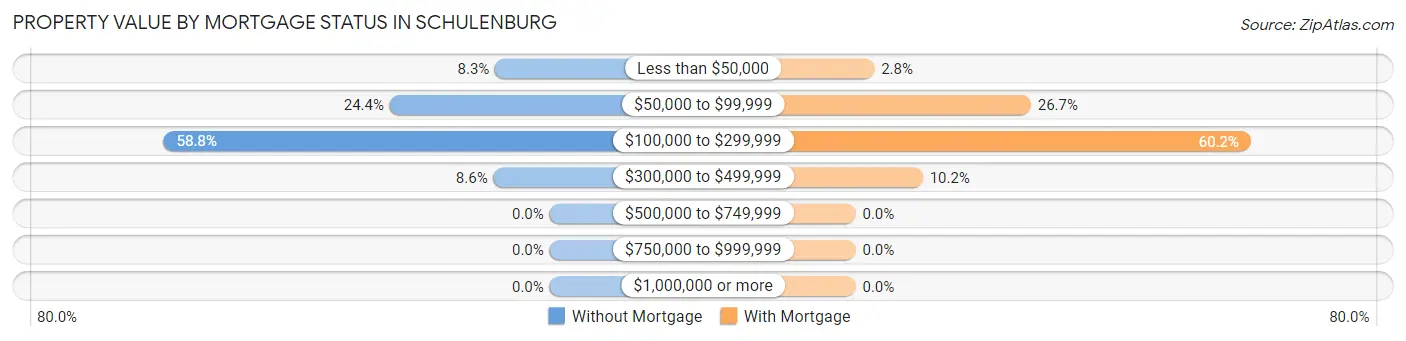
| Property Value | Without Mortgage | With Mortgage |
| Less than $50,000 | 32 (8.3%) | 5 (2.8%) |
| $50,000 to $99,999 | 94 (24.3%) | 47 (26.7%) |
| $100,000 to $299,999 | 227 (58.8%) | 106 (60.2%) |
| $300,000 to $499,999 | 33 (8.6%) | 18 (10.2%) |
| $500,000 to $749,999 | 0 (0.0%) | 0 (0.0%) |
| $750,000 to $999,999 | 0 (0.0%) | 0 (0.0%) |
| $1,000,000 or more | 0 (0.0%) | 0 (0.0%) |
| Total | 386 (100.0%) | 176 (100.0%) |
Household Income by Mortgage Status in Schulenburg
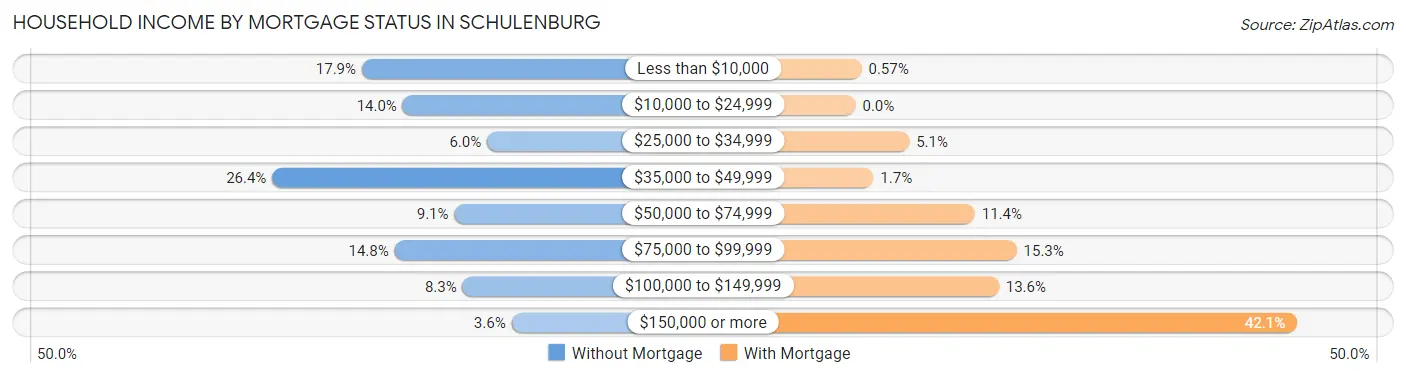
| Household Income | Without Mortgage | With Mortgage |
| Less than $10,000 | 69 (17.9%) | 1 (0.6%) |
| $10,000 to $24,999 | 54 (14.0%) | 0 (0.0%) |
| $25,000 to $34,999 | 23 (6.0%) | 9 (5.1%) |
| $35,000 to $49,999 | 102 (26.4%) | 3 (1.7%) |
| $50,000 to $74,999 | 35 (9.1%) | 20 (11.4%) |
| $75,000 to $99,999 | 57 (14.8%) | 27 (15.3%) |
| $100,000 to $149,999 | 32 (8.3%) | 24 (13.6%) |
| $150,000 or more | 14 (3.6%) | 74 (42.0%) |
| Total | 386 (100.0%) | 176 (100.0%) |
Property Value to Household Income Ratio in Schulenburg
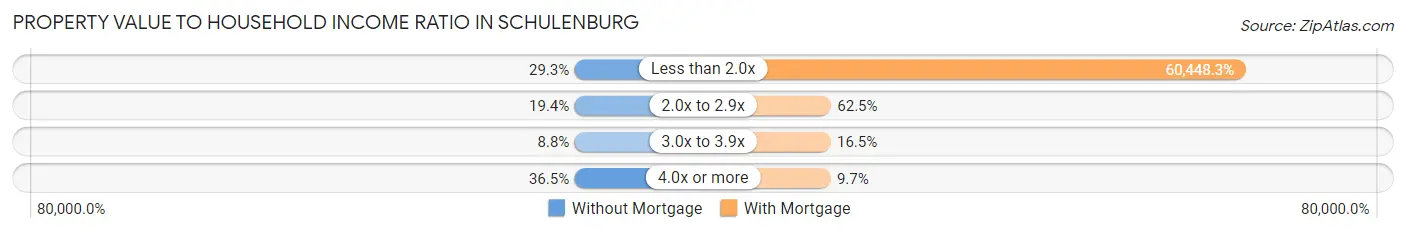
| Value-to-Income Ratio | Without Mortgage | With Mortgage |
| Less than 2.0x | 113 (29.3%) | 106,389 (60,448.3%) |
| 2.0x to 2.9x | 75 (19.4%) | 110 (62.5%) |
| 3.0x to 3.9x | 34 (8.8%) | 29 (16.5%) |
| 4.0x or more | 141 (36.5%) | 17 (9.7%) |
| Total | 386 (100.0%) | 176 (100.0%) |
Real Estate Taxes by Mortgage Status in Schulenburg
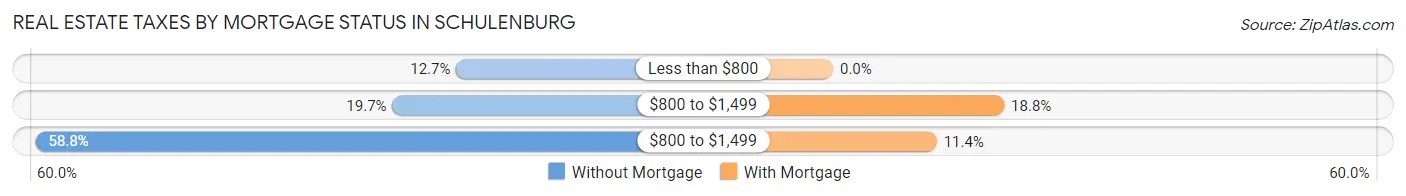
| Property Taxes | Without Mortgage | With Mortgage |
| Less than $800 | 49 (12.7%) | 0 (0.0%) |
| $800 to $1,499 | 76 (19.7%) | 33 (18.8%) |
| $800 to $1,499 | 227 (58.8%) | 20 (11.4%) |
| Total | 386 (100.0%) | 176 (100.0%) |
Health & Disability in Schulenburg
Health Insurance Coverage by Age in Schulenburg
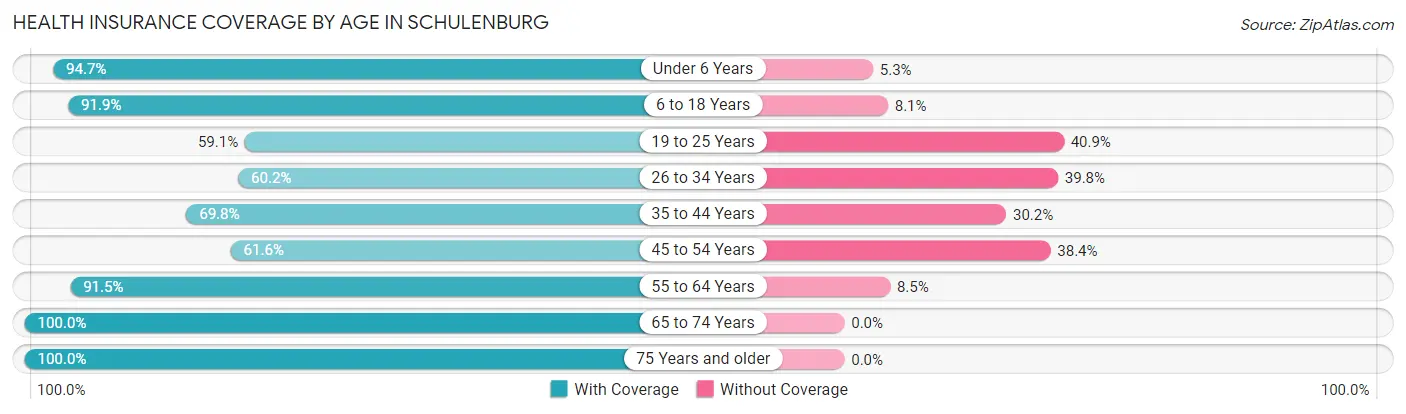
| Age Bracket | With Coverage | Without Coverage |
| Under 6 Years | 284 (94.7%) | 16 (5.3%) |
| 6 to 18 Years | 476 (91.9%) | 42 (8.1%) |
| 19 to 25 Years | 78 (59.1%) | 54 (40.9%) |
| 26 to 34 Years | 139 (60.2%) | 92 (39.8%) |
| 35 to 44 Years | 213 (69.8%) | 92 (30.2%) |
| 45 to 54 Years | 157 (61.6%) | 98 (38.4%) |
| 55 to 64 Years | 301 (91.5%) | 28 (8.5%) |
| 65 to 74 Years | 212 (100.0%) | 0 (0.0%) |
| 75 Years and older | 197 (100.0%) | 0 (0.0%) |
| Total | 2,057 (83.0%) | 422 (17.0%) |
Health Insurance Coverage by Citizenship Status in Schulenburg
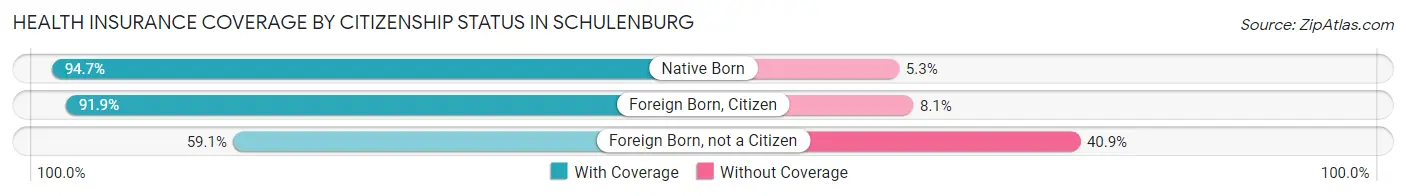
| Citizenship Status | With Coverage | Without Coverage |
| Native Born | 284 (94.7%) | 16 (5.3%) |
| Foreign Born, Citizen | 476 (91.9%) | 42 (8.1%) |
| Foreign Born, not a Citizen | 78 (59.1%) | 54 (40.9%) |
Health Insurance Coverage by Household Income in Schulenburg
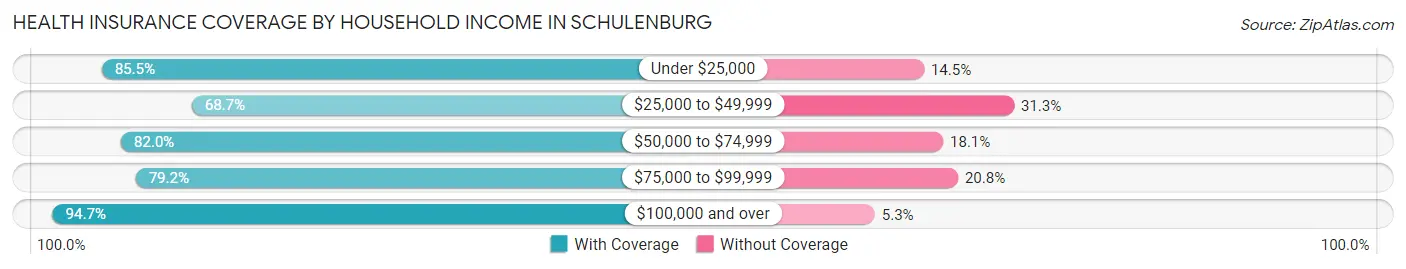
| Household Income | With Coverage | Without Coverage |
| Under $25,000 | 432 (85.5%) | 73 (14.5%) |
| $25,000 to $49,999 | 285 (68.7%) | 130 (31.3%) |
| $50,000 to $74,999 | 286 (82.0%) | 63 (18.0%) |
| $75,000 to $99,999 | 475 (79.2%) | 125 (20.8%) |
| $100,000 and over | 558 (94.7%) | 31 (5.3%) |
Public vs Private Health Insurance Coverage by Age in Schulenburg
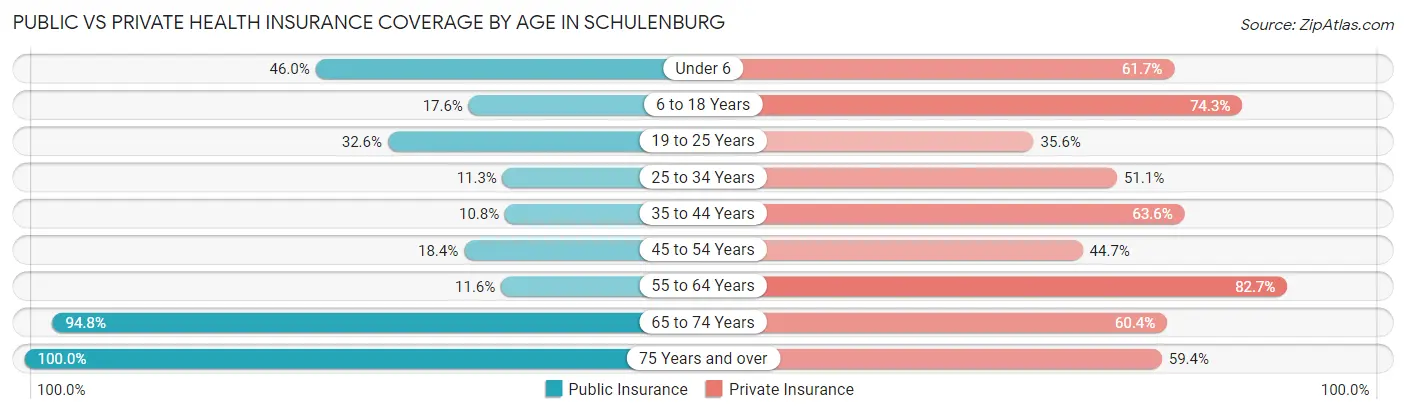
| Age Bracket | Public Insurance | Private Insurance |
| Under 6 | 138 (46.0%) | 185 (61.7%) |
| 6 to 18 Years | 91 (17.6%) | 385 (74.3%) |
| 19 to 25 Years | 43 (32.6%) | 47 (35.6%) |
| 25 to 34 Years | 26 (11.3%) | 118 (51.1%) |
| 35 to 44 Years | 33 (10.8%) | 194 (63.6%) |
| 45 to 54 Years | 47 (18.4%) | 114 (44.7%) |
| 55 to 64 Years | 38 (11.6%) | 272 (82.7%) |
| 65 to 74 Years | 201 (94.8%) | 128 (60.4%) |
| 75 Years and over | 197 (100.0%) | 117 (59.4%) |
| Total | 814 (32.8%) | 1,560 (62.9%) |
Disability Status by Sex by Age in Schulenburg
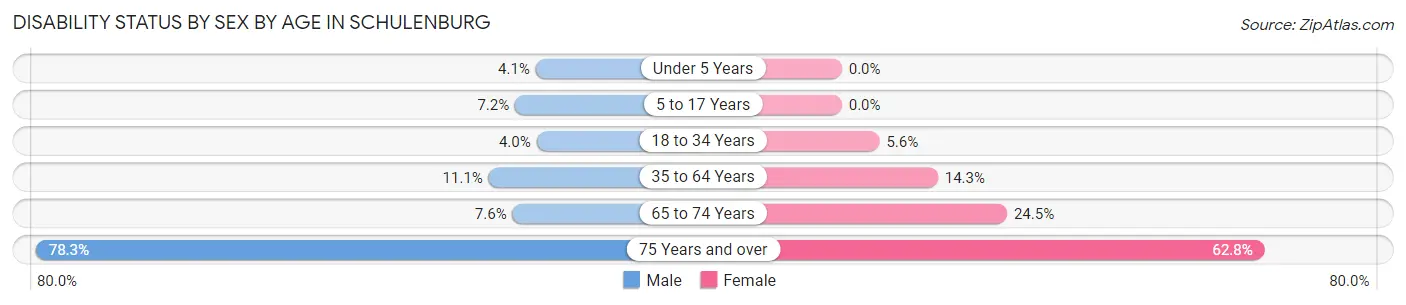
| Age Bracket | Male | Female |
| Under 5 Years | 6 (4.1%) | 0 (0.0%) |
| 5 to 17 Years | 18 (7.2%) | 0 (0.0%) |
| 18 to 34 Years | 10 (4.0%) | 10 (5.6%) |
| 35 to 64 Years | 48 (11.1%) | 65 (14.2%) |
| 65 to 74 Years | 8 (7.5%) | 26 (24.5%) |
| 75 Years and over | 47 (78.3%) | 86 (62.8%) |
Disability Class by Sex by Age in Schulenburg
Disability Class: Hearing Difficulty
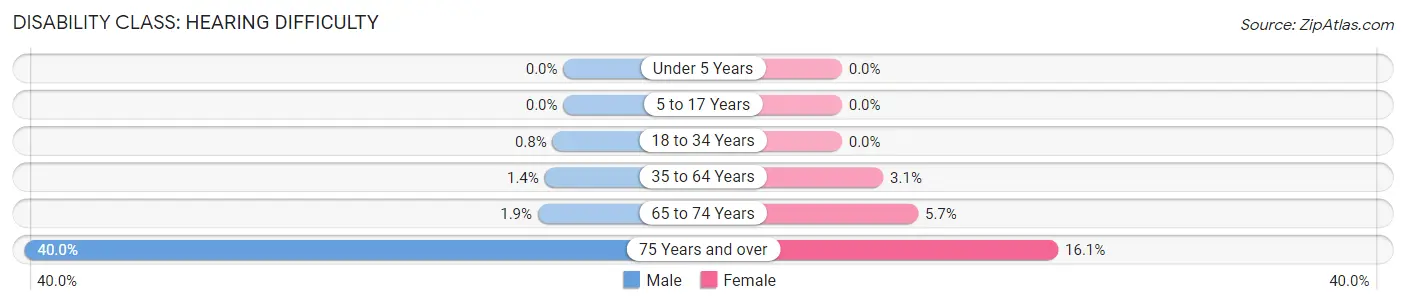
| Age Bracket | Male | Female |
| Under 5 Years | 0 (0.0%) | 0 (0.0%) |
| 5 to 17 Years | 0 (0.0%) | 0 (0.0%) |
| 18 to 34 Years | 2 (0.8%) | 0 (0.0%) |
| 35 to 64 Years | 6 (1.4%) | 14 (3.1%) |
| 65 to 74 Years | 2 (1.9%) | 6 (5.7%) |
| 75 Years and over | 24 (40.0%) | 22 (16.1%) |
Disability Class: Vision Difficulty
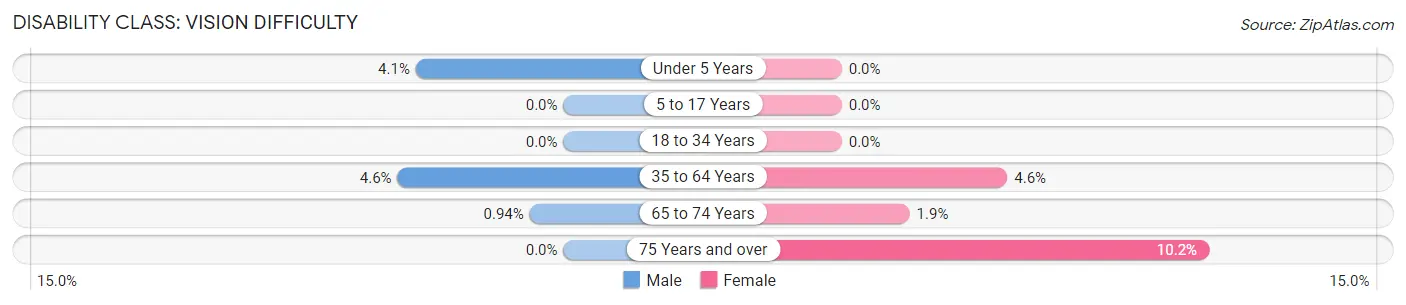
| Age Bracket | Male | Female |
| Under 5 Years | 6 (4.1%) | 0 (0.0%) |
| 5 to 17 Years | 0 (0.0%) | 0 (0.0%) |
| 18 to 34 Years | 0 (0.0%) | 0 (0.0%) |
| 35 to 64 Years | 20 (4.6%) | 21 (4.6%) |
| 65 to 74 Years | 1 (0.9%) | 2 (1.9%) |
| 75 Years and over | 0 (0.0%) | 14 (10.2%) |
Disability Class: Cognitive Difficulty
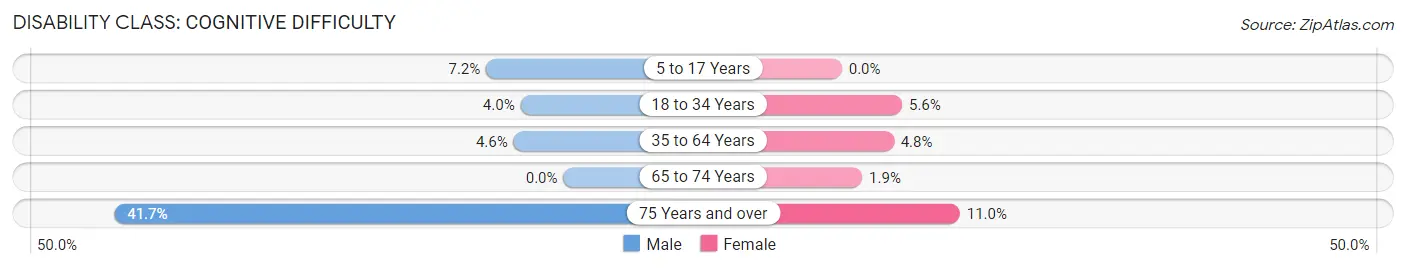
| Age Bracket | Male | Female |
| 5 to 17 Years | 18 (7.2%) | 0 (0.0%) |
| 18 to 34 Years | 10 (4.0%) | 10 (5.6%) |
| 35 to 64 Years | 20 (4.6%) | 22 (4.8%) |
| 65 to 74 Years | 0 (0.0%) | 2 (1.9%) |
| 75 Years and over | 25 (41.7%) | 15 (11.0%) |
Disability Class: Ambulatory Difficulty
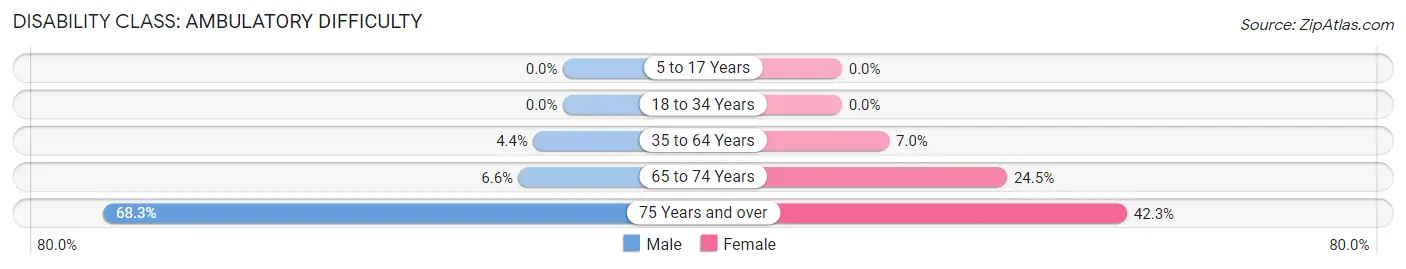
| Age Bracket | Male | Female |
| 5 to 17 Years | 0 (0.0%) | 0 (0.0%) |
| 18 to 34 Years | 0 (0.0%) | 0 (0.0%) |
| 35 to 64 Years | 19 (4.4%) | 32 (7.0%) |
| 65 to 74 Years | 7 (6.6%) | 26 (24.5%) |
| 75 Years and over | 41 (68.3%) | 58 (42.3%) |
Disability Class: Self-Care Difficulty
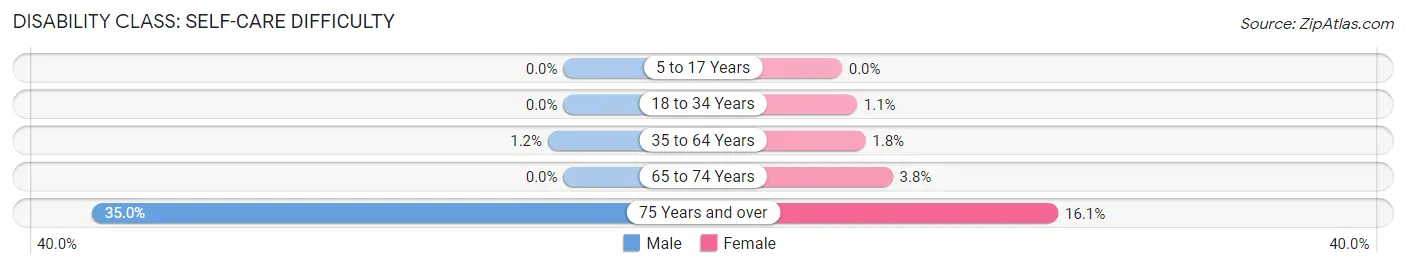
| Age Bracket | Male | Female |
| 5 to 17 Years | 0 (0.0%) | 0 (0.0%) |
| 18 to 34 Years | 0 (0.0%) | 2 (1.1%) |
| 35 to 64 Years | 5 (1.1%) | 8 (1.8%) |
| 65 to 74 Years | 0 (0.0%) | 4 (3.8%) |
| 75 Years and over | 21 (35.0%) | 22 (16.1%) |
Technology Access in Schulenburg
Computing Device Access in Schulenburg
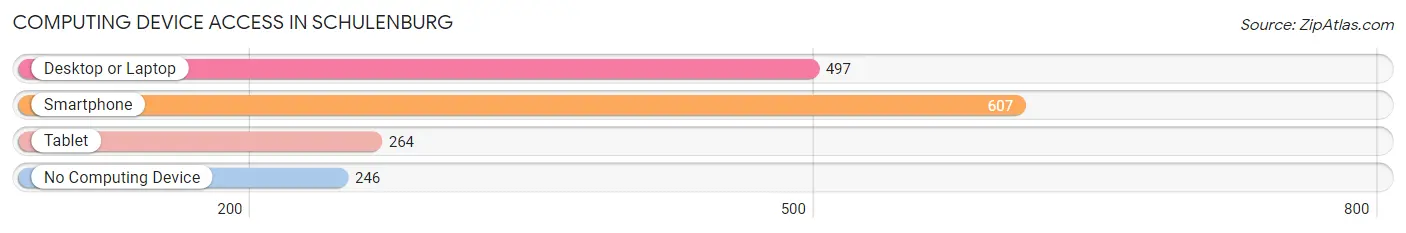
| Device Type | # Households | % Households |
| Desktop or Laptop | 497 | 55.2% |
| Smartphone | 607 | 67.4% |
| Tablet | 264 | 29.3% |
| No Computing Device | 246 | 27.3% |
| Total | 901 | 100.0% |
Internet Access in Schulenburg
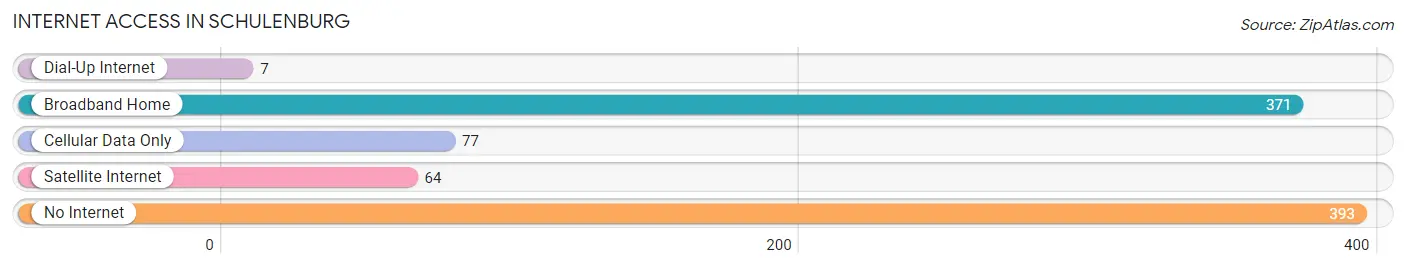
| Internet Type | # Households | % Households |
| Dial-Up Internet | 7 | 0.8% |
| Broadband Home | 371 | 41.2% |
| Cellular Data Only | 77 | 8.6% |
| Satellite Internet | 64 | 7.1% |
| No Internet | 393 | 43.6% |
| Total | 901 | 100.0% |
Schulenburg Summary
Schulenburg, Texas is a small town located in Fayette County, Texas, United States. It is situated about halfway between Houston and San Antonio, and is part of the Greater Houston metropolitan area. The population of Schulenburg was 2,852 at the 2010 census.
History
Schulenburg was founded in 1873 by German immigrants who named the town after a German nobleman, Count Carl of Schulenburg. The town was originally called Schulenburg Station, as it was a stop on the San Antonio and Aransas Pass Railway. The town was incorporated in 1875 and the first post office was established in 1876.
Geography
Schulenburg is located at the intersection of Interstate 10 and U.S. Highway 77, about halfway between Houston and San Antonio. It is situated in the rolling hills of the Blackland Prairie region of Texas. The town is located at an elevation of 441 feet (134 m).
The climate in Schulenburg is humid subtropical, with hot summers and mild winters. The average annual temperature is 68°F (20°C), and the average annual precipitation is 33.3 inches (84.6 cm).
Economy
Schulenburg’s economy is largely based on agriculture and tourism. The town is home to several large farms, including the Schulenburg Dairy, which produces milk, cheese, and other dairy products. The town is also home to several wineries, including the Schulenburg Winery, which produces a variety of wines.
Tourism is an important part of the local economy, with many visitors coming to the town to visit its historic sites, such as the Schulenburg Railroad Museum and the Schulenburg Historical Museum. The town is also home to several festivals, including the Schulenburg Sausage Festival and the Schulenburg Polka Festival.
Demographics
As of the 2010 census, Schulenburg had a population of 2,852. The racial makeup of the town was 79.2% White, 0.7% African American, 0.3% Native American, 0.2% Asian, 0.1% Pacific Islander, 17.7% from other races, and 1.9% from two or more races. Hispanic or Latino of any race were 33.2% of the population.
The median income for a household in Schulenburg was $37,917, and the median income for a family was $45,938. The per capita income for the town was $18,945. About 16.2% of families and 19.2% of the population were below the poverty line, including 25.2% of those under age 18 and 14.2% of those age 65 or over.
Schulenburg is served by the Schulenburg Independent School District, which includes Schulenburg High School. The town is also home to several churches, including the First United Methodist Church, the St. Rose of Lima Catholic Church, and the Schulenburg Baptist Church.
Common Questions
What is Per Capita Income in Schulenburg?
Per Capita income in Schulenburg is $24,189.
What is the Median Family Income in Schulenburg?
Median Family Income in Schulenburg is $71,806.
What is the Median Household income in Schulenburg?
Median Household Income in Schulenburg is $49,969.
What is Income or Wage Gap in Schulenburg?
Income or Wage Gap in Schulenburg is 6.2%.
Women in Schulenburg earn 93.8 cents for every dollar earned by a man.
What is Inequality or Gini Index in Schulenburg?
Inequality or Gini Index in Schulenburg is 0.43.
What is the Total Population of Schulenburg?
Total Population of Schulenburg is 2,679.
What is the Total Male Population of Schulenburg?
Total Male Population of Schulenburg is 1,301.
What is the Total Female Population of Schulenburg?
Total Female Population of Schulenburg is 1,378.
What is the Ratio of Males per 100 Females in Schulenburg?
There are 94.41 Males per 100 Females in Schulenburg.
What is the Ratio of Females per 100 Males in Schulenburg?
There are 105.92 Females per 100 Males in Schulenburg.
What is the Median Population Age in Schulenburg?
Median Population Age in Schulenburg is 40.9 Years.
What is the Average Family Size in Schulenburg
Average Family Size in Schulenburg is 3.7 People.
What is the Average Household Size in Schulenburg
Average Household Size in Schulenburg is 2.7 People.
How Large is the Labor Force in Schulenburg?
There are 1,123 People in the Labor Forcein in Schulenburg.
What is the Percentage of People in the Labor Force in Schulenburg?
56.6% of People are in the Labor Force in Schulenburg.
What is the Unemployment Rate in Schulenburg?
Unemployment Rate in Schulenburg is 6.3%.