San Saba, TX Map & Demographics
San Saba Map
San Saba Overview
$18,312
PER CAPITA INCOME
$53,929
AVG FAMILY INCOME
$43,224
AVG HOUSEHOLD INCOME
16.3%
WAGE / INCOME GAP [ % ]
83.7¢/ $1
WAGE / INCOME GAP [ $ ]
$7,378
FAMILY INCOME DEFICIT
0.40
INEQUALITY / GINI INDEX
3,122
TOTAL POPULATION
1,703
MALE POPULATION
1,419
FEMALE POPULATION
120.01
MALES / 100 FEMALES
83.32
FEMALES / 100 MALES
36.2
MEDIAN AGE
3.3
AVG FAMILY SIZE
2.7
AVG HOUSEHOLD SIZE
1,193
LABOR FORCE [ PEOPLE ]
48.0%
PERCENT IN LABOR FORCE
4.6%
UNEMPLOYMENT RATE
San Saba Zip Codes
San Saba Area Codes
Income in San Saba
Income Overview in San Saba
Per Capita Income in San Saba is $18,312, while median incomes of families and households are $53,929 and $43,224 respectively.
| Characteristic | Number | Measure |
| Per Capita Income | 3,122 | $18,312 |
| Median Family Income | 636 | $53,929 |
| Mean Family Income | 636 | $64,601 |
| Median Household Income | 954 | $43,224 |
| Mean Household Income | 954 | $54,930 |
| Income Deficit | 636 | $7,378 |
| Wage / Income Gap (%) | 3,122 | 16.27% |
| Wage / Income Gap ($) | 3,122 | 83.73¢ per $1 |
| Gini / Inequality Index | 3,122 | 0.40 |
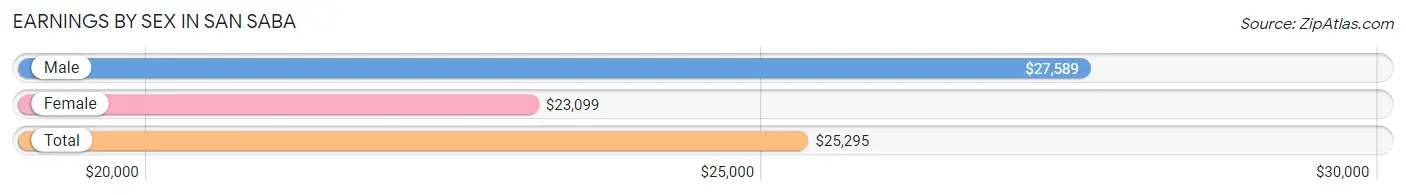
Earnings by Sex in San Saba
Average Earnings in San Saba are $25,295, $27,589 for men and $23,099 for women, a difference of 16.3%.
| Sex | Number | Average Earnings |
| Male | 870 (65.4%) | $27,589 |
| Female | 461 (34.6%) | $23,099 |
| Total | 1,331 (100.0%) | $25,295 |
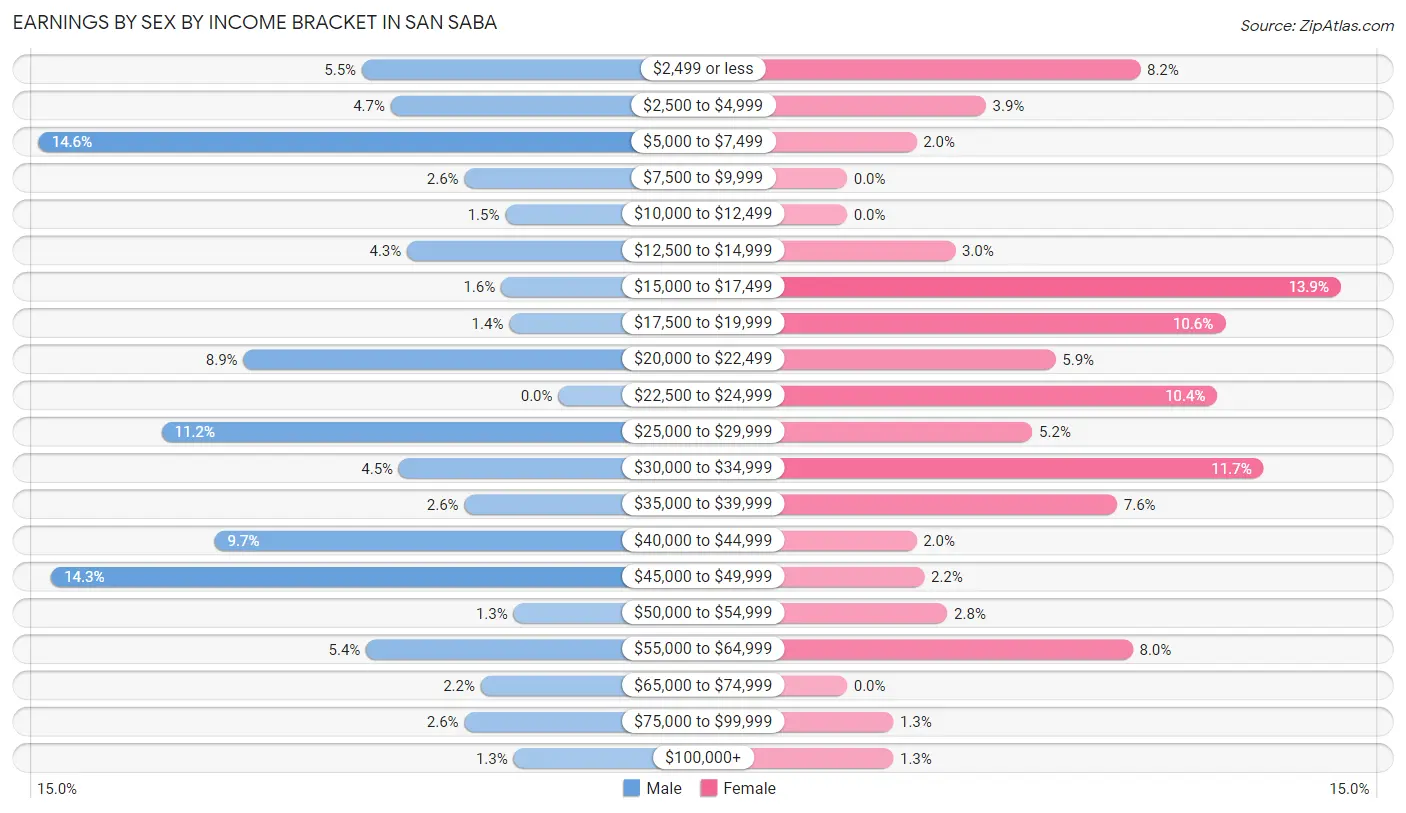
Earnings by Sex by Income Bracket in San Saba
The most common earnings brackets in San Saba are $5,000 to $7,499 for men (127 | 14.6%) and $15,000 to $17,499 for women (64 | 13.9%).
| Income | Male | Female |
| $2,499 or less | 48 (5.5%) | 38 (8.2%) |
| $2,500 to $4,999 | 41 (4.7%) | 18 (3.9%) |
| $5,000 to $7,499 | 127 (14.6%) | 9 (1.9%) |
| $7,500 to $9,999 | 23 (2.6%) | 0 (0.0%) |
| $10,000 to $12,499 | 13 (1.5%) | 0 (0.0%) |
| $12,500 to $14,999 | 37 (4.3%) | 14 (3.0%) |
| $15,000 to $17,499 | 14 (1.6%) | 64 (13.9%) |
| $17,500 to $19,999 | 12 (1.4%) | 49 (10.6%) |
| $20,000 to $22,499 | 77 (8.8%) | 27 (5.9%) |
| $22,500 to $24,999 | 0 (0.0%) | 48 (10.4%) |
| $25,000 to $29,999 | 97 (11.2%) | 24 (5.2%) |
| $30,000 to $34,999 | 39 (4.5%) | 54 (11.7%) |
| $35,000 to $39,999 | 23 (2.6%) | 35 (7.6%) |
| $40,000 to $44,999 | 84 (9.7%) | 9 (1.9%) |
| $45,000 to $49,999 | 124 (14.2%) | 10 (2.2%) |
| $50,000 to $54,999 | 11 (1.3%) | 13 (2.8%) |
| $55,000 to $64,999 | 47 (5.4%) | 37 (8.0%) |
| $65,000 to $74,999 | 19 (2.2%) | 0 (0.0%) |
| $75,000 to $99,999 | 23 (2.6%) | 6 (1.3%) |
| $100,000+ | 11 (1.3%) | 6 (1.3%) |
| Total | 870 (100.0%) | 461 (100.0%) |
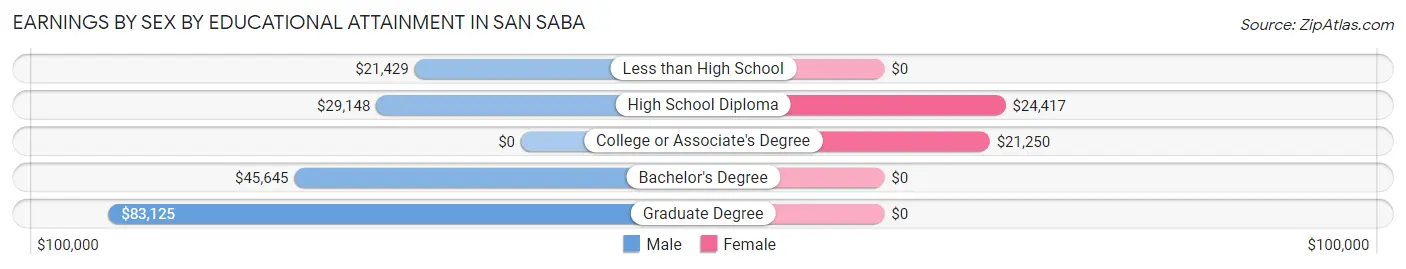
Earnings by Sex by Educational Attainment in San Saba
Average earnings in San Saba are $28,640 for men and $23,542 for women, a difference of 17.8%. Men with an educational attainment of graduate degree enjoy the highest average annual earnings of $83,125, while those with less than high school education earn the least with $21,429. Women with an educational attainment of high school diploma earn the most with the average annual earnings of $24,417, while those with college or associate's degree education have the smallest earnings of $21,250.
| Educational Attainment | Male Income | Female Income |
| Less than High School | $21,429 | $0 |
| High School Diploma | $29,148 | $24,417 |
| College or Associate's Degree | - | - |
| Bachelor's Degree | $45,645 | $0 |
| Graduate Degree | $83,125 | $0 |
| Total | $28,640 | $23,542 |
Family Income in San Saba
Family Income Brackets in San Saba
According to the San Saba family income data, there are 166 families falling into the $50,000 to $74,999 income range, which is the most common income bracket and makes up 26.1% of all families. Conversely, the $150,000 to $199,999 income bracket is the least frequent group with only 6 families (0.9%) belonging to this category.
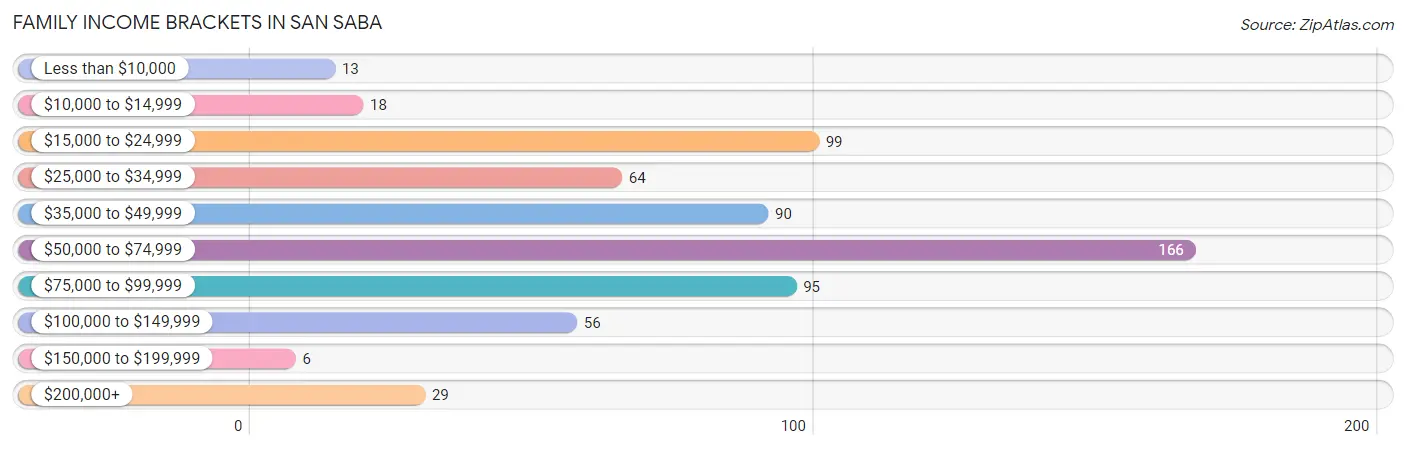
| Income Bracket | # Families | % Families |
| Less than $10,000 | 13 | 2.0% |
| $10,000 to $14,999 | 18 | 2.8% |
| $15,000 to $24,999 | 99 | 15.6% |
| $25,000 to $34,999 | 64 | 10.1% |
| $35,000 to $49,999 | 90 | 14.2% |
| $50,000 to $74,999 | 166 | 26.1% |
| $75,000 to $99,999 | 95 | 14.9% |
| $100,000 to $149,999 | 56 | 8.8% |
| $150,000 to $199,999 | 6 | 0.9% |
| $200,000+ | 29 | 4.6% |
Family Income by Famaliy Size in San Saba
4-person families (168 | 26.4%) account for the highest median family income in San Saba with $64,009 per family, while 2-person families (291 | 45.8%) have the highest median income of $22,299 per family member.
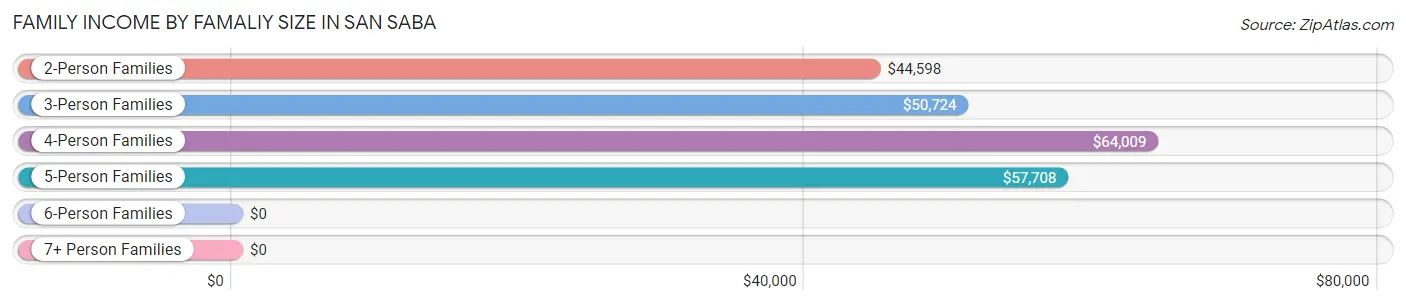
| Income Bracket | # Families | Median Income |
| 2-Person Families | 291 (45.8%) | $44,598 |
| 3-Person Families | 145 (22.8%) | $50,724 |
| 4-Person Families | 168 (26.4%) | $64,009 |
| 5-Person Families | 17 (2.7%) | $57,708 |
| 6-Person Families | 0 (0.0%) | $0 |
| 7+ Person Families | 15 (2.4%) | $0 |
| Total | 636 (100.0%) | $53,929 |
Family Income by Number of Earners in San Saba
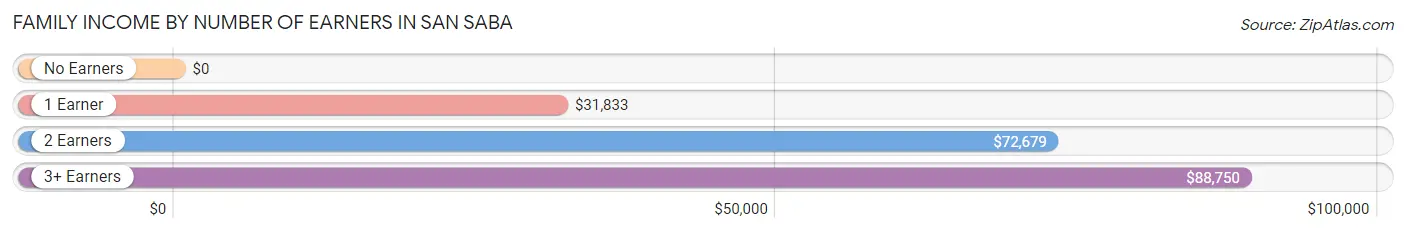
| Number of Earners | # Families | Median Income |
| No Earners | 117 (18.4%) | $0 |
| 1 Earner | 216 (34.0%) | $31,833 |
| 2 Earners | 266 (41.8%) | $72,679 |
| 3+ Earners | 37 (5.8%) | $88,750 |
| Total | 636 (100.0%) | $53,929 |
Household Income in San Saba
Household Income Brackets in San Saba
With 212 households falling in the category, the $50,000 to $74,999 income range is the most frequent in San Saba, accounting for 22.2% of all households. In contrast, only 6 households (0.6%) fall into the $150,000 to $199,999 income bracket, making it the least populous group.
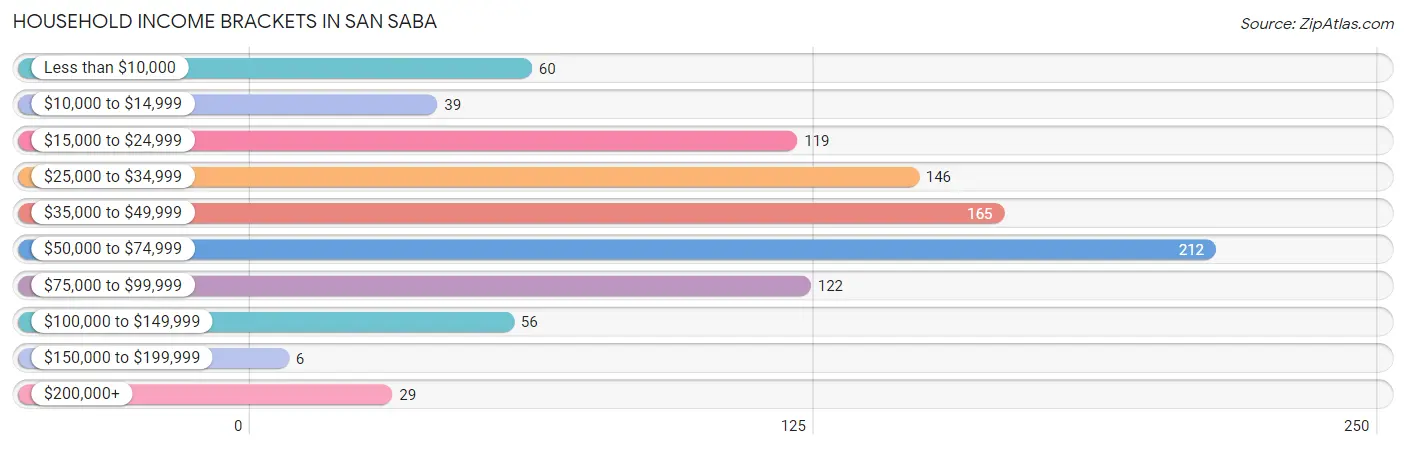
| Income Bracket | # Households | % Households |
| Less than $10,000 | 60 | 6.3% |
| $10,000 to $14,999 | 39 | 4.1% |
| $15,000 to $24,999 | 119 | 12.5% |
| $25,000 to $34,999 | 146 | 15.3% |
| $35,000 to $49,999 | 165 | 17.3% |
| $50,000 to $74,999 | 212 | 22.2% |
| $75,000 to $99,999 | 122 | 12.8% |
| $100,000 to $149,999 | 56 | 5.9% |
| $150,000 to $199,999 | 6 | 0.6% |
| $200,000+ | 29 | 3.0% |
Household Income by Householder Age in San Saba
The median household income in San Saba is $43,224, with the highest median household income of $67,750 found in the 45 to 64 years age bracket for the primary householder. A total of 247 households (25.9%) fall into this category. Meanwhile, the 15 to 24 years age bracket for the primary householder has the lowest median household income of $2,499, with 20 households (2.1%) in this group.
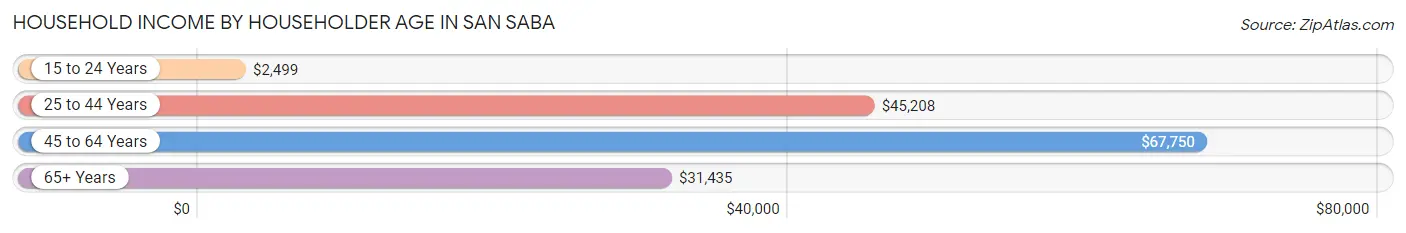
| Income Bracket | # Households | Median Income |
| 15 to 24 Years | 20 (2.1%) | $2,499 |
| 25 to 44 Years | 315 (33.0%) | $45,208 |
| 45 to 64 Years | 247 (25.9%) | $67,750 |
| 65+ Years | 372 (39.0%) | $31,435 |
| Total | 954 (100.0%) | $43,224 |
Poverty in San Saba
Income Below Poverty by Sex and Age in San Saba
With 19.6% poverty level for males and 18.7% for females among the residents of San Saba, 6 to 11 year old males and 35 to 44 year old females are the most vulnerable to poverty, with 58 males (45.7%) and 61 females (42.1%) in their respective age groups living below the poverty level.
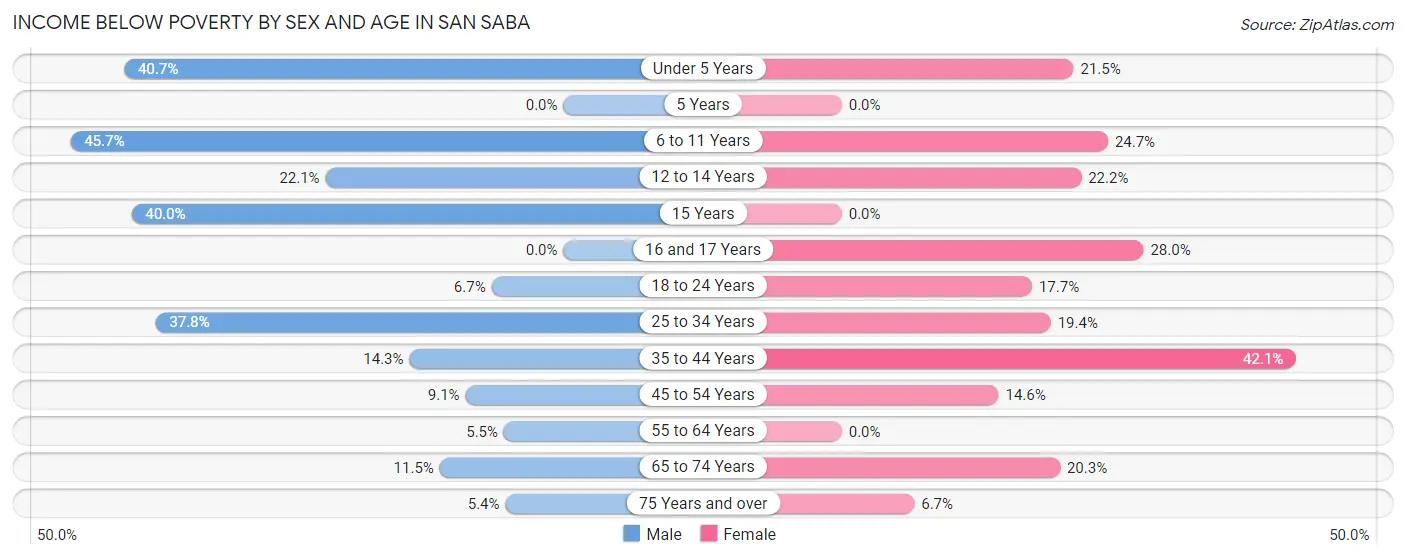
| Age Bracket | Male | Female |
| Under 5 Years | 24 (40.7%) | 20 (21.5%) |
| 5 Years | 0 (0.0%) | 0 (0.0%) |
| 6 to 11 Years | 58 (45.7%) | 41 (24.7%) |
| 12 to 14 Years | 17 (22.1%) | 6 (22.2%) |
| 15 Years | 12 (40.0%) | 0 (0.0%) |
| 16 and 17 Years | 0 (0.0%) | 7 (28.0%) |
| 18 to 24 Years | 10 (6.7%) | 3 (17.6%) |
| 25 to 34 Years | 88 (37.8%) | 19 (19.4%) |
| 35 to 44 Years | 30 (14.3%) | 61 (42.1%) |
| 45 to 54 Years | 6 (9.1%) | 16 (14.5%) |
| 55 to 64 Years | 8 (5.5%) | 0 (0.0%) |
| 65 to 74 Years | 14 (11.5%) | 32 (20.3%) |
| 75 Years and over | 7 (5.4%) | 7 (6.7%) |
| Total | 274 (19.6%) | 212 (18.7%) |
Income Above Poverty by Sex and Age in San Saba
According to the poverty statistics in San Saba, males aged 5 years and females aged 5 years are the age groups that are most secure financially, with 100.0% of males and 100.0% of females in these age groups living above the poverty line.
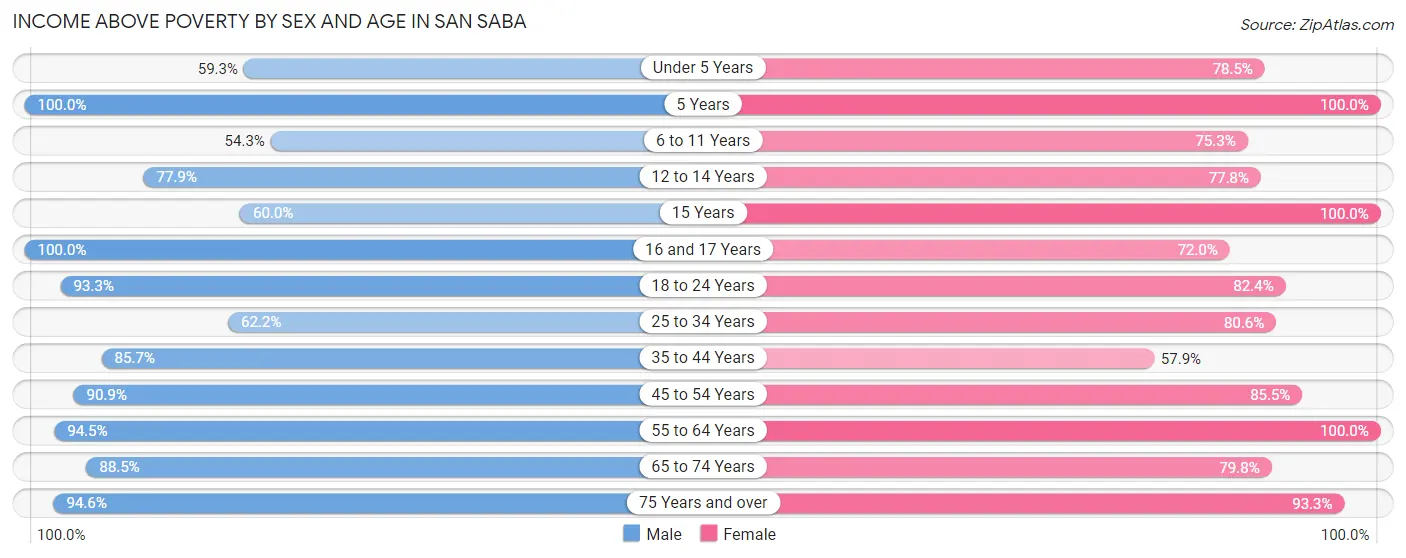
| Age Bracket | Male | Female |
| Under 5 Years | 35 (59.3%) | 73 (78.5%) |
| 5 Years | 13 (100.0%) | 4 (100.0%) |
| 6 to 11 Years | 69 (54.3%) | 125 (75.3%) |
| 12 to 14 Years | 60 (77.9%) | 21 (77.8%) |
| 15 Years | 18 (60.0%) | 12 (100.0%) |
| 16 and 17 Years | 35 (100.0%) | 18 (72.0%) |
| 18 to 24 Years | 140 (93.3%) | 14 (82.4%) |
| 25 to 34 Years | 145 (62.2%) | 79 (80.6%) |
| 35 to 44 Years | 180 (85.7%) | 84 (57.9%) |
| 45 to 54 Years | 60 (90.9%) | 94 (85.5%) |
| 55 to 64 Years | 137 (94.5%) | 172 (100.0%) |
| 65 to 74 Years | 108 (88.5%) | 126 (79.7%) |
| 75 Years and over | 123 (94.6%) | 97 (93.3%) |
| Total | 1,123 (80.4%) | 919 (81.3%) |
Income Below Poverty Among Married-Couple Families in San Saba
The poverty statistics for married-couple families in San Saba show that 10.2% or 50 of the total 490 families live below the poverty line. Families with 3 or 4 children have the highest poverty rate of 27.6%, comprising of 8 families. On the other hand, families with no children have the lowest poverty rate of 2.7%, which includes 7 families.
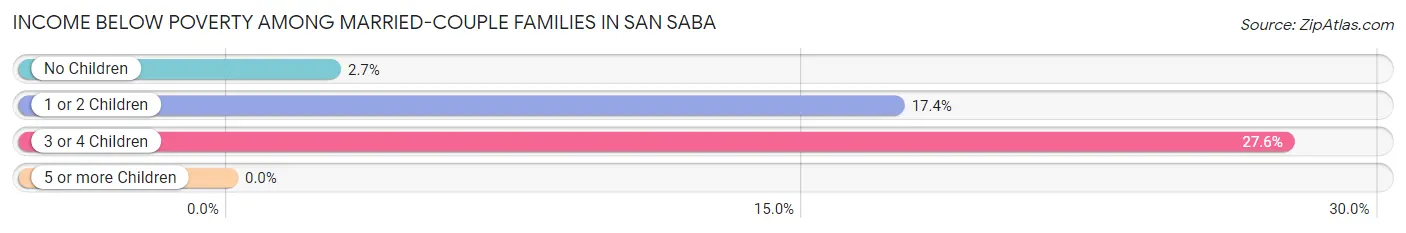
| Children | Above Poverty | Below Poverty |
| No Children | 253 (97.3%) | 7 (2.7%) |
| 1 or 2 Children | 166 (82.6%) | 35 (17.4%) |
| 3 or 4 Children | 21 (72.4%) | 8 (27.6%) |
| 5 or more Children | 0 (0.0%) | 0 (0.0%) |
| Total | 440 (89.8%) | 50 (10.2%) |
Income Below Poverty Among Single-Parent Households in San Saba
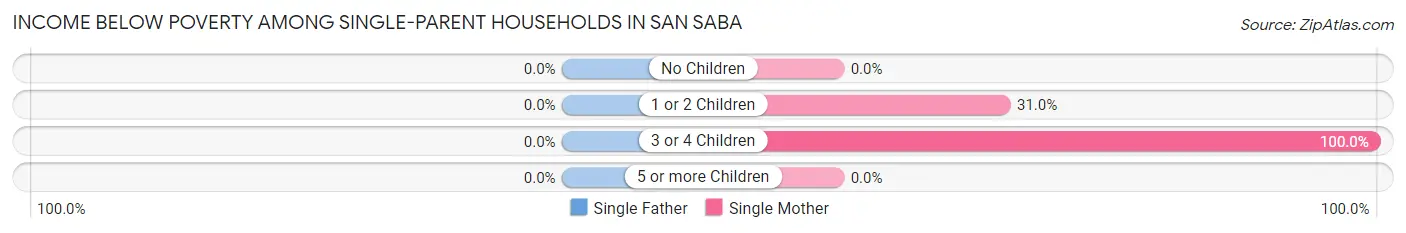
| Children | Single Father | Single Mother |
| No Children | 0 (0.0%) | 0 (0.0%) |
| 1 or 2 Children | 0 (0.0%) | 22 (31.0%) |
| 3 or 4 Children | 0 (0.0%) | 6 (100.0%) |
| 5 or more Children | 0 (0.0%) | 0 (0.0%) |
| Total | 0 (0.0%) | 28 (26.7%) |
Income Below Poverty Among Married-Couple vs Single-Parent Households in San Saba
The poverty data for San Saba shows that 50 of the married-couple family households (10.2%) and 28 of the single-parent households (19.2%) are living below the poverty level. Within the married-couple family households, those with 3 or 4 children have the highest poverty rate, with 8 households (27.6%) falling below the poverty line. Among the single-parent households, those with 3 or 4 children have the highest poverty rate, with 6 household (100.0%) living below poverty.
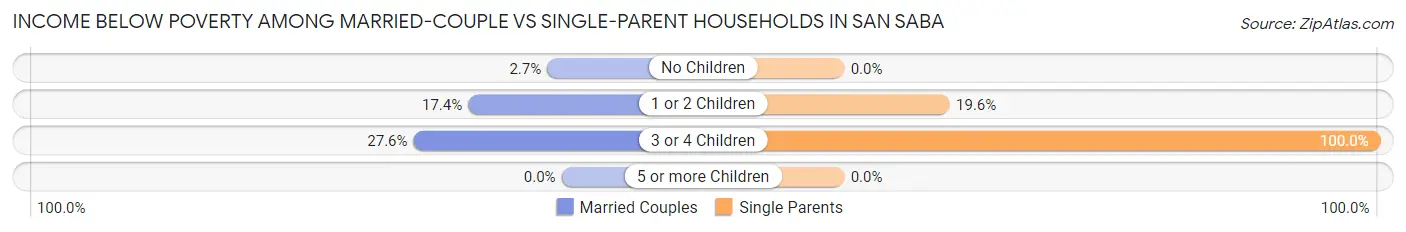
| Children | Married-Couple Families | Single-Parent Households |
| No Children | 7 (2.7%) | 0 (0.0%) |
| 1 or 2 Children | 35 (17.4%) | 22 (19.6%) |
| 3 or 4 Children | 8 (27.6%) | 6 (100.0%) |
| 5 or more Children | 0 (0.0%) | 0 (0.0%) |
| Total | 50 (10.2%) | 28 (19.2%) |
Race in San Saba
The most populous races in San Saba are White / Caucasian (2,397 | 76.8%), Hispanic or Latino (1,437 | 46.0%), and Two or more Races (351 | 11.2%).
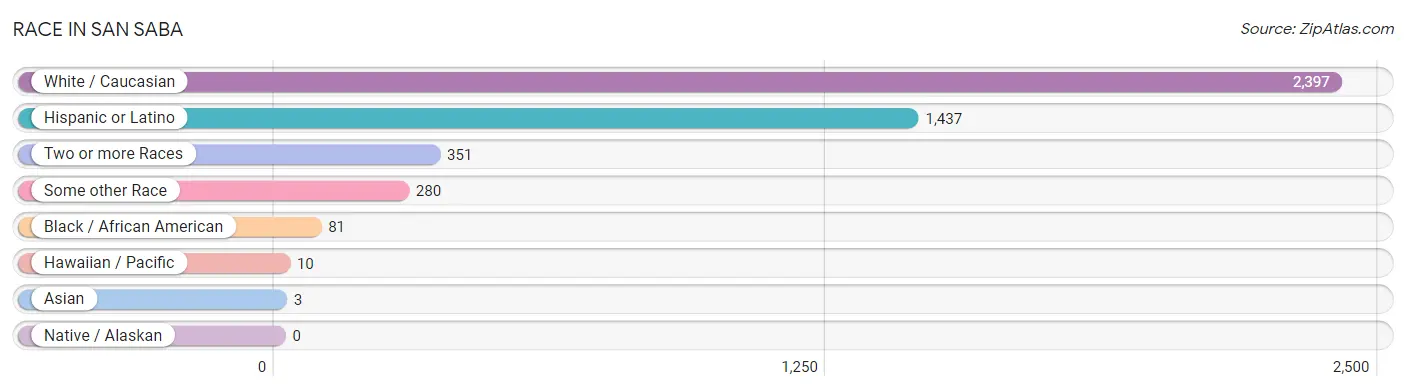
| Race | # Population | % Population |
| Asian | 3 | 0.1% |
| Black / African American | 81 | 2.6% |
| Hawaiian / Pacific | 10 | 0.3% |
| Hispanic or Latino | 1,437 | 46.0% |
| Native / Alaskan | 0 | 0.0% |
| White / Caucasian | 2,397 | 76.8% |
| Two or more Races | 351 | 11.2% |
| Some other Race | 280 | 9.0% |
| Total | 3,122 | 100.0% |
Ancestry in San Saba
The most populous ancestries reported in San Saba are Mexican (1,359 | 43.5%), German (370 | 11.8%), Irish (286 | 9.2%), English (263 | 8.4%), and American (168 | 5.4%), together accounting for 78.3% of all San Saba residents.
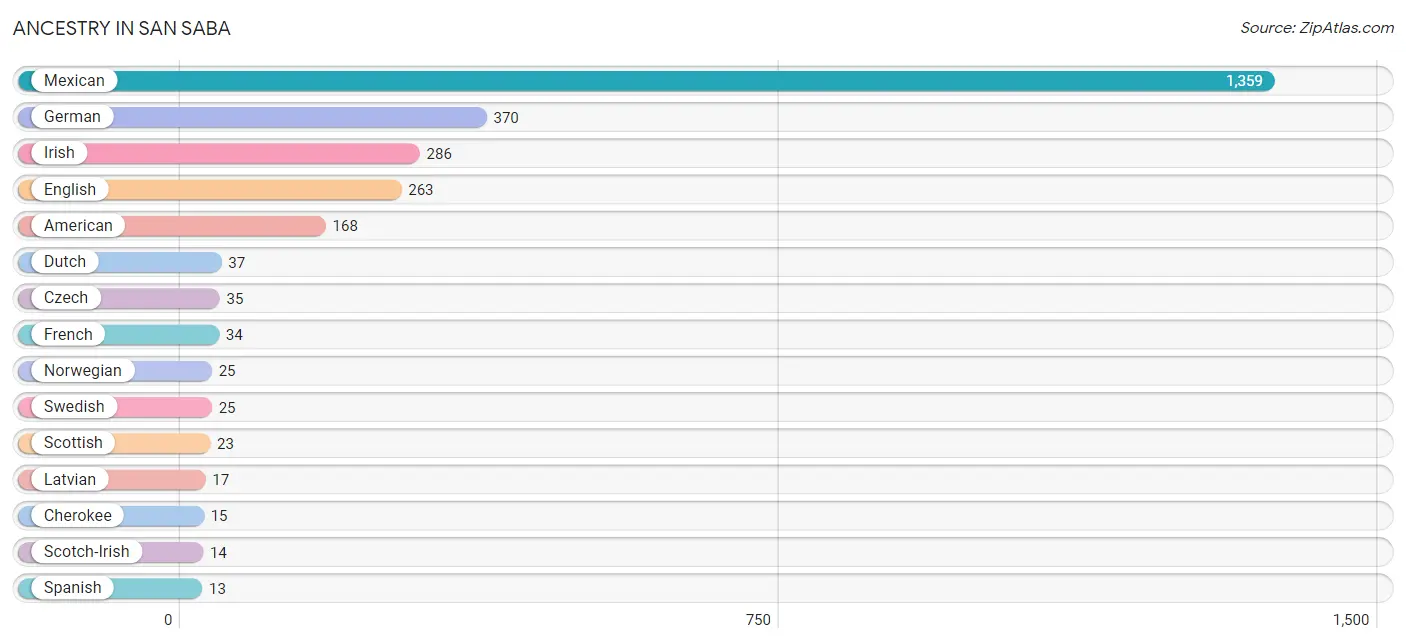
| Ancestry | # Population | % Population |
| African | 9 | 0.3% |
| American | 168 | 5.4% |
| Central American | 9 | 0.3% |
| Cherokee | 15 | 0.5% |
| Chickasaw | 11 | 0.4% |
| Comanche | 6 | 0.2% |
| Czech | 35 | 1.1% |
| Dominican | 11 | 0.4% |
| Dutch | 37 | 1.2% |
| English | 263 | 8.4% |
| French | 34 | 1.1% |
| German | 370 | 11.8% |
| Irish | 286 | 9.2% |
| Italian | 5 | 0.2% |
| Latvian | 17 | 0.5% |
| Mexican | 1,359 | 43.5% |
| Mexican American Indian | 5 | 0.2% |
| Norwegian | 25 | 0.8% |
| Polish | 8 | 0.3% |
| Russian | 8 | 0.3% |
| Salvadoran | 9 | 0.3% |
| Scotch-Irish | 14 | 0.4% |
| Scottish | 23 | 0.7% |
| Shoshone | 10 | 0.3% |
| Slavic | 8 | 0.3% |
| South American | 7 | 0.2% |
| Spanish | 13 | 0.4% |
| Sri Lankan | 3 | 0.1% |
| Subsaharan African | 9 | 0.3% |
| Swedish | 25 | 0.8% |
| Tongan | 10 | 0.3% |
| Venezuelan | 7 | 0.2% |
| Welsh | 11 | 0.4% | View All 33 Rows |
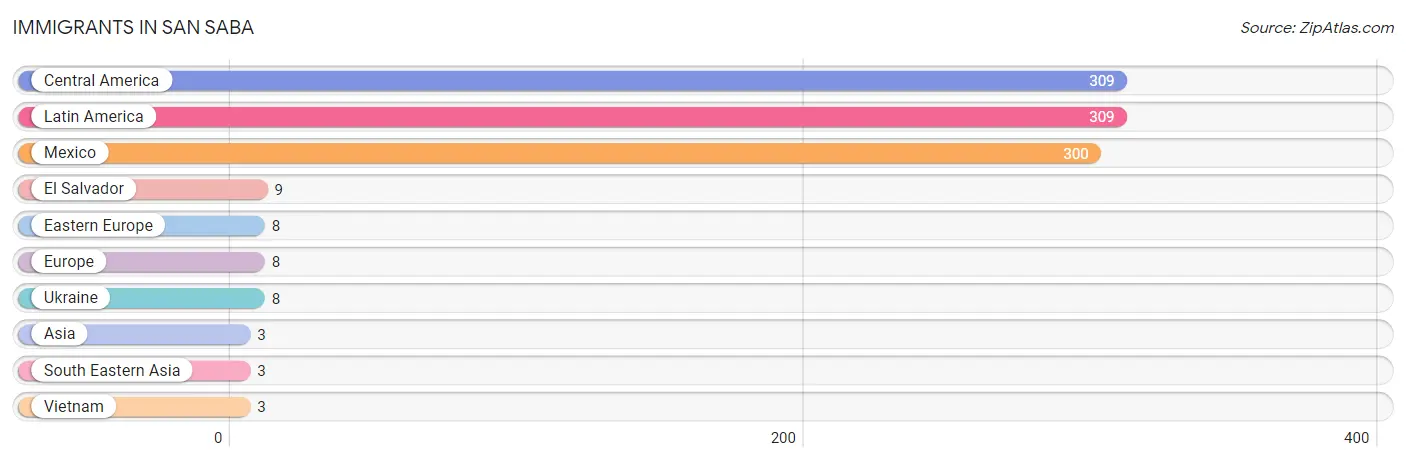
Immigrants in San Saba
The most numerous immigrant groups reported in San Saba came from Central America (309 | 9.9%), Latin America (309 | 9.9%), Mexico (300 | 9.6%), El Salvador (9 | 0.3%), and Eastern Europe (8 | 0.3%), together accounting for 30.0% of all San Saba residents.
| Immigration Origin | # Population | % Population |
| Asia | 3 | 0.1% |
| Central America | 309 | 9.9% |
| Eastern Europe | 8 | 0.3% |
| El Salvador | 9 | 0.3% |
| Europe | 8 | 0.3% |
| Latin America | 309 | 9.9% |
| Mexico | 300 | 9.6% |
| South Eastern Asia | 3 | 0.1% |
| Ukraine | 8 | 0.3% |
| Vietnam | 3 | 0.1% | View All 10 Rows |
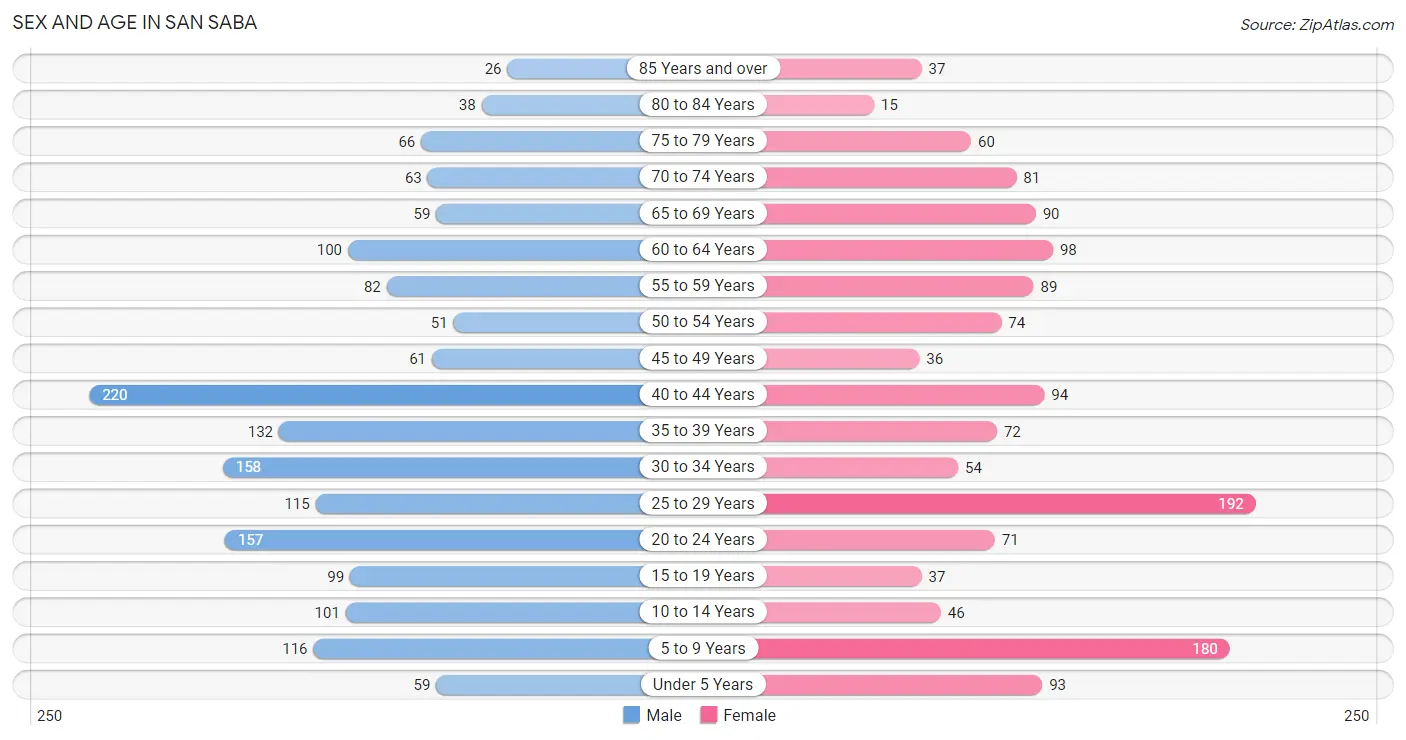
Sex and Age in San Saba
Sex and Age in San Saba
The most populous age groups in San Saba are 40 to 44 Years (220 | 12.9%) for men and 25 to 29 Years (192 | 13.5%) for women.
| Age Bracket | Male | Female |
| Under 5 Years | 59 (3.5%) | 93 (6.6%) |
| 5 to 9 Years | 116 (6.8%) | 180 (12.7%) |
| 10 to 14 Years | 101 (5.9%) | 46 (3.2%) |
| 15 to 19 Years | 99 (5.8%) | 37 (2.6%) |
| 20 to 24 Years | 157 (9.2%) | 71 (5.0%) |
| 25 to 29 Years | 115 (6.8%) | 192 (13.5%) |
| 30 to 34 Years | 158 (9.3%) | 54 (3.8%) |
| 35 to 39 Years | 132 (7.7%) | 72 (5.1%) |
| 40 to 44 Years | 220 (12.9%) | 94 (6.6%) |
| 45 to 49 Years | 61 (3.6%) | 36 (2.5%) |
| 50 to 54 Years | 51 (3.0%) | 74 (5.2%) |
| 55 to 59 Years | 82 (4.8%) | 89 (6.3%) |
| 60 to 64 Years | 100 (5.9%) | 98 (6.9%) |
| 65 to 69 Years | 59 (3.5%) | 90 (6.3%) |
| 70 to 74 Years | 63 (3.7%) | 81 (5.7%) |
| 75 to 79 Years | 66 (3.9%) | 60 (4.2%) |
| 80 to 84 Years | 38 (2.2%) | 15 (1.1%) |
| 85 Years and over | 26 (1.5%) | 37 (2.6%) |
| Total | 1,703 (100.0%) | 1,419 (100.0%) |
Families and Households in San Saba
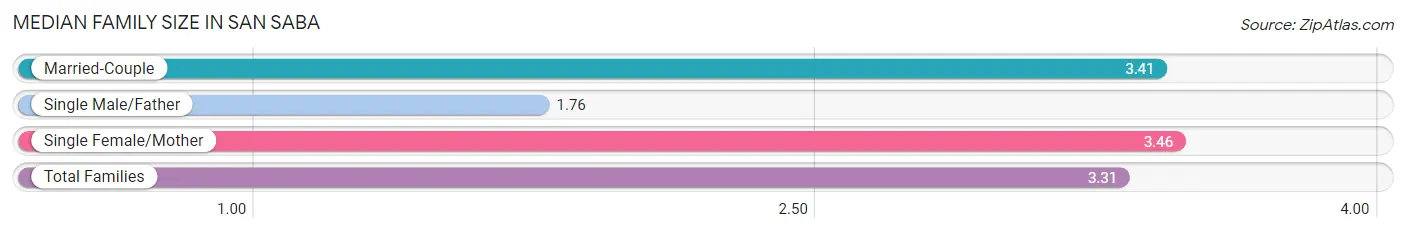
Median Family Size in San Saba
The median family size in San Saba is 3.31 persons per family, with single female/mother families (105 | 16.5%) accounting for the largest median family size of 3.46 persons per family. On the other hand, single male/father families (41 | 6.5%) represent the smallest median family size with 1.76 persons per family.
| Family Type | # Families | Family Size |
| Married-Couple | 490 (77.0%) | 3.41 |
| Single Male/Father | 41 (6.5%) | 1.76 |
| Single Female/Mother | 105 (16.5%) | 3.46 |
| Total Families | 636 (100.0%) | 3.31 |
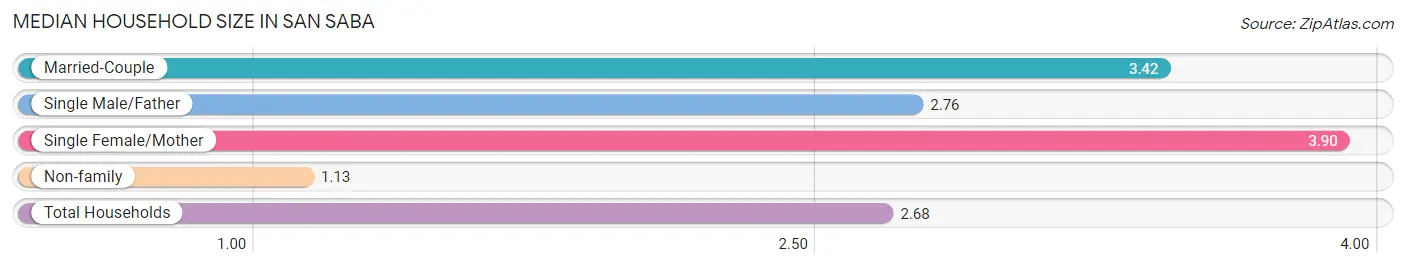
Median Household Size in San Saba
The median household size in San Saba is 2.68 persons per household, with single female/mother households (105 | 11.0%) accounting for the largest median household size of 3.9 persons per household. non-family households (318 | 33.3%) represent the smallest median household size with 1.13 persons per household.
| Household Type | # Households | Household Size |
| Married-Couple | 490 (51.4%) | 3.42 |
| Single Male/Father | 41 (4.3%) | 2.76 |
| Single Female/Mother | 105 (11.0%) | 3.90 |
| Non-family | 318 (33.3%) | 1.13 |
| Total Households | 954 (100.0%) | 2.68 |
Household Size by Marriage Status in San Saba
Out of a total of 954 households in San Saba, 636 (66.7%) are family households, while 318 (33.3%) are nonfamily households. The most numerous type of family households are 2-person households, comprising 247, and the most common type of nonfamily households are 1-person households, comprising 289.
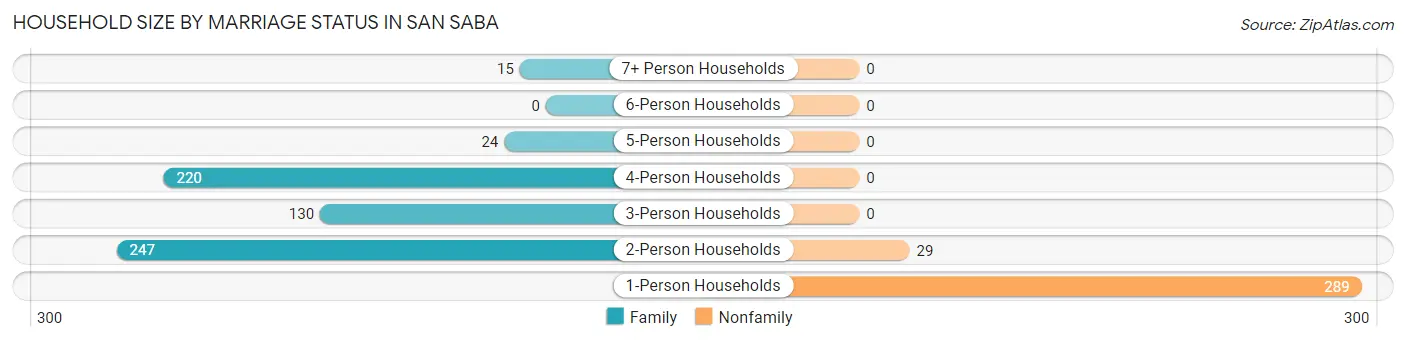
| Household Size | Family Households | Nonfamily Households |
| 1-Person Households | - | 289 (30.3%) |
| 2-Person Households | 247 (25.9%) | 29 (3.0%) |
| 3-Person Households | 130 (13.6%) | 0 (0.0%) |
| 4-Person Households | 220 (23.1%) | 0 (0.0%) |
| 5-Person Households | 24 (2.5%) | 0 (0.0%) |
| 6-Person Households | 0 (0.0%) | 0 (0.0%) |
| 7+ Person Households | 15 (1.6%) | 0 (0.0%) |
| Total | 636 (66.7%) | 318 (33.3%) |
Female Fertility in San Saba
Fertility by Age in San Saba
Average fertility rate in San Saba is 65.0 births per 1,000 women. Women in the age bracket of 20 to 34 years have the highest fertility rate with 73.0 births per 1,000 women. Women in the age bracket of 20 to 34 years acount for 63.9% of all women with births.
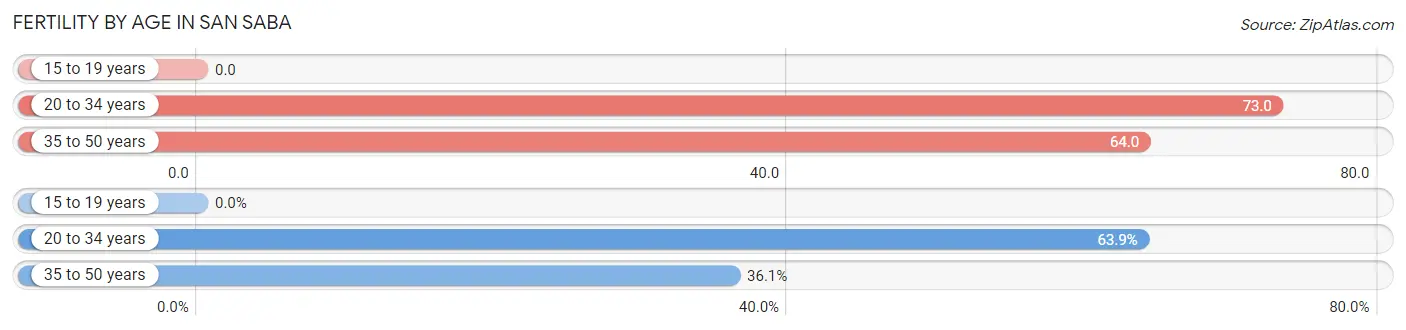
| Age Bracket | Women with Births | Births / 1,000 Women |
| 15 to 19 years | 0 (0.0%) | 0.0 |
| 20 to 34 years | 23 (63.9%) | 73.0 |
| 35 to 50 years | 13 (36.1%) | 64.0 |
| Total | 36 (100.0%) | 65.0 |
Fertility by Age by Marriage Status in San Saba
41.7% of women with births (36) in San Saba are married. The highest percentage of unmarried women with births falls into 20 to 34 years age bracket with 91.3% of them unmarried at the time of birth, while the lowest percentage of unmarried women with births belong to 35 to 50 years age bracket with 0.0% of them unmarried.
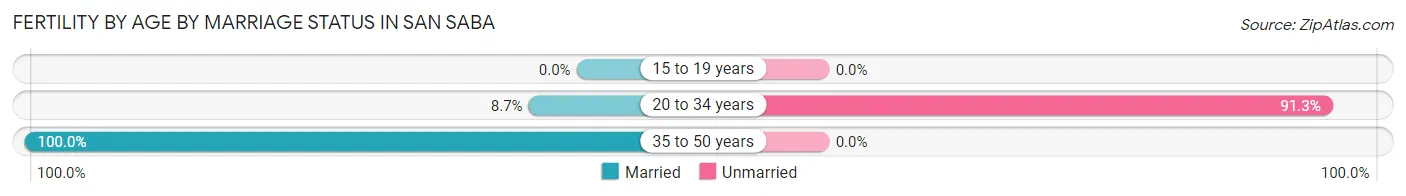
| Age Bracket | Married | Unmarried |
| 15 to 19 years | 0 (0.0%) | 0 (0.0%) |
| 20 to 34 years | 2 (8.7%) | 21 (91.3%) |
| 35 to 50 years | 13 (100.0%) | 0 (0.0%) |
| Total | 15 (41.7%) | 21 (58.3%) |
Fertility by Education in San Saba
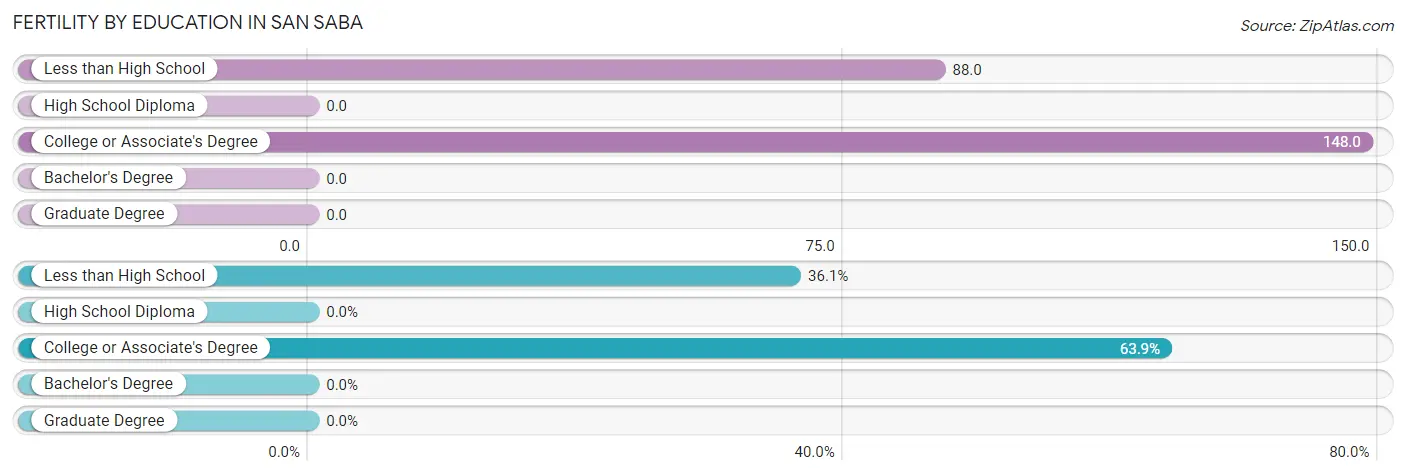
| Educational Attainment | Women with Births | Births / 1,000 Women |
| Less than High School | 13 (36.1%) | 88.0 |
| High School Diploma | 0 (0.0%) | 0.0 |
| College or Associate's Degree | 23 (63.9%) | 148.0 |
| Bachelor's Degree | 0 (0.0%) | 0.0 |
| Graduate Degree | 0 (0.0%) | 0.0 |
| Total | 36 (100.0%) | 65.0 |
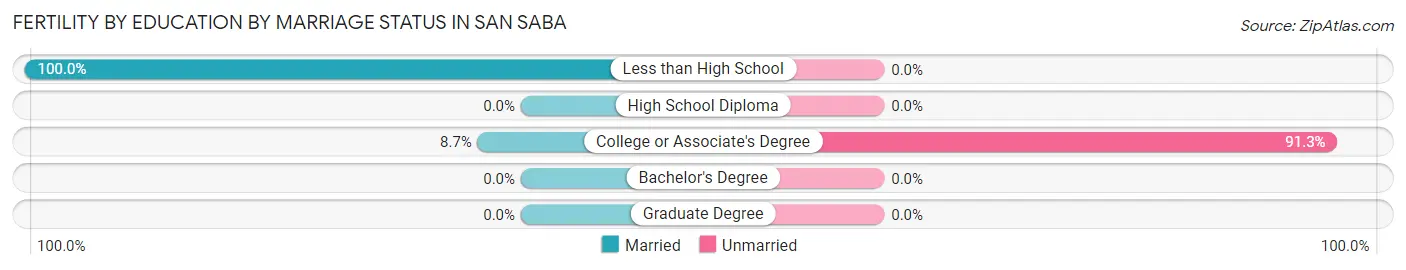
Fertility by Education by Marriage Status in San Saba
58.3% of women with births in San Saba are unmarried. Women with the educational attainment of less than high school are most likely to be married with 100.0% of them married at childbirth, while women with the educational attainment of college or associate's degree are least likely to be married with 91.3% of them unmarried at childbirth.
| Educational Attainment | Married | Unmarried |
| Less than High School | 13 (100.0%) | 0 (0.0%) |
| High School Diploma | 0 (0.0%) | 0 (0.0%) |
| College or Associate's Degree | 2 (8.7%) | 21 (91.3%) |
| Bachelor's Degree | 0 (0.0%) | 0 (0.0%) |
| Graduate Degree | 0 (0.0%) | 0 (0.0%) |
| Total | 15 (41.7%) | 21 (58.3%) |
Employment Characteristics in San Saba
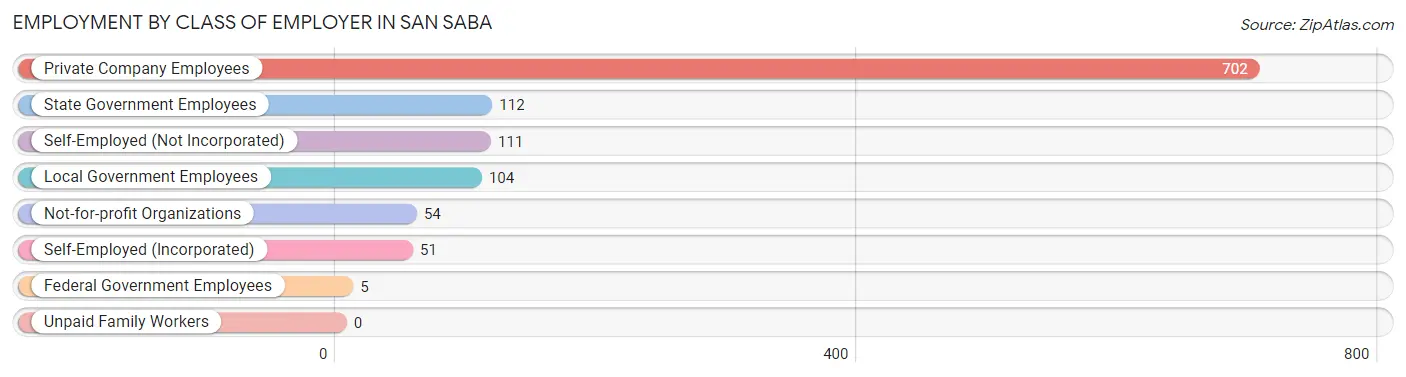
Employment by Class of Employer in San Saba
Among the 1,139 employed individuals in San Saba, private company employees (702 | 61.6%), state government employees (112 | 9.8%), and self-employed (not incorporated) (111 | 9.8%) make up the most common classes of employment.
| Employer Class | # Employees | % Employees |
| Private Company Employees | 702 | 61.6% |
| Self-Employed (Incorporated) | 51 | 4.5% |
| Self-Employed (Not Incorporated) | 111 | 9.8% |
| Not-for-profit Organizations | 54 | 4.7% |
| Local Government Employees | 104 | 9.1% |
| State Government Employees | 112 | 9.8% |
| Federal Government Employees | 5 | 0.4% |
| Unpaid Family Workers | 0 | 0.0% |
| Total | 1,139 | 100.0% |
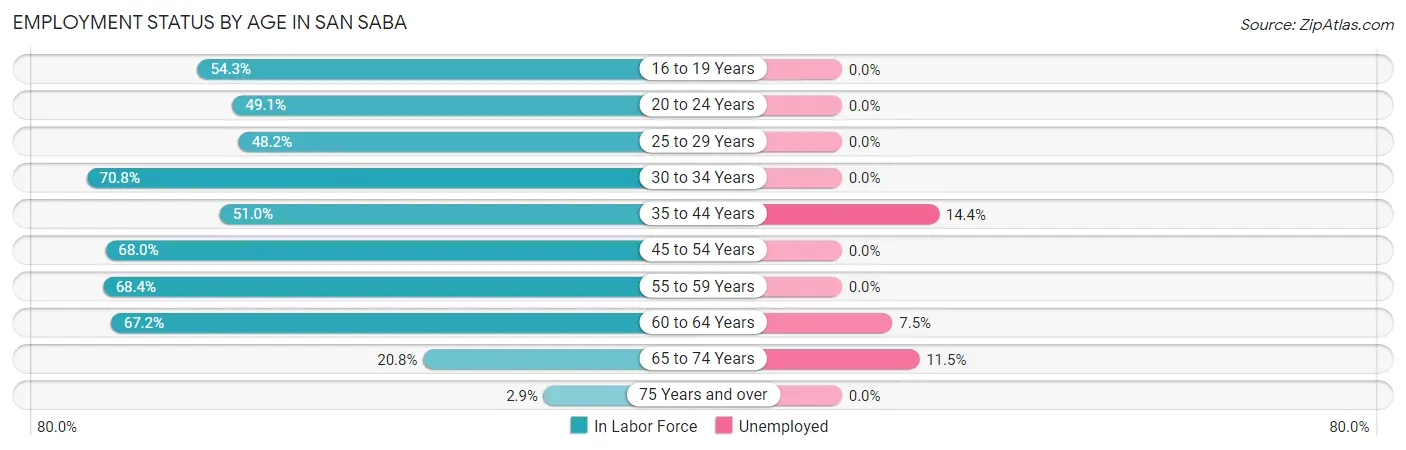
Employment Status by Age in San Saba
According to the labor force statistics for San Saba, out of the total population over 16 years of age (2,485), 48.0% or 1,193 individuals are in the labor force, with 4.6% or 55 of them unemployed. The age group with the highest labor force participation rate is 30 to 34 years, with 70.8% or 150 individuals in the labor force. Within the labor force, the 35 to 44 years age range has the highest percentage of unemployed individuals, with 14.4% or 38 of them being unemployed.
| Age Bracket | In Labor Force | Unemployed |
| 16 to 19 Years | 51 (54.3%) | 0 (0.0%) |
| 20 to 24 Years | 112 (49.1%) | 0 (0.0%) |
| 25 to 29 Years | 148 (48.2%) | 0 (0.0%) |
| 30 to 34 Years | 150 (70.8%) | 0 (0.0%) |
| 35 to 44 Years | 264 (51.0%) | 38 (14.4%) |
| 45 to 54 Years | 151 (68.0%) | 0 (0.0%) |
| 55 to 59 Years | 117 (68.4%) | 0 (0.0%) |
| 60 to 64 Years | 133 (67.2%) | 10 (7.5%) |
| 65 to 74 Years | 61 (20.8%) | 7 (11.5%) |
| 75 Years and over | 7 (2.9%) | 0 (0.0%) |
| Total | 1,193 (48.0%) | 55 (4.6%) |
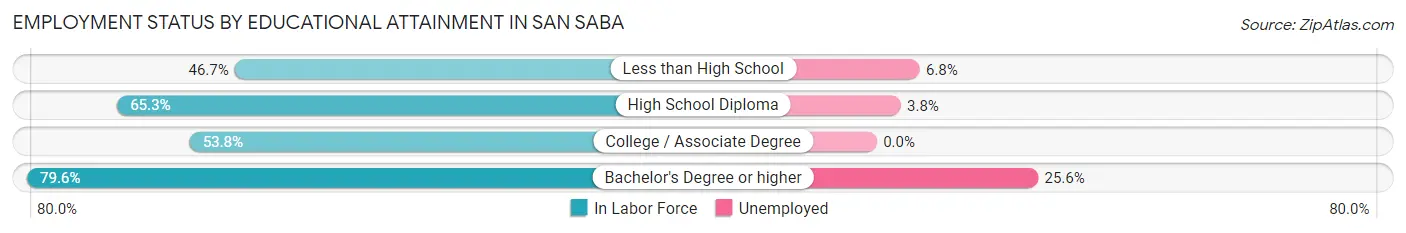
Employment Status by Educational Attainment in San Saba
According to labor force statistics for San Saba, 59.2% of individuals (964) out of the total population between 25 and 64 years of age (1,628) are in the labor force, with 5.0% or 48 of them being unemployed. The group with the highest labor force participation rate are those with the educational attainment of bachelor's degree or higher, with 79.6% or 78 individuals in the labor force. Within the labor force, individuals with bachelor's degree or higher education have the highest percentage of unemployment, with 25.6% or 20 of them being unemployed.
| Educational Attainment | In Labor Force | Unemployed |
| Less than High School | 147 (46.7%) | 21 (6.8%) |
| High School Diploma | 479 (65.3%) | 28 (3.8%) |
| College / Associate Degree | 259 (53.8%) | 0 (0.0%) |
| Bachelor's Degree or higher | 78 (79.6%) | 25 (25.6%) |
| Total | 964 (59.2%) | 81 (5.0%) |
Employment Occupations by Sex in San Saba
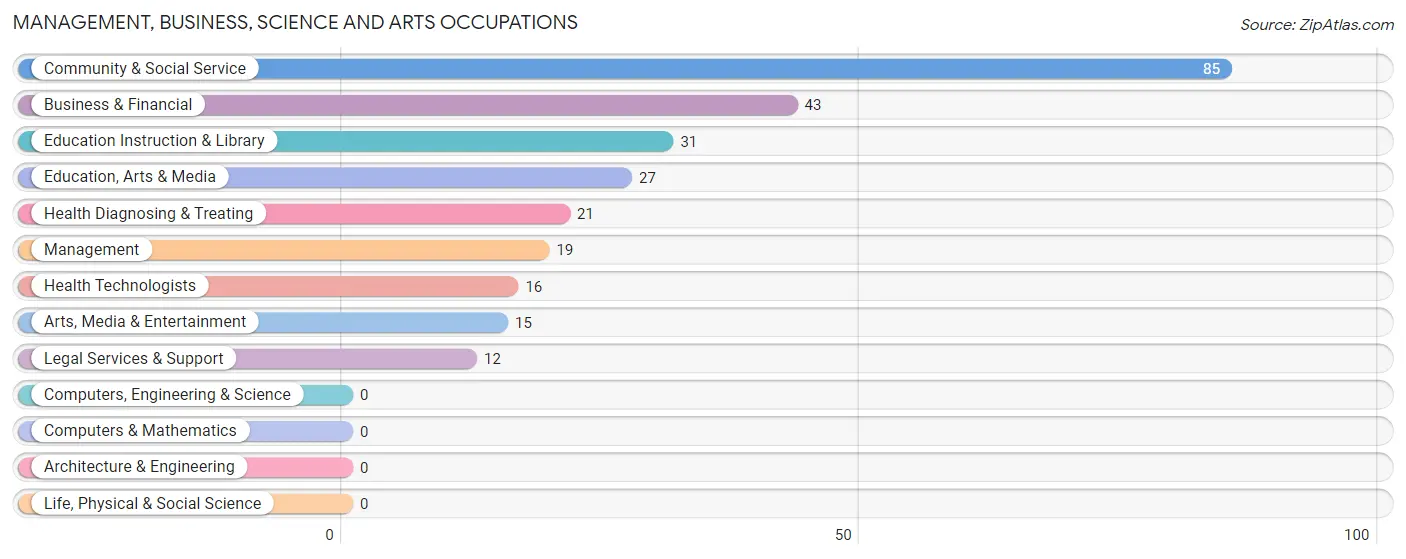
Management, Business, Science and Arts Occupations
The most common Management, Business, Science and Arts occupations in San Saba are Community & Social Service (85 | 7.5%), Business & Financial (43 | 3.8%), Education Instruction & Library (31 | 2.7%), Education, Arts & Media (27 | 2.4%), and Health Diagnosing & Treating (21 | 1.8%).
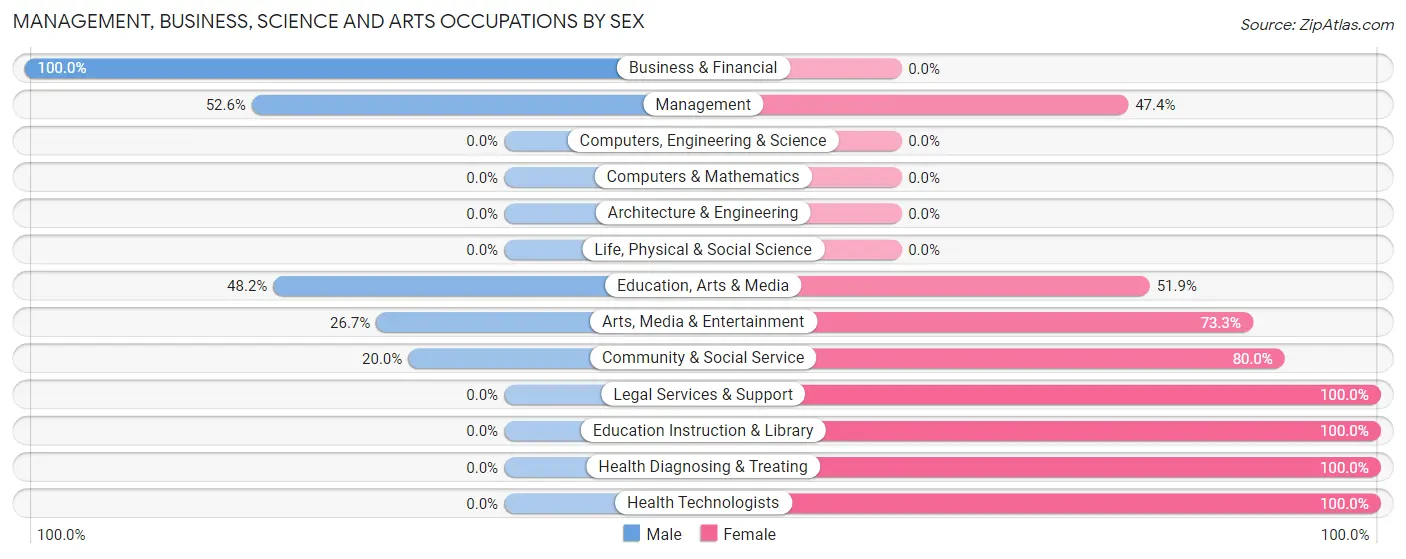
Management, Business, Science and Arts Occupations by Sex
Within the Management, Business, Science and Arts occupations in San Saba, the most male-oriented occupations are Business & Financial (100.0%), Management (52.6%), and Education, Arts & Media (48.1%), while the most female-oriented occupations are Legal Services & Support (100.0%), Education Instruction & Library (100.0%), and Health Diagnosing & Treating (100.0%).
| Occupation | Male | Female |
| Management | 10 (52.6%) | 9 (47.4%) |
| Business & Financial | 43 (100.0%) | 0 (0.0%) |
| Computers, Engineering & Science | 0 (0.0%) | 0 (0.0%) |
| Computers & Mathematics | 0 (0.0%) | 0 (0.0%) |
| Architecture & Engineering | 0 (0.0%) | 0 (0.0%) |
| Life, Physical & Social Science | 0 (0.0%) | 0 (0.0%) |
| Community & Social Service | 17 (20.0%) | 68 (80.0%) |
| Education, Arts & Media | 13 (48.1%) | 14 (51.8%) |
| Legal Services & Support | 0 (0.0%) | 12 (100.0%) |
| Education Instruction & Library | 0 (0.0%) | 31 (100.0%) |
| Arts, Media & Entertainment | 4 (26.7%) | 11 (73.3%) |
| Health Diagnosing & Treating | 0 (0.0%) | 21 (100.0%) |
| Health Technologists | 0 (0.0%) | 16 (100.0%) |
| Total (Category) | 70 (41.7%) | 98 (58.3%) |
| Total (Overall) | 723 (63.5%) | 416 (36.5%) |
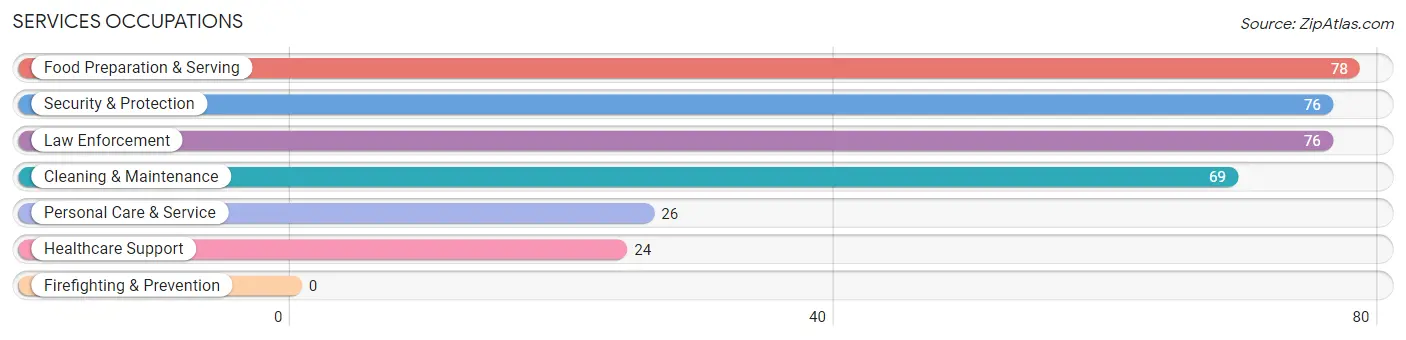
Services Occupations
The most common Services occupations in San Saba are Food Preparation & Serving (78 | 6.9%), Security & Protection (76 | 6.7%), Law Enforcement (76 | 6.7%), Cleaning & Maintenance (69 | 6.1%), and Personal Care & Service (26 | 2.3%).
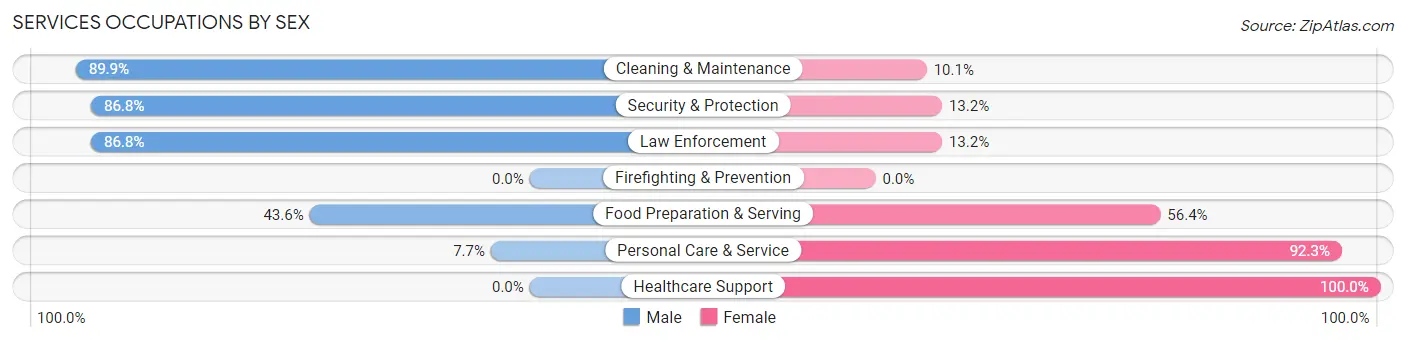
Services Occupations by Sex
Within the Services occupations in San Saba, the most male-oriented occupations are Cleaning & Maintenance (89.9%), Security & Protection (86.8%), and Law Enforcement (86.8%), while the most female-oriented occupations are Healthcare Support (100.0%), Personal Care & Service (92.3%), and Food Preparation & Serving (56.4%).
| Occupation | Male | Female |
| Healthcare Support | 0 (0.0%) | 24 (100.0%) |
| Security & Protection | 66 (86.8%) | 10 (13.2%) |
| Firefighting & Prevention | 0 (0.0%) | 0 (0.0%) |
| Law Enforcement | 66 (86.8%) | 10 (13.2%) |
| Food Preparation & Serving | 34 (43.6%) | 44 (56.4%) |
| Cleaning & Maintenance | 62 (89.9%) | 7 (10.1%) |
| Personal Care & Service | 2 (7.7%) | 24 (92.3%) |
| Total (Category) | 164 (60.1%) | 109 (39.9%) |
| Total (Overall) | 723 (63.5%) | 416 (36.5%) |
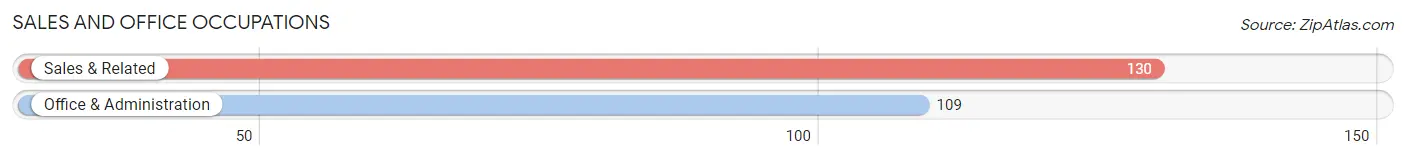
Sales and Office Occupations
The most common Sales and Office occupations in San Saba are Sales & Related (130 | 11.4%), and Office & Administration (109 | 9.6%).
Sales and Office Occupations by Sex
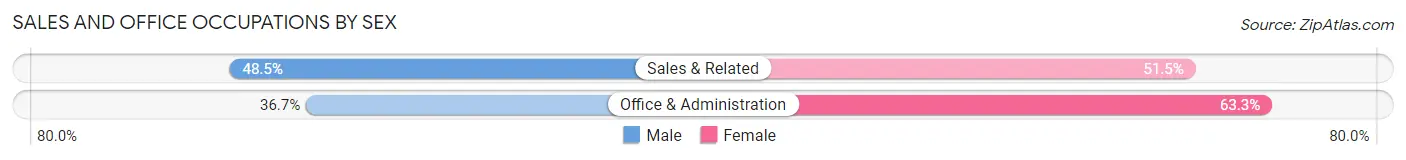
| Occupation | Male | Female |
| Sales & Related | 63 (48.5%) | 67 (51.5%) |
| Office & Administration | 40 (36.7%) | 69 (63.3%) |
| Total (Category) | 103 (43.1%) | 136 (56.9%) |
| Total (Overall) | 723 (63.5%) | 416 (36.5%) |
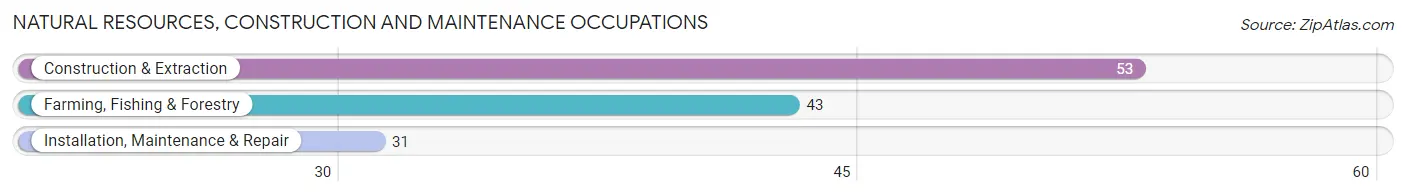
Natural Resources, Construction and Maintenance Occupations
The most common Natural Resources, Construction and Maintenance occupations in San Saba are Construction & Extraction (53 | 4.6%), Farming, Fishing & Forestry (43 | 3.8%), and Installation, Maintenance & Repair (31 | 2.7%).
Natural Resources, Construction and Maintenance Occupations by Sex
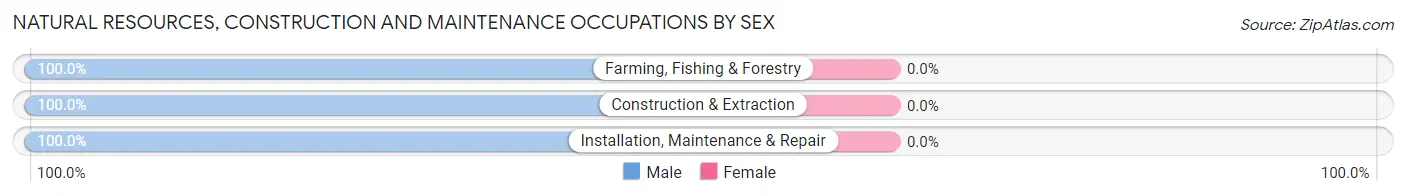
| Occupation | Male | Female |
| Farming, Fishing & Forestry | 43 (100.0%) | 0 (0.0%) |
| Construction & Extraction | 53 (100.0%) | 0 (0.0%) |
| Installation, Maintenance & Repair | 31 (100.0%) | 0 (0.0%) |
| Total (Category) | 127 (100.0%) | 0 (0.0%) |
| Total (Overall) | 723 (63.5%) | 416 (36.5%) |
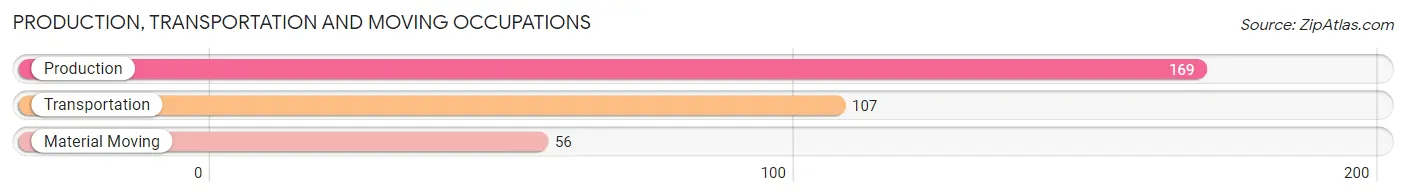
Production, Transportation and Moving Occupations
The most common Production, Transportation and Moving occupations in San Saba are Production (169 | 14.8%), Transportation (107 | 9.4%), and Material Moving (56 | 4.9%).
Production, Transportation and Moving Occupations by Sex
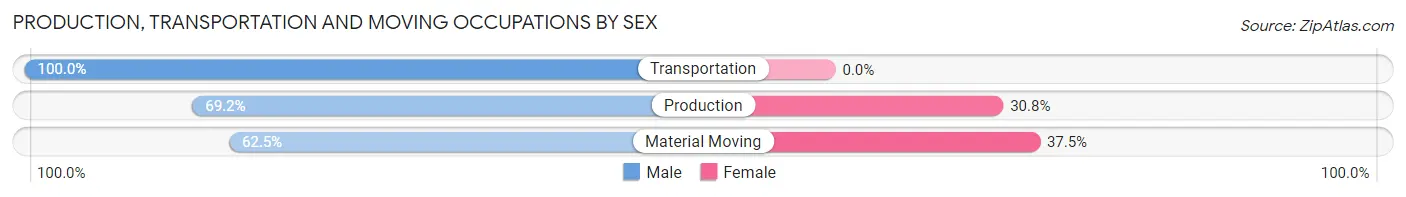
| Occupation | Male | Female |
| Production | 117 (69.2%) | 52 (30.8%) |
| Transportation | 107 (100.0%) | 0 (0.0%) |
| Material Moving | 35 (62.5%) | 21 (37.5%) |
| Total (Category) | 259 (78.0%) | 73 (22.0%) |
| Total (Overall) | 723 (63.5%) | 416 (36.5%) |
Employment Industries by Sex in San Saba
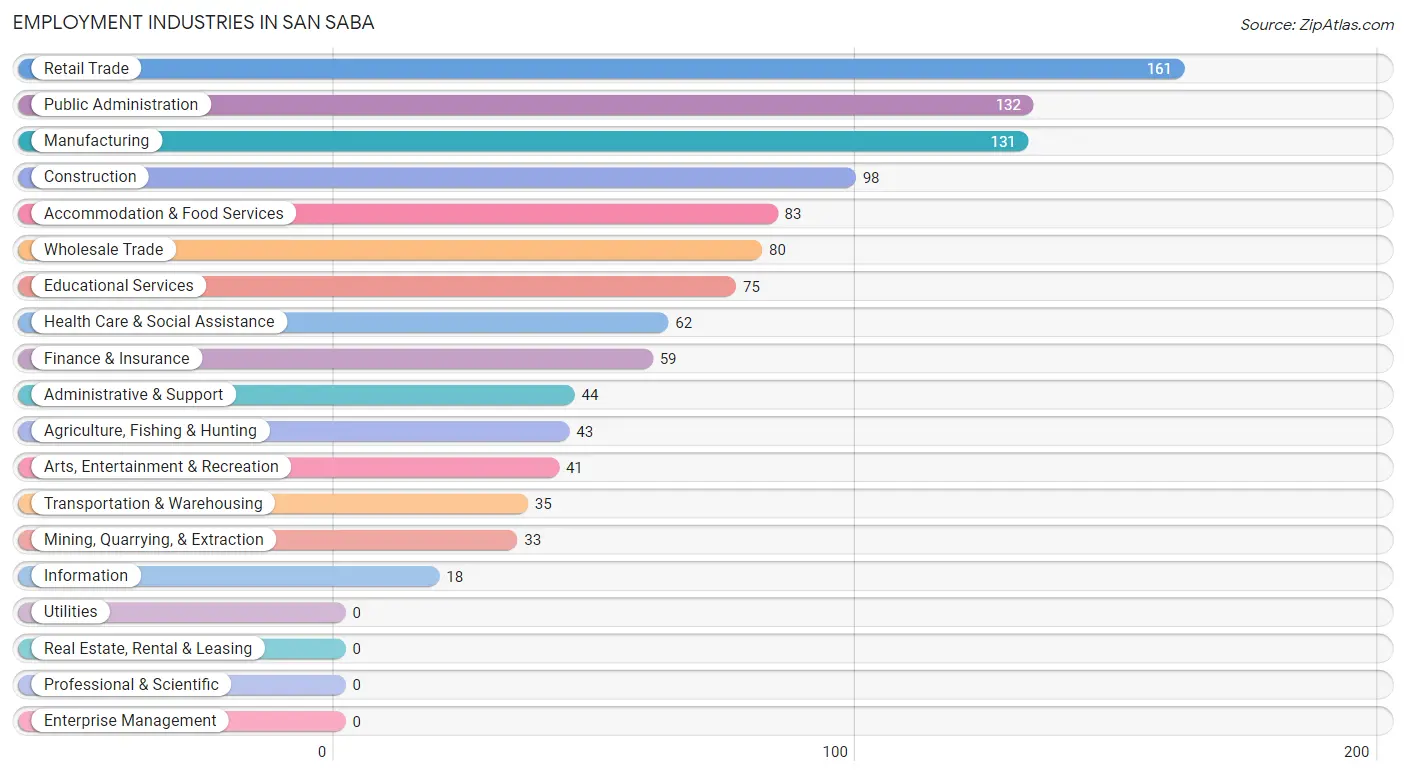
Employment Industries in San Saba
The major employment industries in San Saba include Retail Trade (161 | 14.1%), Public Administration (132 | 11.6%), Manufacturing (131 | 11.5%), Construction (98 | 8.6%), and Accommodation & Food Services (83 | 7.3%).
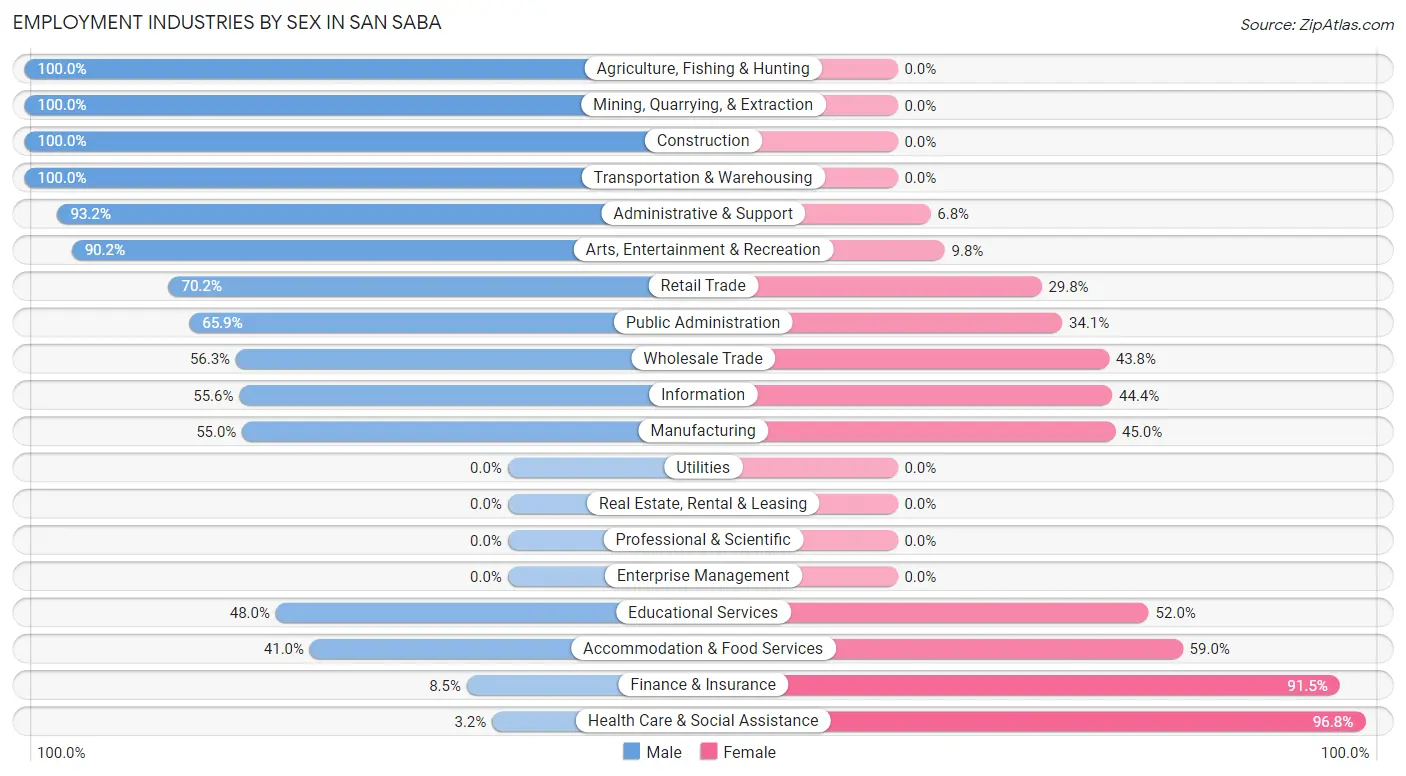
Employment Industries by Sex in San Saba
The San Saba industries that see more men than women are Agriculture, Fishing & Hunting (100.0%), Mining, Quarrying, & Extraction (100.0%), and Construction (100.0%), whereas the industries that tend to have a higher number of women are Health Care & Social Assistance (96.8%), Finance & Insurance (91.5%), and Accommodation & Food Services (59.0%).
| Industry | Male | Female |
| Agriculture, Fishing & Hunting | 43 (100.0%) | 0 (0.0%) |
| Mining, Quarrying, & Extraction | 33 (100.0%) | 0 (0.0%) |
| Construction | 98 (100.0%) | 0 (0.0%) |
| Manufacturing | 72 (55.0%) | 59 (45.0%) |
| Wholesale Trade | 45 (56.2%) | 35 (43.8%) |
| Retail Trade | 113 (70.2%) | 48 (29.8%) |
| Transportation & Warehousing | 35 (100.0%) | 0 (0.0%) |
| Utilities | 0 (0.0%) | 0 (0.0%) |
| Information | 10 (55.6%) | 8 (44.4%) |
| Finance & Insurance | 5 (8.5%) | 54 (91.5%) |
| Real Estate, Rental & Leasing | 0 (0.0%) | 0 (0.0%) |
| Professional & Scientific | 0 (0.0%) | 0 (0.0%) |
| Enterprise Management | 0 (0.0%) | 0 (0.0%) |
| Administrative & Support | 41 (93.2%) | 3 (6.8%) |
| Educational Services | 36 (48.0%) | 39 (52.0%) |
| Health Care & Social Assistance | 2 (3.2%) | 60 (96.8%) |
| Arts, Entertainment & Recreation | 37 (90.2%) | 4 (9.8%) |
| Accommodation & Food Services | 34 (41.0%) | 49 (59.0%) |
| Public Administration | 87 (65.9%) | 45 (34.1%) |
| Total | 723 (63.5%) | 416 (36.5%) |
Education in San Saba
School Enrollment in San Saba
The most common levels of schooling among the 672 students in San Saba are elementary school (230 | 34.2%), high school (197 | 29.3%), and middle school (121 | 18.0%).
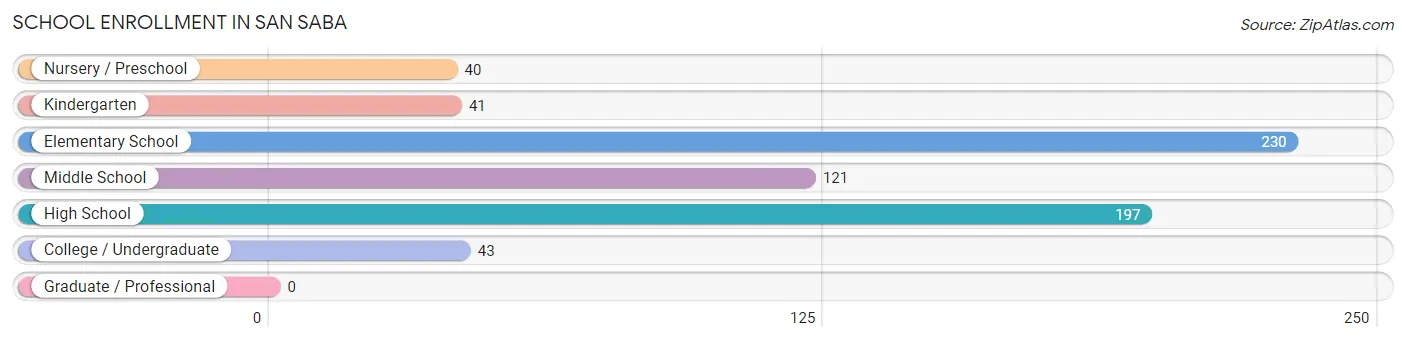
| School Level | # Students | % Students |
| Nursery / Preschool | 40 | 5.9% |
| Kindergarten | 41 | 6.1% |
| Elementary School | 230 | 34.2% |
| Middle School | 121 | 18.0% |
| High School | 197 | 29.3% |
| College / Undergraduate | 43 | 6.4% |
| Graduate / Professional | 0 | 0.0% |
| Total | 672 | 100.0% |
School Enrollment by Age by Funding Source in San Saba
Out of a total of 672 students who are enrolled in schools in San Saba, 27 (4.0%) attend a private institution, while the remaining 645 (96.0%) are enrolled in public schools. The age group of 25 to 34 year olds has the highest likelihood of being enrolled in private schools, with 11 (33.3% in the age bracket) enrolled. Conversely, the age group of 3 to 4 year olds has the lowest likelihood of being enrolled in a private school, with 40 (100.0% in the age bracket) attending a public institution.
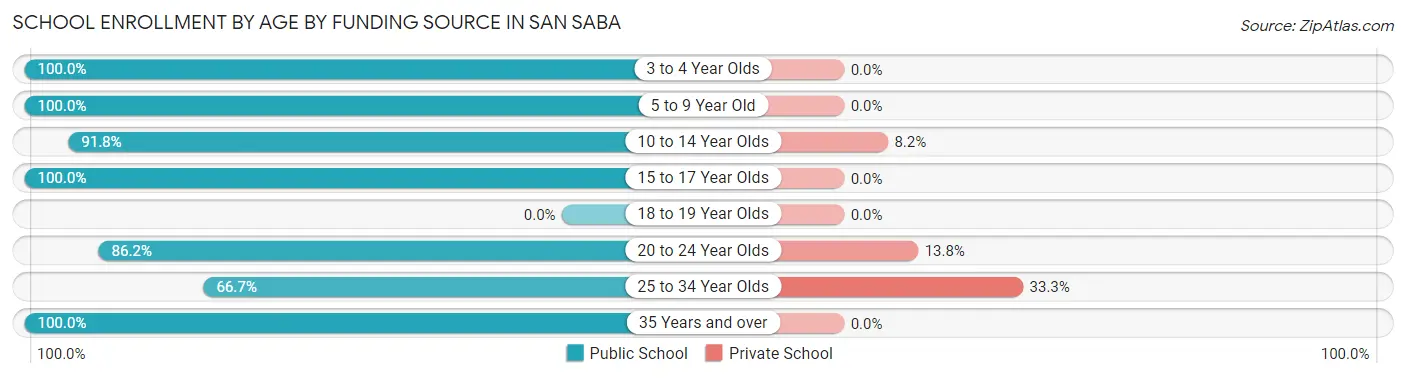
| Age Bracket | Public School | Private School |
| 3 to 4 Year Olds | 40 (100.0%) | 0 (0.0%) |
| 5 to 9 Year Old | 281 (100.0%) | 0 (0.0%) |
| 10 to 14 Year Olds | 135 (91.8%) | 12 (8.2%) |
| 15 to 17 Year Olds | 102 (100.0%) | 0 (0.0%) |
| 18 to 19 Year Olds | 0 (0.0%) | 0 (0.0%) |
| 20 to 24 Year Olds | 25 (86.2%) | 4 (13.8%) |
| 25 to 34 Year Olds | 22 (66.7%) | 11 (33.3%) |
| 35 Years and over | 40 (100.0%) | 0 (0.0%) |
| Total | 645 (96.0%) | 27 (4.0%) |
Educational Attainment by Field of Study in San Saba
Education (60 | 28.7%), social sciences (33 | 15.8%), visual & performing arts (20 | 9.6%), business (18 | 8.6%), and liberal arts & history (16 | 7.7%) are the most common fields of study among 209 individuals in San Saba who have obtained a bachelor's degree or higher.
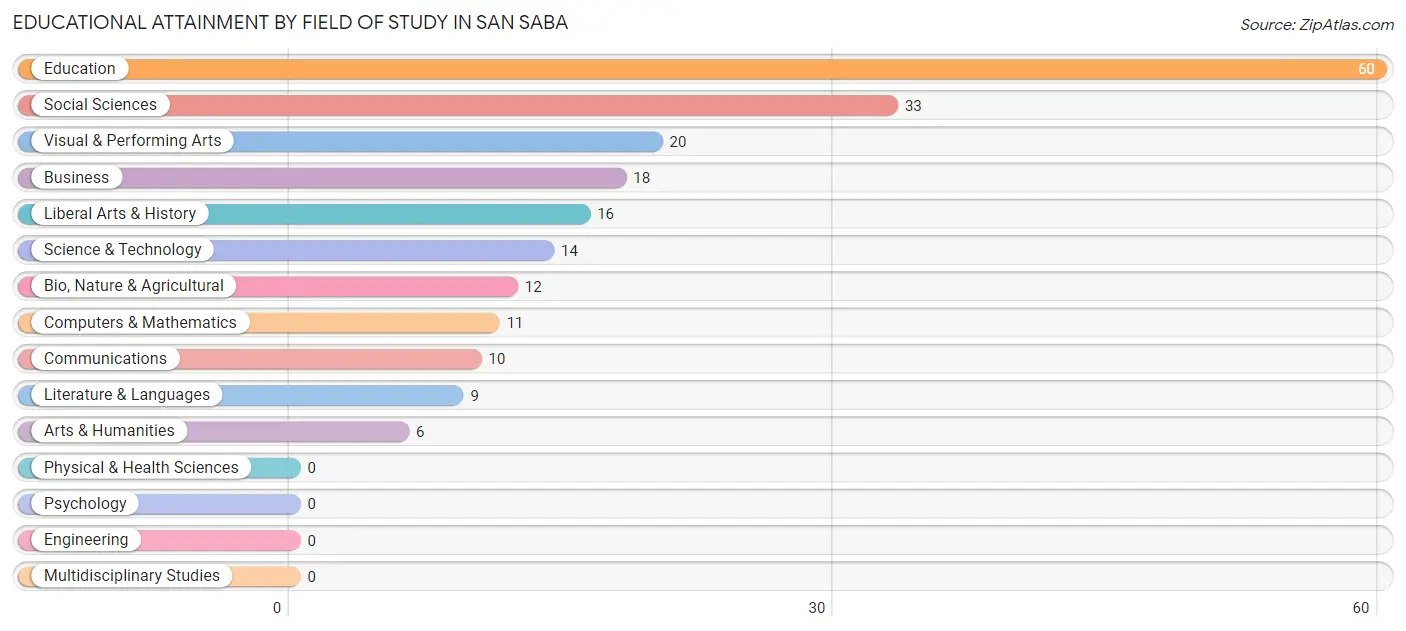
| Field of Study | # Graduates | % Graduates |
| Computers & Mathematics | 11 | 5.3% |
| Bio, Nature & Agricultural | 12 | 5.7% |
| Physical & Health Sciences | 0 | 0.0% |
| Psychology | 0 | 0.0% |
| Social Sciences | 33 | 15.8% |
| Engineering | 0 | 0.0% |
| Multidisciplinary Studies | 0 | 0.0% |
| Science & Technology | 14 | 6.7% |
| Business | 18 | 8.6% |
| Education | 60 | 28.7% |
| Literature & Languages | 9 | 4.3% |
| Liberal Arts & History | 16 | 7.7% |
| Visual & Performing Arts | 20 | 9.6% |
| Communications | 10 | 4.8% |
| Arts & Humanities | 6 | 2.9% |
| Total | 209 | 100.0% |
Transportation & Commute in San Saba
Vehicle Availability by Sex in San Saba
The most prevalent vehicle ownership categories in San Saba are males with 2 vehicles (303, accounting for 41.9%) and females with 2 vehicles (168, making up 72.8%).
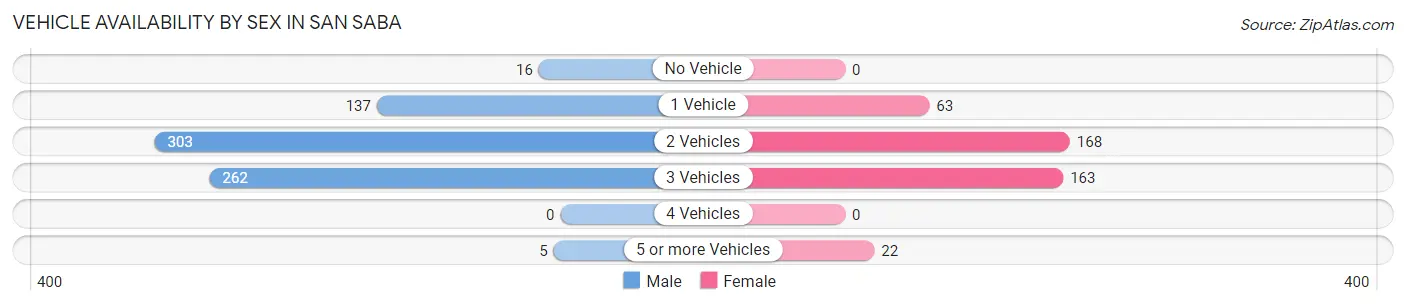
| Vehicles Available | Male | Female |
| No Vehicle | 16 (2.2%) | 0 (0.0%) |
| 1 Vehicle | 137 (19.0%) | 63 (15.1%) |
| 2 Vehicles | 303 (41.9%) | 168 (40.4%) |
| 3 Vehicles | 262 (36.2%) | 163 (39.2%) |
| 4 Vehicles | 0 (0.0%) | 0 (0.0%) |
| 5 or more Vehicles | 5 (0.7%) | 22 (5.3%) |
| Total | 723 (100.0%) | 416 (100.0%) |
Commute Time in San Saba
The most frequently occuring commute durations in San Saba are 5 to 9 minutes (340 commuters, 30.7%), less than 5 minutes (287 commuters, 25.9%), and 60 to 89 minutes (94 commuters, 8.5%).
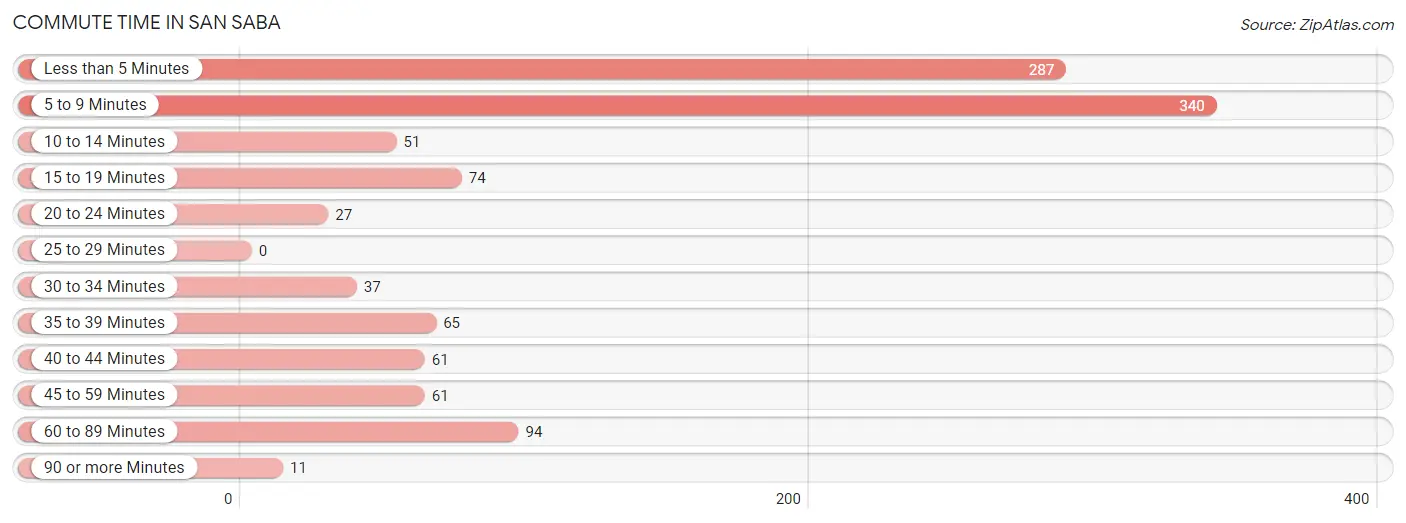
| Commute Time | # Commuters | % Commuters |
| Less than 5 Minutes | 287 | 25.9% |
| 5 to 9 Minutes | 340 | 30.7% |
| 10 to 14 Minutes | 51 | 4.6% |
| 15 to 19 Minutes | 74 | 6.7% |
| 20 to 24 Minutes | 27 | 2.4% |
| 25 to 29 Minutes | 0 | 0.0% |
| 30 to 34 Minutes | 37 | 3.3% |
| 35 to 39 Minutes | 65 | 5.9% |
| 40 to 44 Minutes | 61 | 5.5% |
| 45 to 59 Minutes | 61 | 5.5% |
| 60 to 89 Minutes | 94 | 8.5% |
| 90 or more Minutes | 11 | 1.0% |
Commute Time by Sex in San Saba
The most common commute times in San Saba are 5 to 9 minutes (215 commuters, 29.9%) for males and less than 5 minutes (135 commuters, 34.7%) for females.
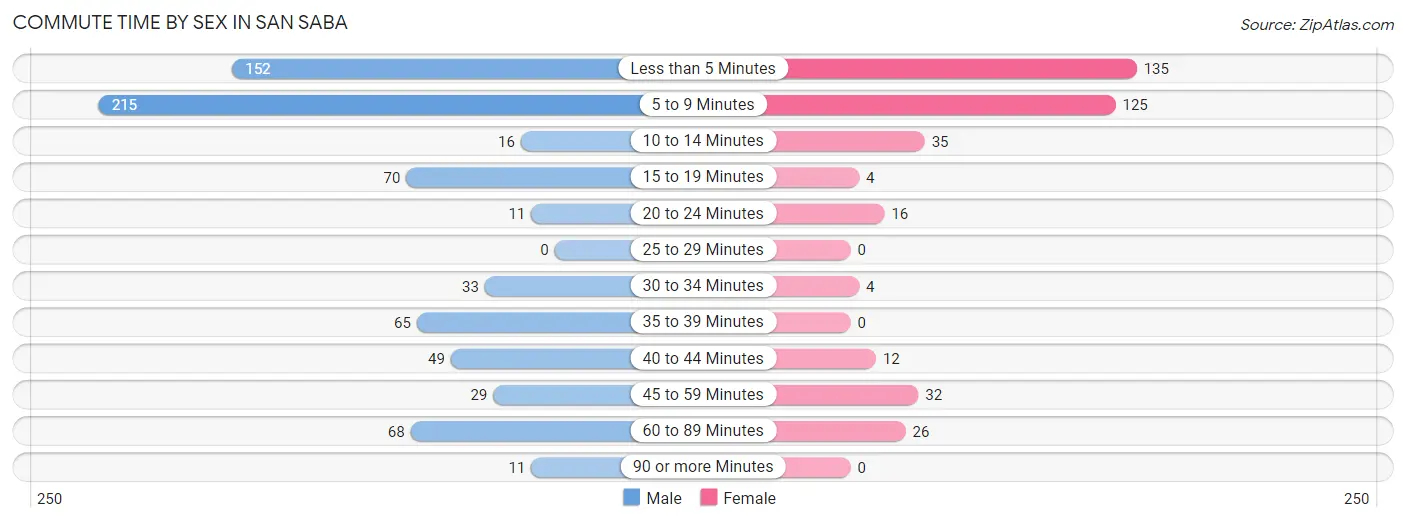
| Commute Time | Male | Female |
| Less than 5 Minutes | 152 (21.1%) | 135 (34.7%) |
| 5 to 9 Minutes | 215 (29.9%) | 125 (32.1%) |
| 10 to 14 Minutes | 16 (2.2%) | 35 (9.0%) |
| 15 to 19 Minutes | 70 (9.7%) | 4 (1.0%) |
| 20 to 24 Minutes | 11 (1.5%) | 16 (4.1%) |
| 25 to 29 Minutes | 0 (0.0%) | 0 (0.0%) |
| 30 to 34 Minutes | 33 (4.6%) | 4 (1.0%) |
| 35 to 39 Minutes | 65 (9.0%) | 0 (0.0%) |
| 40 to 44 Minutes | 49 (6.8%) | 12 (3.1%) |
| 45 to 59 Minutes | 29 (4.0%) | 32 (8.2%) |
| 60 to 89 Minutes | 68 (9.5%) | 26 (6.7%) |
| 90 or more Minutes | 11 (1.5%) | 0 (0.0%) |
Time of Departure to Work by Sex in San Saba
The most frequent times of departure to work in San Saba are 6:00 AM to 6:29 AM (156, 21.7%) for males and 7:30 AM to 7:59 AM (113, 29.0%) for females.
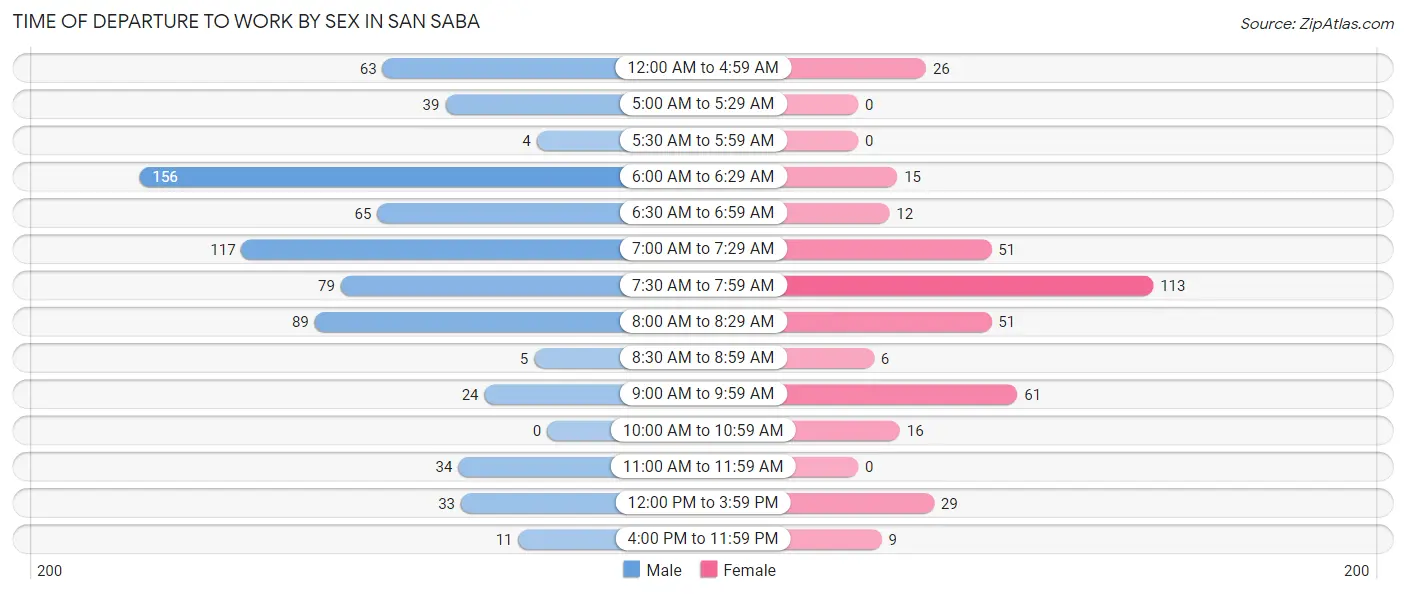
| Time of Departure | Male | Female |
| 12:00 AM to 4:59 AM | 63 (8.8%) | 26 (6.7%) |
| 5:00 AM to 5:29 AM | 39 (5.4%) | 0 (0.0%) |
| 5:30 AM to 5:59 AM | 4 (0.6%) | 0 (0.0%) |
| 6:00 AM to 6:29 AM | 156 (21.7%) | 15 (3.9%) |
| 6:30 AM to 6:59 AM | 65 (9.0%) | 12 (3.1%) |
| 7:00 AM to 7:29 AM | 117 (16.3%) | 51 (13.1%) |
| 7:30 AM to 7:59 AM | 79 (11.0%) | 113 (29.0%) |
| 8:00 AM to 8:29 AM | 89 (12.4%) | 51 (13.1%) |
| 8:30 AM to 8:59 AM | 5 (0.7%) | 6 (1.5%) |
| 9:00 AM to 9:59 AM | 24 (3.3%) | 61 (15.7%) |
| 10:00 AM to 10:59 AM | 0 (0.0%) | 16 (4.1%) |
| 11:00 AM to 11:59 AM | 34 (4.7%) | 0 (0.0%) |
| 12:00 PM to 3:59 PM | 33 (4.6%) | 29 (7.5%) |
| 4:00 PM to 11:59 PM | 11 (1.5%) | 9 (2.3%) |
| Total | 719 (100.0%) | 389 (100.0%) |
Housing Occupancy in San Saba
Occupancy by Ownership in San Saba
Of the total 954 dwellings in San Saba, owner-occupied units account for 735 (77.0%), while renter-occupied units make up 219 (23.0%).
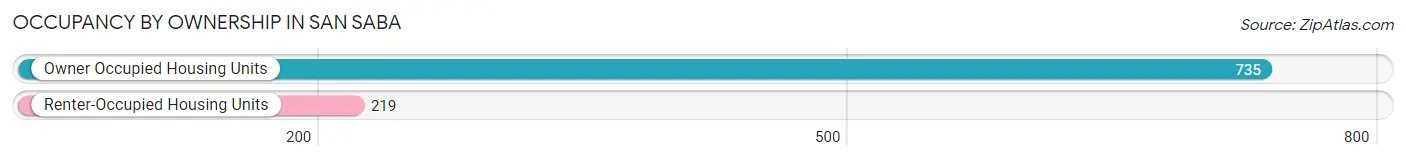
| Occupancy | # Housing Units | % Housing Units |
| Owner Occupied Housing Units | 735 | 77.0% |
| Renter-Occupied Housing Units | 219 | 23.0% |
| Total Occupied Housing Units | 954 | 100.0% |
Occupancy by Household Size in San Saba
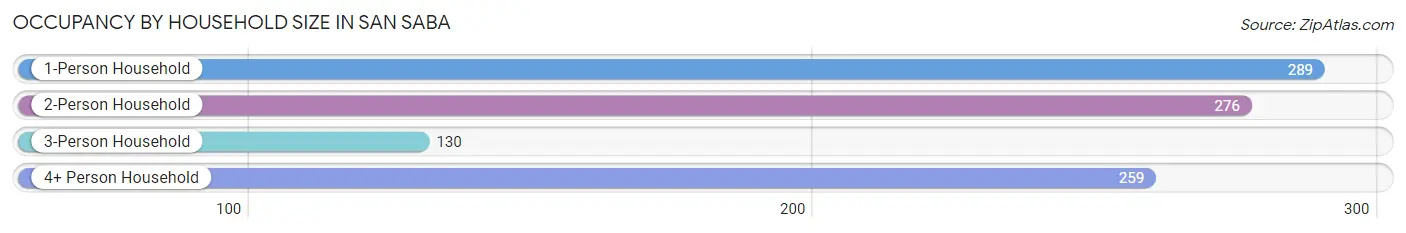
| Household Size | # Housing Units | % Housing Units |
| 1-Person Household | 289 | 30.3% |
| 2-Person Household | 276 | 28.9% |
| 3-Person Household | 130 | 13.6% |
| 4+ Person Household | 259 | 27.2% |
| Total Housing Units | 954 | 100.0% |
Occupancy by Ownership by Household Size in San Saba
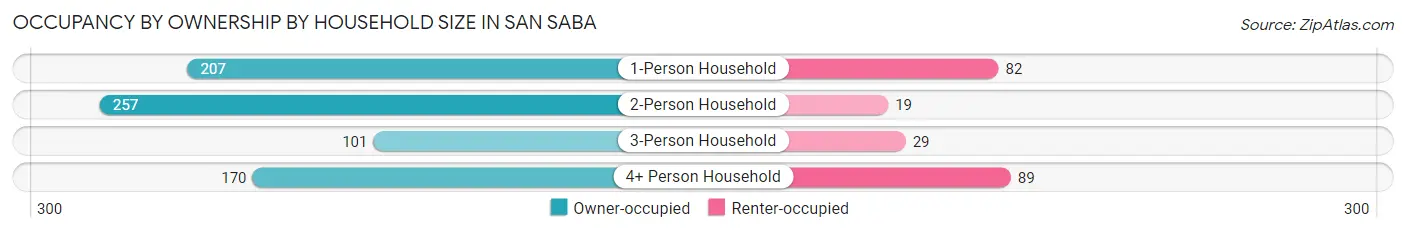
| Household Size | Owner-occupied | Renter-occupied |
| 1-Person Household | 207 (71.6%) | 82 (28.4%) |
| 2-Person Household | 257 (93.1%) | 19 (6.9%) |
| 3-Person Household | 101 (77.7%) | 29 (22.3%) |
| 4+ Person Household | 170 (65.6%) | 89 (34.4%) |
| Total Housing Units | 735 (77.0%) | 219 (23.0%) |
Occupancy by Educational Attainment in San Saba
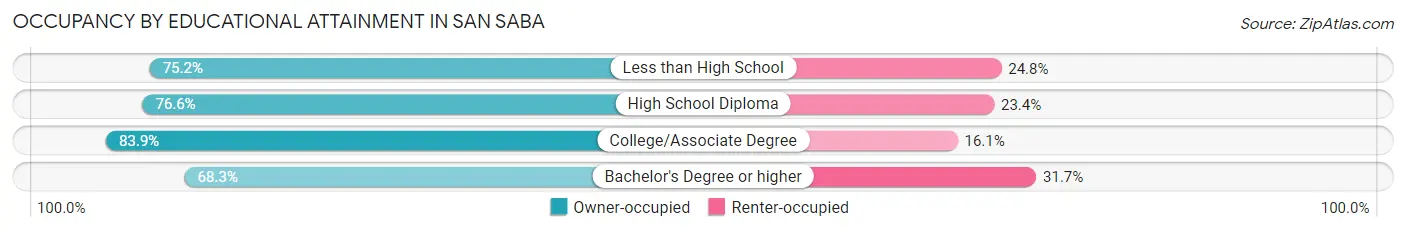
| Household Size | Owner-occupied | Renter-occupied |
| Less than High School | 100 (75.2%) | 33 (24.8%) |
| High School Diploma | 364 (76.6%) | 111 (23.4%) |
| College/Associate Degree | 187 (83.9%) | 36 (16.1%) |
| Bachelor's Degree or higher | 84 (68.3%) | 39 (31.7%) |
Occupancy by Age of Householder in San Saba
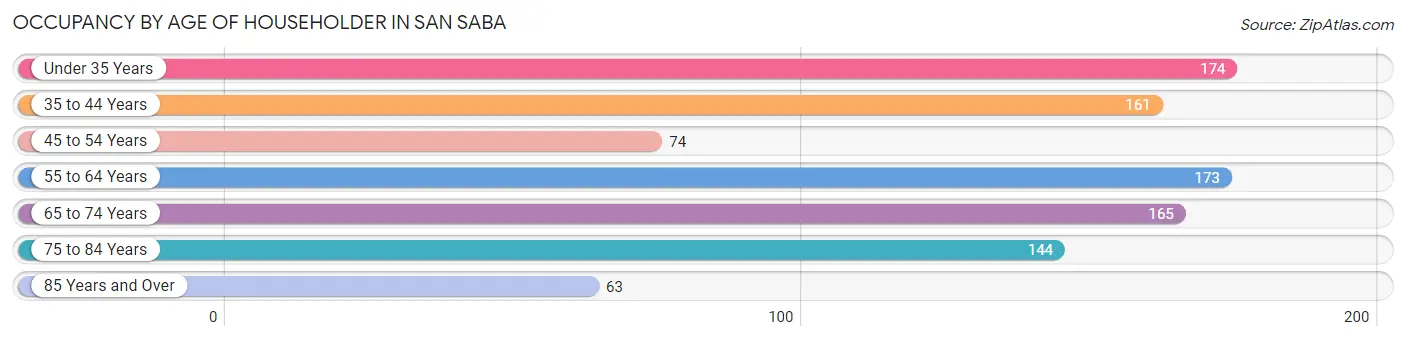
| Age Bracket | # Households | % Households |
| Under 35 Years | 174 | 18.2% |
| 35 to 44 Years | 161 | 16.9% |
| 45 to 54 Years | 74 | 7.8% |
| 55 to 64 Years | 173 | 18.1% |
| 65 to 74 Years | 165 | 17.3% |
| 75 to 84 Years | 144 | 15.1% |
| 85 Years and Over | 63 | 6.6% |
| Total | 954 | 100.0% |
Housing Finances in San Saba
Median Income by Occupancy in San Saba
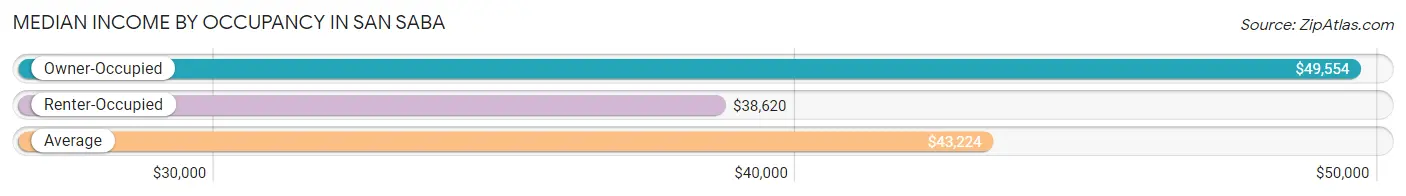
| Occupancy Type | # Households | Median Income |
| Owner-Occupied | 735 (77.0%) | $49,554 |
| Renter-Occupied | 219 (23.0%) | $38,620 |
| Average | 954 (100.0%) | $43,224 |
Occupancy by Householder Income Bracket in San Saba
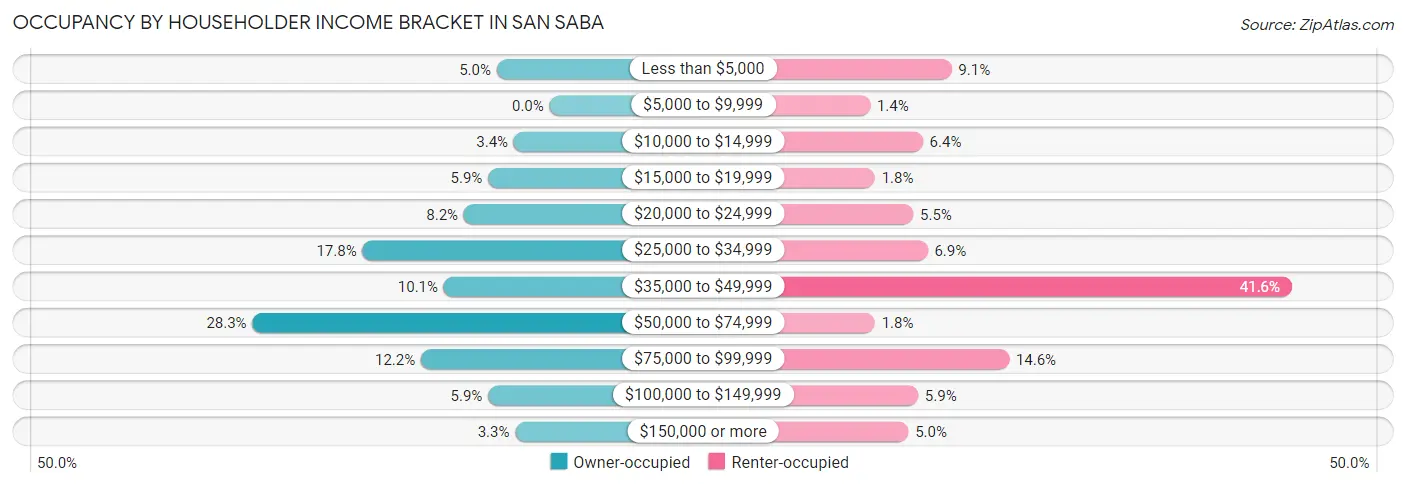
| Income Bracket | Owner-occupied | Renter-occupied |
| Less than $5,000 | 37 (5.0%) | 20 (9.1%) |
| $5,000 to $9,999 | 0 (0.0%) | 3 (1.4%) |
| $10,000 to $14,999 | 25 (3.4%) | 14 (6.4%) |
| $15,000 to $19,999 | 43 (5.9%) | 4 (1.8%) |
| $20,000 to $24,999 | 60 (8.2%) | 12 (5.5%) |
| $25,000 to $34,999 | 131 (17.8%) | 15 (6.9%) |
| $35,000 to $49,999 | 74 (10.1%) | 91 (41.5%) |
| $50,000 to $74,999 | 208 (28.3%) | 4 (1.8%) |
| $75,000 to $99,999 | 90 (12.2%) | 32 (14.6%) |
| $100,000 to $149,999 | 43 (5.9%) | 13 (5.9%) |
| $150,000 or more | 24 (3.3%) | 11 (5.0%) |
| Total | 735 (100.0%) | 219 (100.0%) |
Monthly Housing Cost Tiers in San Saba
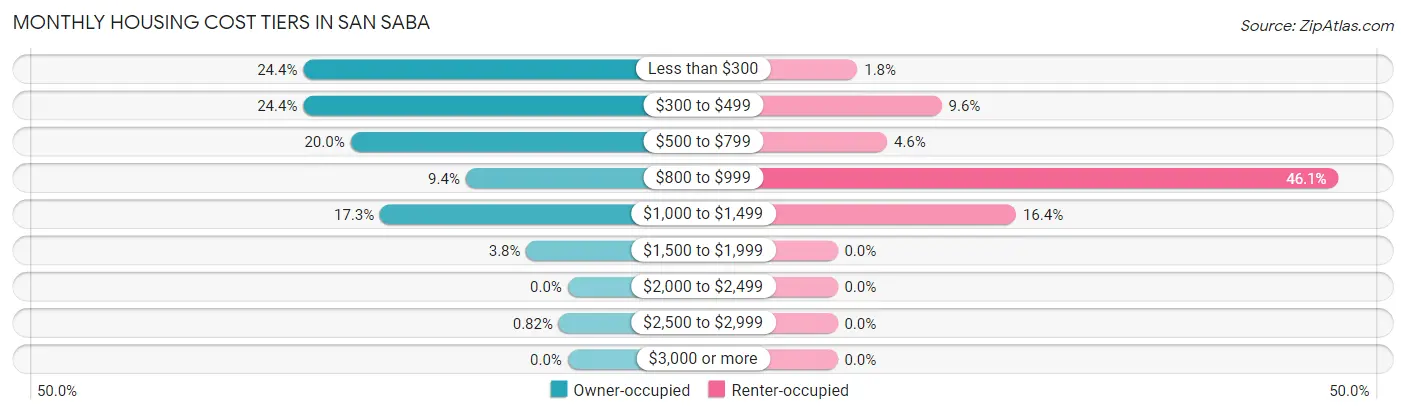
| Monthly Cost | Owner-occupied | Renter-occupied |
| Less than $300 | 179 (24.3%) | 4 (1.8%) |
| $300 to $499 | 179 (24.3%) | 21 (9.6%) |
| $500 to $799 | 147 (20.0%) | 10 (4.6%) |
| $800 to $999 | 69 (9.4%) | 101 (46.1%) |
| $1,000 to $1,499 | 127 (17.3%) | 36 (16.4%) |
| $1,500 to $1,999 | 28 (3.8%) | 0 (0.0%) |
| $2,000 to $2,499 | 0 (0.0%) | 0 (0.0%) |
| $2,500 to $2,999 | 6 (0.8%) | 0 (0.0%) |
| $3,000 or more | 0 (0.0%) | 0 (0.0%) |
| Total | 735 (100.0%) | 219 (100.0%) |
Physical Housing Characteristics in San Saba
Housing Structures in San Saba
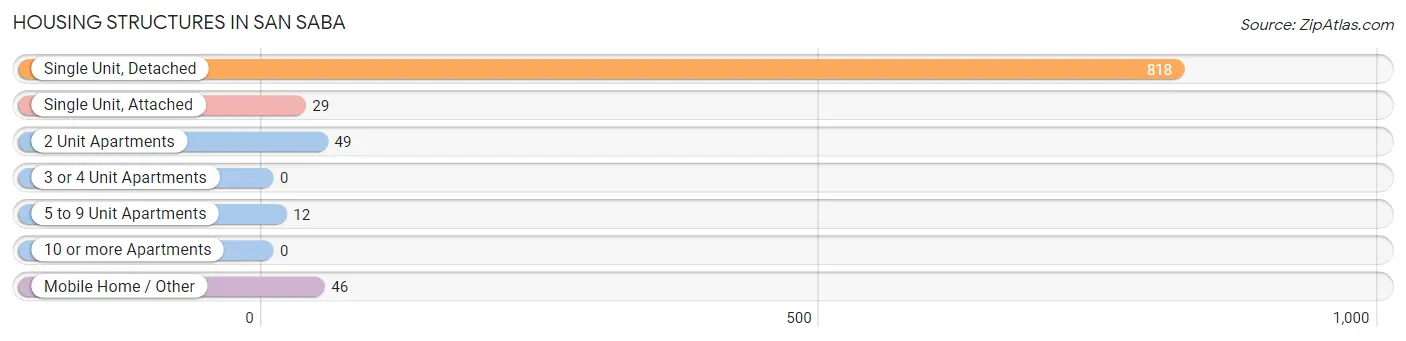
| Structure Type | # Housing Units | % Housing Units |
| Single Unit, Detached | 818 | 85.7% |
| Single Unit, Attached | 29 | 3.0% |
| 2 Unit Apartments | 49 | 5.1% |
| 3 or 4 Unit Apartments | 0 | 0.0% |
| 5 to 9 Unit Apartments | 12 | 1.3% |
| 10 or more Apartments | 0 | 0.0% |
| Mobile Home / Other | 46 | 4.8% |
| Total | 954 | 100.0% |
Housing Structures by Occupancy in San Saba
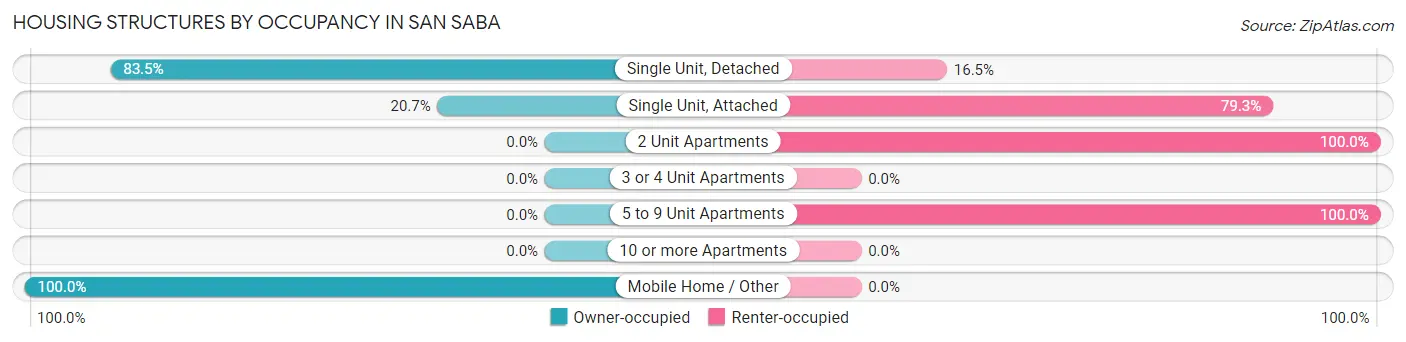
| Structure Type | Owner-occupied | Renter-occupied |
| Single Unit, Detached | 683 (83.5%) | 135 (16.5%) |
| Single Unit, Attached | 6 (20.7%) | 23 (79.3%) |
| 2 Unit Apartments | 0 (0.0%) | 49 (100.0%) |
| 3 or 4 Unit Apartments | 0 (0.0%) | 0 (0.0%) |
| 5 to 9 Unit Apartments | 0 (0.0%) | 12 (100.0%) |
| 10 or more Apartments | 0 (0.0%) | 0 (0.0%) |
| Mobile Home / Other | 46 (100.0%) | 0 (0.0%) |
| Total | 735 (77.0%) | 219 (23.0%) |
Housing Structures by Number of Rooms in San Saba
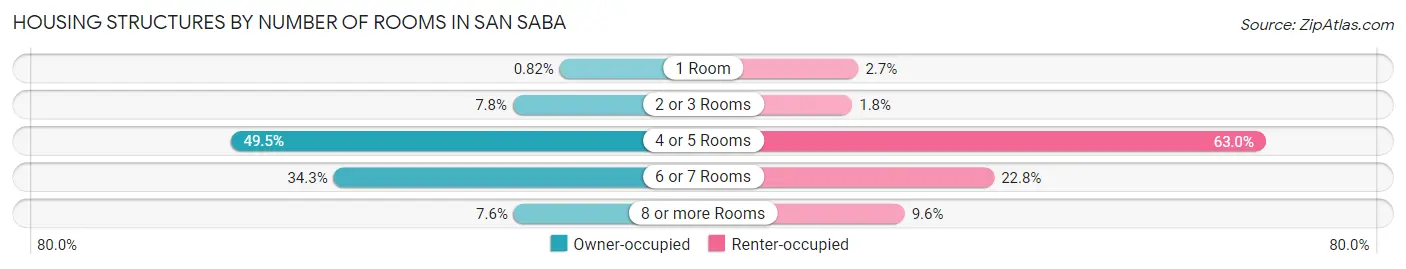
| Number of Rooms | Owner-occupied | Renter-occupied |
| 1 Room | 6 (0.8%) | 6 (2.7%) |
| 2 or 3 Rooms | 57 (7.8%) | 4 (1.8%) |
| 4 or 5 Rooms | 364 (49.5%) | 138 (63.0%) |
| 6 or 7 Rooms | 252 (34.3%) | 50 (22.8%) |
| 8 or more Rooms | 56 (7.6%) | 21 (9.6%) |
| Total | 735 (100.0%) | 219 (100.0%) |
Housing Structure by Heating Type in San Saba
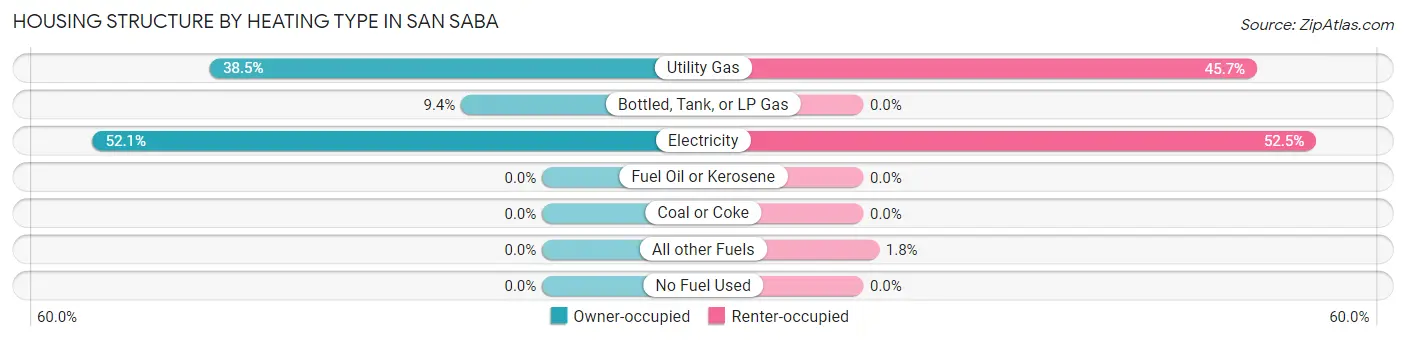
| Heating Type | Owner-occupied | Renter-occupied |
| Utility Gas | 283 (38.5%) | 100 (45.7%) |
| Bottled, Tank, or LP Gas | 69 (9.4%) | 0 (0.0%) |
| Electricity | 383 (52.1%) | 115 (52.5%) |
| Fuel Oil or Kerosene | 0 (0.0%) | 0 (0.0%) |
| Coal or Coke | 0 (0.0%) | 0 (0.0%) |
| All other Fuels | 0 (0.0%) | 4 (1.8%) |
| No Fuel Used | 0 (0.0%) | 0 (0.0%) |
| Total | 735 (100.0%) | 219 (100.0%) |
Household Vehicle Usage in San Saba
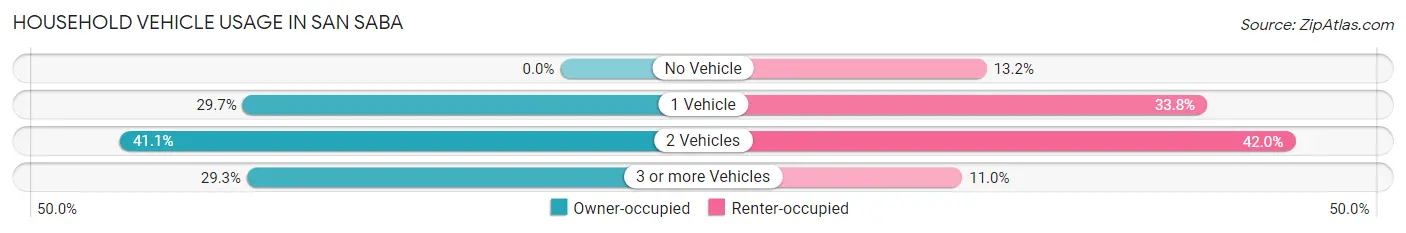
| Vehicles per Household | Owner-occupied | Renter-occupied |
| No Vehicle | 0 (0.0%) | 29 (13.2%) |
| 1 Vehicle | 218 (29.7%) | 74 (33.8%) |
| 2 Vehicles | 302 (41.1%) | 92 (42.0%) |
| 3 or more Vehicles | 215 (29.2%) | 24 (11.0%) |
| Total | 735 (100.0%) | 219 (100.0%) |
Real Estate & Mortgages in San Saba
Real Estate and Mortgage Overview in San Saba
| Characteristic | Without Mortgage | With Mortgage |
| Housing Units | 529 | 206 |
| Median Property Value | $97,200 | $133,900 |
| Median Household Income | $44,777 | $0 |
| Monthly Housing Costs | $428 | $0 |
| Real Estate Taxes | $1,032 | $0 |
Property Value by Mortgage Status in San Saba
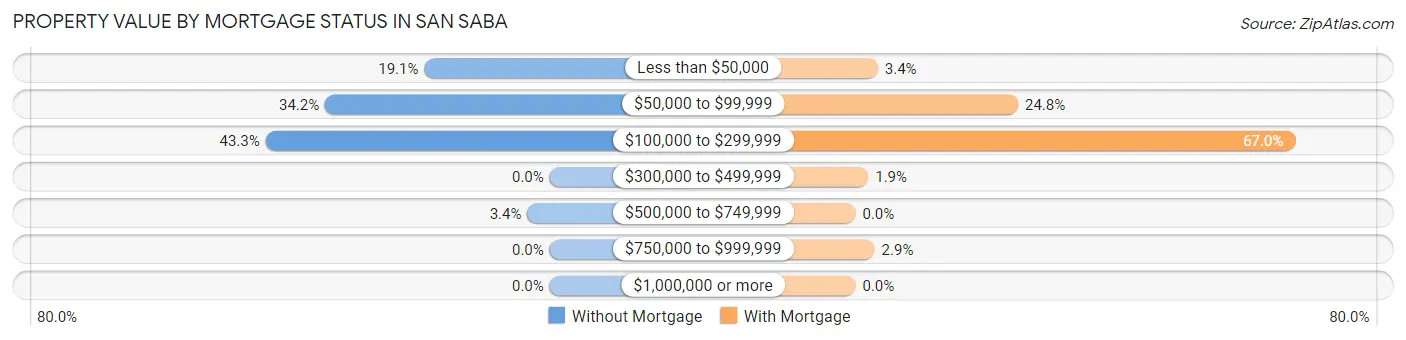
| Property Value | Without Mortgage | With Mortgage |
| Less than $50,000 | 101 (19.1%) | 7 (3.4%) |
| $50,000 to $99,999 | 181 (34.2%) | 51 (24.8%) |
| $100,000 to $299,999 | 229 (43.3%) | 138 (67.0%) |
| $300,000 to $499,999 | 0 (0.0%) | 4 (1.9%) |
| $500,000 to $749,999 | 18 (3.4%) | 0 (0.0%) |
| $750,000 to $999,999 | 0 (0.0%) | 6 (2.9%) |
| $1,000,000 or more | 0 (0.0%) | 0 (0.0%) |
| Total | 529 (100.0%) | 206 (100.0%) |
Household Income by Mortgage Status in San Saba
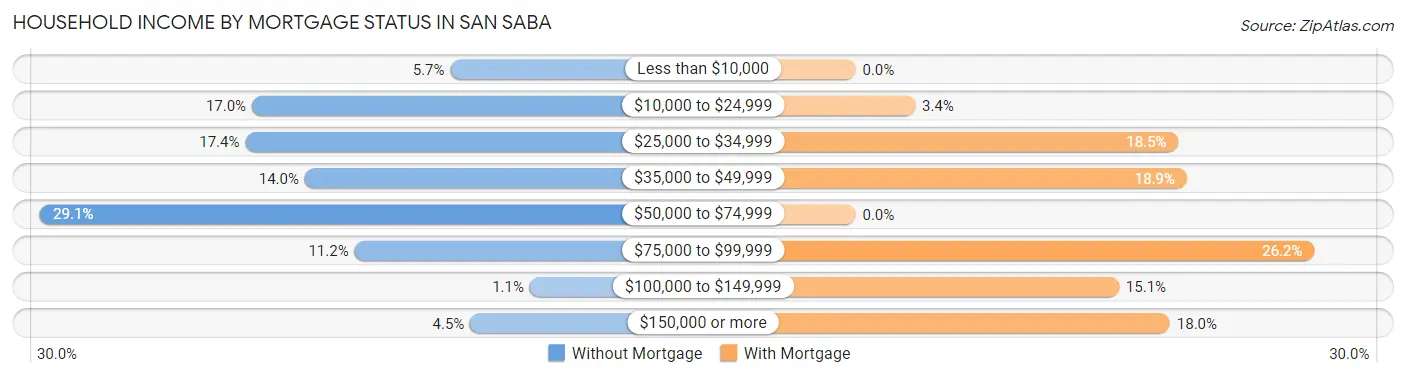
| Household Income | Without Mortgage | With Mortgage |
| Less than $10,000 | 30 (5.7%) | 0 (0.0%) |
| $10,000 to $24,999 | 90 (17.0%) | 7 (3.4%) |
| $25,000 to $34,999 | 92 (17.4%) | 38 (18.4%) |
| $35,000 to $49,999 | 74 (14.0%) | 39 (18.9%) |
| $50,000 to $74,999 | 154 (29.1%) | 0 (0.0%) |
| $75,000 to $99,999 | 59 (11.2%) | 54 (26.2%) |
| $100,000 to $149,999 | 6 (1.1%) | 31 (15.0%) |
| $150,000 or more | 24 (4.5%) | 37 (18.0%) |
| Total | 529 (100.0%) | 206 (100.0%) |
Property Value to Household Income Ratio in San Saba
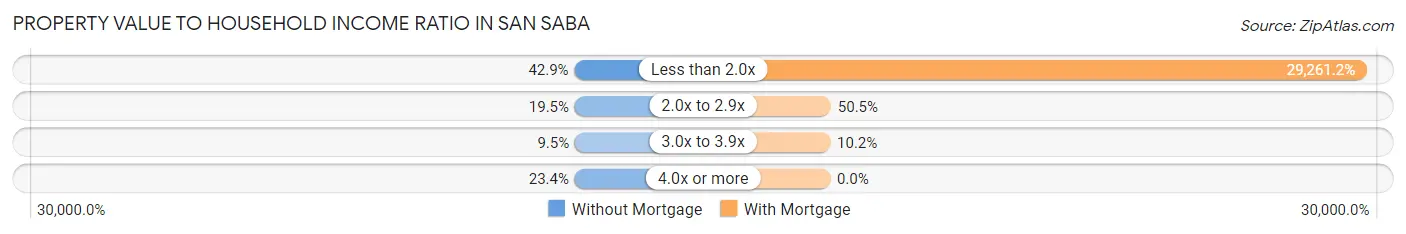
| Value-to-Income Ratio | Without Mortgage | With Mortgage |
| Less than 2.0x | 227 (42.9%) | 60,278 (29,261.2%) |
| 2.0x to 2.9x | 103 (19.5%) | 104 (50.5%) |
| 3.0x to 3.9x | 50 (9.5%) | 21 (10.2%) |
| 4.0x or more | 124 (23.4%) | 0 (0.0%) |
| Total | 529 (100.0%) | 206 (100.0%) |
Real Estate Taxes by Mortgage Status in San Saba
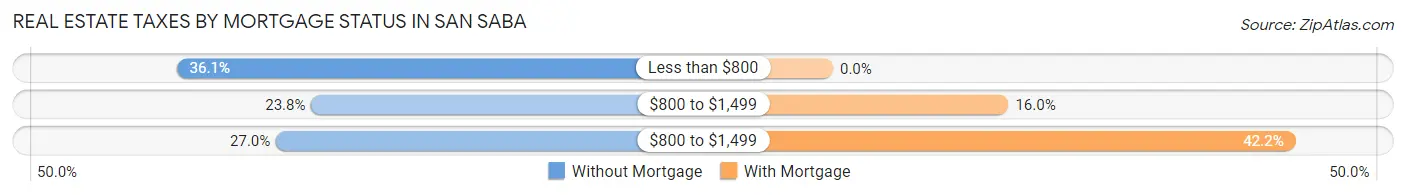
| Property Taxes | Without Mortgage | With Mortgage |
| Less than $800 | 191 (36.1%) | 0 (0.0%) |
| $800 to $1,499 | 126 (23.8%) | 33 (16.0%) |
| $800 to $1,499 | 143 (27.0%) | 87 (42.2%) |
| Total | 529 (100.0%) | 206 (100.0%) |
Health & Disability in San Saba
Health Insurance Coverage by Age in San Saba
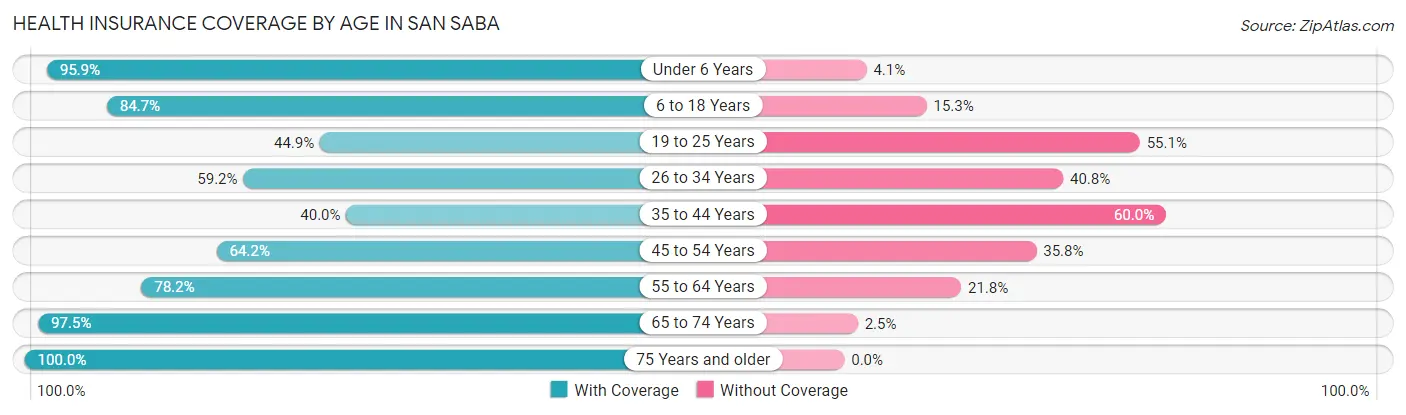
| Age Bracket | With Coverage | Without Coverage |
| Under 6 Years | 162 (95.9%) | 7 (4.1%) |
| 6 to 18 Years | 447 (84.7%) | 81 (15.3%) |
| 19 to 25 Years | 75 (44.9%) | 92 (55.1%) |
| 26 to 34 Years | 196 (59.2%) | 135 (40.8%) |
| 35 to 44 Years | 142 (40.0%) | 213 (60.0%) |
| 45 to 54 Years | 113 (64.2%) | 63 (35.8%) |
| 55 to 64 Years | 248 (78.2%) | 69 (21.8%) |
| 65 to 74 Years | 273 (97.5%) | 7 (2.5%) |
| 75 Years and older | 234 (100.0%) | 0 (0.0%) |
| Total | 1,890 (73.9%) | 667 (26.1%) |
Health Insurance Coverage by Citizenship Status in San Saba
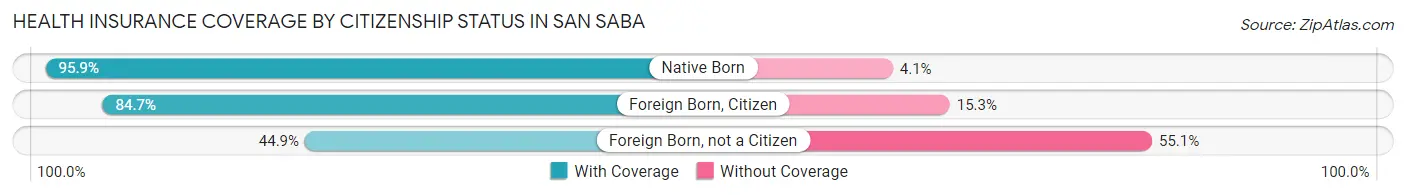
| Citizenship Status | With Coverage | Without Coverage |
| Native Born | 162 (95.9%) | 7 (4.1%) |
| Foreign Born, Citizen | 447 (84.7%) | 81 (15.3%) |
| Foreign Born, not a Citizen | 75 (44.9%) | 92 (55.1%) |
Health Insurance Coverage by Household Income in San Saba
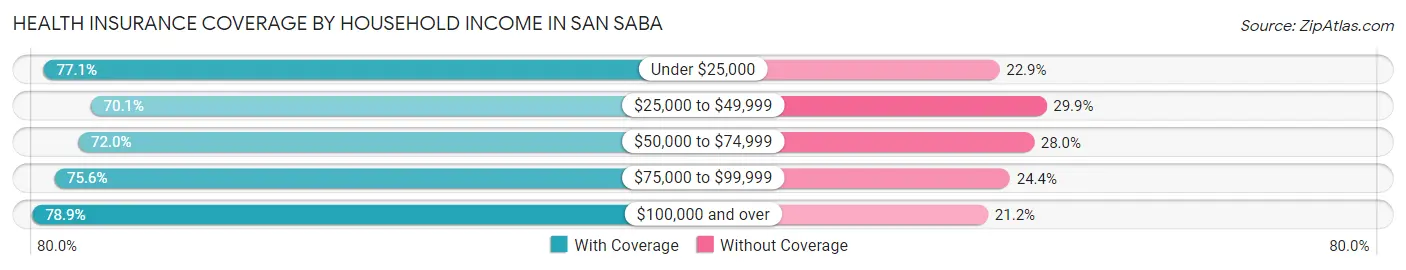
| Household Income | With Coverage | Without Coverage |
| Under $25,000 | 324 (77.1%) | 96 (22.9%) |
| $25,000 to $49,999 | 537 (70.1%) | 229 (29.9%) |
| $50,000 to $74,999 | 439 (72.0%) | 171 (28.0%) |
| $75,000 to $99,999 | 232 (75.6%) | 75 (24.4%) |
| $100,000 and over | 358 (78.8%) | 96 (21.1%) |
Public vs Private Health Insurance Coverage by Age in San Saba
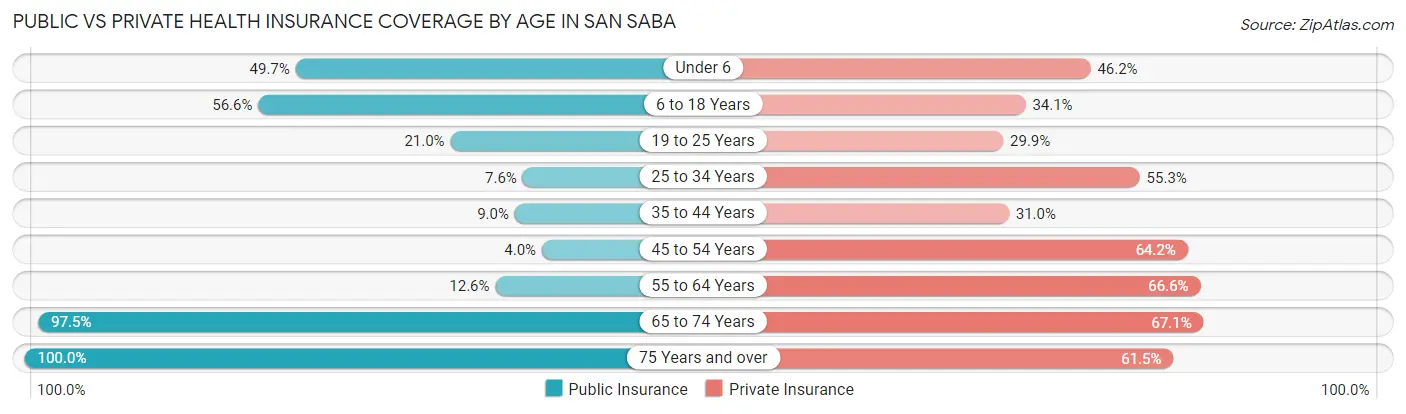
| Age Bracket | Public Insurance | Private Insurance |
| Under 6 | 84 (49.7%) | 78 (46.2%) |
| 6 to 18 Years | 299 (56.6%) | 180 (34.1%) |
| 19 to 25 Years | 35 (21.0%) | 50 (29.9%) |
| 25 to 34 Years | 25 (7.5%) | 183 (55.3%) |
| 35 to 44 Years | 32 (9.0%) | 110 (31.0%) |
| 45 to 54 Years | 7 (4.0%) | 113 (64.2%) |
| 55 to 64 Years | 40 (12.6%) | 211 (66.6%) |
| 65 to 74 Years | 273 (97.5%) | 188 (67.1%) |
| 75 Years and over | 234 (100.0%) | 144 (61.5%) |
| Total | 1,029 (40.2%) | 1,257 (49.2%) |
Disability Status by Sex by Age in San Saba
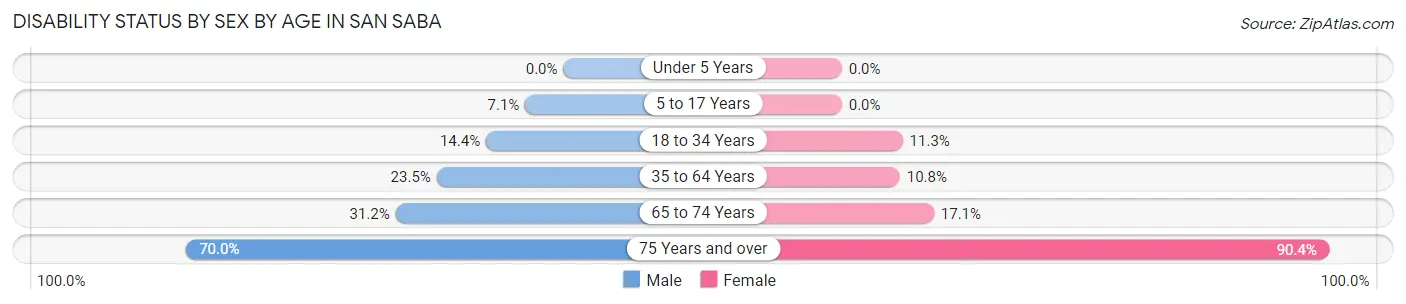
| Age Bracket | Male | Female |
| Under 5 Years | 0 (0.0%) | 0 (0.0%) |
| 5 to 17 Years | 20 (7.1%) | 0 (0.0%) |
| 18 to 34 Years | 55 (14.4%) | 13 (11.3%) |
| 35 to 64 Years | 99 (23.5%) | 46 (10.8%) |
| 65 to 74 Years | 38 (31.1%) | 27 (17.1%) |
| 75 Years and over | 91 (70.0%) | 94 (90.4%) |
Disability Class by Sex by Age in San Saba
Disability Class: Hearing Difficulty
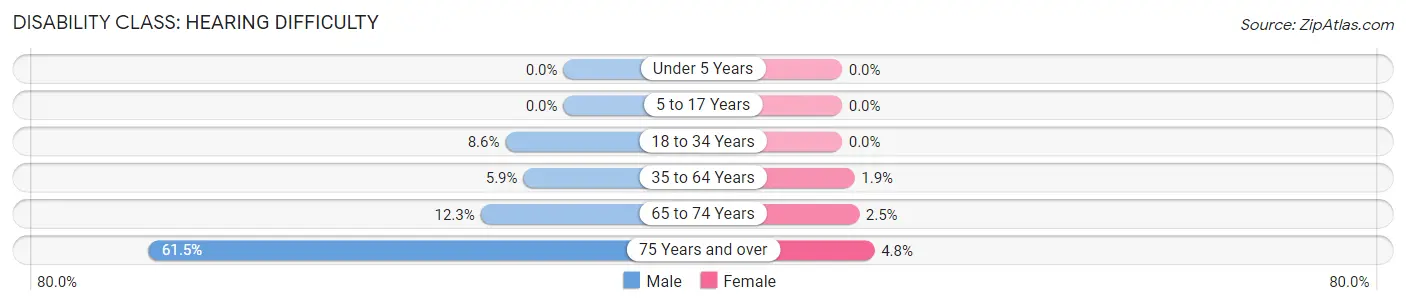
| Age Bracket | Male | Female |
| Under 5 Years | 0 (0.0%) | 0 (0.0%) |
| 5 to 17 Years | 0 (0.0%) | 0 (0.0%) |
| 18 to 34 Years | 33 (8.6%) | 0 (0.0%) |
| 35 to 64 Years | 25 (5.9%) | 8 (1.9%) |
| 65 to 74 Years | 15 (12.3%) | 4 (2.5%) |
| 75 Years and over | 80 (61.5%) | 5 (4.8%) |
Disability Class: Vision Difficulty
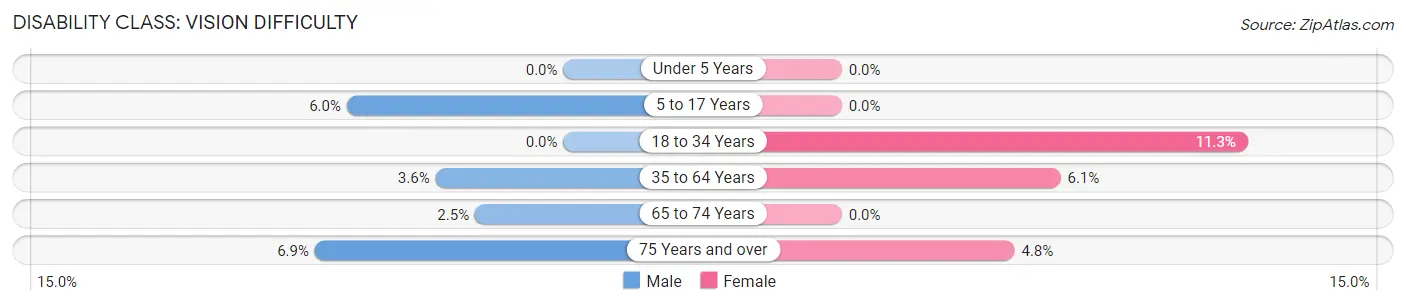
| Age Bracket | Male | Female |
| Under 5 Years | 0 (0.0%) | 0 (0.0%) |
| 5 to 17 Years | 17 (6.0%) | 0 (0.0%) |
| 18 to 34 Years | 0 (0.0%) | 13 (11.3%) |
| 35 to 64 Years | 15 (3.6%) | 26 (6.1%) |
| 65 to 74 Years | 3 (2.5%) | 0 (0.0%) |
| 75 Years and over | 9 (6.9%) | 5 (4.8%) |
Disability Class: Cognitive Difficulty
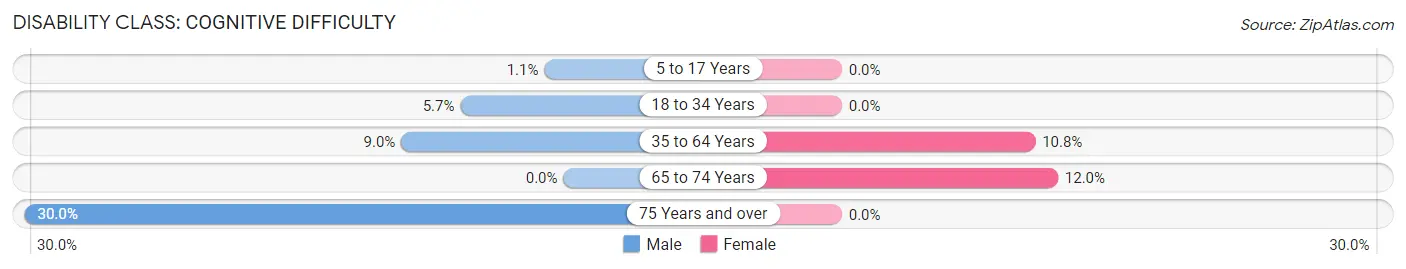
| Age Bracket | Male | Female |
| 5 to 17 Years | 3 (1.1%) | 0 (0.0%) |
| 18 to 34 Years | 22 (5.7%) | 0 (0.0%) |
| 35 to 64 Years | 38 (9.0%) | 46 (10.8%) |
| 65 to 74 Years | 0 (0.0%) | 19 (12.0%) |
| 75 Years and over | 39 (30.0%) | 0 (0.0%) |
Disability Class: Ambulatory Difficulty
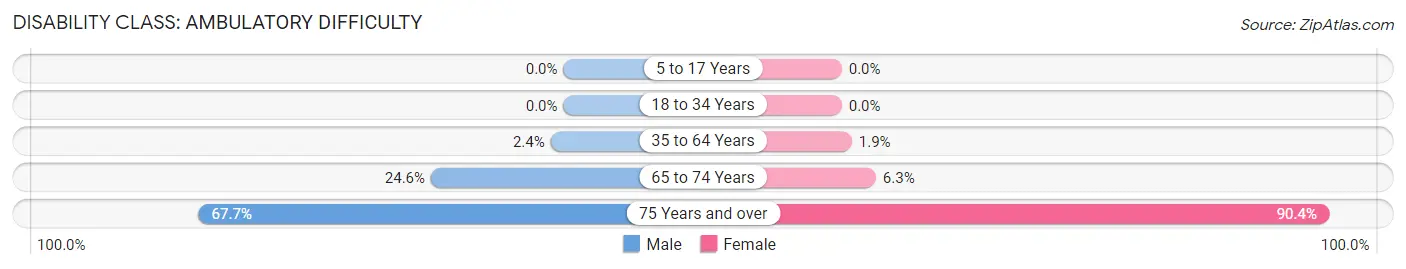
| Age Bracket | Male | Female |
| 5 to 17 Years | 0 (0.0%) | 0 (0.0%) |
| 18 to 34 Years | 0 (0.0%) | 0 (0.0%) |
| 35 to 64 Years | 10 (2.4%) | 8 (1.9%) |
| 65 to 74 Years | 30 (24.6%) | 10 (6.3%) |
| 75 Years and over | 88 (67.7%) | 94 (90.4%) |
Disability Class: Self-Care Difficulty
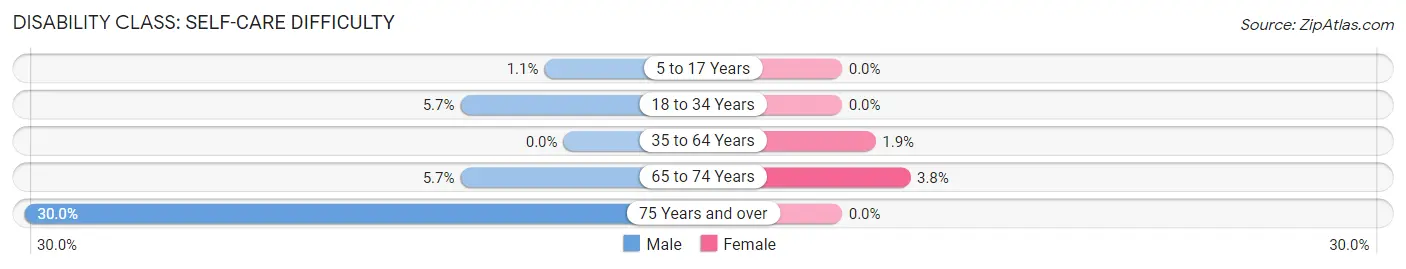
| Age Bracket | Male | Female |
| 5 to 17 Years | 3 (1.1%) | 0 (0.0%) |
| 18 to 34 Years | 22 (5.7%) | 0 (0.0%) |
| 35 to 64 Years | 0 (0.0%) | 8 (1.9%) |
| 65 to 74 Years | 7 (5.7%) | 6 (3.8%) |
| 75 Years and over | 39 (30.0%) | 0 (0.0%) |
Technology Access in San Saba
Computing Device Access in San Saba
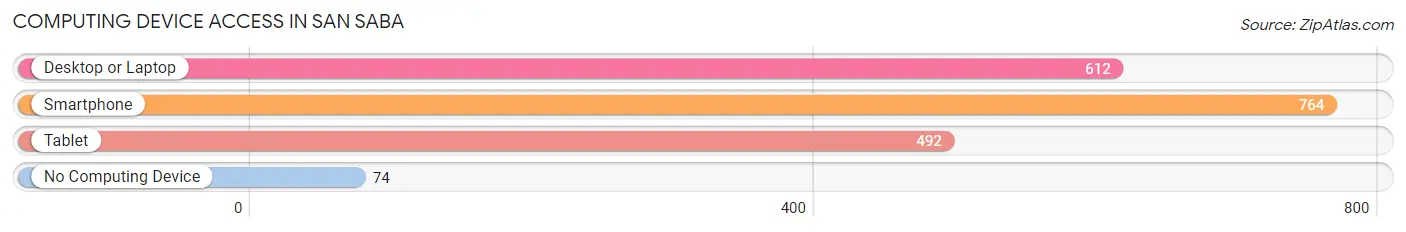
| Device Type | # Households | % Households |
| Desktop or Laptop | 612 | 64.1% |
| Smartphone | 764 | 80.1% |
| Tablet | 492 | 51.6% |
| No Computing Device | 74 | 7.8% |
| Total | 954 | 100.0% |
Internet Access in San Saba
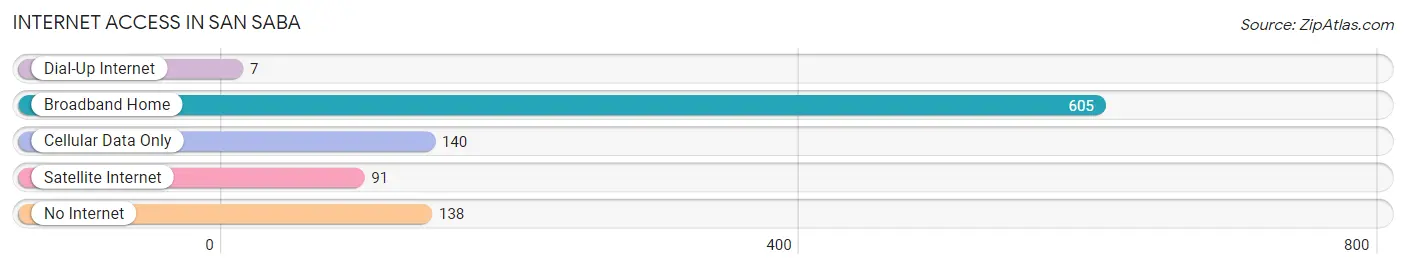
| Internet Type | # Households | % Households |
| Dial-Up Internet | 7 | 0.7% |
| Broadband Home | 605 | 63.4% |
| Cellular Data Only | 140 | 14.7% |
| Satellite Internet | 91 | 9.5% |
| No Internet | 138 | 14.5% |
| Total | 954 | 100.0% |
San Saba Summary
History
The city of San Saba, Texas is located in the heart of the Texas Hill Country, and is the county seat of San Saba County. The area was first settled by Native Americans, including the Tonkawa, Comanche, and Apache tribes. The first European settlers arrived in the area in the early 1800s, and the town of San Saba was officially established in 1854.
The town was named after the San Saba River, which was named by Spanish explorers in the 1700s. The river was named after the San Saba Mission, which was established by Franciscan missionaries in 1757. The mission was intended to convert the local Native Americans to Christianity, but it was abandoned in 1768 due to raids by the Comanche and Apache tribes.
The town of San Saba quickly grew in the late 1800s, and by the early 1900s it had become a major center for ranching and farming. The town was also home to several businesses, including a cotton gin, a flour mill, and a blacksmith shop.
In the early 1900s, San Saba was also home to a thriving oil industry. The first oil well was drilled in the area in 1909, and by the 1920s the town was home to several oil companies. The oil industry continued to be a major part of the local economy until the late 1970s, when the oil industry began to decline.
Geography
San Saba is located in the heart of the Texas Hill Country, and is situated along the San Saba River. The town is located about 90 miles northwest of Austin, and is surrounded by rolling hills and lush vegetation. The area is known for its beautiful scenery, and is home to several state parks and recreational areas.
The climate in San Saba is generally mild, with hot summers and mild winters. The average temperature in the summer is around 90 degrees Fahrenheit, and the average temperature in the winter is around 50 degrees Fahrenheit.
Economy
The economy of San Saba is largely based on agriculture and tourism. The area is home to several large ranches, and is known for its cattle and sheep production. The area is also home to several wineries, and is a popular destination for wine tours.
The town is also home to several businesses, including restaurants, retail stores, and hotels. The town is also home to several manufacturing companies, including a furniture factory and a metal fabrication plant.
Demographics
As of the 2010 census, the population of San Saba was 3,099. The population is largely white (90.2%), with a small Hispanic population (7.2%). The median household income in the town is $37,917, and the median age is 41.7 years. The town is home to several churches, and is served by the San Saba Independent School District.
Common Questions
What is Per Capita Income in San Saba?
Per Capita income in San Saba is $18,312.
What is the Median Family Income in San Saba?
Median Family Income in San Saba is $53,929.
What is the Median Household income in San Saba?
Median Household Income in San Saba is $43,224.
What is Income or Wage Gap in San Saba?
Income or Wage Gap in San Saba is 16.3%.
Women in San Saba earn 83.7 cents for every dollar earned by a man.
What is Family Income Deficit in San Saba?
Family Income Deficit in San Saba is $7,378.
Families that are below poverty line in San Saba earn $7,378 less on average than the poverty threshold level.
What is Inequality or Gini Index in San Saba?
Inequality or Gini Index in San Saba is 0.40.
What is the Total Population of San Saba?
Total Population of San Saba is 3,122.
What is the Total Male Population of San Saba?
Total Male Population of San Saba is 1,703.
What is the Total Female Population of San Saba?
Total Female Population of San Saba is 1,419.
What is the Ratio of Males per 100 Females in San Saba?
There are 120.01 Males per 100 Females in San Saba.
What is the Ratio of Females per 100 Males in San Saba?
There are 83.32 Females per 100 Males in San Saba.
What is the Median Population Age in San Saba?
Median Population Age in San Saba is 36.2 Years.
What is the Average Family Size in San Saba
Average Family Size in San Saba is 3.3 People.
What is the Average Household Size in San Saba
Average Household Size in San Saba is 2.7 People.
How Large is the Labor Force in San Saba?
There are 1,193 People in the Labor Forcein in San Saba.
What is the Percentage of People in the Labor Force in San Saba?
48.0% of People are in the Labor Force in San Saba.
What is the Unemployment Rate in San Saba?
Unemployment Rate in San Saba is 4.6%.