San Pedro, TX Map & Demographics
San Pedro Map
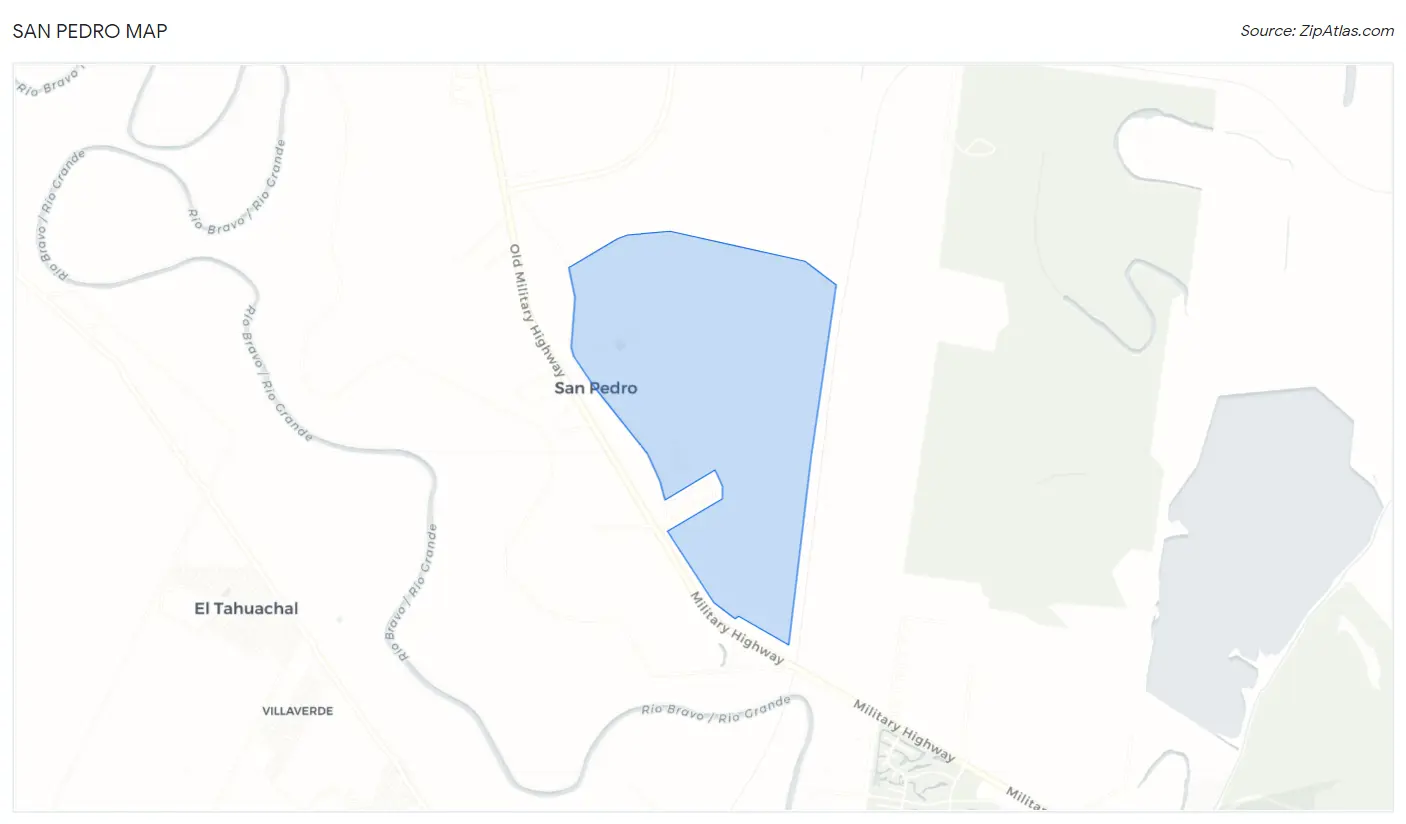
San Pedro Overview
$17,237
PER CAPITA INCOME
$38,173
AVG FAMILY INCOME
$39,904
AVG HOUSEHOLD INCOME
0.33
INEQUALITY / GINI INDEX
360
TOTAL POPULATION
179
MALE POPULATION
181
FEMALE POPULATION
98.90
MALES / 100 FEMALES
101.12
FEMALES / 100 MALES
30.8
MEDIAN AGE
4.3
AVG FAMILY SIZE
3.3
AVG HOUSEHOLD SIZE
175
LABOR FORCE [ PEOPLE ]
69.7%
PERCENT IN LABOR FORCE
Income in San Pedro
Income Overview in San Pedro
Per Capita Income in San Pedro is $17,237, while median incomes of families and households are $38,173 and $39,904 respectively.
| Characteristic | Number | Measure |
| Per Capita Income | 360 | $17,237 |
| Median Family Income | 71 | $38,173 |
| Mean Family Income | 71 | $50,280 |
| Median Household Income | 109 | $39,904 |
| Mean Household Income | 109 | $56,915 |
| Income Deficit | 71 | $0 |
| Wage / Income Gap (%) | 360 | 0.00% |
| Wage / Income Gap ($) | 360 | 100.00¢ per $1 |
| Gini / Inequality Index | 360 | 0.33 |
Earnings by Sex in San Pedro
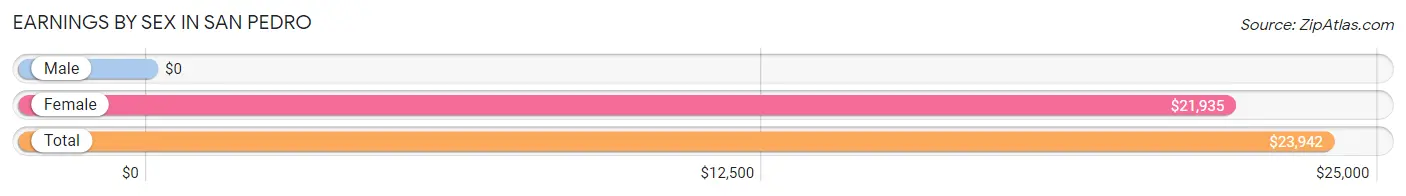
| Sex | Number | Average Earnings |
| Male | 93 (53.1%) | $0 |
| Female | 82 (46.9%) | $21,935 |
| Total | 175 (100.0%) | $23,942 |
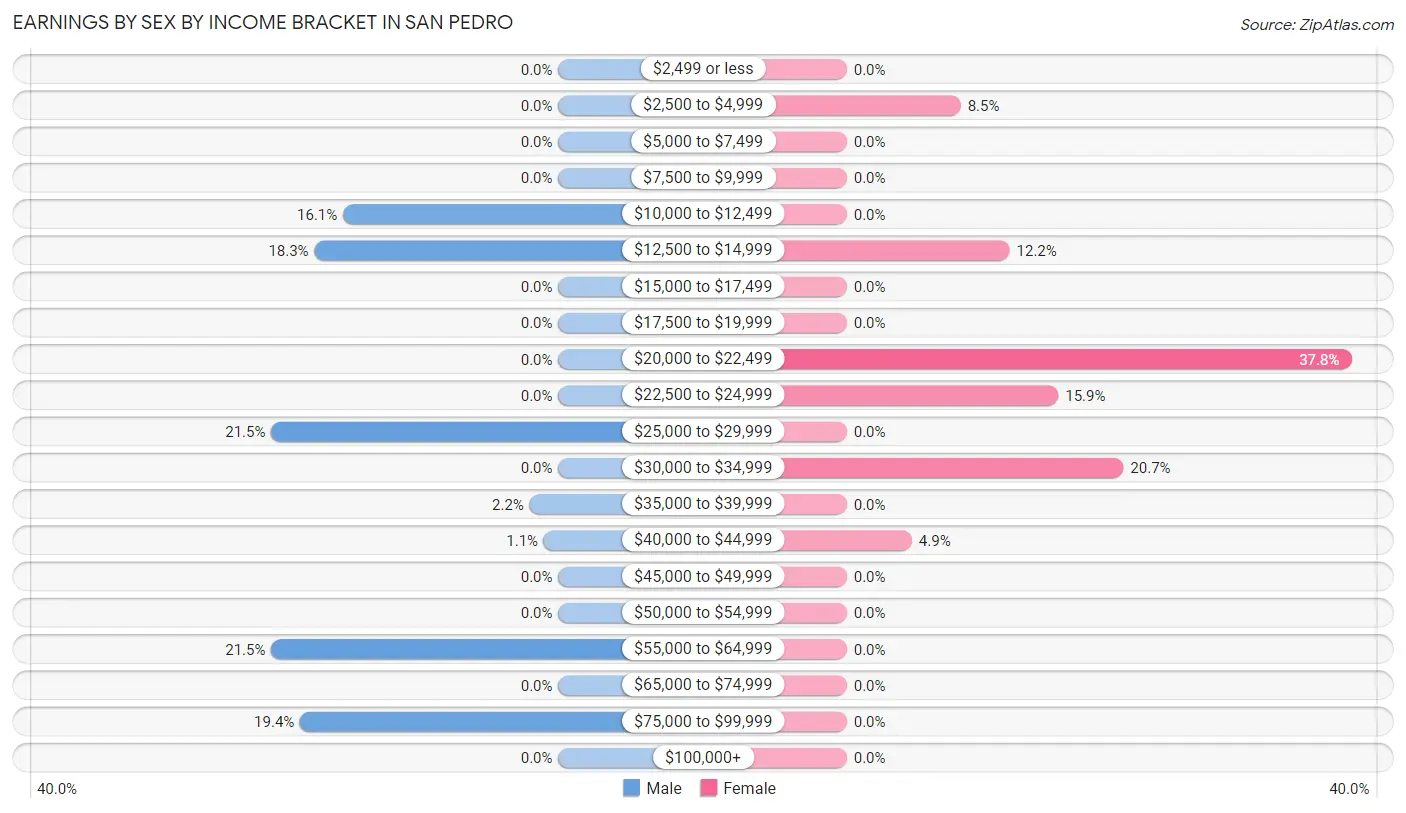
Earnings by Sex by Income Bracket in San Pedro
The most common earnings brackets in San Pedro are $25,000 to $29,999 for men (20 | 21.5%) and $20,000 to $22,499 for women (31 | 37.8%).
| Income | Male | Female |
| $2,499 or less | 0 (0.0%) | 0 (0.0%) |
| $2,500 to $4,999 | 0 (0.0%) | 7 (8.5%) |
| $5,000 to $7,499 | 0 (0.0%) | 0 (0.0%) |
| $7,500 to $9,999 | 0 (0.0%) | 0 (0.0%) |
| $10,000 to $12,499 | 15 (16.1%) | 0 (0.0%) |
| $12,500 to $14,999 | 17 (18.3%) | 10 (12.2%) |
| $15,000 to $17,499 | 0 (0.0%) | 0 (0.0%) |
| $17,500 to $19,999 | 0 (0.0%) | 0 (0.0%) |
| $20,000 to $22,499 | 0 (0.0%) | 31 (37.8%) |
| $22,500 to $24,999 | 0 (0.0%) | 13 (15.9%) |
| $25,000 to $29,999 | 20 (21.5%) | 0 (0.0%) |
| $30,000 to $34,999 | 0 (0.0%) | 17 (20.7%) |
| $35,000 to $39,999 | 2 (2.1%) | 0 (0.0%) |
| $40,000 to $44,999 | 1 (1.1%) | 4 (4.9%) |
| $45,000 to $49,999 | 0 (0.0%) | 0 (0.0%) |
| $50,000 to $54,999 | 0 (0.0%) | 0 (0.0%) |
| $55,000 to $64,999 | 20 (21.5%) | 0 (0.0%) |
| $65,000 to $74,999 | 0 (0.0%) | 0 (0.0%) |
| $75,000 to $99,999 | 18 (19.4%) | 0 (0.0%) |
| $100,000+ | 0 (0.0%) | 0 (0.0%) |
| Total | 93 (100.0%) | 82 (100.0%) |
Earnings by Sex by Educational Attainment in San Pedro
| Educational Attainment | Male Income | Female Income |
| Less than High School | - | - |
| High School Diploma | - | - |
| College or Associate's Degree | - | - |
| Bachelor's Degree | - | - |
| Graduate Degree | - | - |
| Total | - | - |
Family Income in San Pedro
Family Income Brackets in San Pedro
According to the San Pedro family income data, there are 32 families falling into the $25,000 to $34,999 income range, which is the most common income bracket and makes up 45.1% of all families.
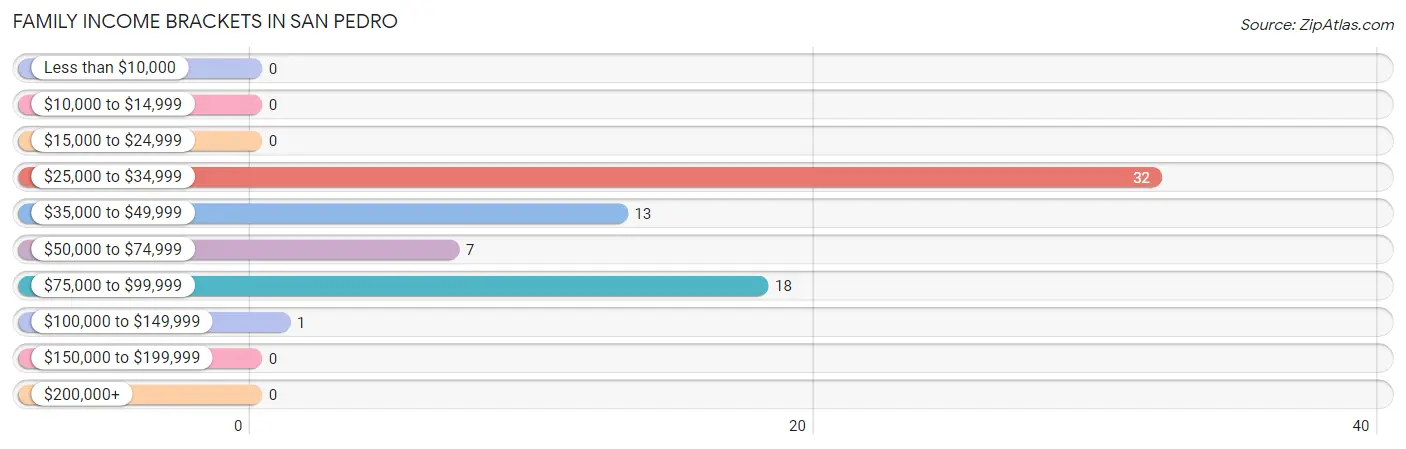
| Income Bracket | # Families | % Families |
| Less than $10,000 | 0 | 0.0% |
| $10,000 to $14,999 | 0 | 0.0% |
| $15,000 to $24,999 | 0 | 0.0% |
| $25,000 to $34,999 | 32 | 45.1% |
| $35,000 to $49,999 | 13 | 18.3% |
| $50,000 to $74,999 | 7 | 9.9% |
| $75,000 to $99,999 | 18 | 25.4% |
| $100,000 to $149,999 | 1 | 1.4% |
| $150,000 to $199,999 | 0 | 0.0% |
| $200,000+ | 0 | 0.0% |
Family Income by Famaliy Size in San Pedro
5-person families (39 | 54.9%) account for the highest median family income in San Pedro with $29,938 per family, while 5-person families (39 | 54.9%) have the highest median income of $5,988 per family member.
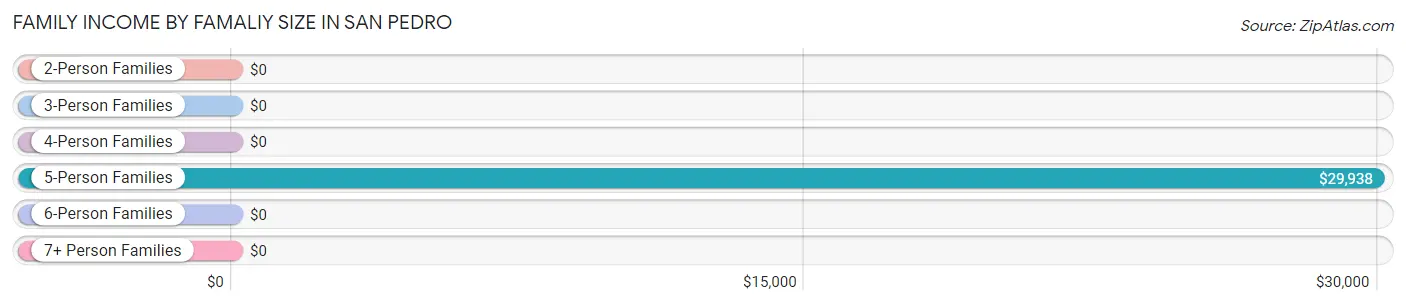
| Income Bracket | # Families | Median Income |
| 2-Person Families | 13 (18.3%) | $0 |
| 3-Person Families | 1 (1.4%) | $0 |
| 4-Person Families | 18 (25.4%) | $0 |
| 5-Person Families | 39 (54.9%) | $29,938 |
| 6-Person Families | 0 (0.0%) | $0 |
| 7+ Person Families | 0 (0.0%) | $0 |
| Total | 71 (100.0%) | $38,173 |
Family Income by Number of Earners in San Pedro
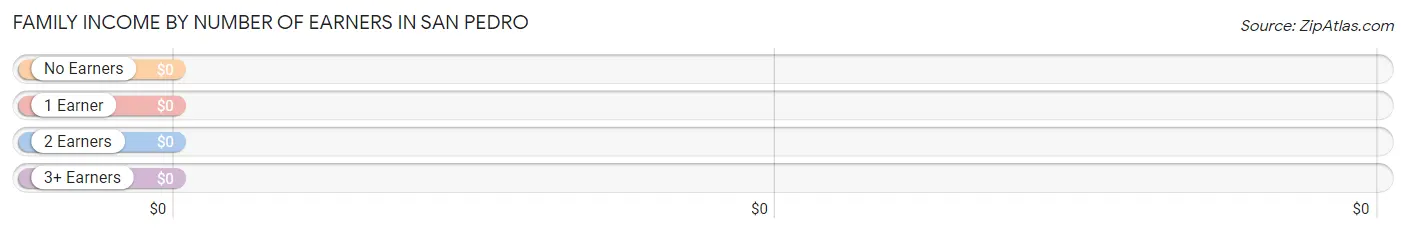
| Number of Earners | # Families | Median Income |
| No Earners | 0 (0.0%) | $0 |
| 1 Earner | 21 (29.6%) | $0 |
| 2 Earners | 43 (60.6%) | $0 |
| 3+ Earners | 7 (9.9%) | $0 |
| Total | 71 (100.0%) | $38,173 |
Household Income in San Pedro
Household Income Brackets in San Pedro
With 32 households falling in the category, the $25,000 to $34,999 income range is the most frequent in San Pedro, accounting for 29.4% of all households.
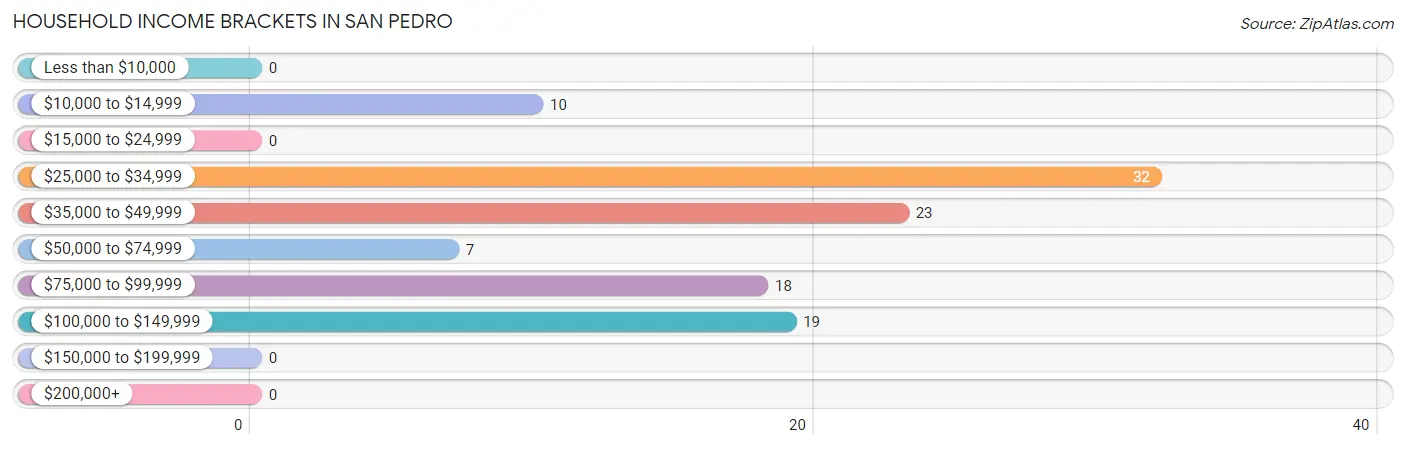
| Income Bracket | # Households | % Households |
| Less than $10,000 | 0 | 0.0% |
| $10,000 to $14,999 | 10 | 9.2% |
| $15,000 to $24,999 | 0 | 0.0% |
| $25,000 to $34,999 | 32 | 29.4% |
| $35,000 to $49,999 | 23 | 21.1% |
| $50,000 to $74,999 | 7 | 6.4% |
| $75,000 to $99,999 | 18 | 16.5% |
| $100,000 to $149,999 | 19 | 17.4% |
| $150,000 to $199,999 | 0 | 0.0% |
| $200,000+ | 0 | 0.0% |
Household Income by Householder Age in San Pedro
The median household income in San Pedro is $39,904, with the highest median household income of $38,654 found in the 45 to 64 years age bracket for the primary householder. A total of 36 households (33.0%) fall into this category.
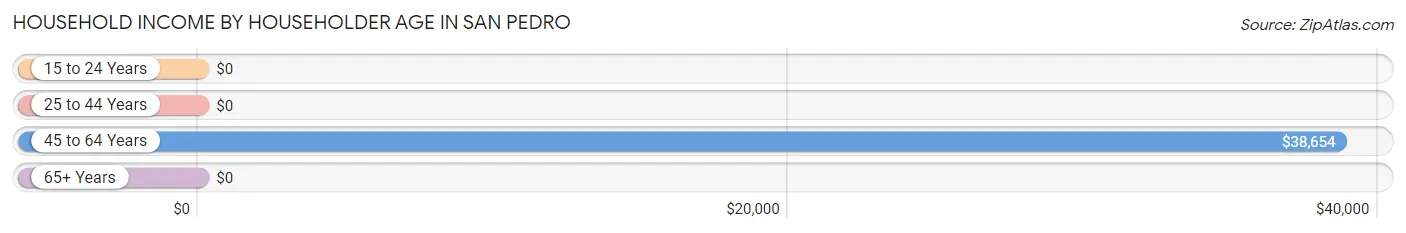
| Income Bracket | # Households | Median Income |
| 15 to 24 Years | 0 (0.0%) | $0 |
| 25 to 44 Years | 38 (34.9%) | $0 |
| 45 to 64 Years | 36 (33.0%) | $38,654 |
| 65+ Years | 35 (32.1%) | $0 |
| Total | 109 (100.0%) | $39,904 |
Poverty in San Pedro
Income Below Poverty by Sex and Age in San Pedro
With 53.6% poverty level for males and 34.3% for females among the residents of San Pedro, under 5 year old males and under 5 year old females are the most vulnerable to poverty, with 14 males (100.0%) and 20 females (100.0%) in their respective age groups living below the poverty level.
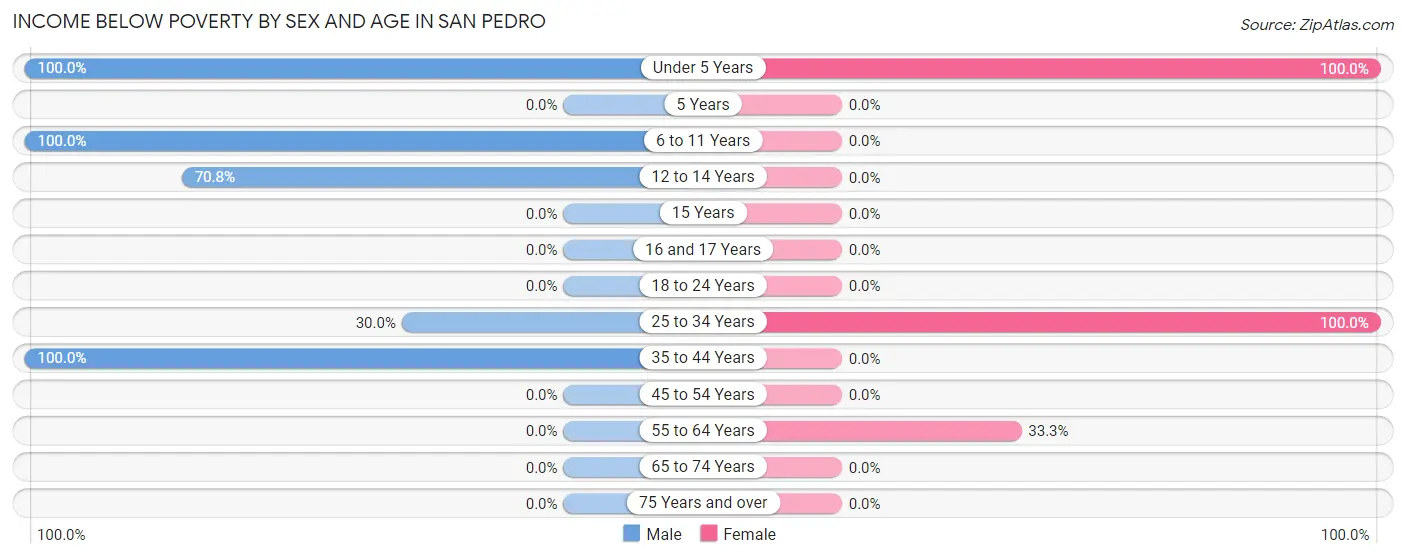
| Age Bracket | Male | Female |
| Under 5 Years | 14 (100.0%) | 20 (100.0%) |
| 5 Years | 0 (0.0%) | 0 (0.0%) |
| 6 to 11 Years | 30 (100.0%) | 0 (0.0%) |
| 12 to 14 Years | 17 (70.8%) | 0 (0.0%) |
| 15 Years | 0 (0.0%) | 0 (0.0%) |
| 16 and 17 Years | 0 (0.0%) | 0 (0.0%) |
| 18 to 24 Years | 0 (0.0%) | 0 (0.0%) |
| 25 to 34 Years | 15 (30.0%) | 30 (100.0%) |
| 35 to 44 Years | 20 (100.0%) | 0 (0.0%) |
| 45 to 54 Years | 0 (0.0%) | 0 (0.0%) |
| 55 to 64 Years | 0 (0.0%) | 12 (33.3%) |
| 65 to 74 Years | 0 (0.0%) | 0 (0.0%) |
| 75 Years and over | 0 (0.0%) | 0 (0.0%) |
| Total | 96 (53.6%) | 62 (34.3%) |
Income Above Poverty by Sex and Age in San Pedro
According to the poverty statistics in San Pedro, males aged 55 to 64 years and females aged 12 to 14 years are the age groups that are most secure financially, with 100.0% of males and 100.0% of females in these age groups living above the poverty line.
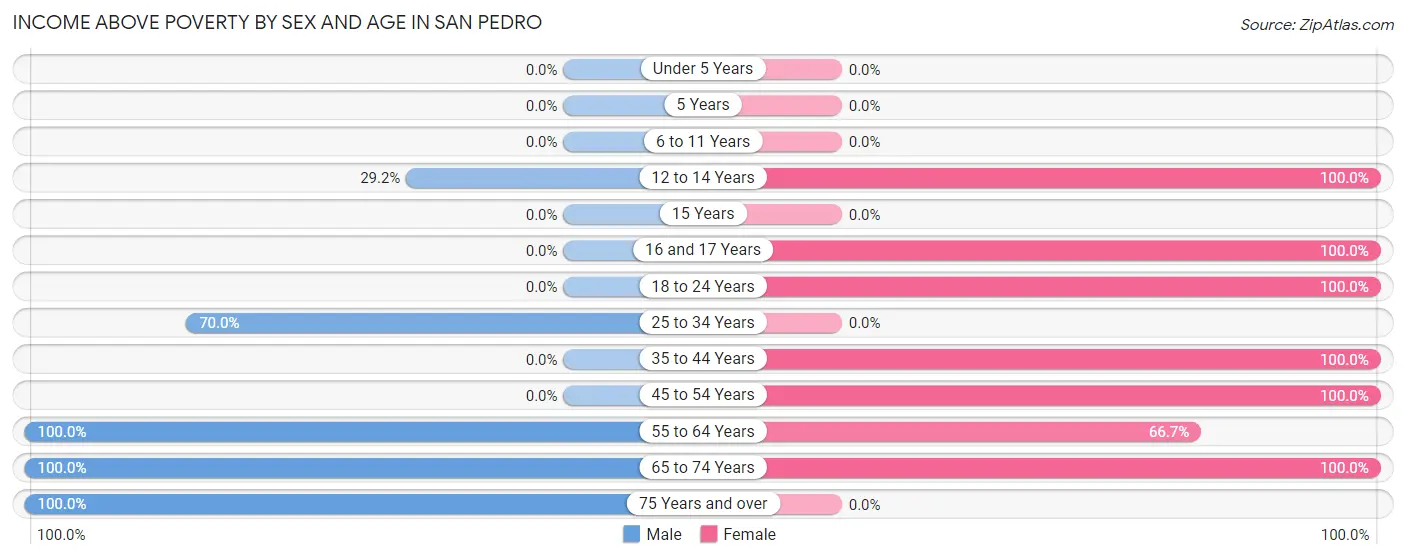
| Age Bracket | Male | Female |
| Under 5 Years | 0 (0.0%) | 0 (0.0%) |
| 5 Years | 0 (0.0%) | 0 (0.0%) |
| 6 to 11 Years | 0 (0.0%) | 0 (0.0%) |
| 12 to 14 Years | 7 (29.2%) | 21 (100.0%) |
| 15 Years | 0 (0.0%) | 0 (0.0%) |
| 16 and 17 Years | 0 (0.0%) | 10 (100.0%) |
| 18 to 24 Years | 0 (0.0%) | 17 (100.0%) |
| 25 to 34 Years | 35 (70.0%) | 0 (0.0%) |
| 35 to 44 Years | 0 (0.0%) | 10 (100.0%) |
| 45 to 54 Years | 0 (0.0%) | 19 (100.0%) |
| 55 to 64 Years | 24 (100.0%) | 24 (66.7%) |
| 65 to 74 Years | 6 (100.0%) | 18 (100.0%) |
| 75 Years and over | 11 (100.0%) | 0 (0.0%) |
| Total | 83 (46.4%) | 119 (65.7%) |
Income Below Poverty Among Married-Couple Families in San Pedro
The poverty statistics for married-couple families in San Pedro show that 74.1% or 20 of the total 27 families live below the poverty line. Families with 3 or 4 children have the highest poverty rate of 100.0%, comprising of 20 families. On the other hand, families with 1 or 2 children have the lowest poverty rate of 0.0%, which includes 0 families.
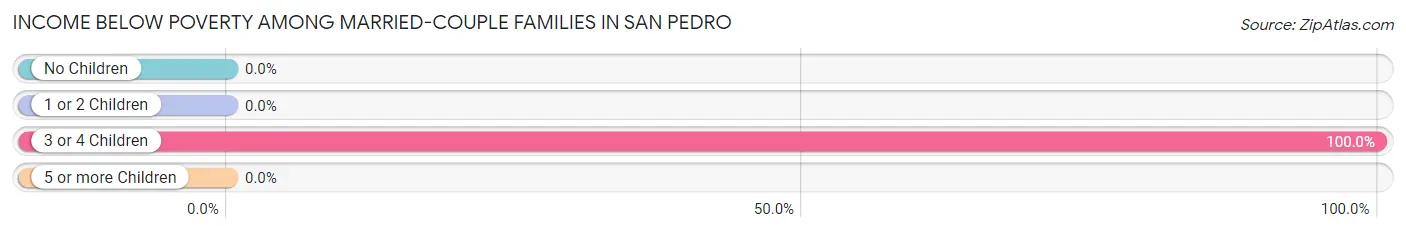
| Children | Above Poverty | Below Poverty |
| No Children | 0 (0.0%) | 0 (0.0%) |
| 1 or 2 Children | 7 (100.0%) | 0 (0.0%) |
| 3 or 4 Children | 0 (0.0%) | 20 (100.0%) |
| 5 or more Children | 0 (0.0%) | 0 (0.0%) |
| Total | 7 (25.9%) | 20 (74.1%) |
Income Below Poverty Among Single-Parent Households in San Pedro
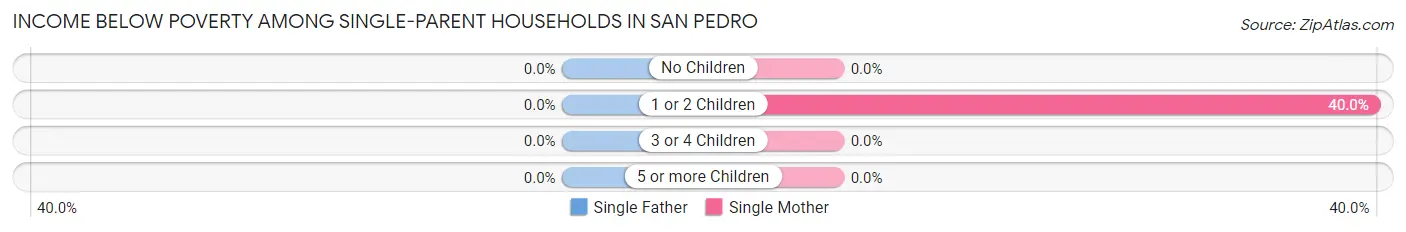
| Children | Single Father | Single Mother |
| No Children | 0 (0.0%) | 0 (0.0%) |
| 1 or 2 Children | 0 (0.0%) | 12 (40.0%) |
| 3 or 4 Children | 0 (0.0%) | 0 (0.0%) |
| 5 or more Children | 0 (0.0%) | 0 (0.0%) |
| Total | 0 (0.0%) | 12 (27.9%) |
Income Below Poverty Among Married-Couple vs Single-Parent Households in San Pedro
The poverty data for San Pedro shows that 20 of the married-couple family households (74.1%) and 12 of the single-parent households (27.3%) are living below the poverty level. Within the married-couple family households, those with 3 or 4 children have the highest poverty rate, with 20 households (100.0%) falling below the poverty line. Among the single-parent households, those with 1 or 2 children have the highest poverty rate, with 12 household (40.0%) living below poverty.
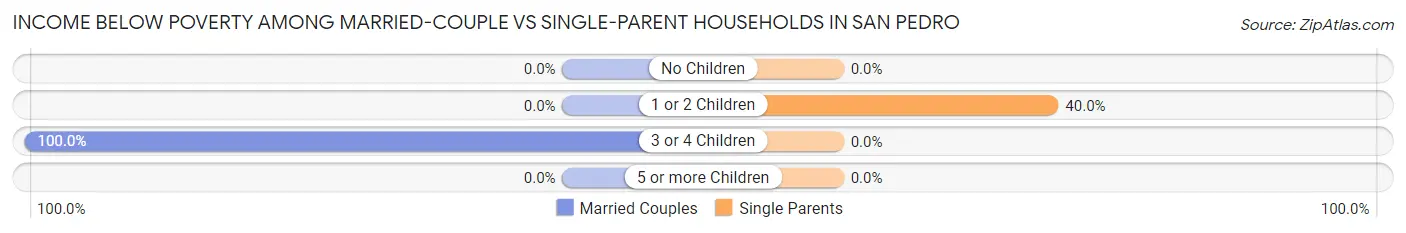
| Children | Married-Couple Families | Single-Parent Households |
| No Children | 0 (0.0%) | 0 (0.0%) |
| 1 or 2 Children | 0 (0.0%) | 12 (40.0%) |
| 3 or 4 Children | 20 (100.0%) | 0 (0.0%) |
| 5 or more Children | 0 (0.0%) | 0 (0.0%) |
| Total | 20 (74.1%) | 12 (27.3%) |
Race in San Pedro
The most populous races in San Pedro are Hispanic or Latino (360 | 100.0%), White / Caucasian (164 | 45.6%), and Two or more Races (102 | 28.3%).
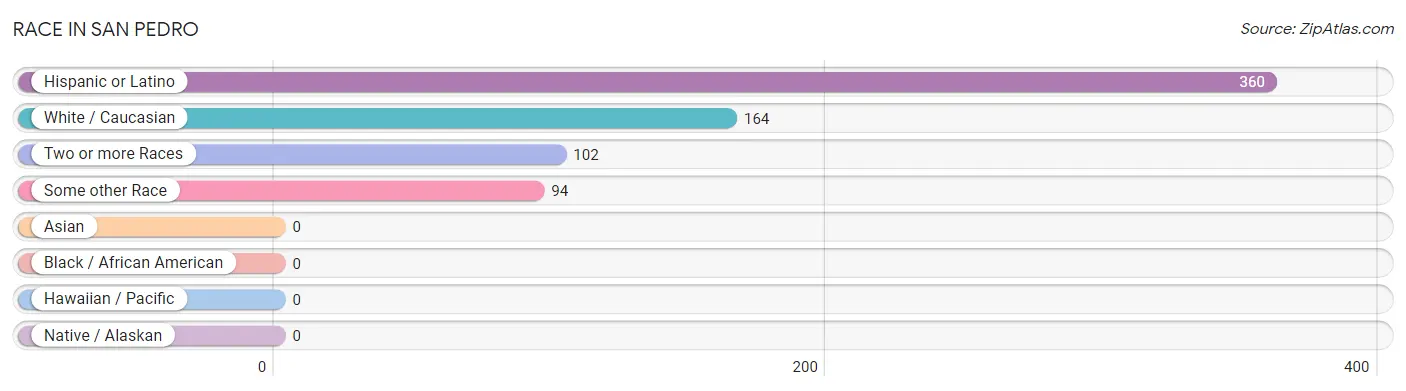
| Race | # Population | % Population |
| Asian | 0 | 0.0% |
| Black / African American | 0 | 0.0% |
| Hawaiian / Pacific | 0 | 0.0% |
| Hispanic or Latino | 360 | 100.0% |
| Native / Alaskan | 0 | 0.0% |
| White / Caucasian | 164 | 45.6% |
| Two or more Races | 102 | 28.3% |
| Some other Race | 94 | 26.1% |
| Total | 360 | 100.0% |
Ancestry in San Pedro
The most populous ancestries reported in San Pedro are , and Mexican (295 | 81.9%), together accounting for 81.9% of all San Pedro residents.

| Ancestry | # Population | % Population |
| Mexican | 295 | 81.9% | View All 1 Rows |
Immigrants in San Pedro
The most numerous immigrant groups reported in San Pedro came from Central America (32 | 8.9%), Latin America (32 | 8.9%), and Mexico (32 | 8.9%), together accounting for 26.7% of all San Pedro residents.
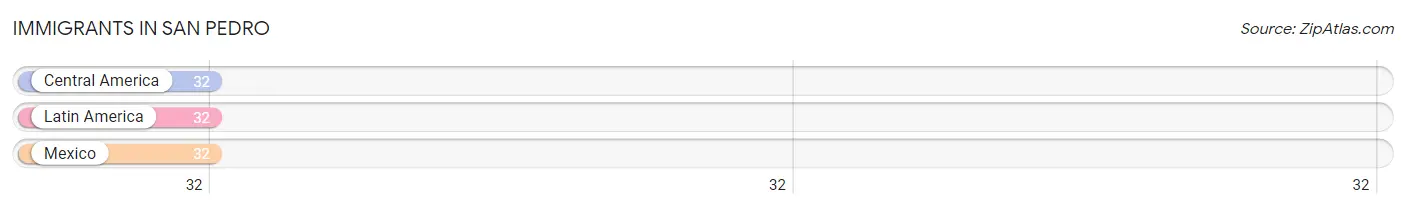
| Immigration Origin | # Population | % Population |
| Central America | 32 | 8.9% |
| Latin America | 32 | 8.9% |
| Mexico | 32 | 8.9% | View All 3 Rows |
Sex and Age in San Pedro
Sex and Age in San Pedro
The most populous age groups in San Pedro are 30 to 34 Years (32 | 17.9%) for men and 60 to 64 Years (24 | 13.3%) for women.
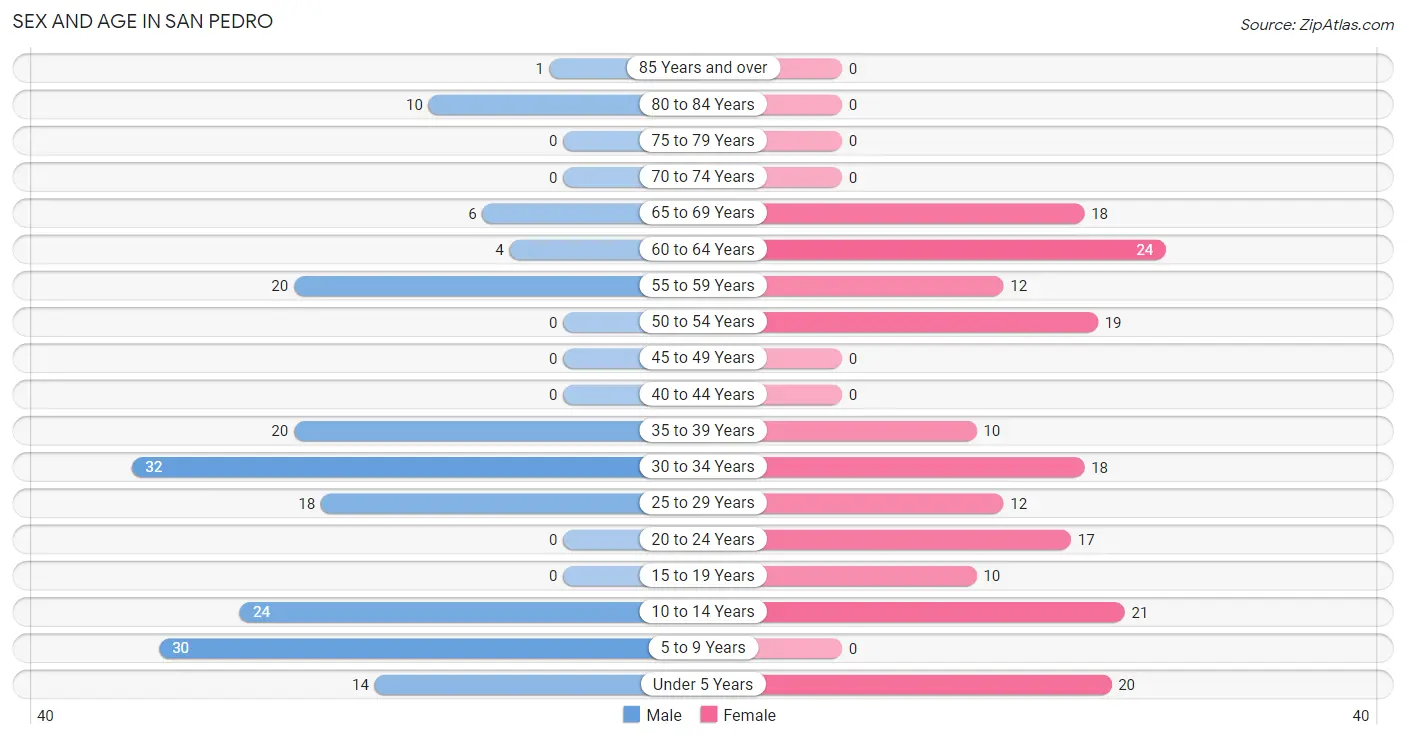
| Age Bracket | Male | Female |
| Under 5 Years | 14 (7.8%) | 20 (11.1%) |
| 5 to 9 Years | 30 (16.8%) | 0 (0.0%) |
| 10 to 14 Years | 24 (13.4%) | 21 (11.6%) |
| 15 to 19 Years | 0 (0.0%) | 10 (5.5%) |
| 20 to 24 Years | 0 (0.0%) | 17 (9.4%) |
| 25 to 29 Years | 18 (10.1%) | 12 (6.6%) |
| 30 to 34 Years | 32 (17.9%) | 18 (9.9%) |
| 35 to 39 Years | 20 (11.2%) | 10 (5.5%) |
| 40 to 44 Years | 0 (0.0%) | 0 (0.0%) |
| 45 to 49 Years | 0 (0.0%) | 0 (0.0%) |
| 50 to 54 Years | 0 (0.0%) | 19 (10.5%) |
| 55 to 59 Years | 20 (11.2%) | 12 (6.6%) |
| 60 to 64 Years | 4 (2.2%) | 24 (13.3%) |
| 65 to 69 Years | 6 (3.4%) | 18 (9.9%) |
| 70 to 74 Years | 0 (0.0%) | 0 (0.0%) |
| 75 to 79 Years | 0 (0.0%) | 0 (0.0%) |
| 80 to 84 Years | 10 (5.6%) | 0 (0.0%) |
| 85 Years and over | 1 (0.6%) | 0 (0.0%) |
| Total | 179 (100.0%) | 181 (100.0%) |
Families and Households in San Pedro
Median Family Size in San Pedro
The median family size in San Pedro is 4.30 persons per family, with married-couple families (27 | 38.0%) accounting for the largest median family size of 4.74 persons per family. On the other hand, single male/father families (1 | 1.4%) represent the smallest median family size with 4.00 persons per family.
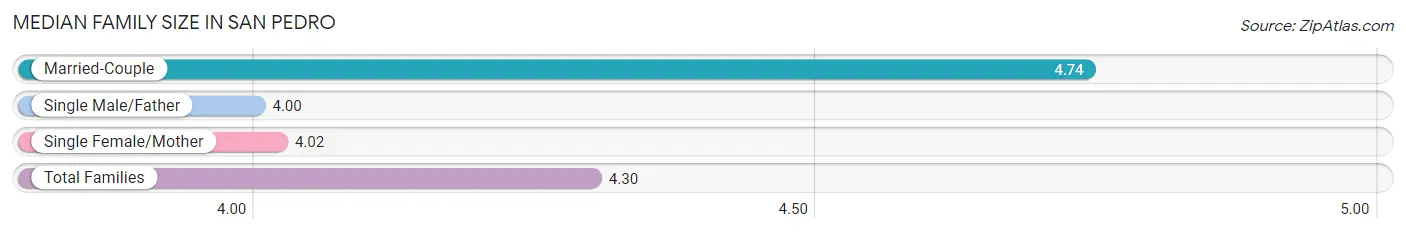
| Family Type | # Families | Family Size |
| Married-Couple | 27 (38.0%) | 4.74 |
| Single Male/Father | 1 (1.4%) | 4.00 |
| Single Female/Mother | 43 (60.6%) | 4.02 |
| Total Families | 71 (100.0%) | 4.30 |
Median Household Size in San Pedro
The median household size in San Pedro is 3.30 persons per household, with married-couple households (27 | 24.8%) accounting for the largest median household size of 4.74 persons per household. non-family households (38 | 34.9%) represent the smallest median household size with 1.45 persons per household.
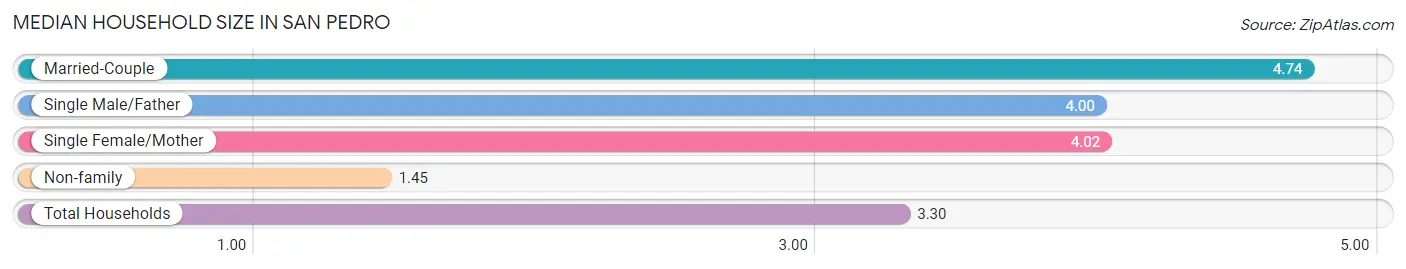
| Household Type | # Households | Household Size |
| Married-Couple | 27 (24.8%) | 4.74 |
| Single Male/Father | 1 (0.9%) | 4.00 |
| Single Female/Mother | 43 (39.5%) | 4.02 |
| Non-family | 38 (34.9%) | 1.45 |
| Total Households | 109 (100.0%) | 3.30 |
Household Size by Marriage Status in San Pedro
Out of a total of 109 households in San Pedro, 71 (65.1%) are family households, while 38 (34.9%) are nonfamily households. The most numerous type of family households are 5-person households, comprising 39, and the most common type of nonfamily households are 1-person households, comprising 20.
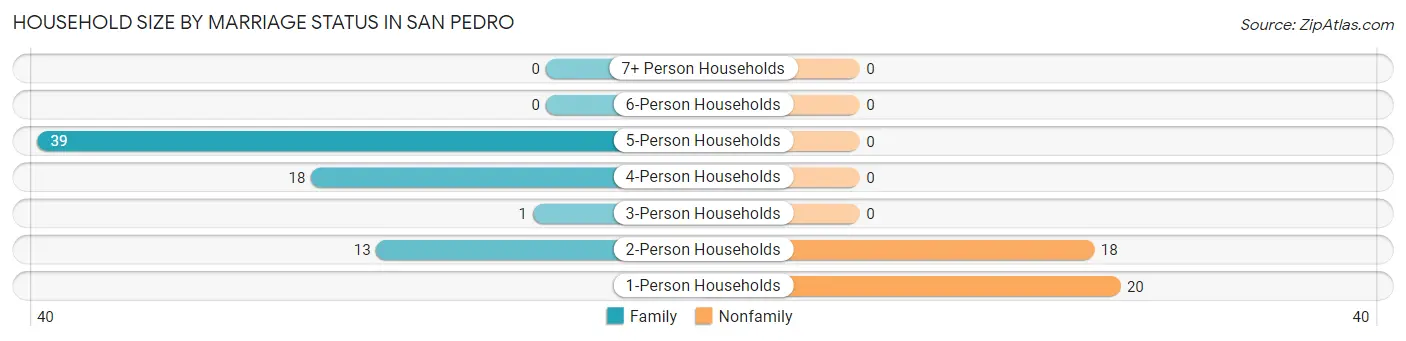
| Household Size | Family Households | Nonfamily Households |
| 1-Person Households | - | 20 (18.3%) |
| 2-Person Households | 13 (11.9%) | 18 (16.5%) |
| 3-Person Households | 1 (0.9%) | 0 (0.0%) |
| 4-Person Households | 18 (16.5%) | 0 (0.0%) |
| 5-Person Households | 39 (35.8%) | 0 (0.0%) |
| 6-Person Households | 0 (0.0%) | 0 (0.0%) |
| 7+ Person Households | 0 (0.0%) | 0 (0.0%) |
| Total | 71 (65.1%) | 38 (34.9%) |
Female Fertility in San Pedro
Fertility by Age in San Pedro
| Age Bracket | Women with Births | Births / 1,000 Women |
| 15 to 19 years | 0 (0.0%) | 0.0 |
| 20 to 34 years | 0 (0.0%) | 0.0 |
| 35 to 50 years | 0 (0.0%) | 0.0 |
| Total | 0 (0.0%) | 0.0 |
Fertility by Age by Marriage Status in San Pedro
| Age Bracket | Married | Unmarried |
| 15 to 19 years | 0 (0.0%) | 0 (0.0%) |
| 20 to 34 years | 0 (0.0%) | 0 (0.0%) |
| 35 to 50 years | 0 (0.0%) | 0 (0.0%) |
| Total | 0 (0.0%) | 0 (0.0%) |
Fertility by Education in San Pedro
| Educational Attainment | Women with Births | Births / 1,000 Women |
| Less than High School | 0 (0.0%) | 0.0 |
| High School Diploma | 0 (0.0%) | 0.0 |
| College or Associate's Degree | 0 (0.0%) | 0.0 |
| Bachelor's Degree | 0 (0.0%) | 0.0 |
| Graduate Degree | 0 (0.0%) | 0.0 |
| Total | 0 (0.0%) | 0.0 |
Fertility by Education by Marriage Status in San Pedro
| Educational Attainment | Married | Unmarried |
| Less than High School | 0 (0.0%) | 0 (0.0%) |
| High School Diploma | 0 (0.0%) | 0 (0.0%) |
| College or Associate's Degree | 0 (0.0%) | 0 (0.0%) |
| Bachelor's Degree | 0 (0.0%) | 0 (0.0%) |
| Graduate Degree | 0 (0.0%) | 0 (0.0%) |
| Total | 0 (0.0%) | 0 (0.0%) |
Employment Characteristics in San Pedro
Employment by Class of Employer in San Pedro
Among the 175 employed individuals in San Pedro, private company employees (135 | 77.1%), local government employees (22 | 12.6%), and federal government employees (18 | 10.3%) make up the most common classes of employment.
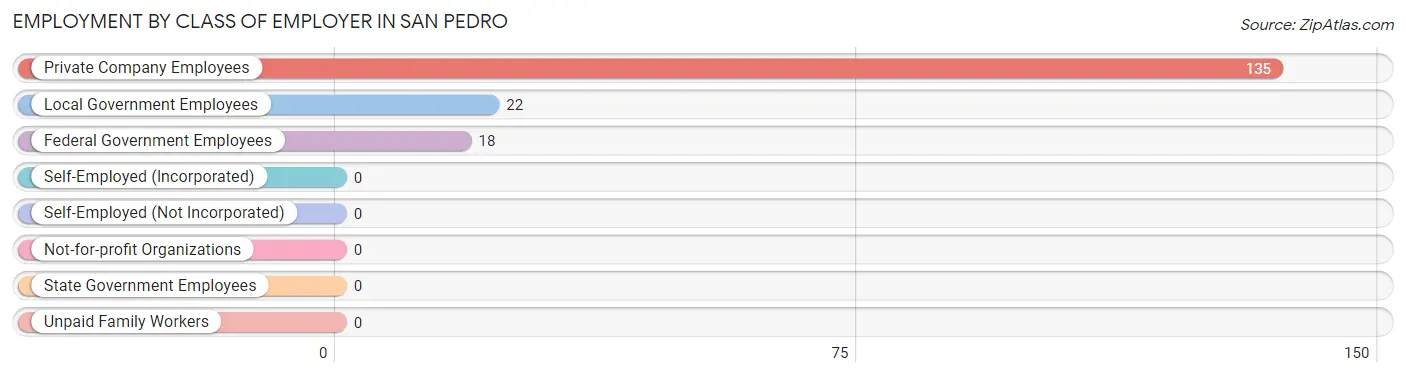
| Employer Class | # Employees | % Employees |
| Private Company Employees | 135 | 77.1% |
| Self-Employed (Incorporated) | 0 | 0.0% |
| Self-Employed (Not Incorporated) | 0 | 0.0% |
| Not-for-profit Organizations | 0 | 0.0% |
| Local Government Employees | 22 | 12.6% |
| State Government Employees | 0 | 0.0% |
| Federal Government Employees | 18 | 10.3% |
| Unpaid Family Workers | 0 | 0.0% |
| Total | 175 | 100.0% |
Employment Status by Age in San Pedro
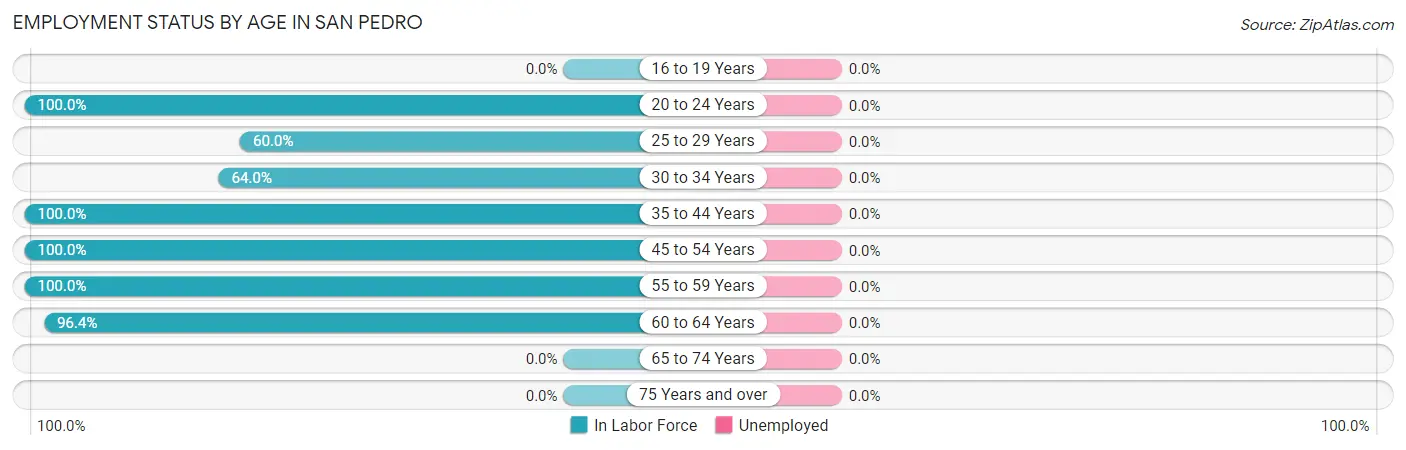
| Age Bracket | In Labor Force | Unemployed |
| 16 to 19 Years | 0 (0.0%) | 0 (0.0%) |
| 20 to 24 Years | 17 (100.0%) | 0 (0.0%) |
| 25 to 29 Years | 18 (60.0%) | 0 (0.0%) |
| 30 to 34 Years | 32 (64.0%) | 0 (0.0%) |
| 35 to 44 Years | 30 (100.0%) | 0 (0.0%) |
| 45 to 54 Years | 19 (100.0%) | 0 (0.0%) |
| 55 to 59 Years | 32 (100.0%) | 0 (0.0%) |
| 60 to 64 Years | 27 (96.4%) | 0 (0.0%) |
| 65 to 74 Years | 0 (0.0%) | 0 (0.0%) |
| 75 Years and over | 0 (0.0%) | 0 (0.0%) |
| Total | 175 (69.7%) | 0 (0.0%) |
Employment Status by Educational Attainment in San Pedro
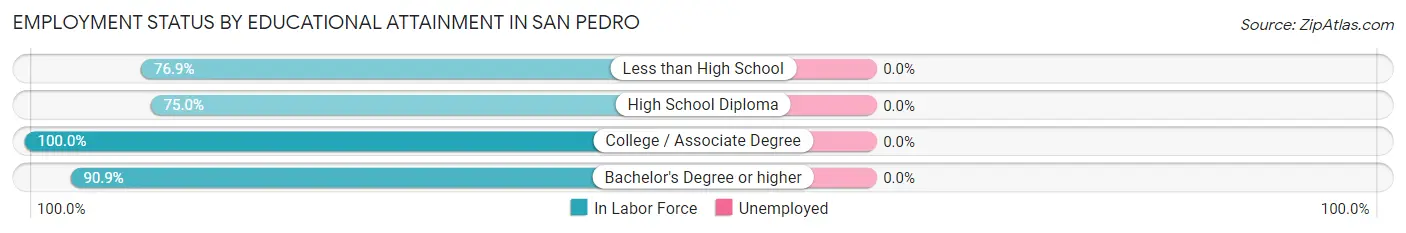
| Educational Attainment | In Labor Force | Unemployed |
| Less than High School | 60 (76.9%) | 0 (0.0%) |
| High School Diploma | 36 (75.0%) | 0 (0.0%) |
| College / Associate Degree | 52 (100.0%) | 0 (0.0%) |
| Bachelor's Degree or higher | 10 (90.9%) | 0 (0.0%) |
| Total | 158 (83.6%) | 0 (0.0%) |
Employment Occupations by Sex in San Pedro
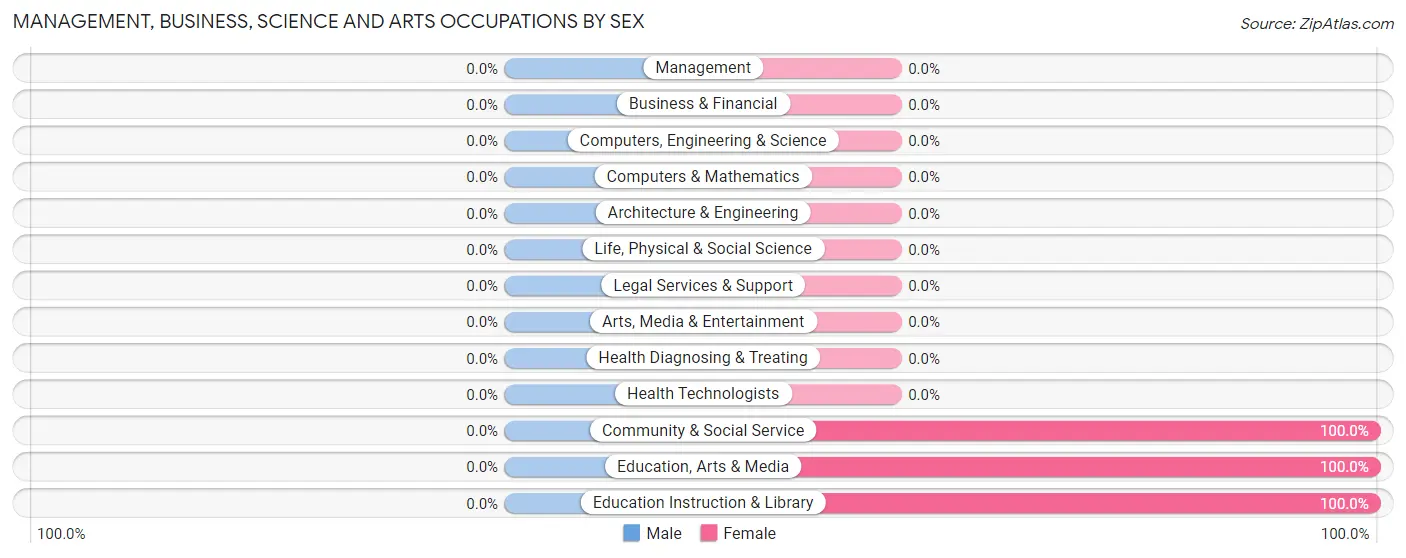
Management, Business, Science and Arts Occupations
The most common Management, Business, Science and Arts occupations in San Pedro are Community & Social Service (31 | 17.7%), Education, Arts & Media (19 | 10.9%), and Education Instruction & Library (12 | 6.9%).
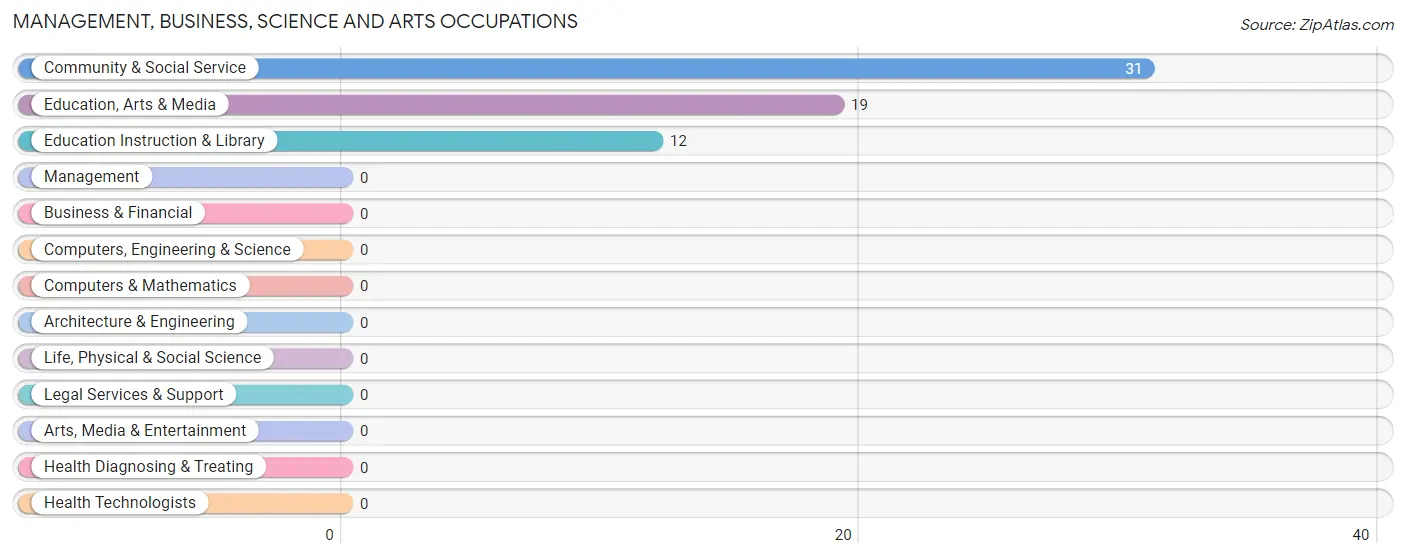
Management, Business, Science and Arts Occupations by Sex
| Occupation | Male | Female |
| Management | 0 (0.0%) | 0 (0.0%) |
| Business & Financial | 0 (0.0%) | 0 (0.0%) |
| Computers, Engineering & Science | 0 (0.0%) | 0 (0.0%) |
| Computers & Mathematics | 0 (0.0%) | 0 (0.0%) |
| Architecture & Engineering | 0 (0.0%) | 0 (0.0%) |
| Life, Physical & Social Science | 0 (0.0%) | 0 (0.0%) |
| Community & Social Service | 0 (0.0%) | 31 (100.0%) |
| Education, Arts & Media | 0 (0.0%) | 19 (100.0%) |
| Legal Services & Support | 0 (0.0%) | 0 (0.0%) |
| Education Instruction & Library | 0 (0.0%) | 12 (100.0%) |
| Arts, Media & Entertainment | 0 (0.0%) | 0 (0.0%) |
| Health Diagnosing & Treating | 0 (0.0%) | 0 (0.0%) |
| Health Technologists | 0 (0.0%) | 0 (0.0%) |
| Total (Category) | 0 (0.0%) | 31 (100.0%) |
| Total (Overall) | 93 (53.1%) | 82 (46.9%) |
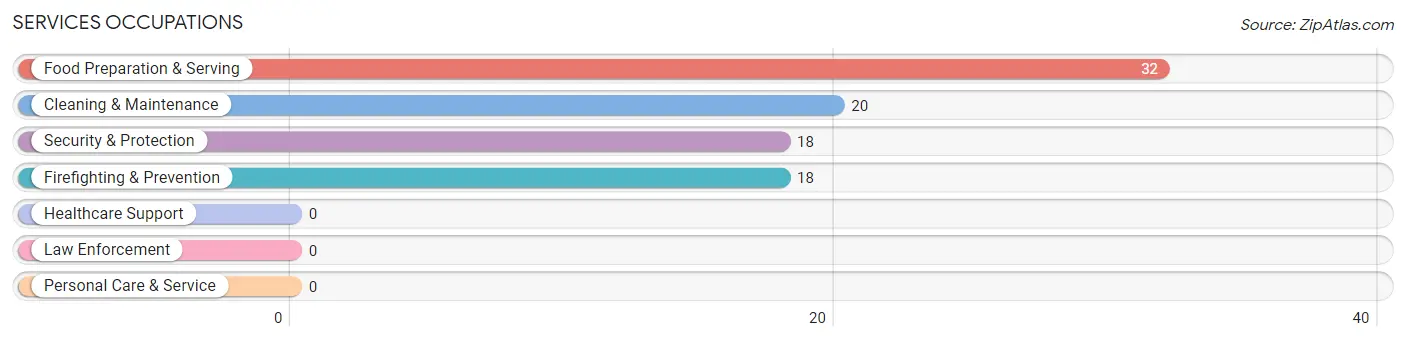
Services Occupations
The most common Services occupations in San Pedro are Food Preparation & Serving (32 | 18.3%), Cleaning & Maintenance (20 | 11.4%), Security & Protection (18 | 10.3%), and Firefighting & Prevention (18 | 10.3%).
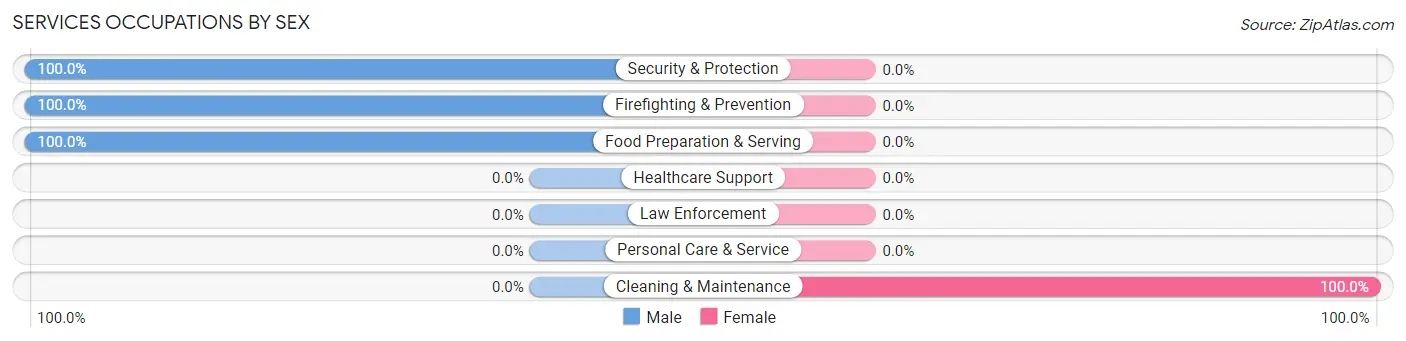
Services Occupations by Sex
| Occupation | Male | Female |
| Healthcare Support | 0 (0.0%) | 0 (0.0%) |
| Security & Protection | 18 (100.0%) | 0 (0.0%) |
| Firefighting & Prevention | 18 (100.0%) | 0 (0.0%) |
| Law Enforcement | 0 (0.0%) | 0 (0.0%) |
| Food Preparation & Serving | 32 (100.0%) | 0 (0.0%) |
| Cleaning & Maintenance | 0 (0.0%) | 20 (100.0%) |
| Personal Care & Service | 0 (0.0%) | 0 (0.0%) |
| Total (Category) | 50 (71.4%) | 20 (28.6%) |
| Total (Overall) | 93 (53.1%) | 82 (46.9%) |
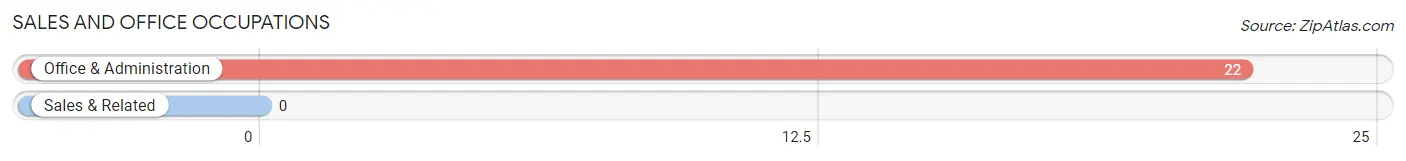
Sales and Office Occupations
The most common Sales and Office occupations in San Pedro are , and Office & Administration (22 | 12.6%).
Sales and Office Occupations by Sex
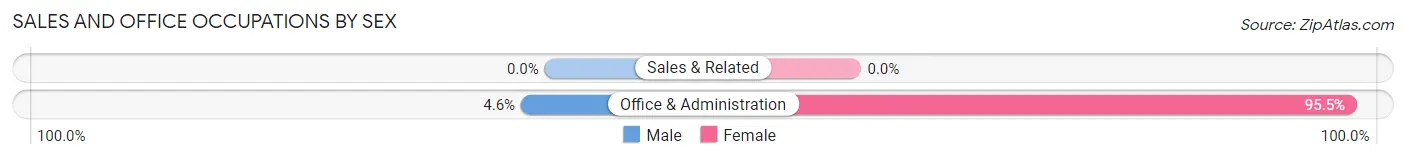
| Occupation | Male | Female |
| Sales & Related | 0 (0.0%) | 0 (0.0%) |
| Office & Administration | 1 (4.5%) | 21 (95.5%) |
| Total (Category) | 1 (4.5%) | 21 (95.5%) |
| Total (Overall) | 93 (53.1%) | 82 (46.9%) |
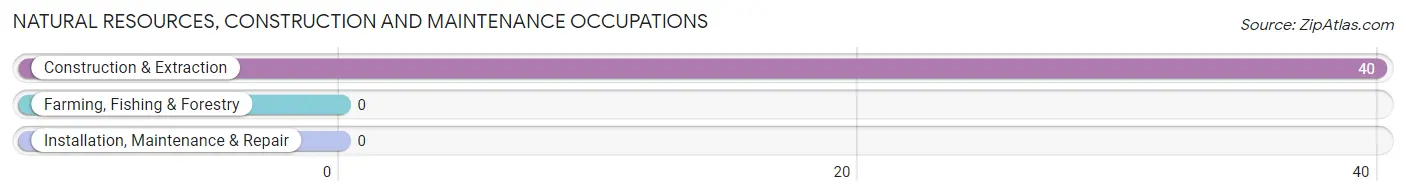
Natural Resources, Construction and Maintenance Occupations
The most common Natural Resources, Construction and Maintenance occupations in San Pedro are , and Construction & Extraction (40 | 22.9%).
Natural Resources, Construction and Maintenance Occupations by Sex
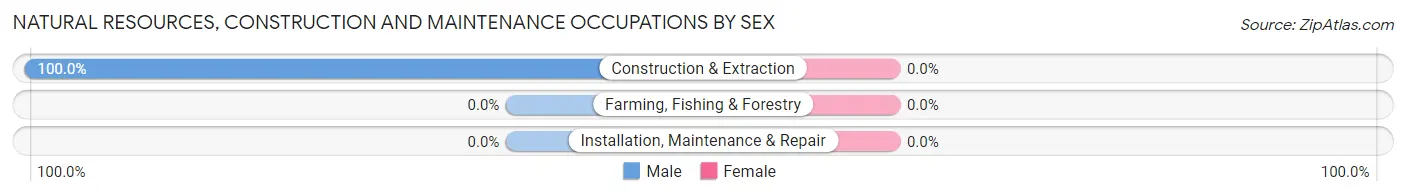
| Occupation | Male | Female |
| Farming, Fishing & Forestry | 0 (0.0%) | 0 (0.0%) |
| Construction & Extraction | 40 (100.0%) | 0 (0.0%) |
| Installation, Maintenance & Repair | 0 (0.0%) | 0 (0.0%) |
| Total (Category) | 40 (100.0%) | 0 (0.0%) |
| Total (Overall) | 93 (53.1%) | 82 (46.9%) |
Production, Transportation and Moving Occupations
The most common Production, Transportation and Moving occupations in San Pedro are Transportation (10 | 5.7%), and Production (2 | 1.1%).
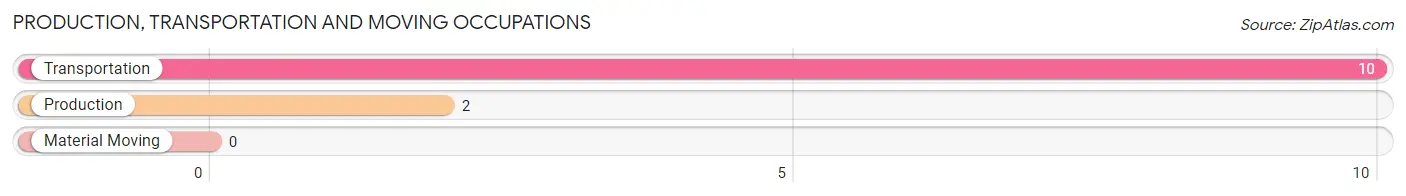
Production, Transportation and Moving Occupations by Sex
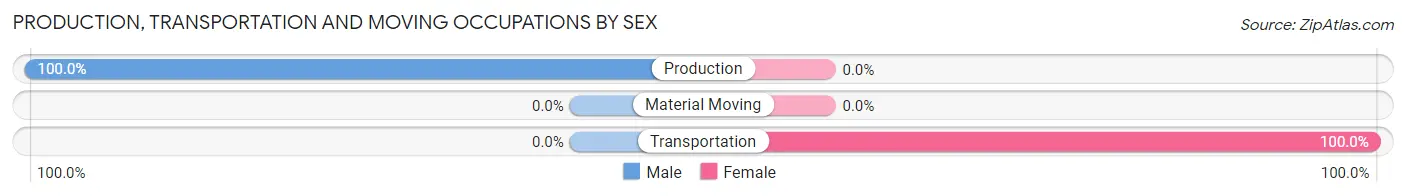
| Occupation | Male | Female |
| Production | 2 (100.0%) | 0 (0.0%) |
| Transportation | 0 (0.0%) | 10 (100.0%) |
| Material Moving | 0 (0.0%) | 0 (0.0%) |
| Total (Category) | 2 (16.7%) | 10 (83.3%) |
| Total (Overall) | 93 (53.1%) | 82 (46.9%) |
Employment Industries by Sex in San Pedro
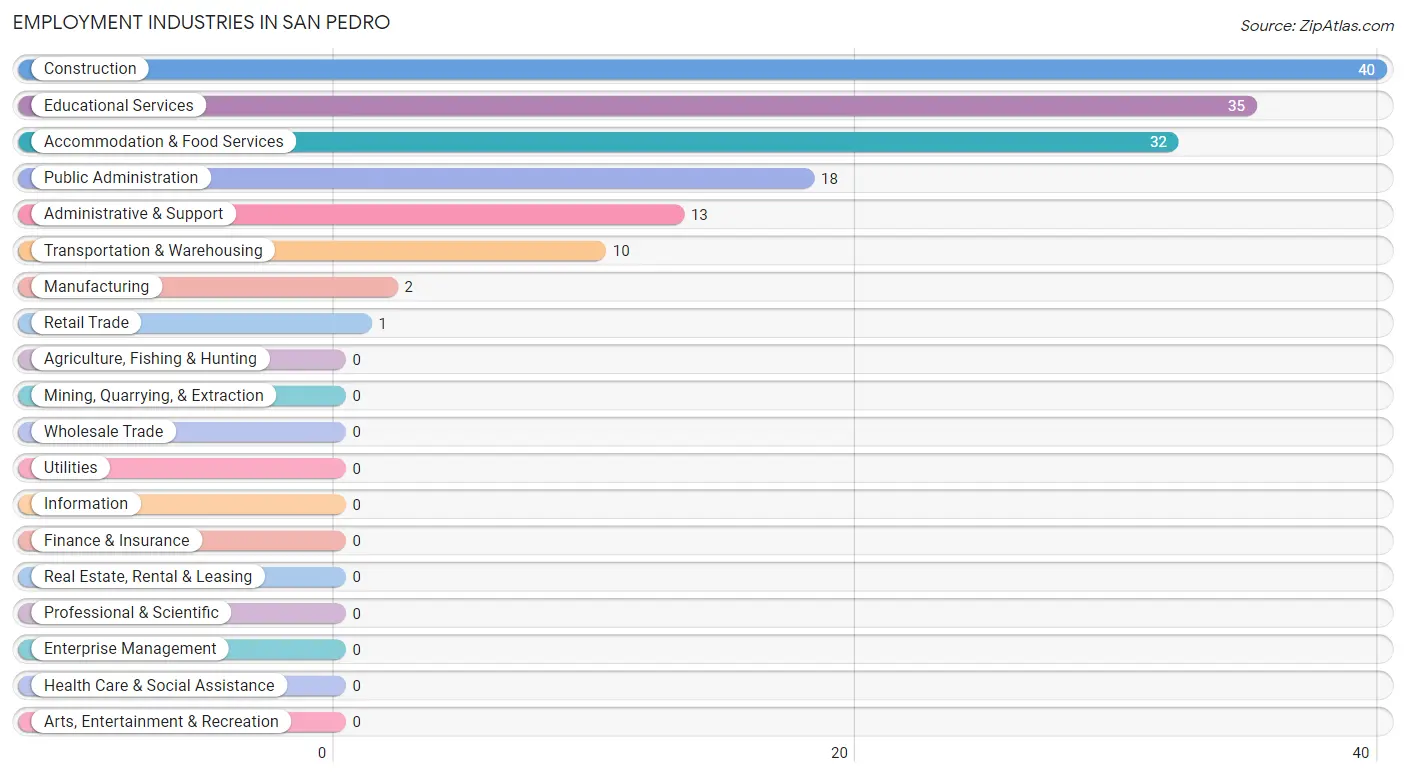
Employment Industries in San Pedro
The major employment industries in San Pedro include Construction (40 | 22.9%), Educational Services (35 | 20.0%), Accommodation & Food Services (32 | 18.3%), Public Administration (18 | 10.3%), and Administrative & Support (13 | 7.4%).
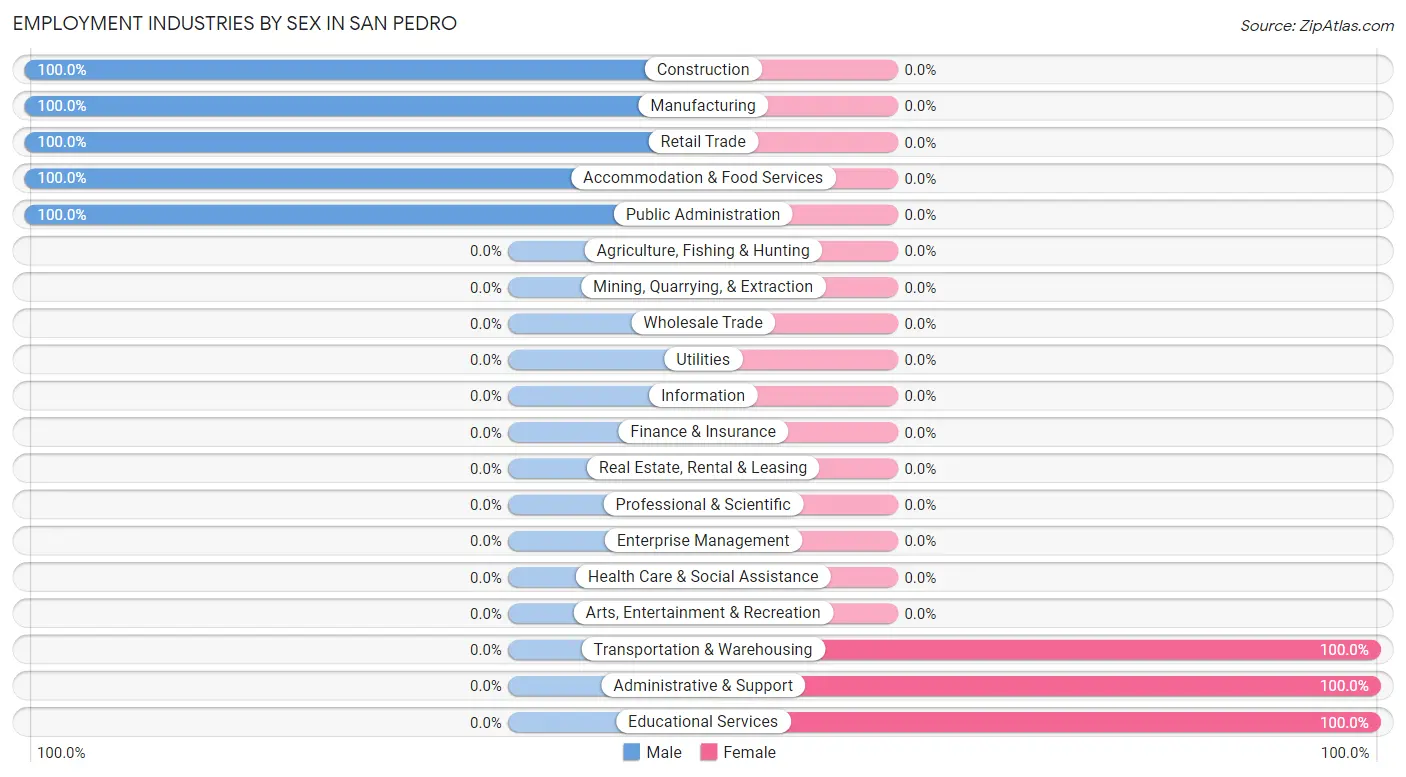
Employment Industries by Sex in San Pedro
The San Pedro industries that see more men than women are Construction (100.0%), Manufacturing (100.0%), and Retail Trade (100.0%), whereas the industries that tend to have a higher number of women are Transportation & Warehousing (100.0%), Administrative & Support (100.0%), and Educational Services (100.0%).
| Industry | Male | Female |
| Agriculture, Fishing & Hunting | 0 (0.0%) | 0 (0.0%) |
| Mining, Quarrying, & Extraction | 0 (0.0%) | 0 (0.0%) |
| Construction | 40 (100.0%) | 0 (0.0%) |
| Manufacturing | 2 (100.0%) | 0 (0.0%) |
| Wholesale Trade | 0 (0.0%) | 0 (0.0%) |
| Retail Trade | 1 (100.0%) | 0 (0.0%) |
| Transportation & Warehousing | 0 (0.0%) | 10 (100.0%) |
| Utilities | 0 (0.0%) | 0 (0.0%) |
| Information | 0 (0.0%) | 0 (0.0%) |
| Finance & Insurance | 0 (0.0%) | 0 (0.0%) |
| Real Estate, Rental & Leasing | 0 (0.0%) | 0 (0.0%) |
| Professional & Scientific | 0 (0.0%) | 0 (0.0%) |
| Enterprise Management | 0 (0.0%) | 0 (0.0%) |
| Administrative & Support | 0 (0.0%) | 13 (100.0%) |
| Educational Services | 0 (0.0%) | 35 (100.0%) |
| Health Care & Social Assistance | 0 (0.0%) | 0 (0.0%) |
| Arts, Entertainment & Recreation | 0 (0.0%) | 0 (0.0%) |
| Accommodation & Food Services | 32 (100.0%) | 0 (0.0%) |
| Public Administration | 18 (100.0%) | 0 (0.0%) |
| Total | 93 (53.1%) | 82 (46.9%) |
Education in San Pedro
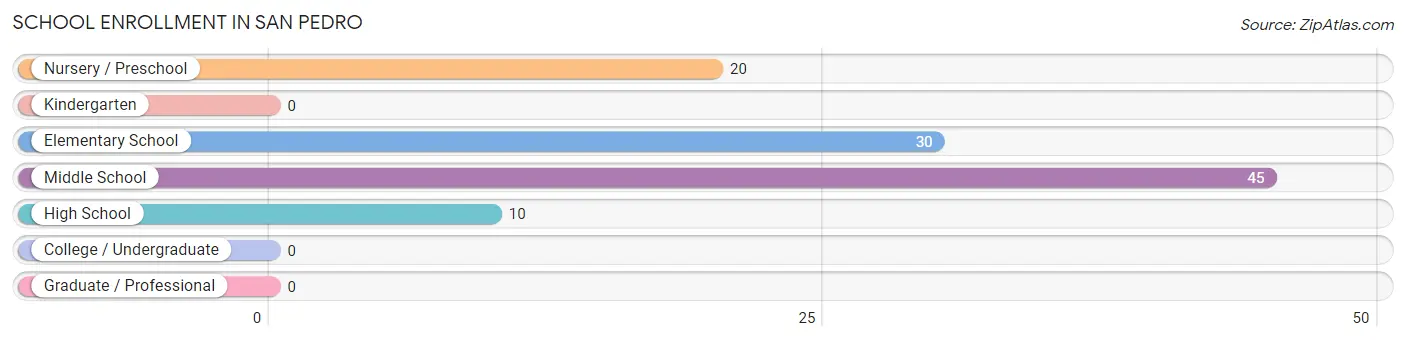
School Enrollment in San Pedro
The most common levels of schooling among the 105 students in San Pedro are middle school (45 | 42.9%), elementary school (30 | 28.6%), and nursery / preschool (20 | 19.1%).
| School Level | # Students | % Students |
| Nursery / Preschool | 20 | 19.1% |
| Kindergarten | 0 | 0.0% |
| Elementary School | 30 | 28.6% |
| Middle School | 45 | 42.9% |
| High School | 10 | 9.5% |
| College / Undergraduate | 0 | 0.0% |
| Graduate / Professional | 0 | 0.0% |
| Total | 105 | 100.0% |
School Enrollment by Age by Funding Source in San Pedro
Out of a total of 105 students who are enrolled in schools in San Pedro, 19 (18.1%) attend a private institution, while the remaining 86 (81.9%) are enrolled in public schools. The age group of 5 to 9 year old has the highest likelihood of being enrolled in private schools, with 12 (40.0% in the age bracket) enrolled. Conversely, the age group of 3 to 4 year olds has the lowest likelihood of being enrolled in a private school, with 20 (100.0% in the age bracket) attending a public institution.
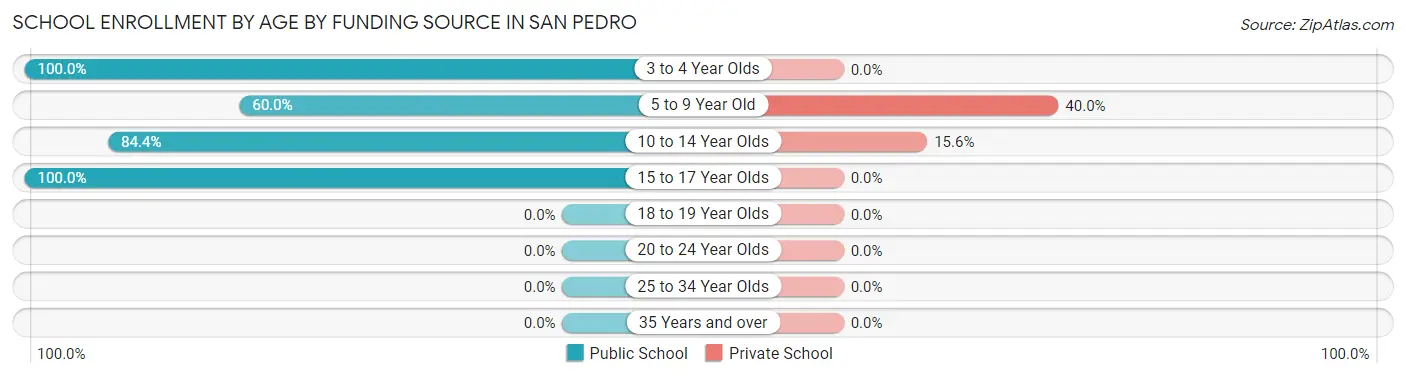
| Age Bracket | Public School | Private School |
| 3 to 4 Year Olds | 20 (100.0%) | 0 (0.0%) |
| 5 to 9 Year Old | 18 (60.0%) | 12 (40.0%) |
| 10 to 14 Year Olds | 38 (84.4%) | 7 (15.6%) |
| 15 to 17 Year Olds | 10 (100.0%) | 0 (0.0%) |
| 18 to 19 Year Olds | 0 (0.0%) | 0 (0.0%) |
| 20 to 24 Year Olds | 0 (0.0%) | 0 (0.0%) |
| 25 to 34 Year Olds | 0 (0.0%) | 0 (0.0%) |
| 35 Years and over | 0 (0.0%) | 0 (0.0%) |
| Total | 86 (81.9%) | 19 (18.1%) |
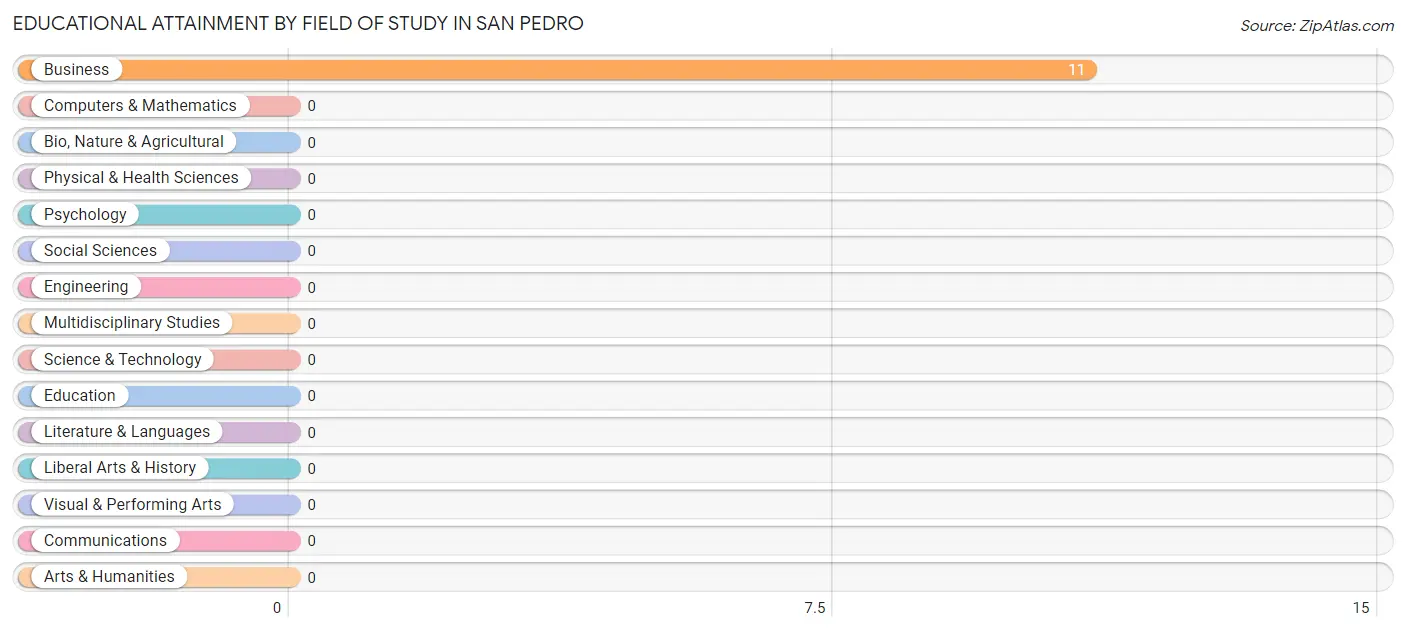
Educational Attainment by Field of Study in San Pedro
, and business (11 | 100.0%) are the most common fields of study among 11 individuals in San Pedro who have obtained a bachelor's degree or higher.
| Field of Study | # Graduates | % Graduates |
| Computers & Mathematics | 0 | 0.0% |
| Bio, Nature & Agricultural | 0 | 0.0% |
| Physical & Health Sciences | 0 | 0.0% |
| Psychology | 0 | 0.0% |
| Social Sciences | 0 | 0.0% |
| Engineering | 0 | 0.0% |
| Multidisciplinary Studies | 0 | 0.0% |
| Science & Technology | 0 | 0.0% |
| Business | 11 | 100.0% |
| Education | 0 | 0.0% |
| Literature & Languages | 0 | 0.0% |
| Liberal Arts & History | 0 | 0.0% |
| Visual & Performing Arts | 0 | 0.0% |
| Communications | 0 | 0.0% |
| Arts & Humanities | 0 | 0.0% |
| Total | 11 | 100.0% |
Transportation & Commute in San Pedro
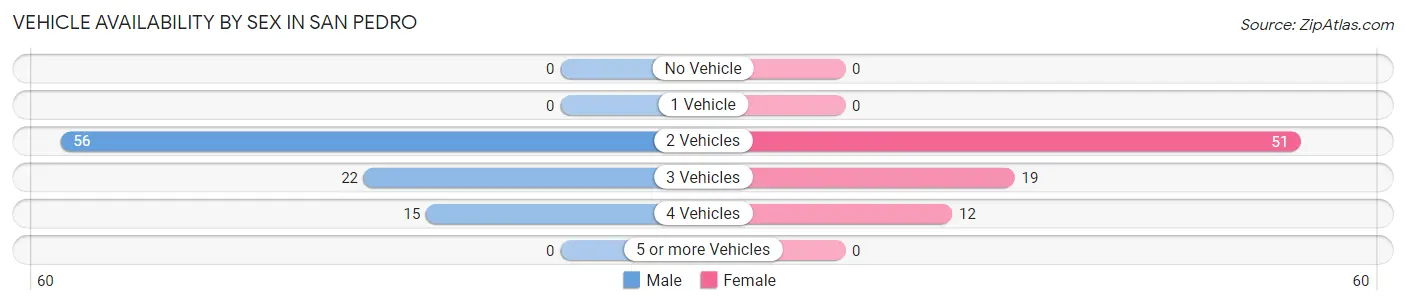
Vehicle Availability by Sex in San Pedro
The most prevalent vehicle ownership categories in San Pedro are males with 2 vehicles (56, accounting for 60.2%) and females with 2 vehicles (51, making up 68.3%).
| Vehicles Available | Male | Female |
| No Vehicle | 0 (0.0%) | 0 (0.0%) |
| 1 Vehicle | 0 (0.0%) | 0 (0.0%) |
| 2 Vehicles | 56 (60.2%) | 51 (62.2%) |
| 3 Vehicles | 22 (23.7%) | 19 (23.2%) |
| 4 Vehicles | 15 (16.1%) | 12 (14.6%) |
| 5 or more Vehicles | 0 (0.0%) | 0 (0.0%) |
| Total | 93 (100.0%) | 82 (100.0%) |
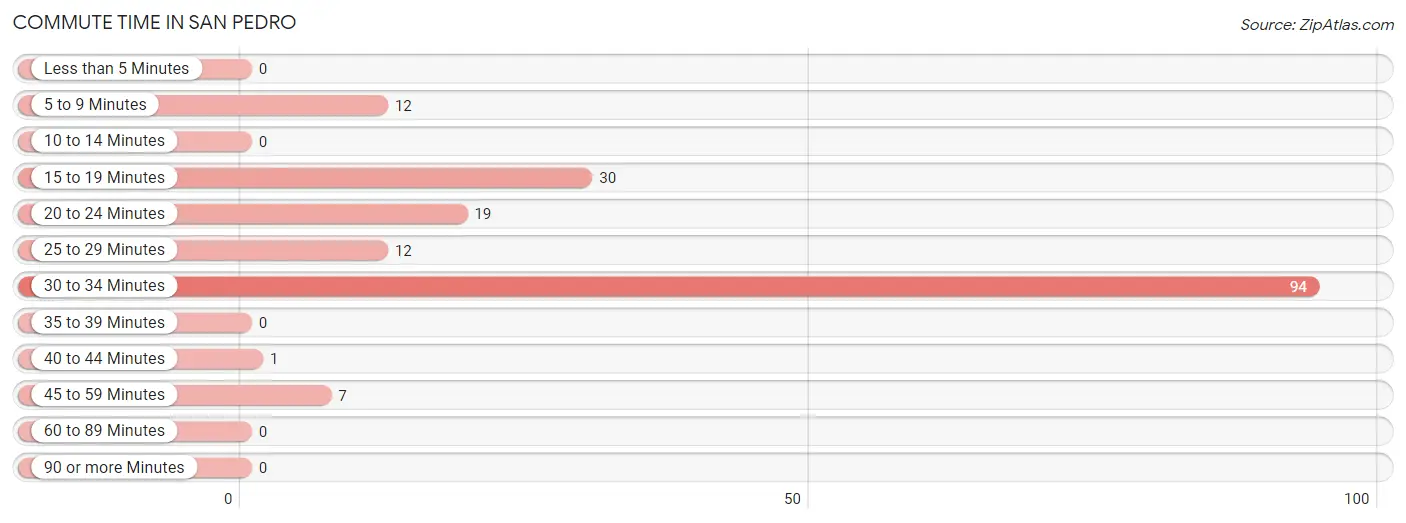
Commute Time in San Pedro
The most frequently occuring commute durations in San Pedro are 30 to 34 minutes (94 commuters, 53.7%), 15 to 19 minutes (30 commuters, 17.1%), and 20 to 24 minutes (19 commuters, 10.9%).
| Commute Time | # Commuters | % Commuters |
| Less than 5 Minutes | 0 | 0.0% |
| 5 to 9 Minutes | 12 | 6.9% |
| 10 to 14 Minutes | 0 | 0.0% |
| 15 to 19 Minutes | 30 | 17.1% |
| 20 to 24 Minutes | 19 | 10.9% |
| 25 to 29 Minutes | 12 | 6.9% |
| 30 to 34 Minutes | 94 | 53.7% |
| 35 to 39 Minutes | 0 | 0.0% |
| 40 to 44 Minutes | 1 | 0.6% |
| 45 to 59 Minutes | 7 | 4.0% |
| 60 to 89 Minutes | 0 | 0.0% |
| 90 or more Minutes | 0 | 0.0% |
Commute Time by Sex in San Pedro
The most common commute times in San Pedro are 30 to 34 minutes (58 commuters, 62.4%) for males and 30 to 34 minutes (36 commuters, 43.9%) for females.
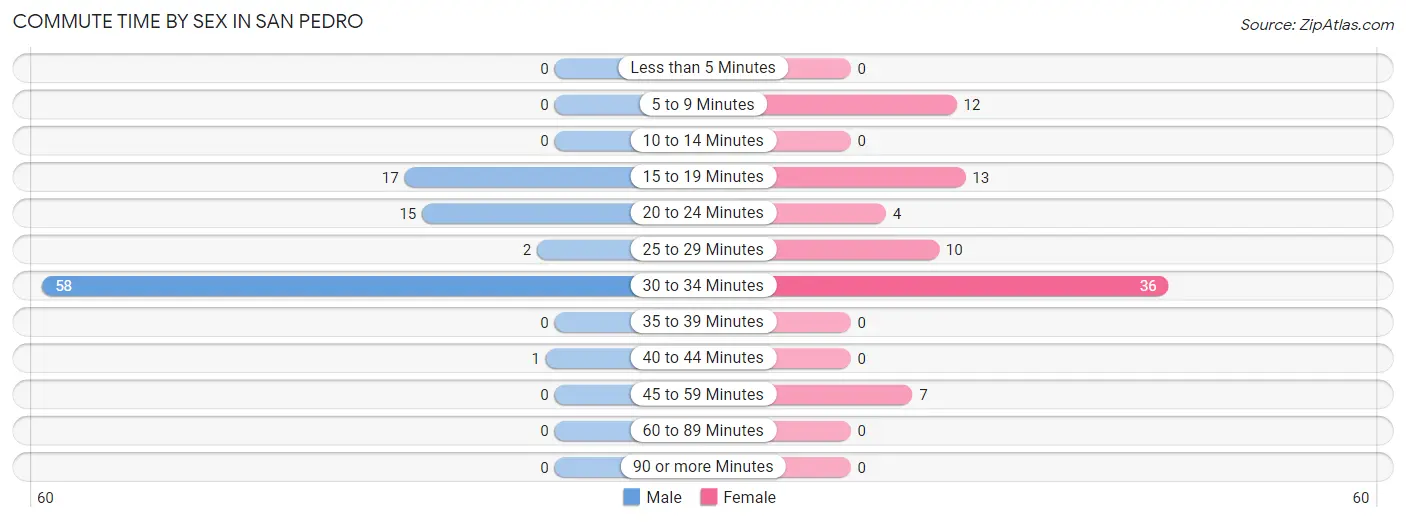
| Commute Time | Male | Female |
| Less than 5 Minutes | 0 (0.0%) | 0 (0.0%) |
| 5 to 9 Minutes | 0 (0.0%) | 12 (14.6%) |
| 10 to 14 Minutes | 0 (0.0%) | 0 (0.0%) |
| 15 to 19 Minutes | 17 (18.3%) | 13 (15.9%) |
| 20 to 24 Minutes | 15 (16.1%) | 4 (4.9%) |
| 25 to 29 Minutes | 2 (2.1%) | 10 (12.2%) |
| 30 to 34 Minutes | 58 (62.4%) | 36 (43.9%) |
| 35 to 39 Minutes | 0 (0.0%) | 0 (0.0%) |
| 40 to 44 Minutes | 1 (1.1%) | 0 (0.0%) |
| 45 to 59 Minutes | 0 (0.0%) | 7 (8.5%) |
| 60 to 89 Minutes | 0 (0.0%) | 0 (0.0%) |
| 90 or more Minutes | 0 (0.0%) | 0 (0.0%) |
Time of Departure to Work by Sex in San Pedro
The most frequent times of departure to work in San Pedro are 8:00 AM to 8:29 AM (38, 40.9%) for males and 6:00 AM to 6:29 AM (32, 39.0%) for females.
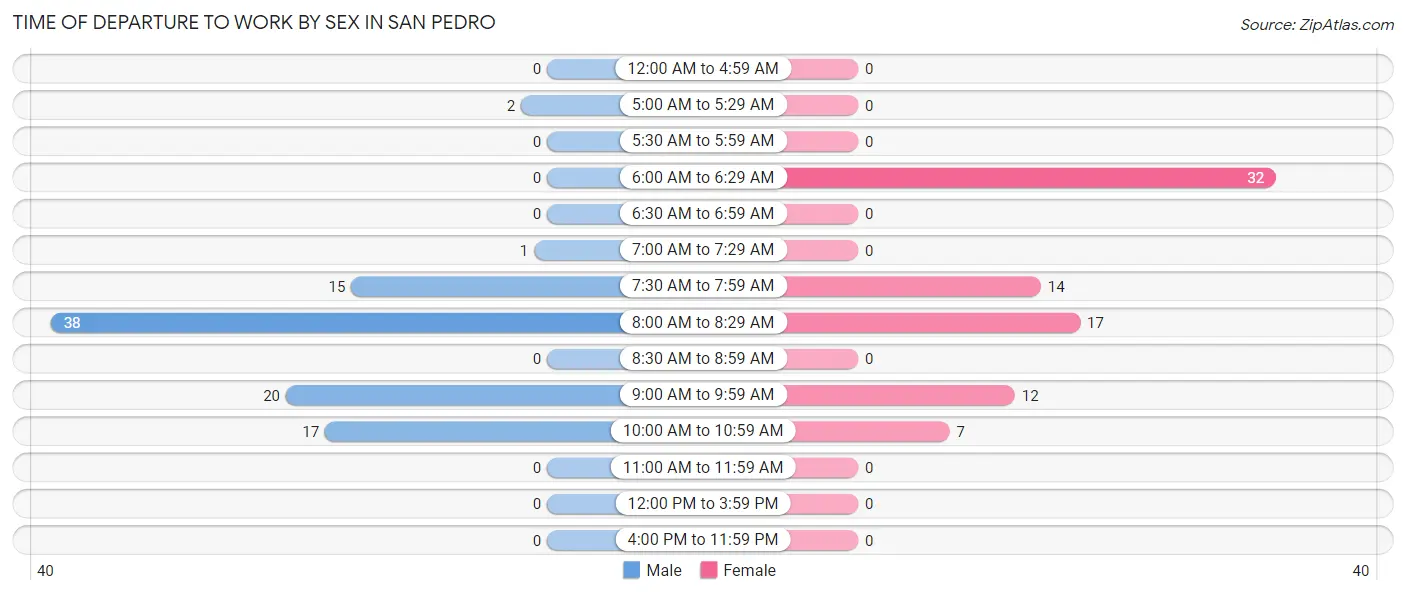
| Time of Departure | Male | Female |
| 12:00 AM to 4:59 AM | 0 (0.0%) | 0 (0.0%) |
| 5:00 AM to 5:29 AM | 2 (2.1%) | 0 (0.0%) |
| 5:30 AM to 5:59 AM | 0 (0.0%) | 0 (0.0%) |
| 6:00 AM to 6:29 AM | 0 (0.0%) | 32 (39.0%) |
| 6:30 AM to 6:59 AM | 0 (0.0%) | 0 (0.0%) |
| 7:00 AM to 7:29 AM | 1 (1.1%) | 0 (0.0%) |
| 7:30 AM to 7:59 AM | 15 (16.1%) | 14 (17.1%) |
| 8:00 AM to 8:29 AM | 38 (40.9%) | 17 (20.7%) |
| 8:30 AM to 8:59 AM | 0 (0.0%) | 0 (0.0%) |
| 9:00 AM to 9:59 AM | 20 (21.5%) | 12 (14.6%) |
| 10:00 AM to 10:59 AM | 17 (18.3%) | 7 (8.5%) |
| 11:00 AM to 11:59 AM | 0 (0.0%) | 0 (0.0%) |
| 12:00 PM to 3:59 PM | 0 (0.0%) | 0 (0.0%) |
| 4:00 PM to 11:59 PM | 0 (0.0%) | 0 (0.0%) |
| Total | 93 (100.0%) | 82 (100.0%) |
Housing Occupancy in San Pedro
Occupancy by Ownership in San Pedro
Of the total 109 dwellings in San Pedro, owner-occupied units account for 102 (93.6%), while renter-occupied units make up 7 (6.4%).
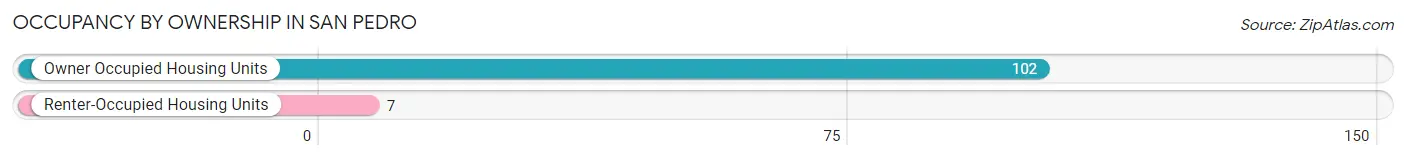
| Occupancy | # Housing Units | % Housing Units |
| Owner Occupied Housing Units | 102 | 93.6% |
| Renter-Occupied Housing Units | 7 | 6.4% |
| Total Occupied Housing Units | 109 | 100.0% |
Occupancy by Household Size in San Pedro
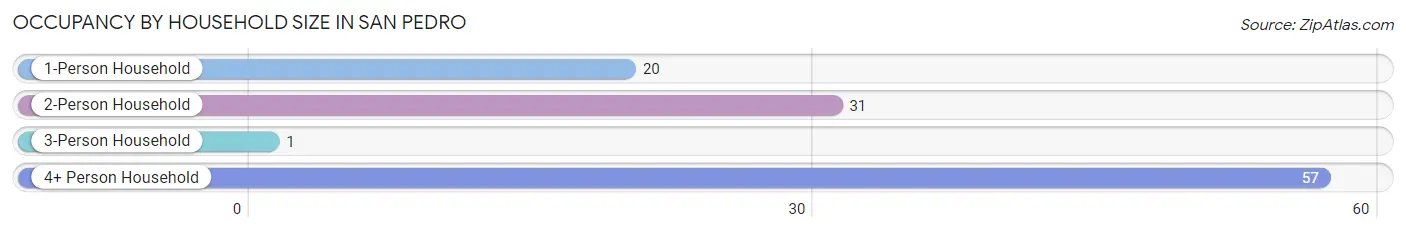
| Household Size | # Housing Units | % Housing Units |
| 1-Person Household | 20 | 18.3% |
| 2-Person Household | 31 | 28.4% |
| 3-Person Household | 1 | 0.9% |
| 4+ Person Household | 57 | 52.3% |
| Total Housing Units | 109 | 100.0% |
Occupancy by Ownership by Household Size in San Pedro
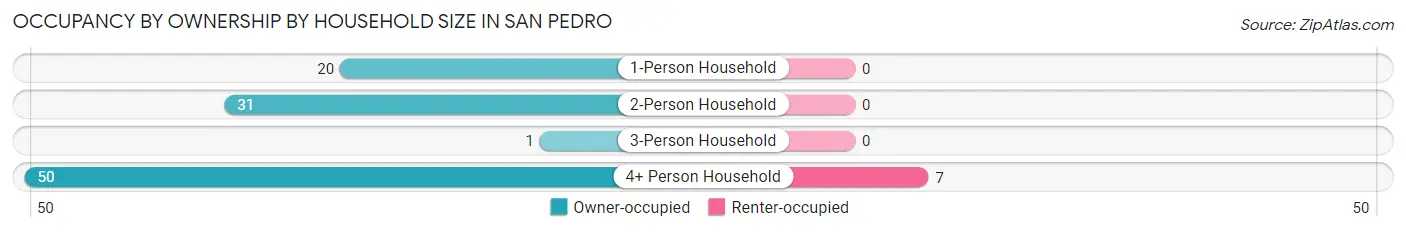
| Household Size | Owner-occupied | Renter-occupied |
| 1-Person Household | 20 (100.0%) | 0 (0.0%) |
| 2-Person Household | 31 (100.0%) | 0 (0.0%) |
| 3-Person Household | 1 (100.0%) | 0 (0.0%) |
| 4+ Person Household | 50 (87.7%) | 7 (12.3%) |
| Total Housing Units | 102 (93.6%) | 7 (6.4%) |
Occupancy by Educational Attainment in San Pedro
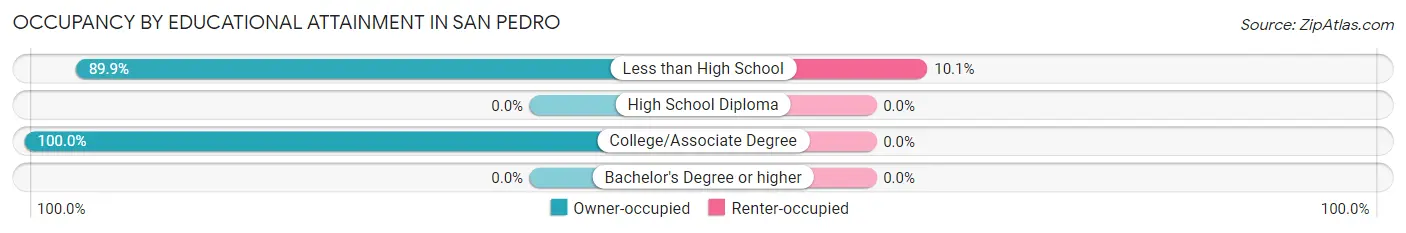
| Household Size | Owner-occupied | Renter-occupied |
| Less than High School | 62 (89.9%) | 7 (10.1%) |
| High School Diploma | 0 (0.0%) | 0 (0.0%) |
| College/Associate Degree | 40 (100.0%) | 0 (0.0%) |
| Bachelor's Degree or higher | 0 (0.0%) | 0 (0.0%) |
Occupancy by Age of Householder in San Pedro
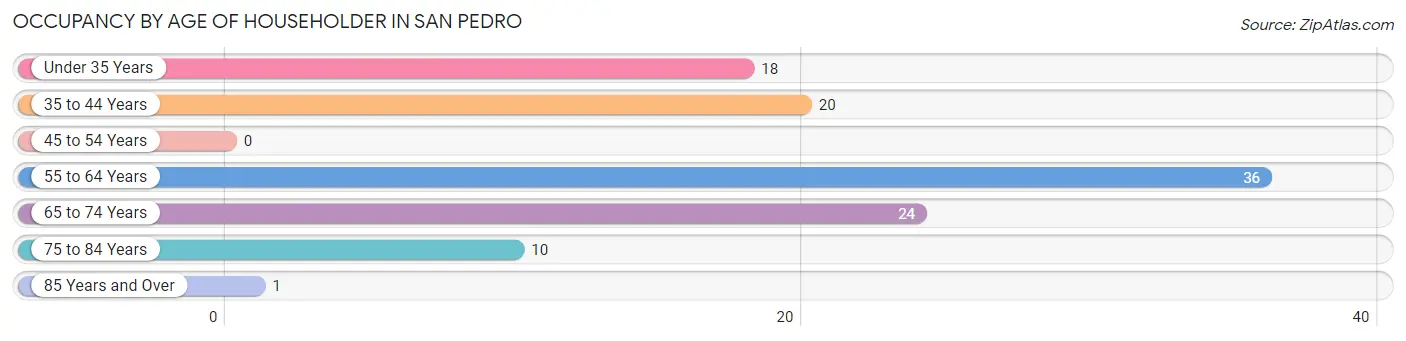
| Age Bracket | # Households | % Households |
| Under 35 Years | 18 | 16.5% |
| 35 to 44 Years | 20 | 18.3% |
| 45 to 54 Years | 0 | 0.0% |
| 55 to 64 Years | 36 | 33.0% |
| 65 to 74 Years | 24 | 22.0% |
| 75 to 84 Years | 10 | 9.2% |
| 85 Years and Over | 1 | 0.9% |
| Total | 109 | 100.0% |
Housing Finances in San Pedro
Median Income by Occupancy in San Pedro
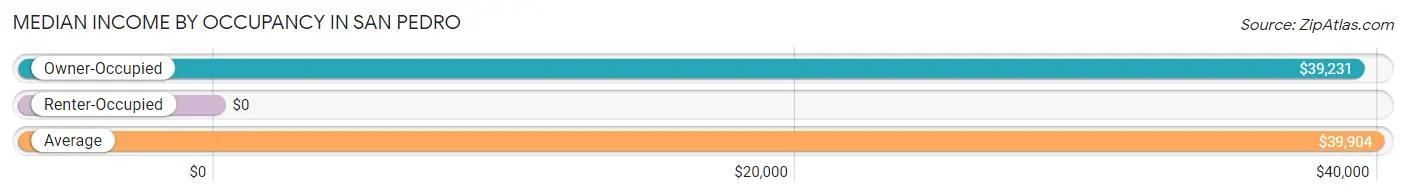
| Occupancy Type | # Households | Median Income |
| Owner-Occupied | 102 (93.6%) | $39,231 |
| Renter-Occupied | 7 (6.4%) | $0 |
| Average | 109 (100.0%) | $39,904 |
Occupancy by Householder Income Bracket in San Pedro
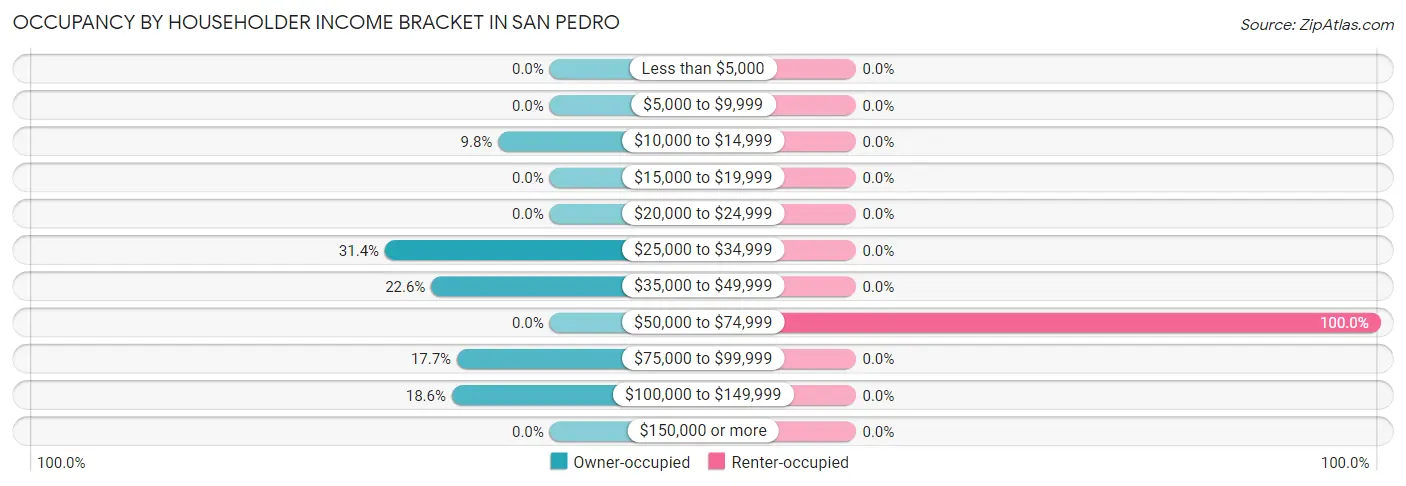
| Income Bracket | Owner-occupied | Renter-occupied |
| Less than $5,000 | 0 (0.0%) | 0 (0.0%) |
| $5,000 to $9,999 | 0 (0.0%) | 0 (0.0%) |
| $10,000 to $14,999 | 10 (9.8%) | 0 (0.0%) |
| $15,000 to $19,999 | 0 (0.0%) | 0 (0.0%) |
| $20,000 to $24,999 | 0 (0.0%) | 0 (0.0%) |
| $25,000 to $34,999 | 32 (31.4%) | 0 (0.0%) |
| $35,000 to $49,999 | 23 (22.6%) | 0 (0.0%) |
| $50,000 to $74,999 | 0 (0.0%) | 7 (100.0%) |
| $75,000 to $99,999 | 18 (17.6%) | 0 (0.0%) |
| $100,000 to $149,999 | 19 (18.6%) | 0 (0.0%) |
| $150,000 or more | 0 (0.0%) | 0 (0.0%) |
| Total | 102 (100.0%) | 7 (100.0%) |
Monthly Housing Cost Tiers in San Pedro
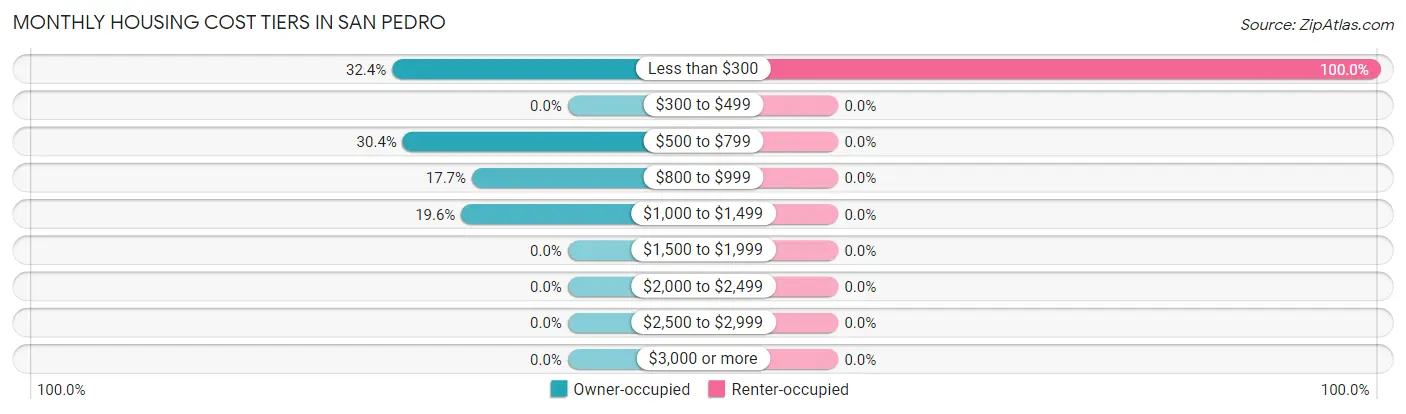
| Monthly Cost | Owner-occupied | Renter-occupied |
| Less than $300 | 33 (32.4%) | 7 (100.0%) |
| $300 to $499 | 0 (0.0%) | 0 (0.0%) |
| $500 to $799 | 31 (30.4%) | 0 (0.0%) |
| $800 to $999 | 18 (17.6%) | 0 (0.0%) |
| $1,000 to $1,499 | 20 (19.6%) | 0 (0.0%) |
| $1,500 to $1,999 | 0 (0.0%) | 0 (0.0%) |
| $2,000 to $2,499 | 0 (0.0%) | 0 (0.0%) |
| $2,500 to $2,999 | 0 (0.0%) | 0 (0.0%) |
| $3,000 or more | 0 (0.0%) | 0 (0.0%) |
| Total | 102 (100.0%) | 7 (100.0%) |
Physical Housing Characteristics in San Pedro
Housing Structures in San Pedro
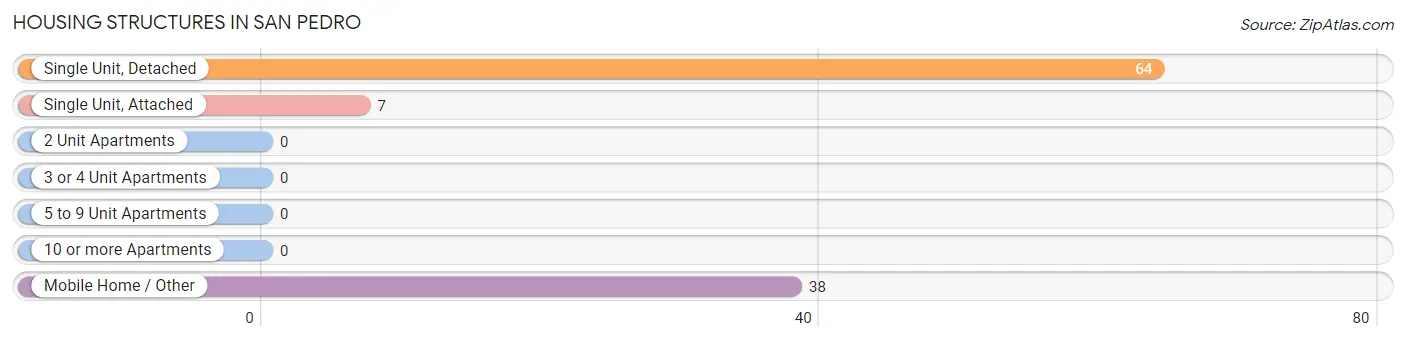
| Structure Type | # Housing Units | % Housing Units |
| Single Unit, Detached | 64 | 58.7% |
| Single Unit, Attached | 7 | 6.4% |
| 2 Unit Apartments | 0 | 0.0% |
| 3 or 4 Unit Apartments | 0 | 0.0% |
| 5 to 9 Unit Apartments | 0 | 0.0% |
| 10 or more Apartments | 0 | 0.0% |
| Mobile Home / Other | 38 | 34.9% |
| Total | 109 | 100.0% |
Housing Structures by Occupancy in San Pedro
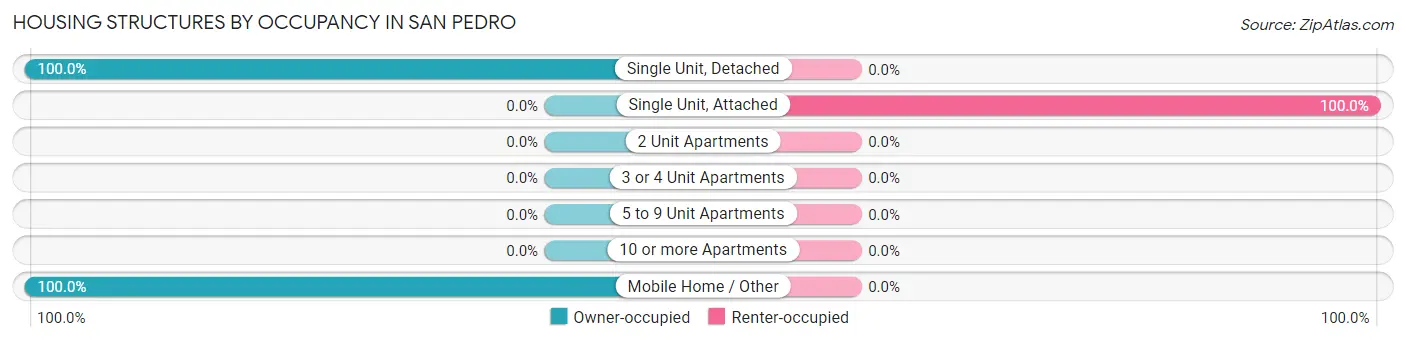
| Structure Type | Owner-occupied | Renter-occupied |
| Single Unit, Detached | 64 (100.0%) | 0 (0.0%) |
| Single Unit, Attached | 0 (0.0%) | 7 (100.0%) |
| 2 Unit Apartments | 0 (0.0%) | 0 (0.0%) |
| 3 or 4 Unit Apartments | 0 (0.0%) | 0 (0.0%) |
| 5 to 9 Unit Apartments | 0 (0.0%) | 0 (0.0%) |
| 10 or more Apartments | 0 (0.0%) | 0 (0.0%) |
| Mobile Home / Other | 38 (100.0%) | 0 (0.0%) |
| Total | 102 (93.6%) | 7 (6.4%) |
Housing Structures by Number of Rooms in San Pedro
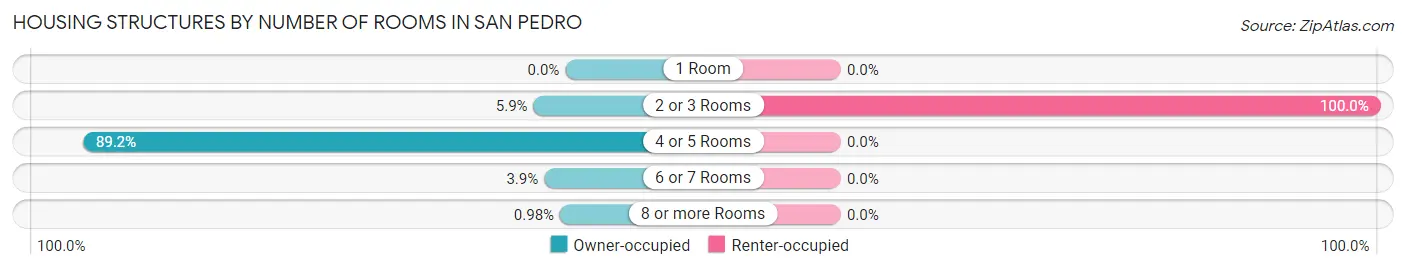
| Number of Rooms | Owner-occupied | Renter-occupied |
| 1 Room | 0 (0.0%) | 0 (0.0%) |
| 2 or 3 Rooms | 6 (5.9%) | 7 (100.0%) |
| 4 or 5 Rooms | 91 (89.2%) | 0 (0.0%) |
| 6 or 7 Rooms | 4 (3.9%) | 0 (0.0%) |
| 8 or more Rooms | 1 (1.0%) | 0 (0.0%) |
| Total | 102 (100.0%) | 7 (100.0%) |
Housing Structure by Heating Type in San Pedro
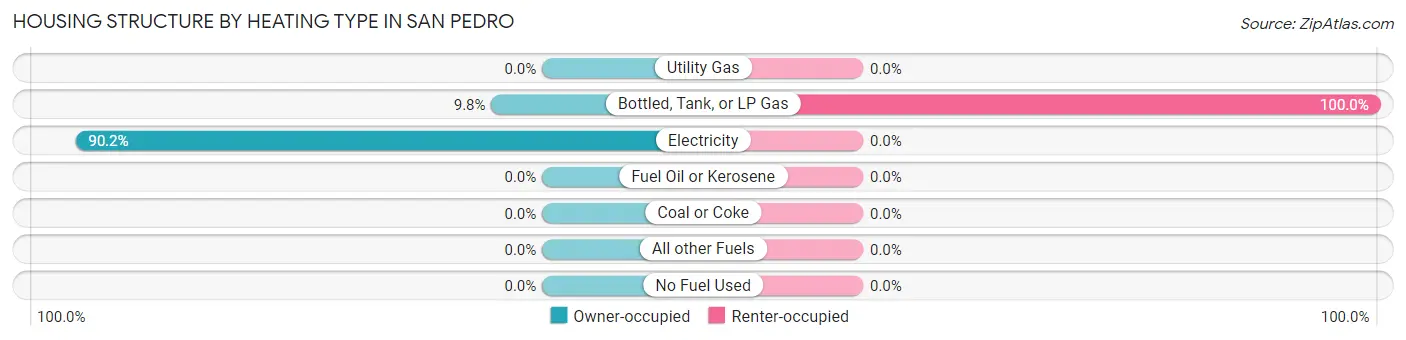
| Heating Type | Owner-occupied | Renter-occupied |
| Utility Gas | 0 (0.0%) | 0 (0.0%) |
| Bottled, Tank, or LP Gas | 10 (9.8%) | 7 (100.0%) |
| Electricity | 92 (90.2%) | 0 (0.0%) |
| Fuel Oil or Kerosene | 0 (0.0%) | 0 (0.0%) |
| Coal or Coke | 0 (0.0%) | 0 (0.0%) |
| All other Fuels | 0 (0.0%) | 0 (0.0%) |
| No Fuel Used | 0 (0.0%) | 0 (0.0%) |
| Total | 102 (100.0%) | 7 (100.0%) |
Household Vehicle Usage in San Pedro
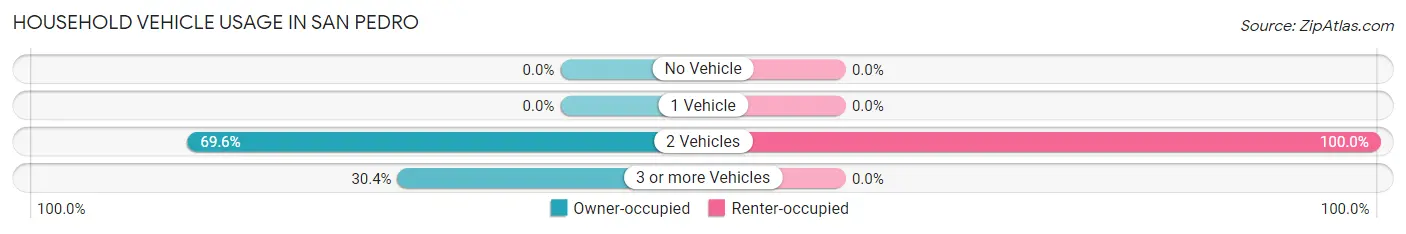
| Vehicles per Household | Owner-occupied | Renter-occupied |
| No Vehicle | 0 (0.0%) | 0 (0.0%) |
| 1 Vehicle | 0 (0.0%) | 0 (0.0%) |
| 2 Vehicles | 71 (69.6%) | 7 (100.0%) |
| 3 or more Vehicles | 31 (30.4%) | 0 (0.0%) |
| Total | 102 (100.0%) | 7 (100.0%) |
Real Estate & Mortgages in San Pedro
Real Estate and Mortgage Overview in San Pedro
| Characteristic | Without Mortgage | With Mortgage |
| Housing Units | 63 | 39 |
| Median Property Value | $22,200 | $49,800 |
| Median Household Income | $39,327 | $0 |
| Monthly Housing Costs | - | - |
| Real Estate Taxes | - | - |
Property Value by Mortgage Status in San Pedro
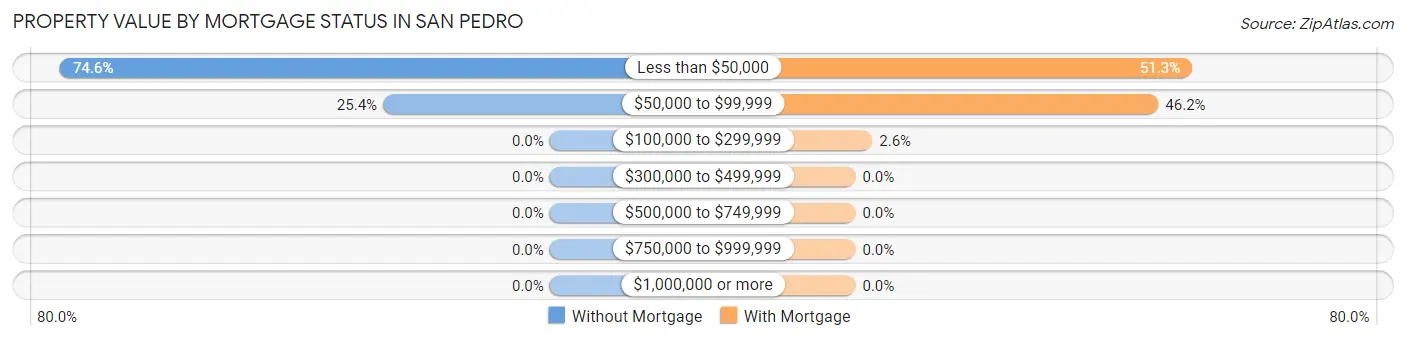
| Property Value | Without Mortgage | With Mortgage |
| Less than $50,000 | 47 (74.6%) | 20 (51.3%) |
| $50,000 to $99,999 | 16 (25.4%) | 18 (46.2%) |
| $100,000 to $299,999 | 0 (0.0%) | 1 (2.6%) |
| $300,000 to $499,999 | 0 (0.0%) | 0 (0.0%) |
| $500,000 to $749,999 | 0 (0.0%) | 0 (0.0%) |
| $750,000 to $999,999 | 0 (0.0%) | 0 (0.0%) |
| $1,000,000 or more | 0 (0.0%) | 0 (0.0%) |
| Total | 63 (100.0%) | 39 (100.0%) |
Household Income by Mortgage Status in San Pedro
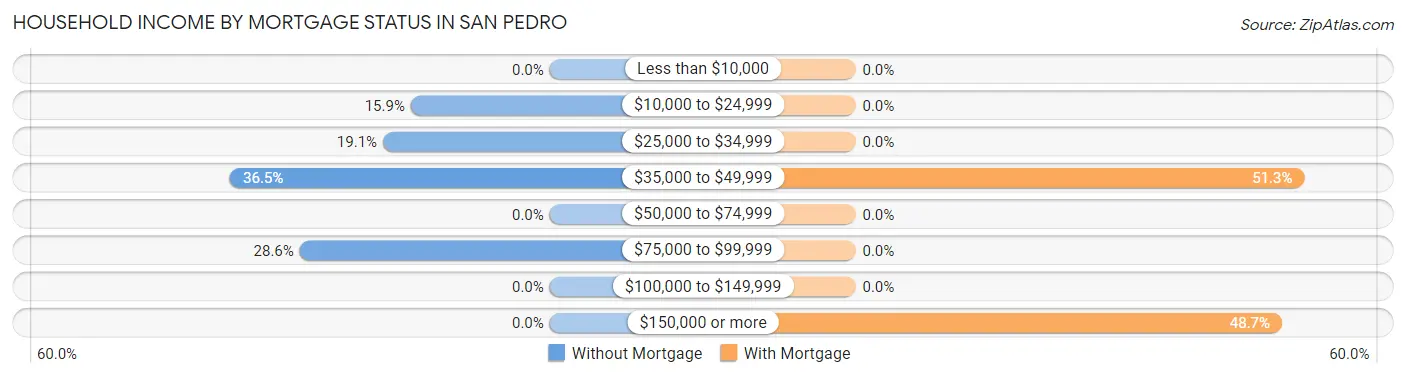
| Household Income | Without Mortgage | With Mortgage |
| Less than $10,000 | 0 (0.0%) | 0 (0.0%) |
| $10,000 to $24,999 | 10 (15.9%) | 0 (0.0%) |
| $25,000 to $34,999 | 12 (19.1%) | 0 (0.0%) |
| $35,000 to $49,999 | 23 (36.5%) | 20 (51.3%) |
| $50,000 to $74,999 | 0 (0.0%) | 0 (0.0%) |
| $75,000 to $99,999 | 18 (28.6%) | 0 (0.0%) |
| $100,000 to $149,999 | 0 (0.0%) | 0 (0.0%) |
| $150,000 or more | 0 (0.0%) | 19 (48.7%) |
| Total | 63 (100.0%) | 39 (100.0%) |
Property Value to Household Income Ratio in San Pedro
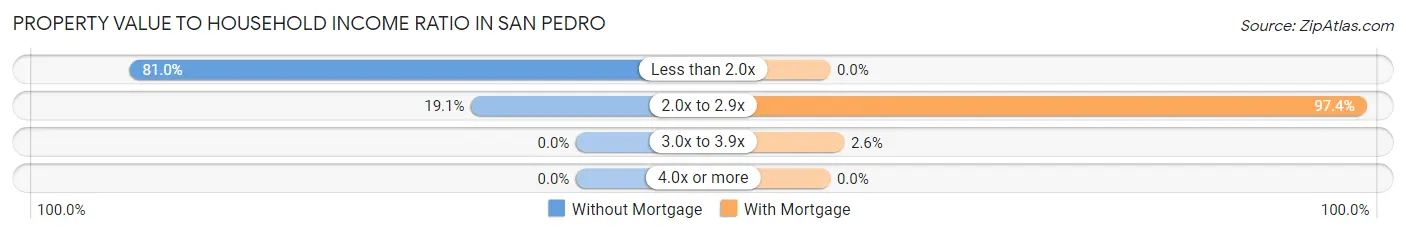
| Value-to-Income Ratio | Without Mortgage | With Mortgage |
| Less than 2.0x | 51 (80.9%) | 0 (0.0%) |
| 2.0x to 2.9x | 12 (19.1%) | 38 (97.4%) |
| 3.0x to 3.9x | 0 (0.0%) | 1 (2.6%) |
| 4.0x or more | 0 (0.0%) | 0 (0.0%) |
| Total | 63 (100.0%) | 39 (100.0%) |
Real Estate Taxes by Mortgage Status in San Pedro
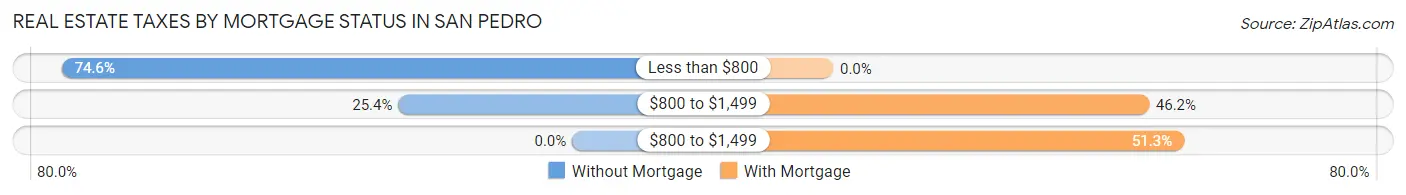
| Property Taxes | Without Mortgage | With Mortgage |
| Less than $800 | 47 (74.6%) | 0 (0.0%) |
| $800 to $1,499 | 16 (25.4%) | 18 (46.2%) |
| $800 to $1,499 | 0 (0.0%) | 20 (51.3%) |
| Total | 63 (100.0%) | 39 (100.0%) |
Health & Disability in San Pedro
Health Insurance Coverage by Age in San Pedro
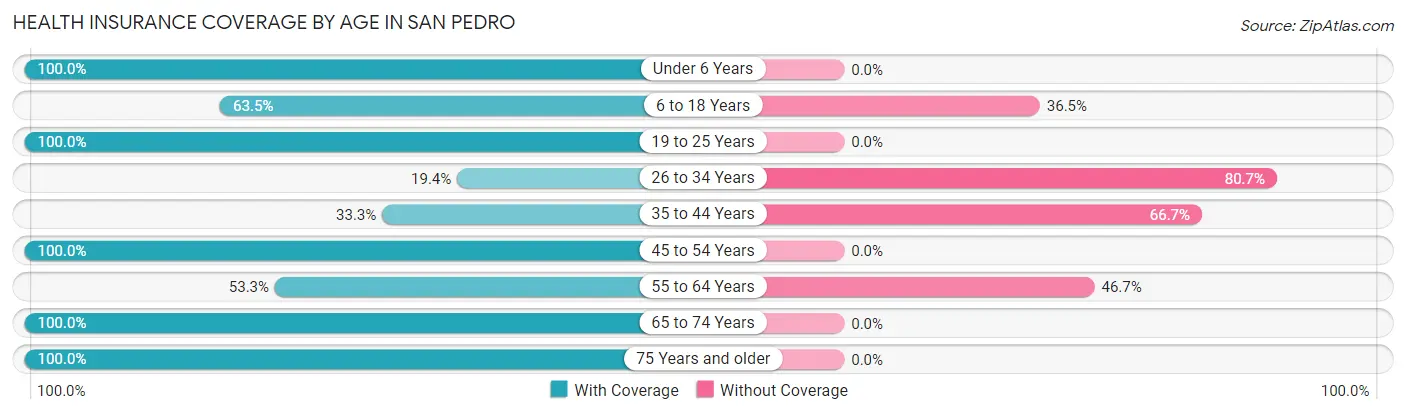
| Age Bracket | With Coverage | Without Coverage |
| Under 6 Years | 34 (100.0%) | 0 (0.0%) |
| 6 to 18 Years | 54 (63.5%) | 31 (36.5%) |
| 19 to 25 Years | 35 (100.0%) | 0 (0.0%) |
| 26 to 34 Years | 12 (19.4%) | 50 (80.6%) |
| 35 to 44 Years | 10 (33.3%) | 20 (66.7%) |
| 45 to 54 Years | 19 (100.0%) | 0 (0.0%) |
| 55 to 64 Years | 32 (53.3%) | 28 (46.7%) |
| 65 to 74 Years | 24 (100.0%) | 0 (0.0%) |
| 75 Years and older | 11 (100.0%) | 0 (0.0%) |
| Total | 231 (64.2%) | 129 (35.8%) |
Health Insurance Coverage by Citizenship Status in San Pedro
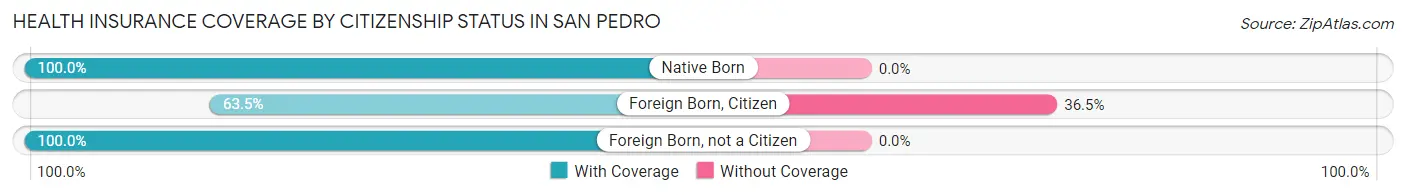
| Citizenship Status | With Coverage | Without Coverage |
| Native Born | 34 (100.0%) | 0 (0.0%) |
| Foreign Born, Citizen | 54 (63.5%) | 31 (36.5%) |
| Foreign Born, not a Citizen | 35 (100.0%) | 0 (0.0%) |
Health Insurance Coverage by Household Income in San Pedro
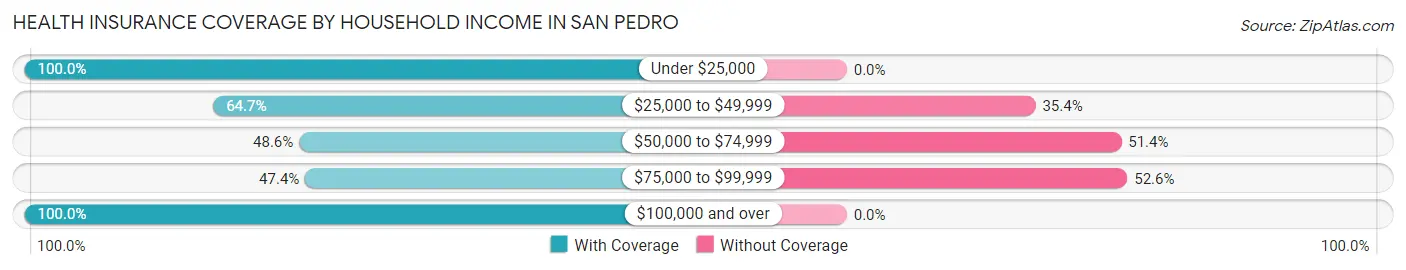
| Household Income | With Coverage | Without Coverage |
| Under $25,000 | 10 (100.0%) | 0 (0.0%) |
| $25,000 to $49,999 | 128 (64.6%) | 70 (35.3%) |
| $50,000 to $74,999 | 17 (48.6%) | 18 (51.4%) |
| $75,000 to $99,999 | 37 (47.4%) | 41 (52.6%) |
| $100,000 and over | 39 (100.0%) | 0 (0.0%) |
Public vs Private Health Insurance Coverage by Age in San Pedro
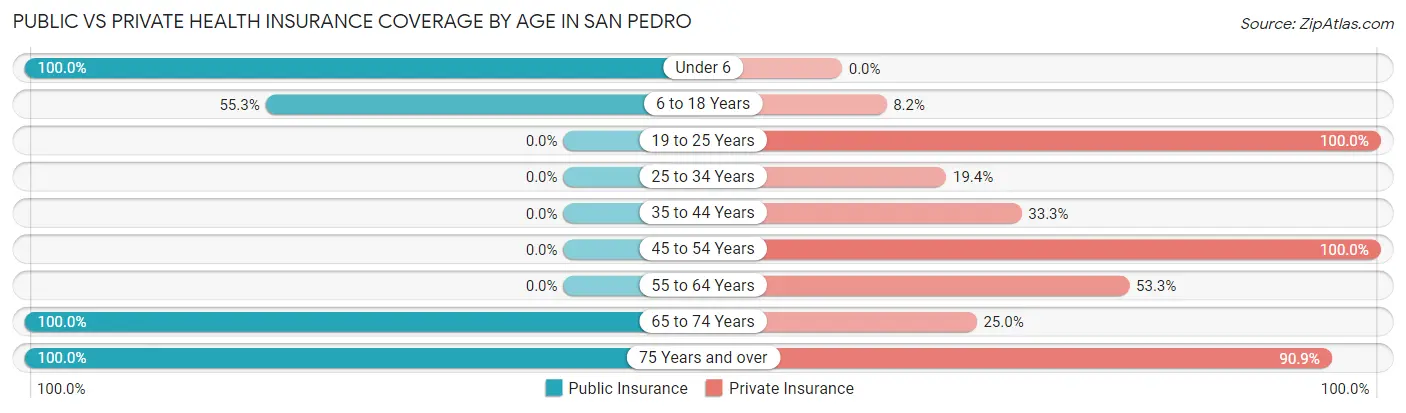
| Age Bracket | Public Insurance | Private Insurance |
| Under 6 | 34 (100.0%) | 0 (0.0%) |
| 6 to 18 Years | 47 (55.3%) | 7 (8.2%) |
| 19 to 25 Years | 0 (0.0%) | 35 (100.0%) |
| 25 to 34 Years | 0 (0.0%) | 12 (19.4%) |
| 35 to 44 Years | 0 (0.0%) | 10 (33.3%) |
| 45 to 54 Years | 0 (0.0%) | 19 (100.0%) |
| 55 to 64 Years | 0 (0.0%) | 32 (53.3%) |
| 65 to 74 Years | 24 (100.0%) | 6 (25.0%) |
| 75 Years and over | 11 (100.0%) | 10 (90.9%) |
| Total | 116 (32.2%) | 131 (36.4%) |
Disability Status by Sex by Age in San Pedro
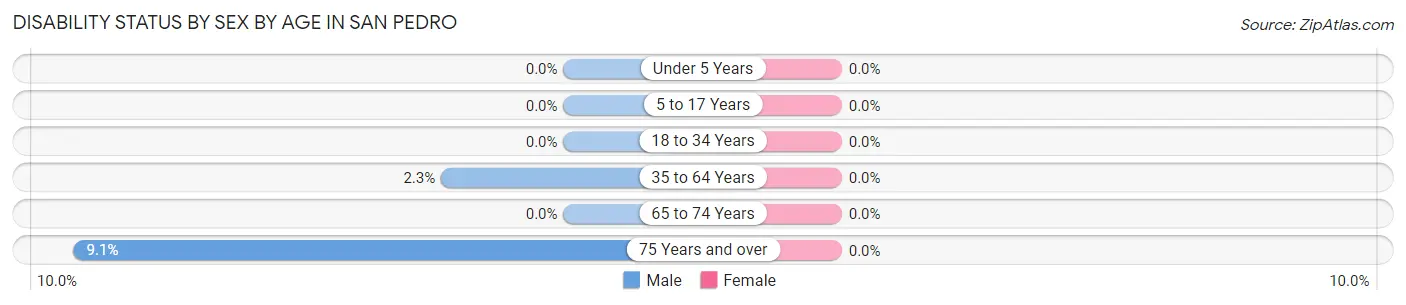
| Age Bracket | Male | Female |
| Under 5 Years | 0 (0.0%) | 0 (0.0%) |
| 5 to 17 Years | 0 (0.0%) | 0 (0.0%) |
| 18 to 34 Years | 0 (0.0%) | 0 (0.0%) |
| 35 to 64 Years | 1 (2.3%) | 0 (0.0%) |
| 65 to 74 Years | 0 (0.0%) | 0 (0.0%) |
| 75 Years and over | 1 (9.1%) | 0 (0.0%) |
Disability Class by Sex by Age in San Pedro
Disability Class: Hearing Difficulty
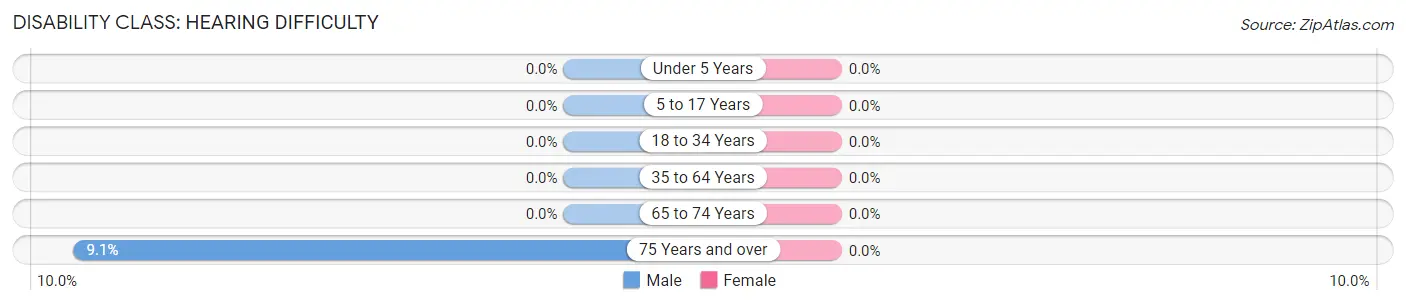
| Age Bracket | Male | Female |
| Under 5 Years | 0 (0.0%) | 0 (0.0%) |
| 5 to 17 Years | 0 (0.0%) | 0 (0.0%) |
| 18 to 34 Years | 0 (0.0%) | 0 (0.0%) |
| 35 to 64 Years | 0 (0.0%) | 0 (0.0%) |
| 65 to 74 Years | 0 (0.0%) | 0 (0.0%) |
| 75 Years and over | 1 (9.1%) | 0 (0.0%) |
Disability Class: Vision Difficulty
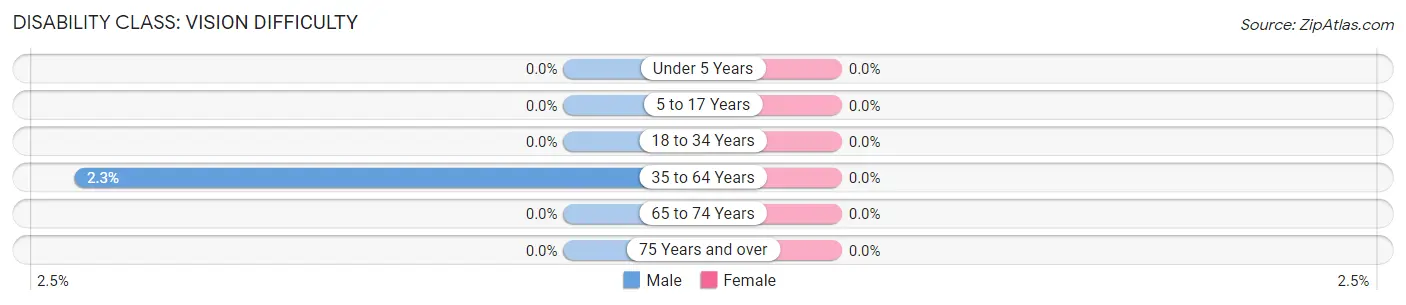
| Age Bracket | Male | Female |
| Under 5 Years | 0 (0.0%) | 0 (0.0%) |
| 5 to 17 Years | 0 (0.0%) | 0 (0.0%) |
| 18 to 34 Years | 0 (0.0%) | 0 (0.0%) |
| 35 to 64 Years | 1 (2.3%) | 0 (0.0%) |
| 65 to 74 Years | 0 (0.0%) | 0 (0.0%) |
| 75 Years and over | 0 (0.0%) | 0 (0.0%) |
Disability Class: Cognitive Difficulty
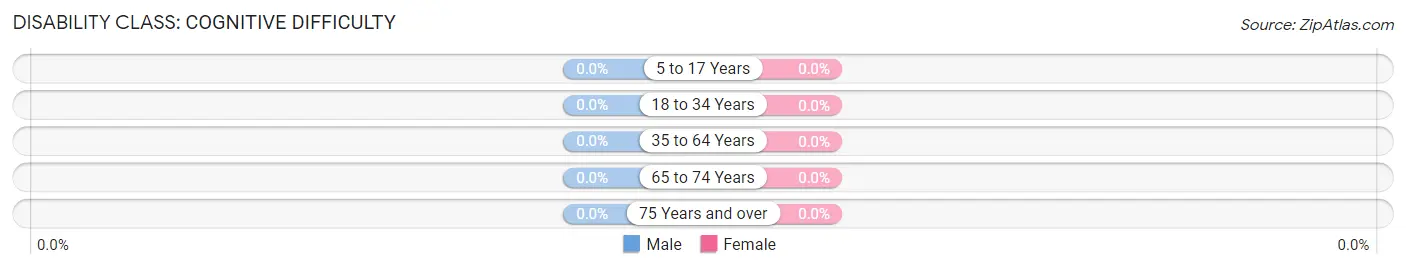
| Age Bracket | Male | Female |
| 5 to 17 Years | 0 (0.0%) | 0 (0.0%) |
| 18 to 34 Years | 0 (0.0%) | 0 (0.0%) |
| 35 to 64 Years | 0 (0.0%) | 0 (0.0%) |
| 65 to 74 Years | 0 (0.0%) | 0 (0.0%) |
| 75 Years and over | 0 (0.0%) | 0 (0.0%) |
Disability Class: Ambulatory Difficulty
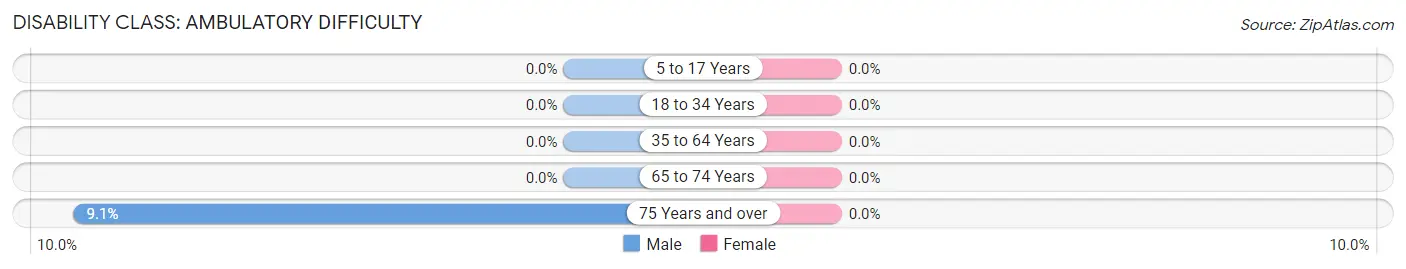
| Age Bracket | Male | Female |
| 5 to 17 Years | 0 (0.0%) | 0 (0.0%) |
| 18 to 34 Years | 0 (0.0%) | 0 (0.0%) |
| 35 to 64 Years | 0 (0.0%) | 0 (0.0%) |
| 65 to 74 Years | 0 (0.0%) | 0 (0.0%) |
| 75 Years and over | 1 (9.1%) | 0 (0.0%) |
Disability Class: Self-Care Difficulty
| Age Bracket | Male | Female |
| 5 to 17 Years | 0 (0.0%) | 0 (0.0%) |
| 18 to 34 Years | 0 (0.0%) | 0 (0.0%) |
| 35 to 64 Years | 0 (0.0%) | 0 (0.0%) |
| 65 to 74 Years | 0 (0.0%) | 0 (0.0%) |
| 75 Years and over | 0 (0.0%) | 0 (0.0%) |
Technology Access in San Pedro
Computing Device Access in San Pedro
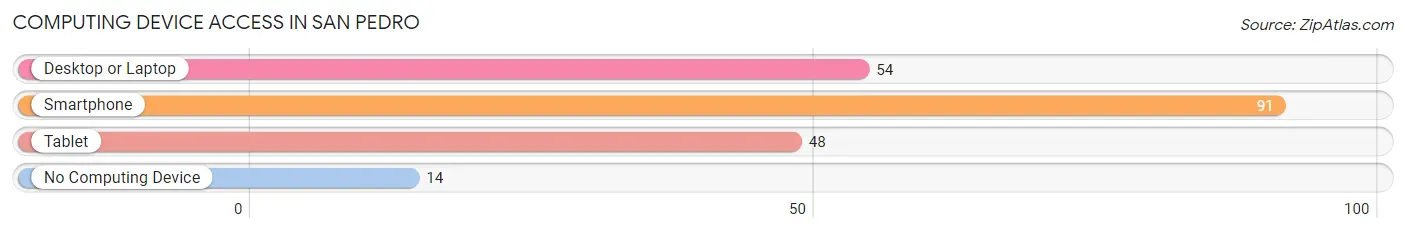
| Device Type | # Households | % Households |
| Desktop or Laptop | 54 | 49.5% |
| Smartphone | 91 | 83.5% |
| Tablet | 48 | 44.0% |
| No Computing Device | 14 | 12.8% |
| Total | 109 | 100.0% |
Internet Access in San Pedro
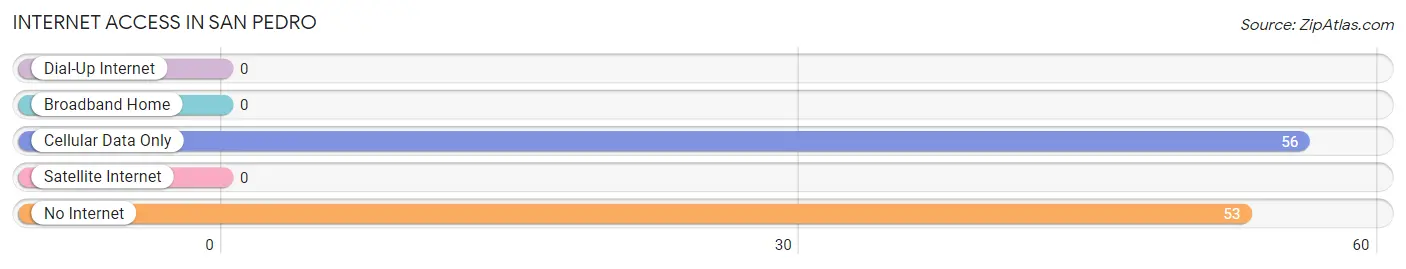
| Internet Type | # Households | % Households |
| Dial-Up Internet | 0 | 0.0% |
| Broadband Home | 0 | 0.0% |
| Cellular Data Only | 56 | 51.4% |
| Satellite Internet | 0 | 0.0% |
| No Internet | 53 | 48.6% |
| Total | 109 | 100.0% |
San Pedro Summary
San Pedro, Texas is a small town located in the Rio Grande Valley of South Texas. It is situated in Hidalgo County, approximately 20 miles south of McAllen and 30 miles north of Brownsville. The town was founded in 1848 and is named after the San Pedro Creek, which runs through the area. The population of San Pedro was 1,845 in the 2010 census.
History
San Pedro was founded in 1848 by a group of settlers from the Mexican state of Tamaulipas. The settlers were attracted to the area by the abundance of water from the San Pedro Creek. The town was originally called San Pedro de los Olmos, but the name was later shortened to San Pedro.
In 1852, San Pedro was officially recognized as a town by the Mexican government. The town was incorporated in 1854 and was the first town in Hidalgo County.
In the late 19th century, San Pedro was a thriving agricultural community. The town was known for its production of cotton, corn, and sugar cane. The town also had a thriving cattle industry.
In the early 20th century, San Pedro began to experience a population boom. This was due to the influx of Mexican immigrants who were attracted to the area by the promise of work in the agricultural industry.
Geography
San Pedro is located in the Rio Grande Valley of South Texas. The town is situated in Hidalgo County, approximately 20 miles south of McAllen and 30 miles north of Brownsville.
The town is located on the banks of the San Pedro Creek, which runs through the area. The creek is a tributary of the Rio Grande River.
The climate in San Pedro is subtropical, with hot summers and mild winters. The average annual temperature is 73 degrees Fahrenheit.
Economy
The economy of San Pedro is largely based on agriculture. The town is known for its production of cotton, corn, and sugar cane. The town also has a thriving cattle industry.
In addition to agriculture, San Pedro is home to several small businesses. These include restaurants, retail stores, and auto repair shops.
Demographics
As of the 2010 census, the population of San Pedro was 1,845. The racial makeup of the town was 94.3% Hispanic or Latino, 4.2% White, and 1.5% Other.
The median household income in San Pedro was 25 938 in 2010 The per capita income was 11 845
Conclusion
San Pedro, Texas is a small town located in the Rio Grande Valley of South Texas. It was founded in 1848 and is known for its production of cotton, corn, and sugar cane. The population of San Pedro was 1,845 in the 2010 census. The town has a largely Hispanic population and a median household income of $25,938. San Pedro is a thriving agricultural community and is home to several small businesses.
Common Questions
What is Per Capita Income in San Pedro?
Per Capita income in San Pedro is $17,237.
What is the Median Family Income in San Pedro?
Median Family Income in San Pedro is $38,173.
What is the Median Household income in San Pedro?
Median Household Income in San Pedro is $39,904.
What is Inequality or Gini Index in San Pedro?
Inequality or Gini Index in San Pedro is 0.33.
What is the Total Population of San Pedro?
Total Population of San Pedro is 360.
What is the Total Male Population of San Pedro?
Total Male Population of San Pedro is 179.
What is the Total Female Population of San Pedro?
Total Female Population of San Pedro is 181.
What is the Ratio of Males per 100 Females in San Pedro?
There are 98.90 Males per 100 Females in San Pedro.
What is the Ratio of Females per 100 Males in San Pedro?
There are 101.12 Females per 100 Males in San Pedro.
What is the Median Population Age in San Pedro?
Median Population Age in San Pedro is 30.8 Years.
What is the Average Family Size in San Pedro
Average Family Size in San Pedro is 4.3 People.
What is the Average Household Size in San Pedro
Average Household Size in San Pedro is 3.3 People.
How Large is the Labor Force in San Pedro?
There are 175 People in the Labor Forcein in San Pedro.
What is the Percentage of People in the Labor Force in San Pedro?
69.7% of People are in the Labor Force in San Pedro.