Salado, TX Map & Demographics
Salado Map
Salado Overview
$47,141
PER CAPITA INCOME
$102,568
AVG FAMILY INCOME
$89,348
AVG HOUSEHOLD INCOME
29.7%
WAGE / INCOME GAP [ % ]
70.3¢/ $1
WAGE / INCOME GAP [ $ ]
0.43
INEQUALITY / GINI INDEX
2,585
TOTAL POPULATION
1,333
MALE POPULATION
1,252
FEMALE POPULATION
106.47
MALES / 100 FEMALES
93.92
FEMALES / 100 MALES
44.6
MEDIAN AGE
3.0
AVG FAMILY SIZE
2.6
AVG HOUSEHOLD SIZE
1,225
LABOR FORCE [ PEOPLE ]
59.6%
PERCENT IN LABOR FORCE
1.1%
UNEMPLOYMENT RATE
Salado Zip Codes
Salado Area Codes
Income in Salado
Income Overview in Salado
Per Capita Income in Salado is $47,141, while median incomes of families and households are $102,568 and $89,348 respectively.
| Characteristic | Number | Measure |
| Per Capita Income | 2,585 | $47,141 |
| Median Family Income | 748 | $102,568 |
| Mean Family Income | 748 | $133,988 |
| Median Household Income | 978 | $89,348 |
| Mean Household Income | 978 | $119,144 |
| Income Deficit | 748 | $0 |
| Wage / Income Gap (%) | 2,585 | 29.70% |
| Wage / Income Gap ($) | 2,585 | 70.30¢ per $1 |
| Gini / Inequality Index | 2,585 | 0.43 |
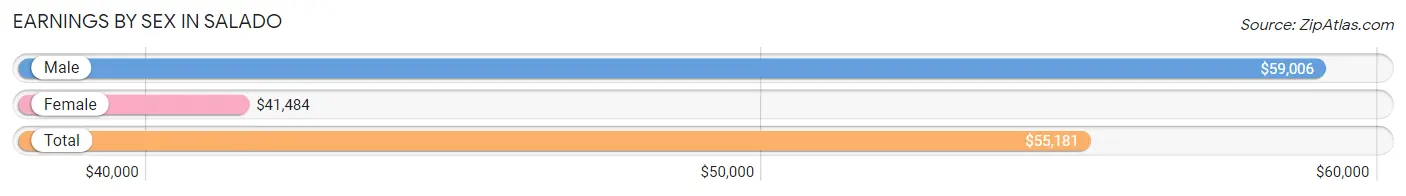
Earnings by Sex in Salado
Average Earnings in Salado are $55,181, $59,006 for men and $41,484 for women, a difference of 29.7%.
| Sex | Number | Average Earnings |
| Male | 747 (58.3%) | $59,006 |
| Female | 535 (41.7%) | $41,484 |
| Total | 1,282 (100.0%) | $55,181 |
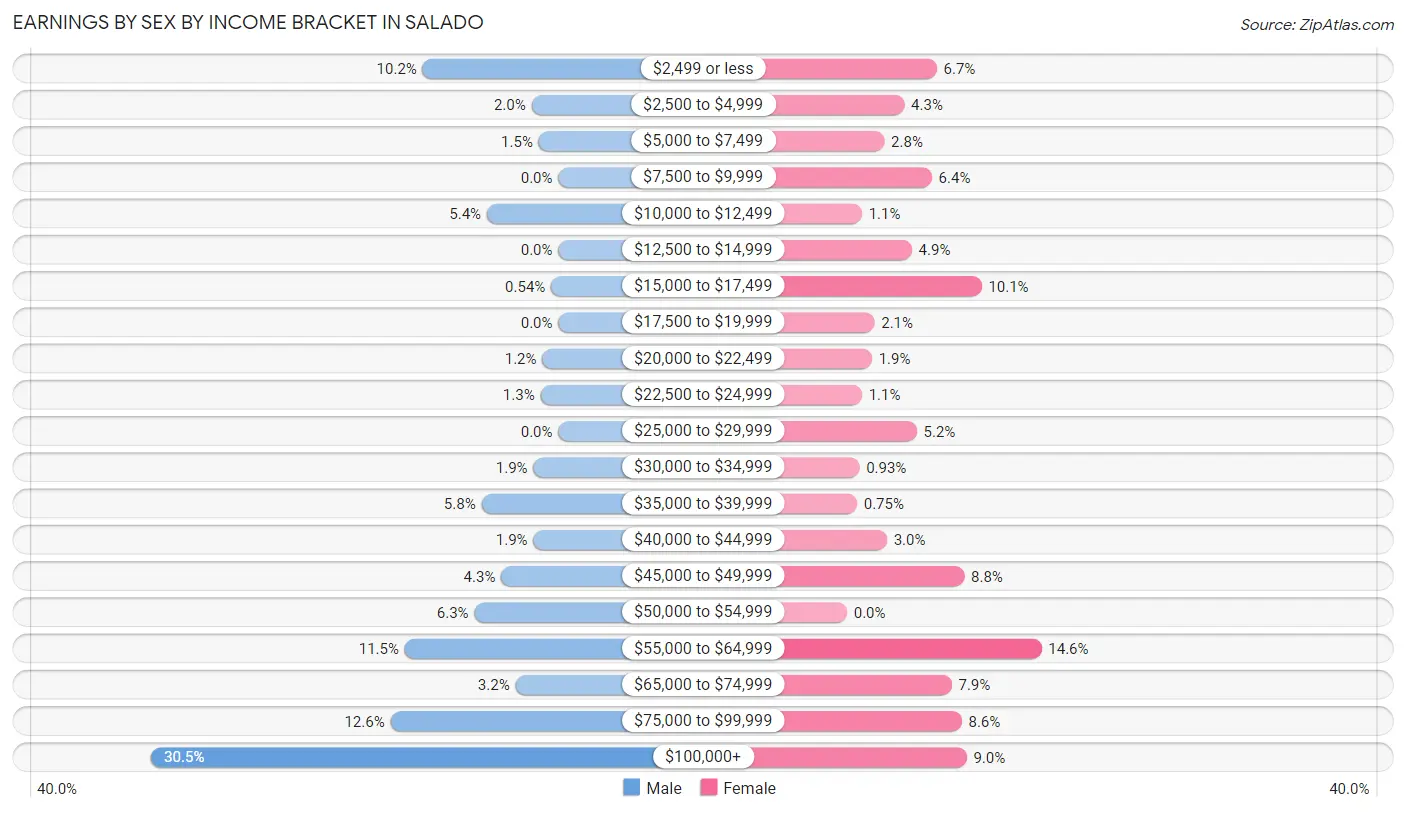
Earnings by Sex by Income Bracket in Salado
The most common earnings brackets in Salado are $100,000+ for men (228 | 30.5%) and $55,000 to $64,999 for women (78 | 14.6%).
| Income | Male | Female |
| $2,499 or less | 76 (10.2%) | 36 (6.7%) |
| $2,500 to $4,999 | 15 (2.0%) | 23 (4.3%) |
| $5,000 to $7,499 | 11 (1.5%) | 15 (2.8%) |
| $7,500 to $9,999 | 0 (0.0%) | 34 (6.4%) |
| $10,000 to $12,499 | 40 (5.3%) | 6 (1.1%) |
| $12,500 to $14,999 | 0 (0.0%) | 26 (4.9%) |
| $15,000 to $17,499 | 4 (0.5%) | 54 (10.1%) |
| $17,500 to $19,999 | 0 (0.0%) | 11 (2.1%) |
| $20,000 to $22,499 | 9 (1.2%) | 10 (1.9%) |
| $22,500 to $24,999 | 10 (1.3%) | 6 (1.1%) |
| $25,000 to $29,999 | 0 (0.0%) | 28 (5.2%) |
| $30,000 to $34,999 | 14 (1.9%) | 5 (0.9%) |
| $35,000 to $39,999 | 43 (5.8%) | 4 (0.7%) |
| $40,000 to $44,999 | 14 (1.9%) | 16 (3.0%) |
| $45,000 to $49,999 | 32 (4.3%) | 47 (8.8%) |
| $50,000 to $54,999 | 47 (6.3%) | 0 (0.0%) |
| $55,000 to $64,999 | 86 (11.5%) | 78 (14.6%) |
| $65,000 to $74,999 | 24 (3.2%) | 42 (7.9%) |
| $75,000 to $99,999 | 94 (12.6%) | 46 (8.6%) |
| $100,000+ | 228 (30.5%) | 48 (9.0%) |
| Total | 747 (100.0%) | 535 (100.0%) |
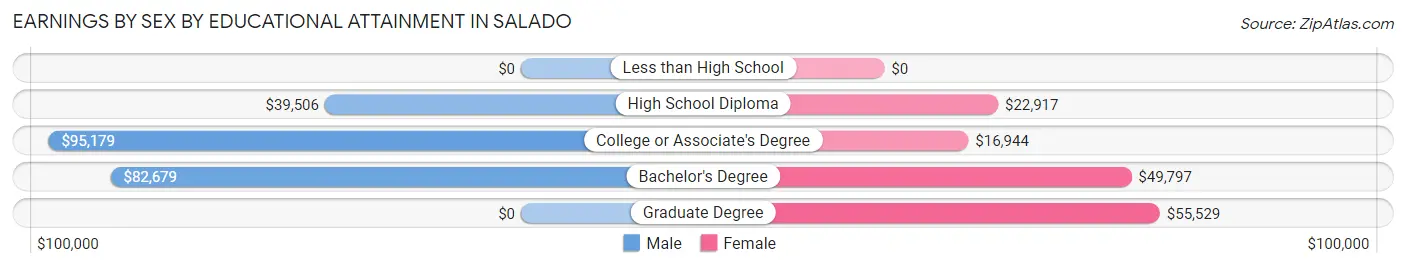
Earnings by Sex by Educational Attainment in Salado
Average earnings in Salado are $73,036 for men and $42,422 for women, a difference of 41.9%. Men with an educational attainment of college or associate's degree enjoy the highest average annual earnings of $95,179, while those with high school diploma education earn the least with $39,506. Women with an educational attainment of graduate degree earn the most with the average annual earnings of $55,529, while those with college or associate's degree education have the smallest earnings of $16,944.
| Educational Attainment | Male Income | Female Income |
| Less than High School | - | - |
| High School Diploma | $39,506 | $22,917 |
| College or Associate's Degree | $95,179 | $16,944 |
| Bachelor's Degree | $82,679 | $49,797 |
| Graduate Degree | - | - |
| Total | $73,036 | $42,422 |
Family Income in Salado
Family Income Brackets in Salado
According to the Salado family income data, there are 155 families falling into the $50,000 to $74,999 income range, which is the most common income bracket and makes up 20.7% of all families.
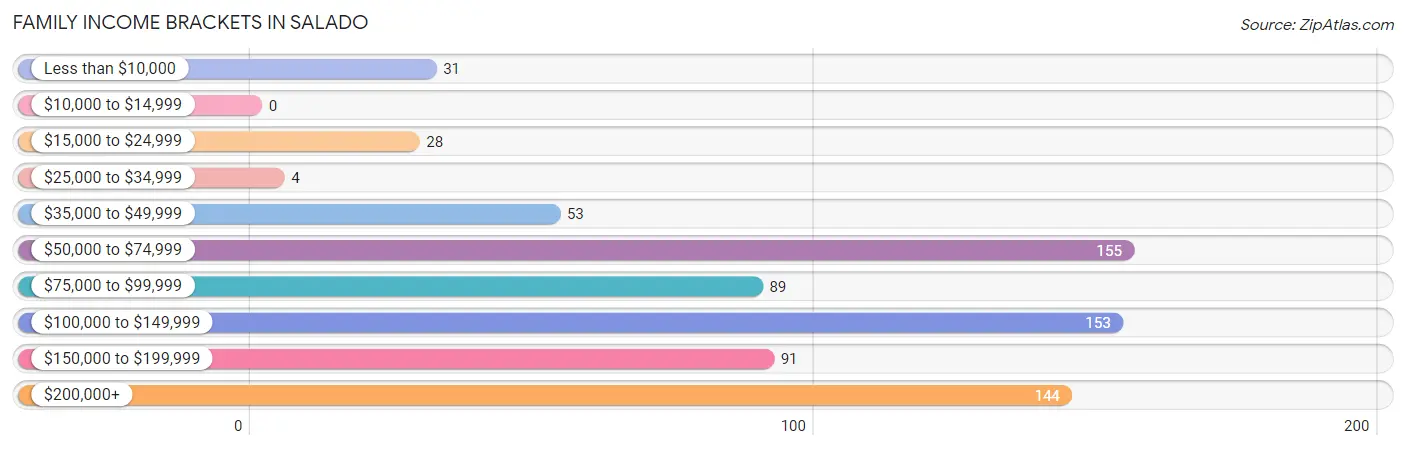
| Income Bracket | # Families | % Families |
| Less than $10,000 | 31 | 4.1% |
| $10,000 to $14,999 | 0 | 0.0% |
| $15,000 to $24,999 | 28 | 3.7% |
| $25,000 to $34,999 | 4 | 0.5% |
| $35,000 to $49,999 | 53 | 7.1% |
| $50,000 to $74,999 | 155 | 20.7% |
| $75,000 to $99,999 | 89 | 11.9% |
| $100,000 to $149,999 | 153 | 20.5% |
| $150,000 to $199,999 | 91 | 12.2% |
| $200,000+ | 144 | 19.3% |
Family Income by Famaliy Size in Salado
4-person families (222 | 29.7%) account for the highest median family income in Salado with $103,581 per family, while 2-person families (404 | 54.0%) have the highest median income of $50,096 per family member.
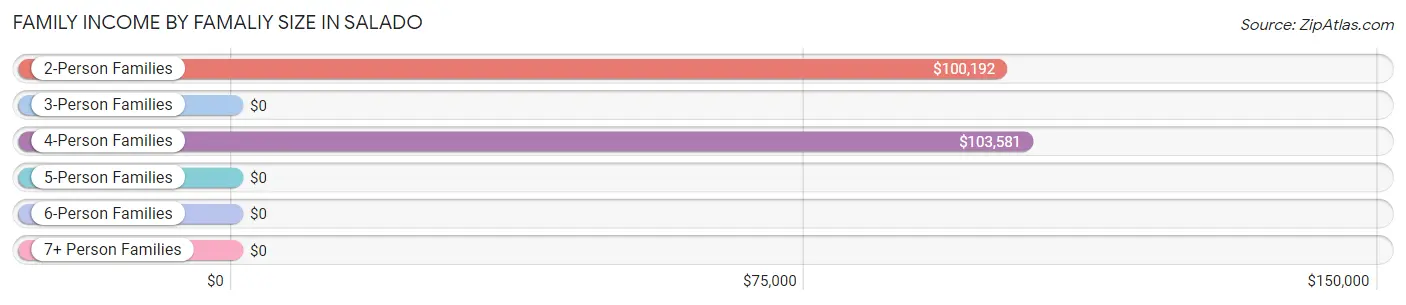
| Income Bracket | # Families | Median Income |
| 2-Person Families | 404 (54.0%) | $100,192 |
| 3-Person Families | 101 (13.5%) | $0 |
| 4-Person Families | 222 (29.7%) | $103,581 |
| 5-Person Families | 9 (1.2%) | $0 |
| 6-Person Families | 12 (1.6%) | $0 |
| 7+ Person Families | 0 (0.0%) | $0 |
| Total | 748 (100.0%) | $102,568 |
Family Income by Number of Earners in Salado
The median family income in Salado is $102,568, with families comprising 3+ earners (56) having the highest median family income of $247,857, while families with no earners (162) have the lowest median family income of $58,654, accounting for 7.5% and 21.7% of families, respectively.
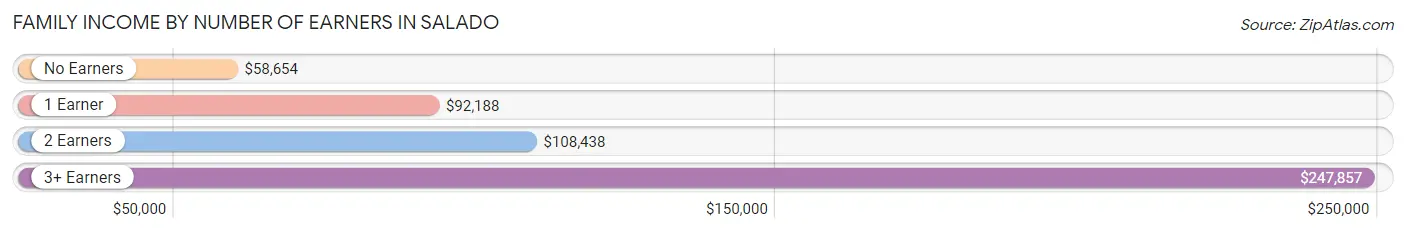
| Number of Earners | # Families | Median Income |
| No Earners | 162 (21.7%) | $58,654 |
| 1 Earner | 207 (27.7%) | $92,188 |
| 2 Earners | 323 (43.2%) | $108,438 |
| 3+ Earners | 56 (7.5%) | $247,857 |
| Total | 748 (100.0%) | $102,568 |
Household Income in Salado
Household Income Brackets in Salado
With 218 households falling in the category, the $50,000 to $74,999 income range is the most frequent in Salado, accounting for 22.3% of all households. In contrast, only 8 households (0.8%) fall into the $10,000 to $14,999 income bracket, making it the least populous group.
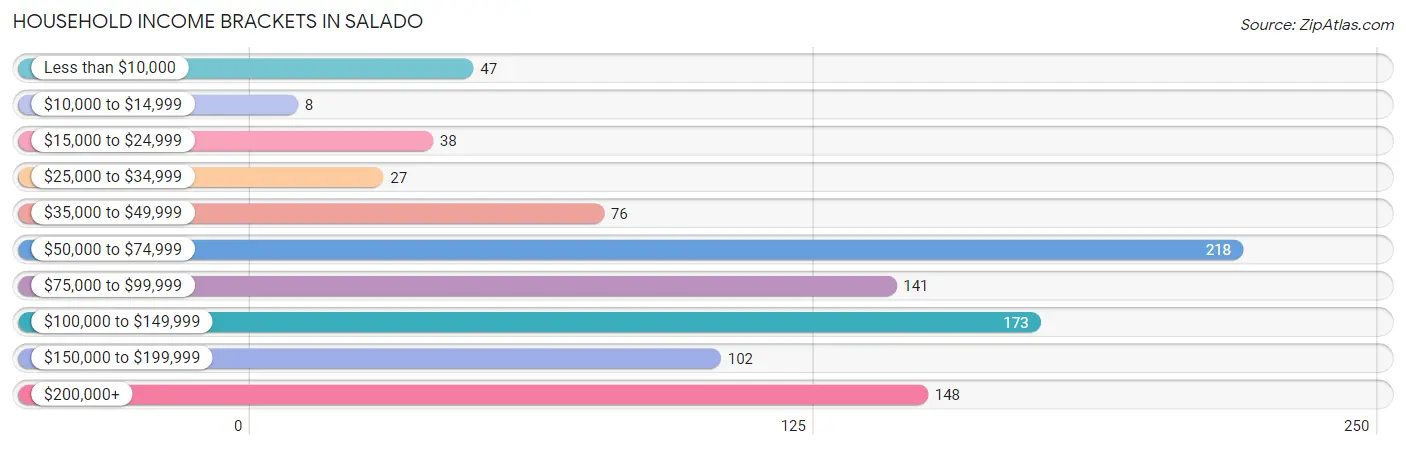
| Income Bracket | # Households | % Households |
| Less than $10,000 | 47 | 4.8% |
| $10,000 to $14,999 | 8 | 0.8% |
| $15,000 to $24,999 | 38 | 3.9% |
| $25,000 to $34,999 | 27 | 2.8% |
| $35,000 to $49,999 | 76 | 7.8% |
| $50,000 to $74,999 | 218 | 22.3% |
| $75,000 to $99,999 | 141 | 14.4% |
| $100,000 to $149,999 | 173 | 17.7% |
| $150,000 to $199,999 | 102 | 10.4% |
| $200,000+ | 148 | 15.1% |
Household Income by Householder Age in Salado
The median household income in Salado is $89,348, with the highest median household income of $149,519 found in the 45 to 64 years age bracket for the primary householder. A total of 304 households (31.1%) fall into this category. Meanwhile, the 15 to 24 years age bracket for the primary householder has the lowest median household income of $0, with 25 households (2.6%) in this group.
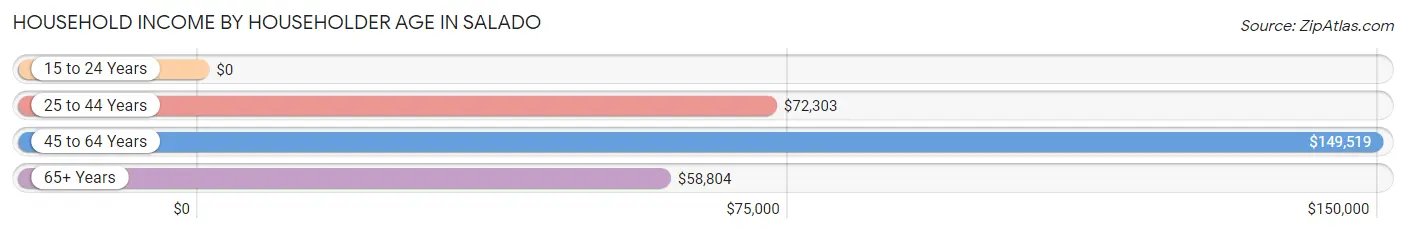
| Income Bracket | # Households | Median Income |
| 15 to 24 Years | 25 (2.6%) | $0 |
| 25 to 44 Years | 265 (27.1%) | $72,303 |
| 45 to 64 Years | 304 (31.1%) | $149,519 |
| 65+ Years | 384 (39.3%) | $58,804 |
| Total | 978 (100.0%) | $89,348 |
Poverty in Salado
Income Below Poverty by Sex and Age in Salado
With 3.7% poverty level for males and 10.6% for females among the residents of Salado, 16 and 17 year old males and 18 to 24 year old females are the most vulnerable to poverty, with 5 males (22.7%) and 6 females (27.3%) in their respective age groups living below the poverty level.

| Age Bracket | Male | Female |
| Under 5 Years | 0 (0.0%) | 14 (7.2%) |
| 5 Years | 0 (0.0%) | 0 (0.0%) |
| 6 to 11 Years | 0 (0.0%) | 0 (0.0%) |
| 12 to 14 Years | 0 (0.0%) | 0 (0.0%) |
| 15 Years | 5 (21.7%) | 0 (0.0%) |
| 16 and 17 Years | 5 (22.7%) | 0 (0.0%) |
| 18 to 24 Years | 0 (0.0%) | 6 (27.3%) |
| 25 to 34 Years | 0 (0.0%) | 36 (24.0%) |
| 35 to 44 Years | 6 (3.3%) | 0 (0.0%) |
| 45 to 54 Years | 0 (0.0%) | 31 (17.2%) |
| 55 to 64 Years | 4 (3.2%) | 5 (3.3%) |
| 65 to 74 Years | 4 (2.7%) | 14 (9.9%) |
| 75 Years and over | 26 (15.4%) | 27 (15.5%) |
| Total | 50 (3.7%) | 133 (10.6%) |
Income Above Poverty by Sex and Age in Salado
According to the poverty statistics in Salado, males aged under 5 years and females aged 5 years are the age groups that are most secure financially, with 100.0% of males and 100.0% of females in these age groups living above the poverty line.
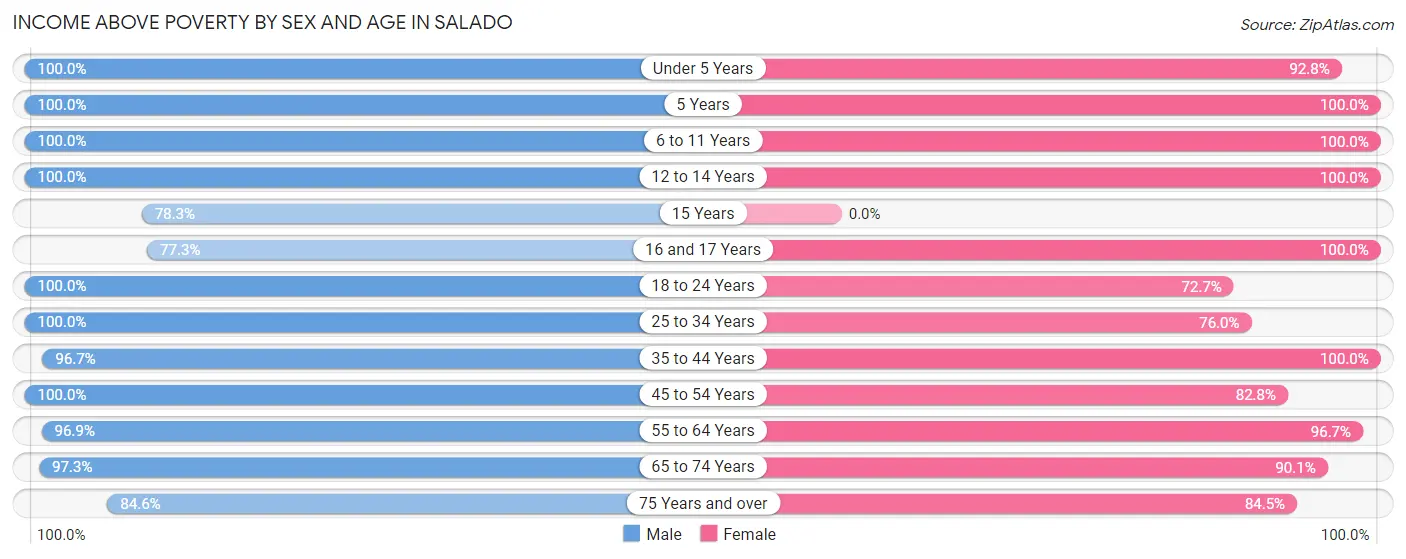
| Age Bracket | Male | Female |
| Under 5 Years | 54 (100.0%) | 179 (92.7%) |
| 5 Years | 41 (100.0%) | 4 (100.0%) |
| 6 to 11 Years | 85 (100.0%) | 68 (100.0%) |
| 12 to 14 Years | 28 (100.0%) | 34 (100.0%) |
| 15 Years | 18 (78.3%) | 0 (0.0%) |
| 16 and 17 Years | 17 (77.3%) | 13 (100.0%) |
| 18 to 24 Years | 153 (100.0%) | 16 (72.7%) |
| 25 to 34 Years | 113 (100.0%) | 114 (76.0%) |
| 35 to 44 Years | 175 (96.7%) | 120 (100.0%) |
| 45 to 54 Years | 188 (100.0%) | 149 (82.8%) |
| 55 to 64 Years | 123 (96.9%) | 147 (96.7%) |
| 65 to 74 Years | 145 (97.3%) | 128 (90.1%) |
| 75 Years and over | 143 (84.6%) | 147 (84.5%) |
| Total | 1,283 (96.3%) | 1,119 (89.4%) |
Income Below Poverty Among Married-Couple Families in Salado
The poverty statistics for married-couple families in Salado show that 3.7% or 25 of the total 671 families live below the poverty line. Families with no children have the highest poverty rate of 5.4%, comprising of 25 families. On the other hand, families with 1 or 2 children have the lowest poverty rate of 0.0%, which includes 0 families.
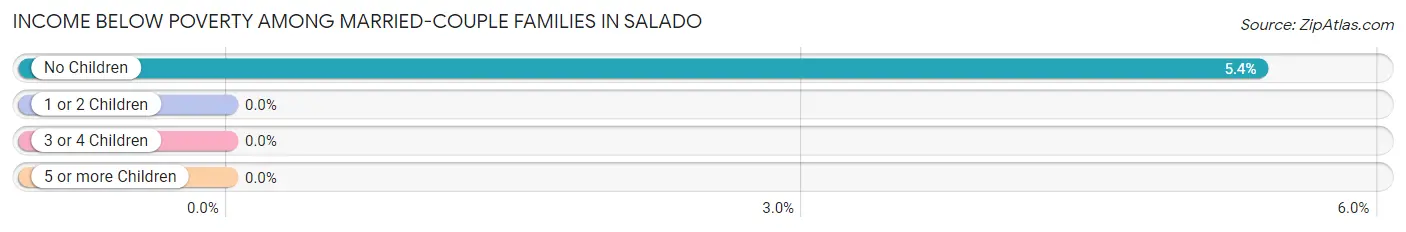
| Children | Above Poverty | Below Poverty |
| No Children | 440 (94.6%) | 25 (5.4%) |
| 1 or 2 Children | 189 (100.0%) | 0 (0.0%) |
| 3 or 4 Children | 17 (100.0%) | 0 (0.0%) |
| 5 or more Children | 0 (0.0%) | 0 (0.0%) |
| Total | 646 (96.3%) | 25 (3.7%) |
Income Below Poverty Among Single-Parent Households in Salado
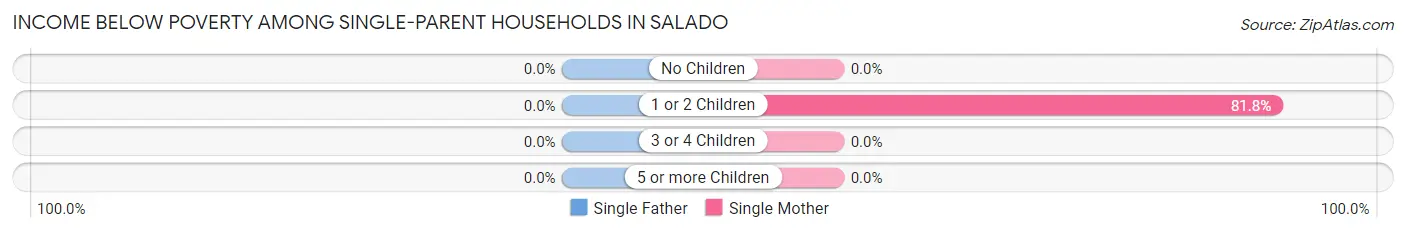
| Children | Single Father | Single Mother |
| No Children | 0 (0.0%) | 0 (0.0%) |
| 1 or 2 Children | 0 (0.0%) | 18 (81.8%) |
| 3 or 4 Children | 0 (0.0%) | 0 (0.0%) |
| 5 or more Children | 0 (0.0%) | 0 (0.0%) |
| Total | 0 (0.0%) | 18 (42.9%) |
Income Below Poverty Among Married-Couple vs Single-Parent Households in Salado
The poverty data for Salado shows that 25 of the married-couple family households (3.7%) and 18 of the single-parent households (23.4%) are living below the poverty level. Within the married-couple family households, those with no children have the highest poverty rate, with 25 households (5.4%) falling below the poverty line. Among the single-parent households, those with 1 or 2 children have the highest poverty rate, with 18 household (35.3%) living below poverty.
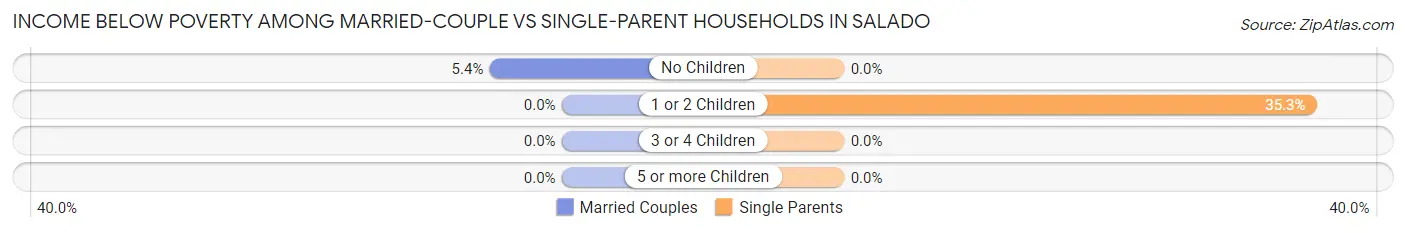
| Children | Married-Couple Families | Single-Parent Households |
| No Children | 25 (5.4%) | 0 (0.0%) |
| 1 or 2 Children | 0 (0.0%) | 18 (35.3%) |
| 3 or 4 Children | 0 (0.0%) | 0 (0.0%) |
| 5 or more Children | 0 (0.0%) | 0 (0.0%) |
| Total | 25 (3.7%) | 18 (23.4%) |
Race in Salado
The most populous races in Salado are White / Caucasian (2,079 | 80.4%), Hispanic or Latino (436 | 16.9%), and Two or more Races (235 | 9.1%).
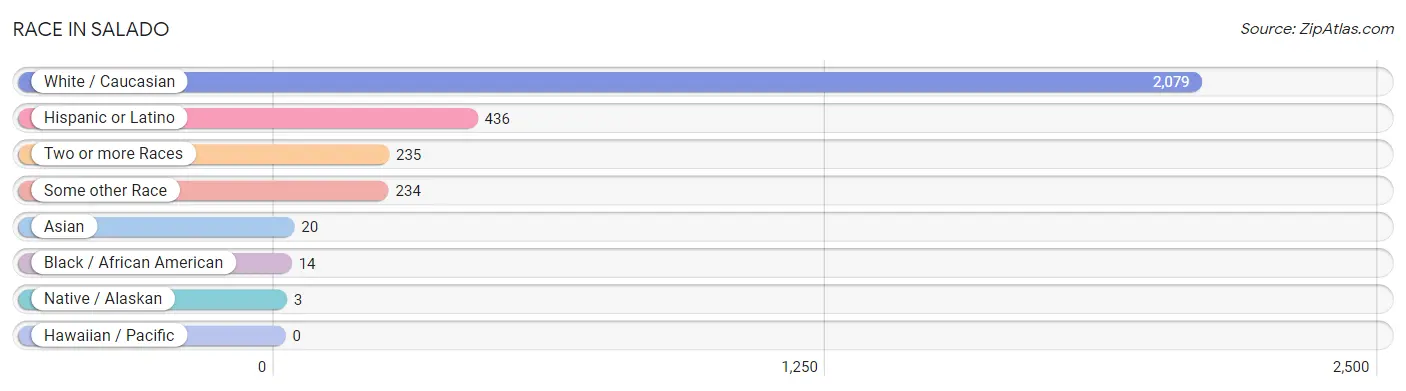
| Race | # Population | % Population |
| Asian | 20 | 0.8% |
| Black / African American | 14 | 0.5% |
| Hawaiian / Pacific | 0 | 0.0% |
| Hispanic or Latino | 436 | 16.9% |
| Native / Alaskan | 3 | 0.1% |
| White / Caucasian | 2,079 | 80.4% |
| Two or more Races | 235 | 9.1% |
| Some other Race | 234 | 9.0% |
| Total | 2,585 | 100.0% |
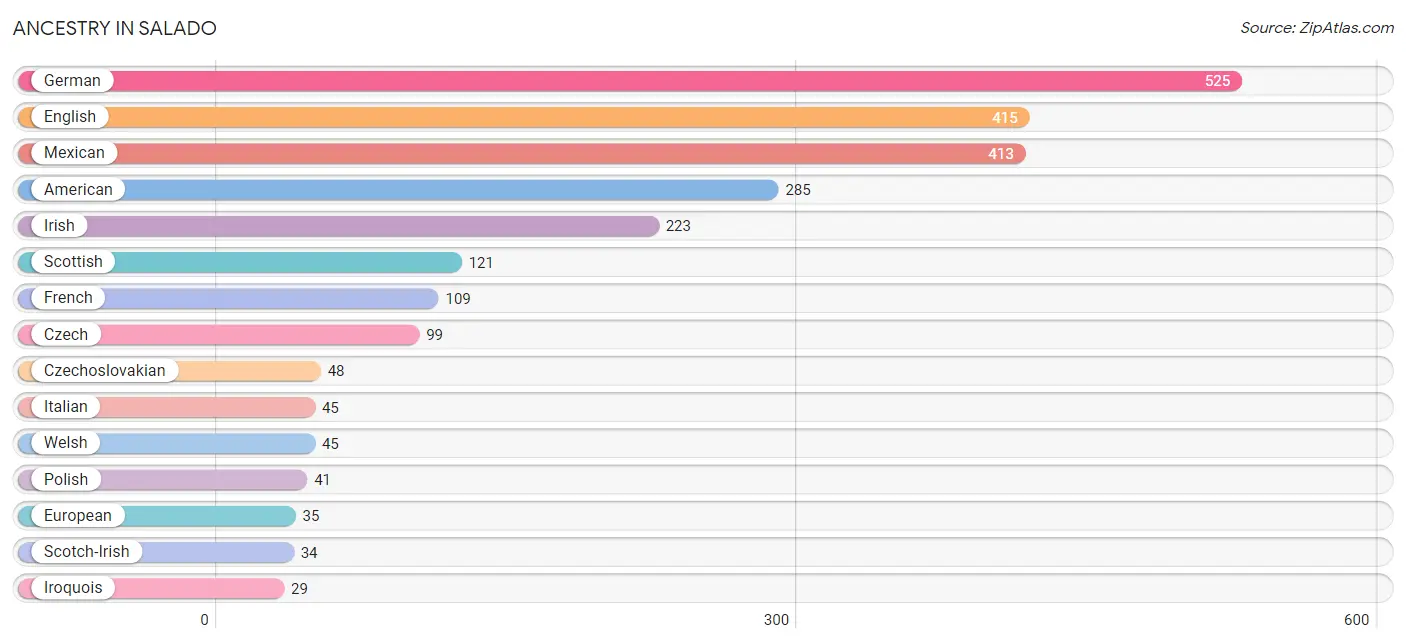
Ancestry in Salado
The most populous ancestries reported in Salado are German (525 | 20.3%), English (415 | 16.1%), Mexican (413 | 16.0%), American (285 | 11.0%), and Irish (223 | 8.6%), together accounting for 72.0% of all Salado residents.
| Ancestry | # Population | % Population |
| American | 285 | 11.0% |
| Armenian | 4 | 0.2% |
| Australian | 6 | 0.2% |
| Burmese | 3 | 0.1% |
| Cherokee | 26 | 1.0% |
| Czech | 99 | 3.8% |
| Czechoslovakian | 48 | 1.9% |
| Dutch | 18 | 0.7% |
| Dutch West Indian | 6 | 0.2% |
| Eastern European | 4 | 0.2% |
| English | 415 | 16.1% |
| European | 35 | 1.3% |
| French | 109 | 4.2% |
| French Canadian | 4 | 0.2% |
| German | 525 | 20.3% |
| Indian (Asian) | 5 | 0.2% |
| Irish | 223 | 8.6% |
| Iroquois | 29 | 1.1% |
| Italian | 45 | 1.7% |
| Korean | 18 | 0.7% |
| Lumbee | 3 | 0.1% |
| Mexican | 413 | 16.0% |
| Nigerian | 6 | 0.2% |
| Norwegian | 23 | 0.9% |
| Polish | 41 | 1.6% |
| Portuguese | 18 | 0.7% |
| Puerto Rican | 14 | 0.5% |
| Russian | 15 | 0.6% |
| Scandinavian | 19 | 0.7% |
| Scotch-Irish | 34 | 1.3% |
| Scottish | 121 | 4.7% |
| Slovak | 6 | 0.2% |
| Slovene | 6 | 0.2% |
| South African | 11 | 0.4% |
| Spanish | 9 | 0.4% |
| Subsaharan African | 17 | 0.7% |
| Swedish | 14 | 0.5% |
| Thai | 6 | 0.2% |
| Ukrainian | 4 | 0.2% |
| Welsh | 45 | 1.7% | View All 40 Rows |
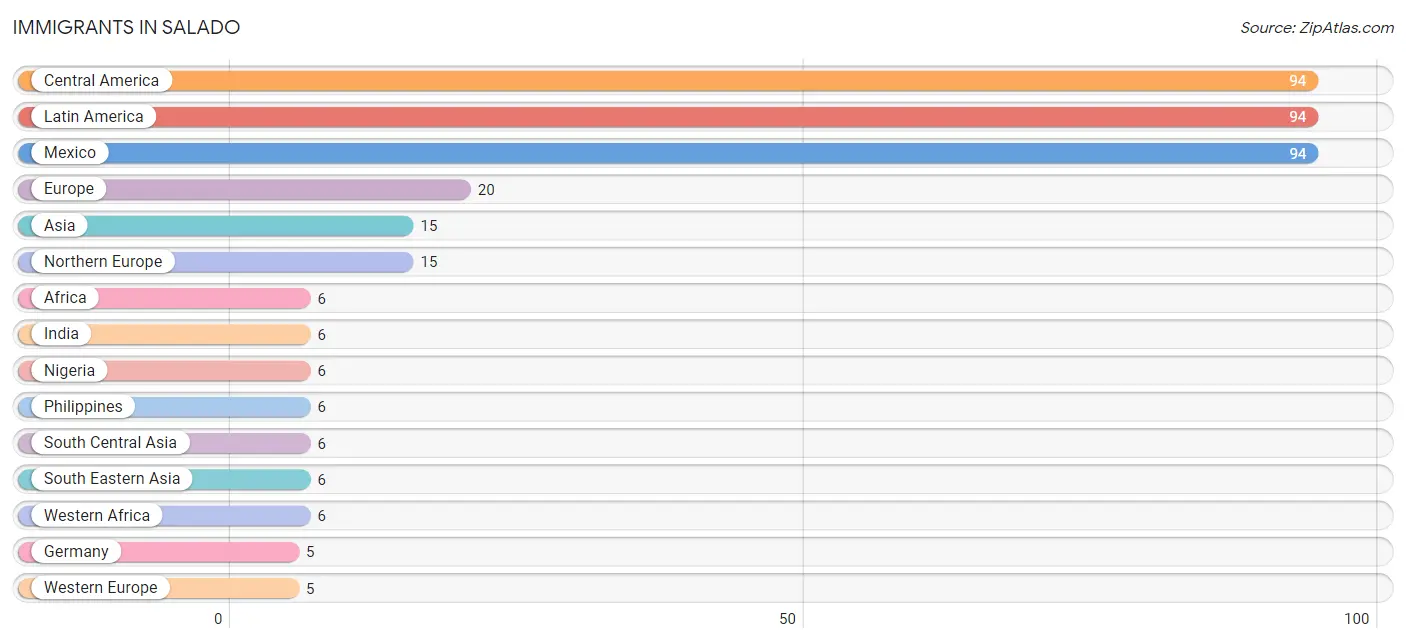
Immigrants in Salado
The most numerous immigrant groups reported in Salado came from Central America (94 | 3.6%), Latin America (94 | 3.6%), Mexico (94 | 3.6%), Europe (20 | 0.8%), and Asia (15 | 0.6%), together accounting for 12.3% of all Salado residents.
| Immigration Origin | # Population | % Population |
| Africa | 6 | 0.2% |
| Asia | 15 | 0.6% |
| Central America | 94 | 3.6% |
| Eastern Asia | 3 | 0.1% |
| Europe | 20 | 0.8% |
| Germany | 5 | 0.2% |
| India | 6 | 0.2% |
| Korea | 3 | 0.1% |
| Latin America | 94 | 3.6% |
| Mexico | 94 | 3.6% |
| Nigeria | 6 | 0.2% |
| Northern Europe | 15 | 0.6% |
| Philippines | 6 | 0.2% |
| South Central Asia | 6 | 0.2% |
| South Eastern Asia | 6 | 0.2% |
| Western Africa | 6 | 0.2% |
| Western Europe | 5 | 0.2% | View All 17 Rows |
Sex and Age in Salado
Sex and Age in Salado
The most populous age groups in Salado are 15 to 19 Years (137 | 10.3%) for men and Under 5 Years (193 | 15.4%) for women.
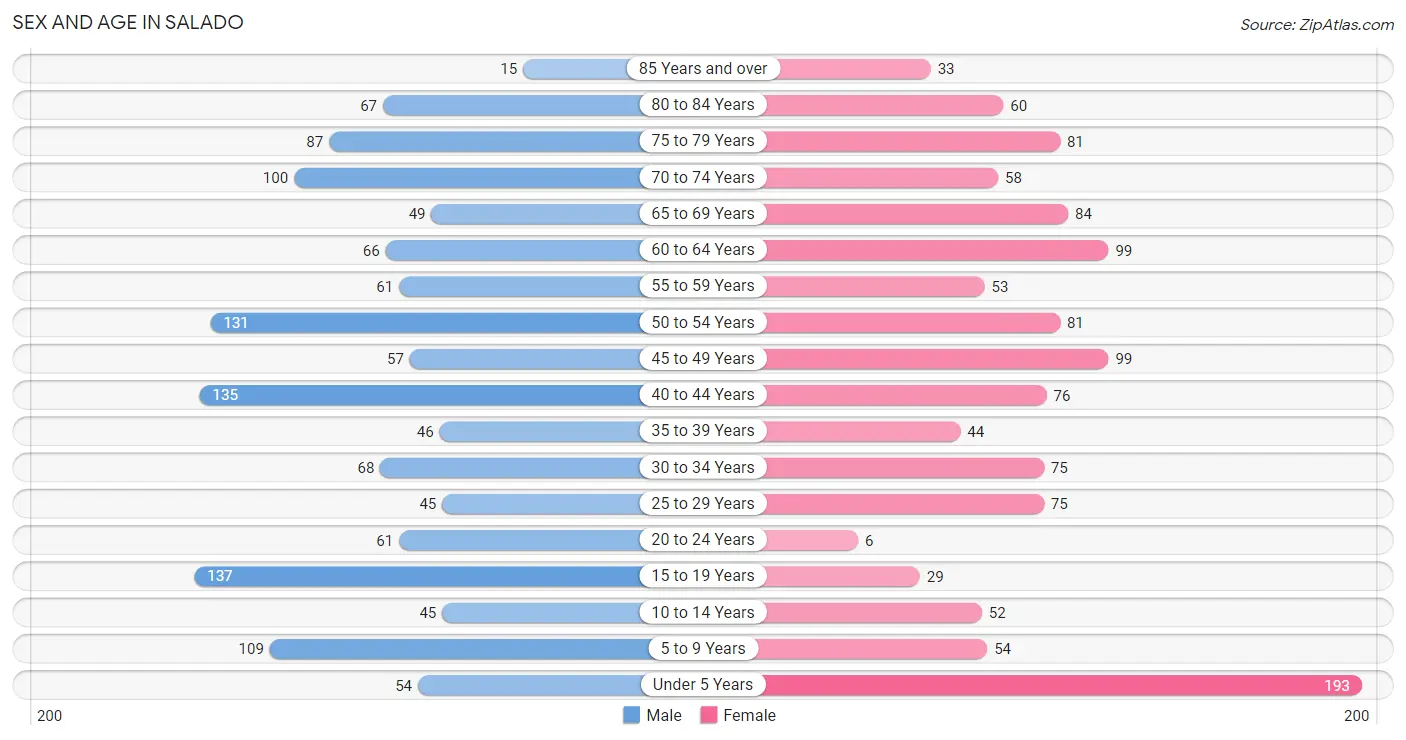
| Age Bracket | Male | Female |
| Under 5 Years | 54 (4.1%) | 193 (15.4%) |
| 5 to 9 Years | 109 (8.2%) | 54 (4.3%) |
| 10 to 14 Years | 45 (3.4%) | 52 (4.2%) |
| 15 to 19 Years | 137 (10.3%) | 29 (2.3%) |
| 20 to 24 Years | 61 (4.6%) | 6 (0.5%) |
| 25 to 29 Years | 45 (3.4%) | 75 (6.0%) |
| 30 to 34 Years | 68 (5.1%) | 75 (6.0%) |
| 35 to 39 Years | 46 (3.5%) | 44 (3.5%) |
| 40 to 44 Years | 135 (10.1%) | 76 (6.1%) |
| 45 to 49 Years | 57 (4.3%) | 99 (7.9%) |
| 50 to 54 Years | 131 (9.8%) | 81 (6.5%) |
| 55 to 59 Years | 61 (4.6%) | 53 (4.2%) |
| 60 to 64 Years | 66 (5.0%) | 99 (7.9%) |
| 65 to 69 Years | 49 (3.7%) | 84 (6.7%) |
| 70 to 74 Years | 100 (7.5%) | 58 (4.6%) |
| 75 to 79 Years | 87 (6.5%) | 81 (6.5%) |
| 80 to 84 Years | 67 (5.0%) | 60 (4.8%) |
| 85 Years and over | 15 (1.1%) | 33 (2.6%) |
| Total | 1,333 (100.0%) | 1,252 (100.0%) |
Families and Households in Salado
Median Family Size in Salado
The median family size in Salado is 3.02 persons per family, with married-couple families (671 | 89.7%) accounting for the largest median family size of 3.06 persons per family. On the other hand, single female/mother families (42 | 5.6%) represent the smallest median family size with 2.60 persons per family.
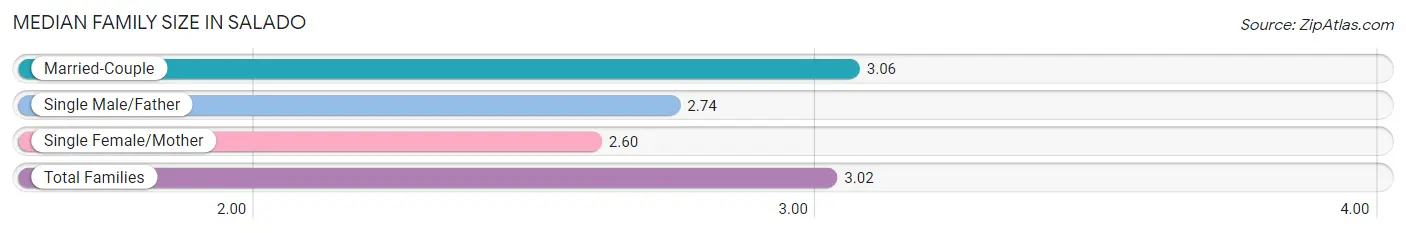
| Family Type | # Families | Family Size |
| Married-Couple | 671 (89.7%) | 3.06 |
| Single Male/Father | 35 (4.7%) | 2.74 |
| Single Female/Mother | 42 (5.6%) | 2.60 |
| Total Families | 748 (100.0%) | 3.02 |
Median Household Size in Salado
The median household size in Salado is 2.64 persons per household, with single male/father households (35 | 3.6%) accounting for the largest median household size of 3.43 persons per household. non-family households (230 | 23.5%) represent the smallest median household size with 1.22 persons per household.
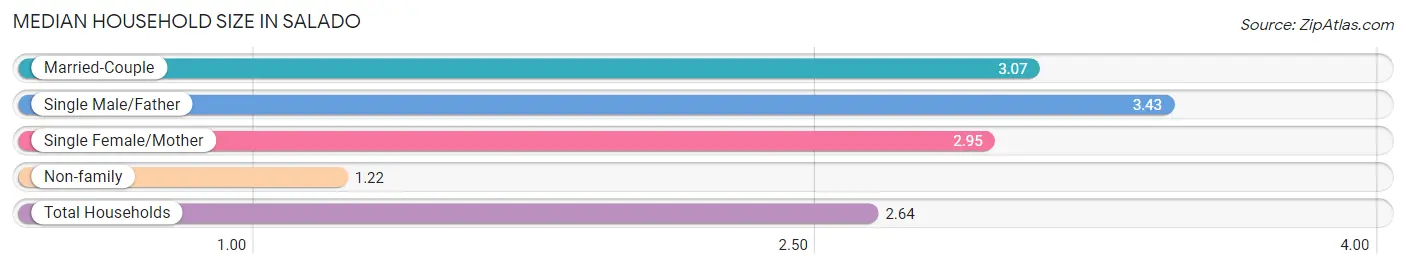
| Household Type | # Households | Household Size |
| Married-Couple | 671 (68.6%) | 3.07 |
| Single Male/Father | 35 (3.6%) | 3.43 |
| Single Female/Mother | 42 (4.3%) | 2.95 |
| Non-family | 230 (23.5%) | 1.22 |
| Total Households | 978 (100.0%) | 2.64 |
Household Size by Marriage Status in Salado
Out of a total of 978 households in Salado, 748 (76.5%) are family households, while 230 (23.5%) are nonfamily households. The most numerous type of family households are 2-person households, comprising 392, and the most common type of nonfamily households are 1-person households, comprising 186.
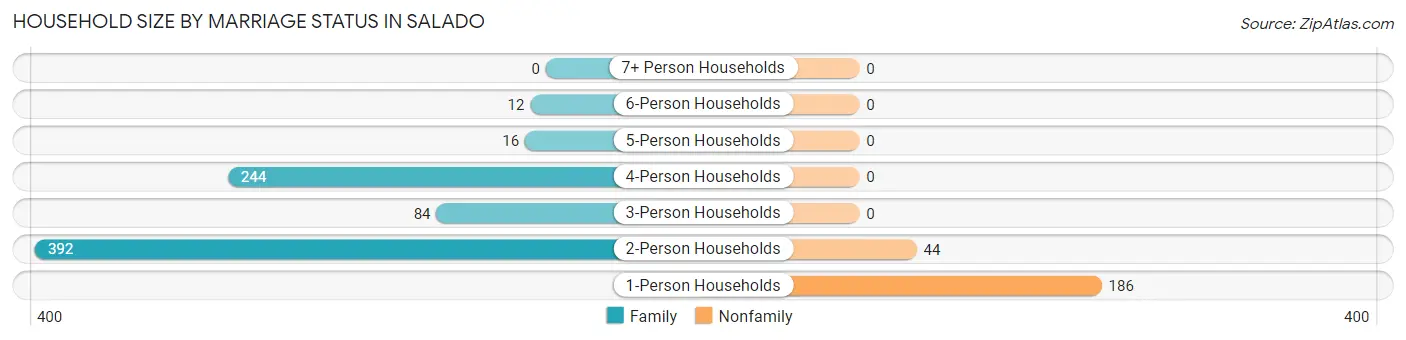
| Household Size | Family Households | Nonfamily Households |
| 1-Person Households | - | 186 (19.0%) |
| 2-Person Households | 392 (40.1%) | 44 (4.5%) |
| 3-Person Households | 84 (8.6%) | 0 (0.0%) |
| 4-Person Households | 244 (24.9%) | 0 (0.0%) |
| 5-Person Households | 16 (1.6%) | 0 (0.0%) |
| 6-Person Households | 12 (1.2%) | 0 (0.0%) |
| 7+ Person Households | 0 (0.0%) | 0 (0.0%) |
| Total | 748 (76.5%) | 230 (23.5%) |
Female Fertility in Salado
Fertility by Age in Salado
Average fertility rate in Salado is 69.0 births per 1,000 women. Women in the age bracket of 15 to 19 years have the highest fertility rate with 345.0 births per 1,000 women. Women in the age bracket of 20 to 34 years acount for 64.3% of all women with births.
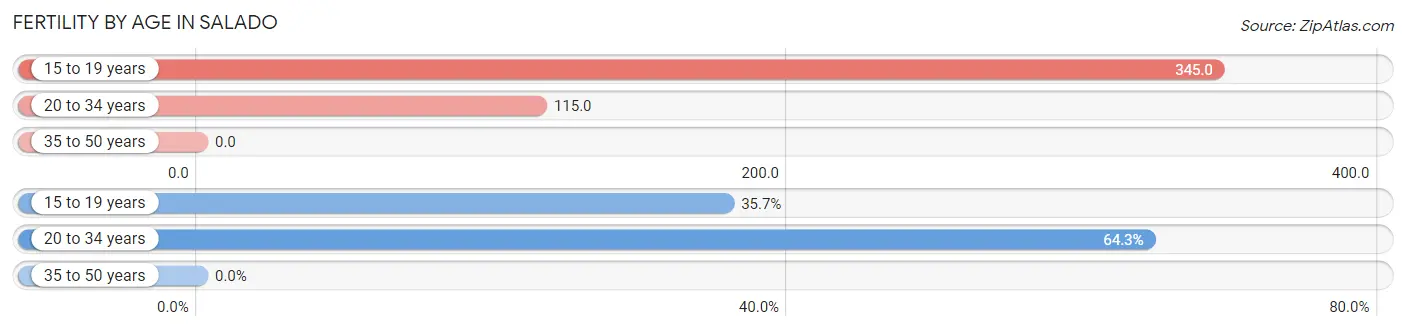
| Age Bracket | Women with Births | Births / 1,000 Women |
| 15 to 19 years | 10 (35.7%) | 345.0 |
| 20 to 34 years | 18 (64.3%) | 115.0 |
| 35 to 50 years | 0 (0.0%) | 0.0 |
| Total | 28 (100.0%) | 69.0 |
Fertility by Age by Marriage Status in Salado
57.1% of women with births (28) in Salado are married. The highest percentage of unmarried women with births falls into 20 to 34 years age bracket with 66.7% of them unmarried at the time of birth, while the lowest percentage of unmarried women with births belong to 15 to 19 years age bracket with 0.0% of them unmarried.
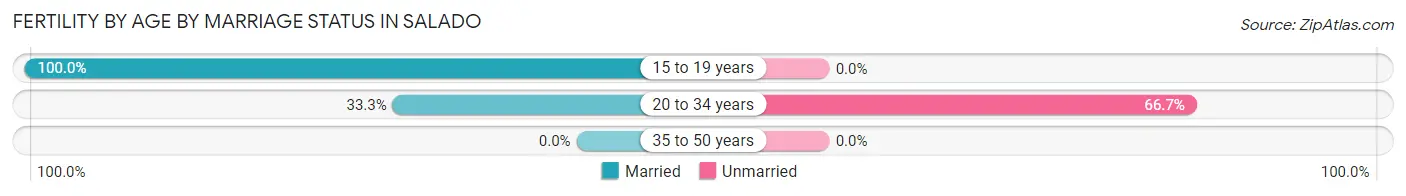
| Age Bracket | Married | Unmarried |
| 15 to 19 years | 10 (100.0%) | 0 (0.0%) |
| 20 to 34 years | 6 (33.3%) | 12 (66.7%) |
| 35 to 50 years | 0 (0.0%) | 0 (0.0%) |
| Total | 16 (57.1%) | 12 (42.9%) |
Fertility by Education in Salado
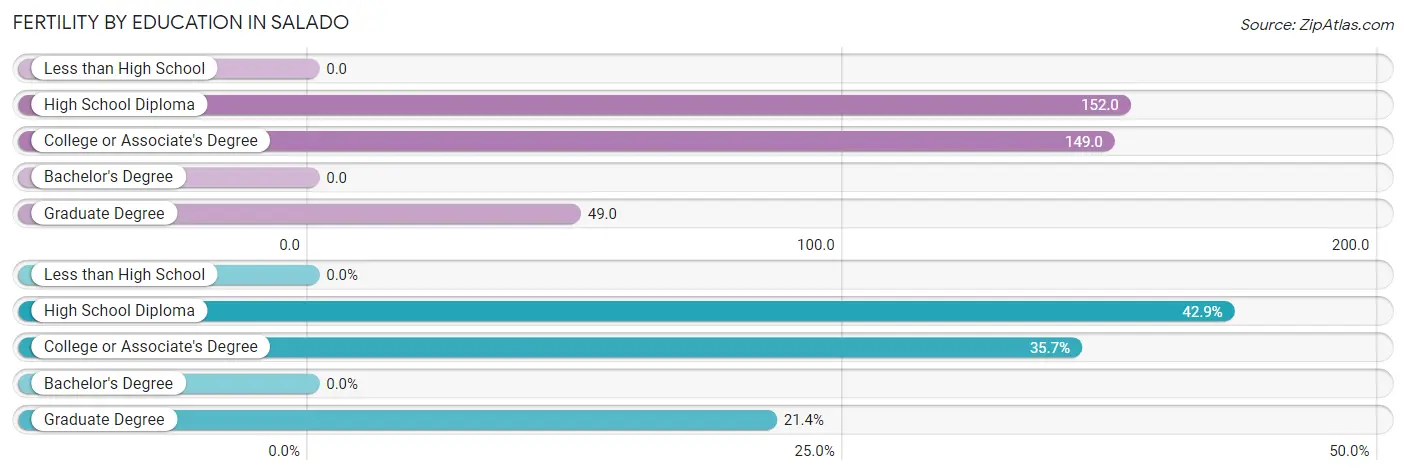
| Educational Attainment | Women with Births | Births / 1,000 Women |
| Less than High School | 0 (0.0%) | 0.0 |
| High School Diploma | 12 (42.9%) | 152.0 |
| College or Associate's Degree | 10 (35.7%) | 149.0 |
| Bachelor's Degree | 0 (0.0%) | 0.0 |
| Graduate Degree | 6 (21.4%) | 49.0 |
| Total | 28 (100.0%) | 69.0 |
Fertility by Education by Marriage Status in Salado
42.9% of women with births in Salado are unmarried. Women with the educational attainment of college or associate's degree are most likely to be married with 100.0% of them married at childbirth, while women with the educational attainment of high school diploma are least likely to be married with 100.0% of them unmarried at childbirth.
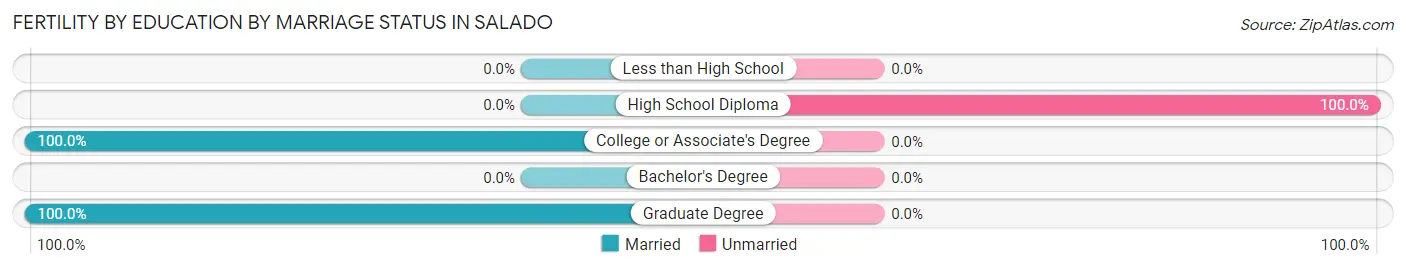
| Educational Attainment | Married | Unmarried |
| Less than High School | 0 (0.0%) | 0 (0.0%) |
| High School Diploma | 0 (0.0%) | 12 (100.0%) |
| College or Associate's Degree | 10 (100.0%) | 0 (0.0%) |
| Bachelor's Degree | 0 (0.0%) | 0 (0.0%) |
| Graduate Degree | 6 (100.0%) | 0 (0.0%) |
| Total | 16 (57.1%) | 12 (42.9%) |
Employment Characteristics in Salado
Employment by Class of Employer in Salado
Among the 1,203 employed individuals in Salado, private company employees (652 | 54.2%), local government employees (195 | 16.2%), and not-for-profit organizations (122 | 10.1%) make up the most common classes of employment.
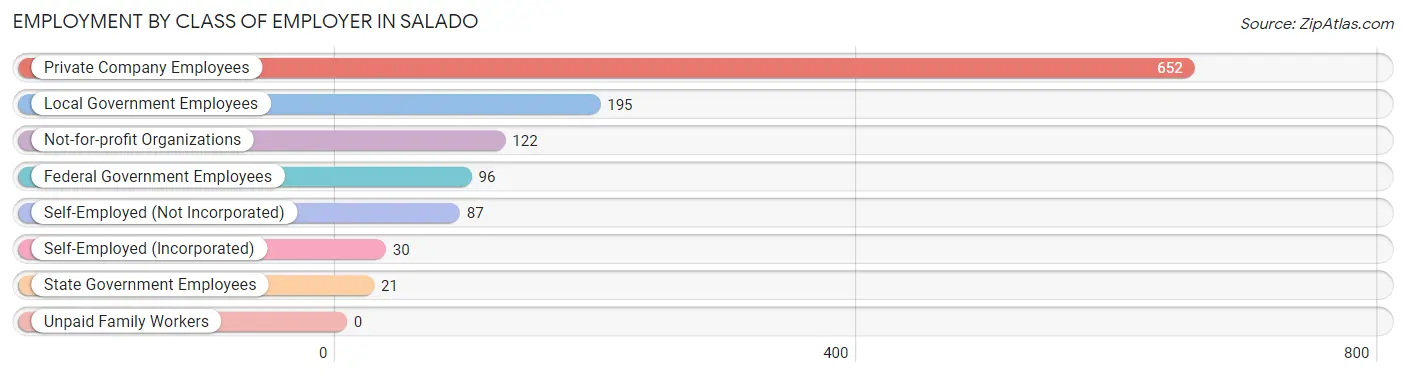
| Employer Class | # Employees | % Employees |
| Private Company Employees | 652 | 54.2% |
| Self-Employed (Incorporated) | 30 | 2.5% |
| Self-Employed (Not Incorporated) | 87 | 7.2% |
| Not-for-profit Organizations | 122 | 10.1% |
| Local Government Employees | 195 | 16.2% |
| State Government Employees | 21 | 1.8% |
| Federal Government Employees | 96 | 8.0% |
| Unpaid Family Workers | 0 | 0.0% |
| Total | 1,203 | 100.0% |
Employment Status by Age in Salado
According to the labor force statistics for Salado, out of the total population over 16 years of age (2,055), 59.6% or 1,225 individuals are in the labor force, with 1.1% or 13 of them unemployed. The age group with the highest labor force participation rate is 45 to 54 years, with 92.1% or 339 individuals in the labor force. Within the labor force, the 25 to 29 years age range has the highest percentage of unemployed individuals, with 3.7% or 4 of them being unemployed.
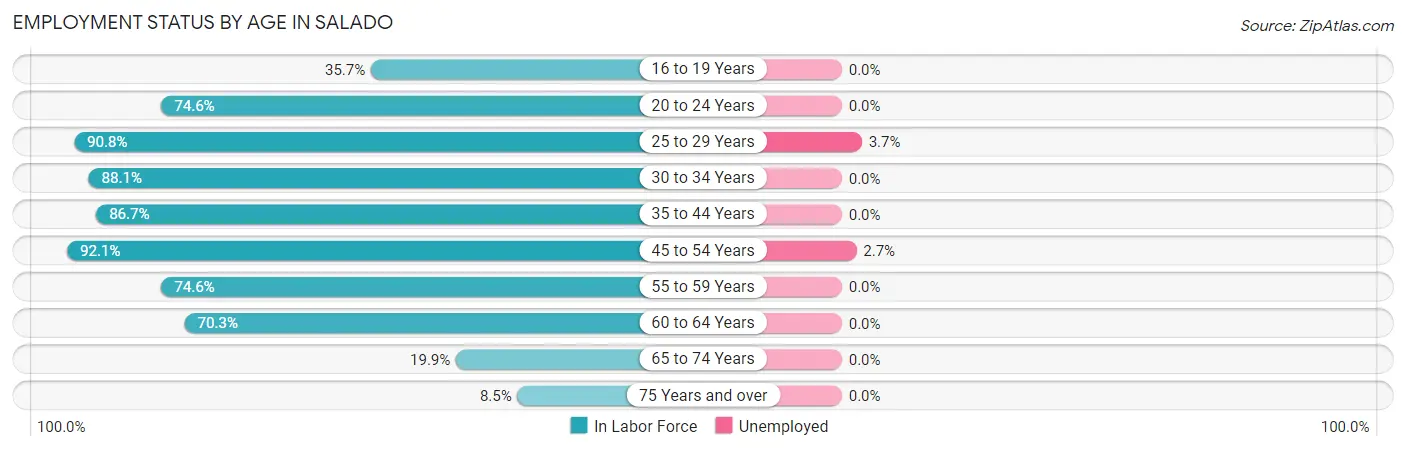
| Age Bracket | In Labor Force | Unemployed |
| 16 to 19 Years | 51 (35.7%) | 0 (0.0%) |
| 20 to 24 Years | 50 (74.6%) | 0 (0.0%) |
| 25 to 29 Years | 109 (90.8%) | 4 (3.7%) |
| 30 to 34 Years | 126 (88.1%) | 0 (0.0%) |
| 35 to 44 Years | 261 (86.7%) | 0 (0.0%) |
| 45 to 54 Years | 339 (92.1%) | 9 (2.7%) |
| 55 to 59 Years | 85 (74.6%) | 0 (0.0%) |
| 60 to 64 Years | 116 (70.3%) | 0 (0.0%) |
| 65 to 74 Years | 58 (19.9%) | 0 (0.0%) |
| 75 Years and over | 29 (8.5%) | 0 (0.0%) |
| Total | 1,225 (59.6%) | 13 (1.1%) |
Employment Status by Educational Attainment in Salado
According to labor force statistics for Salado, 85.5% of individuals (1,035) out of the total population between 25 and 64 years of age (1,211) are in the labor force, with 1.3% or 13 of them being unemployed. The group with the highest labor force participation rate are those with the educational attainment of bachelor's degree or higher, with 92.4% or 620 individuals in the labor force. Within the labor force, individuals with high school diploma education have the highest percentage of unemployment, with 3.4% or 4 of them being unemployed.
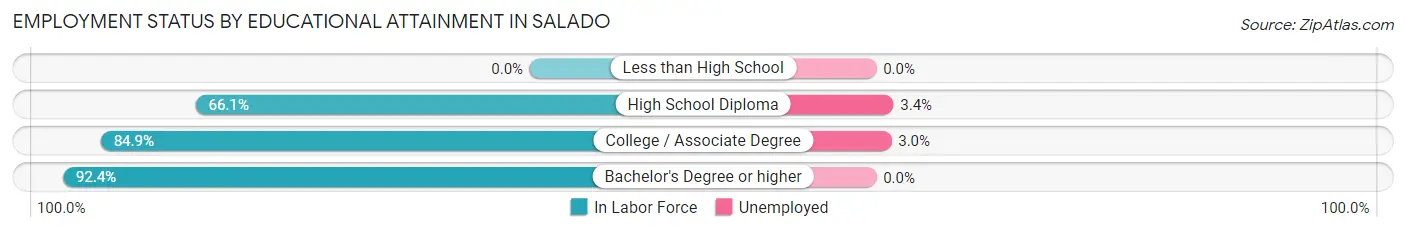
| Educational Attainment | In Labor Force | Unemployed |
| Less than High School | 0 (0.0%) | 0 (0.0%) |
| High School Diploma | 117 (66.1%) | 6 (3.4%) |
| College / Associate Degree | 299 (84.9%) | 11 (3.0%) |
| Bachelor's Degree or higher | 620 (92.4%) | 0 (0.0%) |
| Total | 1,035 (85.5%) | 16 (1.3%) |
Employment Occupations by Sex in Salado
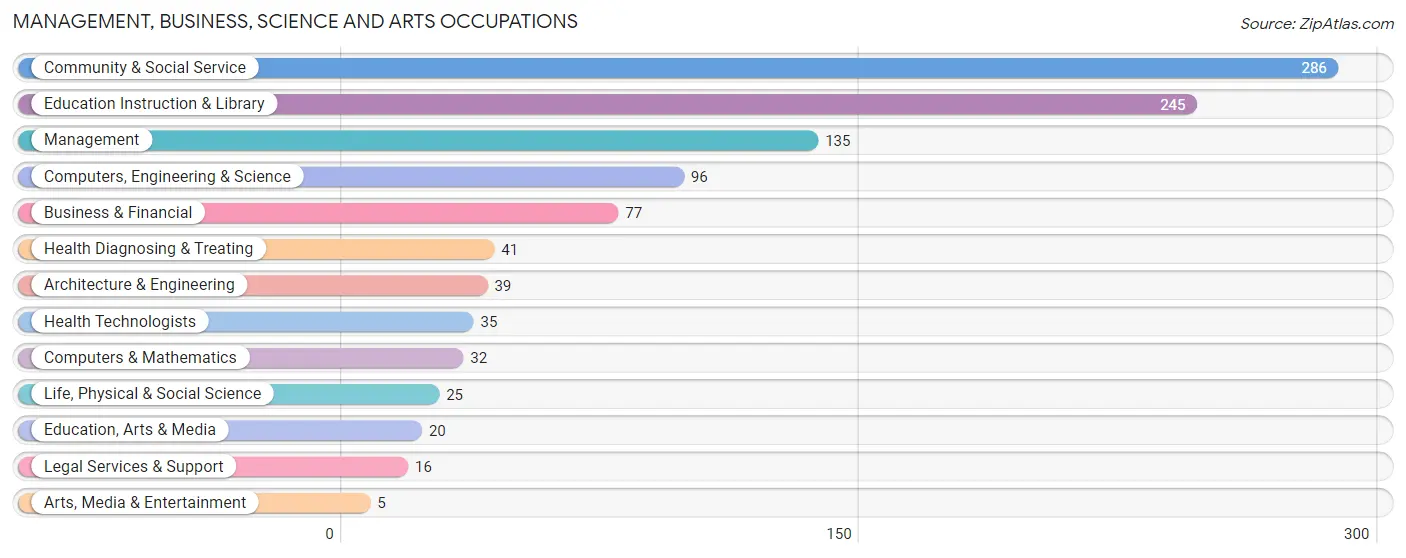
Management, Business, Science and Arts Occupations
The most common Management, Business, Science and Arts occupations in Salado are Community & Social Service (286 | 23.9%), Education Instruction & Library (245 | 20.4%), Management (135 | 11.3%), Computers, Engineering & Science (96 | 8.0%), and Business & Financial (77 | 6.4%).
Management, Business, Science and Arts Occupations by Sex
Within the Management, Business, Science and Arts occupations in Salado, the most male-oriented occupations are Computers & Mathematics (100.0%), Arts, Media & Entertainment (100.0%), and Computers, Engineering & Science (81.2%), while the most female-oriented occupations are Education, Arts & Media (70.0%), Health Technologists (65.7%), and Education Instruction & Library (63.3%).
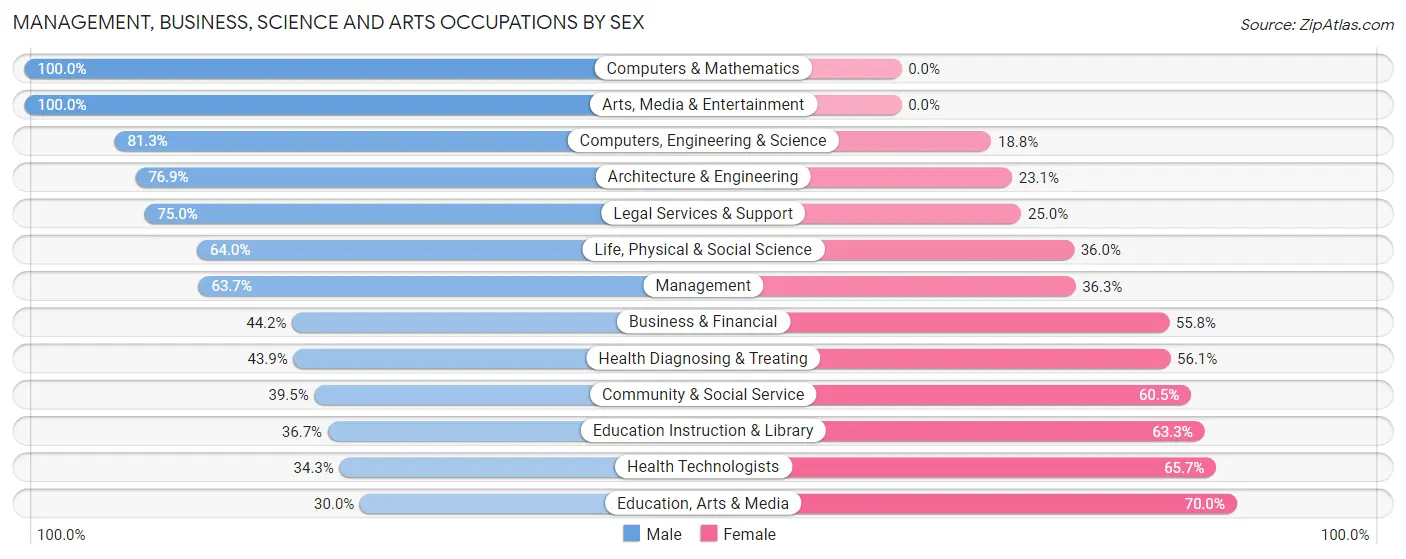
| Occupation | Male | Female |
| Management | 86 (63.7%) | 49 (36.3%) |
| Business & Financial | 34 (44.2%) | 43 (55.8%) |
| Computers, Engineering & Science | 78 (81.2%) | 18 (18.8%) |
| Computers & Mathematics | 32 (100.0%) | 0 (0.0%) |
| Architecture & Engineering | 30 (76.9%) | 9 (23.1%) |
| Life, Physical & Social Science | 16 (64.0%) | 9 (36.0%) |
| Community & Social Service | 113 (39.5%) | 173 (60.5%) |
| Education, Arts & Media | 6 (30.0%) | 14 (70.0%) |
| Legal Services & Support | 12 (75.0%) | 4 (25.0%) |
| Education Instruction & Library | 90 (36.7%) | 155 (63.3%) |
| Arts, Media & Entertainment | 5 (100.0%) | 0 (0.0%) |
| Health Diagnosing & Treating | 18 (43.9%) | 23 (56.1%) |
| Health Technologists | 12 (34.3%) | 23 (65.7%) |
| Total (Category) | 329 (51.8%) | 306 (48.2%) |
| Total (Overall) | 710 (59.3%) | 488 (40.7%) |
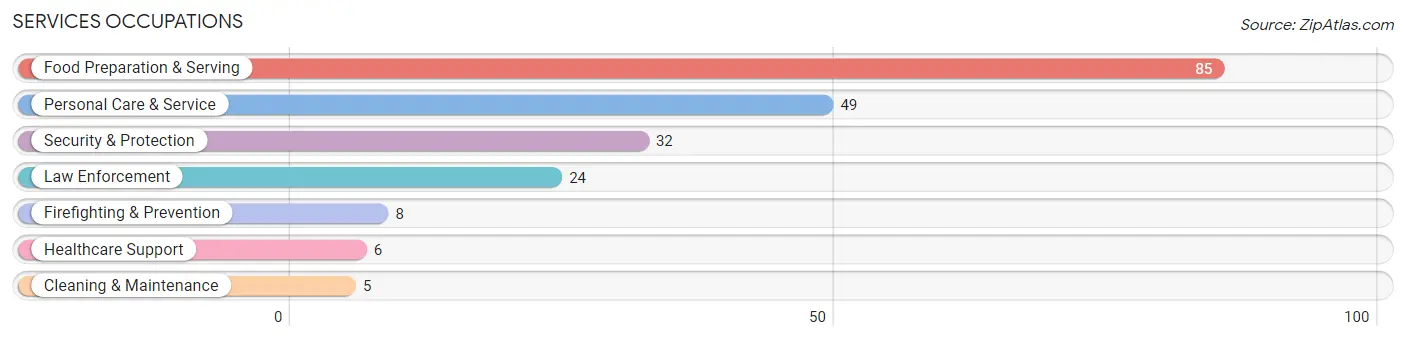
Services Occupations
The most common Services occupations in Salado are Food Preparation & Serving (85 | 7.1%), Personal Care & Service (49 | 4.1%), Security & Protection (32 | 2.7%), Law Enforcement (24 | 2.0%), and Firefighting & Prevention (8 | 0.7%).
Services Occupations by Sex
Within the Services occupations in Salado, the most male-oriented occupations are Security & Protection (100.0%), Firefighting & Prevention (100.0%), and Law Enforcement (100.0%), while the most female-oriented occupations are Healthcare Support (100.0%), Personal Care & Service (91.8%), and Food Preparation & Serving (24.7%).
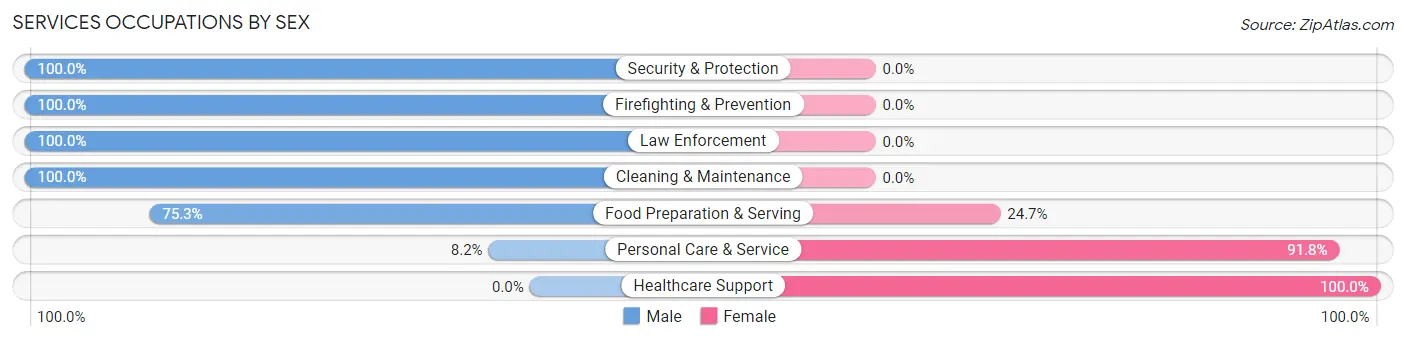
| Occupation | Male | Female |
| Healthcare Support | 0 (0.0%) | 6 (100.0%) |
| Security & Protection | 32 (100.0%) | 0 (0.0%) |
| Firefighting & Prevention | 8 (100.0%) | 0 (0.0%) |
| Law Enforcement | 24 (100.0%) | 0 (0.0%) |
| Food Preparation & Serving | 64 (75.3%) | 21 (24.7%) |
| Cleaning & Maintenance | 5 (100.0%) | 0 (0.0%) |
| Personal Care & Service | 4 (8.2%) | 45 (91.8%) |
| Total (Category) | 105 (59.3%) | 72 (40.7%) |
| Total (Overall) | 710 (59.3%) | 488 (40.7%) |
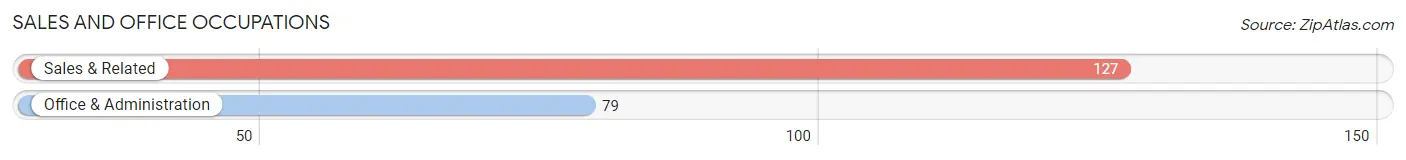
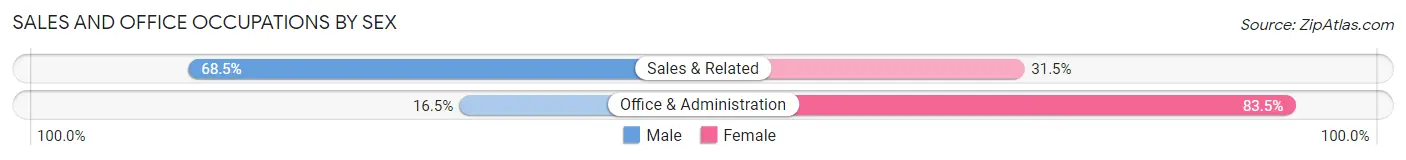
Sales and Office Occupations
The most common Sales and Office occupations in Salado are Sales & Related (127 | 10.6%), and Office & Administration (79 | 6.6%).
Sales and Office Occupations by Sex
| Occupation | Male | Female |
| Sales & Related | 87 (68.5%) | 40 (31.5%) |
| Office & Administration | 13 (16.5%) | 66 (83.5%) |
| Total (Category) | 100 (48.5%) | 106 (51.5%) |
| Total (Overall) | 710 (59.3%) | 488 (40.7%) |
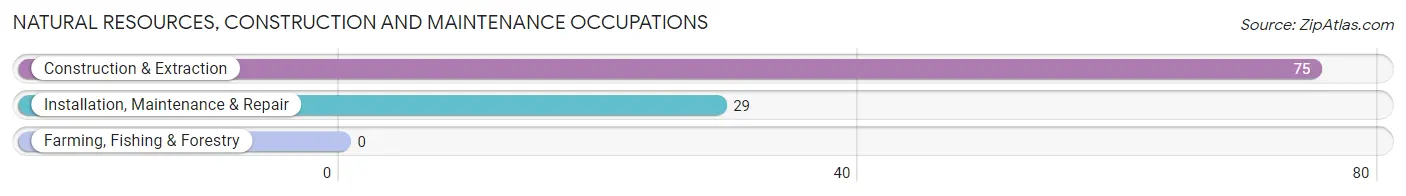
Natural Resources, Construction and Maintenance Occupations
The most common Natural Resources, Construction and Maintenance occupations in Salado are Construction & Extraction (75 | 6.3%), and Installation, Maintenance & Repair (29 | 2.4%).
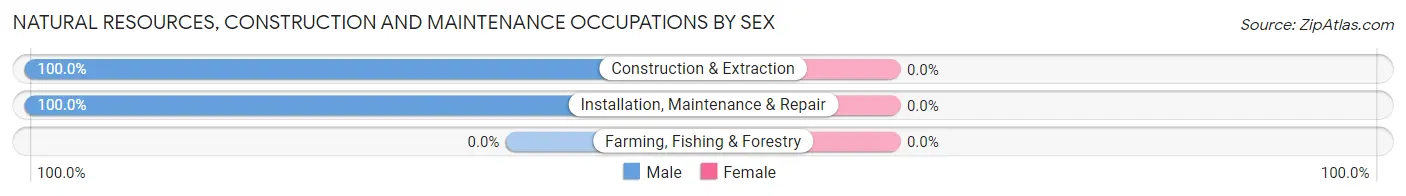
Natural Resources, Construction and Maintenance Occupations by Sex
| Occupation | Male | Female |
| Farming, Fishing & Forestry | 0 (0.0%) | 0 (0.0%) |
| Construction & Extraction | 75 (100.0%) | 0 (0.0%) |
| Installation, Maintenance & Repair | 29 (100.0%) | 0 (0.0%) |
| Total (Category) | 104 (100.0%) | 0 (0.0%) |
| Total (Overall) | 710 (59.3%) | 488 (40.7%) |
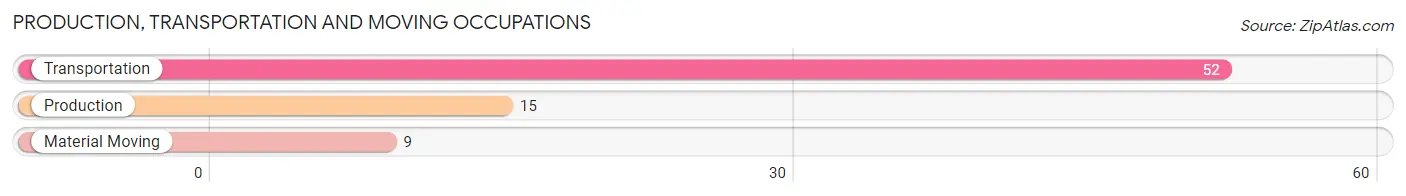
Production, Transportation and Moving Occupations
The most common Production, Transportation and Moving occupations in Salado are Transportation (52 | 4.3%), Production (15 | 1.3%), and Material Moving (9 | 0.7%).
Production, Transportation and Moving Occupations by Sex
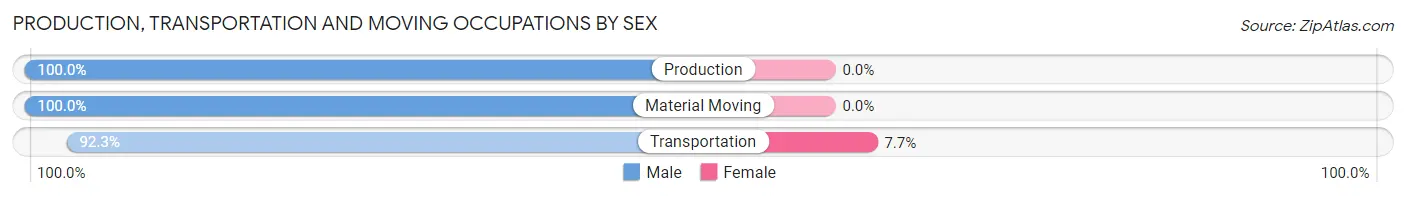
| Occupation | Male | Female |
| Production | 15 (100.0%) | 0 (0.0%) |
| Transportation | 48 (92.3%) | 4 (7.7%) |
| Material Moving | 9 (100.0%) | 0 (0.0%) |
| Total (Category) | 72 (94.7%) | 4 (5.3%) |
| Total (Overall) | 710 (59.3%) | 488 (40.7%) |
Employment Industries by Sex in Salado
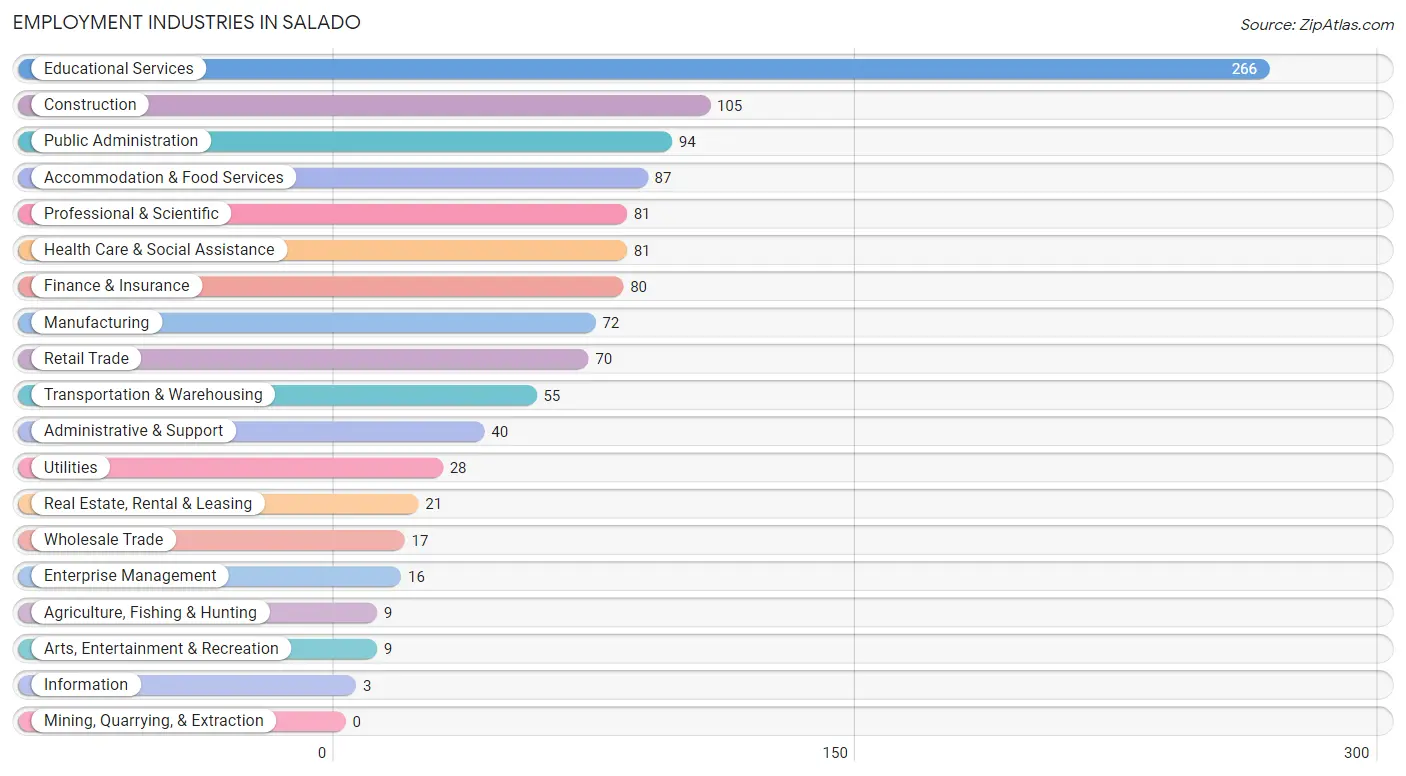
Employment Industries in Salado
The major employment industries in Salado include Educational Services (266 | 22.2%), Construction (105 | 8.8%), Public Administration (94 | 7.9%), Accommodation & Food Services (87 | 7.3%), and Professional & Scientific (81 | 6.8%).
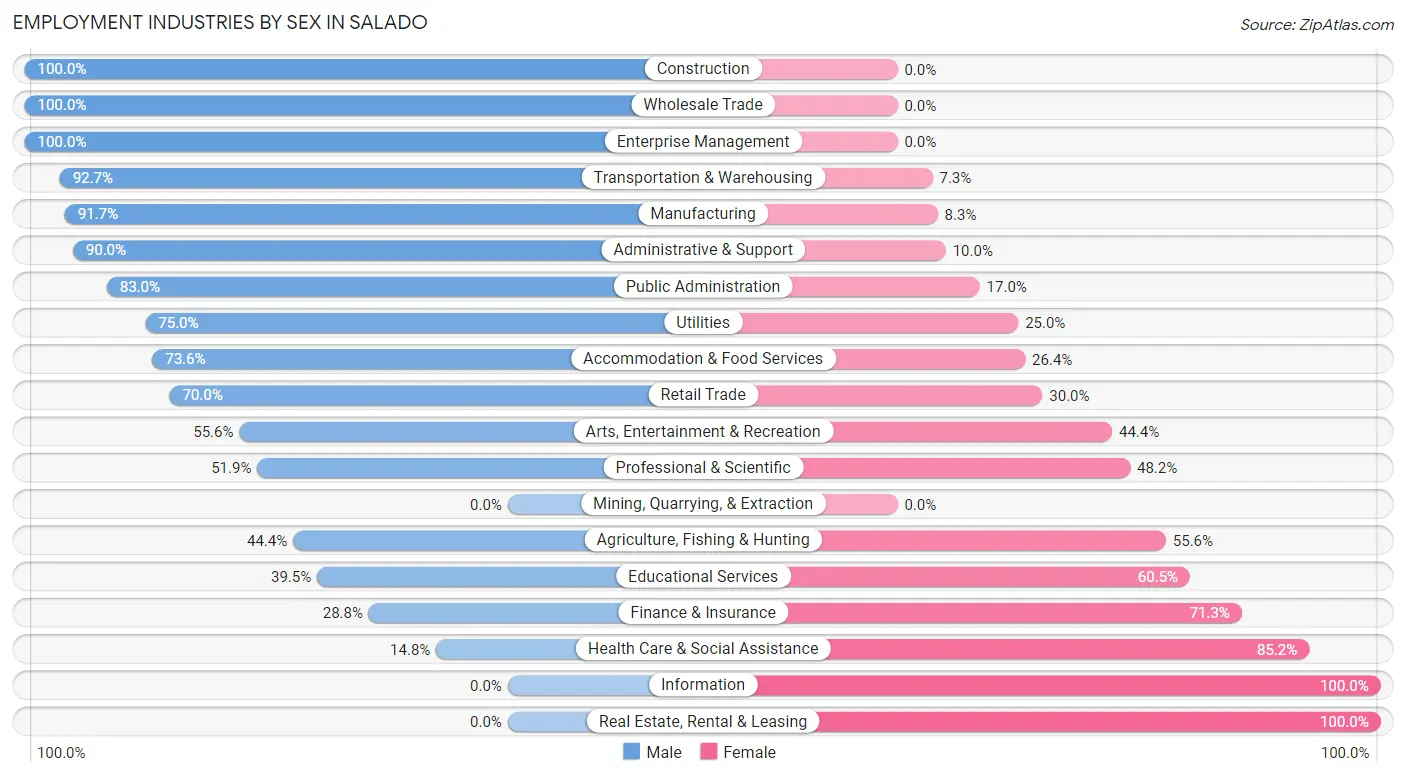
Employment Industries by Sex in Salado
The Salado industries that see more men than women are Construction (100.0%), Wholesale Trade (100.0%), and Enterprise Management (100.0%), whereas the industries that tend to have a higher number of women are Information (100.0%), Real Estate, Rental & Leasing (100.0%), and Health Care & Social Assistance (85.2%).
| Industry | Male | Female |
| Agriculture, Fishing & Hunting | 4 (44.4%) | 5 (55.6%) |
| Mining, Quarrying, & Extraction | 0 (0.0%) | 0 (0.0%) |
| Construction | 105 (100.0%) | 0 (0.0%) |
| Manufacturing | 66 (91.7%) | 6 (8.3%) |
| Wholesale Trade | 17 (100.0%) | 0 (0.0%) |
| Retail Trade | 49 (70.0%) | 21 (30.0%) |
| Transportation & Warehousing | 51 (92.7%) | 4 (7.3%) |
| Utilities | 21 (75.0%) | 7 (25.0%) |
| Information | 0 (0.0%) | 3 (100.0%) |
| Finance & Insurance | 23 (28.7%) | 57 (71.3%) |
| Real Estate, Rental & Leasing | 0 (0.0%) | 21 (100.0%) |
| Professional & Scientific | 42 (51.8%) | 39 (48.1%) |
| Enterprise Management | 16 (100.0%) | 0 (0.0%) |
| Administrative & Support | 36 (90.0%) | 4 (10.0%) |
| Educational Services | 105 (39.5%) | 161 (60.5%) |
| Health Care & Social Assistance | 12 (14.8%) | 69 (85.2%) |
| Arts, Entertainment & Recreation | 5 (55.6%) | 4 (44.4%) |
| Accommodation & Food Services | 64 (73.6%) | 23 (26.4%) |
| Public Administration | 78 (83.0%) | 16 (17.0%) |
| Total | 710 (59.3%) | 488 (40.7%) |
Education in Salado
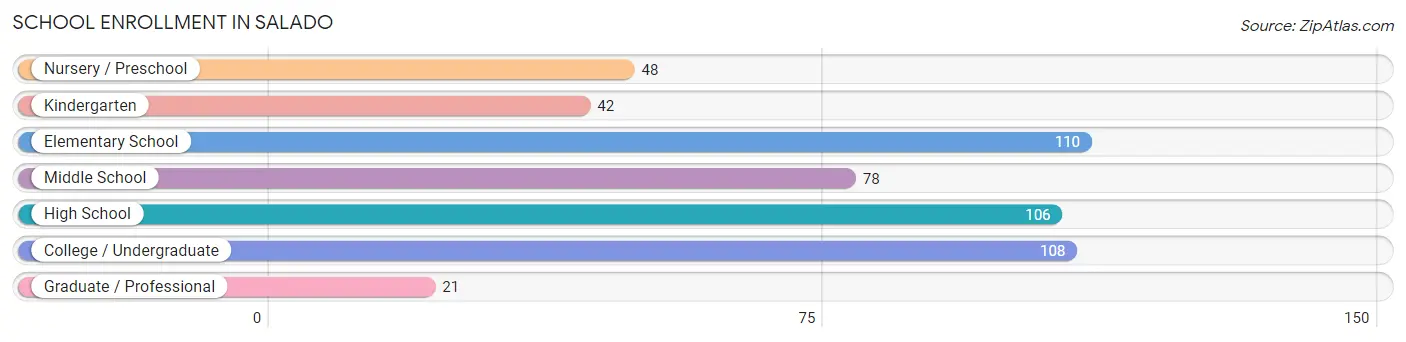
School Enrollment in Salado
The most common levels of schooling among the 513 students in Salado are elementary school (110 | 21.4%), college / undergraduate (108 | 21.0%), and high school (106 | 20.7%).
| School Level | # Students | % Students |
| Nursery / Preschool | 48 | 9.4% |
| Kindergarten | 42 | 8.2% |
| Elementary School | 110 | 21.4% |
| Middle School | 78 | 15.2% |
| High School | 106 | 20.7% |
| College / Undergraduate | 108 | 21.0% |
| Graduate / Professional | 21 | 4.1% |
| Total | 513 | 100.0% |
School Enrollment by Age by Funding Source in Salado
Out of a total of 513 students who are enrolled in schools in Salado, 62 (12.1%) attend a private institution, while the remaining 451 (87.9%) are enrolled in public schools. The age group of 35 years and over has the highest likelihood of being enrolled in private schools, with 10 (66.7% in the age bracket) enrolled. Conversely, the age group of 10 to 14 year olds has the lowest likelihood of being enrolled in a private school, with 87 (100.0% in the age bracket) attending a public institution.
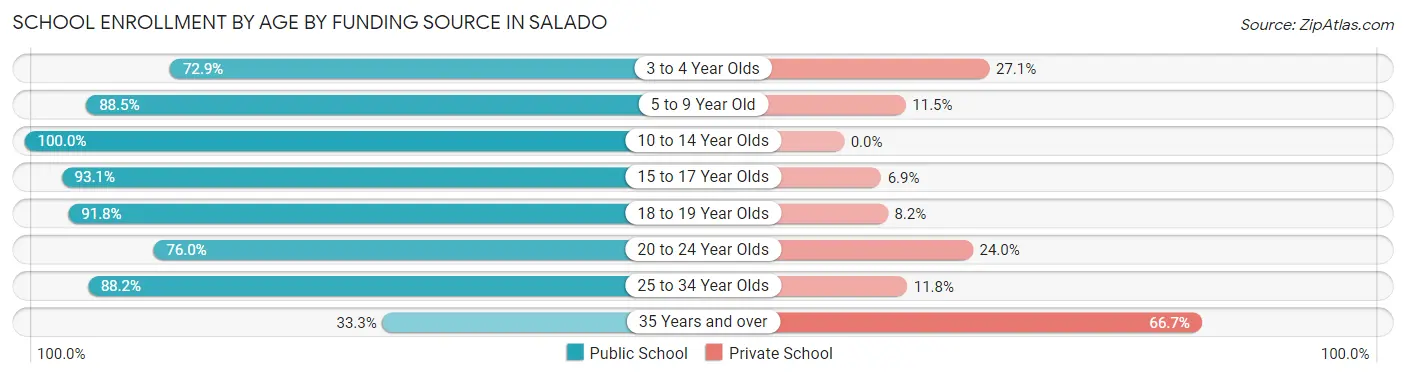
| Age Bracket | Public School | Private School |
| 3 to 4 Year Olds | 35 (72.9%) | 13 (27.1%) |
| 5 to 9 Year Old | 131 (88.5%) | 17 (11.5%) |
| 10 to 14 Year Olds | 87 (100.0%) | 0 (0.0%) |
| 15 to 17 Year Olds | 54 (93.1%) | 4 (6.9%) |
| 18 to 19 Year Olds | 90 (91.8%) | 8 (8.2%) |
| 20 to 24 Year Olds | 19 (76.0%) | 6 (24.0%) |
| 25 to 34 Year Olds | 30 (88.2%) | 4 (11.8%) |
| 35 Years and over | 5 (33.3%) | 10 (66.7%) |
| Total | 451 (87.9%) | 62 (12.1%) |
Educational Attainment by Field of Study in Salado
Education (268 | 24.1%), business (151 | 13.6%), science & technology (101 | 9.1%), arts & humanities (96 | 8.6%), and literature & languages (87 | 7.8%) are the most common fields of study among 1,110 individuals in Salado who have obtained a bachelor's degree or higher.
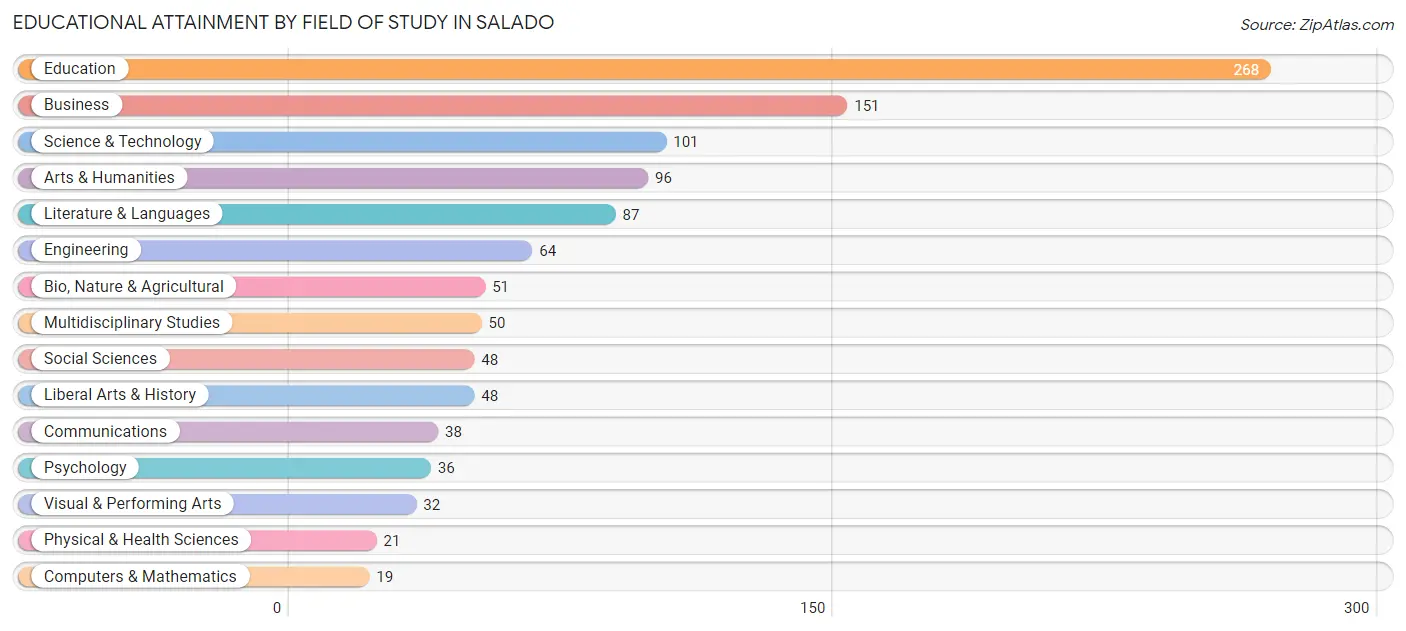
| Field of Study | # Graduates | % Graduates |
| Computers & Mathematics | 19 | 1.7% |
| Bio, Nature & Agricultural | 51 | 4.6% |
| Physical & Health Sciences | 21 | 1.9% |
| Psychology | 36 | 3.2% |
| Social Sciences | 48 | 4.3% |
| Engineering | 64 | 5.8% |
| Multidisciplinary Studies | 50 | 4.5% |
| Science & Technology | 101 | 9.1% |
| Business | 151 | 13.6% |
| Education | 268 | 24.1% |
| Literature & Languages | 87 | 7.8% |
| Liberal Arts & History | 48 | 4.3% |
| Visual & Performing Arts | 32 | 2.9% |
| Communications | 38 | 3.4% |
| Arts & Humanities | 96 | 8.6% |
| Total | 1,110 | 100.0% |
Transportation & Commute in Salado
Vehicle Availability by Sex in Salado
The most prevalent vehicle ownership categories in Salado are males with 2 vehicles (374, accounting for 53.0%) and females with 2 vehicles (222, making up 75.2%).
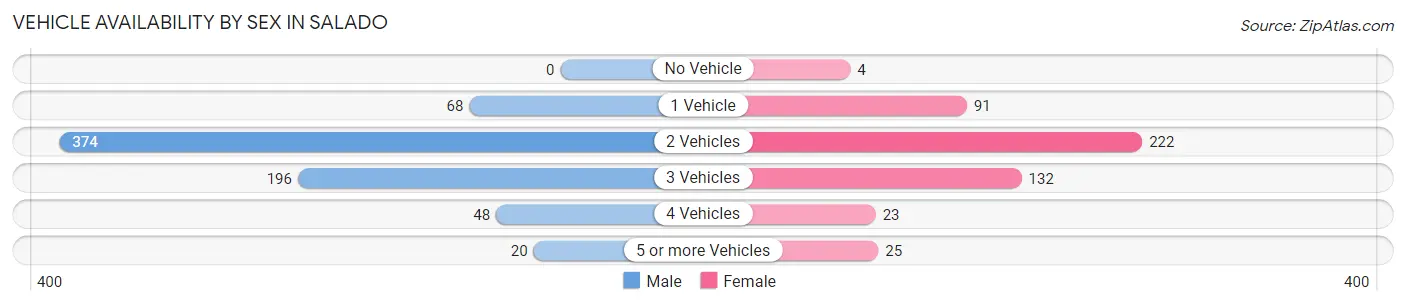
| Vehicles Available | Male | Female |
| No Vehicle | 0 (0.0%) | 4 (0.8%) |
| 1 Vehicle | 68 (9.6%) | 91 (18.3%) |
| 2 Vehicles | 374 (53.0%) | 222 (44.7%) |
| 3 Vehicles | 196 (27.8%) | 132 (26.6%) |
| 4 Vehicles | 48 (6.8%) | 23 (4.6%) |
| 5 or more Vehicles | 20 (2.8%) | 25 (5.0%) |
| Total | 706 (100.0%) | 497 (100.0%) |
Commute Time in Salado
The most frequently occuring commute durations in Salado are 5 to 9 minutes (298 commuters, 28.1%), 20 to 24 minutes (125 commuters, 11.8%), and 30 to 34 minutes (125 commuters, 11.8%).
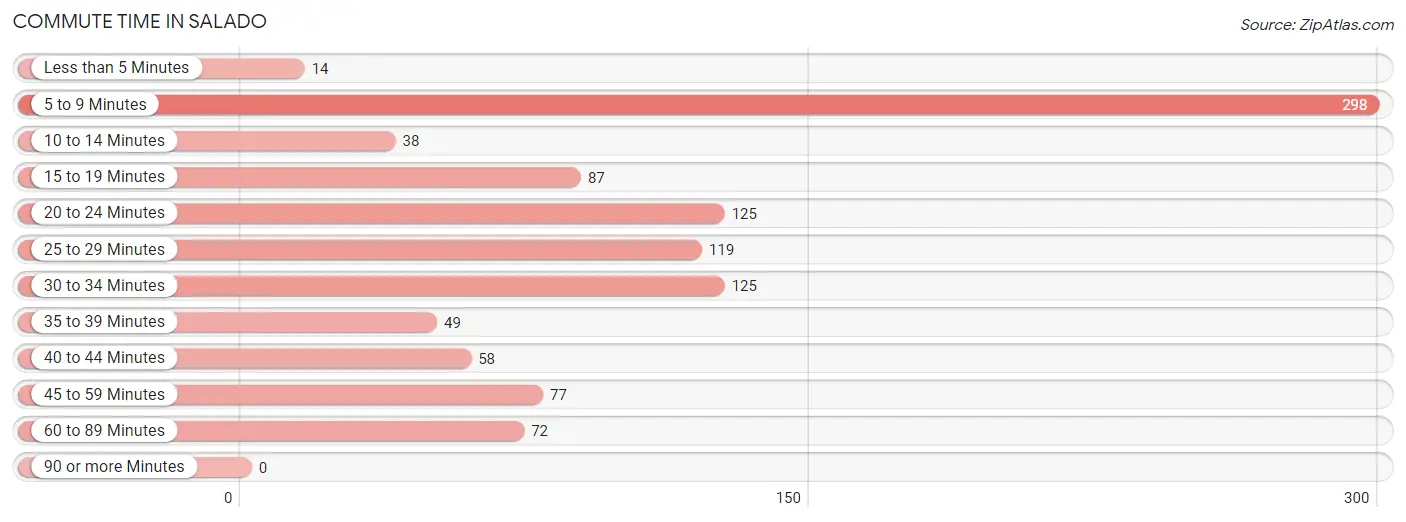
| Commute Time | # Commuters | % Commuters |
| Less than 5 Minutes | 14 | 1.3% |
| 5 to 9 Minutes | 298 | 28.1% |
| 10 to 14 Minutes | 38 | 3.6% |
| 15 to 19 Minutes | 87 | 8.2% |
| 20 to 24 Minutes | 125 | 11.8% |
| 25 to 29 Minutes | 119 | 11.2% |
| 30 to 34 Minutes | 125 | 11.8% |
| 35 to 39 Minutes | 49 | 4.6% |
| 40 to 44 Minutes | 58 | 5.5% |
| 45 to 59 Minutes | 77 | 7.2% |
| 60 to 89 Minutes | 72 | 6.8% |
| 90 or more Minutes | 0 | 0.0% |
Commute Time by Sex in Salado
The most common commute times in Salado are 5 to 9 minutes (156 commuters, 25.6%) for males and 5 to 9 minutes (142 commuters, 31.4%) for females.
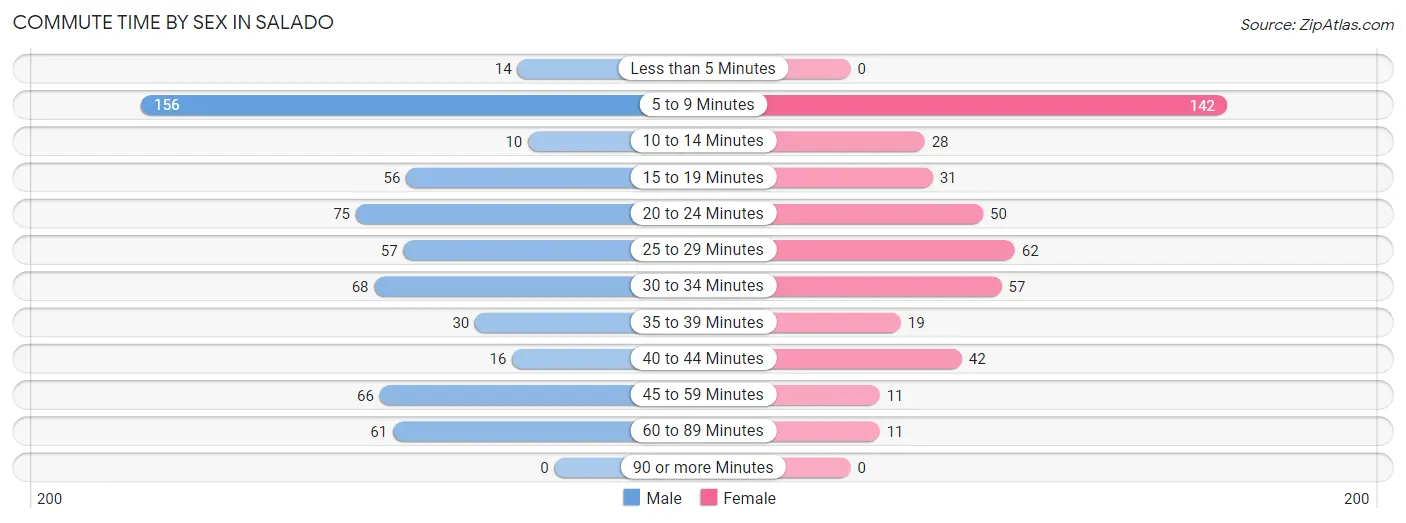
| Commute Time | Male | Female |
| Less than 5 Minutes | 14 (2.3%) | 0 (0.0%) |
| 5 to 9 Minutes | 156 (25.6%) | 142 (31.4%) |
| 10 to 14 Minutes | 10 (1.6%) | 28 (6.2%) |
| 15 to 19 Minutes | 56 (9.2%) | 31 (6.8%) |
| 20 to 24 Minutes | 75 (12.3%) | 50 (11.0%) |
| 25 to 29 Minutes | 57 (9.4%) | 62 (13.7%) |
| 30 to 34 Minutes | 68 (11.2%) | 57 (12.6%) |
| 35 to 39 Minutes | 30 (4.9%) | 19 (4.2%) |
| 40 to 44 Minutes | 16 (2.6%) | 42 (9.3%) |
| 45 to 59 Minutes | 66 (10.8%) | 11 (2.4%) |
| 60 to 89 Minutes | 61 (10.0%) | 11 (2.4%) |
| 90 or more Minutes | 0 (0.0%) | 0 (0.0%) |
Time of Departure to Work by Sex in Salado
The most frequent times of departure to work in Salado are 7:00 AM to 7:29 AM (143, 23.5%) for males and 7:00 AM to 7:29 AM (111, 24.5%) for females.
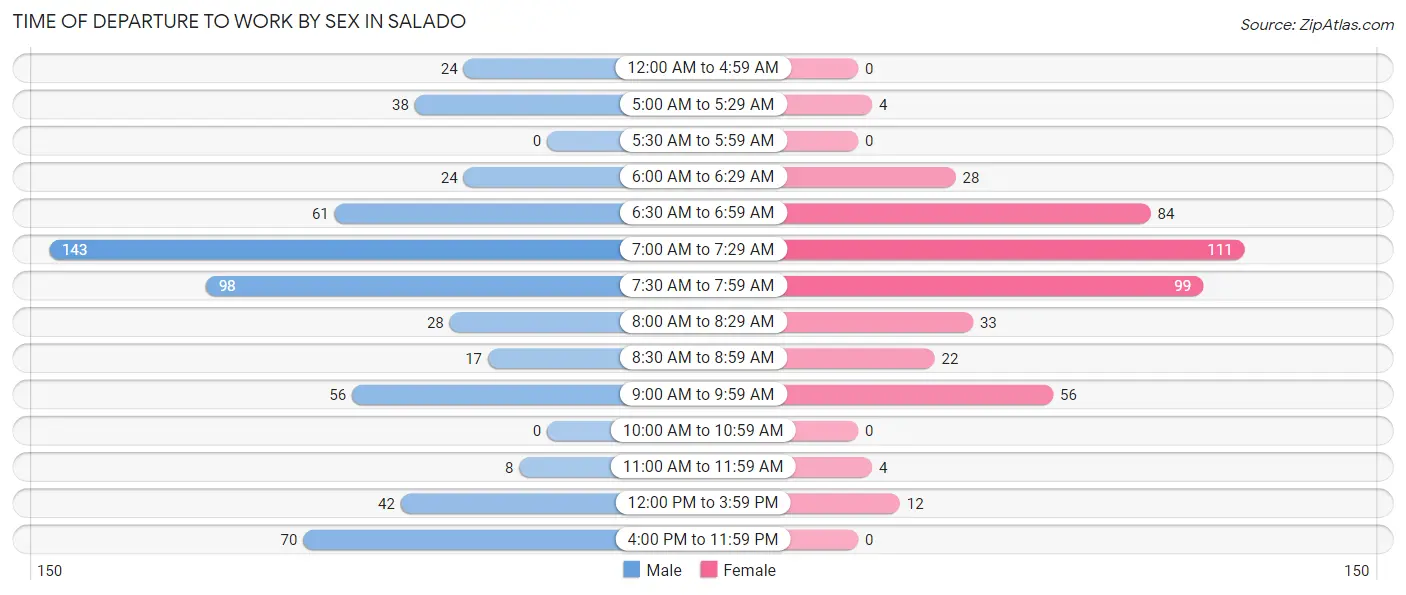
| Time of Departure | Male | Female |
| 12:00 AM to 4:59 AM | 24 (3.9%) | 0 (0.0%) |
| 5:00 AM to 5:29 AM | 38 (6.2%) | 4 (0.9%) |
| 5:30 AM to 5:59 AM | 0 (0.0%) | 0 (0.0%) |
| 6:00 AM to 6:29 AM | 24 (3.9%) | 28 (6.2%) |
| 6:30 AM to 6:59 AM | 61 (10.0%) | 84 (18.5%) |
| 7:00 AM to 7:29 AM | 143 (23.5%) | 111 (24.5%) |
| 7:30 AM to 7:59 AM | 98 (16.1%) | 99 (21.8%) |
| 8:00 AM to 8:29 AM | 28 (4.6%) | 33 (7.3%) |
| 8:30 AM to 8:59 AM | 17 (2.8%) | 22 (4.9%) |
| 9:00 AM to 9:59 AM | 56 (9.2%) | 56 (12.4%) |
| 10:00 AM to 10:59 AM | 0 (0.0%) | 0 (0.0%) |
| 11:00 AM to 11:59 AM | 8 (1.3%) | 4 (0.9%) |
| 12:00 PM to 3:59 PM | 42 (6.9%) | 12 (2.6%) |
| 4:00 PM to 11:59 PM | 70 (11.5%) | 0 (0.0%) |
| Total | 609 (100.0%) | 453 (100.0%) |
Housing Occupancy in Salado
Occupancy by Ownership in Salado
Of the total 978 dwellings in Salado, owner-occupied units account for 809 (82.7%), while renter-occupied units make up 169 (17.3%).
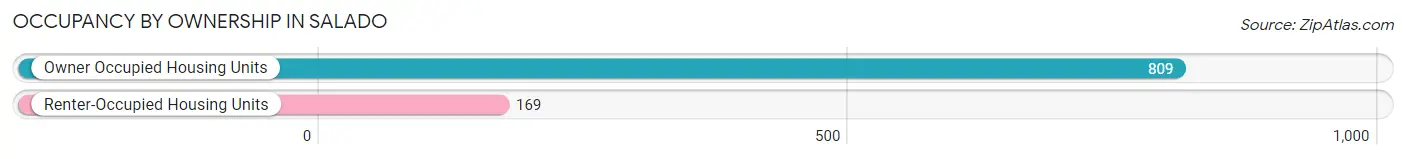
| Occupancy | # Housing Units | % Housing Units |
| Owner Occupied Housing Units | 809 | 82.7% |
| Renter-Occupied Housing Units | 169 | 17.3% |
| Total Occupied Housing Units | 978 | 100.0% |
Occupancy by Household Size in Salado
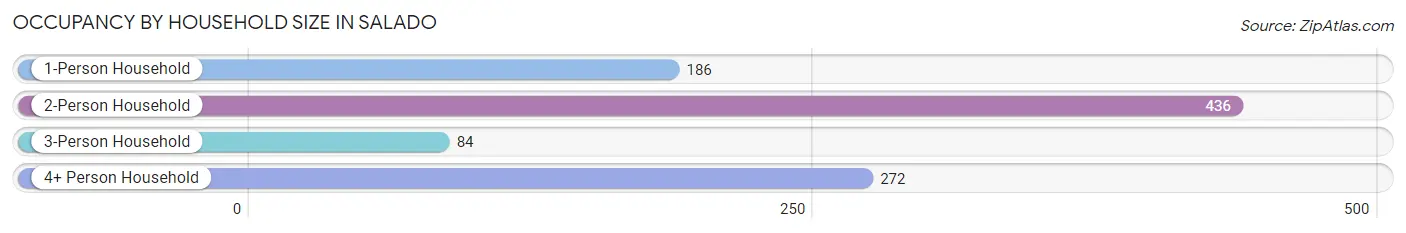
| Household Size | # Housing Units | % Housing Units |
| 1-Person Household | 186 | 19.0% |
| 2-Person Household | 436 | 44.6% |
| 3-Person Household | 84 | 8.6% |
| 4+ Person Household | 272 | 27.8% |
| Total Housing Units | 978 | 100.0% |
Occupancy by Ownership by Household Size in Salado
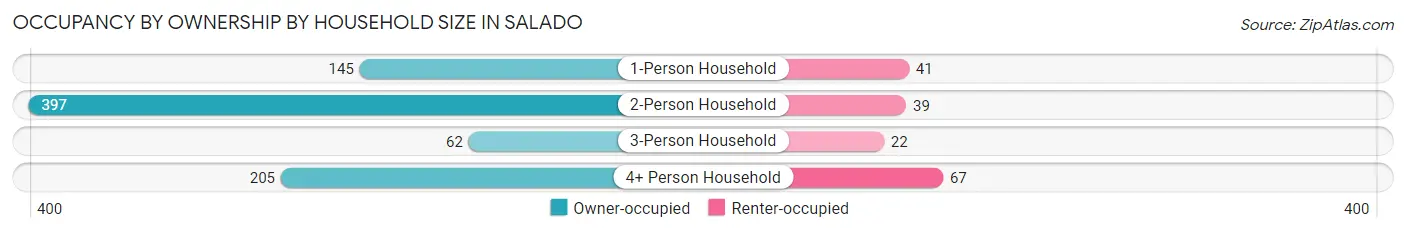
| Household Size | Owner-occupied | Renter-occupied |
| 1-Person Household | 145 (78.0%) | 41 (22.0%) |
| 2-Person Household | 397 (91.1%) | 39 (8.9%) |
| 3-Person Household | 62 (73.8%) | 22 (26.2%) |
| 4+ Person Household | 205 (75.4%) | 67 (24.6%) |
| Total Housing Units | 809 (82.7%) | 169 (17.3%) |
Occupancy by Educational Attainment in Salado
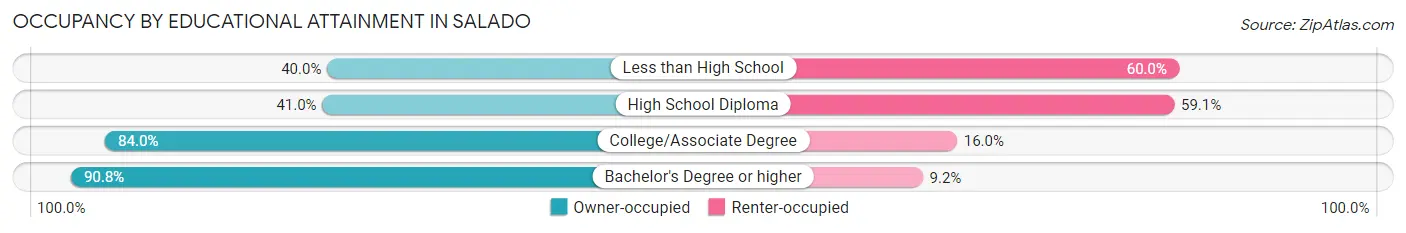
| Household Size | Owner-occupied | Renter-occupied |
| Less than High School | 8 (40.0%) | 12 (60.0%) |
| High School Diploma | 43 (40.9%) | 62 (59.1%) |
| College/Associate Degree | 205 (84.0%) | 39 (16.0%) |
| Bachelor's Degree or higher | 553 (90.8%) | 56 (9.2%) |
Occupancy by Age of Householder in Salado
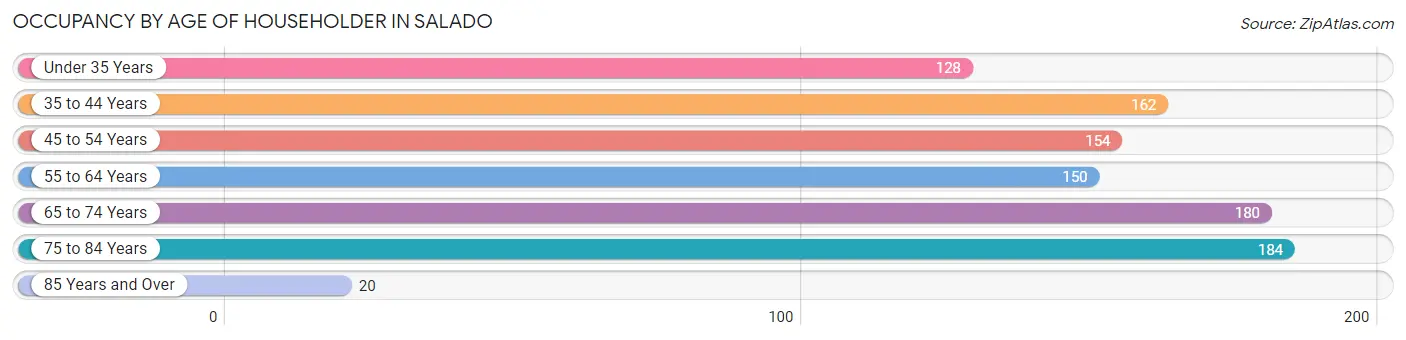
| Age Bracket | # Households | % Households |
| Under 35 Years | 128 | 13.1% |
| 35 to 44 Years | 162 | 16.6% |
| 45 to 54 Years | 154 | 15.8% |
| 55 to 64 Years | 150 | 15.3% |
| 65 to 74 Years | 180 | 18.4% |
| 75 to 84 Years | 184 | 18.8% |
| 85 Years and Over | 20 | 2.0% |
| Total | 978 | 100.0% |
Housing Finances in Salado
Median Income by Occupancy in Salado
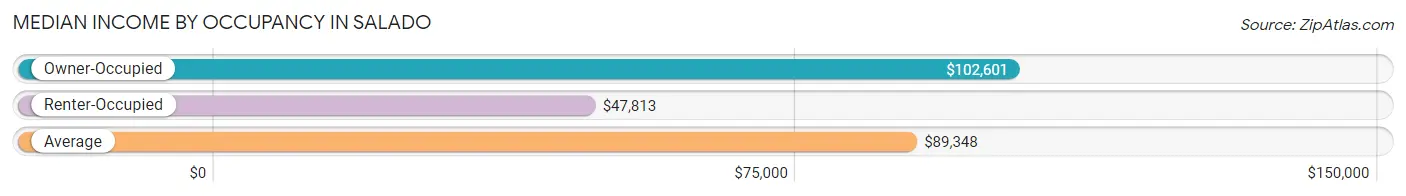
| Occupancy Type | # Households | Median Income |
| Owner-Occupied | 809 (82.7%) | $102,601 |
| Renter-Occupied | 169 (17.3%) | $47,813 |
| Average | 978 (100.0%) | $89,348 |
Occupancy by Householder Income Bracket in Salado
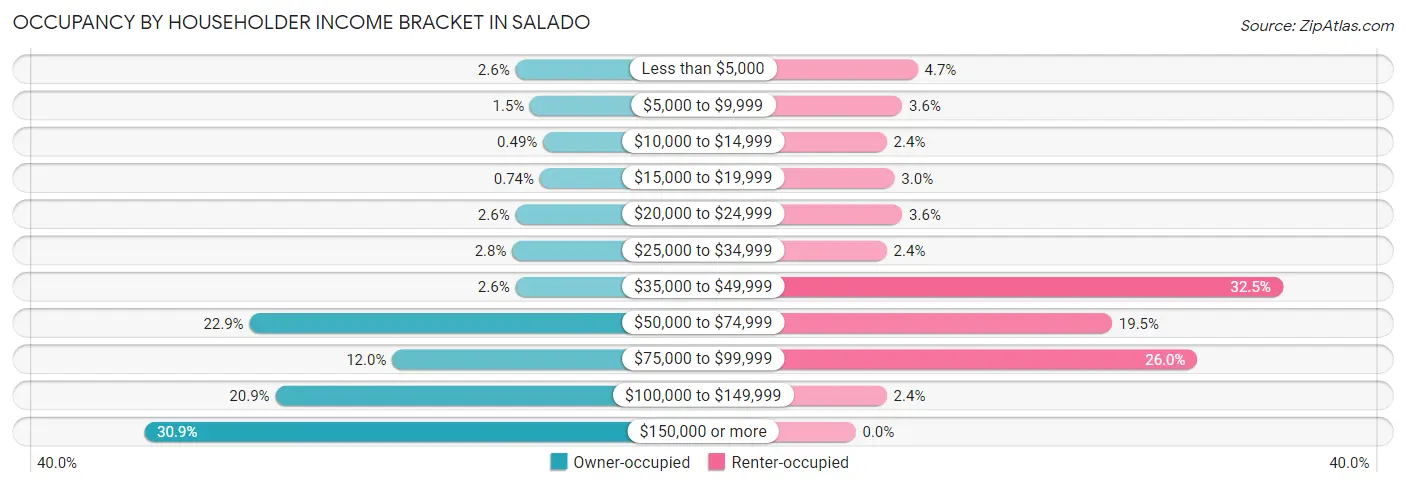
| Income Bracket | Owner-occupied | Renter-occupied |
| Less than $5,000 | 21 (2.6%) | 8 (4.7%) |
| $5,000 to $9,999 | 12 (1.5%) | 6 (3.5%) |
| $10,000 to $14,999 | 4 (0.5%) | 4 (2.4%) |
| $15,000 to $19,999 | 6 (0.7%) | 5 (3.0%) |
| $20,000 to $24,999 | 21 (2.6%) | 6 (3.5%) |
| $25,000 to $34,999 | 23 (2.8%) | 4 (2.4%) |
| $35,000 to $49,999 | 21 (2.6%) | 55 (32.5%) |
| $50,000 to $74,999 | 185 (22.9%) | 33 (19.5%) |
| $75,000 to $99,999 | 97 (12.0%) | 44 (26.0%) |
| $100,000 to $149,999 | 169 (20.9%) | 4 (2.4%) |
| $150,000 or more | 250 (30.9%) | 0 (0.0%) |
| Total | 809 (100.0%) | 169 (100.0%) |
Monthly Housing Cost Tiers in Salado
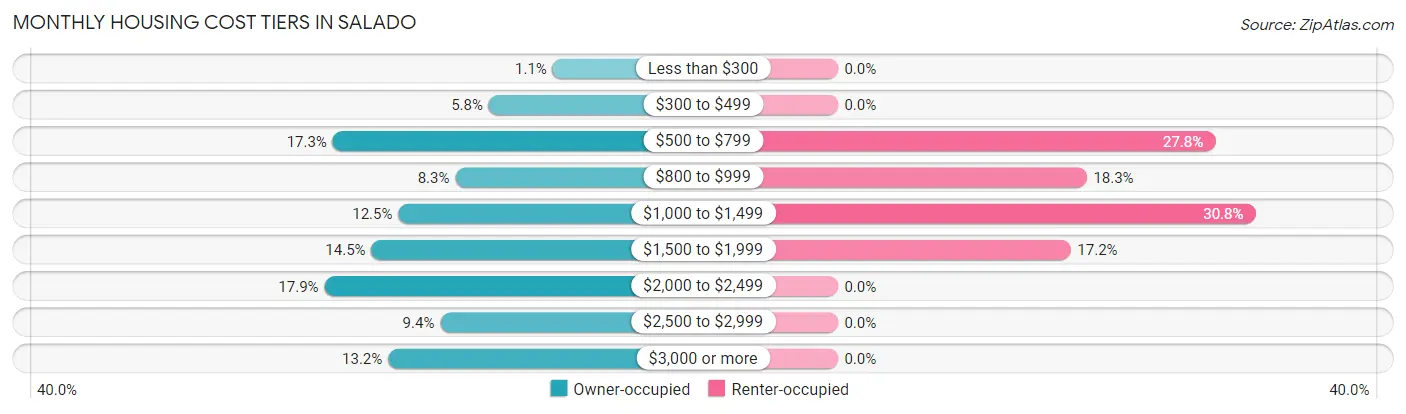
| Monthly Cost | Owner-occupied | Renter-occupied |
| Less than $300 | 9 (1.1%) | 0 (0.0%) |
| $300 to $499 | 47 (5.8%) | 0 (0.0%) |
| $500 to $799 | 140 (17.3%) | 47 (27.8%) |
| $800 to $999 | 67 (8.3%) | 31 (18.3%) |
| $1,000 to $1,499 | 101 (12.5%) | 52 (30.8%) |
| $1,500 to $1,999 | 117 (14.5%) | 29 (17.2%) |
| $2,000 to $2,499 | 145 (17.9%) | 0 (0.0%) |
| $2,500 to $2,999 | 76 (9.4%) | 0 (0.0%) |
| $3,000 or more | 107 (13.2%) | 0 (0.0%) |
| Total | 809 (100.0%) | 169 (100.0%) |
Physical Housing Characteristics in Salado
Housing Structures in Salado
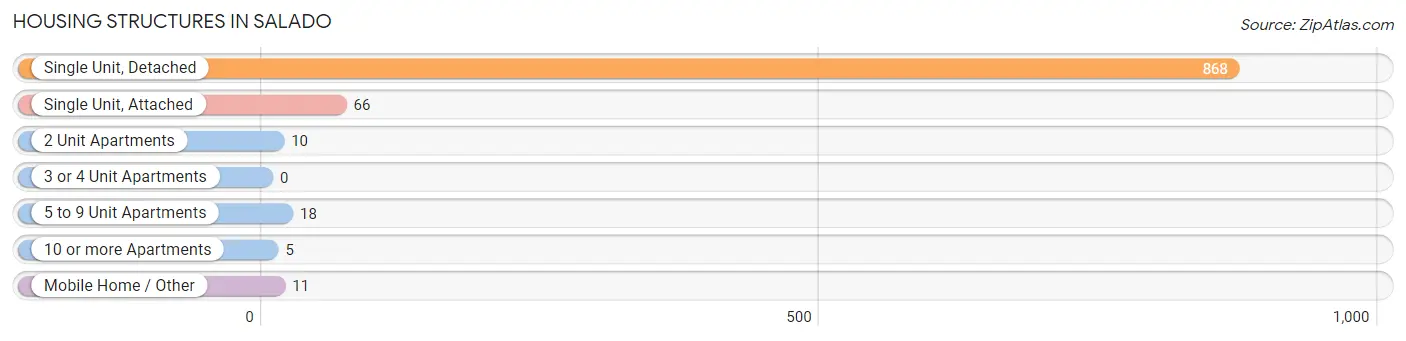
| Structure Type | # Housing Units | % Housing Units |
| Single Unit, Detached | 868 | 88.7% |
| Single Unit, Attached | 66 | 6.8% |
| 2 Unit Apartments | 10 | 1.0% |
| 3 or 4 Unit Apartments | 0 | 0.0% |
| 5 to 9 Unit Apartments | 18 | 1.8% |
| 10 or more Apartments | 5 | 0.5% |
| Mobile Home / Other | 11 | 1.1% |
| Total | 978 | 100.0% |
Housing Structures by Occupancy in Salado
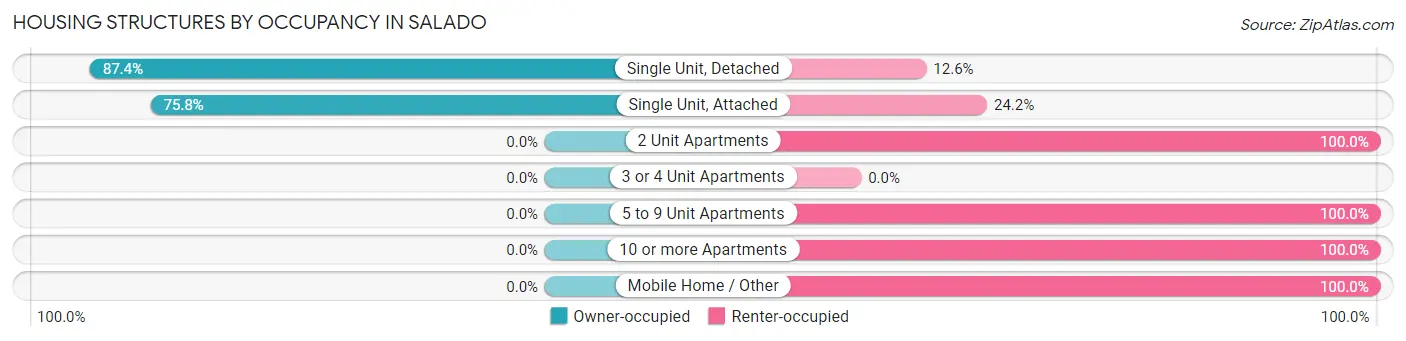
| Structure Type | Owner-occupied | Renter-occupied |
| Single Unit, Detached | 759 (87.4%) | 109 (12.6%) |
| Single Unit, Attached | 50 (75.8%) | 16 (24.2%) |
| 2 Unit Apartments | 0 (0.0%) | 10 (100.0%) |
| 3 or 4 Unit Apartments | 0 (0.0%) | 0 (0.0%) |
| 5 to 9 Unit Apartments | 0 (0.0%) | 18 (100.0%) |
| 10 or more Apartments | 0 (0.0%) | 5 (100.0%) |
| Mobile Home / Other | 0 (0.0%) | 11 (100.0%) |
| Total | 809 (82.7%) | 169 (17.3%) |
Housing Structures by Number of Rooms in Salado
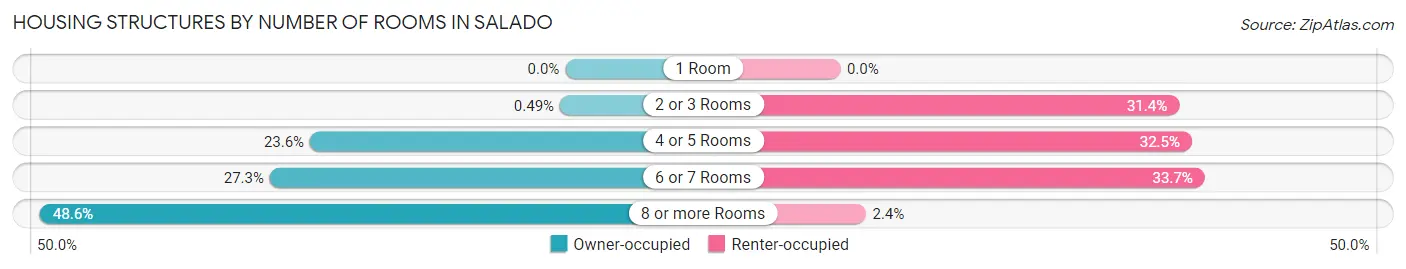
| Number of Rooms | Owner-occupied | Renter-occupied |
| 1 Room | 0 (0.0%) | 0 (0.0%) |
| 2 or 3 Rooms | 4 (0.5%) | 53 (31.4%) |
| 4 or 5 Rooms | 191 (23.6%) | 55 (32.5%) |
| 6 or 7 Rooms | 221 (27.3%) | 57 (33.7%) |
| 8 or more Rooms | 393 (48.6%) | 4 (2.4%) |
| Total | 809 (100.0%) | 169 (100.0%) |
Housing Structure by Heating Type in Salado
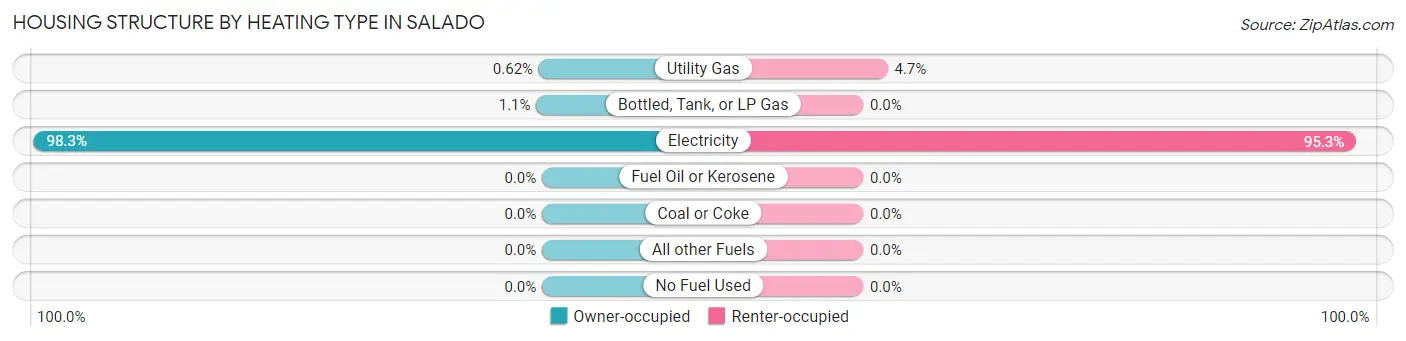
| Heating Type | Owner-occupied | Renter-occupied |
| Utility Gas | 5 (0.6%) | 8 (4.7%) |
| Bottled, Tank, or LP Gas | 9 (1.1%) | 0 (0.0%) |
| Electricity | 795 (98.3%) | 161 (95.3%) |
| Fuel Oil or Kerosene | 0 (0.0%) | 0 (0.0%) |
| Coal or Coke | 0 (0.0%) | 0 (0.0%) |
| All other Fuels | 0 (0.0%) | 0 (0.0%) |
| No Fuel Used | 0 (0.0%) | 0 (0.0%) |
| Total | 809 (100.0%) | 169 (100.0%) |
Household Vehicle Usage in Salado
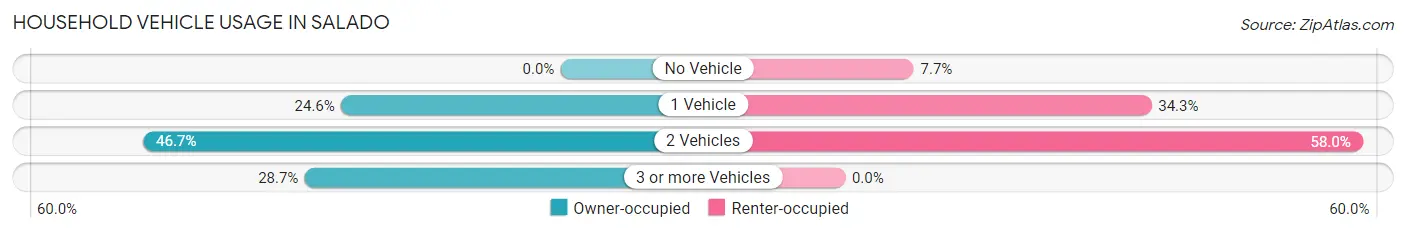
| Vehicles per Household | Owner-occupied | Renter-occupied |
| No Vehicle | 0 (0.0%) | 13 (7.7%) |
| 1 Vehicle | 199 (24.6%) | 58 (34.3%) |
| 2 Vehicles | 378 (46.7%) | 98 (58.0%) |
| 3 or more Vehicles | 232 (28.7%) | 0 (0.0%) |
| Total | 809 (100.0%) | 169 (100.0%) |
Real Estate & Mortgages in Salado
Real Estate and Mortgage Overview in Salado
| Characteristic | Without Mortgage | With Mortgage |
| Housing Units | 333 | 476 |
| Median Property Value | $319,100 | $397,400 |
| Median Household Income | $72,850 | $197 |
| Monthly Housing Costs | $774 | $107 |
| Real Estate Taxes | $4,233 | $12 |
Property Value by Mortgage Status in Salado
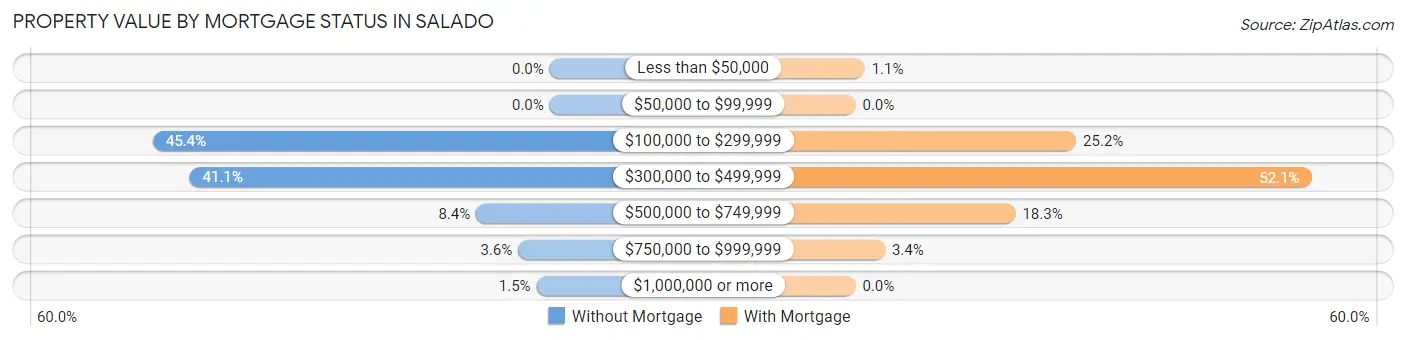
| Property Value | Without Mortgage | With Mortgage |
| Less than $50,000 | 0 (0.0%) | 5 (1.1%) |
| $50,000 to $99,999 | 0 (0.0%) | 0 (0.0%) |
| $100,000 to $299,999 | 151 (45.4%) | 120 (25.2%) |
| $300,000 to $499,999 | 137 (41.1%) | 248 (52.1%) |
| $500,000 to $749,999 | 28 (8.4%) | 87 (18.3%) |
| $750,000 to $999,999 | 12 (3.6%) | 16 (3.4%) |
| $1,000,000 or more | 5 (1.5%) | 0 (0.0%) |
| Total | 333 (100.0%) | 476 (100.0%) |
Household Income by Mortgage Status in Salado
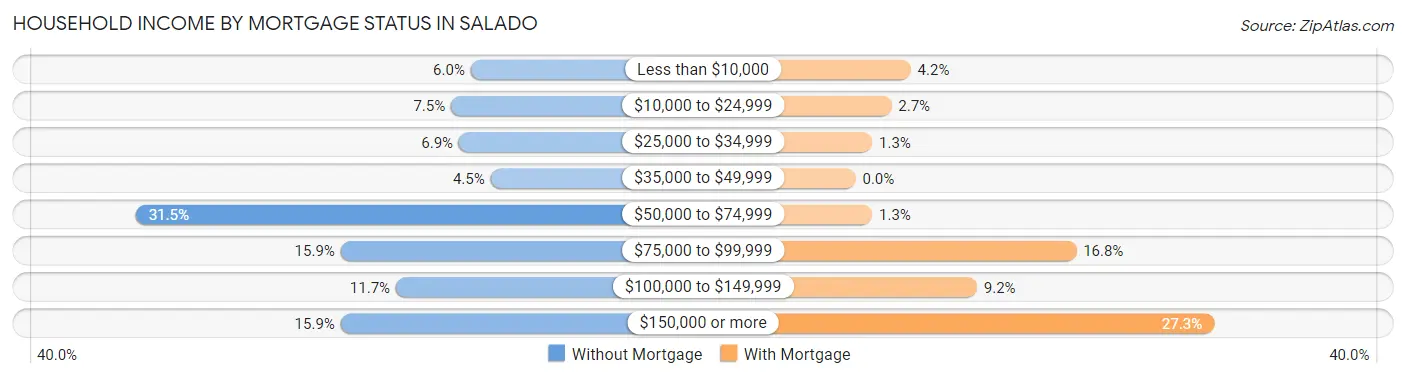
| Household Income | Without Mortgage | With Mortgage |
| Less than $10,000 | 20 (6.0%) | 20 (4.2%) |
| $10,000 to $24,999 | 25 (7.5%) | 13 (2.7%) |
| $25,000 to $34,999 | 23 (6.9%) | 6 (1.3%) |
| $35,000 to $49,999 | 15 (4.5%) | 0 (0.0%) |
| $50,000 to $74,999 | 105 (31.5%) | 6 (1.3%) |
| $75,000 to $99,999 | 53 (15.9%) | 80 (16.8%) |
| $100,000 to $149,999 | 39 (11.7%) | 44 (9.2%) |
| $150,000 or more | 53 (15.9%) | 130 (27.3%) |
| Total | 333 (100.0%) | 476 (100.0%) |
Property Value to Household Income Ratio in Salado
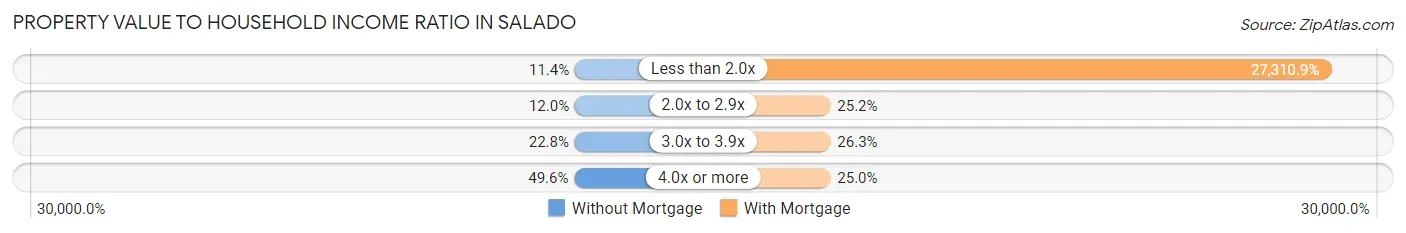
| Value-to-Income Ratio | Without Mortgage | With Mortgage |
| Less than 2.0x | 38 (11.4%) | 130,000 (27,310.9%) |
| 2.0x to 2.9x | 40 (12.0%) | 120 (25.2%) |
| 3.0x to 3.9x | 76 (22.8%) | 125 (26.3%) |
| 4.0x or more | 165 (49.5%) | 119 (25.0%) |
| Total | 333 (100.0%) | 476 (100.0%) |
Real Estate Taxes by Mortgage Status in Salado
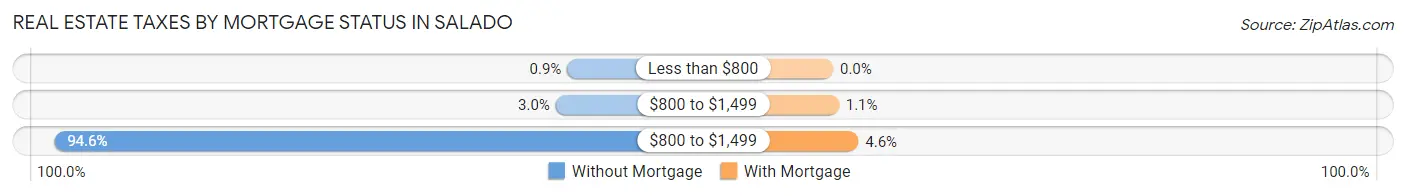
| Property Taxes | Without Mortgage | With Mortgage |
| Less than $800 | 3 (0.9%) | 0 (0.0%) |
| $800 to $1,499 | 10 (3.0%) | 5 (1.1%) |
| $800 to $1,499 | 315 (94.6%) | 22 (4.6%) |
| Total | 333 (100.0%) | 476 (100.0%) |
Health & Disability in Salado
Health Insurance Coverage by Age in Salado
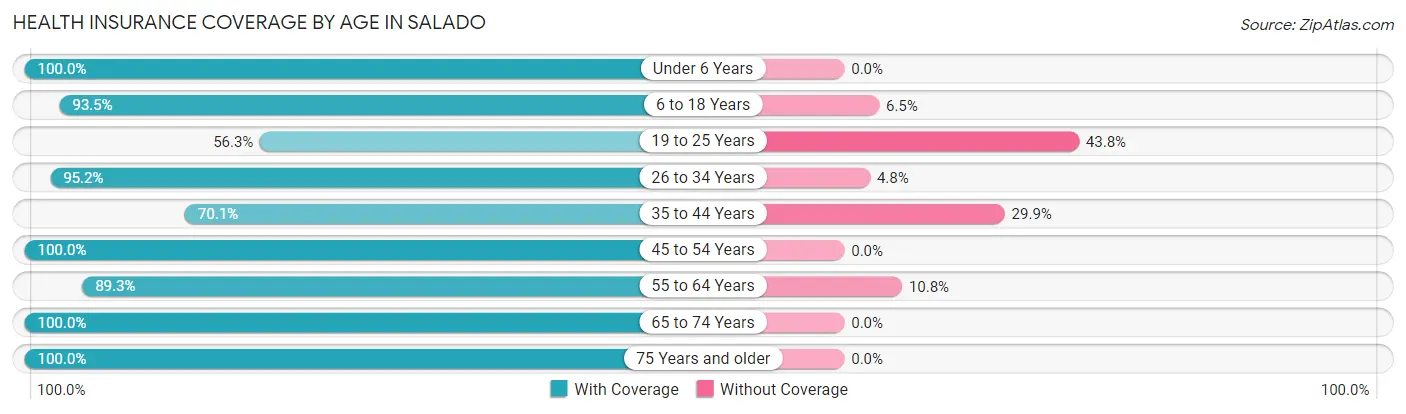
| Age Bracket | With Coverage | Without Coverage |
| Under 6 Years | 292 (100.0%) | 0 (0.0%) |
| 6 to 18 Years | 303 (93.5%) | 21 (6.5%) |
| 19 to 25 Years | 81 (56.2%) | 63 (43.8%) |
| 26 to 34 Years | 219 (95.2%) | 11 (4.8%) |
| 35 to 44 Years | 211 (70.1%) | 90 (29.9%) |
| 45 to 54 Years | 368 (100.0%) | 0 (0.0%) |
| 55 to 64 Years | 249 (89.2%) | 30 (10.7%) |
| 65 to 74 Years | 291 (100.0%) | 0 (0.0%) |
| 75 Years and older | 343 (100.0%) | 0 (0.0%) |
| Total | 2,357 (91.6%) | 215 (8.4%) |
Health Insurance Coverage by Citizenship Status in Salado
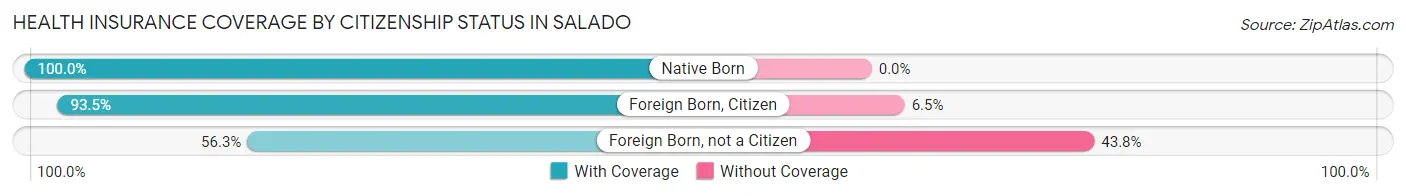
| Citizenship Status | With Coverage | Without Coverage |
| Native Born | 292 (100.0%) | 0 (0.0%) |
| Foreign Born, Citizen | 303 (93.5%) | 21 (6.5%) |
| Foreign Born, not a Citizen | 81 (56.2%) | 63 (43.8%) |
Health Insurance Coverage by Household Income in Salado
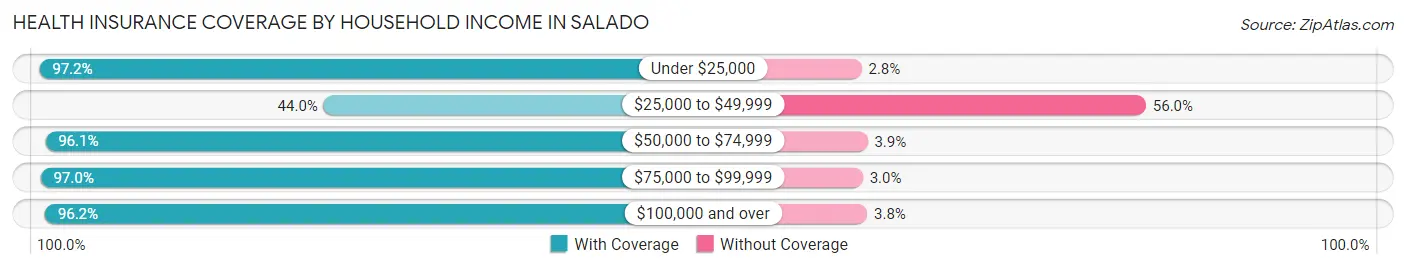
| Household Income | With Coverage | Without Coverage |
| Under $25,000 | 141 (97.2%) | 4 (2.8%) |
| $25,000 to $49,999 | 102 (44.0%) | 130 (56.0%) |
| $50,000 to $74,999 | 546 (96.1%) | 22 (3.9%) |
| $75,000 to $99,999 | 326 (97.0%) | 10 (3.0%) |
| $100,000 and over | 1,242 (96.2%) | 49 (3.8%) |
Public vs Private Health Insurance Coverage by Age in Salado
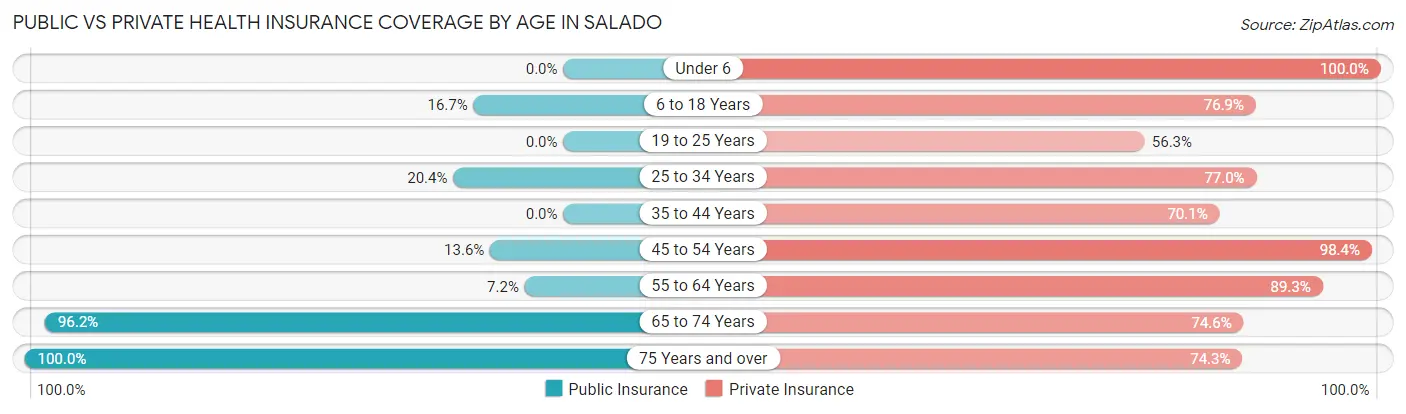
| Age Bracket | Public Insurance | Private Insurance |
| Under 6 | 0 (0.0%) | 292 (100.0%) |
| 6 to 18 Years | 54 (16.7%) | 249 (76.8%) |
| 19 to 25 Years | 0 (0.0%) | 81 (56.2%) |
| 25 to 34 Years | 47 (20.4%) | 177 (77.0%) |
| 35 to 44 Years | 0 (0.0%) | 211 (70.1%) |
| 45 to 54 Years | 50 (13.6%) | 362 (98.4%) |
| 55 to 64 Years | 20 (7.2%) | 249 (89.2%) |
| 65 to 74 Years | 280 (96.2%) | 217 (74.6%) |
| 75 Years and over | 343 (100.0%) | 255 (74.3%) |
| Total | 794 (30.9%) | 2,093 (81.4%) |
Disability Status by Sex by Age in Salado
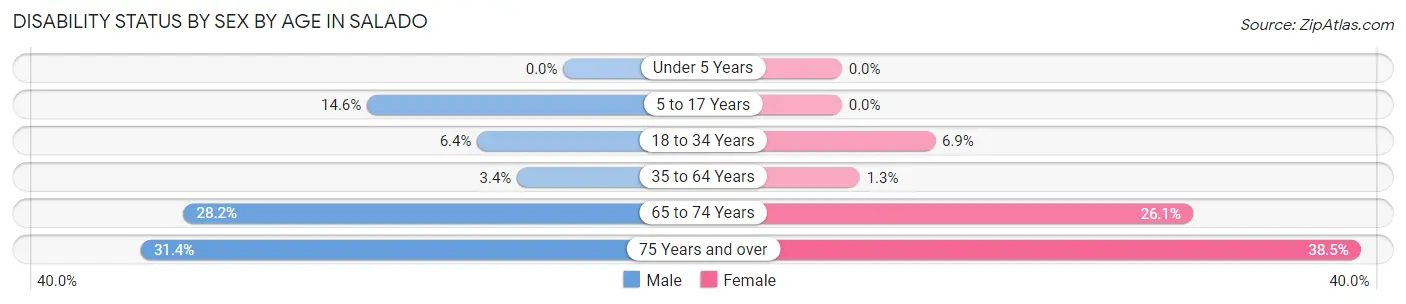
| Age Bracket | Male | Female |
| Under 5 Years | 0 (0.0%) | 0 (0.0%) |
| 5 to 17 Years | 29 (14.6%) | 0 (0.0%) |
| 18 to 34 Years | 17 (6.4%) | 11 (6.9%) |
| 35 to 64 Years | 17 (3.4%) | 6 (1.3%) |
| 65 to 74 Years | 42 (28.2%) | 37 (26.1%) |
| 75 Years and over | 53 (31.4%) | 67 (38.5%) |
Disability Class by Sex by Age in Salado
Disability Class: Hearing Difficulty
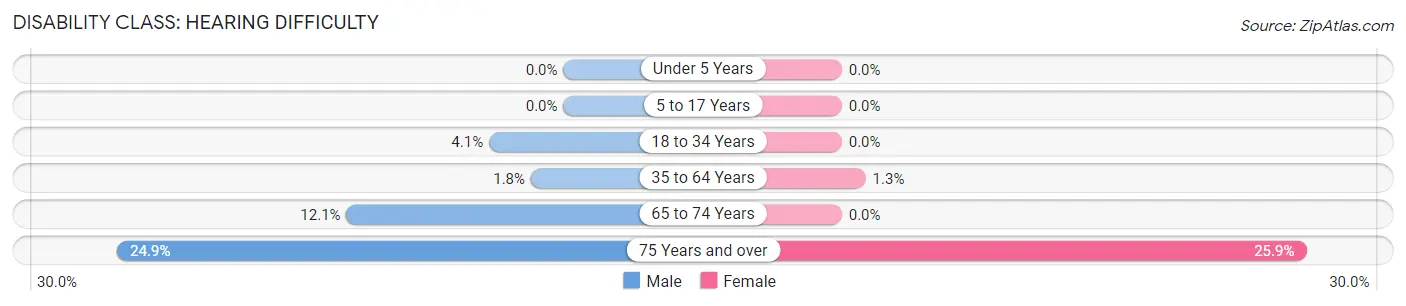
| Age Bracket | Male | Female |
| Under 5 Years | 0 (0.0%) | 0 (0.0%) |
| 5 to 17 Years | 0 (0.0%) | 0 (0.0%) |
| 18 to 34 Years | 11 (4.1%) | 0 (0.0%) |
| 35 to 64 Years | 9 (1.8%) | 6 (1.3%) |
| 65 to 74 Years | 18 (12.1%) | 0 (0.0%) |
| 75 Years and over | 42 (24.8%) | 45 (25.9%) |
Disability Class: Vision Difficulty
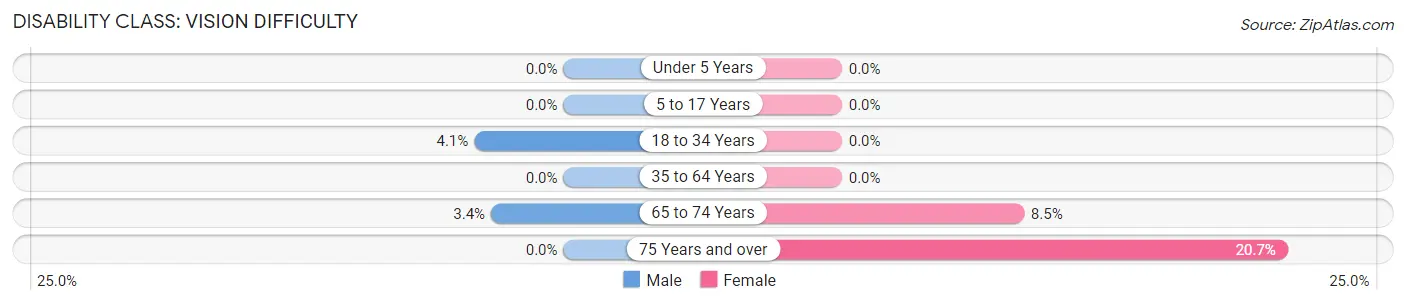
| Age Bracket | Male | Female |
| Under 5 Years | 0 (0.0%) | 0 (0.0%) |
| 5 to 17 Years | 0 (0.0%) | 0 (0.0%) |
| 18 to 34 Years | 11 (4.1%) | 0 (0.0%) |
| 35 to 64 Years | 0 (0.0%) | 0 (0.0%) |
| 65 to 74 Years | 5 (3.4%) | 12 (8.5%) |
| 75 Years and over | 0 (0.0%) | 36 (20.7%) |
Disability Class: Cognitive Difficulty
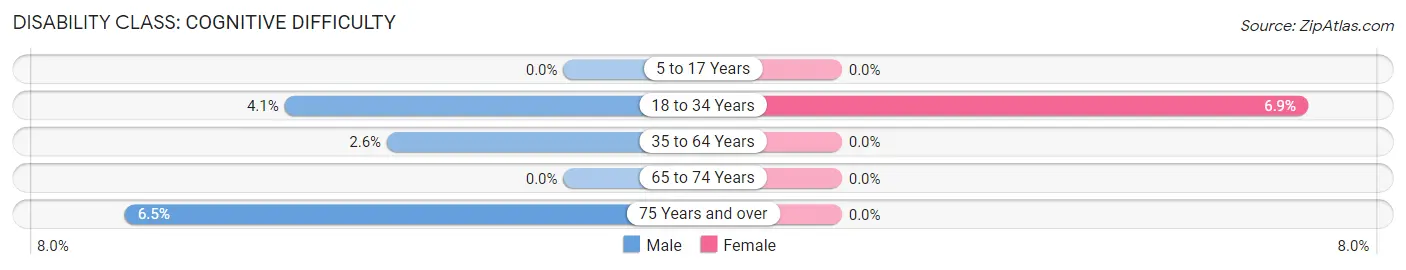
| Age Bracket | Male | Female |
| 5 to 17 Years | 0 (0.0%) | 0 (0.0%) |
| 18 to 34 Years | 11 (4.1%) | 11 (6.9%) |
| 35 to 64 Years | 13 (2.6%) | 0 (0.0%) |
| 65 to 74 Years | 0 (0.0%) | 0 (0.0%) |
| 75 Years and over | 11 (6.5%) | 0 (0.0%) |
Disability Class: Ambulatory Difficulty
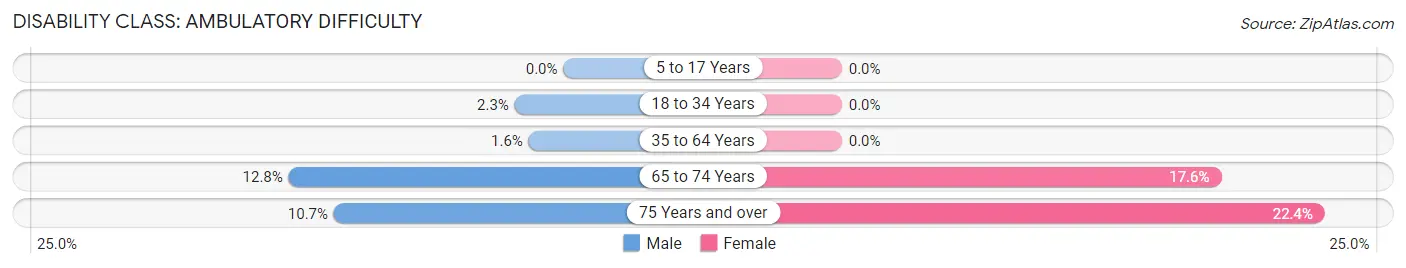
| Age Bracket | Male | Female |
| 5 to 17 Years | 0 (0.0%) | 0 (0.0%) |
| 18 to 34 Years | 6 (2.3%) | 0 (0.0%) |
| 35 to 64 Years | 8 (1.6%) | 0 (0.0%) |
| 65 to 74 Years | 19 (12.8%) | 25 (17.6%) |
| 75 Years and over | 18 (10.6%) | 39 (22.4%) |
Disability Class: Self-Care Difficulty
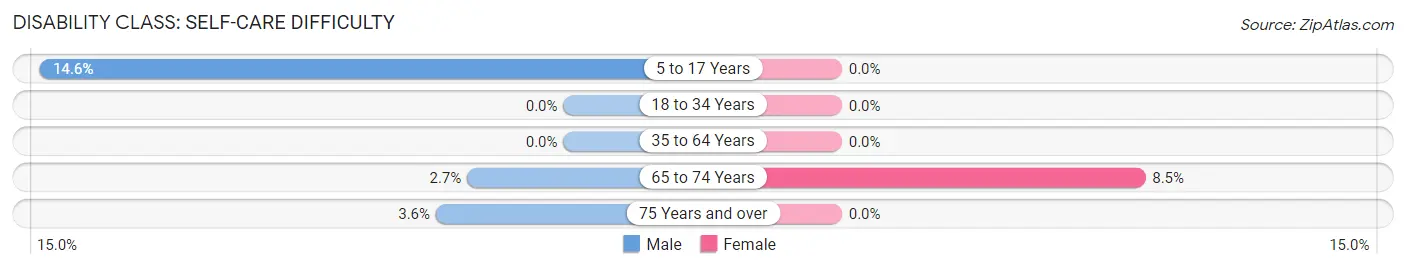
| Age Bracket | Male | Female |
| 5 to 17 Years | 29 (14.6%) | 0 (0.0%) |
| 18 to 34 Years | 0 (0.0%) | 0 (0.0%) |
| 35 to 64 Years | 0 (0.0%) | 0 (0.0%) |
| 65 to 74 Years | 4 (2.7%) | 12 (8.5%) |
| 75 Years and over | 6 (3.5%) | 0 (0.0%) |
Technology Access in Salado
Computing Device Access in Salado
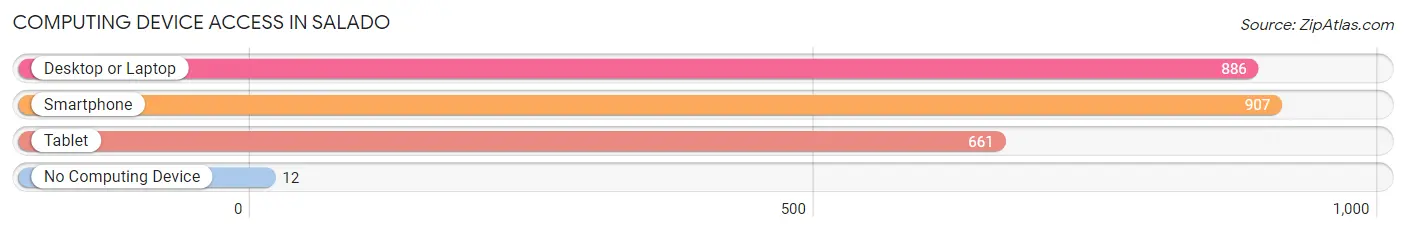
| Device Type | # Households | % Households |
| Desktop or Laptop | 886 | 90.6% |
| Smartphone | 907 | 92.7% |
| Tablet | 661 | 67.6% |
| No Computing Device | 12 | 1.2% |
| Total | 978 | 100.0% |
Internet Access in Salado
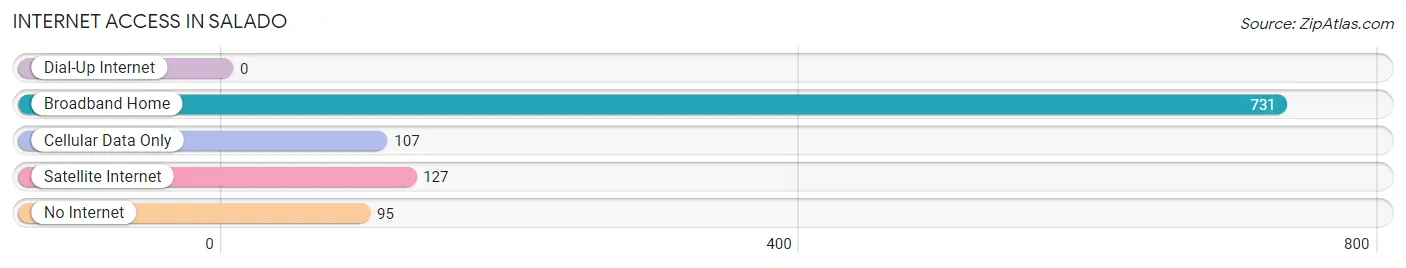
| Internet Type | # Households | % Households |
| Dial-Up Internet | 0 | 0.0% |
| Broadband Home | 731 | 74.7% |
| Cellular Data Only | 107 | 10.9% |
| Satellite Internet | 127 | 13.0% |
| No Internet | 95 | 9.7% |
| Total | 978 | 100.0% |
Salado Summary
Salado, Texas is a small town located in Bell County, Texas, about 20 miles south of the city of Temple. It is situated along the banks of the Salado Creek, which is a tributary of the Lampasas River. The town was founded in 1859 and is one of the oldest continuously inhabited settlements in the state of Texas. The population of Salado was 1,837 as of the 2010 census.
History
The area around Salado was first inhabited by Native American tribes, including the Tonkawa, Comanche, and Apache. The first European settlers arrived in the area in the early 1830s, and the town of Salado was officially founded in 1859. The town was named after the Salado Creek, which was named by Spanish explorers in the 1700s.
The town quickly grew and became an important stop on the Chisholm Trail, which was used by cattle ranchers to drive their herds to market. Salado was also a popular stop for stagecoaches and travelers on the San Antonio-Austin Road.
In the late 1800s, Salado was a center of education and culture. The Salado College was founded in 1860 and was one of the first coeducational colleges in the state. The college was destroyed by a fire in 1884, but the town continued to be a center of education with the founding of the Salado Academy in 1887.
The town was also home to several churches, including the First Baptist Church of Salado, which was founded in 1867. The town also had a thriving business district, with several stores, banks, and other businesses.
Geography
Salado is located in Bell County, Texas, about 20 miles south of the city of Temple. The town is situated along the banks of the Salado Creek, which is a tributary of the Lampasas River. The town is located in the Central Texas Hill Country, and the terrain is mostly rolling hills and grasslands.
The climate in Salado is generally mild, with hot summers and mild winters. The average temperature in the summer is around 90 degrees Fahrenheit, and the average temperature in the winter is around 50 degrees Fahrenheit.
Economy
The economy of Salado is largely based on tourism and agriculture. The town is home to several wineries, and it is a popular destination for wine tours and tastings. The town is also home to several antique stores, art galleries, and other tourist attractions.
Agriculture is also an important part of the local economy. The town is home to several farms, and the surrounding area is known for its production of peaches, pecans, and other fruits and nuts.
Demographics
As of the 2010 census, the population of Salado was 1,837. The racial makeup of the town was 94.3% White, 0.7% African American, 0.3% Native American, 0.7% Asian, 0.1% Pacific Islander, 2.2% from other races, and 1.9% from two or more races. Hispanic or Latino of any race were 6.2% of the population.
The median household income in Salado was $50,938, and the median family income was $60,938. The per capita income in Salado was $25,938. About 8.3% of the population was below the poverty line.
Common Questions
What is Per Capita Income in Salado?
Per Capita income in Salado is $47,141.
What is the Median Family Income in Salado?
Median Family Income in Salado is $102,568.
What is the Median Household income in Salado?
Median Household Income in Salado is $89,348.
What is Income or Wage Gap in Salado?
Income or Wage Gap in Salado is 29.7%.
Women in Salado earn 70.3 cents for every dollar earned by a man.
What is Inequality or Gini Index in Salado?
Inequality or Gini Index in Salado is 0.43.
What is the Total Population of Salado?
Total Population of Salado is 2,585.
What is the Total Male Population of Salado?
Total Male Population of Salado is 1,333.
What is the Total Female Population of Salado?
Total Female Population of Salado is 1,252.
What is the Ratio of Males per 100 Females in Salado?
There are 106.47 Males per 100 Females in Salado.
What is the Ratio of Females per 100 Males in Salado?
There are 93.92 Females per 100 Males in Salado.
What is the Median Population Age in Salado?
Median Population Age in Salado is 44.6 Years.
What is the Average Family Size in Salado
Average Family Size in Salado is 3.0 People.
What is the Average Household Size in Salado
Average Household Size in Salado is 2.6 People.
How Large is the Labor Force in Salado?
There are 1,225 People in the Labor Forcein in Salado.
What is the Percentage of People in the Labor Force in Salado?
59.6% of People are in the Labor Force in Salado.
What is the Unemployment Rate in Salado?
Unemployment Rate in Salado is 1.1%.