Rogers, TX Map & Demographics
Rogers Map
Rogers Overview
$23,864
PER CAPITA INCOME
$73,250
AVG FAMILY INCOME
$69,866
AVG HOUSEHOLD INCOME
19.6%
WAGE / INCOME GAP [ % ]
80.4¢/ $1
WAGE / INCOME GAP [ $ ]
$8,698
FAMILY INCOME DEFICIT
0.38
INEQUALITY / GINI INDEX
1,444
TOTAL POPULATION
772
MALE POPULATION
672
FEMALE POPULATION
114.88
MALES / 100 FEMALES
87.05
FEMALES / 100 MALES
39.0
MEDIAN AGE
3.9
AVG FAMILY SIZE
3.5
AVG HOUSEHOLD SIZE
753
LABOR FORCE [ PEOPLE ]
66.2%
PERCENT IN LABOR FORCE
4.8%
UNEMPLOYMENT RATE
Rogers Zip Codes
Rogers Area Codes
Income in Rogers
Income Overview in Rogers
Per Capita Income in Rogers is $23,864, while median incomes of families and households are $73,250 and $69,866 respectively.
| Characteristic | Number | Measure |
| Per Capita Income | 1,444 | $23,864 |
| Median Family Income | 349 | $73,250 |
| Mean Family Income | 349 | $77,082 |
| Median Household Income | 415 | $69,866 |
| Mean Household Income | 415 | $73,266 |
| Income Deficit | 349 | $8,698 |
| Wage / Income Gap (%) | 1,444 | 19.60% |
| Wage / Income Gap ($) | 1,444 | 80.40¢ per $1 |
| Gini / Inequality Index | 1,444 | 0.38 |
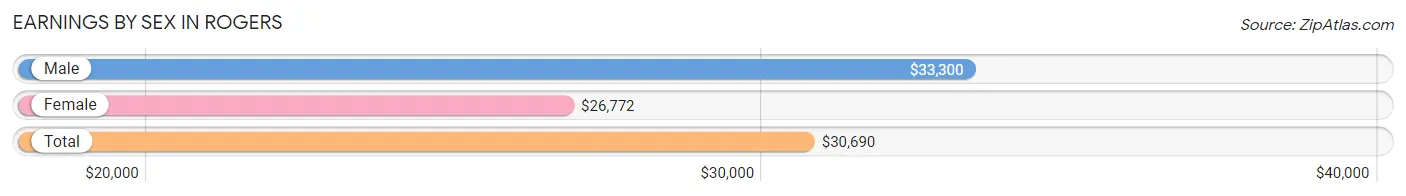
Earnings by Sex in Rogers
Average Earnings in Rogers are $30,690, $33,300 for men and $26,772 for women, a difference of 19.6%.
| Sex | Number | Average Earnings |
| Male | 382 (51.9%) | $33,300 |
| Female | 354 (48.1%) | $26,772 |
| Total | 736 (100.0%) | $30,690 |
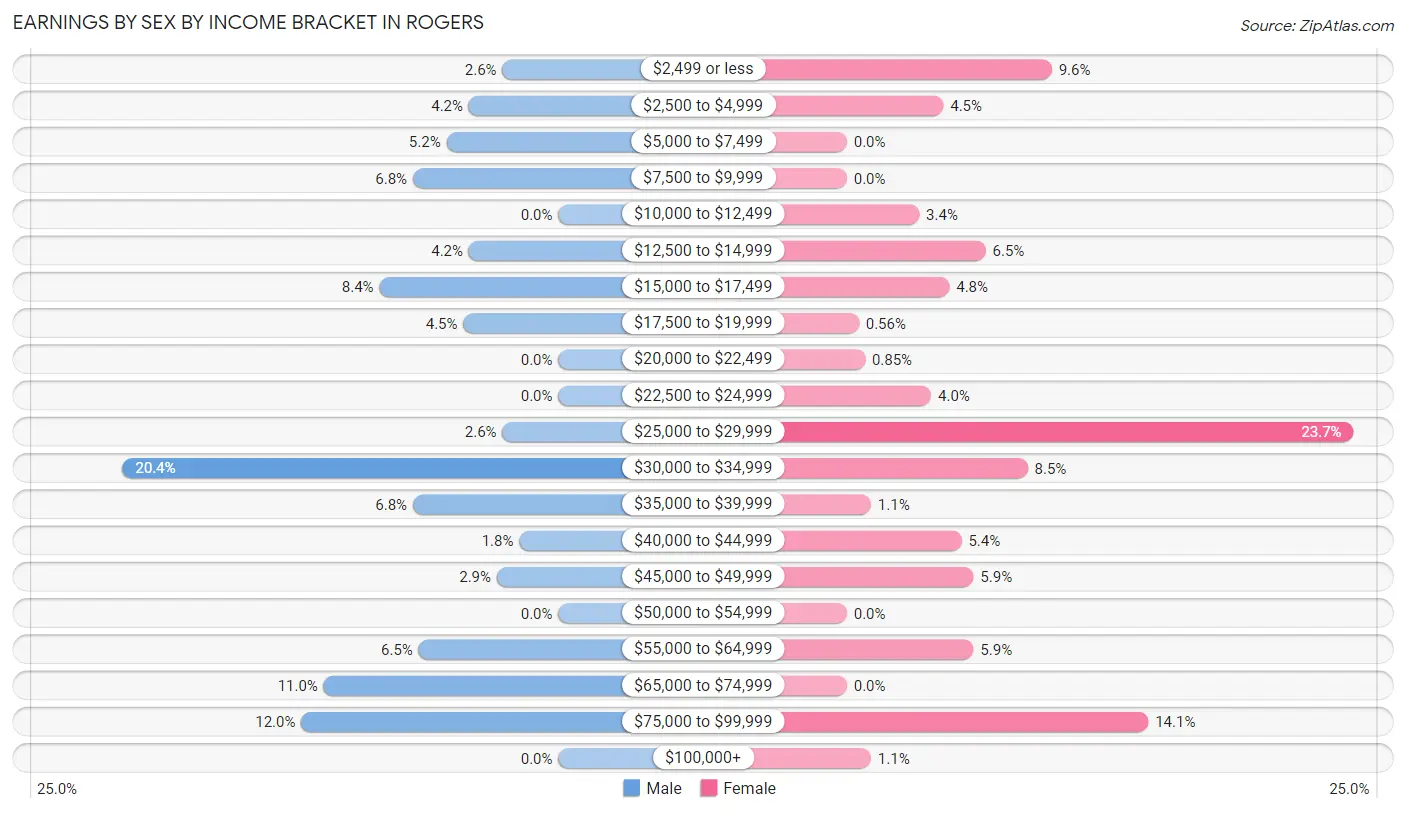
Earnings by Sex by Income Bracket in Rogers
The most common earnings brackets in Rogers are $30,000 to $34,999 for men (78 | 20.4%) and $25,000 to $29,999 for women (84 | 23.7%).
| Income | Male | Female |
| $2,499 or less | 10 (2.6%) | 34 (9.6%) |
| $2,500 to $4,999 | 16 (4.2%) | 16 (4.5%) |
| $5,000 to $7,499 | 20 (5.2%) | 0 (0.0%) |
| $7,500 to $9,999 | 26 (6.8%) | 0 (0.0%) |
| $10,000 to $12,499 | 0 (0.0%) | 12 (3.4%) |
| $12,500 to $14,999 | 16 (4.2%) | 23 (6.5%) |
| $15,000 to $17,499 | 32 (8.4%) | 17 (4.8%) |
| $17,500 to $19,999 | 17 (4.4%) | 2 (0.6%) |
| $20,000 to $22,499 | 0 (0.0%) | 3 (0.9%) |
| $22,500 to $24,999 | 0 (0.0%) | 14 (4.0%) |
| $25,000 to $29,999 | 10 (2.6%) | 84 (23.7%) |
| $30,000 to $34,999 | 78 (20.4%) | 30 (8.5%) |
| $35,000 to $39,999 | 26 (6.8%) | 4 (1.1%) |
| $40,000 to $44,999 | 7 (1.8%) | 19 (5.4%) |
| $45,000 to $49,999 | 11 (2.9%) | 21 (5.9%) |
| $50,000 to $54,999 | 0 (0.0%) | 0 (0.0%) |
| $55,000 to $64,999 | 25 (6.5%) | 21 (5.9%) |
| $65,000 to $74,999 | 42 (11.0%) | 0 (0.0%) |
| $75,000 to $99,999 | 46 (12.0%) | 50 (14.1%) |
| $100,000+ | 0 (0.0%) | 4 (1.1%) |
| Total | 382 (100.0%) | 354 (100.0%) |
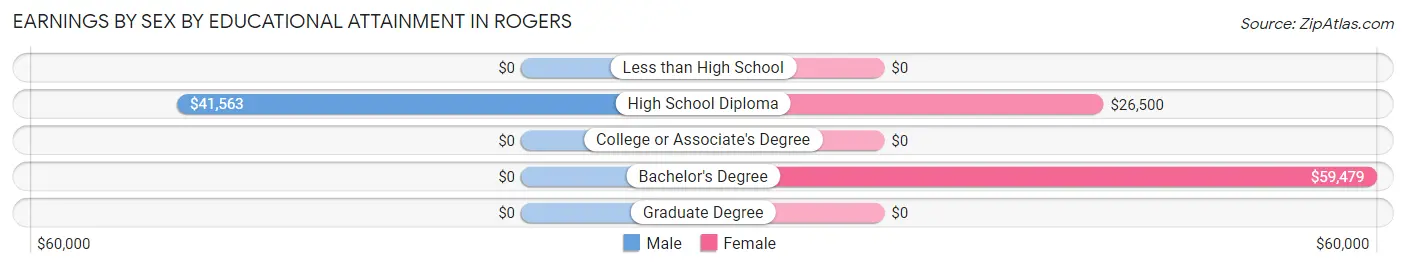
Earnings by Sex by Educational Attainment in Rogers
Average earnings in Rogers are $39,464 for men and $30,083 for women, a difference of 23.8%. Men with an educational attainment of high school diploma enjoy the highest average annual earnings of $41,563, while those with high school diploma education earn the least with $41,563. Women with an educational attainment of bachelor's degree earn the most with the average annual earnings of $59,479, while those with high school diploma education have the smallest earnings of $26,500.
| Educational Attainment | Male Income | Female Income |
| Less than High School | - | - |
| High School Diploma | $41,563 | $26,500 |
| College or Associate's Degree | - | - |
| Bachelor's Degree | - | - |
| Graduate Degree | - | - |
| Total | $39,464 | $30,083 |
Family Income in Rogers
Family Income Brackets in Rogers
According to the Rogers family income data, there are 92 families falling into the $75,000 to $99,999 income range, which is the most common income bracket and makes up 26.4% of all families.
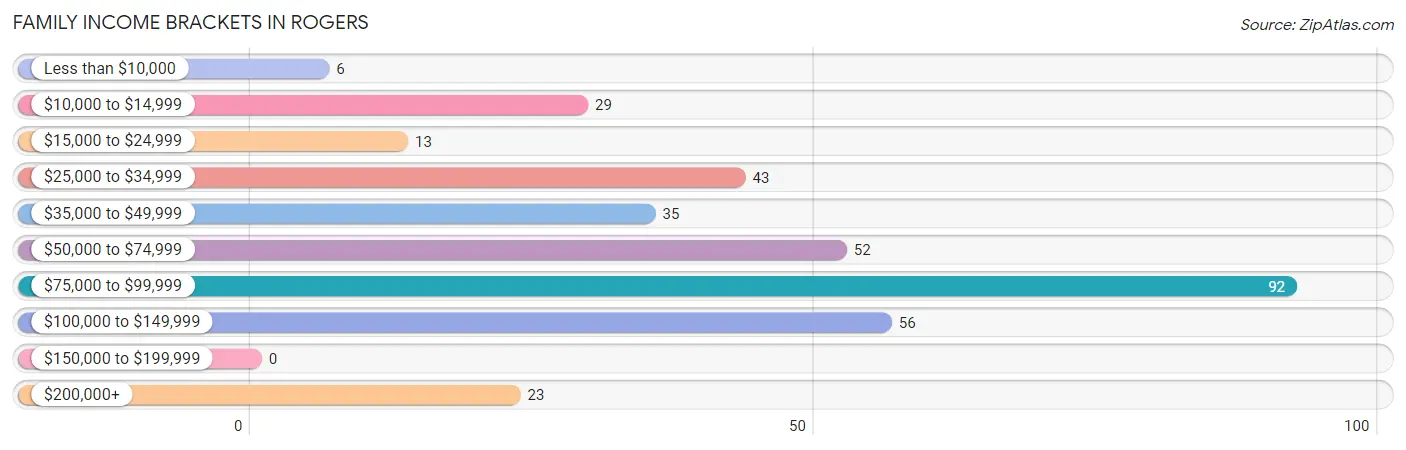
| Income Bracket | # Families | % Families |
| Less than $10,000 | 6 | 1.7% |
| $10,000 to $14,999 | 29 | 8.3% |
| $15,000 to $24,999 | 13 | 3.7% |
| $25,000 to $34,999 | 43 | 12.3% |
| $35,000 to $49,999 | 35 | 10.0% |
| $50,000 to $74,999 | 52 | 14.9% |
| $75,000 to $99,999 | 92 | 26.4% |
| $100,000 to $149,999 | 56 | 16.0% |
| $150,000 to $199,999 | 0 | 0.0% |
| $200,000+ | 23 | 6.6% |
Family Income by Famaliy Size in Rogers
3-person families (96 | 27.5%) account for the highest median family income in Rogers with $78,452 per family, while 2-person families (127 | 36.4%) have the highest median income of $34,453 per family member.
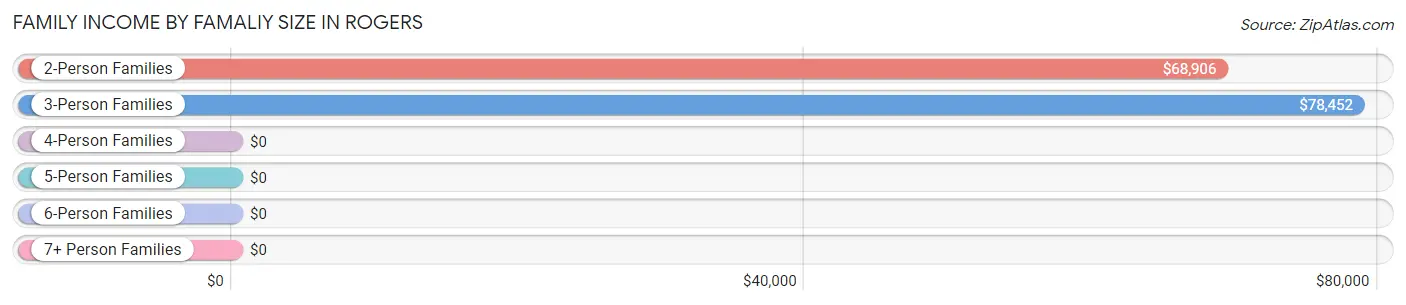
| Income Bracket | # Families | Median Income |
| 2-Person Families | 127 (36.4%) | $68,906 |
| 3-Person Families | 96 (27.5%) | $78,452 |
| 4-Person Families | 34 (9.7%) | $0 |
| 5-Person Families | 53 (15.2%) | $0 |
| 6-Person Families | 20 (5.7%) | $0 |
| 7+ Person Families | 19 (5.4%) | $0 |
| Total | 349 (100.0%) | $73,250 |
Family Income by Number of Earners in Rogers
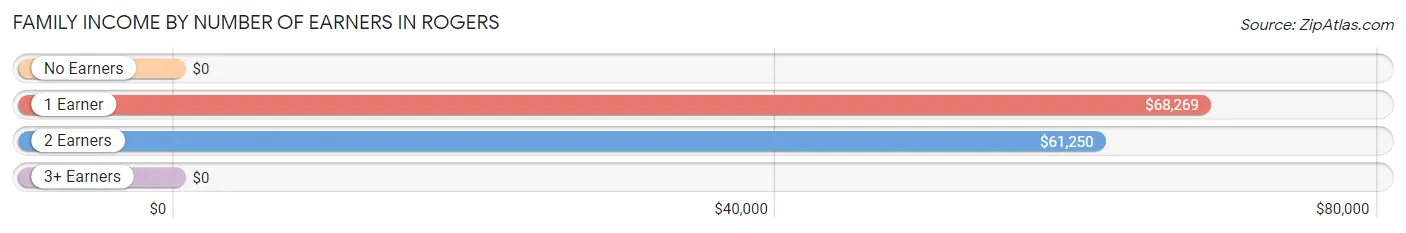
| Number of Earners | # Families | Median Income |
| No Earners | 60 (17.2%) | $0 |
| 1 Earner | 106 (30.4%) | $68,269 |
| 2 Earners | 134 (38.4%) | $61,250 |
| 3+ Earners | 49 (14.0%) | $0 |
| Total | 349 (100.0%) | $73,250 |
Household Income in Rogers
Household Income Brackets in Rogers
With 99 households falling in the category, the $75,000 to $99,999 income range is the most frequent in Rogers, accounting for 23.9% of all households.
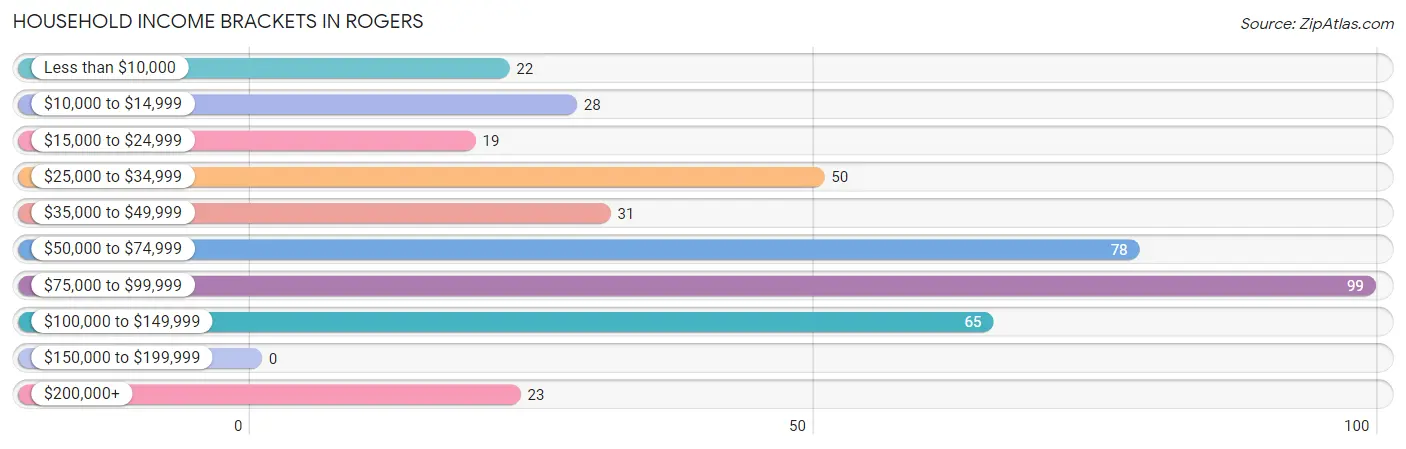
| Income Bracket | # Households | % Households |
| Less than $10,000 | 22 | 5.3% |
| $10,000 to $14,999 | 28 | 6.7% |
| $15,000 to $24,999 | 19 | 4.6% |
| $25,000 to $34,999 | 50 | 12.0% |
| $35,000 to $49,999 | 31 | 7.5% |
| $50,000 to $74,999 | 78 | 18.8% |
| $75,000 to $99,999 | 99 | 23.9% |
| $100,000 to $149,999 | 65 | 15.7% |
| $150,000 to $199,999 | 0 | 0.0% |
| $200,000+ | 23 | 5.5% |
Household Income by Householder Age in Rogers
The median household income in Rogers is $69,866, with the highest median household income of $80,536 found in the 45 to 64 years age bracket for the primary householder. A total of 169 households (40.7%) fall into this category. Meanwhile, the 15 to 24 years age bracket for the primary householder has the lowest median household income of $0, with 10 households (2.4%) in this group.
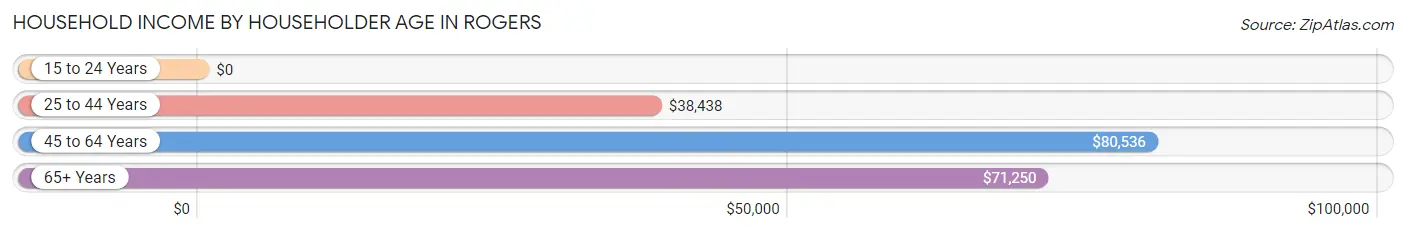
| Income Bracket | # Households | Median Income |
| 15 to 24 Years | 10 (2.4%) | $0 |
| 25 to 44 Years | 130 (31.3%) | $38,438 |
| 45 to 64 Years | 169 (40.7%) | $80,536 |
| 65+ Years | 106 (25.5%) | $71,250 |
| Total | 415 (100.0%) | $69,866 |
Poverty in Rogers
Income Below Poverty by Sex and Age in Rogers
With 21.4% poverty level for males and 22.9% for females among the residents of Rogers, 6 to 11 year old males and 12 to 14 year old females are the most vulnerable to poverty, with 51 males (58.6%) and 37 females (100.0%) in their respective age groups living below the poverty level.
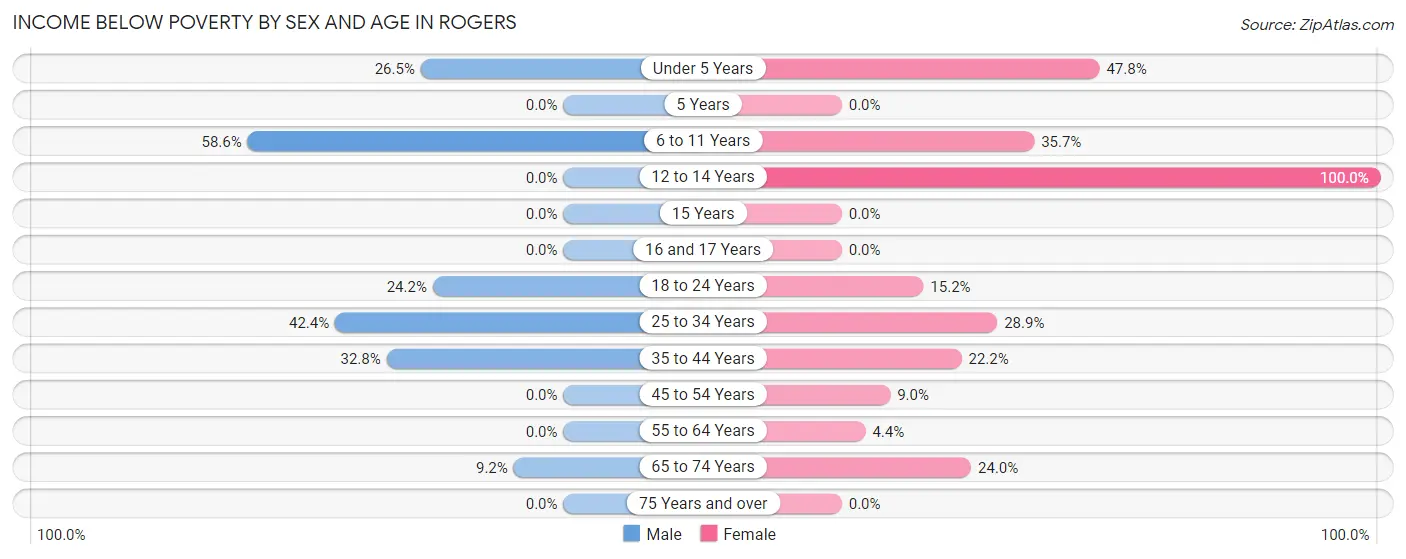
| Age Bracket | Male | Female |
| Under 5 Years | 9 (26.5%) | 22 (47.8%) |
| 5 Years | 0 (0.0%) | 0 (0.0%) |
| 6 to 11 Years | 51 (58.6%) | 20 (35.7%) |
| 12 to 14 Years | 0 (0.0%) | 37 (100.0%) |
| 15 Years | 0 (0.0%) | 0 (0.0%) |
| 16 and 17 Years | 0 (0.0%) | 0 (0.0%) |
| 18 to 24 Years | 32 (24.2%) | 10 (15.1%) |
| 25 to 34 Years | 25 (42.4%) | 15 (28.8%) |
| 35 to 44 Years | 42 (32.8%) | 12 (22.2%) |
| 45 to 54 Years | 0 (0.0%) | 16 (9.0%) |
| 55 to 64 Years | 0 (0.0%) | 4 (4.4%) |
| 65 to 74 Years | 6 (9.2%) | 18 (24.0%) |
| 75 Years and over | 0 (0.0%) | 0 (0.0%) |
| Total | 165 (21.4%) | 154 (22.9%) |
Income Above Poverty by Sex and Age in Rogers
According to the poverty statistics in Rogers, males aged 5 years and females aged 75 years and over are the age groups that are most secure financially, with 100.0% of males and 100.0% of females in these age groups living above the poverty line.
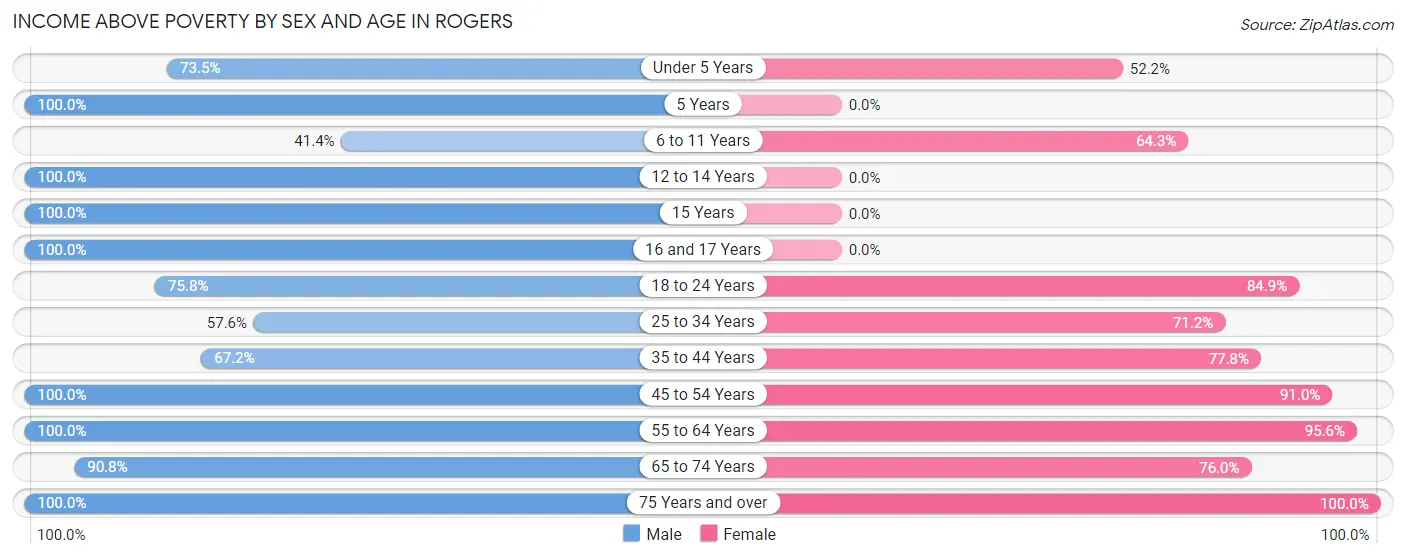
| Age Bracket | Male | Female |
| Under 5 Years | 25 (73.5%) | 24 (52.2%) |
| 5 Years | 4 (100.0%) | 0 (0.0%) |
| 6 to 11 Years | 36 (41.4%) | 36 (64.3%) |
| 12 to 14 Years | 40 (100.0%) | 0 (0.0%) |
| 15 Years | 3 (100.0%) | 0 (0.0%) |
| 16 and 17 Years | 48 (100.0%) | 0 (0.0%) |
| 18 to 24 Years | 100 (75.8%) | 56 (84.9%) |
| 25 to 34 Years | 34 (57.6%) | 37 (71.2%) |
| 35 to 44 Years | 86 (67.2%) | 42 (77.8%) |
| 45 to 54 Years | 87 (100.0%) | 162 (91.0%) |
| 55 to 64 Years | 59 (100.0%) | 87 (95.6%) |
| 65 to 74 Years | 59 (90.8%) | 57 (76.0%) |
| 75 Years and over | 26 (100.0%) | 17 (100.0%) |
| Total | 607 (78.6%) | 518 (77.1%) |
Income Below Poverty Among Married-Couple Families in Rogers
The poverty statistics for married-couple families in Rogers show that 16.2% or 40 of the total 247 families live below the poverty line. Families with 3 or 4 children have the highest poverty rate of 40.0%, comprising of 22 families. On the other hand, families with no children have the lowest poverty rate of 0.0%, which includes 0 families.
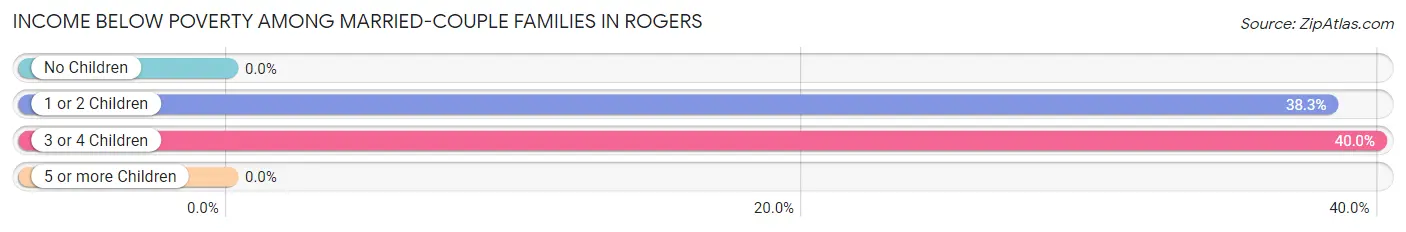
| Children | Above Poverty | Below Poverty |
| No Children | 145 (100.0%) | 0 (0.0%) |
| 1 or 2 Children | 29 (61.7%) | 18 (38.3%) |
| 3 or 4 Children | 33 (60.0%) | 22 (40.0%) |
| 5 or more Children | 0 (0.0%) | 0 (0.0%) |
| Total | 207 (83.8%) | 40 (16.2%) |
Income Below Poverty Among Single-Parent Households in Rogers
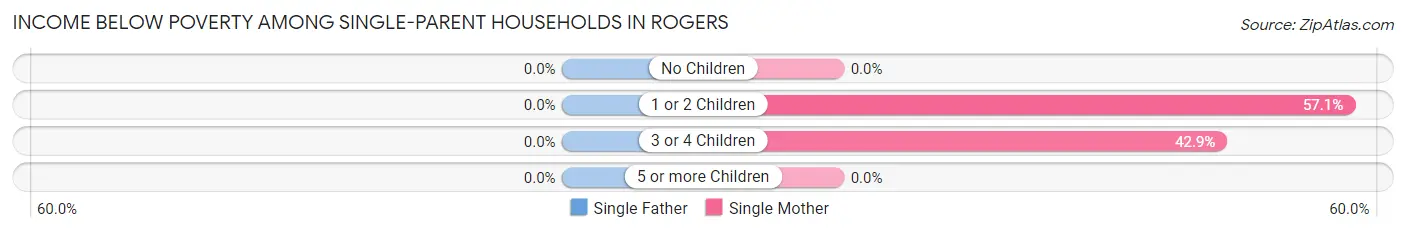
| Children | Single Father | Single Mother |
| No Children | 0 (0.0%) | 0 (0.0%) |
| 1 or 2 Children | 0 (0.0%) | 20 (57.1%) |
| 3 or 4 Children | 0 (0.0%) | 3 (42.9%) |
| 5 or more Children | 0 (0.0%) | 0 (0.0%) |
| Total | 0 (0.0%) | 23 (24.0%) |
Income Below Poverty Among Married-Couple vs Single-Parent Households in Rogers
The poverty data for Rogers shows that 40 of the married-couple family households (16.2%) and 23 of the single-parent households (22.6%) are living below the poverty level. Within the married-couple family households, those with 3 or 4 children have the highest poverty rate, with 22 households (40.0%) falling below the poverty line. Among the single-parent households, those with 1 or 2 children have the highest poverty rate, with 20 household (57.1%) living below poverty.
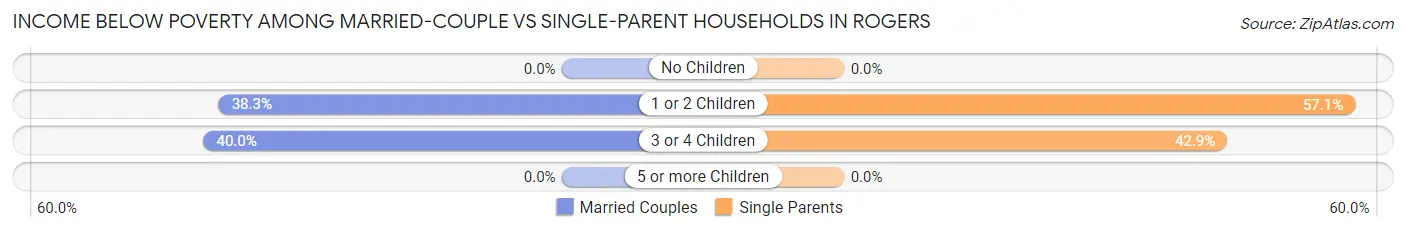
| Children | Married-Couple Families | Single-Parent Households |
| No Children | 0 (0.0%) | 0 (0.0%) |
| 1 or 2 Children | 18 (38.3%) | 20 (57.1%) |
| 3 or 4 Children | 22 (40.0%) | 3 (42.9%) |
| 5 or more Children | 0 (0.0%) | 0 (0.0%) |
| Total | 40 (16.2%) | 23 (22.6%) |
Race in Rogers
The most populous races in Rogers are White / Caucasian (892 | 61.8%), Hispanic or Latino (597 | 41.3%), and Some other Race (304 | 21.0%).
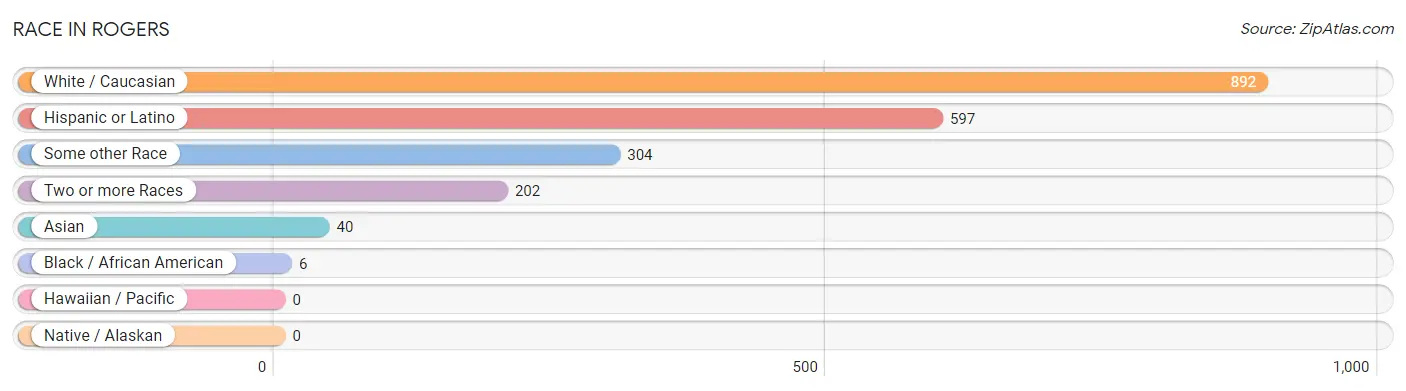
| Race | # Population | % Population |
| Asian | 40 | 2.8% |
| Black / African American | 6 | 0.4% |
| Hawaiian / Pacific | 0 | 0.0% |
| Hispanic or Latino | 597 | 41.3% |
| Native / Alaskan | 0 | 0.0% |
| White / Caucasian | 892 | 61.8% |
| Two or more Races | 202 | 14.0% |
| Some other Race | 304 | 21.0% |
| Total | 1,444 | 100.0% |
Ancestry in Rogers
The most populous ancestries reported in Rogers are Mexican (526 | 36.4%), Irish (256 | 17.7%), German (196 | 13.6%), English (113 | 7.8%), and American (90 | 6.2%), together accounting for 81.8% of all Rogers residents.
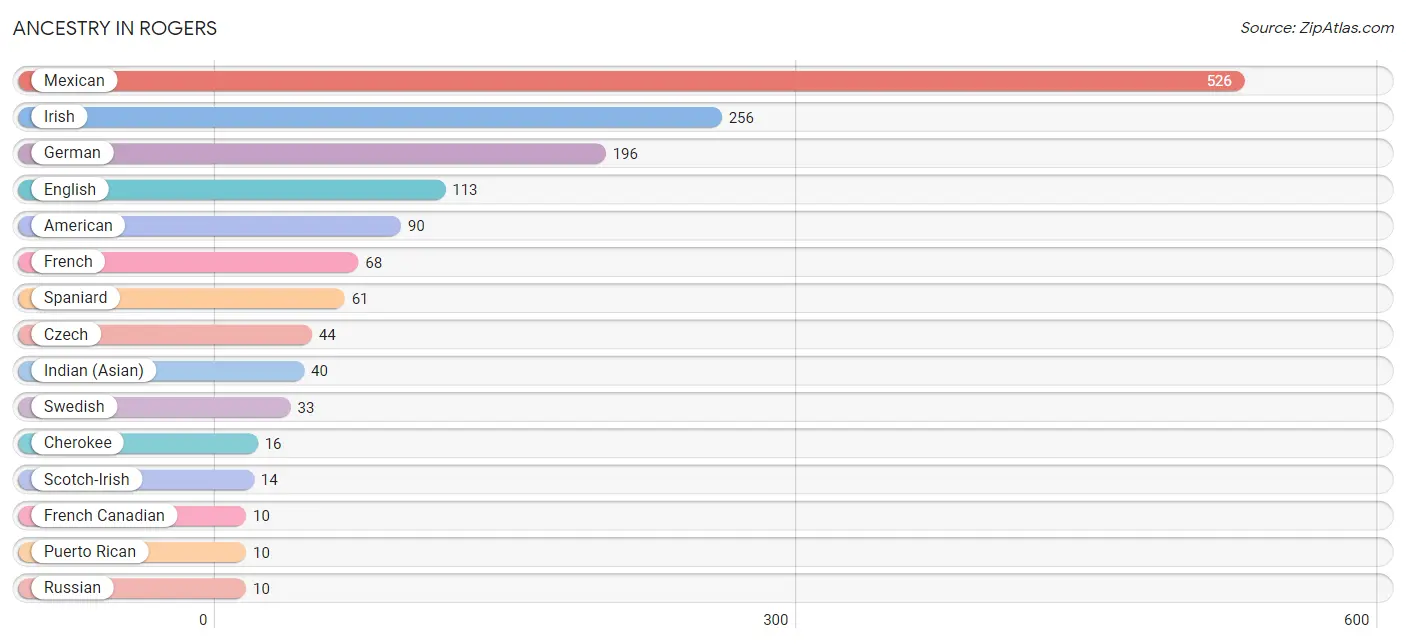
| Ancestry | # Population | % Population |
| American | 90 | 6.2% |
| British | 3 | 0.2% |
| Cherokee | 16 | 1.1% |
| Czech | 44 | 3.0% |
| Dutch | 7 | 0.5% |
| English | 113 | 7.8% |
| French | 68 | 4.7% |
| French Canadian | 10 | 0.7% |
| German | 196 | 13.6% |
| Greek | 3 | 0.2% |
| Indian (Asian) | 40 | 2.8% |
| Irish | 256 | 17.7% |
| Italian | 5 | 0.4% |
| Mexican | 526 | 36.4% |
| Pakistani | 7 | 0.5% |
| Puerto Rican | 10 | 0.7% |
| Russian | 10 | 0.7% |
| Scotch-Irish | 14 | 1.0% |
| Scottish | 4 | 0.3% |
| Spaniard | 61 | 4.2% |
| Swedish | 33 | 2.3% | View All 21 Rows |
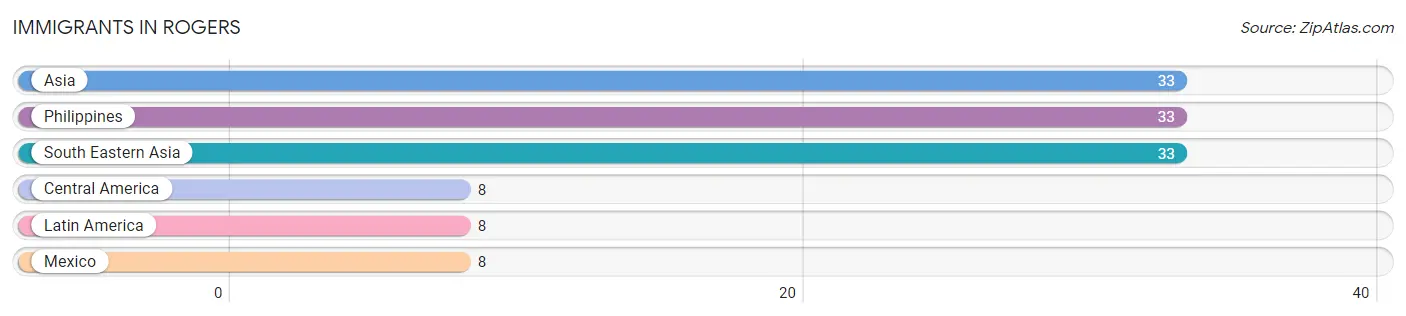
Immigrants in Rogers
The most numerous immigrant groups reported in Rogers came from Asia (33 | 2.3%), Philippines (33 | 2.3%), South Eastern Asia (33 | 2.3%), Central America (8 | 0.5%), and Latin America (8 | 0.5%), together accounting for 8.0% of all Rogers residents.
| Immigration Origin | # Population | % Population |
| Asia | 33 | 2.3% |
| Central America | 8 | 0.5% |
| Latin America | 8 | 0.5% |
| Mexico | 8 | 0.5% |
| Philippines | 33 | 2.3% |
| South Eastern Asia | 33 | 2.3% | View All 6 Rows |
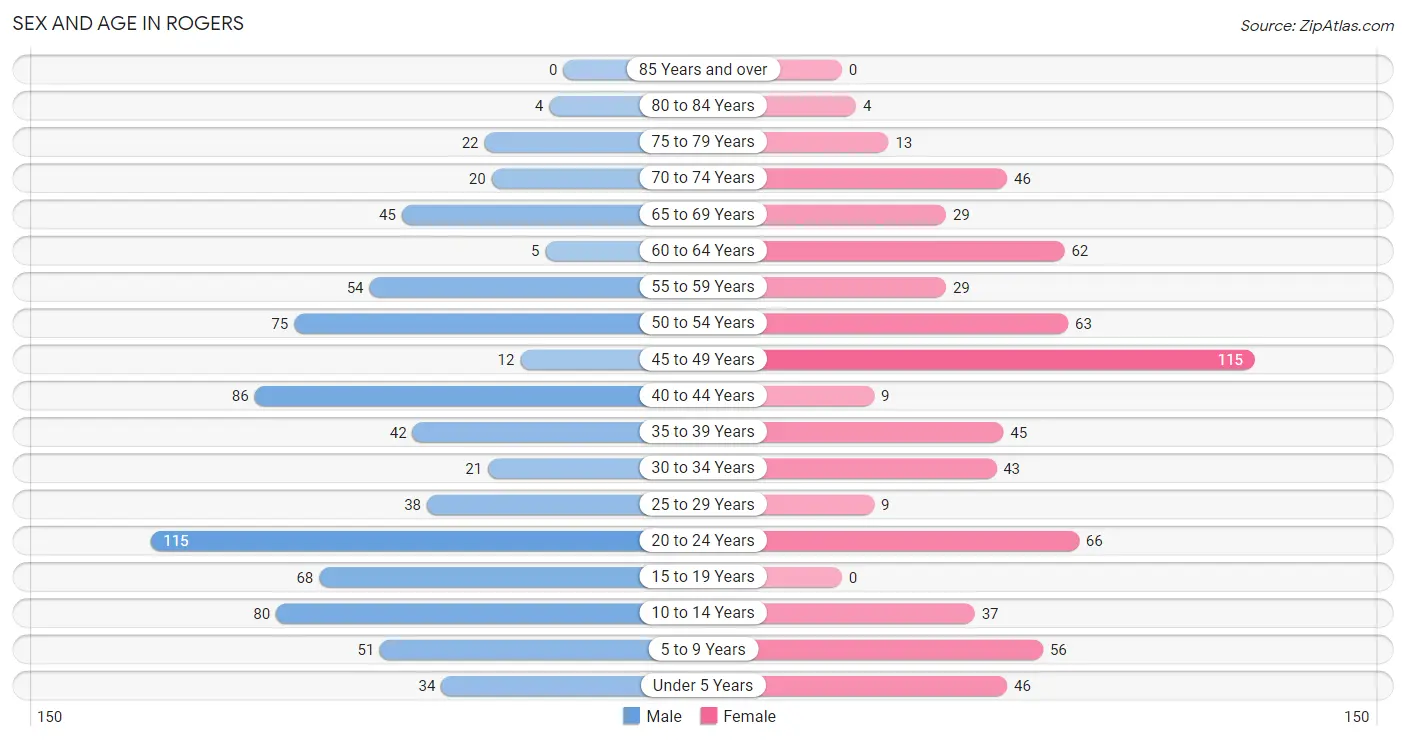
Sex and Age in Rogers
Sex and Age in Rogers
The most populous age groups in Rogers are 20 to 24 Years (115 | 14.9%) for men and 45 to 49 Years (115 | 17.1%) for women.
| Age Bracket | Male | Female |
| Under 5 Years | 34 (4.4%) | 46 (6.9%) |
| 5 to 9 Years | 51 (6.6%) | 56 (8.3%) |
| 10 to 14 Years | 80 (10.4%) | 37 (5.5%) |
| 15 to 19 Years | 68 (8.8%) | 0 (0.0%) |
| 20 to 24 Years | 115 (14.9%) | 66 (9.8%) |
| 25 to 29 Years | 38 (4.9%) | 9 (1.3%) |
| 30 to 34 Years | 21 (2.7%) | 43 (6.4%) |
| 35 to 39 Years | 42 (5.4%) | 45 (6.7%) |
| 40 to 44 Years | 86 (11.1%) | 9 (1.3%) |
| 45 to 49 Years | 12 (1.5%) | 115 (17.1%) |
| 50 to 54 Years | 75 (9.7%) | 63 (9.4%) |
| 55 to 59 Years | 54 (7.0%) | 29 (4.3%) |
| 60 to 64 Years | 5 (0.6%) | 62 (9.2%) |
| 65 to 69 Years | 45 (5.8%) | 29 (4.3%) |
| 70 to 74 Years | 20 (2.6%) | 46 (6.9%) |
| 75 to 79 Years | 22 (2.9%) | 13 (1.9%) |
| 80 to 84 Years | 4 (0.5%) | 4 (0.6%) |
| 85 Years and over | 0 (0.0%) | 0 (0.0%) |
| Total | 772 (100.0%) | 672 (100.0%) |
Families and Households in Rogers
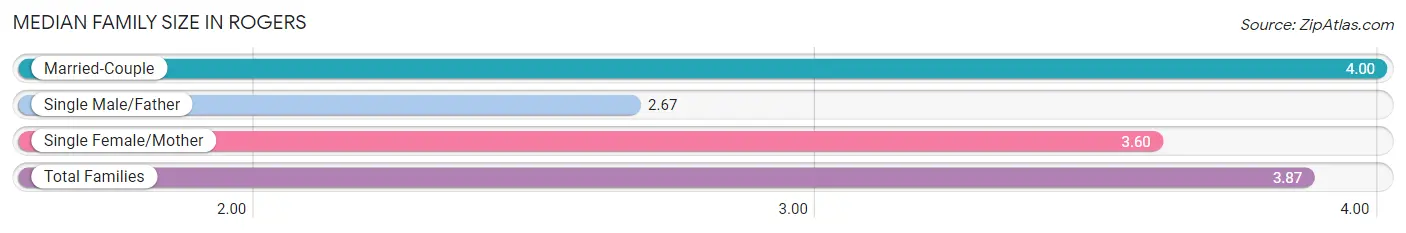
Median Family Size in Rogers
The median family size in Rogers is 3.87 persons per family, with married-couple families (247 | 70.8%) accounting for the largest median family size of 4 persons per family. On the other hand, single male/father families (6 | 1.7%) represent the smallest median family size with 2.67 persons per family.
| Family Type | # Families | Family Size |
| Married-Couple | 247 (70.8%) | 4.00 |
| Single Male/Father | 6 (1.7%) | 2.67 |
| Single Female/Mother | 96 (27.5%) | 3.60 |
| Total Families | 349 (100.0%) | 3.87 |
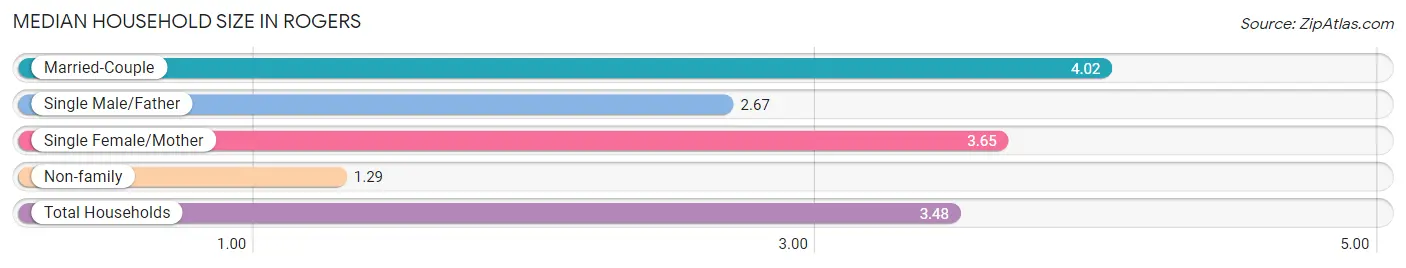
Median Household Size in Rogers
The median household size in Rogers is 3.48 persons per household, with married-couple households (247 | 59.5%) accounting for the largest median household size of 4.02 persons per household. non-family households (66 | 15.9%) represent the smallest median household size with 1.29 persons per household.
| Household Type | # Households | Household Size |
| Married-Couple | 247 (59.5%) | 4.02 |
| Single Male/Father | 6 (1.5%) | 2.67 |
| Single Female/Mother | 96 (23.1%) | 3.65 |
| Non-family | 66 (15.9%) | 1.29 |
| Total Households | 415 (100.0%) | 3.48 |
Household Size by Marriage Status in Rogers
Out of a total of 415 households in Rogers, 349 (84.1%) are family households, while 66 (15.9%) are nonfamily households. The most numerous type of family households are 2-person households, comprising 119, and the most common type of nonfamily households are 1-person households, comprising 49.
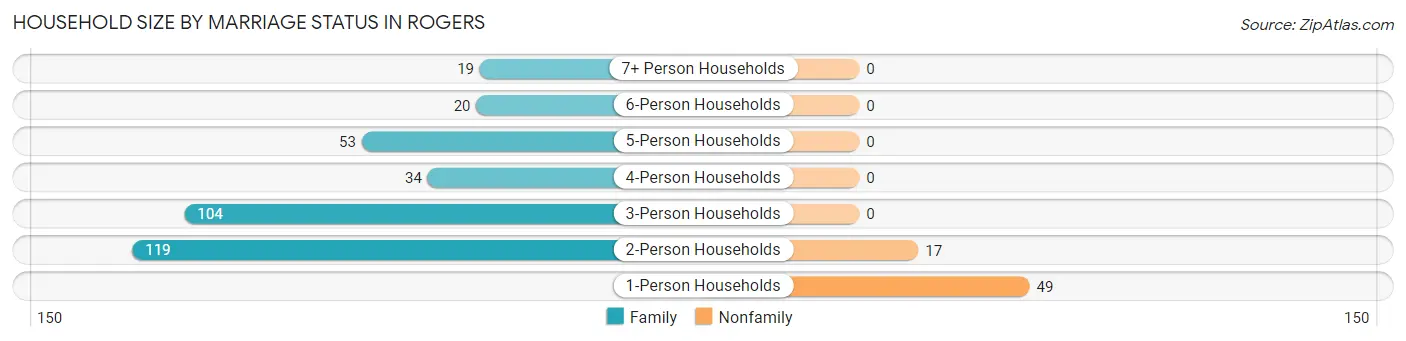
| Household Size | Family Households | Nonfamily Households |
| 1-Person Households | - | 49 (11.8%) |
| 2-Person Households | 119 (28.7%) | 17 (4.1%) |
| 3-Person Households | 104 (25.1%) | 0 (0.0%) |
| 4-Person Households | 34 (8.2%) | 0 (0.0%) |
| 5-Person Households | 53 (12.8%) | 0 (0.0%) |
| 6-Person Households | 20 (4.8%) | 0 (0.0%) |
| 7+ Person Households | 19 (4.6%) | 0 (0.0%) |
| Total | 349 (84.1%) | 66 (15.9%) |
Female Fertility in Rogers
Fertility by Age in Rogers
Average fertility rate in Rogers is 70.0 births per 1,000 women. Women in the age bracket of 35 to 50 years have the highest fertility rate with 118.0 births per 1,000 women. Women in the age bracket of 35 to 50 years acount for 100.0% of all women with births.
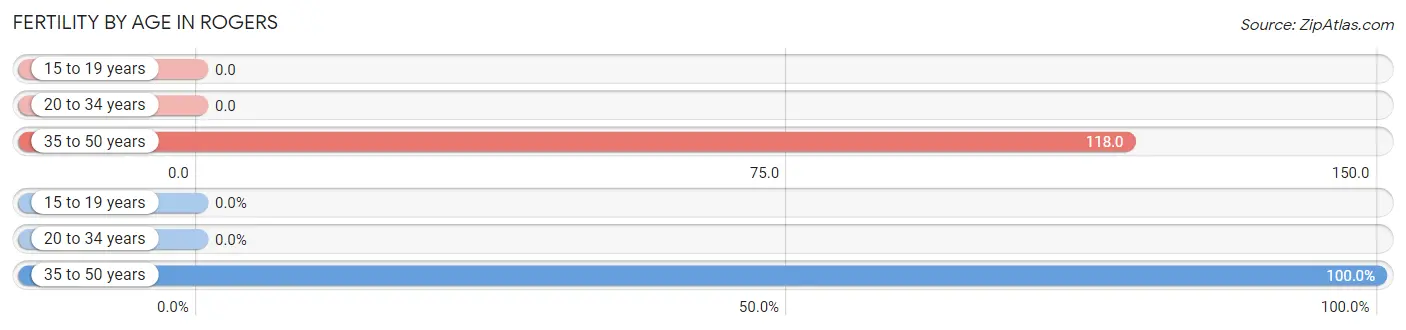
| Age Bracket | Women with Births | Births / 1,000 Women |
| 15 to 19 years | 0 (0.0%) | 0.0 |
| 20 to 34 years | 0 (0.0%) | 0.0 |
| 35 to 50 years | 20 (100.0%) | 118.0 |
| Total | 20 (100.0%) | 70.0 |
Fertility by Age by Marriage Status in Rogers
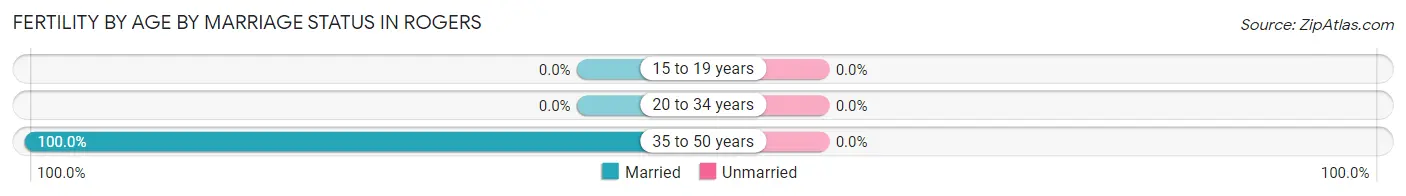
| Age Bracket | Married | Unmarried |
| 15 to 19 years | 0 (0.0%) | 0 (0.0%) |
| 20 to 34 years | 0 (0.0%) | 0 (0.0%) |
| 35 to 50 years | 20 (100.0%) | 0 (0.0%) |
| Total | 20 (100.0%) | 0 (0.0%) |
Fertility by Education in Rogers
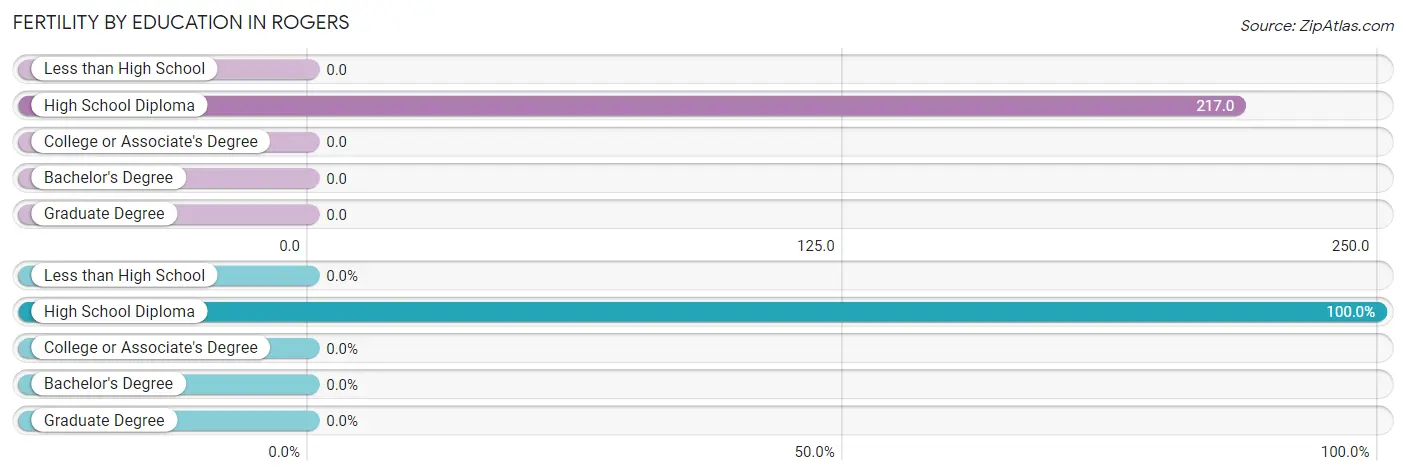
| Educational Attainment | Women with Births | Births / 1,000 Women |
| Less than High School | 0 (0.0%) | 0.0 |
| High School Diploma | 20 (100.0%) | 217.0 |
| College or Associate's Degree | 0 (0.0%) | 0.0 |
| Bachelor's Degree | 0 (0.0%) | 0.0 |
| Graduate Degree | 0 (0.0%) | 0.0 |
| Total | 20 (100.0%) | 70.0 |
Fertility by Education by Marriage Status in Rogers
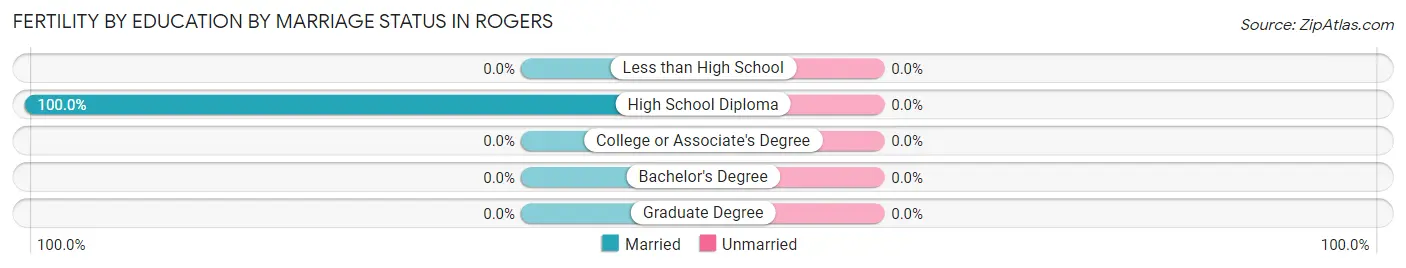
| Educational Attainment | Married | Unmarried |
| Less than High School | 0 (0.0%) | 0 (0.0%) |
| High School Diploma | 20 (100.0%) | 0 (0.0%) |
| College or Associate's Degree | 0 (0.0%) | 0 (0.0%) |
| Bachelor's Degree | 0 (0.0%) | 0 (0.0%) |
| Graduate Degree | 0 (0.0%) | 0 (0.0%) |
| Total | 20 (100.0%) | 0 (0.0%) |
Employment Characteristics in Rogers
Employment by Class of Employer in Rogers
Among the 709 employed individuals in Rogers, private company employees (512 | 72.2%), not-for-profit organizations (66 | 9.3%), and local government employees (39 | 5.5%) make up the most common classes of employment.
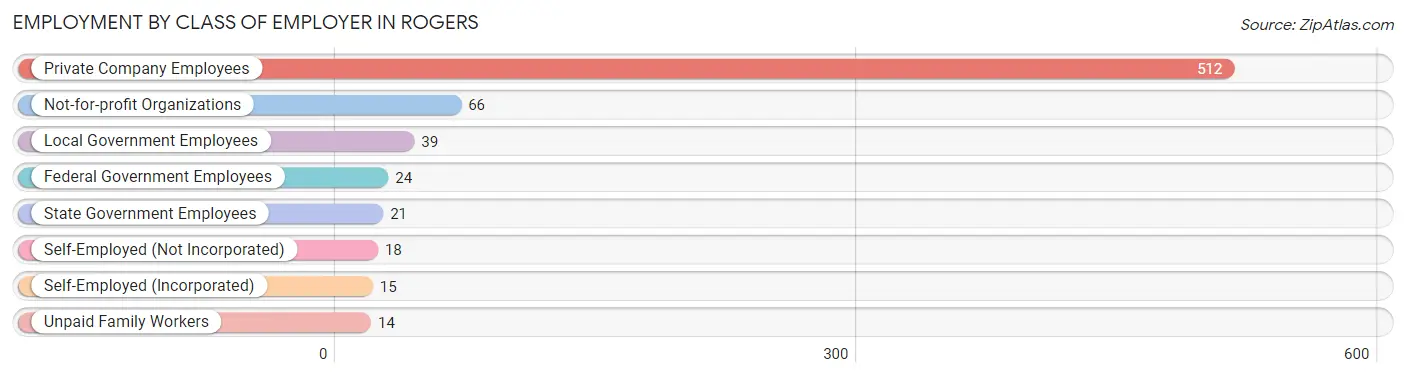
| Employer Class | # Employees | % Employees |
| Private Company Employees | 512 | 72.2% |
| Self-Employed (Incorporated) | 15 | 2.1% |
| Self-Employed (Not Incorporated) | 18 | 2.5% |
| Not-for-profit Organizations | 66 | 9.3% |
| Local Government Employees | 39 | 5.5% |
| State Government Employees | 21 | 3.0% |
| Federal Government Employees | 24 | 3.4% |
| Unpaid Family Workers | 14 | 2.0% |
| Total | 709 | 100.0% |
Employment Status by Age in Rogers
According to the labor force statistics for Rogers, out of the total population over 16 years of age (1,137), 66.2% or 753 individuals are in the labor force, with 4.8% or 36 of them unemployed. The age group with the highest labor force participation rate is 30 to 34 years, with 100.0% or 64 individuals in the labor force. Within the labor force, the 25 to 29 years age range has the highest percentage of unemployed individuals, with 76.9% or 30 of them being unemployed.
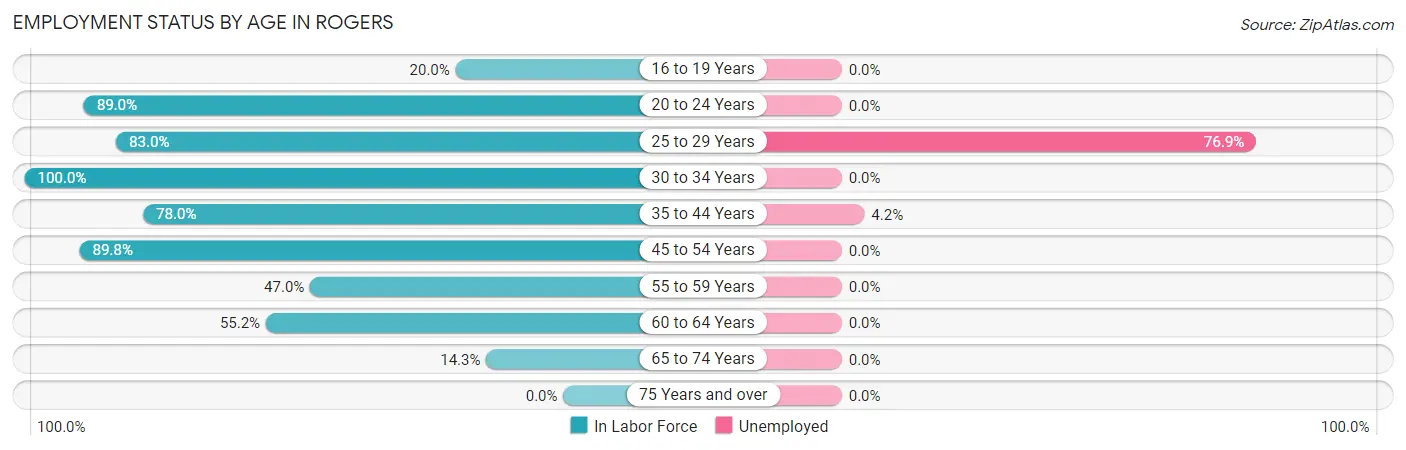
| Age Bracket | In Labor Force | Unemployed |
| 16 to 19 Years | 13 (20.0%) | 0 (0.0%) |
| 20 to 24 Years | 161 (89.0%) | 0 (0.0%) |
| 25 to 29 Years | 39 (83.0%) | 30 (76.9%) |
| 30 to 34 Years | 64 (100.0%) | 0 (0.0%) |
| 35 to 44 Years | 142 (78.0%) | 6 (4.2%) |
| 45 to 54 Years | 238 (89.8%) | 0 (0.0%) |
| 55 to 59 Years | 39 (47.0%) | 0 (0.0%) |
| 60 to 64 Years | 37 (55.2%) | 0 (0.0%) |
| 65 to 74 Years | 20 (14.3%) | 0 (0.0%) |
| 75 Years and over | 0 (0.0%) | 0 (0.0%) |
| Total | 753 (66.2%) | 36 (4.8%) |
Employment Status by Educational Attainment in Rogers
According to labor force statistics for Rogers, 79.0% of individuals (559) out of the total population between 25 and 64 years of age (708) are in the labor force, with 6.4% or 36 of them being unemployed. The group with the highest labor force participation rate are those with the educational attainment of bachelor's degree or higher, with 100.0% or 28 individuals in the labor force. Within the labor force, individuals with high school diploma education have the highest percentage of unemployment, with 14.4% or 36 of them being unemployed.
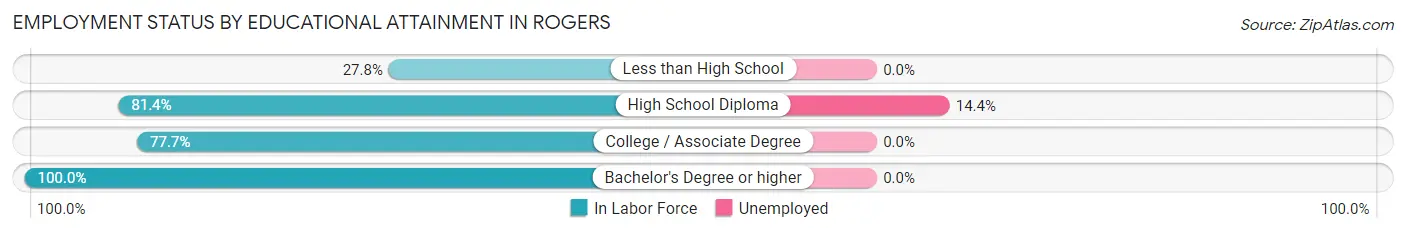
| Educational Attainment | In Labor Force | Unemployed |
| Less than High School | 5 (27.8%) | 0 (0.0%) |
| High School Diploma | 250 (81.4%) | 44 (14.4%) |
| College / Associate Degree | 276 (77.7%) | 0 (0.0%) |
| Bachelor's Degree or higher | 28 (100.0%) | 0 (0.0%) |
| Total | 559 (79.0%) | 45 (6.4%) |
Employment Occupations by Sex in Rogers
Management, Business, Science and Arts Occupations
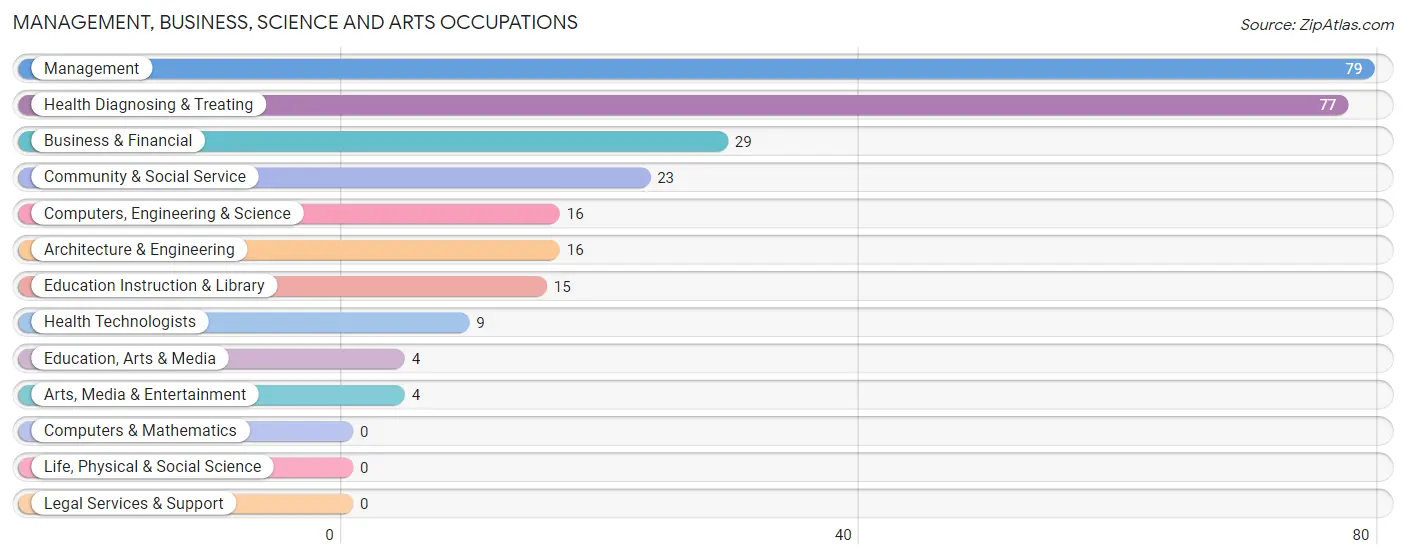
The most common Management, Business, Science and Arts occupations in Rogers are Management (79 | 11.0%), Health Diagnosing & Treating (77 | 10.7%), Business & Financial (29 | 4.0%), Community & Social Service (23 | 3.2%), and Computers, Engineering & Science (16 | 2.2%).
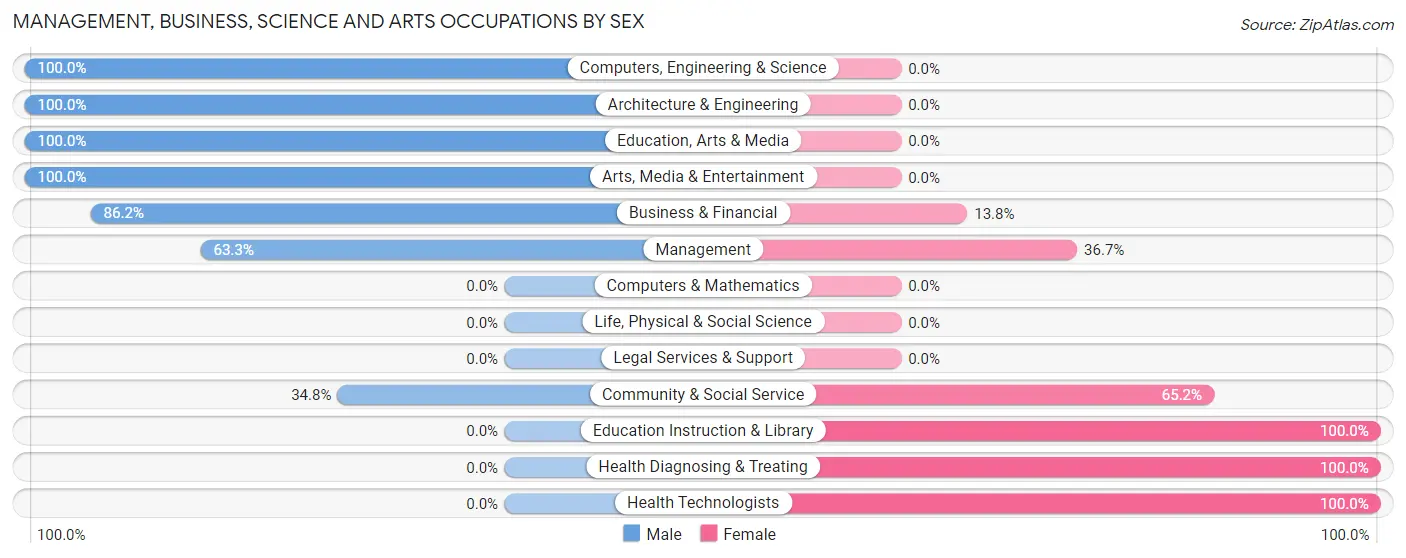
Management, Business, Science and Arts Occupations by Sex
Within the Management, Business, Science and Arts occupations in Rogers, the most male-oriented occupations are Computers, Engineering & Science (100.0%), Architecture & Engineering (100.0%), and Education, Arts & Media (100.0%), while the most female-oriented occupations are Education Instruction & Library (100.0%), Health Diagnosing & Treating (100.0%), and Health Technologists (100.0%).
| Occupation | Male | Female |
| Management | 50 (63.3%) | 29 (36.7%) |
| Business & Financial | 25 (86.2%) | 4 (13.8%) |
| Computers, Engineering & Science | 16 (100.0%) | 0 (0.0%) |
| Computers & Mathematics | 0 (0.0%) | 0 (0.0%) |
| Architecture & Engineering | 16 (100.0%) | 0 (0.0%) |
| Life, Physical & Social Science | 0 (0.0%) | 0 (0.0%) |
| Community & Social Service | 8 (34.8%) | 15 (65.2%) |
| Education, Arts & Media | 4 (100.0%) | 0 (0.0%) |
| Legal Services & Support | 0 (0.0%) | 0 (0.0%) |
| Education Instruction & Library | 0 (0.0%) | 15 (100.0%) |
| Arts, Media & Entertainment | 4 (100.0%) | 0 (0.0%) |
| Health Diagnosing & Treating | 0 (0.0%) | 77 (100.0%) |
| Health Technologists | 0 (0.0%) | 9 (100.0%) |
| Total (Category) | 99 (44.2%) | 125 (55.8%) |
| Total (Overall) | 363 (50.6%) | 354 (49.4%) |
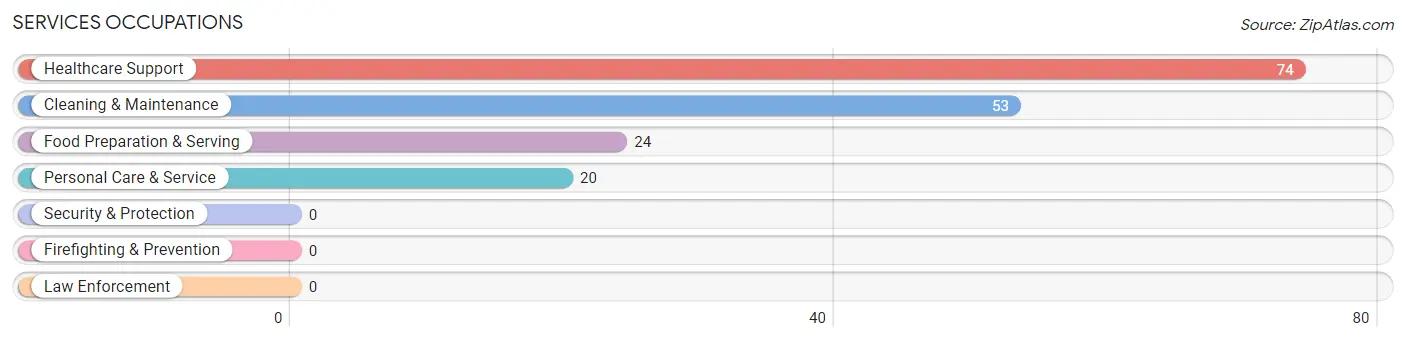
Services Occupations
The most common Services occupations in Rogers are Healthcare Support (74 | 10.3%), Cleaning & Maintenance (53 | 7.4%), Food Preparation & Serving (24 | 3.4%), and Personal Care & Service (20 | 2.8%).
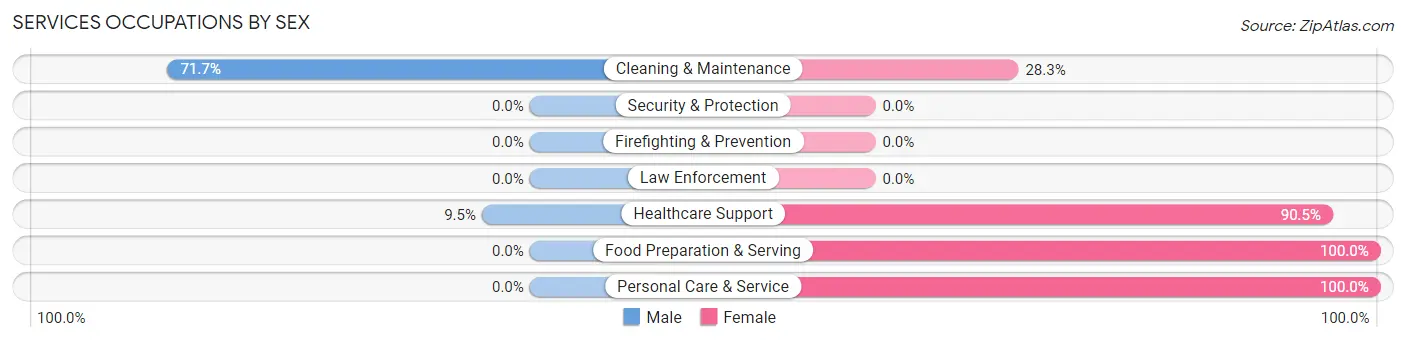
Services Occupations by Sex
Within the Services occupations in Rogers, the most male-oriented occupations are Cleaning & Maintenance (71.7%), and Healthcare Support (9.5%), while the most female-oriented occupations are Food Preparation & Serving (100.0%), Personal Care & Service (100.0%), and Healthcare Support (90.5%).
| Occupation | Male | Female |
| Healthcare Support | 7 (9.5%) | 67 (90.5%) |
| Security & Protection | 0 (0.0%) | 0 (0.0%) |
| Firefighting & Prevention | 0 (0.0%) | 0 (0.0%) |
| Law Enforcement | 0 (0.0%) | 0 (0.0%) |
| Food Preparation & Serving | 0 (0.0%) | 24 (100.0%) |
| Cleaning & Maintenance | 38 (71.7%) | 15 (28.3%) |
| Personal Care & Service | 0 (0.0%) | 20 (100.0%) |
| Total (Category) | 45 (26.3%) | 126 (73.7%) |
| Total (Overall) | 363 (50.6%) | 354 (49.4%) |
Sales and Office Occupations
The most common Sales and Office occupations in Rogers are Sales & Related (122 | 17.0%), and Office & Administration (41 | 5.7%).
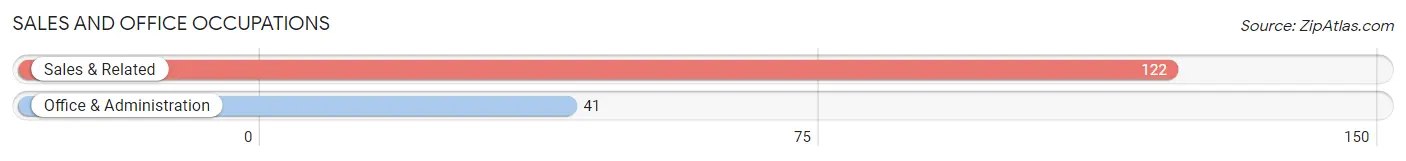
Sales and Office Occupations by Sex
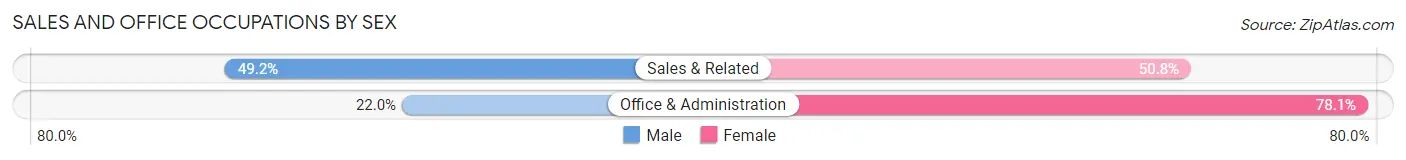
| Occupation | Male | Female |
| Sales & Related | 60 (49.2%) | 62 (50.8%) |
| Office & Administration | 9 (22.0%) | 32 (78.0%) |
| Total (Category) | 69 (42.3%) | 94 (57.7%) |
| Total (Overall) | 363 (50.6%) | 354 (49.4%) |
Natural Resources, Construction and Maintenance Occupations
The most common Natural Resources, Construction and Maintenance occupations in Rogers are Installation, Maintenance & Repair (49 | 6.8%), and Construction & Extraction (28 | 3.9%).
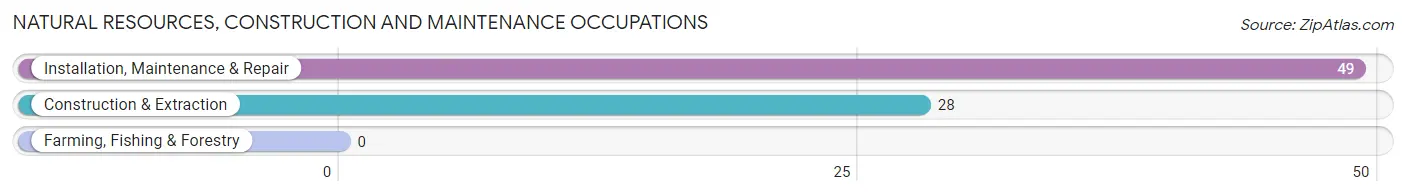
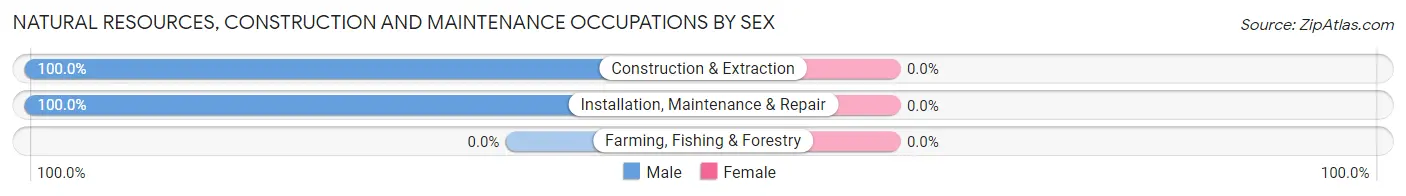
Natural Resources, Construction and Maintenance Occupations by Sex
| Occupation | Male | Female |
| Farming, Fishing & Forestry | 0 (0.0%) | 0 (0.0%) |
| Construction & Extraction | 28 (100.0%) | 0 (0.0%) |
| Installation, Maintenance & Repair | 49 (100.0%) | 0 (0.0%) |
| Total (Category) | 77 (100.0%) | 0 (0.0%) |
| Total (Overall) | 363 (50.6%) | 354 (49.4%) |
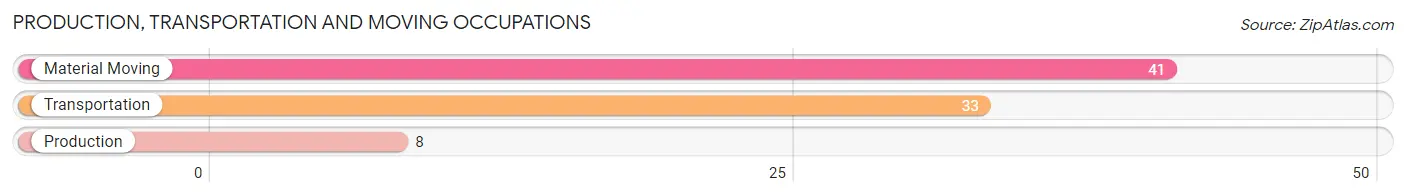
Production, Transportation and Moving Occupations
The most common Production, Transportation and Moving occupations in Rogers are Material Moving (41 | 5.7%), Transportation (33 | 4.6%), and Production (8 | 1.1%).
Production, Transportation and Moving Occupations by Sex
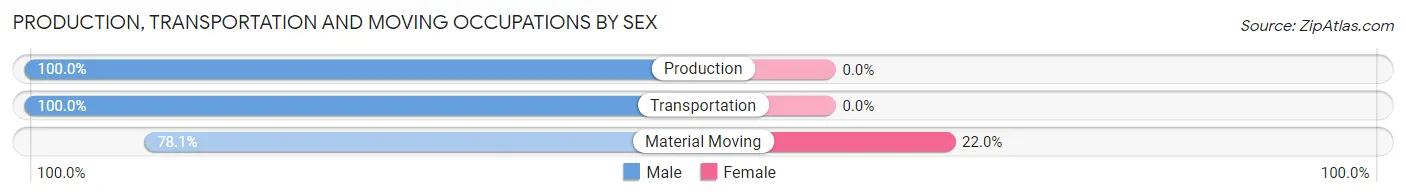
| Occupation | Male | Female |
| Production | 8 (100.0%) | 0 (0.0%) |
| Transportation | 33 (100.0%) | 0 (0.0%) |
| Material Moving | 32 (78.0%) | 9 (22.0%) |
| Total (Category) | 73 (89.0%) | 9 (11.0%) |
| Total (Overall) | 363 (50.6%) | 354 (49.4%) |
Employment Industries by Sex in Rogers
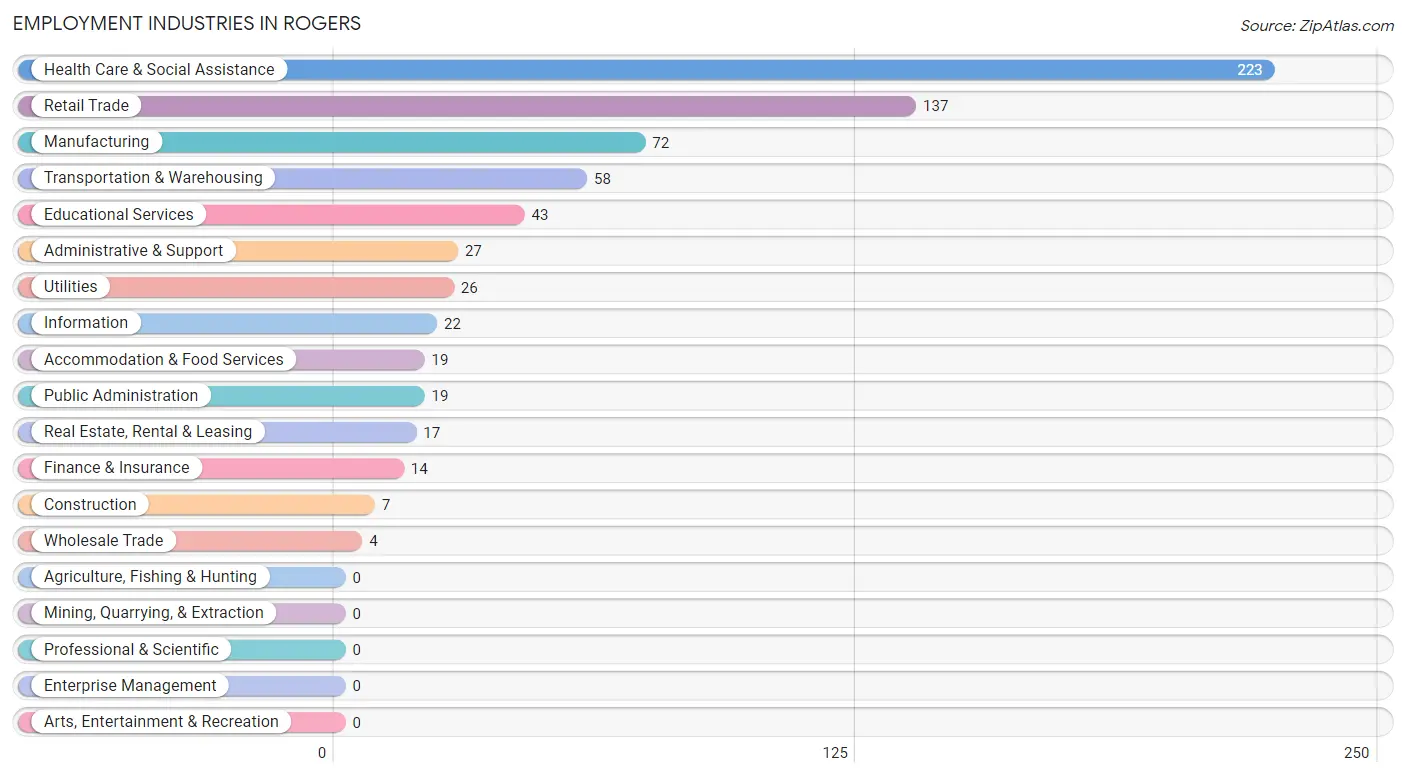
Employment Industries in Rogers
The major employment industries in Rogers include Health Care & Social Assistance (223 | 31.1%), Retail Trade (137 | 19.1%), Manufacturing (72 | 10.0%), Transportation & Warehousing (58 | 8.1%), and Educational Services (43 | 6.0%).
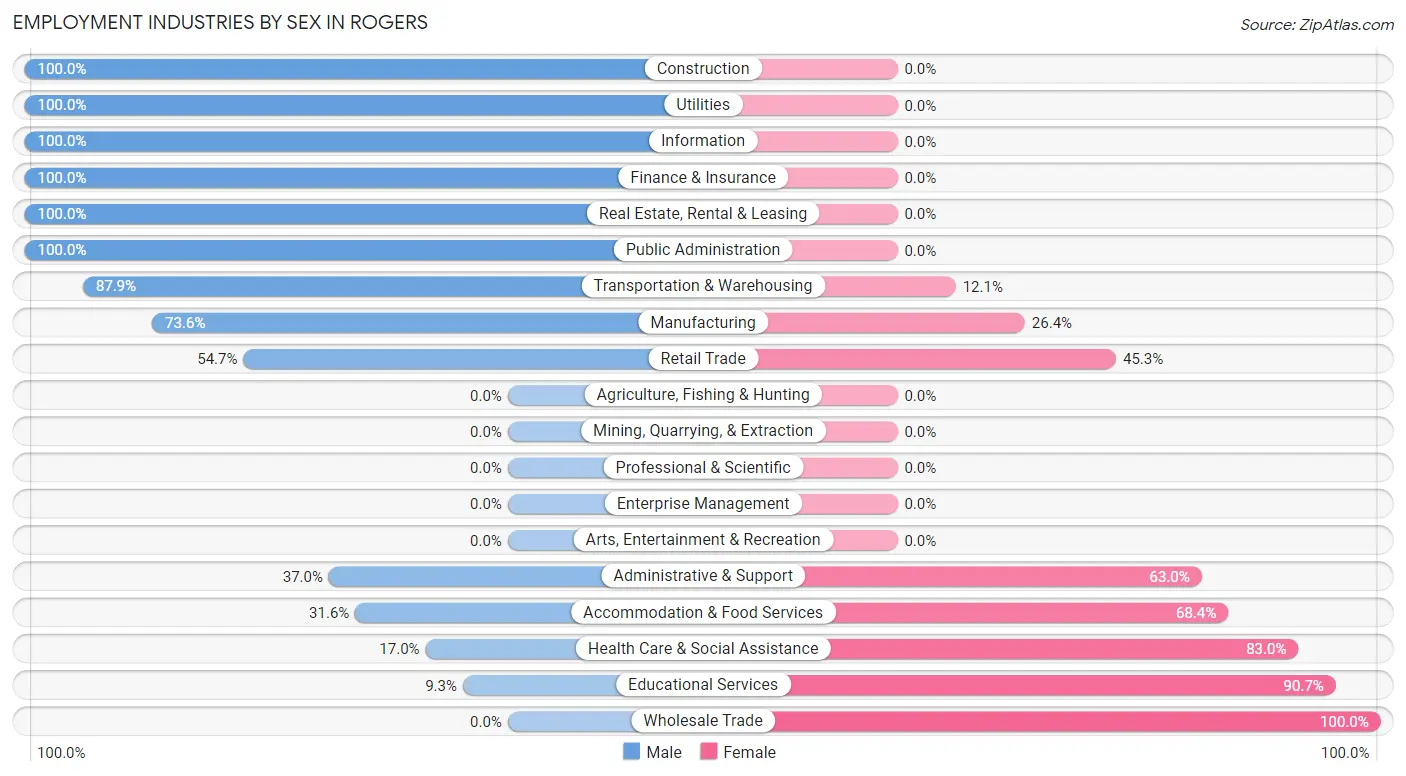
Employment Industries by Sex in Rogers
The Rogers industries that see more men than women are Construction (100.0%), Utilities (100.0%), and Information (100.0%), whereas the industries that tend to have a higher number of women are Wholesale Trade (100.0%), Educational Services (90.7%), and Health Care & Social Assistance (83.0%).
| Industry | Male | Female |
| Agriculture, Fishing & Hunting | 0 (0.0%) | 0 (0.0%) |
| Mining, Quarrying, & Extraction | 0 (0.0%) | 0 (0.0%) |
| Construction | 7 (100.0%) | 0 (0.0%) |
| Manufacturing | 53 (73.6%) | 19 (26.4%) |
| Wholesale Trade | 0 (0.0%) | 4 (100.0%) |
| Retail Trade | 75 (54.7%) | 62 (45.3%) |
| Transportation & Warehousing | 51 (87.9%) | 7 (12.1%) |
| Utilities | 26 (100.0%) | 0 (0.0%) |
| Information | 22 (100.0%) | 0 (0.0%) |
| Finance & Insurance | 14 (100.0%) | 0 (0.0%) |
| Real Estate, Rental & Leasing | 17 (100.0%) | 0 (0.0%) |
| Professional & Scientific | 0 (0.0%) | 0 (0.0%) |
| Enterprise Management | 0 (0.0%) | 0 (0.0%) |
| Administrative & Support | 10 (37.0%) | 17 (63.0%) |
| Educational Services | 4 (9.3%) | 39 (90.7%) |
| Health Care & Social Assistance | 38 (17.0%) | 185 (83.0%) |
| Arts, Entertainment & Recreation | 0 (0.0%) | 0 (0.0%) |
| Accommodation & Food Services | 6 (31.6%) | 13 (68.4%) |
| Public Administration | 19 (100.0%) | 0 (0.0%) |
| Total | 363 (50.6%) | 354 (49.4%) |
Education in Rogers
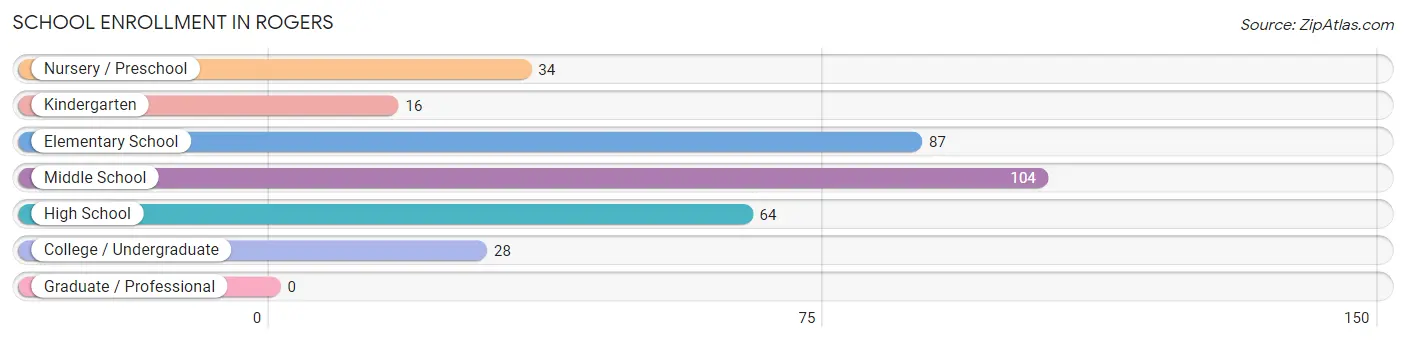
School Enrollment in Rogers
The most common levels of schooling among the 333 students in Rogers are middle school (104 | 31.2%), elementary school (87 | 26.1%), and high school (64 | 19.2%).
| School Level | # Students | % Students |
| Nursery / Preschool | 34 | 10.2% |
| Kindergarten | 16 | 4.8% |
| Elementary School | 87 | 26.1% |
| Middle School | 104 | 31.2% |
| High School | 64 | 19.2% |
| College / Undergraduate | 28 | 8.4% |
| Graduate / Professional | 0 | 0.0% |
| Total | 333 | 100.0% |
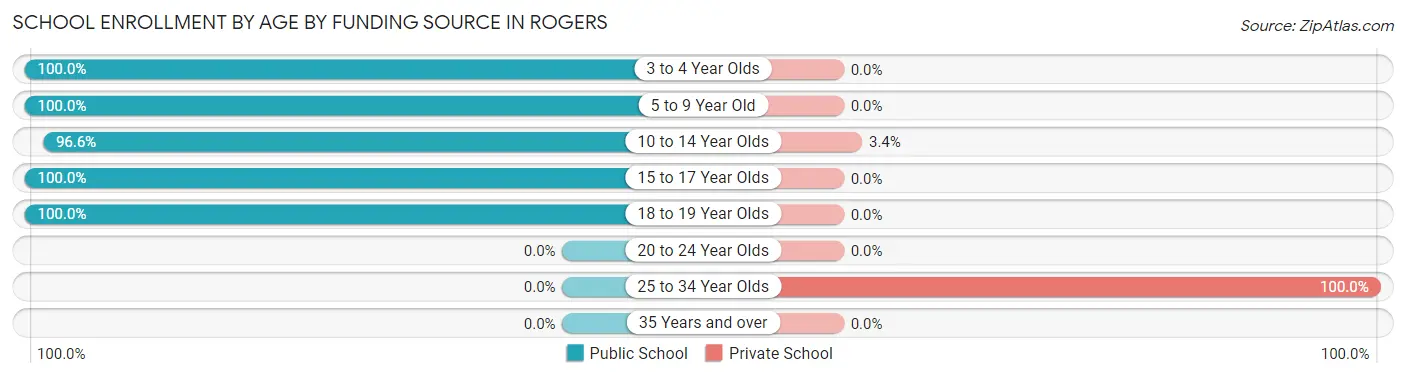
School Enrollment by Age by Funding Source in Rogers
Out of a total of 333 students who are enrolled in schools in Rogers, 19 (5.7%) attend a private institution, while the remaining 314 (94.3%) are enrolled in public schools. The age group of 25 to 34 year olds has the highest likelihood of being enrolled in private schools, with 15 (100.0% in the age bracket) enrolled. Conversely, the age group of 3 to 4 year olds has the lowest likelihood of being enrolled in a private school, with 30 (100.0% in the age bracket) attending a public institution.
| Age Bracket | Public School | Private School |
| 3 to 4 Year Olds | 30 (100.0%) | 0 (0.0%) |
| 5 to 9 Year Old | 107 (100.0%) | 0 (0.0%) |
| 10 to 14 Year Olds | 113 (96.6%) | 4 (3.4%) |
| 15 to 17 Year Olds | 51 (100.0%) | 0 (0.0%) |
| 18 to 19 Year Olds | 13 (100.0%) | 0 (0.0%) |
| 20 to 24 Year Olds | 0 (0.0%) | 0 (0.0%) |
| 25 to 34 Year Olds | 0 (0.0%) | 15 (100.0%) |
| 35 Years and over | 0 (0.0%) | 0 (0.0%) |
| Total | 314 (94.3%) | 19 (5.7%) |
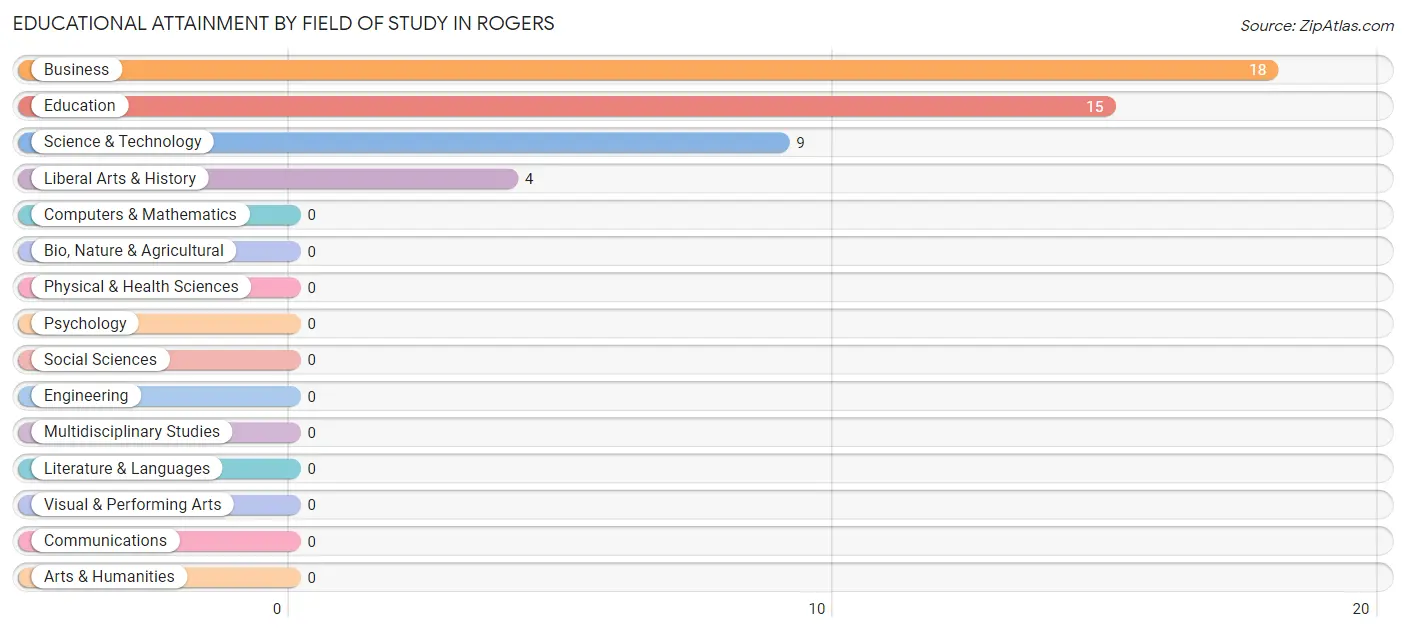
Educational Attainment by Field of Study in Rogers
Business (18 | 39.1%), education (15 | 32.6%), science & technology (9 | 19.6%), and liberal arts & history (4 | 8.7%) are the most common fields of study among 46 individuals in Rogers who have obtained a bachelor's degree or higher.
| Field of Study | # Graduates | % Graduates |
| Computers & Mathematics | 0 | 0.0% |
| Bio, Nature & Agricultural | 0 | 0.0% |
| Physical & Health Sciences | 0 | 0.0% |
| Psychology | 0 | 0.0% |
| Social Sciences | 0 | 0.0% |
| Engineering | 0 | 0.0% |
| Multidisciplinary Studies | 0 | 0.0% |
| Science & Technology | 9 | 19.6% |
| Business | 18 | 39.1% |
| Education | 15 | 32.6% |
| Literature & Languages | 0 | 0.0% |
| Liberal Arts & History | 4 | 8.7% |
| Visual & Performing Arts | 0 | 0.0% |
| Communications | 0 | 0.0% |
| Arts & Humanities | 0 | 0.0% |
| Total | 46 | 100.0% |
Transportation & Commute in Rogers
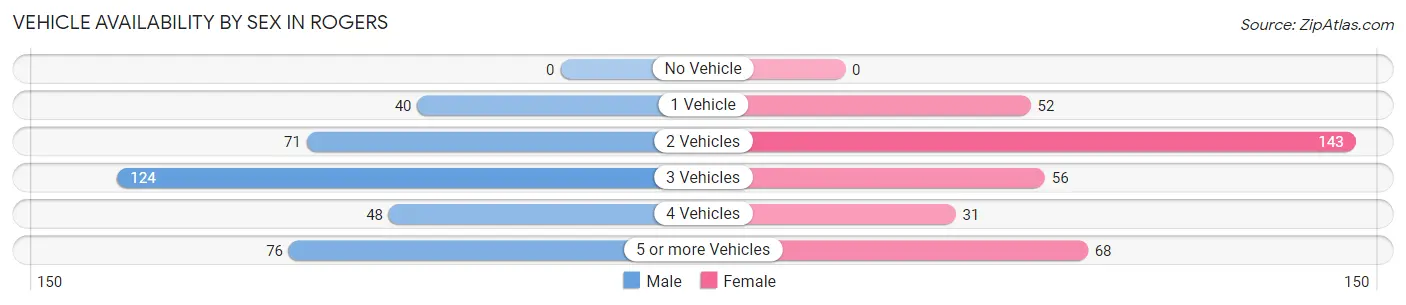
Vehicle Availability by Sex in Rogers
The most prevalent vehicle ownership categories in Rogers are males with 3 vehicles (124, accounting for 34.5%) and females with 3 vehicles (56, making up 35.4%).
| Vehicles Available | Male | Female |
| No Vehicle | 0 (0.0%) | 0 (0.0%) |
| 1 Vehicle | 40 (11.1%) | 52 (14.9%) |
| 2 Vehicles | 71 (19.8%) | 143 (40.9%) |
| 3 Vehicles | 124 (34.5%) | 56 (16.0%) |
| 4 Vehicles | 48 (13.4%) | 31 (8.9%) |
| 5 or more Vehicles | 76 (21.2%) | 68 (19.4%) |
| Total | 359 (100.0%) | 350 (100.0%) |
Commute Time in Rogers
The most frequently occuring commute durations in Rogers are 30 to 34 minutes (231 commuters, 33.0%), 25 to 29 minutes (100 commuters, 14.3%), and 20 to 24 minutes (86 commuters, 12.3%).
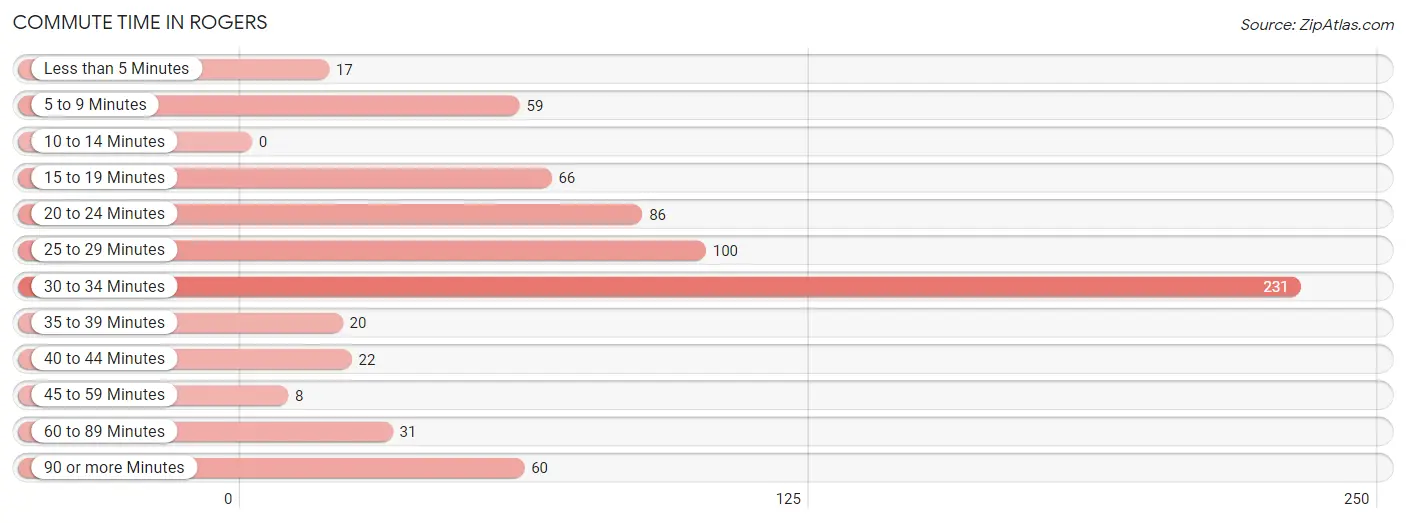
| Commute Time | # Commuters | % Commuters |
| Less than 5 Minutes | 17 | 2.4% |
| 5 to 9 Minutes | 59 | 8.4% |
| 10 to 14 Minutes | 0 | 0.0% |
| 15 to 19 Minutes | 66 | 9.4% |
| 20 to 24 Minutes | 86 | 12.3% |
| 25 to 29 Minutes | 100 | 14.3% |
| 30 to 34 Minutes | 231 | 33.0% |
| 35 to 39 Minutes | 20 | 2.9% |
| 40 to 44 Minutes | 22 | 3.1% |
| 45 to 59 Minutes | 8 | 1.1% |
| 60 to 89 Minutes | 31 | 4.4% |
| 90 or more Minutes | 60 | 8.6% |
Commute Time by Sex in Rogers
The most common commute times in Rogers are 30 to 34 minutes (129 commuters, 36.9%) for males and 30 to 34 minutes (102 commuters, 29.1%) for females.
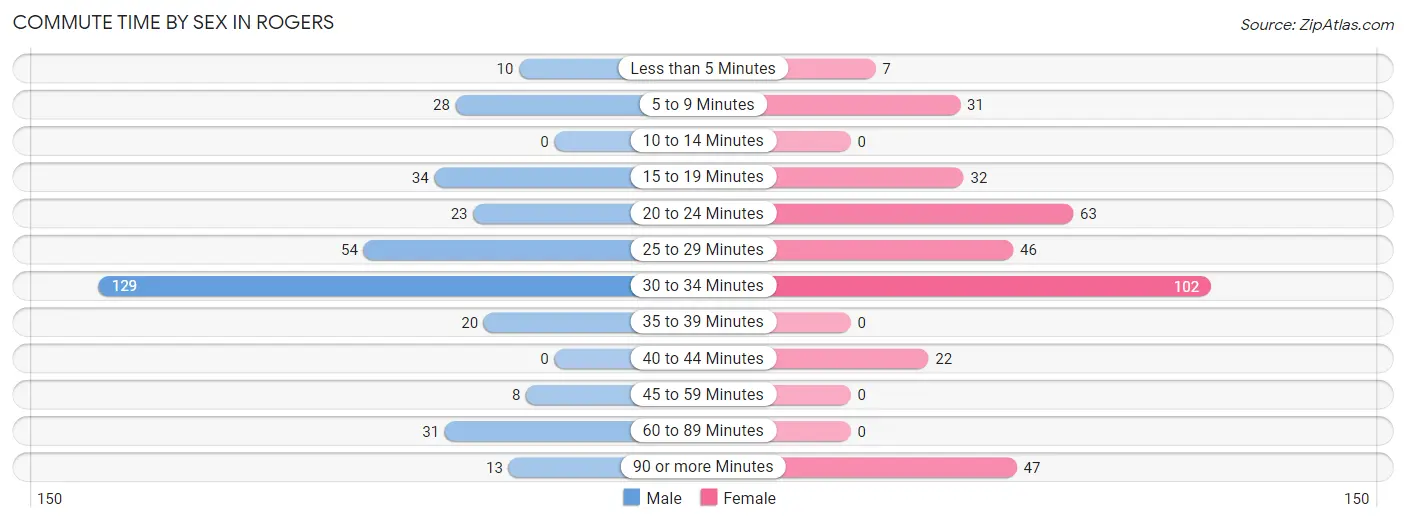
| Commute Time | Male | Female |
| Less than 5 Minutes | 10 (2.9%) | 7 (2.0%) |
| 5 to 9 Minutes | 28 (8.0%) | 31 (8.9%) |
| 10 to 14 Minutes | 0 (0.0%) | 0 (0.0%) |
| 15 to 19 Minutes | 34 (9.7%) | 32 (9.1%) |
| 20 to 24 Minutes | 23 (6.6%) | 63 (18.0%) |
| 25 to 29 Minutes | 54 (15.4%) | 46 (13.1%) |
| 30 to 34 Minutes | 129 (36.9%) | 102 (29.1%) |
| 35 to 39 Minutes | 20 (5.7%) | 0 (0.0%) |
| 40 to 44 Minutes | 0 (0.0%) | 22 (6.3%) |
| 45 to 59 Minutes | 8 (2.3%) | 0 (0.0%) |
| 60 to 89 Minutes | 31 (8.9%) | 0 (0.0%) |
| 90 or more Minutes | 13 (3.7%) | 47 (13.4%) |
Time of Departure to Work by Sex in Rogers
The most frequent times of departure to work in Rogers are 12:00 PM to 3:59 PM (58, 16.6%) for males and 12:00 AM to 4:59 AM (62, 17.7%) for females.
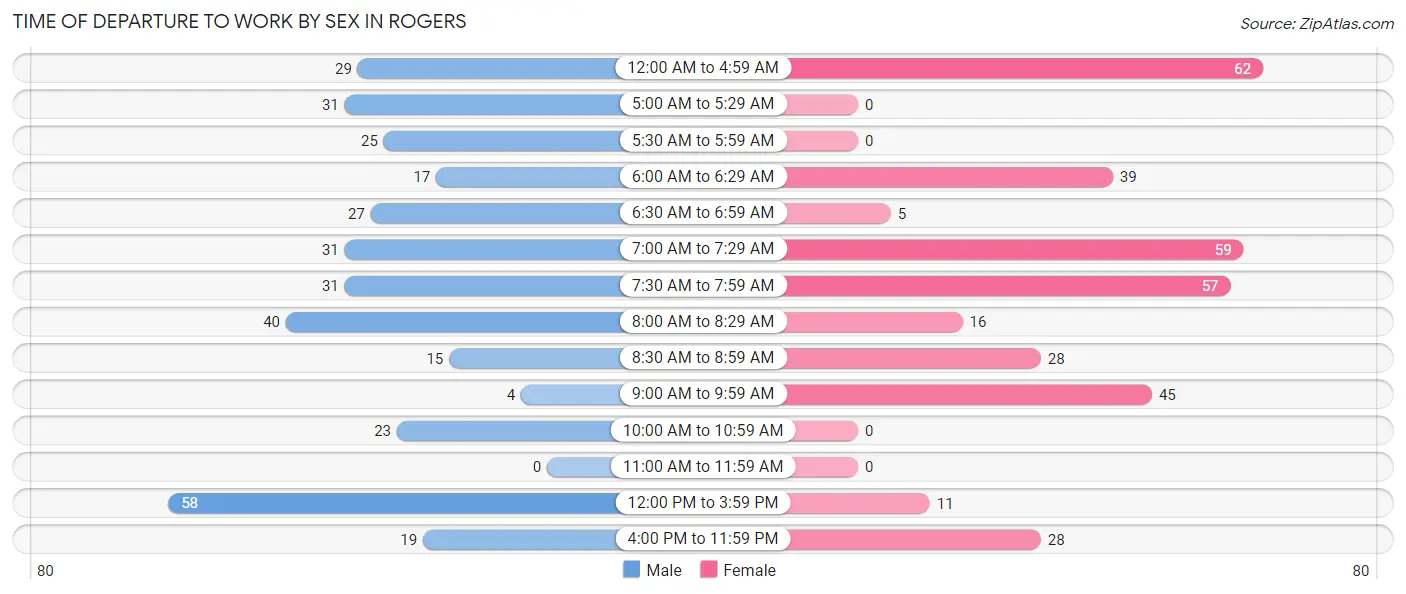
| Time of Departure | Male | Female |
| 12:00 AM to 4:59 AM | 29 (8.3%) | 62 (17.7%) |
| 5:00 AM to 5:29 AM | 31 (8.9%) | 0 (0.0%) |
| 5:30 AM to 5:59 AM | 25 (7.1%) | 0 (0.0%) |
| 6:00 AM to 6:29 AM | 17 (4.9%) | 39 (11.1%) |
| 6:30 AM to 6:59 AM | 27 (7.7%) | 5 (1.4%) |
| 7:00 AM to 7:29 AM | 31 (8.9%) | 59 (16.9%) |
| 7:30 AM to 7:59 AM | 31 (8.9%) | 57 (16.3%) |
| 8:00 AM to 8:29 AM | 40 (11.4%) | 16 (4.6%) |
| 8:30 AM to 8:59 AM | 15 (4.3%) | 28 (8.0%) |
| 9:00 AM to 9:59 AM | 4 (1.1%) | 45 (12.9%) |
| 10:00 AM to 10:59 AM | 23 (6.6%) | 0 (0.0%) |
| 11:00 AM to 11:59 AM | 0 (0.0%) | 0 (0.0%) |
| 12:00 PM to 3:59 PM | 58 (16.6%) | 11 (3.1%) |
| 4:00 PM to 11:59 PM | 19 (5.4%) | 28 (8.0%) |
| Total | 350 (100.0%) | 350 (100.0%) |
Housing Occupancy in Rogers
Occupancy by Ownership in Rogers
Of the total 415 dwellings in Rogers, owner-occupied units account for 310 (74.7%), while renter-occupied units make up 105 (25.3%).
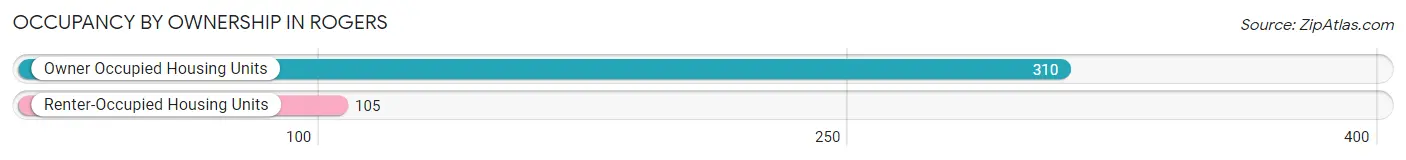
| Occupancy | # Housing Units | % Housing Units |
| Owner Occupied Housing Units | 310 | 74.7% |
| Renter-Occupied Housing Units | 105 | 25.3% |
| Total Occupied Housing Units | 415 | 100.0% |
Occupancy by Household Size in Rogers
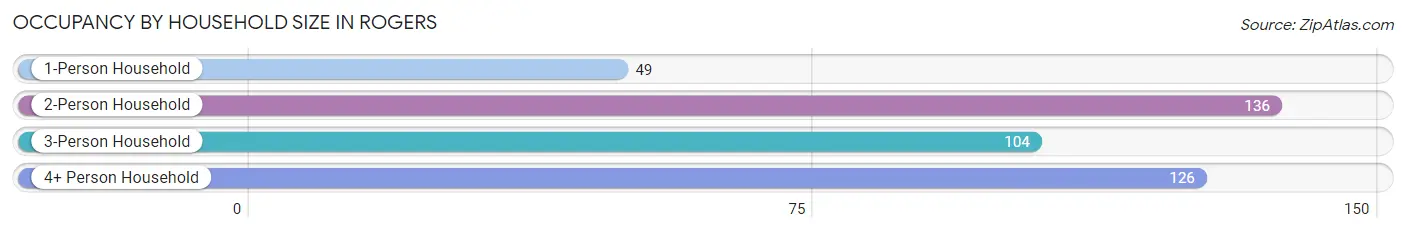
| Household Size | # Housing Units | % Housing Units |
| 1-Person Household | 49 | 11.8% |
| 2-Person Household | 136 | 32.8% |
| 3-Person Household | 104 | 25.1% |
| 4+ Person Household | 126 | 30.4% |
| Total Housing Units | 415 | 100.0% |
Occupancy by Ownership by Household Size in Rogers
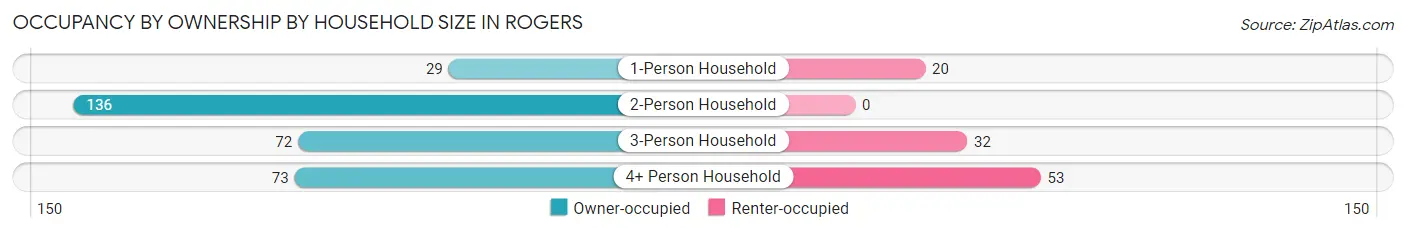
| Household Size | Owner-occupied | Renter-occupied |
| 1-Person Household | 29 (59.2%) | 20 (40.8%) |
| 2-Person Household | 136 (100.0%) | 0 (0.0%) |
| 3-Person Household | 72 (69.2%) | 32 (30.8%) |
| 4+ Person Household | 73 (57.9%) | 53 (42.1%) |
| Total Housing Units | 310 (74.7%) | 105 (25.3%) |
Occupancy by Educational Attainment in Rogers
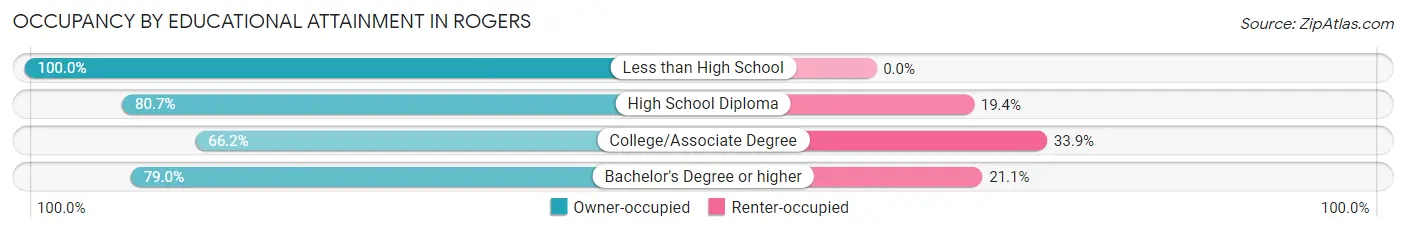
| Household Size | Owner-occupied | Renter-occupied |
| Less than High School | 18 (100.0%) | 0 (0.0%) |
| High School Diploma | 150 (80.6%) | 36 (19.4%) |
| College/Associate Degree | 127 (66.1%) | 65 (33.9%) |
| Bachelor's Degree or higher | 15 (78.9%) | 4 (21.0%) |
Occupancy by Age of Householder in Rogers
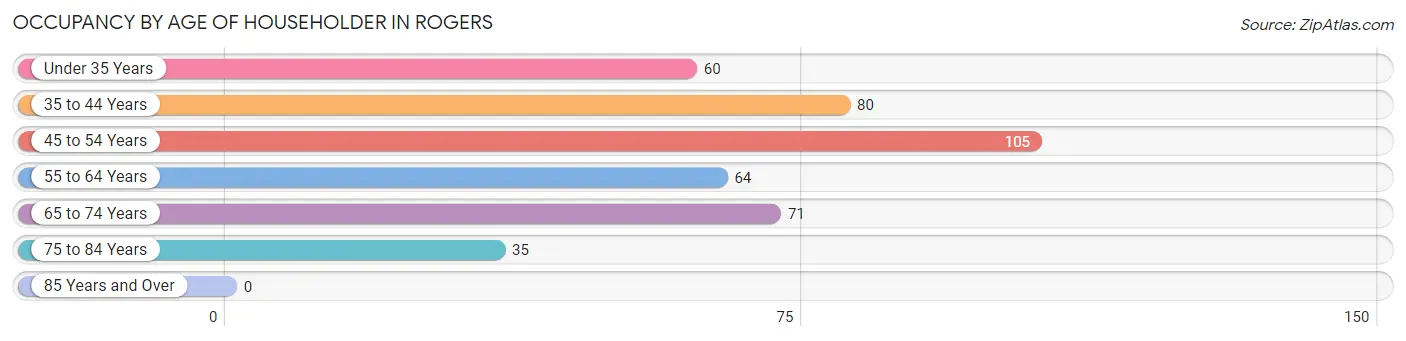
| Age Bracket | # Households | % Households |
| Under 35 Years | 60 | 14.5% |
| 35 to 44 Years | 80 | 19.3% |
| 45 to 54 Years | 105 | 25.3% |
| 55 to 64 Years | 64 | 15.4% |
| 65 to 74 Years | 71 | 17.1% |
| 75 to 84 Years | 35 | 8.4% |
| 85 Years and Over | 0 | 0.0% |
| Total | 415 | 100.0% |
Housing Finances in Rogers
Median Income by Occupancy in Rogers
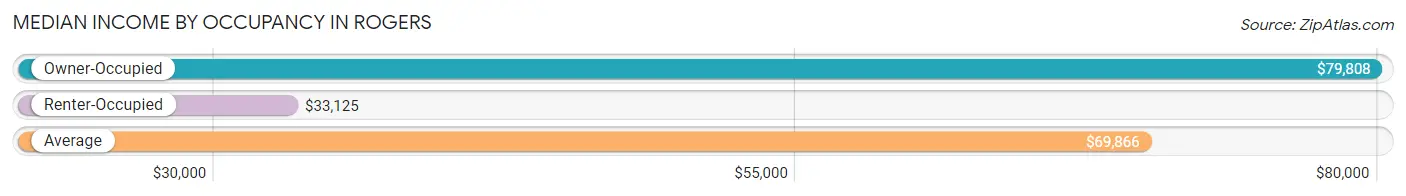
| Occupancy Type | # Households | Median Income |
| Owner-Occupied | 310 (74.7%) | $79,808 |
| Renter-Occupied | 105 (25.3%) | $33,125 |
| Average | 415 (100.0%) | $69,866 |
Occupancy by Householder Income Bracket in Rogers
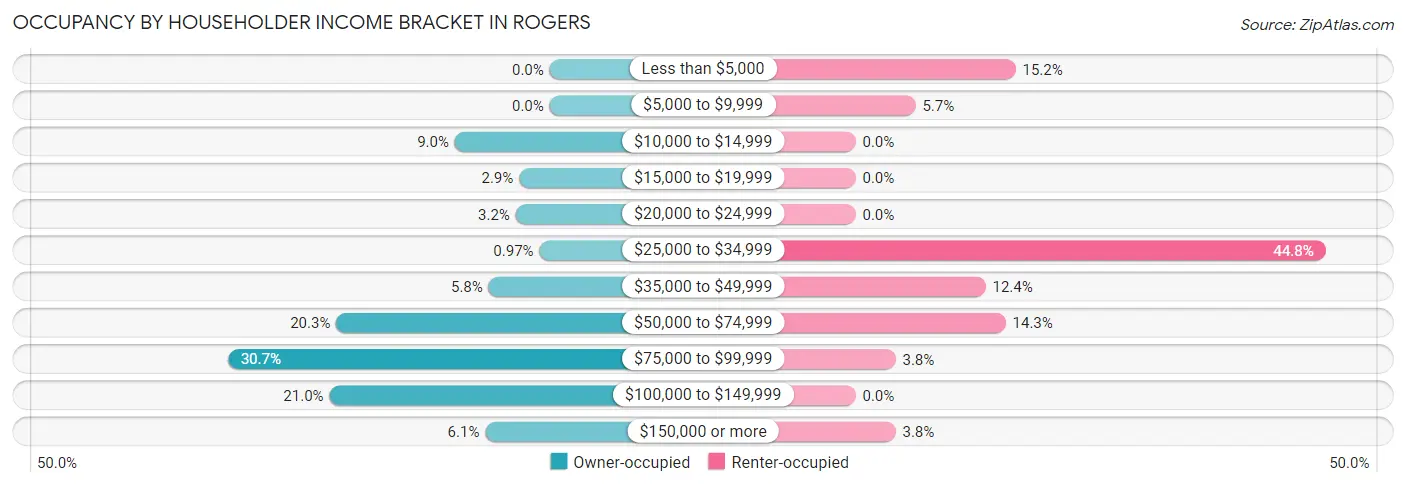
| Income Bracket | Owner-occupied | Renter-occupied |
| Less than $5,000 | 0 (0.0%) | 16 (15.2%) |
| $5,000 to $9,999 | 0 (0.0%) | 6 (5.7%) |
| $10,000 to $14,999 | 28 (9.0%) | 0 (0.0%) |
| $15,000 to $19,999 | 9 (2.9%) | 0 (0.0%) |
| $20,000 to $24,999 | 10 (3.2%) | 0 (0.0%) |
| $25,000 to $34,999 | 3 (1.0%) | 47 (44.8%) |
| $35,000 to $49,999 | 18 (5.8%) | 13 (12.4%) |
| $50,000 to $74,999 | 63 (20.3%) | 15 (14.3%) |
| $75,000 to $99,999 | 95 (30.6%) | 4 (3.8%) |
| $100,000 to $149,999 | 65 (21.0%) | 0 (0.0%) |
| $150,000 or more | 19 (6.1%) | 4 (3.8%) |
| Total | 310 (100.0%) | 105 (100.0%) |
Monthly Housing Cost Tiers in Rogers
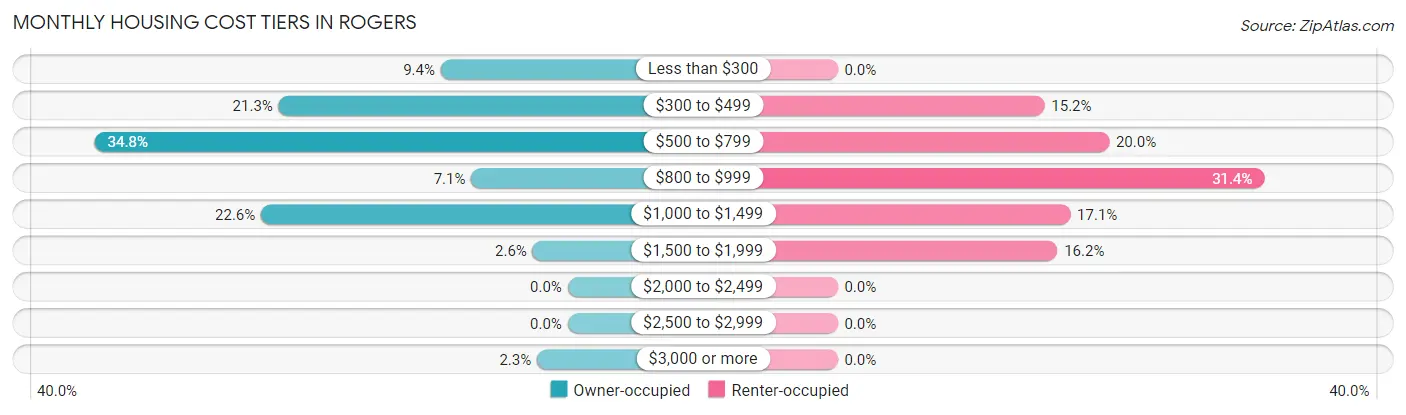
| Monthly Cost | Owner-occupied | Renter-occupied |
| Less than $300 | 29 (9.3%) | 0 (0.0%) |
| $300 to $499 | 66 (21.3%) | 16 (15.2%) |
| $500 to $799 | 108 (34.8%) | 21 (20.0%) |
| $800 to $999 | 22 (7.1%) | 33 (31.4%) |
| $1,000 to $1,499 | 70 (22.6%) | 18 (17.1%) |
| $1,500 to $1,999 | 8 (2.6%) | 17 (16.2%) |
| $2,000 to $2,499 | 0 (0.0%) | 0 (0.0%) |
| $2,500 to $2,999 | 0 (0.0%) | 0 (0.0%) |
| $3,000 or more | 7 (2.3%) | 0 (0.0%) |
| Total | 310 (100.0%) | 105 (100.0%) |
Physical Housing Characteristics in Rogers
Housing Structures in Rogers
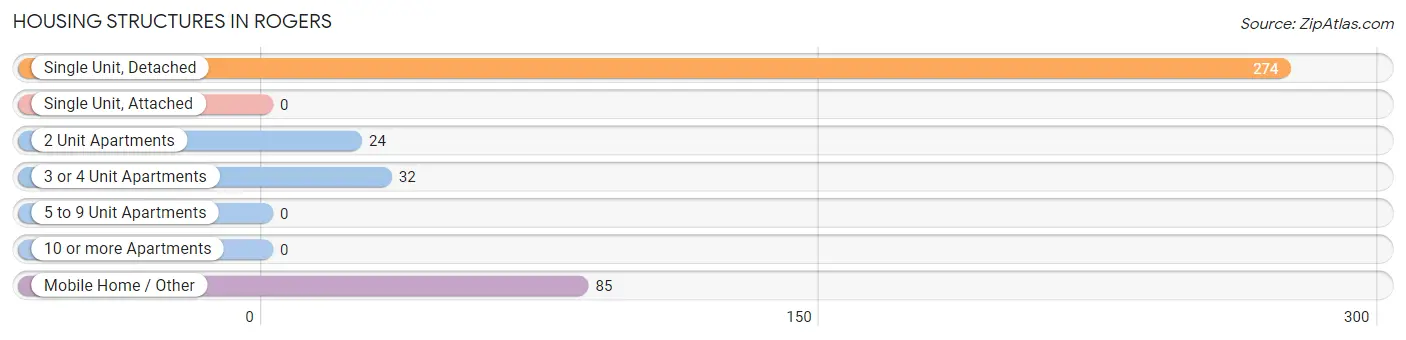
| Structure Type | # Housing Units | % Housing Units |
| Single Unit, Detached | 274 | 66.0% |
| Single Unit, Attached | 0 | 0.0% |
| 2 Unit Apartments | 24 | 5.8% |
| 3 or 4 Unit Apartments | 32 | 7.7% |
| 5 to 9 Unit Apartments | 0 | 0.0% |
| 10 or more Apartments | 0 | 0.0% |
| Mobile Home / Other | 85 | 20.5% |
| Total | 415 | 100.0% |
Housing Structures by Occupancy in Rogers
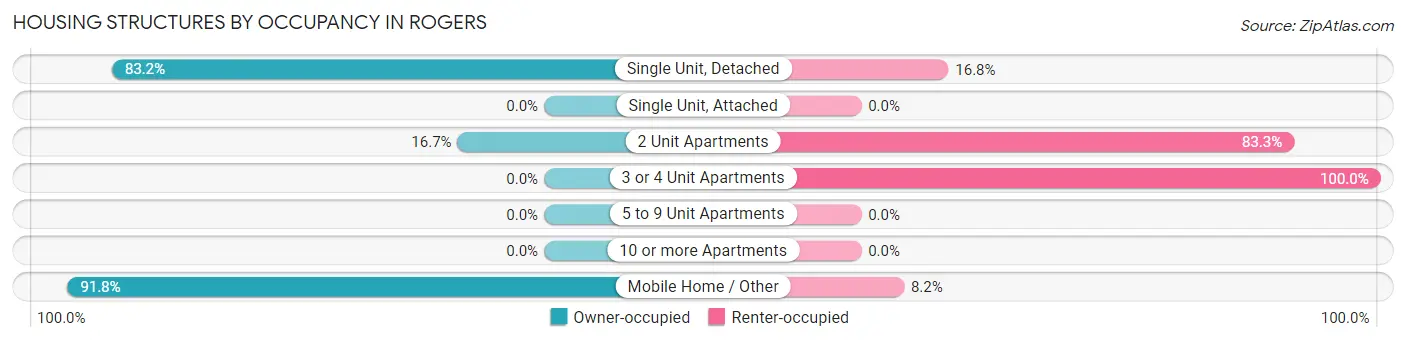
| Structure Type | Owner-occupied | Renter-occupied |
| Single Unit, Detached | 228 (83.2%) | 46 (16.8%) |
| Single Unit, Attached | 0 (0.0%) | 0 (0.0%) |
| 2 Unit Apartments | 4 (16.7%) | 20 (83.3%) |
| 3 or 4 Unit Apartments | 0 (0.0%) | 32 (100.0%) |
| 5 to 9 Unit Apartments | 0 (0.0%) | 0 (0.0%) |
| 10 or more Apartments | 0 (0.0%) | 0 (0.0%) |
| Mobile Home / Other | 78 (91.8%) | 7 (8.2%) |
| Total | 310 (74.7%) | 105 (25.3%) |
Housing Structures by Number of Rooms in Rogers
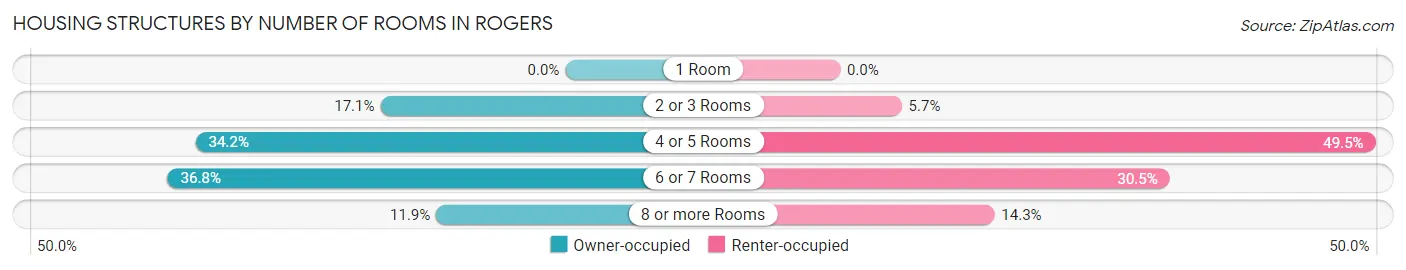
| Number of Rooms | Owner-occupied | Renter-occupied |
| 1 Room | 0 (0.0%) | 0 (0.0%) |
| 2 or 3 Rooms | 53 (17.1%) | 6 (5.7%) |
| 4 or 5 Rooms | 106 (34.2%) | 52 (49.5%) |
| 6 or 7 Rooms | 114 (36.8%) | 32 (30.5%) |
| 8 or more Rooms | 37 (11.9%) | 15 (14.3%) |
| Total | 310 (100.0%) | 105 (100.0%) |
Housing Structure by Heating Type in Rogers
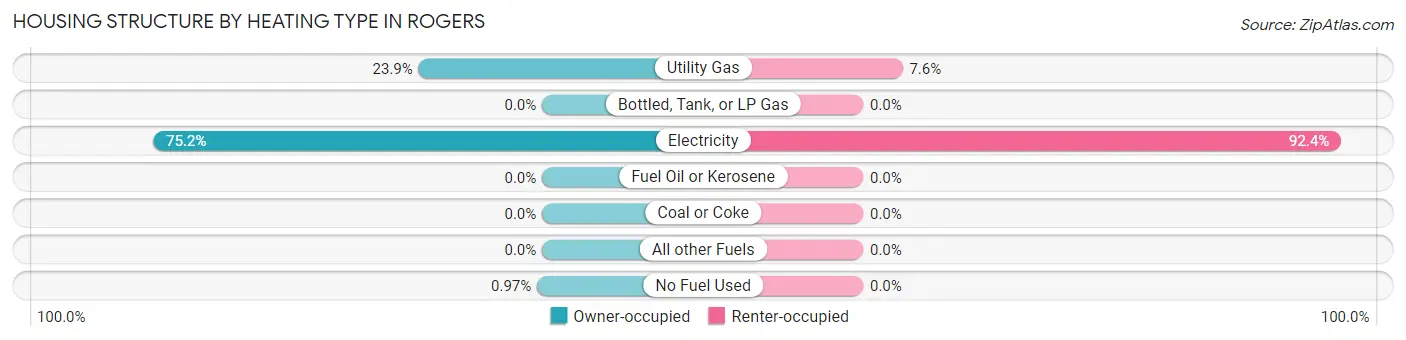
| Heating Type | Owner-occupied | Renter-occupied |
| Utility Gas | 74 (23.9%) | 8 (7.6%) |
| Bottled, Tank, or LP Gas | 0 (0.0%) | 0 (0.0%) |
| Electricity | 233 (75.2%) | 97 (92.4%) |
| Fuel Oil or Kerosene | 0 (0.0%) | 0 (0.0%) |
| Coal or Coke | 0 (0.0%) | 0 (0.0%) |
| All other Fuels | 0 (0.0%) | 0 (0.0%) |
| No Fuel Used | 3 (1.0%) | 0 (0.0%) |
| Total | 310 (100.0%) | 105 (100.0%) |
Household Vehicle Usage in Rogers
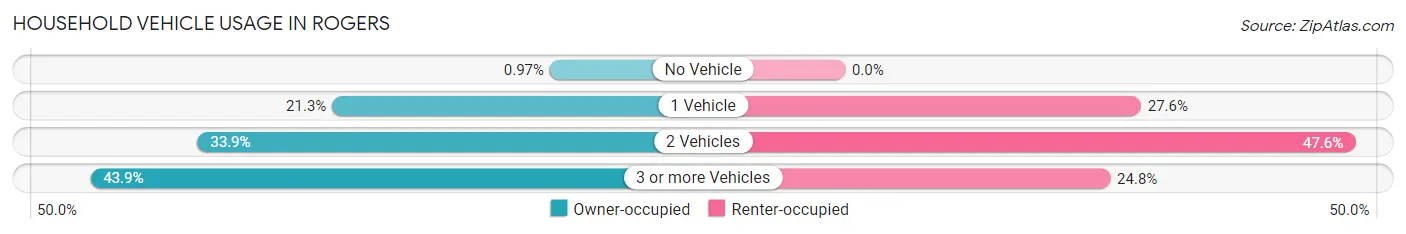
| Vehicles per Household | Owner-occupied | Renter-occupied |
| No Vehicle | 3 (1.0%) | 0 (0.0%) |
| 1 Vehicle | 66 (21.3%) | 29 (27.6%) |
| 2 Vehicles | 105 (33.9%) | 50 (47.6%) |
| 3 or more Vehicles | 136 (43.9%) | 26 (24.8%) |
| Total | 310 (100.0%) | 105 (100.0%) |
Real Estate & Mortgages in Rogers
Real Estate and Mortgage Overview in Rogers
| Characteristic | Without Mortgage | With Mortgage |
| Housing Units | 195 | 115 |
| Median Property Value | $72,500 | $86,500 |
| Median Household Income | $93,693 | $0 |
| Monthly Housing Costs | $522 | $7 |
| Real Estate Taxes | $1,560 | $10 |
Property Value by Mortgage Status in Rogers
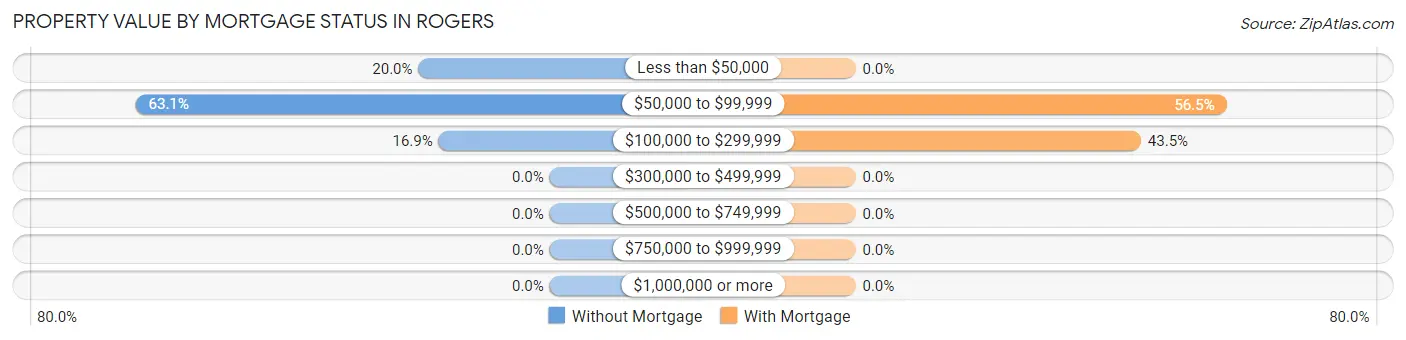
| Property Value | Without Mortgage | With Mortgage |
| Less than $50,000 | 39 (20.0%) | 0 (0.0%) |
| $50,000 to $99,999 | 123 (63.1%) | 65 (56.5%) |
| $100,000 to $299,999 | 33 (16.9%) | 50 (43.5%) |
| $300,000 to $499,999 | 0 (0.0%) | 0 (0.0%) |
| $500,000 to $749,999 | 0 (0.0%) | 0 (0.0%) |
| $750,000 to $999,999 | 0 (0.0%) | 0 (0.0%) |
| $1,000,000 or more | 0 (0.0%) | 0 (0.0%) |
| Total | 195 (100.0%) | 115 (100.0%) |
Household Income by Mortgage Status in Rogers
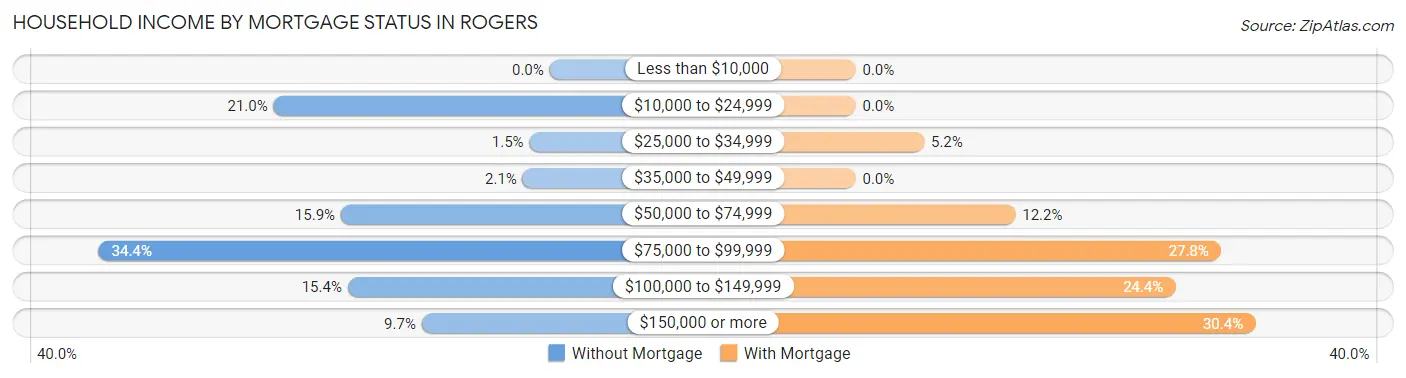
| Household Income | Without Mortgage | With Mortgage |
| Less than $10,000 | 0 (0.0%) | 0 (0.0%) |
| $10,000 to $24,999 | 41 (21.0%) | 0 (0.0%) |
| $25,000 to $34,999 | 3 (1.5%) | 6 (5.2%) |
| $35,000 to $49,999 | 4 (2.1%) | 0 (0.0%) |
| $50,000 to $74,999 | 31 (15.9%) | 14 (12.2%) |
| $75,000 to $99,999 | 67 (34.4%) | 32 (27.8%) |
| $100,000 to $149,999 | 30 (15.4%) | 28 (24.3%) |
| $150,000 or more | 19 (9.7%) | 35 (30.4%) |
| Total | 195 (100.0%) | 115 (100.0%) |
Property Value to Household Income Ratio in Rogers
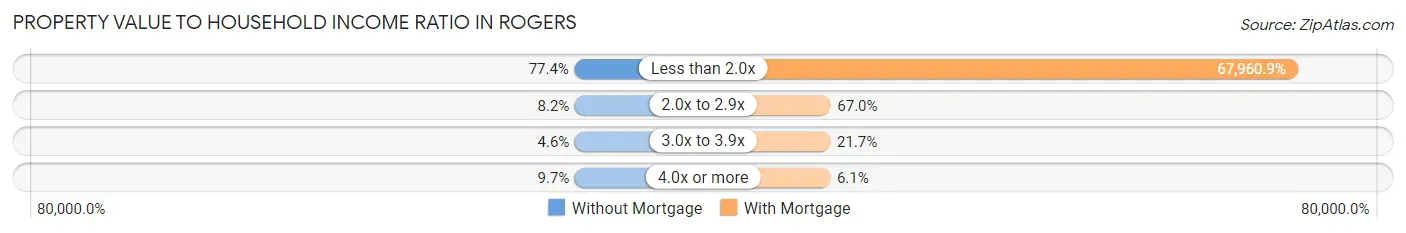
| Value-to-Income Ratio | Without Mortgage | With Mortgage |
| Less than 2.0x | 151 (77.4%) | 78,155 (67,960.9%) |
| 2.0x to 2.9x | 16 (8.2%) | 77 (67.0%) |
| 3.0x to 3.9x | 9 (4.6%) | 25 (21.7%) |
| 4.0x or more | 19 (9.7%) | 7 (6.1%) |
| Total | 195 (100.0%) | 115 (100.0%) |
Real Estate Taxes by Mortgage Status in Rogers
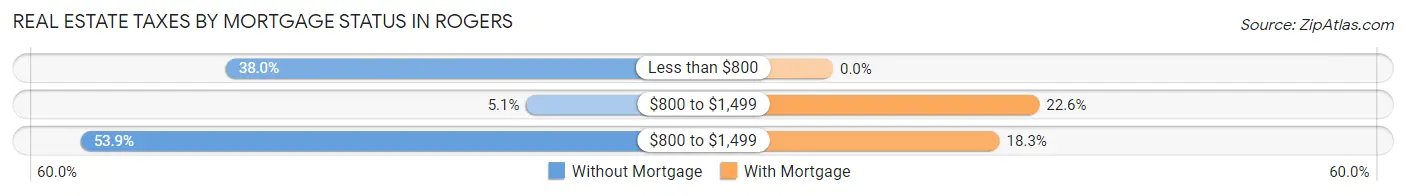
| Property Taxes | Without Mortgage | With Mortgage |
| Less than $800 | 74 (38.0%) | 0 (0.0%) |
| $800 to $1,499 | 10 (5.1%) | 26 (22.6%) |
| $800 to $1,499 | 105 (53.8%) | 21 (18.3%) |
| Total | 195 (100.0%) | 115 (100.0%) |
Health & Disability in Rogers
Health Insurance Coverage by Age in Rogers
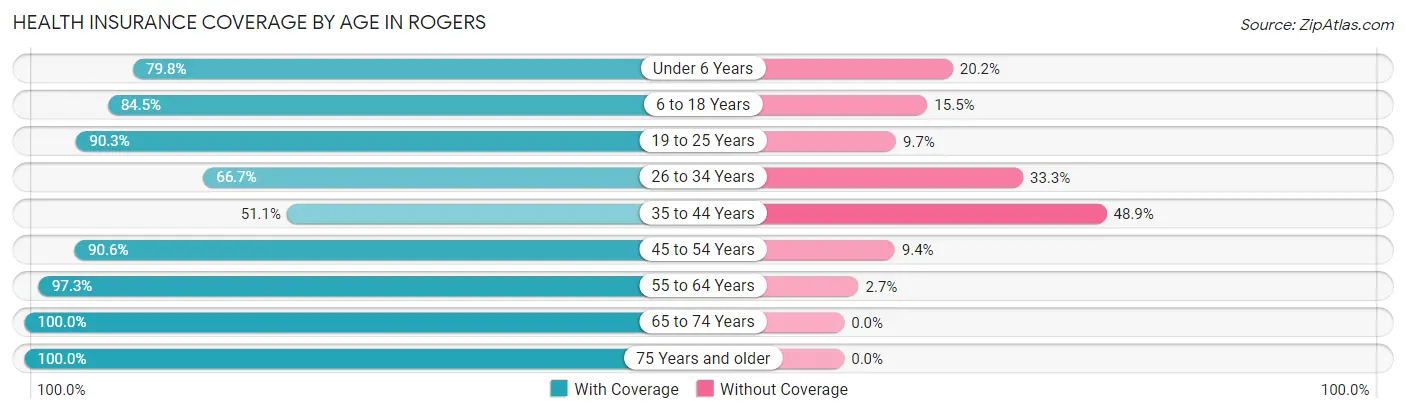
| Age Bracket | With Coverage | Without Coverage |
| Under 6 Years | 67 (79.8%) | 17 (20.2%) |
| 6 to 18 Years | 229 (84.5%) | 42 (15.5%) |
| 19 to 25 Years | 187 (90.3%) | 20 (9.7%) |
| 26 to 34 Years | 68 (66.7%) | 34 (33.3%) |
| 35 to 44 Years | 93 (51.1%) | 89 (48.9%) |
| 45 to 54 Years | 240 (90.6%) | 25 (9.4%) |
| 55 to 64 Years | 146 (97.3%) | 4 (2.7%) |
| 65 to 74 Years | 140 (100.0%) | 0 (0.0%) |
| 75 Years and older | 43 (100.0%) | 0 (0.0%) |
| Total | 1,213 (84.0%) | 231 (16.0%) |
Health Insurance Coverage by Citizenship Status in Rogers
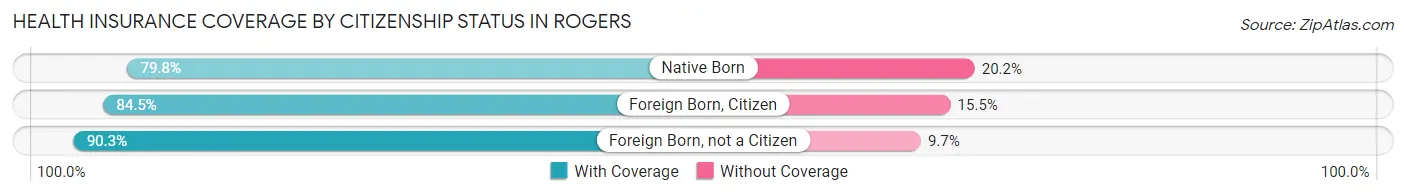
| Citizenship Status | With Coverage | Without Coverage |
| Native Born | 67 (79.8%) | 17 (20.2%) |
| Foreign Born, Citizen | 229 (84.5%) | 42 (15.5%) |
| Foreign Born, not a Citizen | 187 (90.3%) | 20 (9.7%) |
Health Insurance Coverage by Household Income in Rogers
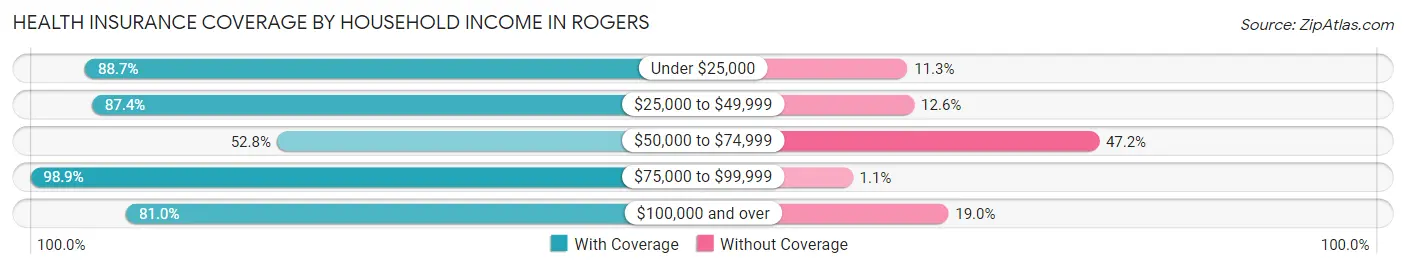
| Household Income | With Coverage | Without Coverage |
| Under $25,000 | 172 (88.7%) | 22 (11.3%) |
| $25,000 to $49,999 | 263 (87.4%) | 38 (12.6%) |
| $50,000 to $74,999 | 105 (52.8%) | 94 (47.2%) |
| $75,000 to $99,999 | 362 (98.9%) | 4 (1.1%) |
| $100,000 and over | 311 (81.0%) | 73 (19.0%) |
Public vs Private Health Insurance Coverage by Age in Rogers
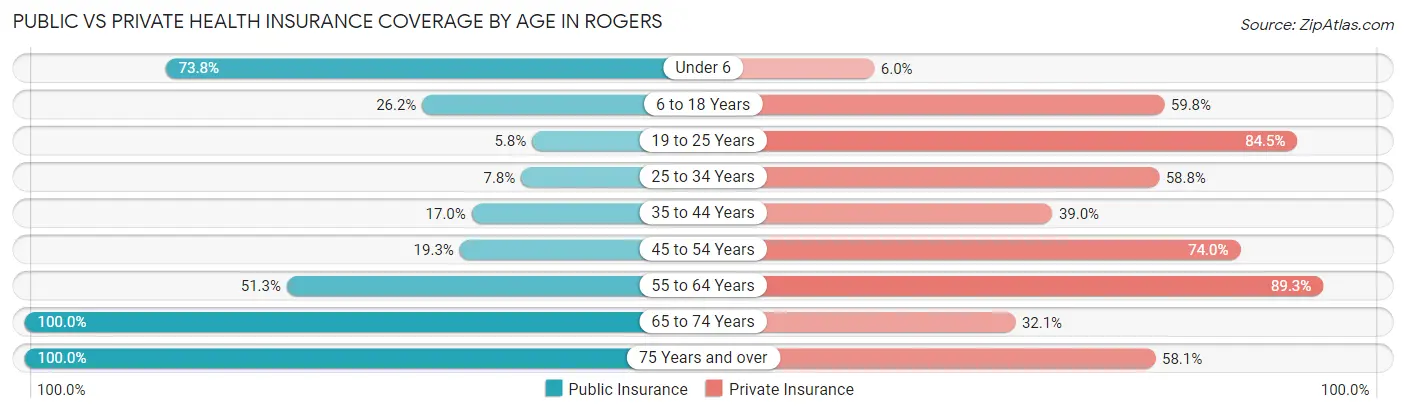
| Age Bracket | Public Insurance | Private Insurance |
| Under 6 | 62 (73.8%) | 5 (5.9%) |
| 6 to 18 Years | 71 (26.2%) | 162 (59.8%) |
| 19 to 25 Years | 12 (5.8%) | 175 (84.5%) |
| 25 to 34 Years | 8 (7.8%) | 60 (58.8%) |
| 35 to 44 Years | 31 (17.0%) | 71 (39.0%) |
| 45 to 54 Years | 51 (19.3%) | 196 (74.0%) |
| 55 to 64 Years | 77 (51.3%) | 134 (89.3%) |
| 65 to 74 Years | 140 (100.0%) | 45 (32.1%) |
| 75 Years and over | 43 (100.0%) | 25 (58.1%) |
| Total | 495 (34.3%) | 873 (60.5%) |
Disability Status by Sex by Age in Rogers
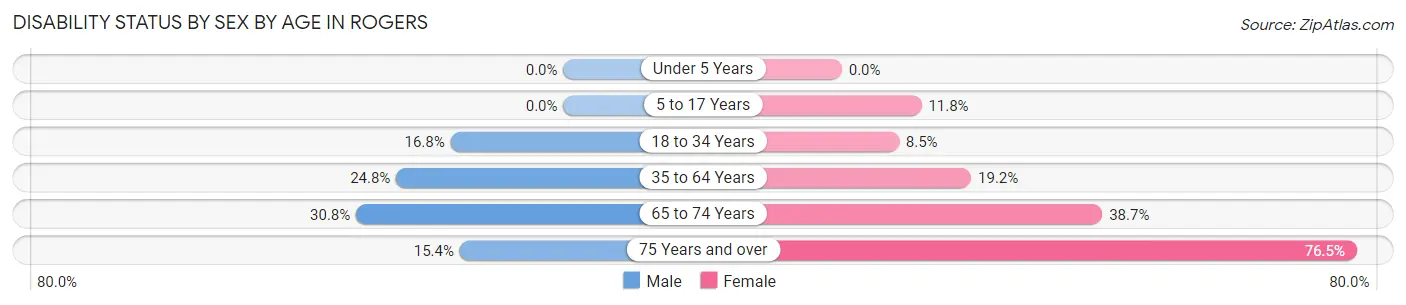
| Age Bracket | Male | Female |
| Under 5 Years | 0 (0.0%) | 0 (0.0%) |
| 5 to 17 Years | 0 (0.0%) | 11 (11.8%) |
| 18 to 34 Years | 32 (16.8%) | 10 (8.5%) |
| 35 to 64 Years | 68 (24.8%) | 62 (19.2%) |
| 65 to 74 Years | 20 (30.8%) | 29 (38.7%) |
| 75 Years and over | 4 (15.4%) | 13 (76.5%) |
Disability Class by Sex by Age in Rogers
Disability Class: Hearing Difficulty
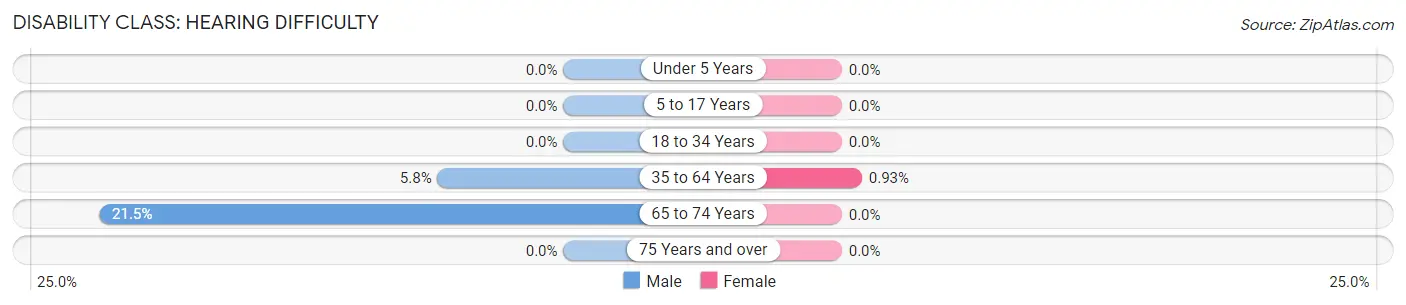
| Age Bracket | Male | Female |
| Under 5 Years | 0 (0.0%) | 0 (0.0%) |
| 5 to 17 Years | 0 (0.0%) | 0 (0.0%) |
| 18 to 34 Years | 0 (0.0%) | 0 (0.0%) |
| 35 to 64 Years | 16 (5.8%) | 3 (0.9%) |
| 65 to 74 Years | 14 (21.5%) | 0 (0.0%) |
| 75 Years and over | 0 (0.0%) | 0 (0.0%) |
Disability Class: Vision Difficulty
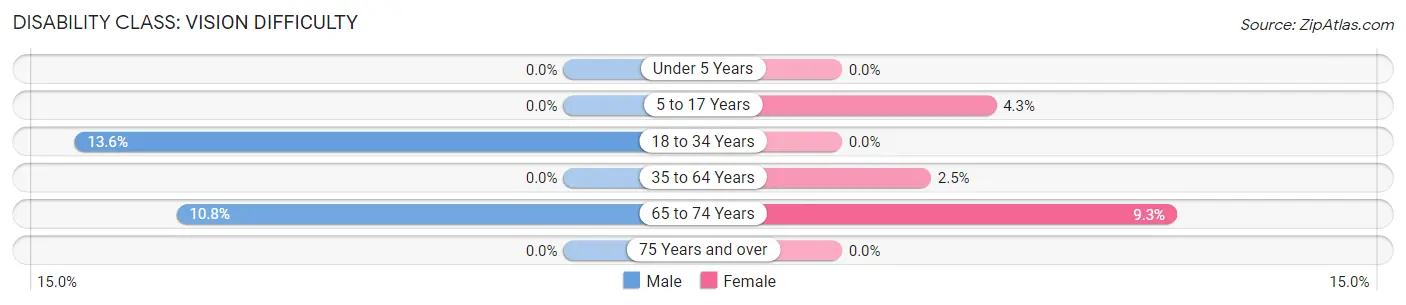
| Age Bracket | Male | Female |
| Under 5 Years | 0 (0.0%) | 0 (0.0%) |
| 5 to 17 Years | 0 (0.0%) | 4 (4.3%) |
| 18 to 34 Years | 26 (13.6%) | 0 (0.0%) |
| 35 to 64 Years | 0 (0.0%) | 8 (2.5%) |
| 65 to 74 Years | 7 (10.8%) | 7 (9.3%) |
| 75 Years and over | 0 (0.0%) | 0 (0.0%) |
Disability Class: Cognitive Difficulty
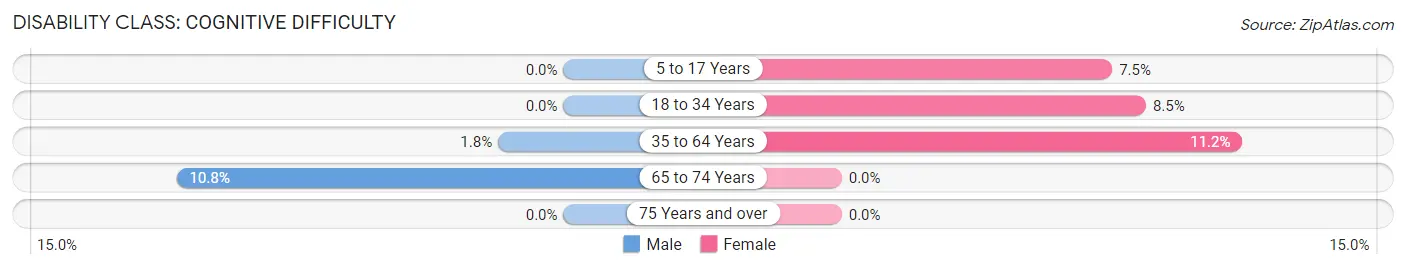
| Age Bracket | Male | Female |
| 5 to 17 Years | 0 (0.0%) | 7 (7.5%) |
| 18 to 34 Years | 0 (0.0%) | 10 (8.5%) |
| 35 to 64 Years | 5 (1.8%) | 36 (11.2%) |
| 65 to 74 Years | 7 (10.8%) | 0 (0.0%) |
| 75 Years and over | 0 (0.0%) | 0 (0.0%) |
Disability Class: Ambulatory Difficulty
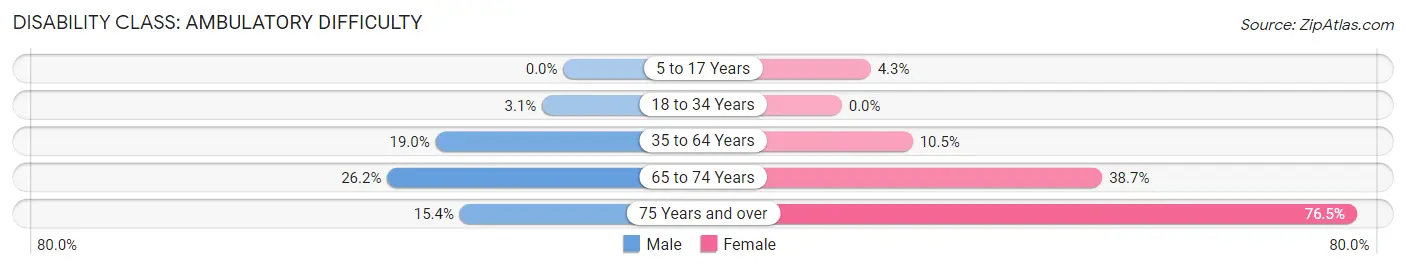
| Age Bracket | Male | Female |
| 5 to 17 Years | 0 (0.0%) | 4 (4.3%) |
| 18 to 34 Years | 6 (3.1%) | 0 (0.0%) |
| 35 to 64 Years | 52 (19.0%) | 34 (10.5%) |
| 65 to 74 Years | 17 (26.2%) | 29 (38.7%) |
| 75 Years and over | 4 (15.4%) | 13 (76.5%) |
Disability Class: Self-Care Difficulty
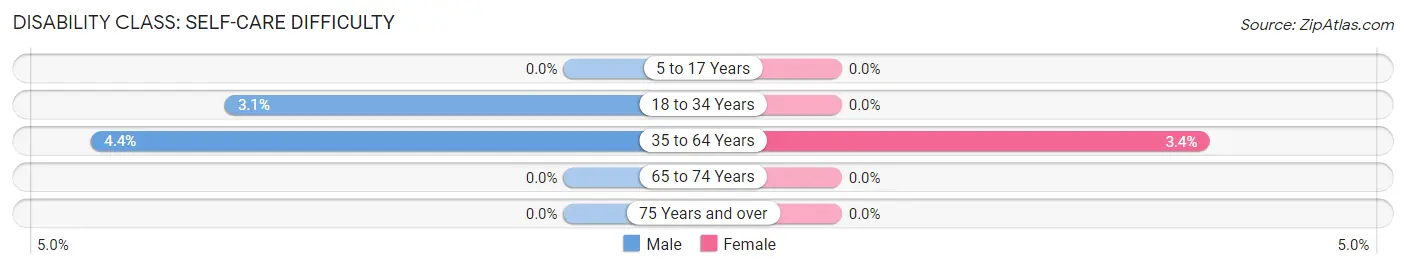
| Age Bracket | Male | Female |
| 5 to 17 Years | 0 (0.0%) | 0 (0.0%) |
| 18 to 34 Years | 6 (3.1%) | 0 (0.0%) |
| 35 to 64 Years | 12 (4.4%) | 11 (3.4%) |
| 65 to 74 Years | 0 (0.0%) | 0 (0.0%) |
| 75 Years and over | 0 (0.0%) | 0 (0.0%) |
Technology Access in Rogers
Computing Device Access in Rogers
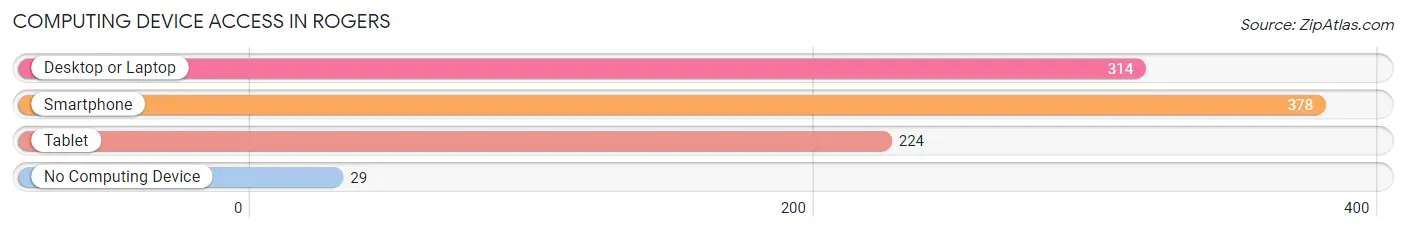
| Device Type | # Households | % Households |
| Desktop or Laptop | 314 | 75.7% |
| Smartphone | 378 | 91.1% |
| Tablet | 224 | 54.0% |
| No Computing Device | 29 | 7.0% |
| Total | 415 | 100.0% |
Internet Access in Rogers
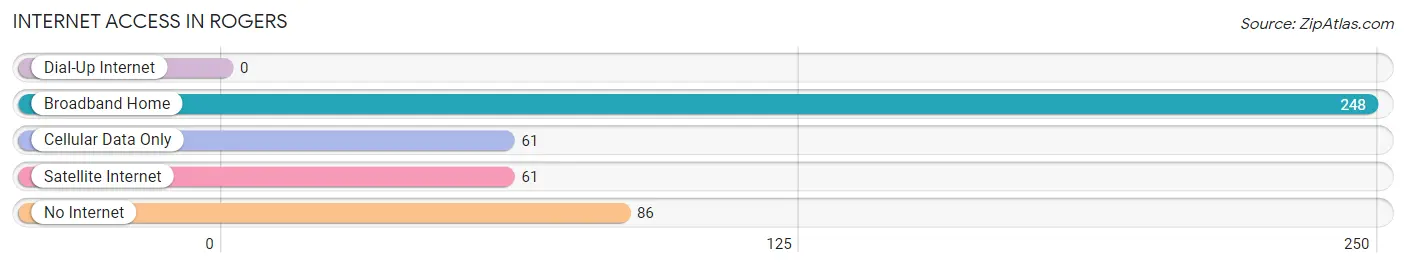
| Internet Type | # Households | % Households |
| Dial-Up Internet | 0 | 0.0% |
| Broadband Home | 248 | 59.8% |
| Cellular Data Only | 61 | 14.7% |
| Satellite Internet | 61 | 14.7% |
| No Internet | 86 | 20.7% |
| Total | 415 | 100.0% |
Rogers Summary
Rogers, Texas is a small town located in Bell County, Texas, United States. It is situated about 20 miles south of Temple and about 30 miles north of Austin. The population of Rogers was 1,093 at the 2010 census.
History
The area that is now Rogers was first settled in the late 1800s by German immigrants. The town was originally called “Germantown” and was later renamed “Rogers” after a local family. The town was officially incorporated in 1891.
In the early 1900s, Rogers was a thriving agricultural community. Cotton, corn, and other crops were grown in the area. The town also had a number of businesses, including a general store, a blacksmith shop, and a hotel.
In the 1920s, the town began to decline as the railroad bypassed Rogers. The population decreased and many businesses closed.
In the 1950s, the town began to experience a resurgence. The population increased and new businesses opened. The town also became a popular tourist destination due to its proximity to Austin and the nearby lakes.
Geography
Rogers is located in Bell County, Texas, United States. It is situated about 20 miles south of Temple and about 30 miles north of Austin. The town is located at the intersection of State Highway 95 and Farm to Market Road 439.
The terrain around Rogers is mostly flat with some rolling hills. The area is mostly covered in grasslands and woodlands. The town is located in the Central Texas Hill Country.
Economy
The economy of Rogers is largely based on agriculture. Cotton, corn, and other crops are grown in the area. The town also has a number of businesses, including a general store, a blacksmith shop, and a hotel.
The town is also home to a number of manufacturing companies, including a plastics factory and a metal fabrication plant.
Demographics
As of the 2010 census, the population of Rogers was 1,093. The racial makeup of the town was 94.3% White, 0.7% African American, 0.2% Native American, 0.2% Asian, 0.1% Pacific Islander, 2.7% from other races, and 1.7% from two or more races. Hispanic or Latino of any race were 5.2% of the population.
The median income for a household in Rogers was $37,500, and the median income for a family was $41,250. The per capita income for the town was $17,845. About 11.2% of families and 13.2% of the population were below the poverty line, including 17.2% of those under age 18 and 8.3% of those age 65 or over.
Conclusion
Rogers, Texas is a small town located in Bell County, Texas, United States. It is situated about 20 miles south of Temple and about 30 miles north of Austin. The population of Rogers was 1,093 at the 2010 census. The town has a long history, dating back to the late 1800s when it was first settled by German immigrants. The economy of Rogers is largely based on agriculture, with cotton, corn, and other crops being grown in the area. The town also has a number of businesses, including a general store, a blacksmith shop, and a hotel. The racial makeup of the town is 94.3% White, 0.7% African American, 0.2% Native American, 0.2% Asian, 0.1% Pacific Islander, 2.7% from other races, and 1.7% from two or more races. The median income for a household in Rogers was $37,500, and the median income for a family was $41,250.
Common Questions
What is Per Capita Income in Rogers?
Per Capita income in Rogers is $23,864.
What is the Median Family Income in Rogers?
Median Family Income in Rogers is $73,250.
What is the Median Household income in Rogers?
Median Household Income in Rogers is $69,866.
What is Income or Wage Gap in Rogers?
Income or Wage Gap in Rogers is 19.6%.
Women in Rogers earn 80.4 cents for every dollar earned by a man.
What is Family Income Deficit in Rogers?
Family Income Deficit in Rogers is $8,698.
Families that are below poverty line in Rogers earn $8,698 less on average than the poverty threshold level.
What is Inequality or Gini Index in Rogers?
Inequality or Gini Index in Rogers is 0.38.
What is the Total Population of Rogers?
Total Population of Rogers is 1,444.
What is the Total Male Population of Rogers?
Total Male Population of Rogers is 772.
What is the Total Female Population of Rogers?
Total Female Population of Rogers is 672.
What is the Ratio of Males per 100 Females in Rogers?
There are 114.88 Males per 100 Females in Rogers.
What is the Ratio of Females per 100 Males in Rogers?
There are 87.05 Females per 100 Males in Rogers.
What is the Median Population Age in Rogers?
Median Population Age in Rogers is 39.0 Years.
What is the Average Family Size in Rogers
Average Family Size in Rogers is 3.9 People.
What is the Average Household Size in Rogers
Average Household Size in Rogers is 3.5 People.
How Large is the Labor Force in Rogers?
There are 753 People in the Labor Forcein in Rogers.
What is the Percentage of People in the Labor Force in Rogers?
66.2% of People are in the Labor Force in Rogers.
What is the Unemployment Rate in Rogers?
Unemployment Rate in Rogers is 4.8%.