Rio Vista, TX Map & Demographics
Rio Vista Map
Rio Vista Overview
$27,875
PER CAPITA INCOME
$68,320
AVG FAMILY INCOME
$68,078
AVG HOUSEHOLD INCOME
14.1%
WAGE / INCOME GAP [ % ]
85.9¢/ $1
WAGE / INCOME GAP [ $ ]
0.34
INEQUALITY / GINI INDEX
1,290
TOTAL POPULATION
709
MALE POPULATION
581
FEMALE POPULATION
122.03
MALES / 100 FEMALES
81.95
FEMALES / 100 MALES
29.8
MEDIAN AGE
2.9
AVG FAMILY SIZE
2.7
AVG HOUSEHOLD SIZE
681
LABOR FORCE [ PEOPLE ]
71.7%
PERCENT IN LABOR FORCE
3.2%
UNEMPLOYMENT RATE
Rio Vista Zip Codes
Rio Vista Area Codes
Income in Rio Vista
Income Overview in Rio Vista
Per Capita Income in Rio Vista is $27,875, while median incomes of families and households are $68,320 and $68,078 respectively.
| Characteristic | Number | Measure |
| Per Capita Income | 1,290 | $27,875 |
| Median Family Income | 398 | $68,320 |
| Mean Family Income | 398 | $77,849 |
| Median Household Income | 483 | $68,078 |
| Mean Household Income | 483 | $75,320 |
| Income Deficit | 398 | $0 |
| Wage / Income Gap (%) | 1,290 | 14.13% |
| Wage / Income Gap ($) | 1,290 | 85.87¢ per $1 |
| Gini / Inequality Index | 1,290 | 0.34 |
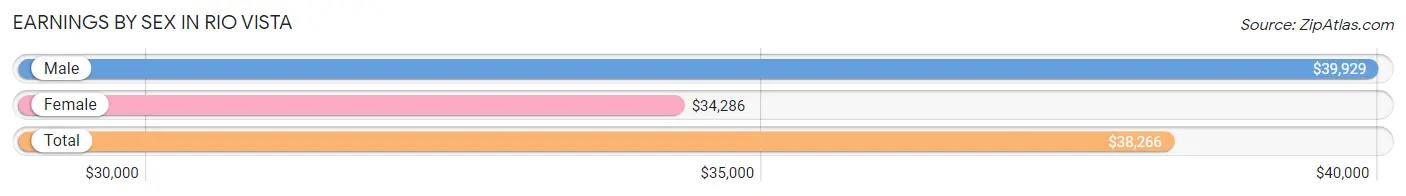
Earnings by Sex in Rio Vista
Average Earnings in Rio Vista are $38,266, $39,929 for men and $34,286 for women, a difference of 14.1%.
| Sex | Number | Average Earnings |
| Male | 377 (54.2%) | $39,929 |
| Female | 318 (45.8%) | $34,286 |
| Total | 695 (100.0%) | $38,266 |
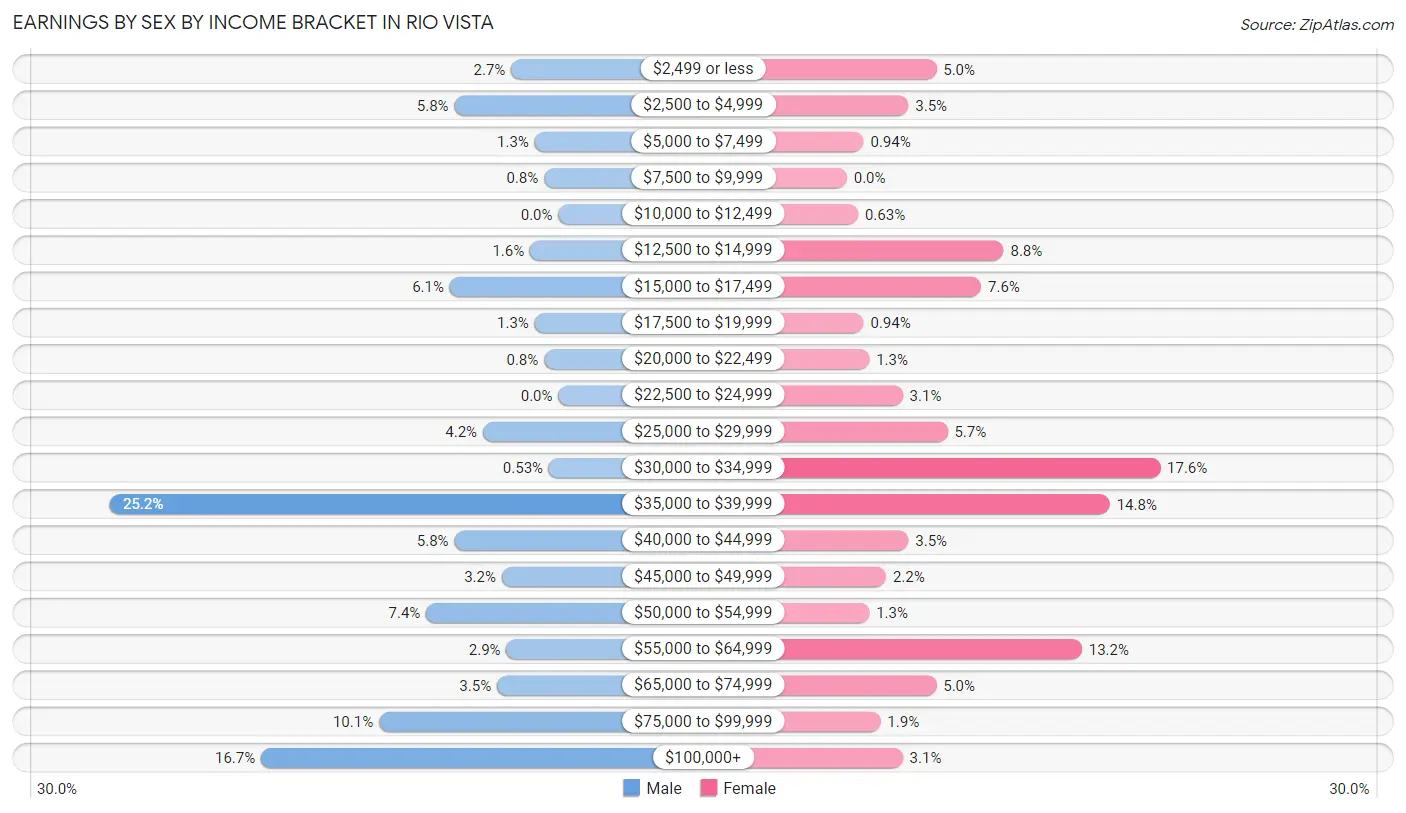
Earnings by Sex by Income Bracket in Rio Vista
The most common earnings brackets in Rio Vista are $35,000 to $39,999 for men (95 | 25.2%) and $30,000 to $34,999 for women (56 | 17.6%).
| Income | Male | Female |
| $2,499 or less | 10 (2.6%) | 16 (5.0%) |
| $2,500 to $4,999 | 22 (5.8%) | 11 (3.5%) |
| $5,000 to $7,499 | 5 (1.3%) | 3 (0.9%) |
| $7,500 to $9,999 | 3 (0.8%) | 0 (0.0%) |
| $10,000 to $12,499 | 0 (0.0%) | 2 (0.6%) |
| $12,500 to $14,999 | 6 (1.6%) | 28 (8.8%) |
| $15,000 to $17,499 | 23 (6.1%) | 24 (7.5%) |
| $17,500 to $19,999 | 5 (1.3%) | 3 (0.9%) |
| $20,000 to $22,499 | 3 (0.8%) | 4 (1.3%) |
| $22,500 to $24,999 | 0 (0.0%) | 10 (3.1%) |
| $25,000 to $29,999 | 16 (4.2%) | 18 (5.7%) |
| $30,000 to $34,999 | 2 (0.5%) | 56 (17.6%) |
| $35,000 to $39,999 | 95 (25.2%) | 47 (14.8%) |
| $40,000 to $44,999 | 22 (5.8%) | 11 (3.5%) |
| $45,000 to $49,999 | 12 (3.2%) | 7 (2.2%) |
| $50,000 to $54,999 | 28 (7.4%) | 4 (1.3%) |
| $55,000 to $64,999 | 11 (2.9%) | 42 (13.2%) |
| $65,000 to $74,999 | 13 (3.5%) | 16 (5.0%) |
| $75,000 to $99,999 | 38 (10.1%) | 6 (1.9%) |
| $100,000+ | 63 (16.7%) | 10 (3.1%) |
| Total | 377 (100.0%) | 318 (100.0%) |
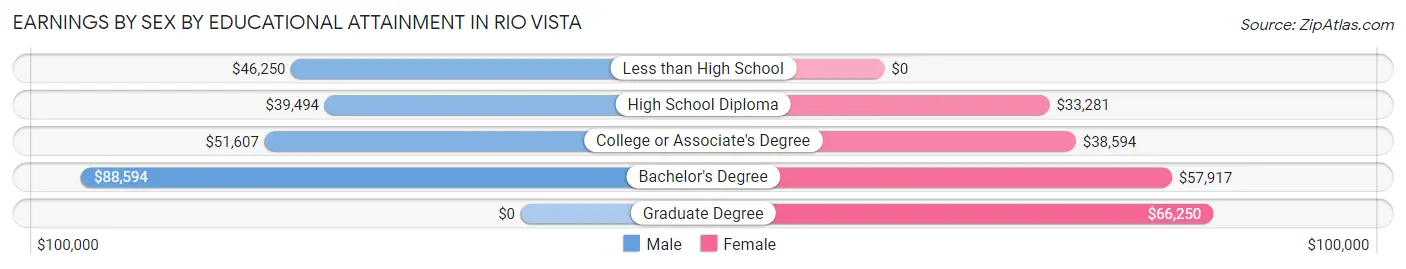
Earnings by Sex by Educational Attainment in Rio Vista
Average earnings in Rio Vista are $46,667 for men and $34,621 for women, a difference of 25.8%. Men with an educational attainment of bachelor's degree enjoy the highest average annual earnings of $88,594, while those with high school diploma education earn the least with $39,494. Women with an educational attainment of graduate degree earn the most with the average annual earnings of $66,250, while those with high school diploma education have the smallest earnings of $33,281.
| Educational Attainment | Male Income | Female Income |
| Less than High School | $46,250 | $0 |
| High School Diploma | $39,494 | $33,281 |
| College or Associate's Degree | $51,607 | $38,594 |
| Bachelor's Degree | $88,594 | $57,917 |
| Graduate Degree | - | - |
| Total | $46,667 | $34,621 |
Family Income in Rio Vista
Family Income Brackets in Rio Vista
According to the Rio Vista family income data, there are 102 families falling into the $35,000 to $49,999 income range, which is the most common income bracket and makes up 25.6% of all families.
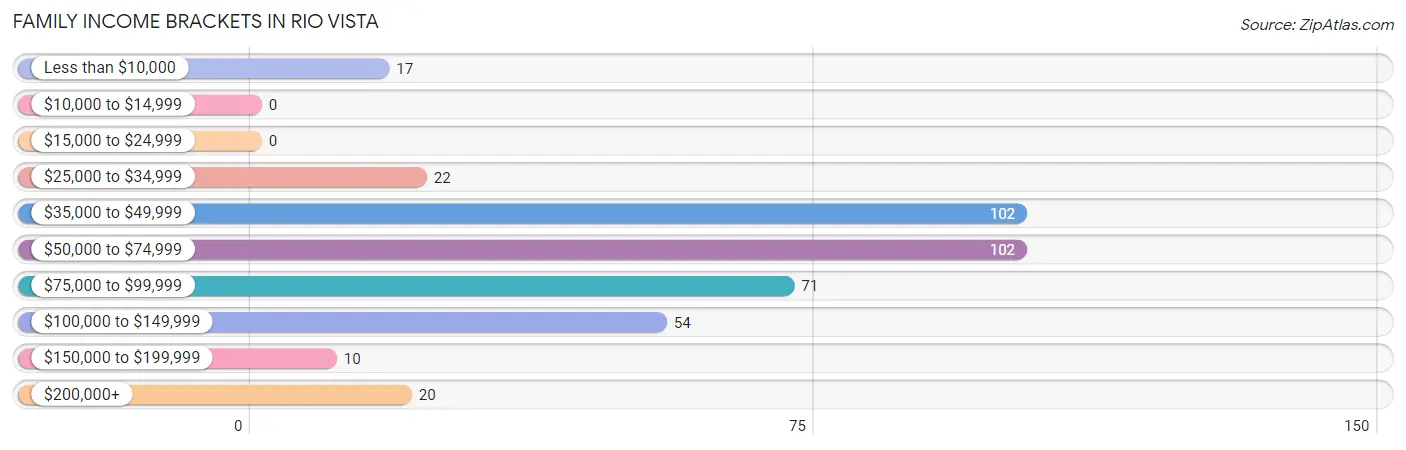
| Income Bracket | # Families | % Families |
| Less than $10,000 | 17 | 4.3% |
| $10,000 to $14,999 | 0 | 0.0% |
| $15,000 to $24,999 | 0 | 0.0% |
| $25,000 to $34,999 | 22 | 5.5% |
| $35,000 to $49,999 | 102 | 25.6% |
| $50,000 to $74,999 | 102 | 25.6% |
| $75,000 to $99,999 | 71 | 17.8% |
| $100,000 to $149,999 | 54 | 13.6% |
| $150,000 to $199,999 | 10 | 2.5% |
| $200,000+ | 20 | 5.0% |
Family Income by Famaliy Size in Rio Vista
5-person families (25 | 6.3%) account for the highest median family income in Rio Vista with $109,375 per family, while 3-person families (67 | 16.8%) have the highest median income of $28,229 per family member.
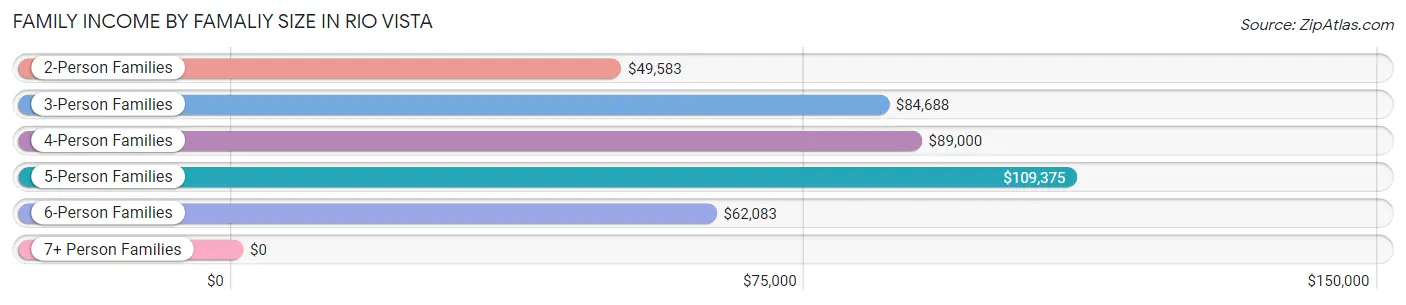
| Income Bracket | # Families | Median Income |
| 2-Person Families | 197 (49.5%) | $49,583 |
| 3-Person Families | 67 (16.8%) | $84,688 |
| 4-Person Families | 88 (22.1%) | $89,000 |
| 5-Person Families | 25 (6.3%) | $109,375 |
| 6-Person Families | 21 (5.3%) | $62,083 |
| 7+ Person Families | 0 (0.0%) | $0 |
| Total | 398 (100.0%) | $68,320 |
Family Income by Number of Earners in Rio Vista
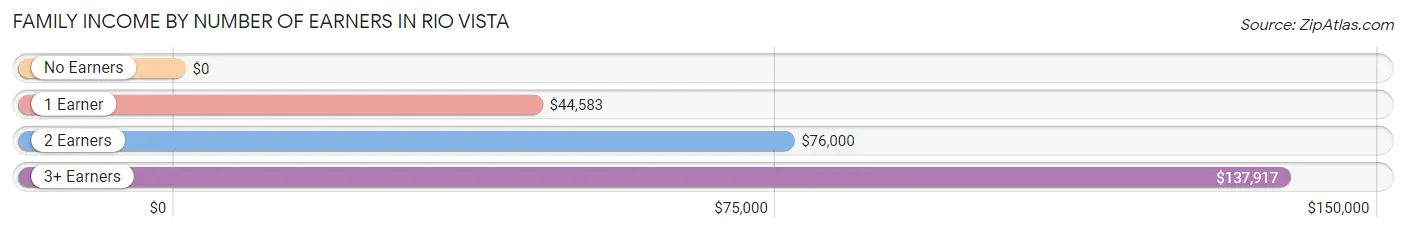
| Number of Earners | # Families | Median Income |
| No Earners | 38 (9.6%) | $0 |
| 1 Earner | 163 (40.9%) | $44,583 |
| 2 Earners | 162 (40.7%) | $76,000 |
| 3+ Earners | 35 (8.8%) | $137,917 |
| Total | 398 (100.0%) | $68,320 |
Household Income in Rio Vista
Household Income Brackets in Rio Vista
With 124 households falling in the category, the $50,000 to $74,999 income range is the most frequent in Rio Vista, accounting for 25.7% of all households.
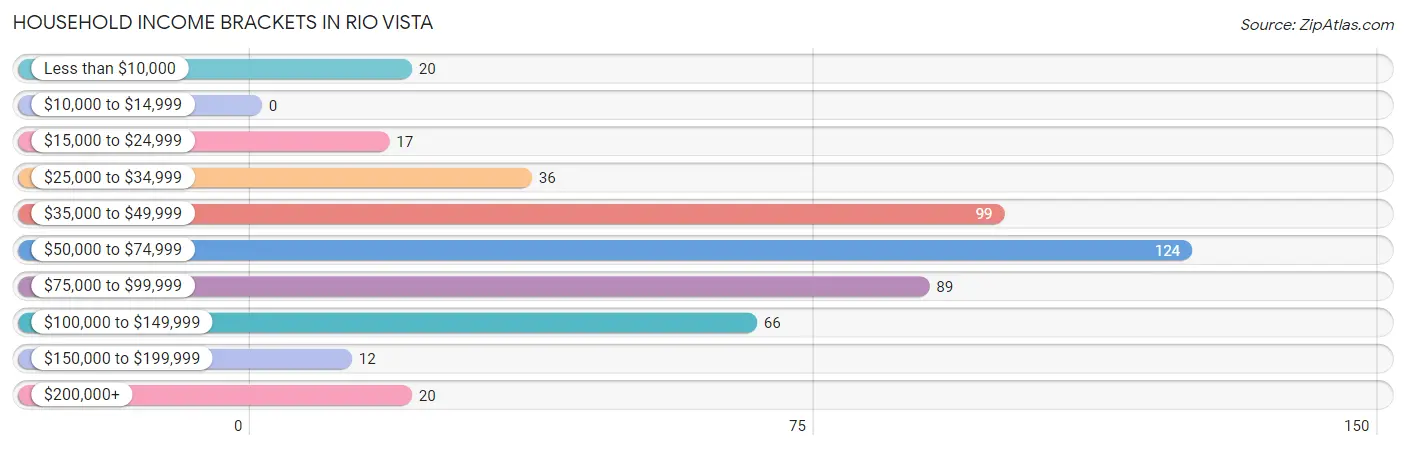
| Income Bracket | # Households | % Households |
| Less than $10,000 | 20 | 4.1% |
| $10,000 to $14,999 | 0 | 0.0% |
| $15,000 to $24,999 | 17 | 3.5% |
| $25,000 to $34,999 | 36 | 7.5% |
| $35,000 to $49,999 | 99 | 20.5% |
| $50,000 to $74,999 | 124 | 25.7% |
| $75,000 to $99,999 | 89 | 18.4% |
| $100,000 to $149,999 | 66 | 13.7% |
| $150,000 to $199,999 | 12 | 2.5% |
| $200,000+ | 20 | 4.1% |
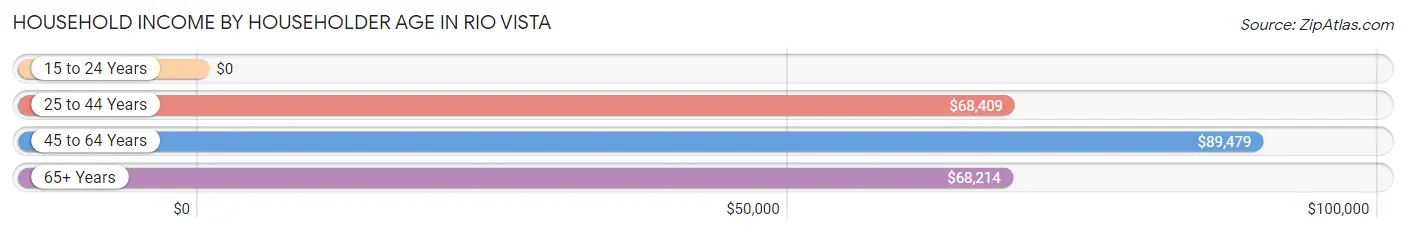
Household Income by Householder Age in Rio Vista
The median household income in Rio Vista is $68,078, with the highest median household income of $89,479 found in the 45 to 64 years age bracket for the primary householder. A total of 135 households (28.0%) fall into this category. Meanwhile, the 15 to 24 years age bracket for the primary householder has the lowest median household income of $0, with 52 households (10.8%) in this group.
| Income Bracket | # Households | Median Income |
| 15 to 24 Years | 52 (10.8%) | $0 |
| 25 to 44 Years | 182 (37.7%) | $68,409 |
| 45 to 64 Years | 135 (28.0%) | $89,479 |
| 65+ Years | 114 (23.6%) | $68,214 |
| Total | 483 (100.0%) | $68,078 |
Poverty in Rio Vista
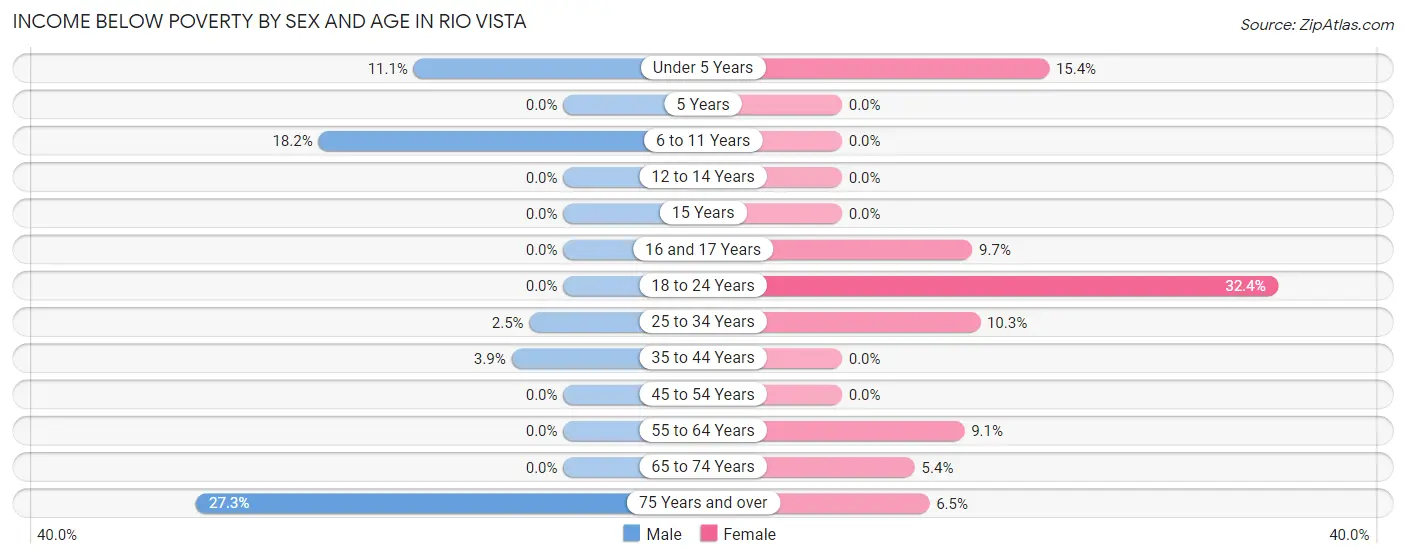
Income Below Poverty by Sex and Age in Rio Vista
With 3.8% poverty level for males and 8.5% for females among the residents of Rio Vista, 75 year old and over males and 18 to 24 year old females are the most vulnerable to poverty, with 3 males (27.3%) and 22 females (32.4%) in their respective age groups living below the poverty level.
| Age Bracket | Male | Female |
| Under 5 Years | 7 (11.1%) | 6 (15.4%) |
| 5 Years | 0 (0.0%) | 0 (0.0%) |
| 6 to 11 Years | 12 (18.2%) | 0 (0.0%) |
| 12 to 14 Years | 0 (0.0%) | 0 (0.0%) |
| 15 Years | 0 (0.0%) | 0 (0.0%) |
| 16 and 17 Years | 0 (0.0%) | 3 (9.7%) |
| 18 to 24 Years | 0 (0.0%) | 22 (32.4%) |
| 25 to 34 Years | 3 (2.5%) | 8 (10.3%) |
| 35 to 44 Years | 2 (3.8%) | 0 (0.0%) |
| 45 to 54 Years | 0 (0.0%) | 0 (0.0%) |
| 55 to 64 Years | 0 (0.0%) | 3 (9.1%) |
| 65 to 74 Years | 0 (0.0%) | 2 (5.4%) |
| 75 Years and over | 3 (27.3%) | 5 (6.5%) |
| Total | 27 (3.8%) | 49 (8.5%) |
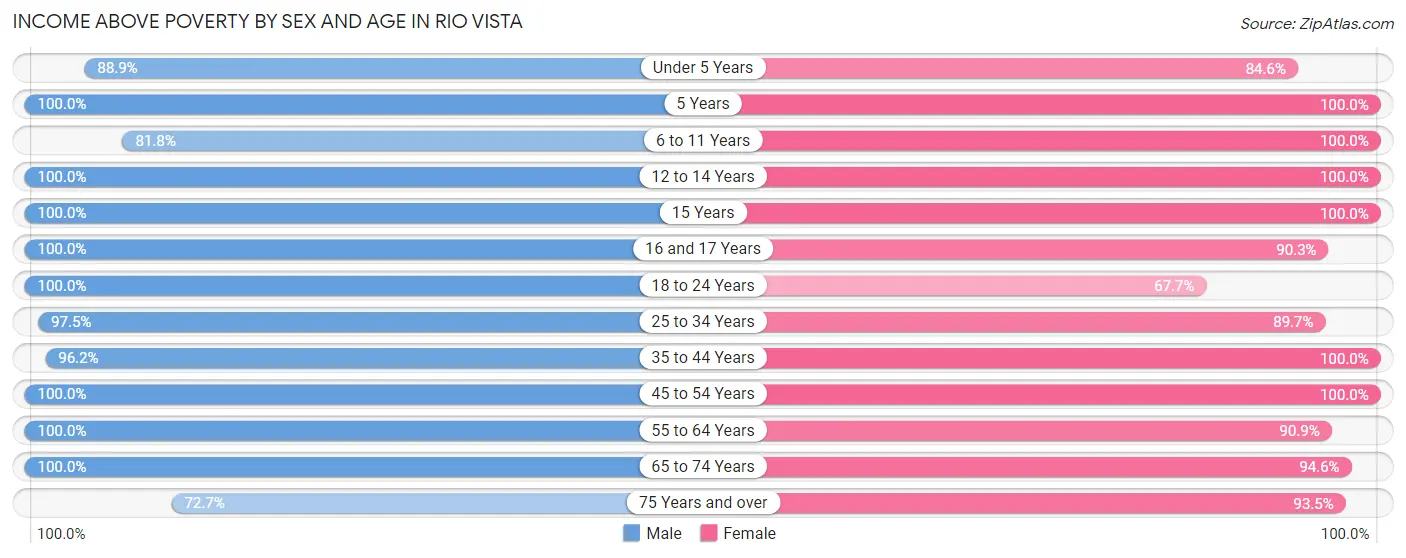
Income Above Poverty by Sex and Age in Rio Vista
According to the poverty statistics in Rio Vista, males aged 5 years and females aged 5 years are the age groups that are most secure financially, with 100.0% of males and 100.0% of females in these age groups living above the poverty line.
| Age Bracket | Male | Female |
| Under 5 Years | 56 (88.9%) | 33 (84.6%) |
| 5 Years | 45 (100.0%) | 2 (100.0%) |
| 6 to 11 Years | 54 (81.8%) | 41 (100.0%) |
| 12 to 14 Years | 39 (100.0%) | 16 (100.0%) |
| 15 Years | 9 (100.0%) | 15 (100.0%) |
| 16 and 17 Years | 20 (100.0%) | 28 (90.3%) |
| 18 to 24 Years | 70 (100.0%) | 46 (67.6%) |
| 25 to 34 Years | 116 (97.5%) | 70 (89.7%) |
| 35 to 44 Years | 50 (96.2%) | 60 (100.0%) |
| 45 to 54 Years | 133 (100.0%) | 81 (100.0%) |
| 55 to 64 Years | 50 (100.0%) | 30 (90.9%) |
| 65 to 74 Years | 30 (100.0%) | 35 (94.6%) |
| 75 Years and over | 8 (72.7%) | 72 (93.5%) |
| Total | 680 (96.2%) | 529 (91.5%) |
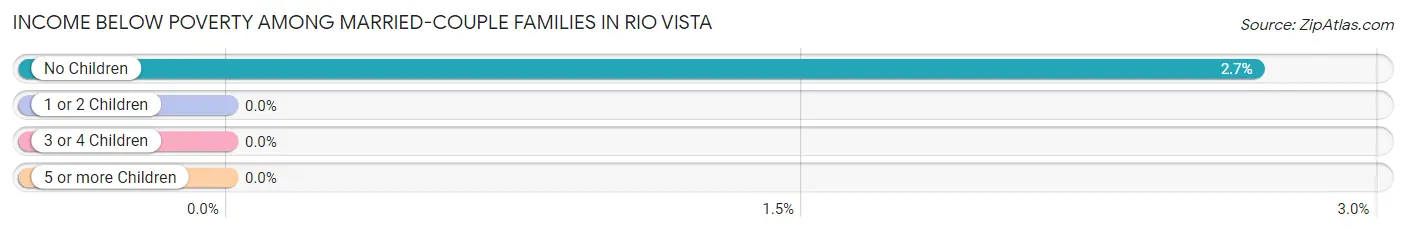
Income Below Poverty Among Married-Couple Families in Rio Vista
The poverty statistics for married-couple families in Rio Vista show that 1.3% or 3 of the total 238 families live below the poverty line. Families with no children have the highest poverty rate of 2.7%, comprising of 3 families. On the other hand, families with 1 or 2 children have the lowest poverty rate of 0.0%, which includes 0 families.
| Children | Above Poverty | Below Poverty |
| No Children | 109 (97.3%) | 3 (2.7%) |
| 1 or 2 Children | 108 (100.0%) | 0 (0.0%) |
| 3 or 4 Children | 18 (100.0%) | 0 (0.0%) |
| 5 or more Children | 0 (0.0%) | 0 (0.0%) |
| Total | 235 (98.7%) | 3 (1.3%) |
Income Below Poverty Among Single-Parent Households in Rio Vista
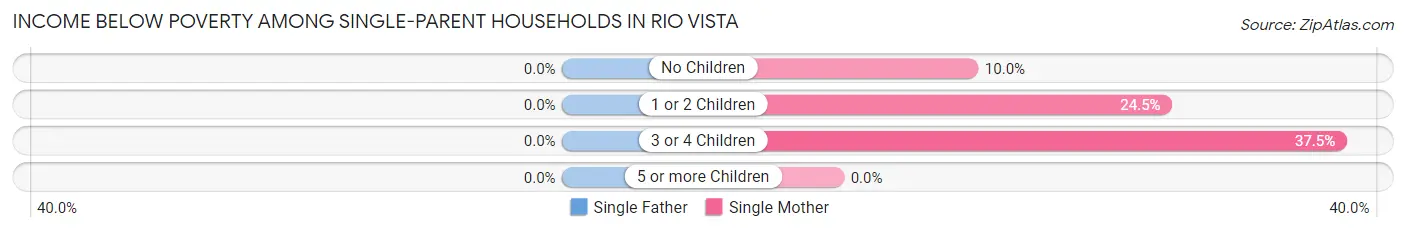
| Children | Single Father | Single Mother |
| No Children | 0 (0.0%) | 2 (10.0%) |
| 1 or 2 Children | 0 (0.0%) | 12 (24.5%) |
| 3 or 4 Children | 0 (0.0%) | 6 (37.5%) |
| 5 or more Children | 0 (0.0%) | 0 (0.0%) |
| Total | 0 (0.0%) | 20 (23.5%) |
Income Below Poverty Among Married-Couple vs Single-Parent Households in Rio Vista
The poverty data for Rio Vista shows that 3 of the married-couple family households (1.3%) and 20 of the single-parent households (12.5%) are living below the poverty level. Within the married-couple family households, those with no children have the highest poverty rate, with 3 households (2.7%) falling below the poverty line. Among the single-parent households, those with 3 or 4 children have the highest poverty rate, with 6 household (31.6%) living below poverty.
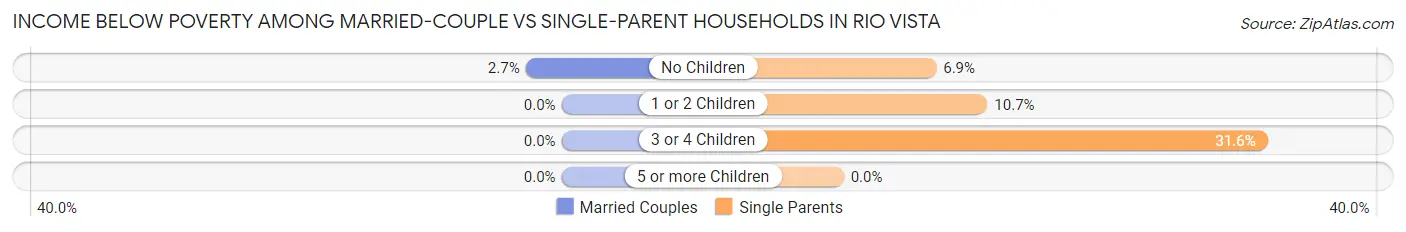
| Children | Married-Couple Families | Single-Parent Households |
| No Children | 3 (2.7%) | 2 (6.9%) |
| 1 or 2 Children | 0 (0.0%) | 12 (10.7%) |
| 3 or 4 Children | 0 (0.0%) | 6 (31.6%) |
| 5 or more Children | 0 (0.0%) | 0 (0.0%) |
| Total | 3 (1.3%) | 20 (12.5%) |
Race in Rio Vista
The most populous races in Rio Vista are White / Caucasian (1,240 | 96.1%), Two or more Races (40 | 3.1%), and Hispanic or Latino (26 | 2.0%).
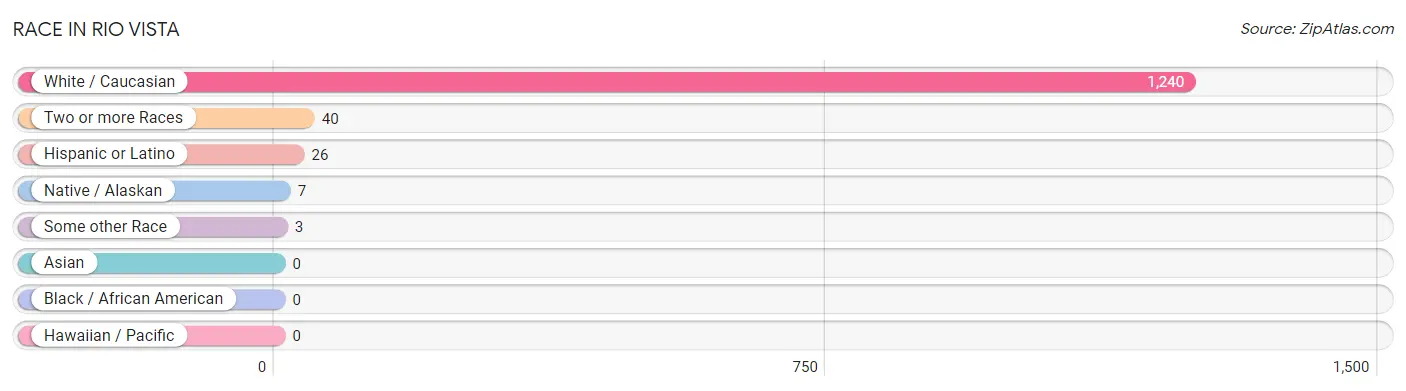
| Race | # Population | % Population |
| Asian | 0 | 0.0% |
| Black / African American | 0 | 0.0% |
| Hawaiian / Pacific | 0 | 0.0% |
| Hispanic or Latino | 26 | 2.0% |
| Native / Alaskan | 7 | 0.5% |
| White / Caucasian | 1,240 | 96.1% |
| Two or more Races | 40 | 3.1% |
| Some other Race | 3 | 0.2% |
| Total | 1,290 | 100.0% |
Ancestry in Rio Vista
The most populous ancestries reported in Rio Vista are American (512 | 39.7%), English (132 | 10.2%), Irish (101 | 7.8%), German (76 | 5.9%), and French (19 | 1.5%), together accounting for 65.1% of all Rio Vista residents.
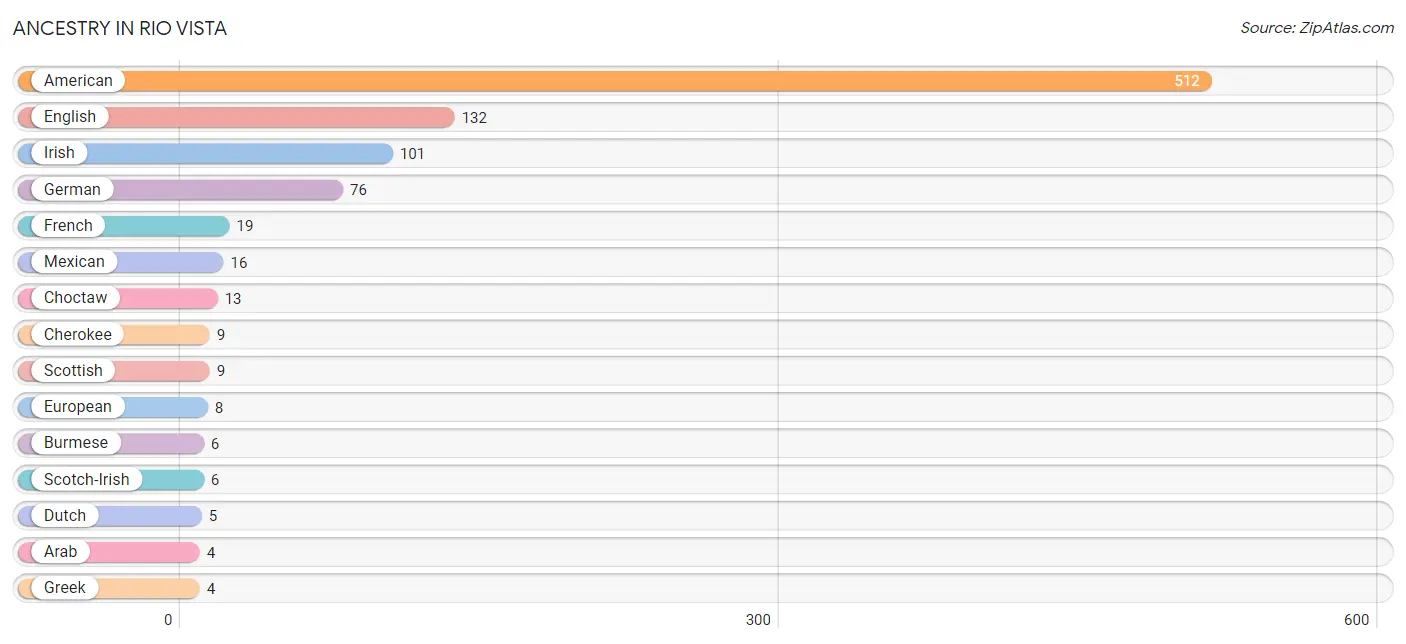
| Ancestry | # Population | % Population |
| American | 512 | 39.7% |
| Arab | 4 | 0.3% |
| British | 2 | 0.2% |
| Burmese | 6 | 0.5% |
| Cajun | 2 | 0.2% |
| Cherokee | 9 | 0.7% |
| Choctaw | 13 | 1.0% |
| Cuban | 3 | 0.2% |
| Dutch | 5 | 0.4% |
| English | 132 | 10.2% |
| European | 8 | 0.6% |
| French | 19 | 1.5% |
| German | 76 | 5.9% |
| Greek | 4 | 0.3% |
| Irish | 101 | 7.8% |
| Italian | 4 | 0.3% |
| Lebanese | 4 | 0.3% |
| Mexican | 16 | 1.2% |
| Polish | 3 | 0.2% |
| Scotch-Irish | 6 | 0.5% |
| Scottish | 9 | 0.7% |
| Spaniard | 4 | 0.3% |
| Swedish | 1 | 0.1% |
| Swiss | 3 | 0.2% | View All 24 Rows |
Immigrants in Rio Vista

| Immigration Origin | # Population | % Population | View All 0 Rows |
Sex and Age in Rio Vista
Sex and Age in Rio Vista
The most populous age groups in Rio Vista are 45 to 49 Years (101 | 14.2%) for men and 15 to 19 Years (70 | 12.0%) for women.
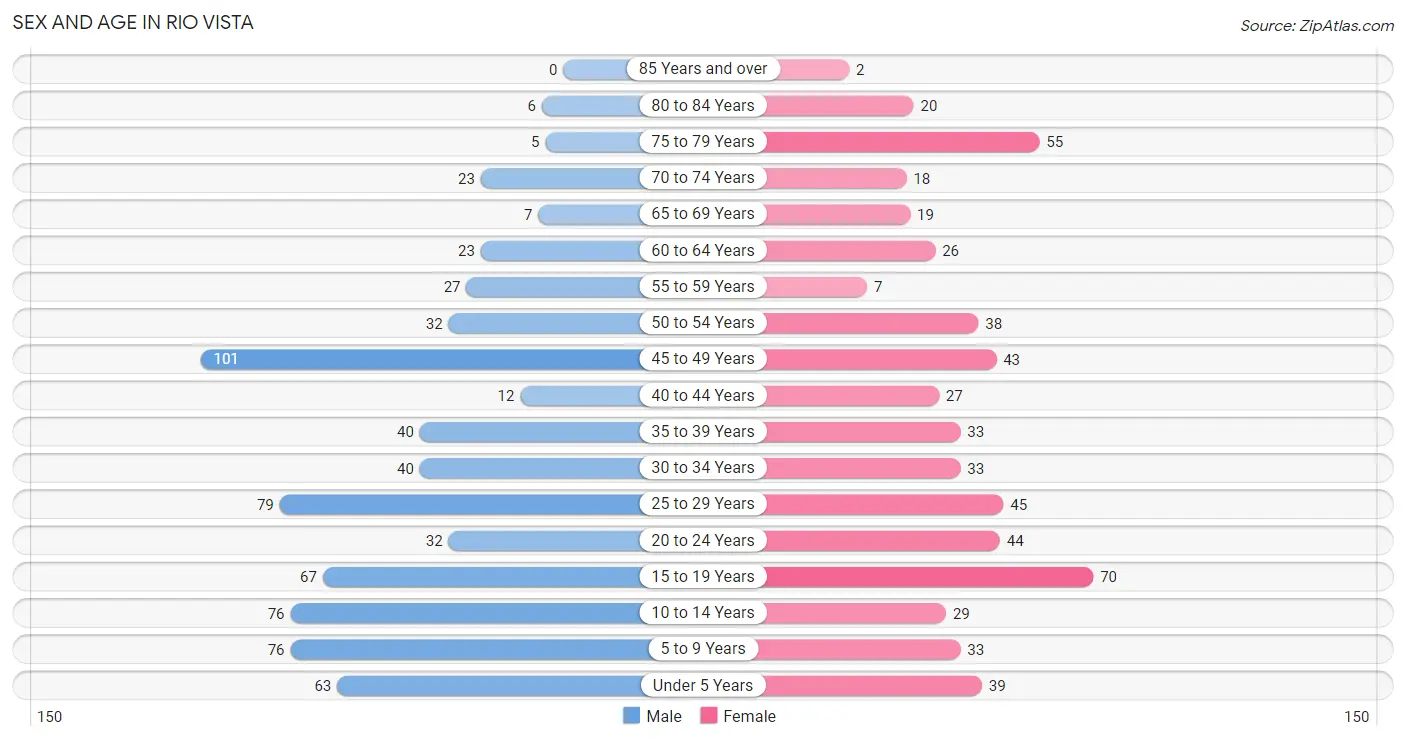
| Age Bracket | Male | Female |
| Under 5 Years | 63 (8.9%) | 39 (6.7%) |
| 5 to 9 Years | 76 (10.7%) | 33 (5.7%) |
| 10 to 14 Years | 76 (10.7%) | 29 (5.0%) |
| 15 to 19 Years | 67 (9.5%) | 70 (12.0%) |
| 20 to 24 Years | 32 (4.5%) | 44 (7.6%) |
| 25 to 29 Years | 79 (11.1%) | 45 (7.7%) |
| 30 to 34 Years | 40 (5.6%) | 33 (5.7%) |
| 35 to 39 Years | 40 (5.6%) | 33 (5.7%) |
| 40 to 44 Years | 12 (1.7%) | 27 (4.6%) |
| 45 to 49 Years | 101 (14.2%) | 43 (7.4%) |
| 50 to 54 Years | 32 (4.5%) | 38 (6.5%) |
| 55 to 59 Years | 27 (3.8%) | 7 (1.2%) |
| 60 to 64 Years | 23 (3.2%) | 26 (4.5%) |
| 65 to 69 Years | 7 (1.0%) | 19 (3.3%) |
| 70 to 74 Years | 23 (3.2%) | 18 (3.1%) |
| 75 to 79 Years | 5 (0.7%) | 55 (9.5%) |
| 80 to 84 Years | 6 (0.9%) | 20 (3.4%) |
| 85 Years and over | 0 (0.0%) | 2 (0.3%) |
| Total | 709 (100.0%) | 581 (100.0%) |
Families and Households in Rio Vista
Median Family Size in Rio Vista
The median family size in Rio Vista is 2.91 persons per family, with married-couple families (238 | 59.8%) accounting for the largest median family size of 3.19 persons per family. On the other hand, single male/father families (75 | 18.8%) represent the smallest median family size with 2.29 persons per family.
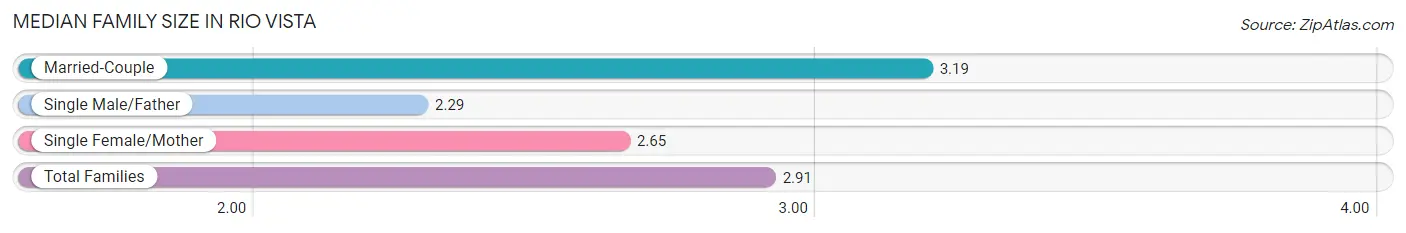
| Family Type | # Families | Family Size |
| Married-Couple | 238 (59.8%) | 3.19 |
| Single Male/Father | 75 (18.8%) | 2.29 |
| Single Female/Mother | 85 (21.4%) | 2.65 |
| Total Families | 398 (100.0%) | 2.91 |
Median Household Size in Rio Vista
The median household size in Rio Vista is 2.67 persons per household, with married-couple households (238 | 49.3%) accounting for the largest median household size of 3.23 persons per household. non-family households (85 | 17.6%) represent the smallest median household size with 1.31 persons per household.
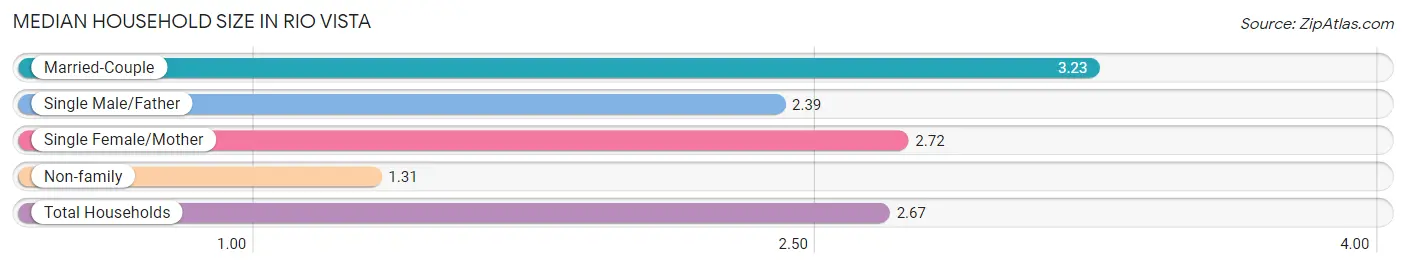
| Household Type | # Households | Household Size |
| Married-Couple | 238 (49.3%) | 3.23 |
| Single Male/Father | 75 (15.5%) | 2.39 |
| Single Female/Mother | 85 (17.6%) | 2.72 |
| Non-family | 85 (17.6%) | 1.31 |
| Total Households | 483 (100.0%) | 2.67 |
Household Size by Marriage Status in Rio Vista
Out of a total of 483 households in Rio Vista, 398 (82.4%) are family households, while 85 (17.6%) are nonfamily households. The most numerous type of family households are 2-person households, comprising 197, and the most common type of nonfamily households are 1-person households, comprising 61.
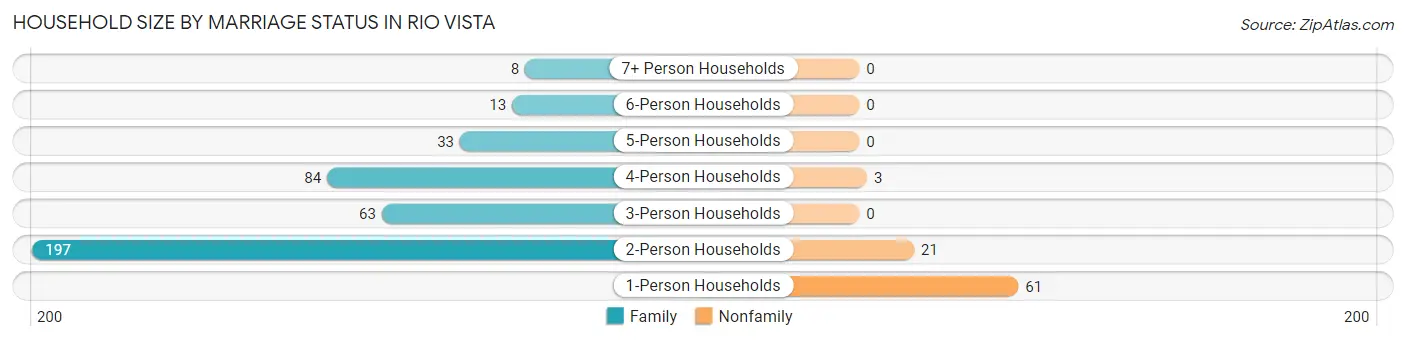
| Household Size | Family Households | Nonfamily Households |
| 1-Person Households | - | 61 (12.6%) |
| 2-Person Households | 197 (40.8%) | 21 (4.3%) |
| 3-Person Households | 63 (13.0%) | 0 (0.0%) |
| 4-Person Households | 84 (17.4%) | 3 (0.6%) |
| 5-Person Households | 33 (6.8%) | 0 (0.0%) |
| 6-Person Households | 13 (2.7%) | 0 (0.0%) |
| 7+ Person Households | 8 (1.7%) | 0 (0.0%) |
| Total | 398 (82.4%) | 85 (17.6%) |
Female Fertility in Rio Vista
Fertility by Age in Rio Vista
Average fertility rate in Rio Vista is 59.0 births per 1,000 women. Women in the age bracket of 20 to 34 years have the highest fertility rate with 148.0 births per 1,000 women. Women in the age bracket of 20 to 34 years acount for 100.0% of all women with births.
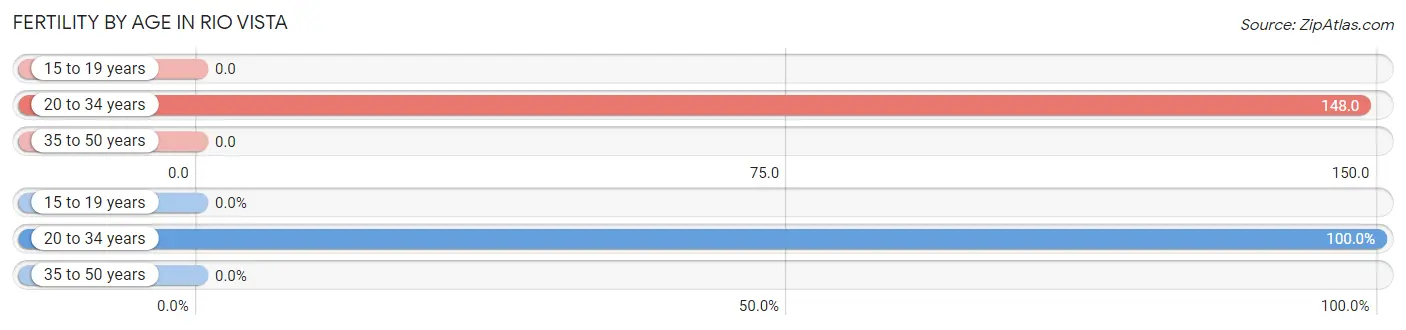
| Age Bracket | Women with Births | Births / 1,000 Women |
| 15 to 19 years | 0 (0.0%) | 0.0 |
| 20 to 34 years | 18 (100.0%) | 148.0 |
| 35 to 50 years | 0 (0.0%) | 0.0 |
| Total | 18 (100.0%) | 59.0 |
Fertility by Age by Marriage Status in Rio Vista
55.6% of women with births (18) in Rio Vista are married. The highest percentage of unmarried women with births falls into 20 to 34 years age bracket with 44.4% of them unmarried at the time of birth, while the lowest percentage of unmarried women with births belong to 20 to 34 years age bracket with 44.4% of them unmarried.

| Age Bracket | Married | Unmarried |
| 15 to 19 years | 0 (0.0%) | 0 (0.0%) |
| 20 to 34 years | 10 (55.6%) | 8 (44.4%) |
| 35 to 50 years | 0 (0.0%) | 0 (0.0%) |
| Total | 10 (55.6%) | 8 (44.4%) |
Fertility by Education in Rio Vista
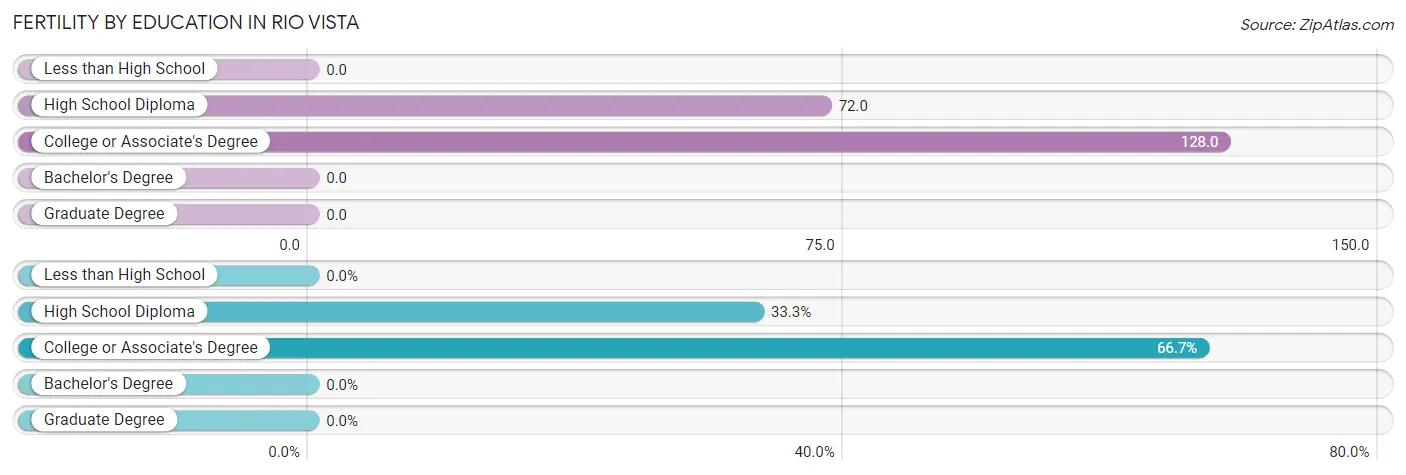
| Educational Attainment | Women with Births | Births / 1,000 Women |
| Less than High School | 0 (0.0%) | 0.0 |
| High School Diploma | 6 (33.3%) | 72.0 |
| College or Associate's Degree | 12 (66.7%) | 128.0 |
| Bachelor's Degree | 0 (0.0%) | 0.0 |
| Graduate Degree | 0 (0.0%) | 0.0 |
| Total | 18 (100.0%) | 59.0 |
Fertility by Education by Marriage Status in Rio Vista
44.4% of women with births in Rio Vista are unmarried. Women with the educational attainment of high school diploma are most likely to be married with 100.0% of them married at childbirth, while women with the educational attainment of college or associate's degree are least likely to be married with 66.7% of them unmarried at childbirth.
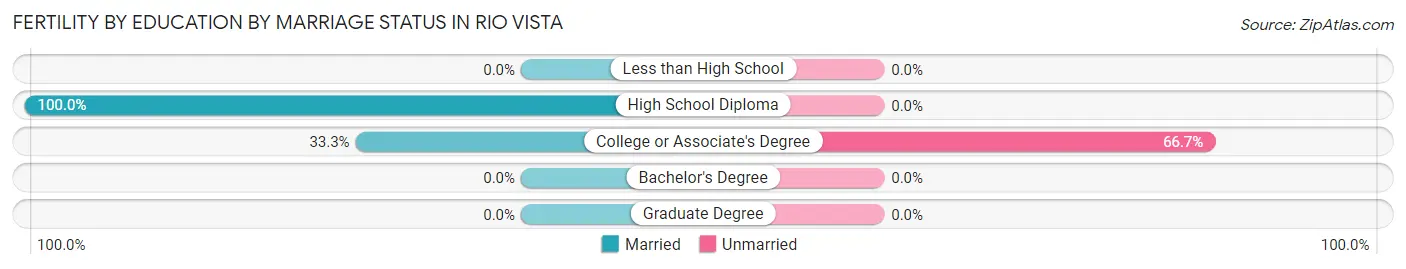
| Educational Attainment | Married | Unmarried |
| Less than High School | 0 (0.0%) | 0 (0.0%) |
| High School Diploma | 6 (100.0%) | 0 (0.0%) |
| College or Associate's Degree | 4 (33.3%) | 8 (66.7%) |
| Bachelor's Degree | 0 (0.0%) | 0 (0.0%) |
| Graduate Degree | 0 (0.0%) | 0 (0.0%) |
| Total | 10 (55.6%) | 8 (44.4%) |
Employment Characteristics in Rio Vista
Employment by Class of Employer in Rio Vista
Among the 650 employed individuals in Rio Vista, private company employees (537 | 82.6%), local government employees (39 | 6.0%), and not-for-profit organizations (38 | 5.9%) make up the most common classes of employment.
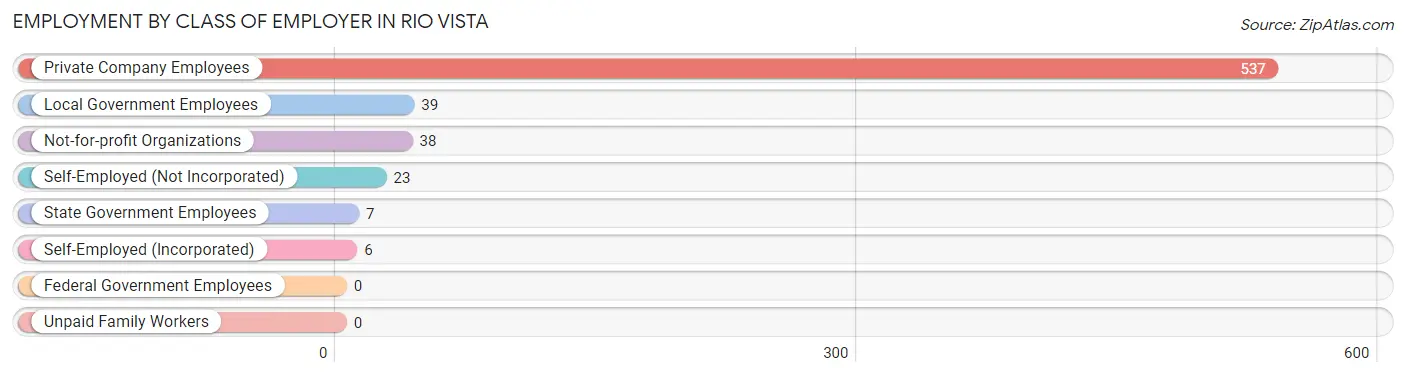
| Employer Class | # Employees | % Employees |
| Private Company Employees | 537 | 82.6% |
| Self-Employed (Incorporated) | 6 | 0.9% |
| Self-Employed (Not Incorporated) | 23 | 3.5% |
| Not-for-profit Organizations | 38 | 5.9% |
| Local Government Employees | 39 | 6.0% |
| State Government Employees | 7 | 1.1% |
| Federal Government Employees | 0 | 0.0% |
| Unpaid Family Workers | 0 | 0.0% |
| Total | 650 | 100.0% |
Employment Status by Age in Rio Vista
According to the labor force statistics for Rio Vista, out of the total population over 16 years of age (950), 71.7% or 681 individuals are in the labor force, with 3.2% or 22 of them unemployed. The age group with the highest labor force participation rate is 35 to 44 years, with 90.2% or 101 individuals in the labor force. Within the labor force, the 30 to 34 years age range has the highest percentage of unemployed individuals, with 9.4% or 6 of them being unemployed.
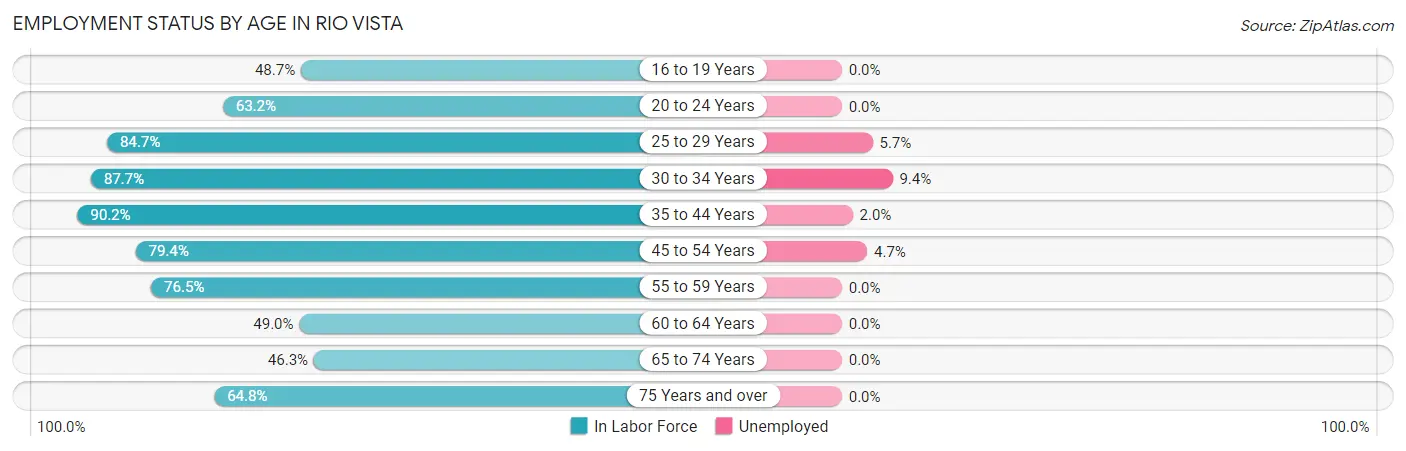
| Age Bracket | In Labor Force | Unemployed |
| 16 to 19 Years | 55 (48.7%) | 0 (0.0%) |
| 20 to 24 Years | 48 (63.2%) | 0 (0.0%) |
| 25 to 29 Years | 105 (84.7%) | 6 (5.7%) |
| 30 to 34 Years | 64 (87.7%) | 6 (9.4%) |
| 35 to 44 Years | 101 (90.2%) | 2 (2.0%) |
| 45 to 54 Years | 170 (79.4%) | 8 (4.7%) |
| 55 to 59 Years | 26 (76.5%) | 0 (0.0%) |
| 60 to 64 Years | 24 (49.0%) | 0 (0.0%) |
| 65 to 74 Years | 31 (46.3%) | 0 (0.0%) |
| 75 Years and over | 57 (64.8%) | 0 (0.0%) |
| Total | 681 (71.7%) | 22 (3.2%) |
Employment Status by Educational Attainment in Rio Vista
According to labor force statistics for Rio Vista, 80.9% of individuals (490) out of the total population between 25 and 64 years of age (606) are in the labor force, with 4.5% or 22 of them being unemployed. The group with the highest labor force participation rate are those with the educational attainment of bachelor's degree or higher, with 96.3% or 77 individuals in the labor force. Within the labor force, individuals with college / associate degree education have the highest percentage of unemployment, with 10.6% or 14 of them being unemployed.

| Educational Attainment | In Labor Force | Unemployed |
| Less than High School | 12 (50.0%) | 0 (0.0%) |
| High School Diploma | 269 (82.8%) | 10 (3.0%) |
| College / Associate Degree | 132 (74.6%) | 19 (10.6%) |
| Bachelor's Degree or higher | 77 (96.3%) | 0 (0.0%) |
| Total | 490 (80.9%) | 27 (4.5%) |
Employment Occupations by Sex in Rio Vista
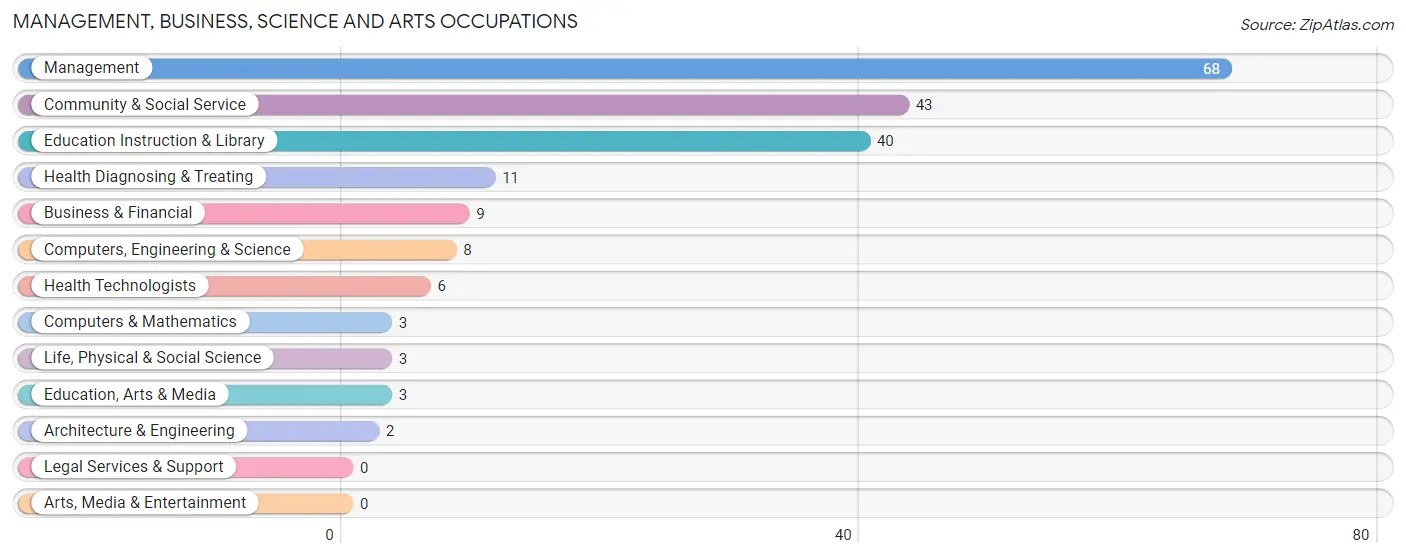
Management, Business, Science and Arts Occupations
The most common Management, Business, Science and Arts occupations in Rio Vista are Management (68 | 10.3%), Community & Social Service (43 | 6.5%), Education Instruction & Library (40 | 6.1%), Health Diagnosing & Treating (11 | 1.7%), and Business & Financial (9 | 1.4%).
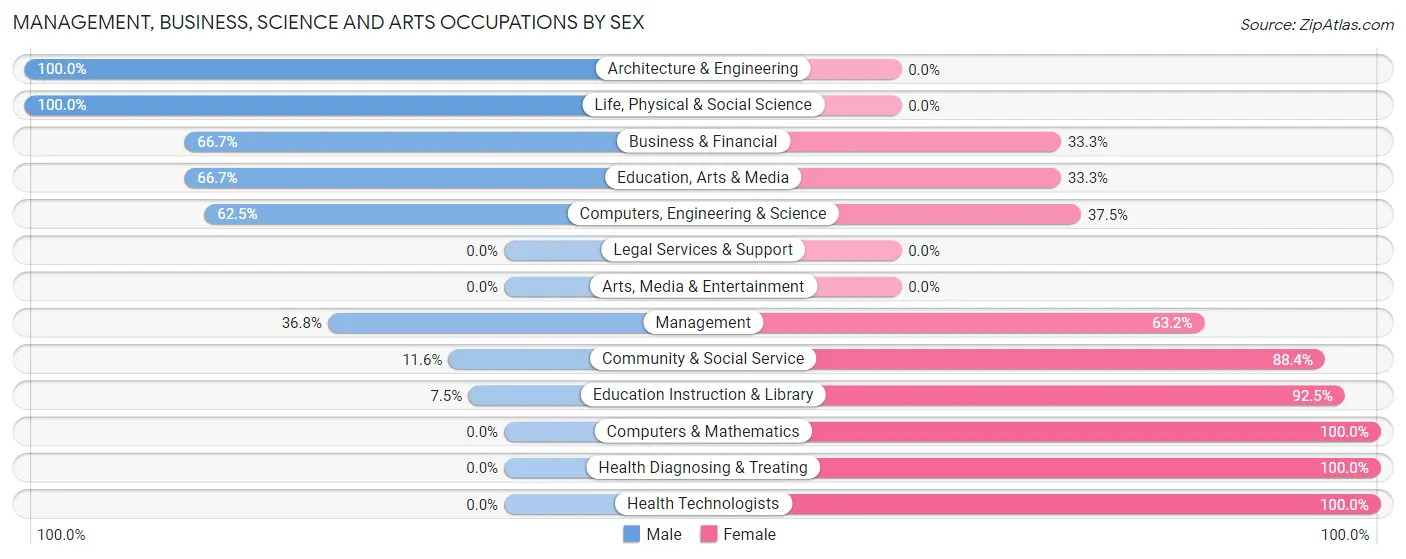
Management, Business, Science and Arts Occupations by Sex
Within the Management, Business, Science and Arts occupations in Rio Vista, the most male-oriented occupations are Architecture & Engineering (100.0%), Life, Physical & Social Science (100.0%), and Business & Financial (66.7%), while the most female-oriented occupations are Computers & Mathematics (100.0%), Health Diagnosing & Treating (100.0%), and Health Technologists (100.0%).
| Occupation | Male | Female |
| Management | 25 (36.8%) | 43 (63.2%) |
| Business & Financial | 6 (66.7%) | 3 (33.3%) |
| Computers, Engineering & Science | 5 (62.5%) | 3 (37.5%) |
| Computers & Mathematics | 0 (0.0%) | 3 (100.0%) |
| Architecture & Engineering | 2 (100.0%) | 0 (0.0%) |
| Life, Physical & Social Science | 3 (100.0%) | 0 (0.0%) |
| Community & Social Service | 5 (11.6%) | 38 (88.4%) |
| Education, Arts & Media | 2 (66.7%) | 1 (33.3%) |
| Legal Services & Support | 0 (0.0%) | 0 (0.0%) |
| Education Instruction & Library | 3 (7.5%) | 37 (92.5%) |
| Arts, Media & Entertainment | 0 (0.0%) | 0 (0.0%) |
| Health Diagnosing & Treating | 0 (0.0%) | 11 (100.0%) |
| Health Technologists | 0 (0.0%) | 6 (100.0%) |
| Total (Category) | 41 (29.5%) | 98 (70.5%) |
| Total (Overall) | 363 (55.1%) | 296 (44.9%) |
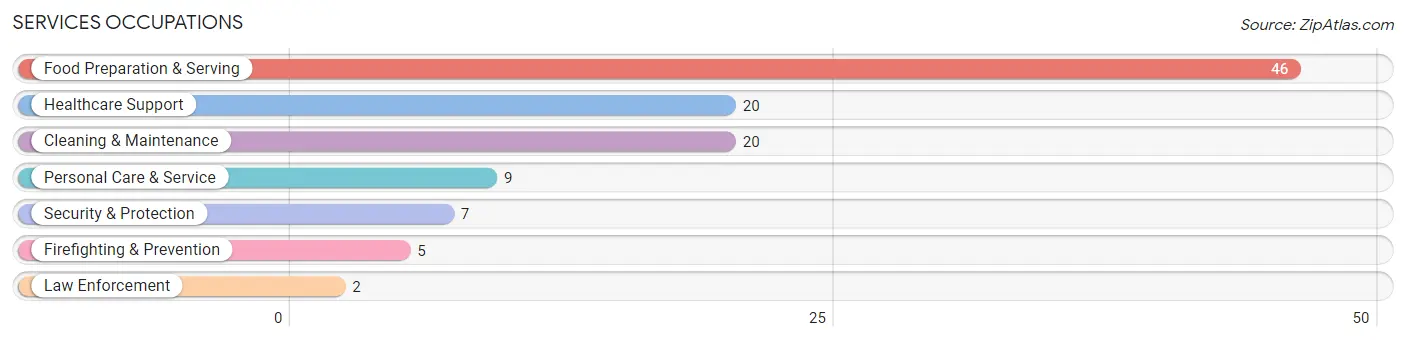
Services Occupations
The most common Services occupations in Rio Vista are Food Preparation & Serving (46 | 7.0%), Healthcare Support (20 | 3.0%), Cleaning & Maintenance (20 | 3.0%), Personal Care & Service (9 | 1.4%), and Security & Protection (7 | 1.1%).
Services Occupations by Sex
Within the Services occupations in Rio Vista, the most male-oriented occupations are Security & Protection (100.0%), Firefighting & Prevention (100.0%), and Law Enforcement (100.0%), while the most female-oriented occupations are Healthcare Support (100.0%), Personal Care & Service (100.0%), and Food Preparation & Serving (32.6%).
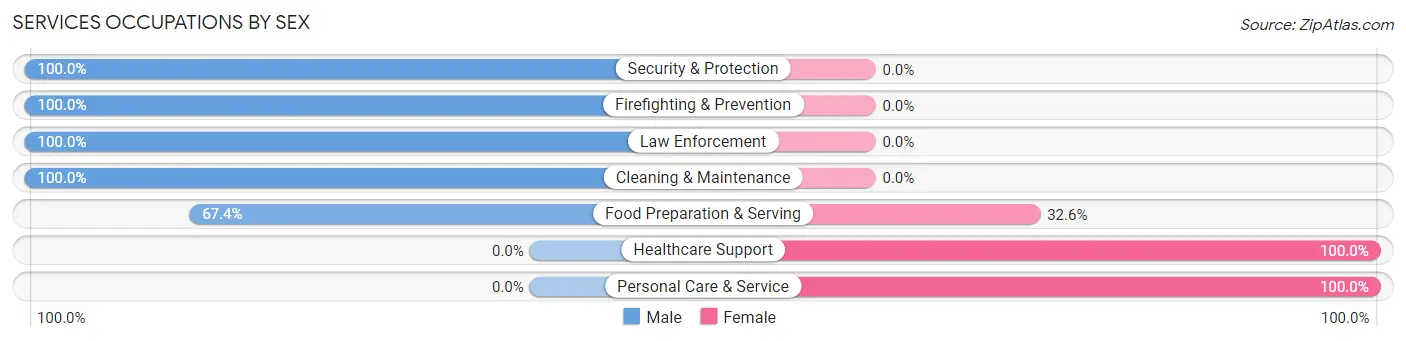
| Occupation | Male | Female |
| Healthcare Support | 0 (0.0%) | 20 (100.0%) |
| Security & Protection | 7 (100.0%) | 0 (0.0%) |
| Firefighting & Prevention | 5 (100.0%) | 0 (0.0%) |
| Law Enforcement | 2 (100.0%) | 0 (0.0%) |
| Food Preparation & Serving | 31 (67.4%) | 15 (32.6%) |
| Cleaning & Maintenance | 20 (100.0%) | 0 (0.0%) |
| Personal Care & Service | 0 (0.0%) | 9 (100.0%) |
| Total (Category) | 58 (56.9%) | 44 (43.1%) |
| Total (Overall) | 363 (55.1%) | 296 (44.9%) |
Sales and Office Occupations
The most common Sales and Office occupations in Rio Vista are Office & Administration (89 | 13.5%), and Sales & Related (74 | 11.2%).

Sales and Office Occupations by Sex

| Occupation | Male | Female |
| Sales & Related | 42 (56.8%) | 32 (43.2%) |
| Office & Administration | 16 (18.0%) | 73 (82.0%) |
| Total (Category) | 58 (35.6%) | 105 (64.4%) |
| Total (Overall) | 363 (55.1%) | 296 (44.9%) |
Natural Resources, Construction and Maintenance Occupations
The most common Natural Resources, Construction and Maintenance occupations in Rio Vista are Construction & Extraction (51 | 7.7%), and Installation, Maintenance & Repair (50 | 7.6%).
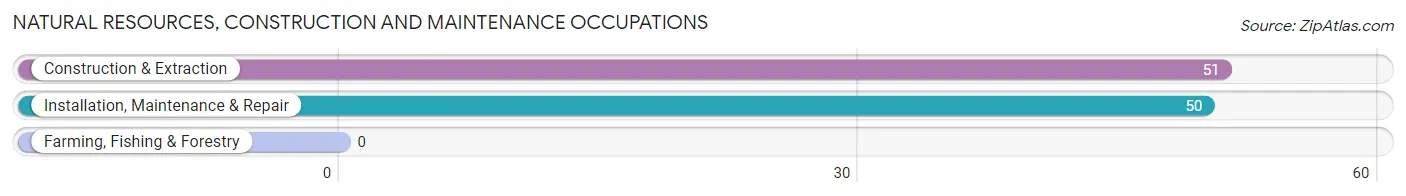
Natural Resources, Construction and Maintenance Occupations by Sex

| Occupation | Male | Female |
| Farming, Fishing & Forestry | 0 (0.0%) | 0 (0.0%) |
| Construction & Extraction | 44 (86.3%) | 7 (13.7%) |
| Installation, Maintenance & Repair | 50 (100.0%) | 0 (0.0%) |
| Total (Category) | 94 (93.1%) | 7 (6.9%) |
| Total (Overall) | 363 (55.1%) | 296 (44.9%) |
Production, Transportation and Moving Occupations
The most common Production, Transportation and Moving occupations in Rio Vista are Material Moving (117 | 17.7%), Production (19 | 2.9%), and Transportation (18 | 2.7%).
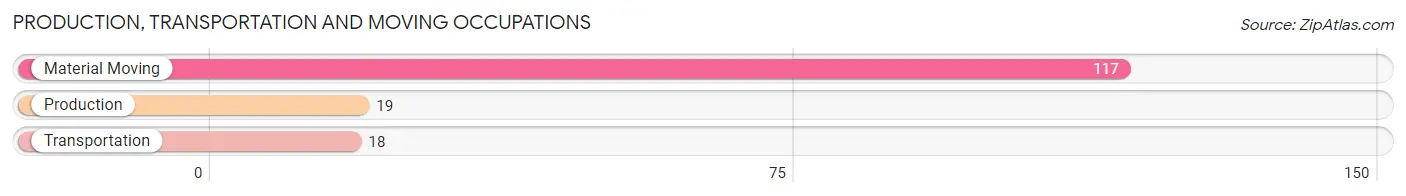
Production, Transportation and Moving Occupations by Sex
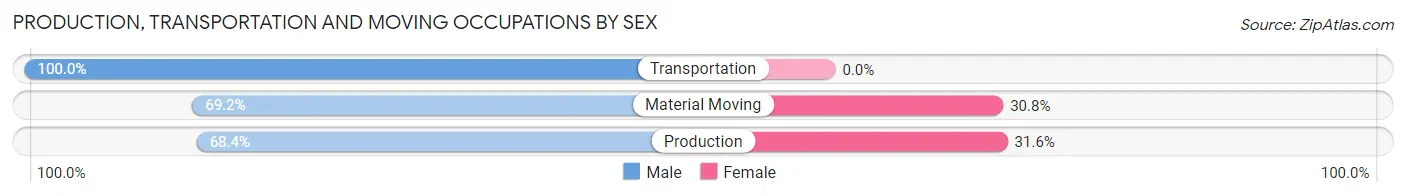
| Occupation | Male | Female |
| Production | 13 (68.4%) | 6 (31.6%) |
| Transportation | 18 (100.0%) | 0 (0.0%) |
| Material Moving | 81 (69.2%) | 36 (30.8%) |
| Total (Category) | 112 (72.7%) | 42 (27.3%) |
| Total (Overall) | 363 (55.1%) | 296 (44.9%) |
Employment Industries by Sex in Rio Vista
Employment Industries in Rio Vista
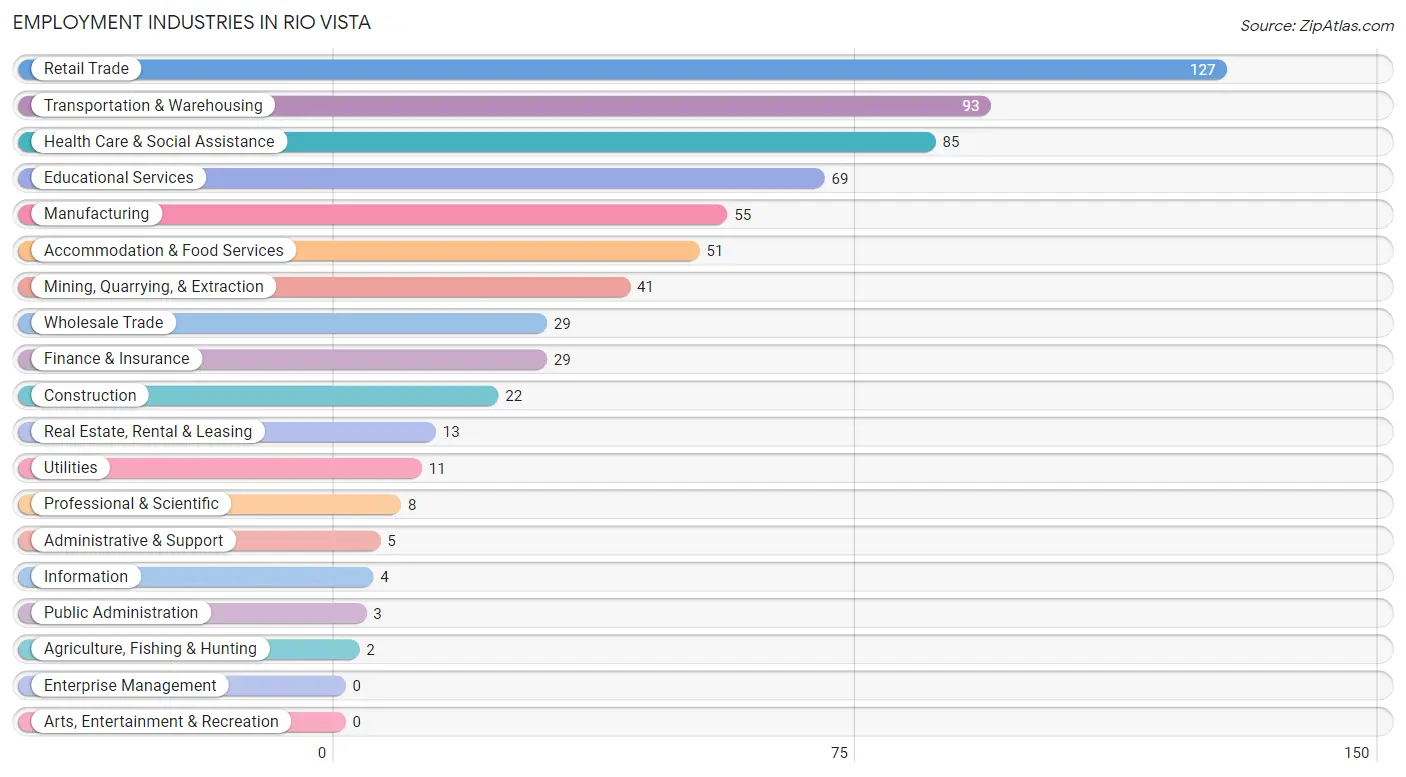
The major employment industries in Rio Vista include Retail Trade (127 | 19.3%), Transportation & Warehousing (93 | 14.1%), Health Care & Social Assistance (85 | 12.9%), Educational Services (69 | 10.5%), and Manufacturing (55 | 8.4%).
Employment Industries by Sex in Rio Vista
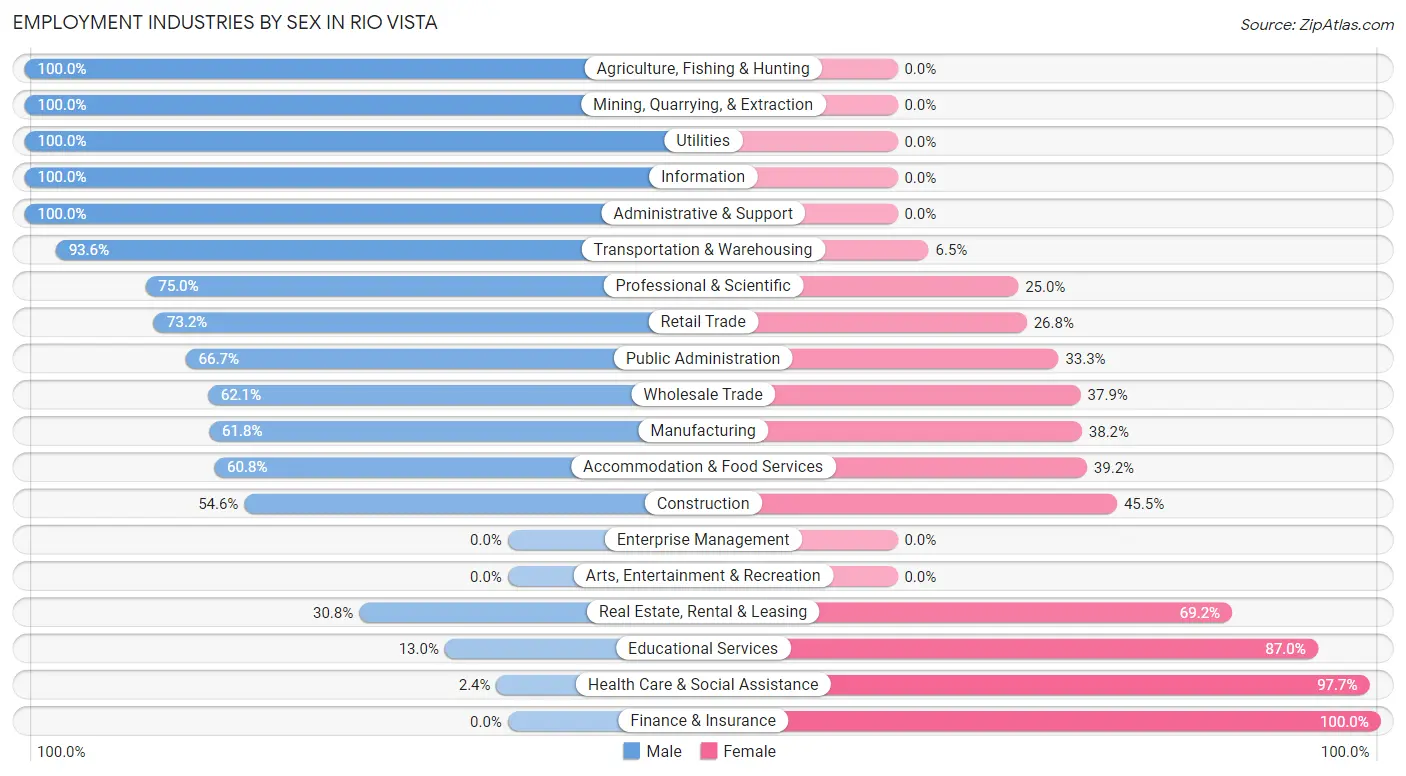
The Rio Vista industries that see more men than women are Agriculture, Fishing & Hunting (100.0%), Mining, Quarrying, & Extraction (100.0%), and Utilities (100.0%), whereas the industries that tend to have a higher number of women are Finance & Insurance (100.0%), Health Care & Social Assistance (97.7%), and Educational Services (87.0%).
| Industry | Male | Female |
| Agriculture, Fishing & Hunting | 2 (100.0%) | 0 (0.0%) |
| Mining, Quarrying, & Extraction | 41 (100.0%) | 0 (0.0%) |
| Construction | 12 (54.5%) | 10 (45.5%) |
| Manufacturing | 34 (61.8%) | 21 (38.2%) |
| Wholesale Trade | 18 (62.1%) | 11 (37.9%) |
| Retail Trade | 93 (73.2%) | 34 (26.8%) |
| Transportation & Warehousing | 87 (93.5%) | 6 (6.5%) |
| Utilities | 11 (100.0%) | 0 (0.0%) |
| Information | 4 (100.0%) | 0 (0.0%) |
| Finance & Insurance | 0 (0.0%) | 29 (100.0%) |
| Real Estate, Rental & Leasing | 4 (30.8%) | 9 (69.2%) |
| Professional & Scientific | 6 (75.0%) | 2 (25.0%) |
| Enterprise Management | 0 (0.0%) | 0 (0.0%) |
| Administrative & Support | 5 (100.0%) | 0 (0.0%) |
| Educational Services | 9 (13.0%) | 60 (87.0%) |
| Health Care & Social Assistance | 2 (2.4%) | 83 (97.7%) |
| Arts, Entertainment & Recreation | 0 (0.0%) | 0 (0.0%) |
| Accommodation & Food Services | 31 (60.8%) | 20 (39.2%) |
| Public Administration | 2 (66.7%) | 1 (33.3%) |
| Total | 363 (55.1%) | 296 (44.9%) |
Education in Rio Vista
School Enrollment in Rio Vista
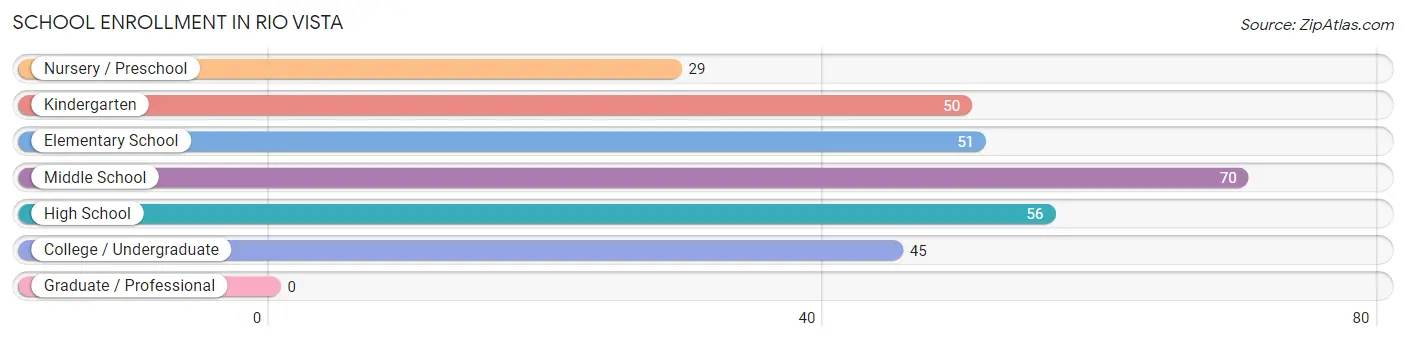
The most common levels of schooling among the 301 students in Rio Vista are middle school (70 | 23.3%), high school (56 | 18.6%), and elementary school (51 | 16.9%).
| School Level | # Students | % Students |
| Nursery / Preschool | 29 | 9.6% |
| Kindergarten | 50 | 16.6% |
| Elementary School | 51 | 16.9% |
| Middle School | 70 | 23.3% |
| High School | 56 | 18.6% |
| College / Undergraduate | 45 | 14.9% |
| Graduate / Professional | 0 | 0.0% |
| Total | 301 | 100.0% |
School Enrollment by Age by Funding Source in Rio Vista
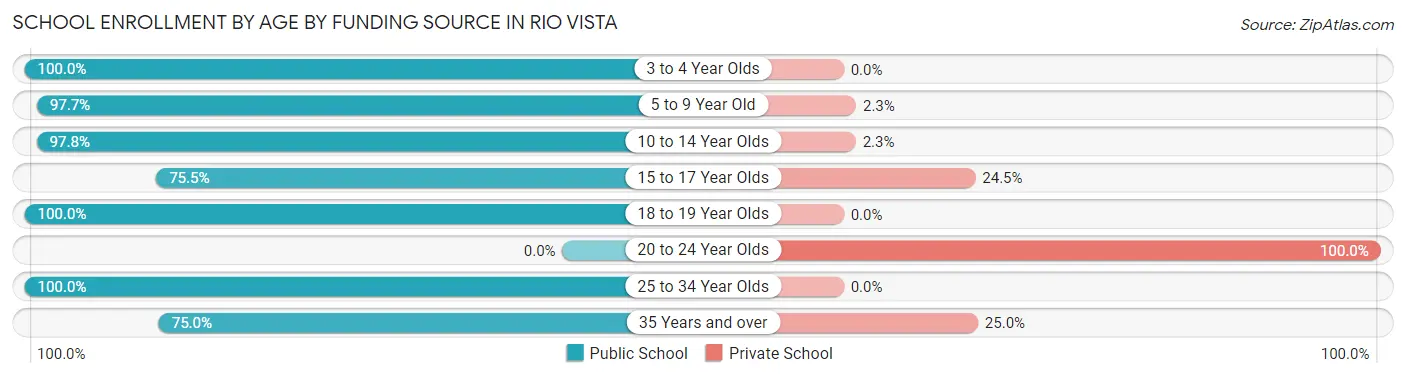
Out of a total of 301 students who are enrolled in schools in Rio Vista, 23 (7.6%) attend a private institution, while the remaining 278 (92.4%) are enrolled in public schools. The age group of 20 to 24 year olds has the highest likelihood of being enrolled in private schools, with 3 (100.0% in the age bracket) enrolled. Conversely, the age group of 3 to 4 year olds has the lowest likelihood of being enrolled in a private school, with 27 (100.0% in the age bracket) attending a public institution.
| Age Bracket | Public School | Private School |
| 3 to 4 Year Olds | 27 (100.0%) | 0 (0.0%) |
| 5 to 9 Year Old | 85 (97.7%) | 2 (2.3%) |
| 10 to 14 Year Olds | 87 (97.8%) | 2 (2.2%) |
| 15 to 17 Year Olds | 40 (75.5%) | 13 (24.5%) |
| 18 to 19 Year Olds | 16 (100.0%) | 0 (0.0%) |
| 20 to 24 Year Olds | 0 (0.0%) | 3 (100.0%) |
| 25 to 34 Year Olds | 14 (100.0%) | 0 (0.0%) |
| 35 Years and over | 9 (75.0%) | 3 (25.0%) |
| Total | 278 (92.4%) | 23 (7.6%) |
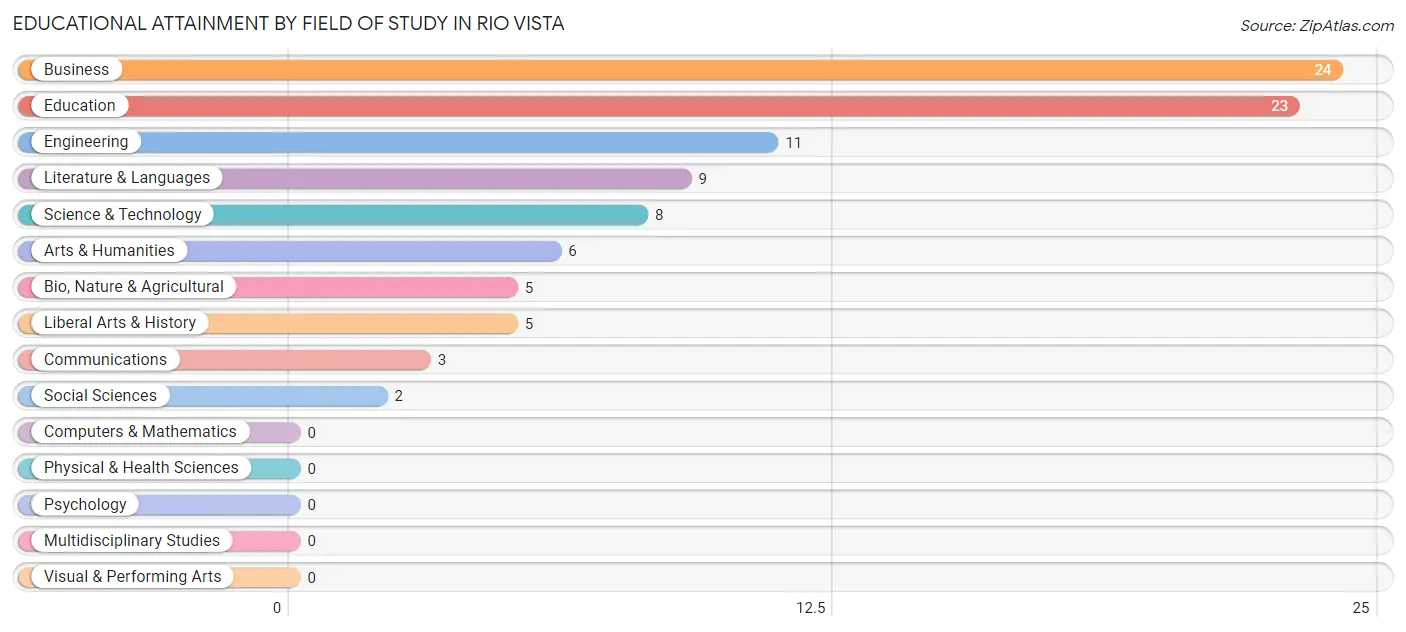
Educational Attainment by Field of Study in Rio Vista
Business (24 | 25.0%), education (23 | 24.0%), engineering (11 | 11.5%), literature & languages (9 | 9.4%), and science & technology (8 | 8.3%) are the most common fields of study among 96 individuals in Rio Vista who have obtained a bachelor's degree or higher.
| Field of Study | # Graduates | % Graduates |
| Computers & Mathematics | 0 | 0.0% |
| Bio, Nature & Agricultural | 5 | 5.2% |
| Physical & Health Sciences | 0 | 0.0% |
| Psychology | 0 | 0.0% |
| Social Sciences | 2 | 2.1% |
| Engineering | 11 | 11.5% |
| Multidisciplinary Studies | 0 | 0.0% |
| Science & Technology | 8 | 8.3% |
| Business | 24 | 25.0% |
| Education | 23 | 24.0% |
| Literature & Languages | 9 | 9.4% |
| Liberal Arts & History | 5 | 5.2% |
| Visual & Performing Arts | 0 | 0.0% |
| Communications | 3 | 3.1% |
| Arts & Humanities | 6 | 6.2% |
| Total | 96 | 100.0% |
Transportation & Commute in Rio Vista
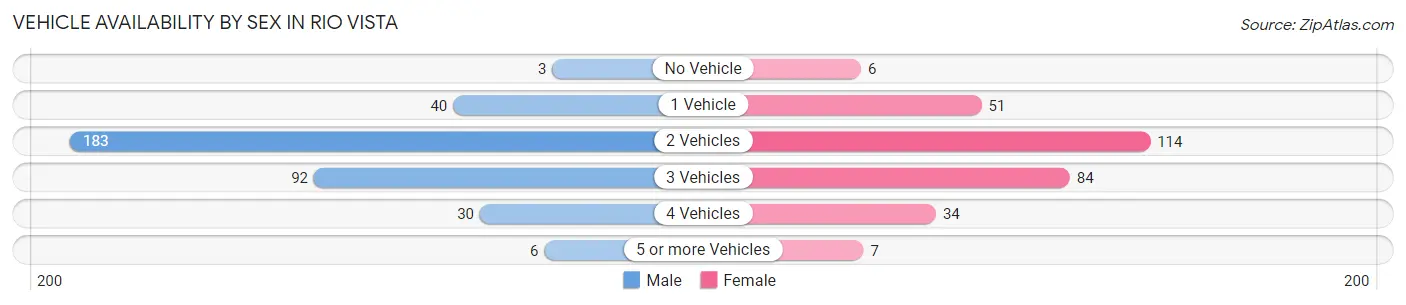
Vehicle Availability by Sex in Rio Vista
The most prevalent vehicle ownership categories in Rio Vista are males with 2 vehicles (183, accounting for 51.7%) and females with 2 vehicles (114, making up 61.8%).
| Vehicles Available | Male | Female |
| No Vehicle | 3 (0.9%) | 6 (2.0%) |
| 1 Vehicle | 40 (11.3%) | 51 (17.2%) |
| 2 Vehicles | 183 (51.7%) | 114 (38.5%) |
| 3 Vehicles | 92 (26.0%) | 84 (28.4%) |
| 4 Vehicles | 30 (8.5%) | 34 (11.5%) |
| 5 or more Vehicles | 6 (1.7%) | 7 (2.4%) |
| Total | 354 (100.0%) | 296 (100.0%) |
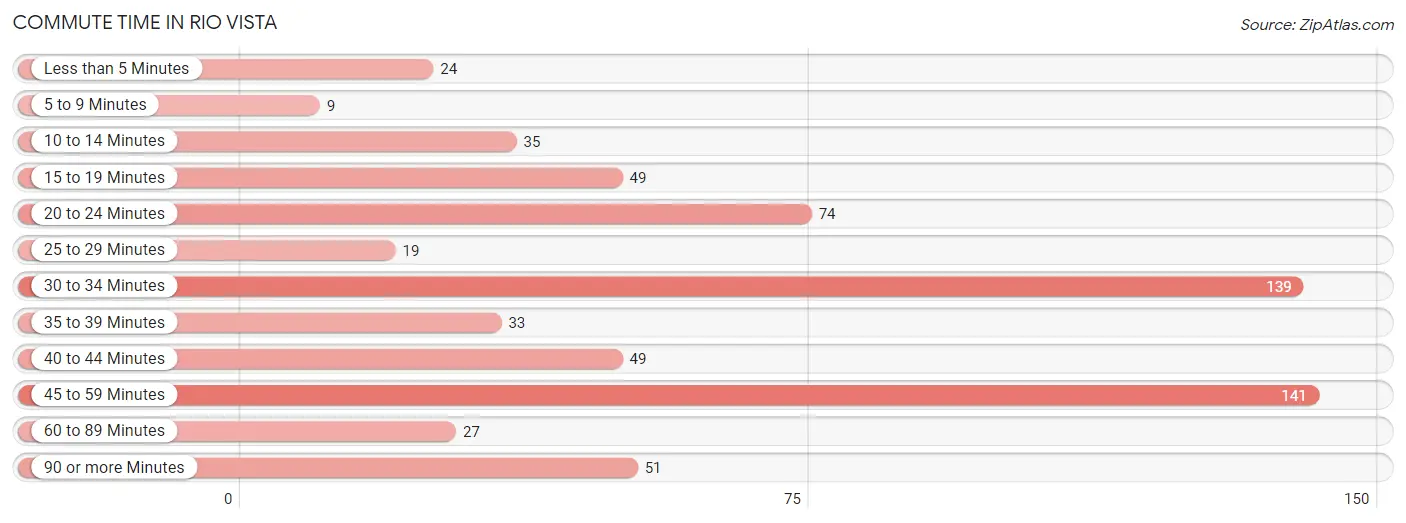
Commute Time in Rio Vista
The most frequently occuring commute durations in Rio Vista are 45 to 59 minutes (141 commuters, 21.7%), 30 to 34 minutes (139 commuters, 21.4%), and 20 to 24 minutes (74 commuters, 11.4%).
| Commute Time | # Commuters | % Commuters |
| Less than 5 Minutes | 24 | 3.7% |
| 5 to 9 Minutes | 9 | 1.4% |
| 10 to 14 Minutes | 35 | 5.4% |
| 15 to 19 Minutes | 49 | 7.5% |
| 20 to 24 Minutes | 74 | 11.4% |
| 25 to 29 Minutes | 19 | 2.9% |
| 30 to 34 Minutes | 139 | 21.4% |
| 35 to 39 Minutes | 33 | 5.1% |
| 40 to 44 Minutes | 49 | 7.5% |
| 45 to 59 Minutes | 141 | 21.7% |
| 60 to 89 Minutes | 27 | 4.2% |
| 90 or more Minutes | 51 | 7.9% |
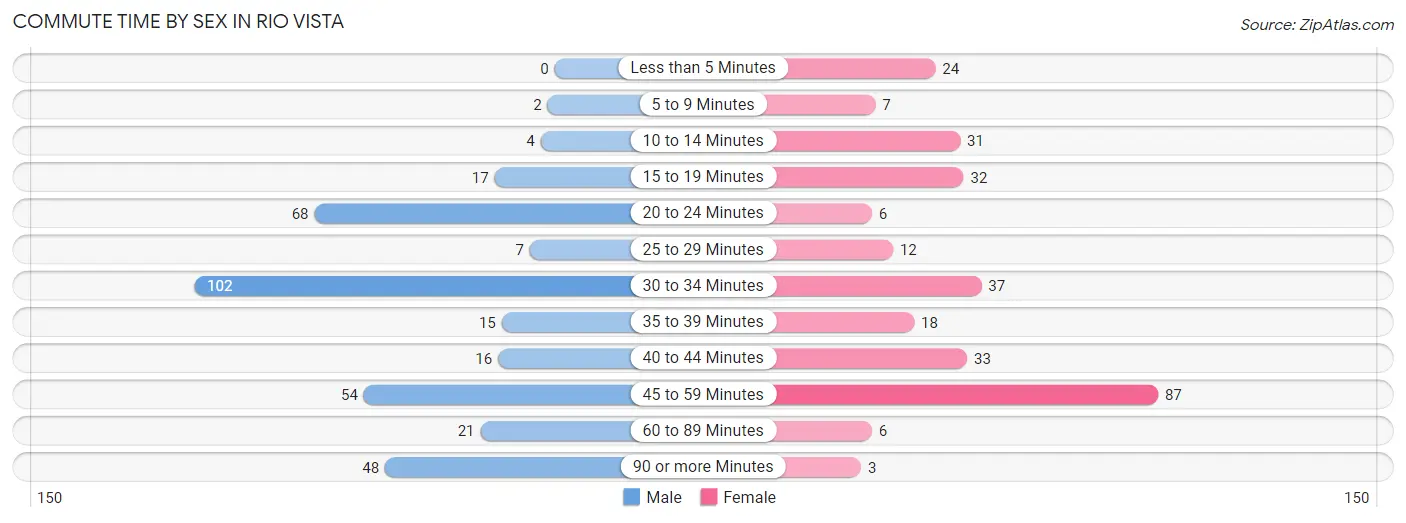
Commute Time by Sex in Rio Vista
The most common commute times in Rio Vista are 30 to 34 minutes (102 commuters, 28.8%) for males and 45 to 59 minutes (87 commuters, 29.4%) for females.
| Commute Time | Male | Female |
| Less than 5 Minutes | 0 (0.0%) | 24 (8.1%) |
| 5 to 9 Minutes | 2 (0.6%) | 7 (2.4%) |
| 10 to 14 Minutes | 4 (1.1%) | 31 (10.5%) |
| 15 to 19 Minutes | 17 (4.8%) | 32 (10.8%) |
| 20 to 24 Minutes | 68 (19.2%) | 6 (2.0%) |
| 25 to 29 Minutes | 7 (2.0%) | 12 (4.1%) |
| 30 to 34 Minutes | 102 (28.8%) | 37 (12.5%) |
| 35 to 39 Minutes | 15 (4.2%) | 18 (6.1%) |
| 40 to 44 Minutes | 16 (4.5%) | 33 (11.2%) |
| 45 to 59 Minutes | 54 (15.2%) | 87 (29.4%) |
| 60 to 89 Minutes | 21 (5.9%) | 6 (2.0%) |
| 90 or more Minutes | 48 (13.6%) | 3 (1.0%) |
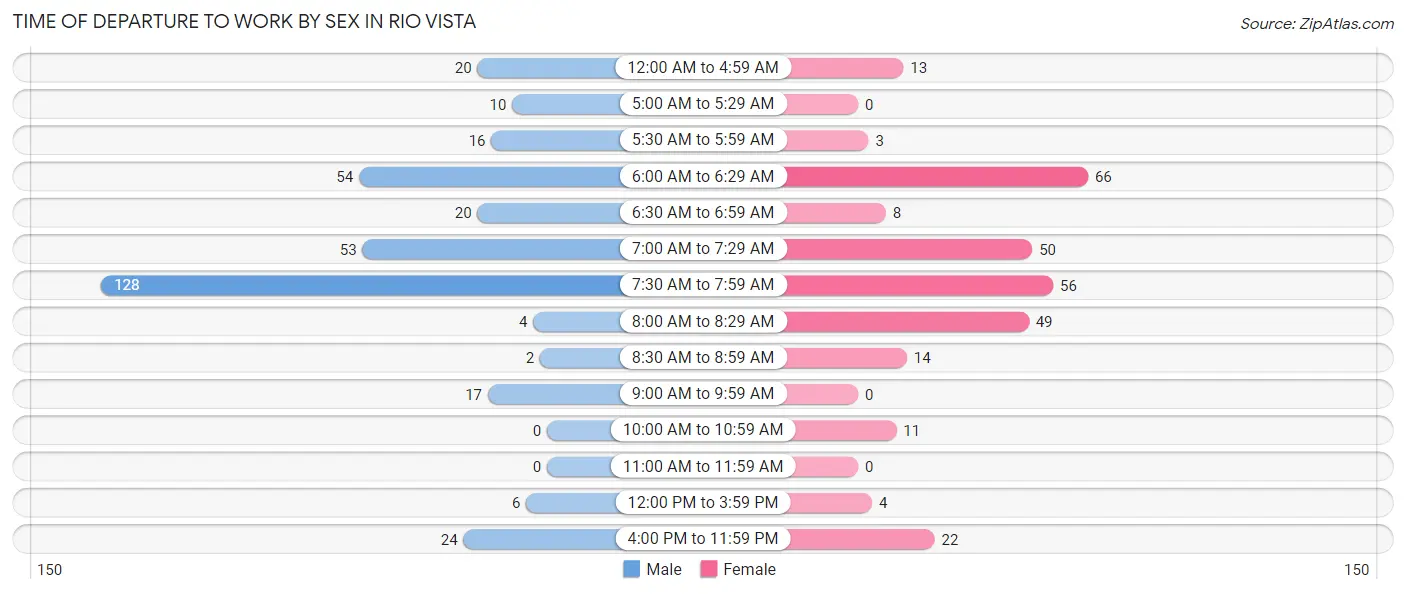
Time of Departure to Work by Sex in Rio Vista
The most frequent times of departure to work in Rio Vista are 7:30 AM to 7:59 AM (128, 36.2%) for males and 6:00 AM to 6:29 AM (66, 22.3%) for females.
| Time of Departure | Male | Female |
| 12:00 AM to 4:59 AM | 20 (5.7%) | 13 (4.4%) |
| 5:00 AM to 5:29 AM | 10 (2.8%) | 0 (0.0%) |
| 5:30 AM to 5:59 AM | 16 (4.5%) | 3 (1.0%) |
| 6:00 AM to 6:29 AM | 54 (15.2%) | 66 (22.3%) |
| 6:30 AM to 6:59 AM | 20 (5.7%) | 8 (2.7%) |
| 7:00 AM to 7:29 AM | 53 (15.0%) | 50 (16.9%) |
| 7:30 AM to 7:59 AM | 128 (36.2%) | 56 (18.9%) |
| 8:00 AM to 8:29 AM | 4 (1.1%) | 49 (16.6%) |
| 8:30 AM to 8:59 AM | 2 (0.6%) | 14 (4.7%) |
| 9:00 AM to 9:59 AM | 17 (4.8%) | 0 (0.0%) |
| 10:00 AM to 10:59 AM | 0 (0.0%) | 11 (3.7%) |
| 11:00 AM to 11:59 AM | 0 (0.0%) | 0 (0.0%) |
| 12:00 PM to 3:59 PM | 6 (1.7%) | 4 (1.3%) |
| 4:00 PM to 11:59 PM | 24 (6.8%) | 22 (7.4%) |
| Total | 354 (100.0%) | 296 (100.0%) |
Housing Occupancy in Rio Vista
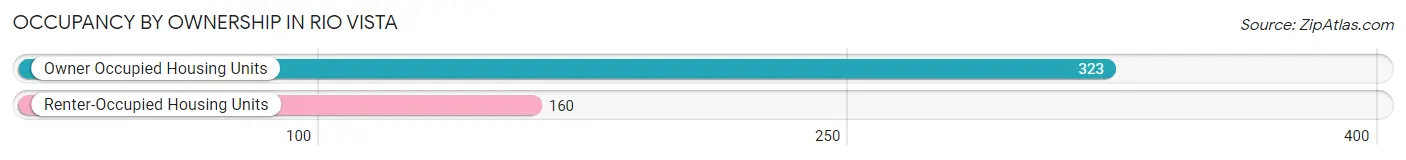
Occupancy by Ownership in Rio Vista
Of the total 483 dwellings in Rio Vista, owner-occupied units account for 323 (66.9%), while renter-occupied units make up 160 (33.1%).
| Occupancy | # Housing Units | % Housing Units |
| Owner Occupied Housing Units | 323 | 66.9% |
| Renter-Occupied Housing Units | 160 | 33.1% |
| Total Occupied Housing Units | 483 | 100.0% |
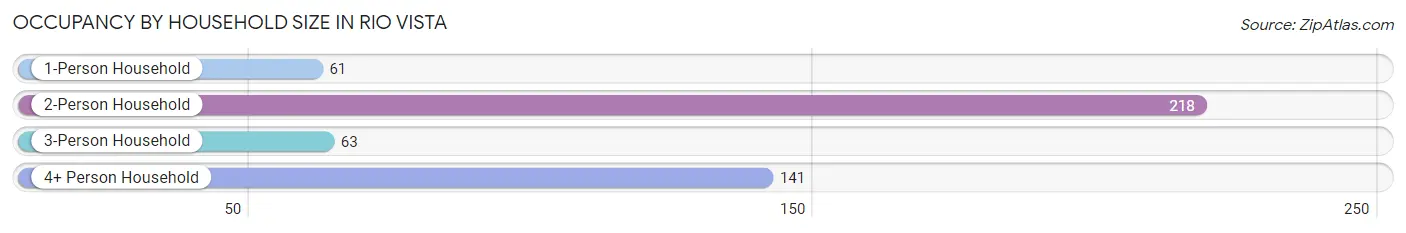
Occupancy by Household Size in Rio Vista
| Household Size | # Housing Units | % Housing Units |
| 1-Person Household | 61 | 12.6% |
| 2-Person Household | 218 | 45.1% |
| 3-Person Household | 63 | 13.0% |
| 4+ Person Household | 141 | 29.2% |
| Total Housing Units | 483 | 100.0% |
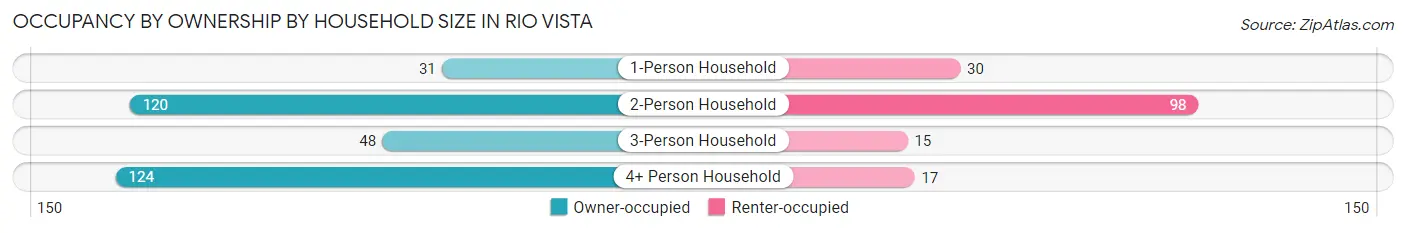
Occupancy by Ownership by Household Size in Rio Vista
| Household Size | Owner-occupied | Renter-occupied |
| 1-Person Household | 31 (50.8%) | 30 (49.2%) |
| 2-Person Household | 120 (55.0%) | 98 (45.0%) |
| 3-Person Household | 48 (76.2%) | 15 (23.8%) |
| 4+ Person Household | 124 (87.9%) | 17 (12.1%) |
| Total Housing Units | 323 (66.9%) | 160 (33.1%) |
Occupancy by Educational Attainment in Rio Vista
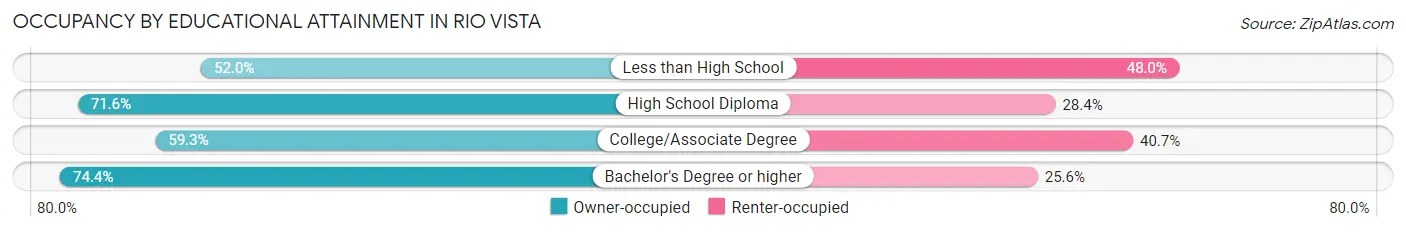
| Household Size | Owner-occupied | Renter-occupied |
| Less than High School | 13 (52.0%) | 12 (48.0%) |
| High School Diploma | 156 (71.6%) | 62 (28.4%) |
| College/Associate Degree | 96 (59.3%) | 66 (40.7%) |
| Bachelor's Degree or higher | 58 (74.4%) | 20 (25.6%) |
Occupancy by Age of Householder in Rio Vista
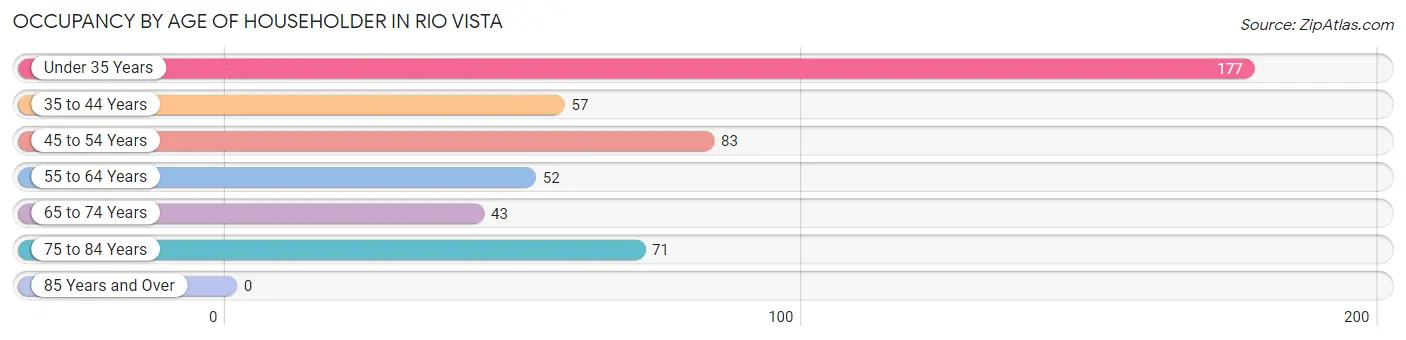
| Age Bracket | # Households | % Households |
| Under 35 Years | 177 | 36.6% |
| 35 to 44 Years | 57 | 11.8% |
| 45 to 54 Years | 83 | 17.2% |
| 55 to 64 Years | 52 | 10.8% |
| 65 to 74 Years | 43 | 8.9% |
| 75 to 84 Years | 71 | 14.7% |
| 85 Years and Over | 0 | 0.0% |
| Total | 483 | 100.0% |
Housing Finances in Rio Vista
Median Income by Occupancy in Rio Vista
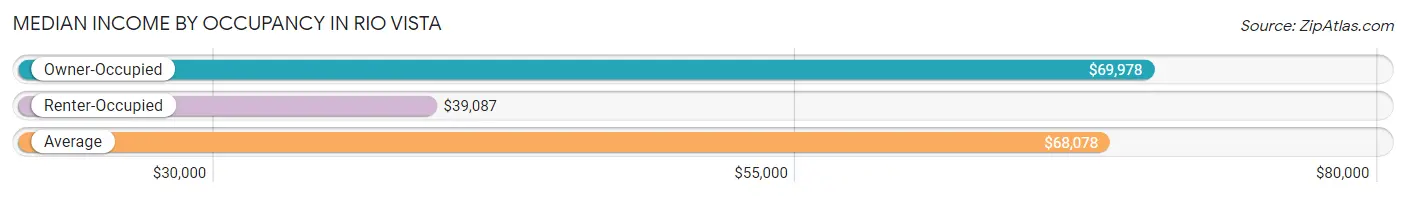
| Occupancy Type | # Households | Median Income |
| Owner-Occupied | 323 (66.9%) | $69,978 |
| Renter-Occupied | 160 (33.1%) | $39,087 |
| Average | 483 (100.0%) | $68,078 |
Occupancy by Householder Income Bracket in Rio Vista
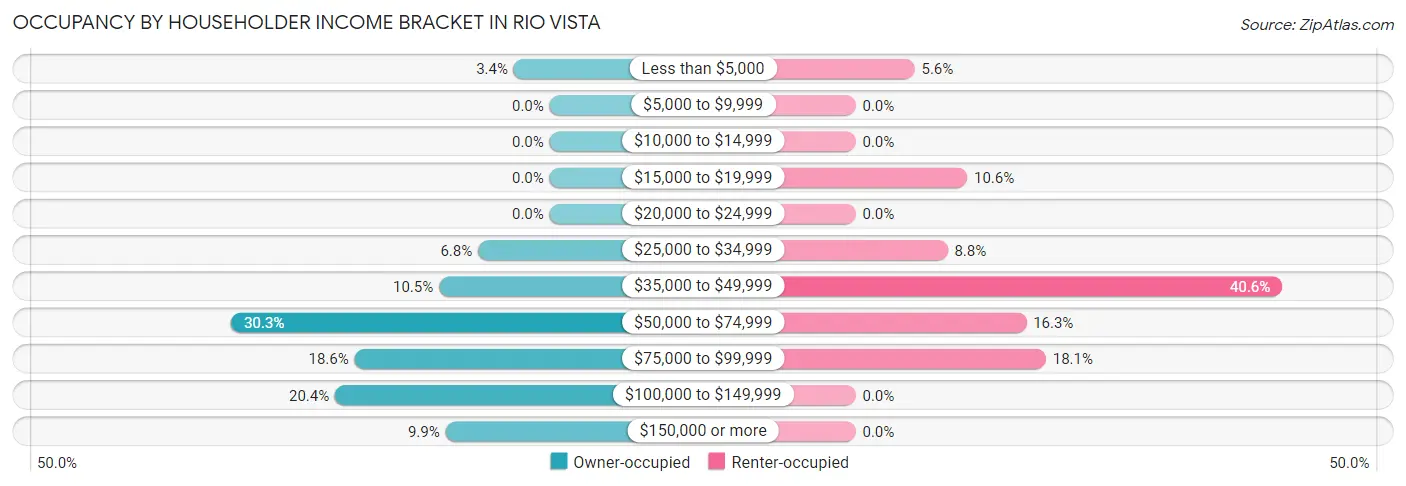
| Income Bracket | Owner-occupied | Renter-occupied |
| Less than $5,000 | 11 (3.4%) | 9 (5.6%) |
| $5,000 to $9,999 | 0 (0.0%) | 0 (0.0%) |
| $10,000 to $14,999 | 0 (0.0%) | 0 (0.0%) |
| $15,000 to $19,999 | 0 (0.0%) | 17 (10.6%) |
| $20,000 to $24,999 | 0 (0.0%) | 0 (0.0%) |
| $25,000 to $34,999 | 22 (6.8%) | 14 (8.7%) |
| $35,000 to $49,999 | 34 (10.5%) | 65 (40.6%) |
| $50,000 to $74,999 | 98 (30.3%) | 26 (16.3%) |
| $75,000 to $99,999 | 60 (18.6%) | 29 (18.1%) |
| $100,000 to $149,999 | 66 (20.4%) | 0 (0.0%) |
| $150,000 or more | 32 (9.9%) | 0 (0.0%) |
| Total | 323 (100.0%) | 160 (100.0%) |
Monthly Housing Cost Tiers in Rio Vista
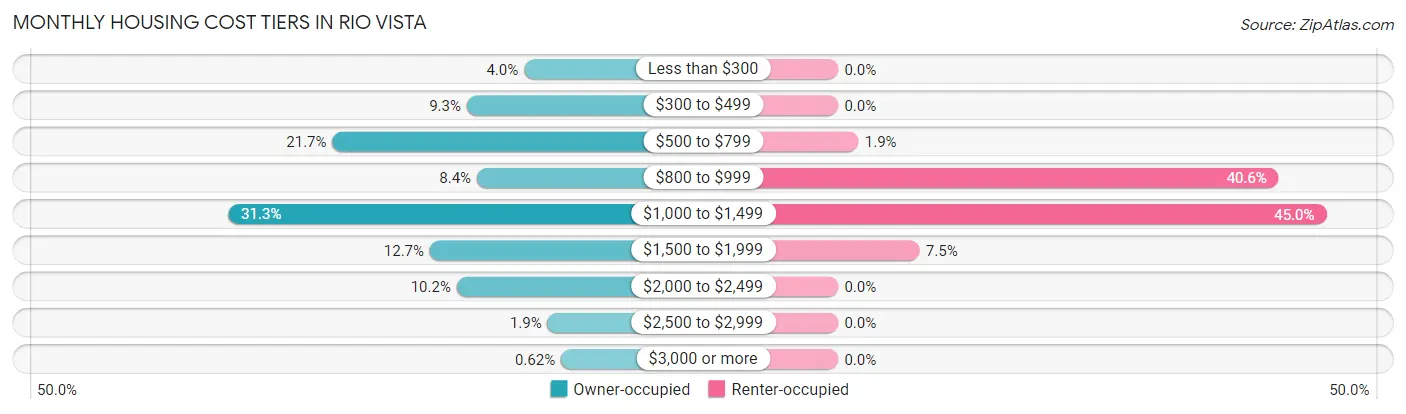
| Monthly Cost | Owner-occupied | Renter-occupied |
| Less than $300 | 13 (4.0%) | 0 (0.0%) |
| $300 to $499 | 30 (9.3%) | 0 (0.0%) |
| $500 to $799 | 70 (21.7%) | 3 (1.9%) |
| $800 to $999 | 27 (8.4%) | 65 (40.6%) |
| $1,000 to $1,499 | 101 (31.3%) | 72 (45.0%) |
| $1,500 to $1,999 | 41 (12.7%) | 12 (7.5%) |
| $2,000 to $2,499 | 33 (10.2%) | 0 (0.0%) |
| $2,500 to $2,999 | 6 (1.9%) | 0 (0.0%) |
| $3,000 or more | 2 (0.6%) | 0 (0.0%) |
| Total | 323 (100.0%) | 160 (100.0%) |
Physical Housing Characteristics in Rio Vista
Housing Structures in Rio Vista
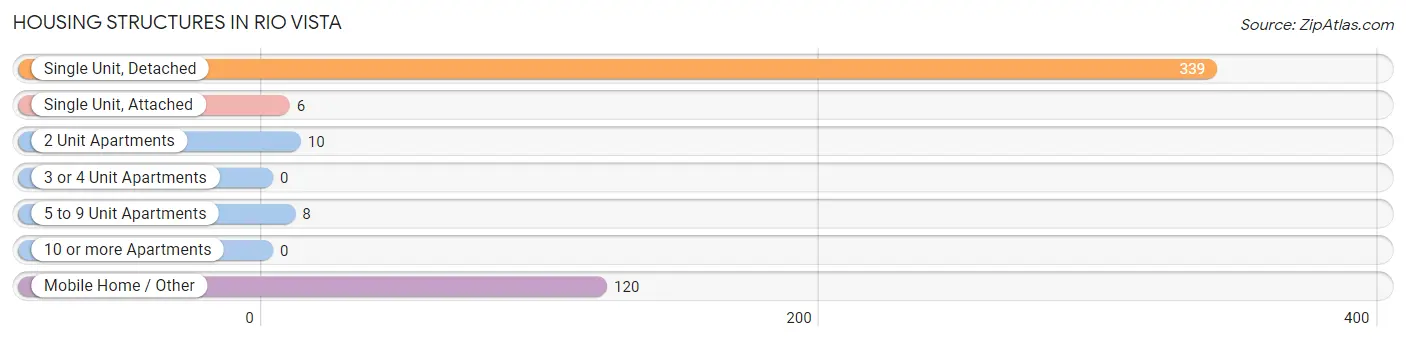
| Structure Type | # Housing Units | % Housing Units |
| Single Unit, Detached | 339 | 70.2% |
| Single Unit, Attached | 6 | 1.2% |
| 2 Unit Apartments | 10 | 2.1% |
| 3 or 4 Unit Apartments | 0 | 0.0% |
| 5 to 9 Unit Apartments | 8 | 1.7% |
| 10 or more Apartments | 0 | 0.0% |
| Mobile Home / Other | 120 | 24.8% |
| Total | 483 | 100.0% |
Housing Structures by Occupancy in Rio Vista
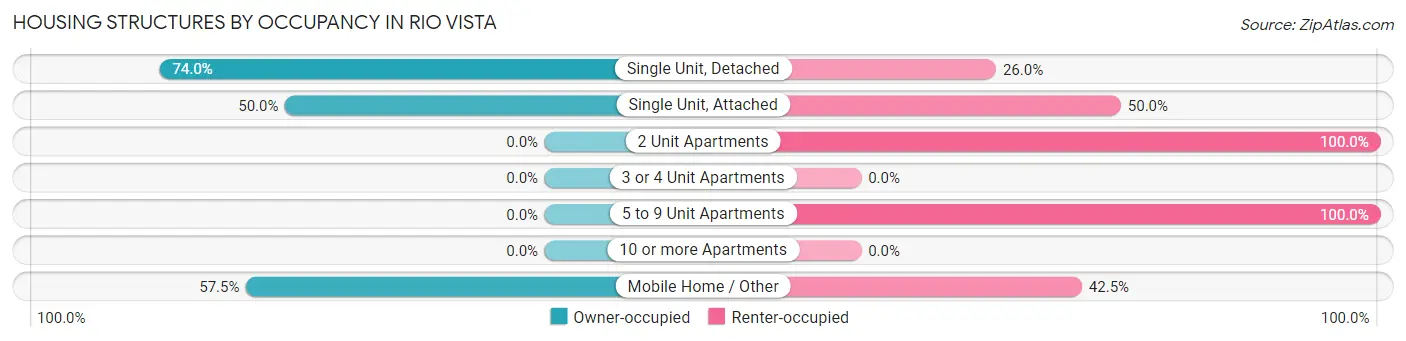
| Structure Type | Owner-occupied | Renter-occupied |
| Single Unit, Detached | 251 (74.0%) | 88 (26.0%) |
| Single Unit, Attached | 3 (50.0%) | 3 (50.0%) |
| 2 Unit Apartments | 0 (0.0%) | 10 (100.0%) |
| 3 or 4 Unit Apartments | 0 (0.0%) | 0 (0.0%) |
| 5 to 9 Unit Apartments | 0 (0.0%) | 8 (100.0%) |
| 10 or more Apartments | 0 (0.0%) | 0 (0.0%) |
| Mobile Home / Other | 69 (57.5%) | 51 (42.5%) |
| Total | 323 (66.9%) | 160 (33.1%) |
Housing Structures by Number of Rooms in Rio Vista
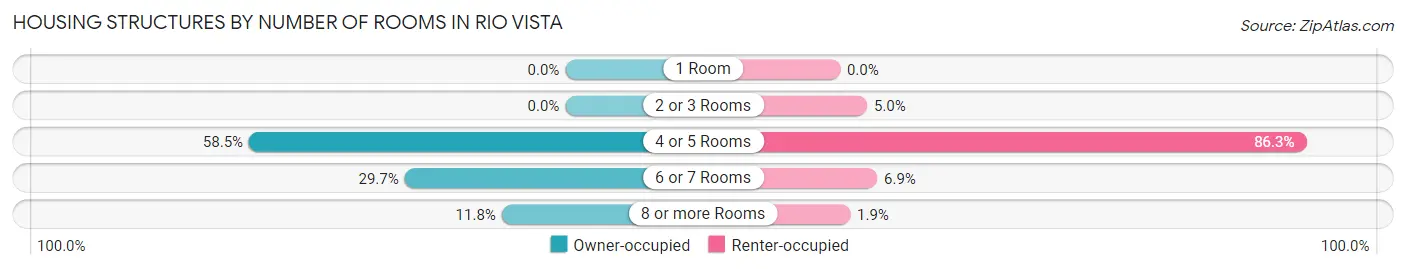
| Number of Rooms | Owner-occupied | Renter-occupied |
| 1 Room | 0 (0.0%) | 0 (0.0%) |
| 2 or 3 Rooms | 0 (0.0%) | 8 (5.0%) |
| 4 or 5 Rooms | 189 (58.5%) | 138 (86.3%) |
| 6 or 7 Rooms | 96 (29.7%) | 11 (6.9%) |
| 8 or more Rooms | 38 (11.8%) | 3 (1.9%) |
| Total | 323 (100.0%) | 160 (100.0%) |
Housing Structure by Heating Type in Rio Vista
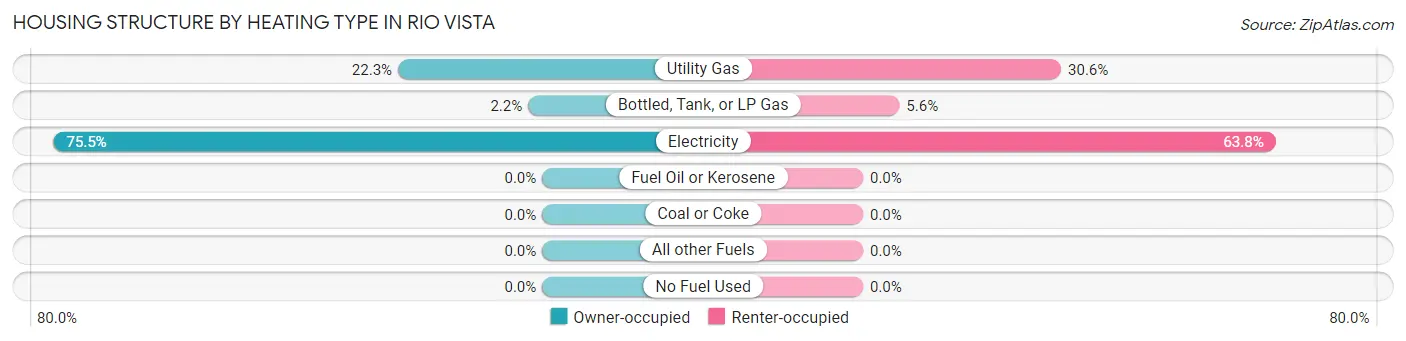
| Heating Type | Owner-occupied | Renter-occupied |
| Utility Gas | 72 (22.3%) | 49 (30.6%) |
| Bottled, Tank, or LP Gas | 7 (2.2%) | 9 (5.6%) |
| Electricity | 244 (75.5%) | 102 (63.7%) |
| Fuel Oil or Kerosene | 0 (0.0%) | 0 (0.0%) |
| Coal or Coke | 0 (0.0%) | 0 (0.0%) |
| All other Fuels | 0 (0.0%) | 0 (0.0%) |
| No Fuel Used | 0 (0.0%) | 0 (0.0%) |
| Total | 323 (100.0%) | 160 (100.0%) |
Household Vehicle Usage in Rio Vista
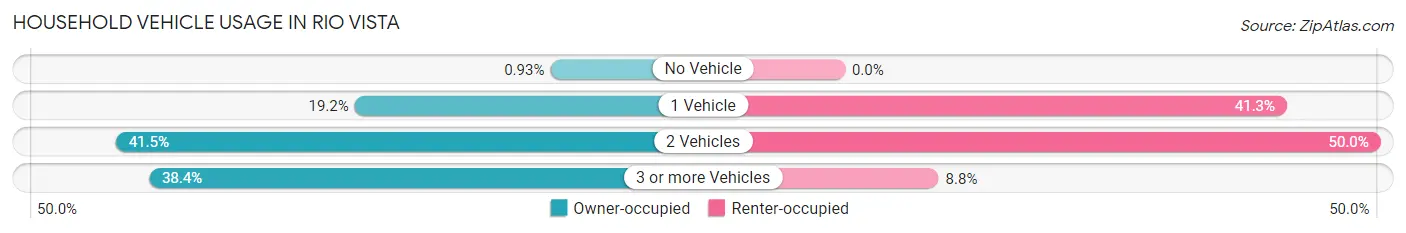
| Vehicles per Household | Owner-occupied | Renter-occupied |
| No Vehicle | 3 (0.9%) | 0 (0.0%) |
| 1 Vehicle | 62 (19.2%) | 66 (41.2%) |
| 2 Vehicles | 134 (41.5%) | 80 (50.0%) |
| 3 or more Vehicles | 124 (38.4%) | 14 (8.7%) |
| Total | 323 (100.0%) | 160 (100.0%) |
Real Estate & Mortgages in Rio Vista
Real Estate and Mortgage Overview in Rio Vista
| Characteristic | Without Mortgage | With Mortgage |
| Housing Units | 106 | 217 |
| Median Property Value | $87,100 | $186,000 |
| Median Household Income | $85,833 | $32 |
| Monthly Housing Costs | $536 | $2 |
| Real Estate Taxes | $2,163 | $9 |
Property Value by Mortgage Status in Rio Vista
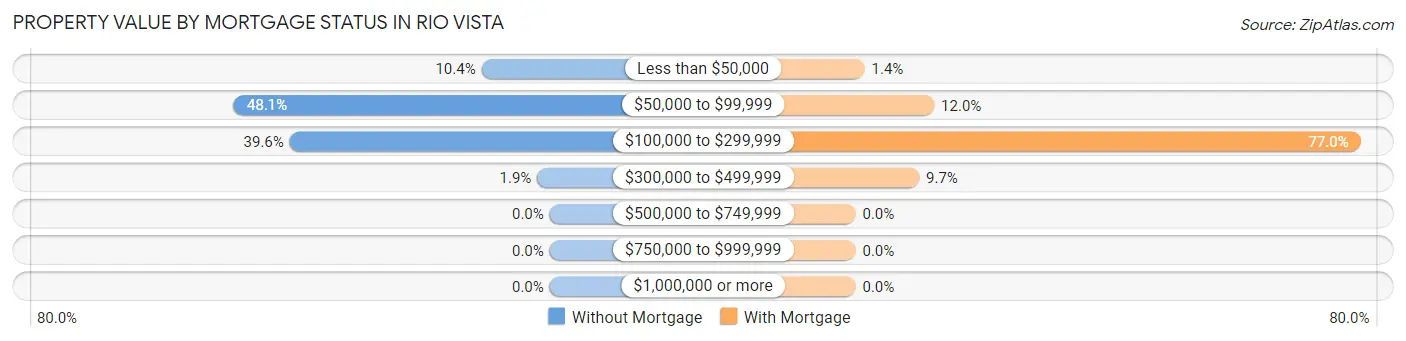
| Property Value | Without Mortgage | With Mortgage |
| Less than $50,000 | 11 (10.4%) | 3 (1.4%) |
| $50,000 to $99,999 | 51 (48.1%) | 26 (12.0%) |
| $100,000 to $299,999 | 42 (39.6%) | 167 (77.0%) |
| $300,000 to $499,999 | 2 (1.9%) | 21 (9.7%) |
| $500,000 to $749,999 | 0 (0.0%) | 0 (0.0%) |
| $750,000 to $999,999 | 0 (0.0%) | 0 (0.0%) |
| $1,000,000 or more | 0 (0.0%) | 0 (0.0%) |
| Total | 106 (100.0%) | 217 (100.0%) |
Household Income by Mortgage Status in Rio Vista
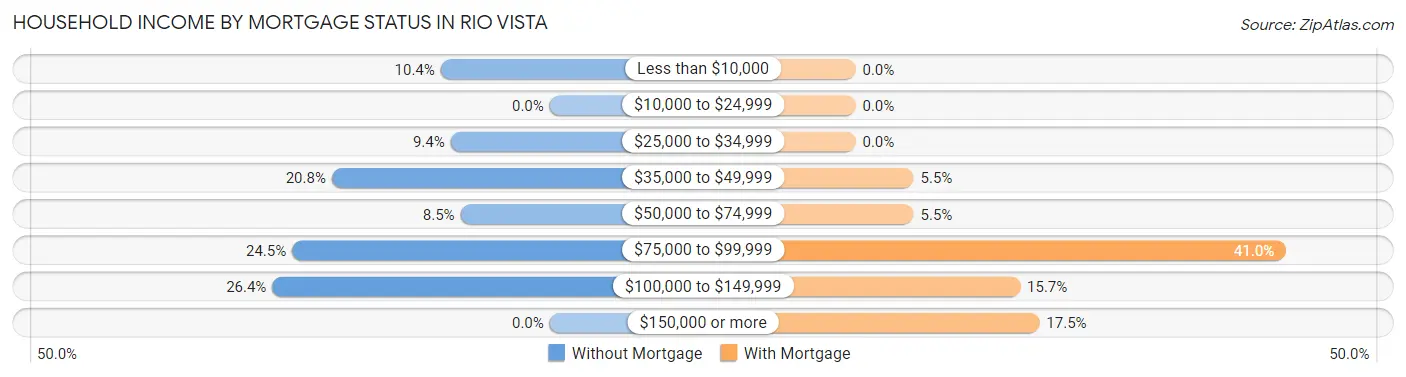
| Household Income | Without Mortgage | With Mortgage |
| Less than $10,000 | 11 (10.4%) | 0 (0.0%) |
| $10,000 to $24,999 | 0 (0.0%) | 0 (0.0%) |
| $25,000 to $34,999 | 10 (9.4%) | 0 (0.0%) |
| $35,000 to $49,999 | 22 (20.7%) | 12 (5.5%) |
| $50,000 to $74,999 | 9 (8.5%) | 12 (5.5%) |
| $75,000 to $99,999 | 26 (24.5%) | 89 (41.0%) |
| $100,000 to $149,999 | 28 (26.4%) | 34 (15.7%) |
| $150,000 or more | 0 (0.0%) | 38 (17.5%) |
| Total | 106 (100.0%) | 217 (100.0%) |
Property Value to Household Income Ratio in Rio Vista

| Value-to-Income Ratio | Without Mortgage | With Mortgage |
| Less than 2.0x | 67 (63.2%) | 69,933 (32,227.2%) |
| 2.0x to 2.9x | 15 (14.1%) | 94 (43.3%) |
| 3.0x to 3.9x | 4 (3.8%) | 82 (37.8%) |
| 4.0x or more | 14 (13.2%) | 14 (6.5%) |
| Total | 106 (100.0%) | 217 (100.0%) |
Real Estate Taxes by Mortgage Status in Rio Vista

| Property Taxes | Without Mortgage | With Mortgage |
| Less than $800 | 14 (13.2%) | 0 (0.0%) |
| $800 to $1,499 | 30 (28.3%) | 10 (4.6%) |
| $800 to $1,499 | 59 (55.7%) | 21 (9.7%) |
| Total | 106 (100.0%) | 217 (100.0%) |
Health & Disability in Rio Vista
Health Insurance Coverage by Age in Rio Vista
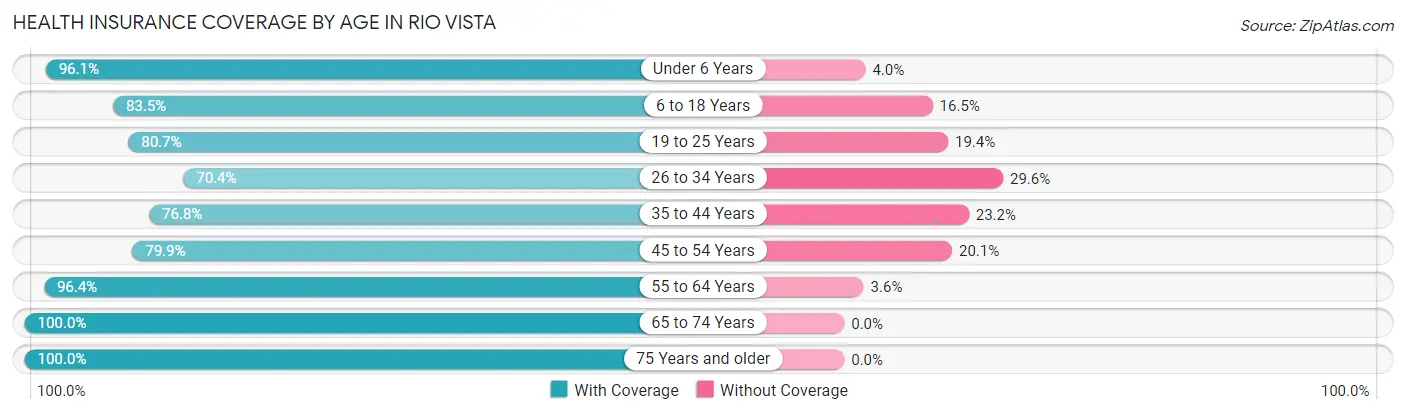
| Age Bracket | With Coverage | Without Coverage |
| Under 6 Years | 146 (96.1%) | 6 (4.0%) |
| 6 to 18 Years | 223 (83.5%) | 44 (16.5%) |
| 19 to 25 Years | 125 (80.6%) | 30 (19.4%) |
| 26 to 34 Years | 107 (70.4%) | 45 (29.6%) |
| 35 to 44 Years | 86 (76.8%) | 26 (23.2%) |
| 45 to 54 Years | 171 (79.9%) | 43 (20.1%) |
| 55 to 64 Years | 80 (96.4%) | 3 (3.6%) |
| 65 to 74 Years | 67 (100.0%) | 0 (0.0%) |
| 75 Years and older | 88 (100.0%) | 0 (0.0%) |
| Total | 1,093 (84.7%) | 197 (15.3%) |
Health Insurance Coverage by Citizenship Status in Rio Vista

| Citizenship Status | With Coverage | Without Coverage |
| Native Born | 146 (96.1%) | 6 (4.0%) |
| Foreign Born, Citizen | 223 (83.5%) | 44 (16.5%) |
| Foreign Born, not a Citizen | 125 (80.6%) | 30 (19.4%) |
Health Insurance Coverage by Household Income in Rio Vista
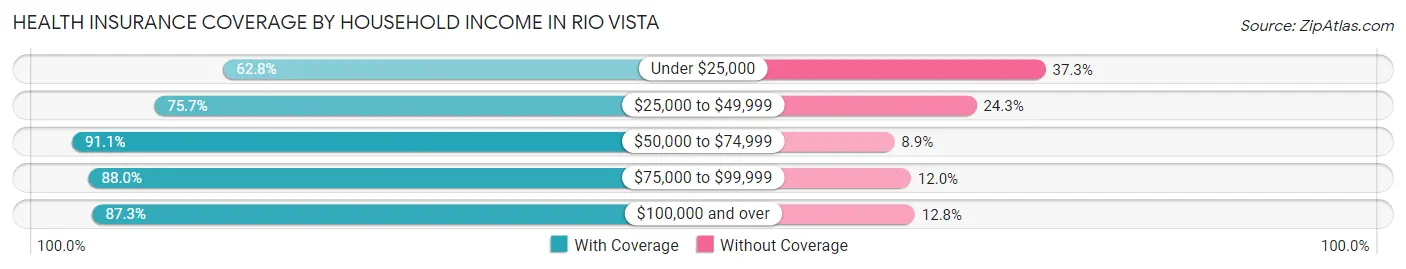
| Household Income | With Coverage | Without Coverage |
| Under $25,000 | 32 (62.7%) | 19 (37.2%) |
| $25,000 to $49,999 | 215 (75.7%) | 69 (24.3%) |
| $50,000 to $74,999 | 245 (91.1%) | 24 (8.9%) |
| $75,000 to $99,999 | 293 (88.0%) | 40 (12.0%) |
| $100,000 and over | 308 (87.3%) | 45 (12.8%) |
Public vs Private Health Insurance Coverage by Age in Rio Vista
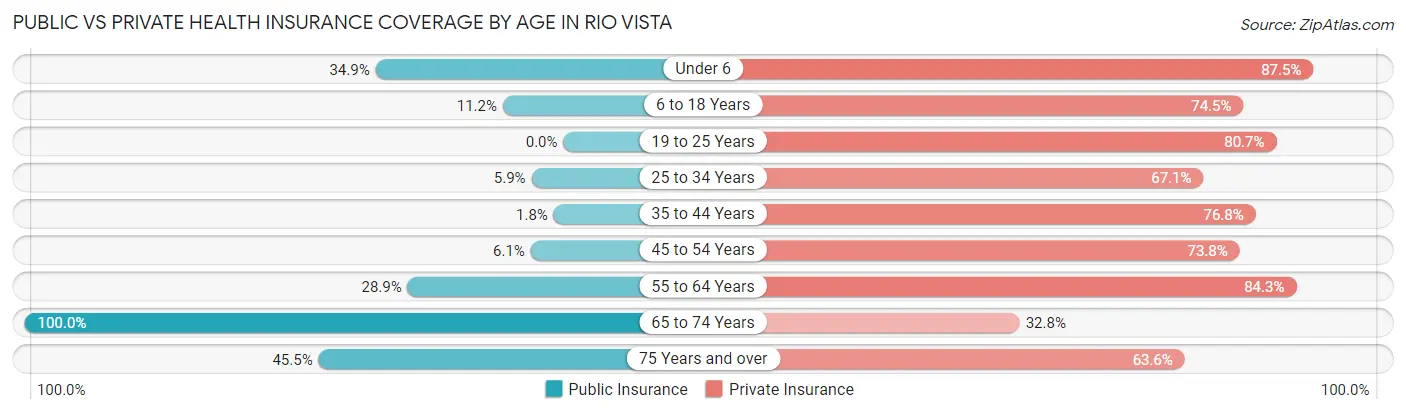
| Age Bracket | Public Insurance | Private Insurance |
| Under 6 | 53 (34.9%) | 133 (87.5%) |
| 6 to 18 Years | 30 (11.2%) | 199 (74.5%) |
| 19 to 25 Years | 0 (0.0%) | 125 (80.6%) |
| 25 to 34 Years | 9 (5.9%) | 102 (67.1%) |
| 35 to 44 Years | 2 (1.8%) | 86 (76.8%) |
| 45 to 54 Years | 13 (6.1%) | 158 (73.8%) |
| 55 to 64 Years | 24 (28.9%) | 70 (84.3%) |
| 65 to 74 Years | 67 (100.0%) | 22 (32.8%) |
| 75 Years and over | 40 (45.5%) | 56 (63.6%) |
| Total | 238 (18.4%) | 951 (73.7%) |
Disability Status by Sex by Age in Rio Vista
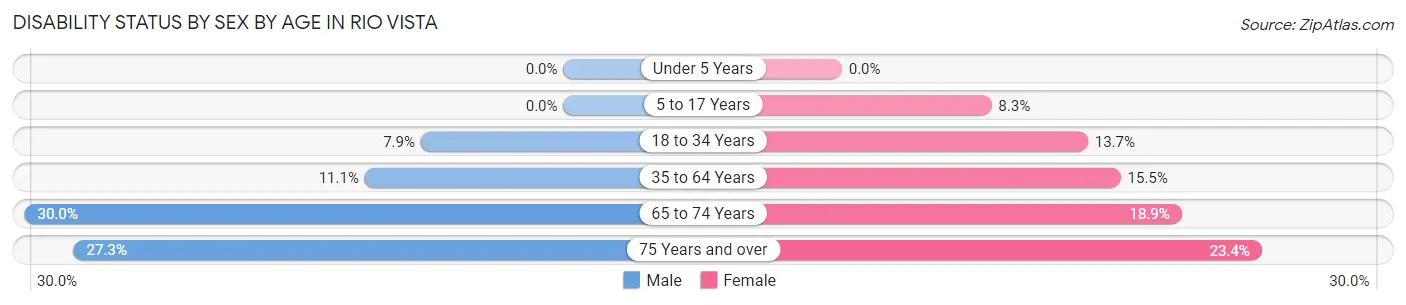
| Age Bracket | Male | Female |
| Under 5 Years | 0 (0.0%) | 0 (0.0%) |
| 5 to 17 Years | 0 (0.0%) | 9 (8.3%) |
| 18 to 34 Years | 15 (7.9%) | 20 (13.7%) |
| 35 to 64 Years | 26 (11.1%) | 27 (15.5%) |
| 65 to 74 Years | 9 (30.0%) | 7 (18.9%) |
| 75 Years and over | 3 (27.3%) | 18 (23.4%) |
Disability Class by Sex by Age in Rio Vista
Disability Class: Hearing Difficulty
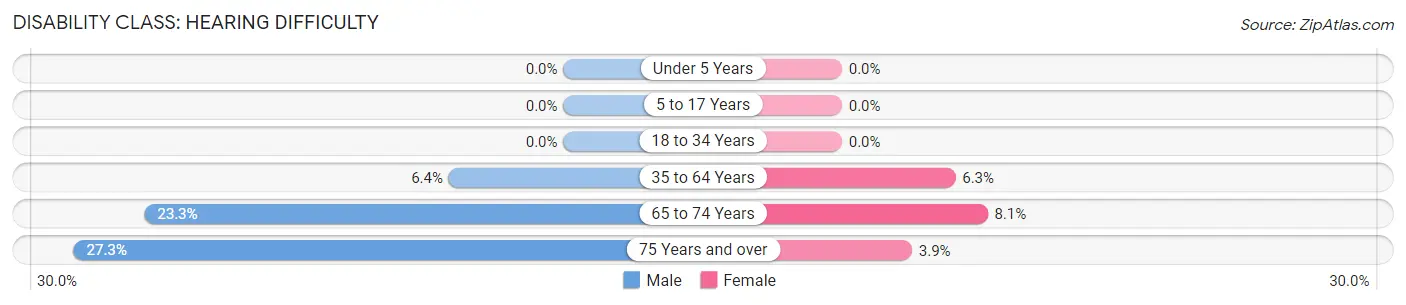
| Age Bracket | Male | Female |
| Under 5 Years | 0 (0.0%) | 0 (0.0%) |
| 5 to 17 Years | 0 (0.0%) | 0 (0.0%) |
| 18 to 34 Years | 0 (0.0%) | 0 (0.0%) |
| 35 to 64 Years | 15 (6.4%) | 11 (6.3%) |
| 65 to 74 Years | 7 (23.3%) | 3 (8.1%) |
| 75 Years and over | 3 (27.3%) | 3 (3.9%) |
Disability Class: Vision Difficulty
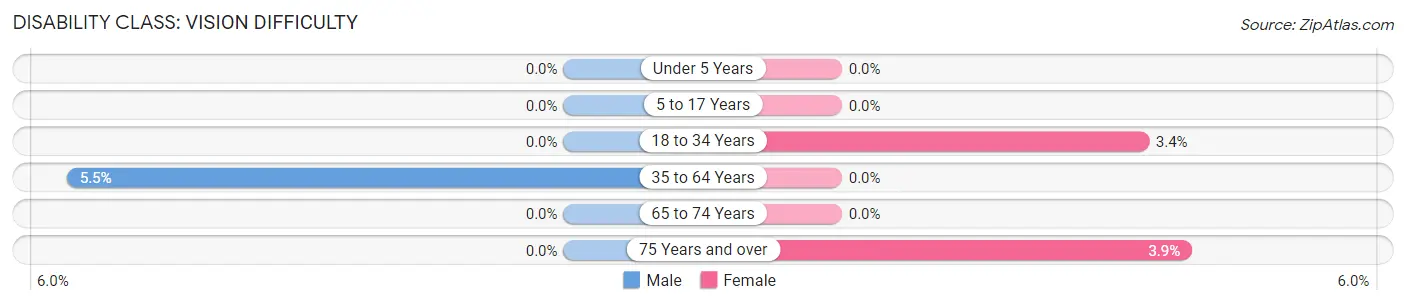
| Age Bracket | Male | Female |
| Under 5 Years | 0 (0.0%) | 0 (0.0%) |
| 5 to 17 Years | 0 (0.0%) | 0 (0.0%) |
| 18 to 34 Years | 0 (0.0%) | 5 (3.4%) |
| 35 to 64 Years | 13 (5.5%) | 0 (0.0%) |
| 65 to 74 Years | 0 (0.0%) | 0 (0.0%) |
| 75 Years and over | 0 (0.0%) | 3 (3.9%) |
Disability Class: Cognitive Difficulty
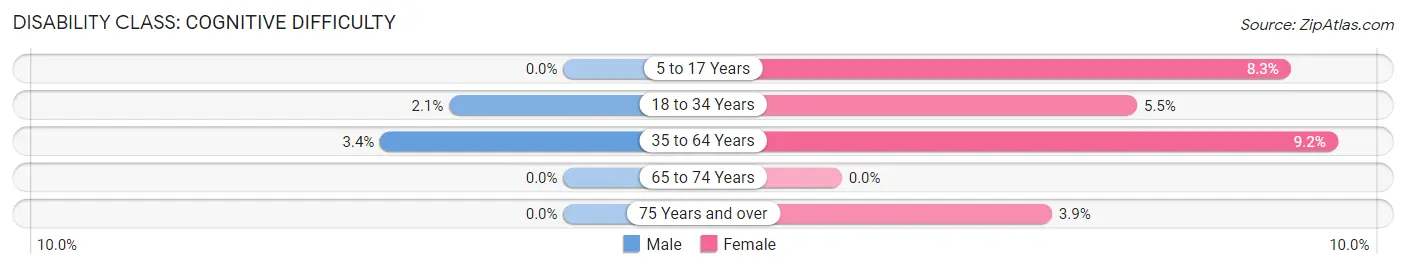
| Age Bracket | Male | Female |
| 5 to 17 Years | 0 (0.0%) | 9 (8.3%) |
| 18 to 34 Years | 4 (2.1%) | 8 (5.5%) |
| 35 to 64 Years | 8 (3.4%) | 16 (9.2%) |
| 65 to 74 Years | 0 (0.0%) | 0 (0.0%) |
| 75 Years and over | 0 (0.0%) | 3 (3.9%) |
Disability Class: Ambulatory Difficulty
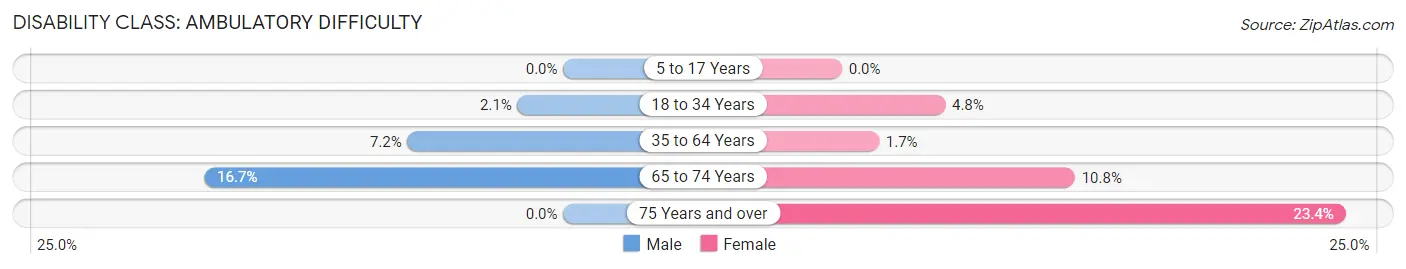
| Age Bracket | Male | Female |
| 5 to 17 Years | 0 (0.0%) | 0 (0.0%) |
| 18 to 34 Years | 4 (2.1%) | 7 (4.8%) |
| 35 to 64 Years | 17 (7.2%) | 3 (1.7%) |
| 65 to 74 Years | 5 (16.7%) | 4 (10.8%) |
| 75 Years and over | 0 (0.0%) | 18 (23.4%) |
Disability Class: Self-Care Difficulty
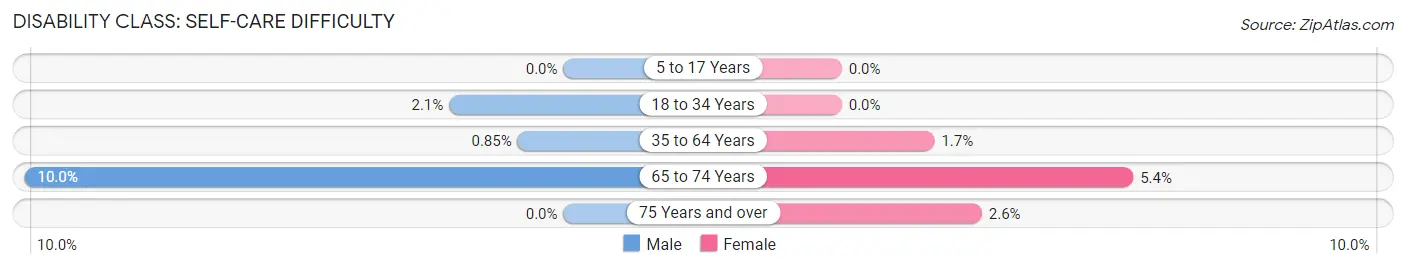
| Age Bracket | Male | Female |
| 5 to 17 Years | 0 (0.0%) | 0 (0.0%) |
| 18 to 34 Years | 4 (2.1%) | 0 (0.0%) |
| 35 to 64 Years | 2 (0.9%) | 3 (1.7%) |
| 65 to 74 Years | 3 (10.0%) | 2 (5.4%) |
| 75 Years and over | 0 (0.0%) | 2 (2.6%) |
Technology Access in Rio Vista
Computing Device Access in Rio Vista
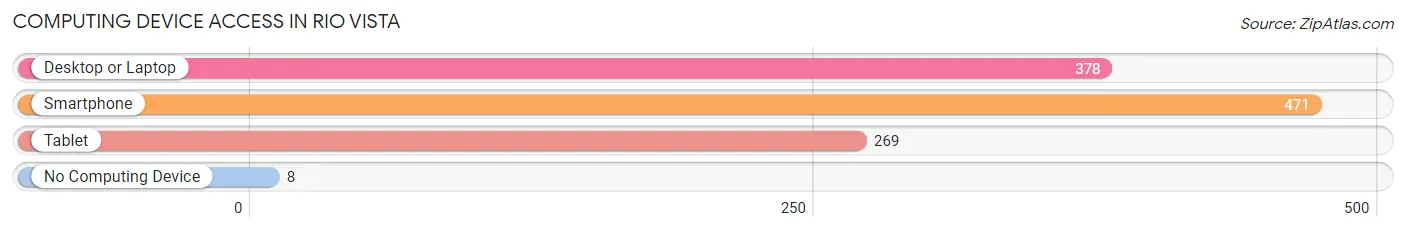
| Device Type | # Households | % Households |
| Desktop or Laptop | 378 | 78.3% |
| Smartphone | 471 | 97.5% |
| Tablet | 269 | 55.7% |
| No Computing Device | 8 | 1.7% |
| Total | 483 | 100.0% |
Internet Access in Rio Vista
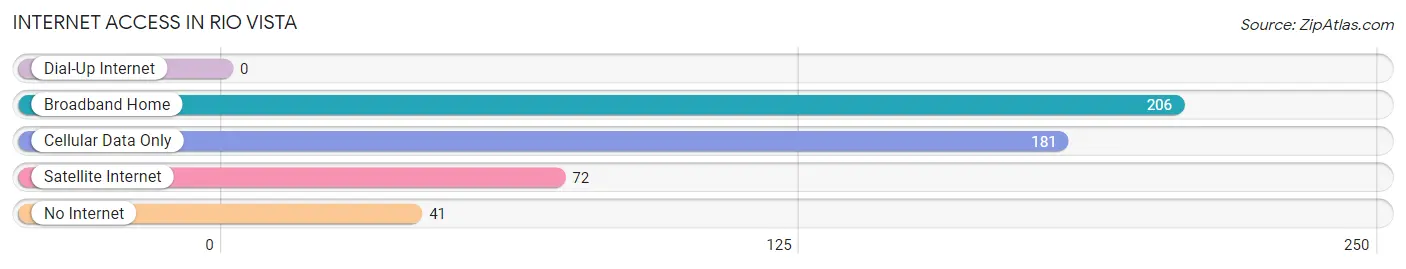
| Internet Type | # Households | % Households |
| Dial-Up Internet | 0 | 0.0% |
| Broadband Home | 206 | 42.6% |
| Cellular Data Only | 181 | 37.5% |
| Satellite Internet | 72 | 14.9% |
| No Internet | 41 | 8.5% |
| Total | 483 | 100.0% |
Rio Vista Summary
Rio Vista is a small city located in Johnson County, Texas, United States. It is situated on the banks of the Brazos River, approximately 25 miles south of Fort Worth. The city has a population of 1,845 as of the 2010 census.
History
Rio Vista was founded in 1854 by a group of settlers from Missouri. The town was originally known as “Rio Vista Crossing”, and was located at the intersection of the Brazos River and the Chisholm Trail. The town was renamed to Rio Vista in 1876, and was incorporated in 1882.
In the late 19th century, Rio Vista was a thriving agricultural community, with cotton, corn, and wheat being the main crops. The town also had a number of businesses, including a hotel, a general store, and a blacksmith shop.
In the early 20th century, the town began to decline as the railroad bypassed it and the population began to move away. The town was nearly abandoned by the 1950s, but was revitalized in the 1970s when the Brazos River Authority began to develop the area for recreational purposes.
Geography
Rio Vista is located at 32°45'25" North, 97°17'45" West (32.7569, -97.2958). The city has a total area of 1.2 square miles, all of which is land.
The city is situated on the banks of the Brazos River, and is surrounded by rolling hills and farmland. The climate is hot and humid in the summer, and mild in the winter.
Economy
The economy of Rio Vista is largely based on agriculture and tourism. The city is home to several farms, which produce cotton, corn, wheat, and other crops. The city is also home to several tourist attractions, including the Brazos River Authority’s Lake Whitney, which offers fishing, boating, and other recreational activities.
Demographics
As of the 2010 census, there were 1,845 people, 690 households, and 486 families residing in the city. The population density was 1,527.3 people per square mile. The racial makeup of the city was 81.2% White, 11.2% African American, 0.7% Native American, 0.4% Asian, 0.1% Pacific Islander, 4.7% from other races, and 1.7% from two or more races. Hispanic or Latino of any race were 11.2% of the population.
The median income for a household in the city was $37,500, and the median income for a family was $45,000. The per capita income for the city was $17,845. About 11.2% of families and 14.2% of the population were below the poverty line, including 18.2% of those under age 18 and 8.2% of those age 65 or over.
Common Questions
What is Per Capita Income in Rio Vista?
Per Capita income in Rio Vista is $27,875.
What is the Median Family Income in Rio Vista?
Median Family Income in Rio Vista is $68,320.
What is the Median Household income in Rio Vista?
Median Household Income in Rio Vista is $68,078.
What is Income or Wage Gap in Rio Vista?
Income or Wage Gap in Rio Vista is 14.1%.
Women in Rio Vista earn 85.9 cents for every dollar earned by a man.
What is Inequality or Gini Index in Rio Vista?
Inequality or Gini Index in Rio Vista is 0.34.
What is the Total Population of Rio Vista?
Total Population of Rio Vista is 1,290.
What is the Total Male Population of Rio Vista?
Total Male Population of Rio Vista is 709.
What is the Total Female Population of Rio Vista?
Total Female Population of Rio Vista is 581.
What is the Ratio of Males per 100 Females in Rio Vista?
There are 122.03 Males per 100 Females in Rio Vista.
What is the Ratio of Females per 100 Males in Rio Vista?
There are 81.95 Females per 100 Males in Rio Vista.
What is the Median Population Age in Rio Vista?
Median Population Age in Rio Vista is 29.8 Years.
What is the Average Family Size in Rio Vista
Average Family Size in Rio Vista is 2.9 People.
What is the Average Household Size in Rio Vista
Average Household Size in Rio Vista is 2.7 People.
How Large is the Labor Force in Rio Vista?
There are 681 People in the Labor Forcein in Rio Vista.
What is the Percentage of People in the Labor Force in Rio Vista?
71.7% of People are in the Labor Force in Rio Vista.
What is the Unemployment Rate in Rio Vista?
Unemployment Rate in Rio Vista is 3.2%.