Riesel, TX Map & Demographics
Riesel Map
Riesel Overview
$37,331
PER CAPITA INCOME
$107,784
AVG FAMILY INCOME
$106,216
AVG HOUSEHOLD INCOME
30.7%
WAGE / INCOME GAP [ % ]
69.3¢/ $1
WAGE / INCOME GAP [ $ ]
0.32
INEQUALITY / GINI INDEX
1,463
TOTAL POPULATION
786
MALE POPULATION
677
FEMALE POPULATION
116.10
MALES / 100 FEMALES
86.13
FEMALES / 100 MALES
35.0
MEDIAN AGE
3.3
AVG FAMILY SIZE
3.0
AVG HOUSEHOLD SIZE
837
LABOR FORCE [ PEOPLE ]
76.4%
PERCENT IN LABOR FORCE
Riesel Zip Codes
Riesel Area Codes
Income in Riesel
Income Overview in Riesel
Per Capita Income in Riesel is $37,331, while median incomes of families and households are $107,784 and $106,216 respectively.
| Characteristic | Number | Measure |
| Per Capita Income | 1,463 | $37,331 |
| Median Family Income | 393 | $107,784 |
| Mean Family Income | 393 | $106,704 |
| Median Household Income | 480 | $106,216 |
| Mean Household Income | 480 | $109,146 |
| Income Deficit | 393 | $0 |
| Wage / Income Gap (%) | 1,463 | 30.69% |
| Wage / Income Gap ($) | 1,463 | 69.31¢ per $1 |
| Gini / Inequality Index | 1,463 | 0.32 |
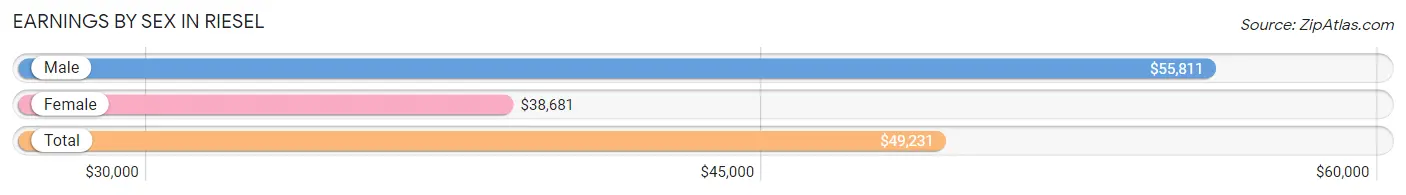
Earnings by Sex in Riesel
Average Earnings in Riesel are $49,231, $55,811 for men and $38,681 for women, a difference of 30.7%.
| Sex | Number | Average Earnings |
| Male | 549 (62.1%) | $55,811 |
| Female | 335 (37.9%) | $38,681 |
| Total | 884 (100.0%) | $49,231 |
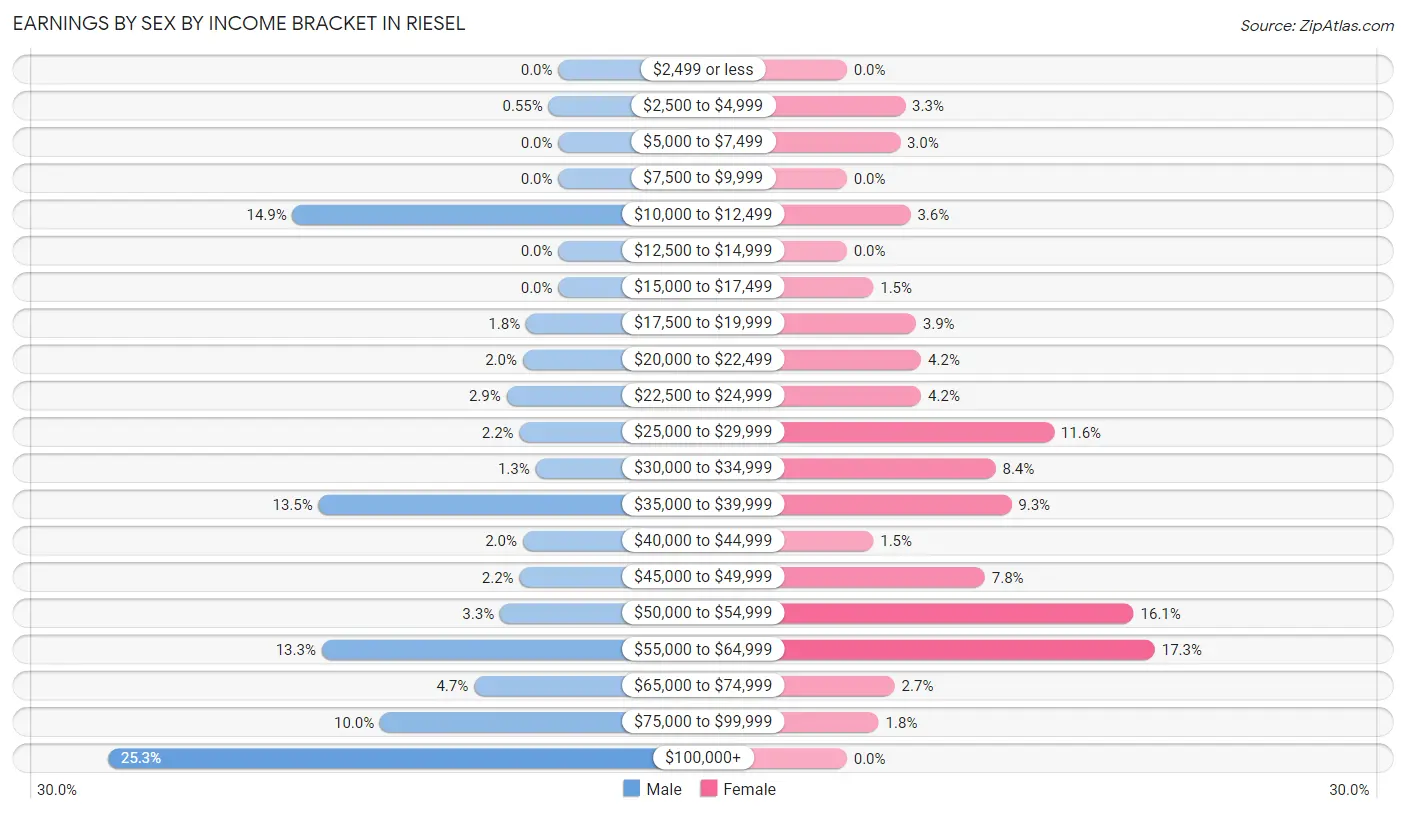
Earnings by Sex by Income Bracket in Riesel
The most common earnings brackets in Riesel are $100,000+ for men (139 | 25.3%) and $55,000 to $64,999 for women (58 | 17.3%).
| Income | Male | Female |
| $2,499 or less | 0 (0.0%) | 0 (0.0%) |
| $2,500 to $4,999 | 3 (0.5%) | 11 (3.3%) |
| $5,000 to $7,499 | 0 (0.0%) | 10 (3.0%) |
| $7,500 to $9,999 | 0 (0.0%) | 0 (0.0%) |
| $10,000 to $12,499 | 82 (14.9%) | 12 (3.6%) |
| $12,500 to $14,999 | 0 (0.0%) | 0 (0.0%) |
| $15,000 to $17,499 | 0 (0.0%) | 5 (1.5%) |
| $17,500 to $19,999 | 10 (1.8%) | 13 (3.9%) |
| $20,000 to $22,499 | 11 (2.0%) | 14 (4.2%) |
| $22,500 to $24,999 | 16 (2.9%) | 14 (4.2%) |
| $25,000 to $29,999 | 12 (2.2%) | 39 (11.6%) |
| $30,000 to $34,999 | 7 (1.3%) | 28 (8.4%) |
| $35,000 to $39,999 | 74 (13.5%) | 31 (9.2%) |
| $40,000 to $44,999 | 11 (2.0%) | 5 (1.5%) |
| $45,000 to $49,999 | 12 (2.2%) | 26 (7.8%) |
| $50,000 to $54,999 | 18 (3.3%) | 54 (16.1%) |
| $55,000 to $64,999 | 73 (13.3%) | 58 (17.3%) |
| $65,000 to $74,999 | 26 (4.7%) | 9 (2.7%) |
| $75,000 to $99,999 | 55 (10.0%) | 6 (1.8%) |
| $100,000+ | 139 (25.3%) | 0 (0.0%) |
| Total | 549 (100.0%) | 335 (100.0%) |
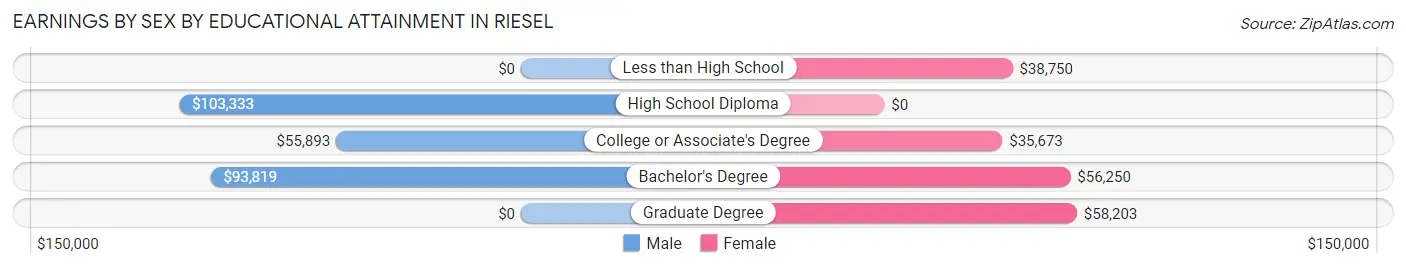
Earnings by Sex by Educational Attainment in Riesel
Average earnings in Riesel are $71,944 for men and $40,000 for women, a difference of 44.4%. Men with an educational attainment of high school diploma enjoy the highest average annual earnings of $103,333, while those with college or associate's degree education earn the least with $55,893. Women with an educational attainment of graduate degree earn the most with the average annual earnings of $58,203, while those with college or associate's degree education have the smallest earnings of $35,673.
| Educational Attainment | Male Income | Female Income |
| Less than High School | - | - |
| High School Diploma | $103,333 | $0 |
| College or Associate's Degree | $55,893 | $35,673 |
| Bachelor's Degree | $93,819 | $56,250 |
| Graduate Degree | - | - |
| Total | $71,944 | $40,000 |
Family Income in Riesel
Family Income Brackets in Riesel
According to the Riesel family income data, there are 147 families falling into the $100,000 to $149,999 income range, which is the most common income bracket and makes up 37.4% of all families.
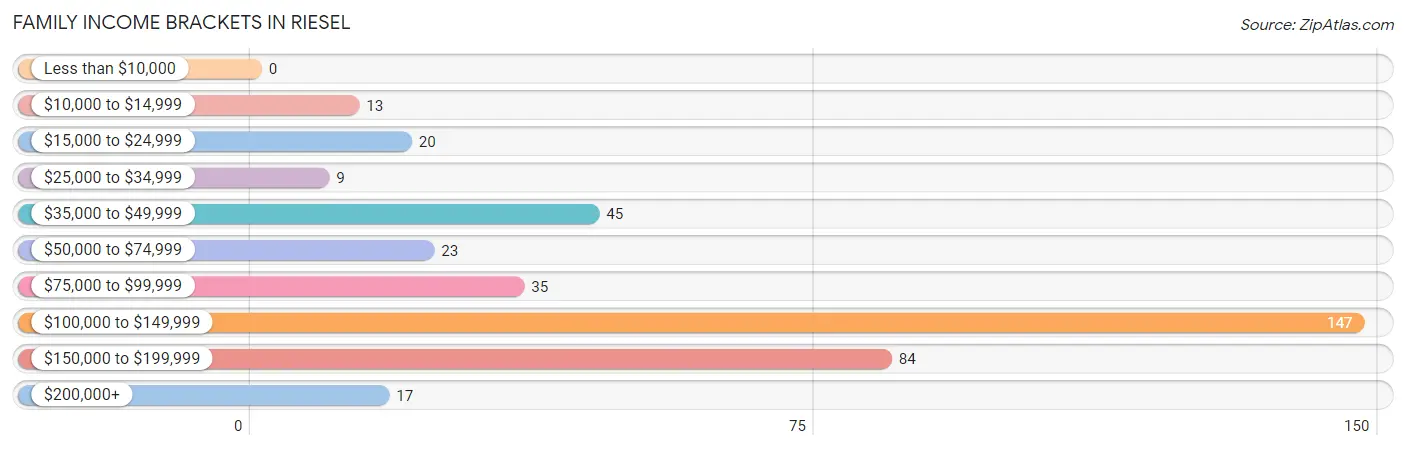
| Income Bracket | # Families | % Families |
| Less than $10,000 | 0 | 0.0% |
| $10,000 to $14,999 | 13 | 3.3% |
| $15,000 to $24,999 | 20 | 5.1% |
| $25,000 to $34,999 | 9 | 2.3% |
| $35,000 to $49,999 | 45 | 11.5% |
| $50,000 to $74,999 | 23 | 5.9% |
| $75,000 to $99,999 | 35 | 8.9% |
| $100,000 to $149,999 | 147 | 37.4% |
| $150,000 to $199,999 | 84 | 21.4% |
| $200,000+ | 17 | 4.3% |
Family Income by Famaliy Size in Riesel
5-person families (21 | 5.3%) account for the highest median family income in Riesel with $133,438 per family, while 2-person families (149 | 37.9%) have the highest median income of $54,062 per family member.
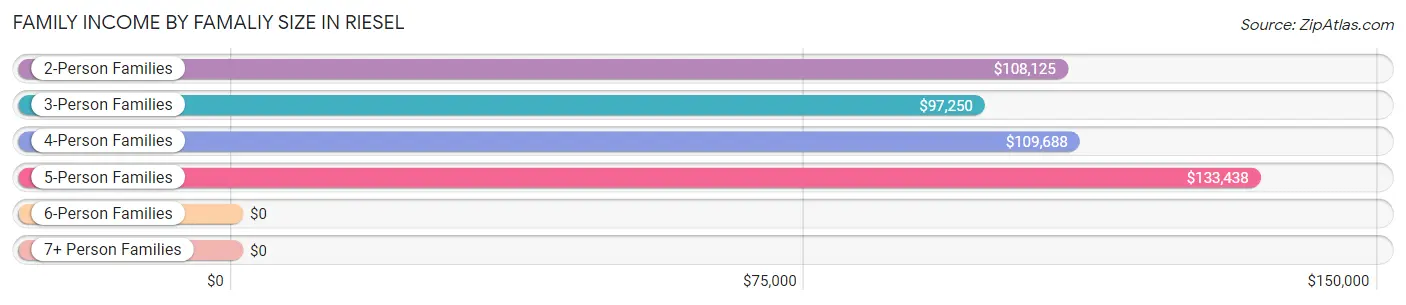
| Income Bracket | # Families | Median Income |
| 2-Person Families | 149 (37.9%) | $108,125 |
| 3-Person Families | 87 (22.1%) | $97,250 |
| 4-Person Families | 110 (28.0%) | $109,688 |
| 5-Person Families | 21 (5.3%) | $133,438 |
| 6-Person Families | 26 (6.6%) | $0 |
| 7+ Person Families | 0 (0.0%) | $0 |
| Total | 393 (100.0%) | $107,784 |
Family Income by Number of Earners in Riesel
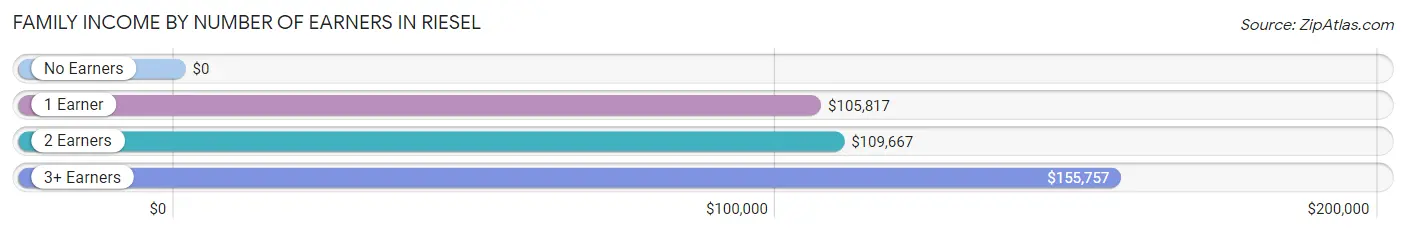
| Number of Earners | # Families | Median Income |
| No Earners | 21 (5.3%) | $0 |
| 1 Earner | 141 (35.9%) | $105,817 |
| 2 Earners | 178 (45.3%) | $109,667 |
| 3+ Earners | 53 (13.5%) | $155,757 |
| Total | 393 (100.0%) | $107,784 |
Household Income in Riesel
Household Income Brackets in Riesel
With 158 households falling in the category, the $100,000 to $149,999 income range is the most frequent in Riesel, accounting for 32.9% of all households.
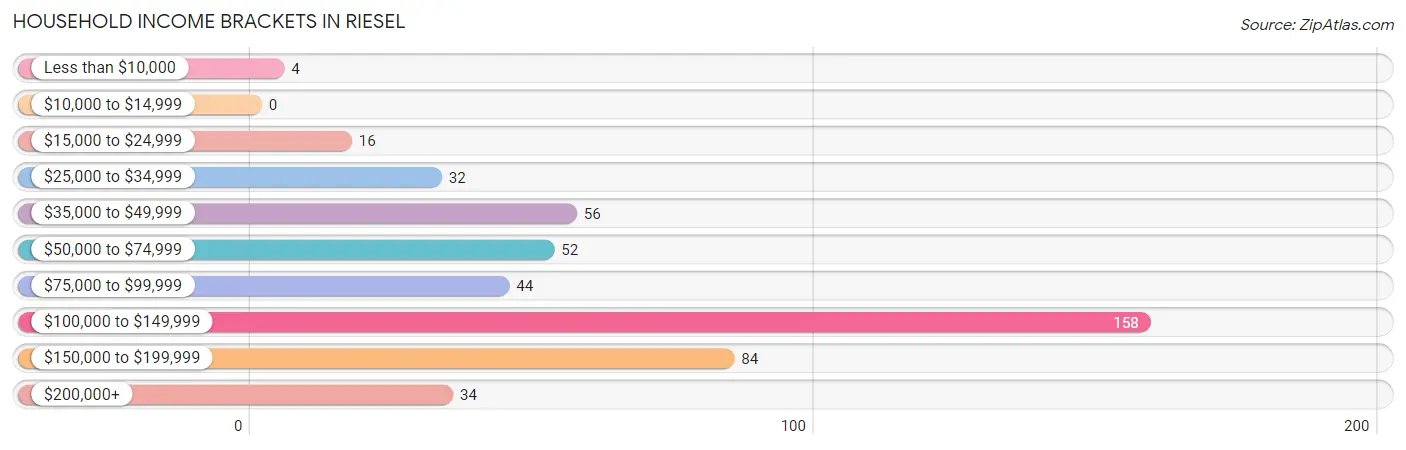
| Income Bracket | # Households | % Households |
| Less than $10,000 | 4 | 0.8% |
| $10,000 to $14,999 | 0 | 0.0% |
| $15,000 to $24,999 | 16 | 3.3% |
| $25,000 to $34,999 | 32 | 6.7% |
| $35,000 to $49,999 | 56 | 11.7% |
| $50,000 to $74,999 | 52 | 10.8% |
| $75,000 to $99,999 | 44 | 9.2% |
| $100,000 to $149,999 | 158 | 32.9% |
| $150,000 to $199,999 | 84 | 17.5% |
| $200,000+ | 34 | 7.1% |
Household Income by Householder Age in Riesel
The median household income in Riesel is $106,216, with the highest median household income of $109,018 found in the 45 to 64 years age bracket for the primary householder. A total of 187 households (39.0%) fall into this category. Meanwhile, the 15 to 24 years age bracket for the primary householder has the lowest median household income of $47,292, with 22 households (4.6%) in this group.
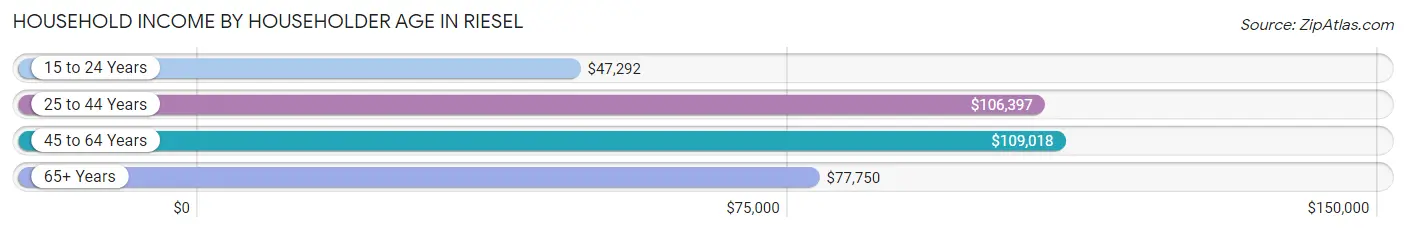
| Income Bracket | # Households | Median Income |
| 15 to 24 Years | 22 (4.6%) | $47,292 |
| 25 to 44 Years | 204 (42.5%) | $106,397 |
| 45 to 64 Years | 187 (39.0%) | $109,018 |
| 65+ Years | 67 (14.0%) | $77,750 |
| Total | 480 (100.0%) | $106,216 |
Poverty in Riesel
Income Below Poverty by Sex and Age in Riesel
With 2.5% poverty level for males and 2.9% for females among the residents of Riesel, 55 to 64 year old males and 6 to 11 year old females are the most vulnerable to poverty, with 13 males (10.9%) and 20 females (33.9%) in their respective age groups living below the poverty level.
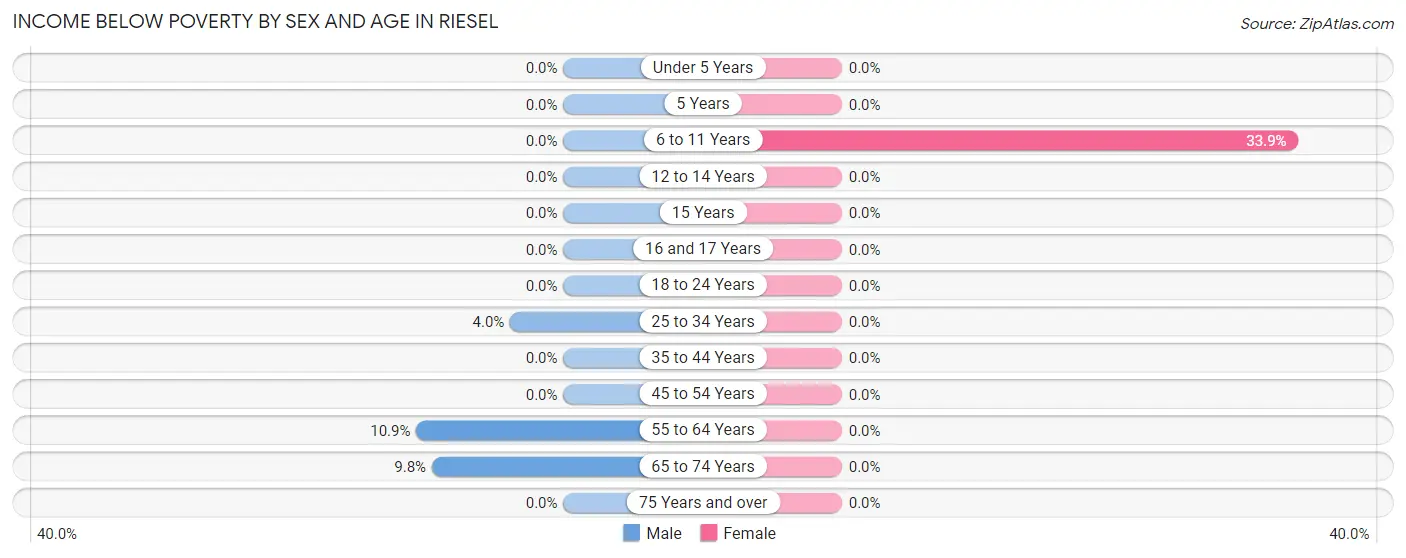
| Age Bracket | Male | Female |
| Under 5 Years | 0 (0.0%) | 0 (0.0%) |
| 5 Years | 0 (0.0%) | 0 (0.0%) |
| 6 to 11 Years | 0 (0.0%) | 20 (33.9%) |
| 12 to 14 Years | 0 (0.0%) | 0 (0.0%) |
| 15 Years | 0 (0.0%) | 0 (0.0%) |
| 16 and 17 Years | 0 (0.0%) | 0 (0.0%) |
| 18 to 24 Years | 0 (0.0%) | 0 (0.0%) |
| 25 to 34 Years | 3 (4.0%) | 0 (0.0%) |
| 35 to 44 Years | 0 (0.0%) | 0 (0.0%) |
| 45 to 54 Years | 0 (0.0%) | 0 (0.0%) |
| 55 to 64 Years | 13 (10.9%) | 0 (0.0%) |
| 65 to 74 Years | 4 (9.8%) | 0 (0.0%) |
| 75 Years and over | 0 (0.0%) | 0 (0.0%) |
| Total | 20 (2.5%) | 20 (2.9%) |
Income Above Poverty by Sex and Age in Riesel
According to the poverty statistics in Riesel, males aged under 5 years and females aged under 5 years are the age groups that are most secure financially, with 100.0% of males and 100.0% of females in these age groups living above the poverty line.
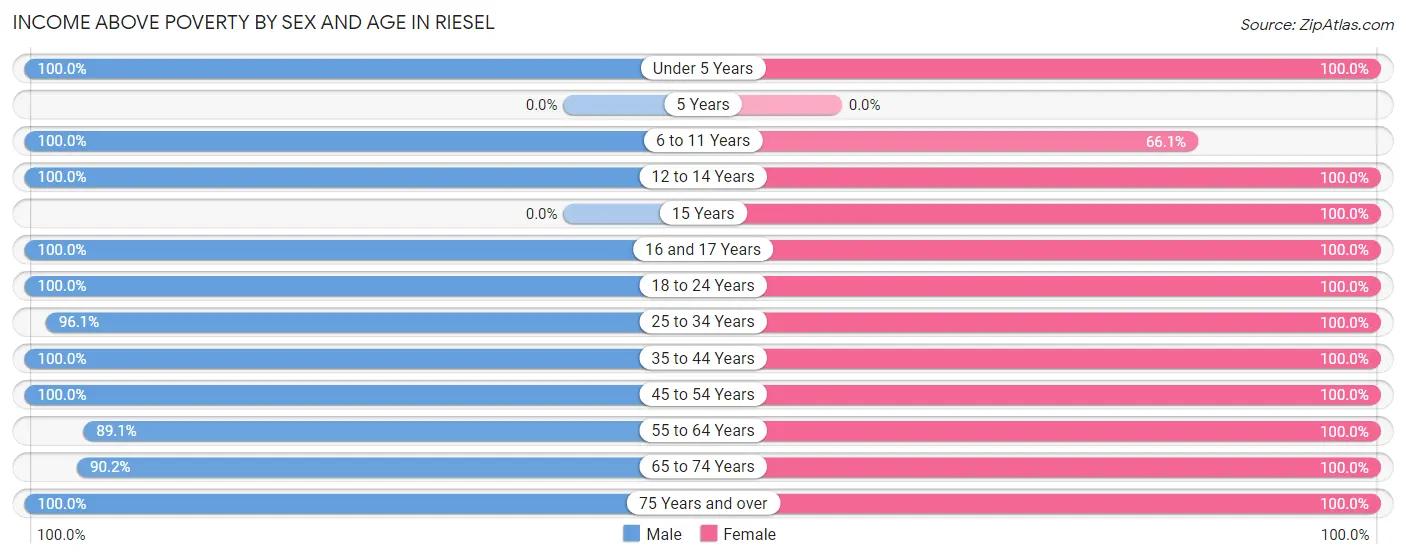
| Age Bracket | Male | Female |
| Under 5 Years | 113 (100.0%) | 93 (100.0%) |
| 5 Years | 0 (0.0%) | 0 (0.0%) |
| 6 to 11 Years | 52 (100.0%) | 39 (66.1%) |
| 12 to 14 Years | 8 (100.0%) | 36 (100.0%) |
| 15 Years | 0 (0.0%) | 7 (100.0%) |
| 16 and 17 Years | 6 (100.0%) | 14 (100.0%) |
| 18 to 24 Years | 137 (100.0%) | 38 (100.0%) |
| 25 to 34 Years | 73 (96.1%) | 94 (100.0%) |
| 35 to 44 Years | 148 (100.0%) | 129 (100.0%) |
| 45 to 54 Years | 72 (100.0%) | 77 (100.0%) |
| 55 to 64 Years | 106 (89.1%) | 86 (100.0%) |
| 65 to 74 Years | 37 (90.2%) | 17 (100.0%) |
| 75 Years and over | 14 (100.0%) | 27 (100.0%) |
| Total | 766 (97.5%) | 657 (97.1%) |
Income Below Poverty Among Married-Couple Families in Riesel
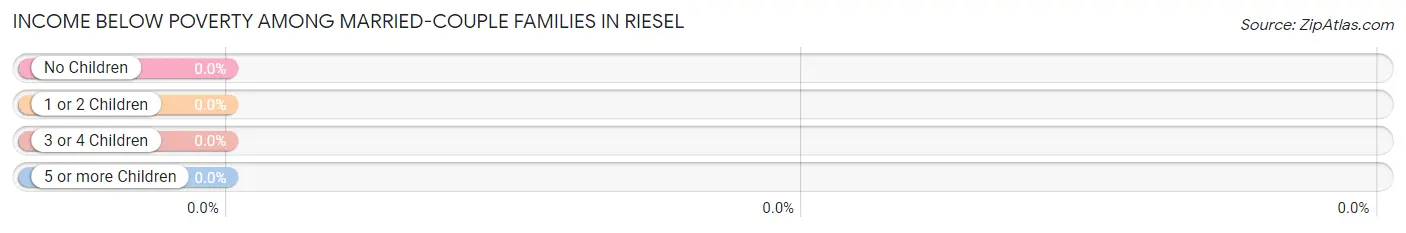
| Children | Above Poverty | Below Poverty |
| No Children | 162 (100.0%) | 0 (0.0%) |
| 1 or 2 Children | 108 (100.0%) | 0 (0.0%) |
| 3 or 4 Children | 45 (100.0%) | 0 (0.0%) |
| 5 or more Children | 0 (0.0%) | 0 (0.0%) |
| Total | 315 (100.0%) | 0 (0.0%) |
Income Below Poverty Among Single-Parent Households in Riesel
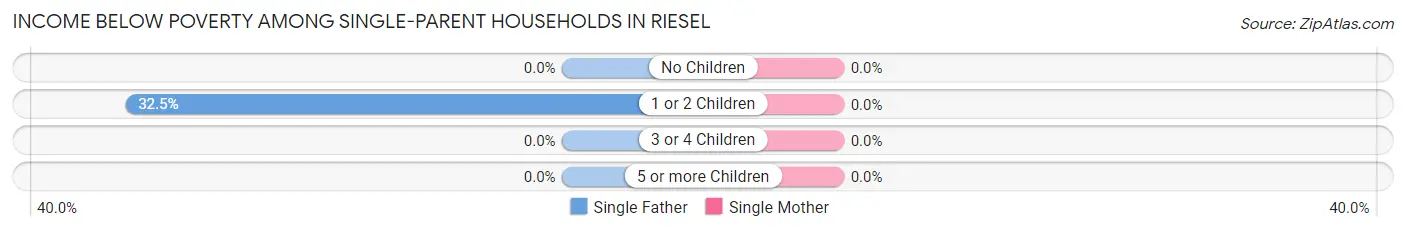
| Children | Single Father | Single Mother |
| No Children | 0 (0.0%) | 0 (0.0%) |
| 1 or 2 Children | 13 (32.5%) | 0 (0.0%) |
| 3 or 4 Children | 0 (0.0%) | 0 (0.0%) |
| 5 or more Children | 0 (0.0%) | 0 (0.0%) |
| Total | 13 (32.5%) | 0 (0.0%) |
Income Below Poverty Among Married-Couple vs Single-Parent Households in Riesel
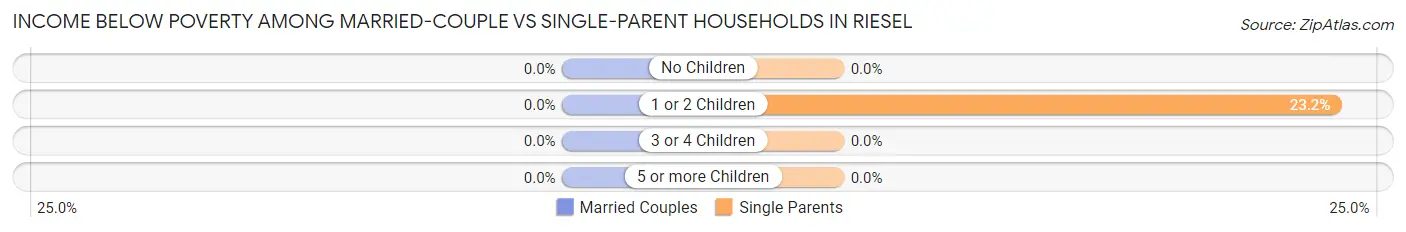
| Children | Married-Couple Families | Single-Parent Households |
| No Children | 0 (0.0%) | 0 (0.0%) |
| 1 or 2 Children | 0 (0.0%) | 13 (23.2%) |
| 3 or 4 Children | 0 (0.0%) | 0 (0.0%) |
| 5 or more Children | 0 (0.0%) | 0 (0.0%) |
| Total | 0 (0.0%) | 13 (16.7%) |
Race in Riesel
The most populous races in Riesel are White / Caucasian (1,389 | 94.9%), Hispanic or Latino (138 | 9.4%), and Two or more Races (54 | 3.7%).
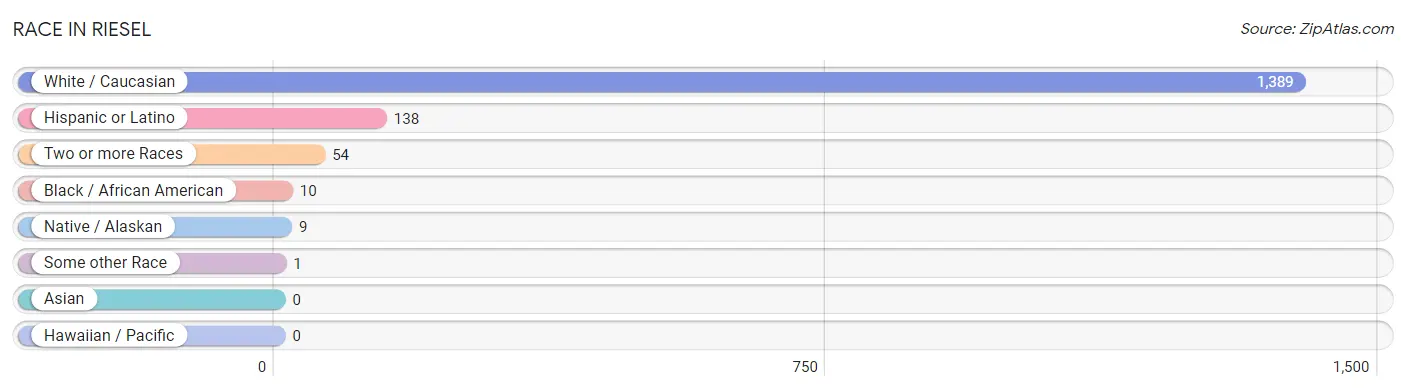
| Race | # Population | % Population |
| Asian | 0 | 0.0% |
| Black / African American | 10 | 0.7% |
| Hawaiian / Pacific | 0 | 0.0% |
| Hispanic or Latino | 138 | 9.4% |
| Native / Alaskan | 9 | 0.6% |
| White / Caucasian | 1,389 | 94.9% |
| Two or more Races | 54 | 3.7% |
| Some other Race | 1 | 0.1% |
| Total | 1,463 | 100.0% |
Ancestry in Riesel
The most populous ancestries reported in Riesel are German (542 | 37.0%), Irish (238 | 16.3%), Mexican (95 | 6.5%), English (76 | 5.2%), and Czech (55 | 3.8%), together accounting for 68.8% of all Riesel residents.
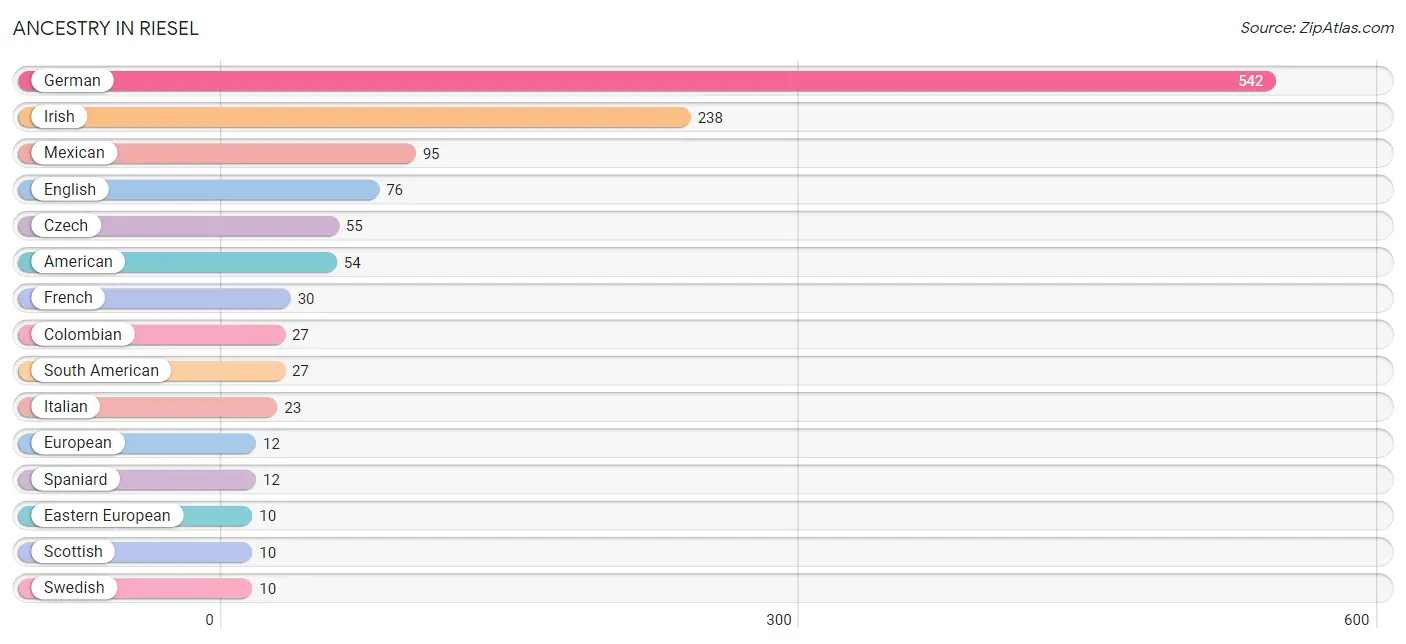
| Ancestry | # Population | % Population |
| African | 1 | 0.1% |
| American | 54 | 3.7% |
| Cherokee | 2 | 0.1% |
| Colombian | 27 | 1.8% |
| Czech | 55 | 3.8% |
| Dutch | 9 | 0.6% |
| Eastern European | 10 | 0.7% |
| English | 76 | 5.2% |
| European | 12 | 0.8% |
| French | 30 | 2.1% |
| German | 542 | 37.0% |
| Irish | 238 | 16.3% |
| Italian | 23 | 1.6% |
| Korean | 8 | 0.5% |
| Mexican | 95 | 6.5% |
| Polish | 5 | 0.3% |
| Pueblo | 7 | 0.5% |
| Scotch-Irish | 8 | 0.5% |
| Scottish | 10 | 0.7% |
| South American | 27 | 1.8% |
| Spaniard | 12 | 0.8% |
| Spanish | 4 | 0.3% |
| Subsaharan African | 1 | 0.1% |
| Swedish | 10 | 0.7% | View All 24 Rows |
Immigrants in Riesel
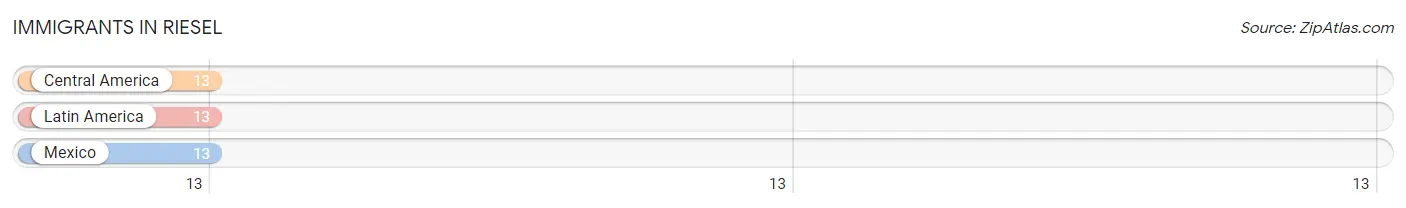
The most numerous immigrant groups reported in Riesel came from Central America (13 | 0.9%), Latin America (13 | 0.9%), and Mexico (13 | 0.9%), together accounting for 2.7% of all Riesel residents.
| Immigration Origin | # Population | % Population |
| Central America | 13 | 0.9% |
| Latin America | 13 | 0.9% |
| Mexico | 13 | 0.9% | View All 3 Rows |
Sex and Age in Riesel
Sex and Age in Riesel
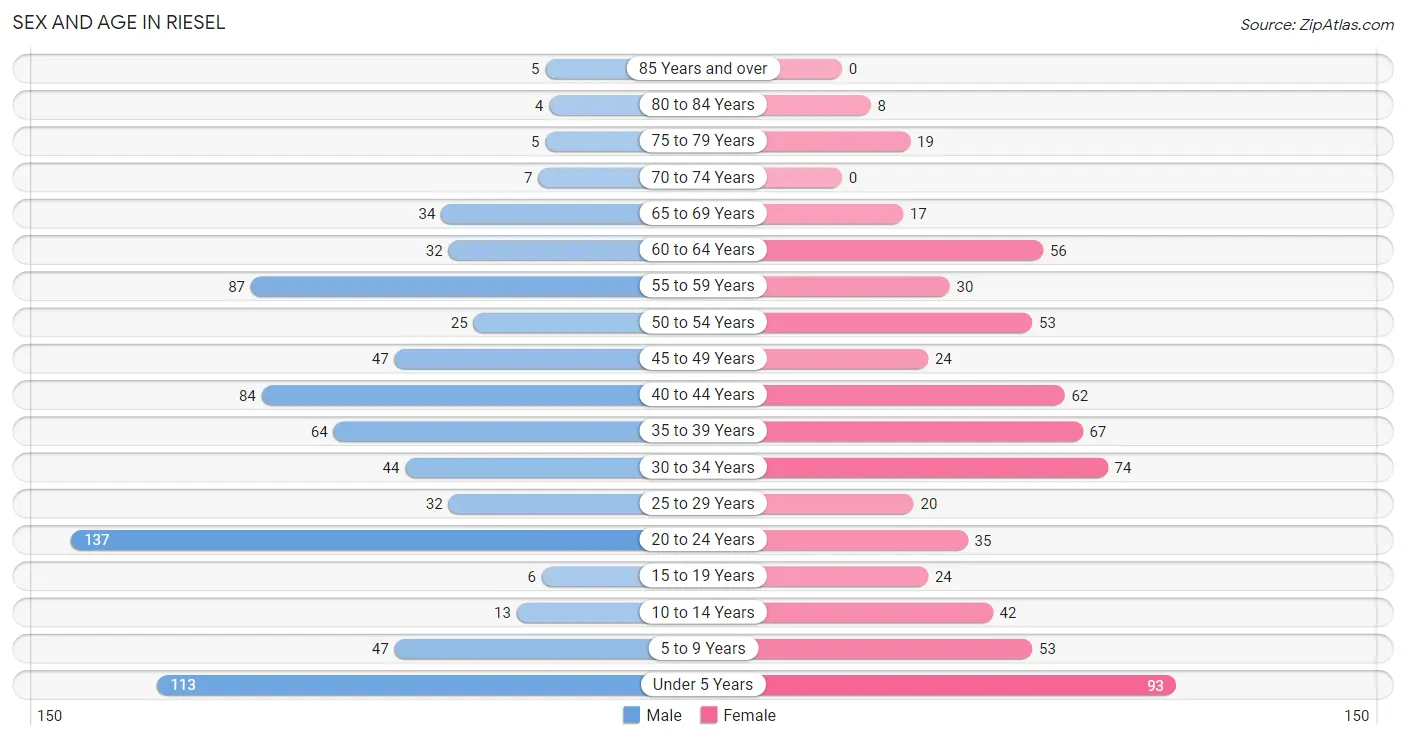
The most populous age groups in Riesel are 20 to 24 Years (137 | 17.4%) for men and Under 5 Years (93 | 13.7%) for women.
| Age Bracket | Male | Female |
| Under 5 Years | 113 (14.4%) | 93 (13.7%) |
| 5 to 9 Years | 47 (6.0%) | 53 (7.8%) |
| 10 to 14 Years | 13 (1.7%) | 42 (6.2%) |
| 15 to 19 Years | 6 (0.8%) | 24 (3.5%) |
| 20 to 24 Years | 137 (17.4%) | 35 (5.2%) |
| 25 to 29 Years | 32 (4.1%) | 20 (2.9%) |
| 30 to 34 Years | 44 (5.6%) | 74 (10.9%) |
| 35 to 39 Years | 64 (8.1%) | 67 (9.9%) |
| 40 to 44 Years | 84 (10.7%) | 62 (9.2%) |
| 45 to 49 Years | 47 (6.0%) | 24 (3.5%) |
| 50 to 54 Years | 25 (3.2%) | 53 (7.8%) |
| 55 to 59 Years | 87 (11.1%) | 30 (4.4%) |
| 60 to 64 Years | 32 (4.1%) | 56 (8.3%) |
| 65 to 69 Years | 34 (4.3%) | 17 (2.5%) |
| 70 to 74 Years | 7 (0.9%) | 0 (0.0%) |
| 75 to 79 Years | 5 (0.6%) | 19 (2.8%) |
| 80 to 84 Years | 4 (0.5%) | 8 (1.2%) |
| 85 Years and over | 5 (0.6%) | 0 (0.0%) |
| Total | 786 (100.0%) | 677 (100.0%) |
Families and Households in Riesel
Median Family Size in Riesel
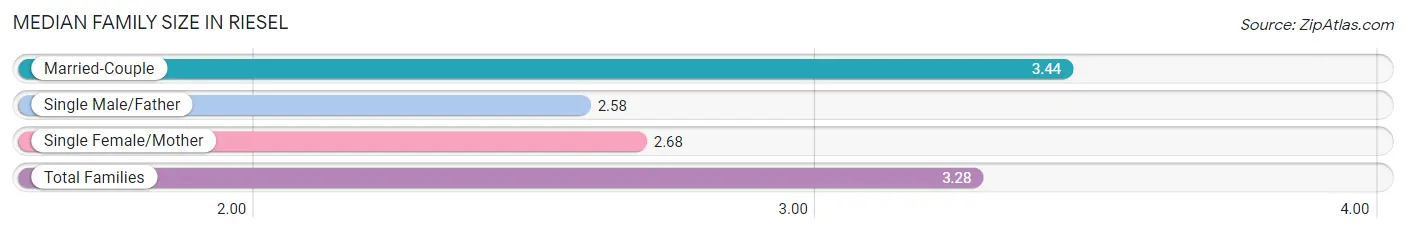
The median family size in Riesel is 3.28 persons per family, with married-couple families (315 | 80.1%) accounting for the largest median family size of 3.44 persons per family. On the other hand, single male/father families (40 | 10.2%) represent the smallest median family size with 2.58 persons per family.
| Family Type | # Families | Family Size |
| Married-Couple | 315 (80.1%) | 3.44 |
| Single Male/Father | 40 (10.2%) | 2.58 |
| Single Female/Mother | 38 (9.7%) | 2.68 |
| Total Families | 393 (100.0%) | 3.28 |
Median Household Size in Riesel
The median household size in Riesel is 3.05 persons per household, with married-couple households (315 | 65.6%) accounting for the largest median household size of 3.45 persons per household. non-family households (87 | 18.1%) represent the smallest median household size with 1.61 persons per household.

| Household Type | # Households | Household Size |
| Married-Couple | 315 (65.6%) | 3.45 |
| Single Male/Father | 40 (8.3%) | 3.25 |
| Single Female/Mother | 38 (7.9%) | 2.82 |
| Non-family | 87 (18.1%) | 1.61 |
| Total Households | 480 (100.0%) | 3.05 |
Household Size by Marriage Status in Riesel
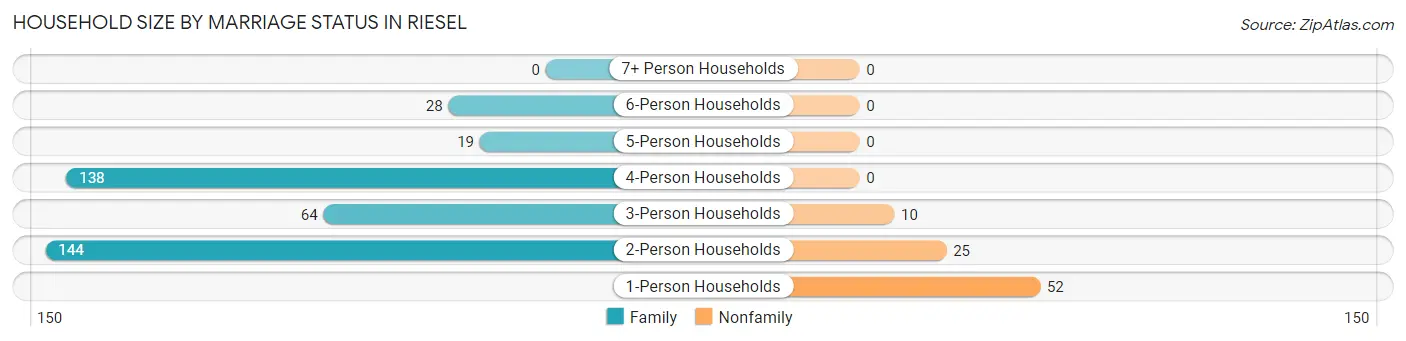
Out of a total of 480 households in Riesel, 393 (81.9%) are family households, while 87 (18.1%) are nonfamily households. The most numerous type of family households are 2-person households, comprising 144, and the most common type of nonfamily households are 1-person households, comprising 52.
| Household Size | Family Households | Nonfamily Households |
| 1-Person Households | - | 52 (10.8%) |
| 2-Person Households | 144 (30.0%) | 25 (5.2%) |
| 3-Person Households | 64 (13.3%) | 10 (2.1%) |
| 4-Person Households | 138 (28.7%) | 0 (0.0%) |
| 5-Person Households | 19 (4.0%) | 0 (0.0%) |
| 6-Person Households | 28 (5.8%) | 0 (0.0%) |
| 7+ Person Households | 0 (0.0%) | 0 (0.0%) |
| Total | 393 (81.9%) | 87 (18.1%) |
Female Fertility in Riesel
Fertility by Age in Riesel
Average fertility rate in Riesel is 165.0 births per 1,000 women. Women in the age bracket of 20 to 34 years have the highest fertility rate with 419.0 births per 1,000 women. Women in the age bracket of 20 to 34 years acount for 100.0% of all women with births.
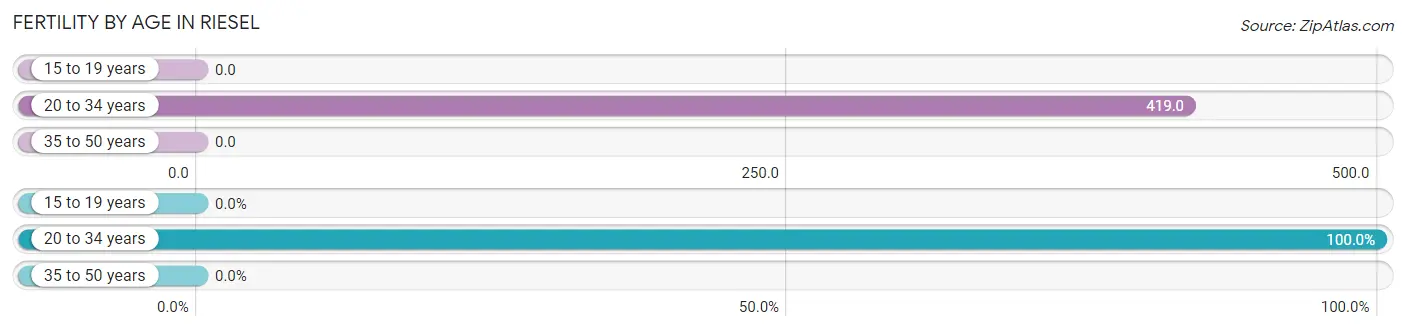
| Age Bracket | Women with Births | Births / 1,000 Women |
| 15 to 19 years | 0 (0.0%) | 0.0 |
| 20 to 34 years | 54 (100.0%) | 419.0 |
| 35 to 50 years | 0 (0.0%) | 0.0 |
| Total | 54 (100.0%) | 165.0 |
Fertility by Age by Marriage Status in Riesel
90.7% of women with births (54) in Riesel are married. The highest percentage of unmarried women with births falls into 20 to 34 years age bracket with 9.3% of them unmarried at the time of birth, while the lowest percentage of unmarried women with births belong to 20 to 34 years age bracket with 9.3% of them unmarried.
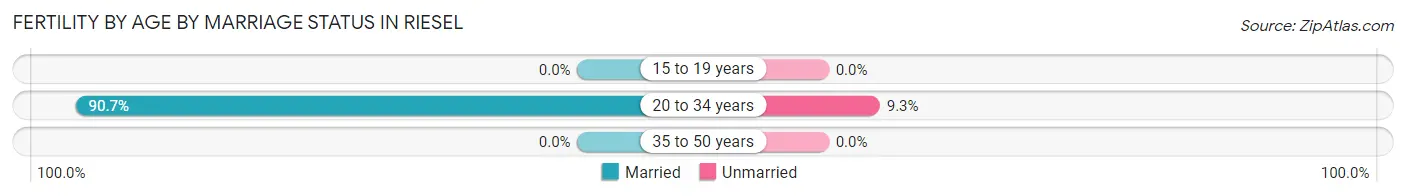
| Age Bracket | Married | Unmarried |
| 15 to 19 years | 0 (0.0%) | 0 (0.0%) |
| 20 to 34 years | 49 (90.7%) | 5 (9.3%) |
| 35 to 50 years | 0 (0.0%) | 0 (0.0%) |
| Total | 49 (90.7%) | 5 (9.3%) |
Fertility by Education in Riesel
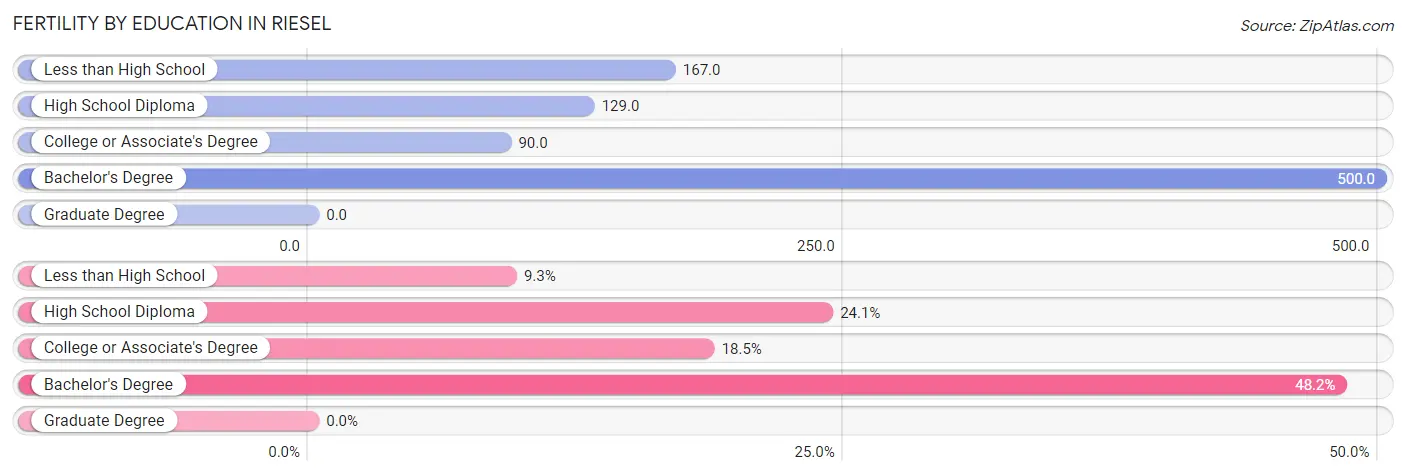
| Educational Attainment | Women with Births | Births / 1,000 Women |
| Less than High School | 5 (9.3%) | 167.0 |
| High School Diploma | 13 (24.1%) | 129.0 |
| College or Associate's Degree | 10 (18.5%) | 90.0 |
| Bachelor's Degree | 26 (48.1%) | 500.0 |
| Graduate Degree | 0 (0.0%) | 0.0 |
| Total | 54 (100.0%) | 165.0 |
Fertility by Education by Marriage Status in Riesel
9.3% of women with births in Riesel are unmarried. Women with the educational attainment of high school diploma are most likely to be married with 100.0% of them married at childbirth, while women with the educational attainment of less than high school are least likely to be married with 100.0% of them unmarried at childbirth.
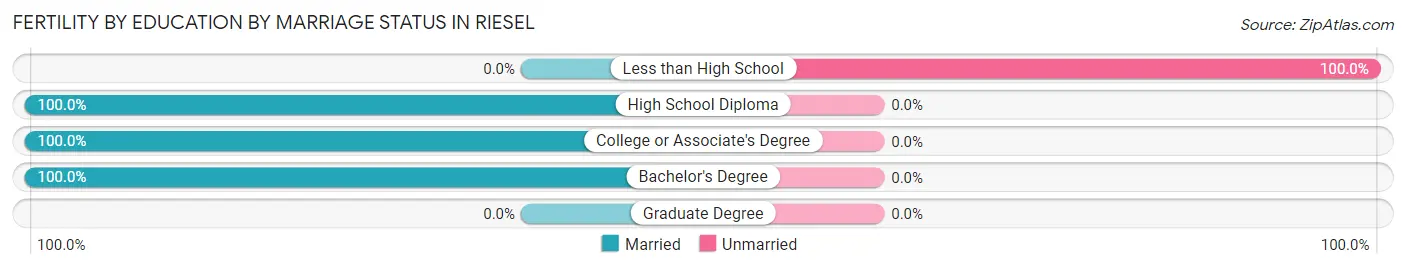
| Educational Attainment | Married | Unmarried |
| Less than High School | 0 (0.0%) | 5 (100.0%) |
| High School Diploma | 13 (100.0%) | 0 (0.0%) |
| College or Associate's Degree | 10 (100.0%) | 0 (0.0%) |
| Bachelor's Degree | 26 (100.0%) | 0 (0.0%) |
| Graduate Degree | 0 (0.0%) | 0 (0.0%) |
| Total | 49 (90.7%) | 5 (9.3%) |
Employment Characteristics in Riesel
Employment by Class of Employer in Riesel
Among the 832 employed individuals in Riesel, private company employees (574 | 69.0%), local government employees (78 | 9.4%), and state government employees (64 | 7.7%) make up the most common classes of employment.
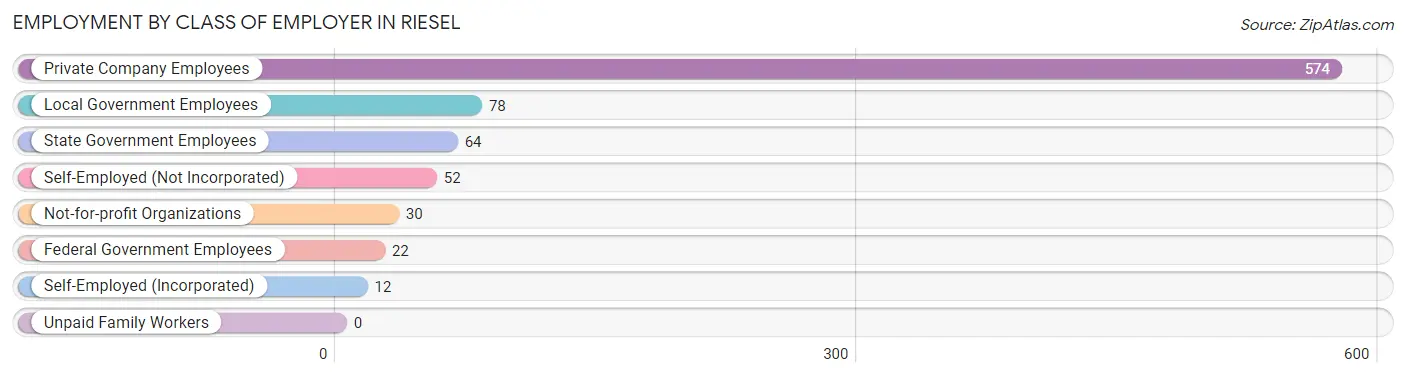
| Employer Class | # Employees | % Employees |
| Private Company Employees | 574 | 69.0% |
| Self-Employed (Incorporated) | 12 | 1.4% |
| Self-Employed (Not Incorporated) | 52 | 6.2% |
| Not-for-profit Organizations | 30 | 3.6% |
| Local Government Employees | 78 | 9.4% |
| State Government Employees | 64 | 7.7% |
| Federal Government Employees | 22 | 2.6% |
| Unpaid Family Workers | 0 | 0.0% |
| Total | 832 | 100.0% |
Employment Status by Age in Riesel
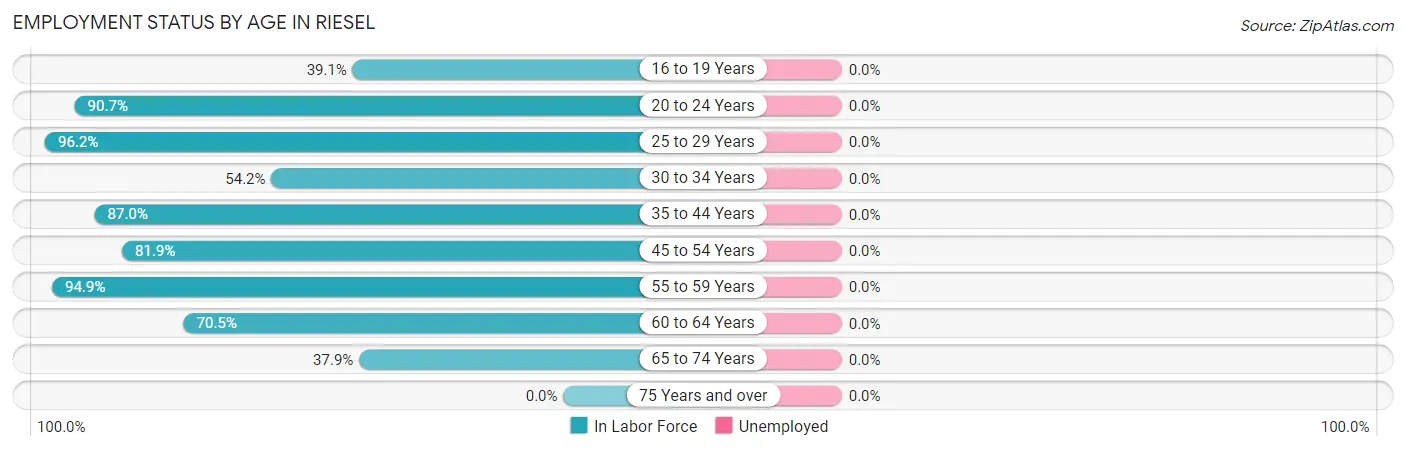
| Age Bracket | In Labor Force | Unemployed |
| 16 to 19 Years | 9 (39.1%) | 0 (0.0%) |
| 20 to 24 Years | 156 (90.7%) | 0 (0.0%) |
| 25 to 29 Years | 50 (96.2%) | 0 (0.0%) |
| 30 to 34 Years | 64 (54.2%) | 0 (0.0%) |
| 35 to 44 Years | 241 (87.0%) | 0 (0.0%) |
| 45 to 54 Years | 122 (81.9%) | 0 (0.0%) |
| 55 to 59 Years | 111 (94.9%) | 0 (0.0%) |
| 60 to 64 Years | 62 (70.5%) | 0 (0.0%) |
| 65 to 74 Years | 22 (37.9%) | 0 (0.0%) |
| 75 Years and over | 0 (0.0%) | 0 (0.0%) |
| Total | 837 (76.4%) | 0 (0.0%) |
Employment Status by Educational Attainment in Riesel
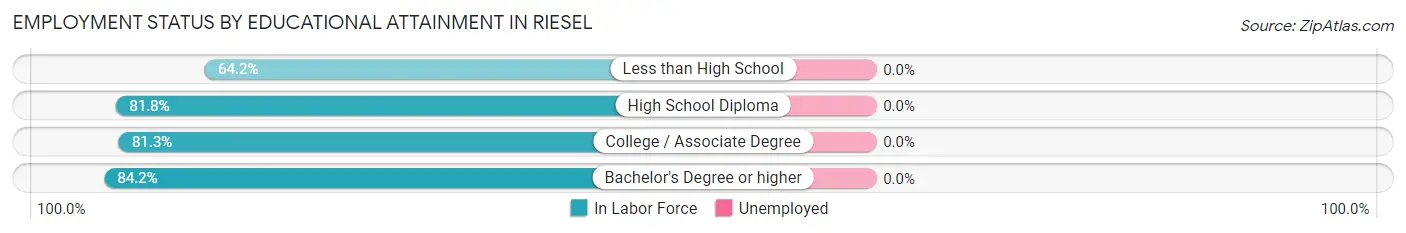
| Educational Attainment | In Labor Force | Unemployed |
| Less than High School | 34 (64.2%) | 0 (0.0%) |
| High School Diploma | 220 (81.8%) | 0 (0.0%) |
| College / Associate Degree | 204 (81.3%) | 0 (0.0%) |
| Bachelor's Degree or higher | 192 (84.2%) | 0 (0.0%) |
| Total | 650 (81.1%) | 0 (0.0%) |
Employment Occupations by Sex in Riesel
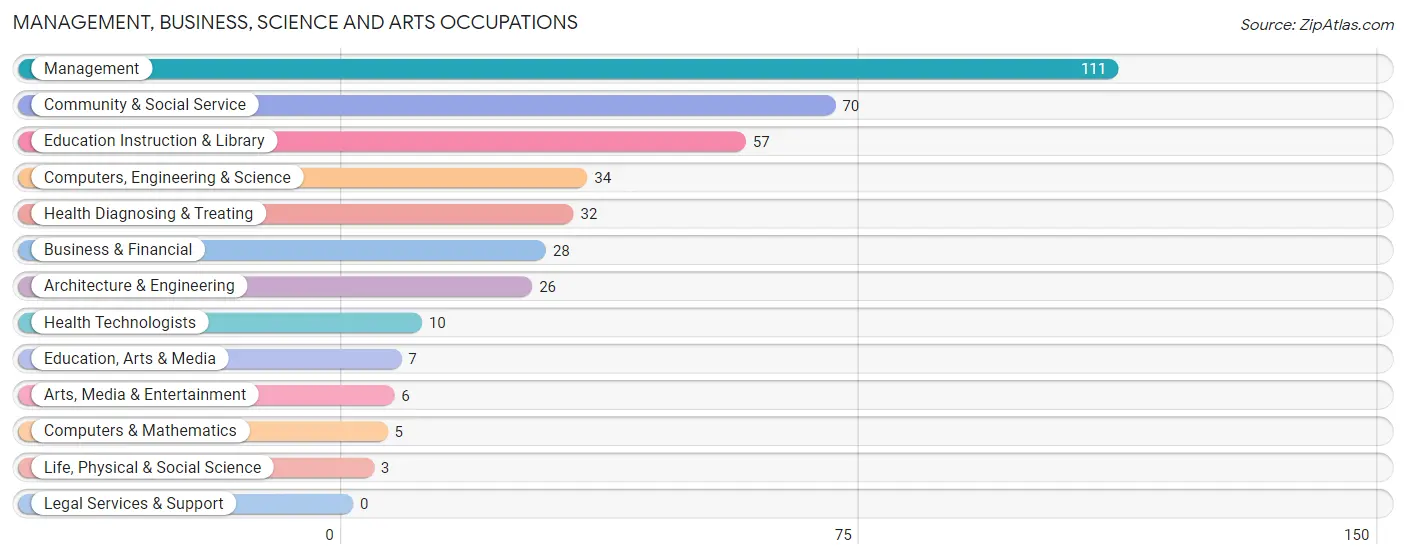
Management, Business, Science and Arts Occupations
The most common Management, Business, Science and Arts occupations in Riesel are Management (111 | 13.3%), Community & Social Service (70 | 8.4%), Education Instruction & Library (57 | 6.8%), Computers, Engineering & Science (34 | 4.1%), and Health Diagnosing & Treating (32 | 3.8%).
Management, Business, Science and Arts Occupations by Sex
Within the Management, Business, Science and Arts occupations in Riesel, the most male-oriented occupations are Computers, Engineering & Science (100.0%), Computers & Mathematics (100.0%), and Architecture & Engineering (100.0%), while the most female-oriented occupations are Education, Arts & Media (100.0%), Education Instruction & Library (93.0%), and Community & Social Service (85.7%).
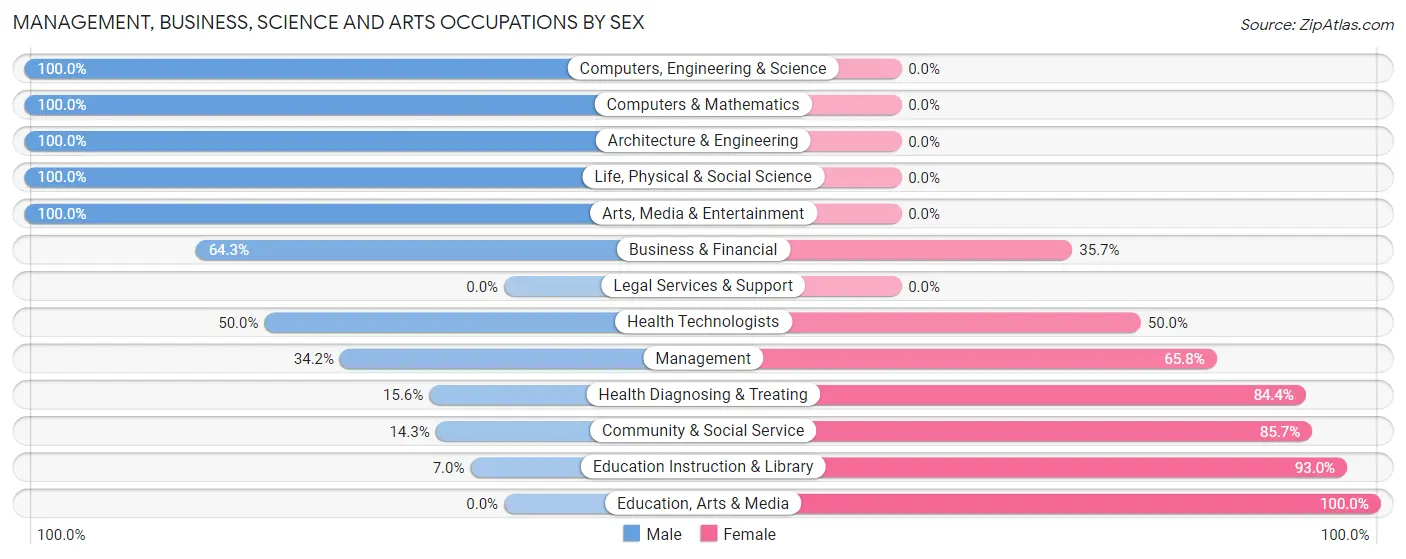
| Occupation | Male | Female |
| Management | 38 (34.2%) | 73 (65.8%) |
| Business & Financial | 18 (64.3%) | 10 (35.7%) |
| Computers, Engineering & Science | 34 (100.0%) | 0 (0.0%) |
| Computers & Mathematics | 5 (100.0%) | 0 (0.0%) |
| Architecture & Engineering | 26 (100.0%) | 0 (0.0%) |
| Life, Physical & Social Science | 3 (100.0%) | 0 (0.0%) |
| Community & Social Service | 10 (14.3%) | 60 (85.7%) |
| Education, Arts & Media | 0 (0.0%) | 7 (100.0%) |
| Legal Services & Support | 0 (0.0%) | 0 (0.0%) |
| Education Instruction & Library | 4 (7.0%) | 53 (93.0%) |
| Arts, Media & Entertainment | 6 (100.0%) | 0 (0.0%) |
| Health Diagnosing & Treating | 5 (15.6%) | 27 (84.4%) |
| Health Technologists | 5 (50.0%) | 5 (50.0%) |
| Total (Category) | 105 (38.2%) | 170 (61.8%) |
| Total (Overall) | 523 (62.5%) | 314 (37.5%) |
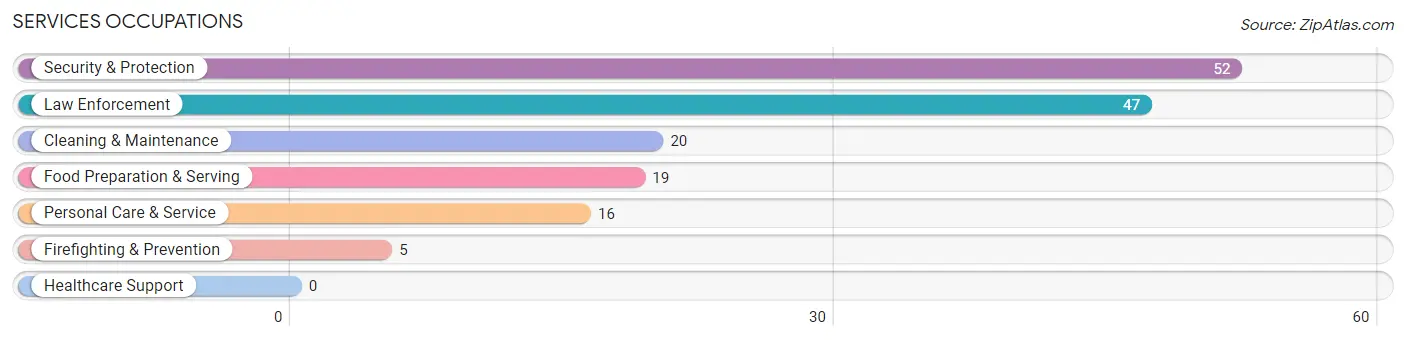
Services Occupations
The most common Services occupations in Riesel are Security & Protection (52 | 6.2%), Law Enforcement (47 | 5.6%), Cleaning & Maintenance (20 | 2.4%), Food Preparation & Serving (19 | 2.3%), and Personal Care & Service (16 | 1.9%).
Services Occupations by Sex
Within the Services occupations in Riesel, the most male-oriented occupations are Firefighting & Prevention (100.0%), Security & Protection (80.8%), and Law Enforcement (78.7%), while the most female-oriented occupations are Personal Care & Service (100.0%), Food Preparation & Serving (47.4%), and Cleaning & Maintenance (35.0%).
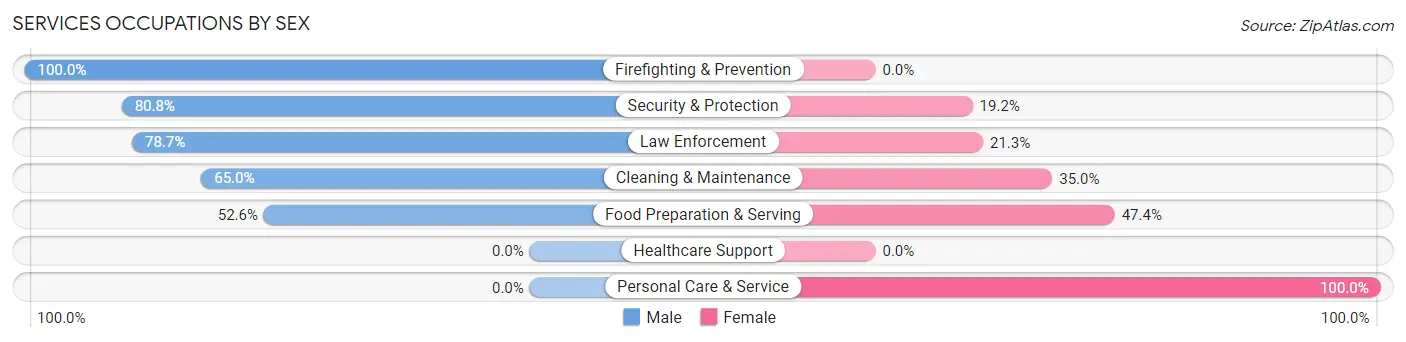
| Occupation | Male | Female |
| Healthcare Support | 0 (0.0%) | 0 (0.0%) |
| Security & Protection | 42 (80.8%) | 10 (19.2%) |
| Firefighting & Prevention | 5 (100.0%) | 0 (0.0%) |
| Law Enforcement | 37 (78.7%) | 10 (21.3%) |
| Food Preparation & Serving | 10 (52.6%) | 9 (47.4%) |
| Cleaning & Maintenance | 13 (65.0%) | 7 (35.0%) |
| Personal Care & Service | 0 (0.0%) | 16 (100.0%) |
| Total (Category) | 65 (60.8%) | 42 (39.3%) |
| Total (Overall) | 523 (62.5%) | 314 (37.5%) |
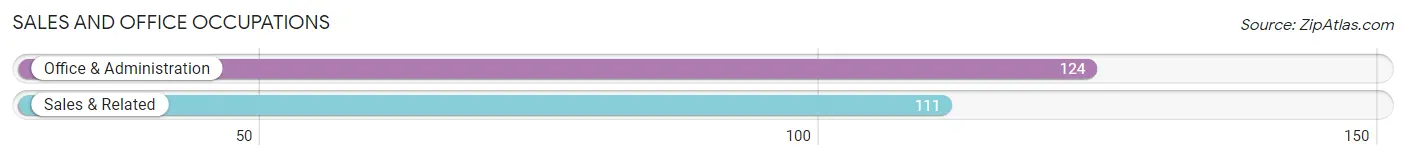
Sales and Office Occupations
The most common Sales and Office occupations in Riesel are Office & Administration (124 | 14.8%), and Sales & Related (111 | 13.3%).
Sales and Office Occupations by Sex
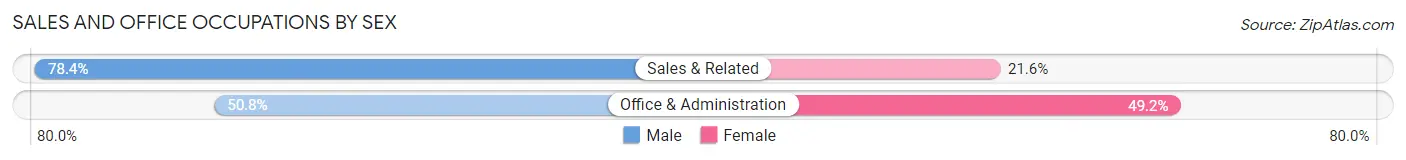
| Occupation | Male | Female |
| Sales & Related | 87 (78.4%) | 24 (21.6%) |
| Office & Administration | 63 (50.8%) | 61 (49.2%) |
| Total (Category) | 150 (63.8%) | 85 (36.2%) |
| Total (Overall) | 523 (62.5%) | 314 (37.5%) |
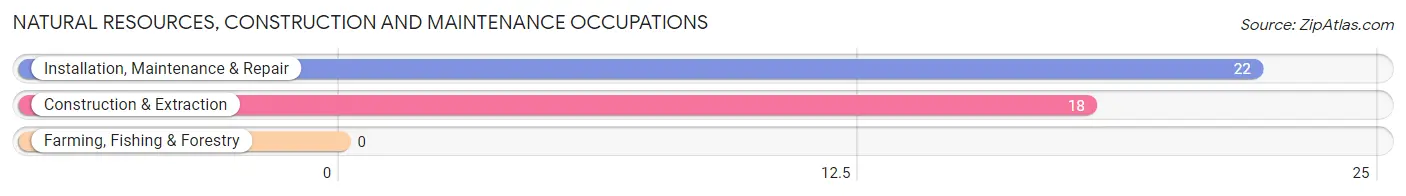
Natural Resources, Construction and Maintenance Occupations
The most common Natural Resources, Construction and Maintenance occupations in Riesel are Installation, Maintenance & Repair (22 | 2.6%), and Construction & Extraction (18 | 2.1%).
Natural Resources, Construction and Maintenance Occupations by Sex
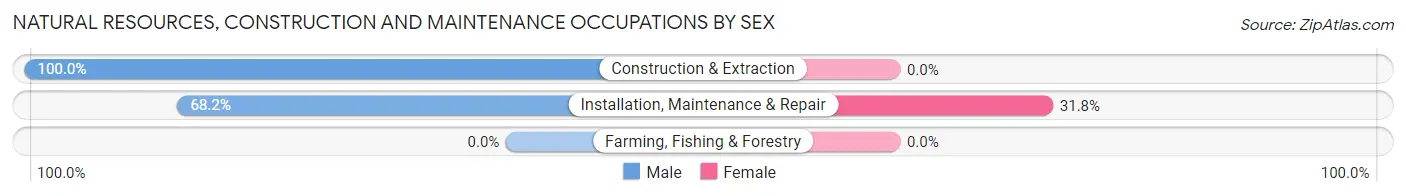
| Occupation | Male | Female |
| Farming, Fishing & Forestry | 0 (0.0%) | 0 (0.0%) |
| Construction & Extraction | 18 (100.0%) | 0 (0.0%) |
| Installation, Maintenance & Repair | 15 (68.2%) | 7 (31.8%) |
| Total (Category) | 33 (82.5%) | 7 (17.5%) |
| Total (Overall) | 523 (62.5%) | 314 (37.5%) |
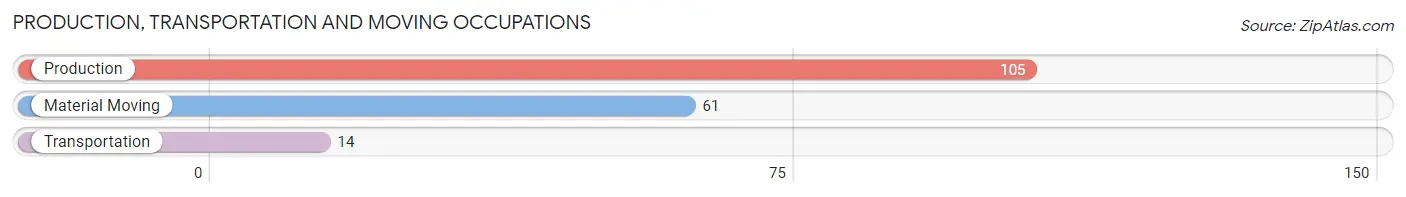
Production, Transportation and Moving Occupations
The most common Production, Transportation and Moving occupations in Riesel are Production (105 | 12.5%), Material Moving (61 | 7.3%), and Transportation (14 | 1.7%).
Production, Transportation and Moving Occupations by Sex
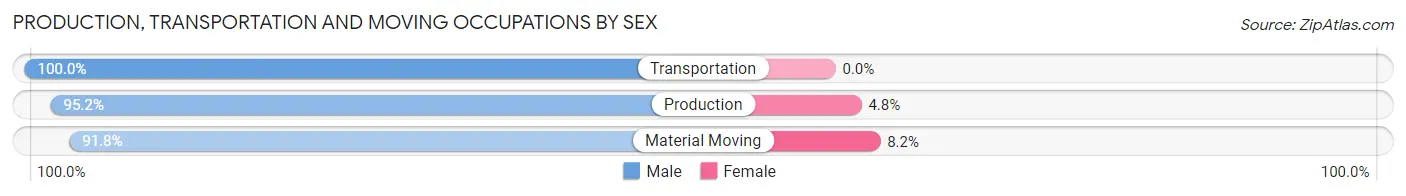
| Occupation | Male | Female |
| Production | 100 (95.2%) | 5 (4.8%) |
| Transportation | 14 (100.0%) | 0 (0.0%) |
| Material Moving | 56 (91.8%) | 5 (8.2%) |
| Total (Category) | 170 (94.4%) | 10 (5.6%) |
| Total (Overall) | 523 (62.5%) | 314 (37.5%) |
Employment Industries by Sex in Riesel
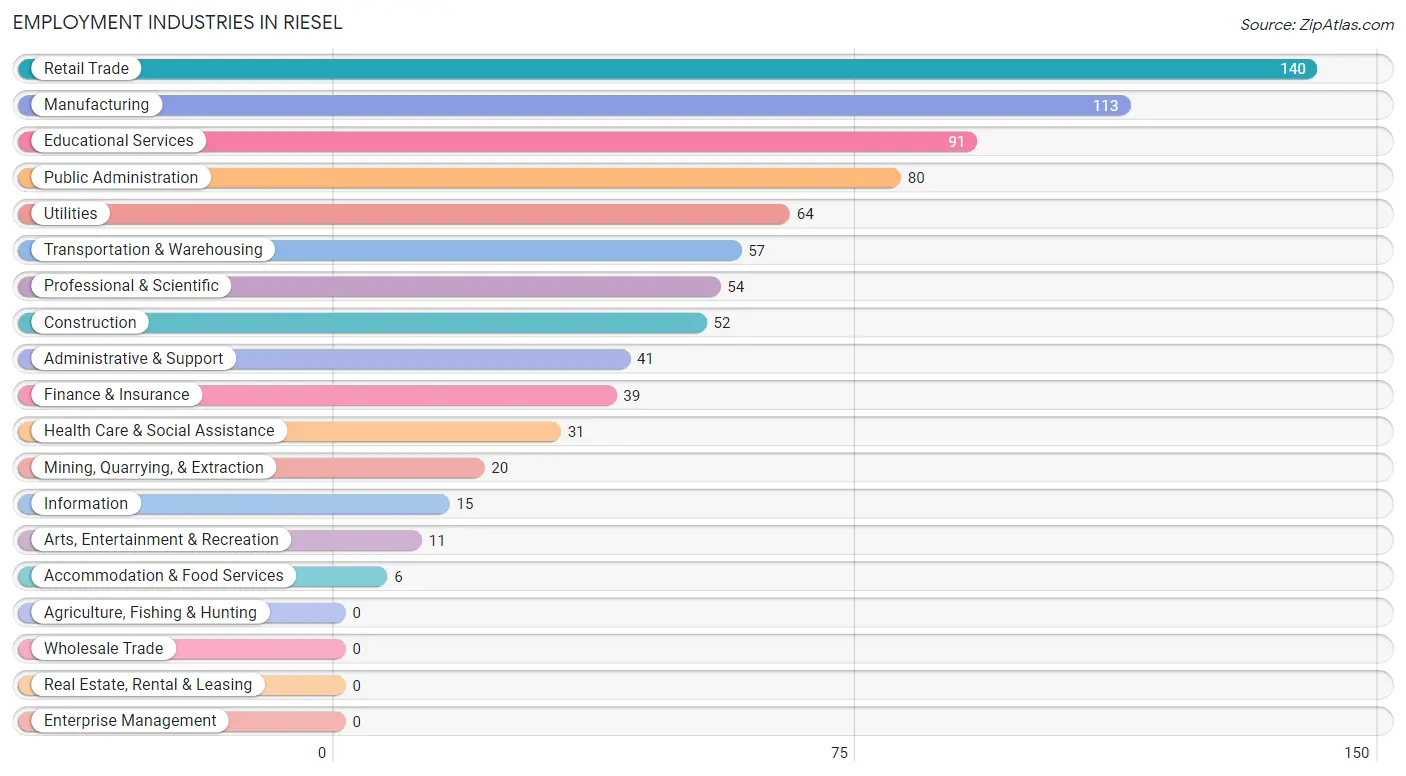
Employment Industries in Riesel
The major employment industries in Riesel include Retail Trade (140 | 16.7%), Manufacturing (113 | 13.5%), Educational Services (91 | 10.9%), Public Administration (80 | 9.6%), and Utilities (64 | 7.6%).
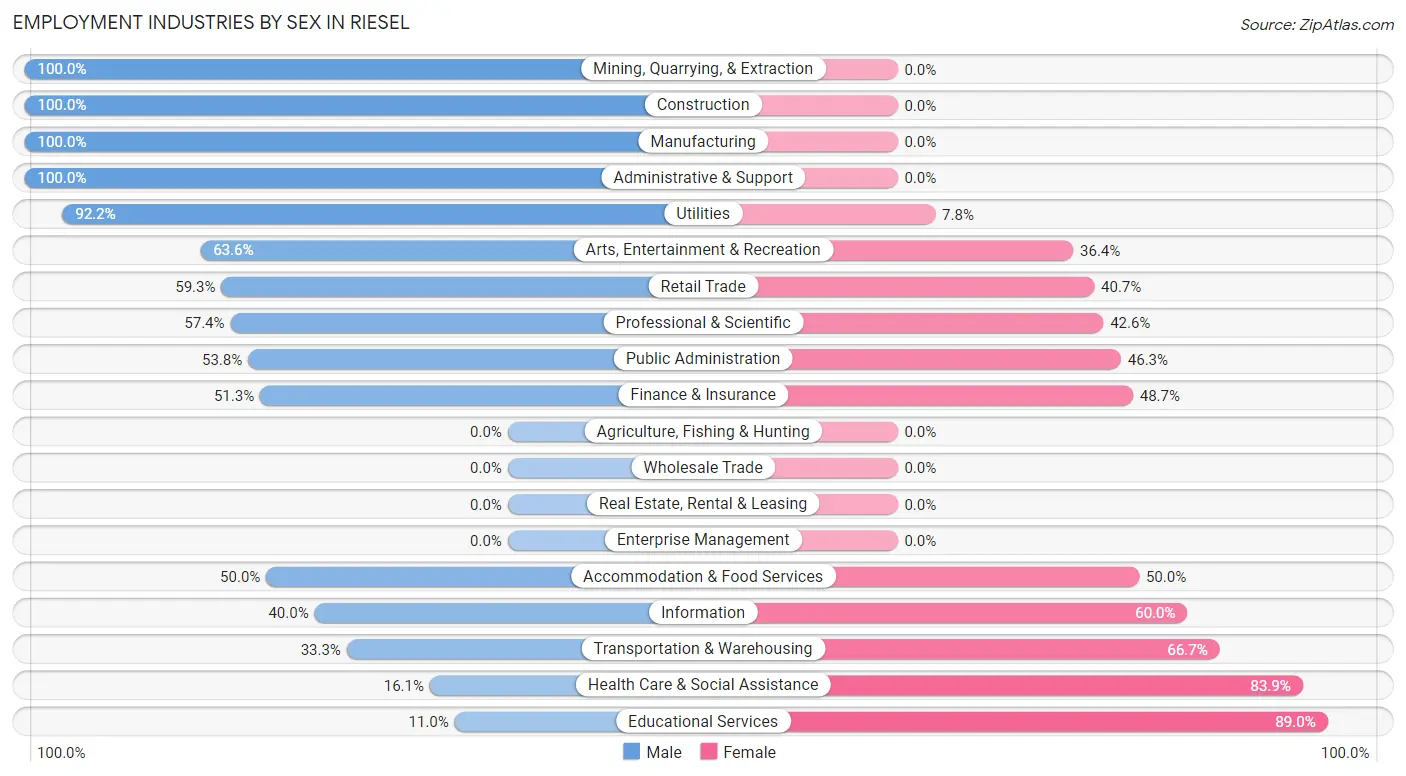
Employment Industries by Sex in Riesel
The Riesel industries that see more men than women are Mining, Quarrying, & Extraction (100.0%), Construction (100.0%), and Manufacturing (100.0%), whereas the industries that tend to have a higher number of women are Educational Services (89.0%), Health Care & Social Assistance (83.9%), and Transportation & Warehousing (66.7%).
| Industry | Male | Female |
| Agriculture, Fishing & Hunting | 0 (0.0%) | 0 (0.0%) |
| Mining, Quarrying, & Extraction | 20 (100.0%) | 0 (0.0%) |
| Construction | 52 (100.0%) | 0 (0.0%) |
| Manufacturing | 113 (100.0%) | 0 (0.0%) |
| Wholesale Trade | 0 (0.0%) | 0 (0.0%) |
| Retail Trade | 83 (59.3%) | 57 (40.7%) |
| Transportation & Warehousing | 19 (33.3%) | 38 (66.7%) |
| Utilities | 59 (92.2%) | 5 (7.8%) |
| Information | 6 (40.0%) | 9 (60.0%) |
| Finance & Insurance | 20 (51.3%) | 19 (48.7%) |
| Real Estate, Rental & Leasing | 0 (0.0%) | 0 (0.0%) |
| Professional & Scientific | 31 (57.4%) | 23 (42.6%) |
| Enterprise Management | 0 (0.0%) | 0 (0.0%) |
| Administrative & Support | 41 (100.0%) | 0 (0.0%) |
| Educational Services | 10 (11.0%) | 81 (89.0%) |
| Health Care & Social Assistance | 5 (16.1%) | 26 (83.9%) |
| Arts, Entertainment & Recreation | 7 (63.6%) | 4 (36.4%) |
| Accommodation & Food Services | 3 (50.0%) | 3 (50.0%) |
| Public Administration | 43 (53.7%) | 37 (46.3%) |
| Total | 523 (62.5%) | 314 (37.5%) |
Education in Riesel
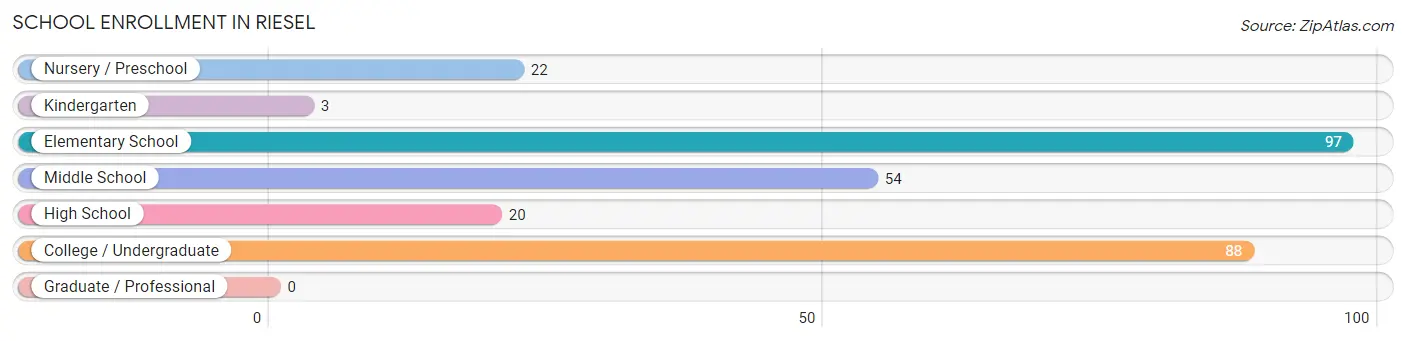
School Enrollment in Riesel
The most common levels of schooling among the 284 students in Riesel are elementary school (97 | 34.2%), college / undergraduate (88 | 31.0%), and middle school (54 | 19.0%).
| School Level | # Students | % Students |
| Nursery / Preschool | 22 | 7.7% |
| Kindergarten | 3 | 1.1% |
| Elementary School | 97 | 34.2% |
| Middle School | 54 | 19.0% |
| High School | 20 | 7.0% |
| College / Undergraduate | 88 | 31.0% |
| Graduate / Professional | 0 | 0.0% |
| Total | 284 | 100.0% |
School Enrollment by Age by Funding Source in Riesel
Out of a total of 284 students who are enrolled in schools in Riesel, 27 (9.5%) attend a private institution, while the remaining 257 (90.5%) are enrolled in public schools. The age group of 5 to 9 year old has the highest likelihood of being enrolled in private schools, with 17 (17.0% in the age bracket) enrolled. Conversely, the age group of 10 to 14 year olds has the lowest likelihood of being enrolled in a private school, with 55 (100.0% in the age bracket) attending a public institution.
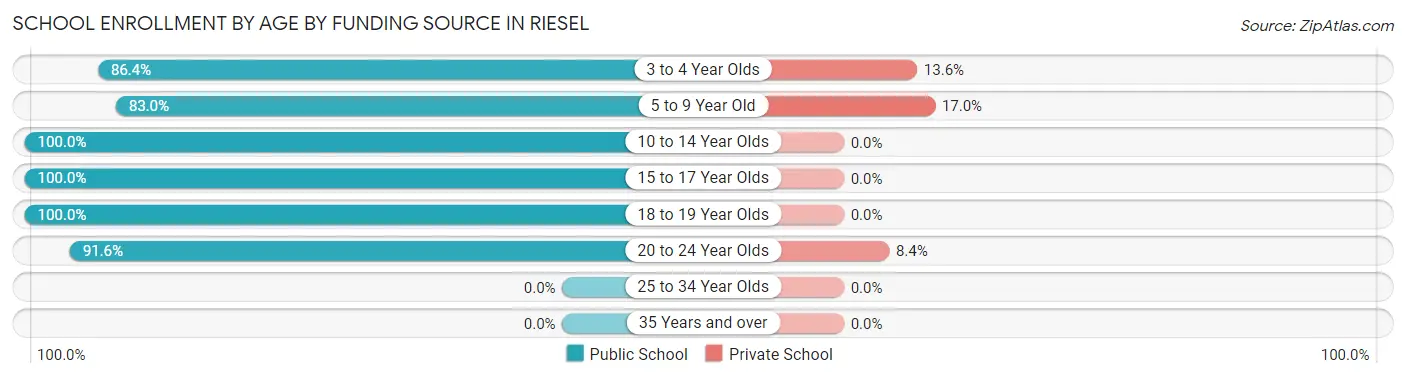
| Age Bracket | Public School | Private School |
| 3 to 4 Year Olds | 19 (86.4%) | 3 (13.6%) |
| 5 to 9 Year Old | 83 (83.0%) | 17 (17.0%) |
| 10 to 14 Year Olds | 55 (100.0%) | 0 (0.0%) |
| 15 to 17 Year Olds | 21 (100.0%) | 0 (0.0%) |
| 18 to 19 Year Olds | 3 (100.0%) | 0 (0.0%) |
| 20 to 24 Year Olds | 76 (91.6%) | 7 (8.4%) |
| 25 to 34 Year Olds | 0 (0.0%) | 0 (0.0%) |
| 35 Years and over | 0 (0.0%) | 0 (0.0%) |
| Total | 257 (90.5%) | 27 (9.5%) |
Educational Attainment by Field of Study in Riesel
Engineering (45 | 17.9%), education (44 | 17.5%), business (40 | 15.9%), computers & mathematics (36 | 14.3%), and arts & humanities (22 | 8.7%) are the most common fields of study among 252 individuals in Riesel who have obtained a bachelor's degree or higher.
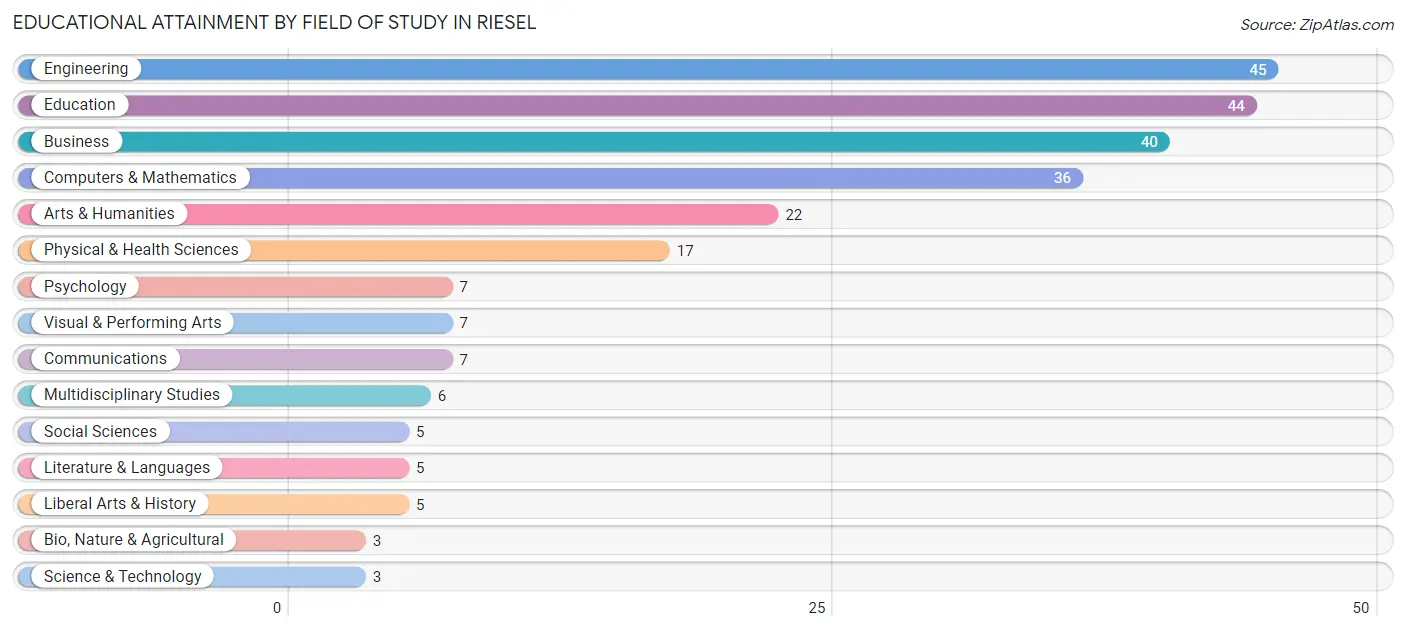
| Field of Study | # Graduates | % Graduates |
| Computers & Mathematics | 36 | 14.3% |
| Bio, Nature & Agricultural | 3 | 1.2% |
| Physical & Health Sciences | 17 | 6.8% |
| Psychology | 7 | 2.8% |
| Social Sciences | 5 | 2.0% |
| Engineering | 45 | 17.9% |
| Multidisciplinary Studies | 6 | 2.4% |
| Science & Technology | 3 | 1.2% |
| Business | 40 | 15.9% |
| Education | 44 | 17.5% |
| Literature & Languages | 5 | 2.0% |
| Liberal Arts & History | 5 | 2.0% |
| Visual & Performing Arts | 7 | 2.8% |
| Communications | 7 | 2.8% |
| Arts & Humanities | 22 | 8.7% |
| Total | 252 | 100.0% |
Transportation & Commute in Riesel
Vehicle Availability by Sex in Riesel
The most prevalent vehicle ownership categories in Riesel are males with 3 vehicles (252, accounting for 48.2%) and females with 3 vehicles (80, making up 81.6%).
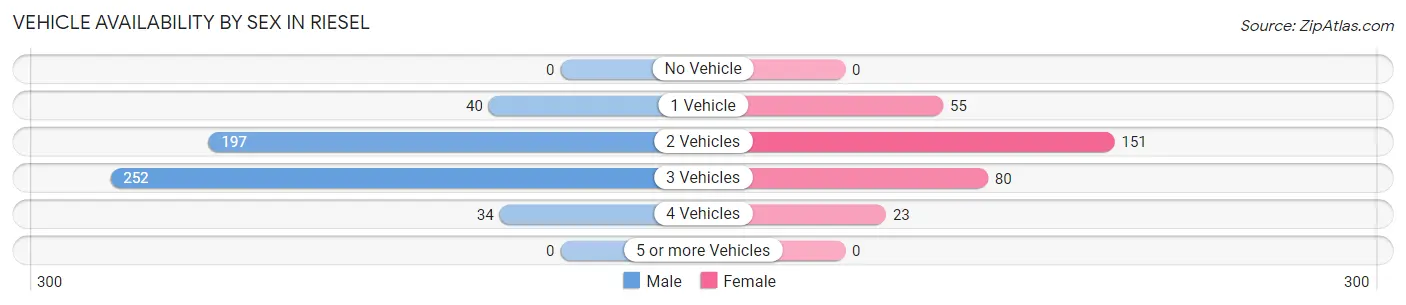
| Vehicles Available | Male | Female |
| No Vehicle | 0 (0.0%) | 0 (0.0%) |
| 1 Vehicle | 40 (7.6%) | 55 (17.8%) |
| 2 Vehicles | 197 (37.7%) | 151 (48.9%) |
| 3 Vehicles | 252 (48.2%) | 80 (25.9%) |
| 4 Vehicles | 34 (6.5%) | 23 (7.4%) |
| 5 or more Vehicles | 0 (0.0%) | 0 (0.0%) |
| Total | 523 (100.0%) | 309 (100.0%) |
Commute Time in Riesel
The most frequently occuring commute durations in Riesel are 30 to 34 minutes (210 commuters, 26.7%), 25 to 29 minutes (147 commuters, 18.7%), and 20 to 24 minutes (138 commuters, 17.5%).
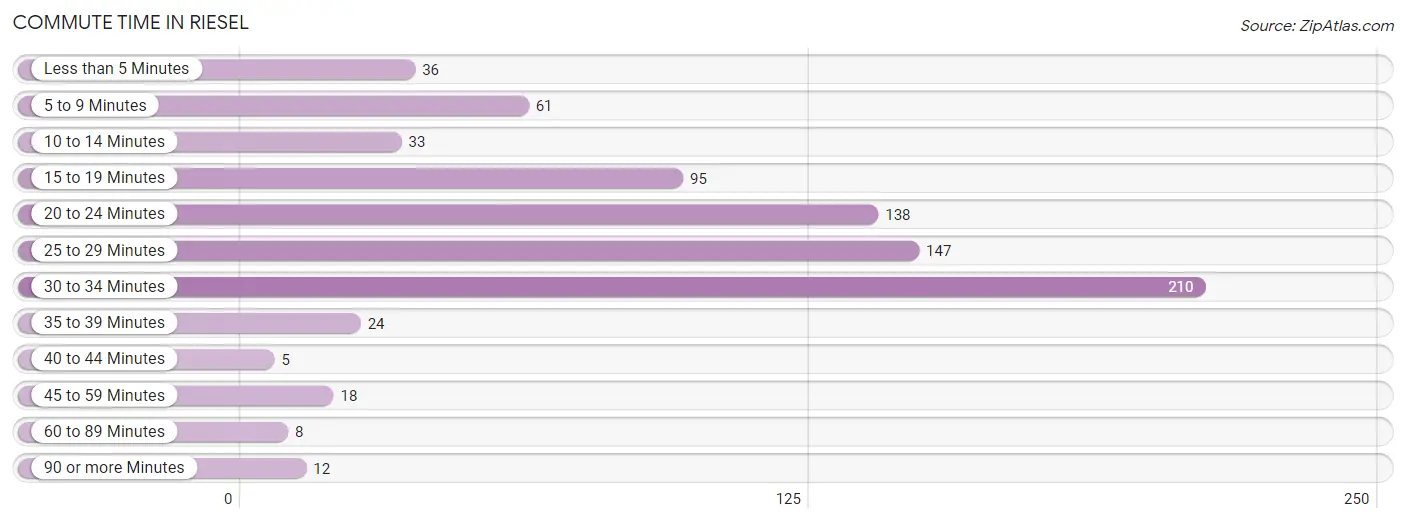
| Commute Time | # Commuters | % Commuters |
| Less than 5 Minutes | 36 | 4.6% |
| 5 to 9 Minutes | 61 | 7.7% |
| 10 to 14 Minutes | 33 | 4.2% |
| 15 to 19 Minutes | 95 | 12.1% |
| 20 to 24 Minutes | 138 | 17.5% |
| 25 to 29 Minutes | 147 | 18.7% |
| 30 to 34 Minutes | 210 | 26.7% |
| 35 to 39 Minutes | 24 | 3.0% |
| 40 to 44 Minutes | 5 | 0.6% |
| 45 to 59 Minutes | 18 | 2.3% |
| 60 to 89 Minutes | 8 | 1.0% |
| 90 or more Minutes | 12 | 1.5% |
Commute Time by Sex in Riesel
The most common commute times in Riesel are 30 to 34 minutes (160 commuters, 31.9%) for males and 25 to 29 minutes (96 commuters, 33.7%) for females.
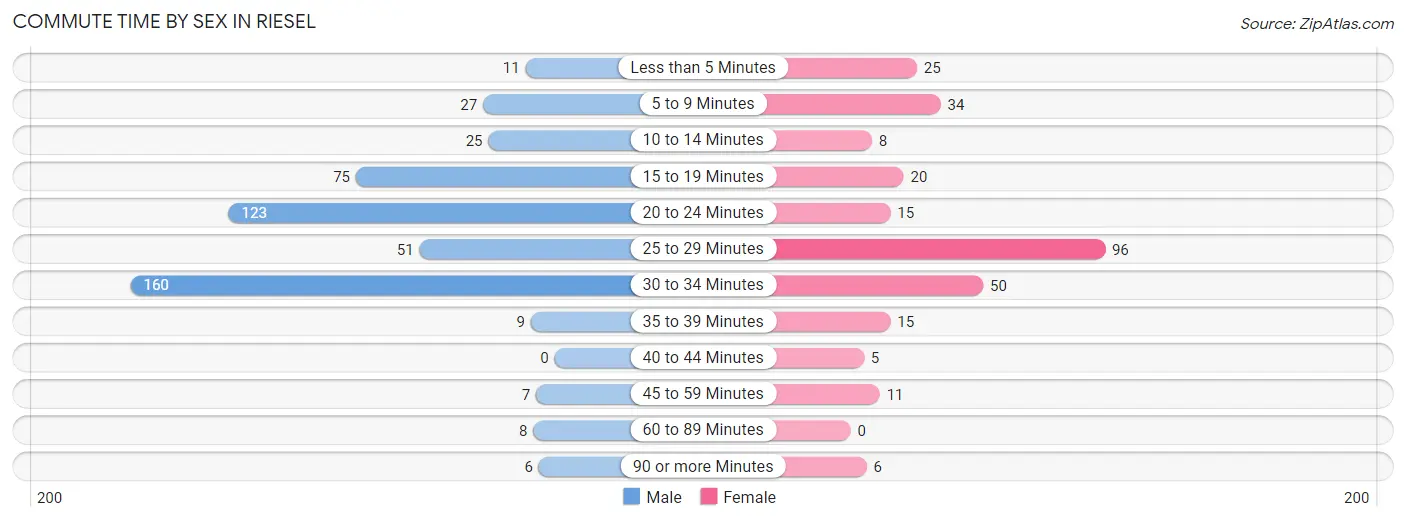
| Commute Time | Male | Female |
| Less than 5 Minutes | 11 (2.2%) | 25 (8.8%) |
| 5 to 9 Minutes | 27 (5.4%) | 34 (11.9%) |
| 10 to 14 Minutes | 25 (5.0%) | 8 (2.8%) |
| 15 to 19 Minutes | 75 (14.9%) | 20 (7.0%) |
| 20 to 24 Minutes | 123 (24.5%) | 15 (5.3%) |
| 25 to 29 Minutes | 51 (10.2%) | 96 (33.7%) |
| 30 to 34 Minutes | 160 (31.9%) | 50 (17.5%) |
| 35 to 39 Minutes | 9 (1.8%) | 15 (5.3%) |
| 40 to 44 Minutes | 0 (0.0%) | 5 (1.8%) |
| 45 to 59 Minutes | 7 (1.4%) | 11 (3.9%) |
| 60 to 89 Minutes | 8 (1.6%) | 0 (0.0%) |
| 90 or more Minutes | 6 (1.2%) | 6 (2.1%) |
Time of Departure to Work by Sex in Riesel
The most frequent times of departure to work in Riesel are 7:00 AM to 7:29 AM (159, 31.7%) for males and 7:00 AM to 7:29 AM (126, 44.2%) for females.
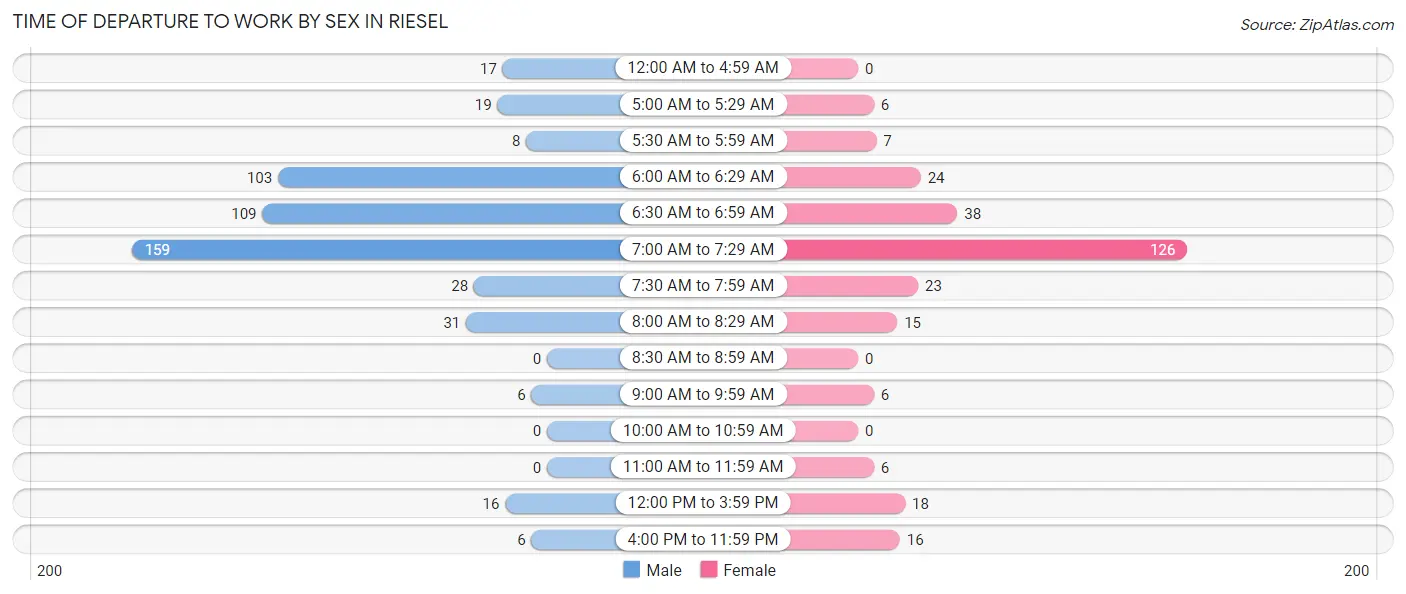
| Time of Departure | Male | Female |
| 12:00 AM to 4:59 AM | 17 (3.4%) | 0 (0.0%) |
| 5:00 AM to 5:29 AM | 19 (3.8%) | 6 (2.1%) |
| 5:30 AM to 5:59 AM | 8 (1.6%) | 7 (2.5%) |
| 6:00 AM to 6:29 AM | 103 (20.5%) | 24 (8.4%) |
| 6:30 AM to 6:59 AM | 109 (21.7%) | 38 (13.3%) |
| 7:00 AM to 7:29 AM | 159 (31.7%) | 126 (44.2%) |
| 7:30 AM to 7:59 AM | 28 (5.6%) | 23 (8.1%) |
| 8:00 AM to 8:29 AM | 31 (6.2%) | 15 (5.3%) |
| 8:30 AM to 8:59 AM | 0 (0.0%) | 0 (0.0%) |
| 9:00 AM to 9:59 AM | 6 (1.2%) | 6 (2.1%) |
| 10:00 AM to 10:59 AM | 0 (0.0%) | 0 (0.0%) |
| 11:00 AM to 11:59 AM | 0 (0.0%) | 6 (2.1%) |
| 12:00 PM to 3:59 PM | 16 (3.2%) | 18 (6.3%) |
| 4:00 PM to 11:59 PM | 6 (1.2%) | 16 (5.6%) |
| Total | 502 (100.0%) | 285 (100.0%) |
Housing Occupancy in Riesel
Occupancy by Ownership in Riesel
Of the total 480 dwellings in Riesel, owner-occupied units account for 353 (73.5%), while renter-occupied units make up 127 (26.5%).
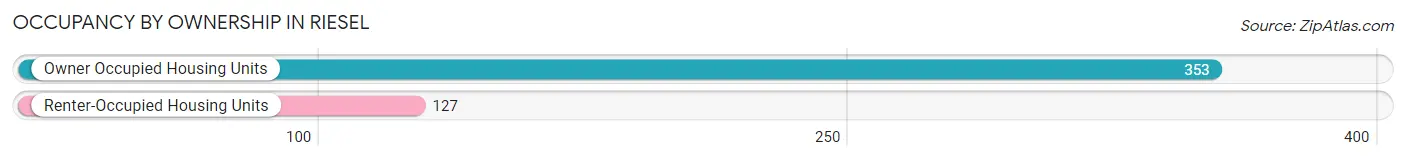
| Occupancy | # Housing Units | % Housing Units |
| Owner Occupied Housing Units | 353 | 73.5% |
| Renter-Occupied Housing Units | 127 | 26.5% |
| Total Occupied Housing Units | 480 | 100.0% |
Occupancy by Household Size in Riesel
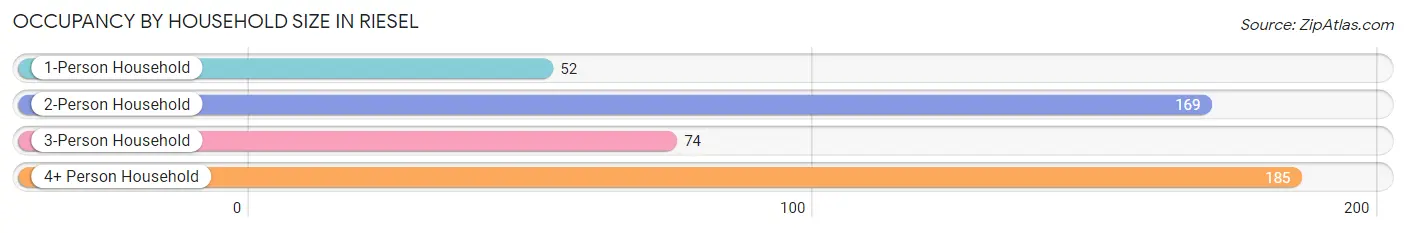
| Household Size | # Housing Units | % Housing Units |
| 1-Person Household | 52 | 10.8% |
| 2-Person Household | 169 | 35.2% |
| 3-Person Household | 74 | 15.4% |
| 4+ Person Household | 185 | 38.5% |
| Total Housing Units | 480 | 100.0% |
Occupancy by Ownership by Household Size in Riesel
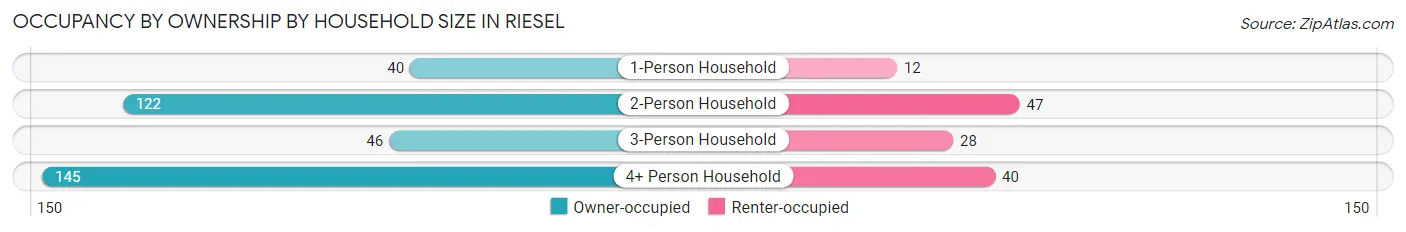
| Household Size | Owner-occupied | Renter-occupied |
| 1-Person Household | 40 (76.9%) | 12 (23.1%) |
| 2-Person Household | 122 (72.2%) | 47 (27.8%) |
| 3-Person Household | 46 (62.2%) | 28 (37.8%) |
| 4+ Person Household | 145 (78.4%) | 40 (21.6%) |
| Total Housing Units | 353 (73.5%) | 127 (26.5%) |
Occupancy by Educational Attainment in Riesel
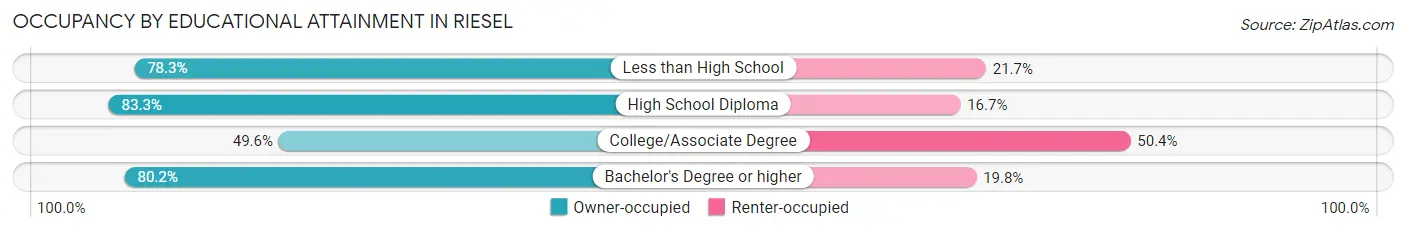
| Household Size | Owner-occupied | Renter-occupied |
| Less than High School | 18 (78.3%) | 5 (21.7%) |
| High School Diploma | 180 (83.3%) | 36 (16.7%) |
| College/Associate Degree | 62 (49.6%) | 63 (50.4%) |
| Bachelor's Degree or higher | 93 (80.2%) | 23 (19.8%) |
Occupancy by Age of Householder in Riesel
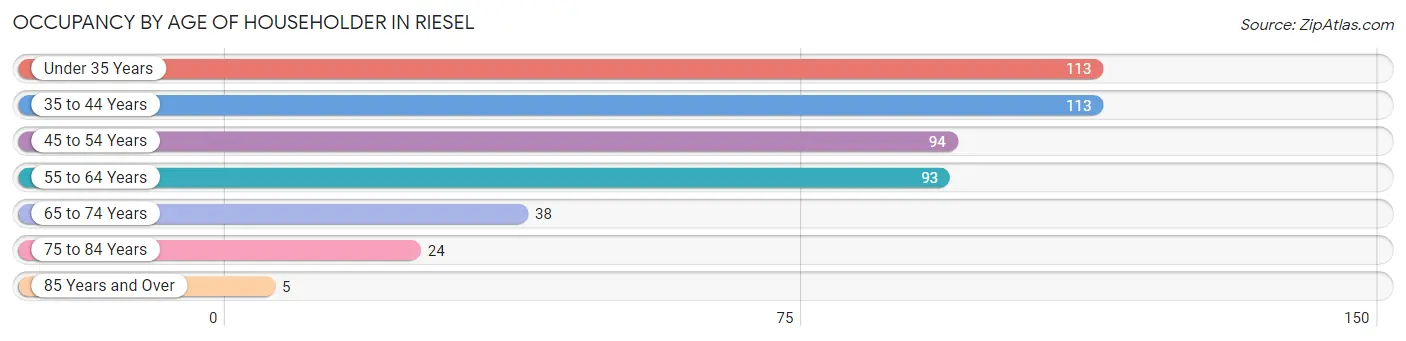
| Age Bracket | # Households | % Households |
| Under 35 Years | 113 | 23.5% |
| 35 to 44 Years | 113 | 23.5% |
| 45 to 54 Years | 94 | 19.6% |
| 55 to 64 Years | 93 | 19.4% |
| 65 to 74 Years | 38 | 7.9% |
| 75 to 84 Years | 24 | 5.0% |
| 85 Years and Over | 5 | 1.0% |
| Total | 480 | 100.0% |
Housing Finances in Riesel
Median Income by Occupancy in Riesel
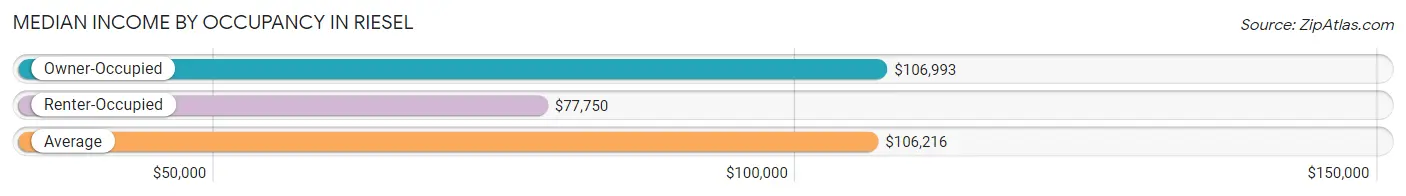
| Occupancy Type | # Households | Median Income |
| Owner-Occupied | 353 (73.5%) | $106,993 |
| Renter-Occupied | 127 (26.5%) | $77,750 |
| Average | 480 (100.0%) | $106,216 |
Occupancy by Householder Income Bracket in Riesel
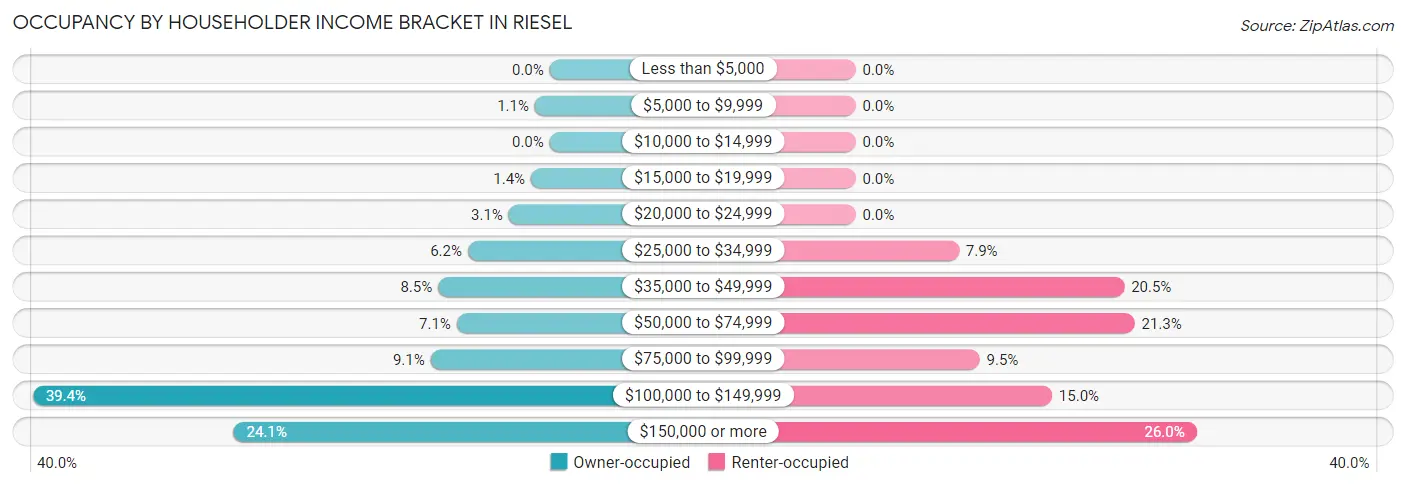
| Income Bracket | Owner-occupied | Renter-occupied |
| Less than $5,000 | 0 (0.0%) | 0 (0.0%) |
| $5,000 to $9,999 | 4 (1.1%) | 0 (0.0%) |
| $10,000 to $14,999 | 0 (0.0%) | 0 (0.0%) |
| $15,000 to $19,999 | 5 (1.4%) | 0 (0.0%) |
| $20,000 to $24,999 | 11 (3.1%) | 0 (0.0%) |
| $25,000 to $34,999 | 22 (6.2%) | 10 (7.9%) |
| $35,000 to $49,999 | 30 (8.5%) | 26 (20.5%) |
| $50,000 to $74,999 | 25 (7.1%) | 27 (21.3%) |
| $75,000 to $99,999 | 32 (9.1%) | 12 (9.5%) |
| $100,000 to $149,999 | 139 (39.4%) | 19 (15.0%) |
| $150,000 or more | 85 (24.1%) | 33 (26.0%) |
| Total | 353 (100.0%) | 127 (100.0%) |
Monthly Housing Cost Tiers in Riesel
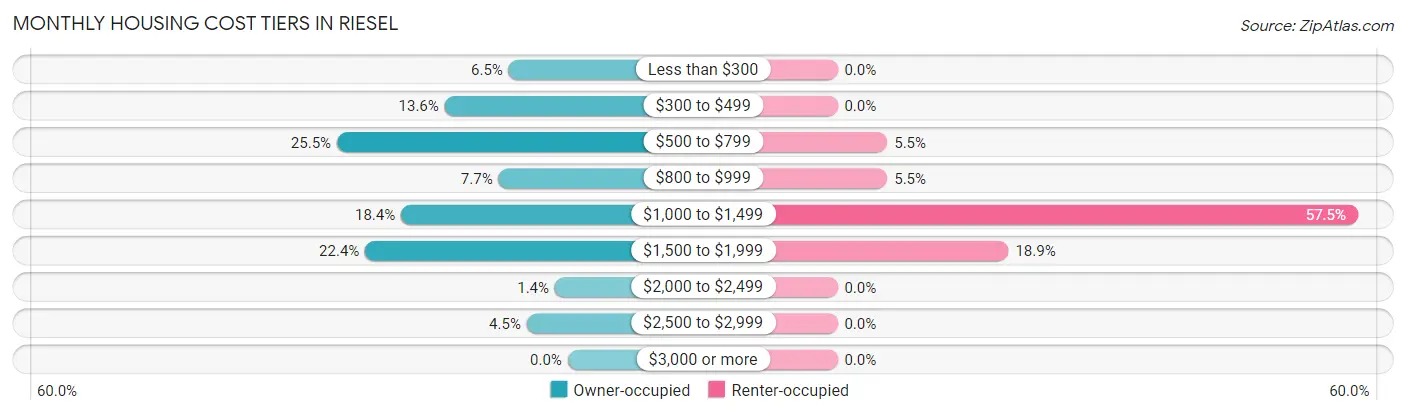
| Monthly Cost | Owner-occupied | Renter-occupied |
| Less than $300 | 23 (6.5%) | 0 (0.0%) |
| $300 to $499 | 48 (13.6%) | 0 (0.0%) |
| $500 to $799 | 90 (25.5%) | 7 (5.5%) |
| $800 to $999 | 27 (7.6%) | 7 (5.5%) |
| $1,000 to $1,499 | 65 (18.4%) | 73 (57.5%) |
| $1,500 to $1,999 | 79 (22.4%) | 24 (18.9%) |
| $2,000 to $2,499 | 5 (1.4%) | 0 (0.0%) |
| $2,500 to $2,999 | 16 (4.5%) | 0 (0.0%) |
| $3,000 or more | 0 (0.0%) | 0 (0.0%) |
| Total | 353 (100.0%) | 127 (100.0%) |
Physical Housing Characteristics in Riesel
Housing Structures in Riesel
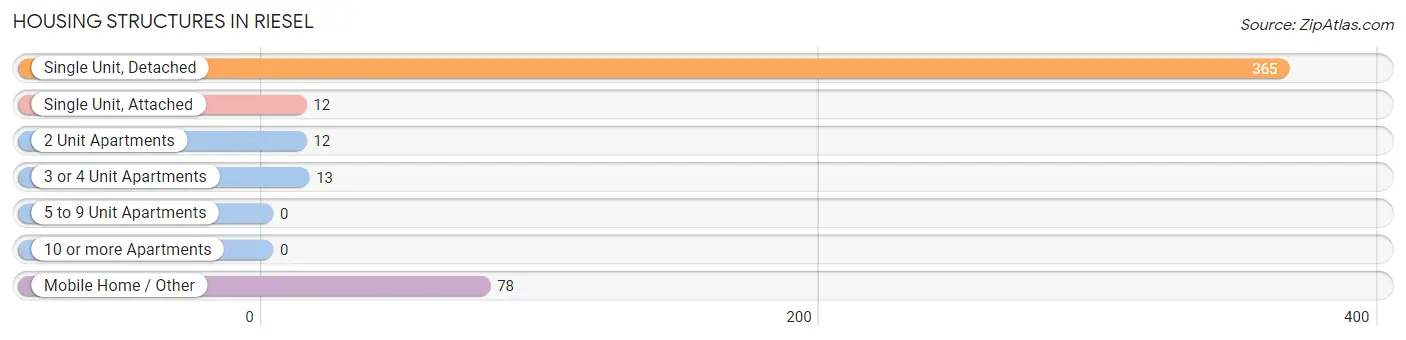
| Structure Type | # Housing Units | % Housing Units |
| Single Unit, Detached | 365 | 76.0% |
| Single Unit, Attached | 12 | 2.5% |
| 2 Unit Apartments | 12 | 2.5% |
| 3 or 4 Unit Apartments | 13 | 2.7% |
| 5 to 9 Unit Apartments | 0 | 0.0% |
| 10 or more Apartments | 0 | 0.0% |
| Mobile Home / Other | 78 | 16.3% |
| Total | 480 | 100.0% |
Housing Structures by Occupancy in Riesel
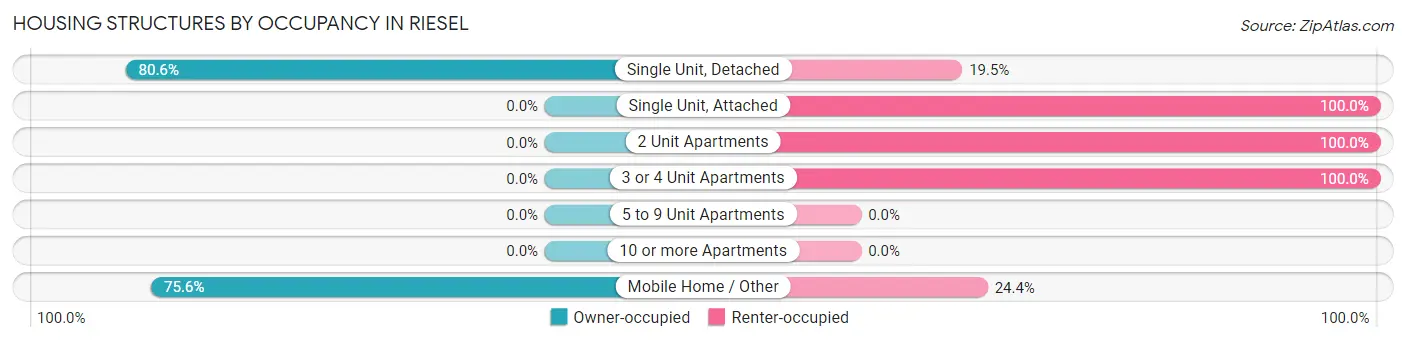
| Structure Type | Owner-occupied | Renter-occupied |
| Single Unit, Detached | 294 (80.5%) | 71 (19.5%) |
| Single Unit, Attached | 0 (0.0%) | 12 (100.0%) |
| 2 Unit Apartments | 0 (0.0%) | 12 (100.0%) |
| 3 or 4 Unit Apartments | 0 (0.0%) | 13 (100.0%) |
| 5 to 9 Unit Apartments | 0 (0.0%) | 0 (0.0%) |
| 10 or more Apartments | 0 (0.0%) | 0 (0.0%) |
| Mobile Home / Other | 59 (75.6%) | 19 (24.4%) |
| Total | 353 (73.5%) | 127 (26.5%) |
Housing Structures by Number of Rooms in Riesel
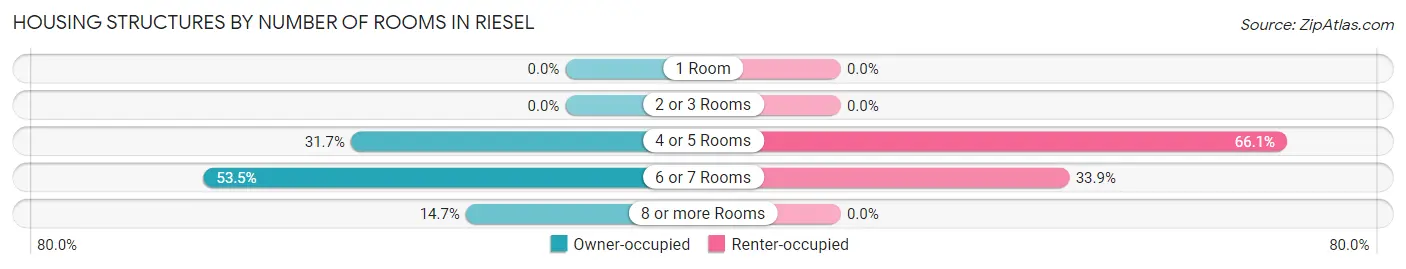
| Number of Rooms | Owner-occupied | Renter-occupied |
| 1 Room | 0 (0.0%) | 0 (0.0%) |
| 2 or 3 Rooms | 0 (0.0%) | 0 (0.0%) |
| 4 or 5 Rooms | 112 (31.7%) | 84 (66.1%) |
| 6 or 7 Rooms | 189 (53.5%) | 43 (33.9%) |
| 8 or more Rooms | 52 (14.7%) | 0 (0.0%) |
| Total | 353 (100.0%) | 127 (100.0%) |
Housing Structure by Heating Type in Riesel
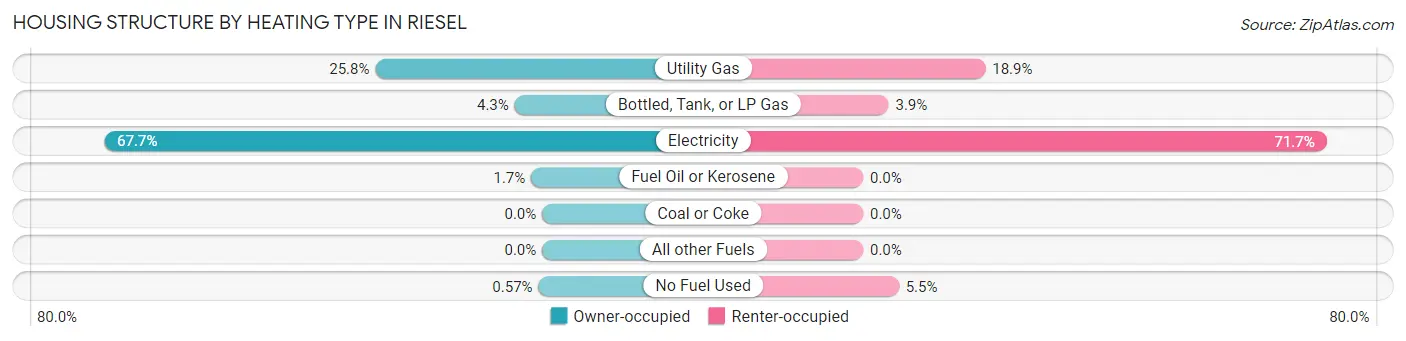
| Heating Type | Owner-occupied | Renter-occupied |
| Utility Gas | 91 (25.8%) | 24 (18.9%) |
| Bottled, Tank, or LP Gas | 15 (4.3%) | 5 (3.9%) |
| Electricity | 239 (67.7%) | 91 (71.7%) |
| Fuel Oil or Kerosene | 6 (1.7%) | 0 (0.0%) |
| Coal or Coke | 0 (0.0%) | 0 (0.0%) |
| All other Fuels | 0 (0.0%) | 0 (0.0%) |
| No Fuel Used | 2 (0.6%) | 7 (5.5%) |
| Total | 353 (100.0%) | 127 (100.0%) |
Household Vehicle Usage in Riesel
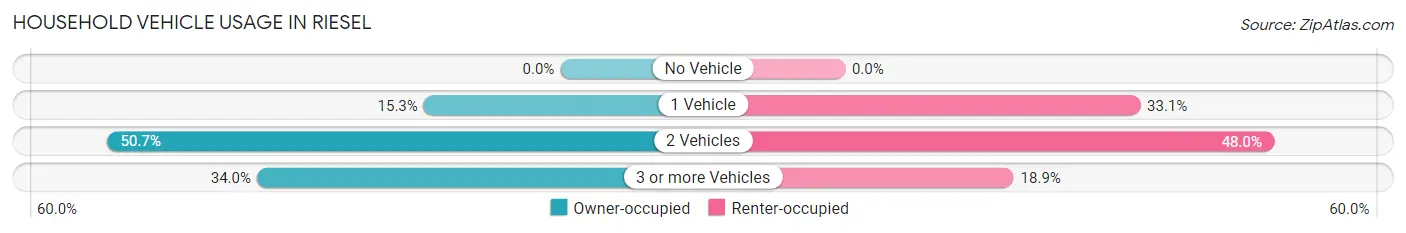
| Vehicles per Household | Owner-occupied | Renter-occupied |
| No Vehicle | 0 (0.0%) | 0 (0.0%) |
| 1 Vehicle | 54 (15.3%) | 42 (33.1%) |
| 2 Vehicles | 179 (50.7%) | 61 (48.0%) |
| 3 or more Vehicles | 120 (34.0%) | 24 (18.9%) |
| Total | 353 (100.0%) | 127 (100.0%) |
Real Estate & Mortgages in Riesel
Real Estate and Mortgage Overview in Riesel
| Characteristic | Without Mortgage | With Mortgage |
| Housing Units | 183 | 170 |
| Median Property Value | $62,000 | $177,600 |
| Median Household Income | $104,688 | $22 |
| Monthly Housing Costs | $538 | $0 |
| Real Estate Taxes | $1,010 | $10 |
Property Value by Mortgage Status in Riesel
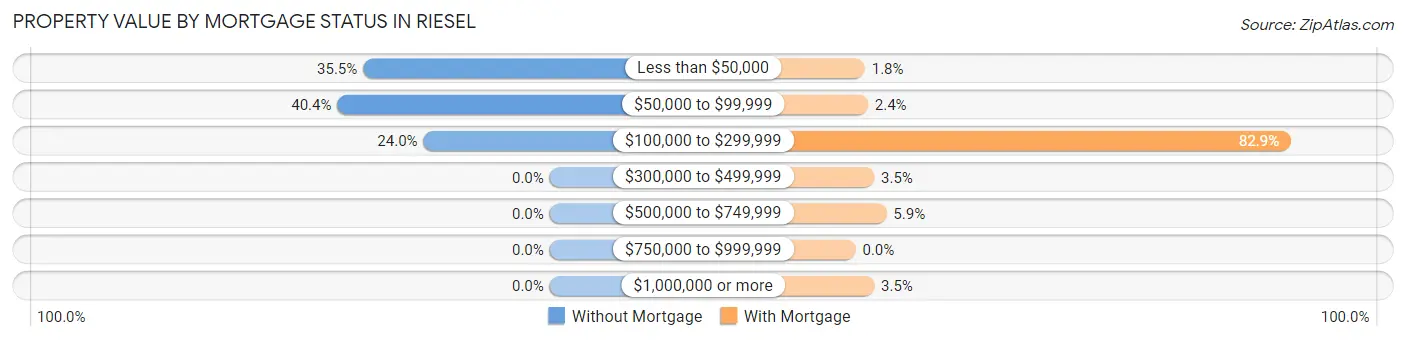
| Property Value | Without Mortgage | With Mortgage |
| Less than $50,000 | 65 (35.5%) | 3 (1.8%) |
| $50,000 to $99,999 | 74 (40.4%) | 4 (2.4%) |
| $100,000 to $299,999 | 44 (24.0%) | 141 (82.9%) |
| $300,000 to $499,999 | 0 (0.0%) | 6 (3.5%) |
| $500,000 to $749,999 | 0 (0.0%) | 10 (5.9%) |
| $750,000 to $999,999 | 0 (0.0%) | 0 (0.0%) |
| $1,000,000 or more | 0 (0.0%) | 6 (3.5%) |
| Total | 183 (100.0%) | 170 (100.0%) |
Household Income by Mortgage Status in Riesel
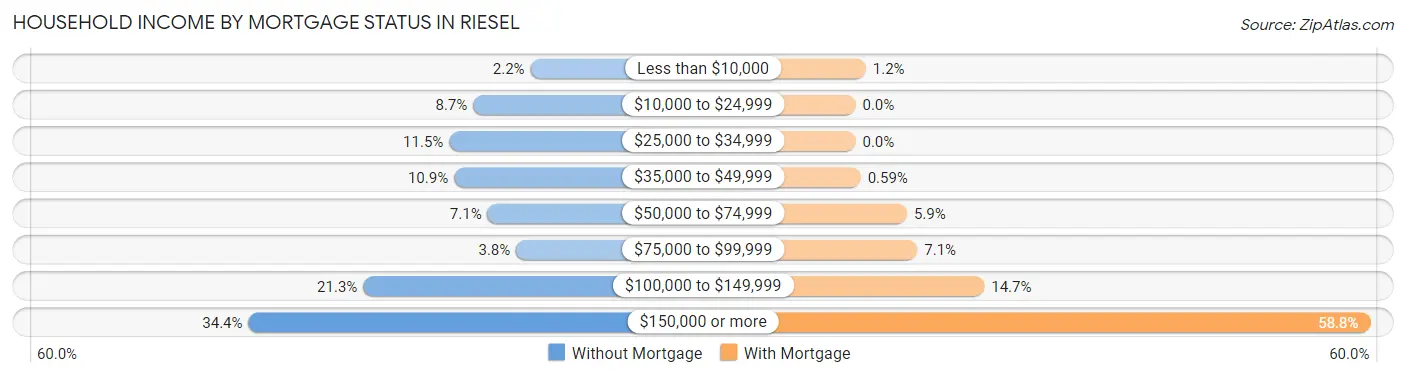
| Household Income | Without Mortgage | With Mortgage |
| Less than $10,000 | 4 (2.2%) | 2 (1.2%) |
| $10,000 to $24,999 | 16 (8.7%) | 0 (0.0%) |
| $25,000 to $34,999 | 21 (11.5%) | 0 (0.0%) |
| $35,000 to $49,999 | 20 (10.9%) | 1 (0.6%) |
| $50,000 to $74,999 | 13 (7.1%) | 10 (5.9%) |
| $75,000 to $99,999 | 7 (3.8%) | 12 (7.1%) |
| $100,000 to $149,999 | 39 (21.3%) | 25 (14.7%) |
| $150,000 or more | 63 (34.4%) | 100 (58.8%) |
| Total | 183 (100.0%) | 170 (100.0%) |
Property Value to Household Income Ratio in Riesel
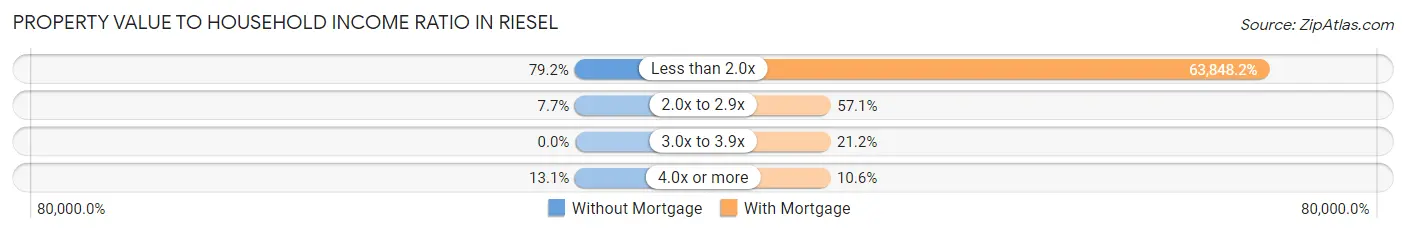
| Value-to-Income Ratio | Without Mortgage | With Mortgage |
| Less than 2.0x | 145 (79.2%) | 108,542 (63,848.2%) |
| 2.0x to 2.9x | 14 (7.6%) | 97 (57.1%) |
| 3.0x to 3.9x | 0 (0.0%) | 36 (21.2%) |
| 4.0x or more | 24 (13.1%) | 18 (10.6%) |
| Total | 183 (100.0%) | 170 (100.0%) |
Real Estate Taxes by Mortgage Status in Riesel
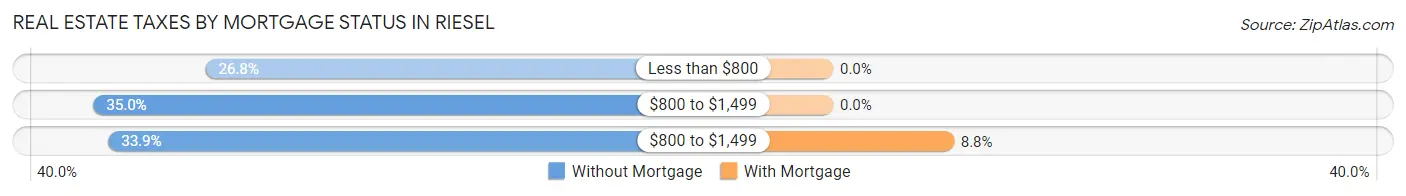
| Property Taxes | Without Mortgage | With Mortgage |
| Less than $800 | 49 (26.8%) | 0 (0.0%) |
| $800 to $1,499 | 64 (35.0%) | 0 (0.0%) |
| $800 to $1,499 | 62 (33.9%) | 15 (8.8%) |
| Total | 183 (100.0%) | 170 (100.0%) |
Health & Disability in Riesel
Health Insurance Coverage by Age in Riesel
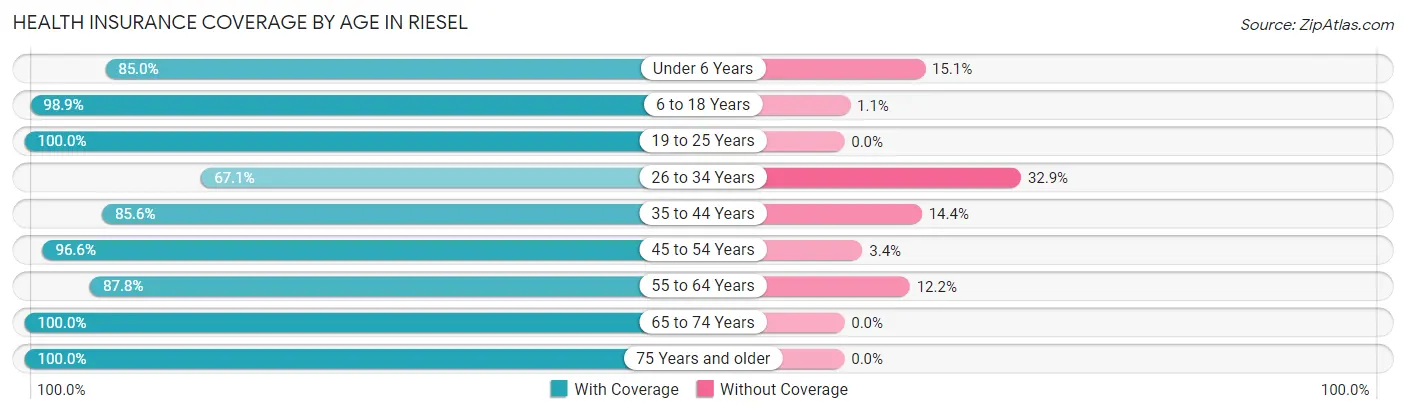
| Age Bracket | With Coverage | Without Coverage |
| Under 6 Years | 175 (85.0%) | 31 (15.0%) |
| 6 to 18 Years | 183 (98.9%) | 2 (1.1%) |
| 19 to 25 Years | 172 (100.0%) | 0 (0.0%) |
| 26 to 34 Years | 114 (67.1%) | 56 (32.9%) |
| 35 to 44 Years | 237 (85.6%) | 40 (14.4%) |
| 45 to 54 Years | 144 (96.6%) | 5 (3.4%) |
| 55 to 64 Years | 180 (87.8%) | 25 (12.2%) |
| 65 to 74 Years | 58 (100.0%) | 0 (0.0%) |
| 75 Years and older | 41 (100.0%) | 0 (0.0%) |
| Total | 1,304 (89.1%) | 159 (10.9%) |
Health Insurance Coverage by Citizenship Status in Riesel
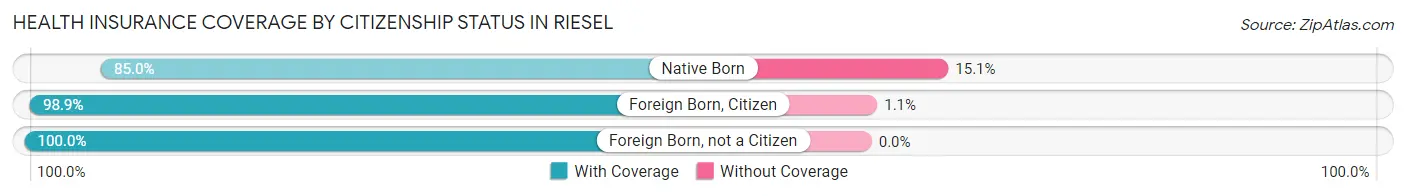
| Citizenship Status | With Coverage | Without Coverage |
| Native Born | 175 (85.0%) | 31 (15.0%) |
| Foreign Born, Citizen | 183 (98.9%) | 2 (1.1%) |
| Foreign Born, not a Citizen | 172 (100.0%) | 0 (0.0%) |
Health Insurance Coverage by Household Income in Riesel
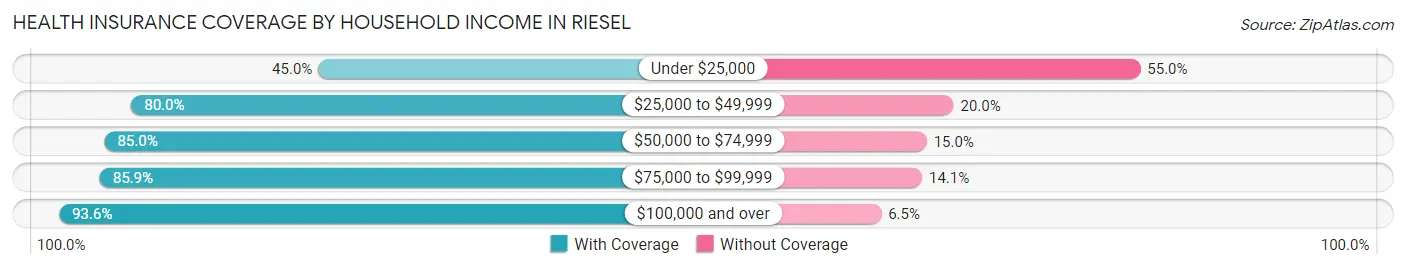
| Household Income | With Coverage | Without Coverage |
| Under $25,000 | 9 (45.0%) | 11 (55.0%) |
| $25,000 to $49,999 | 180 (80.0%) | 45 (20.0%) |
| $50,000 to $74,999 | 125 (85.0%) | 22 (15.0%) |
| $75,000 to $99,999 | 134 (85.9%) | 22 (14.1%) |
| $100,000 and over | 856 (93.5%) | 59 (6.5%) |
Public vs Private Health Insurance Coverage by Age in Riesel
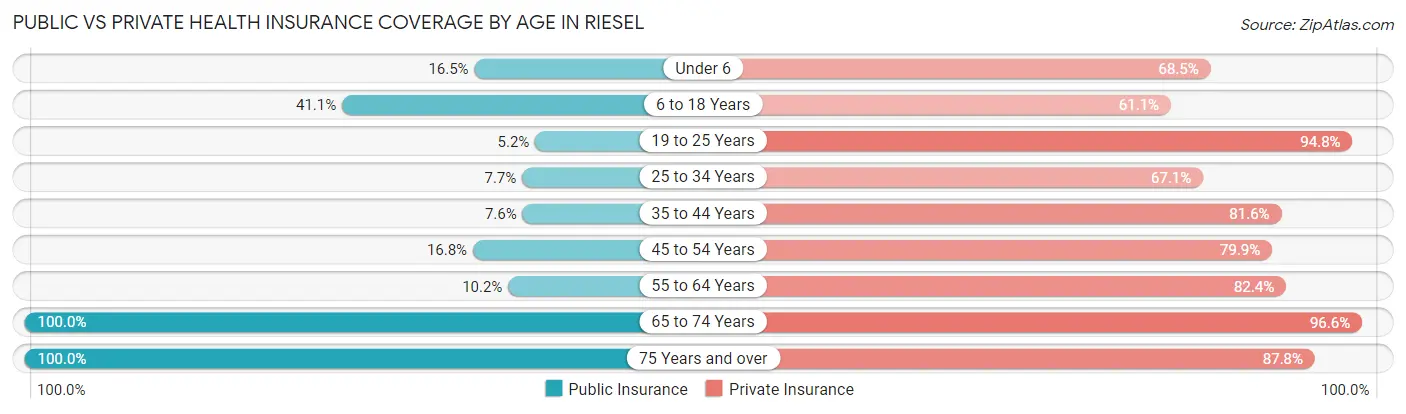
| Age Bracket | Public Insurance | Private Insurance |
| Under 6 | 34 (16.5%) | 141 (68.4%) |
| 6 to 18 Years | 76 (41.1%) | 113 (61.1%) |
| 19 to 25 Years | 9 (5.2%) | 163 (94.8%) |
| 25 to 34 Years | 13 (7.6%) | 114 (67.1%) |
| 35 to 44 Years | 21 (7.6%) | 226 (81.6%) |
| 45 to 54 Years | 25 (16.8%) | 119 (79.9%) |
| 55 to 64 Years | 21 (10.2%) | 169 (82.4%) |
| 65 to 74 Years | 58 (100.0%) | 56 (96.6%) |
| 75 Years and over | 41 (100.0%) | 36 (87.8%) |
| Total | 298 (20.4%) | 1,137 (77.7%) |
Disability Status by Sex by Age in Riesel
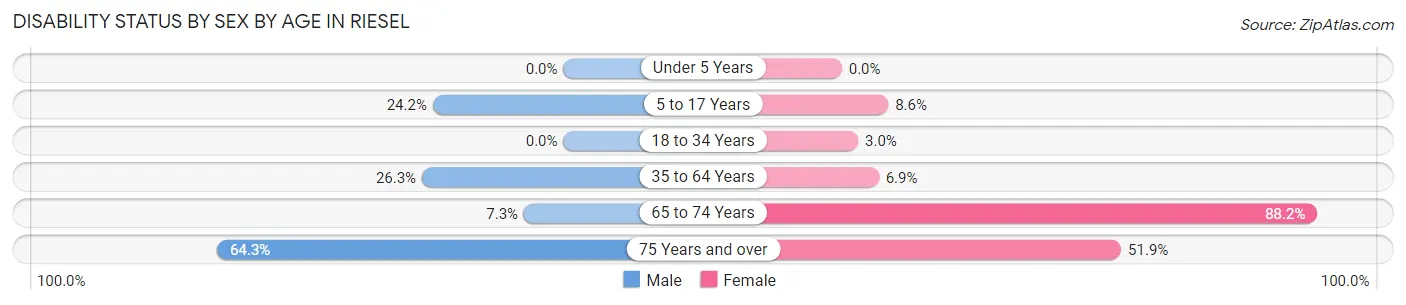
| Age Bracket | Male | Female |
| Under 5 Years | 0 (0.0%) | 0 (0.0%) |
| 5 to 17 Years | 16 (24.2%) | 10 (8.6%) |
| 18 to 34 Years | 0 (0.0%) | 4 (3.0%) |
| 35 to 64 Years | 89 (26.3%) | 20 (6.9%) |
| 65 to 74 Years | 3 (7.3%) | 15 (88.2%) |
| 75 Years and over | 9 (64.3%) | 14 (51.8%) |
Disability Class by Sex by Age in Riesel
Disability Class: Hearing Difficulty
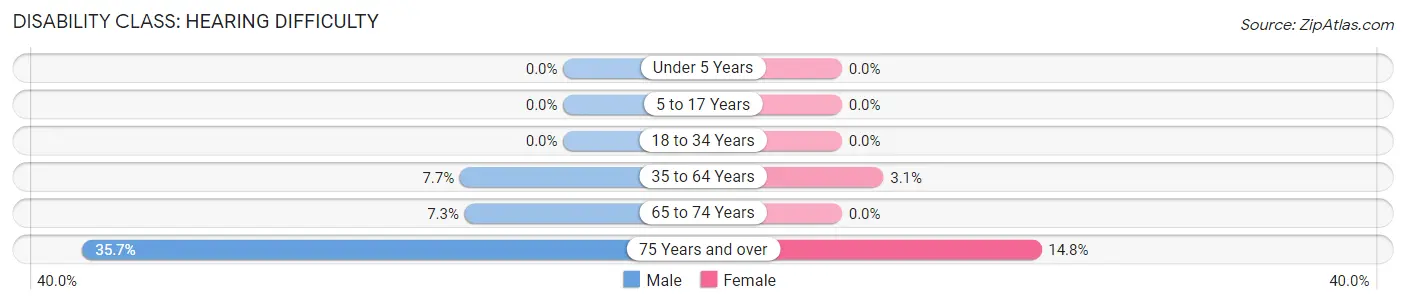
| Age Bracket | Male | Female |
| Under 5 Years | 0 (0.0%) | 0 (0.0%) |
| 5 to 17 Years | 0 (0.0%) | 0 (0.0%) |
| 18 to 34 Years | 0 (0.0%) | 0 (0.0%) |
| 35 to 64 Years | 26 (7.7%) | 9 (3.1%) |
| 65 to 74 Years | 3 (7.3%) | 0 (0.0%) |
| 75 Years and over | 5 (35.7%) | 4 (14.8%) |
Disability Class: Vision Difficulty
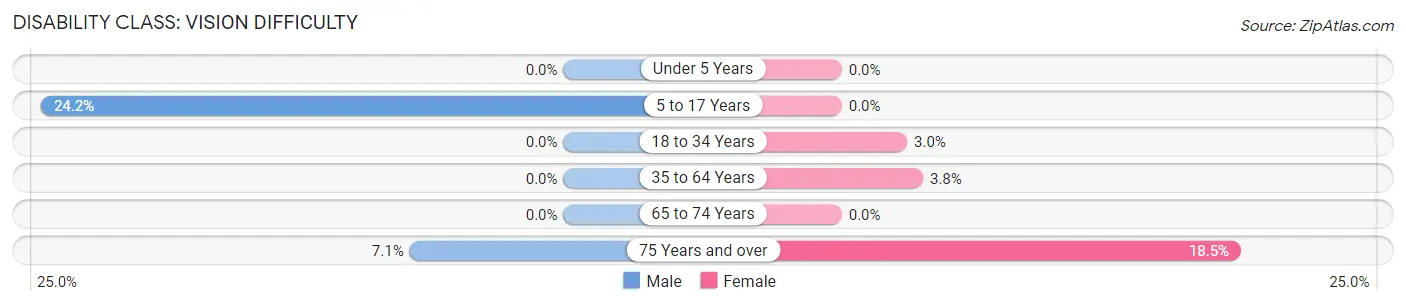
| Age Bracket | Male | Female |
| Under 5 Years | 0 (0.0%) | 0 (0.0%) |
| 5 to 17 Years | 16 (24.2%) | 0 (0.0%) |
| 18 to 34 Years | 0 (0.0%) | 4 (3.0%) |
| 35 to 64 Years | 0 (0.0%) | 11 (3.8%) |
| 65 to 74 Years | 0 (0.0%) | 0 (0.0%) |
| 75 Years and over | 1 (7.1%) | 5 (18.5%) |
Disability Class: Cognitive Difficulty
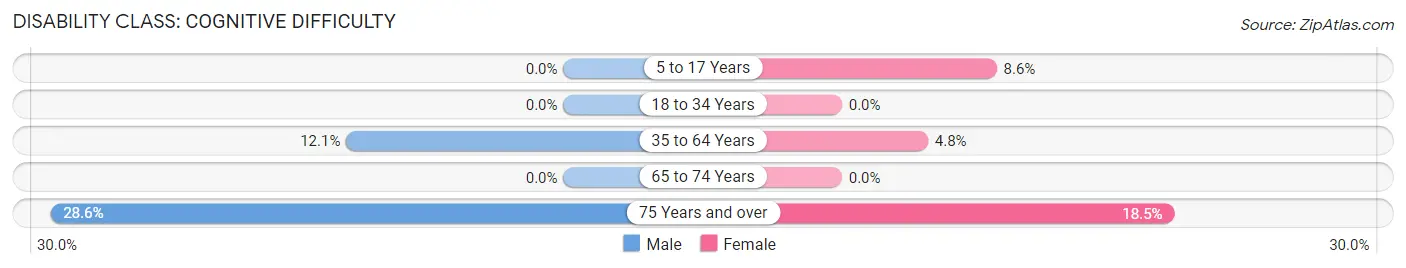
| Age Bracket | Male | Female |
| 5 to 17 Years | 0 (0.0%) | 10 (8.6%) |
| 18 to 34 Years | 0 (0.0%) | 0 (0.0%) |
| 35 to 64 Years | 41 (12.1%) | 14 (4.8%) |
| 65 to 74 Years | 0 (0.0%) | 0 (0.0%) |
| 75 Years and over | 4 (28.6%) | 5 (18.5%) |
Disability Class: Ambulatory Difficulty
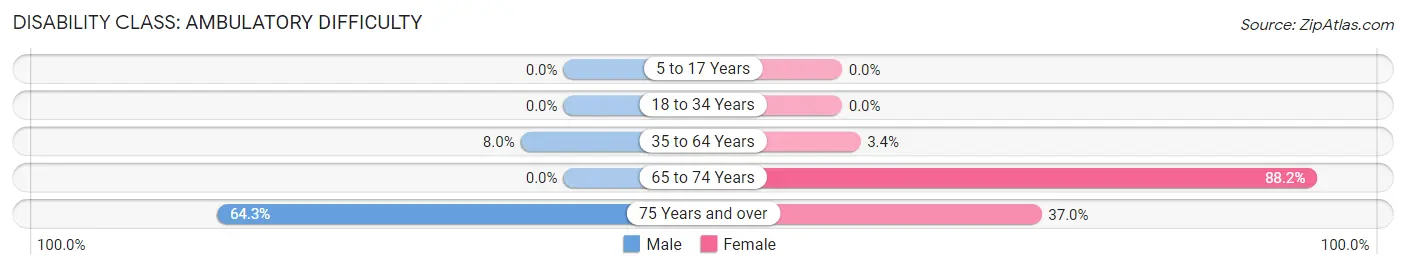
| Age Bracket | Male | Female |
| 5 to 17 Years | 0 (0.0%) | 0 (0.0%) |
| 18 to 34 Years | 0 (0.0%) | 0 (0.0%) |
| 35 to 64 Years | 27 (8.0%) | 10 (3.4%) |
| 65 to 74 Years | 0 (0.0%) | 15 (88.2%) |
| 75 Years and over | 9 (64.3%) | 10 (37.0%) |
Disability Class: Self-Care Difficulty
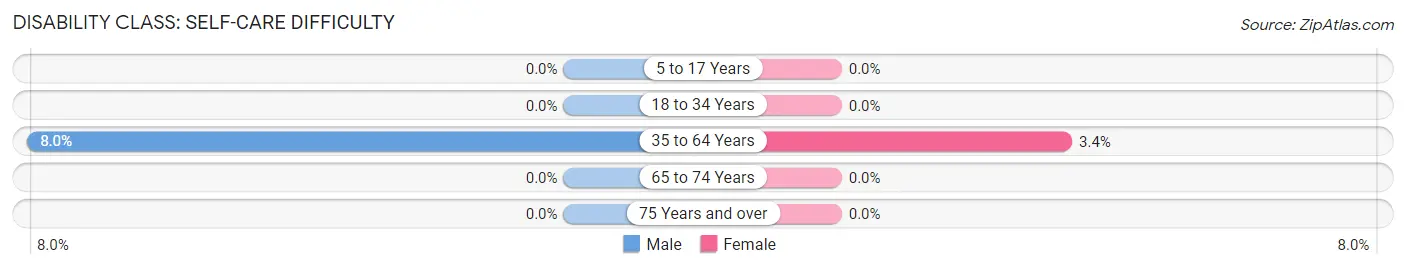
| Age Bracket | Male | Female |
| 5 to 17 Years | 0 (0.0%) | 0 (0.0%) |
| 18 to 34 Years | 0 (0.0%) | 0 (0.0%) |
| 35 to 64 Years | 27 (8.0%) | 10 (3.4%) |
| 65 to 74 Years | 0 (0.0%) | 0 (0.0%) |
| 75 Years and over | 0 (0.0%) | 0 (0.0%) |
Technology Access in Riesel
Computing Device Access in Riesel
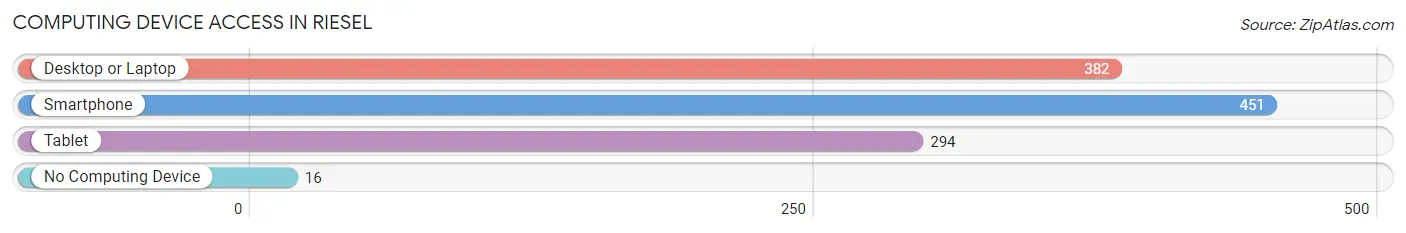
| Device Type | # Households | % Households |
| Desktop or Laptop | 382 | 79.6% |
| Smartphone | 451 | 94.0% |
| Tablet | 294 | 61.3% |
| No Computing Device | 16 | 3.3% |
| Total | 480 | 100.0% |
Internet Access in Riesel
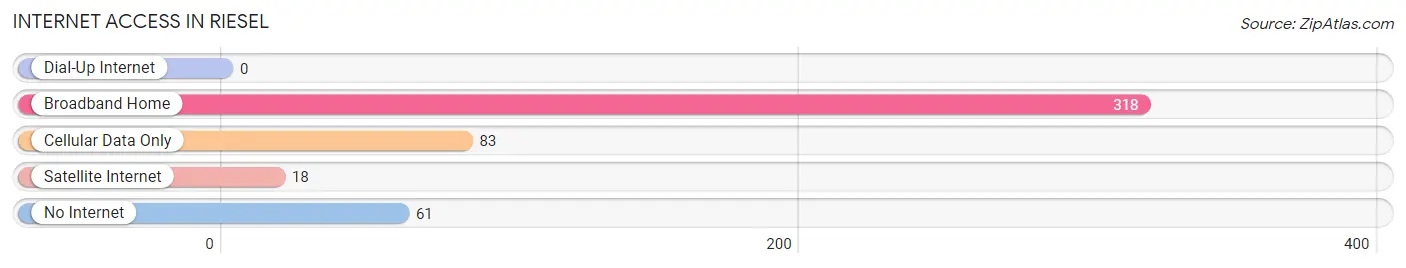
| Internet Type | # Households | % Households |
| Dial-Up Internet | 0 | 0.0% |
| Broadband Home | 318 | 66.2% |
| Cellular Data Only | 83 | 17.3% |
| Satellite Internet | 18 | 3.7% |
| No Internet | 61 | 12.7% |
| Total | 480 | 100.0% |
Riesel Summary
Riesel is a small town located in McLennan County, Texas, United States. The population was 1,072 at the 2010 census. It is part of the Waco Metropolitan Statistical Area.
History
Riesel was founded in 1881 by German immigrants who had settled in the area. The town was named after a local farmer, John Riesel. The town was incorporated in 1891 and the first post office was established in 1892.
Riesel was a farming community until the early 1900s when the railroad came through. This allowed the town to become a shipping point for cotton, grain, and other agricultural products. The town also had a cotton gin, a blacksmith shop, and a general store.
In the 1920s, the town began to grow and the population increased to over 500. The town had a bank, a hotel, a movie theater, and several other businesses.
In the 1950s, the town began to decline as the railroad stopped running and the population decreased. The town was almost abandoned by the 1970s.
Geography
Riesel is located at 31 25 45 North 97 7 45 West 31 429167 97 129028
According to the United States Census Bureau, the town has a total area of 0.7 square miles (1.8 km2), all of it land.
Economy
Riesel is a small, rural town with a population of 1,072. The town is primarily agricultural, with cotton, grain, and other crops being the main sources of income.
The town also has a few small businesses, including a gas station, a convenience store, and a few restaurants.
Demographics
As of the census of 2000, there were 1,072 people, 393 households, and 287 families residing in the town. The population density was 1,521.2 people per square mile (586.2/km2). There were 431 housing units at an average density of 614.3 per square mile (236.3/km2). The racial makeup of the town was 81.2% White, 15.2% African American, 0.7% Native American, 0.4% Asian, 0.4% from other races, and 2.1% from two or more races. Hispanic or Latino of any race were 2.3% of the population.
There were 393 households, out of which 33.7% had children under the age of 18 living with them, 57.2% were married couples living together, 11.2% had a female householder with no husband present, and 27.2% were non-families. 24.3% of all households were made up of individuals, and 12.2% had someone living alone who was 65 years of age or older. The average household size was 2.63 and the average family size was 3.13.
In the town, the population was spread out, with 27.2% under the age of 18, 8.2% from 18 to 24, 27.2% from 25 to 44, 22.2% from 45 to 64, and 15.2% who were 65 years of age or older. The median age was 36 years. For every 100 females, there were 94.2 males. For every 100 females age 18 and over, there were 88.2 males.
The median income for a household in the town was $31,250, and the median income for a family was $36,250. Males had a median income of $30,000 versus $20,000 for females. The per capita income for the town was $14,845. About 11.2% of families and 14.2% of the population were below the poverty line, including 17.2% of those under age 18 and 10.2% of those age 65 or over.
Common Questions
What is Per Capita Income in Riesel?
Per Capita income in Riesel is $37,331.
What is the Median Family Income in Riesel?
Median Family Income in Riesel is $107,784.
What is the Median Household income in Riesel?
Median Household Income in Riesel is $106,216.
What is Income or Wage Gap in Riesel?
Income or Wage Gap in Riesel is 30.7%.
Women in Riesel earn 69.3 cents for every dollar earned by a man.
What is Inequality or Gini Index in Riesel?
Inequality or Gini Index in Riesel is 0.32.
What is the Total Population of Riesel?
Total Population of Riesel is 1,463.
What is the Total Male Population of Riesel?
Total Male Population of Riesel is 786.
What is the Total Female Population of Riesel?
Total Female Population of Riesel is 677.
What is the Ratio of Males per 100 Females in Riesel?
There are 116.10 Males per 100 Females in Riesel.
What is the Ratio of Females per 100 Males in Riesel?
There are 86.13 Females per 100 Males in Riesel.
What is the Median Population Age in Riesel?
Median Population Age in Riesel is 35.0 Years.
What is the Average Family Size in Riesel
Average Family Size in Riesel is 3.3 People.
What is the Average Household Size in Riesel
Average Household Size in Riesel is 3.0 People.
How Large is the Labor Force in Riesel?
There are 837 People in the Labor Forcein in Riesel.
What is the Percentage of People in the Labor Force in Riesel?
76.4% of People are in the Labor Force in Riesel.