Rice, TX Map & Demographics
Rice Map
Rice Overview
$21,432
PER CAPITA INCOME
$78,250
AVG FAMILY INCOME
$72,969
AVG HOUSEHOLD INCOME
52.7%
WAGE / INCOME GAP [ % ]
47.3¢/ $1
WAGE / INCOME GAP [ $ ]
0.33
INEQUALITY / GINI INDEX
1,119
TOTAL POPULATION
489
MALE POPULATION
630
FEMALE POPULATION
77.62
MALES / 100 FEMALES
128.83
FEMALES / 100 MALES
30.3
MEDIAN AGE
3.8
AVG FAMILY SIZE
3.4
AVG HOUSEHOLD SIZE
552
LABOR FORCE [ PEOPLE ]
70.4%
PERCENT IN LABOR FORCE
1.9%
UNEMPLOYMENT RATE
Rice Zip Codes
Rice Area Codes
Income in Rice
Income Overview in Rice
Per Capita Income in Rice is $21,432, while median incomes of families and households are $78,250 and $72,969 respectively.
| Characteristic | Number | Measure |
| Per Capita Income | 1,119 | $21,432 |
| Median Family Income | 264 | $78,250 |
| Mean Family Income | 264 | $72,169 |
| Median Household Income | 334 | $72,969 |
| Mean Household Income | 334 | $69,574 |
| Income Deficit | 264 | $0 |
| Wage / Income Gap (%) | 1,119 | 52.66% |
| Wage / Income Gap ($) | 1,119 | 47.34¢ per $1 |
| Gini / Inequality Index | 1,119 | 0.33 |
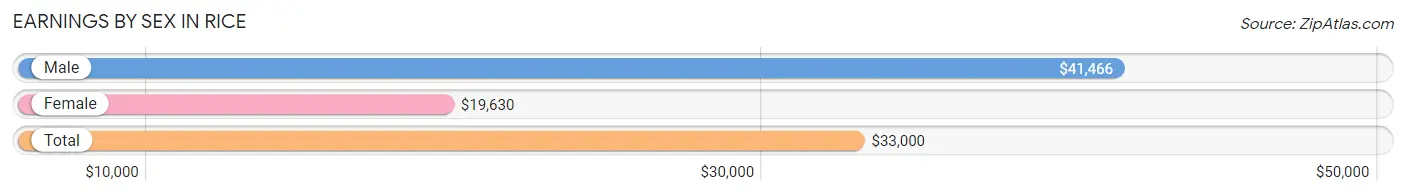
Earnings by Sex in Rice
Average Earnings in Rice are $33,000, $41,466 for men and $19,630 for women, a difference of 52.7%.
| Sex | Number | Average Earnings |
| Male | 320 (55.7%) | $41,466 |
| Female | 254 (44.3%) | $19,630 |
| Total | 574 (100.0%) | $33,000 |
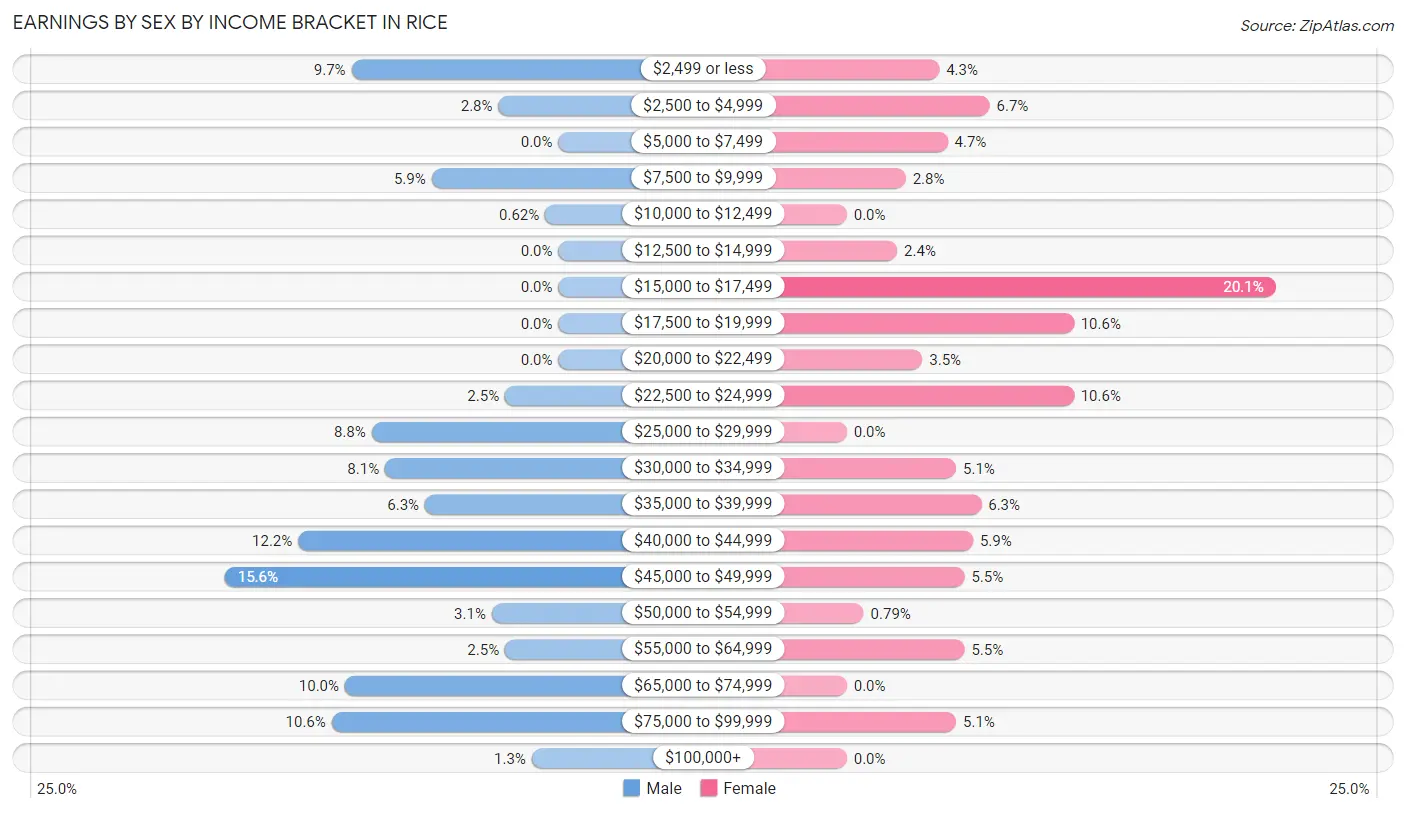
Earnings by Sex by Income Bracket in Rice
The most common earnings brackets in Rice are $45,000 to $49,999 for men (50 | 15.6%) and $15,000 to $17,499 for women (51 | 20.1%).
| Income | Male | Female |
| $2,499 or less | 31 (9.7%) | 11 (4.3%) |
| $2,500 to $4,999 | 9 (2.8%) | 17 (6.7%) |
| $5,000 to $7,499 | 0 (0.0%) | 12 (4.7%) |
| $7,500 to $9,999 | 19 (5.9%) | 7 (2.8%) |
| $10,000 to $12,499 | 2 (0.6%) | 0 (0.0%) |
| $12,500 to $14,999 | 0 (0.0%) | 6 (2.4%) |
| $15,000 to $17,499 | 0 (0.0%) | 51 (20.1%) |
| $17,500 to $19,999 | 0 (0.0%) | 27 (10.6%) |
| $20,000 to $22,499 | 0 (0.0%) | 9 (3.5%) |
| $22,500 to $24,999 | 8 (2.5%) | 27 (10.6%) |
| $25,000 to $29,999 | 28 (8.7%) | 0 (0.0%) |
| $30,000 to $34,999 | 26 (8.1%) | 13 (5.1%) |
| $35,000 to $39,999 | 20 (6.2%) | 16 (6.3%) |
| $40,000 to $44,999 | 39 (12.2%) | 15 (5.9%) |
| $45,000 to $49,999 | 50 (15.6%) | 14 (5.5%) |
| $50,000 to $54,999 | 10 (3.1%) | 2 (0.8%) |
| $55,000 to $64,999 | 8 (2.5%) | 14 (5.5%) |
| $65,000 to $74,999 | 32 (10.0%) | 0 (0.0%) |
| $75,000 to $99,999 | 34 (10.6%) | 13 (5.1%) |
| $100,000+ | 4 (1.3%) | 0 (0.0%) |
| Total | 320 (100.0%) | 254 (100.0%) |
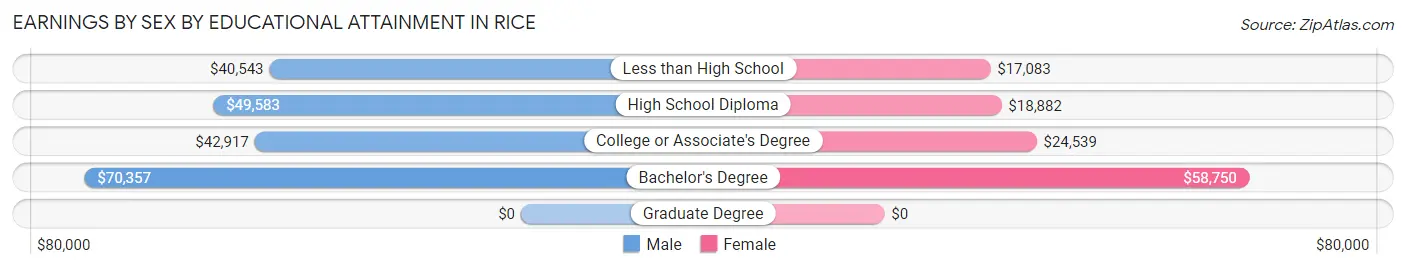
Earnings by Sex by Educational Attainment in Rice
Average earnings in Rice are $45,000 for men and $22,500 for women, a difference of 50.0%. Men with an educational attainment of bachelor's degree enjoy the highest average annual earnings of $70,357, while those with less than high school education earn the least with $40,543. Women with an educational attainment of bachelor's degree earn the most with the average annual earnings of $58,750, while those with less than high school education have the smallest earnings of $17,083.
| Educational Attainment | Male Income | Female Income |
| Less than High School | $40,543 | $17,083 |
| High School Diploma | $49,583 | $18,882 |
| College or Associate's Degree | $42,917 | $24,539 |
| Bachelor's Degree | $70,357 | $58,750 |
| Graduate Degree | - | - |
| Total | $45,000 | $22,500 |
Family Income in Rice
Family Income Brackets in Rice
According to the Rice family income data, there are 78 families falling into the $75,000 to $99,999 income range, which is the most common income bracket and makes up 29.5% of all families.
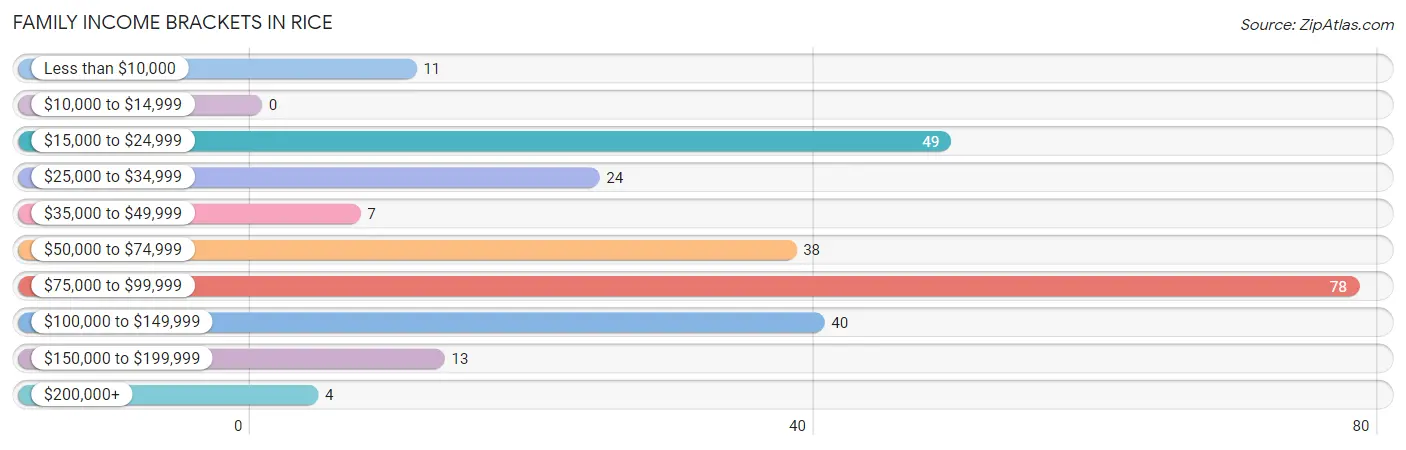
| Income Bracket | # Families | % Families |
| Less than $10,000 | 11 | 4.2% |
| $10,000 to $14,999 | 0 | 0.0% |
| $15,000 to $24,999 | 49 | 18.6% |
| $25,000 to $34,999 | 24 | 9.1% |
| $35,000 to $49,999 | 7 | 2.7% |
| $50,000 to $74,999 | 38 | 14.4% |
| $75,000 to $99,999 | 78 | 29.5% |
| $100,000 to $149,999 | 40 | 15.2% |
| $150,000 to $199,999 | 13 | 4.9% |
| $200,000+ | 4 | 1.5% |
Family Income by Famaliy Size in Rice
4-person families (35 | 13.3%) account for the highest median family income in Rice with $85,673 per family, while 2-person families (96 | 36.4%) have the highest median income of $31,875 per family member.
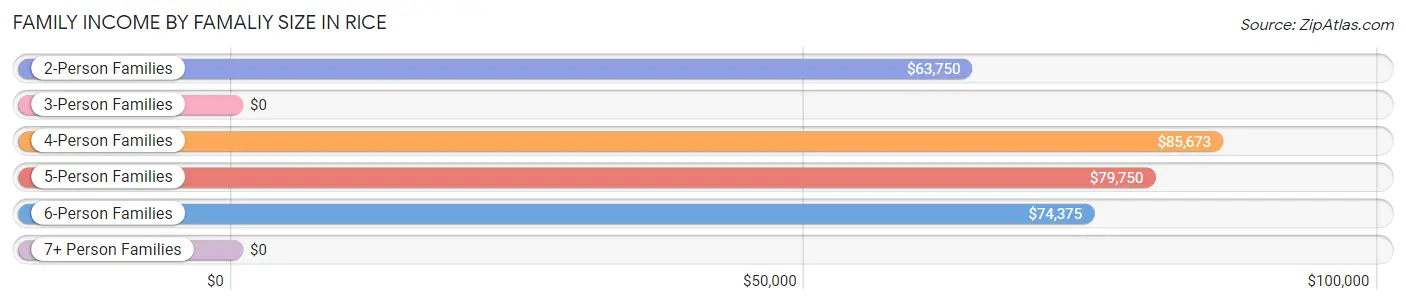
| Income Bracket | # Families | Median Income |
| 2-Person Families | 96 (36.4%) | $63,750 |
| 3-Person Families | 73 (27.7%) | $0 |
| 4-Person Families | 35 (13.3%) | $85,673 |
| 5-Person Families | 22 (8.3%) | $79,750 |
| 6-Person Families | 25 (9.5%) | $74,375 |
| 7+ Person Families | 13 (4.9%) | $0 |
| Total | 264 (100.0%) | $78,250 |
Family Income by Number of Earners in Rice
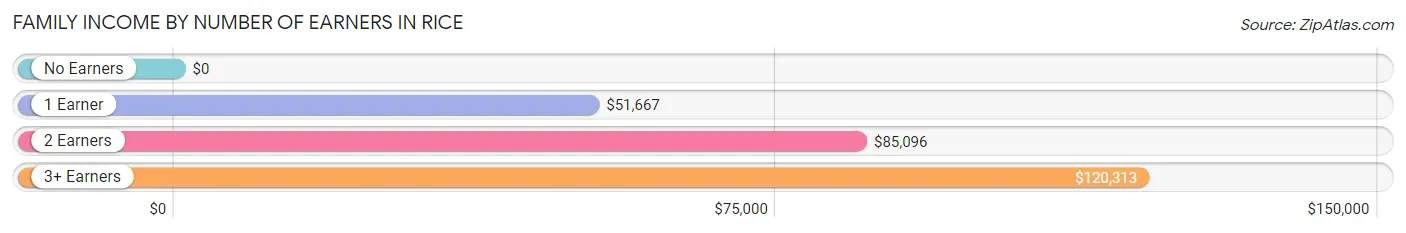
| Number of Earners | # Families | Median Income |
| No Earners | 19 (7.2%) | $0 |
| 1 Earner | 98 (37.1%) | $51,667 |
| 2 Earners | 113 (42.8%) | $85,096 |
| 3+ Earners | 34 (12.9%) | $120,313 |
| Total | 264 (100.0%) | $78,250 |
Household Income in Rice
Household Income Brackets in Rice
With 87 households falling in the category, the $75,000 to $99,999 income range is the most frequent in Rice, accounting for 26.1% of all households.
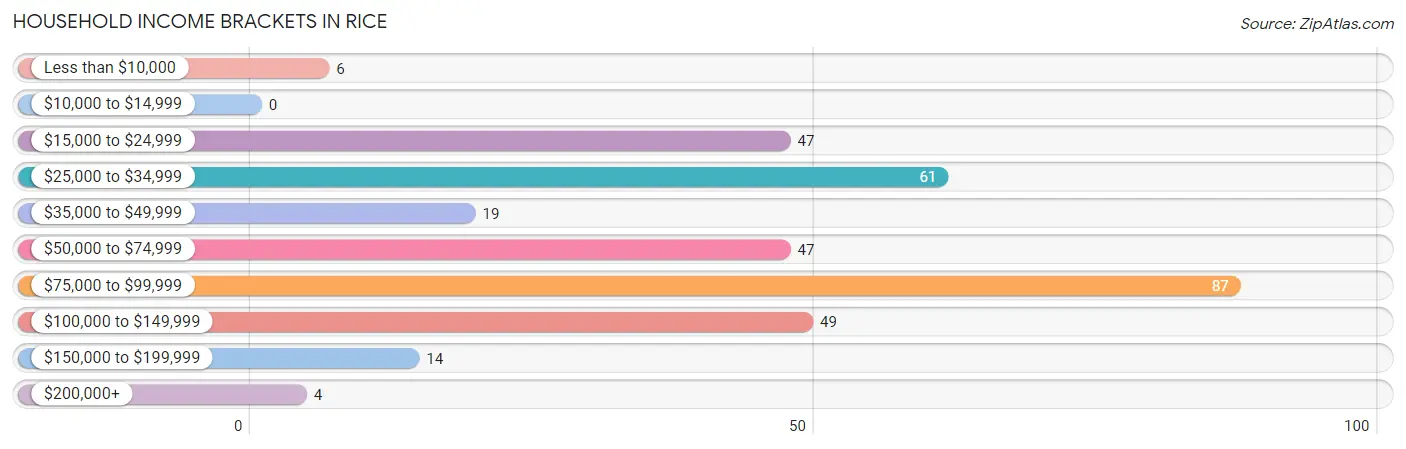
| Income Bracket | # Households | % Households |
| Less than $10,000 | 6 | 1.8% |
| $10,000 to $14,999 | 0 | 0.0% |
| $15,000 to $24,999 | 47 | 14.1% |
| $25,000 to $34,999 | 61 | 18.3% |
| $35,000 to $49,999 | 19 | 5.7% |
| $50,000 to $74,999 | 47 | 14.1% |
| $75,000 to $99,999 | 87 | 26.0% |
| $100,000 to $149,999 | 49 | 14.7% |
| $150,000 to $199,999 | 14 | 4.2% |
| $200,000+ | 4 | 1.2% |
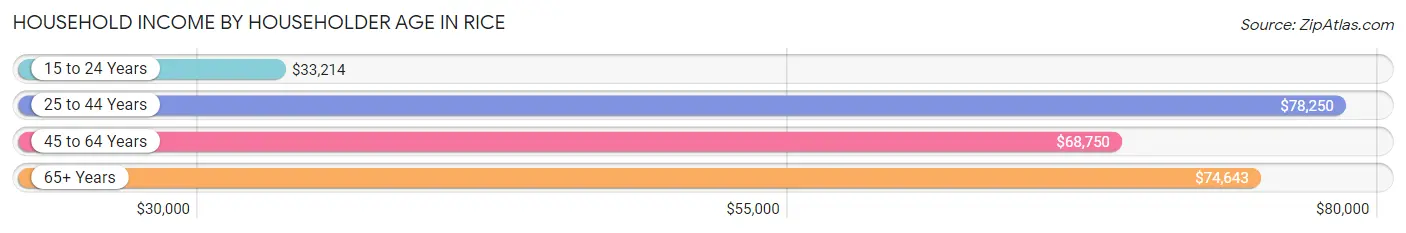
Household Income by Householder Age in Rice
The median household income in Rice is $72,969, with the highest median household income of $78,250 found in the 25 to 44 years age bracket for the primary householder. A total of 128 households (38.3%) fall into this category. Meanwhile, the 15 to 24 years age bracket for the primary householder has the lowest median household income of $33,214, with 26 households (7.8%) in this group.
| Income Bracket | # Households | Median Income |
| 15 to 24 Years | 26 (7.8%) | $33,214 |
| 25 to 44 Years | 128 (38.3%) | $78,250 |
| 45 to 64 Years | 124 (37.1%) | $68,750 |
| 65+ Years | 56 (16.8%) | $74,643 |
| Total | 334 (100.0%) | $72,969 |
Poverty in Rice
Income Below Poverty by Sex and Age in Rice
With 6.3% poverty level for males and 19.8% for females among the residents of Rice, 18 to 24 year old males and 12 to 14 year old females are the most vulnerable to poverty, with 18 males (36.0%) and 15 females (68.2%) in their respective age groups living below the poverty level.
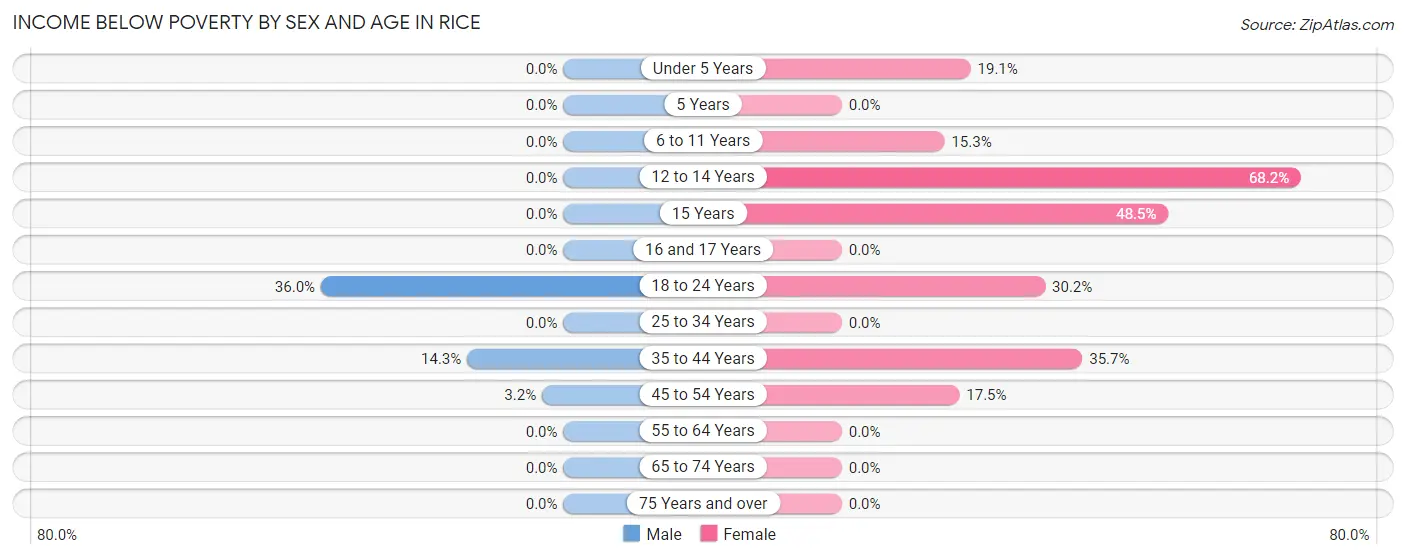
| Age Bracket | Male | Female |
| Under 5 Years | 0 (0.0%) | 22 (19.1%) |
| 5 Years | 0 (0.0%) | 0 (0.0%) |
| 6 to 11 Years | 0 (0.0%) | 9 (15.2%) |
| 12 to 14 Years | 0 (0.0%) | 15 (68.2%) |
| 15 Years | 0 (0.0%) | 16 (48.5%) |
| 16 and 17 Years | 0 (0.0%) | 0 (0.0%) |
| 18 to 24 Years | 18 (36.0%) | 16 (30.2%) |
| 25 to 34 Years | 0 (0.0%) | 0 (0.0%) |
| 35 to 44 Years | 11 (14.3%) | 35 (35.7%) |
| 45 to 54 Years | 2 (3.2%) | 11 (17.5%) |
| 55 to 64 Years | 0 (0.0%) | 0 (0.0%) |
| 65 to 74 Years | 0 (0.0%) | 0 (0.0%) |
| 75 Years and over | 0 (0.0%) | 0 (0.0%) |
| Total | 31 (6.3%) | 124 (19.8%) |
Income Above Poverty by Sex and Age in Rice
According to the poverty statistics in Rice, males aged under 5 years and females aged 16 and 17 years are the age groups that are most secure financially, with 100.0% of males and 100.0% of females in these age groups living above the poverty line.
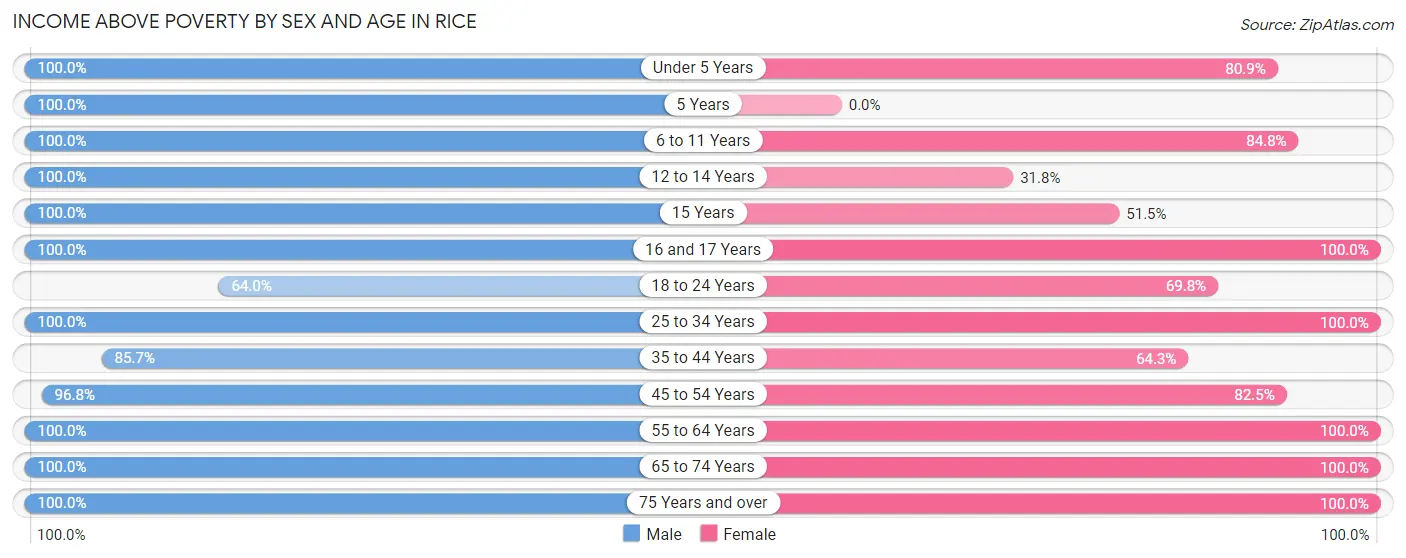
| Age Bracket | Male | Female |
| Under 5 Years | 49 (100.0%) | 93 (80.9%) |
| 5 Years | 4 (100.0%) | 0 (0.0%) |
| 6 to 11 Years | 27 (100.0%) | 50 (84.8%) |
| 12 to 14 Years | 23 (100.0%) | 7 (31.8%) |
| 15 Years | 1 (100.0%) | 17 (51.5%) |
| 16 and 17 Years | 1 (100.0%) | 14 (100.0%) |
| 18 to 24 Years | 32 (64.0%) | 37 (69.8%) |
| 25 to 34 Years | 79 (100.0%) | 75 (100.0%) |
| 35 to 44 Years | 66 (85.7%) | 63 (64.3%) |
| 45 to 54 Years | 61 (96.8%) | 52 (82.5%) |
| 55 to 64 Years | 75 (100.0%) | 64 (100.0%) |
| 65 to 74 Years | 34 (100.0%) | 27 (100.0%) |
| 75 Years and over | 6 (100.0%) | 5 (100.0%) |
| Total | 458 (93.7%) | 504 (80.2%) |
Income Below Poverty Among Married-Couple Families in Rice
The poverty statistics for married-couple families in Rice show that 4.2% or 7 of the total 167 families live below the poverty line. Families with 3 or 4 children have the highest poverty rate of 16.1%, comprising of 5 families. On the other hand, families with 1 or 2 children have the lowest poverty rate of 0.0%, which includes 0 families.
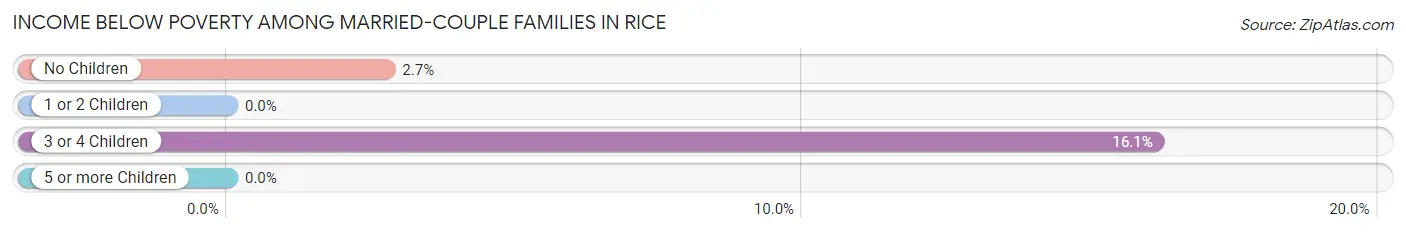
| Children | Above Poverty | Below Poverty |
| No Children | 71 (97.3%) | 2 (2.7%) |
| 1 or 2 Children | 63 (100.0%) | 0 (0.0%) |
| 3 or 4 Children | 26 (83.9%) | 5 (16.1%) |
| 5 or more Children | 0 (0.0%) | 0 (0.0%) |
| Total | 160 (95.8%) | 7 (4.2%) |
Income Below Poverty Among Single-Parent Households in Rice
According to the poverty data in Rice, 33.3% or 20 single-father households and 64.9% or 24 single-mother households are living below the poverty line. Among single-father households, those with 1 or 2 children have the highest poverty rate, with 14 households (73.7%) experiencing poverty. Likewise, among single-mother households, those with 1 or 2 children have the highest poverty rate, with 17 households (89.5%) falling below the poverty line.
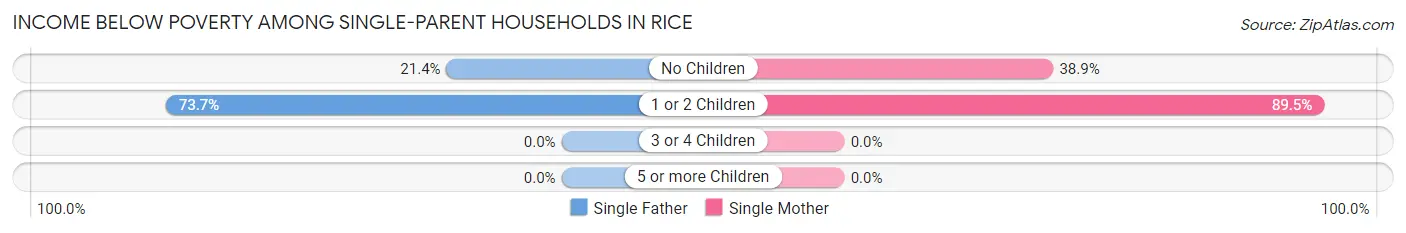
| Children | Single Father | Single Mother |
| No Children | 6 (21.4%) | 7 (38.9%) |
| 1 or 2 Children | 14 (73.7%) | 17 (89.5%) |
| 3 or 4 Children | 0 (0.0%) | 0 (0.0%) |
| 5 or more Children | 0 (0.0%) | 0 (0.0%) |
| Total | 20 (33.3%) | 24 (64.9%) |
Income Below Poverty Among Married-Couple vs Single-Parent Households in Rice
The poverty data for Rice shows that 7 of the married-couple family households (4.2%) and 44 of the single-parent households (45.4%) are living below the poverty level. Within the married-couple family households, those with 3 or 4 children have the highest poverty rate, with 5 households (16.1%) falling below the poverty line. Among the single-parent households, those with 1 or 2 children have the highest poverty rate, with 31 household (81.6%) living below poverty.
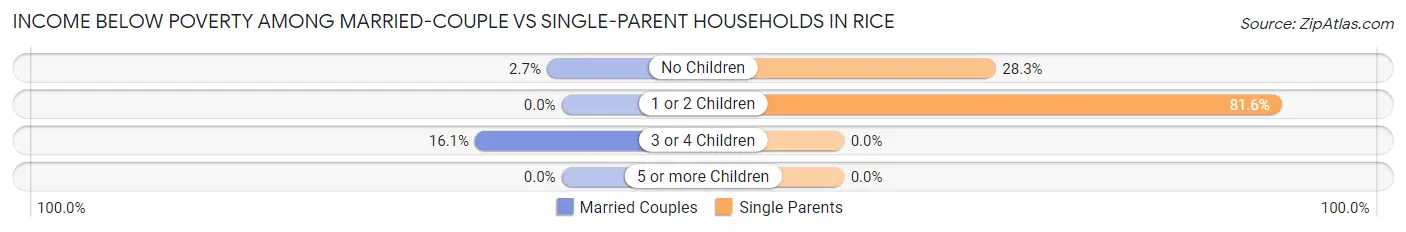
| Children | Married-Couple Families | Single-Parent Households |
| No Children | 2 (2.7%) | 13 (28.3%) |
| 1 or 2 Children | 0 (0.0%) | 31 (81.6%) |
| 3 or 4 Children | 5 (16.1%) | 0 (0.0%) |
| 5 or more Children | 0 (0.0%) | 0 (0.0%) |
| Total | 7 (4.2%) | 44 (45.4%) |
Race in Rice
The most populous races in Rice are White / Caucasian (635 | 56.8%), Hispanic or Latino (469 | 41.9%), and Black / African American (216 | 19.3%).
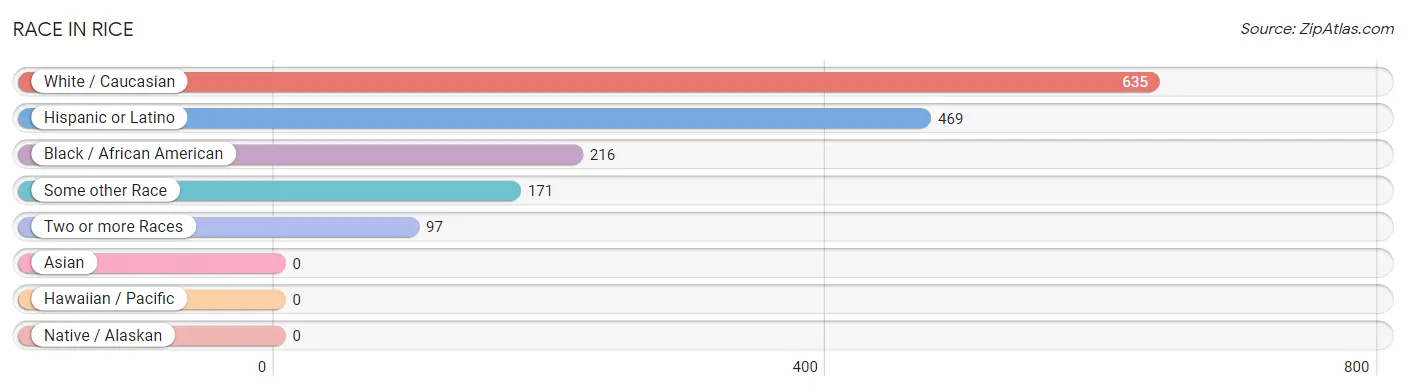
| Race | # Population | % Population |
| Asian | 0 | 0.0% |
| Black / African American | 216 | 19.3% |
| Hawaiian / Pacific | 0 | 0.0% |
| Hispanic or Latino | 469 | 41.9% |
| Native / Alaskan | 0 | 0.0% |
| White / Caucasian | 635 | 56.8% |
| Two or more Races | 97 | 8.7% |
| Some other Race | 171 | 15.3% |
| Total | 1,119 | 100.0% |
Ancestry in Rice
The most populous ancestries reported in Rice are Mexican (460 | 41.1%), Irish (106 | 9.5%), German (81 | 7.2%), American (53 | 4.7%), and Czech (45 | 4.0%), together accounting for 66.6% of all Rice residents.
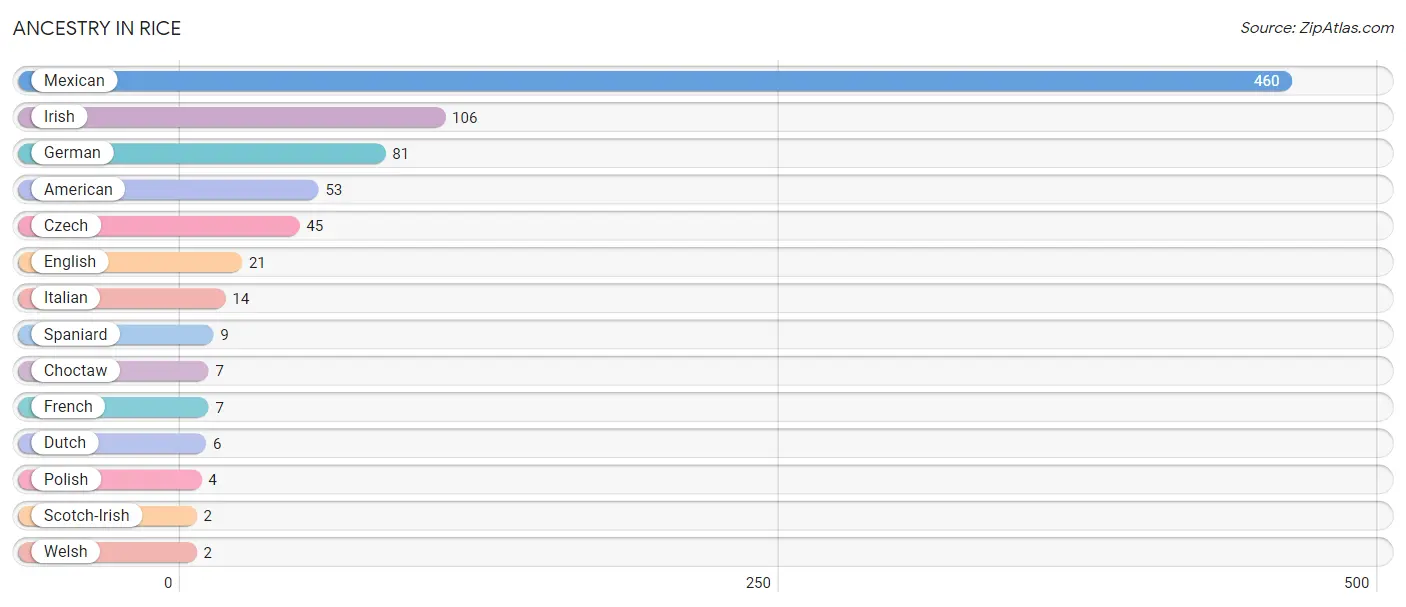
| Ancestry | # Population | % Population |
| American | 53 | 4.7% |
| Choctaw | 7 | 0.6% |
| Czech | 45 | 4.0% |
| Dutch | 6 | 0.5% |
| English | 21 | 1.9% |
| French | 7 | 0.6% |
| German | 81 | 7.2% |
| Irish | 106 | 9.5% |
| Italian | 14 | 1.3% |
| Mexican | 460 | 41.1% |
| Polish | 4 | 0.4% |
| Scotch-Irish | 2 | 0.2% |
| Spaniard | 9 | 0.8% |
| Welsh | 2 | 0.2% | View All 14 Rows |
Immigrants in Rice
The most numerous immigrant groups reported in Rice came from Central America (145 | 13.0%), Latin America (145 | 13.0%), and Mexico (145 | 13.0%), together accounting for 38.9% of all Rice residents.
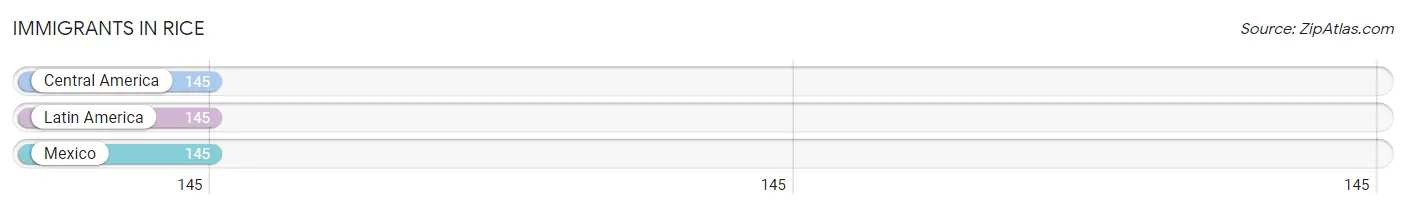
| Immigration Origin | # Population | % Population |
| Central America | 145 | 13.0% |
| Latin America | 145 | 13.0% |
| Mexico | 145 | 13.0% | View All 3 Rows |
Sex and Age in Rice
Sex and Age in Rice
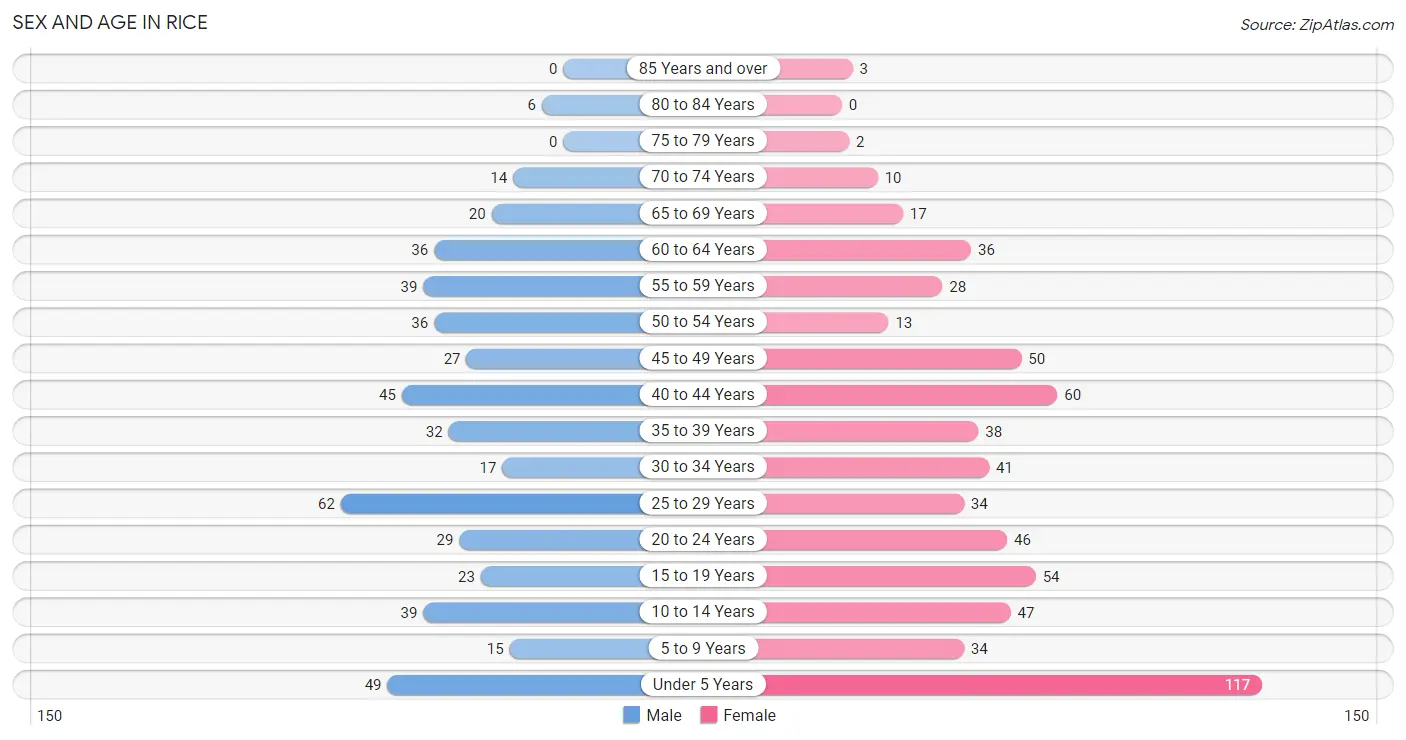
The most populous age groups in Rice are 25 to 29 Years (62 | 12.7%) for men and Under 5 Years (117 | 18.6%) for women.
| Age Bracket | Male | Female |
| Under 5 Years | 49 (10.0%) | 117 (18.6%) |
| 5 to 9 Years | 15 (3.1%) | 34 (5.4%) |
| 10 to 14 Years | 39 (8.0%) | 47 (7.5%) |
| 15 to 19 Years | 23 (4.7%) | 54 (8.6%) |
| 20 to 24 Years | 29 (5.9%) | 46 (7.3%) |
| 25 to 29 Years | 62 (12.7%) | 34 (5.4%) |
| 30 to 34 Years | 17 (3.5%) | 41 (6.5%) |
| 35 to 39 Years | 32 (6.5%) | 38 (6.0%) |
| 40 to 44 Years | 45 (9.2%) | 60 (9.5%) |
| 45 to 49 Years | 27 (5.5%) | 50 (7.9%) |
| 50 to 54 Years | 36 (7.4%) | 13 (2.1%) |
| 55 to 59 Years | 39 (8.0%) | 28 (4.4%) |
| 60 to 64 Years | 36 (7.4%) | 36 (5.7%) |
| 65 to 69 Years | 20 (4.1%) | 17 (2.7%) |
| 70 to 74 Years | 14 (2.9%) | 10 (1.6%) |
| 75 to 79 Years | 0 (0.0%) | 2 (0.3%) |
| 80 to 84 Years | 6 (1.2%) | 0 (0.0%) |
| 85 Years and over | 0 (0.0%) | 3 (0.5%) |
| Total | 489 (100.0%) | 630 (100.0%) |
Families and Households in Rice
Median Family Size in Rice
The median family size in Rice is 3.75 persons per family, with married-couple families (167 | 63.3%) accounting for the largest median family size of 4.32 persons per family. On the other hand, single female/mother families (37 | 14.0%) represent the smallest median family size with 2.70 persons per family.
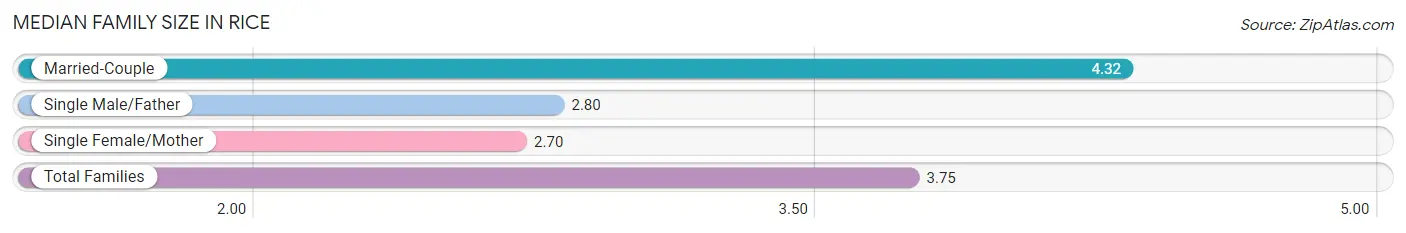
| Family Type | # Families | Family Size |
| Married-Couple | 167 (63.3%) | 4.32 |
| Single Male/Father | 60 (22.7%) | 2.80 |
| Single Female/Mother | 37 (14.0%) | 2.70 |
| Total Families | 264 (100.0%) | 3.75 |
Median Household Size in Rice
The median household size in Rice is 3.35 persons per household, with married-couple households (167 | 50.0%) accounting for the largest median household size of 4.32 persons per household. non-family households (70 | 21.0%) represent the smallest median household size with 1.27 persons per household.
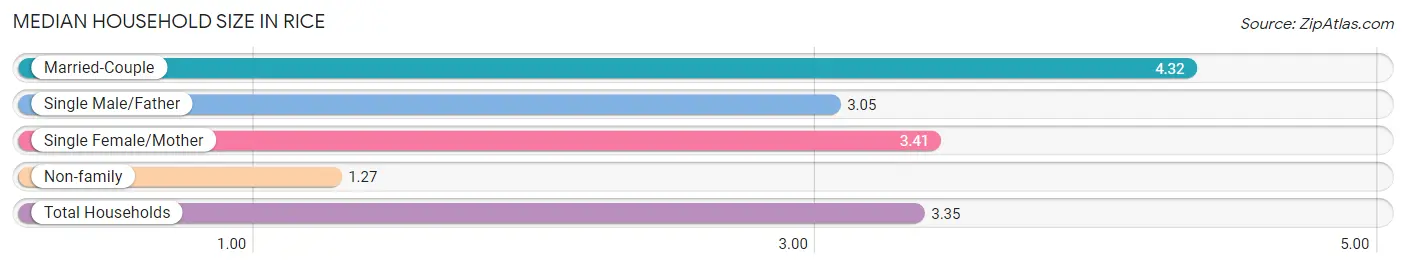
| Household Type | # Households | Household Size |
| Married-Couple | 167 (50.0%) | 4.32 |
| Single Male/Father | 60 (18.0%) | 3.05 |
| Single Female/Mother | 37 (11.1%) | 3.41 |
| Non-family | 70 (21.0%) | 1.27 |
| Total Households | 334 (100.0%) | 3.35 |
Household Size by Marriage Status in Rice
Out of a total of 334 households in Rice, 264 (79.0%) are family households, while 70 (21.0%) are nonfamily households. The most numerous type of family households are 2-person households, comprising 83, and the most common type of nonfamily households are 1-person households, comprising 51.
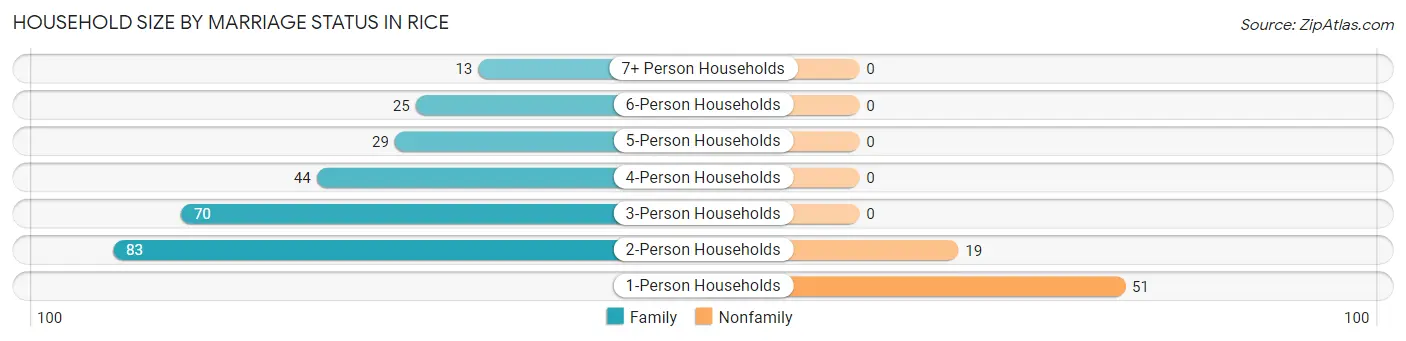
| Household Size | Family Households | Nonfamily Households |
| 1-Person Households | - | 51 (15.3%) |
| 2-Person Households | 83 (24.8%) | 19 (5.7%) |
| 3-Person Households | 70 (21.0%) | 0 (0.0%) |
| 4-Person Households | 44 (13.2%) | 0 (0.0%) |
| 5-Person Households | 29 (8.7%) | 0 (0.0%) |
| 6-Person Households | 25 (7.5%) | 0 (0.0%) |
| 7+ Person Households | 13 (3.9%) | 0 (0.0%) |
| Total | 264 (79.0%) | 70 (21.0%) |
Female Fertility in Rice
Fertility by Age in Rice
Average fertility rate in Rice is 67.0 births per 1,000 women. Women in the age bracket of 20 to 34 years have the highest fertility rate with 116.0 births per 1,000 women. Women in the age bracket of 20 to 34 years acount for 63.6% of all women with births.
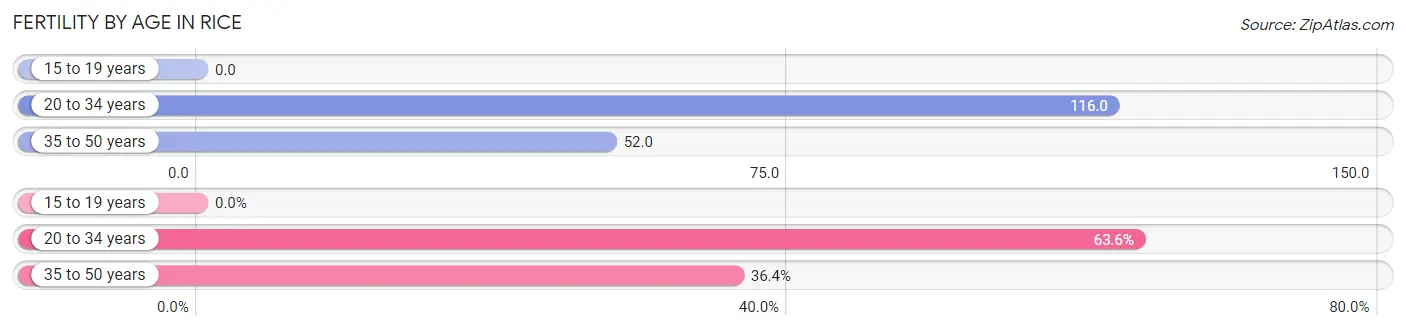
| Age Bracket | Women with Births | Births / 1,000 Women |
| 15 to 19 years | 0 (0.0%) | 0.0 |
| 20 to 34 years | 14 (63.6%) | 116.0 |
| 35 to 50 years | 8 (36.4%) | 52.0 |
| Total | 22 (100.0%) | 67.0 |
Fertility by Age by Marriage Status in Rice
90.9% of women with births (22) in Rice are married. The highest percentage of unmarried women with births falls into 20 to 34 years age bracket with 14.3% of them unmarried at the time of birth, while the lowest percentage of unmarried women with births belong to 35 to 50 years age bracket with 0.0% of them unmarried.
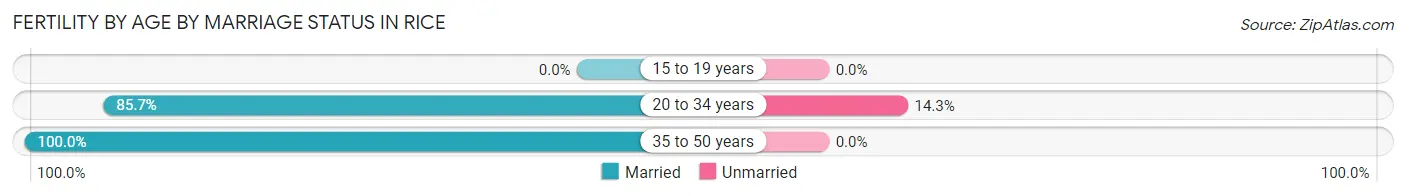
| Age Bracket | Married | Unmarried |
| 15 to 19 years | 0 (0.0%) | 0 (0.0%) |
| 20 to 34 years | 12 (85.7%) | 2 (14.3%) |
| 35 to 50 years | 8 (100.0%) | 0 (0.0%) |
| Total | 20 (90.9%) | 2 (9.1%) |
Fertility by Education in Rice
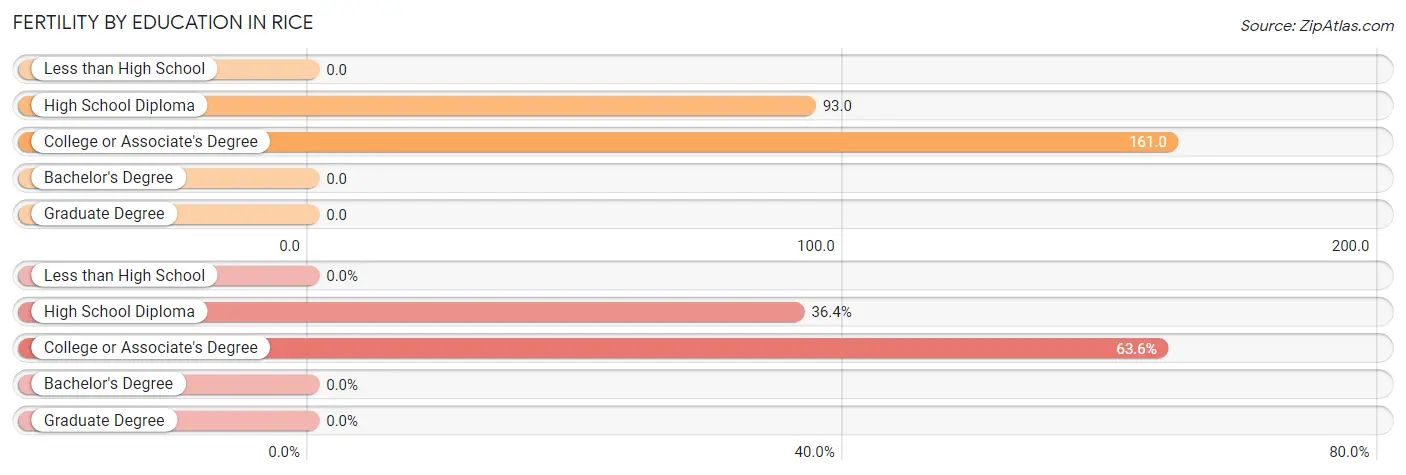
| Educational Attainment | Women with Births | Births / 1,000 Women |
| Less than High School | 0 (0.0%) | 0.0 |
| High School Diploma | 8 (36.4%) | 93.0 |
| College or Associate's Degree | 14 (63.6%) | 161.0 |
| Bachelor's Degree | 0 (0.0%) | 0.0 |
| Graduate Degree | 0 (0.0%) | 0.0 |
| Total | 22 (100.0%) | 67.0 |
Fertility by Education by Marriage Status in Rice
9.1% of women with births in Rice are unmarried. Women with the educational attainment of college or associate's degree are most likely to be married with 100.0% of them married at childbirth, while women with the educational attainment of high school diploma are least likely to be married with 25.0% of them unmarried at childbirth.
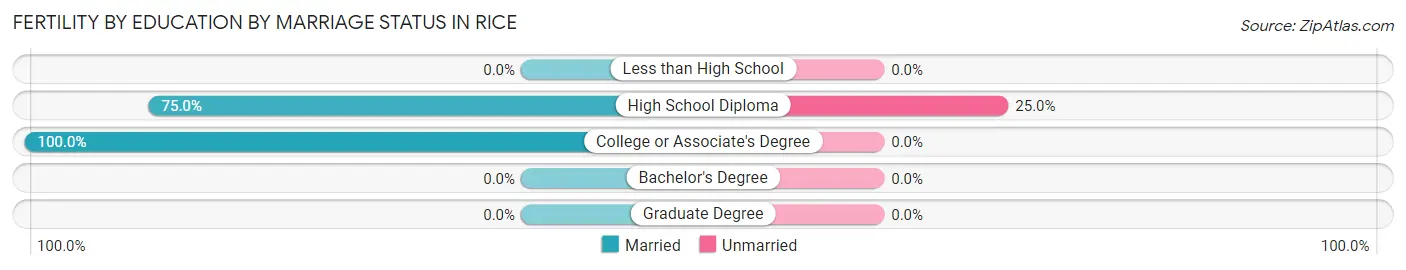
| Educational Attainment | Married | Unmarried |
| Less than High School | 0 (0.0%) | 0 (0.0%) |
| High School Diploma | 6 (75.0%) | 2 (25.0%) |
| College or Associate's Degree | 14 (100.0%) | 0 (0.0%) |
| Bachelor's Degree | 0 (0.0%) | 0 (0.0%) |
| Graduate Degree | 0 (0.0%) | 0 (0.0%) |
| Total | 20 (90.9%) | 2 (9.1%) |
Employment Characteristics in Rice
Employment by Class of Employer in Rice
Among the 521 employed individuals in Rice, private company employees (401 | 77.0%), self-employed (not incorporated) (33 | 6.3%), and local government employees (29 | 5.6%) make up the most common classes of employment.
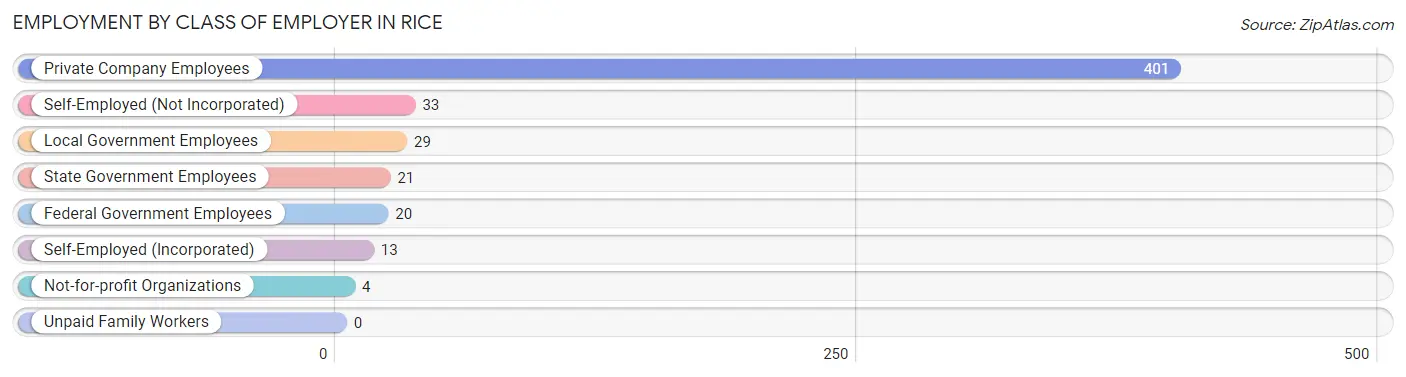
| Employer Class | # Employees | % Employees |
| Private Company Employees | 401 | 77.0% |
| Self-Employed (Incorporated) | 13 | 2.5% |
| Self-Employed (Not Incorporated) | 33 | 6.3% |
| Not-for-profit Organizations | 4 | 0.8% |
| Local Government Employees | 29 | 5.6% |
| State Government Employees | 21 | 4.0% |
| Federal Government Employees | 20 | 3.8% |
| Unpaid Family Workers | 0 | 0.0% |
| Total | 521 | 100.0% |
Employment Status by Age in Rice
According to the labor force statistics for Rice, out of the total population over 16 years of age (784), 70.4% or 552 individuals are in the labor force, with 1.9% or 10 of them unemployed. The age group with the highest labor force participation rate is 35 to 44 years, with 89.1% or 156 individuals in the labor force. Within the labor force, the 16 to 19 years age range has the highest percentage of unemployed individuals, with 10.7% or 3 of them being unemployed.
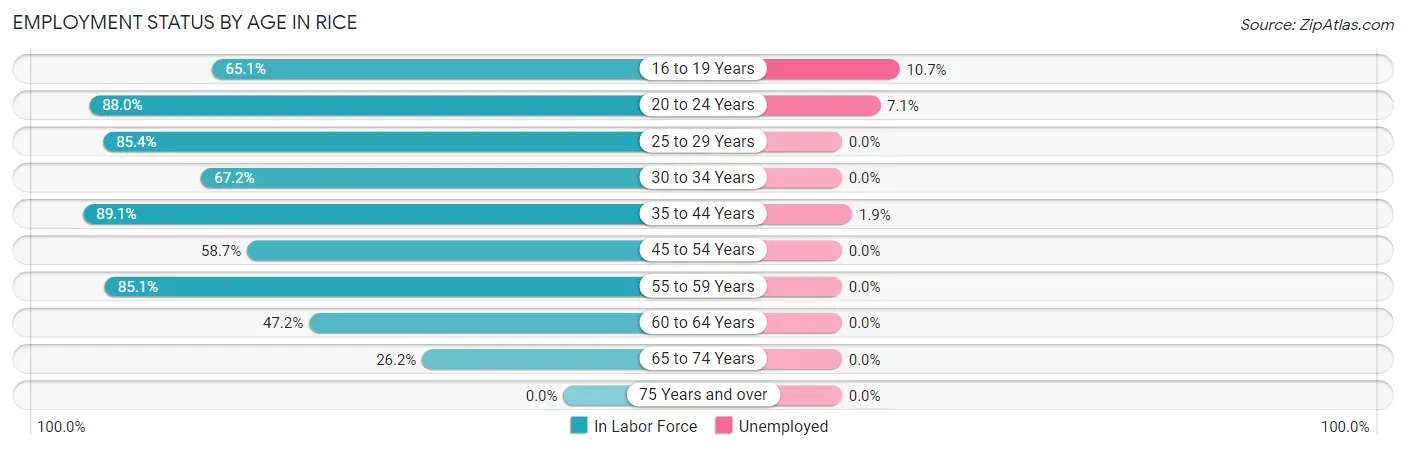
| Age Bracket | In Labor Force | Unemployed |
| 16 to 19 Years | 28 (65.1%) | 3 (10.7%) |
| 20 to 24 Years | 66 (88.0%) | 5 (7.1%) |
| 25 to 29 Years | 82 (85.4%) | 0 (0.0%) |
| 30 to 34 Years | 39 (67.2%) | 0 (0.0%) |
| 35 to 44 Years | 156 (89.1%) | 3 (1.9%) |
| 45 to 54 Years | 74 (58.7%) | 0 (0.0%) |
| 55 to 59 Years | 57 (85.1%) | 0 (0.0%) |
| 60 to 64 Years | 34 (47.2%) | 0 (0.0%) |
| 65 to 74 Years | 16 (26.2%) | 0 (0.0%) |
| 75 Years and over | 0 (0.0%) | 0 (0.0%) |
| Total | 552 (70.4%) | 10 (1.9%) |
Employment Status by Educational Attainment in Rice
According to labor force statistics for Rice, 74.4% of individuals (442) out of the total population between 25 and 64 years of age (594) are in the labor force, with 0.7% or 3 of them being unemployed. The group with the highest labor force participation rate are those with the educational attainment of college / associate degree, with 84.2% or 123 individuals in the labor force. Within the labor force, individuals with college / associate degree education have the highest percentage of unemployment, with 2.7% or 3 of them being unemployed.
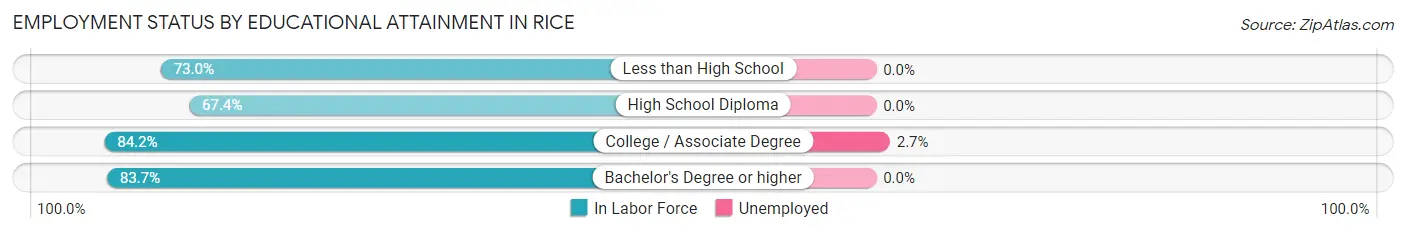
| Educational Attainment | In Labor Force | Unemployed |
| Less than High School | 130 (73.0%) | 0 (0.0%) |
| High School Diploma | 153 (67.4%) | 0 (0.0%) |
| College / Associate Degree | 123 (84.2%) | 4 (2.7%) |
| Bachelor's Degree or higher | 36 (83.7%) | 0 (0.0%) |
| Total | 442 (74.4%) | 4 (0.7%) |
Employment Occupations by Sex in Rice
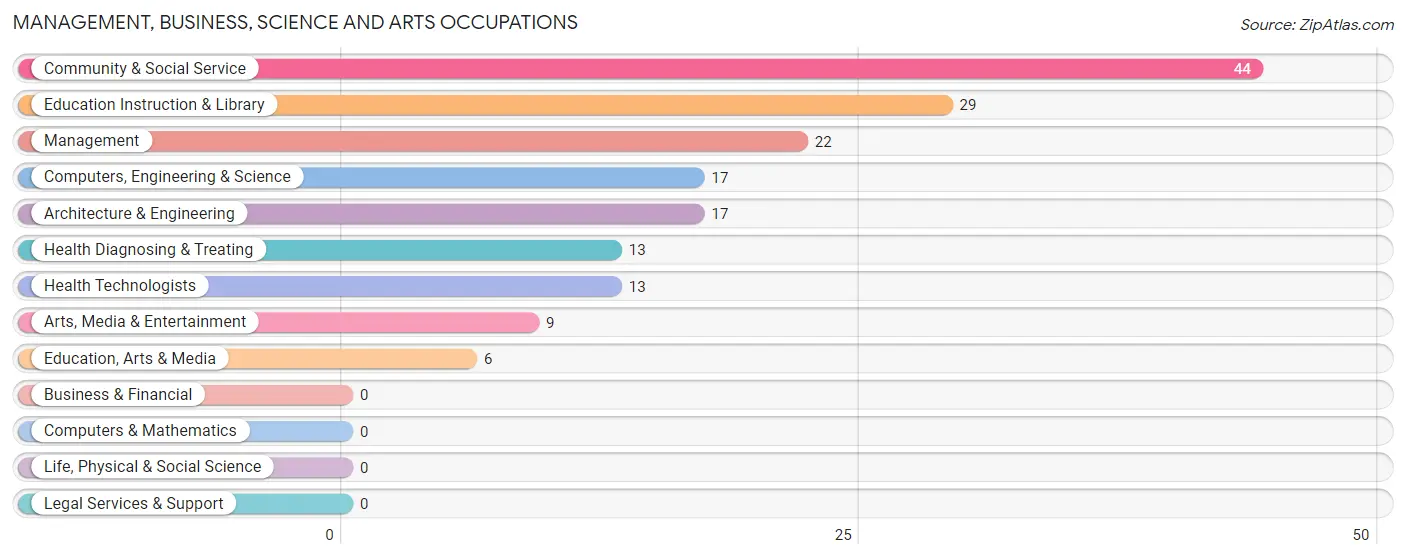
Management, Business, Science and Arts Occupations
The most common Management, Business, Science and Arts occupations in Rice are Community & Social Service (44 | 8.4%), Education Instruction & Library (29 | 5.6%), Management (22 | 4.2%), Computers, Engineering & Science (17 | 3.3%), and Architecture & Engineering (17 | 3.3%).
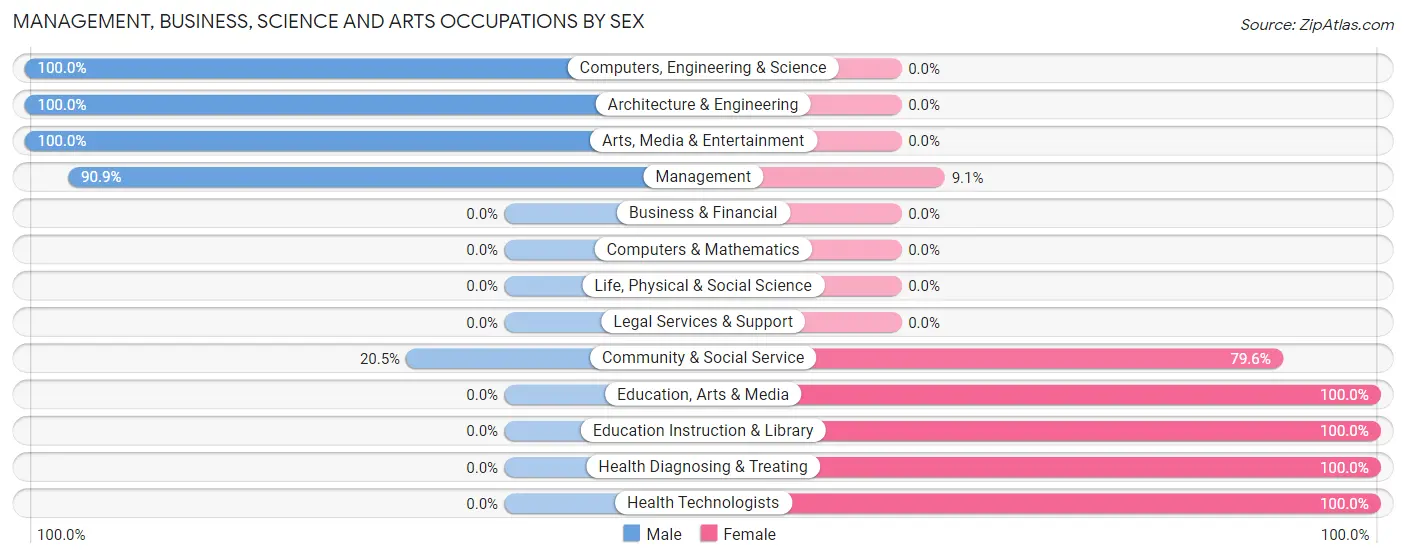
Management, Business, Science and Arts Occupations by Sex
Within the Management, Business, Science and Arts occupations in Rice, the most male-oriented occupations are Computers, Engineering & Science (100.0%), Architecture & Engineering (100.0%), and Arts, Media & Entertainment (100.0%), while the most female-oriented occupations are Education, Arts & Media (100.0%), Education Instruction & Library (100.0%), and Health Diagnosing & Treating (100.0%).
| Occupation | Male | Female |
| Management | 20 (90.9%) | 2 (9.1%) |
| Business & Financial | 0 (0.0%) | 0 (0.0%) |
| Computers, Engineering & Science | 17 (100.0%) | 0 (0.0%) |
| Computers & Mathematics | 0 (0.0%) | 0 (0.0%) |
| Architecture & Engineering | 17 (100.0%) | 0 (0.0%) |
| Life, Physical & Social Science | 0 (0.0%) | 0 (0.0%) |
| Community & Social Service | 9 (20.4%) | 35 (79.5%) |
| Education, Arts & Media | 0 (0.0%) | 6 (100.0%) |
| Legal Services & Support | 0 (0.0%) | 0 (0.0%) |
| Education Instruction & Library | 0 (0.0%) | 29 (100.0%) |
| Arts, Media & Entertainment | 9 (100.0%) | 0 (0.0%) |
| Health Diagnosing & Treating | 0 (0.0%) | 13 (100.0%) |
| Health Technologists | 0 (0.0%) | 13 (100.0%) |
| Total (Category) | 46 (47.9%) | 50 (52.1%) |
| Total (Overall) | 303 (58.1%) | 219 (41.9%) |
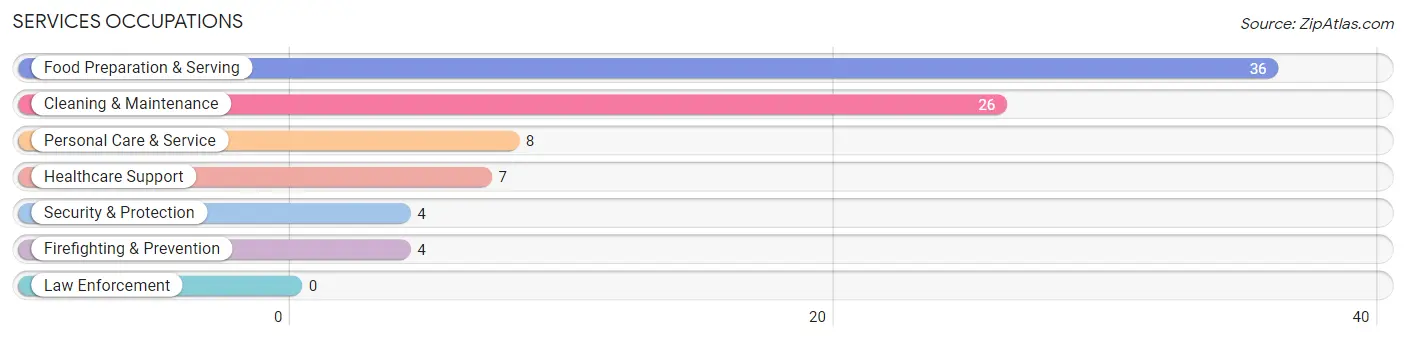
Services Occupations
The most common Services occupations in Rice are Food Preparation & Serving (36 | 6.9%), Cleaning & Maintenance (26 | 5.0%), Personal Care & Service (8 | 1.5%), Healthcare Support (7 | 1.3%), and Security & Protection (4 | 0.8%).
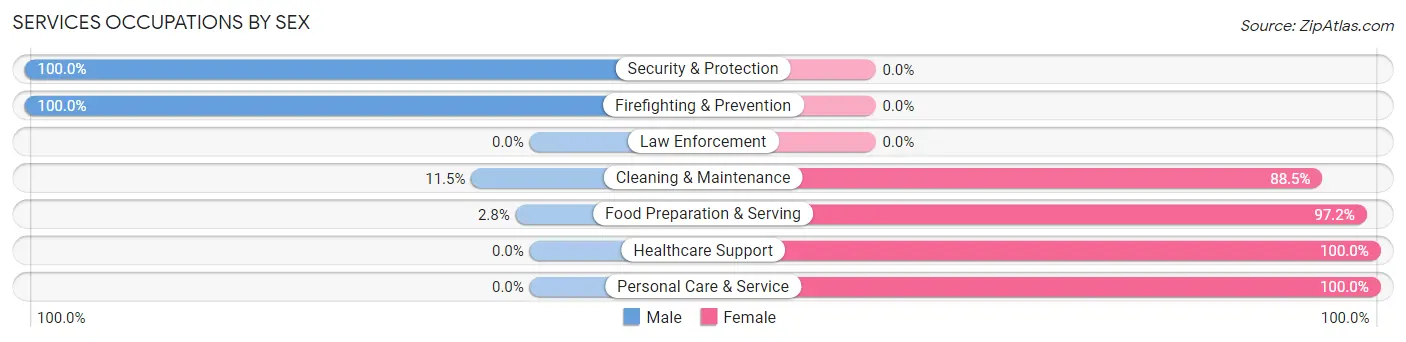
Services Occupations by Sex
Within the Services occupations in Rice, the most male-oriented occupations are Security & Protection (100.0%), Firefighting & Prevention (100.0%), and Cleaning & Maintenance (11.5%), while the most female-oriented occupations are Healthcare Support (100.0%), Personal Care & Service (100.0%), and Food Preparation & Serving (97.2%).
| Occupation | Male | Female |
| Healthcare Support | 0 (0.0%) | 7 (100.0%) |
| Security & Protection | 4 (100.0%) | 0 (0.0%) |
| Firefighting & Prevention | 4 (100.0%) | 0 (0.0%) |
| Law Enforcement | 0 (0.0%) | 0 (0.0%) |
| Food Preparation & Serving | 1 (2.8%) | 35 (97.2%) |
| Cleaning & Maintenance | 3 (11.5%) | 23 (88.5%) |
| Personal Care & Service | 0 (0.0%) | 8 (100.0%) |
| Total (Category) | 8 (9.9%) | 73 (90.1%) |
| Total (Overall) | 303 (58.1%) | 219 (41.9%) |
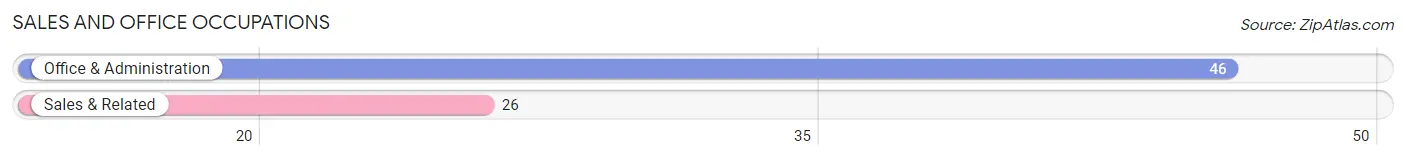
Sales and Office Occupations
The most common Sales and Office occupations in Rice are Office & Administration (46 | 8.8%), and Sales & Related (26 | 5.0%).
Sales and Office Occupations by Sex
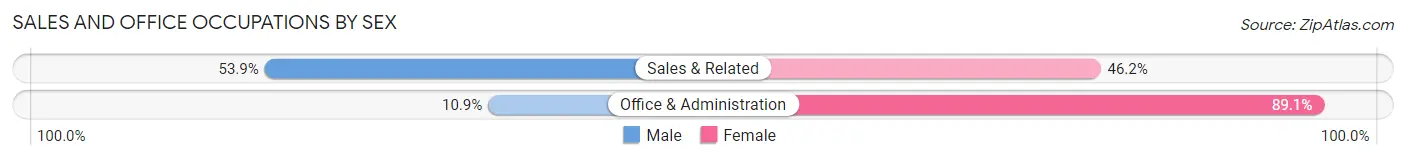
| Occupation | Male | Female |
| Sales & Related | 14 (53.8%) | 12 (46.2%) |
| Office & Administration | 5 (10.9%) | 41 (89.1%) |
| Total (Category) | 19 (26.4%) | 53 (73.6%) |
| Total (Overall) | 303 (58.1%) | 219 (41.9%) |
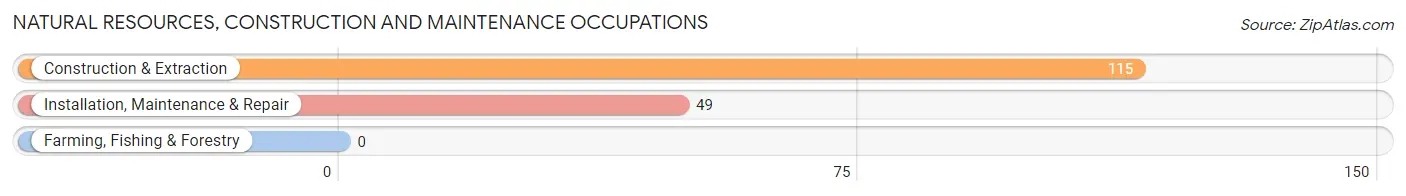
Natural Resources, Construction and Maintenance Occupations
The most common Natural Resources, Construction and Maintenance occupations in Rice are Construction & Extraction (115 | 22.0%), and Installation, Maintenance & Repair (49 | 9.4%).
Natural Resources, Construction and Maintenance Occupations by Sex
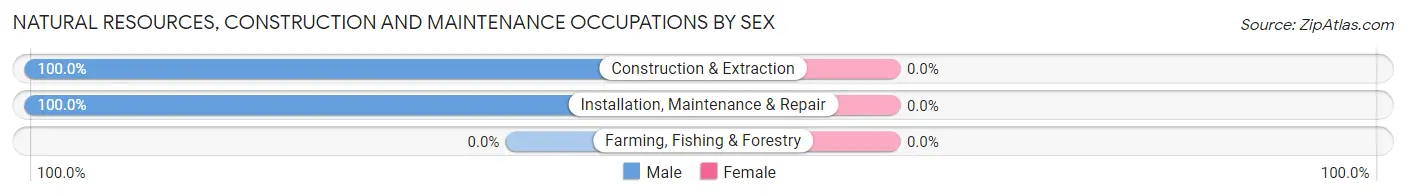
| Occupation | Male | Female |
| Farming, Fishing & Forestry | 0 (0.0%) | 0 (0.0%) |
| Construction & Extraction | 115 (100.0%) | 0 (0.0%) |
| Installation, Maintenance & Repair | 49 (100.0%) | 0 (0.0%) |
| Total (Category) | 164 (100.0%) | 0 (0.0%) |
| Total (Overall) | 303 (58.1%) | 219 (41.9%) |
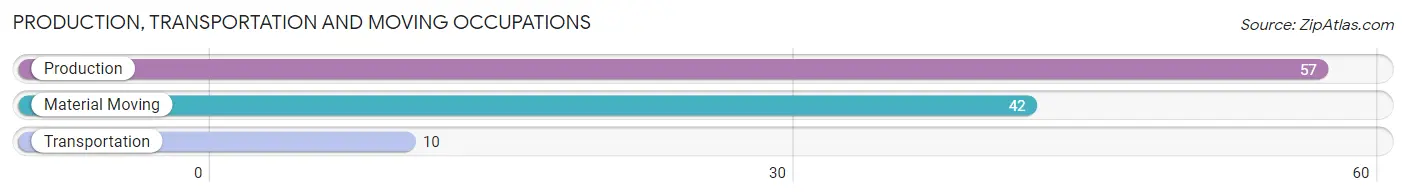
Production, Transportation and Moving Occupations
The most common Production, Transportation and Moving occupations in Rice are Production (57 | 10.9%), Material Moving (42 | 8.1%), and Transportation (10 | 1.9%).
Production, Transportation and Moving Occupations by Sex
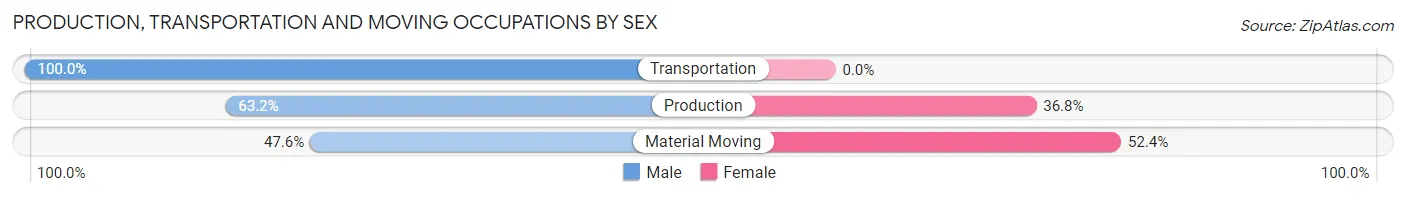
| Occupation | Male | Female |
| Production | 36 (63.2%) | 21 (36.8%) |
| Transportation | 10 (100.0%) | 0 (0.0%) |
| Material Moving | 20 (47.6%) | 22 (52.4%) |
| Total (Category) | 66 (60.6%) | 43 (39.5%) |
| Total (Overall) | 303 (58.1%) | 219 (41.9%) |
Employment Industries by Sex in Rice
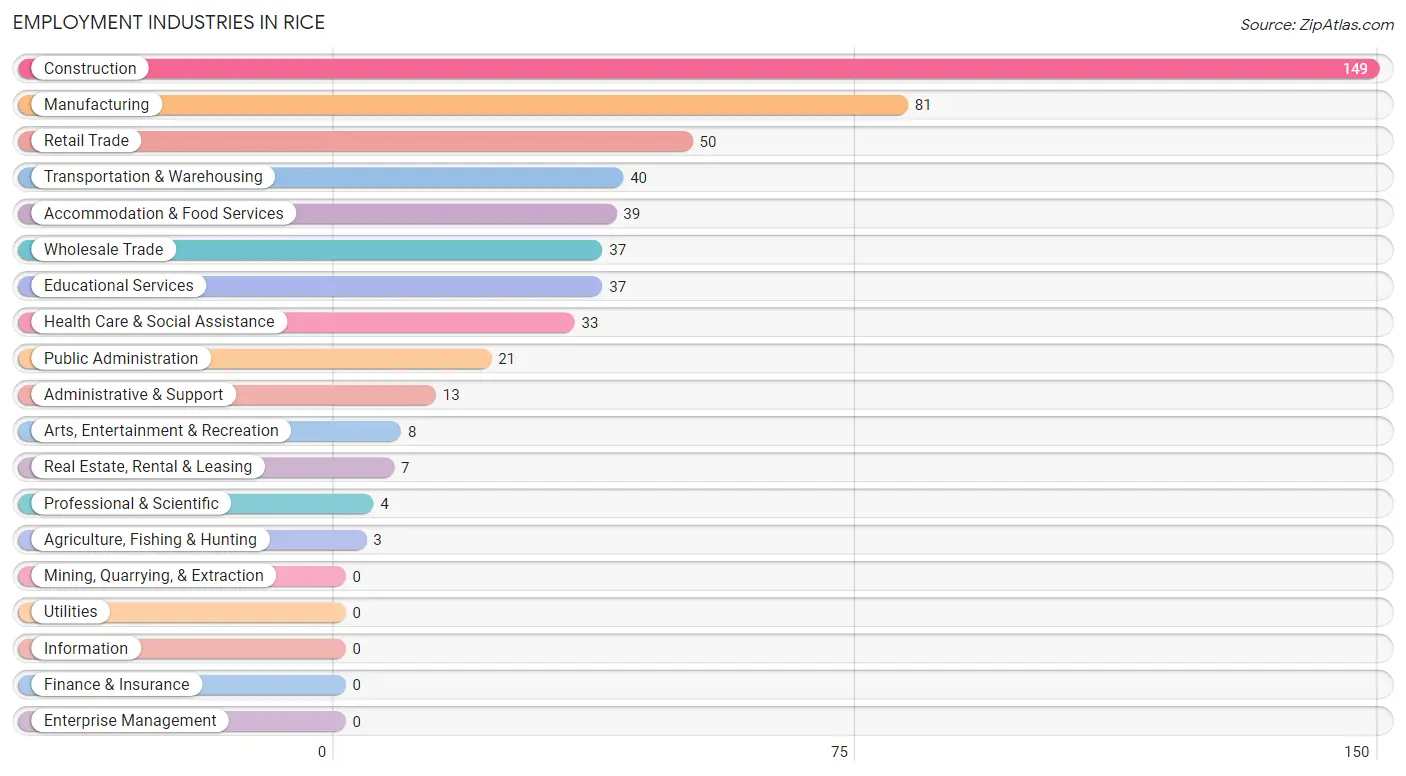
Employment Industries in Rice
The major employment industries in Rice include Construction (149 | 28.5%), Manufacturing (81 | 15.5%), Retail Trade (50 | 9.6%), Transportation & Warehousing (40 | 7.7%), and Accommodation & Food Services (39 | 7.5%).
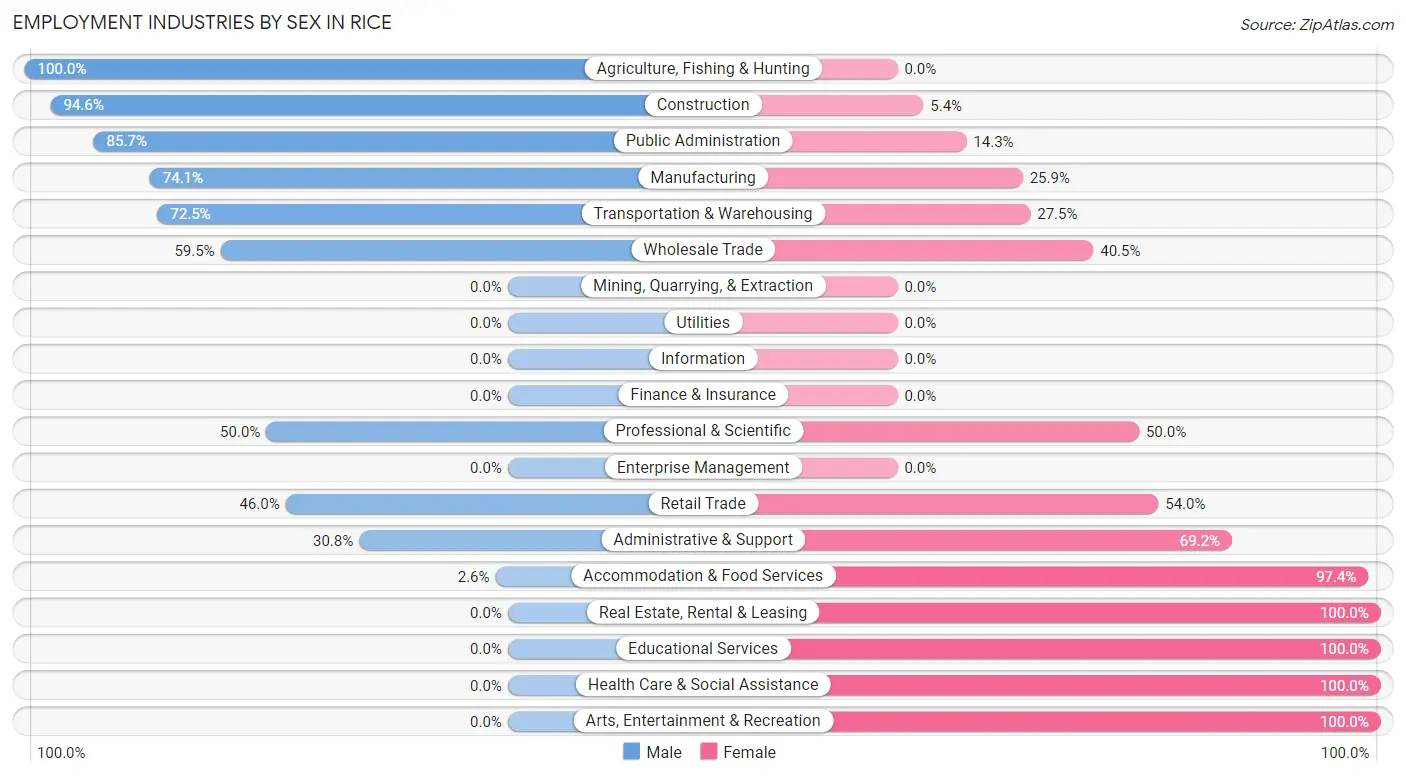
Employment Industries by Sex in Rice
The Rice industries that see more men than women are Agriculture, Fishing & Hunting (100.0%), Construction (94.6%), and Public Administration (85.7%), whereas the industries that tend to have a higher number of women are Real Estate, Rental & Leasing (100.0%), Educational Services (100.0%), and Health Care & Social Assistance (100.0%).
| Industry | Male | Female |
| Agriculture, Fishing & Hunting | 3 (100.0%) | 0 (0.0%) |
| Mining, Quarrying, & Extraction | 0 (0.0%) | 0 (0.0%) |
| Construction | 141 (94.6%) | 8 (5.4%) |
| Manufacturing | 60 (74.1%) | 21 (25.9%) |
| Wholesale Trade | 22 (59.5%) | 15 (40.5%) |
| Retail Trade | 23 (46.0%) | 27 (54.0%) |
| Transportation & Warehousing | 29 (72.5%) | 11 (27.5%) |
| Utilities | 0 (0.0%) | 0 (0.0%) |
| Information | 0 (0.0%) | 0 (0.0%) |
| Finance & Insurance | 0 (0.0%) | 0 (0.0%) |
| Real Estate, Rental & Leasing | 0 (0.0%) | 7 (100.0%) |
| Professional & Scientific | 2 (50.0%) | 2 (50.0%) |
| Enterprise Management | 0 (0.0%) | 0 (0.0%) |
| Administrative & Support | 4 (30.8%) | 9 (69.2%) |
| Educational Services | 0 (0.0%) | 37 (100.0%) |
| Health Care & Social Assistance | 0 (0.0%) | 33 (100.0%) |
| Arts, Entertainment & Recreation | 0 (0.0%) | 8 (100.0%) |
| Accommodation & Food Services | 1 (2.6%) | 38 (97.4%) |
| Public Administration | 18 (85.7%) | 3 (14.3%) |
| Total | 303 (58.1%) | 219 (41.9%) |
Education in Rice
School Enrollment in Rice
The most common levels of schooling among the 286 students in Rice are middle school (65 | 22.7%), elementary school (58 | 20.3%), and high school (57 | 19.9%).
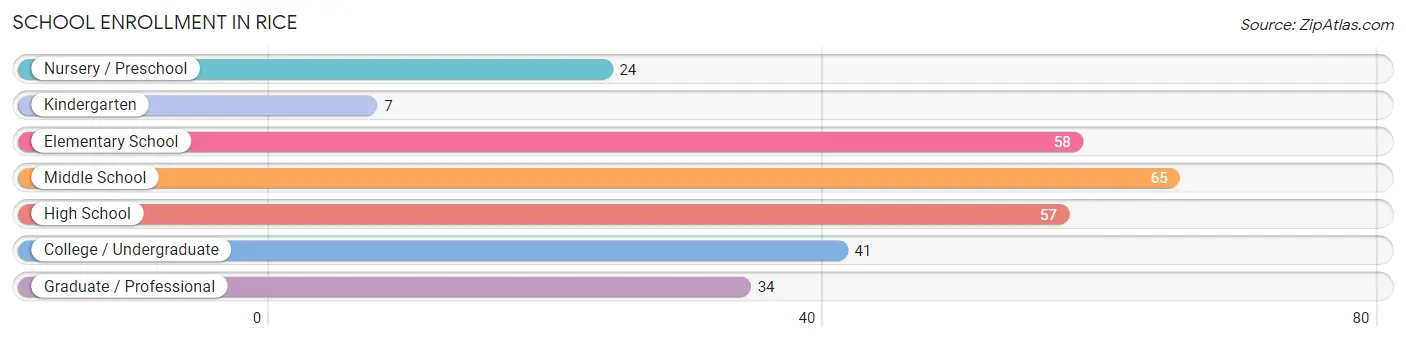
| School Level | # Students | % Students |
| Nursery / Preschool | 24 | 8.4% |
| Kindergarten | 7 | 2.5% |
| Elementary School | 58 | 20.3% |
| Middle School | 65 | 22.7% |
| High School | 57 | 19.9% |
| College / Undergraduate | 41 | 14.3% |
| Graduate / Professional | 34 | 11.9% |
| Total | 286 | 100.0% |
School Enrollment by Age by Funding Source in Rice
Out of a total of 286 students who are enrolled in schools in Rice, 20 (7.0%) attend a private institution, while the remaining 266 (93.0%) are enrolled in public schools. The age group of 5 to 9 year old has the highest likelihood of being enrolled in private schools, with 13 (26.5% in the age bracket) enrolled. Conversely, the age group of 3 to 4 year olds has the lowest likelihood of being enrolled in a private school, with 24 (100.0% in the age bracket) attending a public institution.
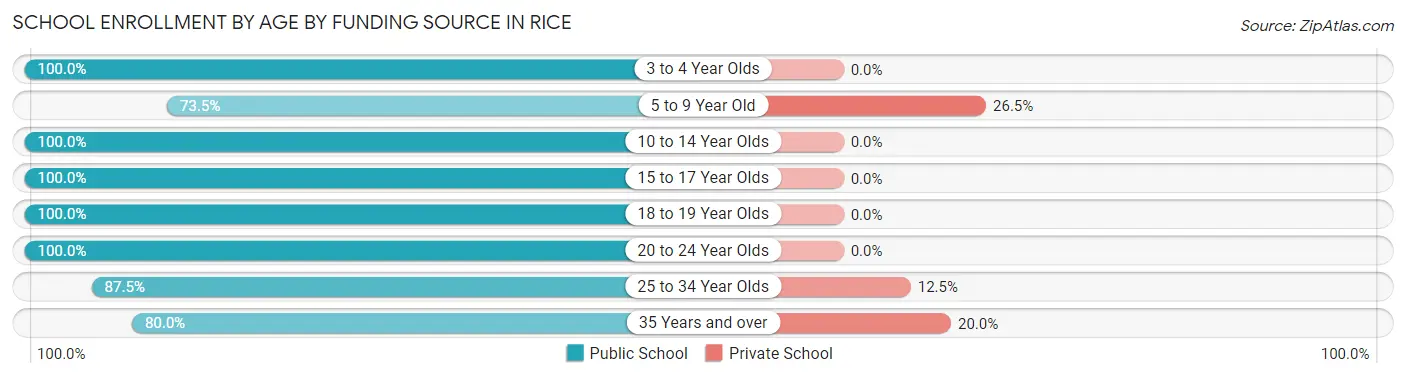
| Age Bracket | Public School | Private School |
| 3 to 4 Year Olds | 24 (100.0%) | 0 (0.0%) |
| 5 to 9 Year Old | 36 (73.5%) | 13 (26.5%) |
| 10 to 14 Year Olds | 86 (100.0%) | 0 (0.0%) |
| 15 to 17 Year Olds | 49 (100.0%) | 0 (0.0%) |
| 18 to 19 Year Olds | 21 (100.0%) | 0 (0.0%) |
| 20 to 24 Year Olds | 13 (100.0%) | 0 (0.0%) |
| 25 to 34 Year Olds | 21 (87.5%) | 3 (12.5%) |
| 35 Years and over | 16 (80.0%) | 4 (20.0%) |
| Total | 266 (93.0%) | 20 (7.0%) |
Educational Attainment by Field of Study in Rice
Science & technology (13 | 24.1%), liberal arts & history (10 | 18.5%), education (8 | 14.8%), bio, nature & agricultural (7 | 13.0%), and psychology (5 | 9.3%) are the most common fields of study among 54 individuals in Rice who have obtained a bachelor's degree or higher.
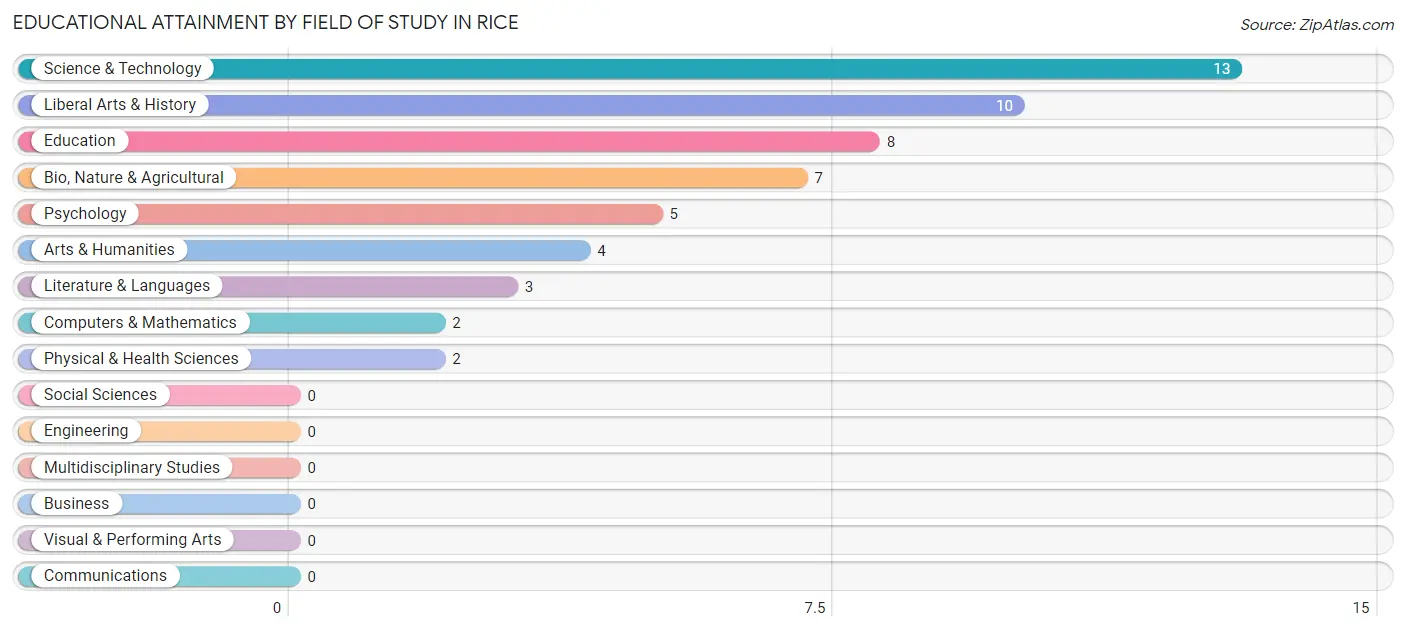
| Field of Study | # Graduates | % Graduates |
| Computers & Mathematics | 2 | 3.7% |
| Bio, Nature & Agricultural | 7 | 13.0% |
| Physical & Health Sciences | 2 | 3.7% |
| Psychology | 5 | 9.3% |
| Social Sciences | 0 | 0.0% |
| Engineering | 0 | 0.0% |
| Multidisciplinary Studies | 0 | 0.0% |
| Science & Technology | 13 | 24.1% |
| Business | 0 | 0.0% |
| Education | 8 | 14.8% |
| Literature & Languages | 3 | 5.6% |
| Liberal Arts & History | 10 | 18.5% |
| Visual & Performing Arts | 0 | 0.0% |
| Communications | 0 | 0.0% |
| Arts & Humanities | 4 | 7.4% |
| Total | 54 | 100.0% |
Transportation & Commute in Rice
Vehicle Availability by Sex in Rice
The most prevalent vehicle ownership categories in Rice are males with 2 vehicles (159, accounting for 53.2%) and females with 2 vehicles (105, making up 71.6%).
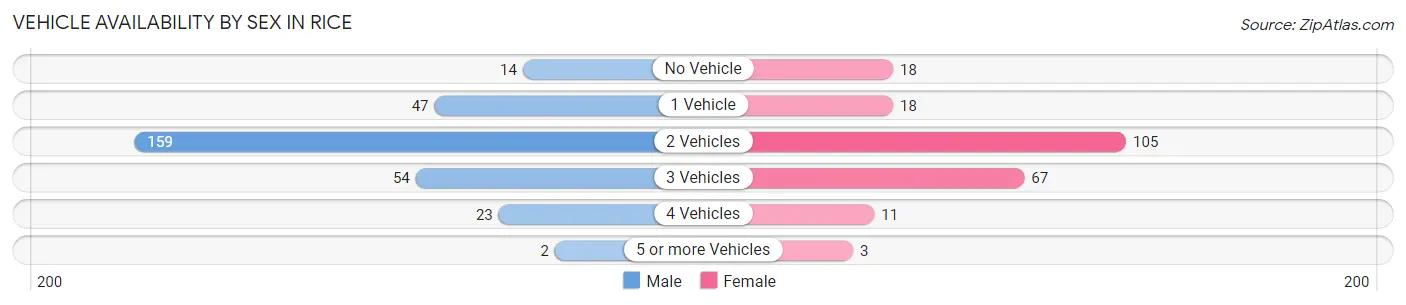
| Vehicles Available | Male | Female |
| No Vehicle | 14 (4.7%) | 18 (8.1%) |
| 1 Vehicle | 47 (15.7%) | 18 (8.1%) |
| 2 Vehicles | 159 (53.2%) | 105 (47.3%) |
| 3 Vehicles | 54 (18.1%) | 67 (30.2%) |
| 4 Vehicles | 23 (7.7%) | 11 (5.0%) |
| 5 or more Vehicles | 2 (0.7%) | 3 (1.3%) |
| Total | 299 (100.0%) | 222 (100.0%) |
Commute Time in Rice
The most frequently occuring commute durations in Rice are 10 to 14 minutes (97 commuters, 19.7%), 15 to 19 minutes (81 commuters, 16.4%), and 20 to 24 minutes (57 commuters, 11.6%).
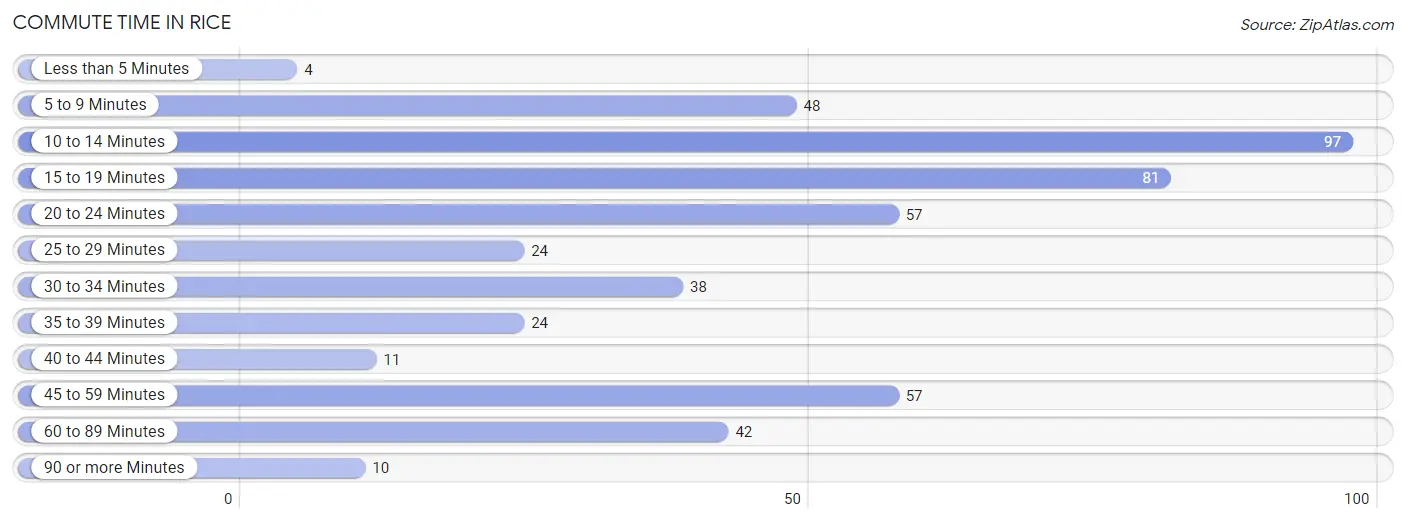
| Commute Time | # Commuters | % Commuters |
| Less than 5 Minutes | 4 | 0.8% |
| 5 to 9 Minutes | 48 | 9.7% |
| 10 to 14 Minutes | 97 | 19.7% |
| 15 to 19 Minutes | 81 | 16.4% |
| 20 to 24 Minutes | 57 | 11.6% |
| 25 to 29 Minutes | 24 | 4.9% |
| 30 to 34 Minutes | 38 | 7.7% |
| 35 to 39 Minutes | 24 | 4.9% |
| 40 to 44 Minutes | 11 | 2.2% |
| 45 to 59 Minutes | 57 | 11.6% |
| 60 to 89 Minutes | 42 | 8.5% |
| 90 or more Minutes | 10 | 2.0% |
Commute Time by Sex in Rice
The most common commute times in Rice are 10 to 14 minutes (53 commuters, 18.9%) for males and 15 to 19 minutes (50 commuters, 23.5%) for females.
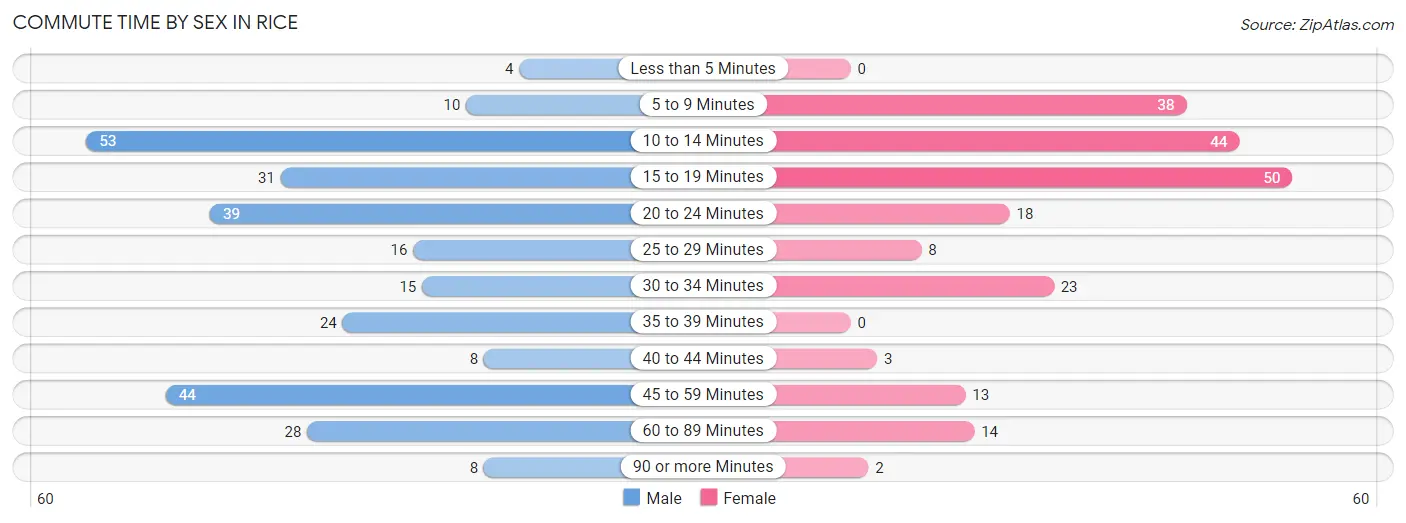
| Commute Time | Male | Female |
| Less than 5 Minutes | 4 (1.4%) | 0 (0.0%) |
| 5 to 9 Minutes | 10 (3.6%) | 38 (17.8%) |
| 10 to 14 Minutes | 53 (18.9%) | 44 (20.7%) |
| 15 to 19 Minutes | 31 (11.1%) | 50 (23.5%) |
| 20 to 24 Minutes | 39 (13.9%) | 18 (8.5%) |
| 25 to 29 Minutes | 16 (5.7%) | 8 (3.8%) |
| 30 to 34 Minutes | 15 (5.4%) | 23 (10.8%) |
| 35 to 39 Minutes | 24 (8.6%) | 0 (0.0%) |
| 40 to 44 Minutes | 8 (2.9%) | 3 (1.4%) |
| 45 to 59 Minutes | 44 (15.7%) | 13 (6.1%) |
| 60 to 89 Minutes | 28 (10.0%) | 14 (6.6%) |
| 90 or more Minutes | 8 (2.9%) | 2 (0.9%) |
Time of Departure to Work by Sex in Rice
The most frequent times of departure to work in Rice are 6:00 AM to 6:29 AM (59, 21.1%) for males and 7:00 AM to 7:29 AM (31, 14.5%) for females.
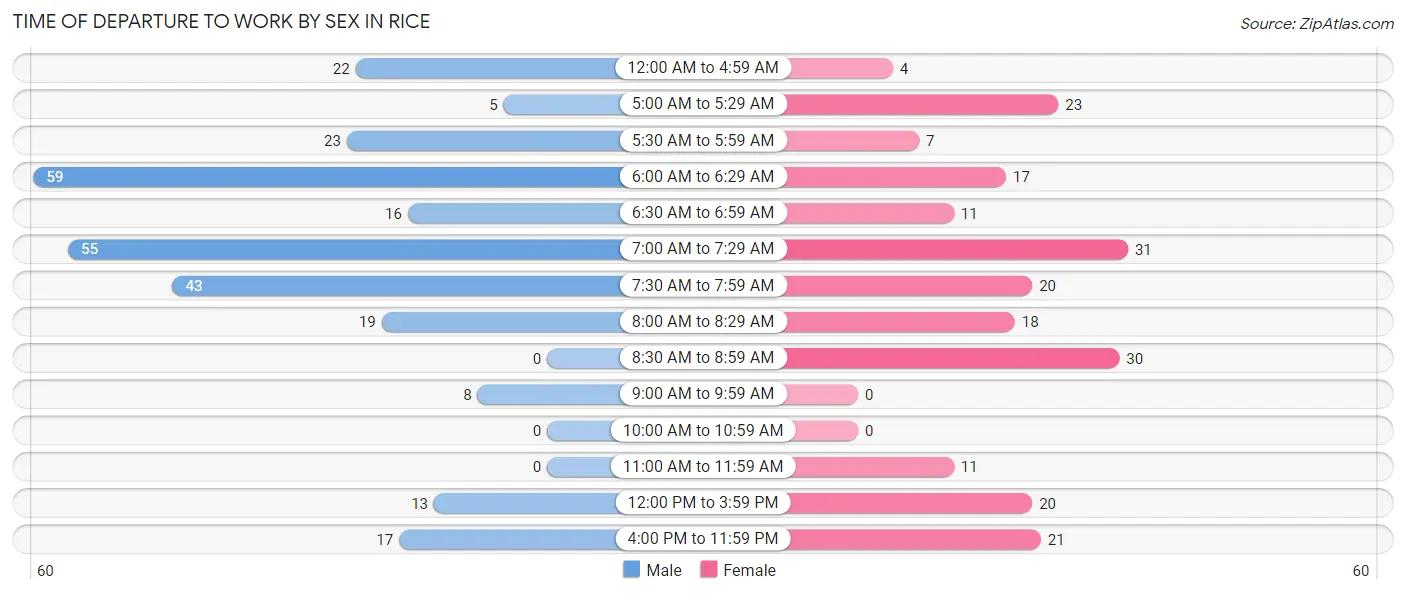
| Time of Departure | Male | Female |
| 12:00 AM to 4:59 AM | 22 (7.9%) | 4 (1.9%) |
| 5:00 AM to 5:29 AM | 5 (1.8%) | 23 (10.8%) |
| 5:30 AM to 5:59 AM | 23 (8.2%) | 7 (3.3%) |
| 6:00 AM to 6:29 AM | 59 (21.1%) | 17 (8.0%) |
| 6:30 AM to 6:59 AM | 16 (5.7%) | 11 (5.2%) |
| 7:00 AM to 7:29 AM | 55 (19.6%) | 31 (14.5%) |
| 7:30 AM to 7:59 AM | 43 (15.4%) | 20 (9.4%) |
| 8:00 AM to 8:29 AM | 19 (6.8%) | 18 (8.5%) |
| 8:30 AM to 8:59 AM | 0 (0.0%) | 30 (14.1%) |
| 9:00 AM to 9:59 AM | 8 (2.9%) | 0 (0.0%) |
| 10:00 AM to 10:59 AM | 0 (0.0%) | 0 (0.0%) |
| 11:00 AM to 11:59 AM | 0 (0.0%) | 11 (5.2%) |
| 12:00 PM to 3:59 PM | 13 (4.6%) | 20 (9.4%) |
| 4:00 PM to 11:59 PM | 17 (6.1%) | 21 (9.9%) |
| Total | 280 (100.0%) | 213 (100.0%) |
Housing Occupancy in Rice
Occupancy by Ownership in Rice
Of the total 334 dwellings in Rice, owner-occupied units account for 250 (74.9%), while renter-occupied units make up 84 (25.2%).
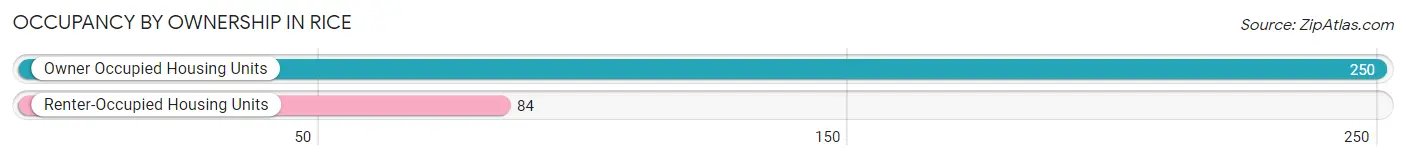
| Occupancy | # Housing Units | % Housing Units |
| Owner Occupied Housing Units | 250 | 74.9% |
| Renter-Occupied Housing Units | 84 | 25.2% |
| Total Occupied Housing Units | 334 | 100.0% |
Occupancy by Household Size in Rice
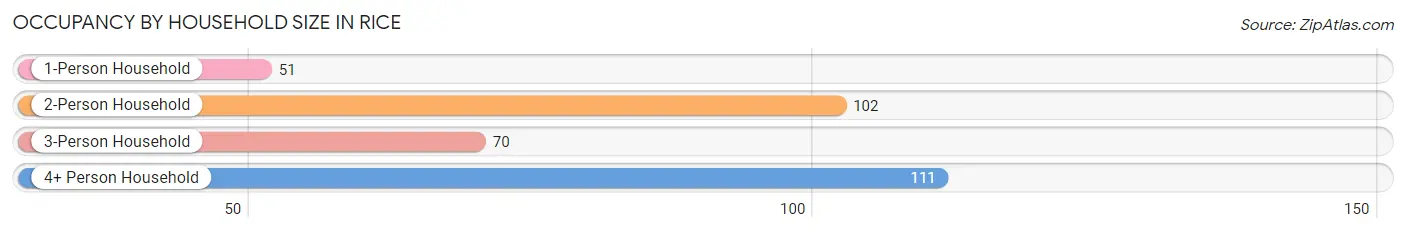
| Household Size | # Housing Units | % Housing Units |
| 1-Person Household | 51 | 15.3% |
| 2-Person Household | 102 | 30.5% |
| 3-Person Household | 70 | 21.0% |
| 4+ Person Household | 111 | 33.2% |
| Total Housing Units | 334 | 100.0% |
Occupancy by Ownership by Household Size in Rice
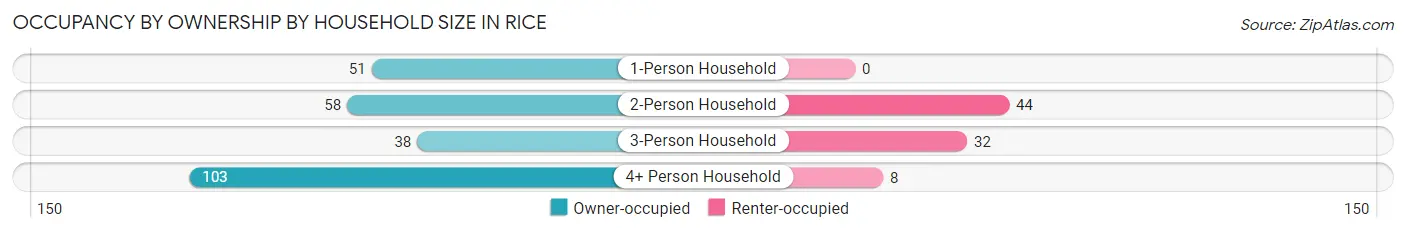
| Household Size | Owner-occupied | Renter-occupied |
| 1-Person Household | 51 (100.0%) | 0 (0.0%) |
| 2-Person Household | 58 (56.9%) | 44 (43.1%) |
| 3-Person Household | 38 (54.3%) | 32 (45.7%) |
| 4+ Person Household | 103 (92.8%) | 8 (7.2%) |
| Total Housing Units | 250 (74.9%) | 84 (25.2%) |
Occupancy by Educational Attainment in Rice
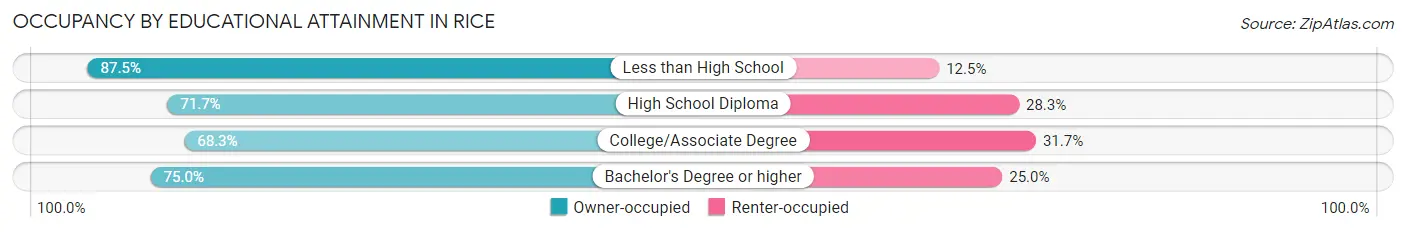
| Household Size | Owner-occupied | Renter-occupied |
| Less than High School | 70 (87.5%) | 10 (12.5%) |
| High School Diploma | 81 (71.7%) | 32 (28.3%) |
| College/Associate Degree | 69 (68.3%) | 32 (31.7%) |
| Bachelor's Degree or higher | 30 (75.0%) | 10 (25.0%) |
Occupancy by Age of Householder in Rice
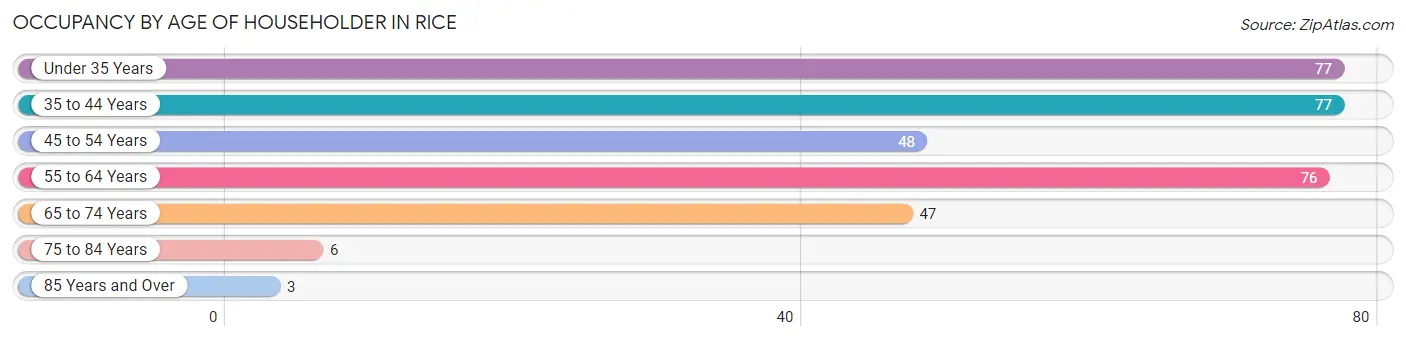
| Age Bracket | # Households | % Households |
| Under 35 Years | 77 | 23.1% |
| 35 to 44 Years | 77 | 23.1% |
| 45 to 54 Years | 48 | 14.4% |
| 55 to 64 Years | 76 | 22.8% |
| 65 to 74 Years | 47 | 14.1% |
| 75 to 84 Years | 6 | 1.8% |
| 85 Years and Over | 3 | 0.9% |
| Total | 334 | 100.0% |
Housing Finances in Rice
Median Income by Occupancy in Rice
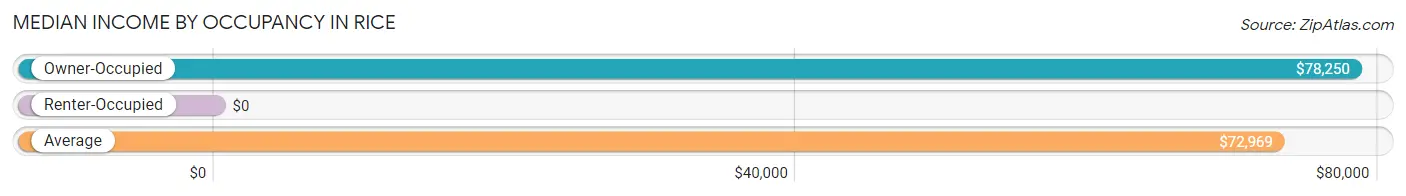
| Occupancy Type | # Households | Median Income |
| Owner-Occupied | 250 (74.9%) | $78,250 |
| Renter-Occupied | 84 (25.2%) | $0 |
| Average | 334 (100.0%) | $72,969 |
Occupancy by Householder Income Bracket in Rice
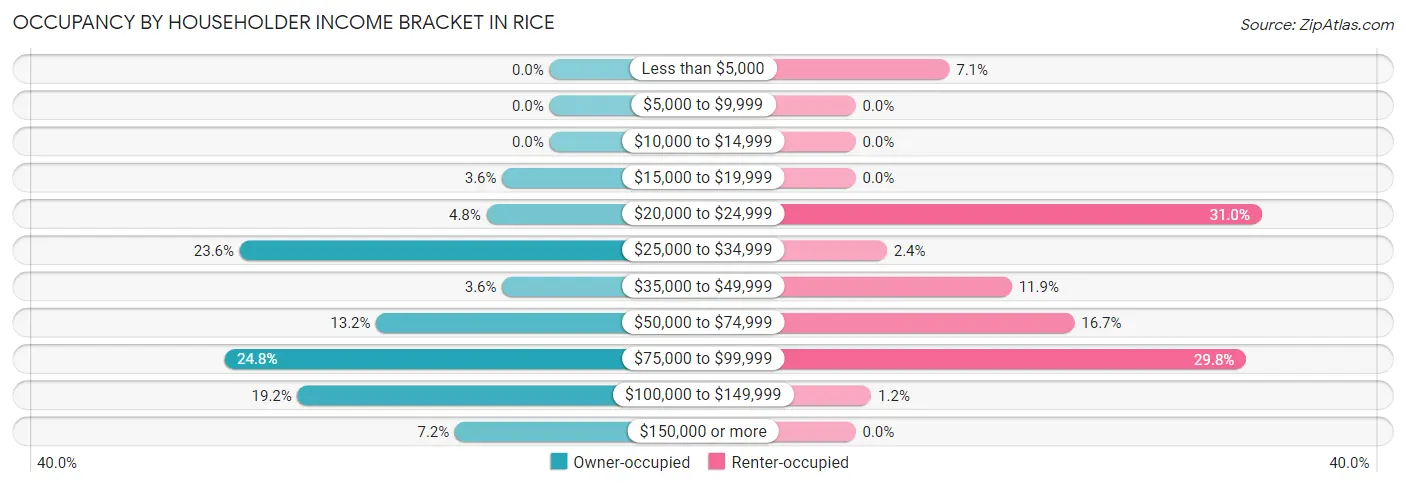
| Income Bracket | Owner-occupied | Renter-occupied |
| Less than $5,000 | 0 (0.0%) | 6 (7.1%) |
| $5,000 to $9,999 | 0 (0.0%) | 0 (0.0%) |
| $10,000 to $14,999 | 0 (0.0%) | 0 (0.0%) |
| $15,000 to $19,999 | 9 (3.6%) | 0 (0.0%) |
| $20,000 to $24,999 | 12 (4.8%) | 26 (30.9%) |
| $25,000 to $34,999 | 59 (23.6%) | 2 (2.4%) |
| $35,000 to $49,999 | 9 (3.6%) | 10 (11.9%) |
| $50,000 to $74,999 | 33 (13.2%) | 14 (16.7%) |
| $75,000 to $99,999 | 62 (24.8%) | 25 (29.8%) |
| $100,000 to $149,999 | 48 (19.2%) | 1 (1.2%) |
| $150,000 or more | 18 (7.2%) | 0 (0.0%) |
| Total | 250 (100.0%) | 84 (100.0%) |
Monthly Housing Cost Tiers in Rice
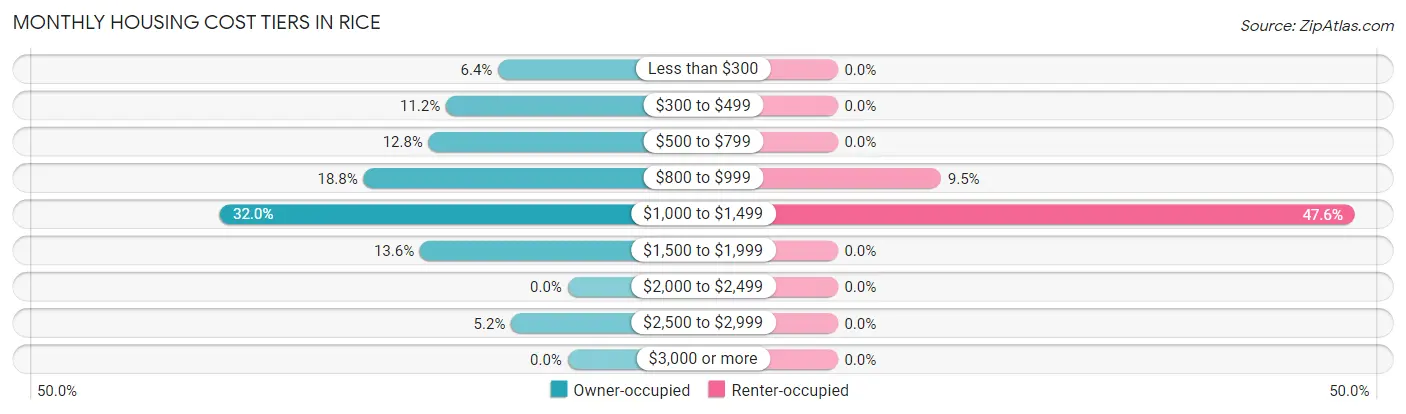
| Monthly Cost | Owner-occupied | Renter-occupied |
| Less than $300 | 16 (6.4%) | 0 (0.0%) |
| $300 to $499 | 28 (11.2%) | 0 (0.0%) |
| $500 to $799 | 32 (12.8%) | 0 (0.0%) |
| $800 to $999 | 47 (18.8%) | 8 (9.5%) |
| $1,000 to $1,499 | 80 (32.0%) | 40 (47.6%) |
| $1,500 to $1,999 | 34 (13.6%) | 0 (0.0%) |
| $2,000 to $2,499 | 0 (0.0%) | 0 (0.0%) |
| $2,500 to $2,999 | 13 (5.2%) | 0 (0.0%) |
| $3,000 or more | 0 (0.0%) | 0 (0.0%) |
| Total | 250 (100.0%) | 84 (100.0%) |
Physical Housing Characteristics in Rice
Housing Structures in Rice
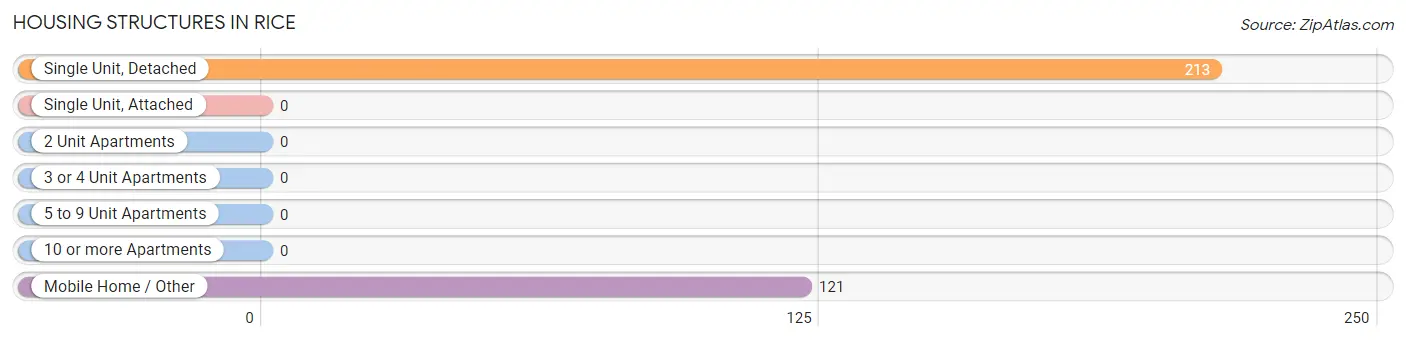
| Structure Type | # Housing Units | % Housing Units |
| Single Unit, Detached | 213 | 63.8% |
| Single Unit, Attached | 0 | 0.0% |
| 2 Unit Apartments | 0 | 0.0% |
| 3 or 4 Unit Apartments | 0 | 0.0% |
| 5 to 9 Unit Apartments | 0 | 0.0% |
| 10 or more Apartments | 0 | 0.0% |
| Mobile Home / Other | 121 | 36.2% |
| Total | 334 | 100.0% |
Housing Structures by Occupancy in Rice
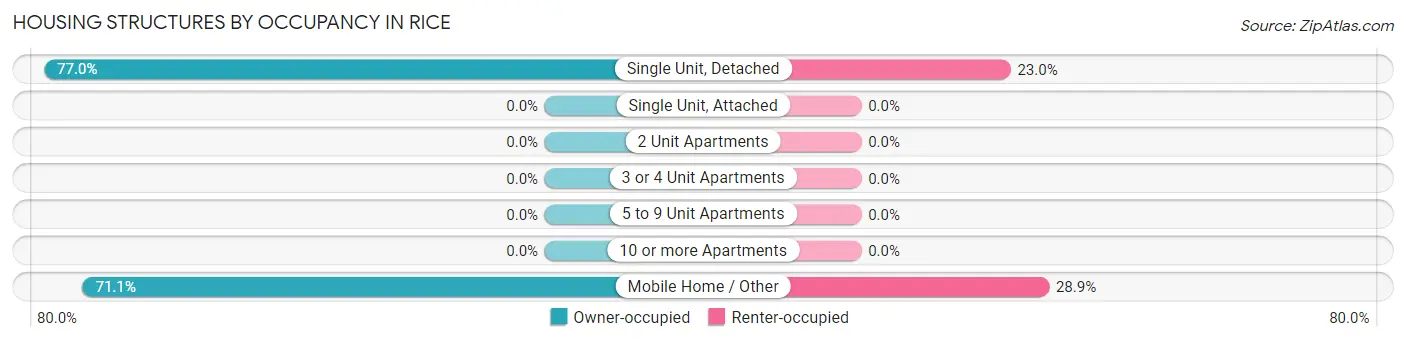
| Structure Type | Owner-occupied | Renter-occupied |
| Single Unit, Detached | 164 (77.0%) | 49 (23.0%) |
| Single Unit, Attached | 0 (0.0%) | 0 (0.0%) |
| 2 Unit Apartments | 0 (0.0%) | 0 (0.0%) |
| 3 or 4 Unit Apartments | 0 (0.0%) | 0 (0.0%) |
| 5 to 9 Unit Apartments | 0 (0.0%) | 0 (0.0%) |
| 10 or more Apartments | 0 (0.0%) | 0 (0.0%) |
| Mobile Home / Other | 86 (71.1%) | 35 (28.9%) |
| Total | 250 (74.9%) | 84 (25.2%) |
Housing Structures by Number of Rooms in Rice
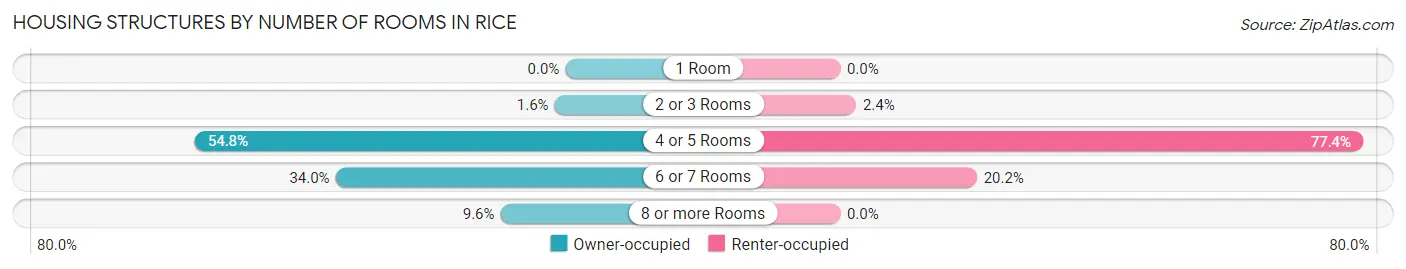
| Number of Rooms | Owner-occupied | Renter-occupied |
| 1 Room | 0 (0.0%) | 0 (0.0%) |
| 2 or 3 Rooms | 4 (1.6%) | 2 (2.4%) |
| 4 or 5 Rooms | 137 (54.8%) | 65 (77.4%) |
| 6 or 7 Rooms | 85 (34.0%) | 17 (20.2%) |
| 8 or more Rooms | 24 (9.6%) | 0 (0.0%) |
| Total | 250 (100.0%) | 84 (100.0%) |
Housing Structure by Heating Type in Rice
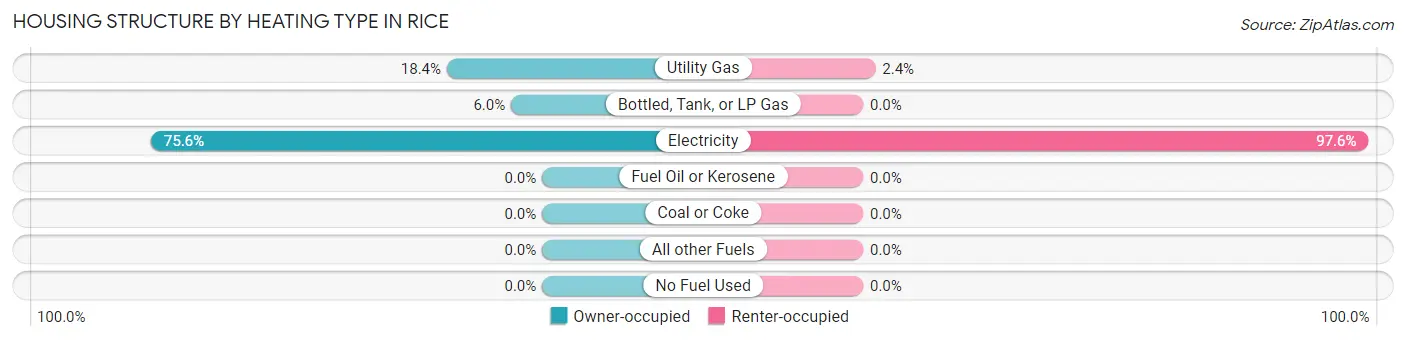
| Heating Type | Owner-occupied | Renter-occupied |
| Utility Gas | 46 (18.4%) | 2 (2.4%) |
| Bottled, Tank, or LP Gas | 15 (6.0%) | 0 (0.0%) |
| Electricity | 189 (75.6%) | 82 (97.6%) |
| Fuel Oil or Kerosene | 0 (0.0%) | 0 (0.0%) |
| Coal or Coke | 0 (0.0%) | 0 (0.0%) |
| All other Fuels | 0 (0.0%) | 0 (0.0%) |
| No Fuel Used | 0 (0.0%) | 0 (0.0%) |
| Total | 250 (100.0%) | 84 (100.0%) |
Household Vehicle Usage in Rice
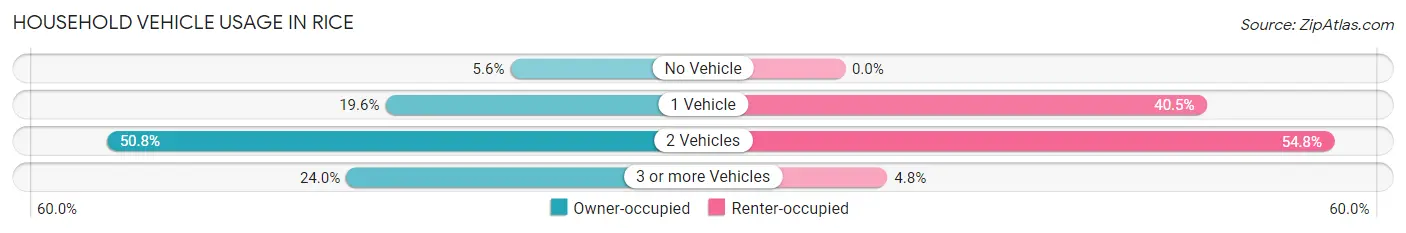
| Vehicles per Household | Owner-occupied | Renter-occupied |
| No Vehicle | 14 (5.6%) | 0 (0.0%) |
| 1 Vehicle | 49 (19.6%) | 34 (40.5%) |
| 2 Vehicles | 127 (50.8%) | 46 (54.8%) |
| 3 or more Vehicles | 60 (24.0%) | 4 (4.8%) |
| Total | 250 (100.0%) | 84 (100.0%) |
Real Estate & Mortgages in Rice
Real Estate and Mortgage Overview in Rice
| Characteristic | Without Mortgage | With Mortgage |
| Housing Units | 124 | 126 |
| Median Property Value | - | - |
| Median Household Income | $73,214 | $9 |
| Monthly Housing Costs | $844 | $0 |
| Real Estate Taxes | $2,967 | $9 |
Property Value by Mortgage Status in Rice
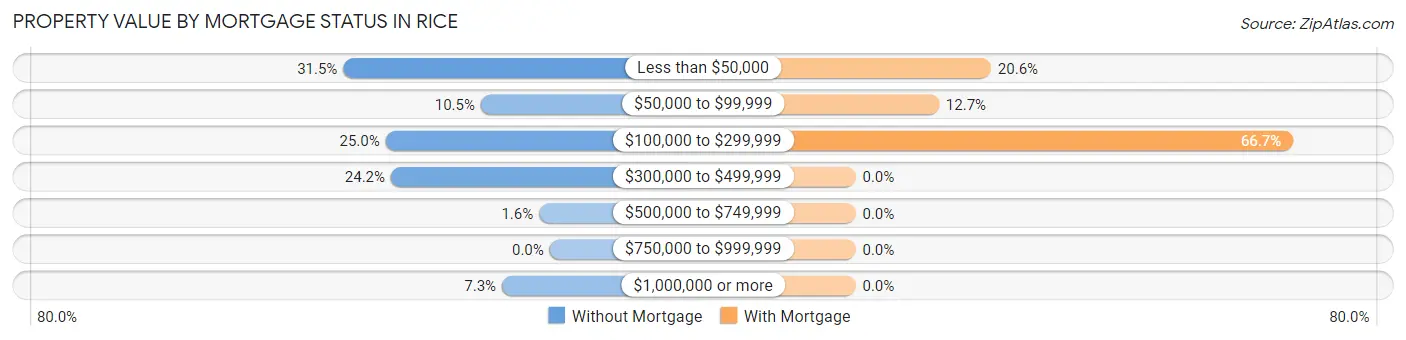
| Property Value | Without Mortgage | With Mortgage |
| Less than $50,000 | 39 (31.5%) | 26 (20.6%) |
| $50,000 to $99,999 | 13 (10.5%) | 16 (12.7%) |
| $100,000 to $299,999 | 31 (25.0%) | 84 (66.7%) |
| $300,000 to $499,999 | 30 (24.2%) | 0 (0.0%) |
| $500,000 to $749,999 | 2 (1.6%) | 0 (0.0%) |
| $750,000 to $999,999 | 0 (0.0%) | 0 (0.0%) |
| $1,000,000 or more | 9 (7.3%) | 0 (0.0%) |
| Total | 124 (100.0%) | 126 (100.0%) |
Household Income by Mortgage Status in Rice
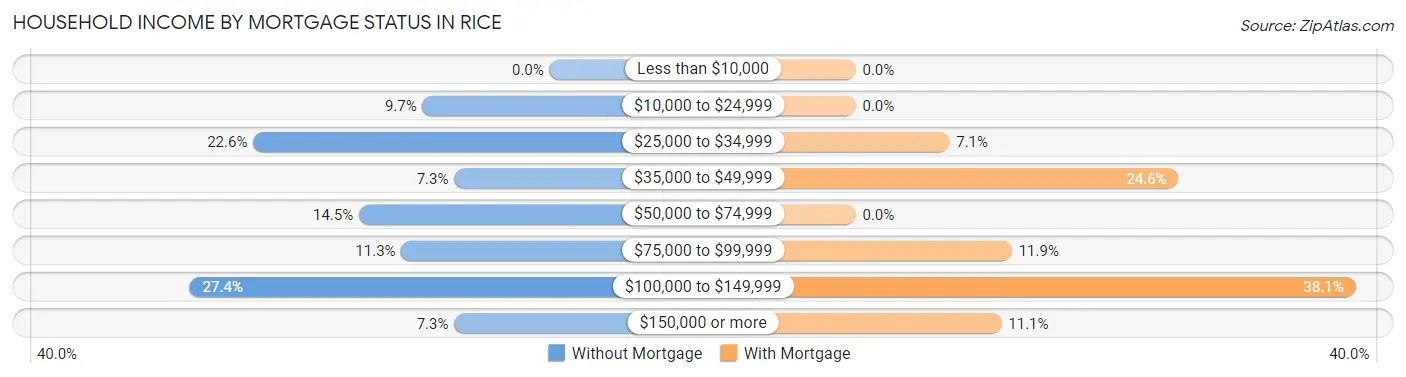
| Household Income | Without Mortgage | With Mortgage |
| Less than $10,000 | 0 (0.0%) | 0 (0.0%) |
| $10,000 to $24,999 | 12 (9.7%) | 0 (0.0%) |
| $25,000 to $34,999 | 28 (22.6%) | 9 (7.1%) |
| $35,000 to $49,999 | 9 (7.3%) | 31 (24.6%) |
| $50,000 to $74,999 | 18 (14.5%) | 0 (0.0%) |
| $75,000 to $99,999 | 14 (11.3%) | 15 (11.9%) |
| $100,000 to $149,999 | 34 (27.4%) | 48 (38.1%) |
| $150,000 or more | 9 (7.3%) | 14 (11.1%) |
| Total | 124 (100.0%) | 126 (100.0%) |
Property Value to Household Income Ratio in Rice
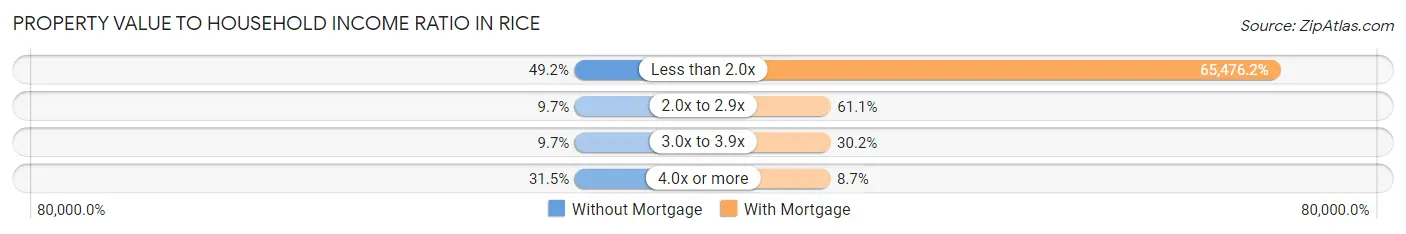
| Value-to-Income Ratio | Without Mortgage | With Mortgage |
| Less than 2.0x | 61 (49.2%) | 82,500 (65,476.2%) |
| 2.0x to 2.9x | 12 (9.7%) | 77 (61.1%) |
| 3.0x to 3.9x | 12 (9.7%) | 38 (30.2%) |
| 4.0x or more | 39 (31.5%) | 11 (8.7%) |
| Total | 124 (100.0%) | 126 (100.0%) |
Real Estate Taxes by Mortgage Status in Rice
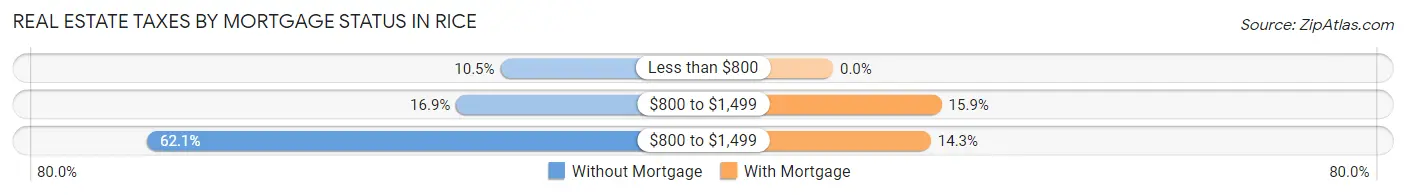
| Property Taxes | Without Mortgage | With Mortgage |
| Less than $800 | 13 (10.5%) | 0 (0.0%) |
| $800 to $1,499 | 21 (16.9%) | 20 (15.9%) |
| $800 to $1,499 | 77 (62.1%) | 18 (14.3%) |
| Total | 124 (100.0%) | 126 (100.0%) |
Health & Disability in Rice
Health Insurance Coverage by Age in Rice
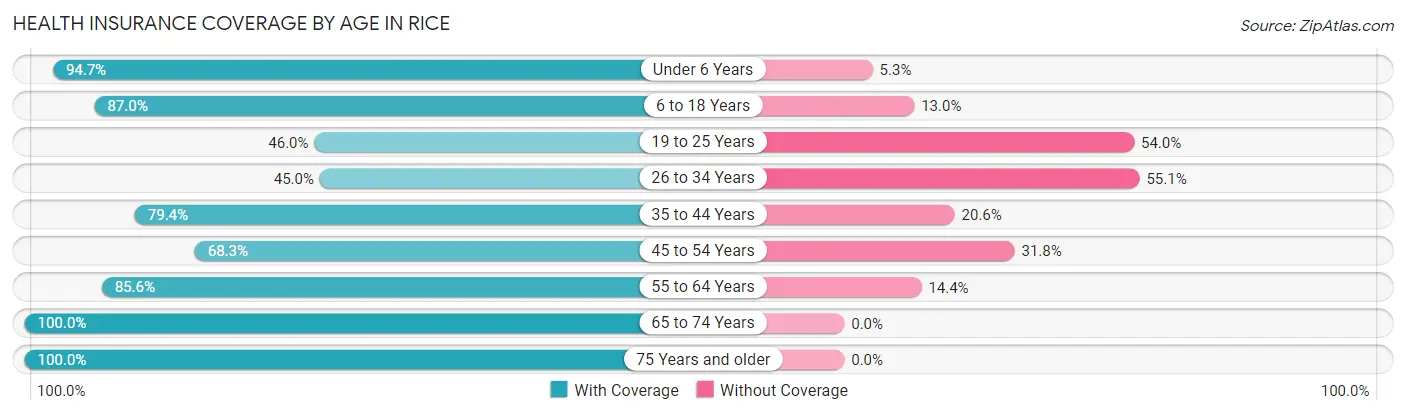
| Age Bracket | With Coverage | Without Coverage |
| Under 6 Years | 161 (94.7%) | 9 (5.3%) |
| 6 to 18 Years | 160 (87.0%) | 24 (13.0%) |
| 19 to 25 Years | 57 (46.0%) | 67 (54.0%) |
| 26 to 34 Years | 49 (45.0%) | 60 (55.0%) |
| 35 to 44 Years | 139 (79.4%) | 36 (20.6%) |
| 45 to 54 Years | 86 (68.2%) | 40 (31.8%) |
| 55 to 64 Years | 119 (85.6%) | 20 (14.4%) |
| 65 to 74 Years | 61 (100.0%) | 0 (0.0%) |
| 75 Years and older | 11 (100.0%) | 0 (0.0%) |
| Total | 843 (76.7%) | 256 (23.3%) |
Health Insurance Coverage by Citizenship Status in Rice
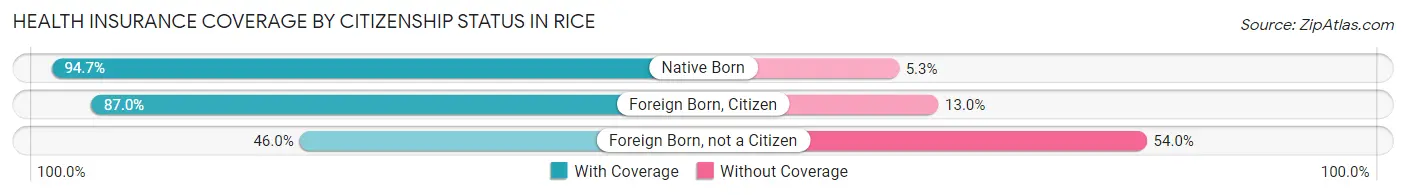
| Citizenship Status | With Coverage | Without Coverage |
| Native Born | 161 (94.7%) | 9 (5.3%) |
| Foreign Born, Citizen | 160 (87.0%) | 24 (13.0%) |
| Foreign Born, not a Citizen | 57 (46.0%) | 67 (54.0%) |
Health Insurance Coverage by Household Income in Rice
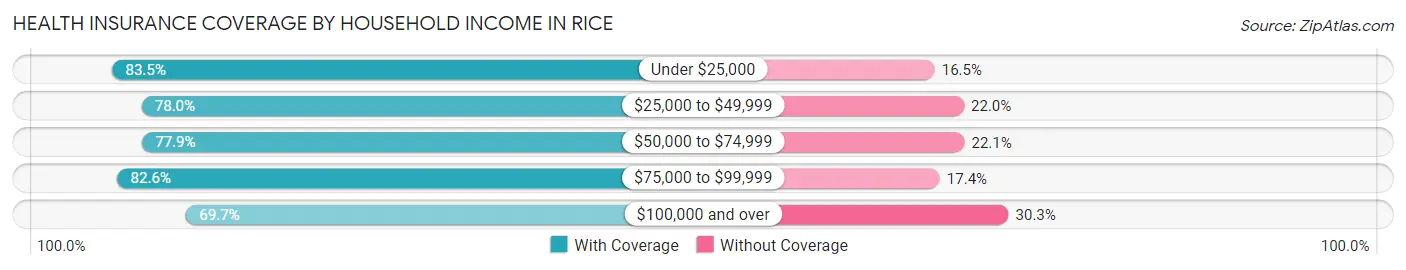
| Household Income | With Coverage | Without Coverage |
| Under $25,000 | 81 (83.5%) | 16 (16.5%) |
| $25,000 to $49,999 | 181 (78.0%) | 51 (22.0%) |
| $50,000 to $74,999 | 106 (77.9%) | 30 (22.1%) |
| $75,000 to $99,999 | 213 (82.6%) | 45 (17.4%) |
| $100,000 and over | 262 (69.7%) | 114 (30.3%) |
Public vs Private Health Insurance Coverage by Age in Rice
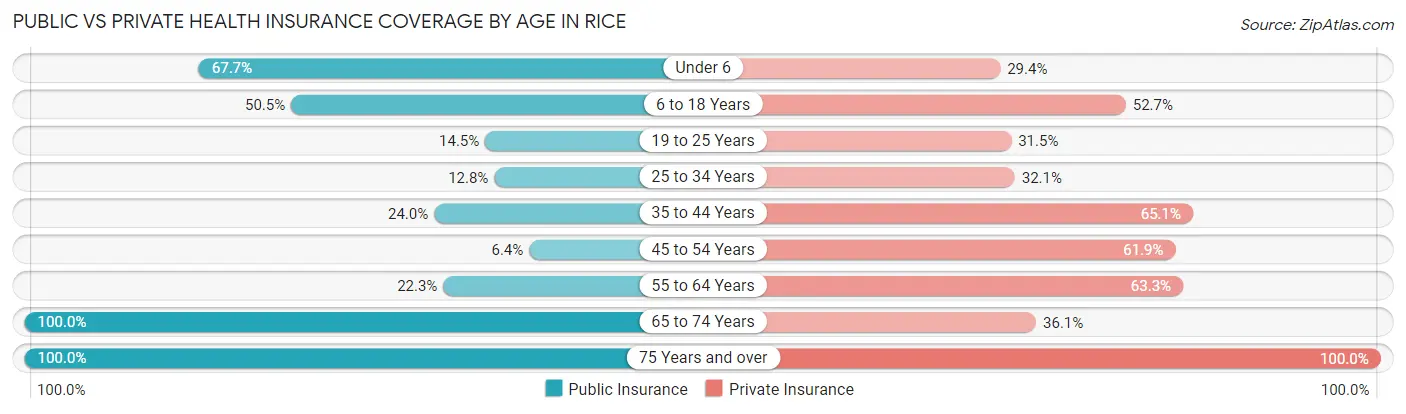
| Age Bracket | Public Insurance | Private Insurance |
| Under 6 | 115 (67.6%) | 50 (29.4%) |
| 6 to 18 Years | 93 (50.5%) | 97 (52.7%) |
| 19 to 25 Years | 18 (14.5%) | 39 (31.5%) |
| 25 to 34 Years | 14 (12.8%) | 35 (32.1%) |
| 35 to 44 Years | 42 (24.0%) | 114 (65.1%) |
| 45 to 54 Years | 8 (6.4%) | 78 (61.9%) |
| 55 to 64 Years | 31 (22.3%) | 88 (63.3%) |
| 65 to 74 Years | 61 (100.0%) | 22 (36.1%) |
| 75 Years and over | 11 (100.0%) | 11 (100.0%) |
| Total | 393 (35.8%) | 534 (48.6%) |
Disability Status by Sex by Age in Rice
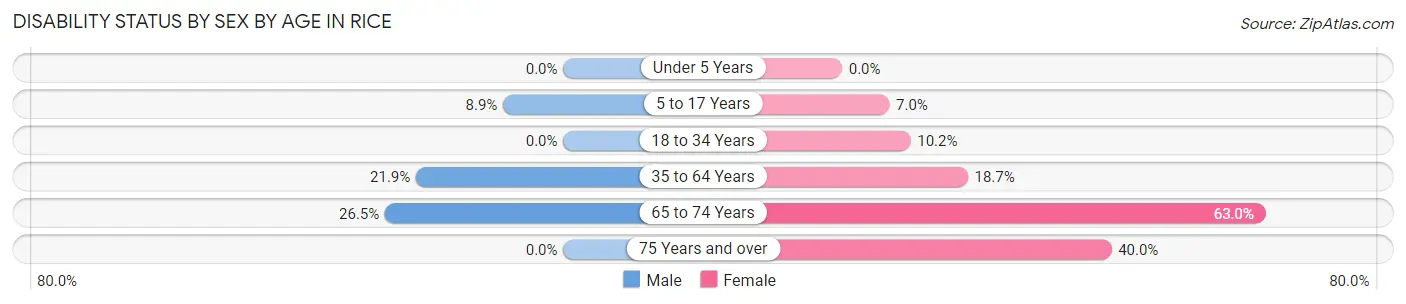
| Age Bracket | Male | Female |
| Under 5 Years | 0 (0.0%) | 0 (0.0%) |
| 5 to 17 Years | 5 (8.9%) | 9 (7.0%) |
| 18 to 34 Years | 0 (0.0%) | 12 (10.2%) |
| 35 to 64 Years | 47 (21.9%) | 42 (18.7%) |
| 65 to 74 Years | 9 (26.5%) | 17 (63.0%) |
| 75 Years and over | 0 (0.0%) | 2 (40.0%) |
Disability Class by Sex by Age in Rice
Disability Class: Hearing Difficulty
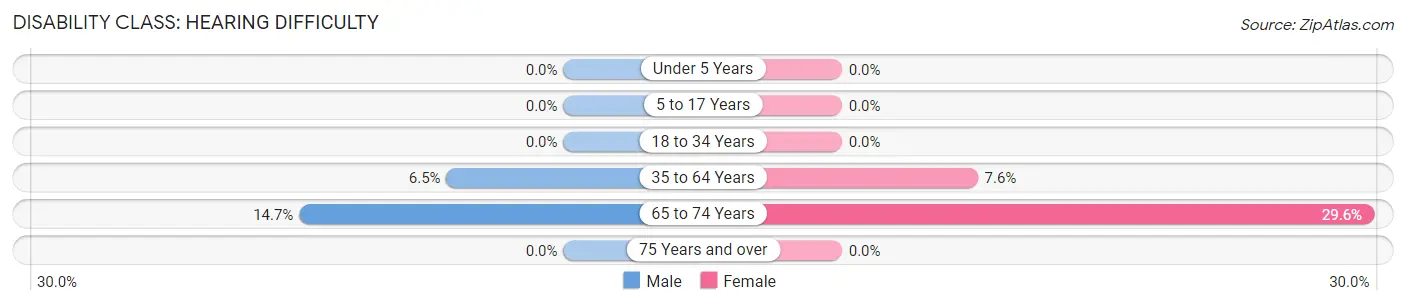
| Age Bracket | Male | Female |
| Under 5 Years | 0 (0.0%) | 0 (0.0%) |
| 5 to 17 Years | 0 (0.0%) | 0 (0.0%) |
| 18 to 34 Years | 0 (0.0%) | 0 (0.0%) |
| 35 to 64 Years | 14 (6.5%) | 17 (7.6%) |
| 65 to 74 Years | 5 (14.7%) | 8 (29.6%) |
| 75 Years and over | 0 (0.0%) | 0 (0.0%) |
Disability Class: Vision Difficulty
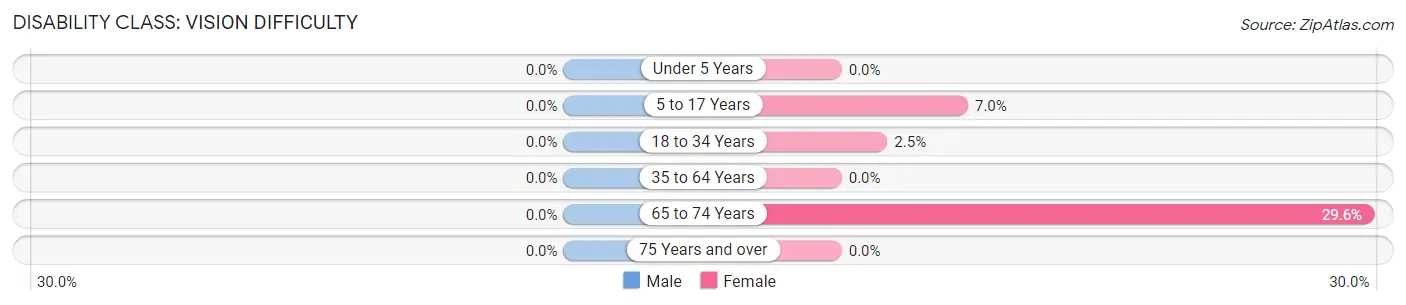
| Age Bracket | Male | Female |
| Under 5 Years | 0 (0.0%) | 0 (0.0%) |
| 5 to 17 Years | 0 (0.0%) | 9 (7.0%) |
| 18 to 34 Years | 0 (0.0%) | 3 (2.5%) |
| 35 to 64 Years | 0 (0.0%) | 0 (0.0%) |
| 65 to 74 Years | 0 (0.0%) | 8 (29.6%) |
| 75 Years and over | 0 (0.0%) | 0 (0.0%) |
Disability Class: Cognitive Difficulty
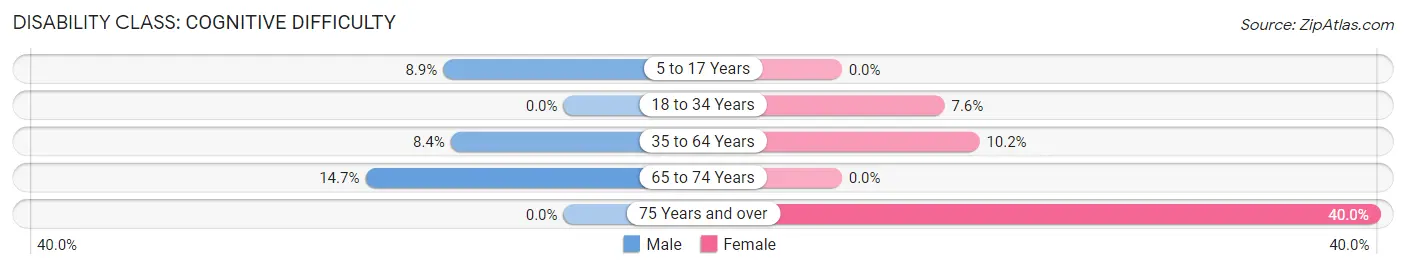
| Age Bracket | Male | Female |
| 5 to 17 Years | 5 (8.9%) | 0 (0.0%) |
| 18 to 34 Years | 0 (0.0%) | 9 (7.6%) |
| 35 to 64 Years | 18 (8.4%) | 23 (10.2%) |
| 65 to 74 Years | 5 (14.7%) | 0 (0.0%) |
| 75 Years and over | 0 (0.0%) | 2 (40.0%) |
Disability Class: Ambulatory Difficulty
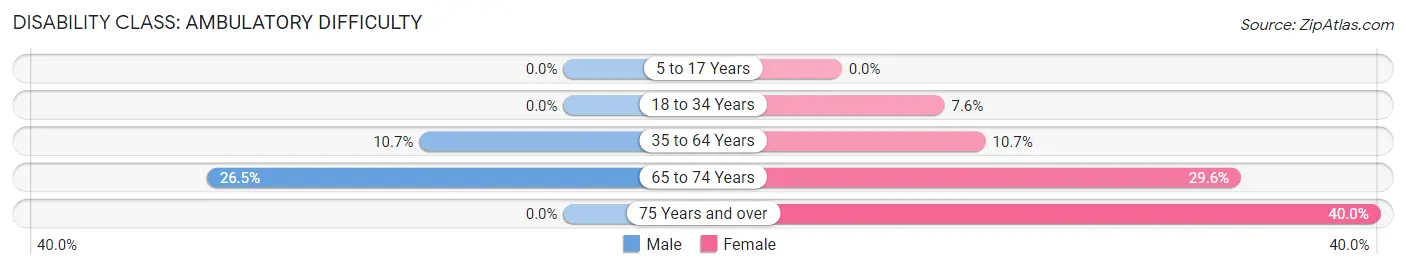
| Age Bracket | Male | Female |
| 5 to 17 Years | 0 (0.0%) | 0 (0.0%) |
| 18 to 34 Years | 0 (0.0%) | 9 (7.6%) |
| 35 to 64 Years | 23 (10.7%) | 24 (10.7%) |
| 65 to 74 Years | 9 (26.5%) | 8 (29.6%) |
| 75 Years and over | 0 (0.0%) | 2 (40.0%) |
Disability Class: Self-Care Difficulty
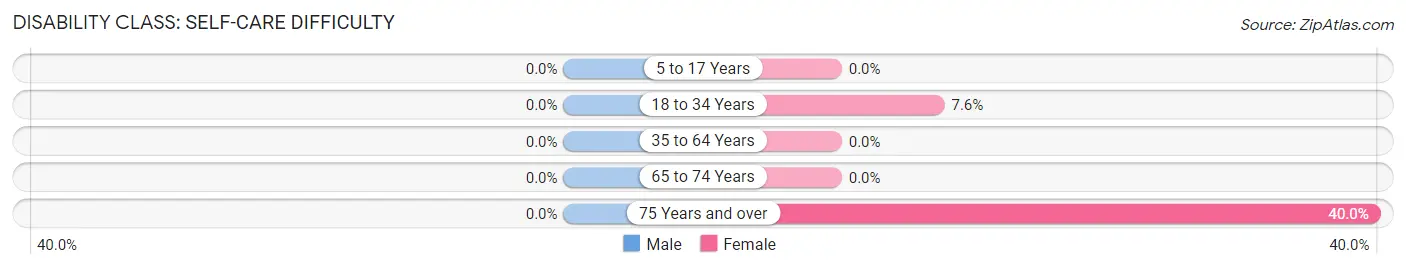
| Age Bracket | Male | Female |
| 5 to 17 Years | 0 (0.0%) | 0 (0.0%) |
| 18 to 34 Years | 0 (0.0%) | 9 (7.6%) |
| 35 to 64 Years | 0 (0.0%) | 0 (0.0%) |
| 65 to 74 Years | 0 (0.0%) | 0 (0.0%) |
| 75 Years and over | 0 (0.0%) | 2 (40.0%) |
Technology Access in Rice
Computing Device Access in Rice
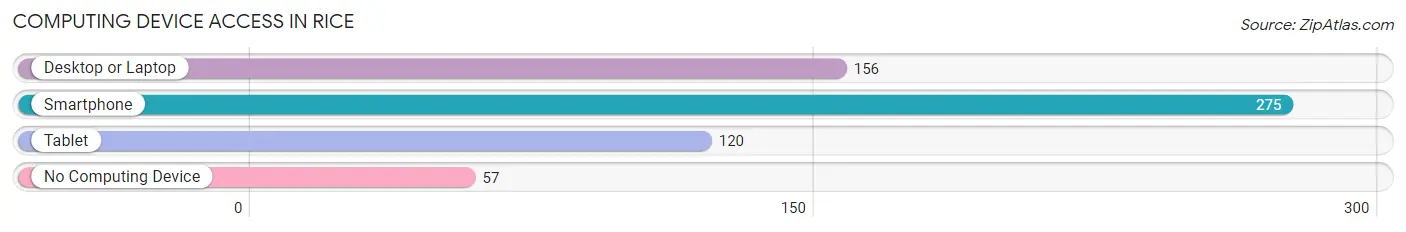
| Device Type | # Households | % Households |
| Desktop or Laptop | 156 | 46.7% |
| Smartphone | 275 | 82.3% |
| Tablet | 120 | 35.9% |
| No Computing Device | 57 | 17.1% |
| Total | 334 | 100.0% |
Internet Access in Rice
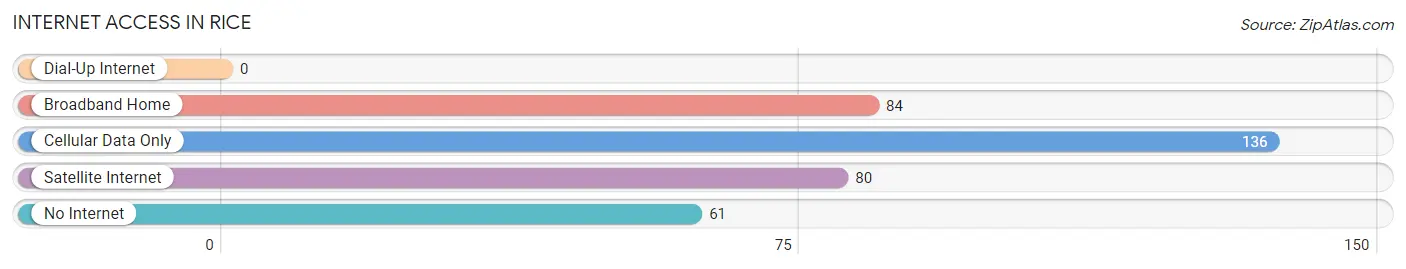
| Internet Type | # Households | % Households |
| Dial-Up Internet | 0 | 0.0% |
| Broadband Home | 84 | 25.2% |
| Cellular Data Only | 136 | 40.7% |
| Satellite Internet | 80 | 23.9% |
| No Internet | 61 | 18.3% |
| Total | 334 | 100.0% |
Rice Summary
Rice, Texas is a small town located in Navarro County, Texas, United States. It is situated about halfway between Dallas and Waco, and is part of the Corsicana Micropolitan Statistical Area. The town was founded in 1873 and named after the rice crop that was grown in the area. Rice has a population of 1,092 as of the 2010 census.
History
Rice was founded in 1873 by a group of settlers from Kentucky and Tennessee. The town was named after the rice crop that was grown in the area. The first post office was established in 1875 and the town was incorporated in 1876.
Rice was a farming community until the early 1900s when oil was discovered in the area. This led to an economic boom in the town and the population grew rapidly. The town was also home to several cotton gins and a cottonseed oil mill.
In the 1920s, Rice was home to a large number of African-American residents. The town had a segregated school system until the 1950s when the schools were integrated.
Geography
Rice is located at 31°45'25" North, 96°25'45" West (31.756944, -96.429167). The town is situated about halfway between Dallas and Waco, and is part of the Corsicana Micropolitan Statistical Area.
The town has a total area of 1.2 square miles, all of which is land. The terrain is mostly flat with some rolling hills. The climate is humid subtropical with hot summers and mild winters.
Economy
Rice is a small town with a limited economy. The town is home to several small businesses, including a grocery store, a hardware store, and a few restaurants. The town also has a few manufacturing plants, including a plastics plant and a metal fabrication plant.
The town is also home to a few oil and gas companies. The town is served by the Rice Independent School District.
Demographics
As of the 2010 census, Rice had a population of 1,092. The racial makeup of the town was 79.2% White, 16.2% African American, 0.7% Native American, 0.3% Asian, 0.1% Pacific Islander, 1.7% from other races, and 1.8% from two or more races. Hispanic or Latino of any race were 4.2% of the population.
The median income for a household in Rice was $37,500, and the median income for a family was $41,250. The per capita income for the town was $17,845. About 15.2% of families and 17.2% of the population were below the poverty line, including 22.2% of those under age 18 and 11.3% of those age 65 or over.
Rice is a small town with a limited economy and a diverse population. The town is home to a few small businesses and manufacturing plants, as well as some oil and gas companies. The town is served by the Rice Independent School District and has a population of 1,092 as of the 2010 census.
Common Questions
What is Per Capita Income in Rice?
Per Capita income in Rice is $21,432.
What is the Median Family Income in Rice?
Median Family Income in Rice is $78,250.
What is the Median Household income in Rice?
Median Household Income in Rice is $72,969.
What is Income or Wage Gap in Rice?
Income or Wage Gap in Rice is 52.7%.
Women in Rice earn 47.3 cents for every dollar earned by a man.
What is Inequality or Gini Index in Rice?
Inequality or Gini Index in Rice is 0.33.
What is the Total Population of Rice?
Total Population of Rice is 1,119.
What is the Total Male Population of Rice?
Total Male Population of Rice is 489.
What is the Total Female Population of Rice?
Total Female Population of Rice is 630.
What is the Ratio of Males per 100 Females in Rice?
There are 77.62 Males per 100 Females in Rice.
What is the Ratio of Females per 100 Males in Rice?
There are 128.83 Females per 100 Males in Rice.
What is the Median Population Age in Rice?
Median Population Age in Rice is 30.3 Years.
What is the Average Family Size in Rice
Average Family Size in Rice is 3.8 People.
What is the Average Household Size in Rice
Average Household Size in Rice is 3.4 People.
How Large is the Labor Force in Rice?
There are 552 People in the Labor Forcein in Rice.
What is the Percentage of People in the Labor Force in Rice?
70.4% of People are in the Labor Force in Rice.
What is the Unemployment Rate in Rice?
Unemployment Rate in Rice is 1.9%.