Quitman, TX Map & Demographics
Quitman Map
Quitman Overview
$26,808
PER CAPITA INCOME
$59,846
AVG FAMILY INCOME
$58,924
AVG HOUSEHOLD INCOME
29.0%
WAGE / INCOME GAP [ % ]
71.0¢/ $1
WAGE / INCOME GAP [ $ ]
0.40
INEQUALITY / GINI INDEX
2,301
TOTAL POPULATION
1,103
MALE POPULATION
1,198
FEMALE POPULATION
92.07
MALES / 100 FEMALES
108.61
FEMALES / 100 MALES
42.1
MEDIAN AGE
3.0
AVG FAMILY SIZE
2.6
AVG HOUSEHOLD SIZE
839
LABOR FORCE [ PEOPLE ]
47.1%
PERCENT IN LABOR FORCE
7.7%
UNEMPLOYMENT RATE
Quitman Zip Codes
Quitman Area Codes
Income in Quitman
Income Overview in Quitman
Per Capita Income in Quitman is $26,808, while median incomes of families and households are $59,846 and $58,924 respectively.
| Characteristic | Number | Measure |
| Per Capita Income | 2,301 | $26,808 |
| Median Family Income | 572 | $59,846 |
| Mean Family Income | 572 | $82,687 |
| Median Household Income | 816 | $58,924 |
| Mean Household Income | 816 | $70,667 |
| Income Deficit | 572 | $0 |
| Wage / Income Gap (%) | 2,301 | 29.01% |
| Wage / Income Gap ($) | 2,301 | 70.99¢ per $1 |
| Gini / Inequality Index | 2,301 | 0.40 |
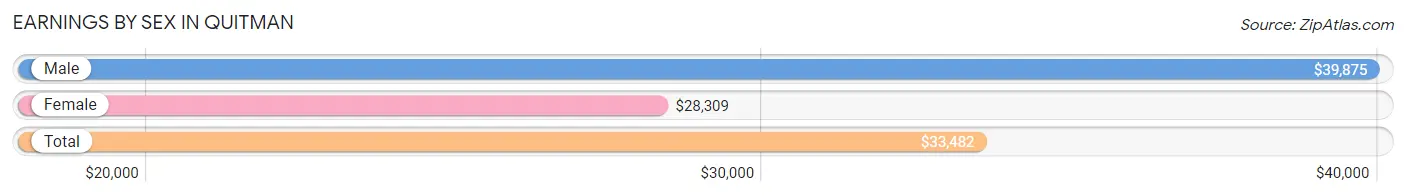
Earnings by Sex in Quitman
Average Earnings in Quitman are $33,482, $39,875 for men and $28,309 for women, a difference of 29.0%.
| Sex | Number | Average Earnings |
| Male | 549 (54.8%) | $39,875 |
| Female | 453 (45.2%) | $28,309 |
| Total | 1,002 (100.0%) | $33,482 |
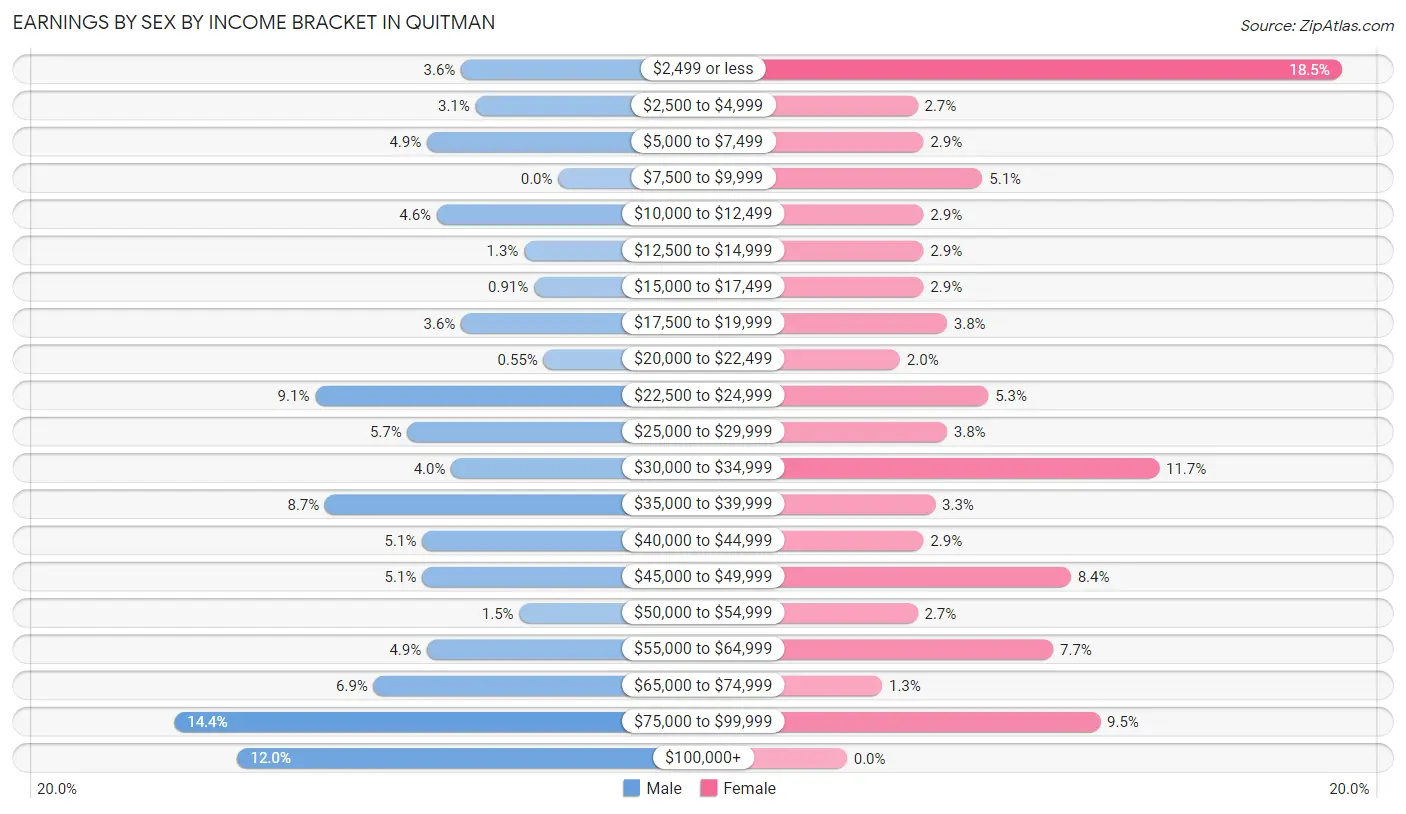
Earnings by Sex by Income Bracket in Quitman
The most common earnings brackets in Quitman are $75,000 to $99,999 for men (79 | 14.4%) and $2,499 or less for women (84 | 18.5%).
| Income | Male | Female |
| $2,499 or less | 20 (3.6%) | 84 (18.5%) |
| $2,500 to $4,999 | 17 (3.1%) | 12 (2.6%) |
| $5,000 to $7,499 | 27 (4.9%) | 13 (2.9%) |
| $7,500 to $9,999 | 0 (0.0%) | 23 (5.1%) |
| $10,000 to $12,499 | 25 (4.5%) | 13 (2.9%) |
| $12,500 to $14,999 | 7 (1.3%) | 13 (2.9%) |
| $15,000 to $17,499 | 5 (0.9%) | 13 (2.9%) |
| $17,500 to $19,999 | 20 (3.6%) | 17 (3.7%) |
| $20,000 to $22,499 | 3 (0.5%) | 9 (2.0%) |
| $22,500 to $24,999 | 50 (9.1%) | 24 (5.3%) |
| $25,000 to $29,999 | 31 (5.7%) | 17 (3.7%) |
| $30,000 to $34,999 | 22 (4.0%) | 53 (11.7%) |
| $35,000 to $39,999 | 48 (8.7%) | 15 (3.3%) |
| $40,000 to $44,999 | 28 (5.1%) | 13 (2.9%) |
| $45,000 to $49,999 | 28 (5.1%) | 38 (8.4%) |
| $50,000 to $54,999 | 8 (1.5%) | 12 (2.6%) |
| $55,000 to $64,999 | 27 (4.9%) | 35 (7.7%) |
| $65,000 to $74,999 | 38 (6.9%) | 6 (1.3%) |
| $75,000 to $99,999 | 79 (14.4%) | 43 (9.5%) |
| $100,000+ | 66 (12.0%) | 0 (0.0%) |
| Total | 549 (100.0%) | 453 (100.0%) |
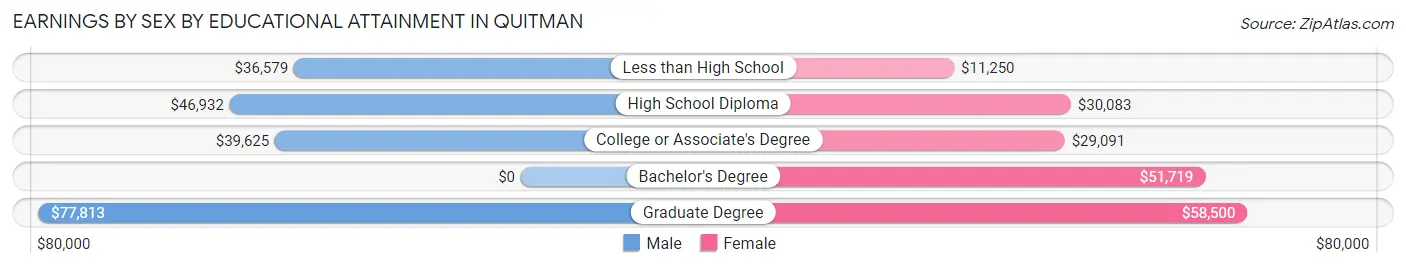
Earnings by Sex by Educational Attainment in Quitman
Average earnings in Quitman are $46,932 for men and $31,992 for women, a difference of 31.8%. Men with an educational attainment of graduate degree enjoy the highest average annual earnings of $77,813, while those with less than high school education earn the least with $36,579. Women with an educational attainment of graduate degree earn the most with the average annual earnings of $58,500, while those with less than high school education have the smallest earnings of $11,250.
| Educational Attainment | Male Income | Female Income |
| Less than High School | $36,579 | $11,250 |
| High School Diploma | $46,932 | $30,083 |
| College or Associate's Degree | $39,625 | $29,091 |
| Bachelor's Degree | - | - |
| Graduate Degree | $77,813 | $58,500 |
| Total | $46,932 | $31,992 |
Family Income in Quitman
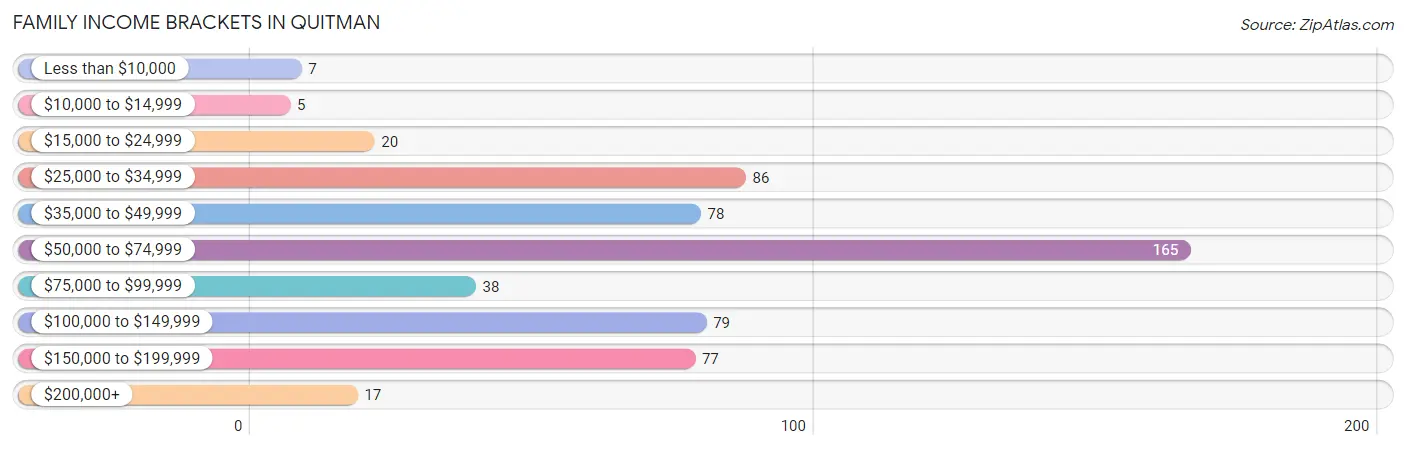
Family Income Brackets in Quitman
According to the Quitman family income data, there are 165 families falling into the $50,000 to $74,999 income range, which is the most common income bracket and makes up 28.8% of all families. Conversely, the $10,000 to $14,999 income bracket is the least frequent group with only 5 families (0.9%) belonging to this category.
| Income Bracket | # Families | % Families |
| Less than $10,000 | 7 | 1.2% |
| $10,000 to $14,999 | 5 | 0.9% |
| $15,000 to $24,999 | 20 | 3.5% |
| $25,000 to $34,999 | 86 | 15.0% |
| $35,000 to $49,999 | 78 | 13.6% |
| $50,000 to $74,999 | 165 | 28.8% |
| $75,000 to $99,999 | 38 | 6.6% |
| $100,000 to $149,999 | 79 | 13.8% |
| $150,000 to $199,999 | 77 | 13.5% |
| $200,000+ | 17 | 3.0% |
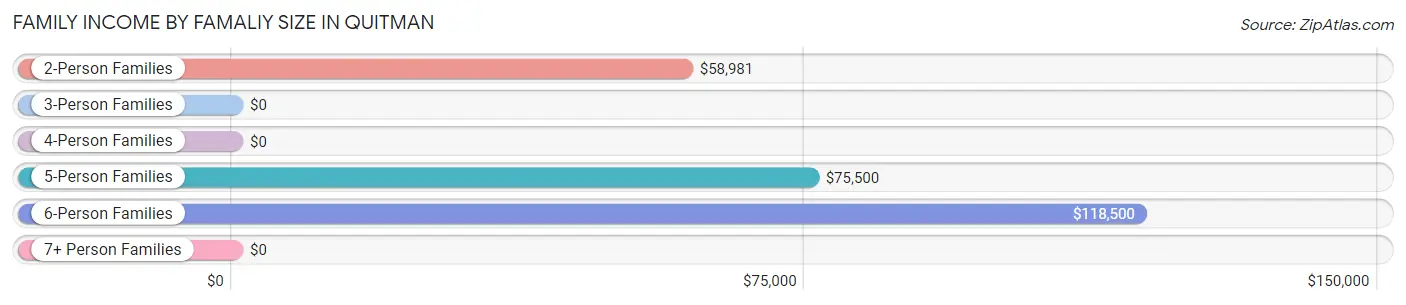
Family Income by Famaliy Size in Quitman
6-person families (18 | 3.2%) account for the highest median family income in Quitman with $118,500 per family, while 2-person families (343 | 60.0%) have the highest median income of $29,490 per family member.
| Income Bracket | # Families | Median Income |
| 2-Person Families | 343 (60.0%) | $58,981 |
| 3-Person Families | 80 (14.0%) | $0 |
| 4-Person Families | 103 (18.0%) | $0 |
| 5-Person Families | 16 (2.8%) | $75,500 |
| 6-Person Families | 18 (3.2%) | $118,500 |
| 7+ Person Families | 12 (2.1%) | $0 |
| Total | 572 (100.0%) | $59,846 |
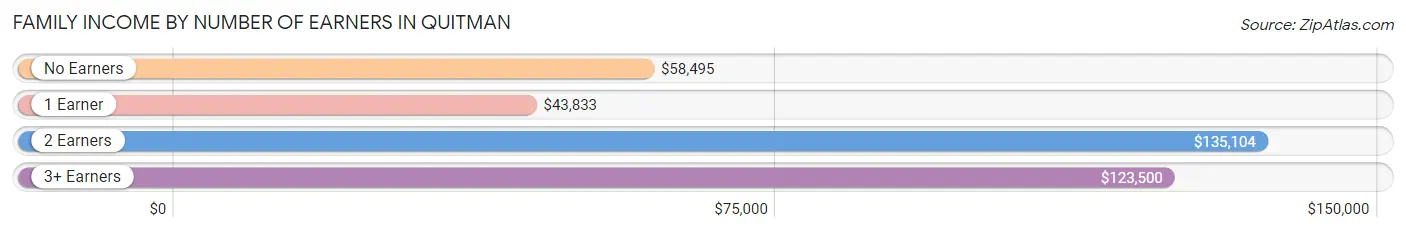
Family Income by Number of Earners in Quitman
The median family income in Quitman is $59,846, with families comprising 2 earners (189) having the highest median family income of $135,104, while families with 1 earner (208) have the lowest median family income of $43,833, accounting for 33.0% and 36.4% of families, respectively.
| Number of Earners | # Families | Median Income |
| No Earners | 135 (23.6%) | $58,495 |
| 1 Earner | 208 (36.4%) | $43,833 |
| 2 Earners | 189 (33.0%) | $135,104 |
| 3+ Earners | 40 (7.0%) | $123,500 |
| Total | 572 (100.0%) | $59,846 |
Household Income in Quitman
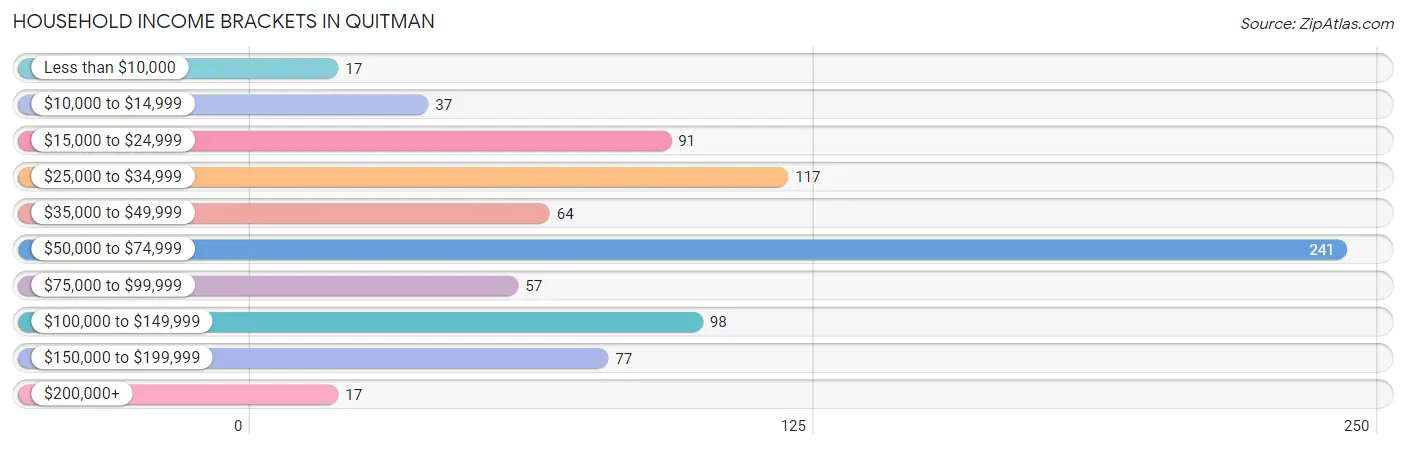
Household Income Brackets in Quitman
With 241 households falling in the category, the $50,000 to $74,999 income range is the most frequent in Quitman, accounting for 29.5% of all households. In contrast, only 17 households (2.1%) fall into the less than $10,000 income bracket, making it the least populous group.
| Income Bracket | # Households | % Households |
| Less than $10,000 | 17 | 2.1% |
| $10,000 to $14,999 | 37 | 4.5% |
| $15,000 to $24,999 | 91 | 11.2% |
| $25,000 to $34,999 | 117 | 14.3% |
| $35,000 to $49,999 | 64 | 7.8% |
| $50,000 to $74,999 | 241 | 29.5% |
| $75,000 to $99,999 | 57 | 7.0% |
| $100,000 to $149,999 | 98 | 12.0% |
| $150,000 to $199,999 | 77 | 9.4% |
| $200,000+ | 17 | 2.1% |
Household Income by Householder Age in Quitman
The median household income in Quitman is $58,924, with the highest median household income of $83,750 found in the 25 to 44 years age bracket for the primary householder. A total of 192 households (23.5%) fall into this category. Meanwhile, the 15 to 24 years age bracket for the primary householder has the lowest median household income of $0, with 16 households (2.0%) in this group.
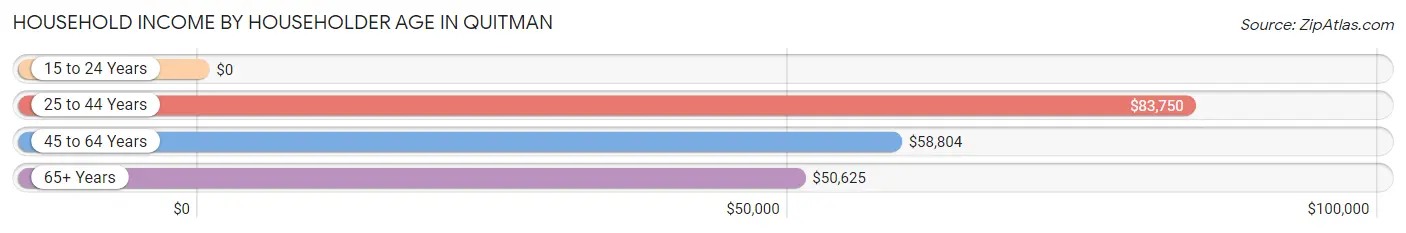
| Income Bracket | # Households | Median Income |
| 15 to 24 Years | 16 (2.0%) | $0 |
| 25 to 44 Years | 192 (23.5%) | $83,750 |
| 45 to 64 Years | 268 (32.8%) | $58,804 |
| 65+ Years | 340 (41.7%) | $50,625 |
| Total | 816 (100.0%) | $58,924 |
Poverty in Quitman
Income Below Poverty by Sex and Age in Quitman
With 7.4% poverty level for males and 12.8% for females among the residents of Quitman, 16 and 17 year old males and 18 to 24 year old females are the most vulnerable to poverty, with 9 males (30.0%) and 34 females (50.0%) in their respective age groups living below the poverty level.
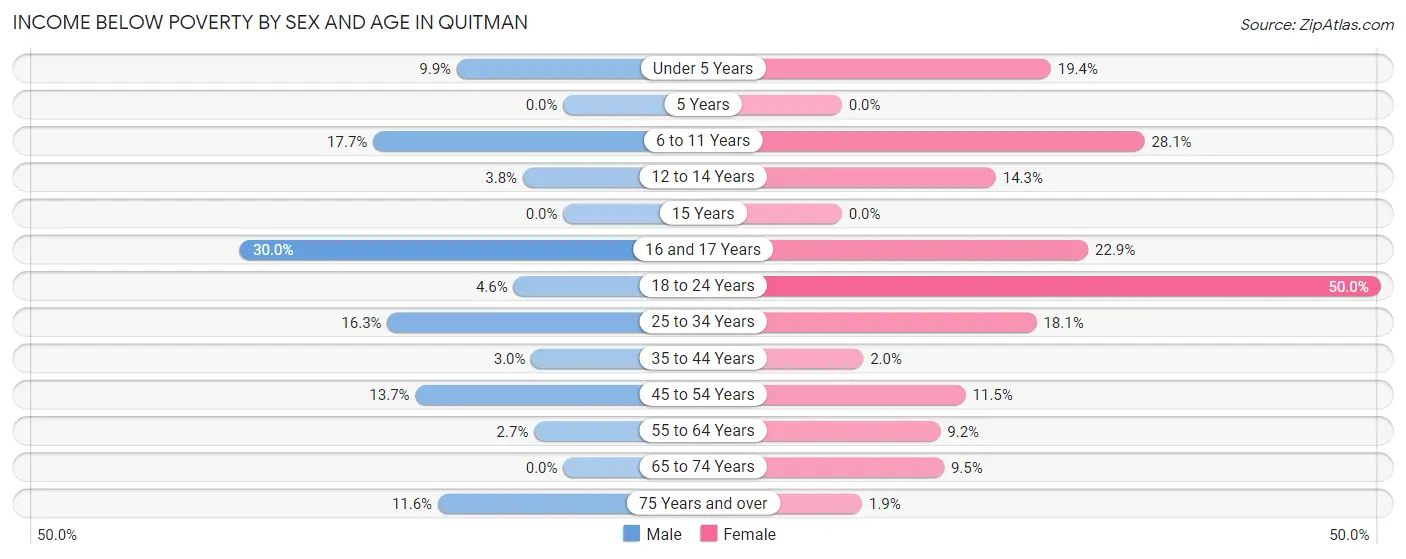
| Age Bracket | Male | Female |
| Under 5 Years | 8 (9.9%) | 13 (19.4%) |
| 5 Years | 0 (0.0%) | 0 (0.0%) |
| 6 to 11 Years | 3 (17.6%) | 25 (28.1%) |
| 12 to 14 Years | 3 (3.7%) | 8 (14.3%) |
| 15 Years | 0 (0.0%) | 0 (0.0%) |
| 16 and 17 Years | 9 (30.0%) | 8 (22.9%) |
| 18 to 24 Years | 3 (4.6%) | 34 (50.0%) |
| 25 to 34 Years | 8 (16.3%) | 15 (18.1%) |
| 35 to 44 Years | 3 (3.0%) | 3 (2.0%) |
| 45 to 54 Years | 14 (13.7%) | 10 (11.5%) |
| 55 to 64 Years | 4 (2.7%) | 13 (9.1%) |
| 65 to 74 Years | 0 (0.0%) | 11 (9.5%) |
| 75 Years and over | 17 (11.6%) | 3 (1.9%) |
| Total | 72 (7.4%) | 143 (12.8%) |
Income Above Poverty by Sex and Age in Quitman
According to the poverty statistics in Quitman, males aged 5 years and females aged 5 years are the age groups that are most secure financially, with 100.0% of males and 100.0% of females in these age groups living above the poverty line.
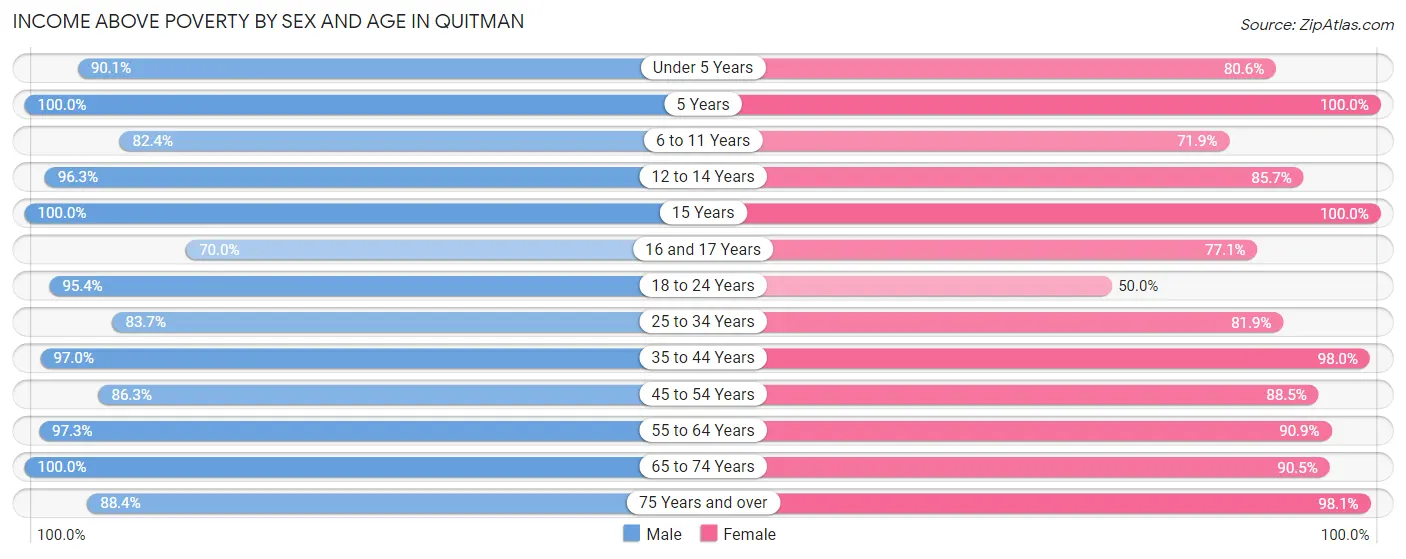
| Age Bracket | Male | Female |
| Under 5 Years | 73 (90.1%) | 54 (80.6%) |
| 5 Years | 35 (100.0%) | 6 (100.0%) |
| 6 to 11 Years | 14 (82.4%) | 64 (71.9%) |
| 12 to 14 Years | 77 (96.3%) | 48 (85.7%) |
| 15 Years | 27 (100.0%) | 54 (100.0%) |
| 16 and 17 Years | 21 (70.0%) | 27 (77.1%) |
| 18 to 24 Years | 62 (95.4%) | 34 (50.0%) |
| 25 to 34 Years | 41 (83.7%) | 68 (81.9%) |
| 35 to 44 Years | 98 (97.0%) | 148 (98.0%) |
| 45 to 54 Years | 88 (86.3%) | 77 (88.5%) |
| 55 to 64 Years | 144 (97.3%) | 129 (90.8%) |
| 65 to 74 Years | 85 (100.0%) | 105 (90.5%) |
| 75 Years and over | 129 (88.4%) | 157 (98.1%) |
| Total | 894 (92.5%) | 971 (87.2%) |
Income Below Poverty Among Married-Couple Families in Quitman
The poverty statistics for married-couple families in Quitman show that 1.5% or 6 of the total 394 families live below the poverty line. Families with 5 or more children have the highest poverty rate of 100.0%, comprising of 4 families. On the other hand, families with 1 or 2 children have the lowest poverty rate of 0.0%, which includes 0 families.
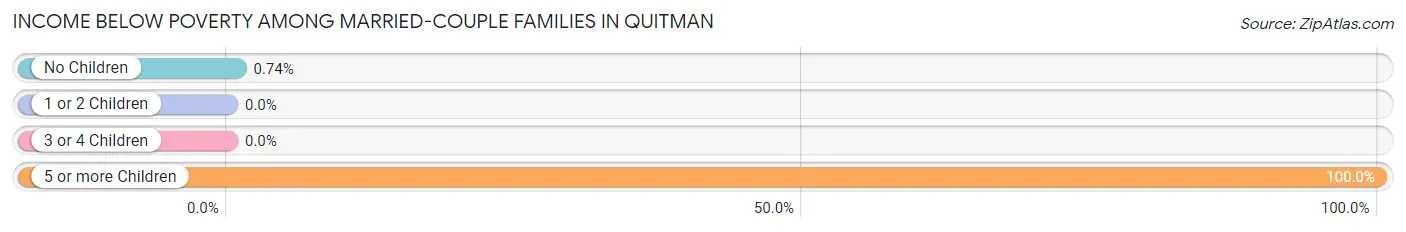
| Children | Above Poverty | Below Poverty |
| No Children | 268 (99.3%) | 2 (0.7%) |
| 1 or 2 Children | 86 (100.0%) | 0 (0.0%) |
| 3 or 4 Children | 34 (100.0%) | 0 (0.0%) |
| 5 or more Children | 0 (0.0%) | 4 (100.0%) |
| Total | 388 (98.5%) | 6 (1.5%) |
Income Below Poverty Among Single-Parent Households in Quitman
According to the poverty data in Quitman, 24.4% or 11 single-father households and 12.0% or 16 single-mother households are living below the poverty line. Among single-father households, those with 1 or 2 children have the highest poverty rate, with 7 households (35.0%) experiencing poverty. Likewise, among single-mother households, those with 5 or more children have the highest poverty rate, with 3 households (100.0%) falling below the poverty line.
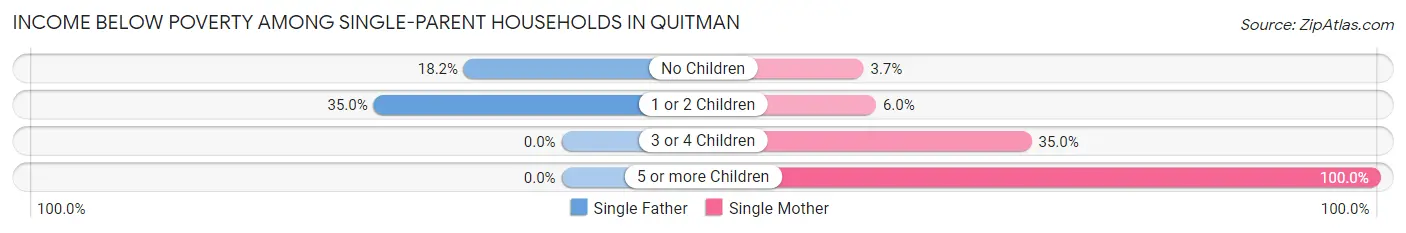
| Children | Single Father | Single Mother |
| No Children | 4 (18.2%) | 1 (3.7%) |
| 1 or 2 Children | 7 (35.0%) | 5 (6.0%) |
| 3 or 4 Children | 0 (0.0%) | 7 (35.0%) |
| 5 or more Children | 0 (0.0%) | 3 (100.0%) |
| Total | 11 (24.4%) | 16 (12.0%) |
Income Below Poverty Among Married-Couple vs Single-Parent Households in Quitman
The poverty data for Quitman shows that 6 of the married-couple family households (1.5%) and 27 of the single-parent households (15.2%) are living below the poverty level. Within the married-couple family households, those with 5 or more children have the highest poverty rate, with 4 households (100.0%) falling below the poverty line. Among the single-parent households, those with 5 or more children have the highest poverty rate, with 3 household (100.0%) living below poverty.
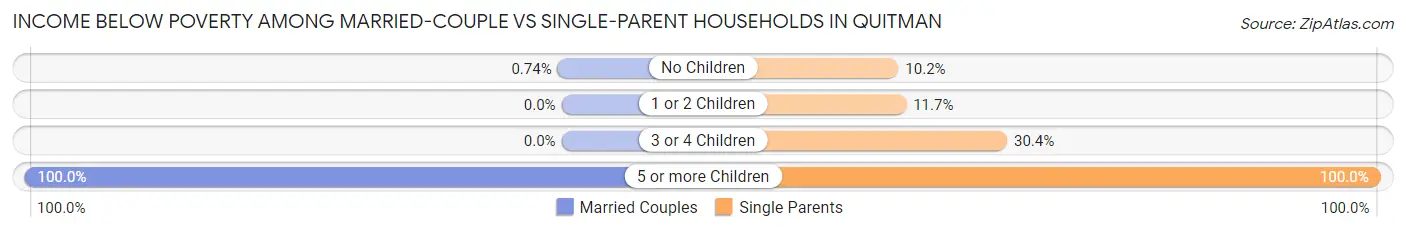
| Children | Married-Couple Families | Single-Parent Households |
| No Children | 2 (0.7%) | 5 (10.2%) |
| 1 or 2 Children | 0 (0.0%) | 12 (11.7%) |
| 3 or 4 Children | 0 (0.0%) | 7 (30.4%) |
| 5 or more Children | 4 (100.0%) | 3 (100.0%) |
| Total | 6 (1.5%) | 27 (15.2%) |
Race in Quitman
The most populous races in Quitman are White / Caucasian (2,062 | 89.6%), Hispanic or Latino (251 | 10.9%), and Two or more Races (181 | 7.9%).
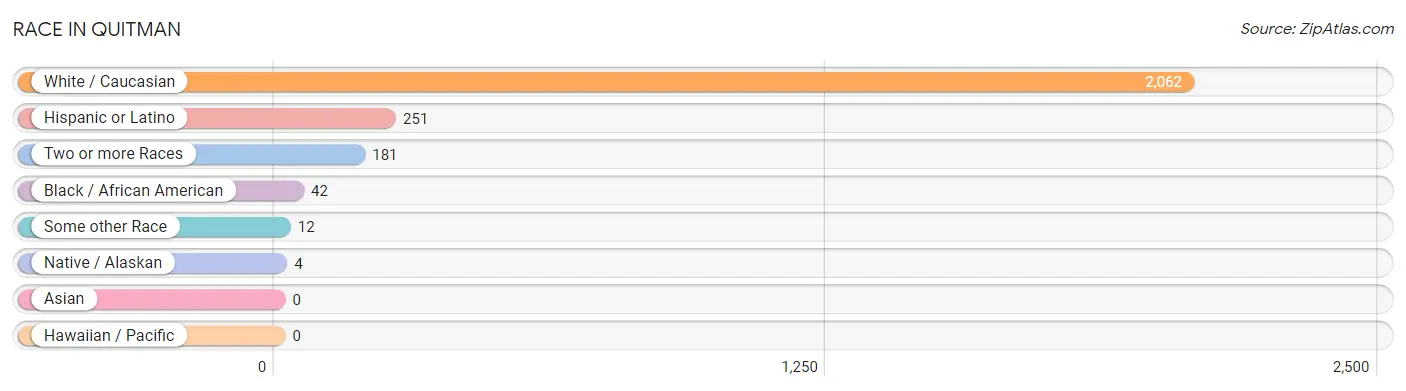
| Race | # Population | % Population |
| Asian | 0 | 0.0% |
| Black / African American | 42 | 1.8% |
| Hawaiian / Pacific | 0 | 0.0% |
| Hispanic or Latino | 251 | 10.9% |
| Native / Alaskan | 4 | 0.2% |
| White / Caucasian | 2,062 | 89.6% |
| Two or more Races | 181 | 7.9% |
| Some other Race | 12 | 0.5% |
| Total | 2,301 | 100.0% |
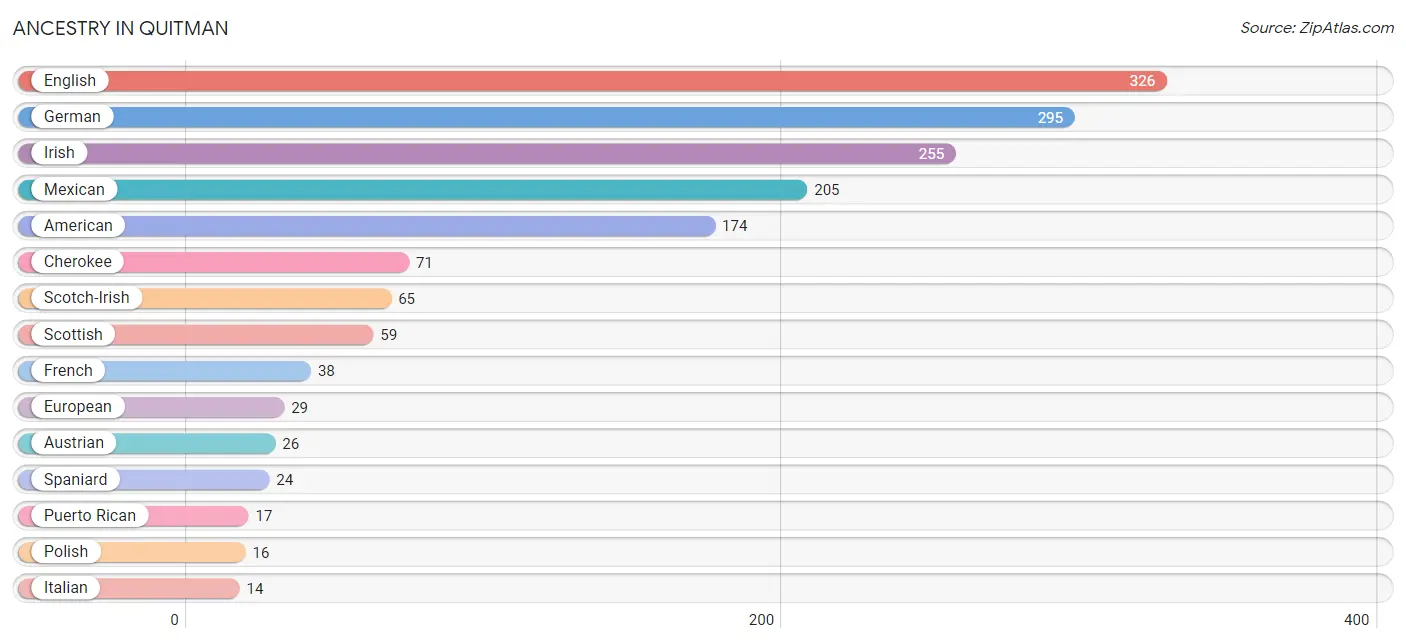
Ancestry in Quitman
The most populous ancestries reported in Quitman are English (326 | 14.2%), German (295 | 12.8%), Irish (255 | 11.1%), Mexican (205 | 8.9%), and American (174 | 7.6%), together accounting for 54.5% of all Quitman residents.
| Ancestry | # Population | % Population |
| African | 1 | 0.0% |
| American | 174 | 7.6% |
| Austrian | 26 | 1.1% |
| Blackfeet | 4 | 0.2% |
| British | 3 | 0.1% |
| Canadian | 5 | 0.2% |
| Central American | 4 | 0.2% |
| Cherokee | 71 | 3.1% |
| Choctaw | 7 | 0.3% |
| Comanche | 3 | 0.1% |
| Czech | 5 | 0.2% |
| Dutch | 9 | 0.4% |
| Dutch West Indian | 12 | 0.5% |
| English | 326 | 14.2% |
| European | 29 | 1.3% |
| French | 38 | 1.7% |
| German | 295 | 12.8% |
| Guatemalan | 4 | 0.2% |
| Irish | 255 | 11.1% |
| Iroquois | 4 | 0.2% |
| Italian | 14 | 0.6% |
| Mexican | 205 | 8.9% |
| New Zealander | 3 | 0.1% |
| Polish | 16 | 0.7% |
| Puerto Rican | 17 | 0.7% |
| Russian | 8 | 0.4% |
| Scotch-Irish | 65 | 2.8% |
| Scottish | 59 | 2.6% |
| Shoshone | 7 | 0.3% |
| Sioux | 4 | 0.2% |
| Spaniard | 24 | 1.0% |
| Subsaharan African | 1 | 0.0% |
| Swedish | 2 | 0.1% |
| Ukrainian | 4 | 0.2% |
| Welsh | 14 | 0.6% | View All 35 Rows |
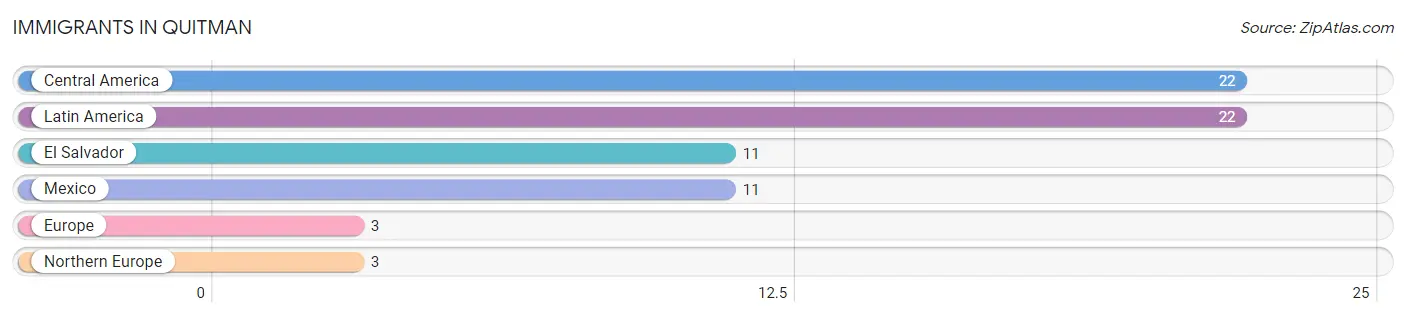
Immigrants in Quitman
The most numerous immigrant groups reported in Quitman came from Central America (22 | 1.0%), Latin America (22 | 1.0%), El Salvador (11 | 0.5%), Mexico (11 | 0.5%), and Europe (3 | 0.1%), together accounting for 3.0% of all Quitman residents.
| Immigration Origin | # Population | % Population |
| Central America | 22 | 1.0% |
| El Salvador | 11 | 0.5% |
| Europe | 3 | 0.1% |
| Latin America | 22 | 1.0% |
| Mexico | 11 | 0.5% |
| Northern Europe | 3 | 0.1% | View All 6 Rows |
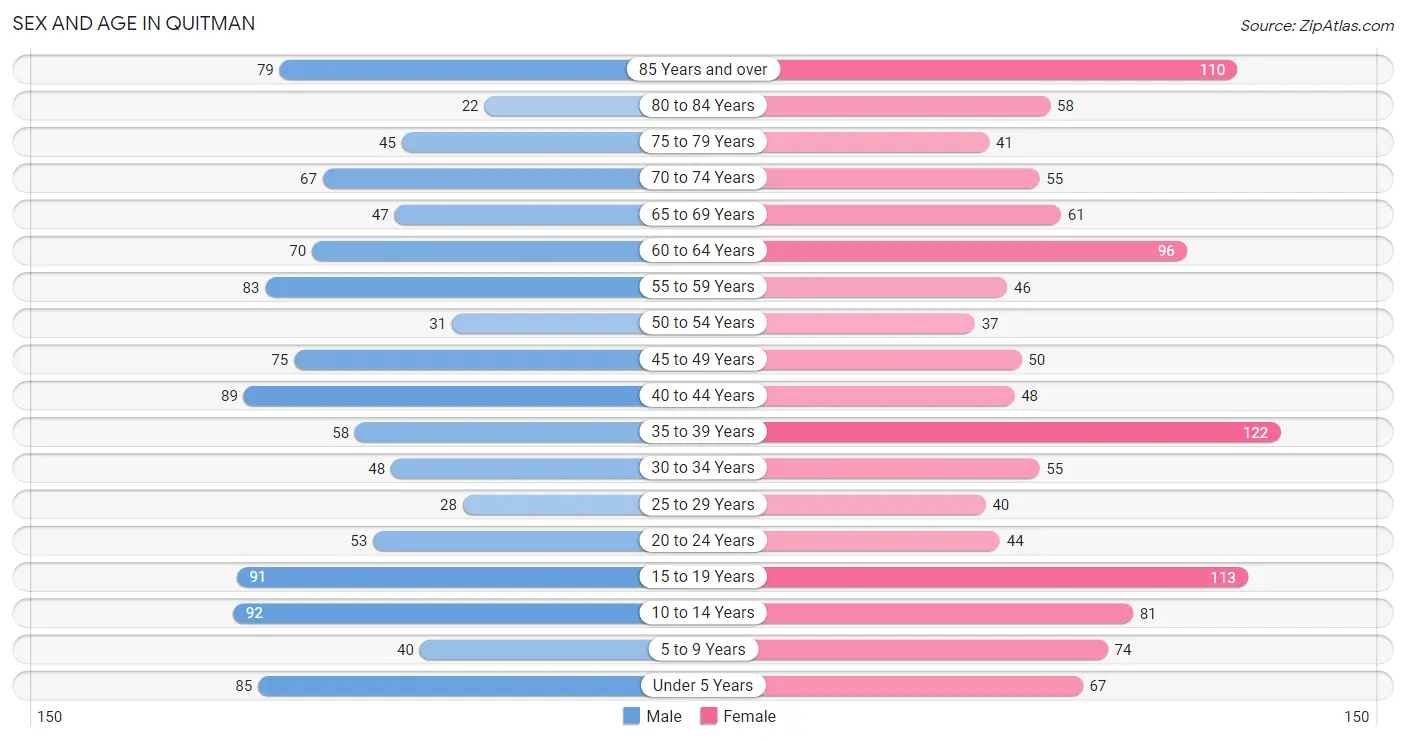
Sex and Age in Quitman
Sex and Age in Quitman
The most populous age groups in Quitman are 10 to 14 Years (92 | 8.3%) for men and 35 to 39 Years (122 | 10.2%) for women.
| Age Bracket | Male | Female |
| Under 5 Years | 85 (7.7%) | 67 (5.6%) |
| 5 to 9 Years | 40 (3.6%) | 74 (6.2%) |
| 10 to 14 Years | 92 (8.3%) | 81 (6.8%) |
| 15 to 19 Years | 91 (8.3%) | 113 (9.4%) |
| 20 to 24 Years | 53 (4.8%) | 44 (3.7%) |
| 25 to 29 Years | 28 (2.5%) | 40 (3.3%) |
| 30 to 34 Years | 48 (4.3%) | 55 (4.6%) |
| 35 to 39 Years | 58 (5.3%) | 122 (10.2%) |
| 40 to 44 Years | 89 (8.1%) | 48 (4.0%) |
| 45 to 49 Years | 75 (6.8%) | 50 (4.2%) |
| 50 to 54 Years | 31 (2.8%) | 37 (3.1%) |
| 55 to 59 Years | 83 (7.5%) | 46 (3.8%) |
| 60 to 64 Years | 70 (6.4%) | 96 (8.0%) |
| 65 to 69 Years | 47 (4.3%) | 61 (5.1%) |
| 70 to 74 Years | 67 (6.1%) | 55 (4.6%) |
| 75 to 79 Years | 45 (4.1%) | 41 (3.4%) |
| 80 to 84 Years | 22 (2.0%) | 58 (4.8%) |
| 85 Years and over | 79 (7.2%) | 110 (9.2%) |
| Total | 1,103 (100.0%) | 1,198 (100.0%) |
Families and Households in Quitman
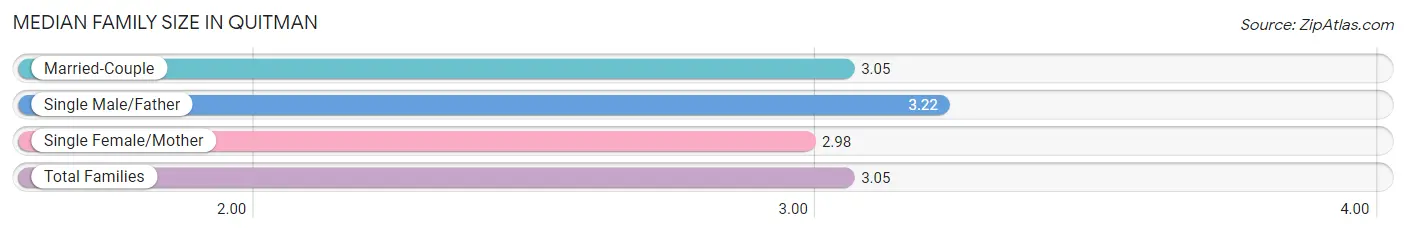
Median Family Size in Quitman
The median family size in Quitman is 3.05 persons per family, with single male/father families (45 | 7.9%) accounting for the largest median family size of 3.22 persons per family. On the other hand, single female/mother families (133 | 23.3%) represent the smallest median family size with 2.98 persons per family.
| Family Type | # Families | Family Size |
| Married-Couple | 394 (68.9%) | 3.05 |
| Single Male/Father | 45 (7.9%) | 3.22 |
| Single Female/Mother | 133 (23.3%) | 2.98 |
| Total Families | 572 (100.0%) | 3.05 |
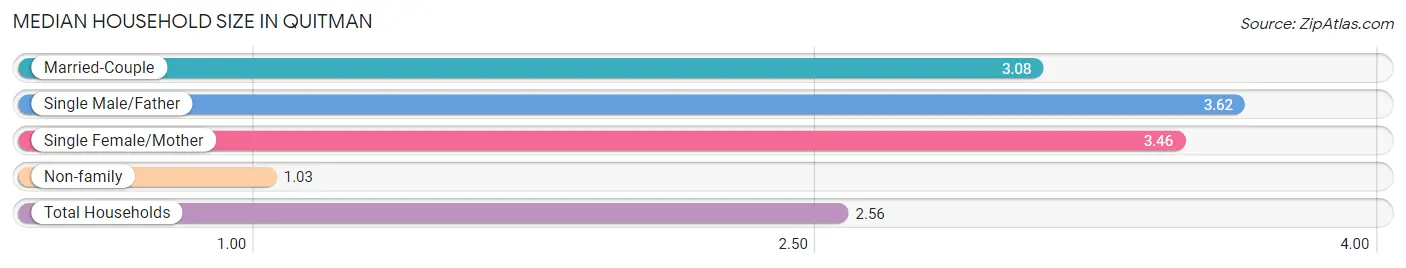
Median Household Size in Quitman
The median household size in Quitman is 2.56 persons per household, with single male/father households (45 | 5.5%) accounting for the largest median household size of 3.62 persons per household. non-family households (244 | 29.9%) represent the smallest median household size with 1.03 persons per household.
| Household Type | # Households | Household Size |
| Married-Couple | 394 (48.3%) | 3.08 |
| Single Male/Father | 45 (5.5%) | 3.62 |
| Single Female/Mother | 133 (16.3%) | 3.46 |
| Non-family | 244 (29.9%) | 1.03 |
| Total Households | 816 (100.0%) | 2.56 |
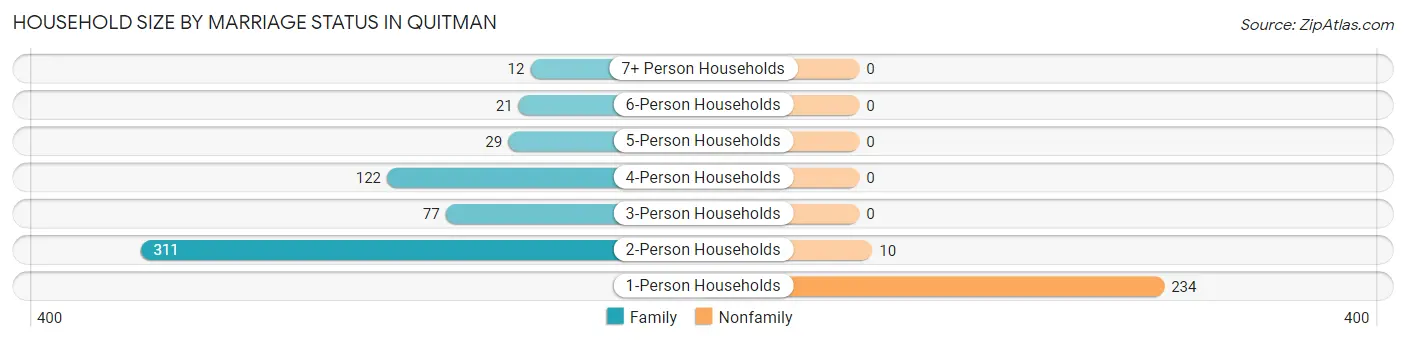
Household Size by Marriage Status in Quitman
Out of a total of 816 households in Quitman, 572 (70.1%) are family households, while 244 (29.9%) are nonfamily households. The most numerous type of family households are 2-person households, comprising 311, and the most common type of nonfamily households are 1-person households, comprising 234.
| Household Size | Family Households | Nonfamily Households |
| 1-Person Households | - | 234 (28.7%) |
| 2-Person Households | 311 (38.1%) | 10 (1.2%) |
| 3-Person Households | 77 (9.4%) | 0 (0.0%) |
| 4-Person Households | 122 (14.9%) | 0 (0.0%) |
| 5-Person Households | 29 (3.5%) | 0 (0.0%) |
| 6-Person Households | 21 (2.6%) | 0 (0.0%) |
| 7+ Person Households | 12 (1.5%) | 0 (0.0%) |
| Total | 572 (70.1%) | 244 (29.9%) |
Female Fertility in Quitman
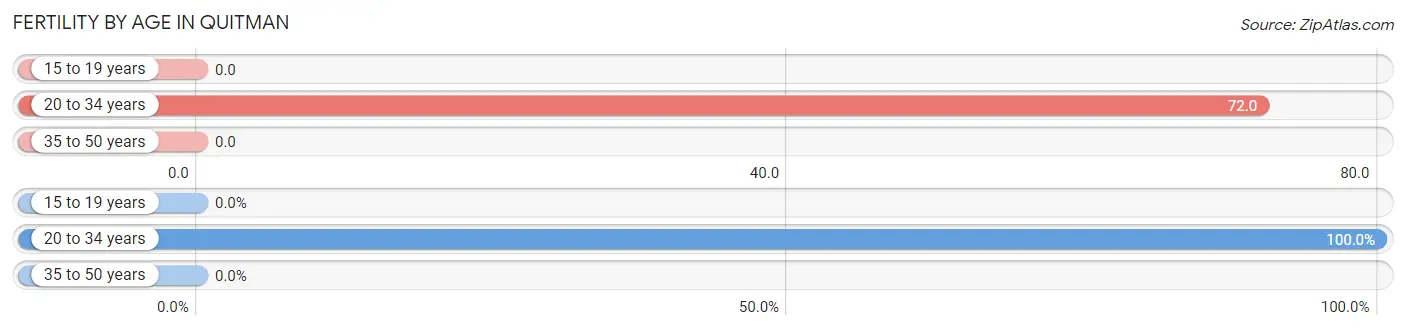
Fertility by Age in Quitman
Average fertility rate in Quitman is 21.0 births per 1,000 women. Women in the age bracket of 20 to 34 years have the highest fertility rate with 72.0 births per 1,000 women. Women in the age bracket of 20 to 34 years acount for 100.0% of all women with births.
| Age Bracket | Women with Births | Births / 1,000 Women |
| 15 to 19 years | 0 (0.0%) | 0.0 |
| 20 to 34 years | 10 (100.0%) | 72.0 |
| 35 to 50 years | 0 (0.0%) | 0.0 |
| Total | 10 (100.0%) | 21.0 |
Fertility by Age by Marriage Status in Quitman
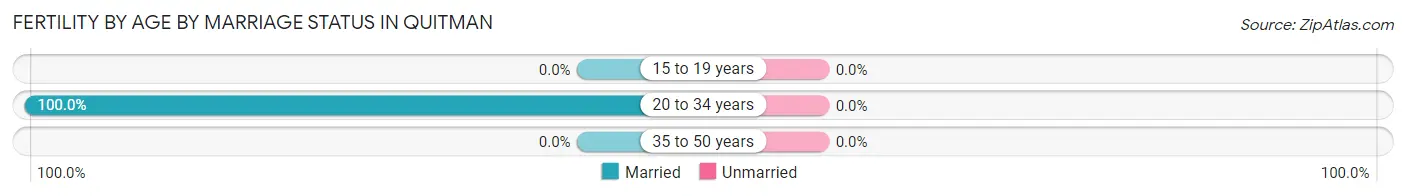
| Age Bracket | Married | Unmarried |
| 15 to 19 years | 0 (0.0%) | 0 (0.0%) |
| 20 to 34 years | 10 (100.0%) | 0 (0.0%) |
| 35 to 50 years | 0 (0.0%) | 0 (0.0%) |
| Total | 10 (100.0%) | 0 (0.0%) |
Fertility by Education in Quitman
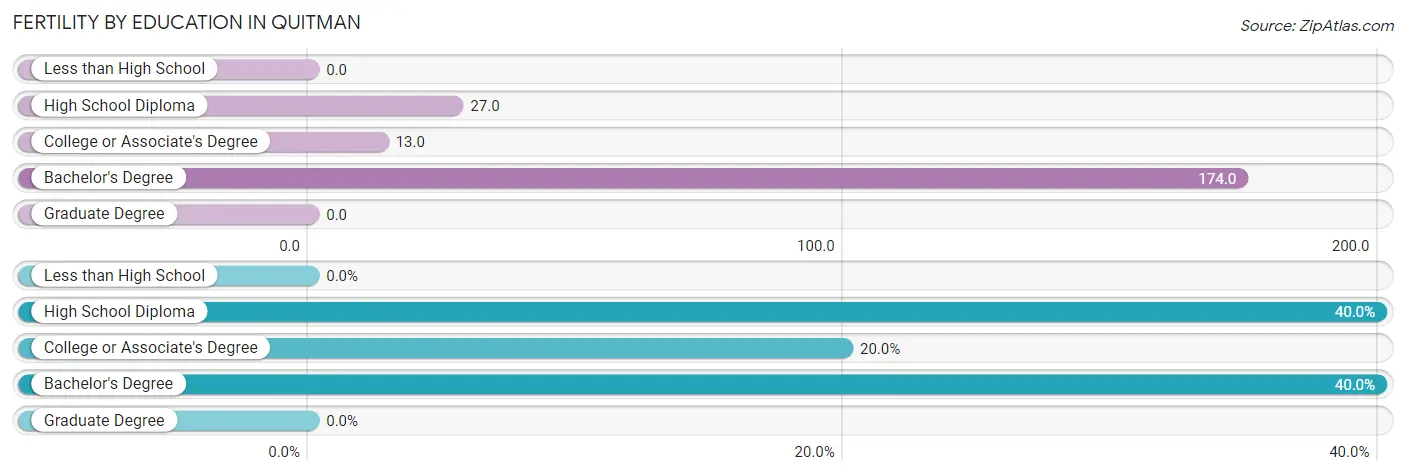
| Educational Attainment | Women with Births | Births / 1,000 Women |
| Less than High School | 0 (0.0%) | 0.0 |
| High School Diploma | 4 (40.0%) | 27.0 |
| College or Associate's Degree | 2 (20.0%) | 13.0 |
| Bachelor's Degree | 4 (40.0%) | 174.0 |
| Graduate Degree | 0 (0.0%) | 0.0 |
| Total | 10 (100.0%) | 21.0 |
Fertility by Education by Marriage Status in Quitman
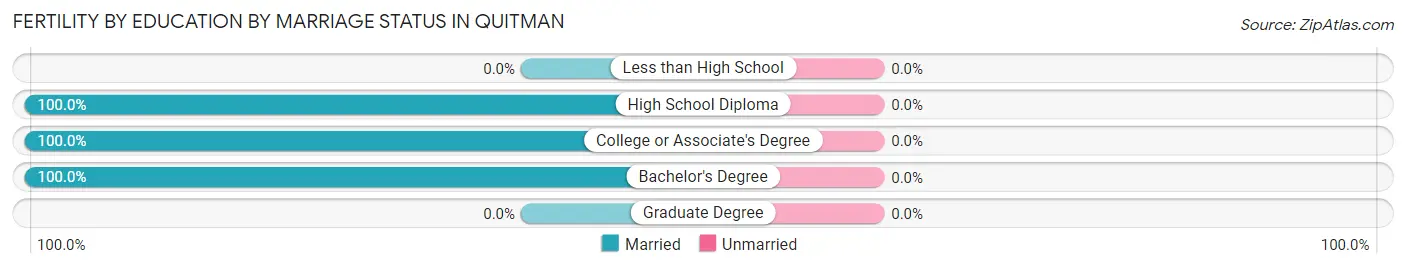
| Educational Attainment | Married | Unmarried |
| Less than High School | 0 (0.0%) | 0 (0.0%) |
| High School Diploma | 4 (100.0%) | 0 (0.0%) |
| College or Associate's Degree | 2 (100.0%) | 0 (0.0%) |
| Bachelor's Degree | 4 (100.0%) | 0 (0.0%) |
| Graduate Degree | 0 (0.0%) | 0 (0.0%) |
| Total | 10 (100.0%) | 0 (0.0%) |
Employment Characteristics in Quitman
Employment by Class of Employer in Quitman
Among the 765 employed individuals in Quitman, private company employees (535 | 69.9%), local government employees (79 | 10.3%), and not-for-profit organizations (50 | 6.5%) make up the most common classes of employment.
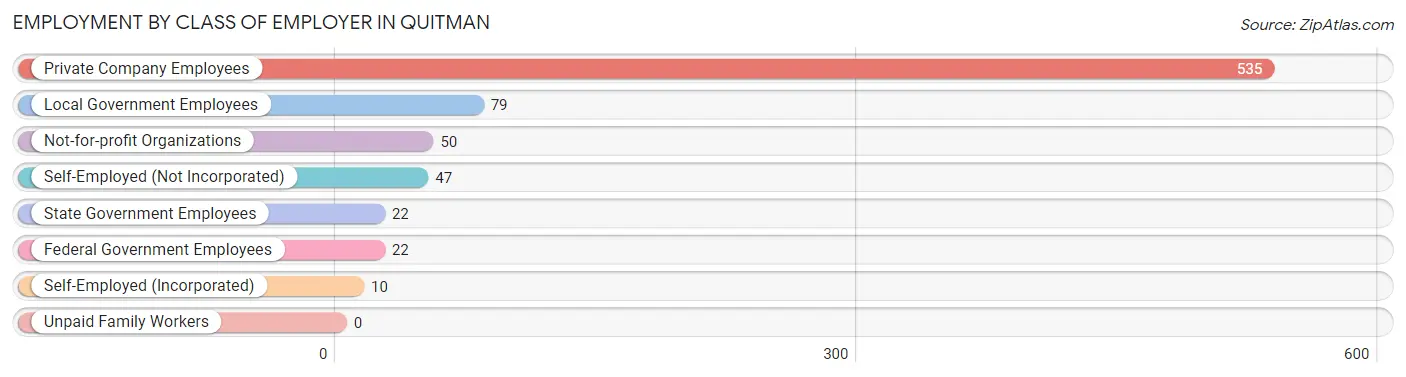
| Employer Class | # Employees | % Employees |
| Private Company Employees | 535 | 69.9% |
| Self-Employed (Incorporated) | 10 | 1.3% |
| Self-Employed (Not Incorporated) | 47 | 6.1% |
| Not-for-profit Organizations | 50 | 6.5% |
| Local Government Employees | 79 | 10.3% |
| State Government Employees | 22 | 2.9% |
| Federal Government Employees | 22 | 2.9% |
| Unpaid Family Workers | 0 | 0.0% |
| Total | 765 | 100.0% |
Employment Status by Age in Quitman
According to the labor force statistics for Quitman, out of the total population over 16 years of age (1,781), 47.1% or 839 individuals are in the labor force, with 7.7% or 65 of them unemployed. The age group with the highest labor force participation rate is 45 to 54 years, with 86.5% or 167 individuals in the labor force. Within the labor force, the 16 to 19 years age range has the highest percentage of unemployed individuals, with 35.3% or 24 of them being unemployed.
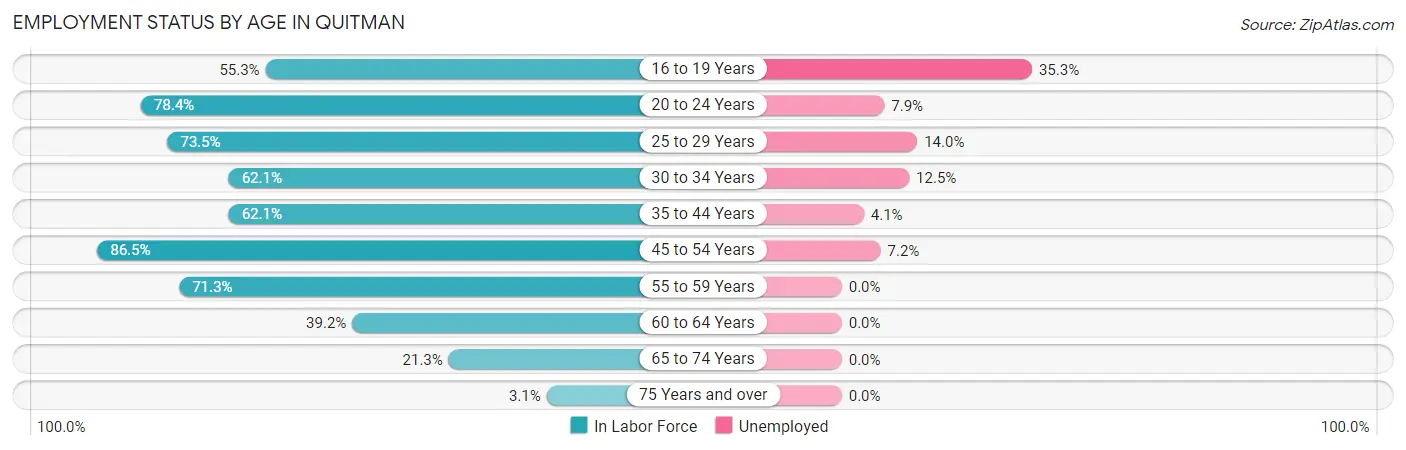
| Age Bracket | In Labor Force | Unemployed |
| 16 to 19 Years | 68 (55.3%) | 24 (35.3%) |
| 20 to 24 Years | 76 (78.4%) | 6 (7.9%) |
| 25 to 29 Years | 50 (73.5%) | 7 (14.0%) |
| 30 to 34 Years | 64 (62.1%) | 8 (12.5%) |
| 35 to 44 Years | 197 (62.1%) | 8 (4.1%) |
| 45 to 54 Years | 167 (86.5%) | 12 (7.2%) |
| 55 to 59 Years | 92 (71.3%) | 0 (0.0%) |
| 60 to 64 Years | 65 (39.2%) | 0 (0.0%) |
| 65 to 74 Years | 49 (21.3%) | 0 (0.0%) |
| 75 Years and over | 11 (3.1%) | 0 (0.0%) |
| Total | 839 (47.1%) | 65 (7.7%) |
Employment Status by Educational Attainment in Quitman
According to labor force statistics for Quitman, 65.1% of individuals (635) out of the total population between 25 and 64 years of age (976) are in the labor force, with 5.5% or 35 of them being unemployed. The group with the highest labor force participation rate are those with the educational attainment of bachelor's degree or higher, with 79.2% or 122 individuals in the labor force. Within the labor force, individuals with less than high school education have the highest percentage of unemployment, with 17.5% or 10 of them being unemployed.
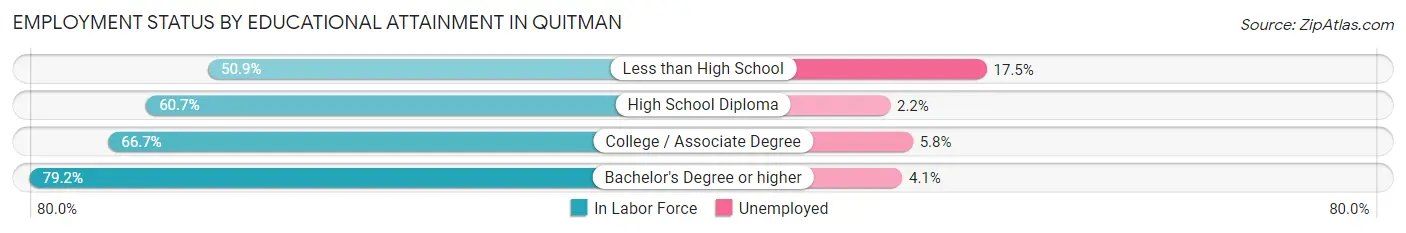
| Educational Attainment | In Labor Force | Unemployed |
| Less than High School | 57 (50.9%) | 20 (17.5%) |
| High School Diploma | 181 (60.7%) | 7 (2.2%) |
| College / Associate Degree | 275 (66.7%) | 24 (5.8%) |
| Bachelor's Degree or higher | 122 (79.2%) | 6 (4.1%) |
| Total | 635 (65.1%) | 54 (5.5%) |
Employment Occupations by Sex in Quitman
Management, Business, Science and Arts Occupations
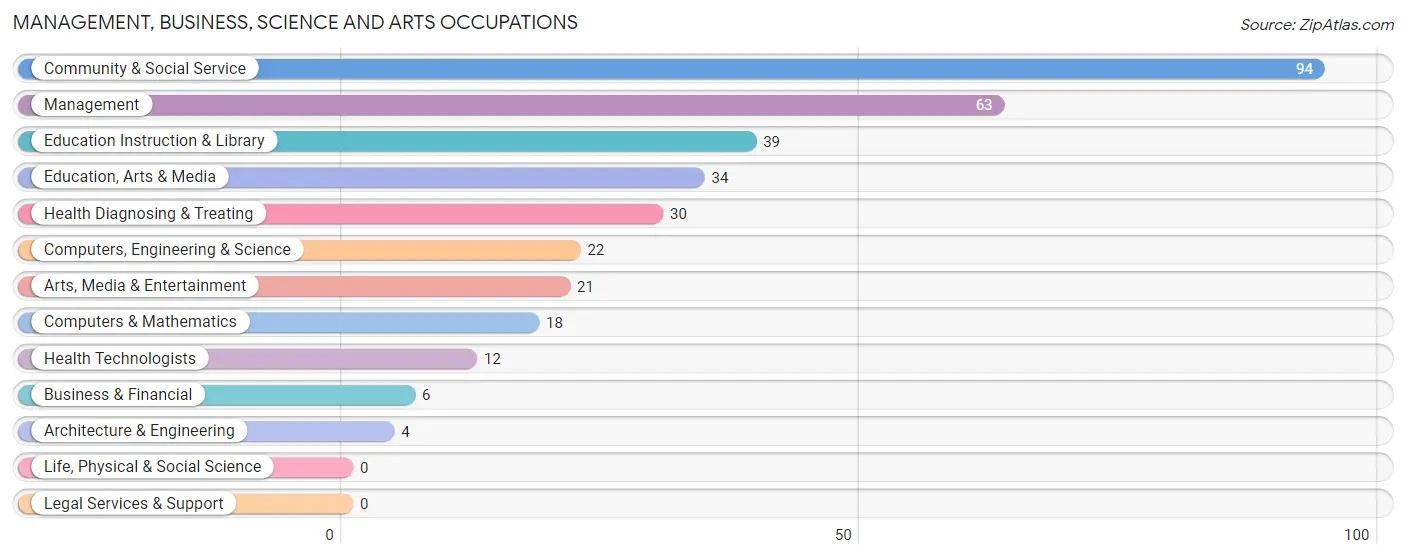
The most common Management, Business, Science and Arts occupations in Quitman are Community & Social Service (94 | 12.1%), Management (63 | 8.1%), Education Instruction & Library (39 | 5.0%), Education, Arts & Media (34 | 4.4%), and Health Diagnosing & Treating (30 | 3.9%).
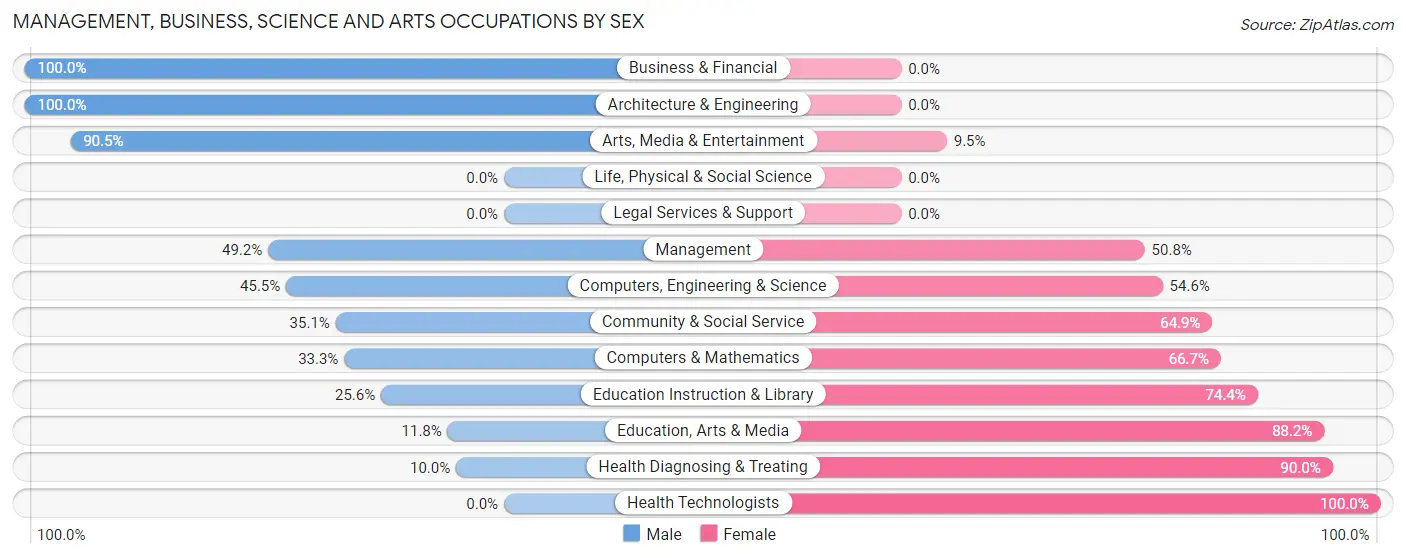
Management, Business, Science and Arts Occupations by Sex
Within the Management, Business, Science and Arts occupations in Quitman, the most male-oriented occupations are Business & Financial (100.0%), Architecture & Engineering (100.0%), and Arts, Media & Entertainment (90.5%), while the most female-oriented occupations are Health Technologists (100.0%), Health Diagnosing & Treating (90.0%), and Education, Arts & Media (88.2%).
| Occupation | Male | Female |
| Management | 31 (49.2%) | 32 (50.8%) |
| Business & Financial | 6 (100.0%) | 0 (0.0%) |
| Computers, Engineering & Science | 10 (45.5%) | 12 (54.5%) |
| Computers & Mathematics | 6 (33.3%) | 12 (66.7%) |
| Architecture & Engineering | 4 (100.0%) | 0 (0.0%) |
| Life, Physical & Social Science | 0 (0.0%) | 0 (0.0%) |
| Community & Social Service | 33 (35.1%) | 61 (64.9%) |
| Education, Arts & Media | 4 (11.8%) | 30 (88.2%) |
| Legal Services & Support | 0 (0.0%) | 0 (0.0%) |
| Education Instruction & Library | 10 (25.6%) | 29 (74.4%) |
| Arts, Media & Entertainment | 19 (90.5%) | 2 (9.5%) |
| Health Diagnosing & Treating | 3 (10.0%) | 27 (90.0%) |
| Health Technologists | 0 (0.0%) | 12 (100.0%) |
| Total (Category) | 83 (38.6%) | 132 (61.4%) |
| Total (Overall) | 423 (54.6%) | 351 (45.4%) |
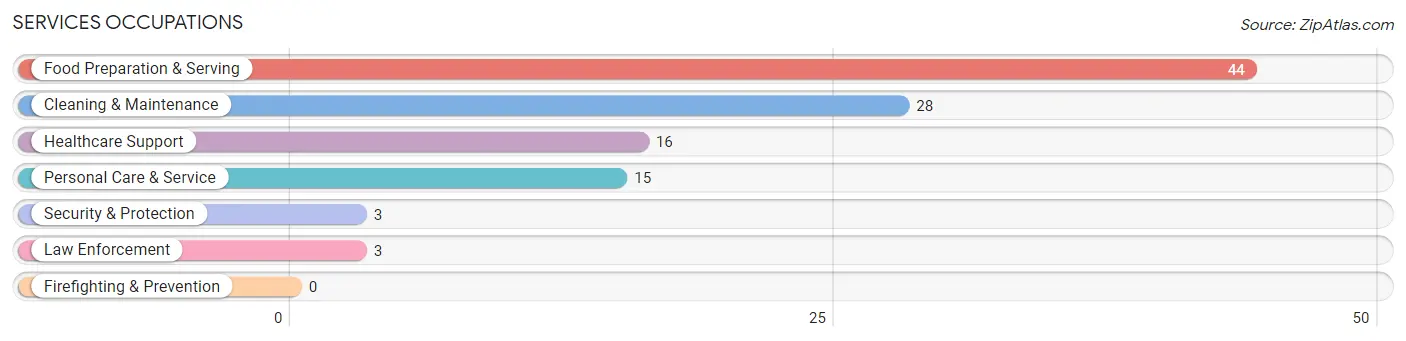
Services Occupations
The most common Services occupations in Quitman are Food Preparation & Serving (44 | 5.7%), Cleaning & Maintenance (28 | 3.6%), Healthcare Support (16 | 2.1%), Personal Care & Service (15 | 1.9%), and Security & Protection (3 | 0.4%).
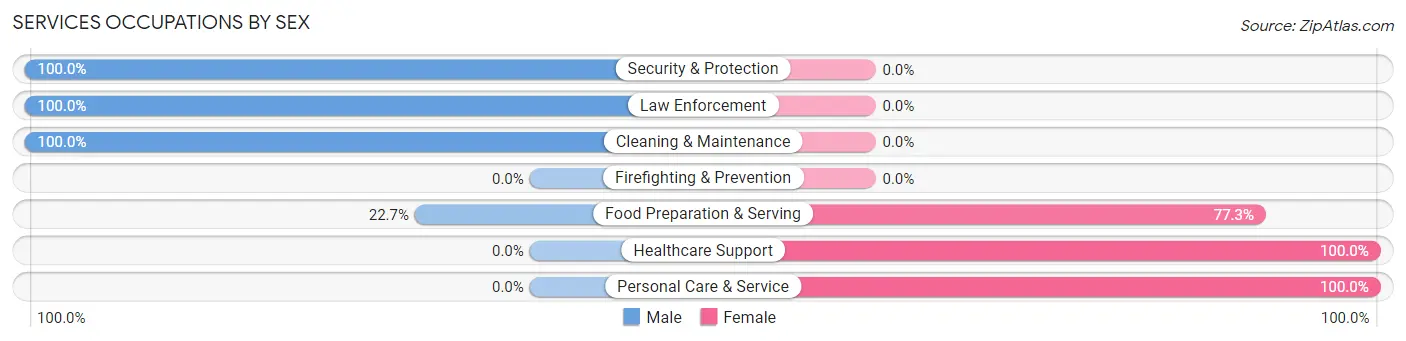
Services Occupations by Sex
Within the Services occupations in Quitman, the most male-oriented occupations are Security & Protection (100.0%), Law Enforcement (100.0%), and Cleaning & Maintenance (100.0%), while the most female-oriented occupations are Healthcare Support (100.0%), Personal Care & Service (100.0%), and Food Preparation & Serving (77.3%).
| Occupation | Male | Female |
| Healthcare Support | 0 (0.0%) | 16 (100.0%) |
| Security & Protection | 3 (100.0%) | 0 (0.0%) |
| Firefighting & Prevention | 0 (0.0%) | 0 (0.0%) |
| Law Enforcement | 3 (100.0%) | 0 (0.0%) |
| Food Preparation & Serving | 10 (22.7%) | 34 (77.3%) |
| Cleaning & Maintenance | 28 (100.0%) | 0 (0.0%) |
| Personal Care & Service | 0 (0.0%) | 15 (100.0%) |
| Total (Category) | 41 (38.7%) | 65 (61.3%) |
| Total (Overall) | 423 (54.6%) | 351 (45.4%) |
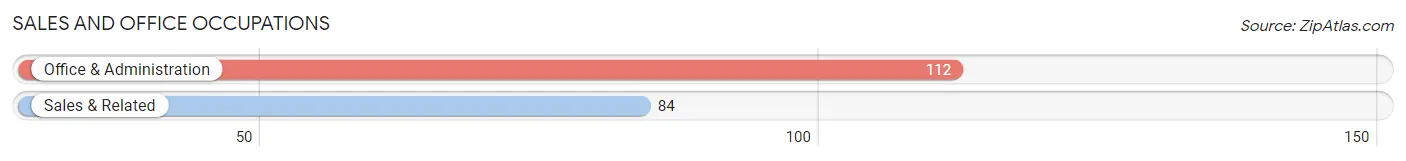
Sales and Office Occupations
The most common Sales and Office occupations in Quitman are Office & Administration (112 | 14.5%), and Sales & Related (84 | 10.8%).
Sales and Office Occupations by Sex
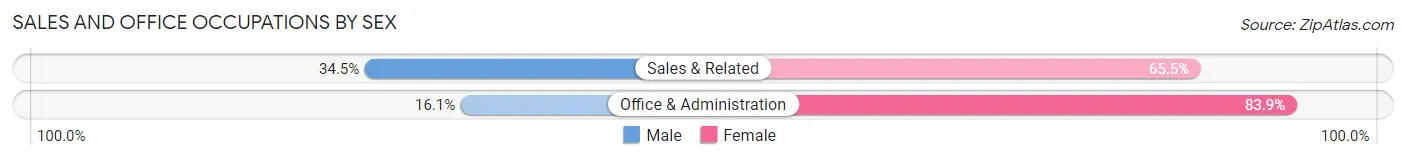
| Occupation | Male | Female |
| Sales & Related | 29 (34.5%) | 55 (65.5%) |
| Office & Administration | 18 (16.1%) | 94 (83.9%) |
| Total (Category) | 47 (24.0%) | 149 (76.0%) |
| Total (Overall) | 423 (54.6%) | 351 (45.4%) |
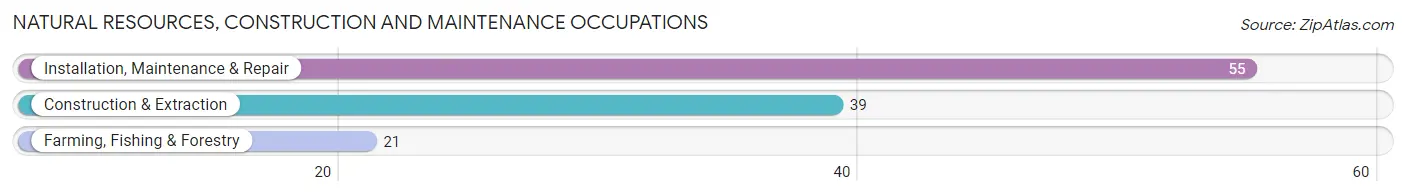
Natural Resources, Construction and Maintenance Occupations
The most common Natural Resources, Construction and Maintenance occupations in Quitman are Installation, Maintenance & Repair (55 | 7.1%), Construction & Extraction (39 | 5.0%), and Farming, Fishing & Forestry (21 | 2.7%).
Natural Resources, Construction and Maintenance Occupations by Sex
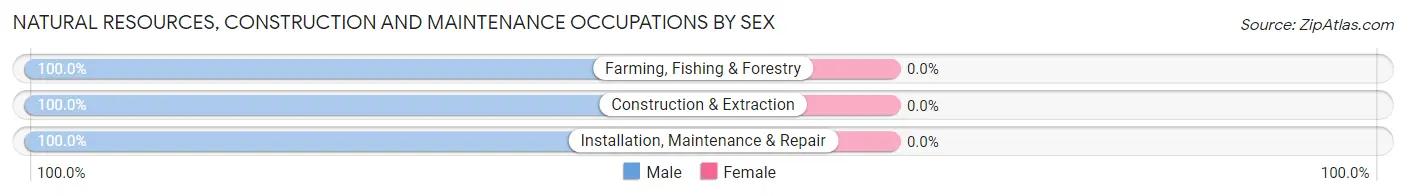
| Occupation | Male | Female |
| Farming, Fishing & Forestry | 21 (100.0%) | 0 (0.0%) |
| Construction & Extraction | 39 (100.0%) | 0 (0.0%) |
| Installation, Maintenance & Repair | 55 (100.0%) | 0 (0.0%) |
| Total (Category) | 115 (100.0%) | 0 (0.0%) |
| Total (Overall) | 423 (54.6%) | 351 (45.4%) |
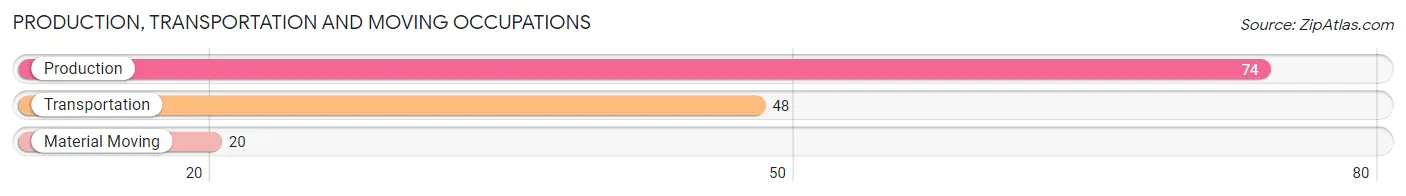
Production, Transportation and Moving Occupations
The most common Production, Transportation and Moving occupations in Quitman are Production (74 | 9.6%), Transportation (48 | 6.2%), and Material Moving (20 | 2.6%).
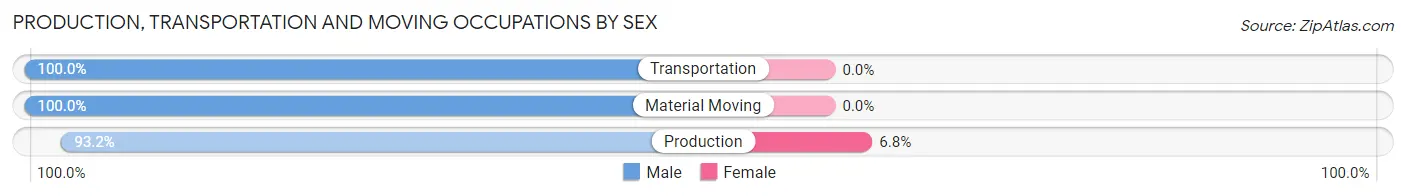
Production, Transportation and Moving Occupations by Sex
| Occupation | Male | Female |
| Production | 69 (93.2%) | 5 (6.8%) |
| Transportation | 48 (100.0%) | 0 (0.0%) |
| Material Moving | 20 (100.0%) | 0 (0.0%) |
| Total (Category) | 137 (96.5%) | 5 (3.5%) |
| Total (Overall) | 423 (54.6%) | 351 (45.4%) |
Employment Industries by Sex in Quitman
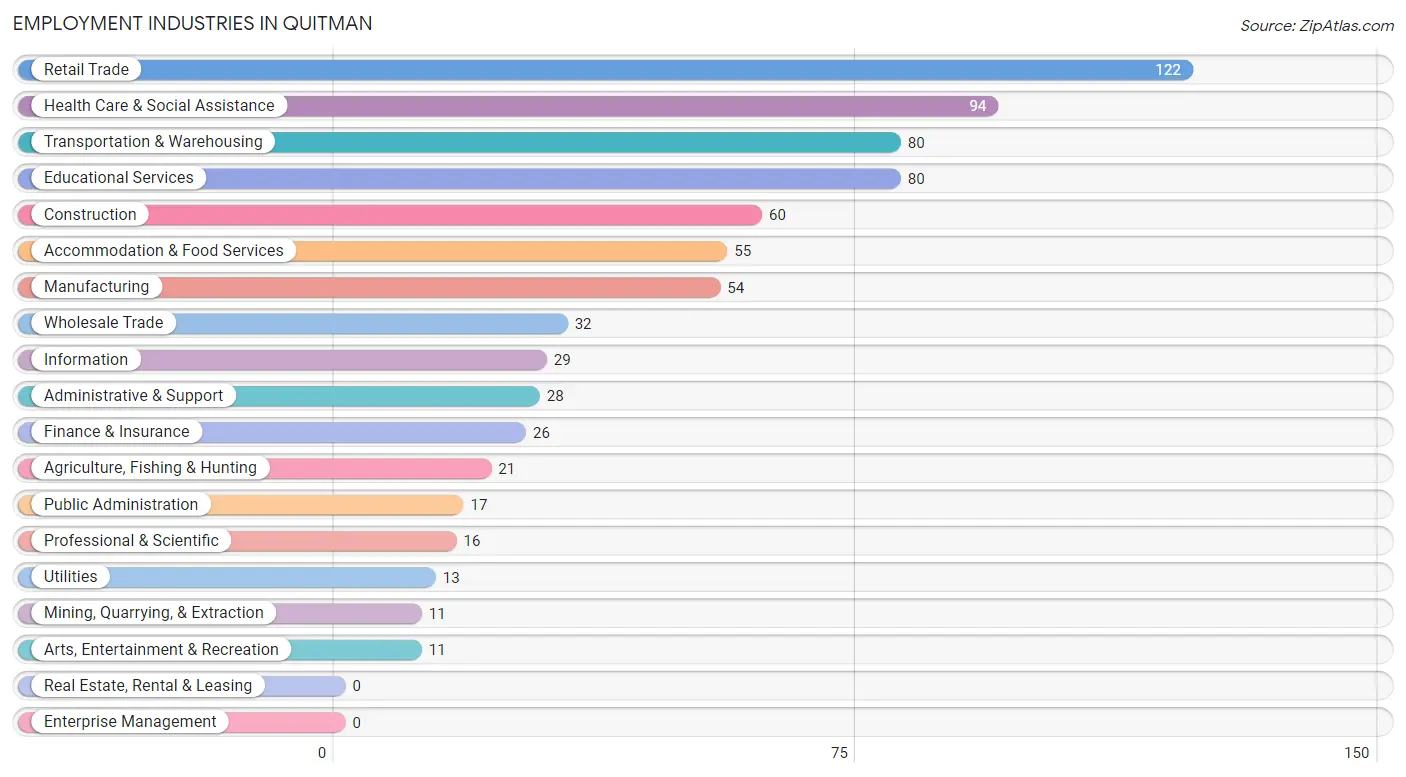
Employment Industries in Quitman
The major employment industries in Quitman include Retail Trade (122 | 15.8%), Health Care & Social Assistance (94 | 12.1%), Transportation & Warehousing (80 | 10.3%), Educational Services (80 | 10.3%), and Construction (60 | 7.7%).
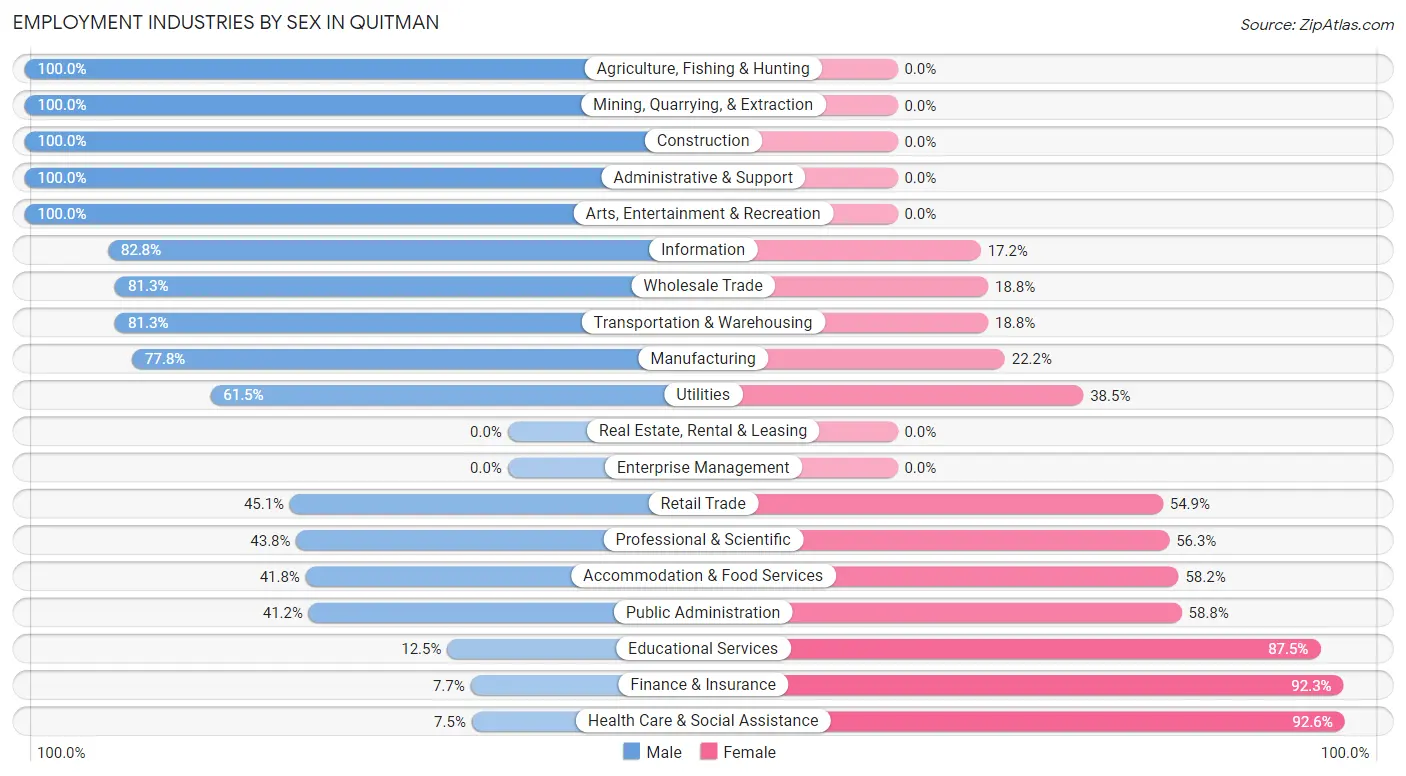
Employment Industries by Sex in Quitman
The Quitman industries that see more men than women are Agriculture, Fishing & Hunting (100.0%), Mining, Quarrying, & Extraction (100.0%), and Construction (100.0%), whereas the industries that tend to have a higher number of women are Health Care & Social Assistance (92.5%), Finance & Insurance (92.3%), and Educational Services (87.5%).
| Industry | Male | Female |
| Agriculture, Fishing & Hunting | 21 (100.0%) | 0 (0.0%) |
| Mining, Quarrying, & Extraction | 11 (100.0%) | 0 (0.0%) |
| Construction | 60 (100.0%) | 0 (0.0%) |
| Manufacturing | 42 (77.8%) | 12 (22.2%) |
| Wholesale Trade | 26 (81.2%) | 6 (18.8%) |
| Retail Trade | 55 (45.1%) | 67 (54.9%) |
| Transportation & Warehousing | 65 (81.2%) | 15 (18.8%) |
| Utilities | 8 (61.5%) | 5 (38.5%) |
| Information | 24 (82.8%) | 5 (17.2%) |
| Finance & Insurance | 2 (7.7%) | 24 (92.3%) |
| Real Estate, Rental & Leasing | 0 (0.0%) | 0 (0.0%) |
| Professional & Scientific | 7 (43.8%) | 9 (56.2%) |
| Enterprise Management | 0 (0.0%) | 0 (0.0%) |
| Administrative & Support | 28 (100.0%) | 0 (0.0%) |
| Educational Services | 10 (12.5%) | 70 (87.5%) |
| Health Care & Social Assistance | 7 (7.4%) | 87 (92.5%) |
| Arts, Entertainment & Recreation | 11 (100.0%) | 0 (0.0%) |
| Accommodation & Food Services | 23 (41.8%) | 32 (58.2%) |
| Public Administration | 7 (41.2%) | 10 (58.8%) |
| Total | 423 (54.6%) | 351 (45.4%) |
Education in Quitman
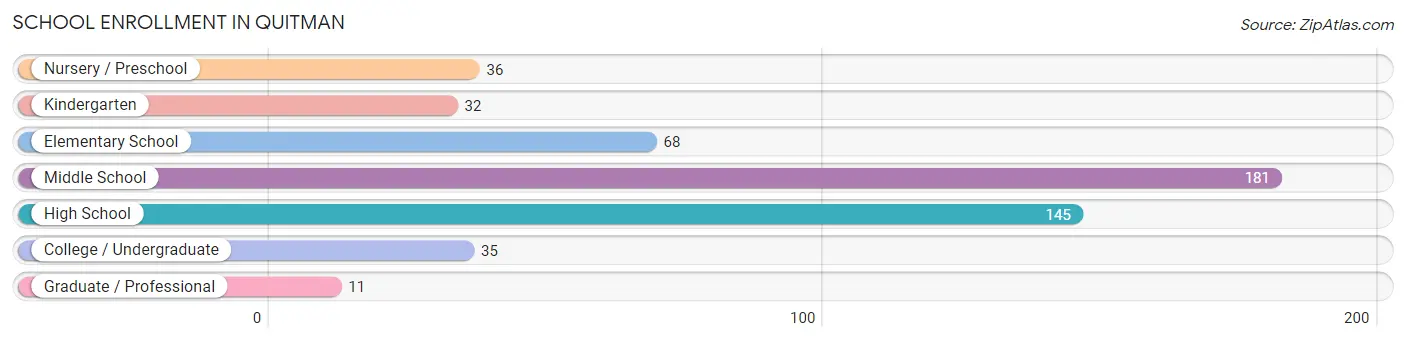
School Enrollment in Quitman
The most common levels of schooling among the 508 students in Quitman are middle school (181 | 35.6%), high school (145 | 28.5%), and elementary school (68 | 13.4%).
| School Level | # Students | % Students |
| Nursery / Preschool | 36 | 7.1% |
| Kindergarten | 32 | 6.3% |
| Elementary School | 68 | 13.4% |
| Middle School | 181 | 35.6% |
| High School | 145 | 28.5% |
| College / Undergraduate | 35 | 6.9% |
| Graduate / Professional | 11 | 2.2% |
| Total | 508 | 100.0% |
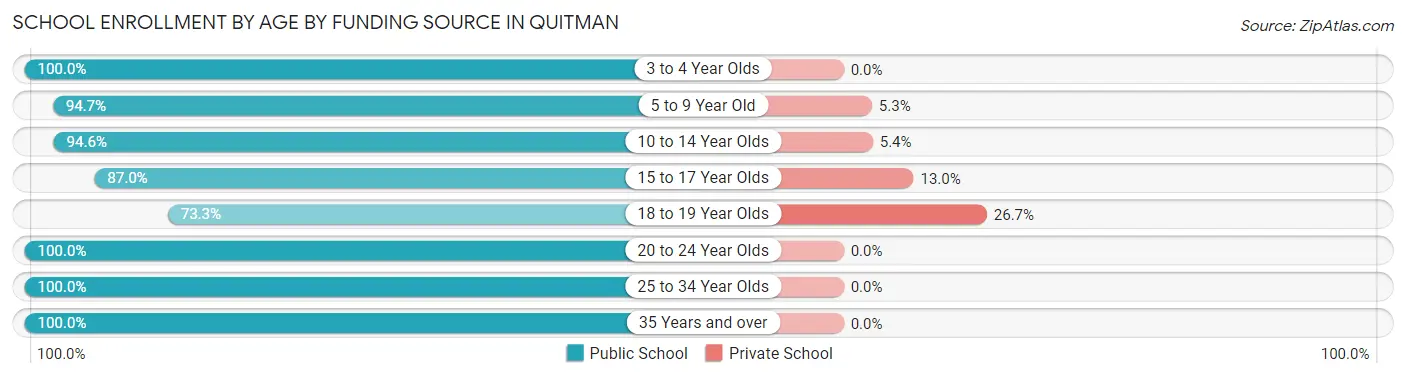
School Enrollment by Age by Funding Source in Quitman
Out of a total of 508 students who are enrolled in schools in Quitman, 42 (8.3%) attend a private institution, while the remaining 466 (91.7%) are enrolled in public schools. The age group of 18 to 19 year olds has the highest likelihood of being enrolled in private schools, with 8 (26.7% in the age bracket) enrolled. Conversely, the age group of 3 to 4 year olds has the lowest likelihood of being enrolled in a private school, with 14 (100.0% in the age bracket) attending a public institution.
| Age Bracket | Public School | Private School |
| 3 to 4 Year Olds | 14 (100.0%) | 0 (0.0%) |
| 5 to 9 Year Old | 108 (94.7%) | 6 (5.3%) |
| 10 to 14 Year Olds | 157 (94.6%) | 9 (5.4%) |
| 15 to 17 Year Olds | 127 (87.0%) | 19 (13.0%) |
| 18 to 19 Year Olds | 22 (73.3%) | 8 (26.7%) |
| 20 to 24 Year Olds | 3 (100.0%) | 0 (0.0%) |
| 25 to 34 Year Olds | 20 (100.0%) | 0 (0.0%) |
| 35 Years and over | 15 (100.0%) | 0 (0.0%) |
| Total | 466 (91.7%) | 42 (8.3%) |
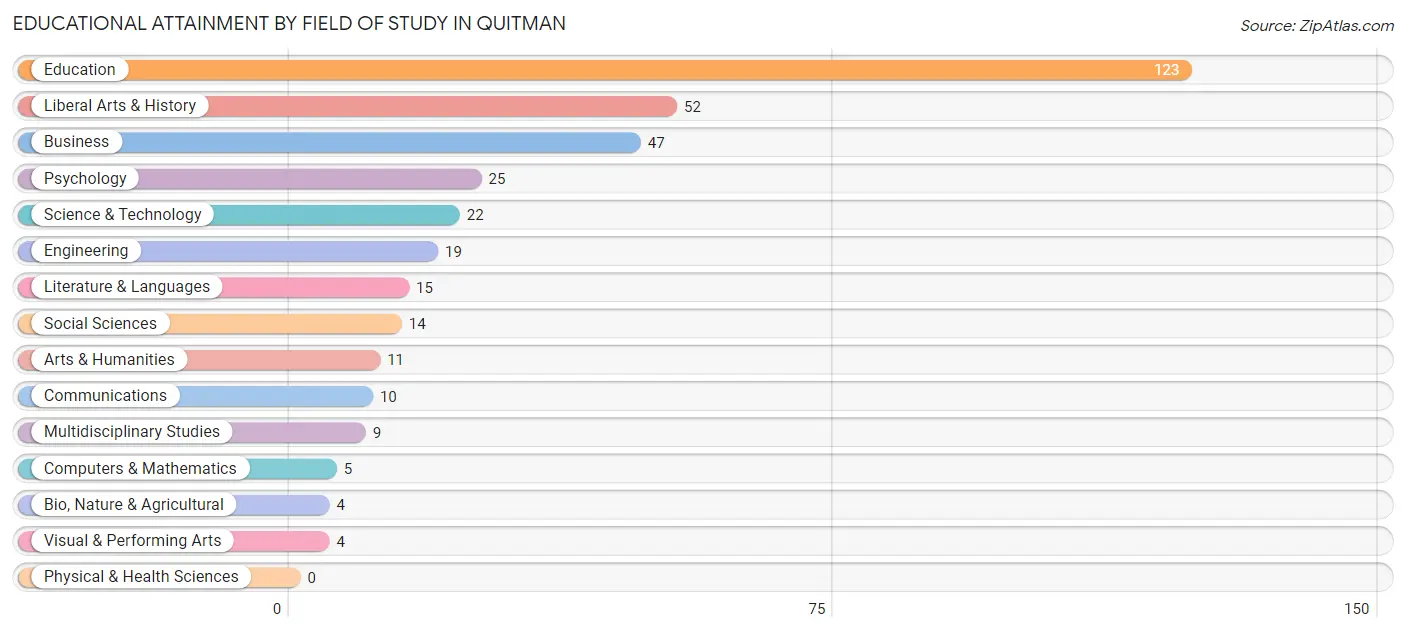
Educational Attainment by Field of Study in Quitman
Education (123 | 34.2%), liberal arts & history (52 | 14.4%), business (47 | 13.1%), psychology (25 | 6.9%), and science & technology (22 | 6.1%) are the most common fields of study among 360 individuals in Quitman who have obtained a bachelor's degree or higher.
| Field of Study | # Graduates | % Graduates |
| Computers & Mathematics | 5 | 1.4% |
| Bio, Nature & Agricultural | 4 | 1.1% |
| Physical & Health Sciences | 0 | 0.0% |
| Psychology | 25 | 6.9% |
| Social Sciences | 14 | 3.9% |
| Engineering | 19 | 5.3% |
| Multidisciplinary Studies | 9 | 2.5% |
| Science & Technology | 22 | 6.1% |
| Business | 47 | 13.1% |
| Education | 123 | 34.2% |
| Literature & Languages | 15 | 4.2% |
| Liberal Arts & History | 52 | 14.4% |
| Visual & Performing Arts | 4 | 1.1% |
| Communications | 10 | 2.8% |
| Arts & Humanities | 11 | 3.1% |
| Total | 360 | 100.0% |
Transportation & Commute in Quitman
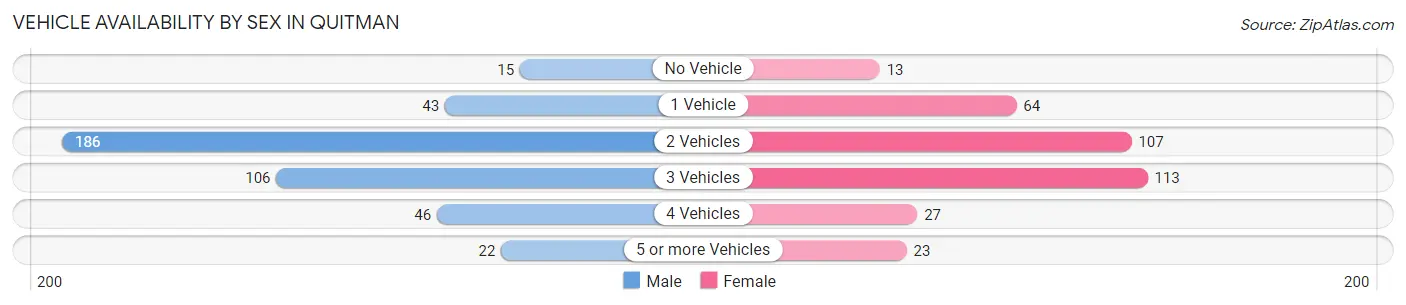
Vehicle Availability by Sex in Quitman
The most prevalent vehicle ownership categories in Quitman are males with 2 vehicles (186, accounting for 44.5%) and females with 2 vehicles (107, making up 53.6%).
| Vehicles Available | Male | Female |
| No Vehicle | 15 (3.6%) | 13 (3.7%) |
| 1 Vehicle | 43 (10.3%) | 64 (18.4%) |
| 2 Vehicles | 186 (44.5%) | 107 (30.8%) |
| 3 Vehicles | 106 (25.4%) | 113 (32.6%) |
| 4 Vehicles | 46 (11.0%) | 27 (7.8%) |
| 5 or more Vehicles | 22 (5.3%) | 23 (6.6%) |
| Total | 418 (100.0%) | 347 (100.0%) |
Commute Time in Quitman
The most frequently occuring commute durations in Quitman are 5 to 9 minutes (161 commuters, 23.0%), 30 to 34 minutes (98 commuters, 14.0%), and 10 to 14 minutes (89 commuters, 12.7%).
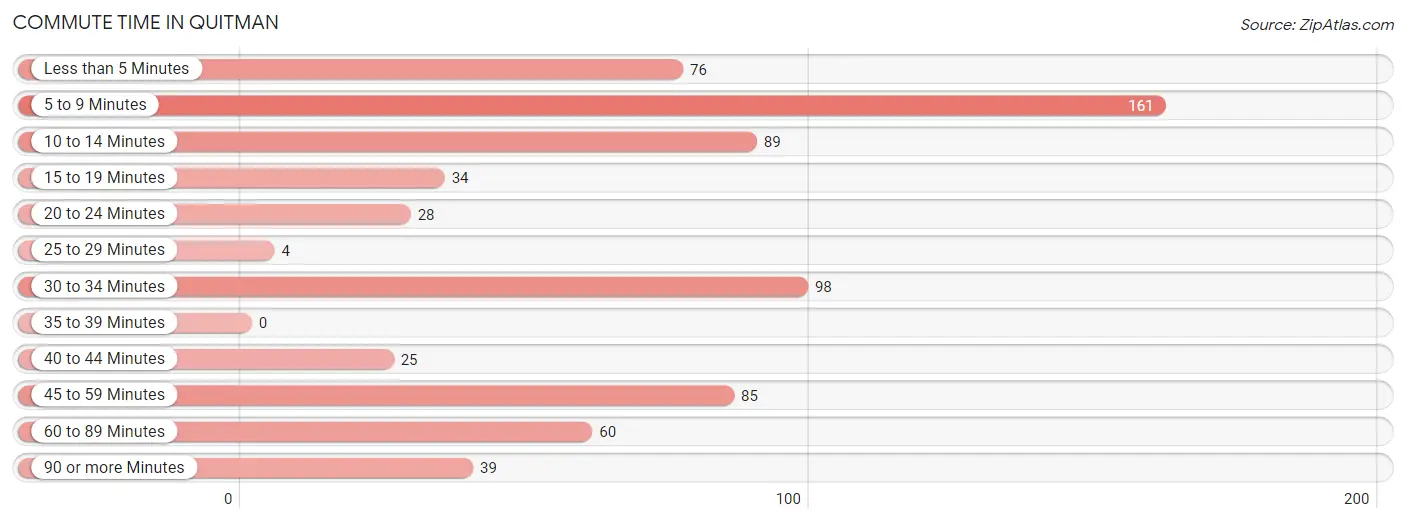
| Commute Time | # Commuters | % Commuters |
| Less than 5 Minutes | 76 | 10.9% |
| 5 to 9 Minutes | 161 | 23.0% |
| 10 to 14 Minutes | 89 | 12.7% |
| 15 to 19 Minutes | 34 | 4.9% |
| 20 to 24 Minutes | 28 | 4.0% |
| 25 to 29 Minutes | 4 | 0.6% |
| 30 to 34 Minutes | 98 | 14.0% |
| 35 to 39 Minutes | 0 | 0.0% |
| 40 to 44 Minutes | 25 | 3.6% |
| 45 to 59 Minutes | 85 | 12.2% |
| 60 to 89 Minutes | 60 | 8.6% |
| 90 or more Minutes | 39 | 5.6% |
Commute Time by Sex in Quitman
The most common commute times in Quitman are 5 to 9 minutes (96 commuters, 24.9%) for males and 5 to 9 minutes (65 commuters, 20.8%) for females.
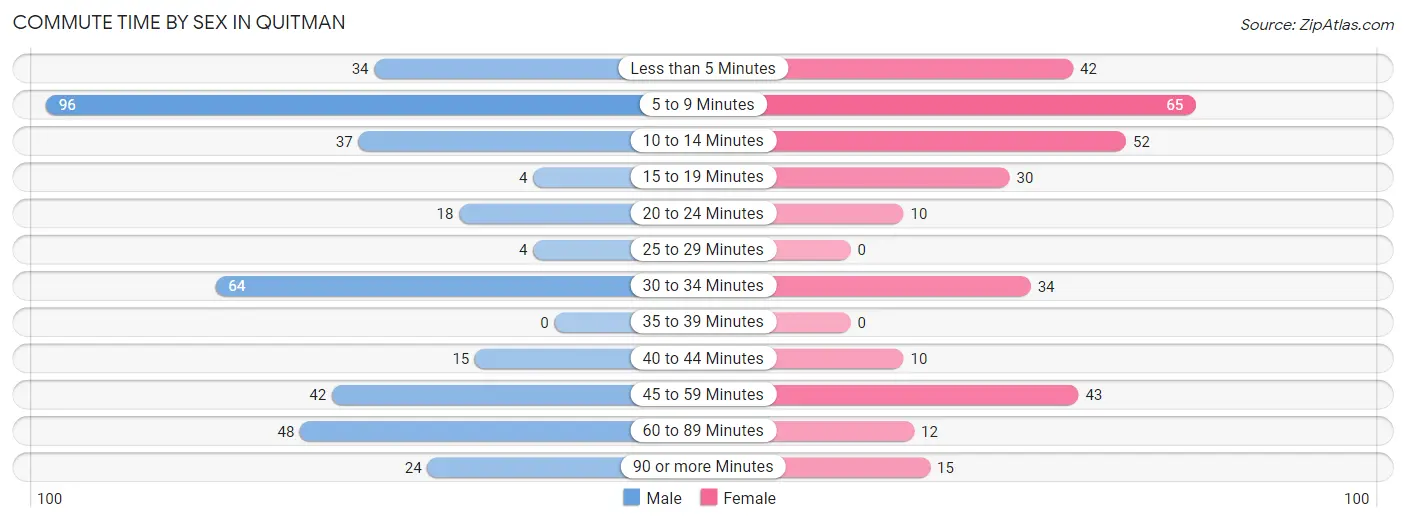
| Commute Time | Male | Female |
| Less than 5 Minutes | 34 (8.8%) | 42 (13.4%) |
| 5 to 9 Minutes | 96 (24.9%) | 65 (20.8%) |
| 10 to 14 Minutes | 37 (9.6%) | 52 (16.6%) |
| 15 to 19 Minutes | 4 (1.0%) | 30 (9.6%) |
| 20 to 24 Minutes | 18 (4.7%) | 10 (3.2%) |
| 25 to 29 Minutes | 4 (1.0%) | 0 (0.0%) |
| 30 to 34 Minutes | 64 (16.6%) | 34 (10.9%) |
| 35 to 39 Minutes | 0 (0.0%) | 0 (0.0%) |
| 40 to 44 Minutes | 15 (3.9%) | 10 (3.2%) |
| 45 to 59 Minutes | 42 (10.9%) | 43 (13.7%) |
| 60 to 89 Minutes | 48 (12.4%) | 12 (3.8%) |
| 90 or more Minutes | 24 (6.2%) | 15 (4.8%) |
Time of Departure to Work by Sex in Quitman
The most frequent times of departure to work in Quitman are 7:00 AM to 7:29 AM (74, 19.2%) for males and 7:00 AM to 7:29 AM (88, 28.1%) for females.
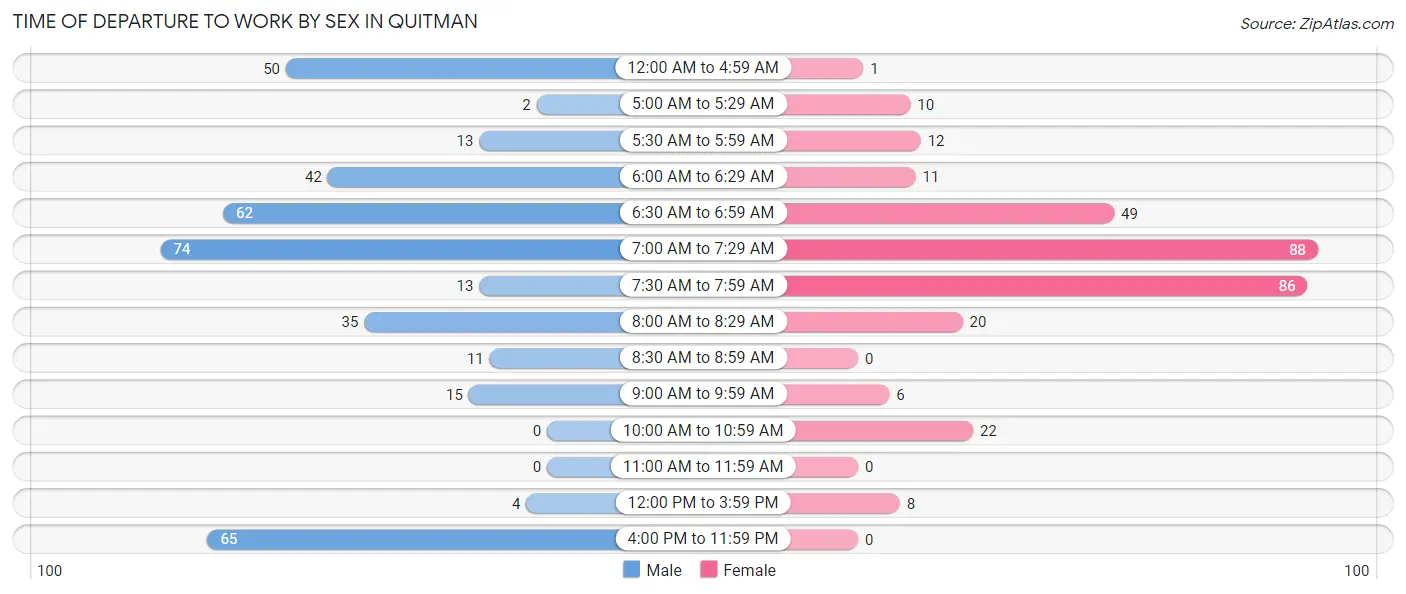
| Time of Departure | Male | Female |
| 12:00 AM to 4:59 AM | 50 (13.0%) | 1 (0.3%) |
| 5:00 AM to 5:29 AM | 2 (0.5%) | 10 (3.2%) |
| 5:30 AM to 5:59 AM | 13 (3.4%) | 12 (3.8%) |
| 6:00 AM to 6:29 AM | 42 (10.9%) | 11 (3.5%) |
| 6:30 AM to 6:59 AM | 62 (16.1%) | 49 (15.7%) |
| 7:00 AM to 7:29 AM | 74 (19.2%) | 88 (28.1%) |
| 7:30 AM to 7:59 AM | 13 (3.4%) | 86 (27.5%) |
| 8:00 AM to 8:29 AM | 35 (9.1%) | 20 (6.4%) |
| 8:30 AM to 8:59 AM | 11 (2.9%) | 0 (0.0%) |
| 9:00 AM to 9:59 AM | 15 (3.9%) | 6 (1.9%) |
| 10:00 AM to 10:59 AM | 0 (0.0%) | 22 (7.0%) |
| 11:00 AM to 11:59 AM | 0 (0.0%) | 0 (0.0%) |
| 12:00 PM to 3:59 PM | 4 (1.0%) | 8 (2.6%) |
| 4:00 PM to 11:59 PM | 65 (16.8%) | 0 (0.0%) |
| Total | 386 (100.0%) | 313 (100.0%) |
Housing Occupancy in Quitman
Occupancy by Ownership in Quitman
Of the total 816 dwellings in Quitman, owner-occupied units account for 509 (62.4%), while renter-occupied units make up 307 (37.6%).
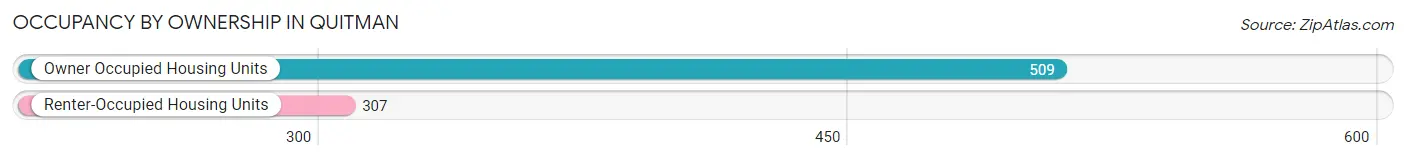
| Occupancy | # Housing Units | % Housing Units |
| Owner Occupied Housing Units | 509 | 62.4% |
| Renter-Occupied Housing Units | 307 | 37.6% |
| Total Occupied Housing Units | 816 | 100.0% |
Occupancy by Household Size in Quitman
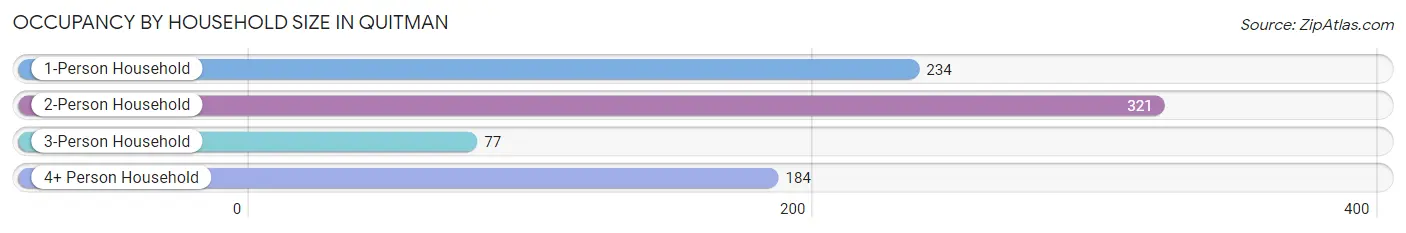
| Household Size | # Housing Units | % Housing Units |
| 1-Person Household | 234 | 28.7% |
| 2-Person Household | 321 | 39.3% |
| 3-Person Household | 77 | 9.4% |
| 4+ Person Household | 184 | 22.6% |
| Total Housing Units | 816 | 100.0% |
Occupancy by Ownership by Household Size in Quitman
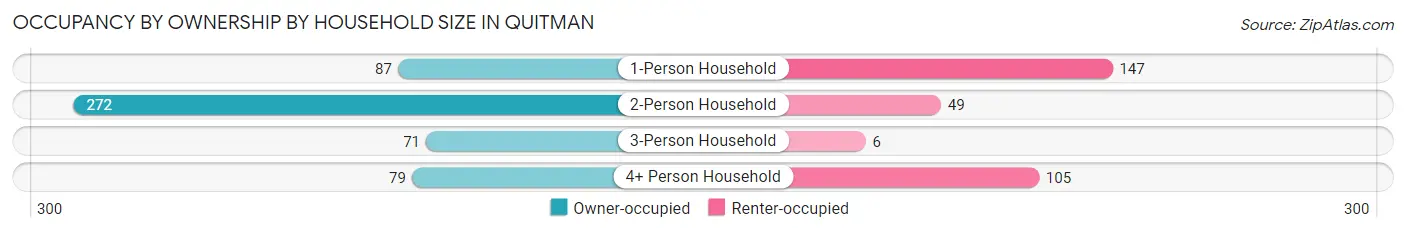
| Household Size | Owner-occupied | Renter-occupied |
| 1-Person Household | 87 (37.2%) | 147 (62.8%) |
| 2-Person Household | 272 (84.7%) | 49 (15.3%) |
| 3-Person Household | 71 (92.2%) | 6 (7.8%) |
| 4+ Person Household | 79 (42.9%) | 105 (57.1%) |
| Total Housing Units | 509 (62.4%) | 307 (37.6%) |
Occupancy by Educational Attainment in Quitman
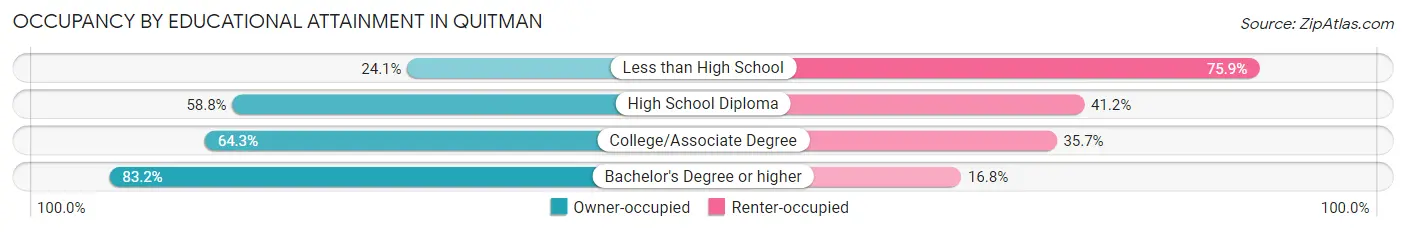
| Household Size | Owner-occupied | Renter-occupied |
| Less than High School | 27 (24.1%) | 85 (75.9%) |
| High School Diploma | 117 (58.8%) | 82 (41.2%) |
| College/Associate Degree | 187 (64.3%) | 104 (35.7%) |
| Bachelor's Degree or higher | 178 (83.2%) | 36 (16.8%) |
Occupancy by Age of Householder in Quitman
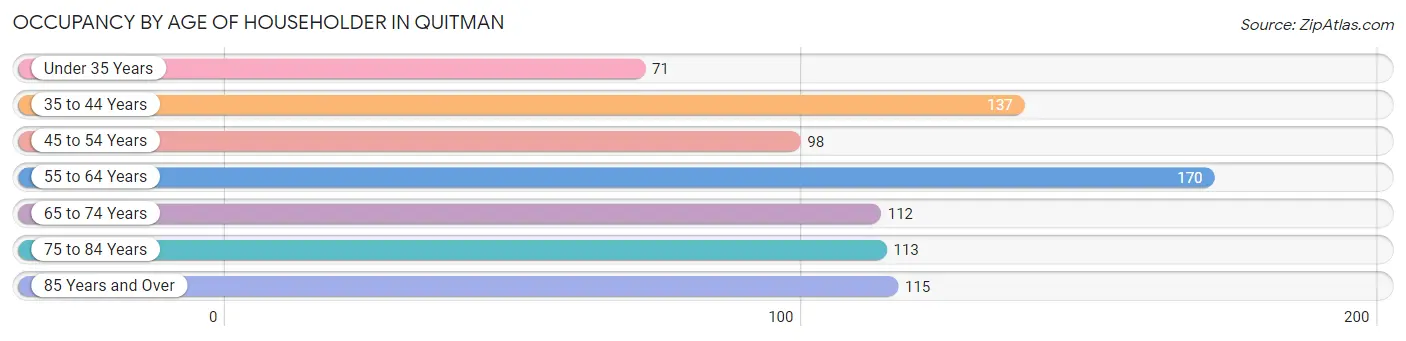
| Age Bracket | # Households | % Households |
| Under 35 Years | 71 | 8.7% |
| 35 to 44 Years | 137 | 16.8% |
| 45 to 54 Years | 98 | 12.0% |
| 55 to 64 Years | 170 | 20.8% |
| 65 to 74 Years | 112 | 13.7% |
| 75 to 84 Years | 113 | 13.9% |
| 85 Years and Over | 115 | 14.1% |
| Total | 816 | 100.0% |
Housing Finances in Quitman
Median Income by Occupancy in Quitman
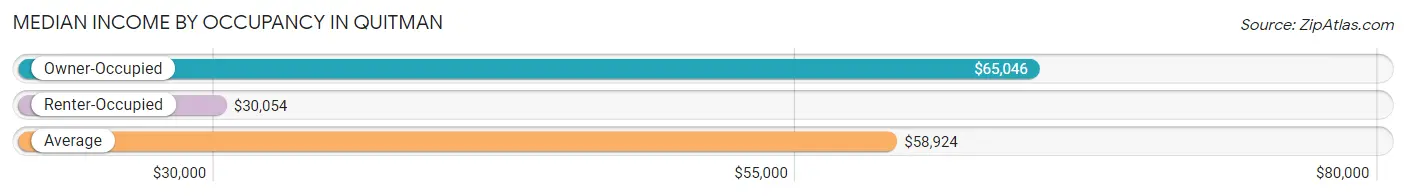
| Occupancy Type | # Households | Median Income |
| Owner-Occupied | 509 (62.4%) | $65,046 |
| Renter-Occupied | 307 (37.6%) | $30,054 |
| Average | 816 (100.0%) | $58,924 |
Occupancy by Householder Income Bracket in Quitman
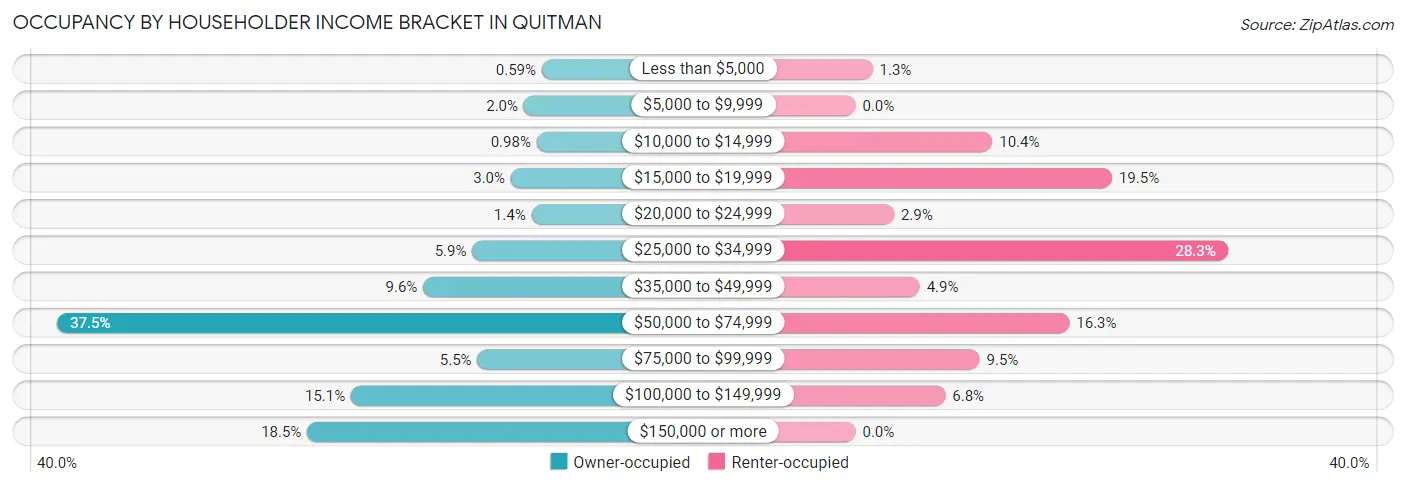
| Income Bracket | Owner-occupied | Renter-occupied |
| Less than $5,000 | 3 (0.6%) | 4 (1.3%) |
| $5,000 to $9,999 | 10 (2.0%) | 0 (0.0%) |
| $10,000 to $14,999 | 5 (1.0%) | 32 (10.4%) |
| $15,000 to $19,999 | 15 (2.9%) | 60 (19.5%) |
| $20,000 to $24,999 | 7 (1.4%) | 9 (2.9%) |
| $25,000 to $34,999 | 30 (5.9%) | 87 (28.3%) |
| $35,000 to $49,999 | 49 (9.6%) | 15 (4.9%) |
| $50,000 to $74,999 | 191 (37.5%) | 50 (16.3%) |
| $75,000 to $99,999 | 28 (5.5%) | 29 (9.5%) |
| $100,000 to $149,999 | 77 (15.1%) | 21 (6.8%) |
| $150,000 or more | 94 (18.5%) | 0 (0.0%) |
| Total | 509 (100.0%) | 307 (100.0%) |
Monthly Housing Cost Tiers in Quitman
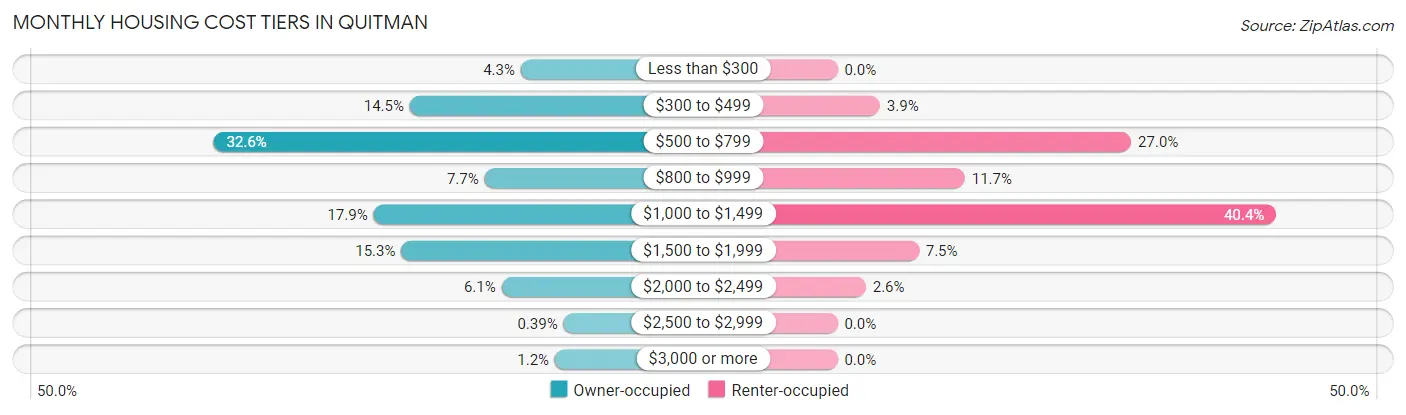
| Monthly Cost | Owner-occupied | Renter-occupied |
| Less than $300 | 22 (4.3%) | 0 (0.0%) |
| $300 to $499 | 74 (14.5%) | 12 (3.9%) |
| $500 to $799 | 166 (32.6%) | 83 (27.0%) |
| $800 to $999 | 39 (7.7%) | 36 (11.7%) |
| $1,000 to $1,499 | 91 (17.9%) | 124 (40.4%) |
| $1,500 to $1,999 | 78 (15.3%) | 23 (7.5%) |
| $2,000 to $2,499 | 31 (6.1%) | 8 (2.6%) |
| $2,500 to $2,999 | 2 (0.4%) | 0 (0.0%) |
| $3,000 or more | 6 (1.2%) | 0 (0.0%) |
| Total | 509 (100.0%) | 307 (100.0%) |
Physical Housing Characteristics in Quitman
Housing Structures in Quitman
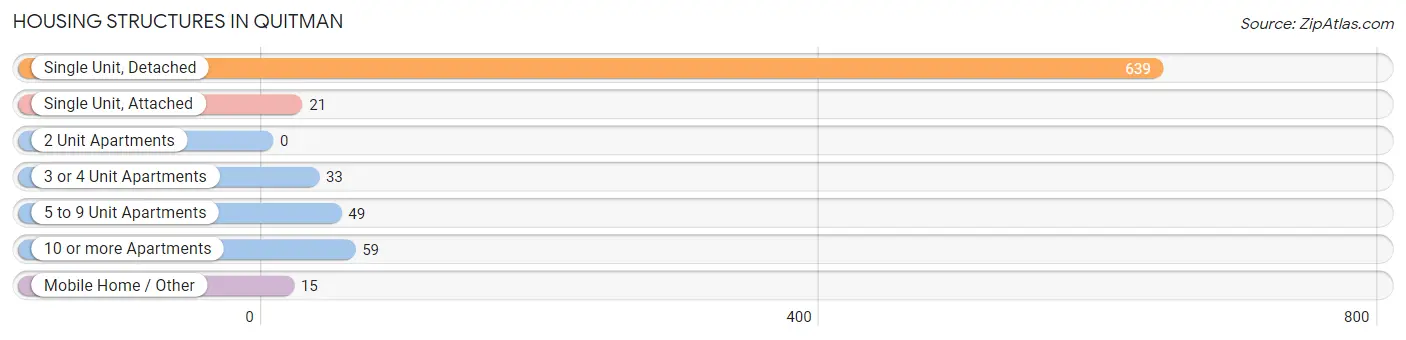
| Structure Type | # Housing Units | % Housing Units |
| Single Unit, Detached | 639 | 78.3% |
| Single Unit, Attached | 21 | 2.6% |
| 2 Unit Apartments | 0 | 0.0% |
| 3 or 4 Unit Apartments | 33 | 4.0% |
| 5 to 9 Unit Apartments | 49 | 6.0% |
| 10 or more Apartments | 59 | 7.2% |
| Mobile Home / Other | 15 | 1.8% |
| Total | 816 | 100.0% |
Housing Structures by Occupancy in Quitman
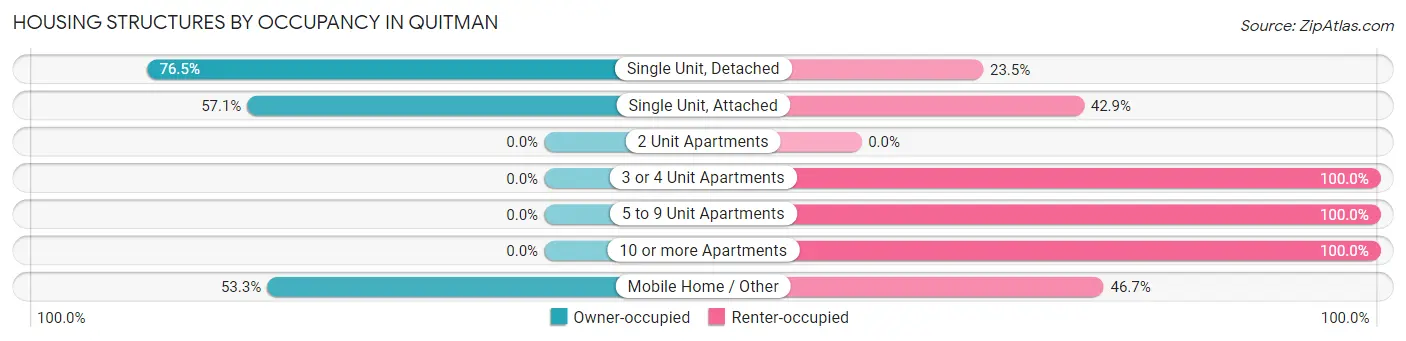
| Structure Type | Owner-occupied | Renter-occupied |
| Single Unit, Detached | 489 (76.5%) | 150 (23.5%) |
| Single Unit, Attached | 12 (57.1%) | 9 (42.9%) |
| 2 Unit Apartments | 0 (0.0%) | 0 (0.0%) |
| 3 or 4 Unit Apartments | 0 (0.0%) | 33 (100.0%) |
| 5 to 9 Unit Apartments | 0 (0.0%) | 49 (100.0%) |
| 10 or more Apartments | 0 (0.0%) | 59 (100.0%) |
| Mobile Home / Other | 8 (53.3%) | 7 (46.7%) |
| Total | 509 (62.4%) | 307 (37.6%) |
Housing Structures by Number of Rooms in Quitman
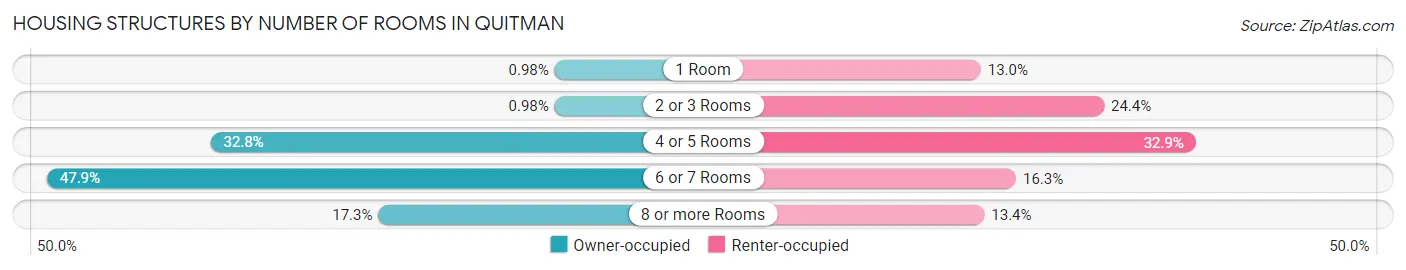
| Number of Rooms | Owner-occupied | Renter-occupied |
| 1 Room | 5 (1.0%) | 40 (13.0%) |
| 2 or 3 Rooms | 5 (1.0%) | 75 (24.4%) |
| 4 or 5 Rooms | 167 (32.8%) | 101 (32.9%) |
| 6 or 7 Rooms | 244 (47.9%) | 50 (16.3%) |
| 8 or more Rooms | 88 (17.3%) | 41 (13.4%) |
| Total | 509 (100.0%) | 307 (100.0%) |
Housing Structure by Heating Type in Quitman
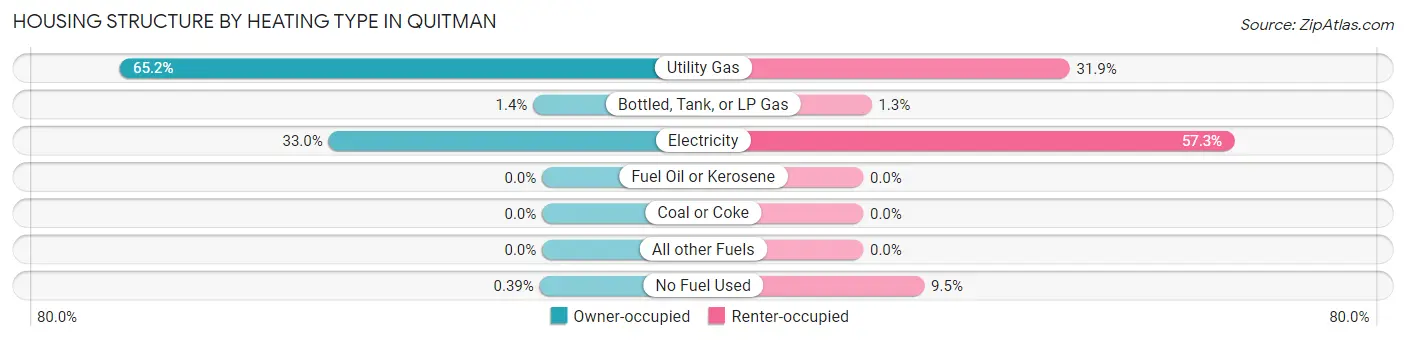
| Heating Type | Owner-occupied | Renter-occupied |
| Utility Gas | 332 (65.2%) | 98 (31.9%) |
| Bottled, Tank, or LP Gas | 7 (1.4%) | 4 (1.3%) |
| Electricity | 168 (33.0%) | 176 (57.3%) |
| Fuel Oil or Kerosene | 0 (0.0%) | 0 (0.0%) |
| Coal or Coke | 0 (0.0%) | 0 (0.0%) |
| All other Fuels | 0 (0.0%) | 0 (0.0%) |
| No Fuel Used | 2 (0.4%) | 29 (9.5%) |
| Total | 509 (100.0%) | 307 (100.0%) |
Household Vehicle Usage in Quitman
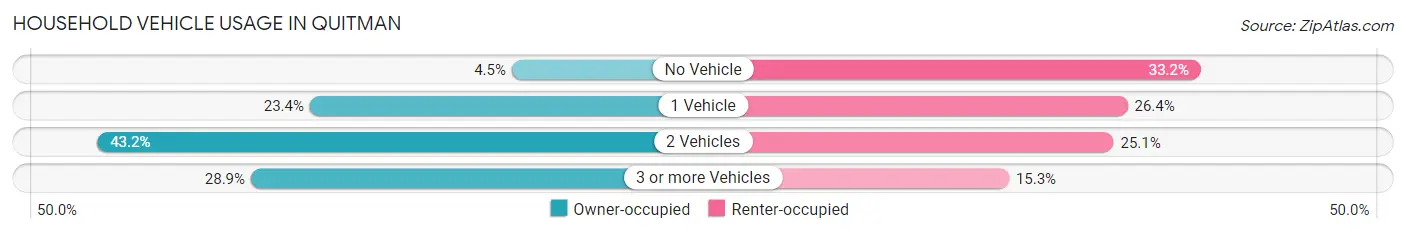
| Vehicles per Household | Owner-occupied | Renter-occupied |
| No Vehicle | 23 (4.5%) | 102 (33.2%) |
| 1 Vehicle | 119 (23.4%) | 81 (26.4%) |
| 2 Vehicles | 220 (43.2%) | 77 (25.1%) |
| 3 or more Vehicles | 147 (28.9%) | 47 (15.3%) |
| Total | 509 (100.0%) | 307 (100.0%) |
Real Estate & Mortgages in Quitman
Real Estate and Mortgage Overview in Quitman
| Characteristic | Without Mortgage | With Mortgage |
| Housing Units | 262 | 247 |
| Median Property Value | $136,500 | $167,600 |
| Median Household Income | $59,491 | $58 |
| Monthly Housing Costs | $556 | $6 |
| Real Estate Taxes | $1,750 | $9 |
Property Value by Mortgage Status in Quitman
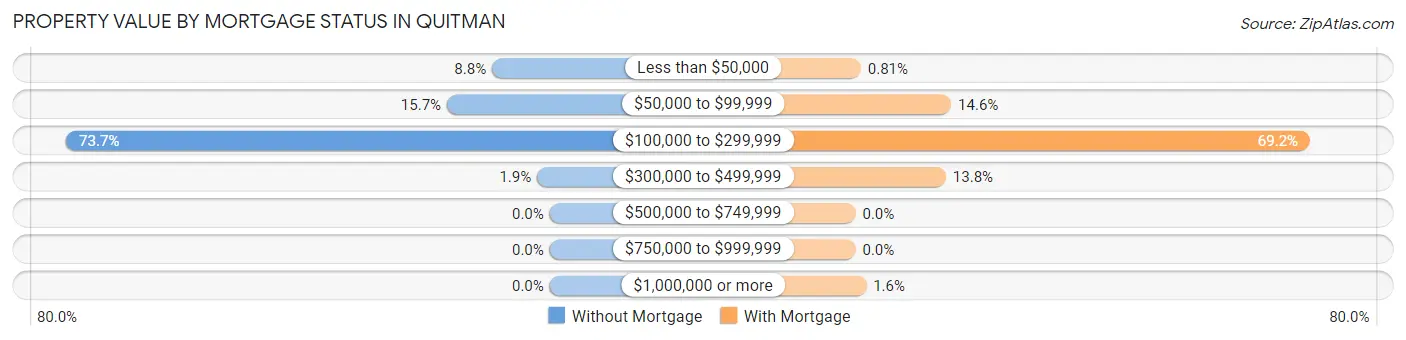
| Property Value | Without Mortgage | With Mortgage |
| Less than $50,000 | 23 (8.8%) | 2 (0.8%) |
| $50,000 to $99,999 | 41 (15.7%) | 36 (14.6%) |
| $100,000 to $299,999 | 193 (73.7%) | 171 (69.2%) |
| $300,000 to $499,999 | 5 (1.9%) | 34 (13.8%) |
| $500,000 to $749,999 | 0 (0.0%) | 0 (0.0%) |
| $750,000 to $999,999 | 0 (0.0%) | 0 (0.0%) |
| $1,000,000 or more | 0 (0.0%) | 4 (1.6%) |
| Total | 262 (100.0%) | 247 (100.0%) |
Household Income by Mortgage Status in Quitman
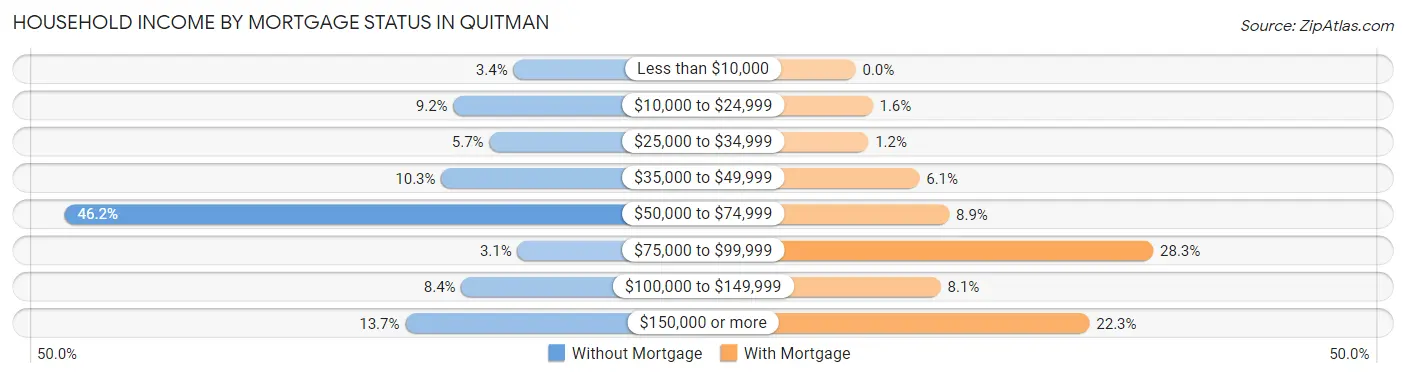
| Household Income | Without Mortgage | With Mortgage |
| Less than $10,000 | 9 (3.4%) | 0 (0.0%) |
| $10,000 to $24,999 | 24 (9.2%) | 4 (1.6%) |
| $25,000 to $34,999 | 15 (5.7%) | 3 (1.2%) |
| $35,000 to $49,999 | 27 (10.3%) | 15 (6.1%) |
| $50,000 to $74,999 | 121 (46.2%) | 22 (8.9%) |
| $75,000 to $99,999 | 8 (3.0%) | 70 (28.3%) |
| $100,000 to $149,999 | 22 (8.4%) | 20 (8.1%) |
| $150,000 or more | 36 (13.7%) | 55 (22.3%) |
| Total | 262 (100.0%) | 247 (100.0%) |
Property Value to Household Income Ratio in Quitman
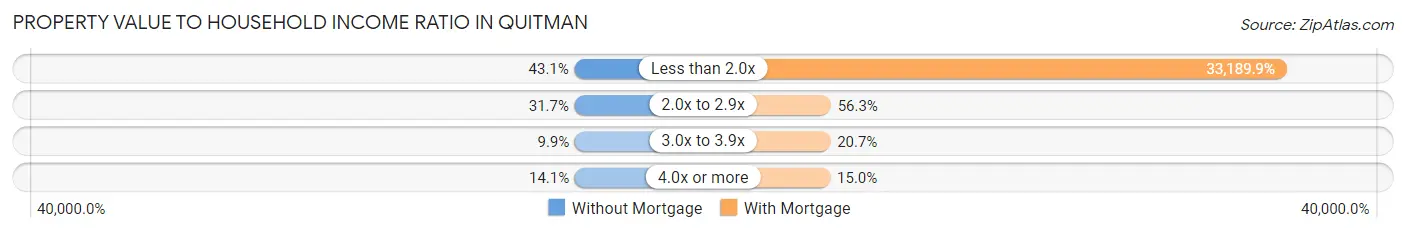
| Value-to-Income Ratio | Without Mortgage | With Mortgage |
| Less than 2.0x | 113 (43.1%) | 81,979 (33,189.9%) |
| 2.0x to 2.9x | 83 (31.7%) | 139 (56.3%) |
| 3.0x to 3.9x | 26 (9.9%) | 51 (20.6%) |
| 4.0x or more | 37 (14.1%) | 37 (15.0%) |
| Total | 262 (100.0%) | 247 (100.0%) |
Real Estate Taxes by Mortgage Status in Quitman
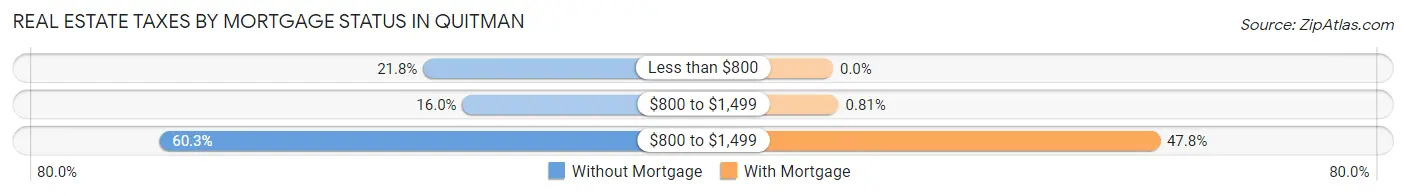
| Property Taxes | Without Mortgage | With Mortgage |
| Less than $800 | 57 (21.8%) | 0 (0.0%) |
| $800 to $1,499 | 42 (16.0%) | 2 (0.8%) |
| $800 to $1,499 | 158 (60.3%) | 118 (47.8%) |
| Total | 262 (100.0%) | 247 (100.0%) |
Health & Disability in Quitman
Health Insurance Coverage by Age in Quitman
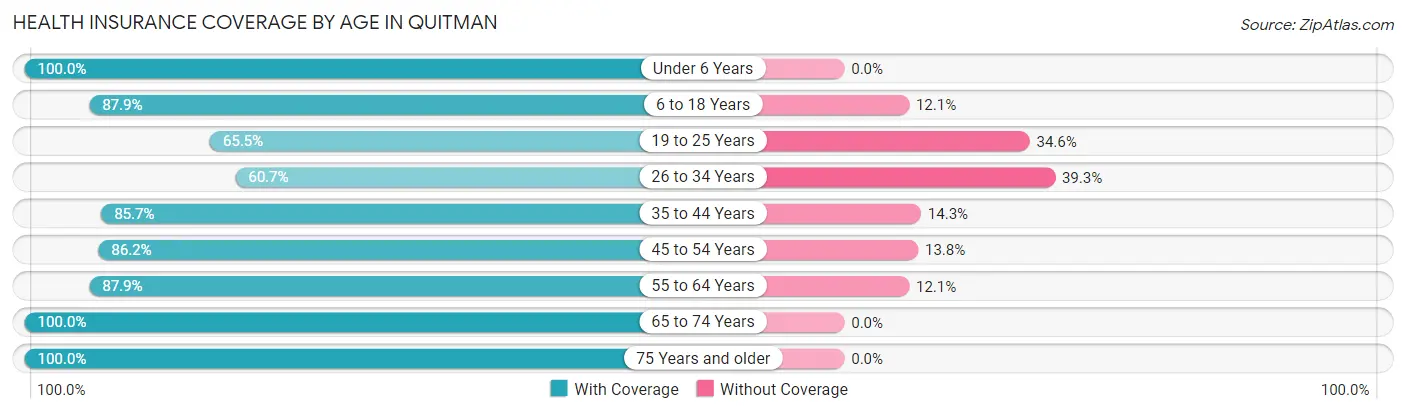
| Age Bracket | With Coverage | Without Coverage |
| Under 6 Years | 197 (100.0%) | 0 (0.0%) |
| 6 to 18 Years | 379 (87.9%) | 52 (12.1%) |
| 19 to 25 Years | 72 (65.4%) | 38 (34.5%) |
| 26 to 34 Years | 68 (60.7%) | 44 (39.3%) |
| 35 to 44 Years | 216 (85.7%) | 36 (14.3%) |
| 45 to 54 Years | 163 (86.2%) | 26 (13.8%) |
| 55 to 64 Years | 255 (87.9%) | 35 (12.1%) |
| 65 to 74 Years | 201 (100.0%) | 0 (0.0%) |
| 75 Years and older | 306 (100.0%) | 0 (0.0%) |
| Total | 1,857 (88.9%) | 231 (11.1%) |
Health Insurance Coverage by Citizenship Status in Quitman
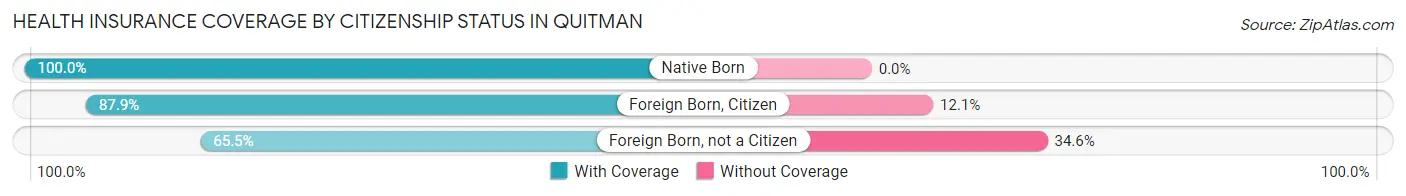
| Citizenship Status | With Coverage | Without Coverage |
| Native Born | 197 (100.0%) | 0 (0.0%) |
| Foreign Born, Citizen | 379 (87.9%) | 52 (12.1%) |
| Foreign Born, not a Citizen | 72 (65.4%) | 38 (34.5%) |
Health Insurance Coverage by Household Income in Quitman
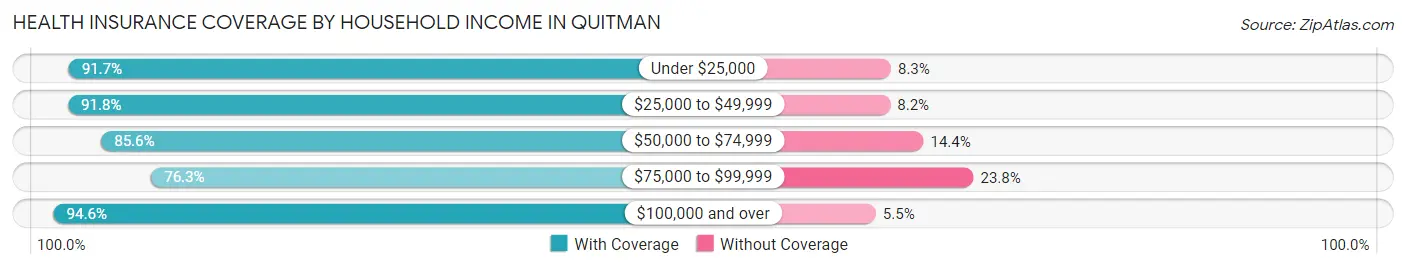
| Household Income | With Coverage | Without Coverage |
| Under $25,000 | 166 (91.7%) | 15 (8.3%) |
| $25,000 to $49,999 | 394 (91.8%) | 35 (8.2%) |
| $50,000 to $74,999 | 542 (85.6%) | 91 (14.4%) |
| $75,000 to $99,999 | 183 (76.2%) | 57 (23.7%) |
| $100,000 and over | 572 (94.6%) | 33 (5.4%) |
Public vs Private Health Insurance Coverage by Age in Quitman
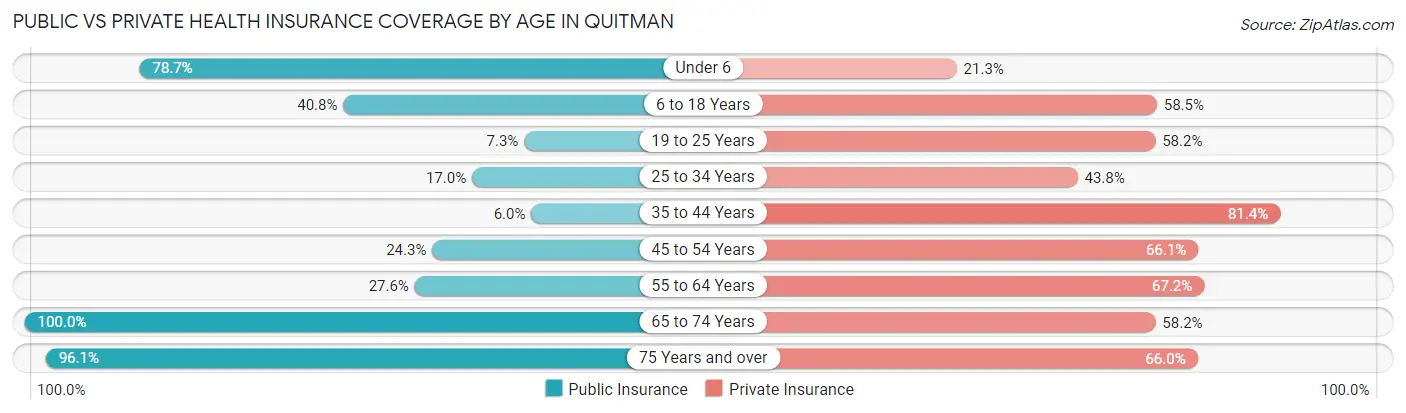
| Age Bracket | Public Insurance | Private Insurance |
| Under 6 | 155 (78.7%) | 42 (21.3%) |
| 6 to 18 Years | 176 (40.8%) | 252 (58.5%) |
| 19 to 25 Years | 8 (7.3%) | 64 (58.2%) |
| 25 to 34 Years | 19 (17.0%) | 49 (43.8%) |
| 35 to 44 Years | 15 (5.9%) | 205 (81.4%) |
| 45 to 54 Years | 46 (24.3%) | 125 (66.1%) |
| 55 to 64 Years | 80 (27.6%) | 195 (67.2%) |
| 65 to 74 Years | 201 (100.0%) | 117 (58.2%) |
| 75 Years and over | 294 (96.1%) | 202 (66.0%) |
| Total | 994 (47.6%) | 1,251 (59.9%) |
Disability Status by Sex by Age in Quitman
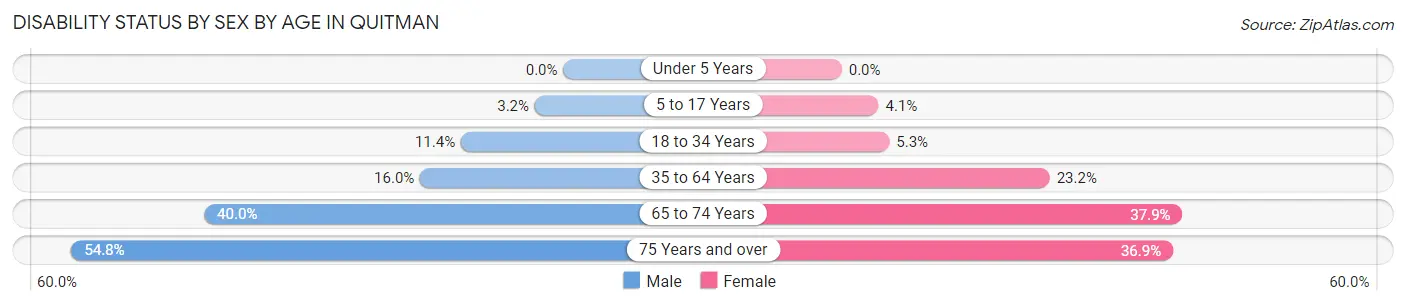
| Age Bracket | Male | Female |
| Under 5 Years | 0 (0.0%) | 0 (0.0%) |
| 5 to 17 Years | 6 (3.2%) | 10 (4.1%) |
| 18 to 34 Years | 13 (11.4%) | 8 (5.3%) |
| 35 to 64 Years | 56 (16.0%) | 88 (23.2%) |
| 65 to 74 Years | 34 (40.0%) | 44 (37.9%) |
| 75 Years and over | 80 (54.8%) | 59 (36.9%) |
Disability Class by Sex by Age in Quitman
Disability Class: Hearing Difficulty
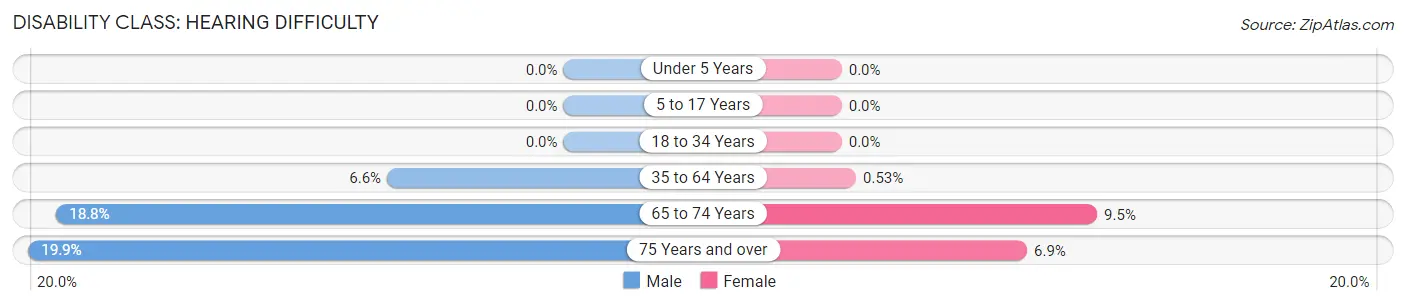
| Age Bracket | Male | Female |
| Under 5 Years | 0 (0.0%) | 0 (0.0%) |
| 5 to 17 Years | 0 (0.0%) | 0 (0.0%) |
| 18 to 34 Years | 0 (0.0%) | 0 (0.0%) |
| 35 to 64 Years | 23 (6.6%) | 2 (0.5%) |
| 65 to 74 Years | 16 (18.8%) | 11 (9.5%) |
| 75 Years and over | 29 (19.9%) | 11 (6.9%) |
Disability Class: Vision Difficulty
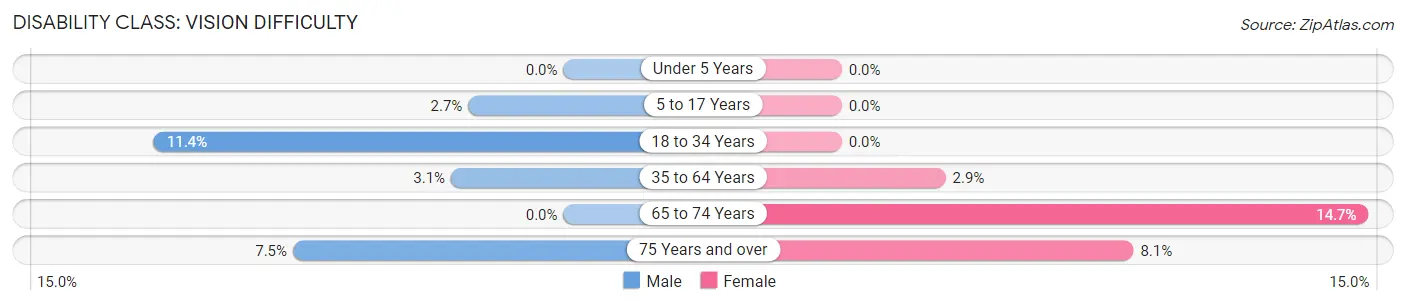
| Age Bracket | Male | Female |
| Under 5 Years | 0 (0.0%) | 0 (0.0%) |
| 5 to 17 Years | 5 (2.6%) | 0 (0.0%) |
| 18 to 34 Years | 13 (11.4%) | 0 (0.0%) |
| 35 to 64 Years | 11 (3.1%) | 11 (2.9%) |
| 65 to 74 Years | 0 (0.0%) | 17 (14.7%) |
| 75 Years and over | 11 (7.5%) | 13 (8.1%) |
Disability Class: Cognitive Difficulty
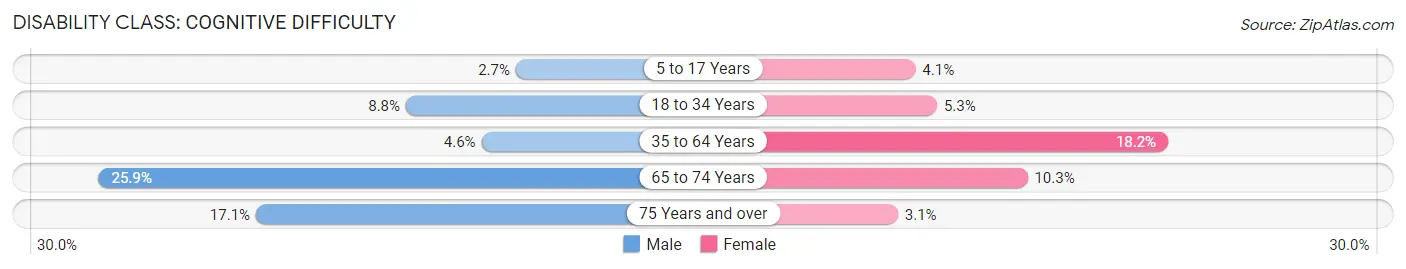
| Age Bracket | Male | Female |
| 5 to 17 Years | 5 (2.6%) | 10 (4.1%) |
| 18 to 34 Years | 10 (8.8%) | 8 (5.3%) |
| 35 to 64 Years | 16 (4.6%) | 69 (18.2%) |
| 65 to 74 Years | 22 (25.9%) | 12 (10.3%) |
| 75 Years and over | 25 (17.1%) | 5 (3.1%) |
Disability Class: Ambulatory Difficulty
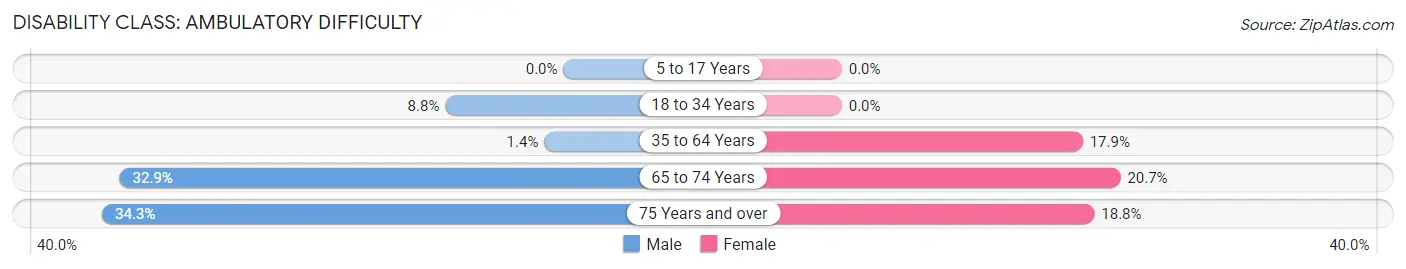
| Age Bracket | Male | Female |
| 5 to 17 Years | 0 (0.0%) | 0 (0.0%) |
| 18 to 34 Years | 10 (8.8%) | 0 (0.0%) |
| 35 to 64 Years | 5 (1.4%) | 68 (17.9%) |
| 65 to 74 Years | 28 (32.9%) | 24 (20.7%) |
| 75 Years and over | 50 (34.3%) | 30 (18.8%) |
Disability Class: Self-Care Difficulty
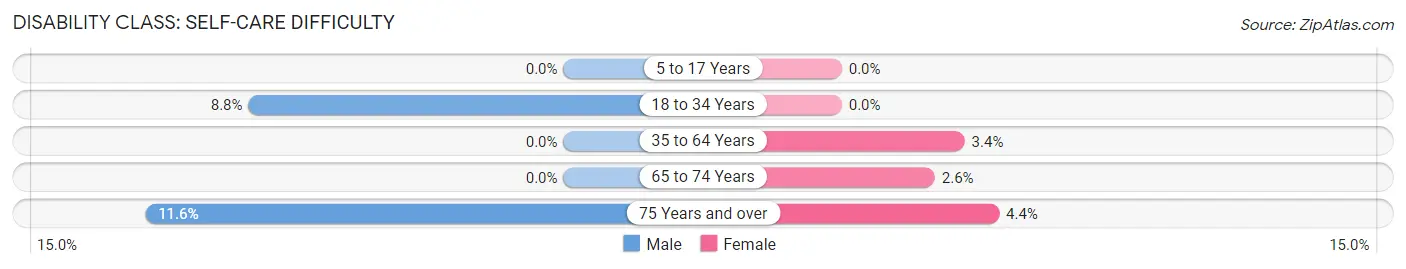
| Age Bracket | Male | Female |
| 5 to 17 Years | 0 (0.0%) | 0 (0.0%) |
| 18 to 34 Years | 10 (8.8%) | 0 (0.0%) |
| 35 to 64 Years | 0 (0.0%) | 13 (3.4%) |
| 65 to 74 Years | 0 (0.0%) | 3 (2.6%) |
| 75 Years and over | 17 (11.6%) | 7 (4.4%) |
Technology Access in Quitman
Computing Device Access in Quitman
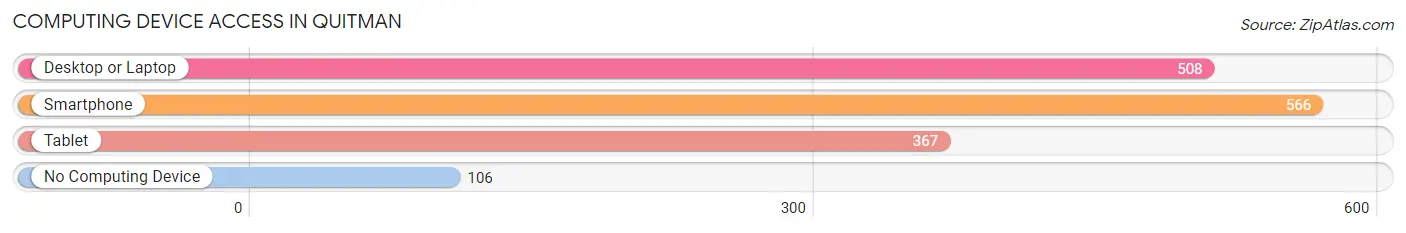
| Device Type | # Households | % Households |
| Desktop or Laptop | 508 | 62.3% |
| Smartphone | 566 | 69.4% |
| Tablet | 367 | 45.0% |
| No Computing Device | 106 | 13.0% |
| Total | 816 | 100.0% |
Internet Access in Quitman
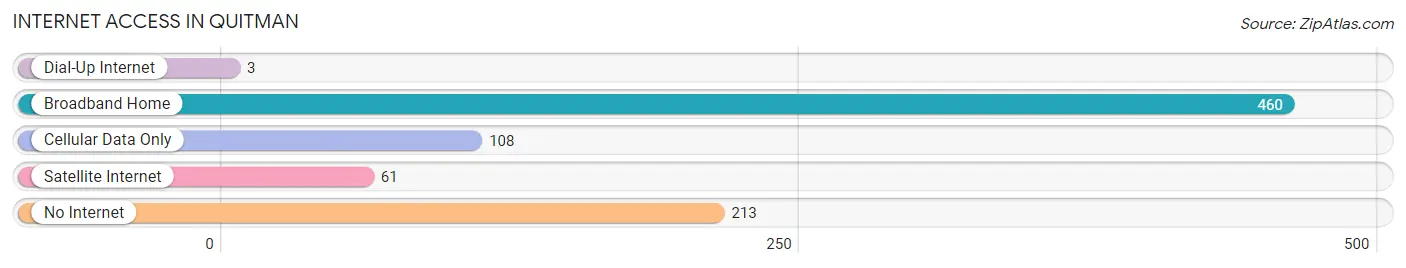
| Internet Type | # Households | % Households |
| Dial-Up Internet | 3 | 0.4% |
| Broadband Home | 460 | 56.4% |
| Cellular Data Only | 108 | 13.2% |
| Satellite Internet | 61 | 7.5% |
| No Internet | 213 | 26.1% |
| Total | 816 | 100.0% |
Quitman Summary
Quitman, Texas is a small town located in Wood County, Texas, United States. It is situated on the banks of Lake Fork Reservoir, about 90 miles east of Dallas. The population of Quitman was 2,541 at the 2010 census.
History
Quitman was founded in 1873 by a group of settlers from Quitman, Georgia. The town was named after John A. Quitman, a former governor of Mississippi. The town was incorporated in 1876 and was the county seat of Wood County until 1879, when it was moved to Mineola.
Quitman was a thriving town in the late 19th century, with a population of over 1,000 people. The town had several stores, a hotel, a bank, a post office, a school, and a newspaper. The town was also home to a number of churches, including the First Baptist Church, which was founded in 1876.
In the early 20th century, Quitman began to decline as the railroad bypassed the town and the population began to move away. By the 1950s, the population had dropped to just over 500 people.
Geography
Quitman is located at the intersection of U.S. Highway 69 and State Highway 154, about 90 miles east of Dallas. The town is situated on the banks of Lake Fork Reservoir, which is a popular fishing and recreational area. The town is surrounded by rolling hills and wooded areas.
Economy
The economy of Quitman is largely based on agriculture and tourism. The town is home to several farms, which produce a variety of crops, including cotton, corn, soybeans, and wheat. The town is also home to several businesses, including a grocery store, a hardware store, and a restaurant.
Tourism is an important part of the local economy, as the town is located near several popular recreational areas, including Lake Fork Reservoir, Lake Quitman, and Lake Hawkins. The town also hosts several annual events, including the Quitman County Fair and the Quitman County Rodeo.
Demographics
As of the 2010 census, the population of Quitman was 2,541. The racial makeup of the town was 79.3% White, 16.2% African American, 0.3% Native American, 0.5% Asian, 0.1% Pacific Islander, 1.7% from other races, and 1.9% from two or more races. Hispanic or Latino of any race were 4.2% of the population.
The median income for a household in Quitman was $31,250, and the median income for a family was $37,500. The per capita income for the town was $17,845. About 17.2% of families and 20.2% of the population were below the poverty line, including 28.3% of those under age 18 and 11.2% of those age 65 or over.
Common Questions
What is Per Capita Income in Quitman?
Per Capita income in Quitman is $26,808.
What is the Median Family Income in Quitman?
Median Family Income in Quitman is $59,846.
What is the Median Household income in Quitman?
Median Household Income in Quitman is $58,924.
What is Income or Wage Gap in Quitman?
Income or Wage Gap in Quitman is 29.0%.
Women in Quitman earn 71.0 cents for every dollar earned by a man.
What is Inequality or Gini Index in Quitman?
Inequality or Gini Index in Quitman is 0.40.
What is the Total Population of Quitman?
Total Population of Quitman is 2,301.
What is the Total Male Population of Quitman?
Total Male Population of Quitman is 1,103.
What is the Total Female Population of Quitman?
Total Female Population of Quitman is 1,198.
What is the Ratio of Males per 100 Females in Quitman?
There are 92.07 Males per 100 Females in Quitman.
What is the Ratio of Females per 100 Males in Quitman?
There are 108.61 Females per 100 Males in Quitman.
What is the Median Population Age in Quitman?
Median Population Age in Quitman is 42.1 Years.
What is the Average Family Size in Quitman
Average Family Size in Quitman is 3.0 People.
What is the Average Household Size in Quitman
Average Household Size in Quitman is 2.6 People.
How Large is the Labor Force in Quitman?
There are 839 People in the Labor Forcein in Quitman.
What is the Percentage of People in the Labor Force in Quitman?
47.1% of People are in the Labor Force in Quitman.
What is the Unemployment Rate in Quitman?
Unemployment Rate in Quitman is 7.7%.