Quinlan, TX Map & Demographics
Quinlan Map
Quinlan Overview
$25,125
PER CAPITA INCOME
$57,045
AVG FAMILY INCOME
$38,151
AVG HOUSEHOLD INCOME
33.3%
WAGE / INCOME GAP [ % ]
66.7¢/ $1
WAGE / INCOME GAP [ $ ]
$9,589
FAMILY INCOME DEFICIT
0.45
INEQUALITY / GINI INDEX
1,470
TOTAL POPULATION
644
MALE POPULATION
826
FEMALE POPULATION
77.97
MALES / 100 FEMALES
128.26
FEMALES / 100 MALES
37.8
MEDIAN AGE
3.1
AVG FAMILY SIZE
2.4
AVG HOUSEHOLD SIZE
615
LABOR FORCE [ PEOPLE ]
56.7%
PERCENT IN LABOR FORCE
5.2%
UNEMPLOYMENT RATE
Quinlan Zip Codes
Quinlan Area Codes
Income in Quinlan
Income Overview in Quinlan
Per Capita Income in Quinlan is $25,125, while median incomes of families and households are $57,045 and $38,151 respectively.
| Characteristic | Number | Measure |
| Per Capita Income | 1,470 | $25,125 |
| Median Family Income | 374 | $57,045 |
| Mean Family Income | 374 | $75,340 |
| Median Household Income | 611 | $38,151 |
| Mean Household Income | 611 | $58,091 |
| Income Deficit | 374 | $9,589 |
| Wage / Income Gap (%) | 1,470 | 33.28% |
| Wage / Income Gap ($) | 1,470 | 66.72¢ per $1 |
| Gini / Inequality Index | 1,470 | 0.45 |
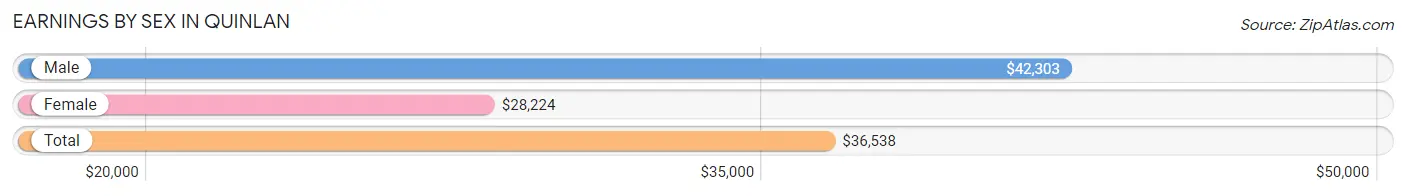
Earnings by Sex in Quinlan
Average Earnings in Quinlan are $36,538, $42,303 for men and $28,224 for women, a difference of 33.3%.
| Sex | Number | Average Earnings |
| Male | 357 (58.1%) | $42,303 |
| Female | 257 (41.9%) | $28,224 |
| Total | 614 (100.0%) | $36,538 |
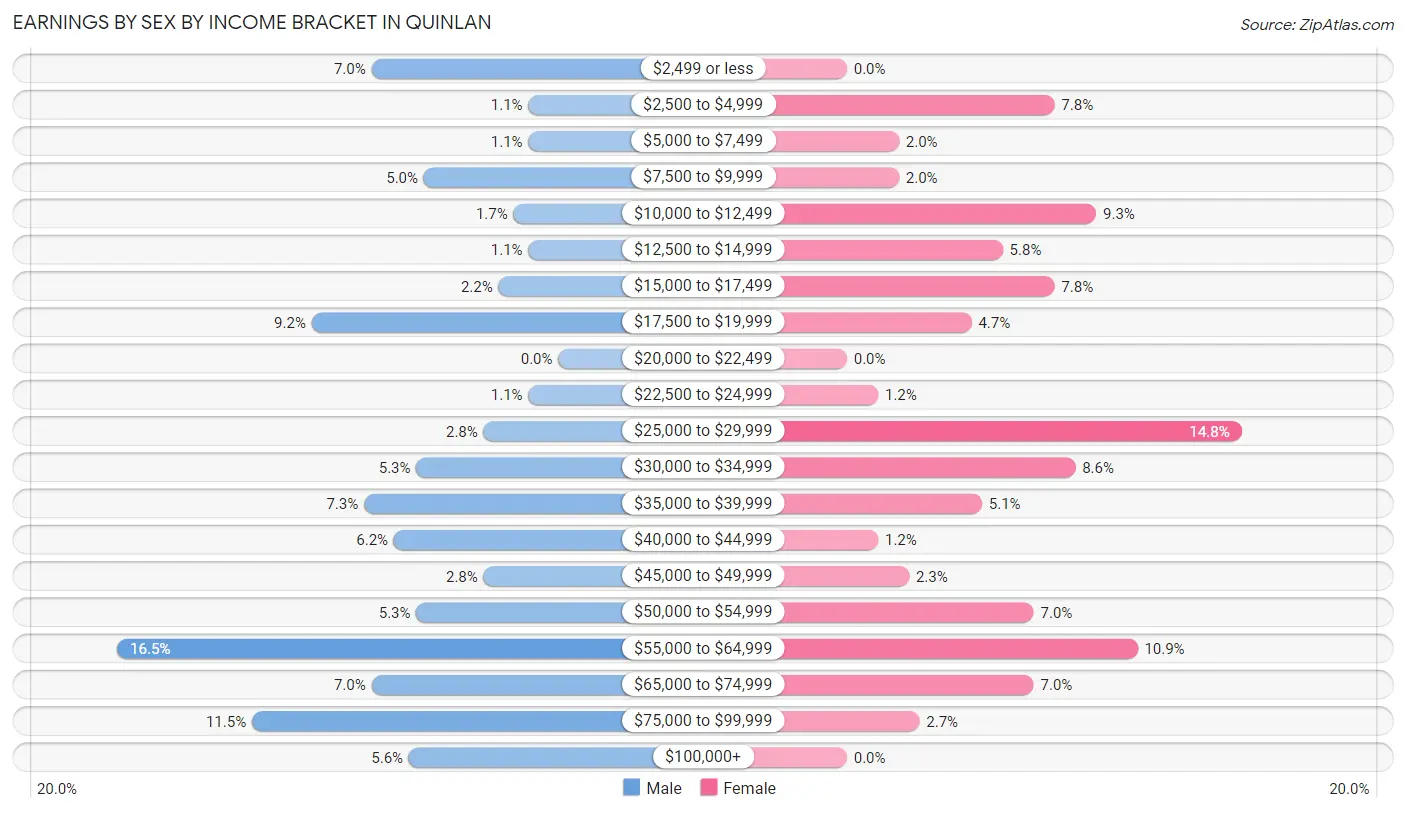
Earnings by Sex by Income Bracket in Quinlan
The most common earnings brackets in Quinlan are $55,000 to $64,999 for men (59 | 16.5%) and $25,000 to $29,999 for women (38 | 14.8%).
| Income | Male | Female |
| $2,499 or less | 25 (7.0%) | 0 (0.0%) |
| $2,500 to $4,999 | 4 (1.1%) | 20 (7.8%) |
| $5,000 to $7,499 | 4 (1.1%) | 5 (1.9%) |
| $7,500 to $9,999 | 18 (5.0%) | 5 (1.9%) |
| $10,000 to $12,499 | 6 (1.7%) | 24 (9.3%) |
| $12,500 to $14,999 | 4 (1.1%) | 15 (5.8%) |
| $15,000 to $17,499 | 8 (2.2%) | 20 (7.8%) |
| $17,500 to $19,999 | 33 (9.2%) | 12 (4.7%) |
| $20,000 to $22,499 | 0 (0.0%) | 0 (0.0%) |
| $22,500 to $24,999 | 4 (1.1%) | 3 (1.2%) |
| $25,000 to $29,999 | 10 (2.8%) | 38 (14.8%) |
| $30,000 to $34,999 | 19 (5.3%) | 22 (8.6%) |
| $35,000 to $39,999 | 26 (7.3%) | 13 (5.1%) |
| $40,000 to $44,999 | 22 (6.2%) | 3 (1.2%) |
| $45,000 to $49,999 | 10 (2.8%) | 6 (2.3%) |
| $50,000 to $54,999 | 19 (5.3%) | 18 (7.0%) |
| $55,000 to $64,999 | 59 (16.5%) | 28 (10.9%) |
| $65,000 to $74,999 | 25 (7.0%) | 18 (7.0%) |
| $75,000 to $99,999 | 41 (11.5%) | 7 (2.7%) |
| $100,000+ | 20 (5.6%) | 0 (0.0%) |
| Total | 357 (100.0%) | 257 (100.0%) |
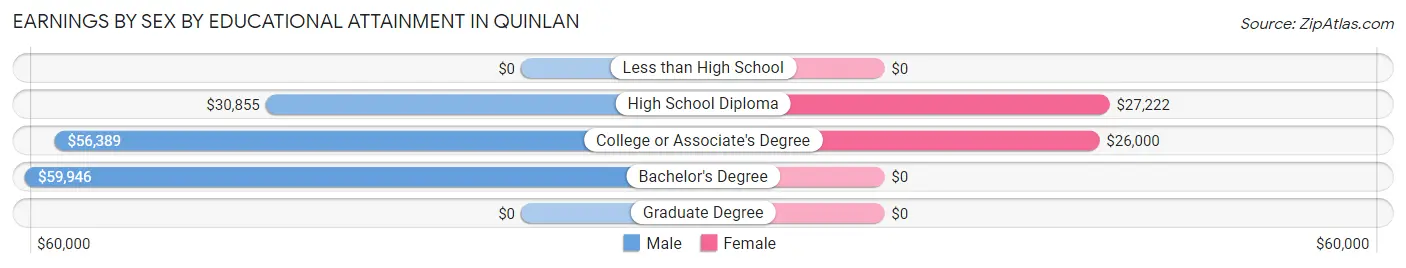
Earnings by Sex by Educational Attainment in Quinlan
Average earnings in Quinlan are $45,875 for men and $28,487 for women, a difference of 37.9%. Men with an educational attainment of bachelor's degree enjoy the highest average annual earnings of $59,946, while those with high school diploma education earn the least with $30,855. Women with an educational attainment of high school diploma earn the most with the average annual earnings of $27,222, while those with college or associate's degree education have the smallest earnings of $26,000.
| Educational Attainment | Male Income | Female Income |
| Less than High School | - | - |
| High School Diploma | $30,855 | $27,222 |
| College or Associate's Degree | $56,389 | $26,000 |
| Bachelor's Degree | $59,946 | $0 |
| Graduate Degree | - | - |
| Total | $45,875 | $28,487 |
Family Income in Quinlan
Family Income Brackets in Quinlan
According to the Quinlan family income data, there are 93 families falling into the $35,000 to $49,999 income range, which is the most common income bracket and makes up 24.9% of all families. Conversely, the $200,000+ income bracket is the least frequent group with only 6 families (1.6%) belonging to this category.
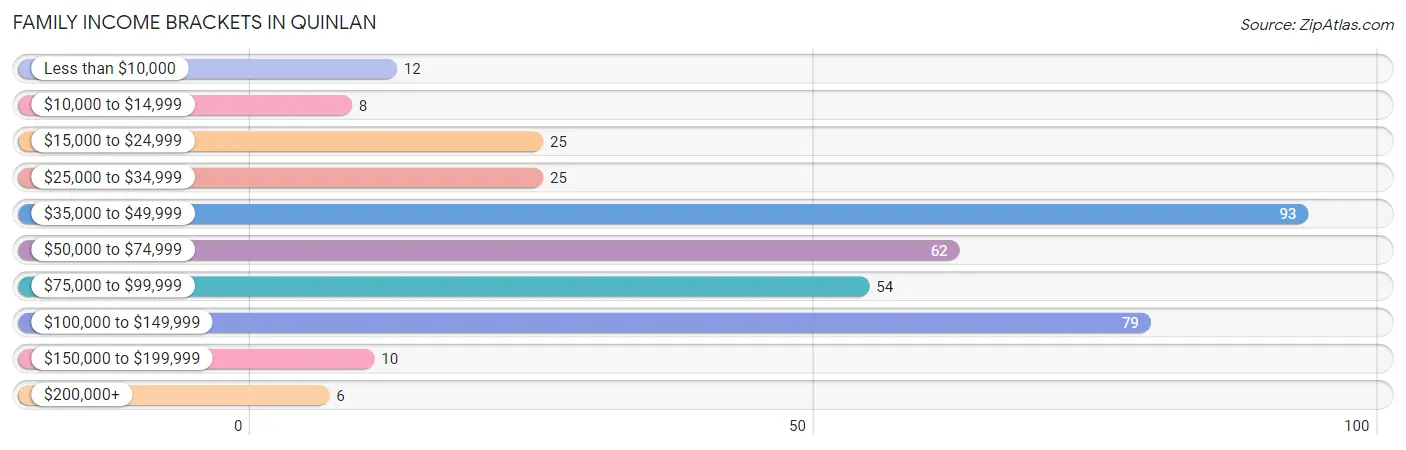
| Income Bracket | # Families | % Families |
| Less than $10,000 | 12 | 3.2% |
| $10,000 to $14,999 | 8 | 2.1% |
| $15,000 to $24,999 | 25 | 6.7% |
| $25,000 to $34,999 | 25 | 6.7% |
| $35,000 to $49,999 | 93 | 24.9% |
| $50,000 to $74,999 | 62 | 16.6% |
| $75,000 to $99,999 | 54 | 14.4% |
| $100,000 to $149,999 | 79 | 21.1% |
| $150,000 to $199,999 | 10 | 2.7% |
| $200,000+ | 6 | 1.6% |
Family Income by Famaliy Size in Quinlan
4-person families (39 | 10.4%) account for the highest median family income in Quinlan with $90,313 per family, while 2-person families (167 | 44.7%) have the highest median income of $28,125 per family member.

| Income Bracket | # Families | Median Income |
| 2-Person Families | 167 (44.7%) | $56,250 |
| 3-Person Families | 117 (31.3%) | $0 |
| 4-Person Families | 39 (10.4%) | $90,313 |
| 5-Person Families | 32 (8.6%) | $64,643 |
| 6-Person Families | 14 (3.7%) | $0 |
| 7+ Person Families | 5 (1.3%) | $0 |
| Total | 374 (100.0%) | $57,045 |
Family Income by Number of Earners in Quinlan
The median family income in Quinlan is $57,045, with families comprising 3+ earners (26) having the highest median family income of $133,125, while families with no earners (75) have the lowest median family income of $35,729, accounting for 7.0% and 20.1% of families, respectively.
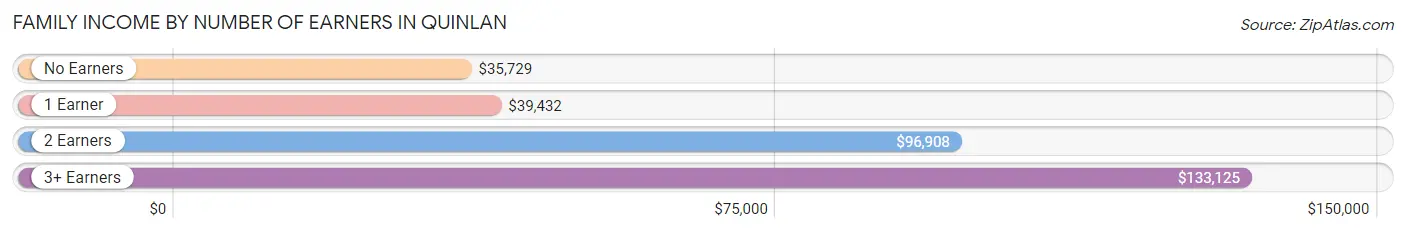
| Number of Earners | # Families | Median Income |
| No Earners | 75 (20.1%) | $35,729 |
| 1 Earner | 134 (35.8%) | $39,432 |
| 2 Earners | 139 (37.2%) | $96,908 |
| 3+ Earners | 26 (7.0%) | $133,125 |
| Total | 374 (100.0%) | $57,045 |
Household Income in Quinlan
Household Income Brackets in Quinlan
With 122 households falling in the category, the $25,000 to $34,999 income range is the most frequent in Quinlan, accounting for 20.0% of all households. In contrast, only 6 households (1.0%) fall into the $200,000+ income bracket, making it the least populous group.
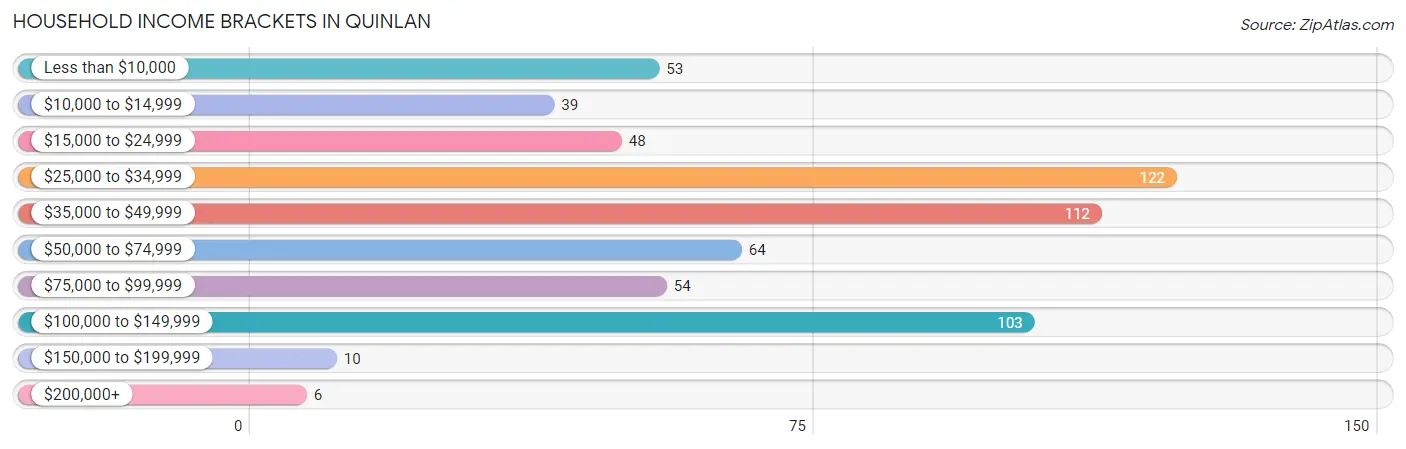
| Income Bracket | # Households | % Households |
| Less than $10,000 | 53 | 8.7% |
| $10,000 to $14,999 | 39 | 6.4% |
| $15,000 to $24,999 | 48 | 7.9% |
| $25,000 to $34,999 | 122 | 20.0% |
| $35,000 to $49,999 | 112 | 18.3% |
| $50,000 to $74,999 | 64 | 10.5% |
| $75,000 to $99,999 | 54 | 8.8% |
| $100,000 to $149,999 | 103 | 16.9% |
| $150,000 to $199,999 | 10 | 1.6% |
| $200,000+ | 6 | 1.0% |
Household Income by Householder Age in Quinlan
The median household income in Quinlan is $38,151, with the highest median household income of $41,250 found in the 25 to 44 years age bracket for the primary householder. A total of 182 households (29.8%) fall into this category. Meanwhile, the 15 to 24 years age bracket for the primary householder has the lowest median household income of $0, with 10 households (1.6%) in this group.
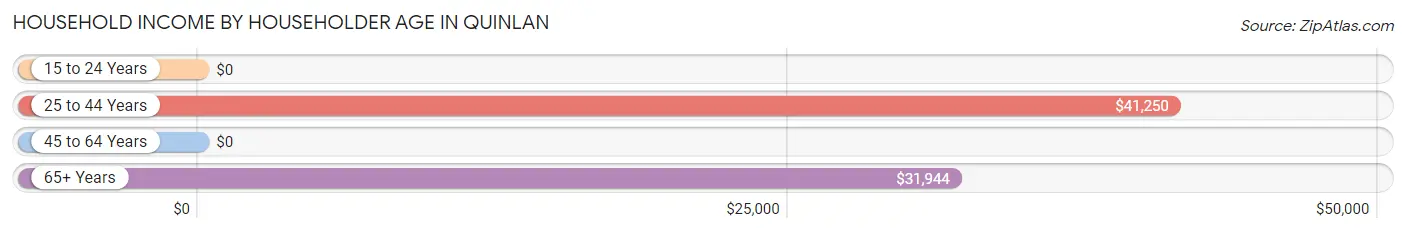
| Income Bracket | # Households | Median Income |
| 15 to 24 Years | 10 (1.6%) | $0 |
| 25 to 44 Years | 182 (29.8%) | $41,250 |
| 45 to 64 Years | 219 (35.8%) | $0 |
| 65+ Years | 200 (32.7%) | $31,944 |
| Total | 611 (100.0%) | $38,151 |
Poverty in Quinlan
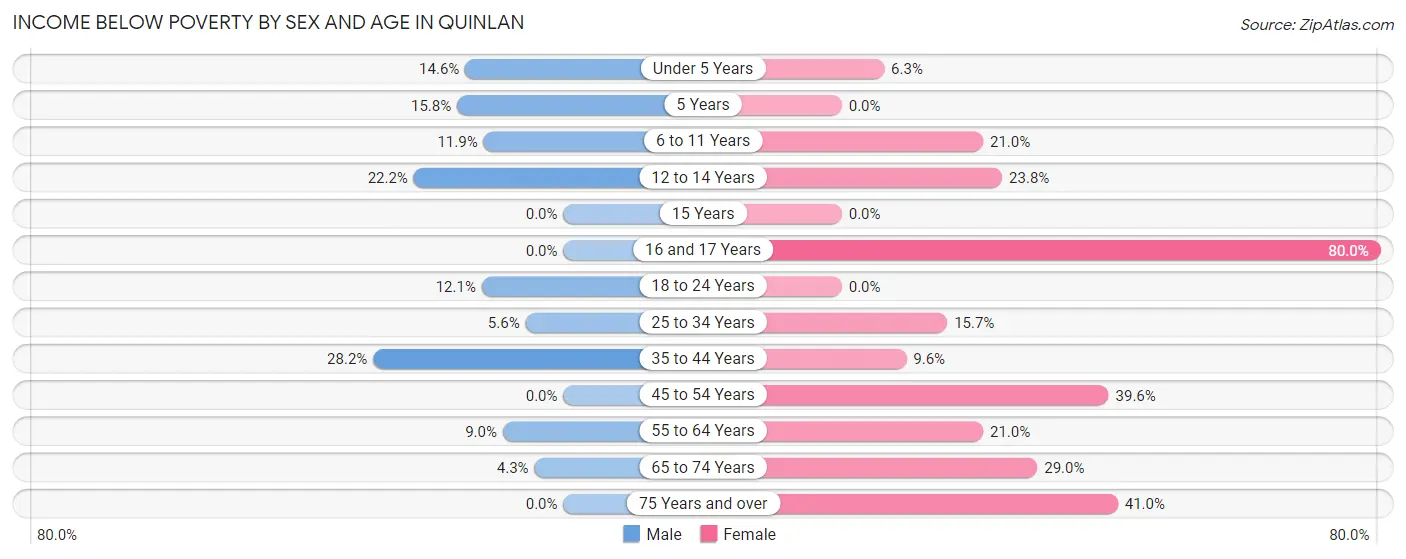
Income Below Poverty by Sex and Age in Quinlan
With 10.2% poverty level for males and 19.9% for females among the residents of Quinlan, 35 to 44 year old males and 16 and 17 year old females are the most vulnerable to poverty, with 24 males (28.2%) and 8 females (80.0%) in their respective age groups living below the poverty level.
| Age Bracket | Male | Female |
| Under 5 Years | 7 (14.6%) | 10 (6.3%) |
| 5 Years | 3 (15.8%) | 0 (0.0%) |
| 6 to 11 Years | 7 (11.9%) | 13 (21.0%) |
| 12 to 14 Years | 4 (22.2%) | 5 (23.8%) |
| 15 Years | 0 (0.0%) | 0 (0.0%) |
| 16 and 17 Years | 0 (0.0%) | 8 (80.0%) |
| 18 to 24 Years | 4 (12.1%) | 0 (0.0%) |
| 25 to 34 Years | 5 (5.6%) | 18 (15.7%) |
| 35 to 44 Years | 24 (28.2%) | 7 (9.6%) |
| 45 to 54 Years | 0 (0.0%) | 21 (39.6%) |
| 55 to 64 Years | 8 (9.0%) | 30 (21.0%) |
| 65 to 74 Years | 4 (4.3%) | 27 (29.0%) |
| 75 Years and over | 0 (0.0%) | 25 (41.0%) |
| Total | 66 (10.2%) | 164 (19.9%) |
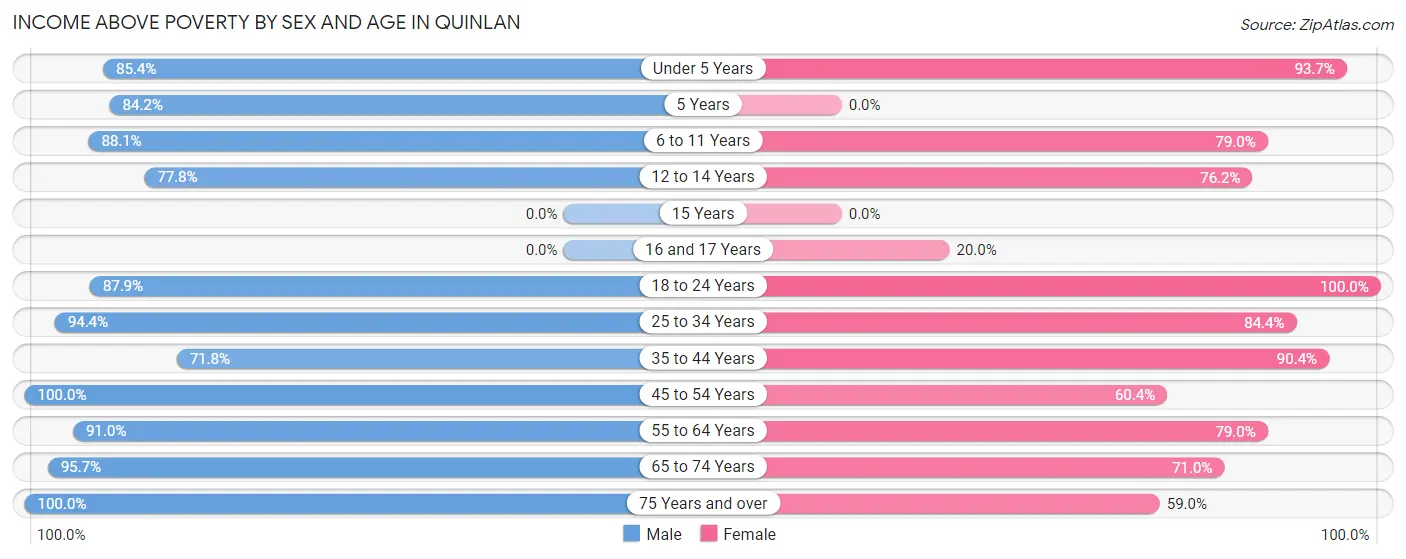
Income Above Poverty by Sex and Age in Quinlan
According to the poverty statistics in Quinlan, males aged 45 to 54 years and females aged 18 to 24 years are the age groups that are most secure financially, with 100.0% of males and 100.0% of females in these age groups living above the poverty line.
| Age Bracket | Male | Female |
| Under 5 Years | 41 (85.4%) | 149 (93.7%) |
| 5 Years | 16 (84.2%) | 0 (0.0%) |
| 6 to 11 Years | 52 (88.1%) | 49 (79.0%) |
| 12 to 14 Years | 14 (77.8%) | 16 (76.2%) |
| 15 Years | 0 (0.0%) | 0 (0.0%) |
| 16 and 17 Years | 0 (0.0%) | 2 (20.0%) |
| 18 to 24 Years | 29 (87.9%) | 36 (100.0%) |
| 25 to 34 Years | 84 (94.4%) | 97 (84.4%) |
| 35 to 44 Years | 61 (71.8%) | 66 (90.4%) |
| 45 to 54 Years | 81 (100.0%) | 32 (60.4%) |
| 55 to 64 Years | 81 (91.0%) | 113 (79.0%) |
| 65 to 74 Years | 89 (95.7%) | 66 (71.0%) |
| 75 Years and over | 30 (100.0%) | 36 (59.0%) |
| Total | 578 (89.7%) | 662 (80.1%) |
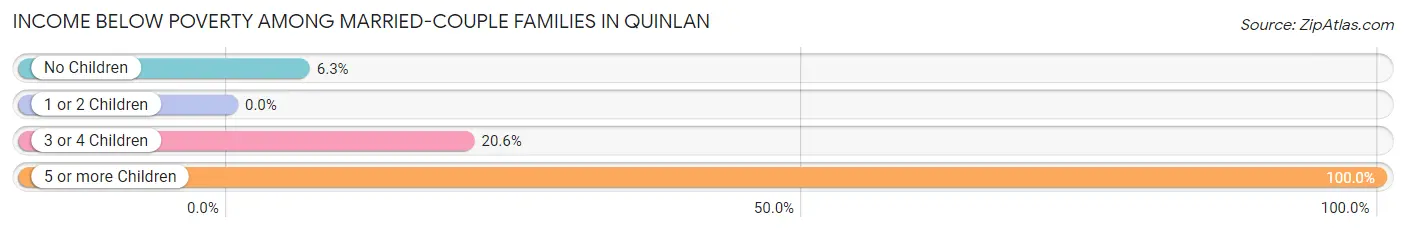
Income Below Poverty Among Married-Couple Families in Quinlan
The poverty statistics for married-couple families in Quinlan show that 6.4% or 18 of the total 281 families live below the poverty line. Families with 5 or more children have the highest poverty rate of 100.0%, comprising of 2 families. On the other hand, families with 1 or 2 children have the lowest poverty rate of 0.0%, which includes 0 families.
| Children | Above Poverty | Below Poverty |
| No Children | 135 (93.8%) | 9 (6.2%) |
| 1 or 2 Children | 101 (100.0%) | 0 (0.0%) |
| 3 or 4 Children | 27 (79.4%) | 7 (20.6%) |
| 5 or more Children | 0 (0.0%) | 2 (100.0%) |
| Total | 263 (93.6%) | 18 (6.4%) |
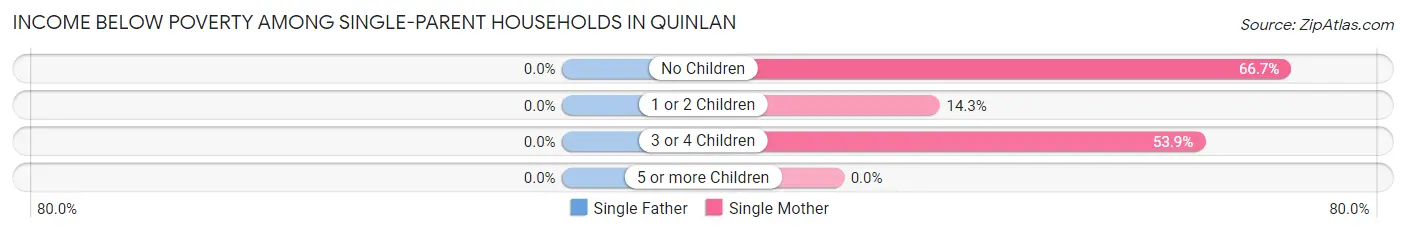
Income Below Poverty Among Single-Parent Households in Quinlan
| Children | Single Father | Single Mother |
| No Children | 0 (0.0%) | 8 (66.7%) |
| 1 or 2 Children | 0 (0.0%) | 3 (14.3%) |
| 3 or 4 Children | 0 (0.0%) | 7 (53.8%) |
| 5 or more Children | 0 (0.0%) | 0 (0.0%) |
| Total | 0 (0.0%) | 18 (39.1%) |
Income Below Poverty Among Married-Couple vs Single-Parent Households in Quinlan
The poverty data for Quinlan shows that 18 of the married-couple family households (6.4%) and 18 of the single-parent households (19.4%) are living below the poverty level. Within the married-couple family households, those with 5 or more children have the highest poverty rate, with 2 households (100.0%) falling below the poverty line. Among the single-parent households, those with 3 or 4 children have the highest poverty rate, with 7 household (43.8%) living below poverty.
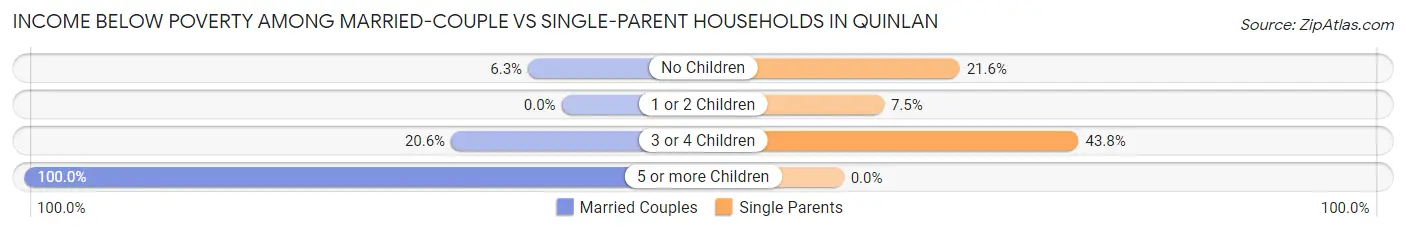
| Children | Married-Couple Families | Single-Parent Households |
| No Children | 9 (6.2%) | 8 (21.6%) |
| 1 or 2 Children | 0 (0.0%) | 3 (7.5%) |
| 3 or 4 Children | 7 (20.6%) | 7 (43.8%) |
| 5 or more Children | 2 (100.0%) | 0 (0.0%) |
| Total | 18 (6.4%) | 18 (19.4%) |
Race in Quinlan
The most populous races in Quinlan are White / Caucasian (1,199 | 81.6%), Two or more Races (179 | 12.2%), and Hispanic or Latino (152 | 10.3%).
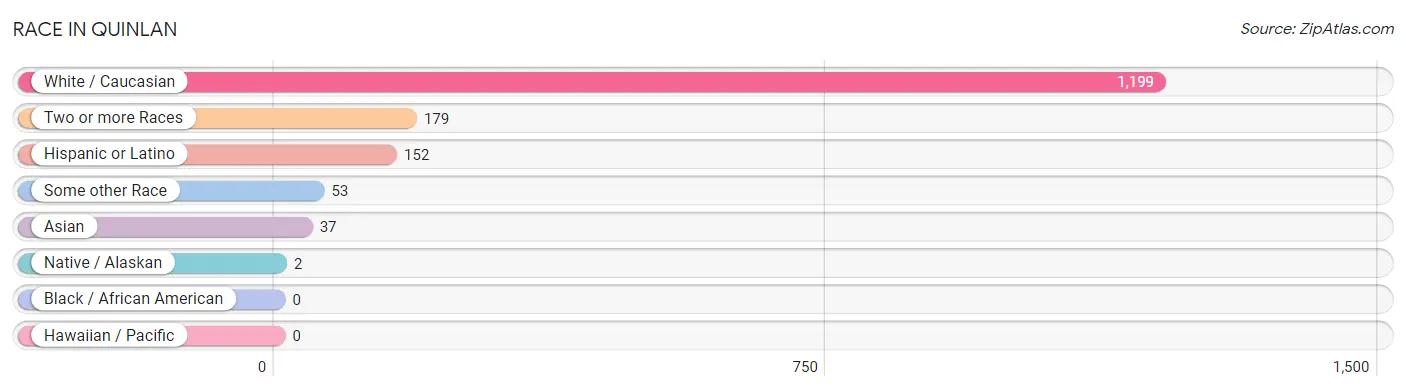
| Race | # Population | % Population |
| Asian | 37 | 2.5% |
| Black / African American | 0 | 0.0% |
| Hawaiian / Pacific | 0 | 0.0% |
| Hispanic or Latino | 152 | 10.3% |
| Native / Alaskan | 2 | 0.1% |
| White / Caucasian | 1,199 | 81.6% |
| Two or more Races | 179 | 12.2% |
| Some other Race | 53 | 3.6% |
| Total | 1,470 | 100.0% |
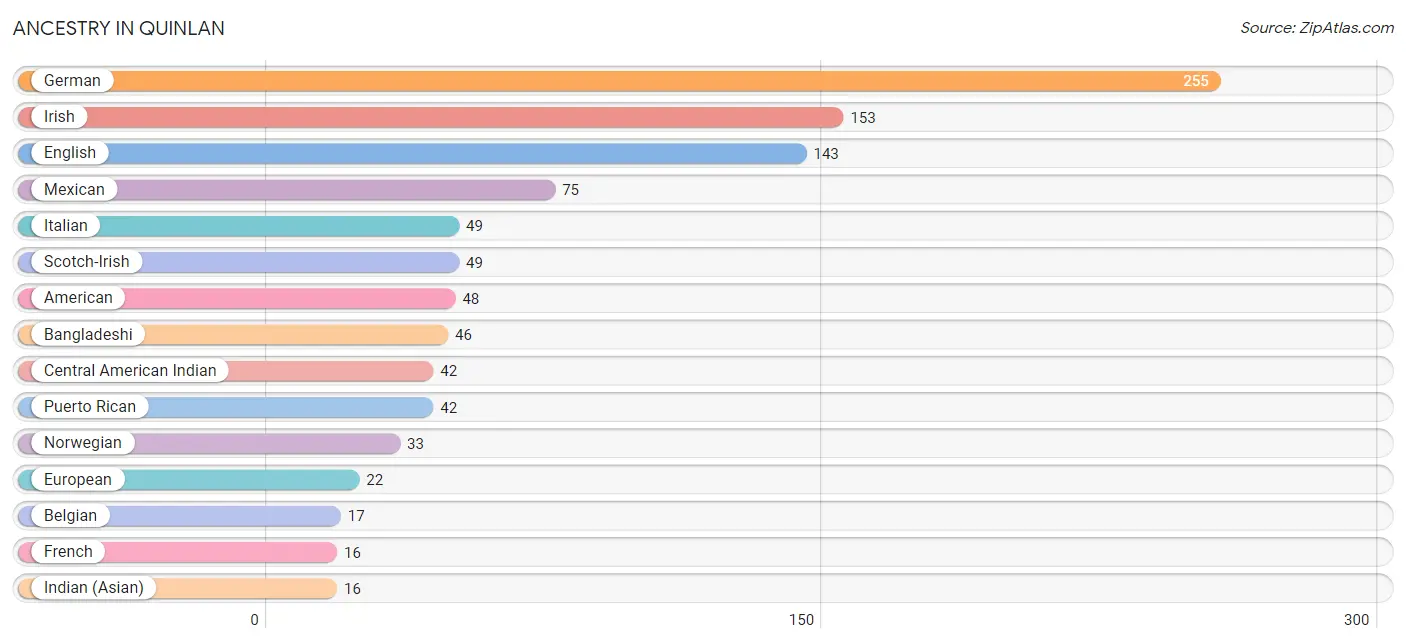
Ancestry in Quinlan
The most populous ancestries reported in Quinlan are German (255 | 17.3%), Irish (153 | 10.4%), English (143 | 9.7%), Mexican (75 | 5.1%), and Italian (49 | 3.3%), together accounting for 45.9% of all Quinlan residents.
| Ancestry | # Population | % Population |
| American | 48 | 3.3% |
| Bangladeshi | 46 | 3.1% |
| Belgian | 17 | 1.2% |
| Blackfeet | 2 | 0.1% |
| Burmese | 8 | 0.5% |
| Central American | 7 | 0.5% |
| Central American Indian | 42 | 2.9% |
| Cherokee | 13 | 0.9% |
| Choctaw | 7 | 0.5% |
| Czechoslovakian | 6 | 0.4% |
| Dutch | 4 | 0.3% |
| English | 143 | 9.7% |
| Estonian | 4 | 0.3% |
| European | 22 | 1.5% |
| French | 16 | 1.1% |
| French Canadian | 11 | 0.7% |
| German | 255 | 17.3% |
| Greek | 12 | 0.8% |
| Indian (Asian) | 16 | 1.1% |
| Irish | 153 | 10.4% |
| Italian | 49 | 3.3% |
| Mexican | 75 | 5.1% |
| Norwegian | 33 | 2.2% |
| Polish | 7 | 0.5% |
| Puerto Rican | 42 | 2.9% |
| Salvadoran | 7 | 0.5% |
| Scandinavian | 7 | 0.5% |
| Scotch-Irish | 49 | 3.3% |
| Scottish | 7 | 0.5% |
| Sri Lankan | 8 | 0.5% |
| Swedish | 6 | 0.4% |
| Swiss | 8 | 0.5% |
| Welsh | 7 | 0.5% | View All 33 Rows |
Immigrants in Quinlan
The most numerous immigrant groups reported in Quinlan came from Asia (22 | 1.5%), Eastern Asia (22 | 1.5%), Central America (15 | 1.0%), Latin America (15 | 1.0%), and Mexico (15 | 1.0%), together accounting for 6.1% of all Quinlan residents.
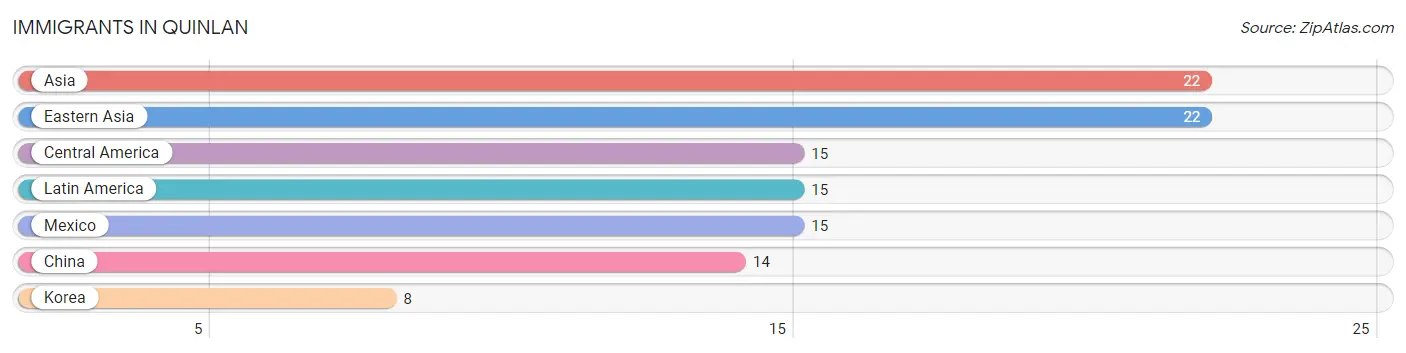
| Immigration Origin | # Population | % Population |
| Asia | 22 | 1.5% |
| Central America | 15 | 1.0% |
| China | 14 | 0.9% |
| Eastern Asia | 22 | 1.5% |
| Korea | 8 | 0.5% |
| Latin America | 15 | 1.0% |
| Mexico | 15 | 1.0% | View All 7 Rows |
Sex and Age in Quinlan
Sex and Age in Quinlan
The most populous age groups in Quinlan are 5 to 9 Years (65 | 10.1%) for men and Under 5 Years (159 | 19.3%) for women.
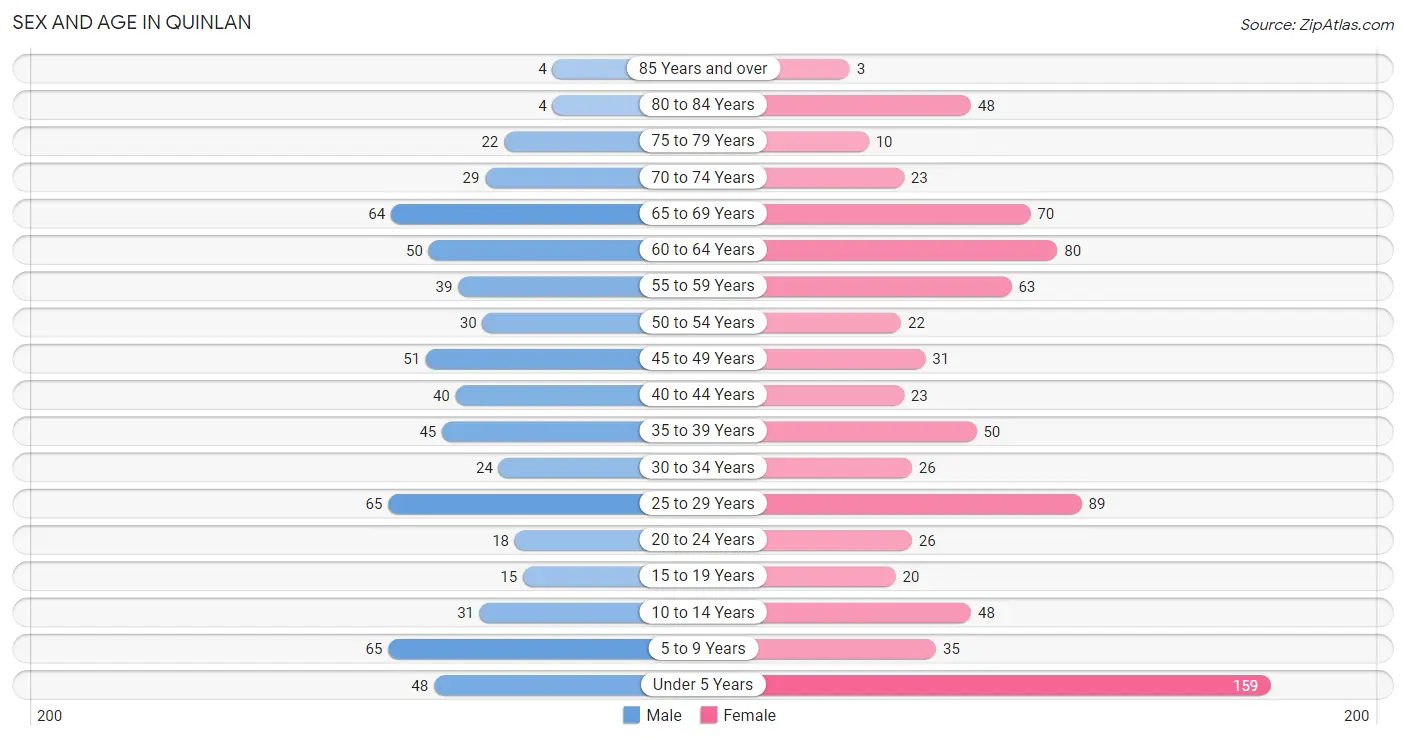
| Age Bracket | Male | Female |
| Under 5 Years | 48 (7.4%) | 159 (19.3%) |
| 5 to 9 Years | 65 (10.1%) | 35 (4.2%) |
| 10 to 14 Years | 31 (4.8%) | 48 (5.8%) |
| 15 to 19 Years | 15 (2.3%) | 20 (2.4%) |
| 20 to 24 Years | 18 (2.8%) | 26 (3.2%) |
| 25 to 29 Years | 65 (10.1%) | 89 (10.8%) |
| 30 to 34 Years | 24 (3.7%) | 26 (3.2%) |
| 35 to 39 Years | 45 (7.0%) | 50 (6.0%) |
| 40 to 44 Years | 40 (6.2%) | 23 (2.8%) |
| 45 to 49 Years | 51 (7.9%) | 31 (3.7%) |
| 50 to 54 Years | 30 (4.7%) | 22 (2.7%) |
| 55 to 59 Years | 39 (6.1%) | 63 (7.6%) |
| 60 to 64 Years | 50 (7.8%) | 80 (9.7%) |
| 65 to 69 Years | 64 (9.9%) | 70 (8.5%) |
| 70 to 74 Years | 29 (4.5%) | 23 (2.8%) |
| 75 to 79 Years | 22 (3.4%) | 10 (1.2%) |
| 80 to 84 Years | 4 (0.6%) | 48 (5.8%) |
| 85 Years and over | 4 (0.6%) | 3 (0.4%) |
| Total | 644 (100.0%) | 826 (100.0%) |
Families and Households in Quinlan
Median Family Size in Quinlan
The median family size in Quinlan is 3.14 persons per family, with single female/mother families (46 | 12.3%) accounting for the largest median family size of 5.2 persons per family. On the other hand, single male/father families (47 | 12.6%) represent the smallest median family size with 2.36 persons per family.
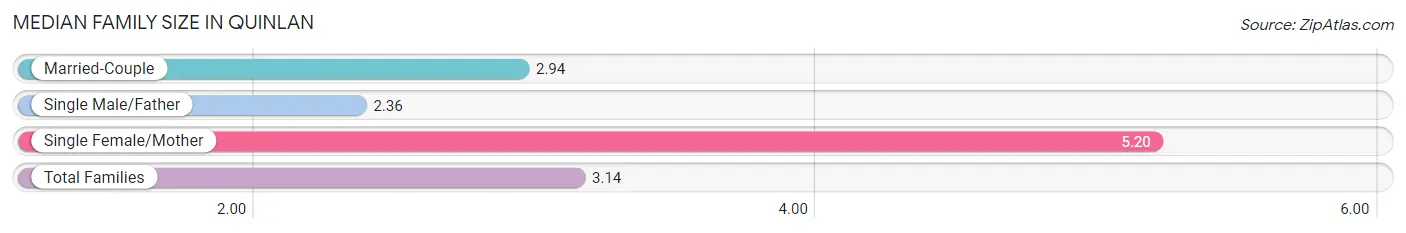
| Family Type | # Families | Family Size |
| Married-Couple | 281 (75.1%) | 2.94 |
| Single Male/Father | 47 (12.6%) | 2.36 |
| Single Female/Mother | 46 (12.3%) | 5.20 |
| Total Families | 374 (100.0%) | 3.14 |
Median Household Size in Quinlan
The median household size in Quinlan is 2.41 persons per household, with single female/mother households (46 | 7.5%) accounting for the largest median household size of 5.2 persons per household. non-family households (237 | 38.8%) represent the smallest median household size with 1.18 persons per household.
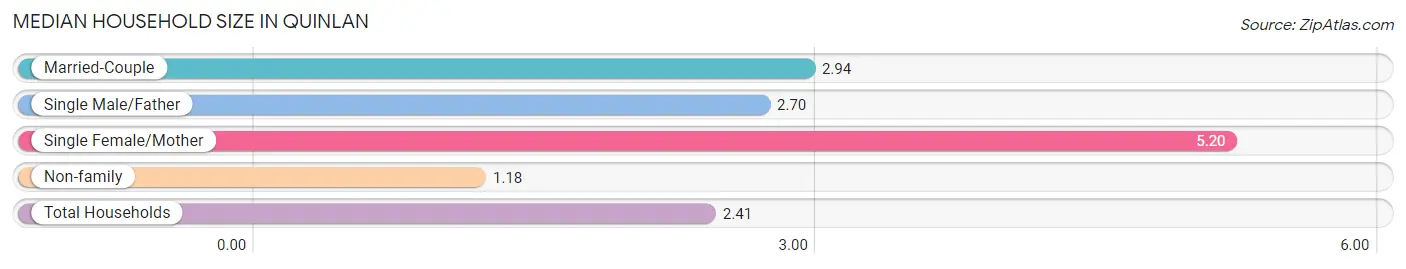
| Household Type | # Households | Household Size |
| Married-Couple | 281 (46.0%) | 2.94 |
| Single Male/Father | 47 (7.7%) | 2.70 |
| Single Female/Mother | 46 (7.5%) | 5.20 |
| Non-family | 237 (38.8%) | 1.18 |
| Total Households | 611 (100.0%) | 2.41 |
Household Size by Marriage Status in Quinlan
Out of a total of 611 households in Quinlan, 374 (61.2%) are family households, while 237 (38.8%) are nonfamily households. The most numerous type of family households are 2-person households, comprising 160, and the most common type of nonfamily households are 1-person households, comprising 193.
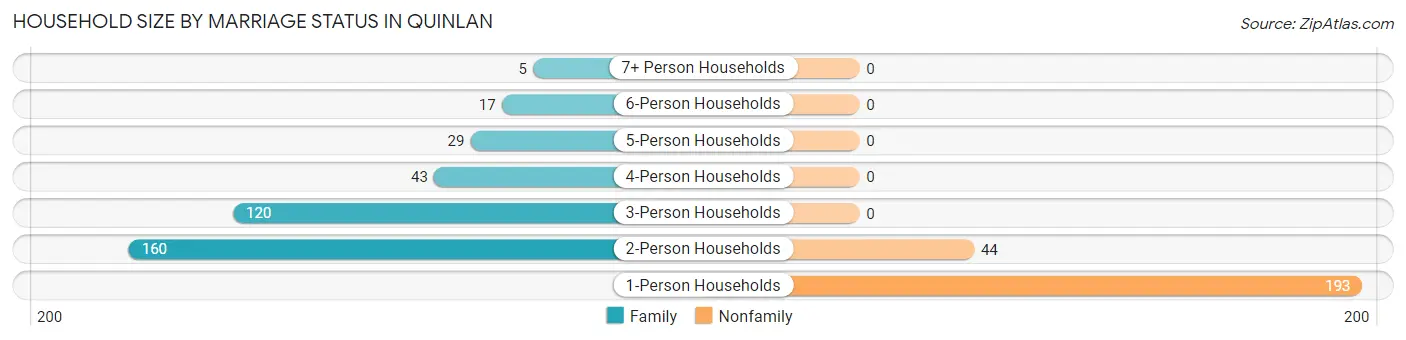
| Household Size | Family Households | Nonfamily Households |
| 1-Person Households | - | 193 (31.6%) |
| 2-Person Households | 160 (26.2%) | 44 (7.2%) |
| 3-Person Households | 120 (19.6%) | 0 (0.0%) |
| 4-Person Households | 43 (7.0%) | 0 (0.0%) |
| 5-Person Households | 29 (4.8%) | 0 (0.0%) |
| 6-Person Households | 17 (2.8%) | 0 (0.0%) |
| 7+ Person Households | 5 (0.8%) | 0 (0.0%) |
| Total | 374 (61.2%) | 237 (38.8%) |
Female Fertility in Quinlan
Fertility by Age in Quinlan
Average fertility rate in Quinlan is 144.0 births per 1,000 women. Women in the age bracket of 35 to 50 years have the highest fertility rate with 265.0 births per 1,000 women. Women in the age bracket of 35 to 50 years acount for 77.5% of all women with births.
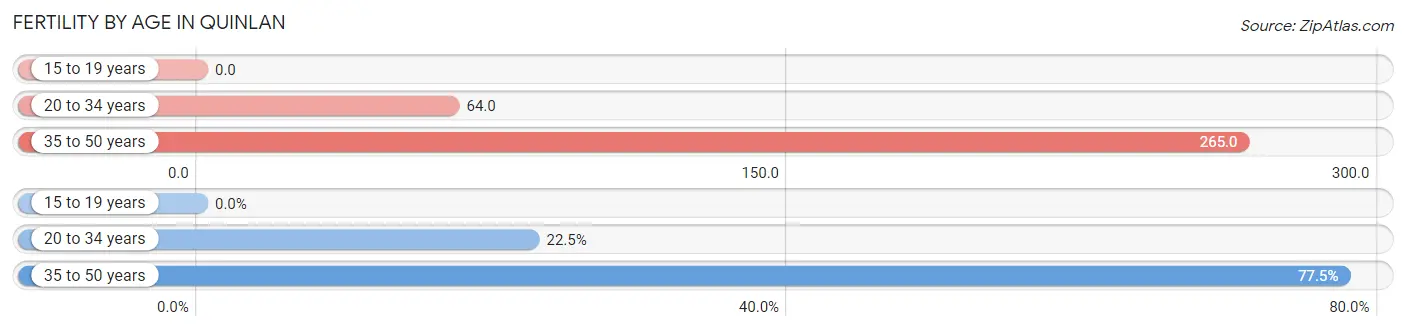
| Age Bracket | Women with Births | Births / 1,000 Women |
| 15 to 19 years | 0 (0.0%) | 0.0 |
| 20 to 34 years | 9 (22.5%) | 64.0 |
| 35 to 50 years | 31 (77.5%) | 265.0 |
| Total | 40 (100.0%) | 144.0 |
Fertility by Age by Marriage Status in Quinlan
92.5% of women with births (40) in Quinlan are married. The highest percentage of unmarried women with births falls into 20 to 34 years age bracket with 33.3% of them unmarried at the time of birth, while the lowest percentage of unmarried women with births belong to 35 to 50 years age bracket with 0.0% of them unmarried.

| Age Bracket | Married | Unmarried |
| 15 to 19 years | 0 (0.0%) | 0 (0.0%) |
| 20 to 34 years | 6 (66.7%) | 3 (33.3%) |
| 35 to 50 years | 31 (100.0%) | 0 (0.0%) |
| Total | 37 (92.5%) | 3 (7.5%) |
Fertility by Education in Quinlan
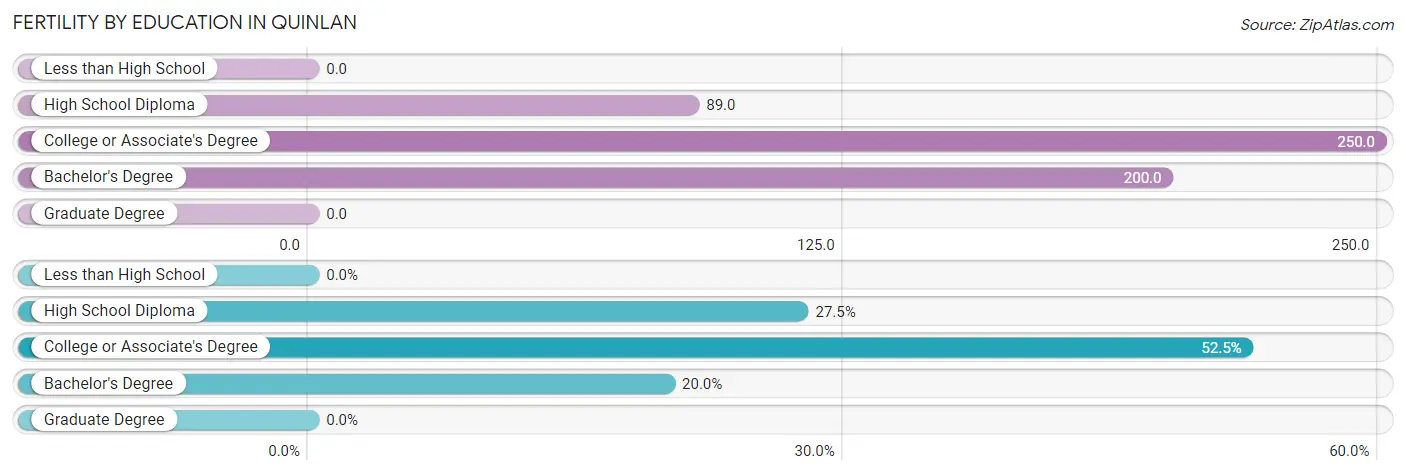
| Educational Attainment | Women with Births | Births / 1,000 Women |
| Less than High School | 0 (0.0%) | 0.0 |
| High School Diploma | 11 (27.5%) | 89.0 |
| College or Associate's Degree | 21 (52.5%) | 250.0 |
| Bachelor's Degree | 8 (20.0%) | 200.0 |
| Graduate Degree | 0 (0.0%) | 0.0 |
| Total | 40 (100.0%) | 144.0 |
Fertility by Education by Marriage Status in Quinlan
7.5% of women with births in Quinlan are unmarried. Women with the educational attainment of college or associate's degree are most likely to be married with 100.0% of them married at childbirth, while women with the educational attainment of high school diploma are least likely to be married with 27.3% of them unmarried at childbirth.
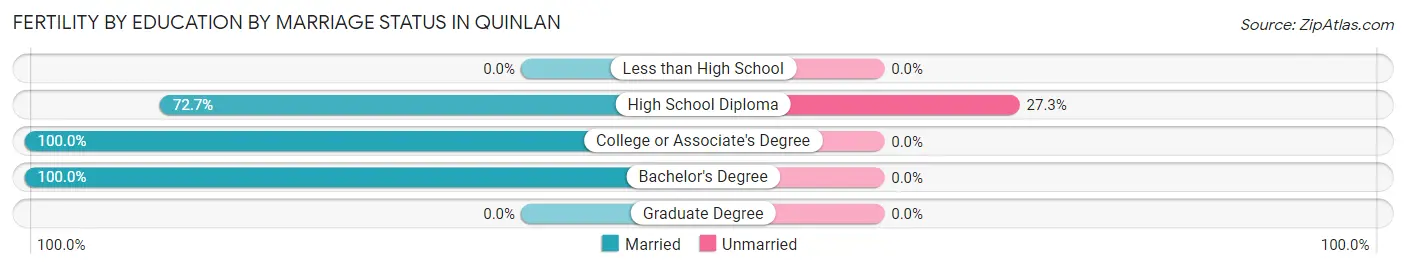
| Educational Attainment | Married | Unmarried |
| Less than High School | 0 (0.0%) | 0 (0.0%) |
| High School Diploma | 8 (72.7%) | 3 (27.3%) |
| College or Associate's Degree | 21 (100.0%) | 0 (0.0%) |
| Bachelor's Degree | 8 (100.0%) | 0 (0.0%) |
| Graduate Degree | 0 (0.0%) | 0 (0.0%) |
| Total | 37 (92.5%) | 3 (7.5%) |
Employment Characteristics in Quinlan
Employment by Class of Employer in Quinlan
Among the 532 employed individuals in Quinlan, private company employees (375 | 70.5%), local government employees (56 | 10.5%), and self-employed (not incorporated) (46 | 8.6%) make up the most common classes of employment.
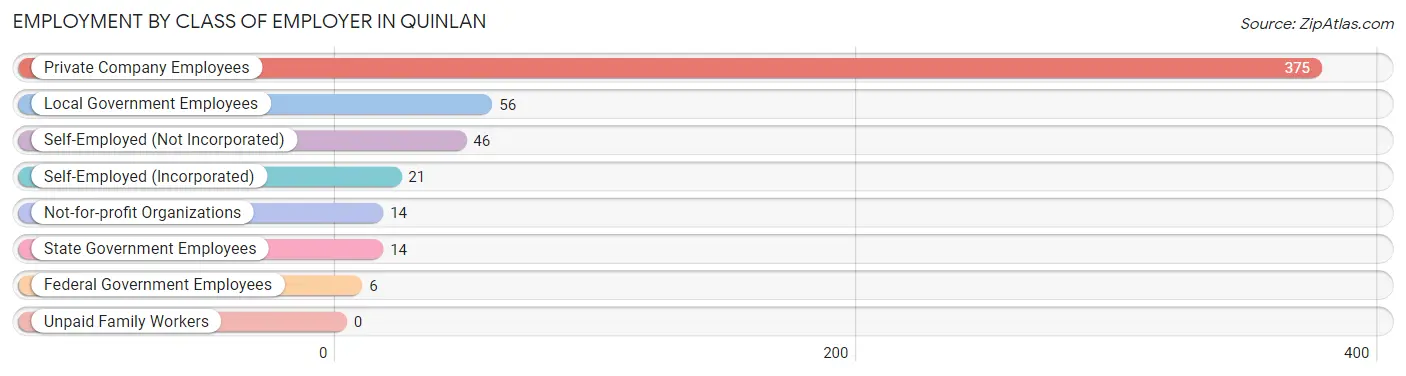
| Employer Class | # Employees | % Employees |
| Private Company Employees | 375 | 70.5% |
| Self-Employed (Incorporated) | 21 | 4.0% |
| Self-Employed (Not Incorporated) | 46 | 8.6% |
| Not-for-profit Organizations | 14 | 2.6% |
| Local Government Employees | 56 | 10.5% |
| State Government Employees | 14 | 2.6% |
| Federal Government Employees | 6 | 1.1% |
| Unpaid Family Workers | 0 | 0.0% |
| Total | 532 | 100.0% |
Employment Status by Age in Quinlan
According to the labor force statistics for Quinlan, out of the total population over 16 years of age (1,084), 56.7% or 615 individuals are in the labor force, with 5.2% or 32 of them unemployed. The age group with the highest labor force participation rate is 30 to 34 years, with 94.0% or 47 individuals in the labor force. Within the labor force, the 16 to 19 years age range has the highest percentage of unemployed individuals, with 20.0% or 3 of them being unemployed.
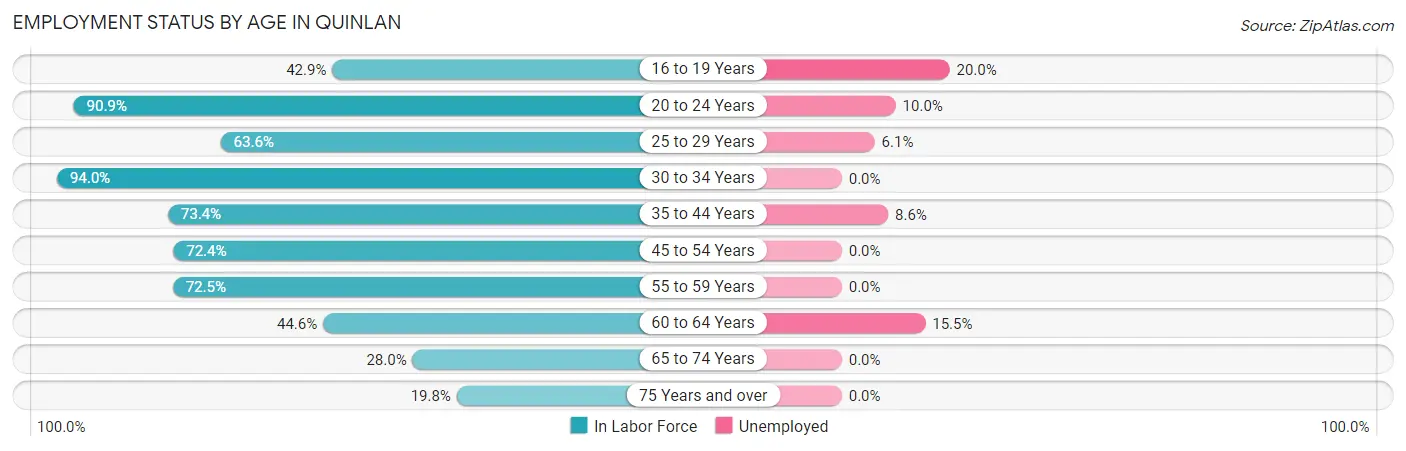
| Age Bracket | In Labor Force | Unemployed |
| 16 to 19 Years | 15 (42.9%) | 3 (20.0%) |
| 20 to 24 Years | 40 (90.9%) | 4 (10.0%) |
| 25 to 29 Years | 98 (63.6%) | 6 (6.1%) |
| 30 to 34 Years | 47 (94.0%) | 0 (0.0%) |
| 35 to 44 Years | 116 (73.4%) | 10 (8.6%) |
| 45 to 54 Years | 97 (72.4%) | 0 (0.0%) |
| 55 to 59 Years | 74 (72.5%) | 0 (0.0%) |
| 60 to 64 Years | 58 (44.6%) | 9 (15.5%) |
| 65 to 74 Years | 52 (28.0%) | 0 (0.0%) |
| 75 Years and over | 18 (19.8%) | 0 (0.0%) |
| Total | 615 (56.7%) | 32 (5.2%) |
Employment Status by Educational Attainment in Quinlan
According to labor force statistics for Quinlan, 67.3% of individuals (490) out of the total population between 25 and 64 years of age (728) are in the labor force, with 5.1% or 25 of them being unemployed. The group with the highest labor force participation rate are those with the educational attainment of bachelor's degree or higher, with 88.3% or 106 individuals in the labor force. Within the labor force, individuals with bachelor's degree or higher education have the highest percentage of unemployment, with 8.5% or 9 of them being unemployed.
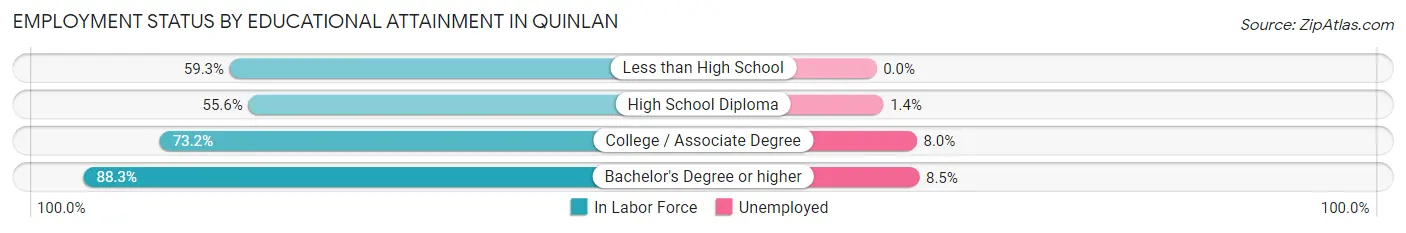
| Educational Attainment | In Labor Force | Unemployed |
| Less than High School | 64 (59.3%) | 0 (0.0%) |
| High School Diploma | 145 (55.6%) | 4 (1.4%) |
| College / Associate Degree | 175 (73.2%) | 19 (8.0%) |
| Bachelor's Degree or higher | 106 (88.3%) | 10 (8.5%) |
| Total | 490 (67.3%) | 37 (5.1%) |
Employment Occupations by Sex in Quinlan
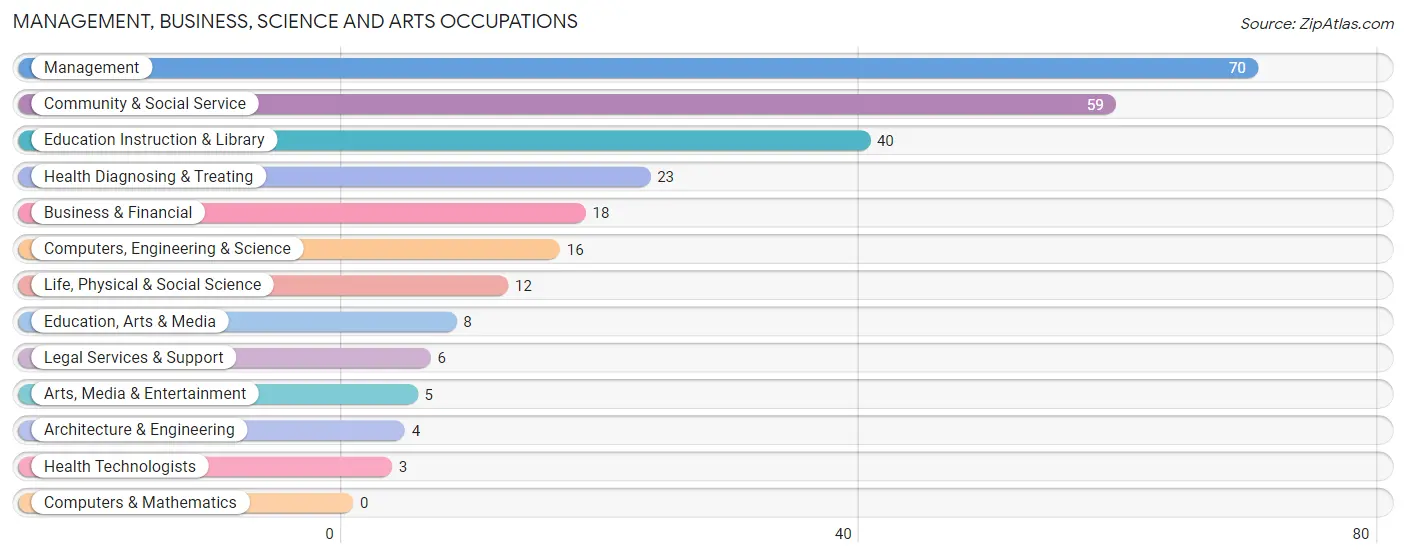
Management, Business, Science and Arts Occupations
The most common Management, Business, Science and Arts occupations in Quinlan are Management (70 | 12.0%), Community & Social Service (59 | 10.1%), Education Instruction & Library (40 | 6.9%), Health Diagnosing & Treating (23 | 4.0%), and Business & Financial (18 | 3.1%).
Management, Business, Science and Arts Occupations by Sex
Within the Management, Business, Science and Arts occupations in Quinlan, the most male-oriented occupations are Computers, Engineering & Science (100.0%), Architecture & Engineering (100.0%), and Life, Physical & Social Science (100.0%), while the most female-oriented occupations are Education, Arts & Media (100.0%), Legal Services & Support (100.0%), and Arts, Media & Entertainment (100.0%).
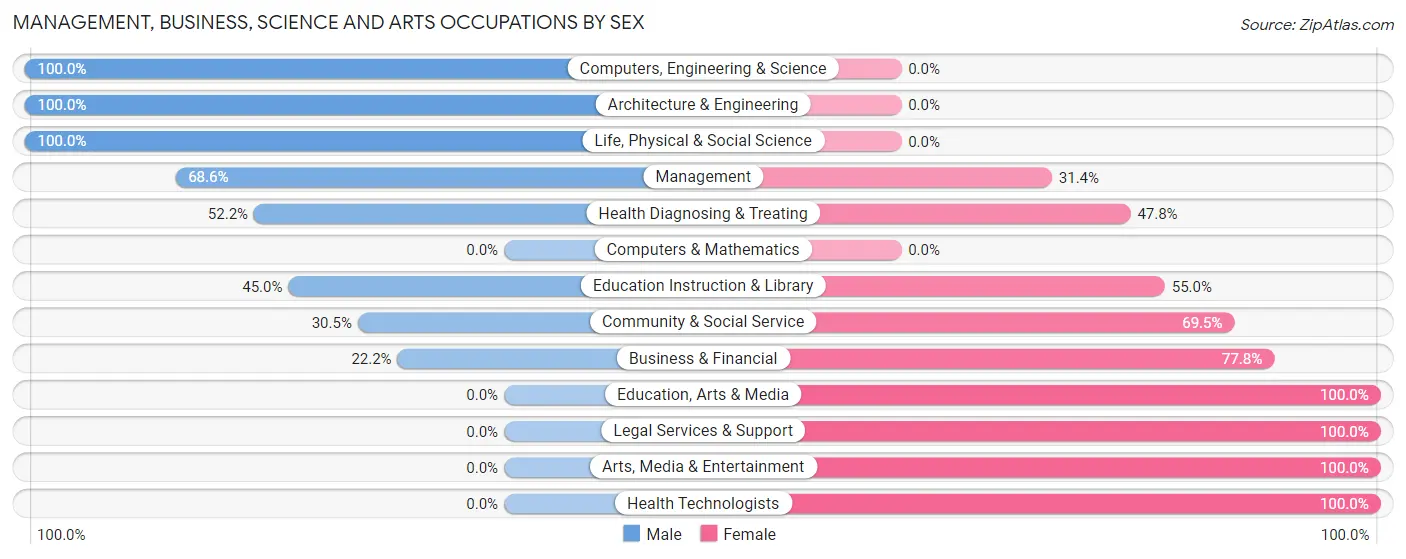
| Occupation | Male | Female |
| Management | 48 (68.6%) | 22 (31.4%) |
| Business & Financial | 4 (22.2%) | 14 (77.8%) |
| Computers, Engineering & Science | 16 (100.0%) | 0 (0.0%) |
| Computers & Mathematics | 0 (0.0%) | 0 (0.0%) |
| Architecture & Engineering | 4 (100.0%) | 0 (0.0%) |
| Life, Physical & Social Science | 12 (100.0%) | 0 (0.0%) |
| Community & Social Service | 18 (30.5%) | 41 (69.5%) |
| Education, Arts & Media | 0 (0.0%) | 8 (100.0%) |
| Legal Services & Support | 0 (0.0%) | 6 (100.0%) |
| Education Instruction & Library | 18 (45.0%) | 22 (55.0%) |
| Arts, Media & Entertainment | 0 (0.0%) | 5 (100.0%) |
| Health Diagnosing & Treating | 12 (52.2%) | 11 (47.8%) |
| Health Technologists | 0 (0.0%) | 3 (100.0%) |
| Total (Category) | 98 (52.7%) | 88 (47.3%) |
| Total (Overall) | 342 (58.7%) | 241 (41.3%) |
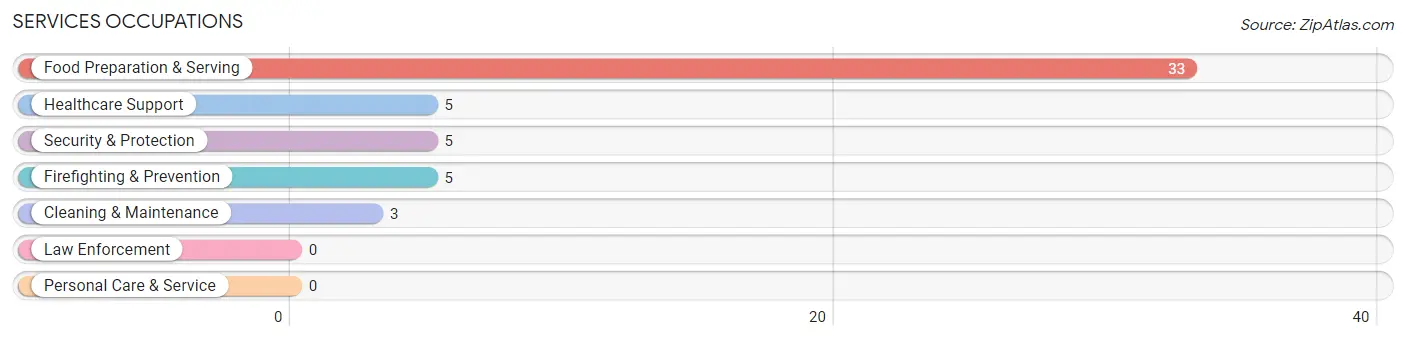
Services Occupations
The most common Services occupations in Quinlan are Food Preparation & Serving (33 | 5.7%), Healthcare Support (5 | 0.9%), Security & Protection (5 | 0.9%), Firefighting & Prevention (5 | 0.9%), and Cleaning & Maintenance (3 | 0.5%).
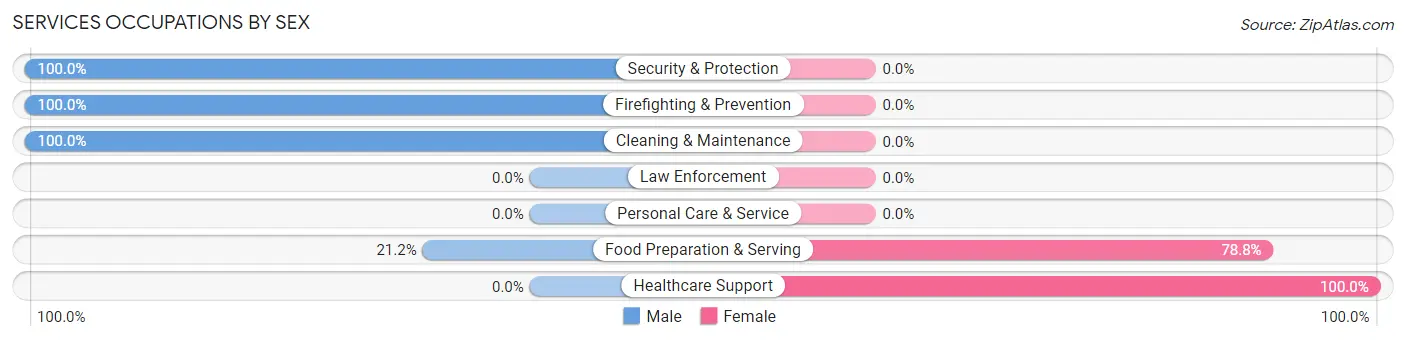
Services Occupations by Sex
Within the Services occupations in Quinlan, the most male-oriented occupations are Security & Protection (100.0%), Firefighting & Prevention (100.0%), and Cleaning & Maintenance (100.0%), while the most female-oriented occupations are Healthcare Support (100.0%), and Food Preparation & Serving (78.8%).
| Occupation | Male | Female |
| Healthcare Support | 0 (0.0%) | 5 (100.0%) |
| Security & Protection | 5 (100.0%) | 0 (0.0%) |
| Firefighting & Prevention | 5 (100.0%) | 0 (0.0%) |
| Law Enforcement | 0 (0.0%) | 0 (0.0%) |
| Food Preparation & Serving | 7 (21.2%) | 26 (78.8%) |
| Cleaning & Maintenance | 3 (100.0%) | 0 (0.0%) |
| Personal Care & Service | 0 (0.0%) | 0 (0.0%) |
| Total (Category) | 15 (32.6%) | 31 (67.4%) |
| Total (Overall) | 342 (58.7%) | 241 (41.3%) |
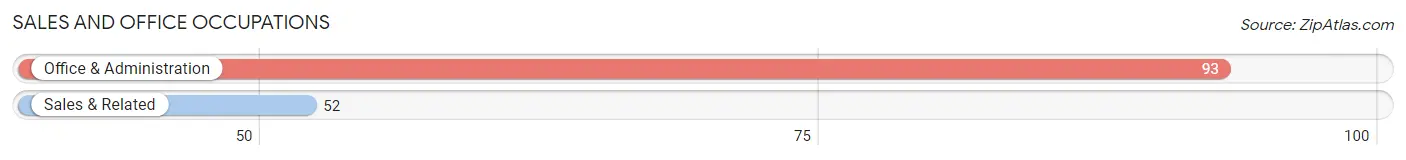
Sales and Office Occupations
The most common Sales and Office occupations in Quinlan are Office & Administration (93 | 16.0%), and Sales & Related (52 | 8.9%).
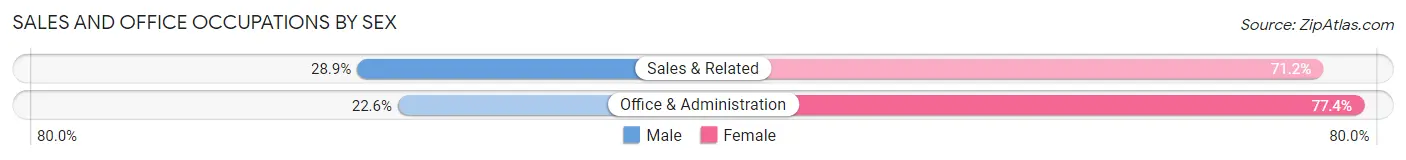
Sales and Office Occupations by Sex
| Occupation | Male | Female |
| Sales & Related | 15 (28.8%) | 37 (71.2%) |
| Office & Administration | 21 (22.6%) | 72 (77.4%) |
| Total (Category) | 36 (24.8%) | 109 (75.2%) |
| Total (Overall) | 342 (58.7%) | 241 (41.3%) |
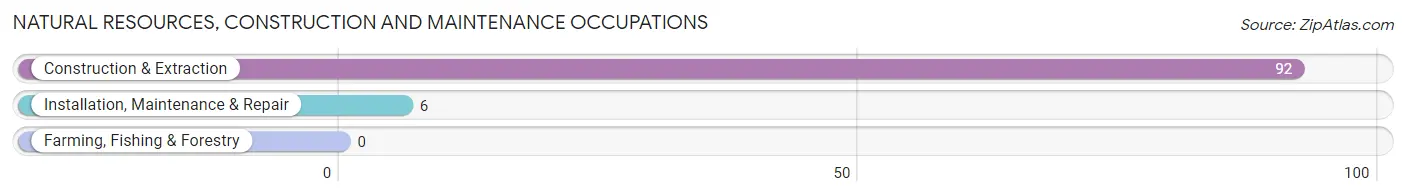
Natural Resources, Construction and Maintenance Occupations
The most common Natural Resources, Construction and Maintenance occupations in Quinlan are Construction & Extraction (92 | 15.8%), and Installation, Maintenance & Repair (6 | 1.0%).
Natural Resources, Construction and Maintenance Occupations by Sex
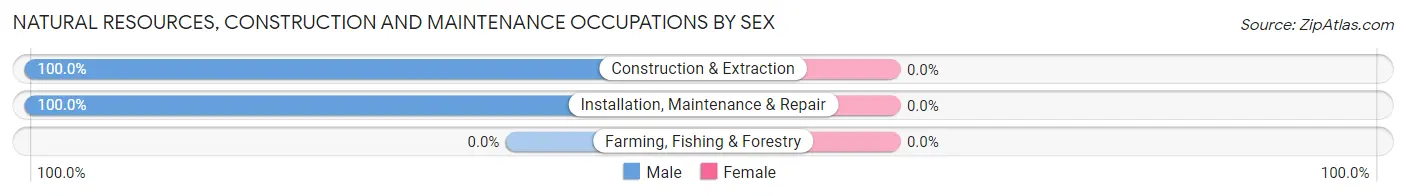
| Occupation | Male | Female |
| Farming, Fishing & Forestry | 0 (0.0%) | 0 (0.0%) |
| Construction & Extraction | 92 (100.0%) | 0 (0.0%) |
| Installation, Maintenance & Repair | 6 (100.0%) | 0 (0.0%) |
| Total (Category) | 98 (100.0%) | 0 (0.0%) |
| Total (Overall) | 342 (58.7%) | 241 (41.3%) |
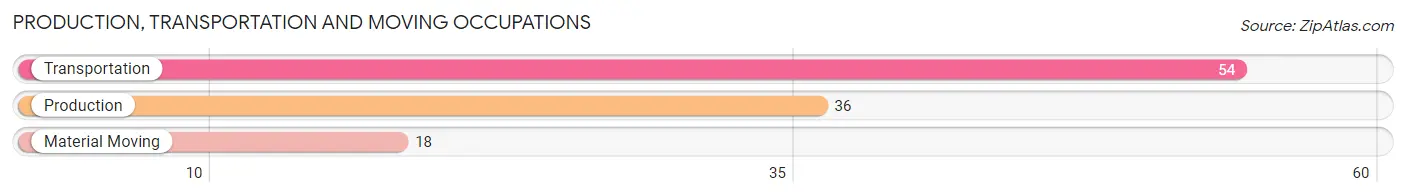
Production, Transportation and Moving Occupations
The most common Production, Transportation and Moving occupations in Quinlan are Transportation (54 | 9.3%), Production (36 | 6.2%), and Material Moving (18 | 3.1%).
Production, Transportation and Moving Occupations by Sex
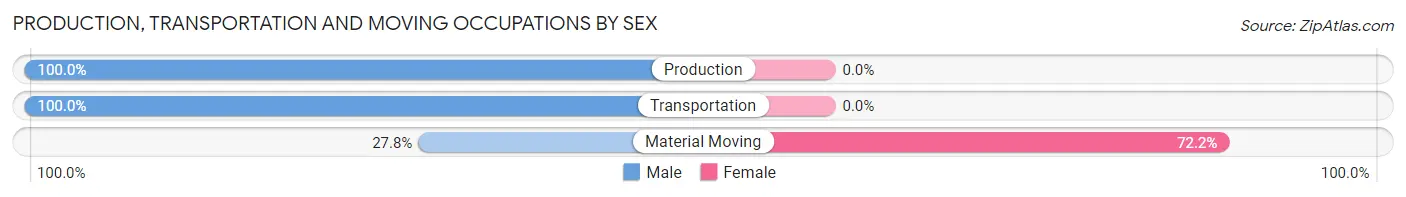
| Occupation | Male | Female |
| Production | 36 (100.0%) | 0 (0.0%) |
| Transportation | 54 (100.0%) | 0 (0.0%) |
| Material Moving | 5 (27.8%) | 13 (72.2%) |
| Total (Category) | 95 (88.0%) | 13 (12.0%) |
| Total (Overall) | 342 (58.7%) | 241 (41.3%) |
Employment Industries by Sex in Quinlan
Employment Industries in Quinlan
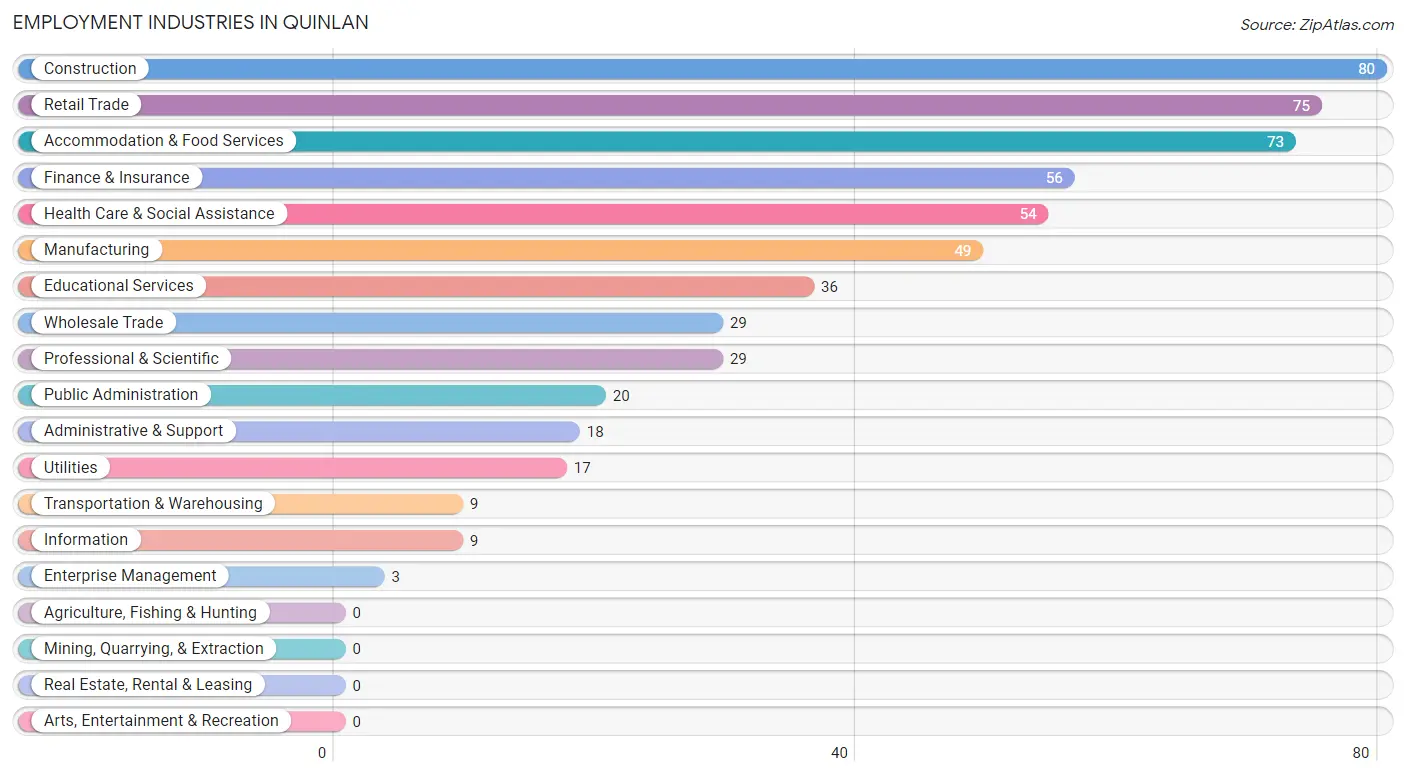
The major employment industries in Quinlan include Construction (80 | 13.7%), Retail Trade (75 | 12.9%), Accommodation & Food Services (73 | 12.5%), Finance & Insurance (56 | 9.6%), and Health Care & Social Assistance (54 | 9.3%).
Employment Industries by Sex in Quinlan
The Quinlan industries that see more men than women are Manufacturing (100.0%), Utilities (100.0%), and Enterprise Management (100.0%), whereas the industries that tend to have a higher number of women are Information (100.0%), Professional & Scientific (100.0%), and Educational Services (75.0%).
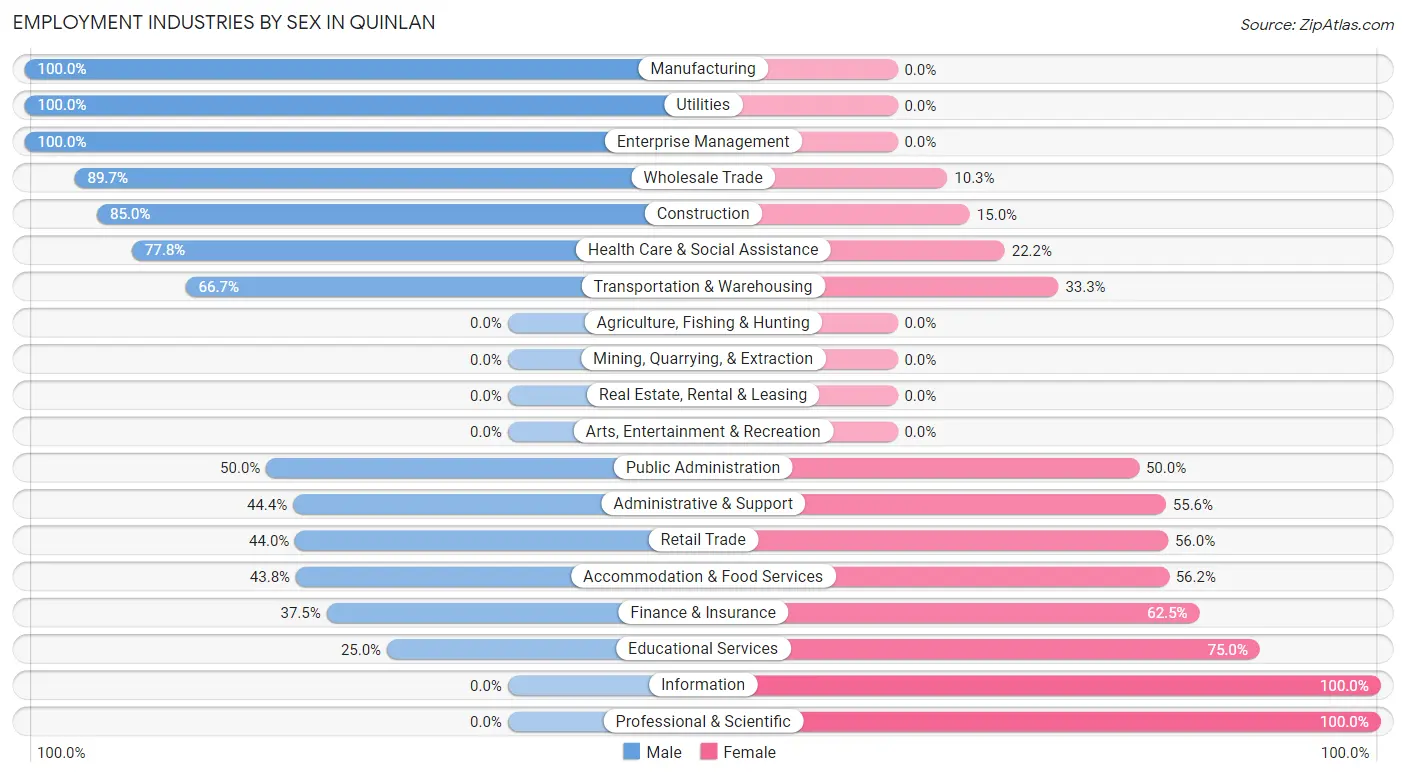
| Industry | Male | Female |
| Agriculture, Fishing & Hunting | 0 (0.0%) | 0 (0.0%) |
| Mining, Quarrying, & Extraction | 0 (0.0%) | 0 (0.0%) |
| Construction | 68 (85.0%) | 12 (15.0%) |
| Manufacturing | 49 (100.0%) | 0 (0.0%) |
| Wholesale Trade | 26 (89.7%) | 3 (10.3%) |
| Retail Trade | 33 (44.0%) | 42 (56.0%) |
| Transportation & Warehousing | 6 (66.7%) | 3 (33.3%) |
| Utilities | 17 (100.0%) | 0 (0.0%) |
| Information | 0 (0.0%) | 9 (100.0%) |
| Finance & Insurance | 21 (37.5%) | 35 (62.5%) |
| Real Estate, Rental & Leasing | 0 (0.0%) | 0 (0.0%) |
| Professional & Scientific | 0 (0.0%) | 29 (100.0%) |
| Enterprise Management | 3 (100.0%) | 0 (0.0%) |
| Administrative & Support | 8 (44.4%) | 10 (55.6%) |
| Educational Services | 9 (25.0%) | 27 (75.0%) |
| Health Care & Social Assistance | 42 (77.8%) | 12 (22.2%) |
| Arts, Entertainment & Recreation | 0 (0.0%) | 0 (0.0%) |
| Accommodation & Food Services | 32 (43.8%) | 41 (56.2%) |
| Public Administration | 10 (50.0%) | 10 (50.0%) |
| Total | 342 (58.7%) | 241 (41.3%) |
Education in Quinlan
School Enrollment in Quinlan
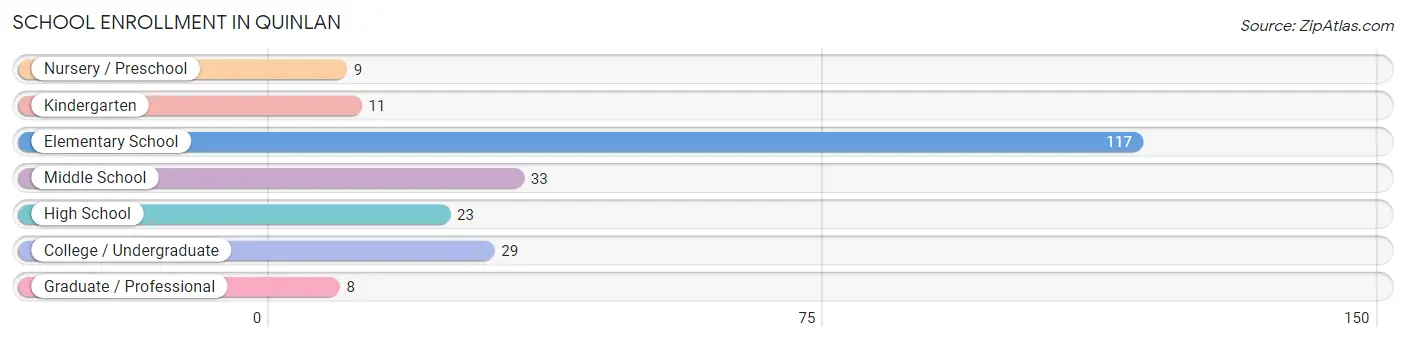
The most common levels of schooling among the 230 students in Quinlan are elementary school (117 | 50.9%), middle school (33 | 14.3%), and college / undergraduate (29 | 12.6%).
| School Level | # Students | % Students |
| Nursery / Preschool | 9 | 3.9% |
| Kindergarten | 11 | 4.8% |
| Elementary School | 117 | 50.9% |
| Middle School | 33 | 14.3% |
| High School | 23 | 10.0% |
| College / Undergraduate | 29 | 12.6% |
| Graduate / Professional | 8 | 3.5% |
| Total | 230 | 100.0% |
School Enrollment by Age by Funding Source in Quinlan
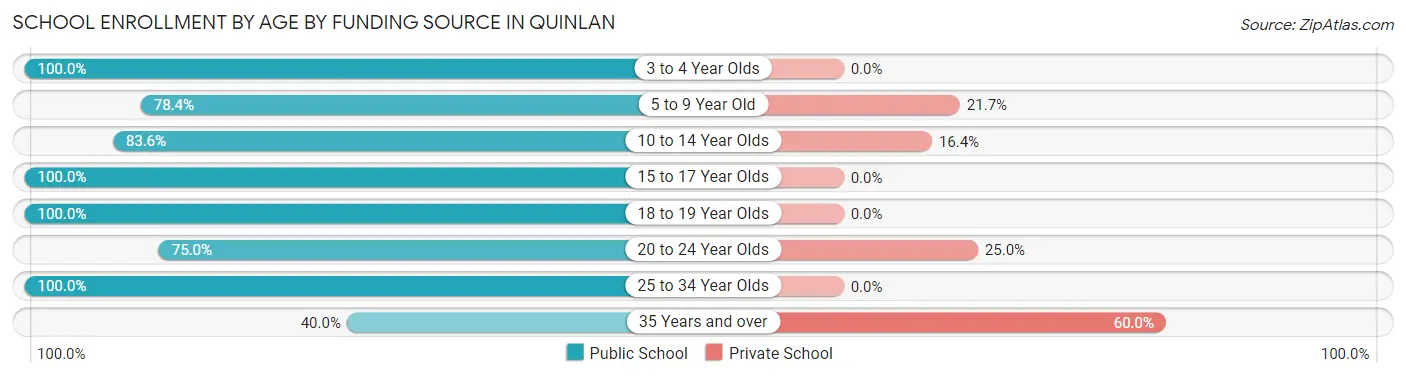
Out of a total of 230 students who are enrolled in schools in Quinlan, 42 (18.3%) attend a private institution, while the remaining 188 (81.7%) are enrolled in public schools. The age group of 35 years and over has the highest likelihood of being enrolled in private schools, with 6 (60.0% in the age bracket) enrolled. Conversely, the age group of 3 to 4 year olds has the lowest likelihood of being enrolled in a private school, with 9 (100.0% in the age bracket) attending a public institution.
| Age Bracket | Public School | Private School |
| 3 to 4 Year Olds | 9 (100.0%) | 0 (0.0%) |
| 5 to 9 Year Old | 76 (78.3%) | 21 (21.6%) |
| 10 to 14 Year Olds | 61 (83.6%) | 12 (16.4%) |
| 15 to 17 Year Olds | 10 (100.0%) | 0 (0.0%) |
| 18 to 19 Year Olds | 15 (100.0%) | 0 (0.0%) |
| 20 to 24 Year Olds | 9 (75.0%) | 3 (25.0%) |
| 25 to 34 Year Olds | 4 (100.0%) | 0 (0.0%) |
| 35 Years and over | 4 (40.0%) | 6 (60.0%) |
| Total | 188 (81.7%) | 42 (18.3%) |
Educational Attainment by Field of Study in Quinlan
Business (55 | 30.9%), education (32 | 18.0%), literature & languages (20 | 11.2%), social sciences (15 | 8.4%), and liberal arts & history (15 | 8.4%) are the most common fields of study among 178 individuals in Quinlan who have obtained a bachelor's degree or higher.
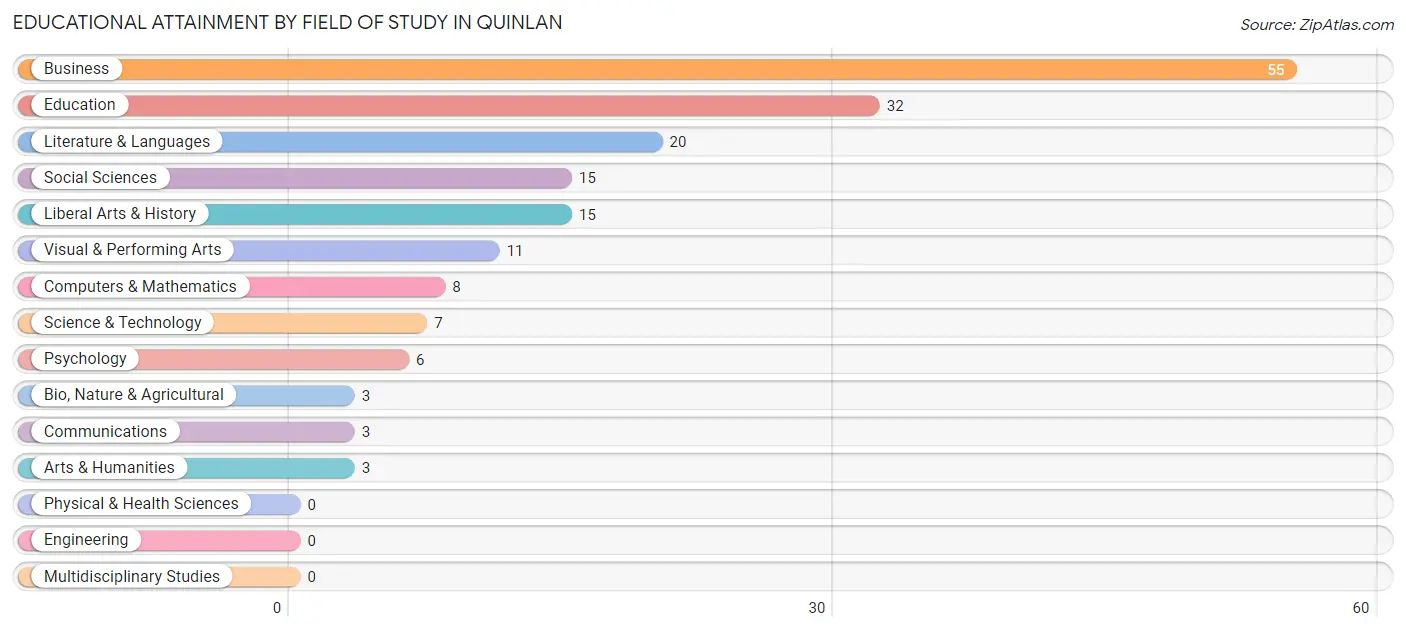
| Field of Study | # Graduates | % Graduates |
| Computers & Mathematics | 8 | 4.5% |
| Bio, Nature & Agricultural | 3 | 1.7% |
| Physical & Health Sciences | 0 | 0.0% |
| Psychology | 6 | 3.4% |
| Social Sciences | 15 | 8.4% |
| Engineering | 0 | 0.0% |
| Multidisciplinary Studies | 0 | 0.0% |
| Science & Technology | 7 | 3.9% |
| Business | 55 | 30.9% |
| Education | 32 | 18.0% |
| Literature & Languages | 20 | 11.2% |
| Liberal Arts & History | 15 | 8.4% |
| Visual & Performing Arts | 11 | 6.2% |
| Communications | 3 | 1.7% |
| Arts & Humanities | 3 | 1.7% |
| Total | 178 | 100.0% |
Transportation & Commute in Quinlan
Vehicle Availability by Sex in Quinlan
The most prevalent vehicle ownership categories in Quinlan are males with 2 vehicles (174, accounting for 59.8%) and females with 2 vehicles (123, making up 72.2%).
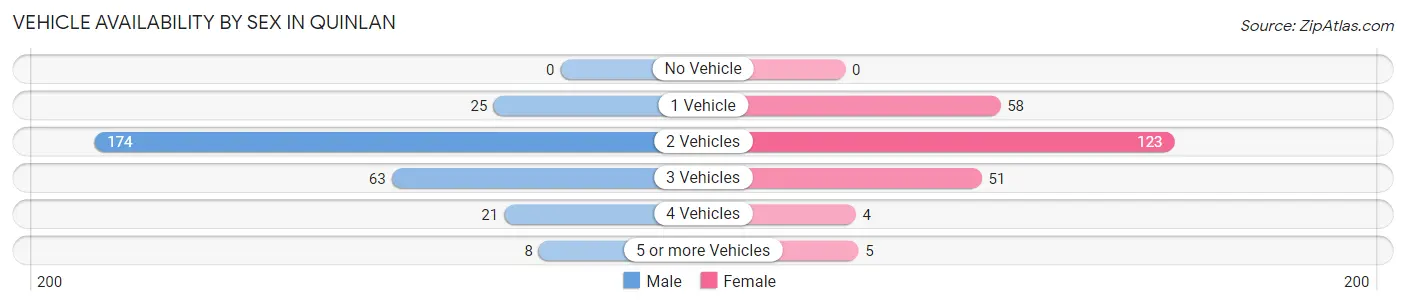
| Vehicles Available | Male | Female |
| No Vehicle | 0 (0.0%) | 0 (0.0%) |
| 1 Vehicle | 25 (8.6%) | 58 (24.1%) |
| 2 Vehicles | 174 (59.8%) | 123 (51.0%) |
| 3 Vehicles | 63 (21.6%) | 51 (21.2%) |
| 4 Vehicles | 21 (7.2%) | 4 (1.7%) |
| 5 or more Vehicles | 8 (2.8%) | 5 (2.1%) |
| Total | 291 (100.0%) | 241 (100.0%) |
Commute Time in Quinlan
The most frequently occuring commute durations in Quinlan are 5 to 9 minutes (114 commuters, 24.1%), 45 to 59 minutes (83 commuters, 17.5%), and 30 to 34 minutes (76 commuters, 16.1%).
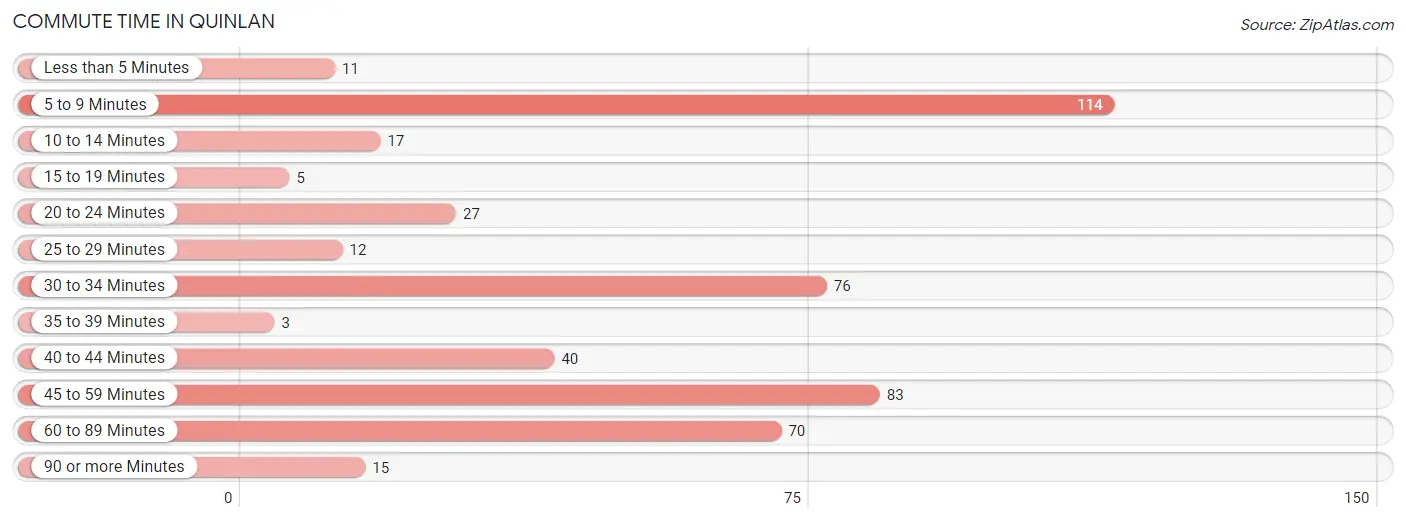
| Commute Time | # Commuters | % Commuters |
| Less than 5 Minutes | 11 | 2.3% |
| 5 to 9 Minutes | 114 | 24.1% |
| 10 to 14 Minutes | 17 | 3.6% |
| 15 to 19 Minutes | 5 | 1.1% |
| 20 to 24 Minutes | 27 | 5.7% |
| 25 to 29 Minutes | 12 | 2.5% |
| 30 to 34 Minutes | 76 | 16.1% |
| 35 to 39 Minutes | 3 | 0.6% |
| 40 to 44 Minutes | 40 | 8.5% |
| 45 to 59 Minutes | 83 | 17.5% |
| 60 to 89 Minutes | 70 | 14.8% |
| 90 or more Minutes | 15 | 3.2% |
Commute Time by Sex in Quinlan
The most common commute times in Quinlan are 60 to 89 minutes (63 commuters, 23.1%) for males and 5 to 9 minutes (65 commuters, 32.5%) for females.
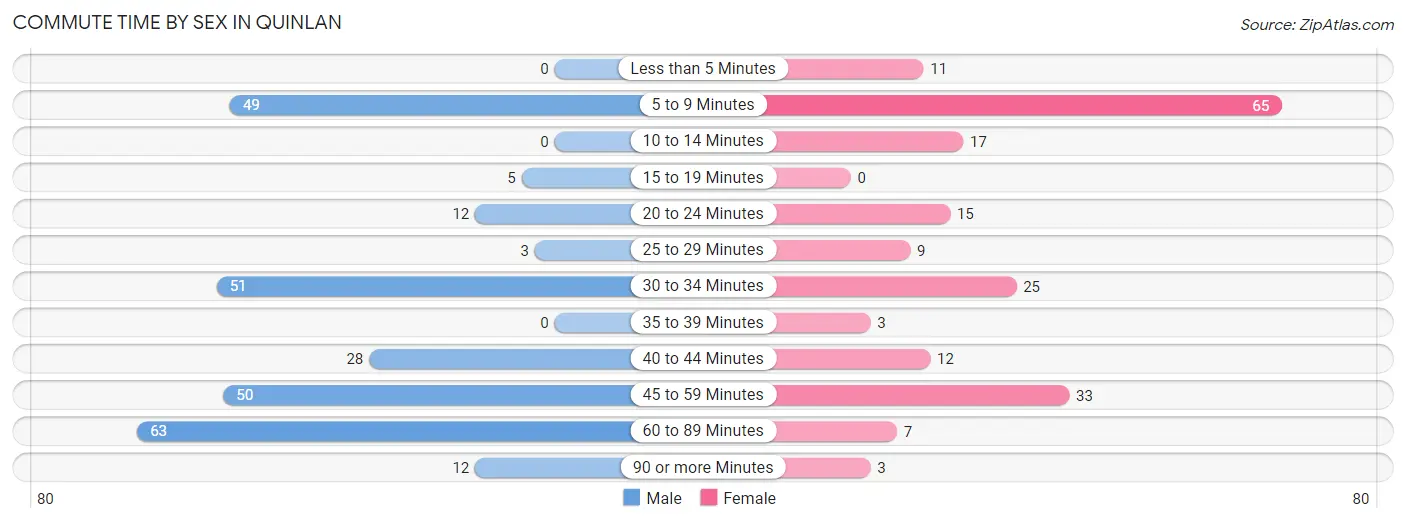
| Commute Time | Male | Female |
| Less than 5 Minutes | 0 (0.0%) | 11 (5.5%) |
| 5 to 9 Minutes | 49 (17.9%) | 65 (32.5%) |
| 10 to 14 Minutes | 0 (0.0%) | 17 (8.5%) |
| 15 to 19 Minutes | 5 (1.8%) | 0 (0.0%) |
| 20 to 24 Minutes | 12 (4.4%) | 15 (7.5%) |
| 25 to 29 Minutes | 3 (1.1%) | 9 (4.5%) |
| 30 to 34 Minutes | 51 (18.7%) | 25 (12.5%) |
| 35 to 39 Minutes | 0 (0.0%) | 3 (1.5%) |
| 40 to 44 Minutes | 28 (10.3%) | 12 (6.0%) |
| 45 to 59 Minutes | 50 (18.3%) | 33 (16.5%) |
| 60 to 89 Minutes | 63 (23.1%) | 7 (3.5%) |
| 90 or more Minutes | 12 (4.4%) | 3 (1.5%) |
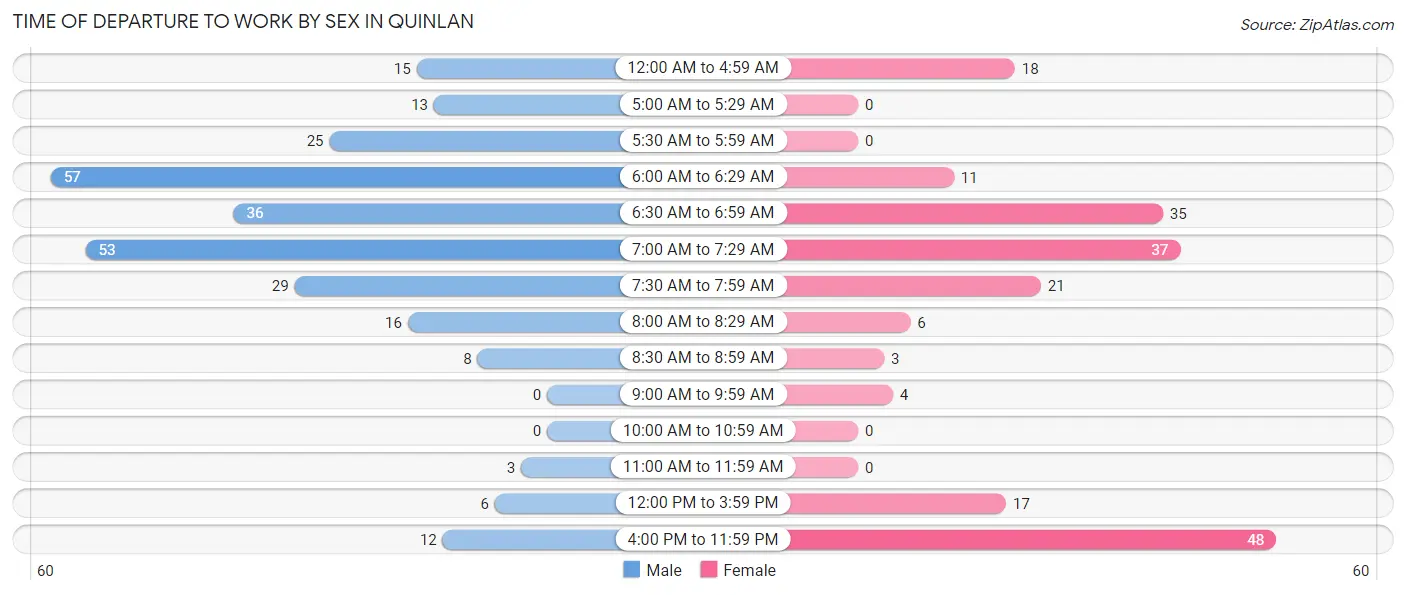
Time of Departure to Work by Sex in Quinlan
The most frequent times of departure to work in Quinlan are 6:00 AM to 6:29 AM (57, 20.9%) for males and 4:00 PM to 11:59 PM (48, 24.0%) for females.
| Time of Departure | Male | Female |
| 12:00 AM to 4:59 AM | 15 (5.5%) | 18 (9.0%) |
| 5:00 AM to 5:29 AM | 13 (4.8%) | 0 (0.0%) |
| 5:30 AM to 5:59 AM | 25 (9.2%) | 0 (0.0%) |
| 6:00 AM to 6:29 AM | 57 (20.9%) | 11 (5.5%) |
| 6:30 AM to 6:59 AM | 36 (13.2%) | 35 (17.5%) |
| 7:00 AM to 7:29 AM | 53 (19.4%) | 37 (18.5%) |
| 7:30 AM to 7:59 AM | 29 (10.6%) | 21 (10.5%) |
| 8:00 AM to 8:29 AM | 16 (5.9%) | 6 (3.0%) |
| 8:30 AM to 8:59 AM | 8 (2.9%) | 3 (1.5%) |
| 9:00 AM to 9:59 AM | 0 (0.0%) | 4 (2.0%) |
| 10:00 AM to 10:59 AM | 0 (0.0%) | 0 (0.0%) |
| 11:00 AM to 11:59 AM | 3 (1.1%) | 0 (0.0%) |
| 12:00 PM to 3:59 PM | 6 (2.2%) | 17 (8.5%) |
| 4:00 PM to 11:59 PM | 12 (4.4%) | 48 (24.0%) |
| Total | 273 (100.0%) | 200 (100.0%) |
Housing Occupancy in Quinlan
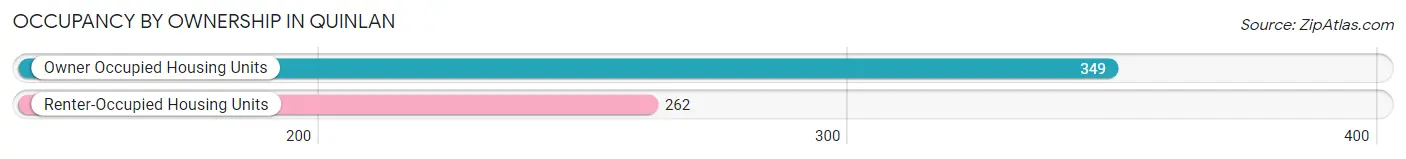
Occupancy by Ownership in Quinlan
Of the total 611 dwellings in Quinlan, owner-occupied units account for 349 (57.1%), while renter-occupied units make up 262 (42.9%).
| Occupancy | # Housing Units | % Housing Units |
| Owner Occupied Housing Units | 349 | 57.1% |
| Renter-Occupied Housing Units | 262 | 42.9% |
| Total Occupied Housing Units | 611 | 100.0% |
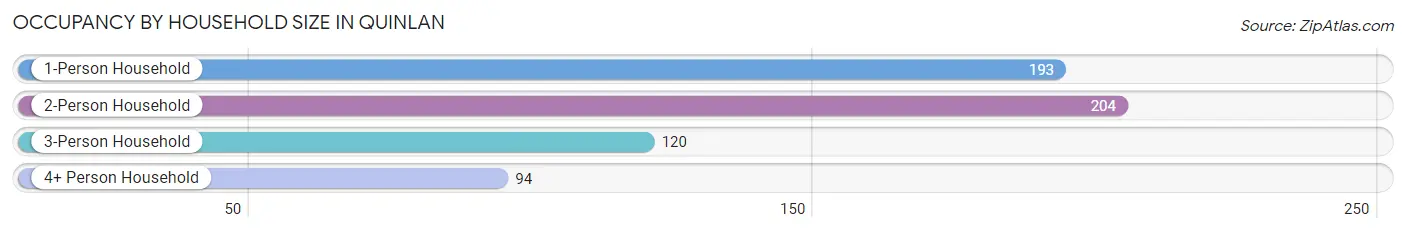
Occupancy by Household Size in Quinlan
| Household Size | # Housing Units | % Housing Units |
| 1-Person Household | 193 | 31.6% |
| 2-Person Household | 204 | 33.4% |
| 3-Person Household | 120 | 19.6% |
| 4+ Person Household | 94 | 15.4% |
| Total Housing Units | 611 | 100.0% |
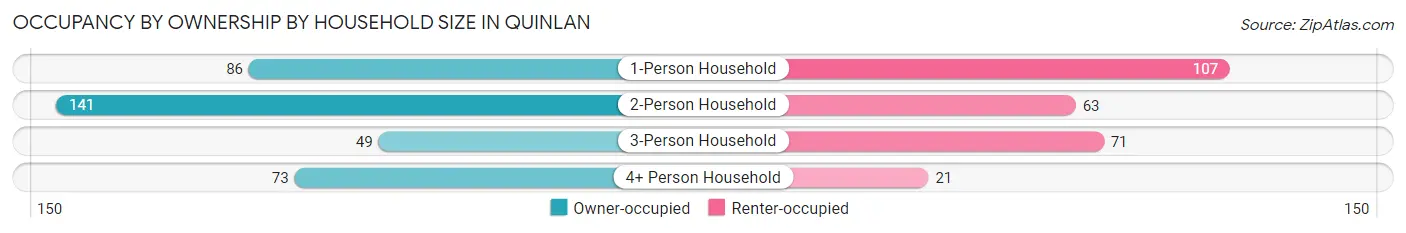
Occupancy by Ownership by Household Size in Quinlan
| Household Size | Owner-occupied | Renter-occupied |
| 1-Person Household | 86 (44.6%) | 107 (55.4%) |
| 2-Person Household | 141 (69.1%) | 63 (30.9%) |
| 3-Person Household | 49 (40.8%) | 71 (59.2%) |
| 4+ Person Household | 73 (77.7%) | 21 (22.3%) |
| Total Housing Units | 349 (57.1%) | 262 (42.9%) |
Occupancy by Educational Attainment in Quinlan
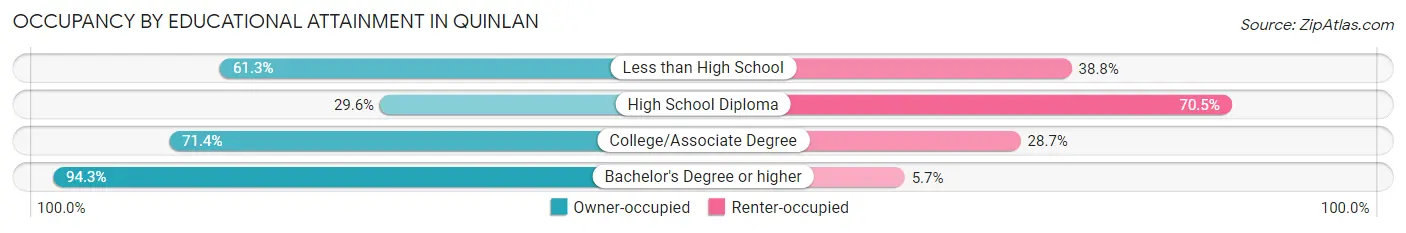
| Household Size | Owner-occupied | Renter-occupied |
| Less than High School | 49 (61.3%) | 31 (38.8%) |
| High School Diploma | 73 (29.5%) | 174 (70.5%) |
| College/Associate Degree | 127 (71.4%) | 51 (28.6%) |
| Bachelor's Degree or higher | 100 (94.3%) | 6 (5.7%) |
Occupancy by Age of Householder in Quinlan
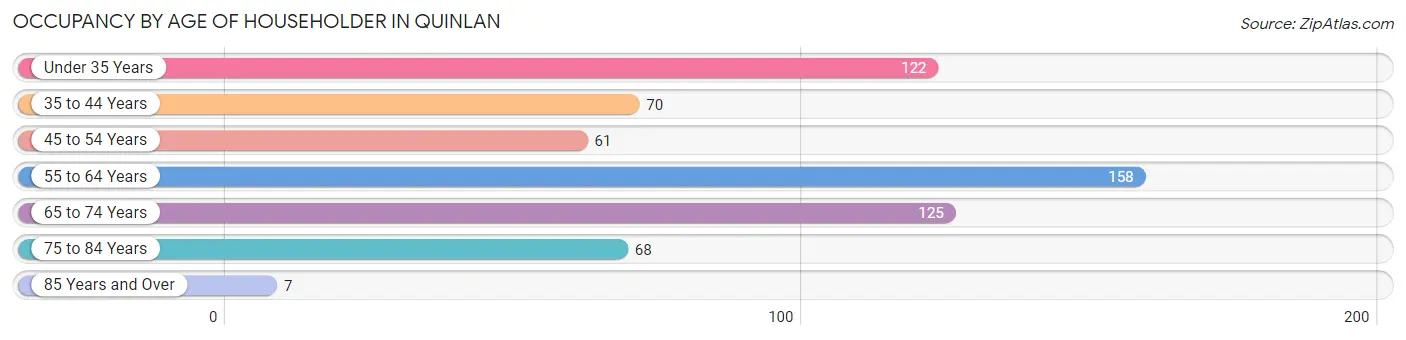
| Age Bracket | # Households | % Households |
| Under 35 Years | 122 | 20.0% |
| 35 to 44 Years | 70 | 11.5% |
| 45 to 54 Years | 61 | 10.0% |
| 55 to 64 Years | 158 | 25.9% |
| 65 to 74 Years | 125 | 20.5% |
| 75 to 84 Years | 68 | 11.1% |
| 85 Years and Over | 7 | 1.1% |
| Total | 611 | 100.0% |
Housing Finances in Quinlan
Median Income by Occupancy in Quinlan
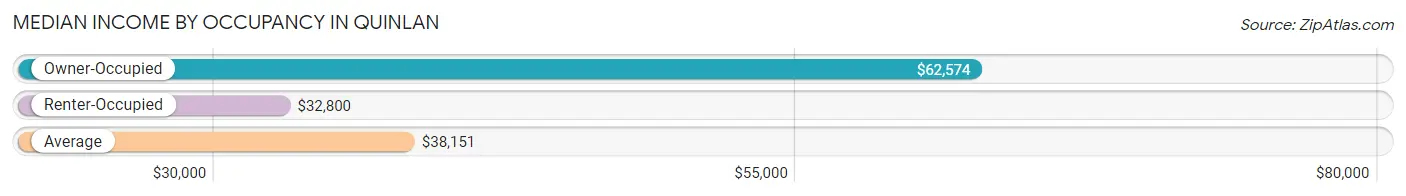
| Occupancy Type | # Households | Median Income |
| Owner-Occupied | 349 (57.1%) | $62,574 |
| Renter-Occupied | 262 (42.9%) | $32,800 |
| Average | 611 (100.0%) | $38,151 |
Occupancy by Householder Income Bracket in Quinlan
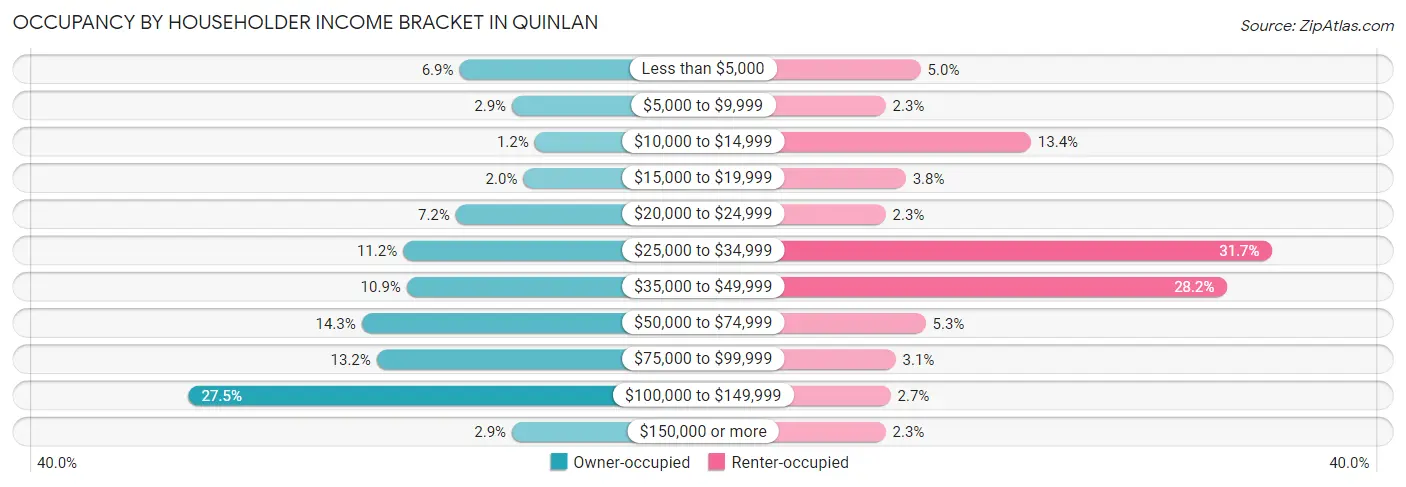
| Income Bracket | Owner-occupied | Renter-occupied |
| Less than $5,000 | 24 (6.9%) | 13 (5.0%) |
| $5,000 to $9,999 | 10 (2.9%) | 6 (2.3%) |
| $10,000 to $14,999 | 4 (1.1%) | 35 (13.4%) |
| $15,000 to $19,999 | 7 (2.0%) | 10 (3.8%) |
| $20,000 to $24,999 | 25 (7.2%) | 6 (2.3%) |
| $25,000 to $34,999 | 39 (11.2%) | 83 (31.7%) |
| $35,000 to $49,999 | 38 (10.9%) | 74 (28.2%) |
| $50,000 to $74,999 | 50 (14.3%) | 14 (5.3%) |
| $75,000 to $99,999 | 46 (13.2%) | 8 (3.0%) |
| $100,000 to $149,999 | 96 (27.5%) | 7 (2.7%) |
| $150,000 or more | 10 (2.9%) | 6 (2.3%) |
| Total | 349 (100.0%) | 262 (100.0%) |
Monthly Housing Cost Tiers in Quinlan
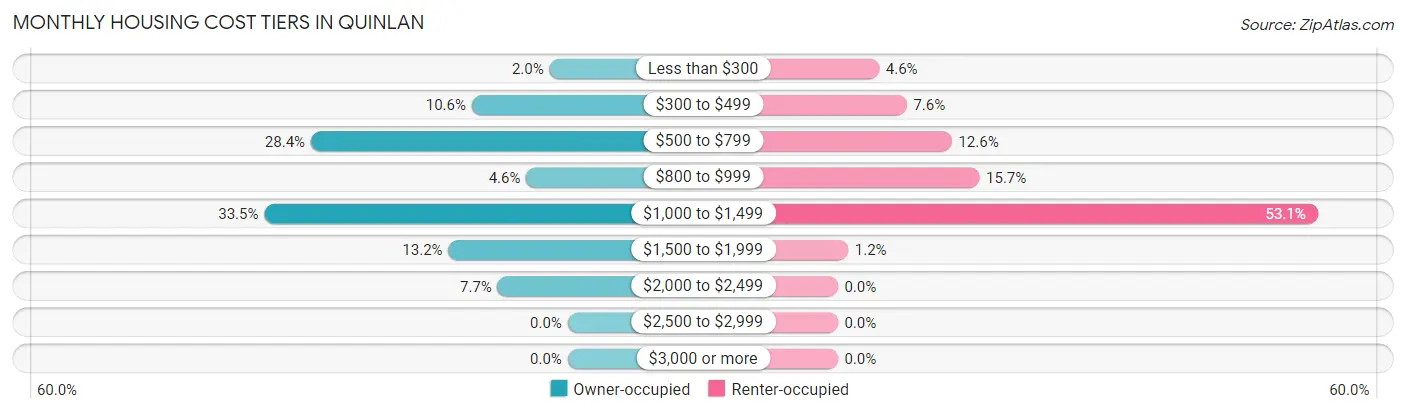
| Monthly Cost | Owner-occupied | Renter-occupied |
| Less than $300 | 7 (2.0%) | 12 (4.6%) |
| $300 to $499 | 37 (10.6%) | 20 (7.6%) |
| $500 to $799 | 99 (28.4%) | 33 (12.6%) |
| $800 to $999 | 16 (4.6%) | 41 (15.7%) |
| $1,000 to $1,499 | 117 (33.5%) | 139 (53.0%) |
| $1,500 to $1,999 | 46 (13.2%) | 3 (1.1%) |
| $2,000 to $2,499 | 27 (7.7%) | 0 (0.0%) |
| $2,500 to $2,999 | 0 (0.0%) | 0 (0.0%) |
| $3,000 or more | 0 (0.0%) | 0 (0.0%) |
| Total | 349 (100.0%) | 262 (100.0%) |
Physical Housing Characteristics in Quinlan
Housing Structures in Quinlan
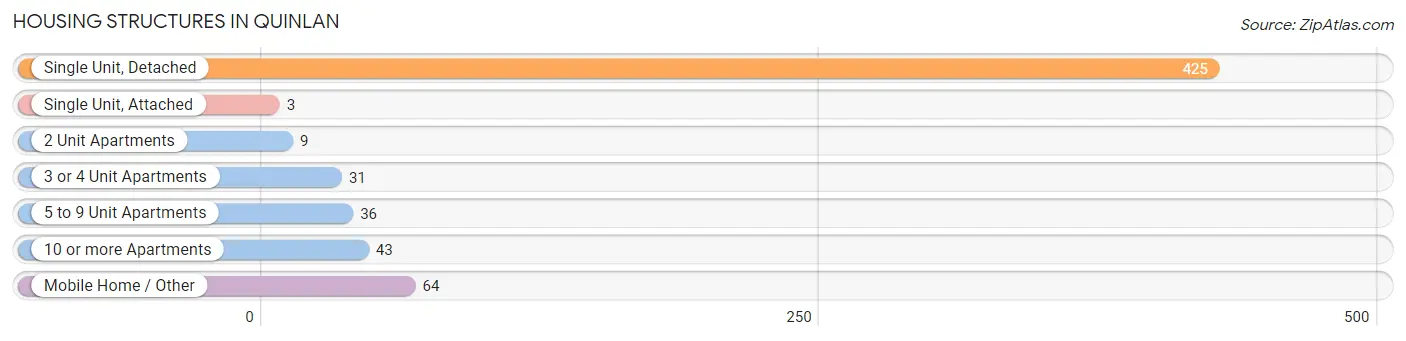
| Structure Type | # Housing Units | % Housing Units |
| Single Unit, Detached | 425 | 69.6% |
| Single Unit, Attached | 3 | 0.5% |
| 2 Unit Apartments | 9 | 1.5% |
| 3 or 4 Unit Apartments | 31 | 5.1% |
| 5 to 9 Unit Apartments | 36 | 5.9% |
| 10 or more Apartments | 43 | 7.0% |
| Mobile Home / Other | 64 | 10.5% |
| Total | 611 | 100.0% |
Housing Structures by Occupancy in Quinlan
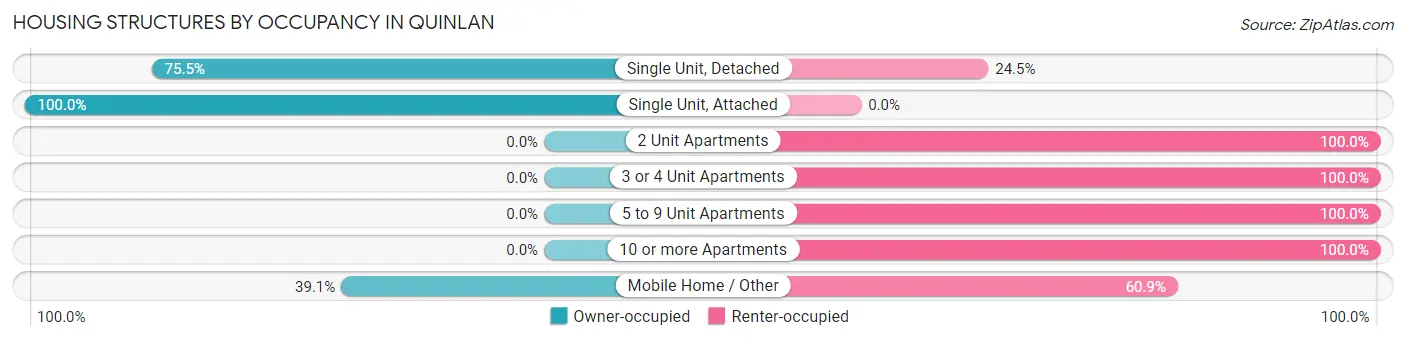
| Structure Type | Owner-occupied | Renter-occupied |
| Single Unit, Detached | 321 (75.5%) | 104 (24.5%) |
| Single Unit, Attached | 3 (100.0%) | 0 (0.0%) |
| 2 Unit Apartments | 0 (0.0%) | 9 (100.0%) |
| 3 or 4 Unit Apartments | 0 (0.0%) | 31 (100.0%) |
| 5 to 9 Unit Apartments | 0 (0.0%) | 36 (100.0%) |
| 10 or more Apartments | 0 (0.0%) | 43 (100.0%) |
| Mobile Home / Other | 25 (39.1%) | 39 (60.9%) |
| Total | 349 (57.1%) | 262 (42.9%) |
Housing Structures by Number of Rooms in Quinlan
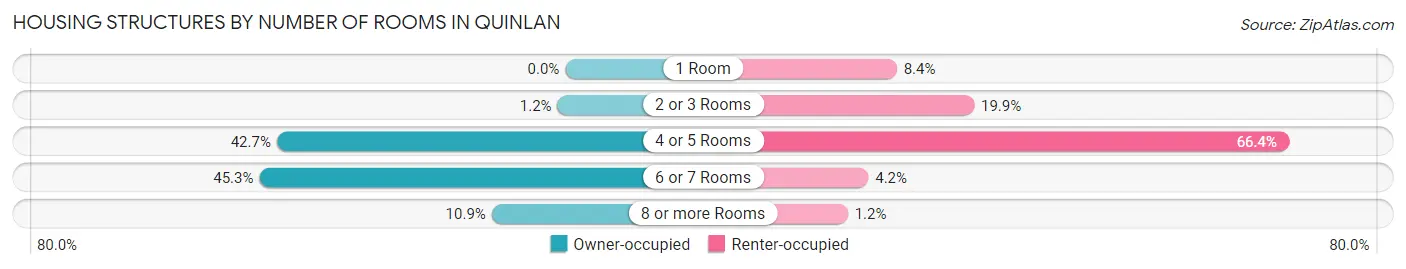
| Number of Rooms | Owner-occupied | Renter-occupied |
| 1 Room | 0 (0.0%) | 22 (8.4%) |
| 2 or 3 Rooms | 4 (1.1%) | 52 (19.9%) |
| 4 or 5 Rooms | 149 (42.7%) | 174 (66.4%) |
| 6 or 7 Rooms | 158 (45.3%) | 11 (4.2%) |
| 8 or more Rooms | 38 (10.9%) | 3 (1.1%) |
| Total | 349 (100.0%) | 262 (100.0%) |
Housing Structure by Heating Type in Quinlan
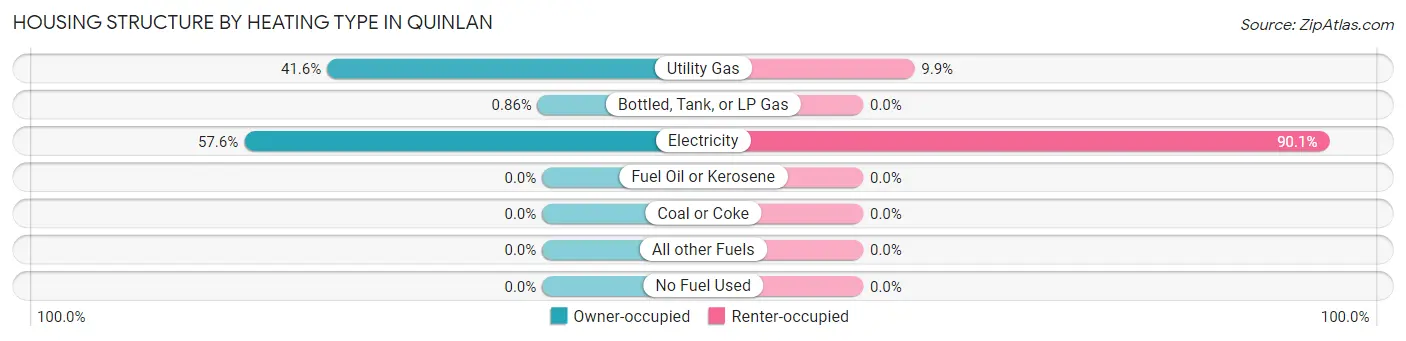
| Heating Type | Owner-occupied | Renter-occupied |
| Utility Gas | 145 (41.5%) | 26 (9.9%) |
| Bottled, Tank, or LP Gas | 3 (0.9%) | 0 (0.0%) |
| Electricity | 201 (57.6%) | 236 (90.1%) |
| Fuel Oil or Kerosene | 0 (0.0%) | 0 (0.0%) |
| Coal or Coke | 0 (0.0%) | 0 (0.0%) |
| All other Fuels | 0 (0.0%) | 0 (0.0%) |
| No Fuel Used | 0 (0.0%) | 0 (0.0%) |
| Total | 349 (100.0%) | 262 (100.0%) |
Household Vehicle Usage in Quinlan
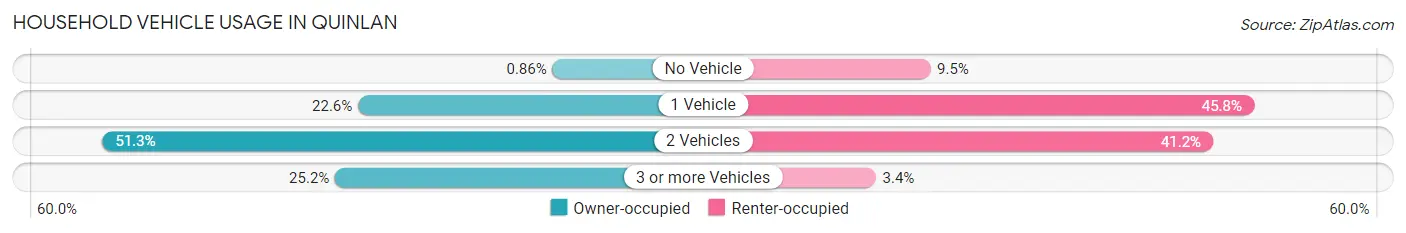
| Vehicles per Household | Owner-occupied | Renter-occupied |
| No Vehicle | 3 (0.9%) | 25 (9.5%) |
| 1 Vehicle | 79 (22.6%) | 120 (45.8%) |
| 2 Vehicles | 179 (51.3%) | 108 (41.2%) |
| 3 or more Vehicles | 88 (25.2%) | 9 (3.4%) |
| Total | 349 (100.0%) | 262 (100.0%) |
Real Estate & Mortgages in Quinlan
Real Estate and Mortgage Overview in Quinlan
| Characteristic | Without Mortgage | With Mortgage |
| Housing Units | 142 | 207 |
| Median Property Value | $133,300 | $176,900 |
| Median Household Income | - | - |
| Monthly Housing Costs | $620 | $0 |
| Real Estate Taxes | $2,081 | $4 |
Property Value by Mortgage Status in Quinlan
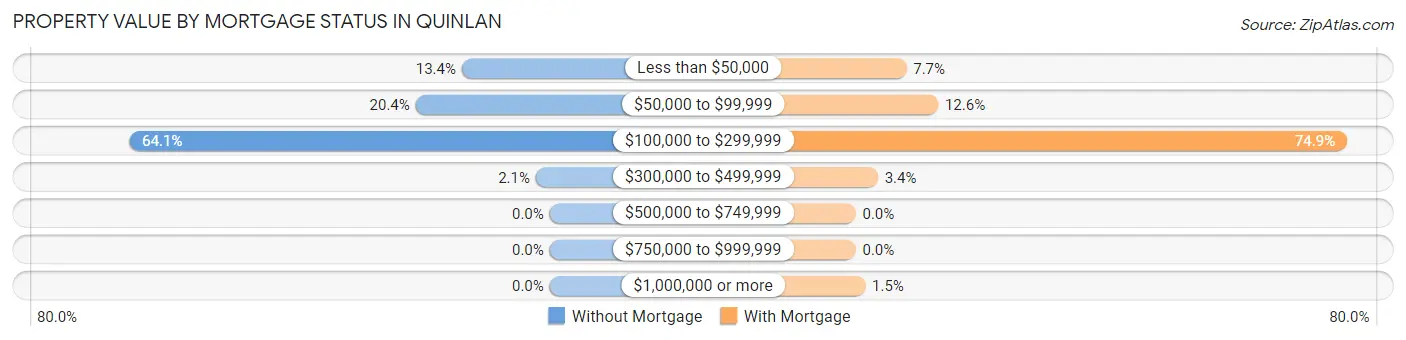
| Property Value | Without Mortgage | With Mortgage |
| Less than $50,000 | 19 (13.4%) | 16 (7.7%) |
| $50,000 to $99,999 | 29 (20.4%) | 26 (12.6%) |
| $100,000 to $299,999 | 91 (64.1%) | 155 (74.9%) |
| $300,000 to $499,999 | 3 (2.1%) | 7 (3.4%) |
| $500,000 to $749,999 | 0 (0.0%) | 0 (0.0%) |
| $750,000 to $999,999 | 0 (0.0%) | 0 (0.0%) |
| $1,000,000 or more | 0 (0.0%) | 3 (1.5%) |
| Total | 142 (100.0%) | 207 (100.0%) |
Household Income by Mortgage Status in Quinlan
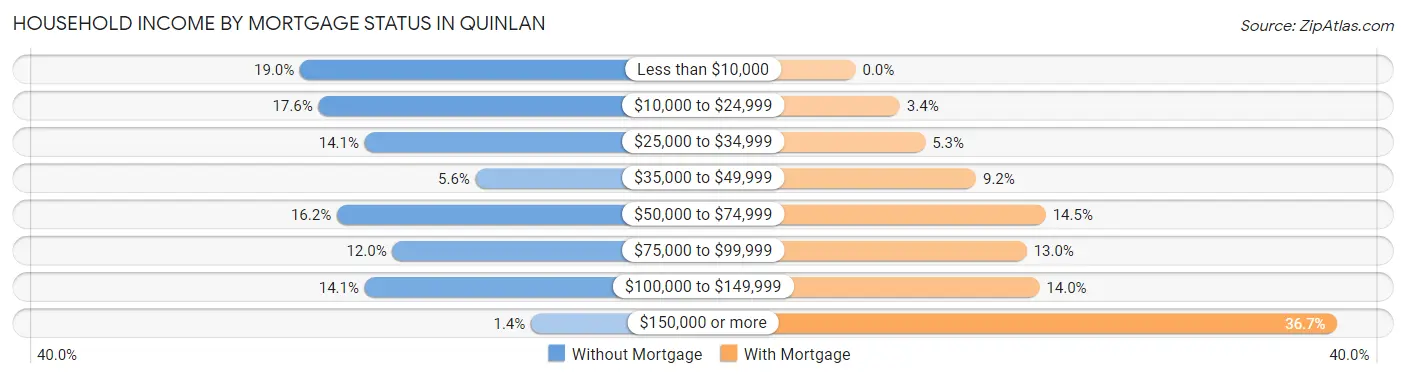
| Household Income | Without Mortgage | With Mortgage |
| Less than $10,000 | 27 (19.0%) | 0 (0.0%) |
| $10,000 to $24,999 | 25 (17.6%) | 7 (3.4%) |
| $25,000 to $34,999 | 20 (14.1%) | 11 (5.3%) |
| $35,000 to $49,999 | 8 (5.6%) | 19 (9.2%) |
| $50,000 to $74,999 | 23 (16.2%) | 30 (14.5%) |
| $75,000 to $99,999 | 17 (12.0%) | 27 (13.0%) |
| $100,000 to $149,999 | 20 (14.1%) | 29 (14.0%) |
| $150,000 or more | 2 (1.4%) | 76 (36.7%) |
| Total | 142 (100.0%) | 207 (100.0%) |
Property Value to Household Income Ratio in Quinlan
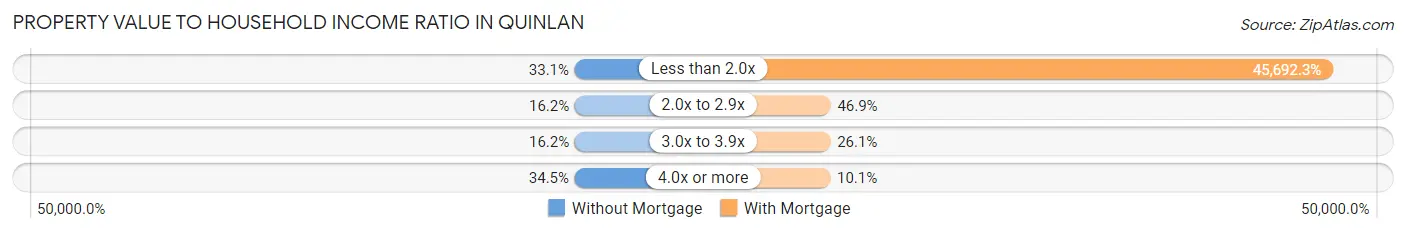
| Value-to-Income Ratio | Without Mortgage | With Mortgage |
| Less than 2.0x | 47 (33.1%) | 94,583 (45,692.3%) |
| 2.0x to 2.9x | 23 (16.2%) | 97 (46.9%) |
| 3.0x to 3.9x | 23 (16.2%) | 54 (26.1%) |
| 4.0x or more | 49 (34.5%) | 21 (10.1%) |
| Total | 142 (100.0%) | 207 (100.0%) |
Real Estate Taxes by Mortgage Status in Quinlan
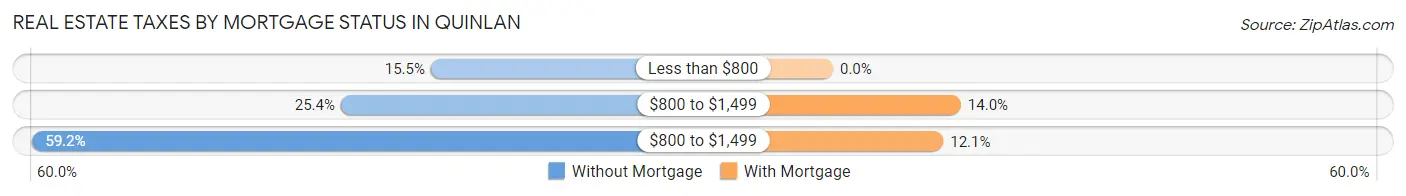
| Property Taxes | Without Mortgage | With Mortgage |
| Less than $800 | 22 (15.5%) | 0 (0.0%) |
| $800 to $1,499 | 36 (25.4%) | 29 (14.0%) |
| $800 to $1,499 | 84 (59.2%) | 25 (12.1%) |
| Total | 142 (100.0%) | 207 (100.0%) |
Health & Disability in Quinlan
Health Insurance Coverage by Age in Quinlan
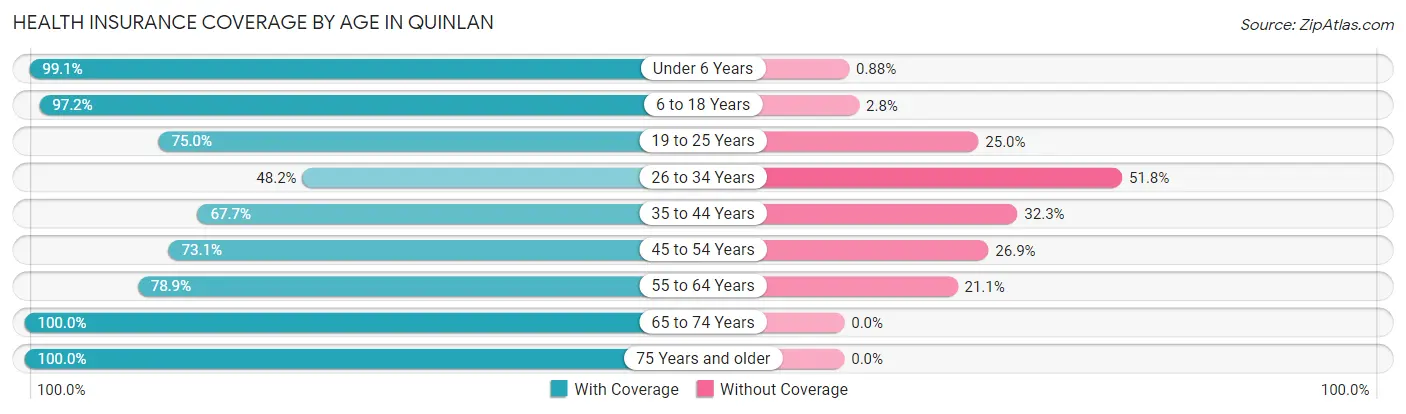
| Age Bracket | With Coverage | Without Coverage |
| Under 6 Years | 224 (99.1%) | 2 (0.9%) |
| 6 to 18 Years | 176 (97.2%) | 5 (2.8%) |
| 19 to 25 Years | 72 (75.0%) | 24 (25.0%) |
| 26 to 34 Years | 80 (48.2%) | 86 (51.8%) |
| 35 to 44 Years | 107 (67.7%) | 51 (32.3%) |
| 45 to 54 Years | 98 (73.1%) | 36 (26.9%) |
| 55 to 64 Years | 183 (78.9%) | 49 (21.1%) |
| 65 to 74 Years | 186 (100.0%) | 0 (0.0%) |
| 75 Years and older | 91 (100.0%) | 0 (0.0%) |
| Total | 1,217 (82.8%) | 253 (17.2%) |
Health Insurance Coverage by Citizenship Status in Quinlan
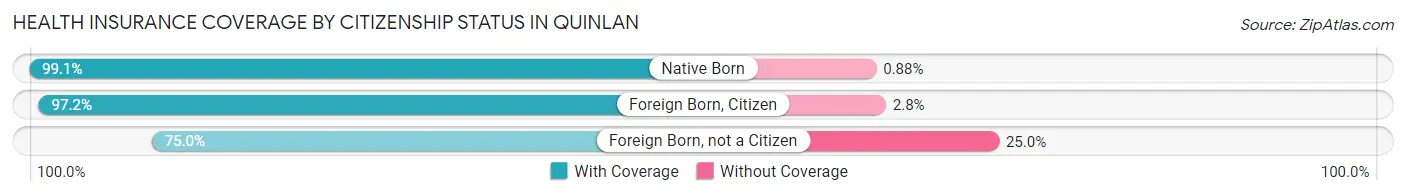
| Citizenship Status | With Coverage | Without Coverage |
| Native Born | 224 (99.1%) | 2 (0.9%) |
| Foreign Born, Citizen | 176 (97.2%) | 5 (2.8%) |
| Foreign Born, not a Citizen | 72 (75.0%) | 24 (25.0%) |
Health Insurance Coverage by Household Income in Quinlan
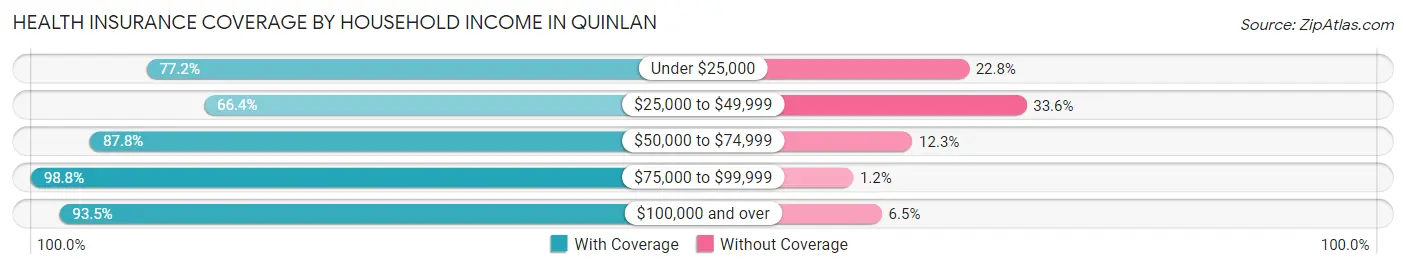
| Household Income | With Coverage | Without Coverage |
| Under $25,000 | 152 (77.2%) | 45 (22.8%) |
| $25,000 to $49,999 | 300 (66.4%) | 152 (33.6%) |
| $50,000 to $74,999 | 179 (87.7%) | 25 (12.2%) |
| $75,000 to $99,999 | 171 (98.8%) | 2 (1.2%) |
| $100,000 and over | 415 (93.5%) | 29 (6.5%) |
Public vs Private Health Insurance Coverage by Age in Quinlan
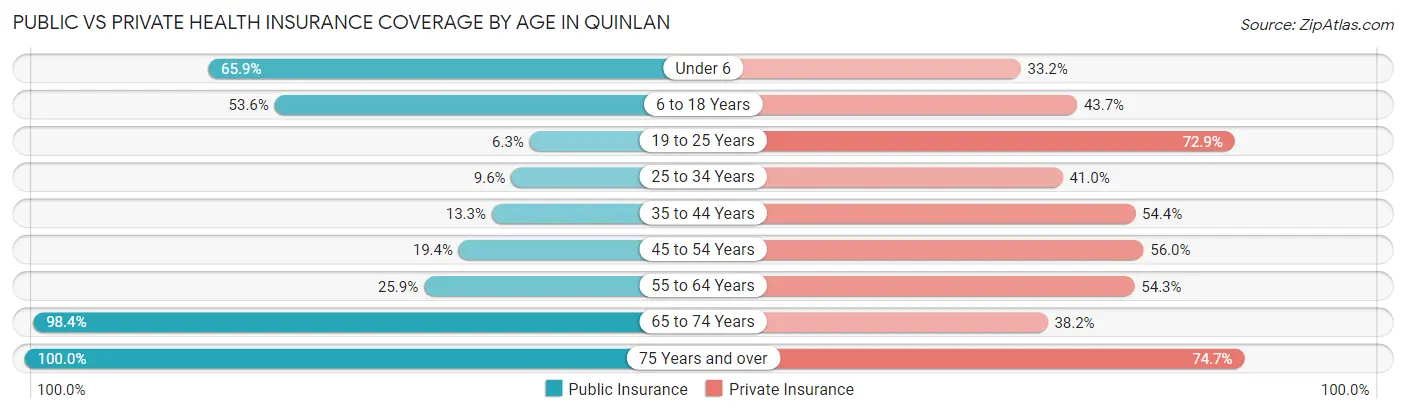
| Age Bracket | Public Insurance | Private Insurance |
| Under 6 | 149 (65.9%) | 75 (33.2%) |
| 6 to 18 Years | 97 (53.6%) | 79 (43.6%) |
| 19 to 25 Years | 6 (6.2%) | 70 (72.9%) |
| 25 to 34 Years | 16 (9.6%) | 68 (41.0%) |
| 35 to 44 Years | 21 (13.3%) | 86 (54.4%) |
| 45 to 54 Years | 26 (19.4%) | 75 (56.0%) |
| 55 to 64 Years | 60 (25.9%) | 126 (54.3%) |
| 65 to 74 Years | 183 (98.4%) | 71 (38.2%) |
| 75 Years and over | 91 (100.0%) | 68 (74.7%) |
| Total | 649 (44.2%) | 718 (48.8%) |
Disability Status by Sex by Age in Quinlan
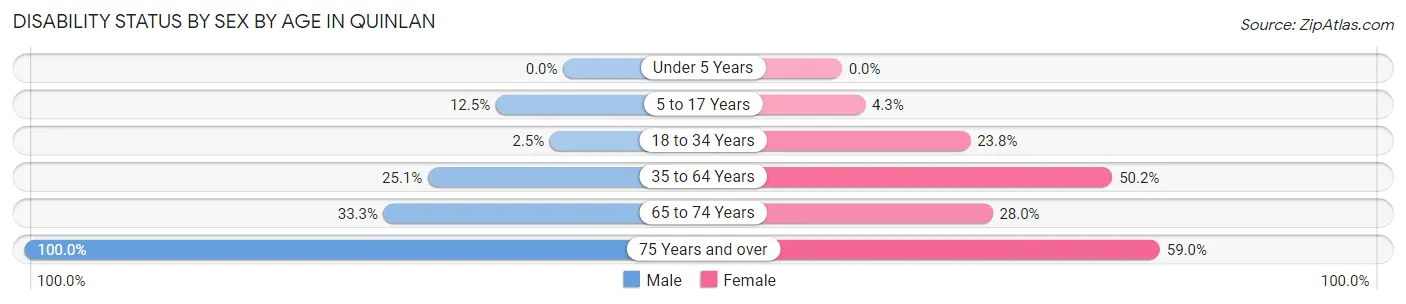
| Age Bracket | Male | Female |
| Under 5 Years | 0 (0.0%) | 0 (0.0%) |
| 5 to 17 Years | 12 (12.5%) | 4 (4.3%) |
| 18 to 34 Years | 3 (2.5%) | 36 (23.8%) |
| 35 to 64 Years | 64 (25.1%) | 135 (50.2%) |
| 65 to 74 Years | 31 (33.3%) | 26 (28.0%) |
| 75 Years and over | 30 (100.0%) | 36 (59.0%) |
Disability Class by Sex by Age in Quinlan
Disability Class: Hearing Difficulty
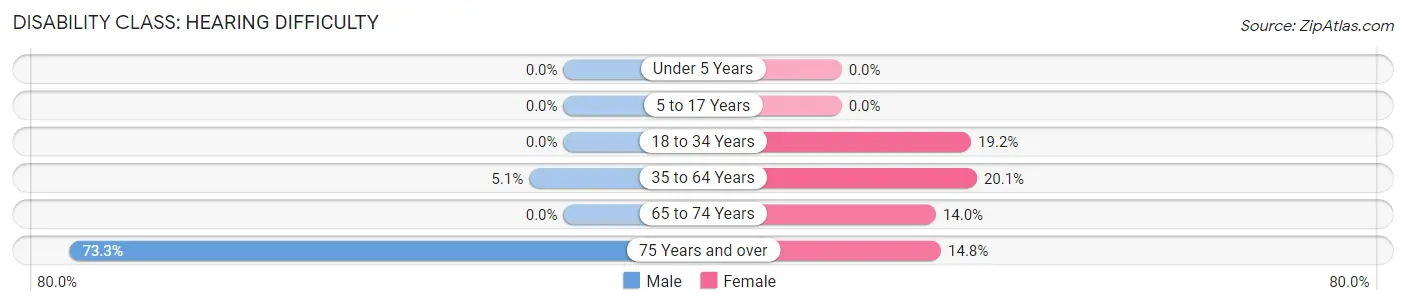
| Age Bracket | Male | Female |
| Under 5 Years | 0 (0.0%) | 0 (0.0%) |
| 5 to 17 Years | 0 (0.0%) | 0 (0.0%) |
| 18 to 34 Years | 0 (0.0%) | 29 (19.2%) |
| 35 to 64 Years | 13 (5.1%) | 54 (20.1%) |
| 65 to 74 Years | 0 (0.0%) | 13 (14.0%) |
| 75 Years and over | 22 (73.3%) | 9 (14.7%) |
Disability Class: Vision Difficulty
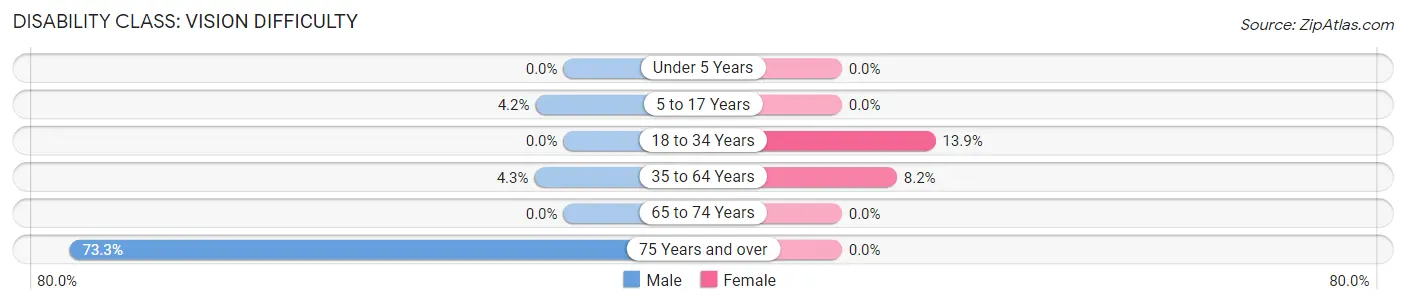
| Age Bracket | Male | Female |
| Under 5 Years | 0 (0.0%) | 0 (0.0%) |
| 5 to 17 Years | 4 (4.2%) | 0 (0.0%) |
| 18 to 34 Years | 0 (0.0%) | 21 (13.9%) |
| 35 to 64 Years | 11 (4.3%) | 22 (8.2%) |
| 65 to 74 Years | 0 (0.0%) | 0 (0.0%) |
| 75 Years and over | 22 (73.3%) | 0 (0.0%) |
Disability Class: Cognitive Difficulty
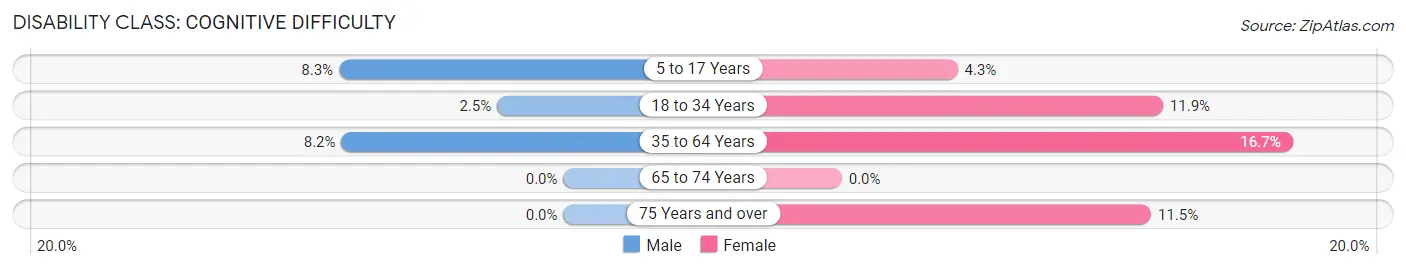
| Age Bracket | Male | Female |
| 5 to 17 Years | 8 (8.3%) | 4 (4.3%) |
| 18 to 34 Years | 3 (2.5%) | 18 (11.9%) |
| 35 to 64 Years | 21 (8.2%) | 45 (16.7%) |
| 65 to 74 Years | 0 (0.0%) | 0 (0.0%) |
| 75 Years and over | 0 (0.0%) | 7 (11.5%) |
Disability Class: Ambulatory Difficulty
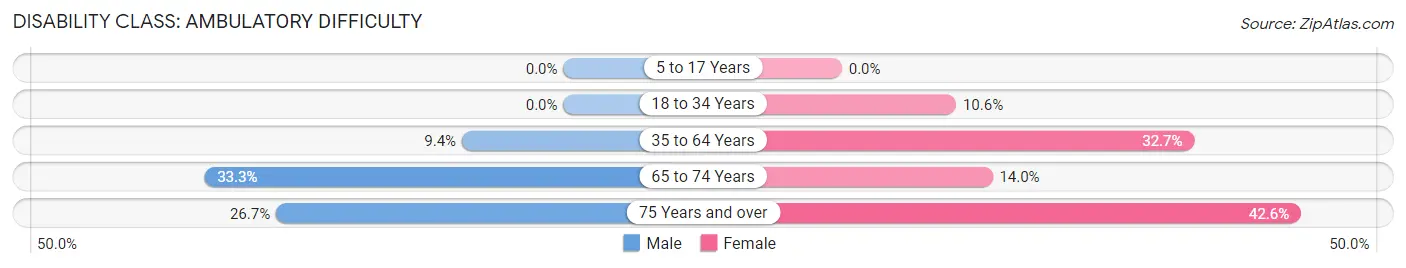
| Age Bracket | Male | Female |
| 5 to 17 Years | 0 (0.0%) | 0 (0.0%) |
| 18 to 34 Years | 0 (0.0%) | 16 (10.6%) |
| 35 to 64 Years | 24 (9.4%) | 88 (32.7%) |
| 65 to 74 Years | 31 (33.3%) | 13 (14.0%) |
| 75 Years and over | 8 (26.7%) | 26 (42.6%) |
Disability Class: Self-Care Difficulty
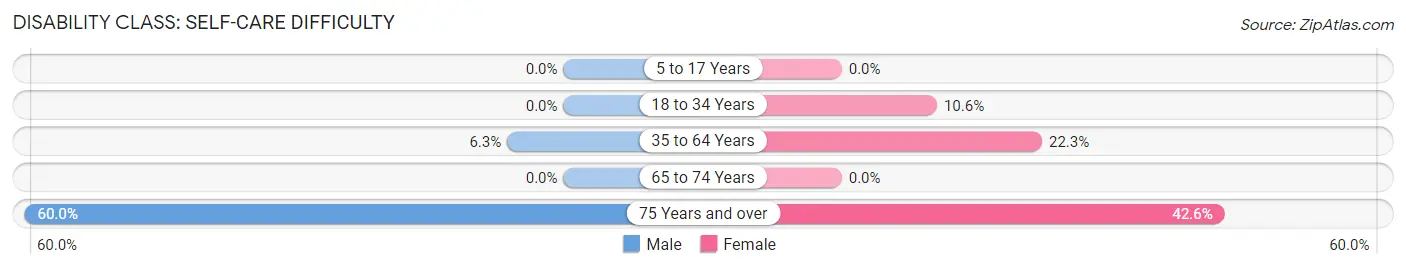
| Age Bracket | Male | Female |
| 5 to 17 Years | 0 (0.0%) | 0 (0.0%) |
| 18 to 34 Years | 0 (0.0%) | 16 (10.6%) |
| 35 to 64 Years | 16 (6.3%) | 60 (22.3%) |
| 65 to 74 Years | 0 (0.0%) | 0 (0.0%) |
| 75 Years and over | 18 (60.0%) | 26 (42.6%) |
Technology Access in Quinlan
Computing Device Access in Quinlan
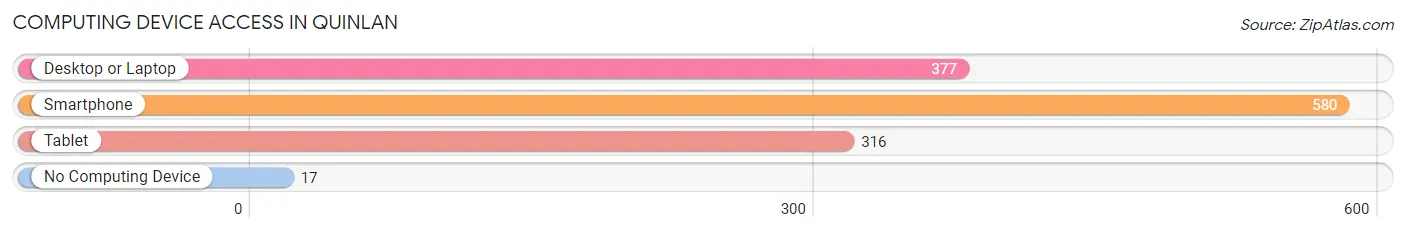
| Device Type | # Households | % Households |
| Desktop or Laptop | 377 | 61.7% |
| Smartphone | 580 | 94.9% |
| Tablet | 316 | 51.7% |
| No Computing Device | 17 | 2.8% |
| Total | 611 | 100.0% |
Internet Access in Quinlan
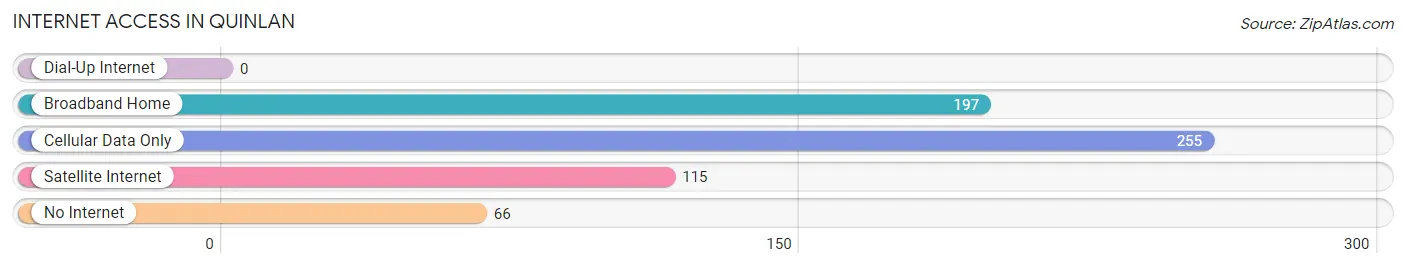
| Internet Type | # Households | % Households |
| Dial-Up Internet | 0 | 0.0% |
| Broadband Home | 197 | 32.2% |
| Cellular Data Only | 255 | 41.7% |
| Satellite Internet | 115 | 18.8% |
| No Internet | 66 | 10.8% |
| Total | 611 | 100.0% |
Quinlan Summary
Quinlan, Texas is a small town located in Hunt County, Texas, about 45 miles east of Dallas. The town was founded in 1872 and named after a local rancher, John Quinlan. The population of Quinlan was 1,845 in the 2010 census.
Geography
Quinlan is located in Hunt County, Texas, about 45 miles east of Dallas. The town is situated on the banks of the East Fork of the Sabine River. The terrain is mostly flat with some rolling hills. The climate is humid subtropical with hot summers and mild winters.
Economy
Quinlan’s economy is largely based on agriculture and manufacturing. The town is home to several large poultry farms, as well as a number of small businesses. The town also has a few retail stores, restaurants, and a few small manufacturing plants.
Demographics
As of the 2010 census, the population of Quinlan was 1,845. The racial makeup of the town was 79.3% White, 15.2% Hispanic or Latino, 2.2% African American, 0.7% Native American, 0.3% Asian, and 2.5% from other races. The median household income was $37,917, and the median family income was $45,917.
History
Quinlan was founded in 1872 and named after a local rancher, John Quinlan. The town was originally a small farming community, but it grew rapidly in the early 20th century due to the discovery of oil in the area. The town was incorporated in 1921 and has remained relatively unchanged since then.
Quinlan has a rich history of community involvement and civic pride. The town has a number of historic buildings, including the Quinlan Opera House, which was built in 1891 and is still in use today. The town also has a number of parks and recreational facilities, including a public swimming pool, a golf course, and a skate park.
Quinlan is a small town with a big heart. The town is known for its friendly people and its commitment to preserving its history and culture. The town is also home to a number of festivals and events throughout the year, including the Quinlan Rodeo and the Quinlan Music Festival.
Common Questions
What is Per Capita Income in Quinlan?
Per Capita income in Quinlan is $25,125.
What is the Median Family Income in Quinlan?
Median Family Income in Quinlan is $57,045.
What is the Median Household income in Quinlan?
Median Household Income in Quinlan is $38,151.
What is Income or Wage Gap in Quinlan?
Income or Wage Gap in Quinlan is 33.3%.
Women in Quinlan earn 66.7 cents for every dollar earned by a man.
What is Family Income Deficit in Quinlan?
Family Income Deficit in Quinlan is $9,589.
Families that are below poverty line in Quinlan earn $9,589 less on average than the poverty threshold level.
What is Inequality or Gini Index in Quinlan?
Inequality or Gini Index in Quinlan is 0.45.
What is the Total Population of Quinlan?
Total Population of Quinlan is 1,470.
What is the Total Male Population of Quinlan?
Total Male Population of Quinlan is 644.
What is the Total Female Population of Quinlan?
Total Female Population of Quinlan is 826.
What is the Ratio of Males per 100 Females in Quinlan?
There are 77.97 Males per 100 Females in Quinlan.
What is the Ratio of Females per 100 Males in Quinlan?
There are 128.26 Females per 100 Males in Quinlan.
What is the Median Population Age in Quinlan?
Median Population Age in Quinlan is 37.8 Years.
What is the Average Family Size in Quinlan
Average Family Size in Quinlan is 3.1 People.
What is the Average Household Size in Quinlan
Average Household Size in Quinlan is 2.4 People.
How Large is the Labor Force in Quinlan?
There are 615 People in the Labor Forcein in Quinlan.
What is the Percentage of People in the Labor Force in Quinlan?
56.7% of People are in the Labor Force in Quinlan.
What is the Unemployment Rate in Quinlan?
Unemployment Rate in Quinlan is 5.2%.