Pyote, TX Map & Demographics
Pyote Map
Pyote Overview
$58,226
PER CAPITA INCOME
0.41
INEQUALITY / GINI INDEX
130
TOTAL POPULATION
69
MALE POPULATION
61
FEMALE POPULATION
113.11
MALES / 100 FEMALES
88.41
FEMALES / 100 MALES
35.5
MEDIAN AGE
2.5
AVG FAMILY SIZE
2.5
AVG HOUSEHOLD SIZE
71
LABOR FORCE [ PEOPLE ]
71.7%
PERCENT IN LABOR FORCE
Pyote Zip Codes
Pyote Area Codes
Income in Pyote
Income Overview in Pyote
| Characteristic | Number | Measure |
| Per Capita Income | 130 | $58,226 |
| Median Family Income | 46 | $0 |
| Mean Family Income | 46 | $136,707 |
| Median Household Income | 51 | $0 |
| Mean Household Income | 51 | $143,404 |
| Income Deficit | 46 | $0 |
| Wage / Income Gap (%) | 130 | 0.00% |
| Wage / Income Gap ($) | 130 | 100.00¢ per $1 |
| Gini / Inequality Index | 130 | 0.41 |
Earnings by Sex in Pyote
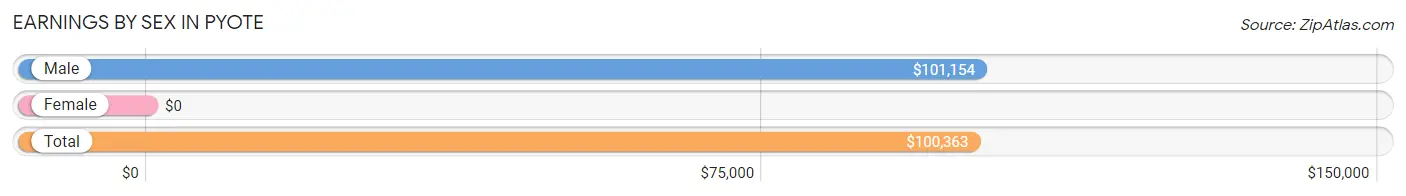
| Sex | Number | Average Earnings |
| Male | 32 (45.1%) | $101,154 |
| Female | 39 (54.9%) | $0 |
| Total | 71 (100.0%) | $100,363 |
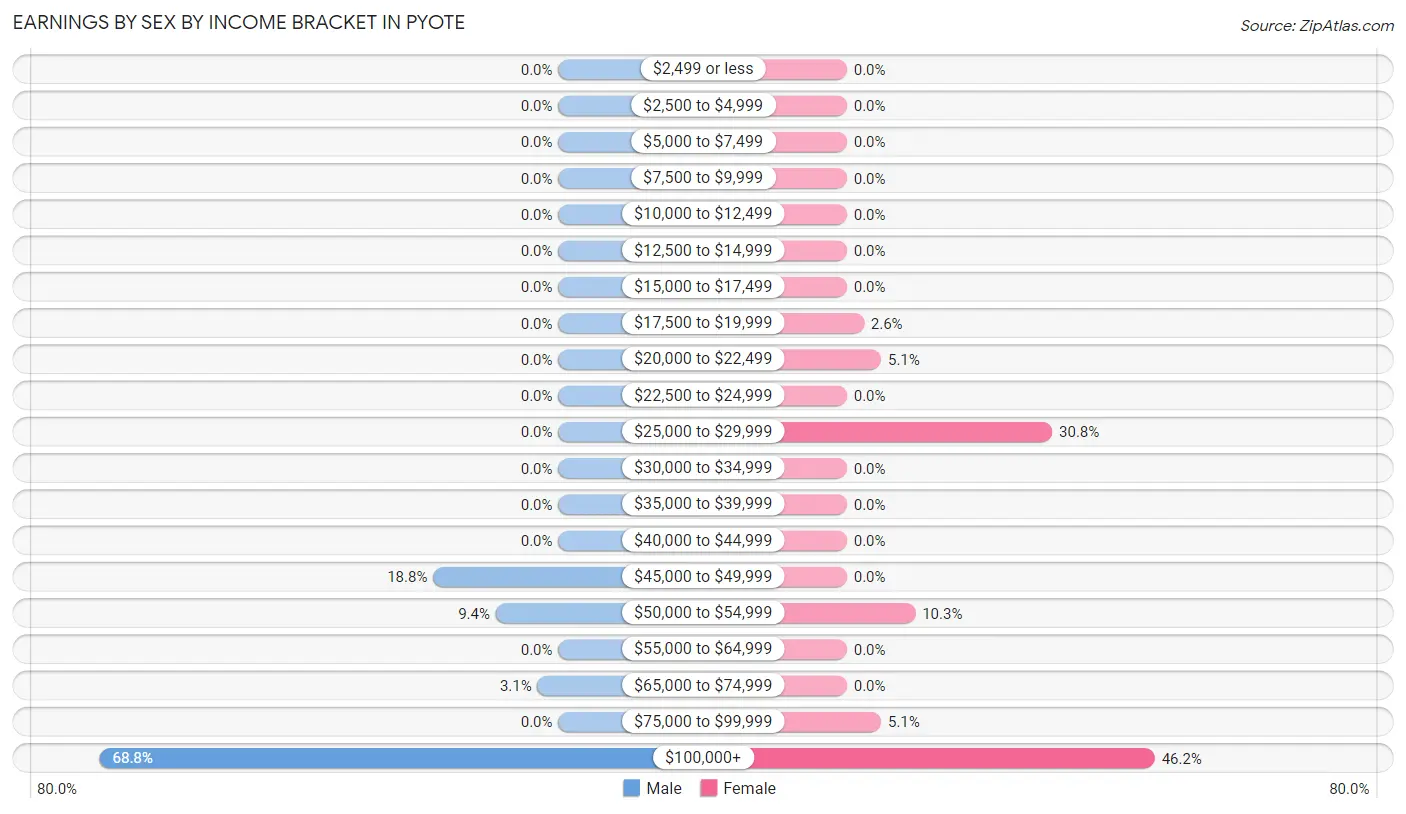
Earnings by Sex by Income Bracket in Pyote
The most common earnings brackets in Pyote are $100,000+ for men (22 | 68.8%) and $100,000+ for women (18 | 46.2%).
| Income | Male | Female |
| $2,499 or less | 0 (0.0%) | 0 (0.0%) |
| $2,500 to $4,999 | 0 (0.0%) | 0 (0.0%) |
| $5,000 to $7,499 | 0 (0.0%) | 0 (0.0%) |
| $7,500 to $9,999 | 0 (0.0%) | 0 (0.0%) |
| $10,000 to $12,499 | 0 (0.0%) | 0 (0.0%) |
| $12,500 to $14,999 | 0 (0.0%) | 0 (0.0%) |
| $15,000 to $17,499 | 0 (0.0%) | 0 (0.0%) |
| $17,500 to $19,999 | 0 (0.0%) | 1 (2.6%) |
| $20,000 to $22,499 | 0 (0.0%) | 2 (5.1%) |
| $22,500 to $24,999 | 0 (0.0%) | 0 (0.0%) |
| $25,000 to $29,999 | 0 (0.0%) | 12 (30.8%) |
| $30,000 to $34,999 | 0 (0.0%) | 0 (0.0%) |
| $35,000 to $39,999 | 0 (0.0%) | 0 (0.0%) |
| $40,000 to $44,999 | 0 (0.0%) | 0 (0.0%) |
| $45,000 to $49,999 | 6 (18.8%) | 0 (0.0%) |
| $50,000 to $54,999 | 3 (9.4%) | 4 (10.3%) |
| $55,000 to $64,999 | 0 (0.0%) | 0 (0.0%) |
| $65,000 to $74,999 | 1 (3.1%) | 0 (0.0%) |
| $75,000 to $99,999 | 0 (0.0%) | 2 (5.1%) |
| $100,000+ | 22 (68.8%) | 18 (46.2%) |
| Total | 32 (100.0%) | 39 (100.0%) |
Earnings by Sex by Educational Attainment in Pyote
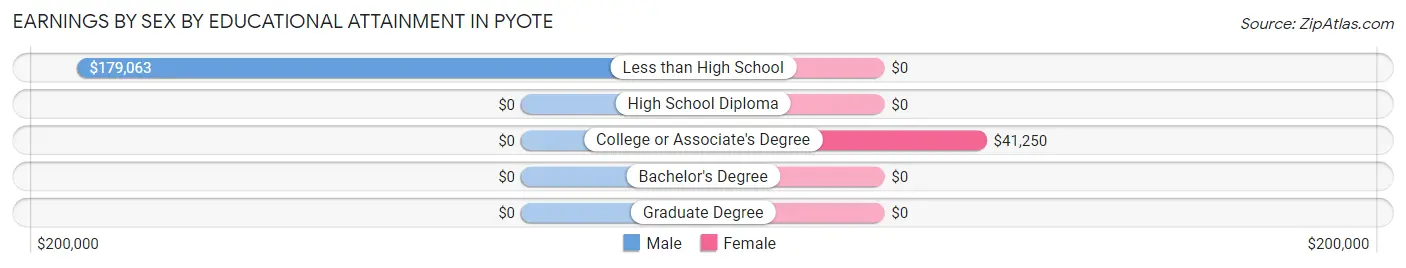
| Educational Attainment | Male Income | Female Income |
| Less than High School | $179,063 | $0 |
| High School Diploma | - | - |
| College or Associate's Degree | - | - |
| Bachelor's Degree | - | - |
| Graduate Degree | - | - |
| Total | $101,538 | $0 |
Family Income in Pyote
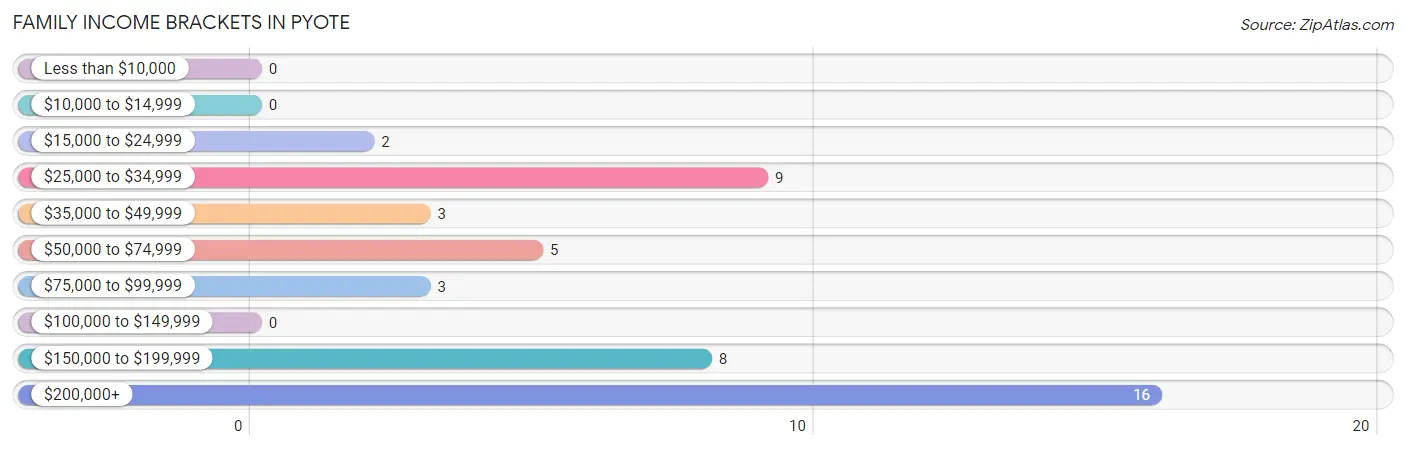
Family Income Brackets in Pyote
According to the Pyote family income data, there are 16 families falling into the $200,000+ income range, which is the most common income bracket and makes up 34.8% of all families.
| Income Bracket | # Families | % Families |
| Less than $10,000 | 0 | 0.0% |
| $10,000 to $14,999 | 0 | 0.0% |
| $15,000 to $24,999 | 2 | 4.3% |
| $25,000 to $34,999 | 9 | 19.6% |
| $35,000 to $49,999 | 3 | 6.5% |
| $50,000 to $74,999 | 5 | 10.9% |
| $75,000 to $99,999 | 3 | 6.5% |
| $100,000 to $149,999 | 0 | 0.0% |
| $150,000 to $199,999 | 8 | 17.4% |
| $200,000+ | 16 | 34.8% |
Family Income by Famaliy Size in Pyote
| Income Bracket | # Families | Median Income |
| 2-Person Families | 43 (93.5%) | $0 |
| 3-Person Families | 0 (0.0%) | $0 |
| 4-Person Families | 0 (0.0%) | $0 |
| 5-Person Families | 3 (6.5%) | $0 |
| 6-Person Families | 0 (0.0%) | $0 |
| 7+ Person Families | 0 (0.0%) | $0 |
| Total | 46 (100.0%) | $0 |
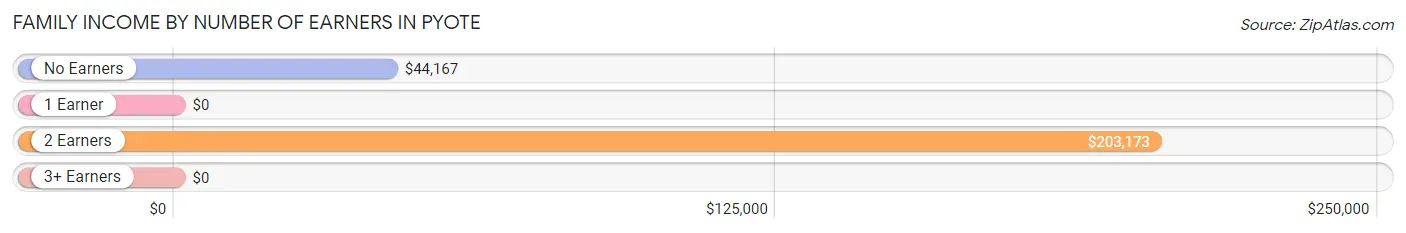
Family Income by Number of Earners in Pyote
| Number of Earners | # Families | Median Income |
| No Earners | 8 (17.4%) | $44,167 |
| 1 Earner | 19 (41.3%) | $0 |
| 2 Earners | 19 (41.3%) | $203,173 |
| 3+ Earners | 0 (0.0%) | $0 |
| Total | 46 (100.0%) | $0 |
Household Income in Pyote
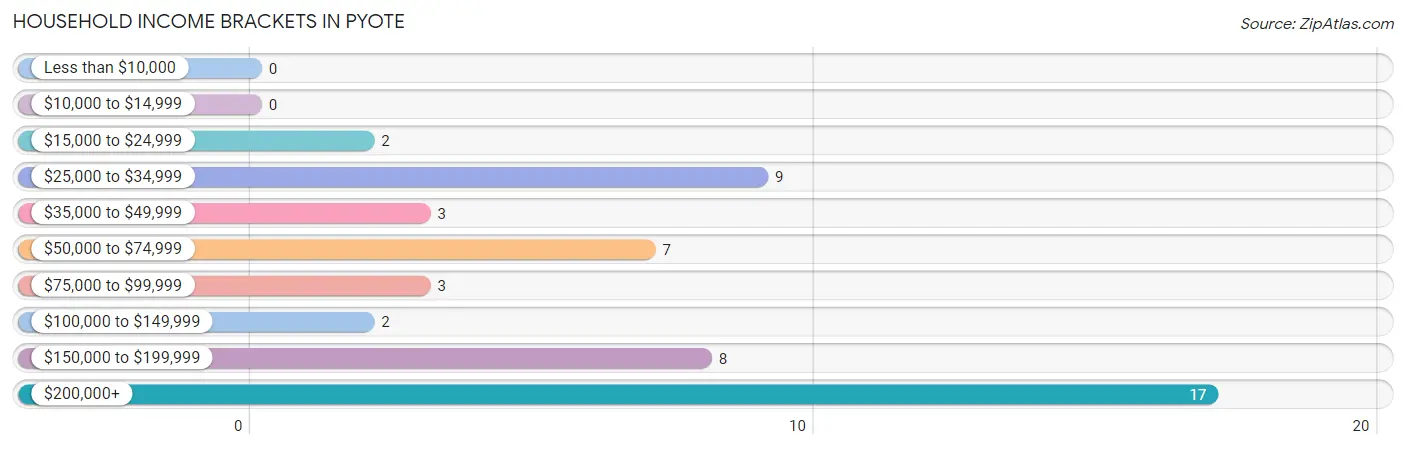
Household Income Brackets in Pyote
With 17 households falling in the category, the $200,000+ income range is the most frequent in Pyote, accounting for 33.3% of all households.
| Income Bracket | # Households | % Households |
| Less than $10,000 | 0 | 0.0% |
| $10,000 to $14,999 | 0 | 0.0% |
| $15,000 to $24,999 | 2 | 3.9% |
| $25,000 to $34,999 | 9 | 17.6% |
| $35,000 to $49,999 | 3 | 5.9% |
| $50,000 to $74,999 | 7 | 13.7% |
| $75,000 to $99,999 | 3 | 5.9% |
| $100,000 to $149,999 | 2 | 3.9% |
| $150,000 to $199,999 | 8 | 15.7% |
| $200,000+ | 17 | 33.3% |
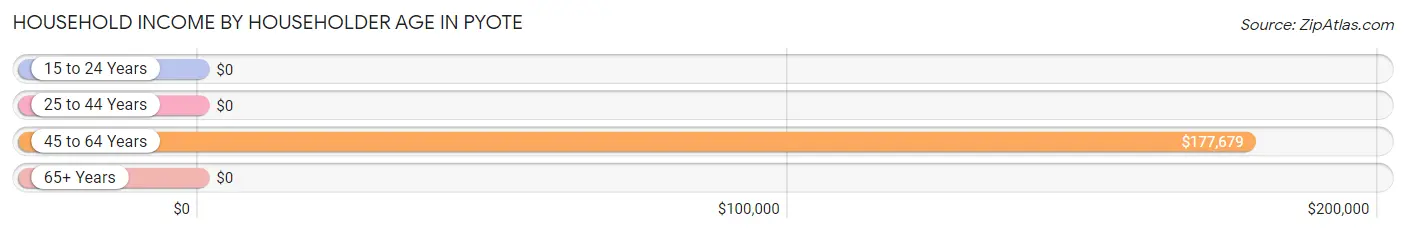
Household Income by Householder Age in Pyote
The median household income in Pyote is $0, with the highest median household income of $177,679 found in the 45 to 64 years age bracket for the primary householder. A total of 15 households (29.4%) fall into this category.
| Income Bracket | # Households | Median Income |
| 15 to 24 Years | 0 (0.0%) | $0 |
| 25 to 44 Years | 25 (49.0%) | $0 |
| 45 to 64 Years | 15 (29.4%) | $177,679 |
| 65+ Years | 11 (21.6%) | $0 |
| Total | 51 (100.0%) | $0 |
Poverty in Pyote
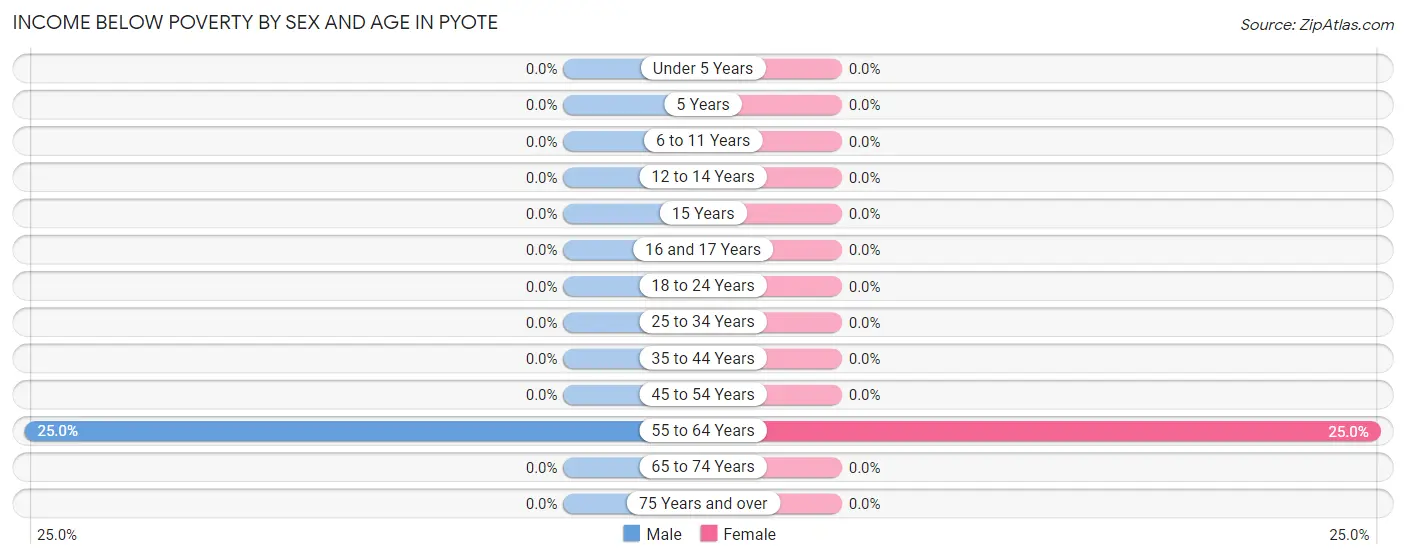
Income Below Poverty by Sex and Age in Pyote
With 2.9% poverty level for males and 4.9% for females among the residents of Pyote, 55 to 64 year old males and 55 to 64 year old females are the most vulnerable to poverty, with 2 males (25.0%) and 3 females (25.0%) in their respective age groups living below the poverty level.
| Age Bracket | Male | Female |
| Under 5 Years | 0 (0.0%) | 0 (0.0%) |
| 5 Years | 0 (0.0%) | 0 (0.0%) |
| 6 to 11 Years | 0 (0.0%) | 0 (0.0%) |
| 12 to 14 Years | 0 (0.0%) | 0 (0.0%) |
| 15 Years | 0 (0.0%) | 0 (0.0%) |
| 16 and 17 Years | 0 (0.0%) | 0 (0.0%) |
| 18 to 24 Years | 0 (0.0%) | 0 (0.0%) |
| 25 to 34 Years | 0 (0.0%) | 0 (0.0%) |
| 35 to 44 Years | 0 (0.0%) | 0 (0.0%) |
| 45 to 54 Years | 0 (0.0%) | 0 (0.0%) |
| 55 to 64 Years | 2 (25.0%) | 3 (25.0%) |
| 65 to 74 Years | 0 (0.0%) | 0 (0.0%) |
| 75 Years and over | 0 (0.0%) | 0 (0.0%) |
| Total | 2 (2.9%) | 3 (4.9%) |
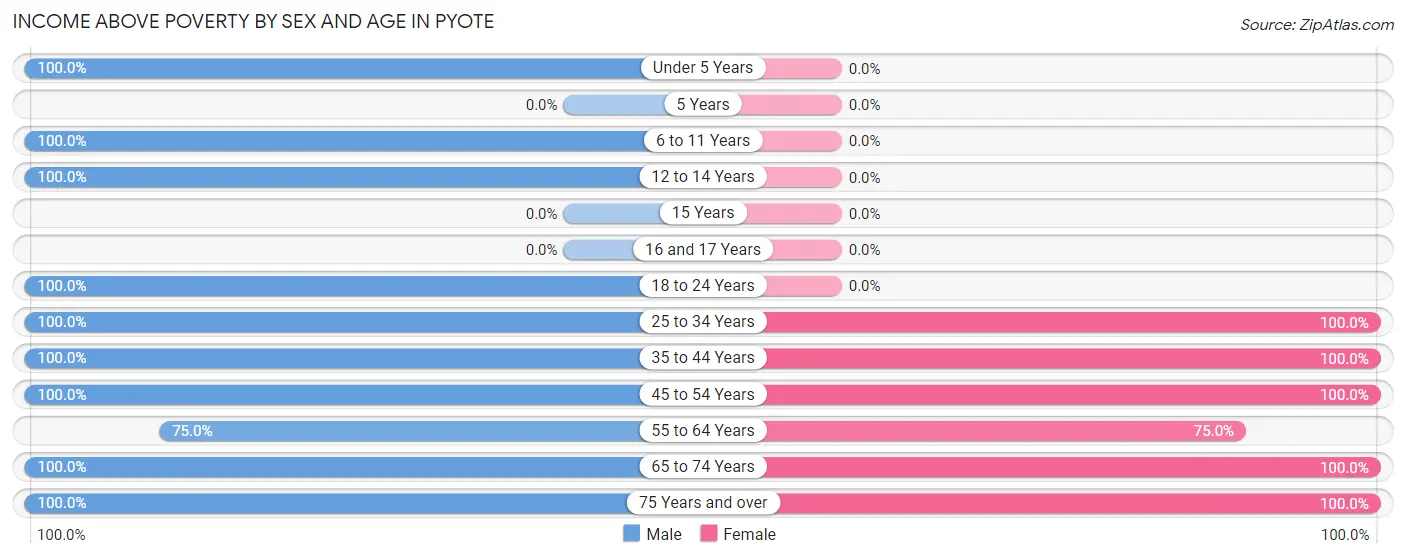
Income Above Poverty by Sex and Age in Pyote
According to the poverty statistics in Pyote, males aged under 5 years and females aged 25 to 34 years are the age groups that are most secure financially, with 100.0% of males and 100.0% of females in these age groups living above the poverty line.
| Age Bracket | Male | Female |
| Under 5 Years | 5 (100.0%) | 0 (0.0%) |
| 5 Years | 0 (0.0%) | 0 (0.0%) |
| 6 to 11 Years | 20 (100.0%) | 0 (0.0%) |
| 12 to 14 Years | 6 (100.0%) | 0 (0.0%) |
| 15 Years | 0 (0.0%) | 0 (0.0%) |
| 16 and 17 Years | 0 (0.0%) | 0 (0.0%) |
| 18 to 24 Years | 4 (100.0%) | 0 (0.0%) |
| 25 to 34 Years | 3 (100.0%) | 12 (100.0%) |
| 35 to 44 Years | 13 (100.0%) | 18 (100.0%) |
| 45 to 54 Years | 2 (100.0%) | 7 (100.0%) |
| 55 to 64 Years | 6 (75.0%) | 9 (75.0%) |
| 65 to 74 Years | 1 (100.0%) | 6 (100.0%) |
| 75 Years and over | 7 (100.0%) | 6 (100.0%) |
| Total | 67 (97.1%) | 58 (95.1%) |
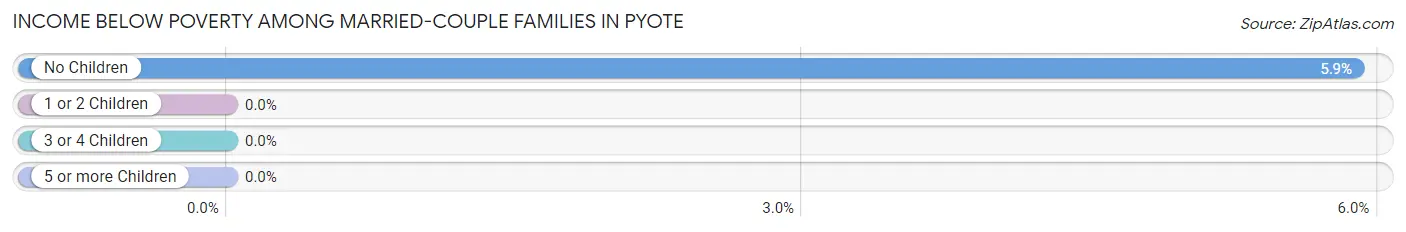
Income Below Poverty Among Married-Couple Families in Pyote
The poverty statistics for married-couple families in Pyote show that 5.4% or 2 of the total 37 families live below the poverty line. Families with no children have the highest poverty rate of 5.9%, comprising of 2 families. On the other hand, families with 3 or 4 children have the lowest poverty rate of 0.0%, which includes 0 families.
| Children | Above Poverty | Below Poverty |
| No Children | 32 (94.1%) | 2 (5.9%) |
| 1 or 2 Children | 0 (0.0%) | 0 (0.0%) |
| 3 or 4 Children | 3 (100.0%) | 0 (0.0%) |
| 5 or more Children | 0 (0.0%) | 0 (0.0%) |
| Total | 35 (94.6%) | 2 (5.4%) |
Income Below Poverty Among Single-Parent Households in Pyote
| Children | Single Father | Single Mother |
| No Children | 0 (0.0%) | 0 (0.0%) |
| 1 or 2 Children | 0 (0.0%) | 0 (0.0%) |
| 3 or 4 Children | 0 (0.0%) | 0 (0.0%) |
| 5 or more Children | 0 (0.0%) | 0 (0.0%) |
| Total | 0 (0.0%) | 0 (0.0%) |
Income Below Poverty Among Married-Couple vs Single-Parent Households in Pyote
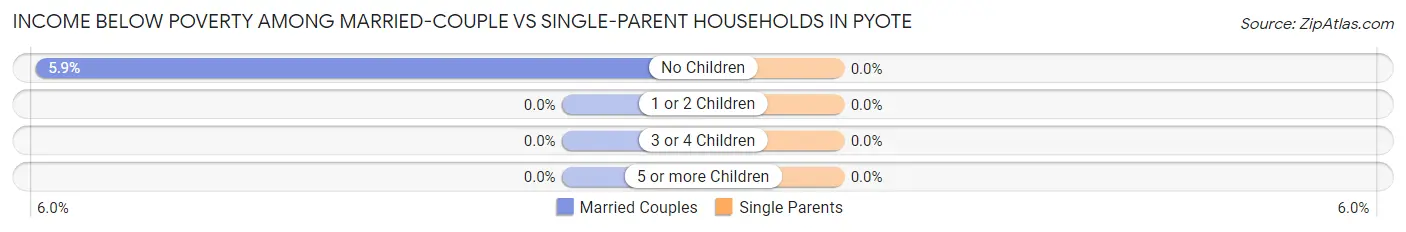
| Children | Married-Couple Families | Single-Parent Households |
| No Children | 2 (5.9%) | 0 (0.0%) |
| 1 or 2 Children | 0 (0.0%) | 0 (0.0%) |
| 3 or 4 Children | 0 (0.0%) | 0 (0.0%) |
| 5 or more Children | 0 (0.0%) | 0 (0.0%) |
| Total | 2 (5.4%) | 0 (0.0%) |
Race in Pyote
The most populous races in Pyote are White / Caucasian (120 | 92.3%), Hispanic or Latino (27 | 20.8%), and Some other Race (10 | 7.7%).
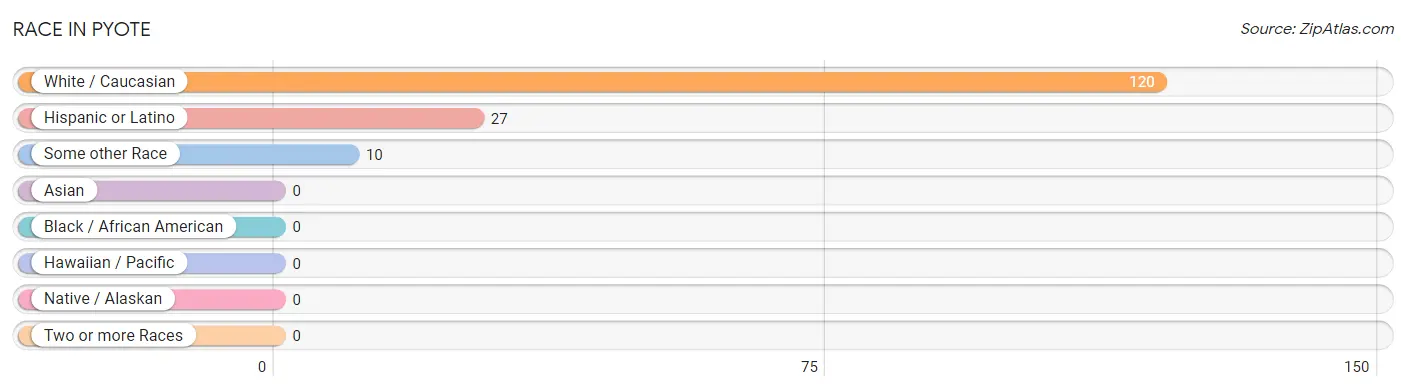
| Race | # Population | % Population |
| Asian | 0 | 0.0% |
| Black / African American | 0 | 0.0% |
| Hawaiian / Pacific | 0 | 0.0% |
| Hispanic or Latino | 27 | 20.8% |
| Native / Alaskan | 0 | 0.0% |
| White / Caucasian | 120 | 92.3% |
| Two or more Races | 0 | 0.0% |
| Some other Race | 10 | 7.7% |
| Total | 130 | 100.0% |
Ancestry in Pyote
The most populous ancestries reported in Pyote are Mexican (27 | 20.8%), and American (1 | 0.8%), together accounting for 21.5% of all Pyote residents.
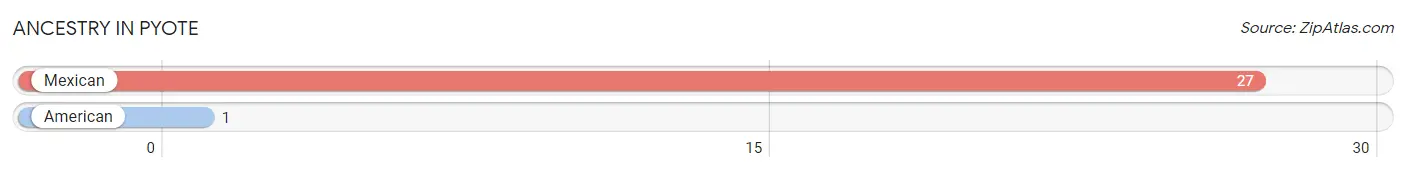
| Ancestry | # Population | % Population |
| American | 1 | 0.8% |
| Mexican | 27 | 20.8% | View All 2 Rows |
Immigrants in Pyote
The most numerous immigrant groups reported in Pyote came from Central America (7 | 5.4%), Latin America (7 | 5.4%), and Mexico (7 | 5.4%), together accounting for 16.1% of all Pyote residents.
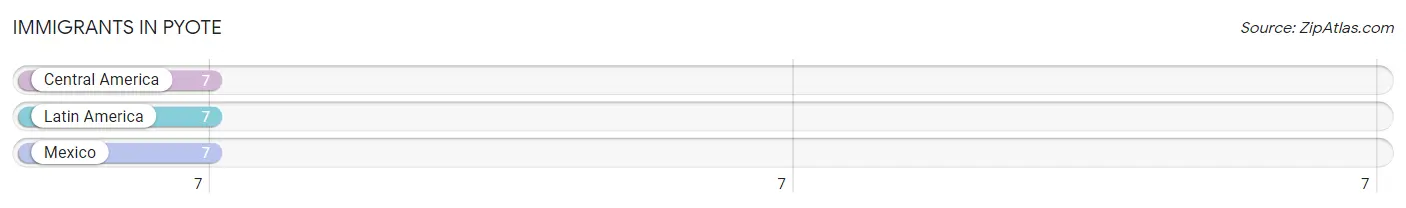
| Immigration Origin | # Population | % Population |
| Central America | 7 | 5.4% |
| Latin America | 7 | 5.4% |
| Mexico | 7 | 5.4% | View All 3 Rows |
Sex and Age in Pyote
Sex and Age in Pyote
The most populous age groups in Pyote are 5 to 9 Years (20 | 29.0%) for men and 35 to 39 Years (18 | 29.5%) for women.
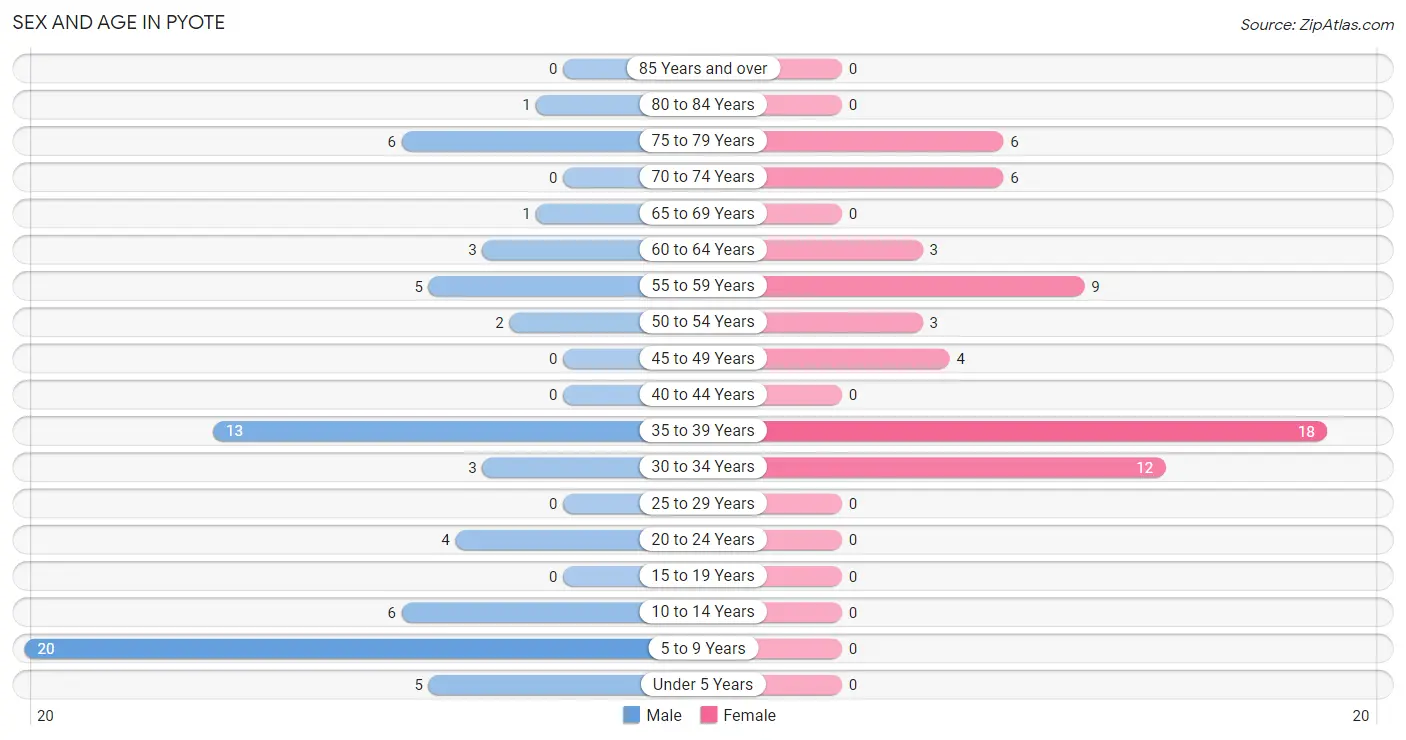
| Age Bracket | Male | Female |
| Under 5 Years | 5 (7.2%) | 0 (0.0%) |
| 5 to 9 Years | 20 (29.0%) | 0 (0.0%) |
| 10 to 14 Years | 6 (8.7%) | 0 (0.0%) |
| 15 to 19 Years | 0 (0.0%) | 0 (0.0%) |
| 20 to 24 Years | 4 (5.8%) | 0 (0.0%) |
| 25 to 29 Years | 0 (0.0%) | 0 (0.0%) |
| 30 to 34 Years | 3 (4.3%) | 12 (19.7%) |
| 35 to 39 Years | 13 (18.8%) | 18 (29.5%) |
| 40 to 44 Years | 0 (0.0%) | 0 (0.0%) |
| 45 to 49 Years | 0 (0.0%) | 4 (6.6%) |
| 50 to 54 Years | 2 (2.9%) | 3 (4.9%) |
| 55 to 59 Years | 5 (7.2%) | 9 (14.7%) |
| 60 to 64 Years | 3 (4.3%) | 3 (4.9%) |
| 65 to 69 Years | 1 (1.5%) | 0 (0.0%) |
| 70 to 74 Years | 0 (0.0%) | 6 (9.8%) |
| 75 to 79 Years | 6 (8.7%) | 6 (9.8%) |
| 80 to 84 Years | 1 (1.5%) | 0 (0.0%) |
| 85 Years and over | 0 (0.0%) | 0 (0.0%) |
| Total | 69 (100.0%) | 61 (100.0%) |
Families and Households in Pyote
Median Family Size in Pyote
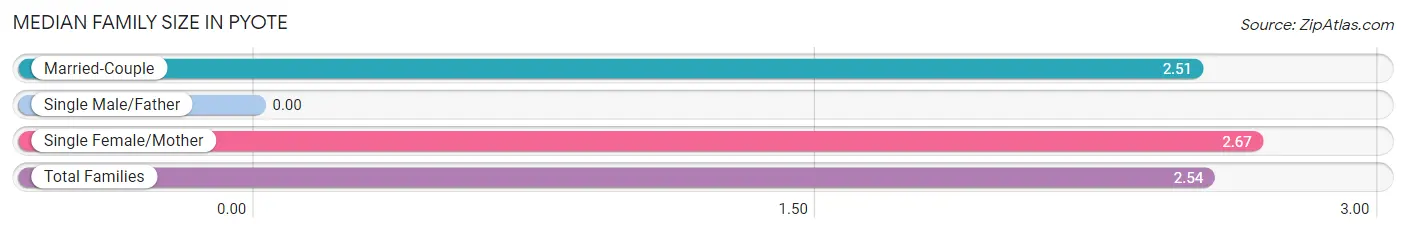
| Family Type | # Families | Family Size |
| Married-Couple | 37 (80.4%) | 2.51 |
| Single Male/Father | 0 (0.0%) | - |
| Single Female/Mother | 9 (19.6%) | 2.67 |
| Total Families | 46 (100.0%) | 2.54 |
Median Household Size in Pyote
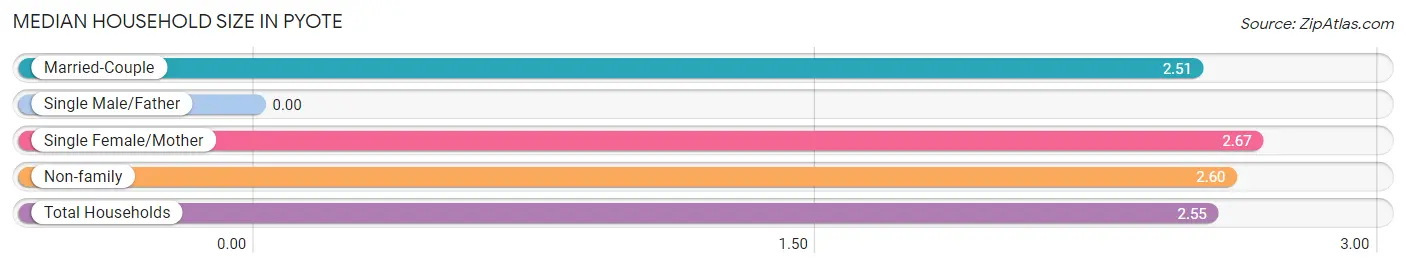
| Household Type | # Households | Household Size |
| Married-Couple | 37 (72.6%) | 2.51 |
| Single Male/Father | 0 (0.0%) | - |
| Single Female/Mother | 9 (17.6%) | 2.67 |
| Non-family | 5 (9.8%) | 2.60 |
| Total Households | 51 (100.0%) | 2.55 |
Household Size by Marriage Status in Pyote
Out of a total of 51 households in Pyote, 46 (90.2%) are family households, while 5 (9.8%) are nonfamily households. The most numerous type of family households are 2-person households, comprising 43, and the most common type of nonfamily households are 2-person households, comprising 3.
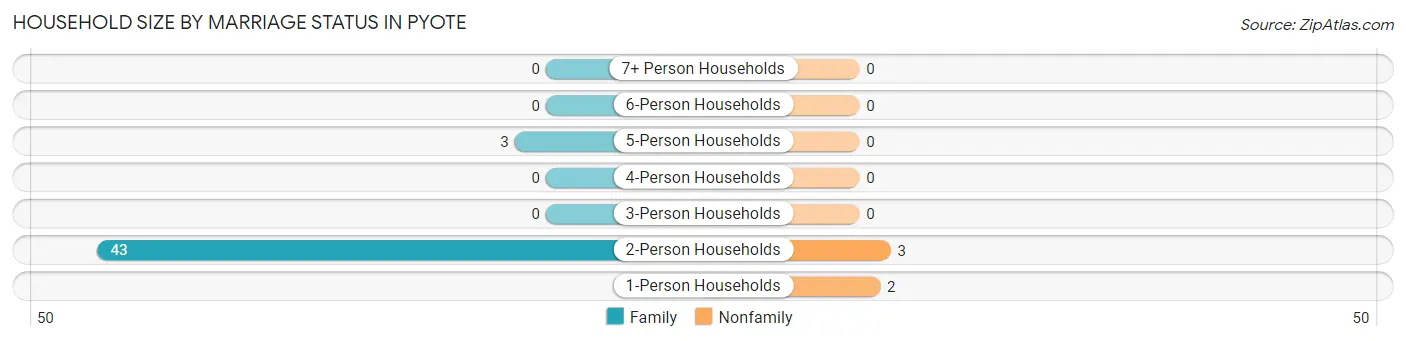
| Household Size | Family Households | Nonfamily Households |
| 1-Person Households | - | 2 (3.9%) |
| 2-Person Households | 43 (84.3%) | 3 (5.9%) |
| 3-Person Households | 0 (0.0%) | 0 (0.0%) |
| 4-Person Households | 0 (0.0%) | 0 (0.0%) |
| 5-Person Households | 3 (5.9%) | 0 (0.0%) |
| 6-Person Households | 0 (0.0%) | 0 (0.0%) |
| 7+ Person Households | 0 (0.0%) | 0 (0.0%) |
| Total | 46 (90.2%) | 5 (9.8%) |
Female Fertility in Pyote
Fertility by Age in Pyote
| Age Bracket | Women with Births | Births / 1,000 Women |
| 15 to 19 years | 0 (0.0%) | 0.0 |
| 20 to 34 years | 0 (0.0%) | 0.0 |
| 35 to 50 years | 0 (0.0%) | 0.0 |
| Total | 0 (0.0%) | 0.0 |
Fertility by Age by Marriage Status in Pyote
| Age Bracket | Married | Unmarried |
| 15 to 19 years | 0 (0.0%) | 0 (0.0%) |
| 20 to 34 years | 0 (0.0%) | 0 (0.0%) |
| 35 to 50 years | 0 (0.0%) | 0 (0.0%) |
| Total | 0 (0.0%) | 0 (0.0%) |
Fertility by Education in Pyote
| Educational Attainment | Women with Births | Births / 1,000 Women |
| Less than High School | 0 (0.0%) | 0.0 |
| High School Diploma | 0 (0.0%) | 0.0 |
| College or Associate's Degree | 0 (0.0%) | 0.0 |
| Bachelor's Degree | 0 (0.0%) | 0.0 |
| Graduate Degree | 0 (0.0%) | 0.0 |
| Total | 0 (0.0%) | 0.0 |
Fertility by Education by Marriage Status in Pyote
| Educational Attainment | Married | Unmarried |
| Less than High School | 0 (0.0%) | 0 (0.0%) |
| High School Diploma | 0 (0.0%) | 0 (0.0%) |
| College or Associate's Degree | 0 (0.0%) | 0 (0.0%) |
| Bachelor's Degree | 0 (0.0%) | 0 (0.0%) |
| Graduate Degree | 0 (0.0%) | 0 (0.0%) |
| Total | 0 (0.0%) | 0 (0.0%) |
Employment Characteristics in Pyote
Employment by Class of Employer in Pyote
Among the 69 employed individuals in Pyote, private company employees (41 | 59.4%), state government employees (18 | 26.1%), and local government employees (5 | 7.2%) make up the most common classes of employment.
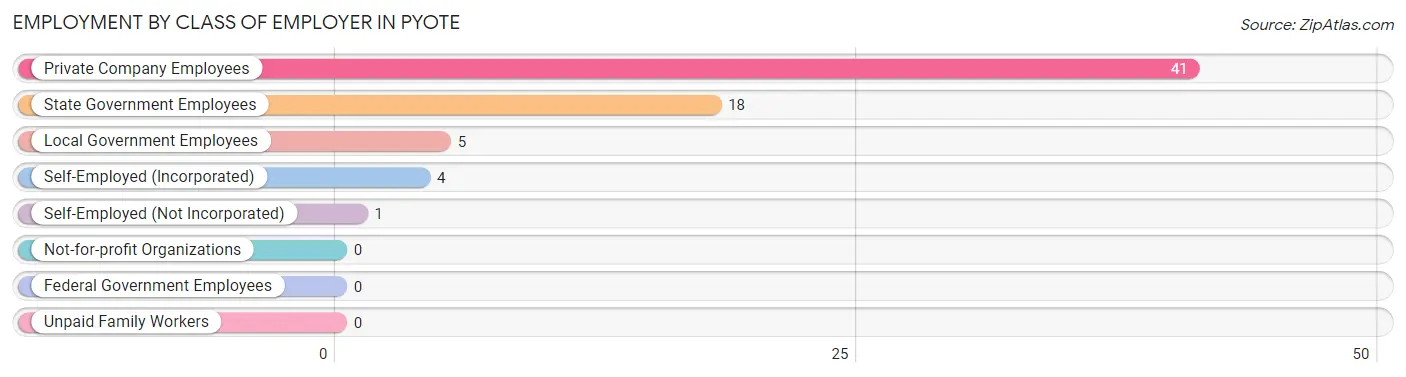
| Employer Class | # Employees | % Employees |
| Private Company Employees | 41 | 59.4% |
| Self-Employed (Incorporated) | 4 | 5.8% |
| Self-Employed (Not Incorporated) | 1 | 1.5% |
| Not-for-profit Organizations | 0 | 0.0% |
| Local Government Employees | 5 | 7.2% |
| State Government Employees | 18 | 26.1% |
| Federal Government Employees | 0 | 0.0% |
| Unpaid Family Workers | 0 | 0.0% |
| Total | 69 | 100.0% |
Employment Status by Age in Pyote
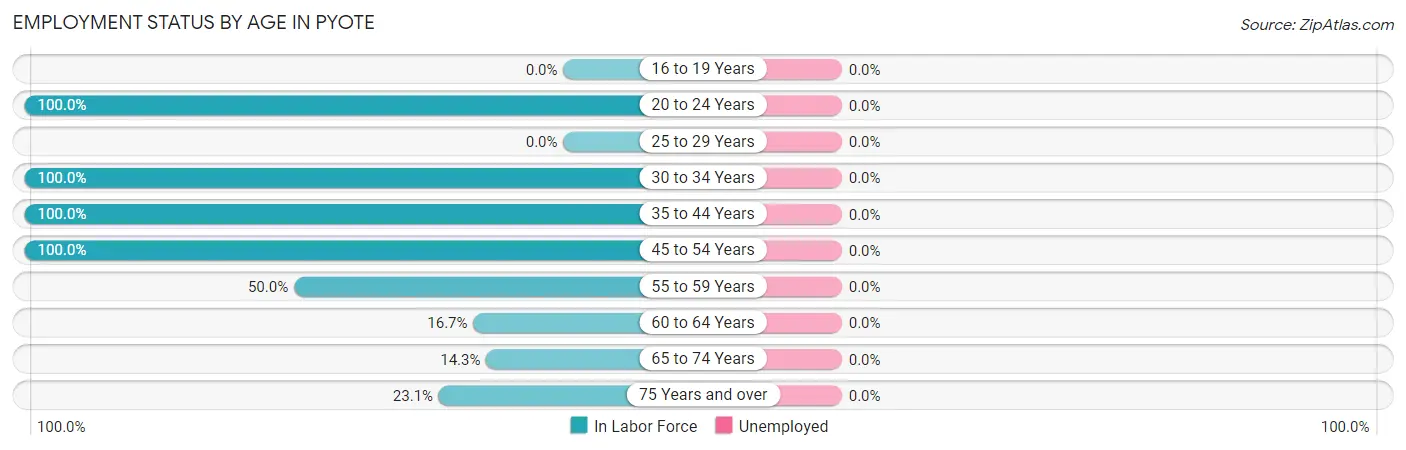
| Age Bracket | In Labor Force | Unemployed |
| 16 to 19 Years | 0 (0.0%) | 0 (0.0%) |
| 20 to 24 Years | 4 (100.0%) | 0 (0.0%) |
| 25 to 29 Years | 0 (0.0%) | 0 (0.0%) |
| 30 to 34 Years | 15 (100.0%) | 0 (0.0%) |
| 35 to 44 Years | 31 (100.0%) | 0 (0.0%) |
| 45 to 54 Years | 9 (100.0%) | 0 (0.0%) |
| 55 to 59 Years | 7 (50.0%) | 0 (0.0%) |
| 60 to 64 Years | 1 (16.7%) | 0 (0.0%) |
| 65 to 74 Years | 1 (14.3%) | 0 (0.0%) |
| 75 Years and over | 3 (23.1%) | 0 (0.0%) |
| Total | 71 (71.7%) | 0 (0.0%) |
Employment Status by Educational Attainment in Pyote
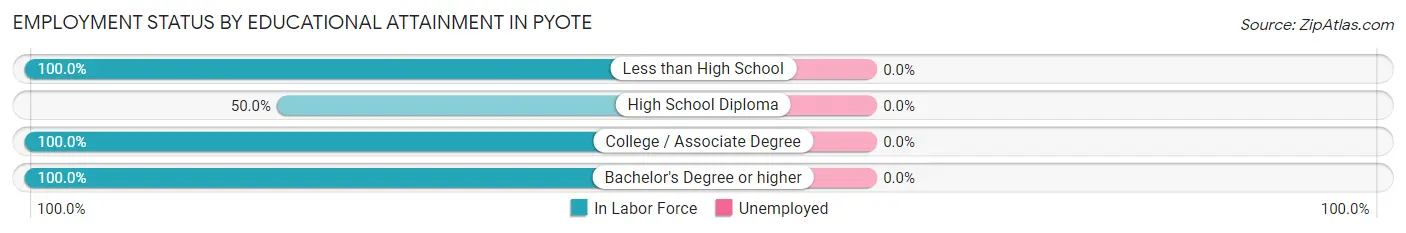
| Educational Attainment | In Labor Force | Unemployed |
| Less than High School | 8 (100.0%) | 0 (0.0%) |
| High School Diploma | 12 (50.0%) | 0 (0.0%) |
| College / Associate Degree | 12 (100.0%) | 0 (0.0%) |
| Bachelor's Degree or higher | 31 (100.0%) | 0 (0.0%) |
| Total | 63 (84.0%) | 0 (0.0%) |
Employment Occupations by Sex in Pyote
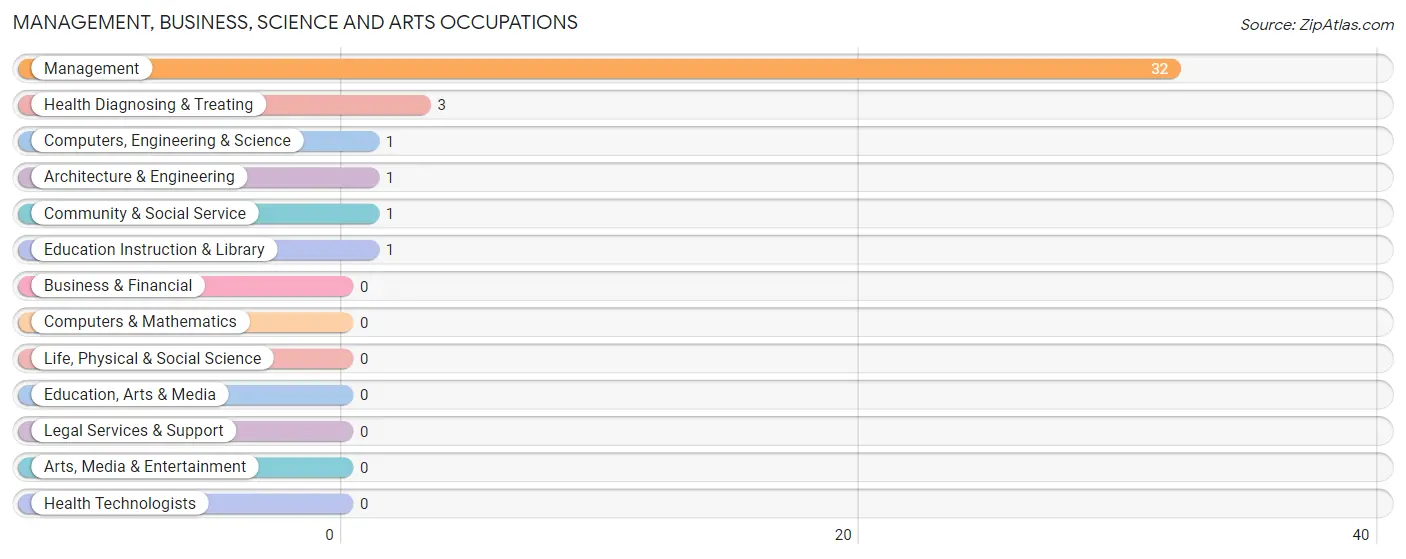
Management, Business, Science and Arts Occupations
The most common Management, Business, Science and Arts occupations in Pyote are Management (32 | 45.1%), Health Diagnosing & Treating (3 | 4.2%), Computers, Engineering & Science (1 | 1.4%), Architecture & Engineering (1 | 1.4%), and Community & Social Service (1 | 1.4%).
Management, Business, Science and Arts Occupations by Sex
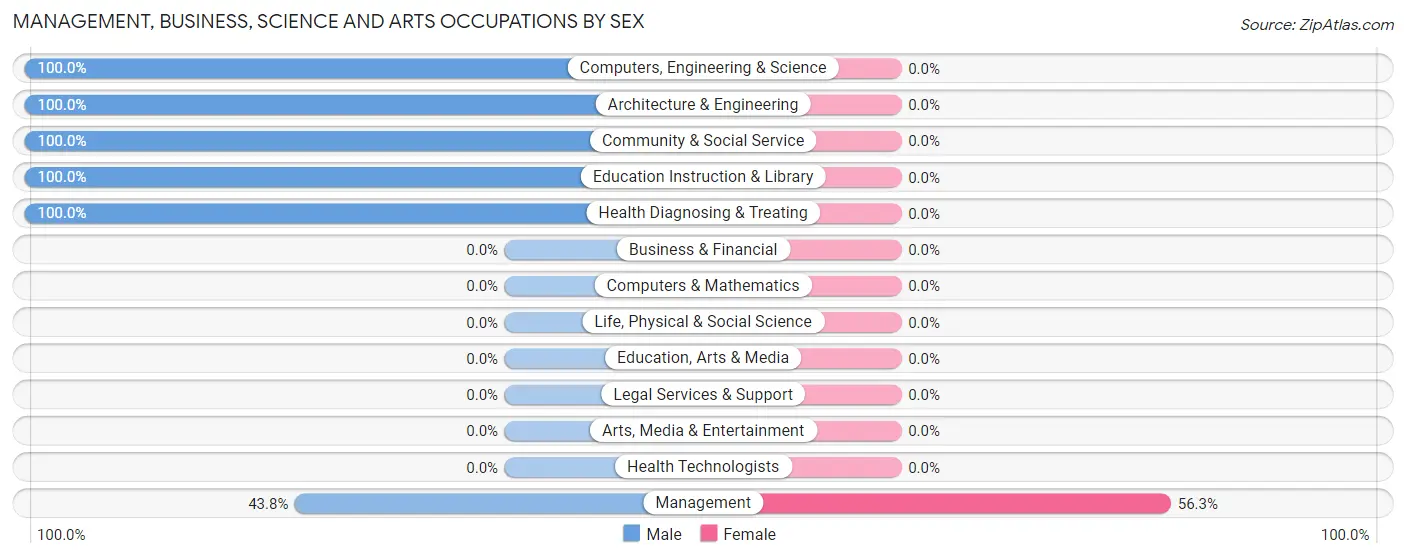
| Occupation | Male | Female |
| Management | 14 (43.8%) | 18 (56.2%) |
| Business & Financial | 0 (0.0%) | 0 (0.0%) |
| Computers, Engineering & Science | 1 (100.0%) | 0 (0.0%) |
| Computers & Mathematics | 0 (0.0%) | 0 (0.0%) |
| Architecture & Engineering | 1 (100.0%) | 0 (0.0%) |
| Life, Physical & Social Science | 0 (0.0%) | 0 (0.0%) |
| Community & Social Service | 1 (100.0%) | 0 (0.0%) |
| Education, Arts & Media | 0 (0.0%) | 0 (0.0%) |
| Legal Services & Support | 0 (0.0%) | 0 (0.0%) |
| Education Instruction & Library | 1 (100.0%) | 0 (0.0%) |
| Arts, Media & Entertainment | 0 (0.0%) | 0 (0.0%) |
| Health Diagnosing & Treating | 3 (100.0%) | 0 (0.0%) |
| Health Technologists | 0 (0.0%) | 0 (0.0%) |
| Total (Category) | 19 (51.3%) | 18 (48.6%) |
| Total (Overall) | 32 (45.1%) | 39 (54.9%) |
Services Occupations
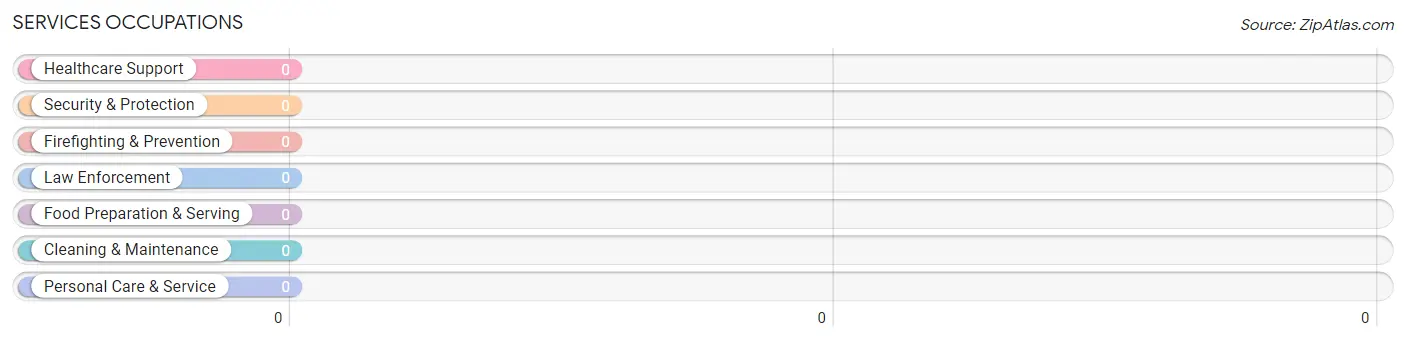
Services Occupations by Sex
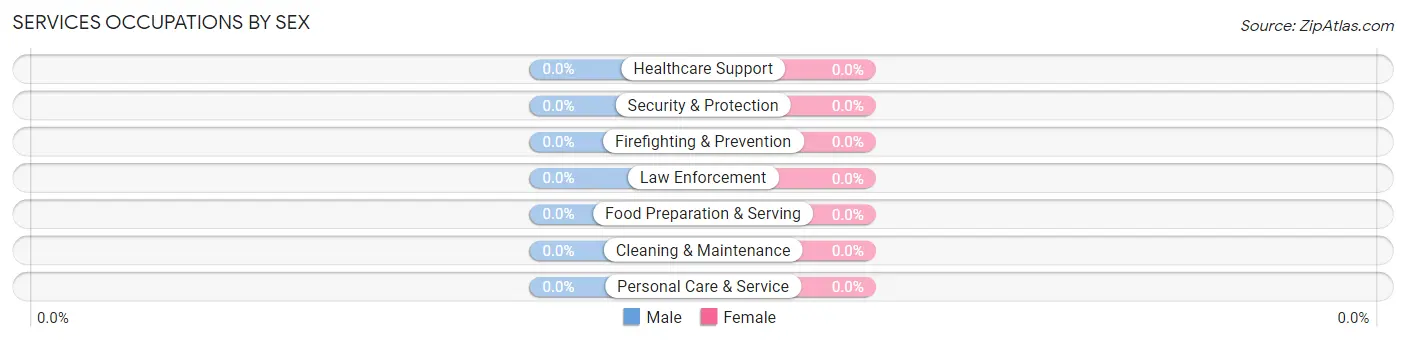
| Occupation | Male | Female |
| Healthcare Support | 0 (0.0%) | 0 (0.0%) |
| Security & Protection | 0 (0.0%) | 0 (0.0%) |
| Firefighting & Prevention | 0 (0.0%) | 0 (0.0%) |
| Law Enforcement | 0 (0.0%) | 0 (0.0%) |
| Food Preparation & Serving | 0 (0.0%) | 0 (0.0%) |
| Cleaning & Maintenance | 0 (0.0%) | 0 (0.0%) |
| Personal Care & Service | 0 (0.0%) | 0 (0.0%) |
| Total (Category) | 0 (0.0%) | 0 (0.0%) |
| Total (Overall) | 32 (45.1%) | 39 (54.9%) |
Sales and Office Occupations
The most common Sales and Office occupations in Pyote are Sales & Related (11 | 15.5%), and Office & Administration (8 | 11.3%).
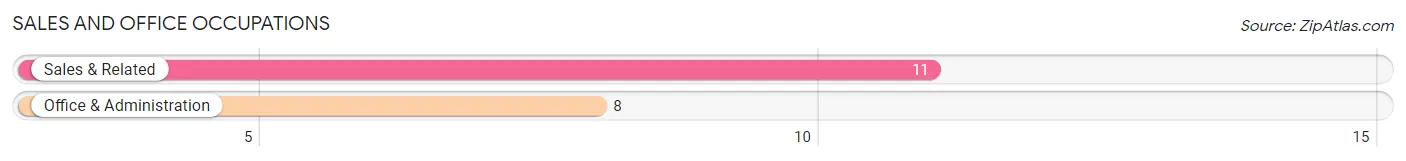
Sales and Office Occupations by Sex
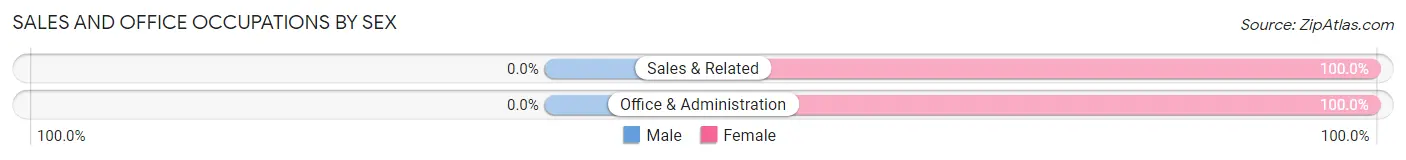
| Occupation | Male | Female |
| Sales & Related | 0 (0.0%) | 11 (100.0%) |
| Office & Administration | 0 (0.0%) | 8 (100.0%) |
| Total (Category) | 0 (0.0%) | 19 (100.0%) |
| Total (Overall) | 32 (45.1%) | 39 (54.9%) |
Natural Resources, Construction and Maintenance Occupations
The most common Natural Resources, Construction and Maintenance occupations in Pyote are Installation, Maintenance & Repair (7 | 9.9%), and Construction & Extraction (2 | 2.8%).
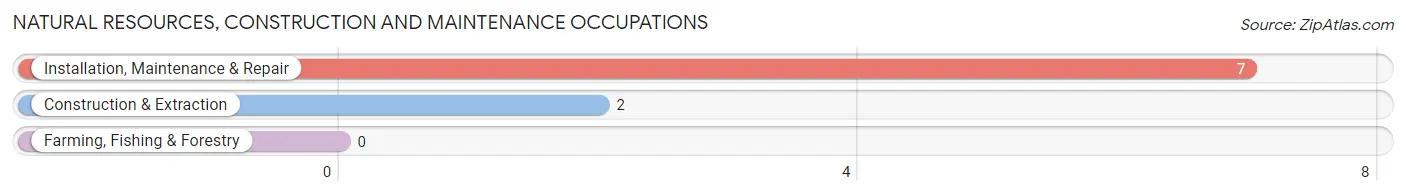
Natural Resources, Construction and Maintenance Occupations by Sex
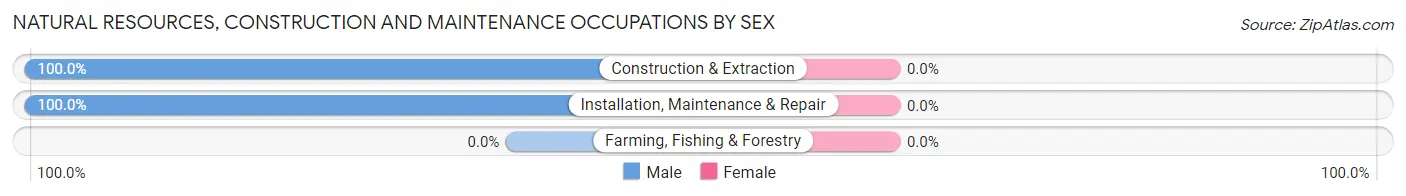
| Occupation | Male | Female |
| Farming, Fishing & Forestry | 0 (0.0%) | 0 (0.0%) |
| Construction & Extraction | 2 (100.0%) | 0 (0.0%) |
| Installation, Maintenance & Repair | 7 (100.0%) | 0 (0.0%) |
| Total (Category) | 9 (100.0%) | 0 (0.0%) |
| Total (Overall) | 32 (45.1%) | 39 (54.9%) |
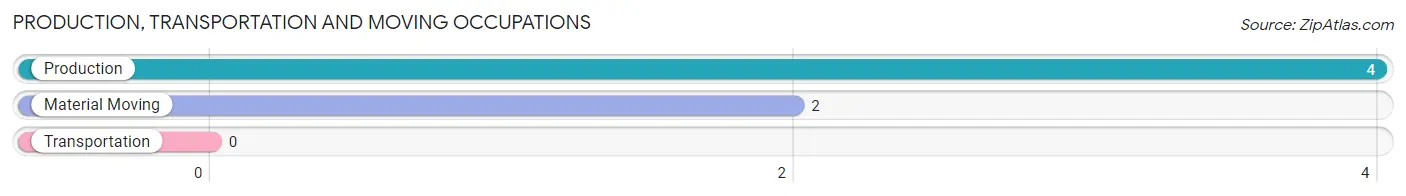
Production, Transportation and Moving Occupations
The most common Production, Transportation and Moving occupations in Pyote are Production (4 | 5.6%), and Material Moving (2 | 2.8%).
Production, Transportation and Moving Occupations by Sex
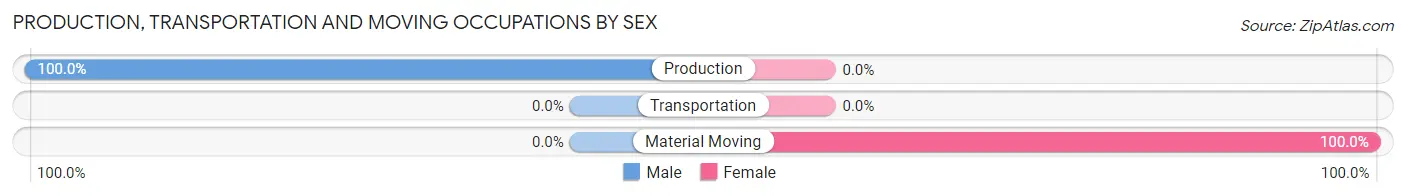
| Occupation | Male | Female |
| Production | 4 (100.0%) | 0 (0.0%) |
| Transportation | 0 (0.0%) | 0 (0.0%) |
| Material Moving | 0 (0.0%) | 2 (100.0%) |
| Total (Category) | 4 (66.7%) | 2 (33.3%) |
| Total (Overall) | 32 (45.1%) | 39 (54.9%) |
Employment Industries by Sex in Pyote
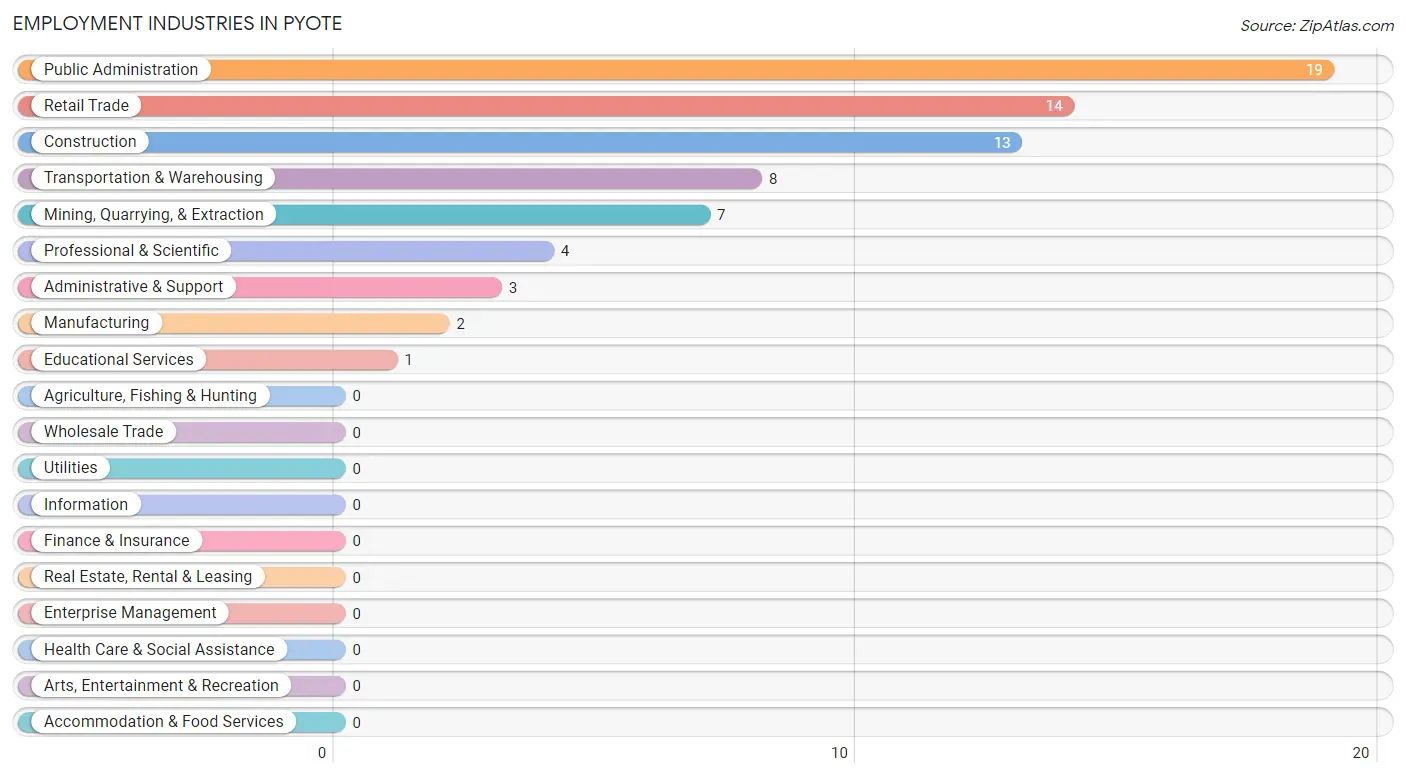
Employment Industries in Pyote
The major employment industries in Pyote include Public Administration (19 | 26.8%), Retail Trade (14 | 19.7%), Construction (13 | 18.3%), Transportation & Warehousing (8 | 11.3%), and Mining, Quarrying, & Extraction (7 | 9.9%).
Employment Industries by Sex in Pyote
The Pyote industries that see more men than women are Mining, Quarrying, & Extraction (100.0%), Construction (100.0%), and Administrative & Support (100.0%), whereas the industries that tend to have a higher number of women are Manufacturing (100.0%), Public Administration (100.0%), and Retail Trade (78.6%).
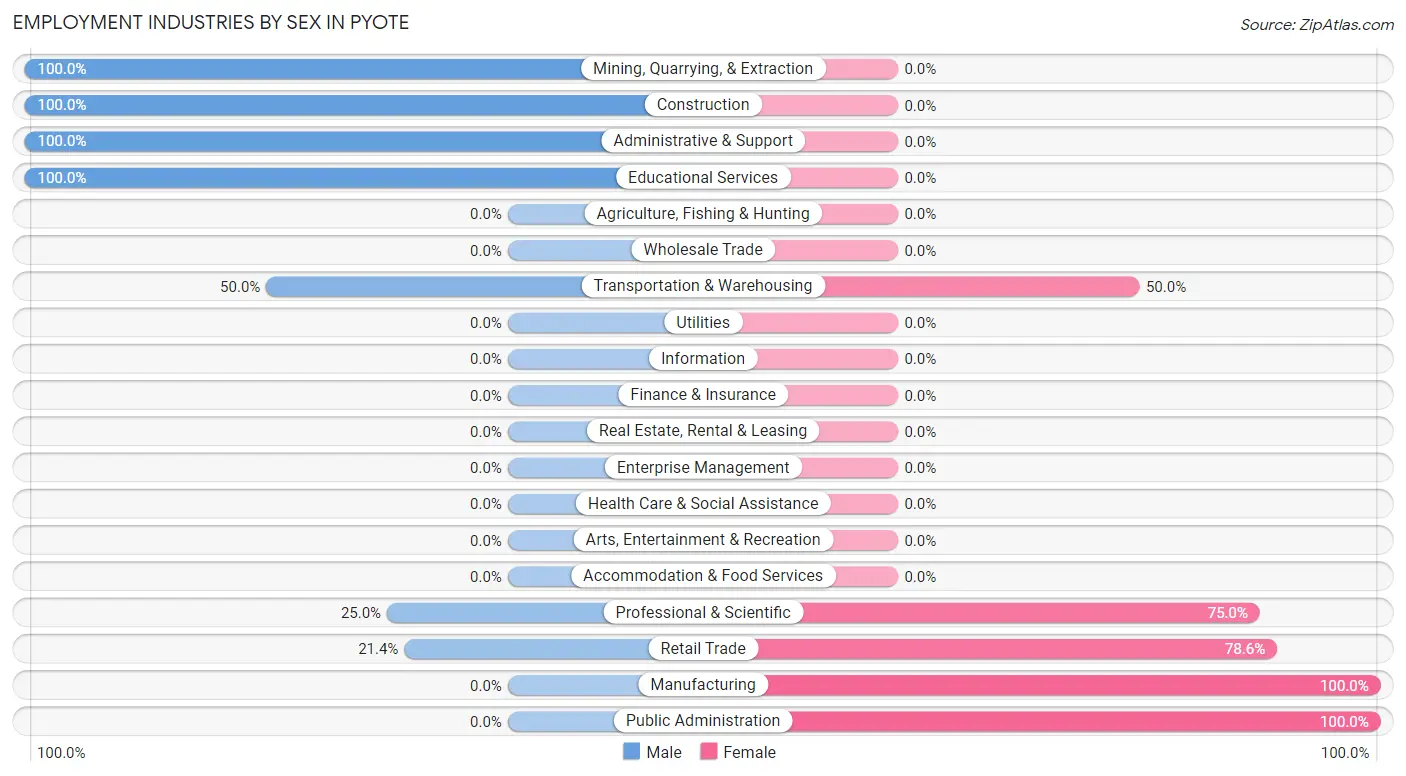
| Industry | Male | Female |
| Agriculture, Fishing & Hunting | 0 (0.0%) | 0 (0.0%) |
| Mining, Quarrying, & Extraction | 7 (100.0%) | 0 (0.0%) |
| Construction | 13 (100.0%) | 0 (0.0%) |
| Manufacturing | 0 (0.0%) | 2 (100.0%) |
| Wholesale Trade | 0 (0.0%) | 0 (0.0%) |
| Retail Trade | 3 (21.4%) | 11 (78.6%) |
| Transportation & Warehousing | 4 (50.0%) | 4 (50.0%) |
| Utilities | 0 (0.0%) | 0 (0.0%) |
| Information | 0 (0.0%) | 0 (0.0%) |
| Finance & Insurance | 0 (0.0%) | 0 (0.0%) |
| Real Estate, Rental & Leasing | 0 (0.0%) | 0 (0.0%) |
| Professional & Scientific | 1 (25.0%) | 3 (75.0%) |
| Enterprise Management | 0 (0.0%) | 0 (0.0%) |
| Administrative & Support | 3 (100.0%) | 0 (0.0%) |
| Educational Services | 1 (100.0%) | 0 (0.0%) |
| Health Care & Social Assistance | 0 (0.0%) | 0 (0.0%) |
| Arts, Entertainment & Recreation | 0 (0.0%) | 0 (0.0%) |
| Accommodation & Food Services | 0 (0.0%) | 0 (0.0%) |
| Public Administration | 0 (0.0%) | 19 (100.0%) |
| Total | 32 (45.1%) | 39 (54.9%) |
Education in Pyote
School Enrollment in Pyote
The most common levels of schooling among the 26 students in Pyote are elementary school (20 | 76.9%), and middle school (6 | 23.1%).
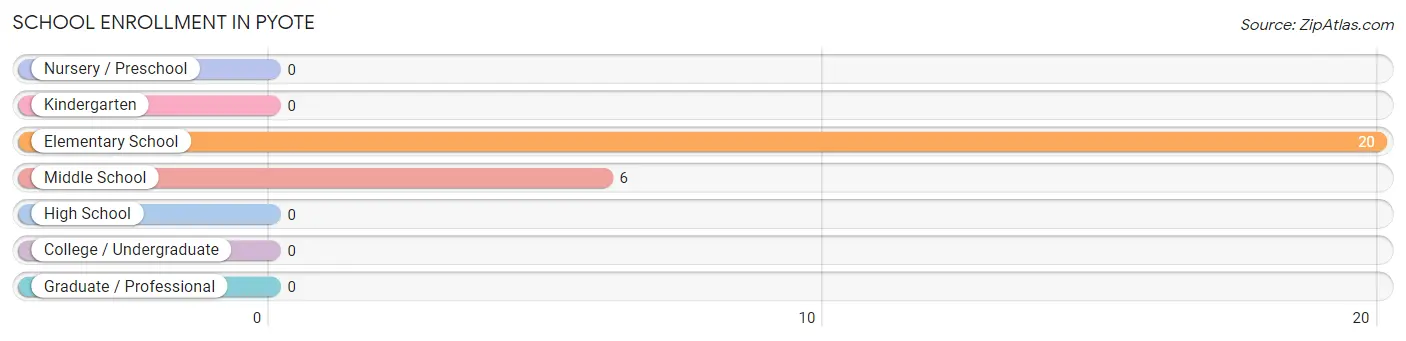
| School Level | # Students | % Students |
| Nursery / Preschool | 0 | 0.0% |
| Kindergarten | 0 | 0.0% |
| Elementary School | 20 | 76.9% |
| Middle School | 6 | 23.1% |
| High School | 0 | 0.0% |
| College / Undergraduate | 0 | 0.0% |
| Graduate / Professional | 0 | 0.0% |
| Total | 26 | 100.0% |
School Enrollment by Age by Funding Source in Pyote
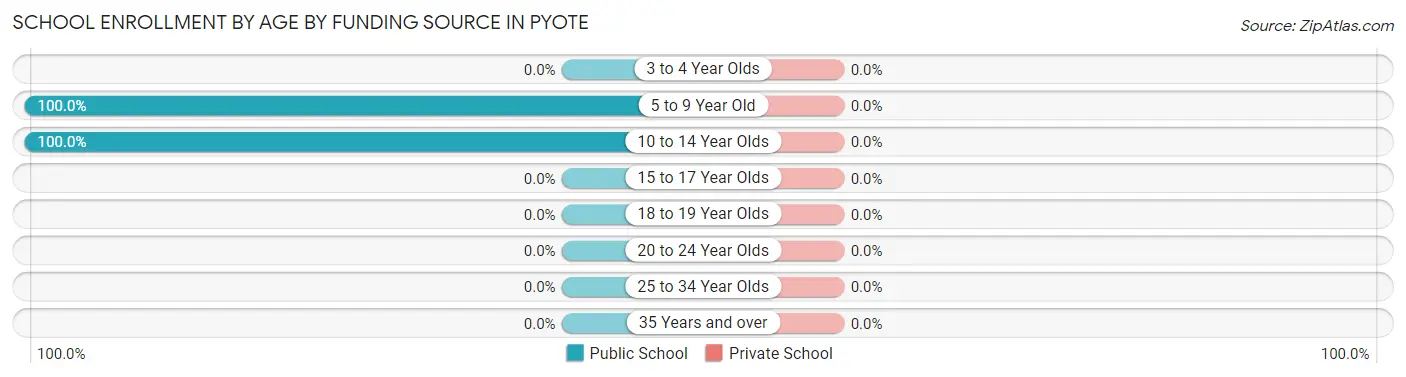
| Age Bracket | Public School | Private School |
| 3 to 4 Year Olds | 0 (0.0%) | 0 (0.0%) |
| 5 to 9 Year Old | 20 (100.0%) | 0 (0.0%) |
| 10 to 14 Year Olds | 6 (100.0%) | 0 (0.0%) |
| 15 to 17 Year Olds | 0 (0.0%) | 0 (0.0%) |
| 18 to 19 Year Olds | 0 (0.0%) | 0 (0.0%) |
| 20 to 24 Year Olds | 0 (0.0%) | 0 (0.0%) |
| 25 to 34 Year Olds | 0 (0.0%) | 0 (0.0%) |
| 35 Years and over | 0 (0.0%) | 0 (0.0%) |
| Total | 26 (100.0%) | 0 (0.0%) |
Educational Attainment by Field of Study in Pyote
Computers & mathematics (18 | 25.4%), physical & health sciences (18 | 25.4%), business (18 | 25.4%), bio, nature & agricultural (16 | 22.5%), and social sciences (1 | 1.4%) are the most common fields of study among 71 individuals in Pyote who have obtained a bachelor's degree or higher.
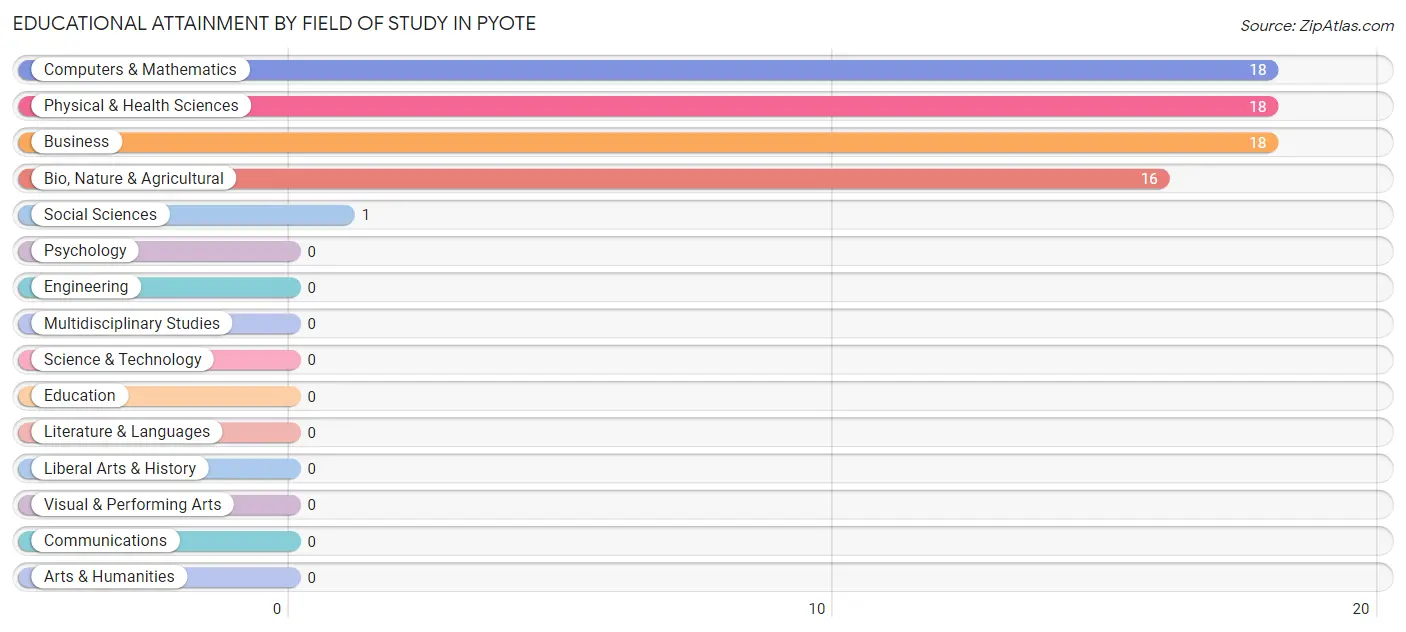
| Field of Study | # Graduates | % Graduates |
| Computers & Mathematics | 18 | 25.4% |
| Bio, Nature & Agricultural | 16 | 22.5% |
| Physical & Health Sciences | 18 | 25.4% |
| Psychology | 0 | 0.0% |
| Social Sciences | 1 | 1.4% |
| Engineering | 0 | 0.0% |
| Multidisciplinary Studies | 0 | 0.0% |
| Science & Technology | 0 | 0.0% |
| Business | 18 | 25.4% |
| Education | 0 | 0.0% |
| Literature & Languages | 0 | 0.0% |
| Liberal Arts & History | 0 | 0.0% |
| Visual & Performing Arts | 0 | 0.0% |
| Communications | 0 | 0.0% |
| Arts & Humanities | 0 | 0.0% |
| Total | 71 | 100.0% |
Transportation & Commute in Pyote
Vehicle Availability by Sex in Pyote
The most prevalent vehicle ownership categories in Pyote are males with 3 vehicles (23, accounting for 71.9%) and females with 3 vehicles (25, making up 62.2%).
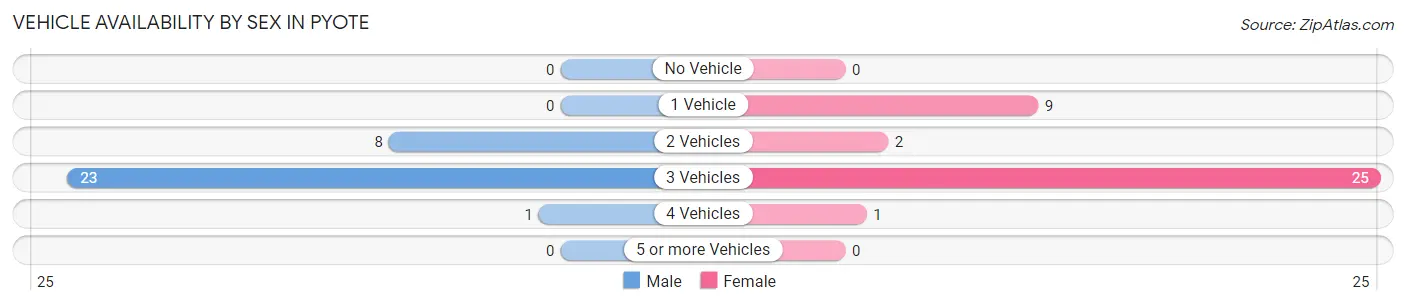
| Vehicles Available | Male | Female |
| No Vehicle | 0 (0.0%) | 0 (0.0%) |
| 1 Vehicle | 0 (0.0%) | 9 (24.3%) |
| 2 Vehicles | 8 (25.0%) | 2 (5.4%) |
| 3 Vehicles | 23 (71.9%) | 25 (67.6%) |
| 4 Vehicles | 1 (3.1%) | 1 (2.7%) |
| 5 or more Vehicles | 0 (0.0%) | 0 (0.0%) |
| Total | 32 (100.0%) | 37 (100.0%) |
Commute Time in Pyote
The most frequently occuring commute durations in Pyote are 60 to 89 minutes (32 commuters, 46.4%), 25 to 29 minutes (12 commuters, 17.4%), and 30 to 34 minutes (7 commuters, 10.1%).
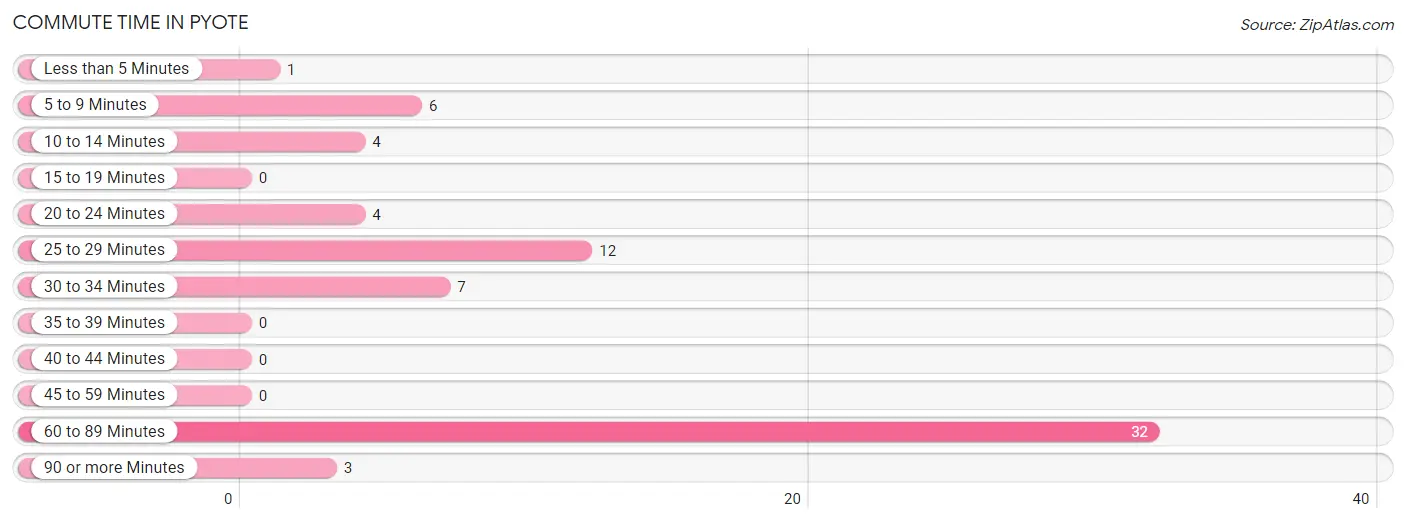
| Commute Time | # Commuters | % Commuters |
| Less than 5 Minutes | 1 | 1.5% |
| 5 to 9 Minutes | 6 | 8.7% |
| 10 to 14 Minutes | 4 | 5.8% |
| 15 to 19 Minutes | 0 | 0.0% |
| 20 to 24 Minutes | 4 | 5.8% |
| 25 to 29 Minutes | 12 | 17.4% |
| 30 to 34 Minutes | 7 | 10.1% |
| 35 to 39 Minutes | 0 | 0.0% |
| 40 to 44 Minutes | 0 | 0.0% |
| 45 to 59 Minutes | 0 | 0.0% |
| 60 to 89 Minutes | 32 | 46.4% |
| 90 or more Minutes | 3 | 4.3% |
Commute Time by Sex in Pyote
The most common commute times in Pyote are 60 to 89 minutes (14 commuters, 43.8%) for males and 60 to 89 minutes (18 commuters, 48.6%) for females.
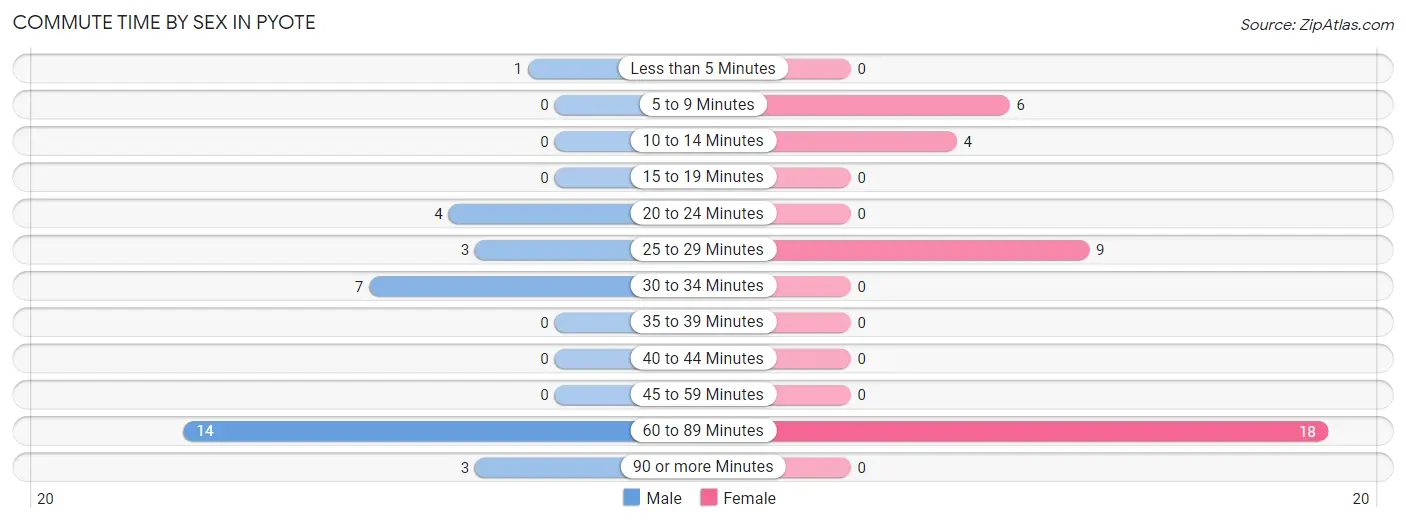
| Commute Time | Male | Female |
| Less than 5 Minutes | 1 (3.1%) | 0 (0.0%) |
| 5 to 9 Minutes | 0 (0.0%) | 6 (16.2%) |
| 10 to 14 Minutes | 0 (0.0%) | 4 (10.8%) |
| 15 to 19 Minutes | 0 (0.0%) | 0 (0.0%) |
| 20 to 24 Minutes | 4 (12.5%) | 0 (0.0%) |
| 25 to 29 Minutes | 3 (9.4%) | 9 (24.3%) |
| 30 to 34 Minutes | 7 (21.9%) | 0 (0.0%) |
| 35 to 39 Minutes | 0 (0.0%) | 0 (0.0%) |
| 40 to 44 Minutes | 0 (0.0%) | 0 (0.0%) |
| 45 to 59 Minutes | 0 (0.0%) | 0 (0.0%) |
| 60 to 89 Minutes | 14 (43.8%) | 18 (48.6%) |
| 90 or more Minutes | 3 (9.4%) | 0 (0.0%) |
Time of Departure to Work by Sex in Pyote
The most frequent times of departure to work in Pyote are 5:00 AM to 5:29 AM (14, 43.8%) for males and 6:00 AM to 6:29 AM (18, 48.6%) for females.
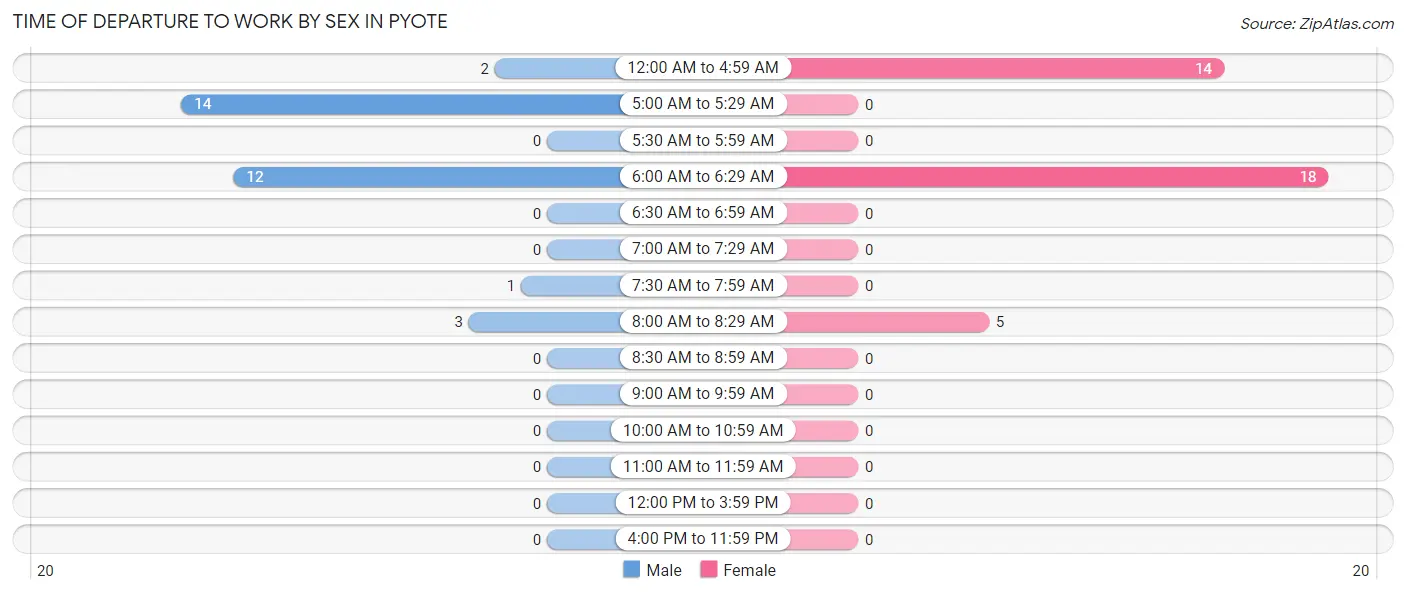
| Time of Departure | Male | Female |
| 12:00 AM to 4:59 AM | 2 (6.2%) | 14 (37.8%) |
| 5:00 AM to 5:29 AM | 14 (43.8%) | 0 (0.0%) |
| 5:30 AM to 5:59 AM | 0 (0.0%) | 0 (0.0%) |
| 6:00 AM to 6:29 AM | 12 (37.5%) | 18 (48.6%) |
| 6:30 AM to 6:59 AM | 0 (0.0%) | 0 (0.0%) |
| 7:00 AM to 7:29 AM | 0 (0.0%) | 0 (0.0%) |
| 7:30 AM to 7:59 AM | 1 (3.1%) | 0 (0.0%) |
| 8:00 AM to 8:29 AM | 3 (9.4%) | 5 (13.5%) |
| 8:30 AM to 8:59 AM | 0 (0.0%) | 0 (0.0%) |
| 9:00 AM to 9:59 AM | 0 (0.0%) | 0 (0.0%) |
| 10:00 AM to 10:59 AM | 0 (0.0%) | 0 (0.0%) |
| 11:00 AM to 11:59 AM | 0 (0.0%) | 0 (0.0%) |
| 12:00 PM to 3:59 PM | 0 (0.0%) | 0 (0.0%) |
| 4:00 PM to 11:59 PM | 0 (0.0%) | 0 (0.0%) |
| Total | 32 (100.0%) | 37 (100.0%) |
Housing Occupancy in Pyote
Occupancy by Ownership in Pyote
Of the total 51 dwellings in Pyote, owner-occupied units account for 42 (82.4%), while renter-occupied units make up 9 (17.6%).
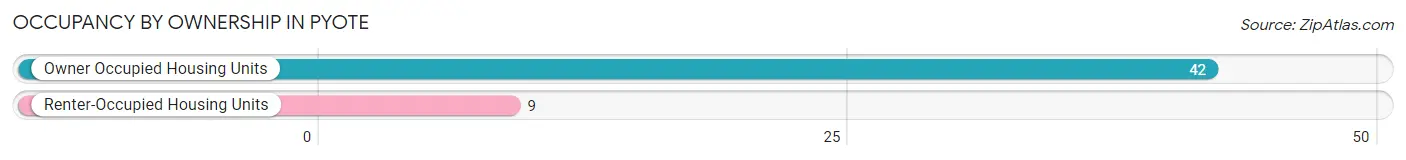
| Occupancy | # Housing Units | % Housing Units |
| Owner Occupied Housing Units | 42 | 82.4% |
| Renter-Occupied Housing Units | 9 | 17.6% |
| Total Occupied Housing Units | 51 | 100.0% |
Occupancy by Household Size in Pyote
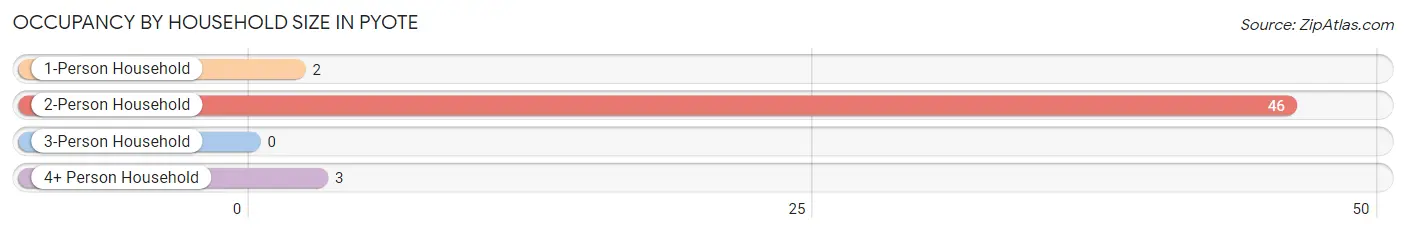
| Household Size | # Housing Units | % Housing Units |
| 1-Person Household | 2 | 3.9% |
| 2-Person Household | 46 | 90.2% |
| 3-Person Household | 0 | 0.0% |
| 4+ Person Household | 3 | 5.9% |
| Total Housing Units | 51 | 100.0% |
Occupancy by Ownership by Household Size in Pyote
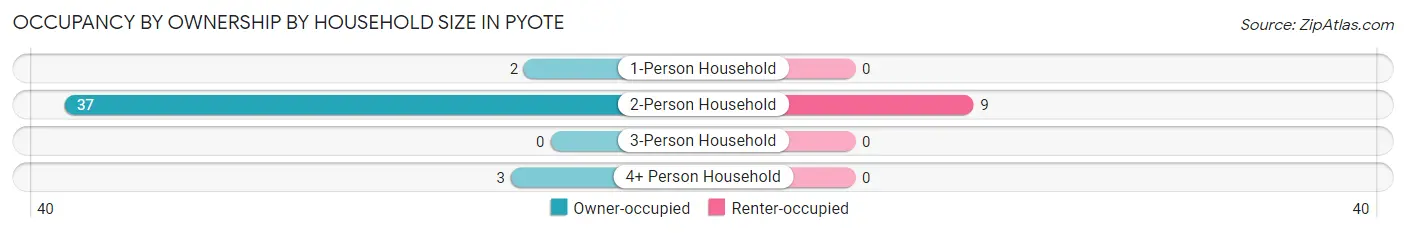
| Household Size | Owner-occupied | Renter-occupied |
| 1-Person Household | 2 (100.0%) | 0 (0.0%) |
| 2-Person Household | 37 (80.4%) | 9 (19.6%) |
| 3-Person Household | 0 (0.0%) | 0 (0.0%) |
| 4+ Person Household | 3 (100.0%) | 0 (0.0%) |
| Total Housing Units | 42 (82.4%) | 9 (17.6%) |
Occupancy by Educational Attainment in Pyote
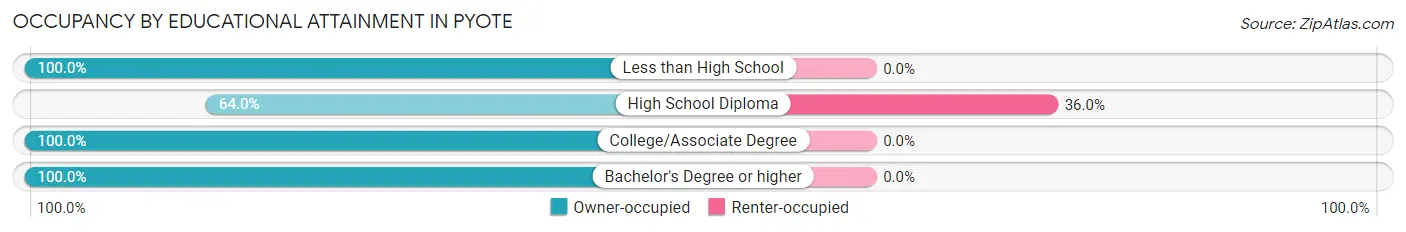
| Household Size | Owner-occupied | Renter-occupied |
| Less than High School | 5 (100.0%) | 0 (0.0%) |
| High School Diploma | 16 (64.0%) | 9 (36.0%) |
| College/Associate Degree | 4 (100.0%) | 0 (0.0%) |
| Bachelor's Degree or higher | 17 (100.0%) | 0 (0.0%) |
Occupancy by Age of Householder in Pyote
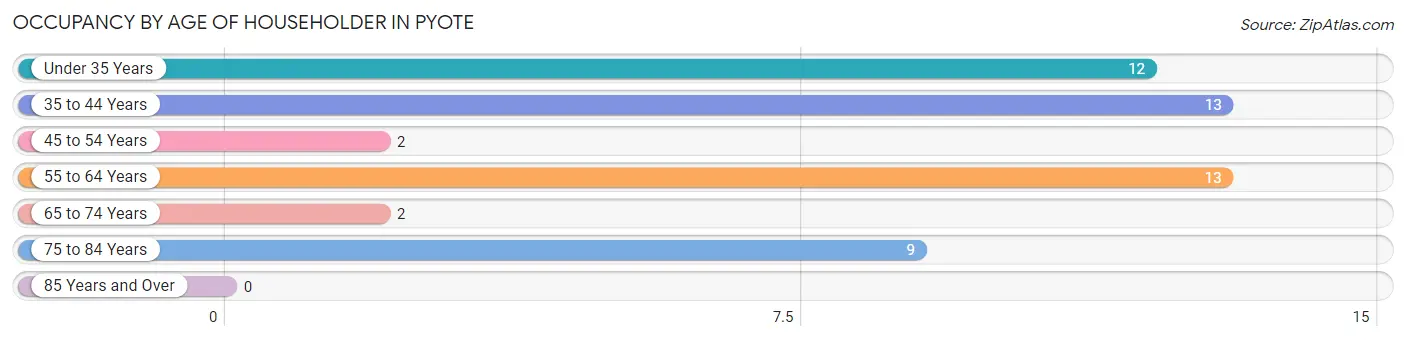
| Age Bracket | # Households | % Households |
| Under 35 Years | 12 | 23.5% |
| 35 to 44 Years | 13 | 25.5% |
| 45 to 54 Years | 2 | 3.9% |
| 55 to 64 Years | 13 | 25.5% |
| 65 to 74 Years | 2 | 3.9% |
| 75 to 84 Years | 9 | 17.6% |
| 85 Years and Over | 0 | 0.0% |
| Total | 51 | 100.0% |
Housing Finances in Pyote
Median Income by Occupancy in Pyote
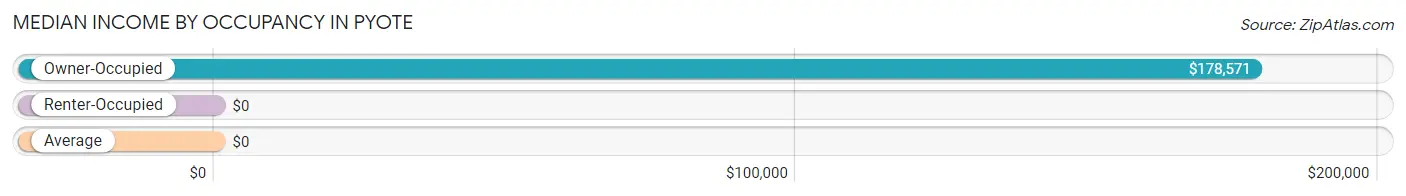
| Occupancy Type | # Households | Median Income |
| Owner-Occupied | 42 (82.4%) | $178,571 |
| Renter-Occupied | 9 (17.6%) | $0 |
| Average | 51 (100.0%) | $0 |
Occupancy by Householder Income Bracket in Pyote
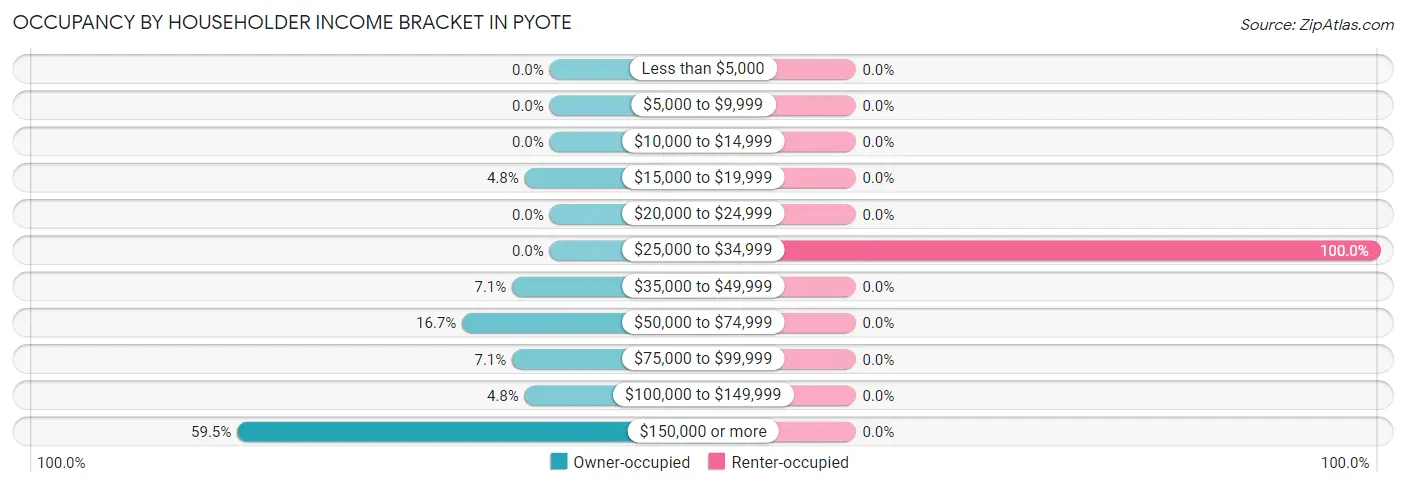
| Income Bracket | Owner-occupied | Renter-occupied |
| Less than $5,000 | 0 (0.0%) | 0 (0.0%) |
| $5,000 to $9,999 | 0 (0.0%) | 0 (0.0%) |
| $10,000 to $14,999 | 0 (0.0%) | 0 (0.0%) |
| $15,000 to $19,999 | 2 (4.8%) | 0 (0.0%) |
| $20,000 to $24,999 | 0 (0.0%) | 0 (0.0%) |
| $25,000 to $34,999 | 0 (0.0%) | 9 (100.0%) |
| $35,000 to $49,999 | 3 (7.1%) | 0 (0.0%) |
| $50,000 to $74,999 | 7 (16.7%) | 0 (0.0%) |
| $75,000 to $99,999 | 3 (7.1%) | 0 (0.0%) |
| $100,000 to $149,999 | 2 (4.8%) | 0 (0.0%) |
| $150,000 or more | 25 (59.5%) | 0 (0.0%) |
| Total | 42 (100.0%) | 9 (100.0%) |
Monthly Housing Cost Tiers in Pyote
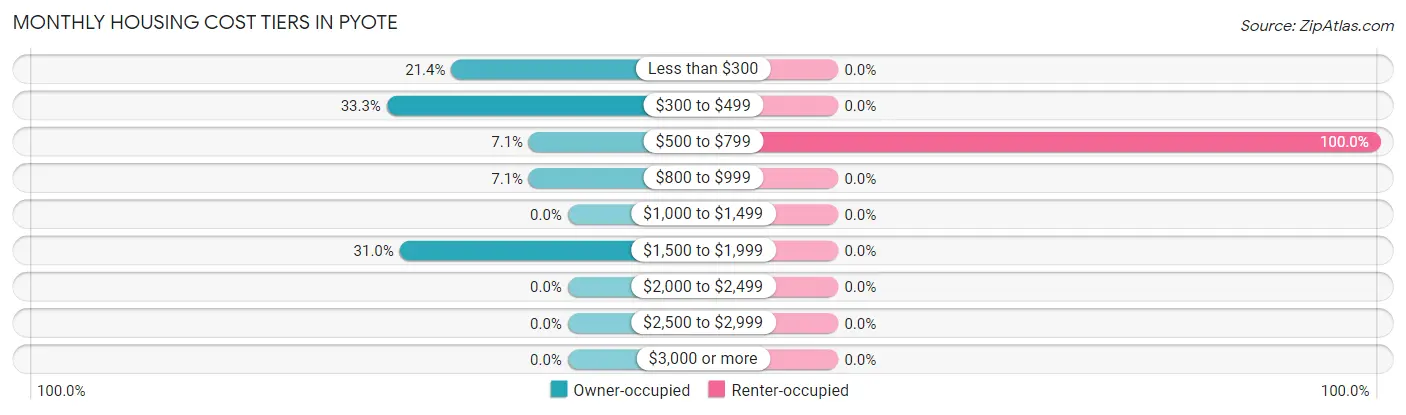
| Monthly Cost | Owner-occupied | Renter-occupied |
| Less than $300 | 9 (21.4%) | 0 (0.0%) |
| $300 to $499 | 14 (33.3%) | 0 (0.0%) |
| $500 to $799 | 3 (7.1%) | 9 (100.0%) |
| $800 to $999 | 3 (7.1%) | 0 (0.0%) |
| $1,000 to $1,499 | 0 (0.0%) | 0 (0.0%) |
| $1,500 to $1,999 | 13 (30.9%) | 0 (0.0%) |
| $2,000 to $2,499 | 0 (0.0%) | 0 (0.0%) |
| $2,500 to $2,999 | 0 (0.0%) | 0 (0.0%) |
| $3,000 or more | 0 (0.0%) | 0 (0.0%) |
| Total | 42 (100.0%) | 9 (100.0%) |
Physical Housing Characteristics in Pyote
Housing Structures in Pyote
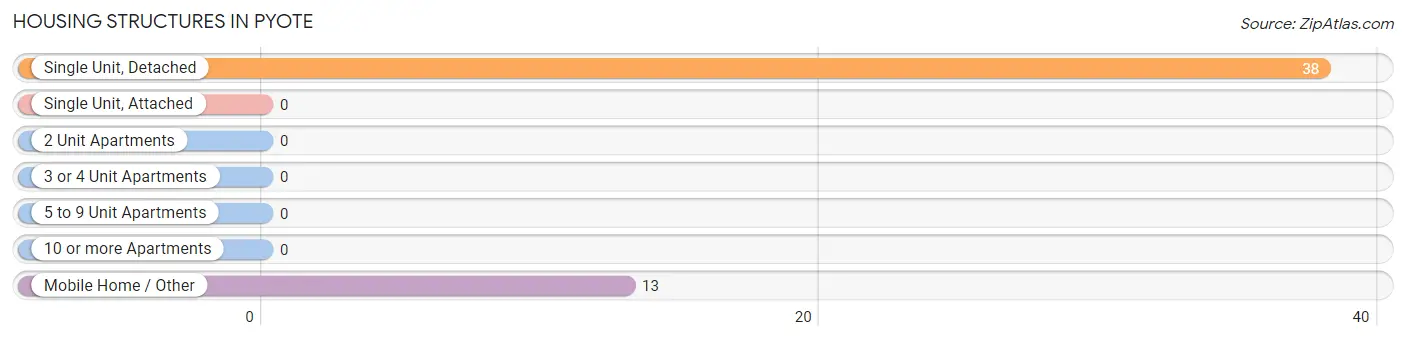
| Structure Type | # Housing Units | % Housing Units |
| Single Unit, Detached | 38 | 74.5% |
| Single Unit, Attached | 0 | 0.0% |
| 2 Unit Apartments | 0 | 0.0% |
| 3 or 4 Unit Apartments | 0 | 0.0% |
| 5 to 9 Unit Apartments | 0 | 0.0% |
| 10 or more Apartments | 0 | 0.0% |
| Mobile Home / Other | 13 | 25.5% |
| Total | 51 | 100.0% |
Housing Structures by Occupancy in Pyote
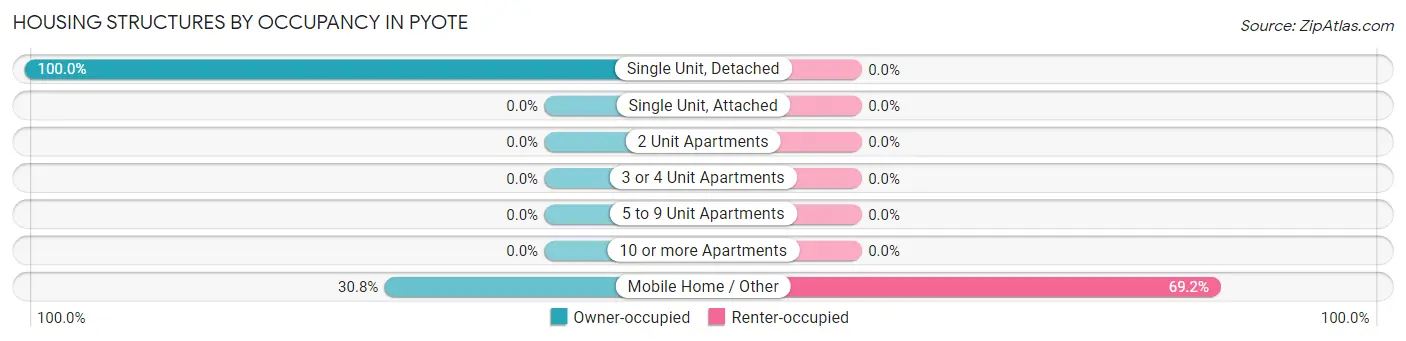
| Structure Type | Owner-occupied | Renter-occupied |
| Single Unit, Detached | 38 (100.0%) | 0 (0.0%) |
| Single Unit, Attached | 0 (0.0%) | 0 (0.0%) |
| 2 Unit Apartments | 0 (0.0%) | 0 (0.0%) |
| 3 or 4 Unit Apartments | 0 (0.0%) | 0 (0.0%) |
| 5 to 9 Unit Apartments | 0 (0.0%) | 0 (0.0%) |
| 10 or more Apartments | 0 (0.0%) | 0 (0.0%) |
| Mobile Home / Other | 4 (30.8%) | 9 (69.2%) |
| Total | 42 (82.4%) | 9 (17.6%) |
Housing Structures by Number of Rooms in Pyote
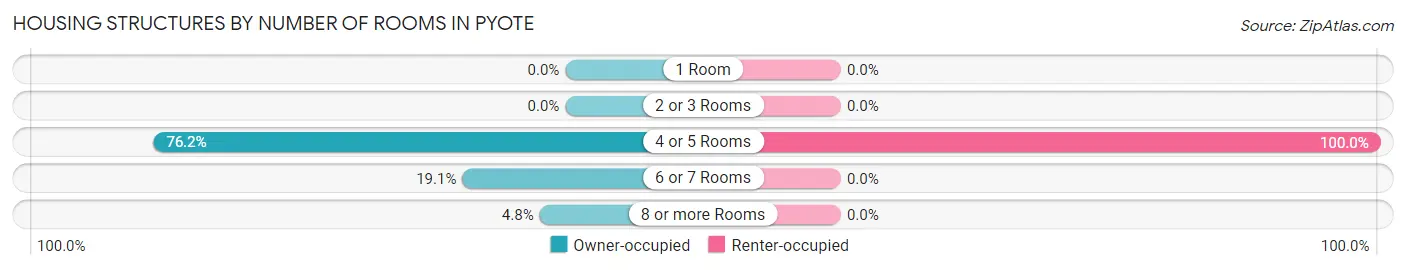
| Number of Rooms | Owner-occupied | Renter-occupied |
| 1 Room | 0 (0.0%) | 0 (0.0%) |
| 2 or 3 Rooms | 0 (0.0%) | 0 (0.0%) |
| 4 or 5 Rooms | 32 (76.2%) | 9 (100.0%) |
| 6 or 7 Rooms | 8 (19.1%) | 0 (0.0%) |
| 8 or more Rooms | 2 (4.8%) | 0 (0.0%) |
| Total | 42 (100.0%) | 9 (100.0%) |
Housing Structure by Heating Type in Pyote
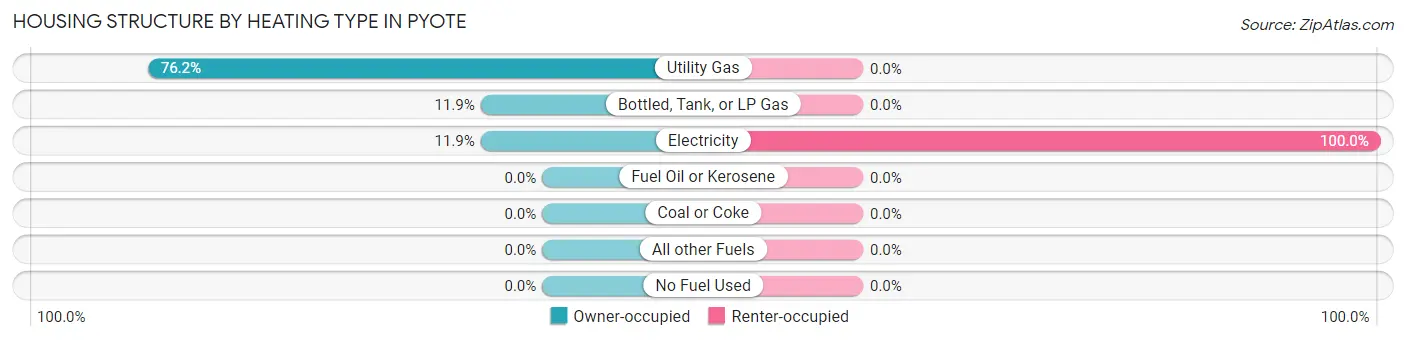
| Heating Type | Owner-occupied | Renter-occupied |
| Utility Gas | 32 (76.2%) | 0 (0.0%) |
| Bottled, Tank, or LP Gas | 5 (11.9%) | 0 (0.0%) |
| Electricity | 5 (11.9%) | 9 (100.0%) |
| Fuel Oil or Kerosene | 0 (0.0%) | 0 (0.0%) |
| Coal or Coke | 0 (0.0%) | 0 (0.0%) |
| All other Fuels | 0 (0.0%) | 0 (0.0%) |
| No Fuel Used | 0 (0.0%) | 0 (0.0%) |
| Total | 42 (100.0%) | 9 (100.0%) |
Household Vehicle Usage in Pyote
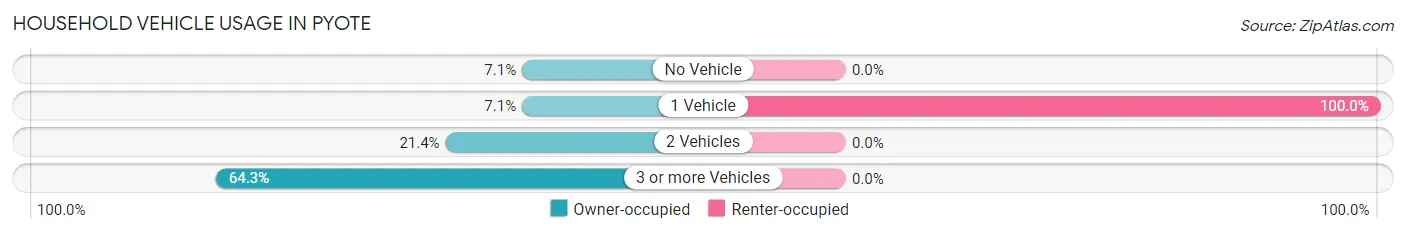
| Vehicles per Household | Owner-occupied | Renter-occupied |
| No Vehicle | 3 (7.1%) | 0 (0.0%) |
| 1 Vehicle | 3 (7.1%) | 9 (100.0%) |
| 2 Vehicles | 9 (21.4%) | 0 (0.0%) |
| 3 or more Vehicles | 27 (64.3%) | 0 (0.0%) |
| Total | 42 (100.0%) | 9 (100.0%) |
Real Estate & Mortgages in Pyote
Real Estate and Mortgage Overview in Pyote
| Characteristic | Without Mortgage | With Mortgage |
| Housing Units | 27 | 15 |
| Median Property Value | $168,800 | $0 |
| Median Household Income | - | - |
| Monthly Housing Costs | $382 | $0 |
| Real Estate Taxes | $392 | $0 |
Property Value by Mortgage Status in Pyote
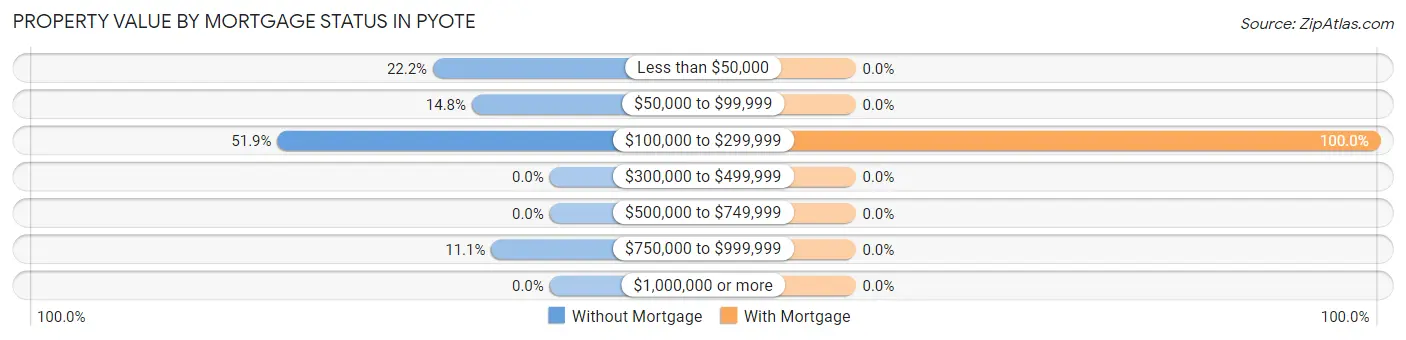
| Property Value | Without Mortgage | With Mortgage |
| Less than $50,000 | 6 (22.2%) | 0 (0.0%) |
| $50,000 to $99,999 | 4 (14.8%) | 0 (0.0%) |
| $100,000 to $299,999 | 14 (51.8%) | 15 (100.0%) |
| $300,000 to $499,999 | 0 (0.0%) | 0 (0.0%) |
| $500,000 to $749,999 | 0 (0.0%) | 0 (0.0%) |
| $750,000 to $999,999 | 3 (11.1%) | 0 (0.0%) |
| $1,000,000 or more | 0 (0.0%) | 0 (0.0%) |
| Total | 27 (100.0%) | 15 (100.0%) |
Household Income by Mortgage Status in Pyote
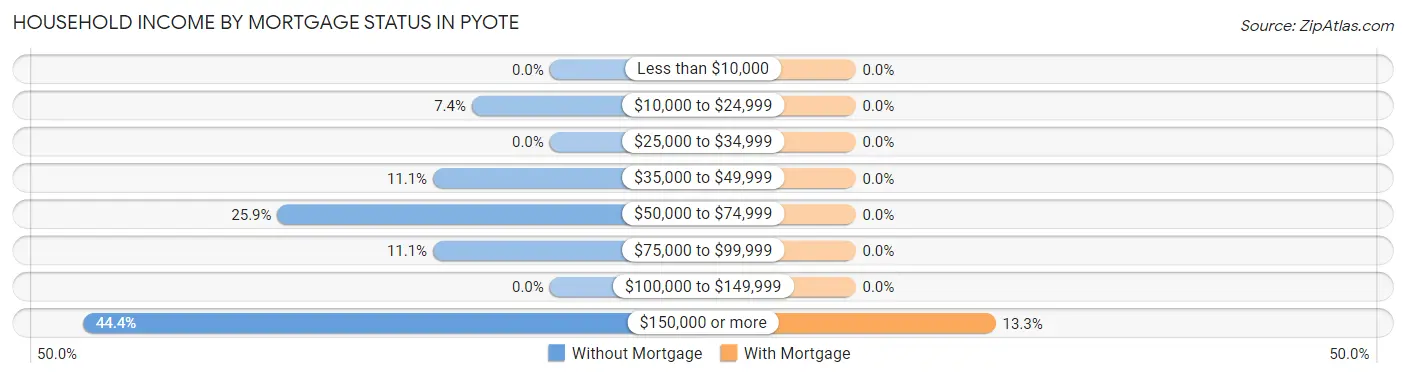
| Household Income | Without Mortgage | With Mortgage |
| Less than $10,000 | 0 (0.0%) | 0 (0.0%) |
| $10,000 to $24,999 | 2 (7.4%) | 0 (0.0%) |
| $25,000 to $34,999 | 0 (0.0%) | 0 (0.0%) |
| $35,000 to $49,999 | 3 (11.1%) | 0 (0.0%) |
| $50,000 to $74,999 | 7 (25.9%) | 0 (0.0%) |
| $75,000 to $99,999 | 3 (11.1%) | 0 (0.0%) |
| $100,000 to $149,999 | 0 (0.0%) | 0 (0.0%) |
| $150,000 or more | 12 (44.4%) | 2 (13.3%) |
| Total | 27 (100.0%) | 15 (100.0%) |
Property Value to Household Income Ratio in Pyote
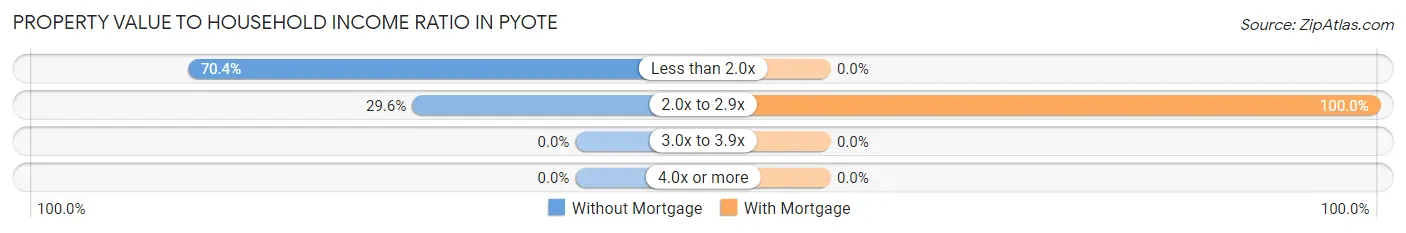
| Value-to-Income Ratio | Without Mortgage | With Mortgage |
| Less than 2.0x | 19 (70.4%) | 0 (0.0%) |
| 2.0x to 2.9x | 8 (29.6%) | 15 (100.0%) |
| 3.0x to 3.9x | 0 (0.0%) | 0 (0.0%) |
| 4.0x or more | 0 (0.0%) | 0 (0.0%) |
| Total | 27 (100.0%) | 15 (100.0%) |
Real Estate Taxes by Mortgage Status in Pyote
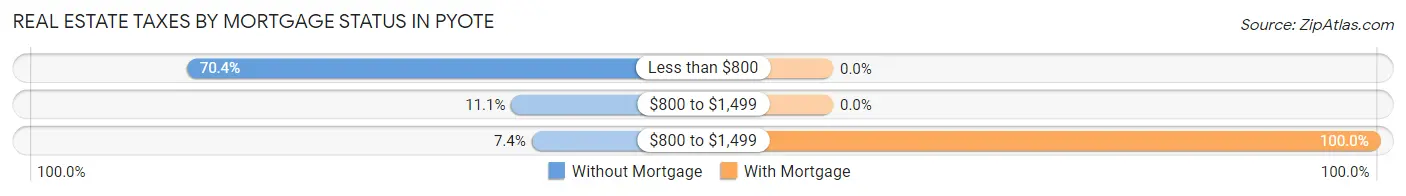
| Property Taxes | Without Mortgage | With Mortgage |
| Less than $800 | 19 (70.4%) | 0 (0.0%) |
| $800 to $1,499 | 3 (11.1%) | 0 (0.0%) |
| $800 to $1,499 | 2 (7.4%) | 15 (100.0%) |
| Total | 27 (100.0%) | 15 (100.0%) |
Health & Disability in Pyote
Health Insurance Coverage by Age in Pyote
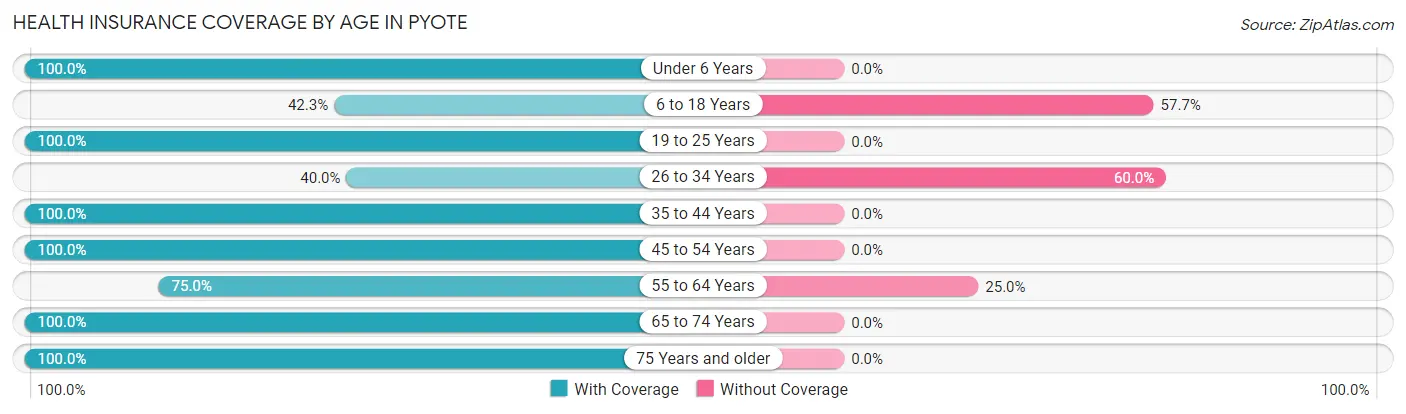
| Age Bracket | With Coverage | Without Coverage |
| Under 6 Years | 5 (100.0%) | 0 (0.0%) |
| 6 to 18 Years | 11 (42.3%) | 15 (57.7%) |
| 19 to 25 Years | 4 (100.0%) | 0 (0.0%) |
| 26 to 34 Years | 6 (40.0%) | 9 (60.0%) |
| 35 to 44 Years | 31 (100.0%) | 0 (0.0%) |
| 45 to 54 Years | 9 (100.0%) | 0 (0.0%) |
| 55 to 64 Years | 15 (75.0%) | 5 (25.0%) |
| 65 to 74 Years | 7 (100.0%) | 0 (0.0%) |
| 75 Years and older | 13 (100.0%) | 0 (0.0%) |
| Total | 101 (77.7%) | 29 (22.3%) |
Health Insurance Coverage by Citizenship Status in Pyote
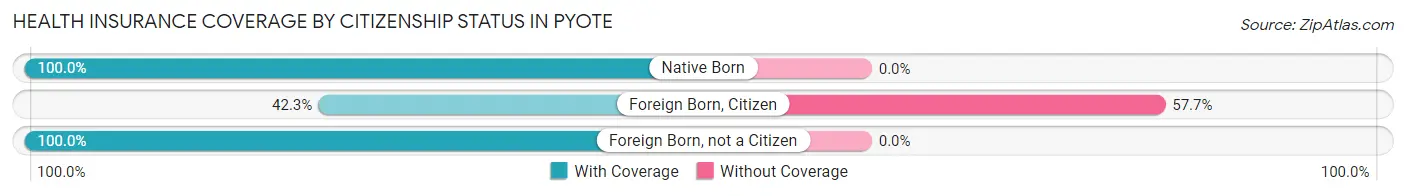
| Citizenship Status | With Coverage | Without Coverage |
| Native Born | 5 (100.0%) | 0 (0.0%) |
| Foreign Born, Citizen | 11 (42.3%) | 15 (57.7%) |
| Foreign Born, not a Citizen | 4 (100.0%) | 0 (0.0%) |
Health Insurance Coverage by Household Income in Pyote
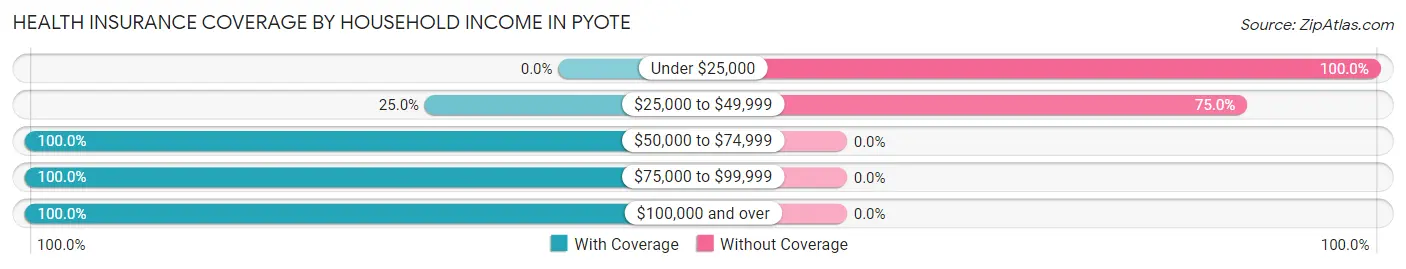
| Household Income | With Coverage | Without Coverage |
| Under $25,000 | 0 (0.0%) | 5 (100.0%) |
| $25,000 to $49,999 | 8 (25.0%) | 24 (75.0%) |
| $50,000 to $74,999 | 10 (100.0%) | 0 (0.0%) |
| $75,000 to $99,999 | 22 (100.0%) | 0 (0.0%) |
| $100,000 and over | 61 (100.0%) | 0 (0.0%) |
Public vs Private Health Insurance Coverage by Age in Pyote
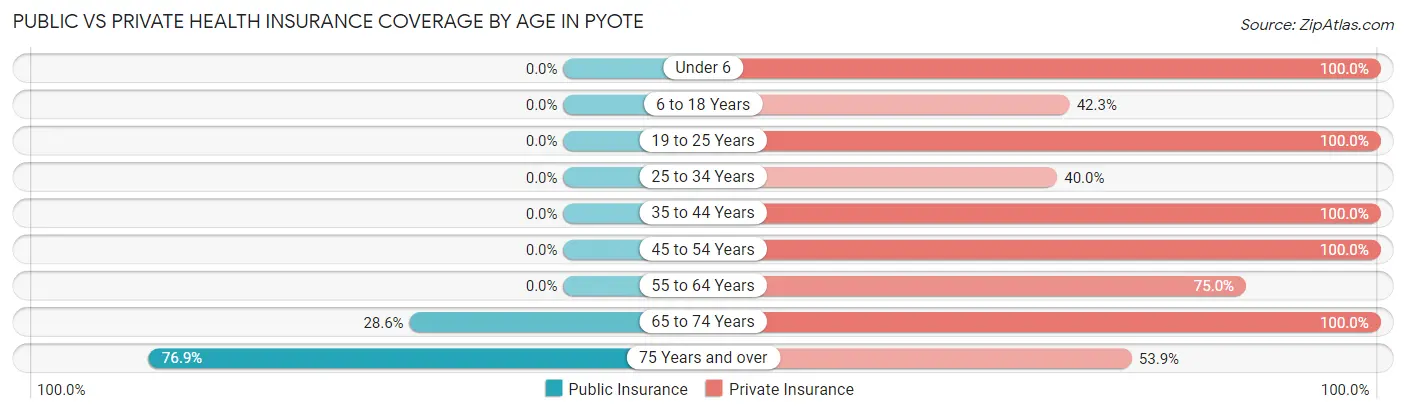
| Age Bracket | Public Insurance | Private Insurance |
| Under 6 | 0 (0.0%) | 5 (100.0%) |
| 6 to 18 Years | 0 (0.0%) | 11 (42.3%) |
| 19 to 25 Years | 0 (0.0%) | 4 (100.0%) |
| 25 to 34 Years | 0 (0.0%) | 6 (40.0%) |
| 35 to 44 Years | 0 (0.0%) | 31 (100.0%) |
| 45 to 54 Years | 0 (0.0%) | 9 (100.0%) |
| 55 to 64 Years | 0 (0.0%) | 15 (75.0%) |
| 65 to 74 Years | 2 (28.6%) | 7 (100.0%) |
| 75 Years and over | 10 (76.9%) | 7 (53.8%) |
| Total | 12 (9.2%) | 95 (73.1%) |
Disability Status by Sex by Age in Pyote
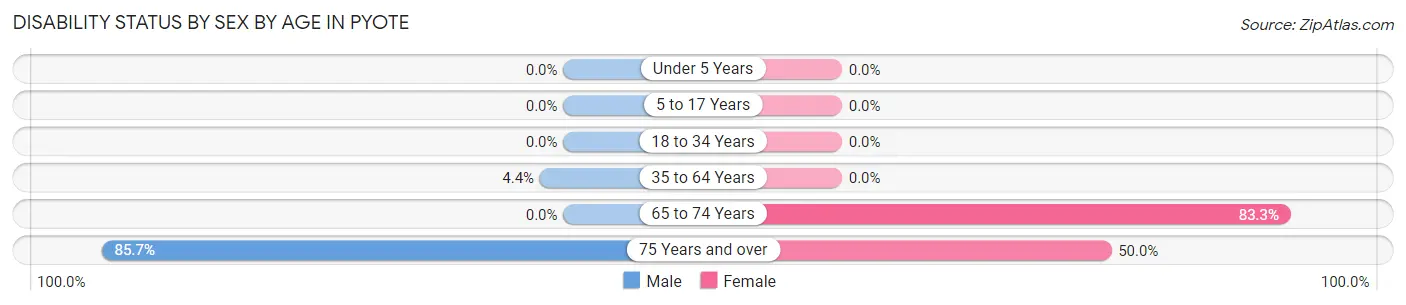
| Age Bracket | Male | Female |
| Under 5 Years | 0 (0.0%) | 0 (0.0%) |
| 5 to 17 Years | 0 (0.0%) | 0 (0.0%) |
| 18 to 34 Years | 0 (0.0%) | 0 (0.0%) |
| 35 to 64 Years | 1 (4.3%) | 0 (0.0%) |
| 65 to 74 Years | 0 (0.0%) | 5 (83.3%) |
| 75 Years and over | 6 (85.7%) | 3 (50.0%) |
Disability Class by Sex by Age in Pyote
Disability Class: Hearing Difficulty
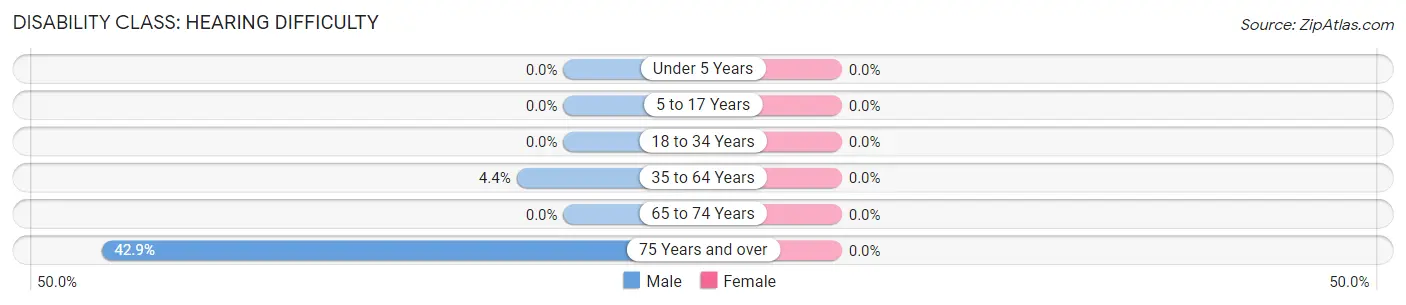
| Age Bracket | Male | Female |
| Under 5 Years | 0 (0.0%) | 0 (0.0%) |
| 5 to 17 Years | 0 (0.0%) | 0 (0.0%) |
| 18 to 34 Years | 0 (0.0%) | 0 (0.0%) |
| 35 to 64 Years | 1 (4.3%) | 0 (0.0%) |
| 65 to 74 Years | 0 (0.0%) | 0 (0.0%) |
| 75 Years and over | 3 (42.9%) | 0 (0.0%) |
Disability Class: Vision Difficulty
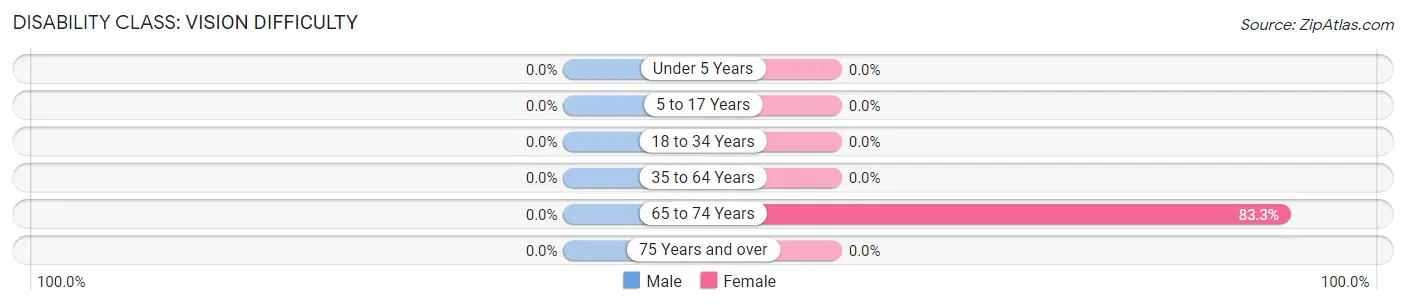
| Age Bracket | Male | Female |
| Under 5 Years | 0 (0.0%) | 0 (0.0%) |
| 5 to 17 Years | 0 (0.0%) | 0 (0.0%) |
| 18 to 34 Years | 0 (0.0%) | 0 (0.0%) |
| 35 to 64 Years | 0 (0.0%) | 0 (0.0%) |
| 65 to 74 Years | 0 (0.0%) | 5 (83.3%) |
| 75 Years and over | 0 (0.0%) | 0 (0.0%) |
Disability Class: Cognitive Difficulty
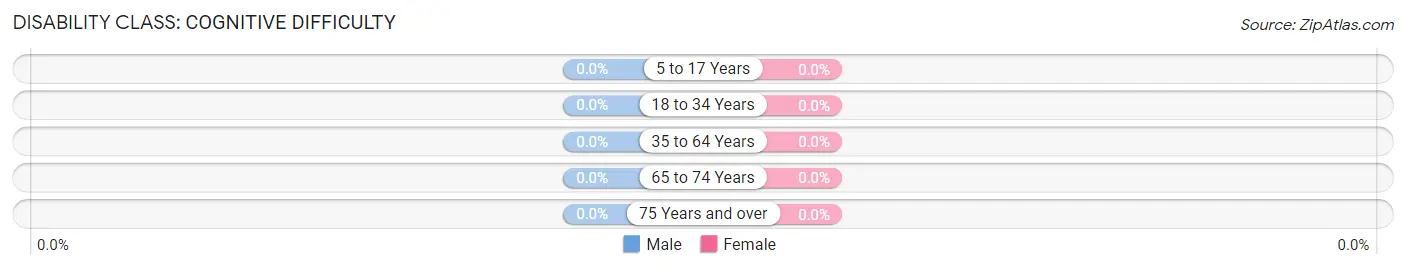
| Age Bracket | Male | Female |
| 5 to 17 Years | 0 (0.0%) | 0 (0.0%) |
| 18 to 34 Years | 0 (0.0%) | 0 (0.0%) |
| 35 to 64 Years | 0 (0.0%) | 0 (0.0%) |
| 65 to 74 Years | 0 (0.0%) | 0 (0.0%) |
| 75 Years and over | 0 (0.0%) | 0 (0.0%) |
Disability Class: Ambulatory Difficulty
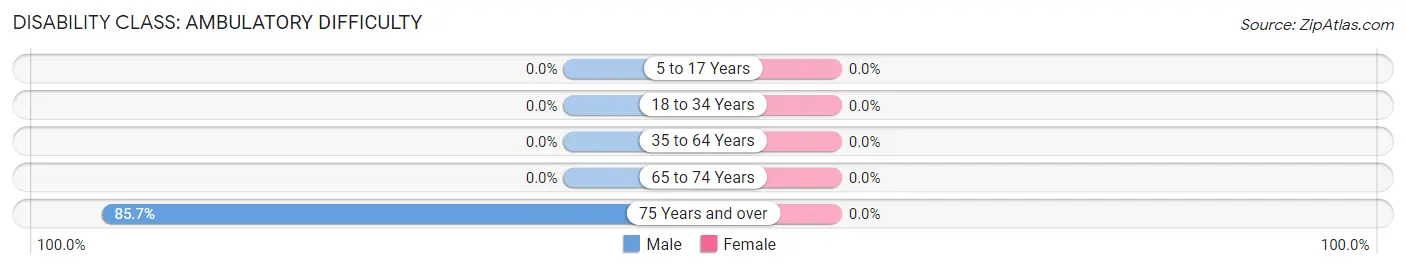
| Age Bracket | Male | Female |
| 5 to 17 Years | 0 (0.0%) | 0 (0.0%) |
| 18 to 34 Years | 0 (0.0%) | 0 (0.0%) |
| 35 to 64 Years | 0 (0.0%) | 0 (0.0%) |
| 65 to 74 Years | 0 (0.0%) | 0 (0.0%) |
| 75 Years and over | 6 (85.7%) | 0 (0.0%) |
Disability Class: Self-Care Difficulty
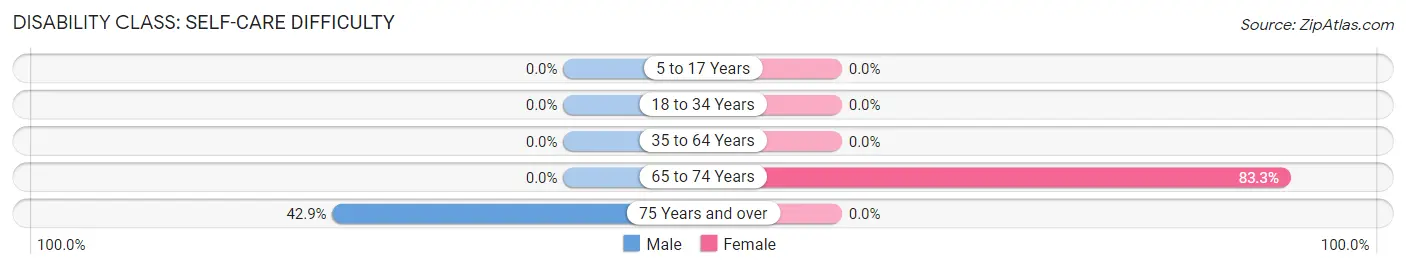
| Age Bracket | Male | Female |
| 5 to 17 Years | 0 (0.0%) | 0 (0.0%) |
| 18 to 34 Years | 0 (0.0%) | 0 (0.0%) |
| 35 to 64 Years | 0 (0.0%) | 0 (0.0%) |
| 65 to 74 Years | 0 (0.0%) | 5 (83.3%) |
| 75 Years and over | 3 (42.9%) | 0 (0.0%) |
Technology Access in Pyote
Computing Device Access in Pyote
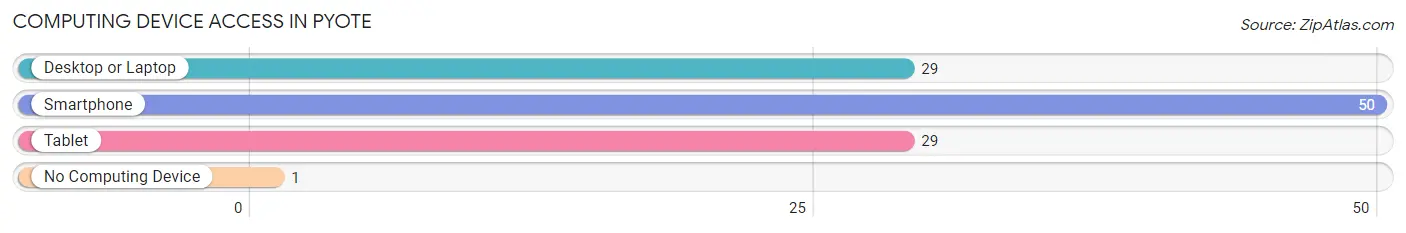
| Device Type | # Households | % Households |
| Desktop or Laptop | 29 | 56.9% |
| Smartphone | 50 | 98.0% |
| Tablet | 29 | 56.9% |
| No Computing Device | 1 | 2.0% |
| Total | 51 | 100.0% |
Internet Access in Pyote
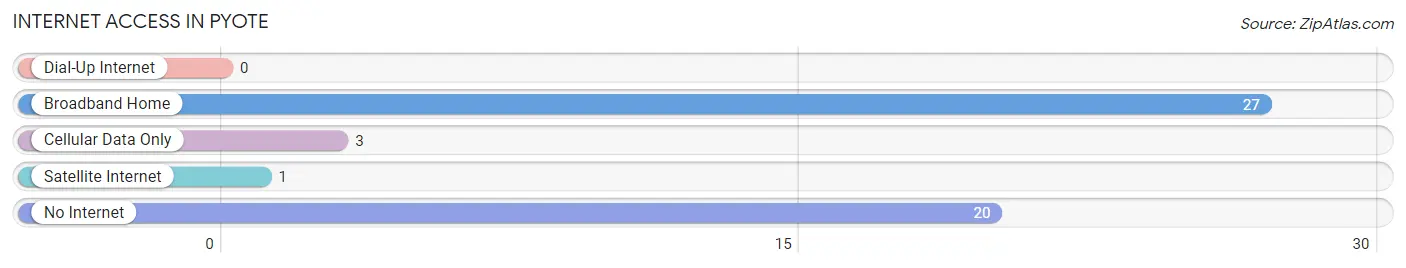
| Internet Type | # Households | % Households |
| Dial-Up Internet | 0 | 0.0% |
| Broadband Home | 27 | 52.9% |
| Cellular Data Only | 3 | 5.9% |
| Satellite Internet | 1 | 2.0% |
| No Internet | 20 | 39.2% |
| Total | 51 | 100.0% |
Pyote Summary
Pyote is a small unincorporated community located in Ward County, Texas, United States. It is situated on the western edge of the county, approximately 20 miles northwest of Monahans, the county seat. The population of Pyote was estimated to be around 200 in 2020.
History
Pyote was founded in the early 1900s as a stop on the Texas and Pacific Railway. The town was named after the nearby Pyote Creek, which was named after the Spanish word for “pigeon”. The town was originally a farming community, but in the 1930s, the Pyote Air Force Base was established nearby. The base was used to train bomber crews during World War II and was later used as a storage facility for nuclear weapons. The base was closed in the 1960s and the town’s population declined.
Geography
Pyote is located in western Ward County at 31°45'25" North, 103°17'45" West (31.7569, -103.2958). It is situated on the western edge of the county, approximately 20 miles northwest of Monahans, the county seat. The town is located on the edge of the Permian Basin, a large sedimentary basin in West Texas and southeastern New Mexico. The terrain around Pyote is mostly flat, with some rolling hills. The climate is semi-arid, with hot summers and mild winters.
Economy
The economy of Pyote is largely based on agriculture and oil and gas production. The town is home to several farms and ranches, as well as several oil and gas production facilities. The town also has a few small businesses, including a convenience store, a gas station, and a restaurant.
Demographics
As of the 2010 census, there were 200 people living in Pyote. The racial makeup of the town was 94.5% White, 0.5% African American, 0.5% Native American, 0.5% Asian, and 4.0% from other races. The median household income was $31,250 and the median family income was $37,500. The per capita income was $14,824. About 11.5% of the population was below the poverty line.
Pyote is a small, rural community with a rich history and a bright future. The town is home to a diverse population and a strong economy based on agriculture and oil and gas production. With its close proximity to larger cities and its unique culture, Pyote is an ideal place to live and work.
Common Questions
What is Per Capita Income in Pyote?
Per Capita income in Pyote is $58,226.
What is Inequality or Gini Index in Pyote?
Inequality or Gini Index in Pyote is 0.41.
What is the Total Population of Pyote?
Total Population of Pyote is 130.
What is the Total Male Population of Pyote?
Total Male Population of Pyote is 69.
What is the Total Female Population of Pyote?
Total Female Population of Pyote is 61.
What is the Ratio of Males per 100 Females in Pyote?
There are 113.11 Males per 100 Females in Pyote.
What is the Ratio of Females per 100 Males in Pyote?
There are 88.41 Females per 100 Males in Pyote.
What is the Median Population Age in Pyote?
Median Population Age in Pyote is 35.5 Years.
What is the Average Family Size in Pyote
Average Family Size in Pyote is 2.5 People.
What is the Average Household Size in Pyote
Average Household Size in Pyote is 2.5 People.
How Large is the Labor Force in Pyote?
There are 71 People in the Labor Forcein in Pyote.
What is the Percentage of People in the Labor Force in Pyote?
71.7% of People are in the Labor Force in Pyote.