Prosper, TX Map & Demographics
Prosper Map
Prosper Overview
$63,344
PER CAPITA INCOME
$181,408
AVG FAMILY INCOME
$178,224
AVG HOUSEHOLD INCOME
56.0%
WAGE / INCOME GAP [ % ]
44.0¢/ $1
WAGE / INCOME GAP [ $ ]
0.36
INEQUALITY / GINI INDEX
31,507
TOTAL POPULATION
16,324
MALE POPULATION
15,183
FEMALE POPULATION
107.51
MALES / 100 FEMALES
93.01
FEMALES / 100 MALES
36.5
MEDIAN AGE
3.6
AVG FAMILY SIZE
3.5
AVG HOUSEHOLD SIZE
15,679
LABOR FORCE [ PEOPLE ]
70.4%
PERCENT IN LABOR FORCE
4.5%
UNEMPLOYMENT RATE
Prosper Zip Codes
Income in Prosper
Income Overview in Prosper
Per Capita Income in Prosper is $63,344, while median incomes of families and households are $181,408 and $178,224 respectively.
| Characteristic | Number | Measure |
| Per Capita Income | 31,507 | $63,344 |
| Median Family Income | 8,341 | $181,408 |
| Mean Family Income | 8,341 | $223,009 |
| Median Household Income | 9,071 | $178,224 |
| Mean Household Income | 9,071 | $215,851 |
| Income Deficit | 8,341 | $0 |
| Wage / Income Gap (%) | 31,507 | 55.98% |
| Wage / Income Gap ($) | 31,507 | 44.02¢ per $1 |
| Gini / Inequality Index | 31,507 | 0.36 |
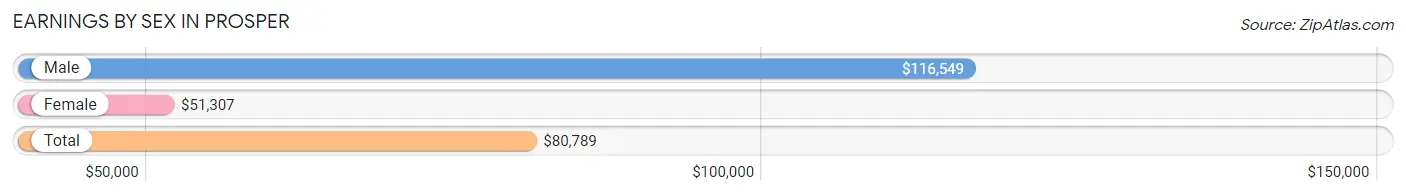
Earnings by Sex in Prosper
Average Earnings in Prosper are $80,789, $116,549 for men and $51,307 for women, a difference of 56.0%.
| Sex | Number | Average Earnings |
| Male | 9,181 (57.3%) | $116,549 |
| Female | 6,846 (42.7%) | $51,307 |
| Total | 16,027 (100.0%) | $80,789 |
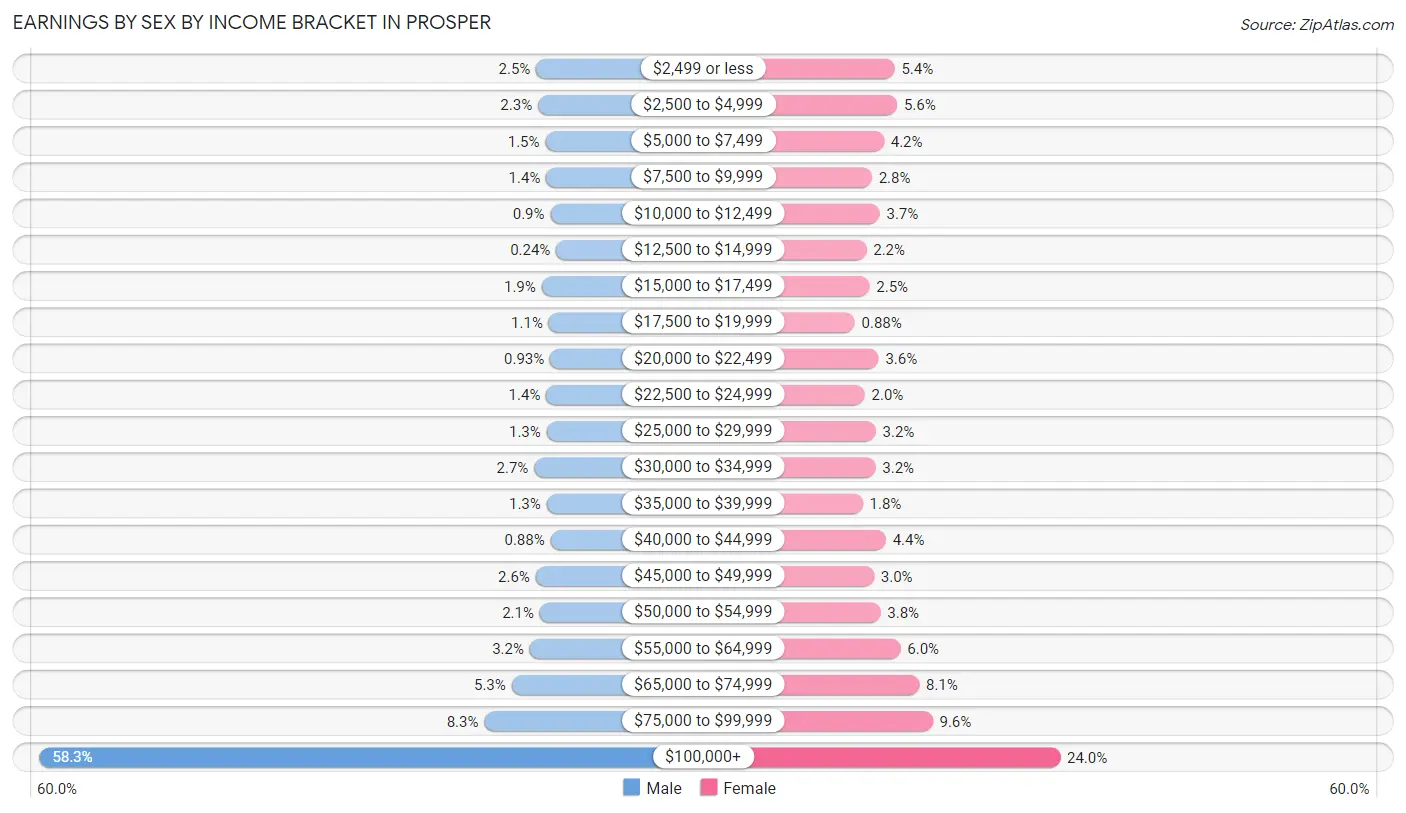
Earnings by Sex by Income Bracket in Prosper
The most common earnings brackets in Prosper are $100,000+ for men (5,356 | 58.3%) and $100,000+ for women (1,641 | 24.0%).
| Income | Male | Female |
| $2,499 or less | 229 (2.5%) | 367 (5.4%) |
| $2,500 to $4,999 | 210 (2.3%) | 386 (5.6%) |
| $5,000 to $7,499 | 134 (1.5%) | 285 (4.2%) |
| $7,500 to $9,999 | 125 (1.4%) | 192 (2.8%) |
| $10,000 to $12,499 | 83 (0.9%) | 252 (3.7%) |
| $12,500 to $14,999 | 22 (0.2%) | 150 (2.2%) |
| $15,000 to $17,499 | 173 (1.9%) | 174 (2.5%) |
| $17,500 to $19,999 | 99 (1.1%) | 60 (0.9%) |
| $20,000 to $22,499 | 85 (0.9%) | 244 (3.6%) |
| $22,500 to $24,999 | 125 (1.4%) | 137 (2.0%) |
| $25,000 to $29,999 | 121 (1.3%) | 222 (3.2%) |
| $30,000 to $34,999 | 250 (2.7%) | 220 (3.2%) |
| $35,000 to $39,999 | 121 (1.3%) | 122 (1.8%) |
| $40,000 to $44,999 | 81 (0.9%) | 300 (4.4%) |
| $45,000 to $49,999 | 234 (2.5%) | 208 (3.0%) |
| $50,000 to $54,999 | 192 (2.1%) | 258 (3.8%) |
| $55,000 to $64,999 | 295 (3.2%) | 412 (6.0%) |
| $65,000 to $74,999 | 482 (5.2%) | 556 (8.1%) |
| $75,000 to $99,999 | 764 (8.3%) | 660 (9.6%) |
| $100,000+ | 5,356 (58.3%) | 1,641 (24.0%) |
| Total | 9,181 (100.0%) | 6,846 (100.0%) |
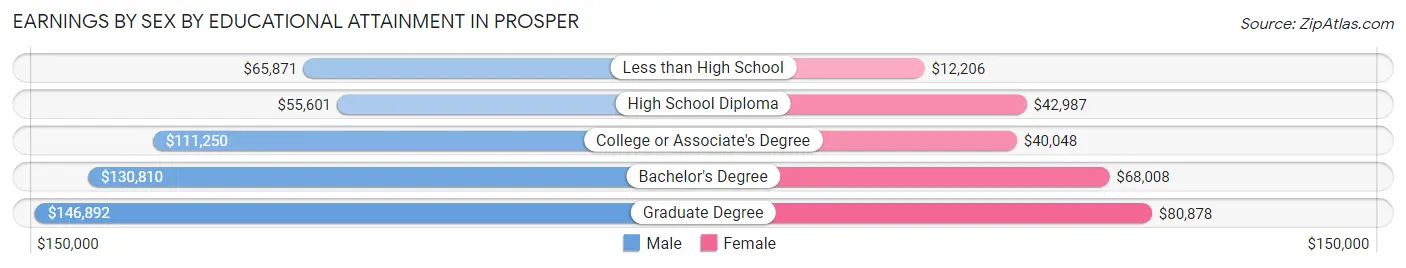
Earnings by Sex by Educational Attainment in Prosper
Average earnings in Prosper are $126,379 for men and $59,488 for women, a difference of 52.9%. Men with an educational attainment of graduate degree enjoy the highest average annual earnings of $146,892, while those with high school diploma education earn the least with $55,601. Women with an educational attainment of graduate degree earn the most with the average annual earnings of $80,878, while those with less than high school education have the smallest earnings of $12,206.
| Educational Attainment | Male Income | Female Income |
| Less than High School | $65,871 | $12,206 |
| High School Diploma | $55,601 | $42,987 |
| College or Associate's Degree | $111,250 | $40,048 |
| Bachelor's Degree | $130,810 | $68,008 |
| Graduate Degree | $146,892 | $80,878 |
| Total | $126,379 | $59,488 |
Family Income in Prosper
Family Income Brackets in Prosper
According to the Prosper family income data, there are 3,628 families falling into the $200,000+ income range, which is the most common income bracket and makes up 43.5% of all families.
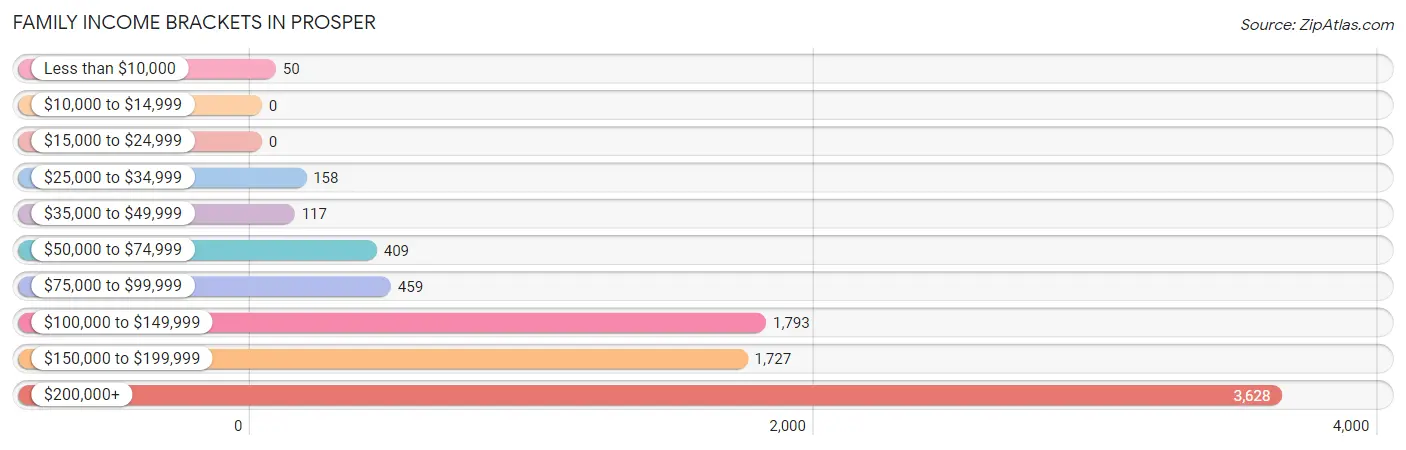
| Income Bracket | # Families | % Families |
| Less than $10,000 | 50 | 0.6% |
| $10,000 to $14,999 | 0 | 0.0% |
| $15,000 to $24,999 | 0 | 0.0% |
| $25,000 to $34,999 | 158 | 1.9% |
| $35,000 to $49,999 | 117 | 1.4% |
| $50,000 to $74,999 | 409 | 4.9% |
| $75,000 to $99,999 | 459 | 5.5% |
| $100,000 to $149,999 | 1,793 | 21.5% |
| $150,000 to $199,999 | 1,727 | 20.7% |
| $200,000+ | 3,628 | 43.5% |
Family Income by Famaliy Size in Prosper
5-person families (1,003 | 12.0%) account for the highest median family income in Prosper with $204,367 per family, while 2-person families (2,258 | 27.1%) have the highest median income of $76,423 per family member.
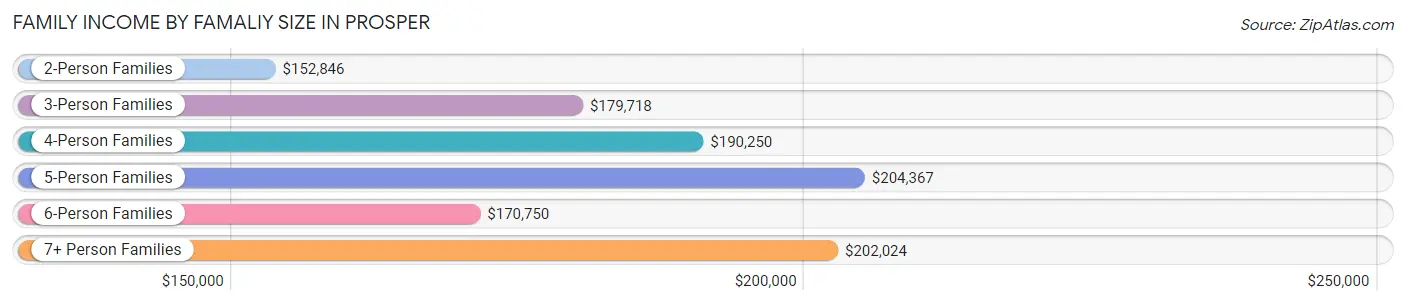
| Income Bracket | # Families | Median Income |
| 2-Person Families | 2,258 (27.1%) | $152,846 |
| 3-Person Families | 1,528 (18.3%) | $179,718 |
| 4-Person Families | 3,116 (37.4%) | $190,250 |
| 5-Person Families | 1,003 (12.0%) | $204,367 |
| 6-Person Families | 262 (3.1%) | $170,750 |
| 7+ Person Families | 174 (2.1%) | $202,024 |
| Total | 8,341 (100.0%) | $181,408 |
Family Income by Number of Earners in Prosper
The median family income in Prosper is $181,408, with families comprising 3+ earners (1,034) having the highest median family income of $244,776, while families with no earners (488) have the lowest median family income of $86,912, accounting for 12.4% and 5.9% of families, respectively.
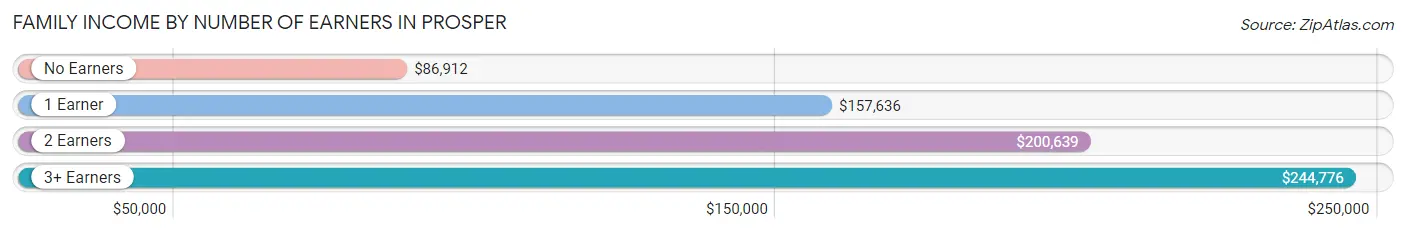
| Number of Earners | # Families | Median Income |
| No Earners | 488 (5.9%) | $86,912 |
| 1 Earner | 2,620 (31.4%) | $157,636 |
| 2 Earners | 4,199 (50.3%) | $200,639 |
| 3+ Earners | 1,034 (12.4%) | $244,776 |
| Total | 8,341 (100.0%) | $181,408 |
Household Income in Prosper
Household Income Brackets in Prosper
With 3,737 households falling in the category, the $200,000+ income range is the most frequent in Prosper, accounting for 41.2% of all households.
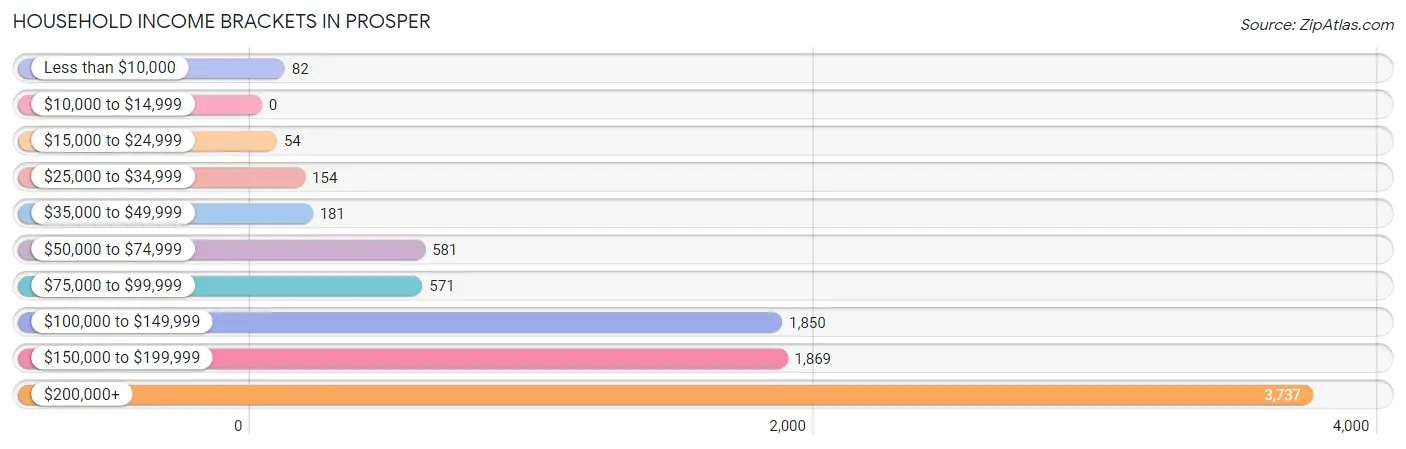
| Income Bracket | # Households | % Households |
| Less than $10,000 | 82 | 0.9% |
| $10,000 to $14,999 | 0 | 0.0% |
| $15,000 to $24,999 | 54 | 0.6% |
| $25,000 to $34,999 | 154 | 1.7% |
| $35,000 to $49,999 | 181 | 2.0% |
| $50,000 to $74,999 | 581 | 6.4% |
| $75,000 to $99,999 | 571 | 6.3% |
| $100,000 to $149,999 | 1,850 | 20.4% |
| $150,000 to $199,999 | 1,869 | 20.6% |
| $200,000+ | 3,737 | 41.2% |
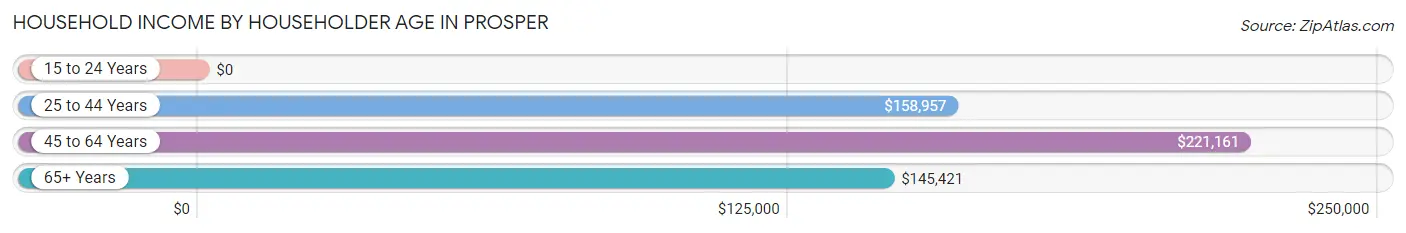
Household Income by Householder Age in Prosper
The median household income in Prosper is $178,224, with the highest median household income of $221,161 found in the 45 to 64 years age bracket for the primary householder. A total of 4,257 households (46.9%) fall into this category. Meanwhile, the 15 to 24 years age bracket for the primary householder has the lowest median household income of $0, with 58 households (0.6%) in this group.
| Income Bracket | # Households | Median Income |
| 15 to 24 Years | 58 (0.6%) | $0 |
| 25 to 44 Years | 3,582 (39.5%) | $158,957 |
| 45 to 64 Years | 4,257 (46.9%) | $221,161 |
| 65+ Years | 1,174 (12.9%) | $145,421 |
| Total | 9,071 (100.0%) | $178,224 |
Poverty in Prosper
Income Below Poverty by Sex and Age in Prosper
With 1.6% poverty level for males and 3.9% for females among the residents of Prosper, 15 year old males and 16 and 17 year old females are the most vulnerable to poverty, with 26 males (5.2%) and 94 females (18.0%) in their respective age groups living below the poverty level.
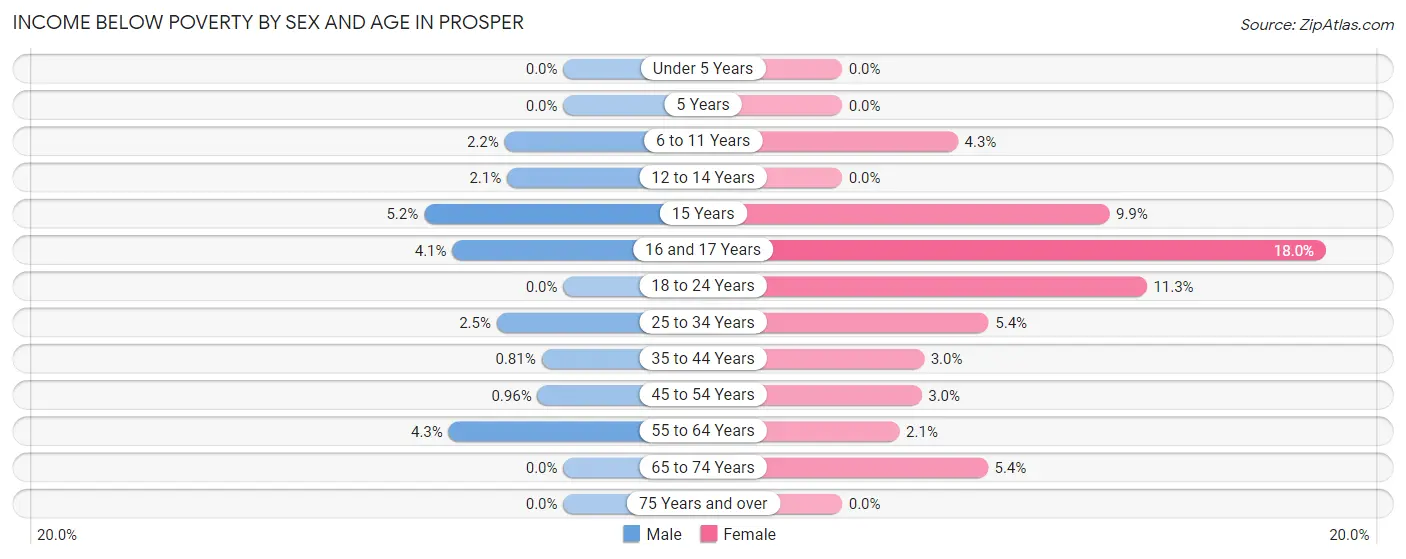
| Age Bracket | Male | Female |
| Under 5 Years | 0 (0.0%) | 0 (0.0%) |
| 5 Years | 0 (0.0%) | 0 (0.0%) |
| 6 to 11 Years | 41 (2.2%) | 64 (4.3%) |
| 12 to 14 Years | 21 (2.1%) | 0 (0.0%) |
| 15 Years | 26 (5.2%) | 25 (9.9%) |
| 16 and 17 Years | 28 (4.1%) | 94 (18.0%) |
| 18 to 24 Years | 0 (0.0%) | 101 (11.3%) |
| 25 to 34 Years | 32 (2.5%) | 75 (5.4%) |
| 35 to 44 Years | 20 (0.8%) | 85 (3.0%) |
| 45 to 54 Years | 30 (1.0%) | 89 (2.9%) |
| 55 to 64 Years | 58 (4.3%) | 24 (2.1%) |
| 65 to 74 Years | 0 (0.0%) | 35 (5.4%) |
| 75 Years and over | 0 (0.0%) | 0 (0.0%) |
| Total | 256 (1.6%) | 592 (3.9%) |
Income Above Poverty by Sex and Age in Prosper
According to the poverty statistics in Prosper, males aged under 5 years and females aged under 5 years are the age groups that are most secure financially, with 100.0% of males and 100.0% of females in these age groups living above the poverty line.
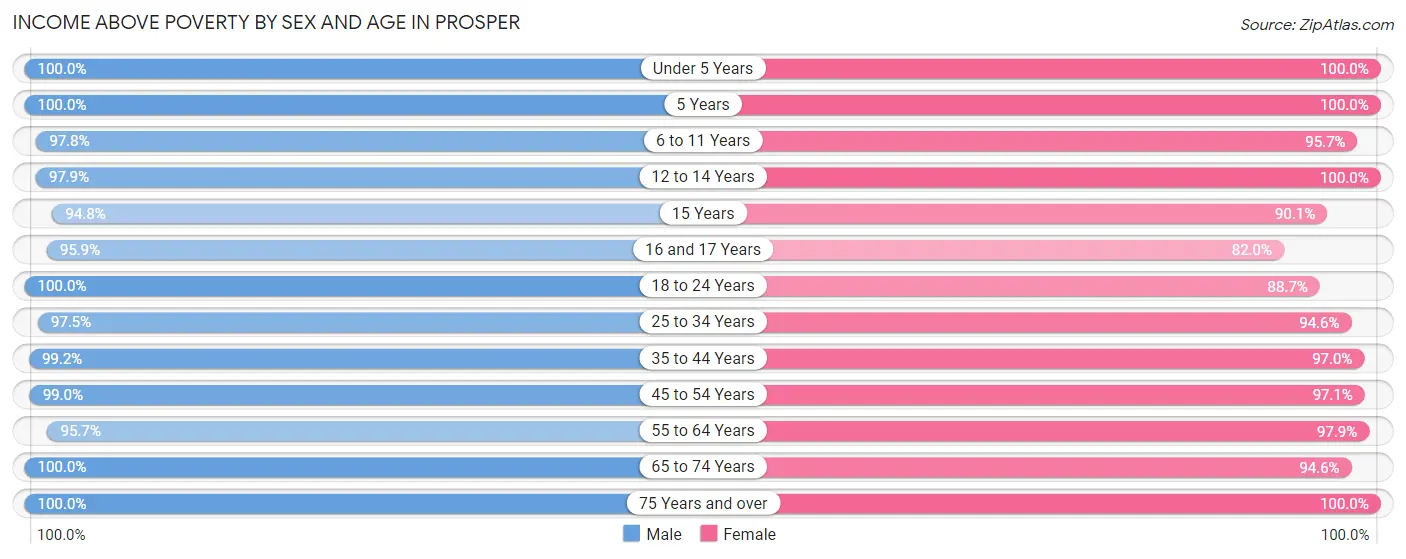
| Age Bracket | Male | Female |
| Under 5 Years | 1,100 (100.0%) | 1,200 (100.0%) |
| 5 Years | 271 (100.0%) | 259 (100.0%) |
| 6 to 11 Years | 1,841 (97.8%) | 1,426 (95.7%) |
| 12 to 14 Years | 983 (97.9%) | 1,039 (100.0%) |
| 15 Years | 477 (94.8%) | 227 (90.1%) |
| 16 and 17 Years | 652 (95.9%) | 429 (82.0%) |
| 18 to 24 Years | 1,149 (100.0%) | 792 (88.7%) |
| 25 to 34 Years | 1,265 (97.5%) | 1,303 (94.6%) |
| 35 to 44 Years | 2,464 (99.2%) | 2,710 (97.0%) |
| 45 to 54 Years | 3,097 (99.0%) | 2,928 (97.1%) |
| 55 to 64 Years | 1,303 (95.7%) | 1,104 (97.9%) |
| 65 to 74 Years | 685 (100.0%) | 612 (94.6%) |
| 75 Years and over | 577 (100.0%) | 531 (100.0%) |
| Total | 15,864 (98.4%) | 14,560 (96.1%) |
Income Below Poverty Among Married-Couple Families in Prosper
The poverty statistics for married-couple families in Prosper show that 0.8% or 57 of the total 7,542 families live below the poverty line. Families with 3 or 4 children have the highest poverty rate of 3.0%, comprising of 25 families. On the other hand, families with 5 or more children have the lowest poverty rate of 0.0%, which includes 0 families.
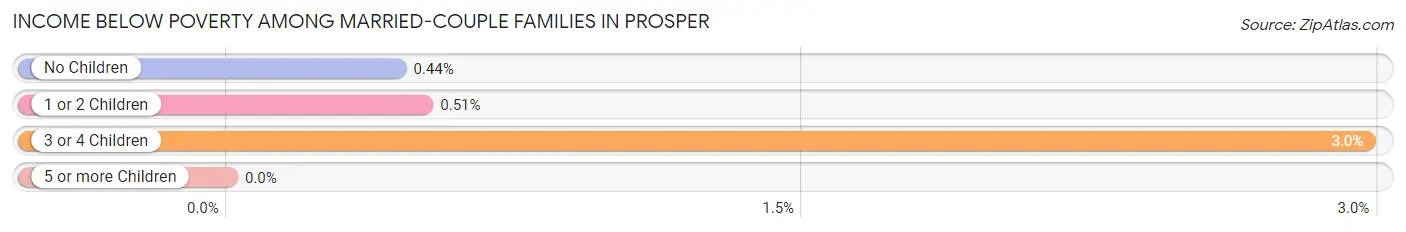
| Children | Above Poverty | Below Poverty |
| No Children | 2,720 (99.6%) | 12 (0.4%) |
| 1 or 2 Children | 3,895 (99.5%) | 20 (0.5%) |
| 3 or 4 Children | 818 (97.0%) | 25 (3.0%) |
| 5 or more Children | 52 (100.0%) | 0 (0.0%) |
| Total | 7,485 (99.2%) | 57 (0.8%) |
Income Below Poverty Among Single-Parent Households in Prosper
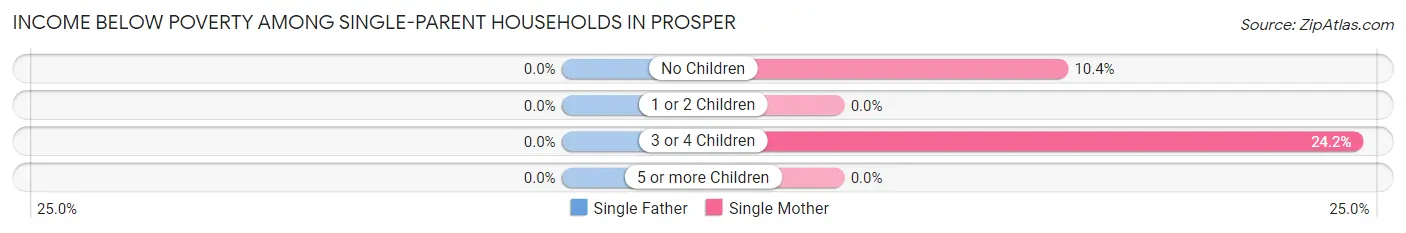
| Children | Single Father | Single Mother |
| No Children | 0 (0.0%) | 20 (10.4%) |
| 1 or 2 Children | 0 (0.0%) | 0 (0.0%) |
| 3 or 4 Children | 0 (0.0%) | 15 (24.2%) |
| 5 or more Children | 0 (0.0%) | 0 (0.0%) |
| Total | 0 (0.0%) | 35 (8.2%) |
Income Below Poverty Among Married-Couple vs Single-Parent Households in Prosper
The poverty data for Prosper shows that 57 of the married-couple family households (0.8%) and 35 of the single-parent households (4.4%) are living below the poverty level. Within the married-couple family households, those with 3 or 4 children have the highest poverty rate, with 25 households (3.0%) falling below the poverty line. Among the single-parent households, those with 3 or 4 children have the highest poverty rate, with 15 household (21.7%) living below poverty.
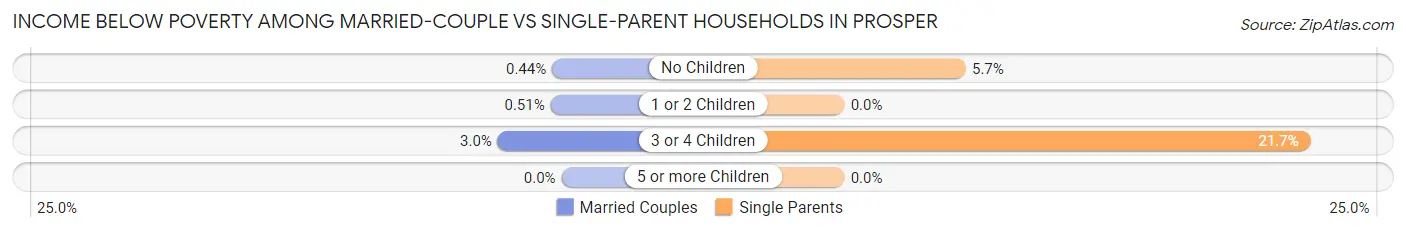
| Children | Married-Couple Families | Single-Parent Households |
| No Children | 12 (0.4%) | 20 (5.7%) |
| 1 or 2 Children | 20 (0.5%) | 0 (0.0%) |
| 3 or 4 Children | 25 (3.0%) | 15 (21.7%) |
| 5 or more Children | 0 (0.0%) | 0 (0.0%) |
| Total | 57 (0.8%) | 35 (4.4%) |
Race in Prosper
The most populous races in Prosper are White / Caucasian (23,055 | 73.2%), Hispanic or Latino (3,164 | 10.0%), and Asian (3,087 | 9.8%).
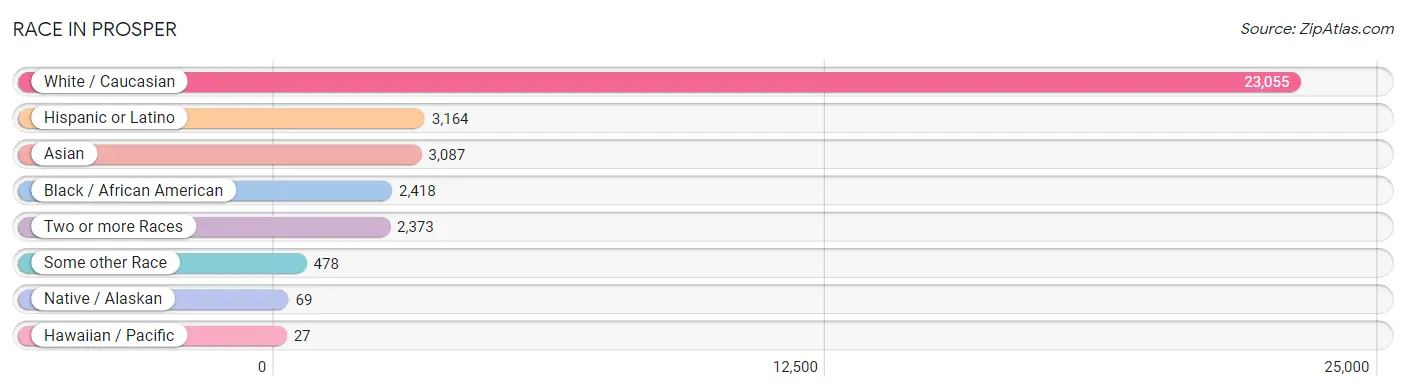
| Race | # Population | % Population |
| Asian | 3,087 | 9.8% |
| Black / African American | 2,418 | 7.7% |
| Hawaiian / Pacific | 27 | 0.1% |
| Hispanic or Latino | 3,164 | 10.0% |
| Native / Alaskan | 69 | 0.2% |
| White / Caucasian | 23,055 | 73.2% |
| Two or more Races | 2,373 | 7.5% |
| Some other Race | 478 | 1.5% |
| Total | 31,507 | 100.0% |
Ancestry in Prosper
The most populous ancestries reported in Prosper are German (4,377 | 13.9%), English (4,142 | 13.2%), American (3,470 | 11.0%), Irish (2,479 | 7.9%), and Mexican (1,851 | 5.9%), together accounting for 51.8% of all Prosper residents.
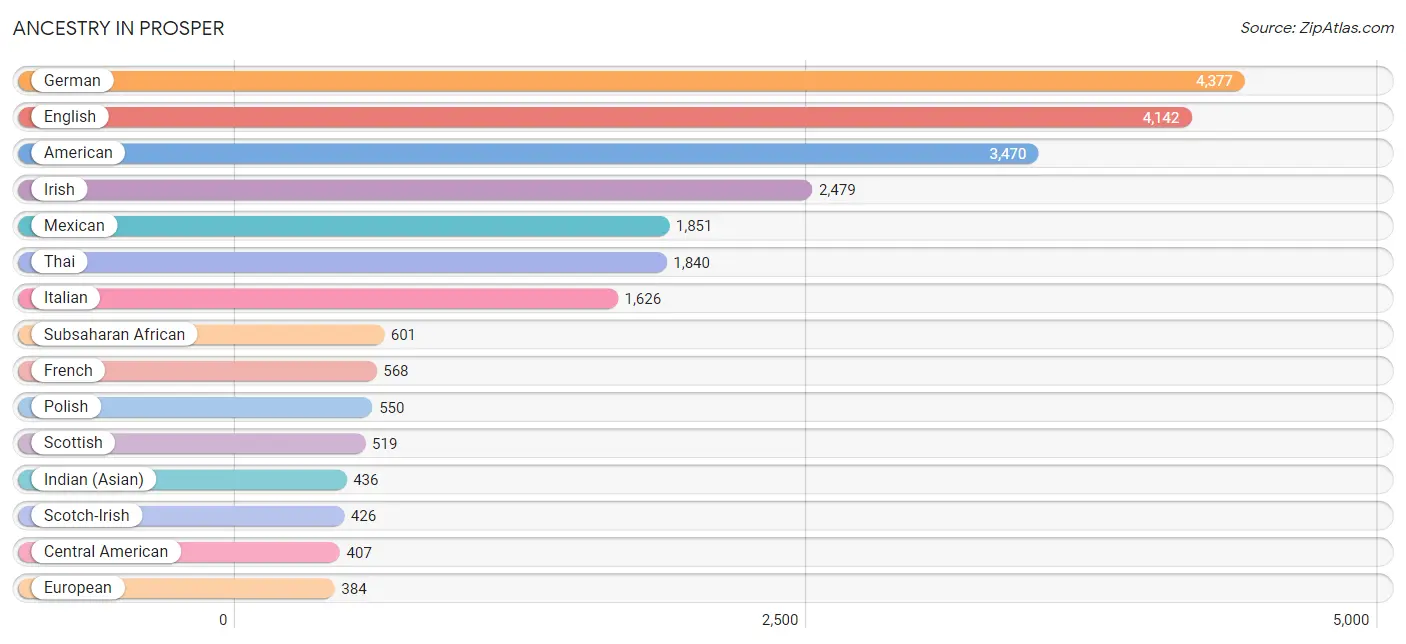
| Ancestry | # Population | % Population |
| African | 225 | 0.7% |
| American | 3,470 | 11.0% |
| Apache | 203 | 0.6% |
| Arab | 282 | 0.9% |
| Argentinean | 70 | 0.2% |
| Armenian | 16 | 0.1% |
| Australian | 22 | 0.1% |
| Austrian | 12 | 0.0% |
| Belgian | 44 | 0.1% |
| Bhutanese | 88 | 0.3% |
| Blackfeet | 26 | 0.1% |
| British | 254 | 0.8% |
| Burmese | 240 | 0.8% |
| Cajun | 4 | 0.0% |
| Canadian | 207 | 0.7% |
| Central American | 407 | 1.3% |
| Central American Indian | 75 | 0.2% |
| Cherokee | 106 | 0.3% |
| Chickasaw | 45 | 0.1% |
| Chilean | 58 | 0.2% |
| Choctaw | 20 | 0.1% |
| Colombian | 26 | 0.1% |
| Cree | 23 | 0.1% |
| Creek | 42 | 0.1% |
| Cuban | 12 | 0.0% |
| Czech | 160 | 0.5% |
| Czechoslovakian | 7 | 0.0% |
| Danish | 82 | 0.3% |
| Dominican | 31 | 0.1% |
| Dutch | 293 | 0.9% |
| Eastern European | 40 | 0.1% |
| Egyptian | 183 | 0.6% |
| English | 4,142 | 13.2% |
| European | 384 | 1.2% |
| French | 568 | 1.8% |
| French Canadian | 108 | 0.3% |
| German | 4,377 | 13.9% |
| Greek | 101 | 0.3% |
| Guatemalan | 68 | 0.2% |
| Honduran | 135 | 0.4% |
| Hungarian | 66 | 0.2% |
| Indian (Asian) | 436 | 1.4% |
| Iranian | 121 | 0.4% |
| Irish | 2,479 | 7.9% |
| Italian | 1,626 | 5.2% |
| Kenyan | 19 | 0.1% |
| Korean | 93 | 0.3% |
| Lebanese | 99 | 0.3% |
| Lithuanian | 92 | 0.3% |
| Malaysian | 1 | 0.0% |
| Mexican | 1,851 | 5.9% |
| Mexican American Indian | 55 | 0.2% |
| Native Hawaiian | 31 | 0.1% |
| Nicaraguan | 69 | 0.2% |
| Nigerian | 304 | 1.0% |
| Northern European | 51 | 0.2% |
| Norwegian | 294 | 0.9% |
| Pakistani | 24 | 0.1% |
| Polish | 550 | 1.8% |
| Portuguese | 7 | 0.0% |
| Puerto Rican | 266 | 0.8% |
| Romanian | 50 | 0.2% |
| Russian | 212 | 0.7% |
| Salvadoran | 135 | 0.4% |
| Samoan | 20 | 0.1% |
| Scandinavian | 69 | 0.2% |
| Scotch-Irish | 426 | 1.3% |
| Scottish | 519 | 1.7% |
| Serbian | 12 | 0.0% |
| Slovak | 17 | 0.1% |
| Slovene | 261 | 0.8% |
| South African | 29 | 0.1% |
| South American | 176 | 0.6% |
| Spaniard | 255 | 0.8% |
| Spanish | 119 | 0.4% |
| Sri Lankan | 362 | 1.1% |
| Subsaharan African | 601 | 1.9% |
| Swedish | 380 | 1.2% |
| Swiss | 7 | 0.0% |
| Thai | 1,840 | 5.8% |
| Turkish | 31 | 0.1% |
| Ugandan | 24 | 0.1% |
| Ukrainian | 64 | 0.2% |
| Venezuelan | 22 | 0.1% |
| Vietnamese | 18 | 0.1% |
| Welsh | 238 | 0.8% |
| Yugoslavian | 4 | 0.0% | View All 87 Rows |
Immigrants in Prosper
The most numerous immigrant groups reported in Prosper came from Asia (2,097 | 6.7%), South Central Asia (1,584 | 5.0%), India (1,086 | 3.5%), Latin America (683 | 2.2%), and Europe (509 | 1.6%), together accounting for 18.9% of all Prosper residents.
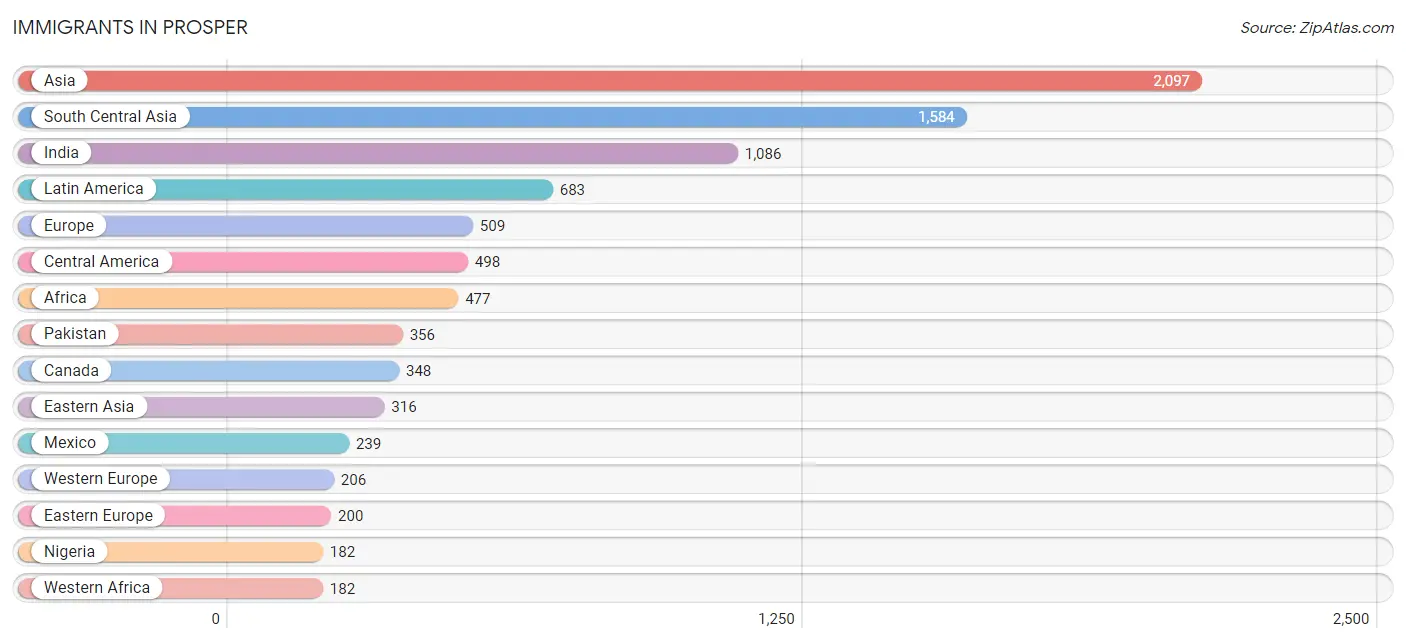
| Immigration Origin | # Population | % Population |
| Africa | 477 | 1.5% |
| Argentina | 24 | 0.1% |
| Asia | 2,097 | 6.7% |
| Australia | 14 | 0.0% |
| Bangladesh | 18 | 0.1% |
| Barbados | 58 | 0.2% |
| Belarus | 3 | 0.0% |
| Belgium | 117 | 0.4% |
| Brazil | 19 | 0.1% |
| Canada | 348 | 1.1% |
| Caribbean | 91 | 0.3% |
| Central America | 498 | 1.6% |
| Chile | 29 | 0.1% |
| China | 164 | 0.5% |
| Colombia | 8 | 0.0% |
| Cuba | 12 | 0.0% |
| Czechoslovakia | 8 | 0.0% |
| Dominican Republic | 21 | 0.1% |
| Eastern Africa | 124 | 0.4% |
| Eastern Asia | 316 | 1.0% |
| Eastern Europe | 200 | 0.6% |
| Egypt | 111 | 0.4% |
| El Salvador | 67 | 0.2% |
| England | 56 | 0.2% |
| Europe | 509 | 1.6% |
| Fiji | 28 | 0.1% |
| France | 16 | 0.1% |
| Germany | 73 | 0.2% |
| Guatemala | 31 | 0.1% |
| Honduras | 92 | 0.3% |
| India | 1,086 | 3.5% |
| Iran | 73 | 0.2% |
| Ireland | 25 | 0.1% |
| Italy | 10 | 0.0% |
| Japan | 43 | 0.1% |
| Kenya | 19 | 0.1% |
| Korea | 109 | 0.4% |
| Laos | 1 | 0.0% |
| Latin America | 683 | 2.2% |
| Malaysia | 25 | 0.1% |
| Mexico | 239 | 0.8% |
| Micronesia | 7 | 0.0% |
| Nepal | 51 | 0.2% |
| Nicaragua | 69 | 0.2% |
| Nigeria | 182 | 0.6% |
| Northern Africa | 111 | 0.4% |
| Northern Europe | 93 | 0.3% |
| Oceania | 49 | 0.2% |
| Pakistan | 356 | 1.1% |
| Philippines | 27 | 0.1% |
| Poland | 16 | 0.1% |
| Romania | 31 | 0.1% |
| Russia | 10 | 0.0% |
| South Africa | 60 | 0.2% |
| South America | 94 | 0.3% |
| South Central Asia | 1,584 | 5.0% |
| South Eastern Asia | 149 | 0.5% |
| Southern Europe | 10 | 0.0% |
| Sweden | 9 | 0.0% |
| Taiwan | 19 | 0.1% |
| Thailand | 1 | 0.0% |
| Turkey | 31 | 0.1% |
| Uganda | 105 | 0.3% |
| Ukraine | 25 | 0.1% |
| Venezuela | 14 | 0.0% |
| Vietnam | 95 | 0.3% |
| Western Africa | 182 | 0.6% |
| Western Asia | 48 | 0.2% |
| Western Europe | 206 | 0.6% | View All 69 Rows |
Sex and Age in Prosper
Sex and Age in Prosper
The most populous age groups in Prosper are 45 to 49 Years (1,804 | 11.1%) for men and 35 to 39 Years (1,639 | 10.8%) for women.
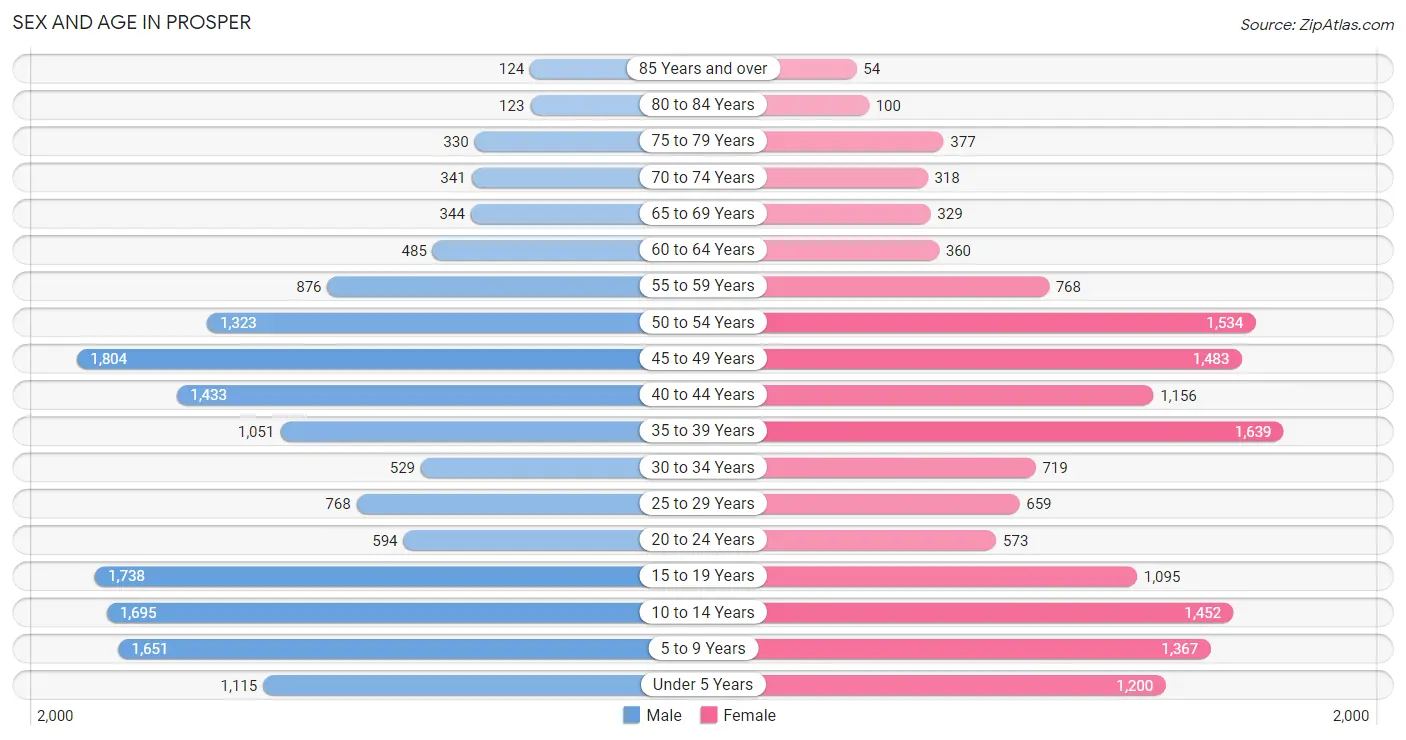
| Age Bracket | Male | Female |
| Under 5 Years | 1,115 (6.8%) | 1,200 (7.9%) |
| 5 to 9 Years | 1,651 (10.1%) | 1,367 (9.0%) |
| 10 to 14 Years | 1,695 (10.4%) | 1,452 (9.6%) |
| 15 to 19 Years | 1,738 (10.6%) | 1,095 (7.2%) |
| 20 to 24 Years | 594 (3.6%) | 573 (3.8%) |
| 25 to 29 Years | 768 (4.7%) | 659 (4.3%) |
| 30 to 34 Years | 529 (3.2%) | 719 (4.7%) |
| 35 to 39 Years | 1,051 (6.4%) | 1,639 (10.8%) |
| 40 to 44 Years | 1,433 (8.8%) | 1,156 (7.6%) |
| 45 to 49 Years | 1,804 (11.1%) | 1,483 (9.8%) |
| 50 to 54 Years | 1,323 (8.1%) | 1,534 (10.1%) |
| 55 to 59 Years | 876 (5.4%) | 768 (5.1%) |
| 60 to 64 Years | 485 (3.0%) | 360 (2.4%) |
| 65 to 69 Years | 344 (2.1%) | 329 (2.2%) |
| 70 to 74 Years | 341 (2.1%) | 318 (2.1%) |
| 75 to 79 Years | 330 (2.0%) | 377 (2.5%) |
| 80 to 84 Years | 123 (0.7%) | 100 (0.7%) |
| 85 Years and over | 124 (0.8%) | 54 (0.4%) |
| Total | 16,324 (100.0%) | 15,183 (100.0%) |
Families and Households in Prosper
Median Family Size in Prosper
The median family size in Prosper is 3.58 persons per family, with single female/mother families (425 | 5.1%) accounting for the largest median family size of 3.68 persons per family. On the other hand, single male/father families (374 | 4.5%) represent the smallest median family size with 2.69 persons per family.
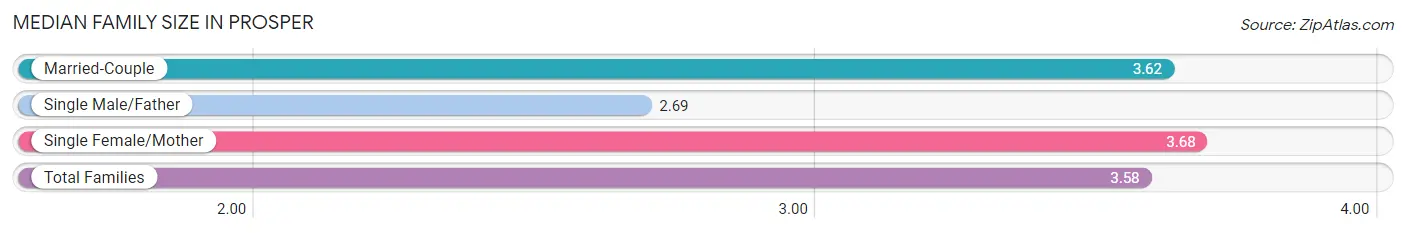
| Family Type | # Families | Family Size |
| Married-Couple | 7,542 (90.4%) | 3.62 |
| Single Male/Father | 374 (4.5%) | 2.69 |
| Single Female/Mother | 425 (5.1%) | 3.68 |
| Total Families | 8,341 (100.0%) | 3.58 |
Median Household Size in Prosper
The median household size in Prosper is 3.47 persons per household, with single female/mother households (425 | 4.7%) accounting for the largest median household size of 3.97 persons per household. non-family households (730 | 8.1%) represent the smallest median household size with 1.27 persons per household.
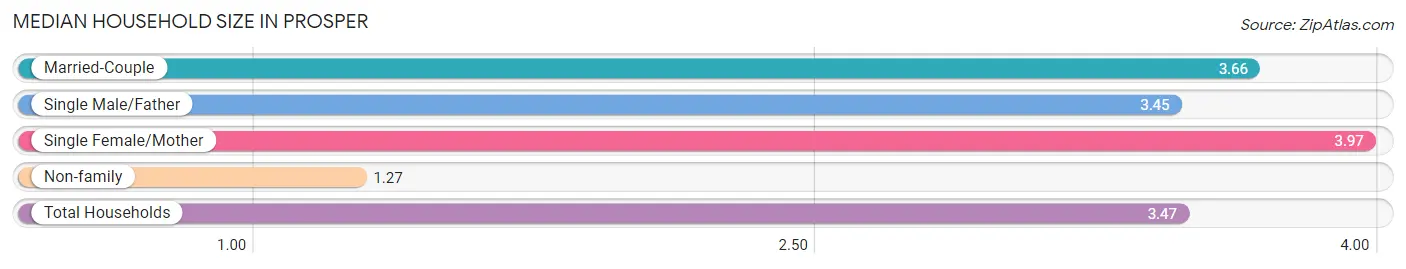
| Household Type | # Households | Household Size |
| Married-Couple | 7,542 (83.1%) | 3.66 |
| Single Male/Father | 374 (4.1%) | 3.45 |
| Single Female/Mother | 425 (4.7%) | 3.97 |
| Non-family | 730 (8.1%) | 1.27 |
| Total Households | 9,071 (100.0%) | 3.47 |
Household Size by Marriage Status in Prosper
Out of a total of 9,071 households in Prosper, 8,341 (91.9%) are family households, while 730 (8.1%) are nonfamily households. The most numerous type of family households are 4-person households, comprising 3,123, and the most common type of nonfamily households are 1-person households, comprising 559.
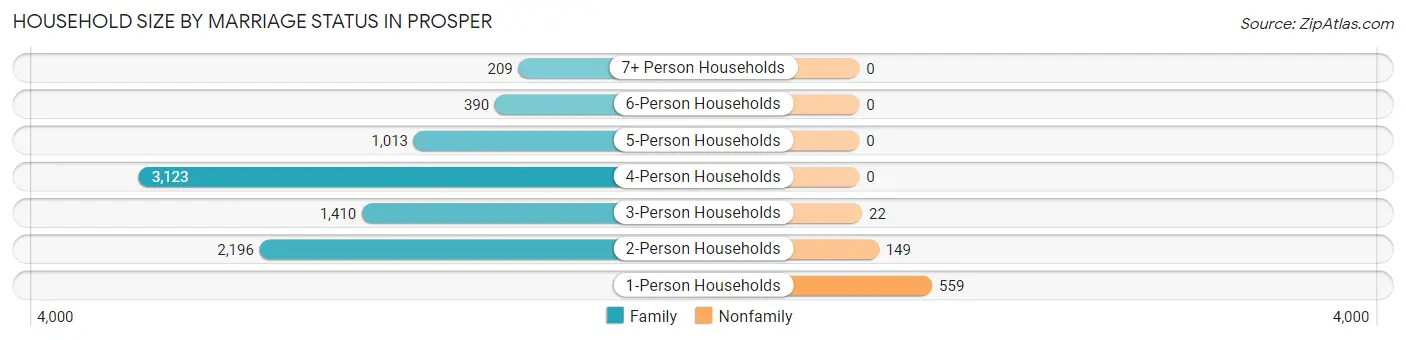
| Household Size | Family Households | Nonfamily Households |
| 1-Person Households | - | 559 (6.2%) |
| 2-Person Households | 2,196 (24.2%) | 149 (1.6%) |
| 3-Person Households | 1,410 (15.5%) | 22 (0.2%) |
| 4-Person Households | 3,123 (34.4%) | 0 (0.0%) |
| 5-Person Households | 1,013 (11.2%) | 0 (0.0%) |
| 6-Person Households | 390 (4.3%) | 0 (0.0%) |
| 7+ Person Households | 209 (2.3%) | 0 (0.0%) |
| Total | 8,341 (91.9%) | 730 (8.1%) |
Female Fertility in Prosper
Fertility by Age in Prosper
Average fertility rate in Prosper is 54.0 births per 1,000 women. Women in the age bracket of 20 to 34 years have the highest fertility rate with 121.0 births per 1,000 women. Women in the age bracket of 20 to 34 years acount for 55.9% of all women with births.
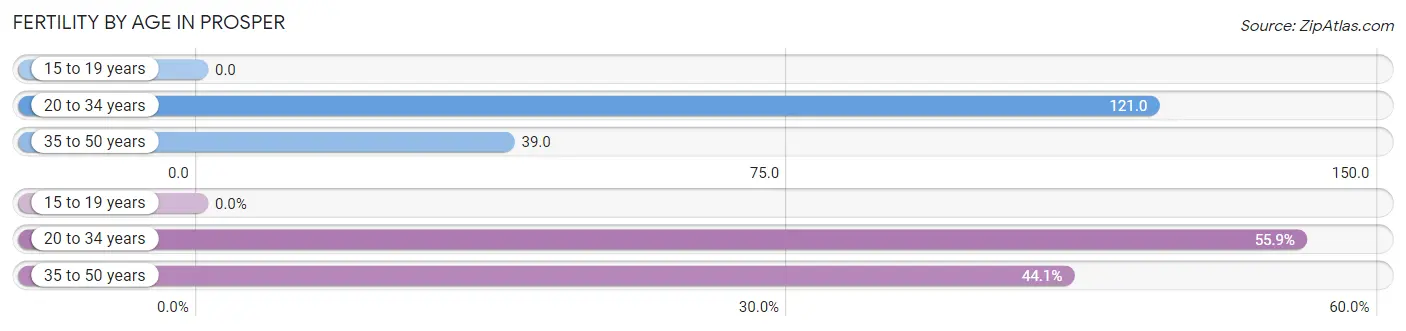
| Age Bracket | Women with Births | Births / 1,000 Women |
| 15 to 19 years | 0 (0.0%) | 0.0 |
| 20 to 34 years | 236 (55.9%) | 121.0 |
| 35 to 50 years | 186 (44.1%) | 39.0 |
| Total | 422 (100.0%) | 54.0 |
Fertility by Age by Marriage Status in Prosper
96.9% of women with births (422) in Prosper are married. The highest percentage of unmarried women with births falls into 35 to 50 years age bracket with 7.0% of them unmarried at the time of birth, while the lowest percentage of unmarried women with births belong to 20 to 34 years age bracket with 0.0% of them unmarried.
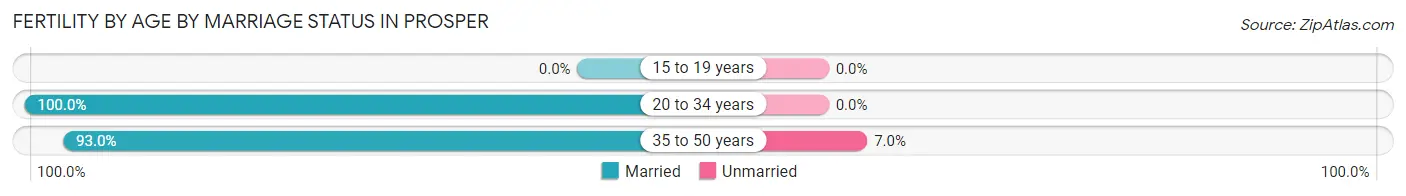
| Age Bracket | Married | Unmarried |
| 15 to 19 years | 0 (0.0%) | 0 (0.0%) |
| 20 to 34 years | 236 (100.0%) | 0 (0.0%) |
| 35 to 50 years | 173 (93.0%) | 13 (7.0%) |
| Total | 409 (96.9%) | 13 (3.1%) |
Fertility by Education in Prosper
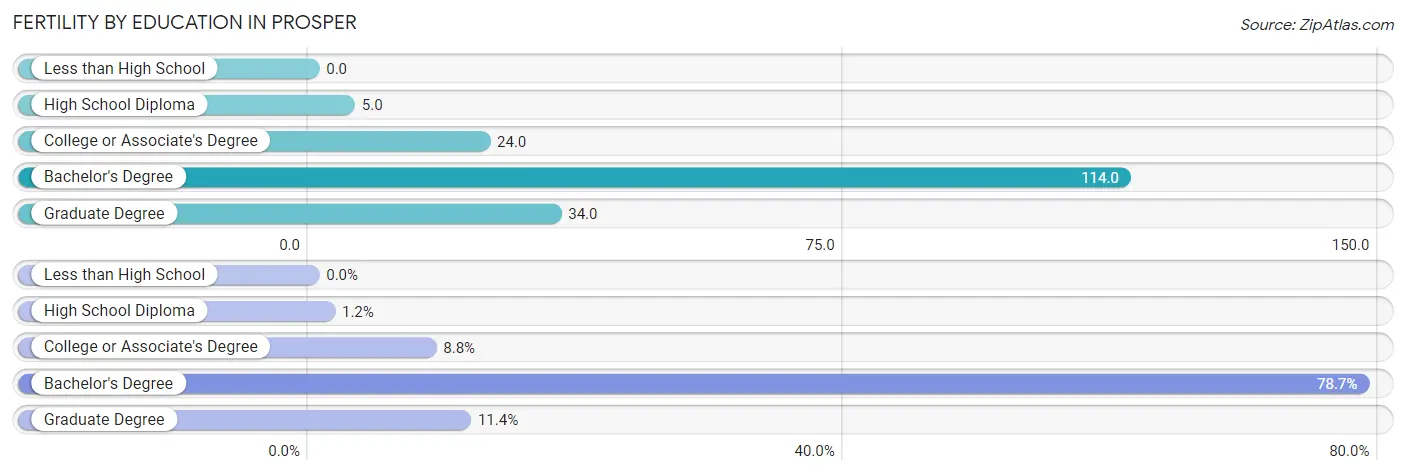
| Educational Attainment | Women with Births | Births / 1,000 Women |
| Less than High School | 0 (0.0%) | 0.0 |
| High School Diploma | 5 (1.2%) | 5.0 |
| College or Associate's Degree | 37 (8.8%) | 24.0 |
| Bachelor's Degree | 332 (78.7%) | 114.0 |
| Graduate Degree | 48 (11.4%) | 34.0 |
| Total | 422 (100.0%) | 54.0 |
Fertility by Education by Marriage Status in Prosper
3.1% of women with births in Prosper are unmarried. Women with the educational attainment of high school diploma are most likely to be married with 100.0% of them married at childbirth, while women with the educational attainment of college or associate's degree are least likely to be married with 35.1% of them unmarried at childbirth.
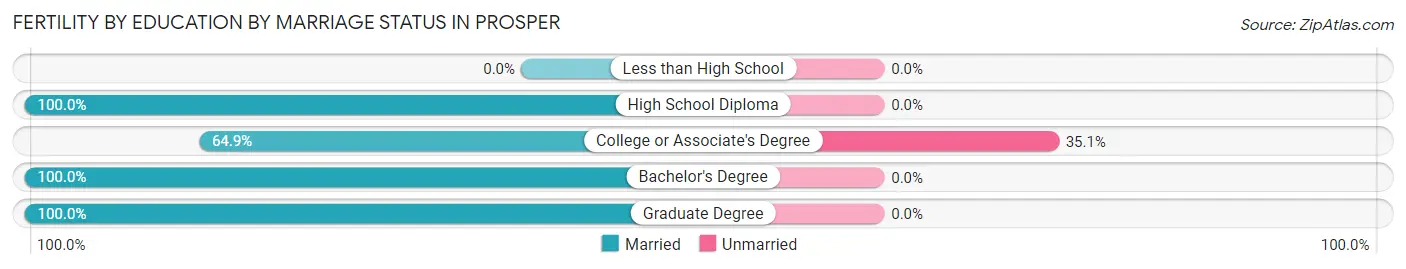
| Educational Attainment | Married | Unmarried |
| Less than High School | 0 (0.0%) | 0 (0.0%) |
| High School Diploma | 5 (100.0%) | 0 (0.0%) |
| College or Associate's Degree | 24 (64.9%) | 13 (35.1%) |
| Bachelor's Degree | 332 (100.0%) | 0 (0.0%) |
| Graduate Degree | 48 (100.0%) | 0 (0.0%) |
| Total | 409 (96.9%) | 13 (3.1%) |
Employment Characteristics in Prosper
Employment by Class of Employer in Prosper
Among the 14,684 employed individuals in Prosper, private company employees (11,114 | 75.7%), self-employed (not incorporated) (900 | 6.1%), and local government employees (845 | 5.8%) make up the most common classes of employment.
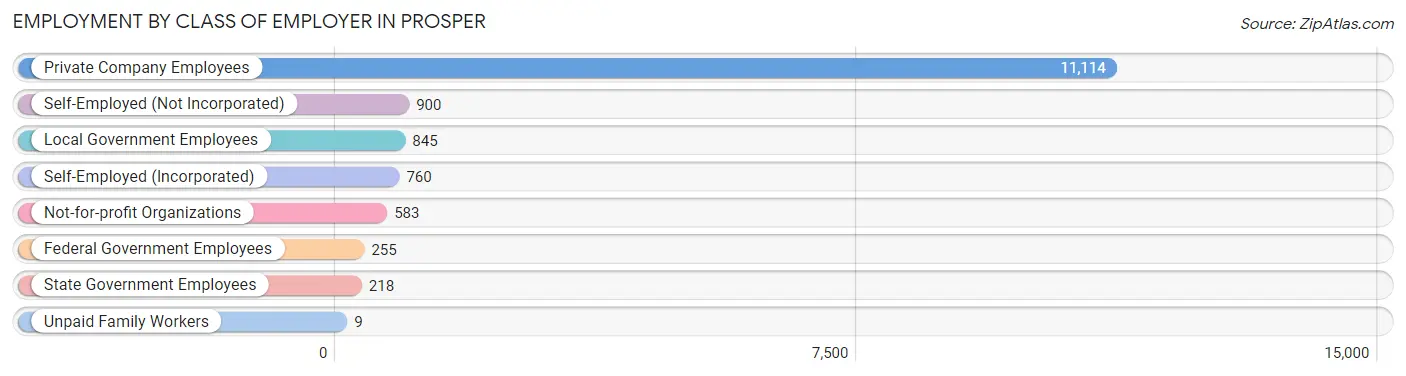
| Employer Class | # Employees | % Employees |
| Private Company Employees | 11,114 | 75.7% |
| Self-Employed (Incorporated) | 760 | 5.2% |
| Self-Employed (Not Incorporated) | 900 | 6.1% |
| Not-for-profit Organizations | 583 | 4.0% |
| Local Government Employees | 845 | 5.8% |
| State Government Employees | 218 | 1.5% |
| Federal Government Employees | 255 | 1.7% |
| Unpaid Family Workers | 9 | 0.1% |
| Total | 14,684 | 100.0% |
Employment Status by Age in Prosper
According to the labor force statistics for Prosper, out of the total population over 16 years of age (22,272), 70.4% or 15,679 individuals are in the labor force, with 4.5% or 706 of them unemployed. The age group with the highest labor force participation rate is 25 to 29 years, with 91.6% or 1,307 individuals in the labor force. Within the labor force, the 16 to 19 years age range has the highest percentage of unemployed individuals, with 13.6% or 93 of them being unemployed.
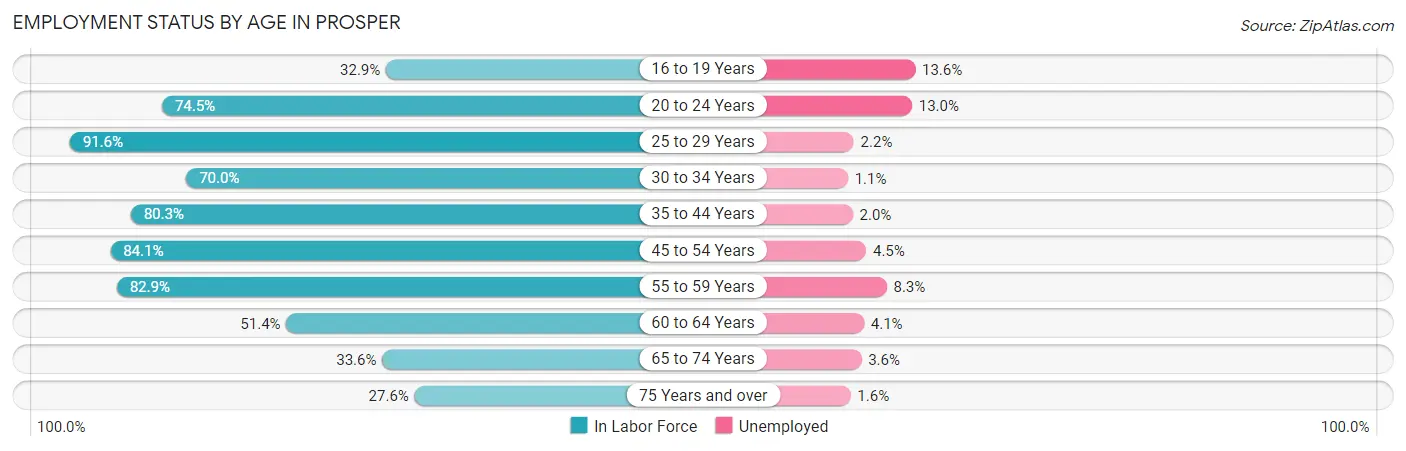
| Age Bracket | In Labor Force | Unemployed |
| 16 to 19 Years | 684 (32.9%) | 93 (13.6%) |
| 20 to 24 Years | 869 (74.5%) | 113 (13.0%) |
| 25 to 29 Years | 1,307 (91.6%) | 29 (2.2%) |
| 30 to 34 Years | 874 (70.0%) | 10 (1.1%) |
| 35 to 44 Years | 4,239 (80.3%) | 85 (2.0%) |
| 45 to 54 Years | 5,167 (84.1%) | 233 (4.5%) |
| 55 to 59 Years | 1,363 (82.9%) | 113 (8.3%) |
| 60 to 64 Years | 434 (51.4%) | 18 (4.1%) |
| 65 to 74 Years | 448 (33.6%) | 16 (3.6%) |
| 75 Years and over | 306 (27.6%) | 5 (1.6%) |
| Total | 15,679 (70.4%) | 706 (4.5%) |
Employment Status by Educational Attainment in Prosper
According to labor force statistics for Prosper, 80.7% of individuals (13,386) out of the total population between 25 and 64 years of age (16,587) are in the labor force, with 3.6% or 482 of them being unemployed. The group with the highest labor force participation rate are those with the educational attainment of bachelor's degree or higher, with 84.1% or 9,472 individuals in the labor force. Within the labor force, individuals with college / associate degree education have the highest percentage of unemployment, with 9.2% or 230 of them being unemployed.
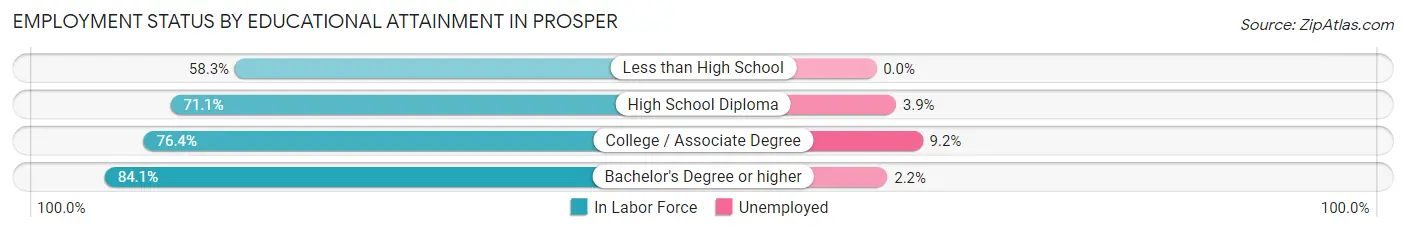
| Educational Attainment | In Labor Force | Unemployed |
| Less than High School | 194 (58.3%) | 0 (0.0%) |
| High School Diploma | 1,220 (71.1%) | 67 (3.9%) |
| College / Associate Degree | 2,502 (76.4%) | 301 (9.2%) |
| Bachelor's Degree or higher | 9,472 (84.1%) | 248 (2.2%) |
| Total | 13,386 (80.7%) | 597 (3.6%) |
Employment Occupations by Sex in Prosper
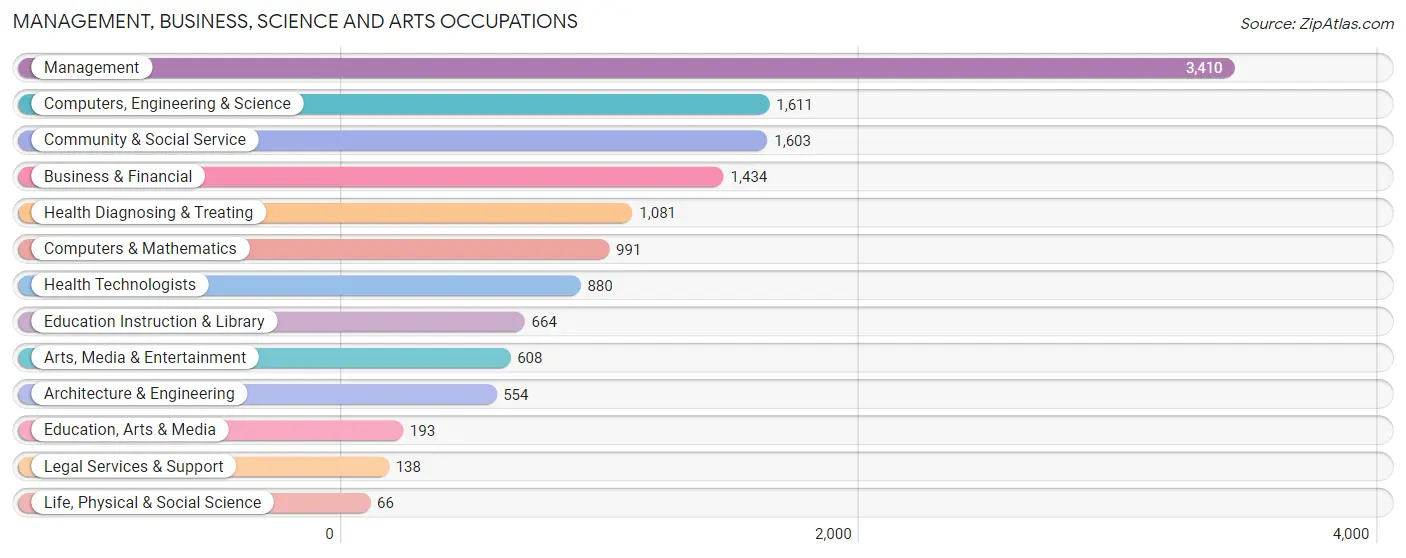
Management, Business, Science and Arts Occupations
The most common Management, Business, Science and Arts occupations in Prosper are Management (3,410 | 22.9%), Computers, Engineering & Science (1,611 | 10.8%), Community & Social Service (1,603 | 10.7%), Business & Financial (1,434 | 9.6%), and Health Diagnosing & Treating (1,081 | 7.2%).
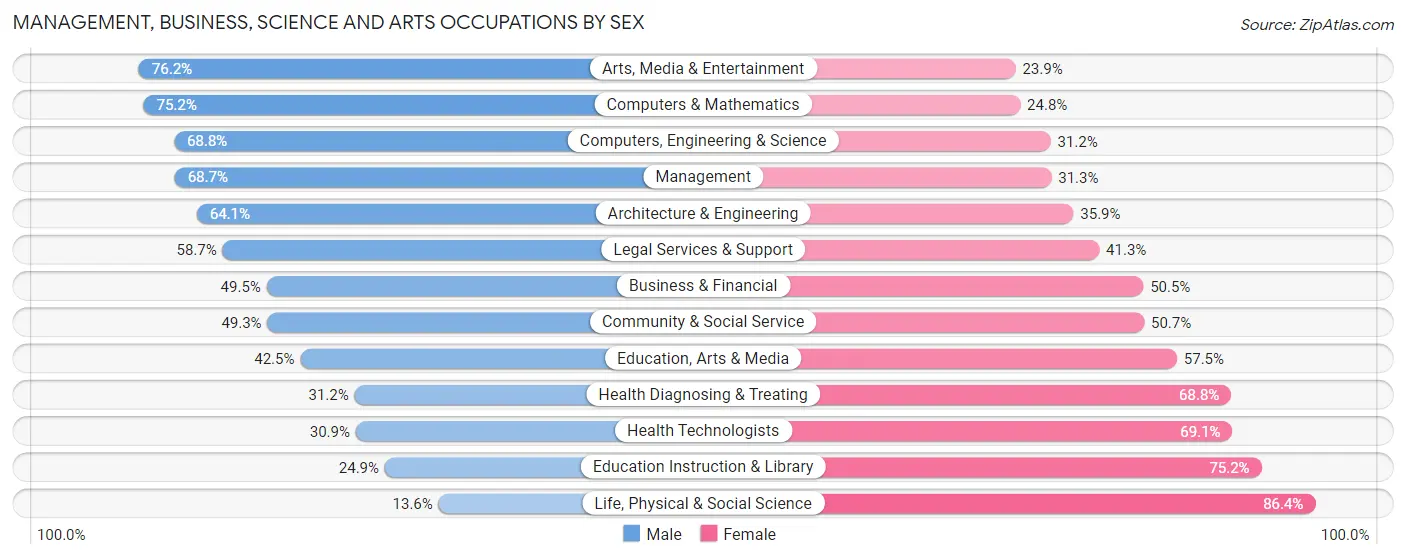
Management, Business, Science and Arts Occupations by Sex
Within the Management, Business, Science and Arts occupations in Prosper, the most male-oriented occupations are Arts, Media & Entertainment (76.1%), Computers & Mathematics (75.2%), and Computers, Engineering & Science (68.8%), while the most female-oriented occupations are Life, Physical & Social Science (86.4%), Education Instruction & Library (75.1%), and Health Technologists (69.1%).
| Occupation | Male | Female |
| Management | 2,342 (68.7%) | 1,068 (31.3%) |
| Business & Financial | 710 (49.5%) | 724 (50.5%) |
| Computers, Engineering & Science | 1,109 (68.8%) | 502 (31.2%) |
| Computers & Mathematics | 745 (75.2%) | 246 (24.8%) |
| Architecture & Engineering | 355 (64.1%) | 199 (35.9%) |
| Life, Physical & Social Science | 9 (13.6%) | 57 (86.4%) |
| Community & Social Service | 791 (49.3%) | 812 (50.7%) |
| Education, Arts & Media | 82 (42.5%) | 111 (57.5%) |
| Legal Services & Support | 81 (58.7%) | 57 (41.3%) |
| Education Instruction & Library | 165 (24.8%) | 499 (75.1%) |
| Arts, Media & Entertainment | 463 (76.1%) | 145 (23.8%) |
| Health Diagnosing & Treating | 337 (31.2%) | 744 (68.8%) |
| Health Technologists | 272 (30.9%) | 608 (69.1%) |
| Total (Category) | 5,289 (57.9%) | 3,850 (42.1%) |
| Total (Overall) | 8,733 (58.5%) | 6,190 (41.5%) |
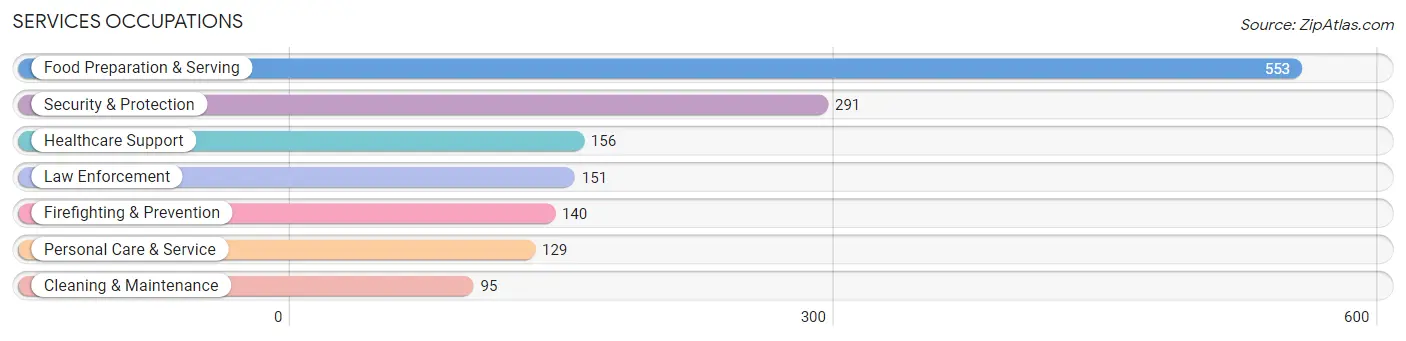
Services Occupations
The most common Services occupations in Prosper are Food Preparation & Serving (553 | 3.7%), Security & Protection (291 | 1.9%), Healthcare Support (156 | 1.1%), Law Enforcement (151 | 1.0%), and Firefighting & Prevention (140 | 0.9%).
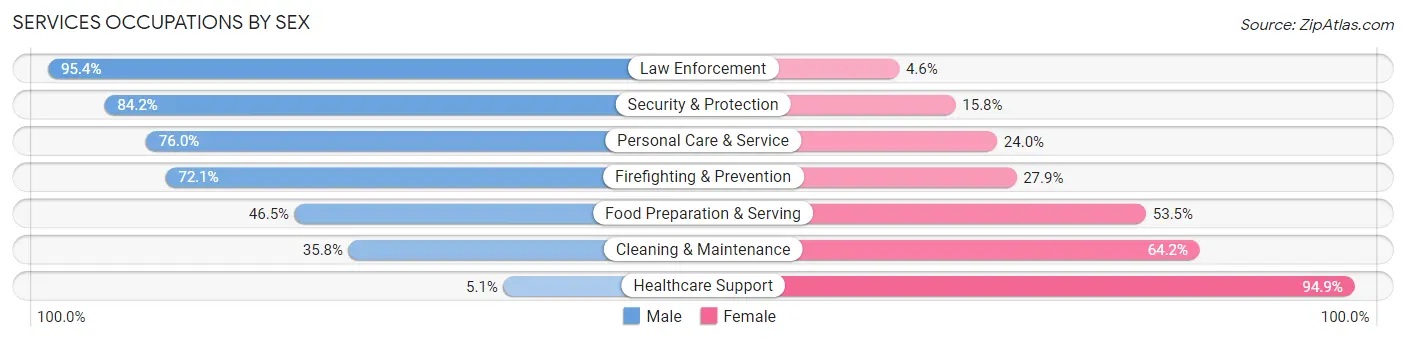
Services Occupations by Sex
Within the Services occupations in Prosper, the most male-oriented occupations are Law Enforcement (95.4%), Security & Protection (84.2%), and Personal Care & Service (76.0%), while the most female-oriented occupations are Healthcare Support (94.9%), Cleaning & Maintenance (64.2%), and Food Preparation & Serving (53.5%).
| Occupation | Male | Female |
| Healthcare Support | 8 (5.1%) | 148 (94.9%) |
| Security & Protection | 245 (84.2%) | 46 (15.8%) |
| Firefighting & Prevention | 101 (72.1%) | 39 (27.9%) |
| Law Enforcement | 144 (95.4%) | 7 (4.6%) |
| Food Preparation & Serving | 257 (46.5%) | 296 (53.5%) |
| Cleaning & Maintenance | 34 (35.8%) | 61 (64.2%) |
| Personal Care & Service | 98 (76.0%) | 31 (24.0%) |
| Total (Category) | 642 (52.4%) | 582 (47.5%) |
| Total (Overall) | 8,733 (58.5%) | 6,190 (41.5%) |
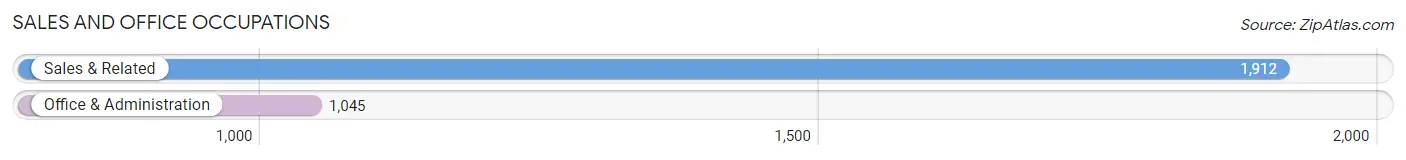
Sales and Office Occupations
The most common Sales and Office occupations in Prosper are Sales & Related (1,912 | 12.8%), and Office & Administration (1,045 | 7.0%).
Sales and Office Occupations by Sex
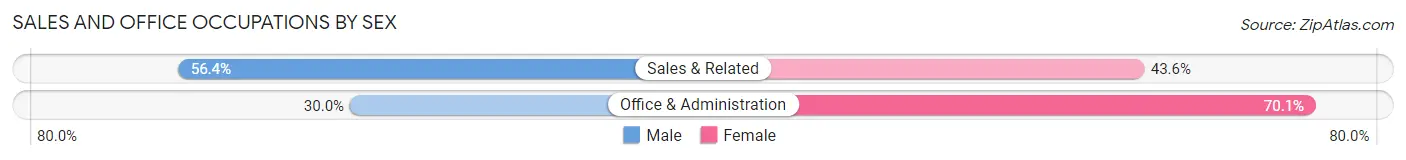
| Occupation | Male | Female |
| Sales & Related | 1,079 (56.4%) | 833 (43.6%) |
| Office & Administration | 313 (29.9%) | 732 (70.1%) |
| Total (Category) | 1,392 (47.1%) | 1,565 (52.9%) |
| Total (Overall) | 8,733 (58.5%) | 6,190 (41.5%) |
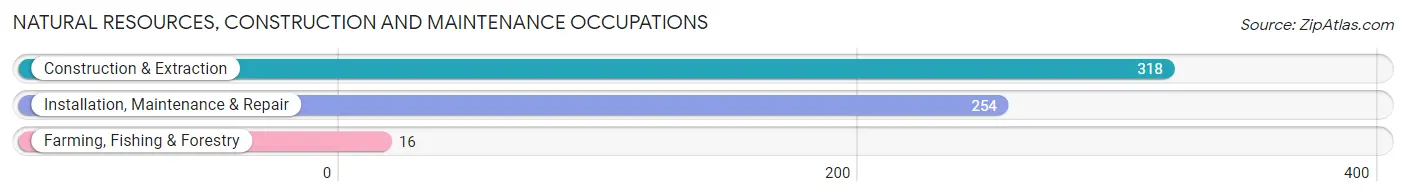
Natural Resources, Construction and Maintenance Occupations
The most common Natural Resources, Construction and Maintenance occupations in Prosper are Construction & Extraction (318 | 2.1%), Installation, Maintenance & Repair (254 | 1.7%), and Farming, Fishing & Forestry (16 | 0.1%).
Natural Resources, Construction and Maintenance Occupations by Sex
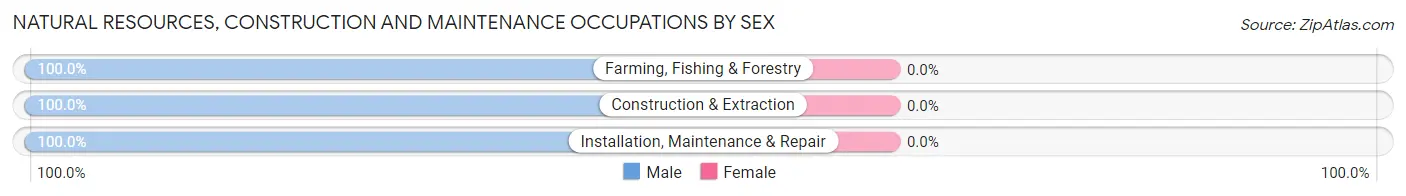
| Occupation | Male | Female |
| Farming, Fishing & Forestry | 16 (100.0%) | 0 (0.0%) |
| Construction & Extraction | 318 (100.0%) | 0 (0.0%) |
| Installation, Maintenance & Repair | 254 (100.0%) | 0 (0.0%) |
| Total (Category) | 588 (100.0%) | 0 (0.0%) |
| Total (Overall) | 8,733 (58.5%) | 6,190 (41.5%) |
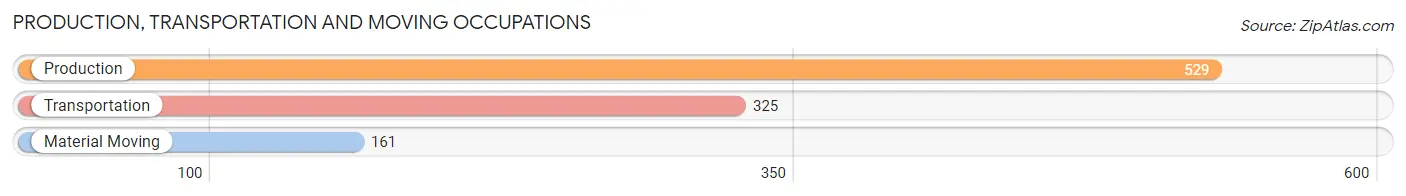
Production, Transportation and Moving Occupations
The most common Production, Transportation and Moving occupations in Prosper are Production (529 | 3.5%), Transportation (325 | 2.2%), and Material Moving (161 | 1.1%).
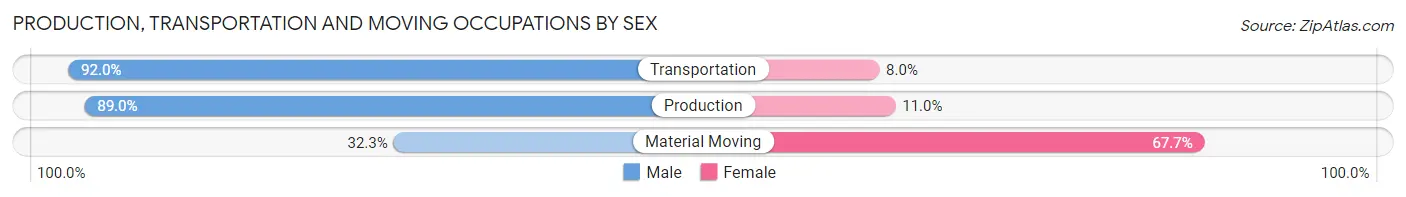
Production, Transportation and Moving Occupations by Sex
| Occupation | Male | Female |
| Production | 471 (89.0%) | 58 (11.0%) |
| Transportation | 299 (92.0%) | 26 (8.0%) |
| Material Moving | 52 (32.3%) | 109 (67.7%) |
| Total (Category) | 822 (81.0%) | 193 (19.0%) |
| Total (Overall) | 8,733 (58.5%) | 6,190 (41.5%) |
Employment Industries by Sex in Prosper
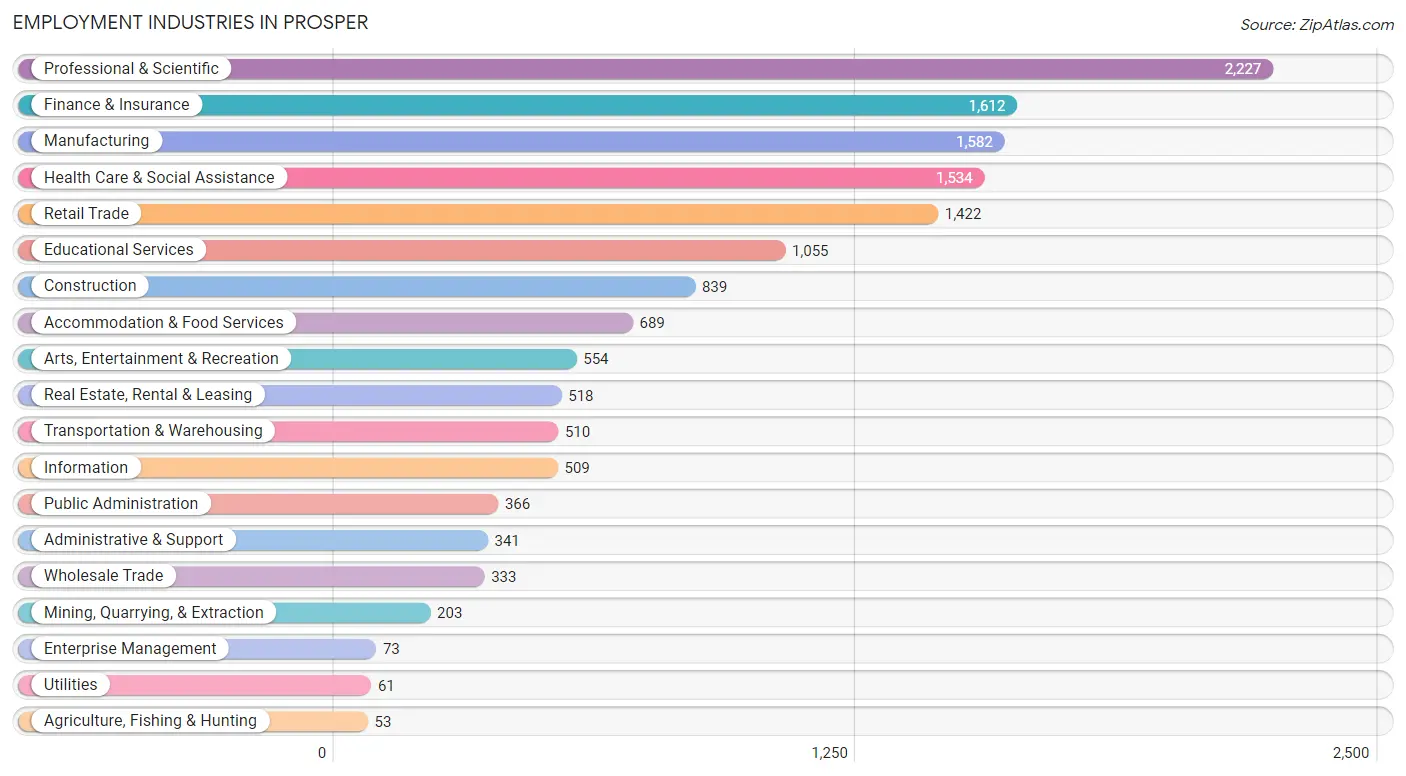
Employment Industries in Prosper
The major employment industries in Prosper include Professional & Scientific (2,227 | 14.9%), Finance & Insurance (1,612 | 10.8%), Manufacturing (1,582 | 10.6%), Health Care & Social Assistance (1,534 | 10.3%), and Retail Trade (1,422 | 9.5%).
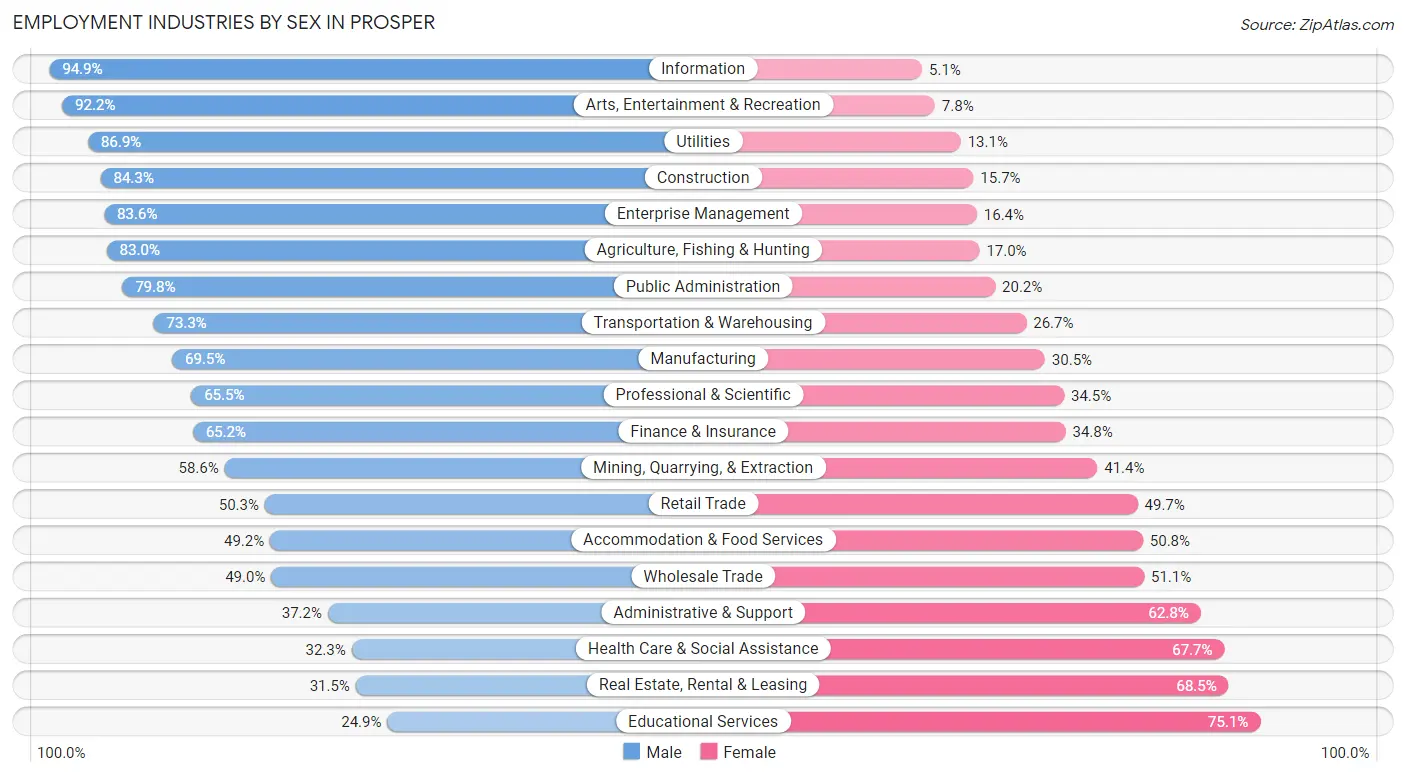
Employment Industries by Sex in Prosper
The Prosper industries that see more men than women are Information (94.9%), Arts, Entertainment & Recreation (92.2%), and Utilities (86.9%), whereas the industries that tend to have a higher number of women are Educational Services (75.1%), Real Estate, Rental & Leasing (68.5%), and Health Care & Social Assistance (67.7%).
| Industry | Male | Female |
| Agriculture, Fishing & Hunting | 44 (83.0%) | 9 (17.0%) |
| Mining, Quarrying, & Extraction | 119 (58.6%) | 84 (41.4%) |
| Construction | 707 (84.3%) | 132 (15.7%) |
| Manufacturing | 1,099 (69.5%) | 483 (30.5%) |
| Wholesale Trade | 163 (48.9%) | 170 (51.0%) |
| Retail Trade | 715 (50.3%) | 707 (49.7%) |
| Transportation & Warehousing | 374 (73.3%) | 136 (26.7%) |
| Utilities | 53 (86.9%) | 8 (13.1%) |
| Information | 483 (94.9%) | 26 (5.1%) |
| Finance & Insurance | 1,051 (65.2%) | 561 (34.8%) |
| Real Estate, Rental & Leasing | 163 (31.5%) | 355 (68.5%) |
| Professional & Scientific | 1,459 (65.5%) | 768 (34.5%) |
| Enterprise Management | 61 (83.6%) | 12 (16.4%) |
| Administrative & Support | 127 (37.2%) | 214 (62.8%) |
| Educational Services | 263 (24.9%) | 792 (75.1%) |
| Health Care & Social Assistance | 496 (32.3%) | 1,038 (67.7%) |
| Arts, Entertainment & Recreation | 511 (92.2%) | 43 (7.8%) |
| Accommodation & Food Services | 339 (49.2%) | 350 (50.8%) |
| Public Administration | 292 (79.8%) | 74 (20.2%) |
| Total | 8,733 (58.5%) | 6,190 (41.5%) |
Education in Prosper
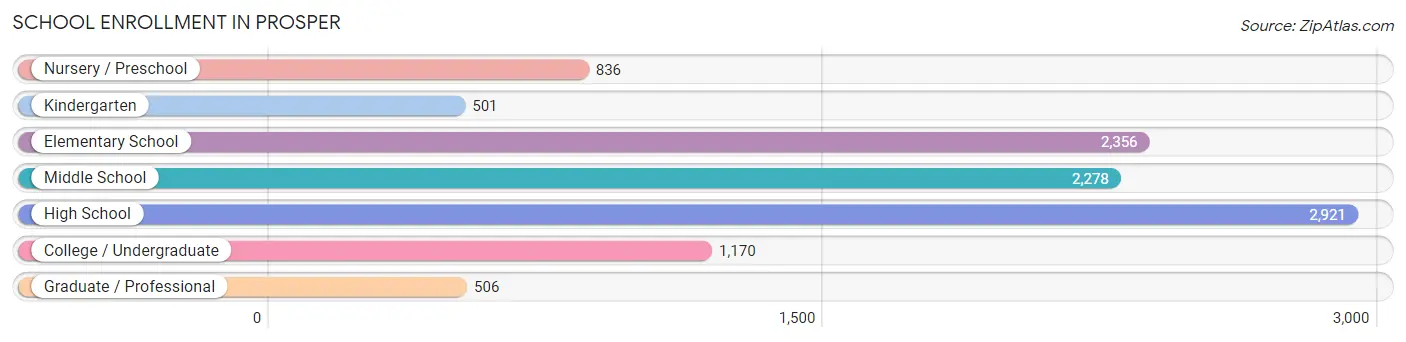
School Enrollment in Prosper
The most common levels of schooling among the 10,568 students in Prosper are high school (2,921 | 27.6%), elementary school (2,356 | 22.3%), and middle school (2,278 | 21.6%).
| School Level | # Students | % Students |
| Nursery / Preschool | 836 | 7.9% |
| Kindergarten | 501 | 4.7% |
| Elementary School | 2,356 | 22.3% |
| Middle School | 2,278 | 21.6% |
| High School | 2,921 | 27.6% |
| College / Undergraduate | 1,170 | 11.1% |
| Graduate / Professional | 506 | 4.8% |
| Total | 10,568 | 100.0% |
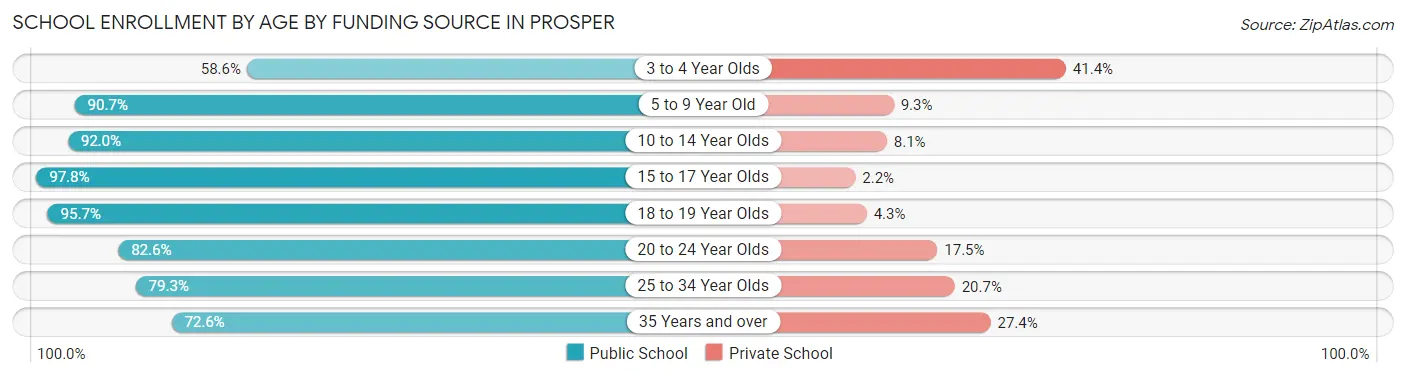
School Enrollment by Age by Funding Source in Prosper
Out of a total of 10,568 students who are enrolled in schools in Prosper, 1,131 (10.7%) attend a private institution, while the remaining 9,437 (89.3%) are enrolled in public schools. The age group of 3 to 4 year olds has the highest likelihood of being enrolled in private schools, with 226 (41.4% in the age bracket) enrolled. Conversely, the age group of 15 to 17 year olds has the lowest likelihood of being enrolled in a private school, with 1,843 (97.8% in the age bracket) attending a public institution.
| Age Bracket | Public School | Private School |
| 3 to 4 Year Olds | 320 (58.6%) | 226 (41.4%) |
| 5 to 9 Year Old | 2,618 (90.7%) | 269 (9.3%) |
| 10 to 14 Year Olds | 2,868 (91.9%) | 251 (8.1%) |
| 15 to 17 Year Olds | 1,843 (97.8%) | 41 (2.2%) |
| 18 to 19 Year Olds | 667 (95.7%) | 30 (4.3%) |
| 20 to 24 Year Olds | 421 (82.6%) | 89 (17.4%) |
| 25 to 34 Year Olds | 322 (79.3%) | 84 (20.7%) |
| 35 Years and over | 377 (72.6%) | 142 (27.4%) |
| Total | 9,437 (89.3%) | 1,131 (10.7%) |
Educational Attainment by Field of Study in Prosper
Business (4,102 | 31.0%), engineering (1,340 | 10.1%), science & technology (1,002 | 7.6%), arts & humanities (964 | 7.3%), and education (884 | 6.7%) are the most common fields of study among 13,238 individuals in Prosper who have obtained a bachelor's degree or higher.
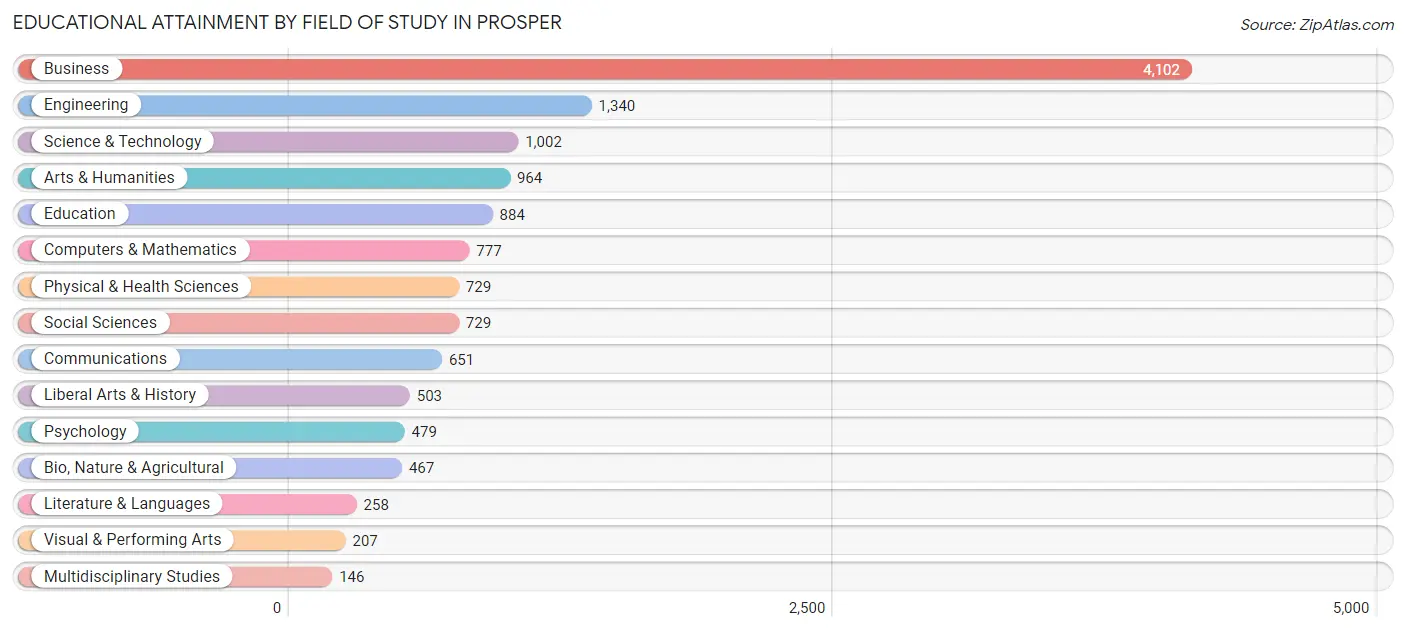
| Field of Study | # Graduates | % Graduates |
| Computers & Mathematics | 777 | 5.9% |
| Bio, Nature & Agricultural | 467 | 3.5% |
| Physical & Health Sciences | 729 | 5.5% |
| Psychology | 479 | 3.6% |
| Social Sciences | 729 | 5.5% |
| Engineering | 1,340 | 10.1% |
| Multidisciplinary Studies | 146 | 1.1% |
| Science & Technology | 1,002 | 7.6% |
| Business | 4,102 | 31.0% |
| Education | 884 | 6.7% |
| Literature & Languages | 258 | 1.9% |
| Liberal Arts & History | 503 | 3.8% |
| Visual & Performing Arts | 207 | 1.6% |
| Communications | 651 | 4.9% |
| Arts & Humanities | 964 | 7.3% |
| Total | 13,238 | 100.0% |
Transportation & Commute in Prosper
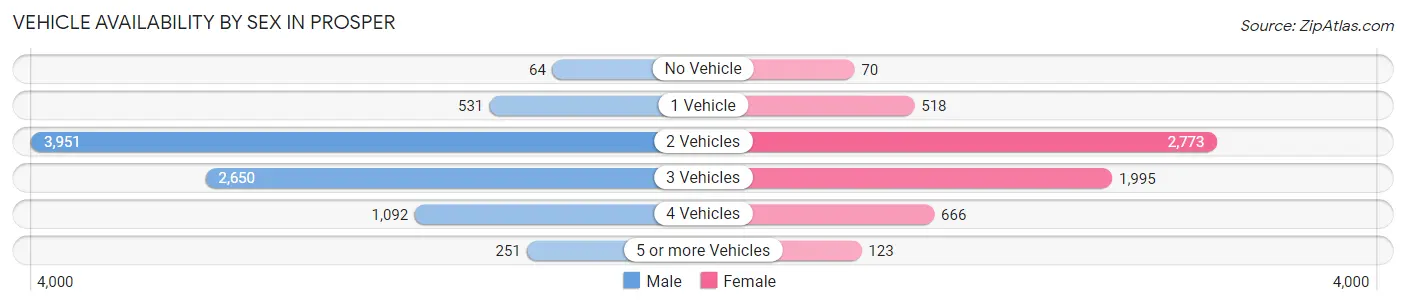
Vehicle Availability by Sex in Prosper
The most prevalent vehicle ownership categories in Prosper are males with 2 vehicles (3,951, accounting for 46.3%) and females with 2 vehicles (2,773, making up 64.3%).
| Vehicles Available | Male | Female |
| No Vehicle | 64 (0.7%) | 70 (1.1%) |
| 1 Vehicle | 531 (6.2%) | 518 (8.4%) |
| 2 Vehicles | 3,951 (46.3%) | 2,773 (45.1%) |
| 3 Vehicles | 2,650 (31.0%) | 1,995 (32.5%) |
| 4 Vehicles | 1,092 (12.8%) | 666 (10.8%) |
| 5 or more Vehicles | 251 (2.9%) | 123 (2.0%) |
| Total | 8,539 (100.0%) | 6,145 (100.0%) |
Commute Time in Prosper
The most frequently occuring commute durations in Prosper are 45 to 59 minutes (1,641 commuters, 16.4%), 30 to 34 minutes (1,516 commuters, 15.2%), and 20 to 24 minutes (1,364 commuters, 13.7%).
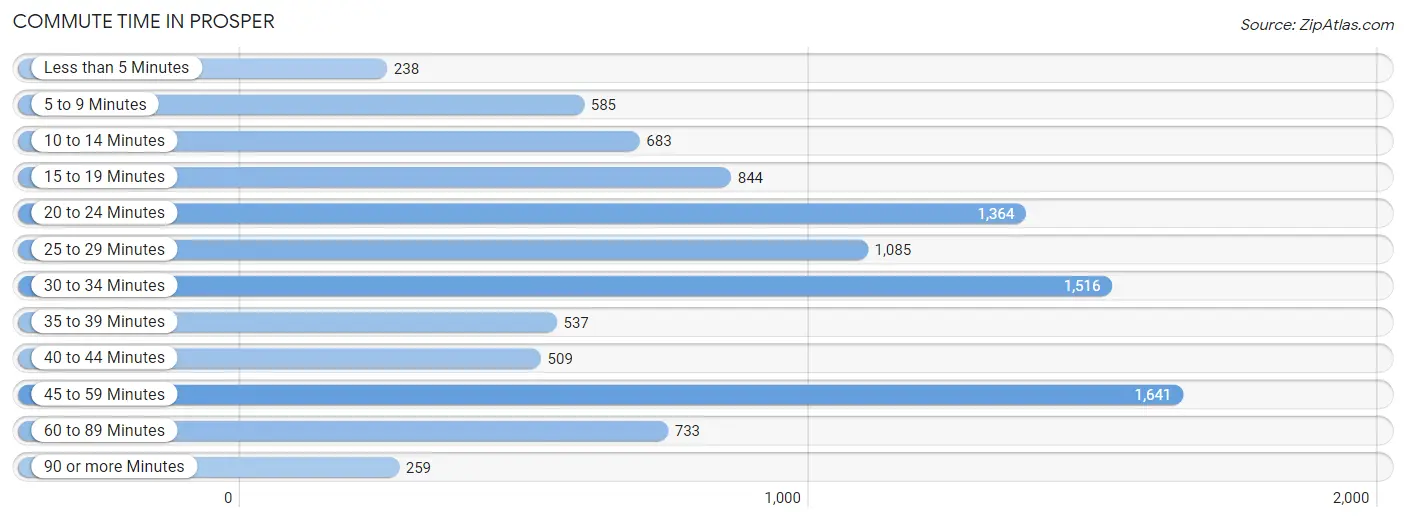
| Commute Time | # Commuters | % Commuters |
| Less than 5 Minutes | 238 | 2.4% |
| 5 to 9 Minutes | 585 | 5.9% |
| 10 to 14 Minutes | 683 | 6.8% |
| 15 to 19 Minutes | 844 | 8.5% |
| 20 to 24 Minutes | 1,364 | 13.7% |
| 25 to 29 Minutes | 1,085 | 10.9% |
| 30 to 34 Minutes | 1,516 | 15.2% |
| 35 to 39 Minutes | 537 | 5.4% |
| 40 to 44 Minutes | 509 | 5.1% |
| 45 to 59 Minutes | 1,641 | 16.4% |
| 60 to 89 Minutes | 733 | 7.3% |
| 90 or more Minutes | 259 | 2.6% |
Commute Time by Sex in Prosper
The most common commute times in Prosper are 45 to 59 minutes (1,096 commuters, 18.8%) for males and 20 to 24 minutes (604 commuters, 14.5%) for females.
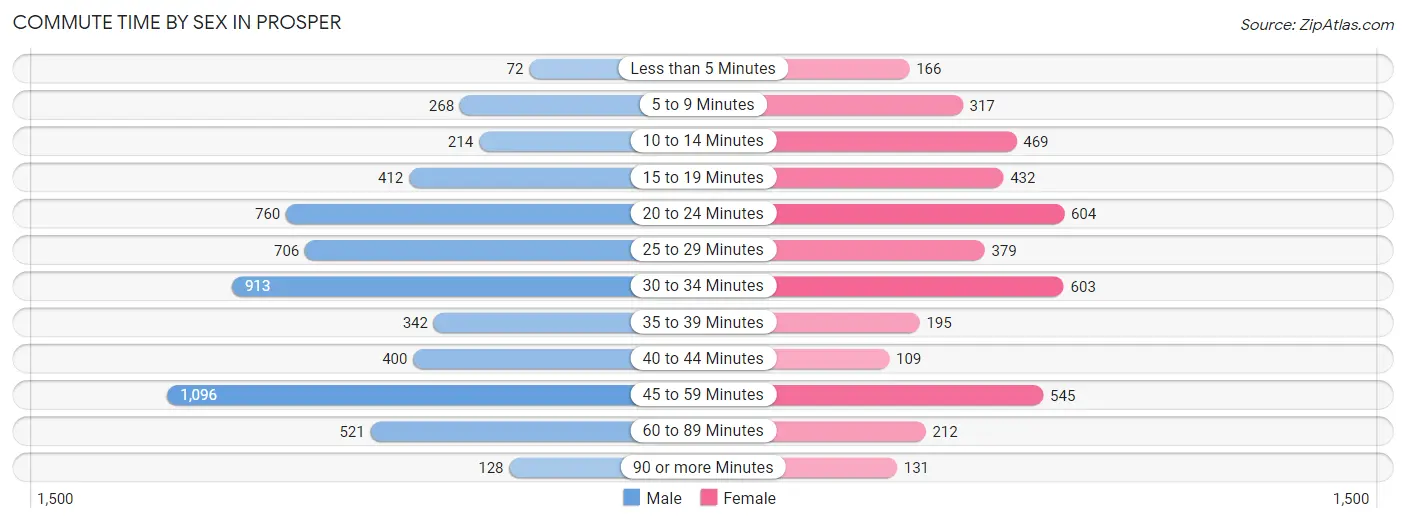
| Commute Time | Male | Female |
| Less than 5 Minutes | 72 (1.2%) | 166 (4.0%) |
| 5 to 9 Minutes | 268 (4.6%) | 317 (7.6%) |
| 10 to 14 Minutes | 214 (3.7%) | 469 (11.3%) |
| 15 to 19 Minutes | 412 (7.1%) | 432 (10.4%) |
| 20 to 24 Minutes | 760 (13.0%) | 604 (14.5%) |
| 25 to 29 Minutes | 706 (12.1%) | 379 (9.1%) |
| 30 to 34 Minutes | 913 (15.7%) | 603 (14.5%) |
| 35 to 39 Minutes | 342 (5.9%) | 195 (4.7%) |
| 40 to 44 Minutes | 400 (6.9%) | 109 (2.6%) |
| 45 to 59 Minutes | 1,096 (18.8%) | 545 (13.1%) |
| 60 to 89 Minutes | 521 (8.9%) | 212 (5.1%) |
| 90 or more Minutes | 128 (2.2%) | 131 (3.2%) |
Time of Departure to Work by Sex in Prosper
The most frequent times of departure to work in Prosper are 7:00 AM to 7:29 AM (1,019, 17.5%) for males and 7:00 AM to 7:29 AM (872, 20.9%) for females.
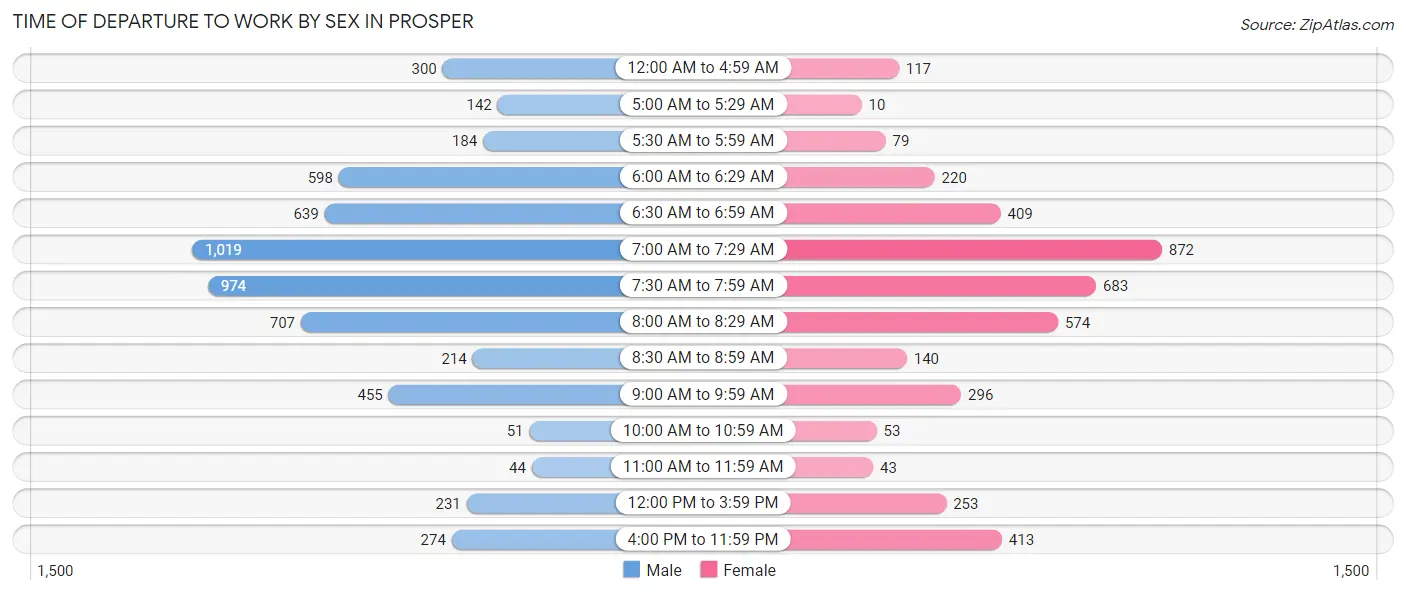
| Time of Departure | Male | Female |
| 12:00 AM to 4:59 AM | 300 (5.1%) | 117 (2.8%) |
| 5:00 AM to 5:29 AM | 142 (2.4%) | 10 (0.2%) |
| 5:30 AM to 5:59 AM | 184 (3.2%) | 79 (1.9%) |
| 6:00 AM to 6:29 AM | 598 (10.2%) | 220 (5.3%) |
| 6:30 AM to 6:59 AM | 639 (11.0%) | 409 (9.8%) |
| 7:00 AM to 7:29 AM | 1,019 (17.5%) | 872 (20.9%) |
| 7:30 AM to 7:59 AM | 974 (16.7%) | 683 (16.4%) |
| 8:00 AM to 8:29 AM | 707 (12.1%) | 574 (13.8%) |
| 8:30 AM to 8:59 AM | 214 (3.7%) | 140 (3.4%) |
| 9:00 AM to 9:59 AM | 455 (7.8%) | 296 (7.1%) |
| 10:00 AM to 10:59 AM | 51 (0.9%) | 53 (1.3%) |
| 11:00 AM to 11:59 AM | 44 (0.7%) | 43 (1.0%) |
| 12:00 PM to 3:59 PM | 231 (4.0%) | 253 (6.1%) |
| 4:00 PM to 11:59 PM | 274 (4.7%) | 413 (9.9%) |
| Total | 5,832 (100.0%) | 4,162 (100.0%) |
Housing Occupancy in Prosper
Occupancy by Ownership in Prosper
Of the total 9,071 dwellings in Prosper, owner-occupied units account for 8,067 (88.9%), while renter-occupied units make up 1,004 (11.1%).
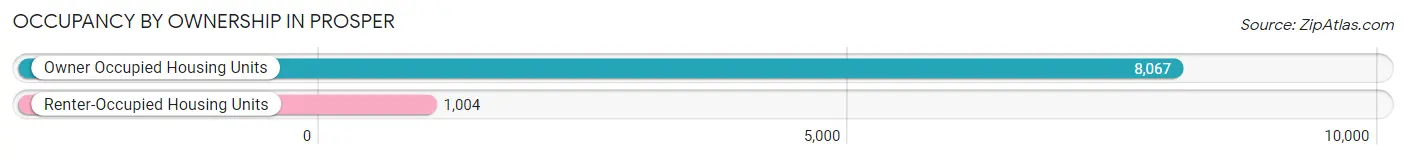
| Occupancy | # Housing Units | % Housing Units |
| Owner Occupied Housing Units | 8,067 | 88.9% |
| Renter-Occupied Housing Units | 1,004 | 11.1% |
| Total Occupied Housing Units | 9,071 | 100.0% |
Occupancy by Household Size in Prosper
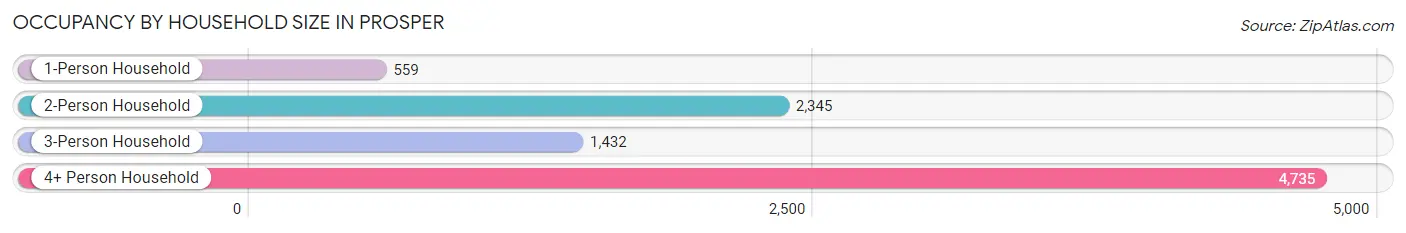
| Household Size | # Housing Units | % Housing Units |
| 1-Person Household | 559 | 6.2% |
| 2-Person Household | 2,345 | 25.9% |
| 3-Person Household | 1,432 | 15.8% |
| 4+ Person Household | 4,735 | 52.2% |
| Total Housing Units | 9,071 | 100.0% |
Occupancy by Ownership by Household Size in Prosper
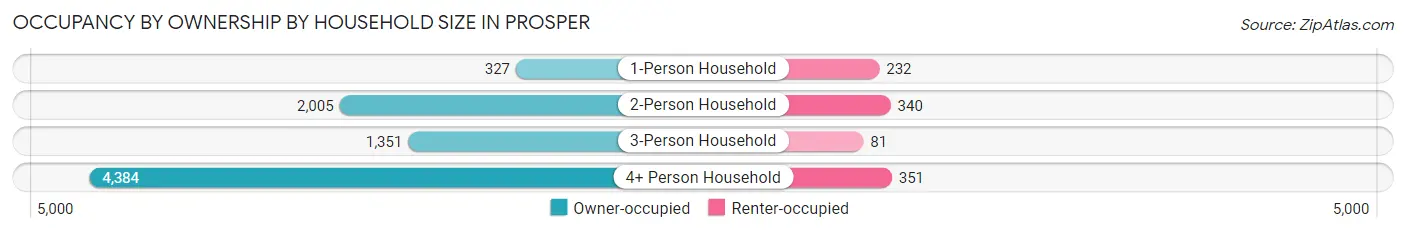
| Household Size | Owner-occupied | Renter-occupied |
| 1-Person Household | 327 (58.5%) | 232 (41.5%) |
| 2-Person Household | 2,005 (85.5%) | 340 (14.5%) |
| 3-Person Household | 1,351 (94.3%) | 81 (5.7%) |
| 4+ Person Household | 4,384 (92.6%) | 351 (7.4%) |
| Total Housing Units | 8,067 (88.9%) | 1,004 (11.1%) |
Occupancy by Educational Attainment in Prosper
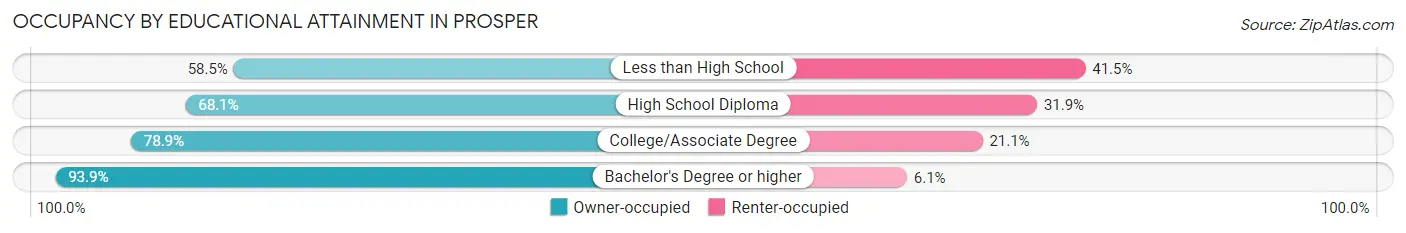
| Household Size | Owner-occupied | Renter-occupied |
| Less than High School | 48 (58.5%) | 34 (41.5%) |
| High School Diploma | 468 (68.1%) | 219 (31.9%) |
| College/Associate Degree | 1,296 (78.9%) | 346 (21.1%) |
| Bachelor's Degree or higher | 6,255 (93.9%) | 405 (6.1%) |
Occupancy by Age of Householder in Prosper
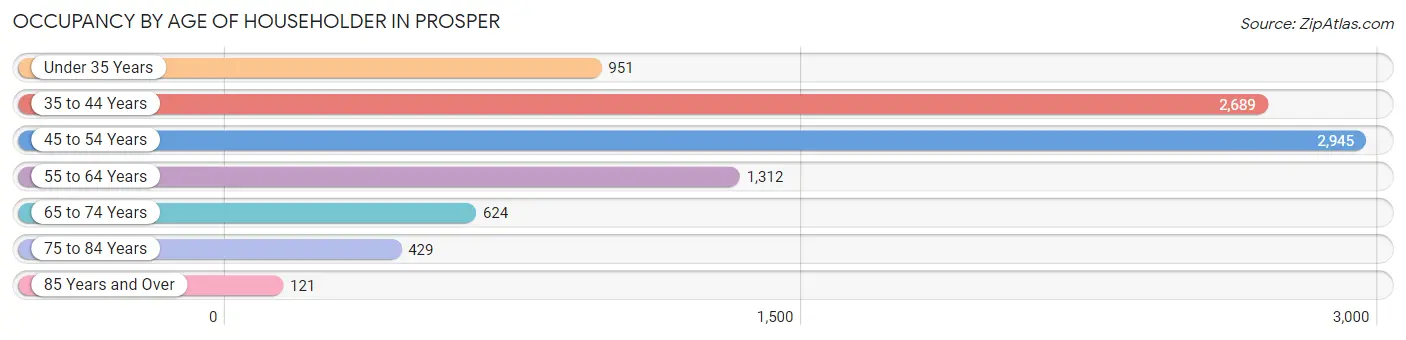
| Age Bracket | # Households | % Households |
| Under 35 Years | 951 | 10.5% |
| 35 to 44 Years | 2,689 | 29.6% |
| 45 to 54 Years | 2,945 | 32.5% |
| 55 to 64 Years | 1,312 | 14.5% |
| 65 to 74 Years | 624 | 6.9% |
| 75 to 84 Years | 429 | 4.7% |
| 85 Years and Over | 121 | 1.3% |
| Total | 9,071 | 100.0% |
Housing Finances in Prosper
Median Income by Occupancy in Prosper
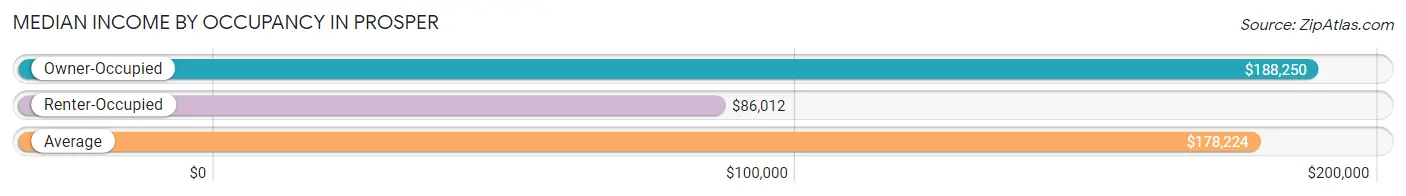
| Occupancy Type | # Households | Median Income |
| Owner-Occupied | 8,067 (88.9%) | $188,250 |
| Renter-Occupied | 1,004 (11.1%) | $86,012 |
| Average | 9,071 (100.0%) | $178,224 |
Occupancy by Householder Income Bracket in Prosper
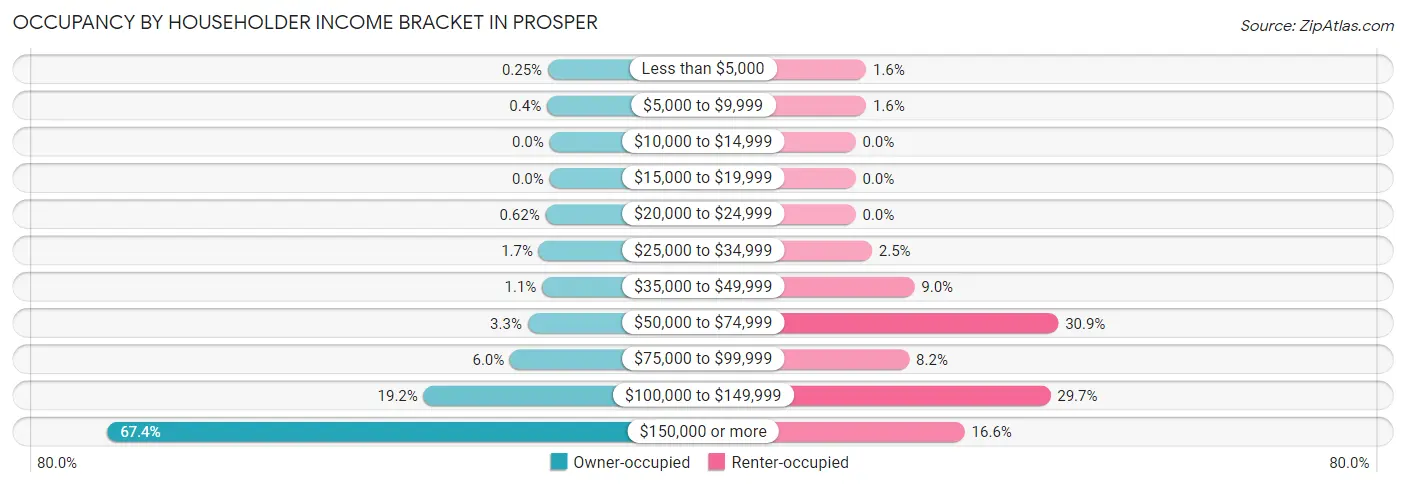
| Income Bracket | Owner-occupied | Renter-occupied |
| Less than $5,000 | 20 (0.3%) | 16 (1.6%) |
| $5,000 to $9,999 | 32 (0.4%) | 16 (1.6%) |
| $10,000 to $14,999 | 0 (0.0%) | 0 (0.0%) |
| $15,000 to $19,999 | 0 (0.0%) | 0 (0.0%) |
| $20,000 to $24,999 | 50 (0.6%) | 0 (0.0%) |
| $25,000 to $34,999 | 133 (1.7%) | 25 (2.5%) |
| $35,000 to $49,999 | 91 (1.1%) | 90 (9.0%) |
| $50,000 to $74,999 | 269 (3.3%) | 310 (30.9%) |
| $75,000 to $99,999 | 486 (6.0%) | 82 (8.2%) |
| $100,000 to $149,999 | 1,549 (19.2%) | 298 (29.7%) |
| $150,000 or more | 5,437 (67.4%) | 167 (16.6%) |
| Total | 8,067 (100.0%) | 1,004 (100.0%) |
Monthly Housing Cost Tiers in Prosper
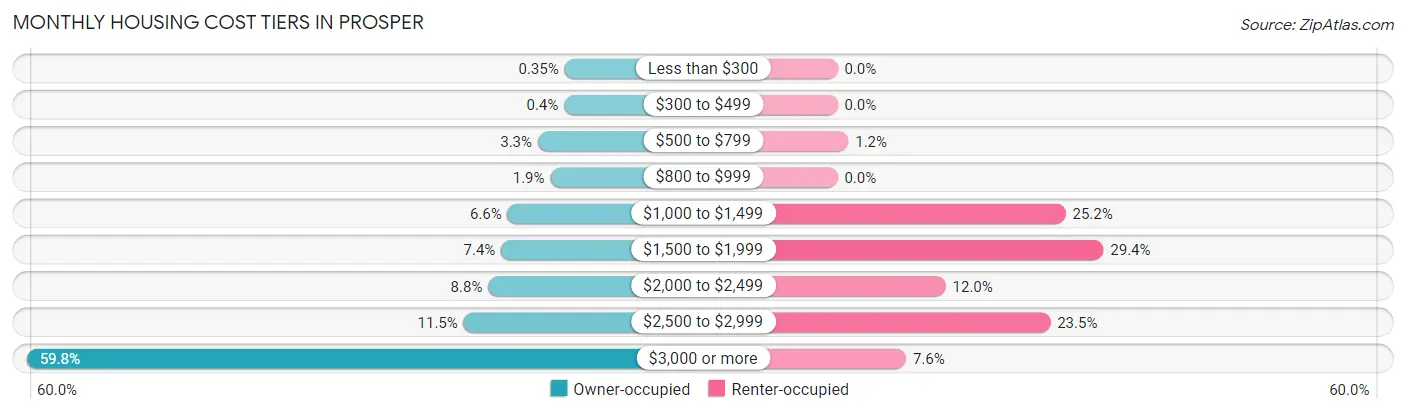
| Monthly Cost | Owner-occupied | Renter-occupied |
| Less than $300 | 28 (0.4%) | 0 (0.0%) |
| $300 to $499 | 32 (0.4%) | 0 (0.0%) |
| $500 to $799 | 266 (3.3%) | 12 (1.2%) |
| $800 to $999 | 155 (1.9%) | 0 (0.0%) |
| $1,000 to $1,499 | 536 (6.6%) | 253 (25.2%) |
| $1,500 to $1,999 | 593 (7.3%) | 295 (29.4%) |
| $2,000 to $2,499 | 708 (8.8%) | 120 (11.9%) |
| $2,500 to $2,999 | 928 (11.5%) | 236 (23.5%) |
| $3,000 or more | 4,821 (59.8%) | 76 (7.6%) |
| Total | 8,067 (100.0%) | 1,004 (100.0%) |
Physical Housing Characteristics in Prosper
Housing Structures in Prosper
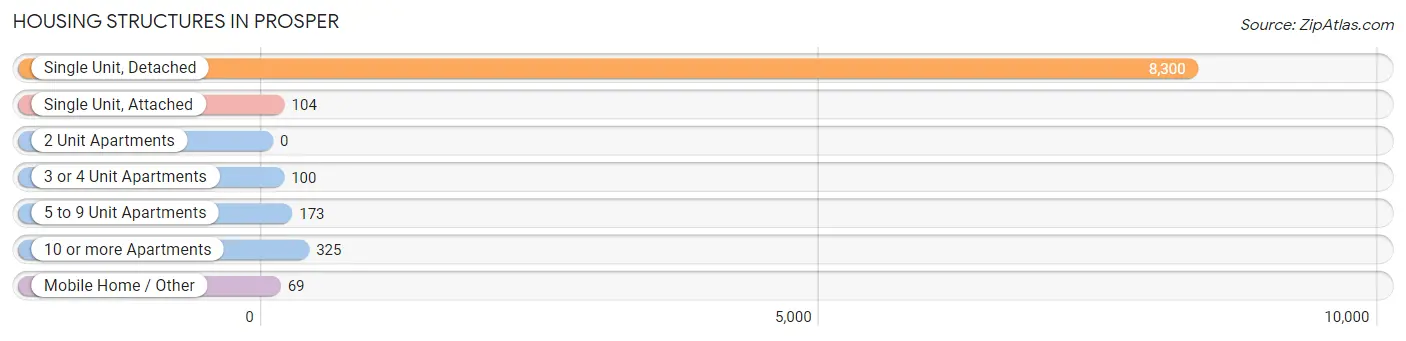
| Structure Type | # Housing Units | % Housing Units |
| Single Unit, Detached | 8,300 | 91.5% |
| Single Unit, Attached | 104 | 1.1% |
| 2 Unit Apartments | 0 | 0.0% |
| 3 or 4 Unit Apartments | 100 | 1.1% |
| 5 to 9 Unit Apartments | 173 | 1.9% |
| 10 or more Apartments | 325 | 3.6% |
| Mobile Home / Other | 69 | 0.8% |
| Total | 9,071 | 100.0% |
Housing Structures by Occupancy in Prosper
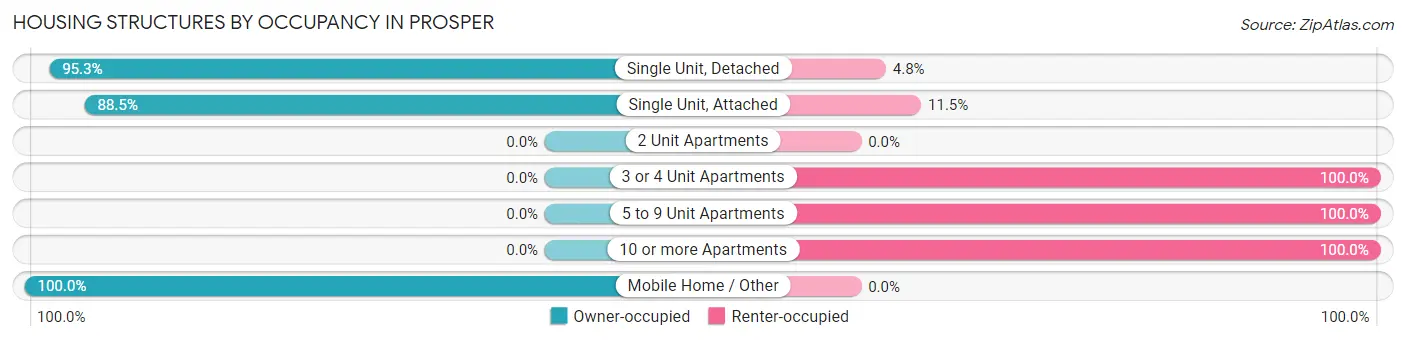
| Structure Type | Owner-occupied | Renter-occupied |
| Single Unit, Detached | 7,906 (95.3%) | 394 (4.8%) |
| Single Unit, Attached | 92 (88.5%) | 12 (11.5%) |
| 2 Unit Apartments | 0 (0.0%) | 0 (0.0%) |
| 3 or 4 Unit Apartments | 0 (0.0%) | 100 (100.0%) |
| 5 to 9 Unit Apartments | 0 (0.0%) | 173 (100.0%) |
| 10 or more Apartments | 0 (0.0%) | 325 (100.0%) |
| Mobile Home / Other | 69 (100.0%) | 0 (0.0%) |
| Total | 8,067 (88.9%) | 1,004 (11.1%) |
Housing Structures by Number of Rooms in Prosper
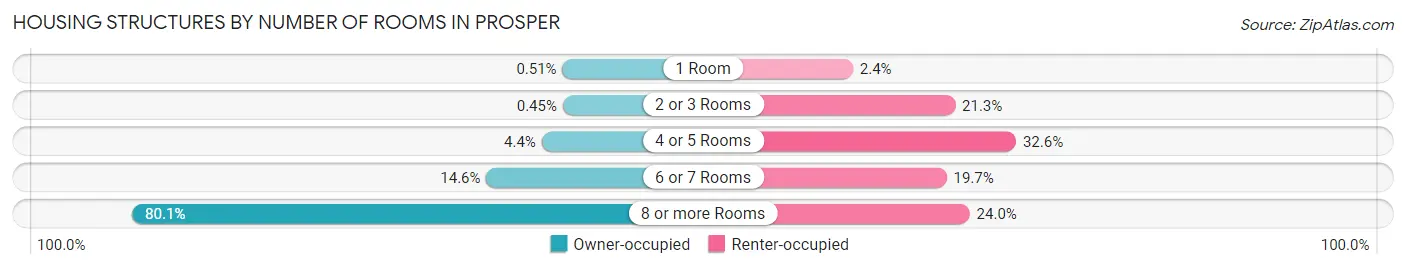
| Number of Rooms | Owner-occupied | Renter-occupied |
| 1 Room | 41 (0.5%) | 24 (2.4%) |
| 2 or 3 Rooms | 36 (0.4%) | 214 (21.3%) |
| 4 or 5 Rooms | 351 (4.3%) | 327 (32.6%) |
| 6 or 7 Rooms | 1,177 (14.6%) | 198 (19.7%) |
| 8 or more Rooms | 6,462 (80.1%) | 241 (24.0%) |
| Total | 8,067 (100.0%) | 1,004 (100.0%) |
Housing Structure by Heating Type in Prosper
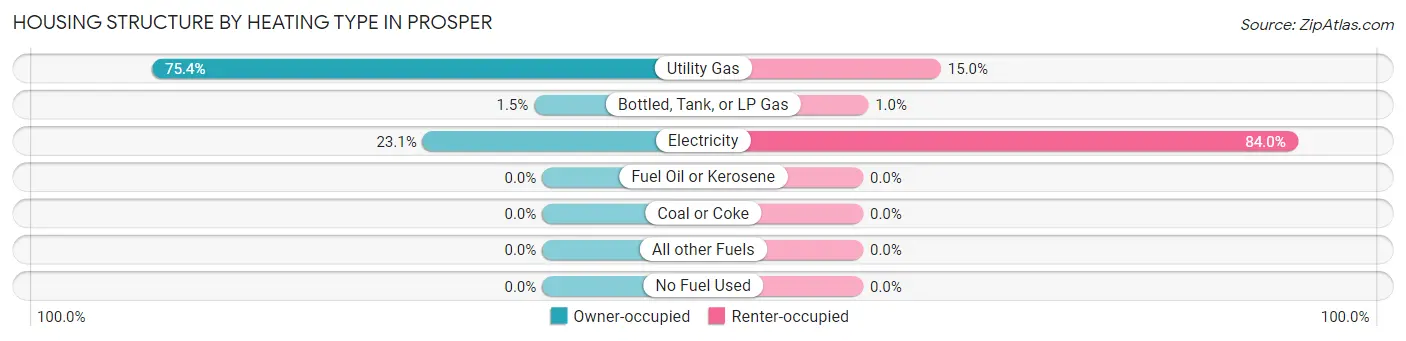
| Heating Type | Owner-occupied | Renter-occupied |
| Utility Gas | 6,079 (75.4%) | 151 (15.0%) |
| Bottled, Tank, or LP Gas | 124 (1.5%) | 10 (1.0%) |
| Electricity | 1,864 (23.1%) | 843 (84.0%) |
| Fuel Oil or Kerosene | 0 (0.0%) | 0 (0.0%) |
| Coal or Coke | 0 (0.0%) | 0 (0.0%) |
| All other Fuels | 0 (0.0%) | 0 (0.0%) |
| No Fuel Used | 0 (0.0%) | 0 (0.0%) |
| Total | 8,067 (100.0%) | 1,004 (100.0%) |
Household Vehicle Usage in Prosper
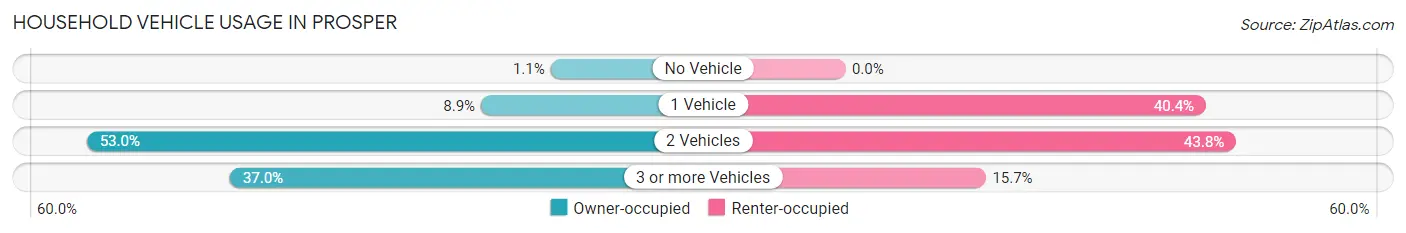
| Vehicles per Household | Owner-occupied | Renter-occupied |
| No Vehicle | 87 (1.1%) | 0 (0.0%) |
| 1 Vehicle | 716 (8.9%) | 406 (40.4%) |
| 2 Vehicles | 4,279 (53.0%) | 440 (43.8%) |
| 3 or more Vehicles | 2,985 (37.0%) | 158 (15.7%) |
| Total | 8,067 (100.0%) | 1,004 (100.0%) |
Real Estate & Mortgages in Prosper
Real Estate and Mortgage Overview in Prosper
| Characteristic | Without Mortgage | With Mortgage |
| Housing Units | 1,738 | 6,329 |
| Median Property Value | $546,500 | $636,600 |
| Median Household Income | $160,610 | $4,446 |
| Monthly Housing Costs | $1,440 | $4,784 |
| Real Estate Taxes | $10,001 | $46 |
Property Value by Mortgage Status in Prosper
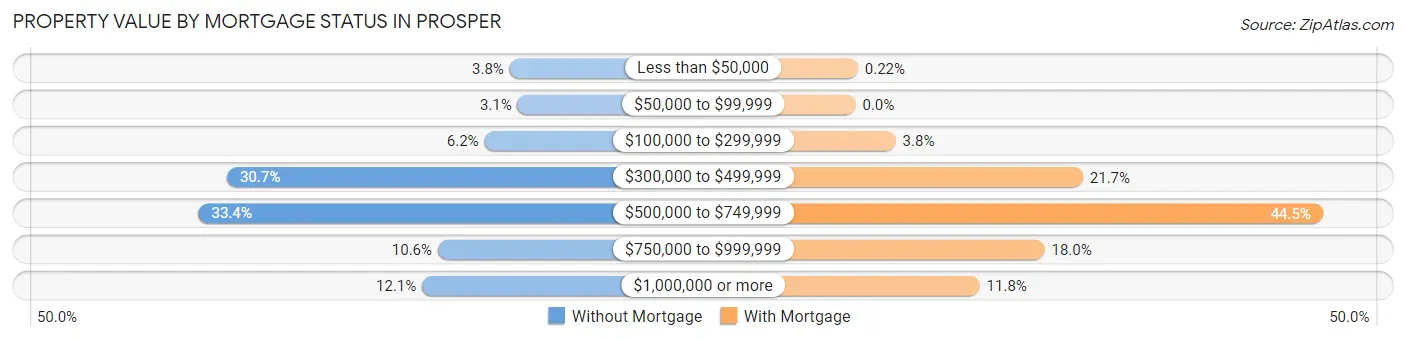
| Property Value | Without Mortgage | With Mortgage |
| Less than $50,000 | 66 (3.8%) | 14 (0.2%) |
| $50,000 to $99,999 | 53 (3.0%) | 0 (0.0%) |
| $100,000 to $299,999 | 108 (6.2%) | 242 (3.8%) |
| $300,000 to $499,999 | 534 (30.7%) | 1,370 (21.6%) |
| $500,000 to $749,999 | 581 (33.4%) | 2,816 (44.5%) |
| $750,000 to $999,999 | 185 (10.6%) | 1,139 (18.0%) |
| $1,000,000 or more | 211 (12.1%) | 748 (11.8%) |
| Total | 1,738 (100.0%) | 6,329 (100.0%) |
Household Income by Mortgage Status in Prosper
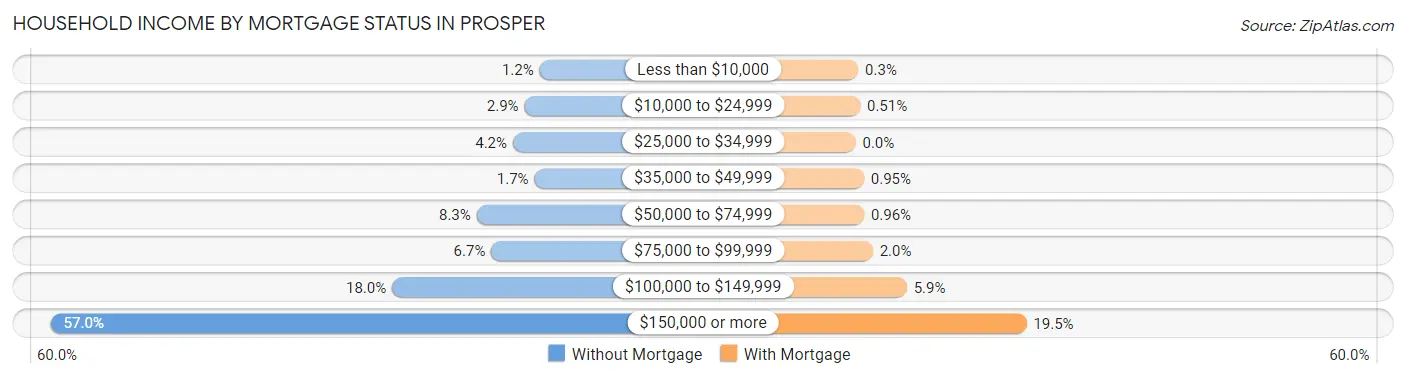
| Household Income | Without Mortgage | With Mortgage |
| Less than $10,000 | 20 (1.1%) | 19 (0.3%) |
| $10,000 to $24,999 | 50 (2.9%) | 32 (0.5%) |
| $25,000 to $34,999 | 73 (4.2%) | 0 (0.0%) |
| $35,000 to $49,999 | 30 (1.7%) | 60 (0.9%) |
| $50,000 to $74,999 | 145 (8.3%) | 61 (1.0%) |
| $75,000 to $99,999 | 116 (6.7%) | 124 (2.0%) |
| $100,000 to $149,999 | 313 (18.0%) | 370 (5.9%) |
| $150,000 or more | 991 (57.0%) | 1,236 (19.5%) |
| Total | 1,738 (100.0%) | 6,329 (100.0%) |
Property Value to Household Income Ratio in Prosper
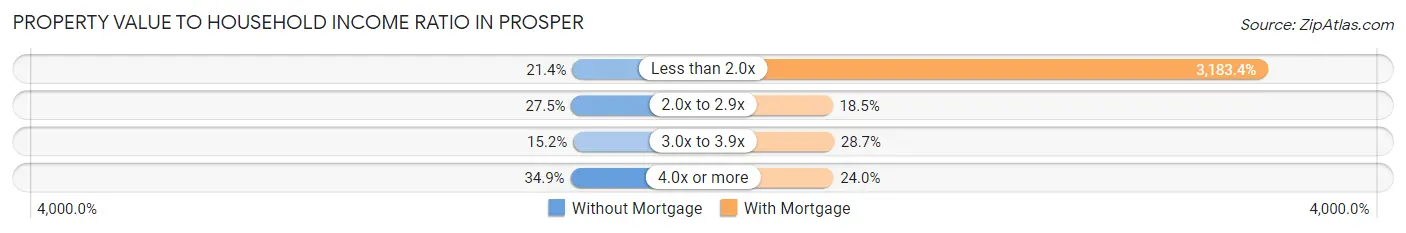
| Value-to-Income Ratio | Without Mortgage | With Mortgage |
| Less than 2.0x | 371 (21.3%) | 201,479 (3,183.4%) |
| 2.0x to 2.9x | 477 (27.5%) | 1,173 (18.5%) |
| 3.0x to 3.9x | 264 (15.2%) | 1,815 (28.7%) |
| 4.0x or more | 606 (34.9%) | 1,518 (24.0%) |
| Total | 1,738 (100.0%) | 6,329 (100.0%) |
Real Estate Taxes by Mortgage Status in Prosper
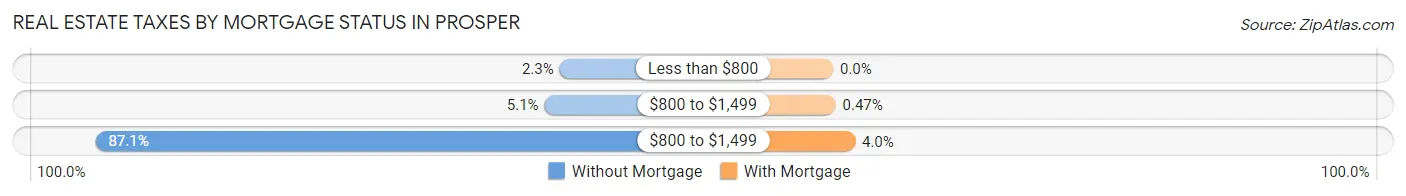
| Property Taxes | Without Mortgage | With Mortgage |
| Less than $800 | 40 (2.3%) | 0 (0.0%) |
| $800 to $1,499 | 88 (5.1%) | 30 (0.5%) |
| $800 to $1,499 | 1,513 (87.1%) | 254 (4.0%) |
| Total | 1,738 (100.0%) | 6,329 (100.0%) |
Health & Disability in Prosper
Health Insurance Coverage by Age in Prosper
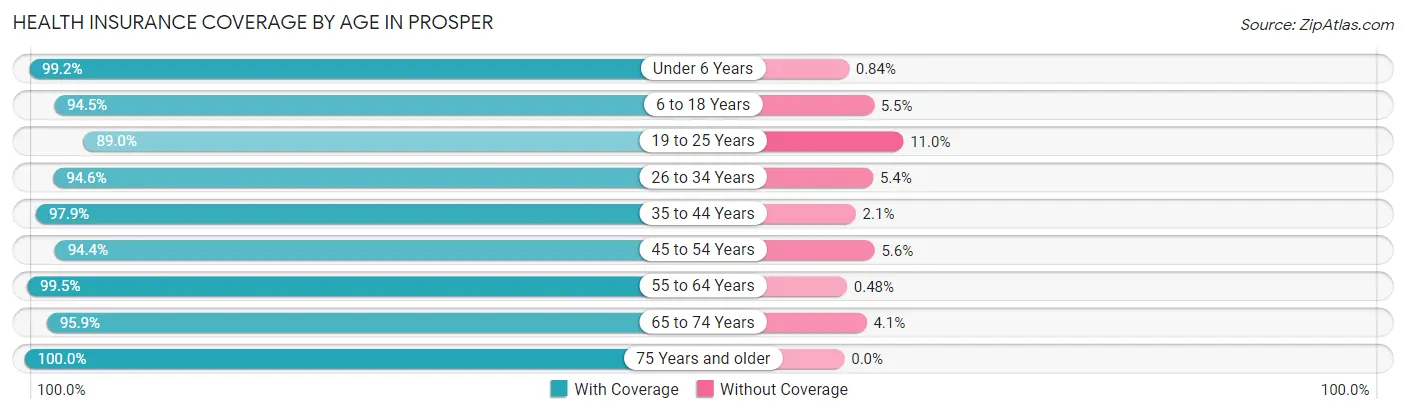
| Age Bracket | With Coverage | Without Coverage |
| Under 6 Years | 2,821 (99.2%) | 24 (0.8%) |
| 6 to 18 Years | 7,705 (94.5%) | 447 (5.5%) |
| 19 to 25 Years | 1,474 (89.0%) | 182 (11.0%) |
| 26 to 34 Years | 2,350 (94.6%) | 133 (5.4%) |
| 35 to 44 Years | 5,131 (97.9%) | 111 (2.1%) |
| 45 to 54 Years | 5,798 (94.4%) | 346 (5.6%) |
| 55 to 64 Years | 2,477 (99.5%) | 12 (0.5%) |
| 65 to 74 Years | 1,277 (95.9%) | 55 (4.1%) |
| 75 Years and older | 1,108 (100.0%) | 0 (0.0%) |
| Total | 30,141 (95.8%) | 1,310 (4.2%) |
Health Insurance Coverage by Citizenship Status in Prosper
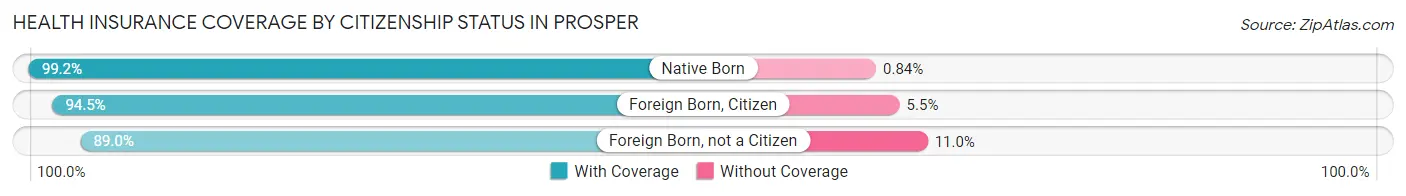
| Citizenship Status | With Coverage | Without Coverage |
| Native Born | 2,821 (99.2%) | 24 (0.8%) |
| Foreign Born, Citizen | 7,705 (94.5%) | 447 (5.5%) |
| Foreign Born, not a Citizen | 1,474 (89.0%) | 182 (11.0%) |
Health Insurance Coverage by Household Income in Prosper
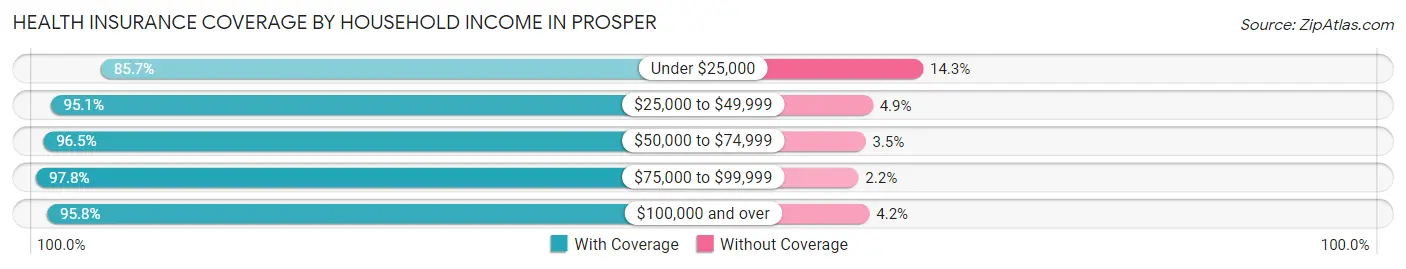
| Household Income | With Coverage | Without Coverage |
| Under $25,000 | 210 (85.7%) | 35 (14.3%) |
| $25,000 to $49,999 | 1,077 (95.1%) | 55 (4.9%) |
| $50,000 to $74,999 | 1,295 (96.5%) | 47 (3.5%) |
| $75,000 to $99,999 | 1,894 (97.8%) | 42 (2.2%) |
| $100,000 and over | 25,665 (95.8%) | 1,131 (4.2%) |
Public vs Private Health Insurance Coverage by Age in Prosper
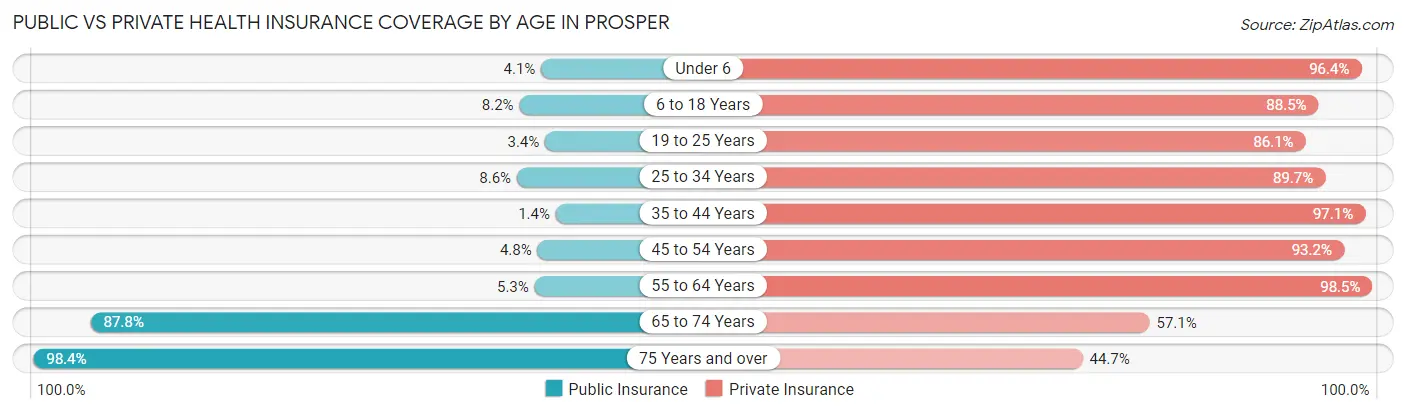
| Age Bracket | Public Insurance | Private Insurance |
| Under 6 | 117 (4.1%) | 2,743 (96.4%) |
| 6 to 18 Years | 665 (8.2%) | 7,211 (88.5%) |
| 19 to 25 Years | 56 (3.4%) | 1,425 (86.1%) |
| 25 to 34 Years | 214 (8.6%) | 2,227 (89.7%) |
| 35 to 44 Years | 74 (1.4%) | 5,090 (97.1%) |
| 45 to 54 Years | 294 (4.8%) | 5,724 (93.2%) |
| 55 to 64 Years | 133 (5.3%) | 2,451 (98.5%) |
| 65 to 74 Years | 1,169 (87.8%) | 761 (57.1%) |
| 75 Years and over | 1,090 (98.4%) | 495 (44.7%) |
| Total | 3,812 (12.1%) | 28,127 (89.4%) |
Disability Status by Sex by Age in Prosper
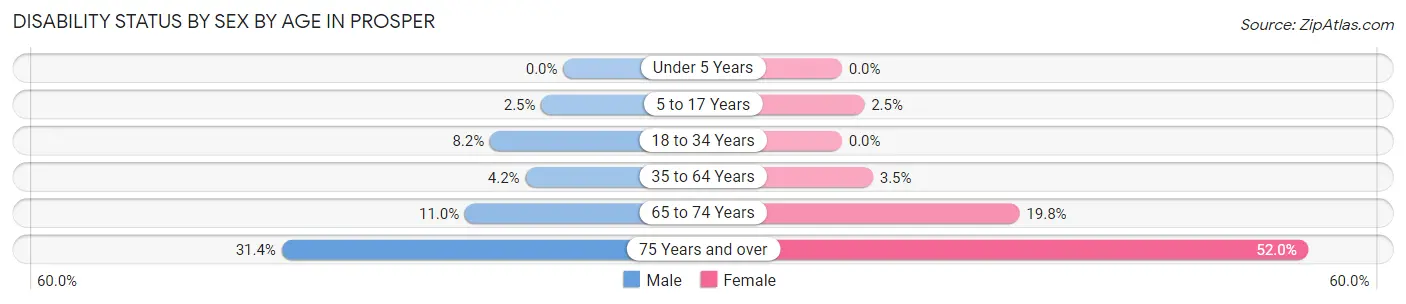
| Age Bracket | Male | Female |
| Under 5 Years | 0 (0.0%) | 0 (0.0%) |
| 5 to 17 Years | 111 (2.5%) | 90 (2.5%) |
| 18 to 34 Years | 198 (8.2%) | 0 (0.0%) |
| 35 to 64 Years | 294 (4.2%) | 238 (3.5%) |
| 65 to 74 Years | 75 (11.0%) | 128 (19.8%) |
| 75 Years and over | 181 (31.4%) | 276 (52.0%) |
Disability Class by Sex by Age in Prosper
Disability Class: Hearing Difficulty
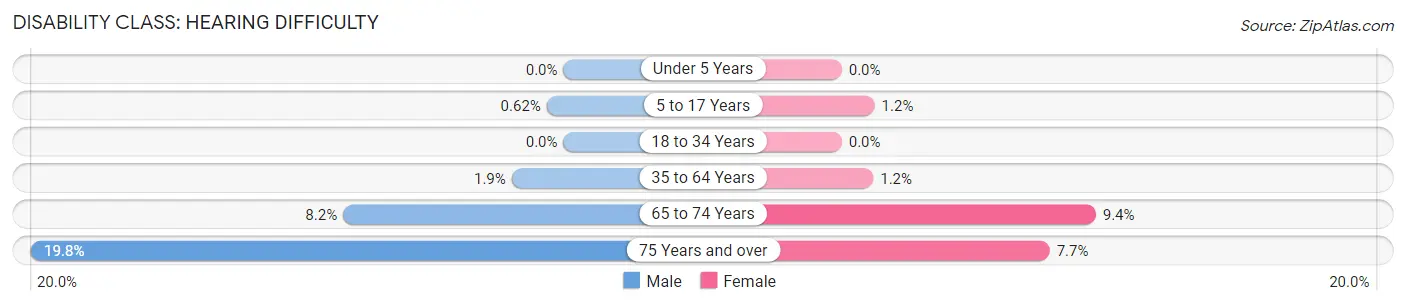
| Age Bracket | Male | Female |
| Under 5 Years | 0 (0.0%) | 0 (0.0%) |
| 5 to 17 Years | 28 (0.6%) | 44 (1.2%) |
| 18 to 34 Years | 0 (0.0%) | 0 (0.0%) |
| 35 to 64 Years | 134 (1.9%) | 81 (1.2%) |
| 65 to 74 Years | 56 (8.2%) | 61 (9.4%) |
| 75 Years and over | 114 (19.8%) | 41 (7.7%) |
Disability Class: Vision Difficulty
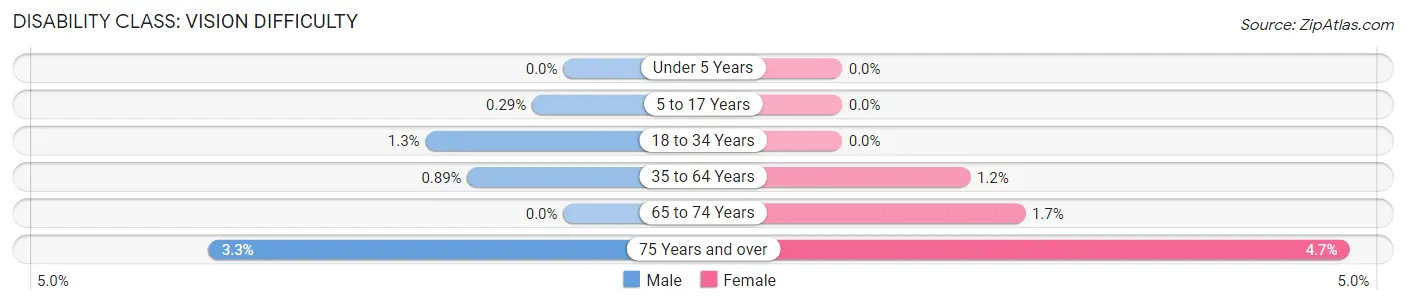
| Age Bracket | Male | Female |
| Under 5 Years | 0 (0.0%) | 0 (0.0%) |
| 5 to 17 Years | 13 (0.3%) | 0 (0.0%) |
| 18 to 34 Years | 31 (1.3%) | 0 (0.0%) |
| 35 to 64 Years | 62 (0.9%) | 82 (1.2%) |
| 65 to 74 Years | 0 (0.0%) | 11 (1.7%) |
| 75 Years and over | 19 (3.3%) | 25 (4.7%) |
Disability Class: Cognitive Difficulty
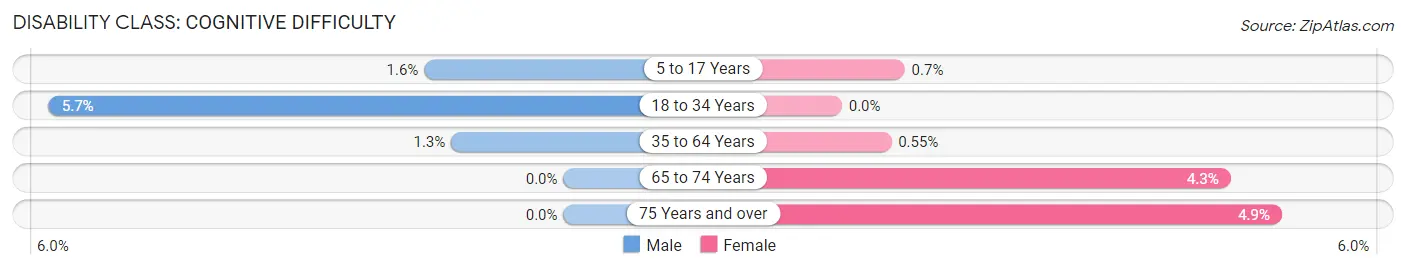
| Age Bracket | Male | Female |
| 5 to 17 Years | 70 (1.5%) | 25 (0.7%) |
| 18 to 34 Years | 139 (5.7%) | 0 (0.0%) |
| 35 to 64 Years | 87 (1.3%) | 38 (0.5%) |
| 65 to 74 Years | 0 (0.0%) | 28 (4.3%) |
| 75 Years and over | 0 (0.0%) | 26 (4.9%) |
Disability Class: Ambulatory Difficulty
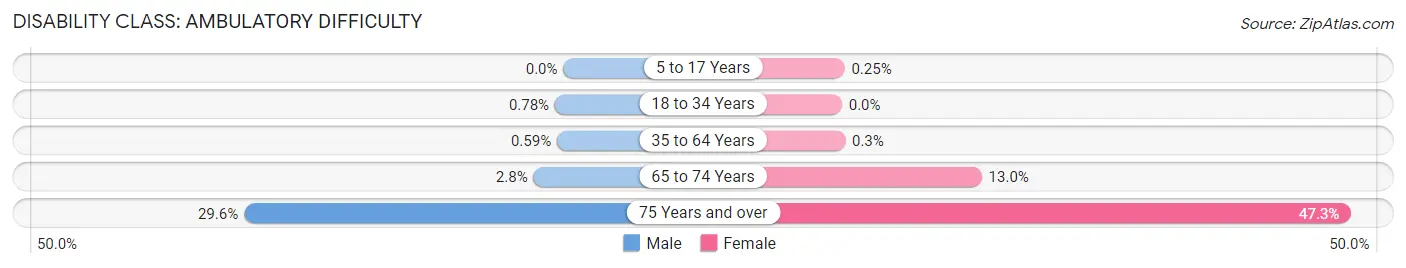
| Age Bracket | Male | Female |
| 5 to 17 Years | 0 (0.0%) | 9 (0.3%) |
| 18 to 34 Years | 19 (0.8%) | 0 (0.0%) |
| 35 to 64 Years | 41 (0.6%) | 21 (0.3%) |
| 65 to 74 Years | 19 (2.8%) | 84 (13.0%) |
| 75 Years and over | 171 (29.6%) | 251 (47.3%) |
Disability Class: Self-Care Difficulty
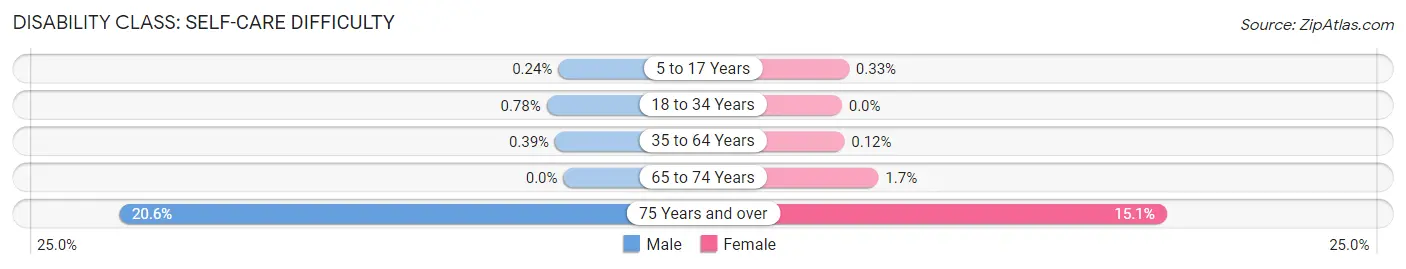
| Age Bracket | Male | Female |
| 5 to 17 Years | 11 (0.2%) | 12 (0.3%) |
| 18 to 34 Years | 19 (0.8%) | 0 (0.0%) |
| 35 to 64 Years | 27 (0.4%) | 8 (0.1%) |
| 65 to 74 Years | 0 (0.0%) | 11 (1.7%) |
| 75 Years and over | 119 (20.6%) | 80 (15.1%) |
Technology Access in Prosper
Computing Device Access in Prosper
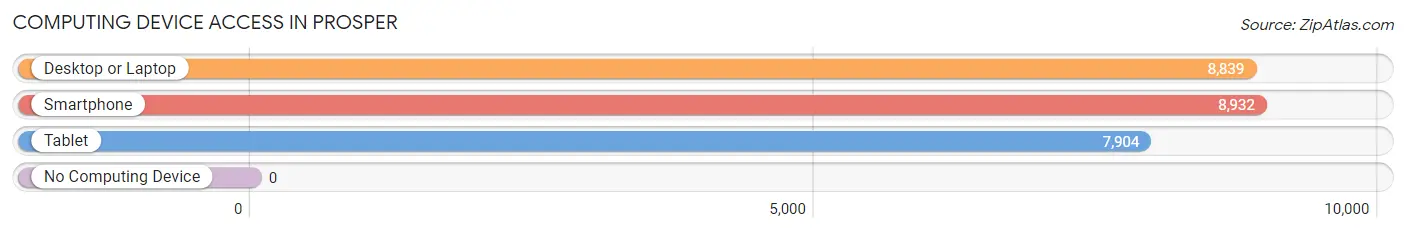
| Device Type | # Households | % Households |
| Desktop or Laptop | 8,839 | 97.4% |
| Smartphone | 8,932 | 98.5% |
| Tablet | 7,904 | 87.1% |
| No Computing Device | 0 | 0.0% |
| Total | 9,071 | 100.0% |
Internet Access in Prosper
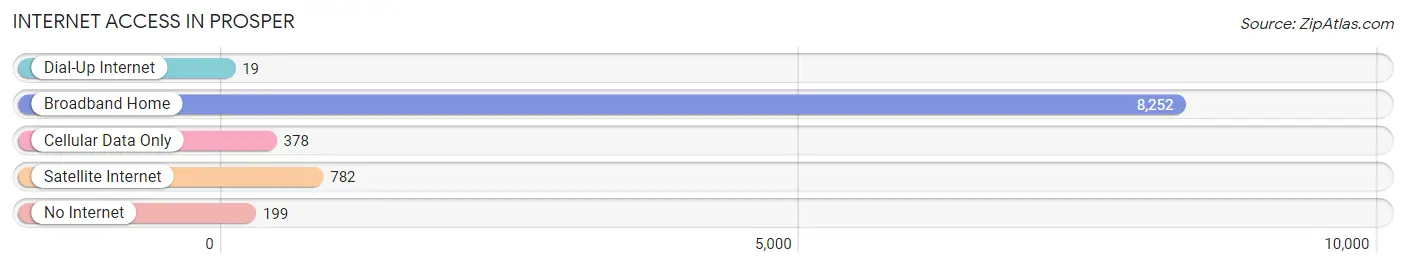
| Internet Type | # Households | % Households |
| Dial-Up Internet | 19 | 0.2% |
| Broadband Home | 8,252 | 91.0% |
| Cellular Data Only | 378 | 4.2% |
| Satellite Internet | 782 | 8.6% |
| No Internet | 199 | 2.2% |
| Total | 9,071 | 100.0% |
Prosper Summary
Prosper, Texas is a small town located in Collin and Denton counties in the state of Texas. It is part of the Dallas-Fort Worth-Arlington metropolitan area and is located about 30 miles north of Dallas. The town was founded in 1902 and has a population of about 20,000 people.
Geography
Prosper is located in the northeast corner of Collin County and the northwest corner of Denton County. It is situated on the banks of the East Fork of the Trinity River. The town is bordered by the cities of Frisco, Celina, and McKinney. The town is located in the Blackland Prairie region of Texas, which is characterized by rolling hills and fertile soil. The climate in Prosper is humid subtropical, with hot summers and mild winters.
Economy
Prosper is a small town with a strong economy. The town is home to several large employers, including the Prosper Independent School District, the Prosper Economic Development Corporation, and the Prosper Chamber of Commerce. The town also has a thriving retail sector, with several large shopping centers and restaurants. Additionally, the town is home to several small businesses, including a winery, a brewery, and a distillery.
Demographics
As of the 2010 census, the population of Prosper was 19,935. The racial makeup of the town was 87.3% White, 5.2% African American, 0.4% Native American, 2.2% Asian, 0.1% Pacific Islander, 2.7% from other races, and 2.1% from two or more races. Hispanic or Latino of any race were 8.3% of the population.
The median income for a household in Prosper was $90,945, and the median income for a family was $103,945. The per capita income for the town was $37,945. About 4.2% of families and 5.3% of the population were below the poverty line, including 6.3% of those under age 18 and 4.2% of those age 65 or over.
Conclusion
Prosper, Texas is a small town located in Collin and Denton counties in the state of Texas. It is part of the Dallas-Fort Worth-Arlington metropolitan area and is located about 30 miles north of Dallas. The town was founded in 1902 and has a population of about 20,000 people. Prosper is situated on the banks of the East Fork of the Trinity River and is characterized by rolling hills and fertile soil. The town has a strong economy, with several large employers and a thriving retail sector. The population of Prosper is predominantly White, with a small percentage of African American, Native American, Asian, and Pacific Islander residents. The median income for a household in Prosper is $90,945, and the per capita income for the town is $37,945.
Common Questions
What is Per Capita Income in Prosper?
Per Capita income in Prosper is $63,344.
What is the Median Family Income in Prosper?
Median Family Income in Prosper is $181,408.
What is the Median Household income in Prosper?
Median Household Income in Prosper is $178,224.
What is Income or Wage Gap in Prosper?
Income or Wage Gap in Prosper is 56.0%.
Women in Prosper earn 44.0 cents for every dollar earned by a man.
What is Inequality or Gini Index in Prosper?
Inequality or Gini Index in Prosper is 0.36.
What is the Total Population of Prosper?
Total Population of Prosper is 31,507.
What is the Total Male Population of Prosper?
Total Male Population of Prosper is 16,324.
What is the Total Female Population of Prosper?
Total Female Population of Prosper is 15,183.
What is the Ratio of Males per 100 Females in Prosper?
There are 107.51 Males per 100 Females in Prosper.
What is the Ratio of Females per 100 Males in Prosper?
There are 93.01 Females per 100 Males in Prosper.
What is the Median Population Age in Prosper?
Median Population Age in Prosper is 36.5 Years.
What is the Average Family Size in Prosper
Average Family Size in Prosper is 3.6 People.
What is the Average Household Size in Prosper
Average Household Size in Prosper is 3.5 People.
How Large is the Labor Force in Prosper?
There are 15,679 People in the Labor Forcein in Prosper.
What is the Percentage of People in the Labor Force in Prosper?
70.4% of People are in the Labor Force in Prosper.
What is the Unemployment Rate in Prosper?
Unemployment Rate in Prosper is 4.5%.