Pottsboro, TX Map & Demographics
Pottsboro Map
Pottsboro Overview
$36,586
PER CAPITA INCOME
$99,605
AVG FAMILY INCOME
$75,938
AVG HOUSEHOLD INCOME
34.2%
WAGE / INCOME GAP [ % ]
65.8¢/ $1
WAGE / INCOME GAP [ $ ]
0.35
INEQUALITY / GINI INDEX
2,536
TOTAL POPULATION
1,363
MALE POPULATION
1,173
FEMALE POPULATION
116.20
MALES / 100 FEMALES
86.06
FEMALES / 100 MALES
40.0
MEDIAN AGE
3.3
AVG FAMILY SIZE
2.6
AVG HOUSEHOLD SIZE
1,350
LABOR FORCE [ PEOPLE ]
68.1%
PERCENT IN LABOR FORCE
4.8%
UNEMPLOYMENT RATE
Pottsboro Zip Codes
Pottsboro Area Codes
Income in Pottsboro
Income Overview in Pottsboro
Per Capita Income in Pottsboro is $36,586, while median incomes of families and households are $99,605 and $75,938 respectively.
| Characteristic | Number | Measure |
| Per Capita Income | 2,536 | $36,586 |
| Median Family Income | 632 | $99,605 |
| Mean Family Income | 632 | $112,235 |
| Median Household Income | 959 | $75,938 |
| Mean Household Income | 959 | $94,145 |
| Income Deficit | 632 | $0 |
| Wage / Income Gap (%) | 2,536 | 34.15% |
| Wage / Income Gap ($) | 2,536 | 65.85¢ per $1 |
| Gini / Inequality Index | 2,536 | 0.35 |
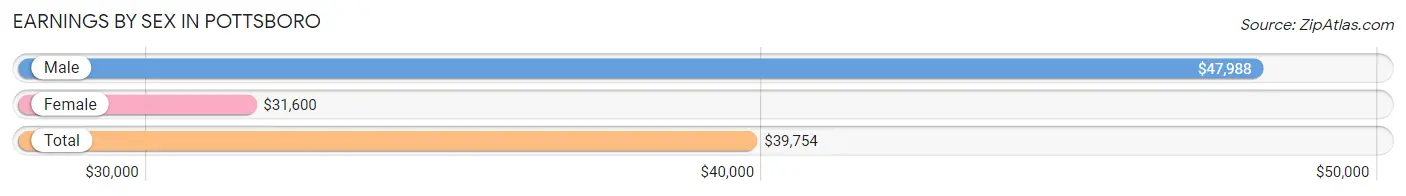
Earnings by Sex in Pottsboro
Average Earnings in Pottsboro are $39,754, $47,988 for men and $31,600 for women, a difference of 34.2%.
| Sex | Number | Average Earnings |
| Male | 772 (55.5%) | $47,988 |
| Female | 618 (44.5%) | $31,600 |
| Total | 1,390 (100.0%) | $39,754 |
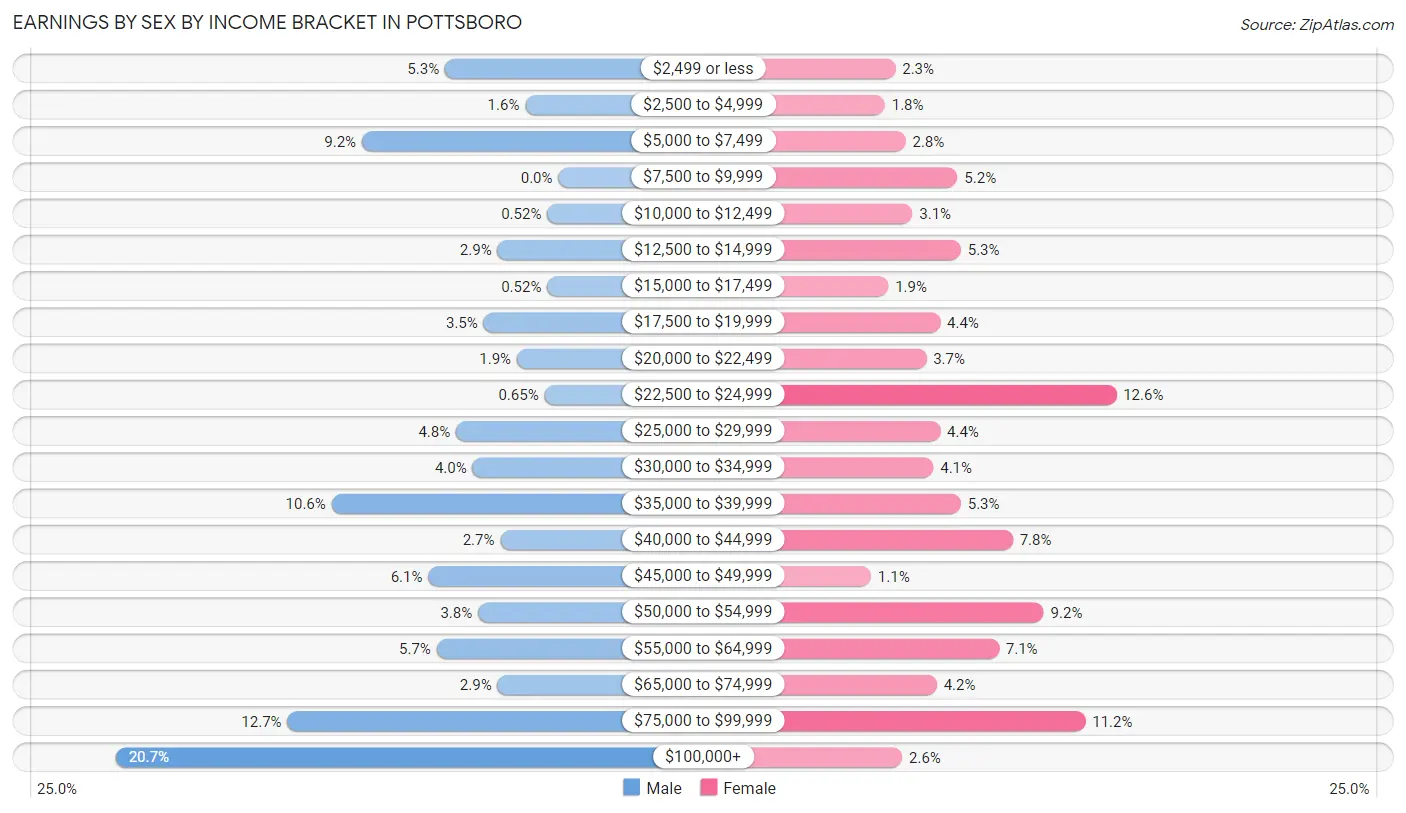
Earnings by Sex by Income Bracket in Pottsboro
The most common earnings brackets in Pottsboro are $100,000+ for men (160 | 20.7%) and $22,500 to $24,999 for women (78 | 12.6%).
| Income | Male | Female |
| $2,499 or less | 41 (5.3%) | 14 (2.3%) |
| $2,500 to $4,999 | 12 (1.5%) | 11 (1.8%) |
| $5,000 to $7,499 | 71 (9.2%) | 17 (2.8%) |
| $7,500 to $9,999 | 0 (0.0%) | 32 (5.2%) |
| $10,000 to $12,499 | 4 (0.5%) | 19 (3.1%) |
| $12,500 to $14,999 | 22 (2.9%) | 33 (5.3%) |
| $15,000 to $17,499 | 4 (0.5%) | 12 (1.9%) |
| $17,500 to $19,999 | 27 (3.5%) | 27 (4.4%) |
| $20,000 to $22,499 | 15 (1.9%) | 23 (3.7%) |
| $22,500 to $24,999 | 5 (0.6%) | 78 (12.6%) |
| $25,000 to $29,999 | 37 (4.8%) | 27 (4.4%) |
| $30,000 to $34,999 | 31 (4.0%) | 25 (4.1%) |
| $35,000 to $39,999 | 82 (10.6%) | 33 (5.3%) |
| $40,000 to $44,999 | 21 (2.7%) | 48 (7.8%) |
| $45,000 to $49,999 | 47 (6.1%) | 7 (1.1%) |
| $50,000 to $54,999 | 29 (3.8%) | 57 (9.2%) |
| $55,000 to $64,999 | 44 (5.7%) | 44 (7.1%) |
| $65,000 to $74,999 | 22 (2.9%) | 26 (4.2%) |
| $75,000 to $99,999 | 98 (12.7%) | 69 (11.2%) |
| $100,000+ | 160 (20.7%) | 16 (2.6%) |
| Total | 772 (100.0%) | 618 (100.0%) |
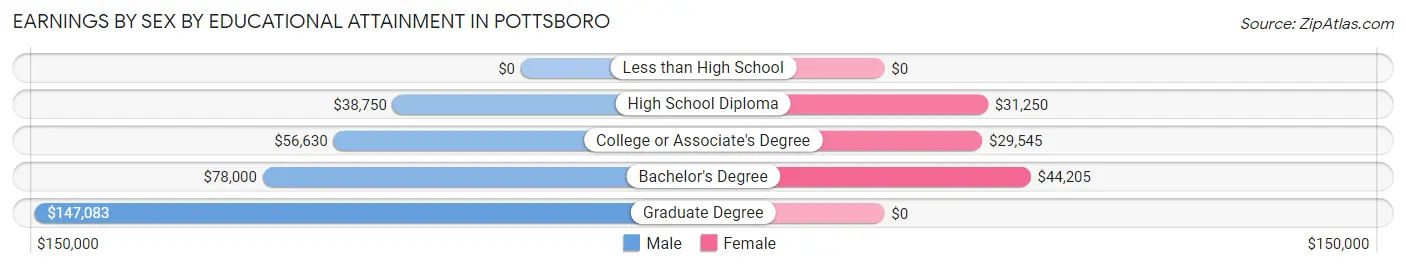
Earnings by Sex by Educational Attainment in Pottsboro
Average earnings in Pottsboro are $52,917 for men and $36,250 for women, a difference of 31.5%. Men with an educational attainment of graduate degree enjoy the highest average annual earnings of $147,083, while those with high school diploma education earn the least with $38,750. Women with an educational attainment of bachelor's degree earn the most with the average annual earnings of $44,205, while those with college or associate's degree education have the smallest earnings of $29,545.
| Educational Attainment | Male Income | Female Income |
| Less than High School | - | - |
| High School Diploma | $38,750 | $31,250 |
| College or Associate's Degree | $56,630 | $29,545 |
| Bachelor's Degree | $78,000 | $44,205 |
| Graduate Degree | $147,083 | $0 |
| Total | $52,917 | $36,250 |
Family Income in Pottsboro
Family Income Brackets in Pottsboro
According to the Pottsboro family income data, there are 134 families falling into the $75,000 to $99,999 income range, which is the most common income bracket and makes up 21.2% of all families.
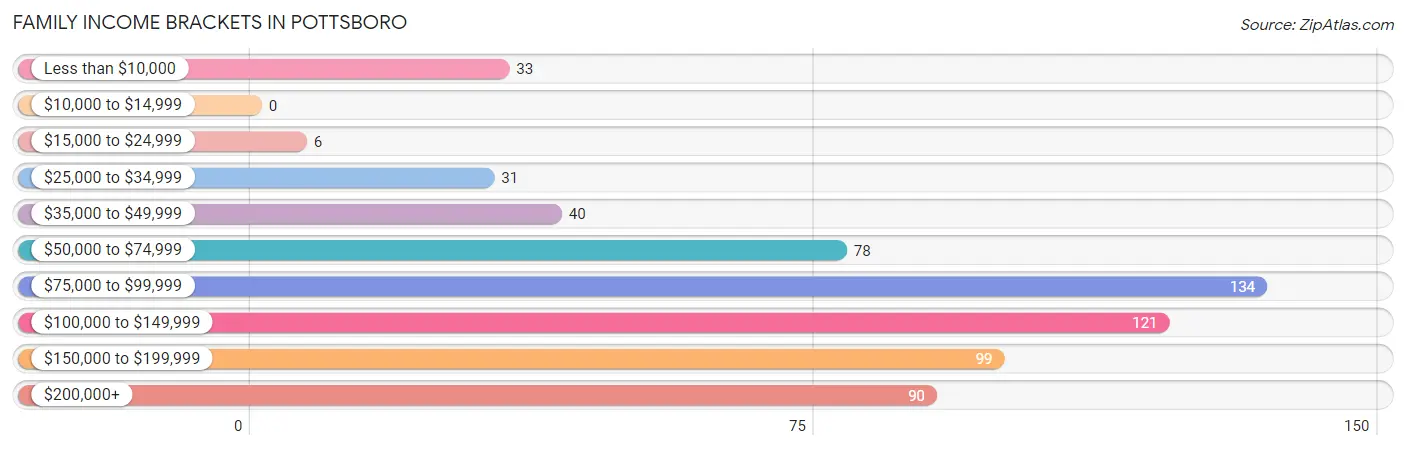
| Income Bracket | # Families | % Families |
| Less than $10,000 | 33 | 5.2% |
| $10,000 to $14,999 | 0 | 0.0% |
| $15,000 to $24,999 | 6 | 0.9% |
| $25,000 to $34,999 | 31 | 4.9% |
| $35,000 to $49,999 | 40 | 6.3% |
| $50,000 to $74,999 | 78 | 12.3% |
| $75,000 to $99,999 | 134 | 21.2% |
| $100,000 to $149,999 | 121 | 19.1% |
| $150,000 to $199,999 | 99 | 15.7% |
| $200,000+ | 90 | 14.2% |
Family Income by Famaliy Size in Pottsboro
5-person families (34 | 5.4%) account for the highest median family income in Pottsboro with $228,152 per family, while 5-person families (34 | 5.4%) have the highest median income of $45,630 per family member.
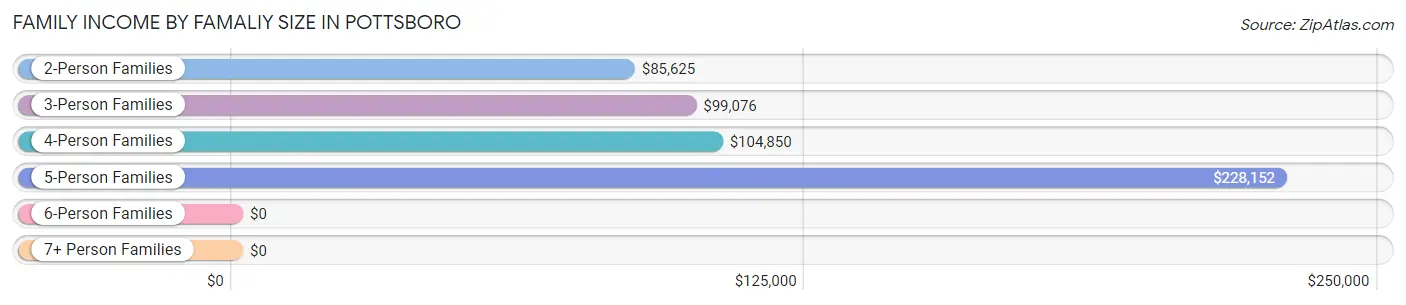
| Income Bracket | # Families | Median Income |
| 2-Person Families | 266 (42.1%) | $85,625 |
| 3-Person Families | 111 (17.6%) | $99,076 |
| 4-Person Families | 211 (33.4%) | $104,850 |
| 5-Person Families | 34 (5.4%) | $228,152 |
| 6-Person Families | 0 (0.0%) | $0 |
| 7+ Person Families | 10 (1.6%) | $0 |
| Total | 632 (100.0%) | $99,605 |
Family Income by Number of Earners in Pottsboro
The median family income in Pottsboro is $99,605, with families comprising 3+ earners (119) having the highest median family income of $154,350, while families with no earners (86) have the lowest median family income of $45,938, accounting for 18.8% and 13.6% of families, respectively.
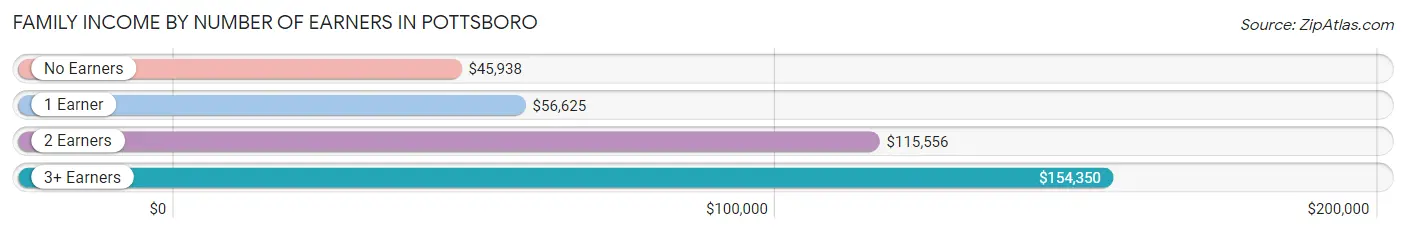
| Number of Earners | # Families | Median Income |
| No Earners | 86 (13.6%) | $45,938 |
| 1 Earner | 167 (26.4%) | $56,625 |
| 2 Earners | 260 (41.1%) | $115,556 |
| 3+ Earners | 119 (18.8%) | $154,350 |
| Total | 632 (100.0%) | $99,605 |
Household Income in Pottsboro
Household Income Brackets in Pottsboro
With 279 households falling in the category, the $50,000 to $74,999 income range is the most frequent in Pottsboro, accounting for 29.1% of all households. In contrast, only 12 households (1.3%) fall into the $15,000 to $24,999 income bracket, making it the least populous group.
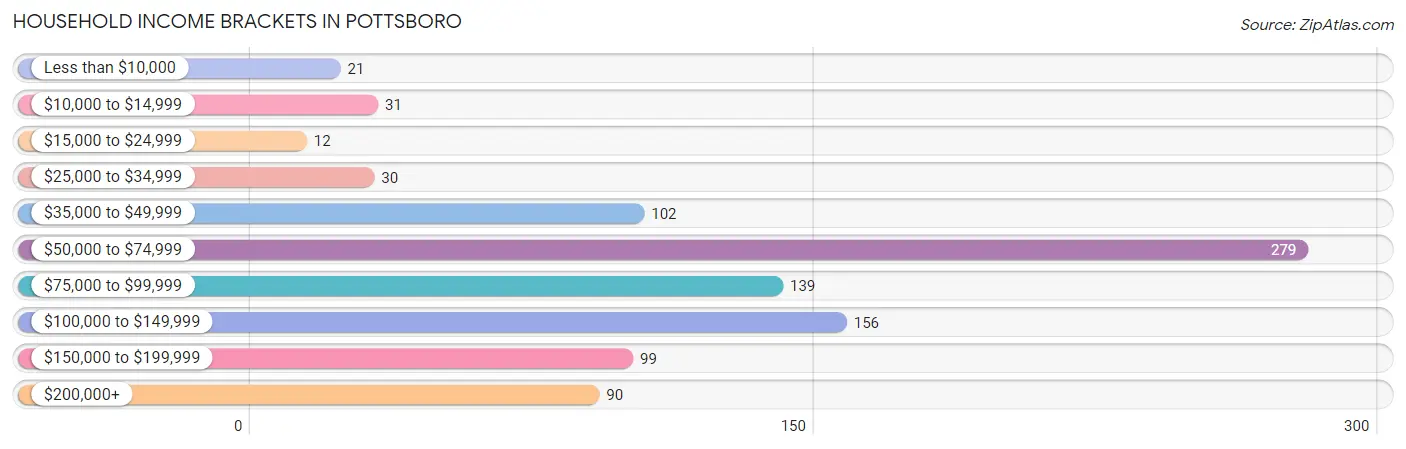
| Income Bracket | # Households | % Households |
| Less than $10,000 | 21 | 2.2% |
| $10,000 to $14,999 | 31 | 3.2% |
| $15,000 to $24,999 | 12 | 1.3% |
| $25,000 to $34,999 | 30 | 3.1% |
| $35,000 to $49,999 | 102 | 10.6% |
| $50,000 to $74,999 | 279 | 29.1% |
| $75,000 to $99,999 | 139 | 14.5% |
| $100,000 to $149,999 | 156 | 16.3% |
| $150,000 to $199,999 | 99 | 10.3% |
| $200,000+ | 90 | 9.4% |
Household Income by Householder Age in Pottsboro
The median household income in Pottsboro is $75,938, with the highest median household income of $116,319 found in the 45 to 64 years age bracket for the primary householder. A total of 437 households (45.6%) fall into this category. Meanwhile, the 15 to 24 years age bracket for the primary householder has the lowest median household income of $0, with 15 households (1.6%) in this group.
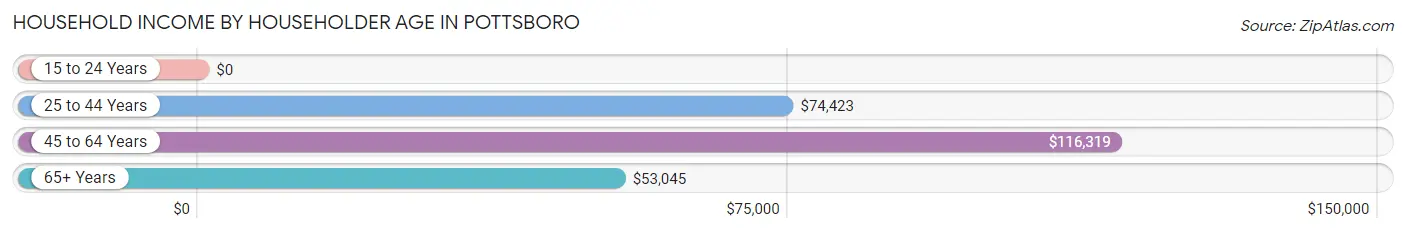
| Income Bracket | # Households | Median Income |
| 15 to 24 Years | 15 (1.6%) | $0 |
| 25 to 44 Years | 222 (23.2%) | $74,423 |
| 45 to 64 Years | 437 (45.6%) | $116,319 |
| 65+ Years | 285 (29.7%) | $53,045 |
| Total | 959 (100.0%) | $75,938 |
Poverty in Pottsboro
Income Below Poverty by Sex and Age in Pottsboro
With 6.0% poverty level for males and 4.9% for females among the residents of Pottsboro, 18 to 24 year old males and 65 to 74 year old females are the most vulnerable to poverty, with 20 males (29.8%) and 17 females (13.0%) in their respective age groups living below the poverty level.
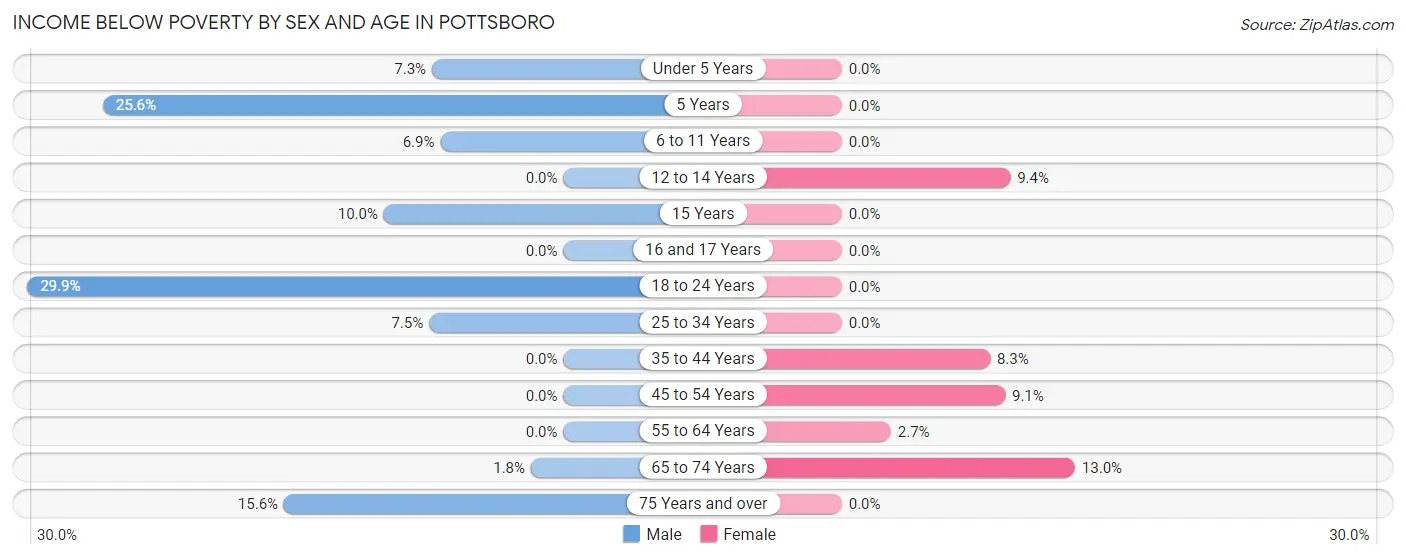
| Age Bracket | Male | Female |
| Under 5 Years | 6 (7.3%) | 0 (0.0%) |
| 5 Years | 10 (25.6%) | 0 (0.0%) |
| 6 to 11 Years | 5 (6.9%) | 0 (0.0%) |
| 12 to 14 Years | 0 (0.0%) | 6 (9.4%) |
| 15 Years | 5 (10.0%) | 0 (0.0%) |
| 16 and 17 Years | 0 (0.0%) | 0 (0.0%) |
| 18 to 24 Years | 20 (29.8%) | 0 (0.0%) |
| 25 to 34 Years | 19 (7.5%) | 0 (0.0%) |
| 35 to 44 Years | 0 (0.0%) | 16 (8.3%) |
| 45 to 54 Years | 0 (0.0%) | 12 (9.1%) |
| 55 to 64 Years | 0 (0.0%) | 6 (2.7%) |
| 65 to 74 Years | 3 (1.8%) | 17 (13.0%) |
| 75 Years and over | 14 (15.6%) | 0 (0.0%) |
| Total | 82 (6.0%) | 57 (4.9%) |
Income Above Poverty by Sex and Age in Pottsboro
According to the poverty statistics in Pottsboro, males aged 12 to 14 years and females aged under 5 years are the age groups that are most secure financially, with 100.0% of males and 100.0% of females in these age groups living above the poverty line.
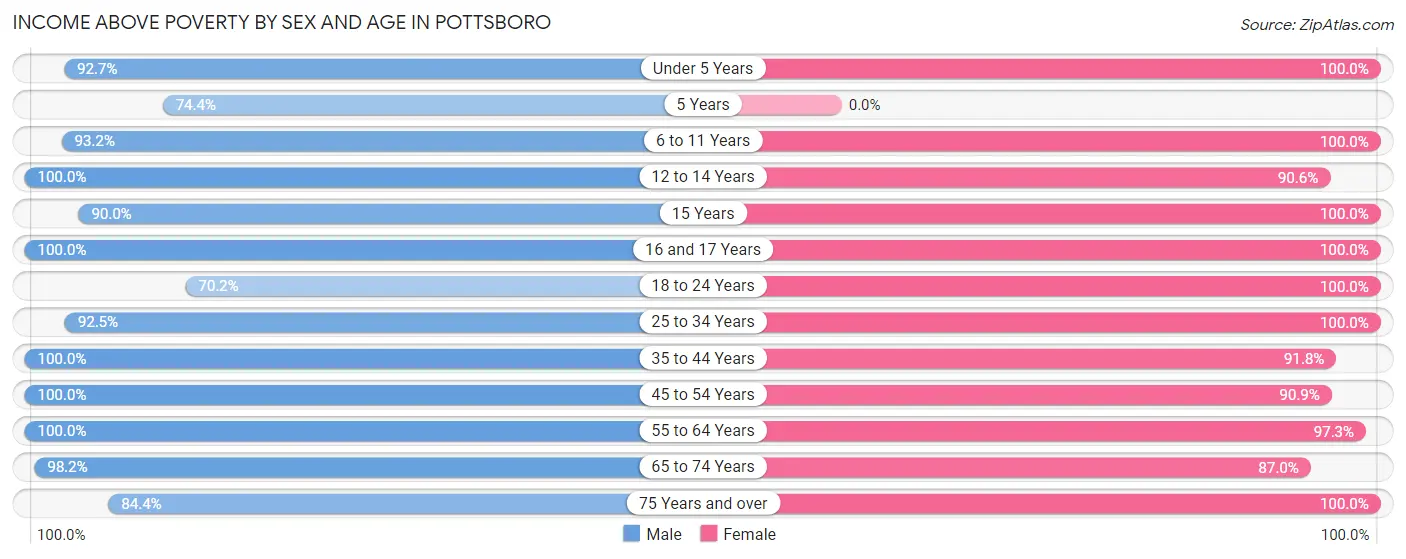
| Age Bracket | Male | Female |
| Under 5 Years | 76 (92.7%) | 67 (100.0%) |
| 5 Years | 29 (74.4%) | 0 (0.0%) |
| 6 to 11 Years | 68 (93.1%) | 127 (100.0%) |
| 12 to 14 Years | 25 (100.0%) | 58 (90.6%) |
| 15 Years | 45 (90.0%) | 27 (100.0%) |
| 16 and 17 Years | 80 (100.0%) | 4 (100.0%) |
| 18 to 24 Years | 47 (70.2%) | 49 (100.0%) |
| 25 to 34 Years | 235 (92.5%) | 94 (100.0%) |
| 35 to 44 Years | 86 (100.0%) | 178 (91.7%) |
| 45 to 54 Years | 227 (100.0%) | 120 (90.9%) |
| 55 to 64 Years | 124 (100.0%) | 214 (97.3%) |
| 65 to 74 Years | 163 (98.2%) | 114 (87.0%) |
| 75 Years and over | 76 (84.4%) | 64 (100.0%) |
| Total | 1,281 (94.0%) | 1,116 (95.1%) |
Income Below Poverty Among Married-Couple Families in Pottsboro
The poverty statistics for married-couple families in Pottsboro show that 3.5% or 17 of the total 487 families live below the poverty line. Families with no children have the highest poverty rate of 6.4%, comprising of 17 families. On the other hand, families with 1 or 2 children have the lowest poverty rate of 0.0%, which includes 0 families.
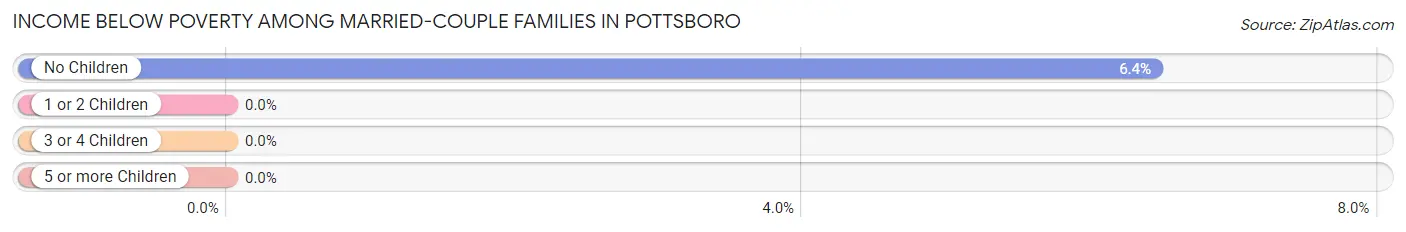
| Children | Above Poverty | Below Poverty |
| No Children | 247 (93.6%) | 17 (6.4%) |
| 1 or 2 Children | 182 (100.0%) | 0 (0.0%) |
| 3 or 4 Children | 31 (100.0%) | 0 (0.0%) |
| 5 or more Children | 10 (100.0%) | 0 (0.0%) |
| Total | 470 (96.5%) | 17 (3.5%) |
Income Below Poverty Among Single-Parent Households in Pottsboro
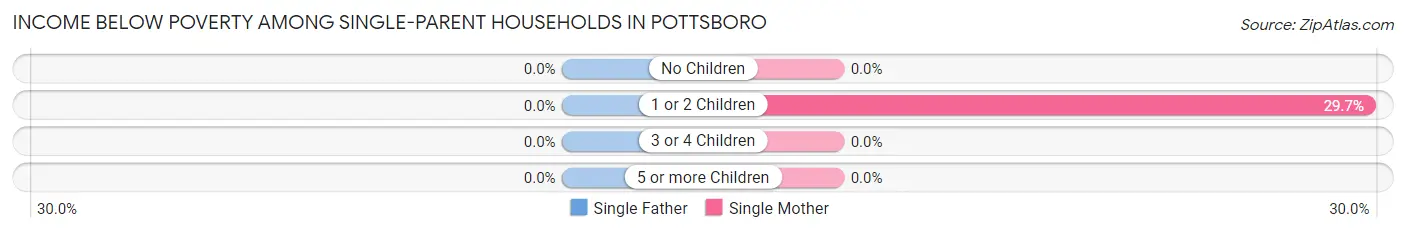
| Children | Single Father | Single Mother |
| No Children | 0 (0.0%) | 0 (0.0%) |
| 1 or 2 Children | 0 (0.0%) | 22 (29.7%) |
| 3 or 4 Children | 0 (0.0%) | 0 (0.0%) |
| 5 or more Children | 0 (0.0%) | 0 (0.0%) |
| Total | 0 (0.0%) | 22 (17.3%) |
Income Below Poverty Among Married-Couple vs Single-Parent Households in Pottsboro
The poverty data for Pottsboro shows that 17 of the married-couple family households (3.5%) and 22 of the single-parent households (15.2%) are living below the poverty level. Within the married-couple family households, those with no children have the highest poverty rate, with 17 households (6.4%) falling below the poverty line. Among the single-parent households, those with 1 or 2 children have the highest poverty rate, with 22 household (27.2%) living below poverty.
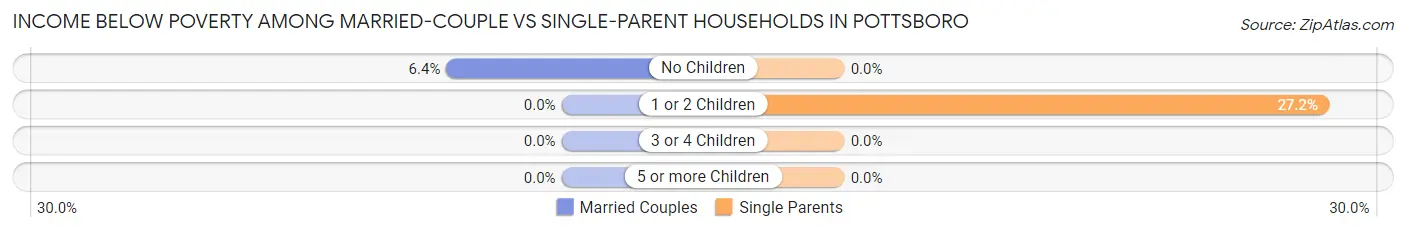
| Children | Married-Couple Families | Single-Parent Households |
| No Children | 17 (6.4%) | 0 (0.0%) |
| 1 or 2 Children | 0 (0.0%) | 22 (27.2%) |
| 3 or 4 Children | 0 (0.0%) | 0 (0.0%) |
| 5 or more Children | 0 (0.0%) | 0 (0.0%) |
| Total | 17 (3.5%) | 22 (15.2%) |
Race in Pottsboro
The most populous races in Pottsboro are White / Caucasian (2,291 | 90.3%), Two or more Races (172 | 6.8%), and Hispanic or Latino (157 | 6.2%).
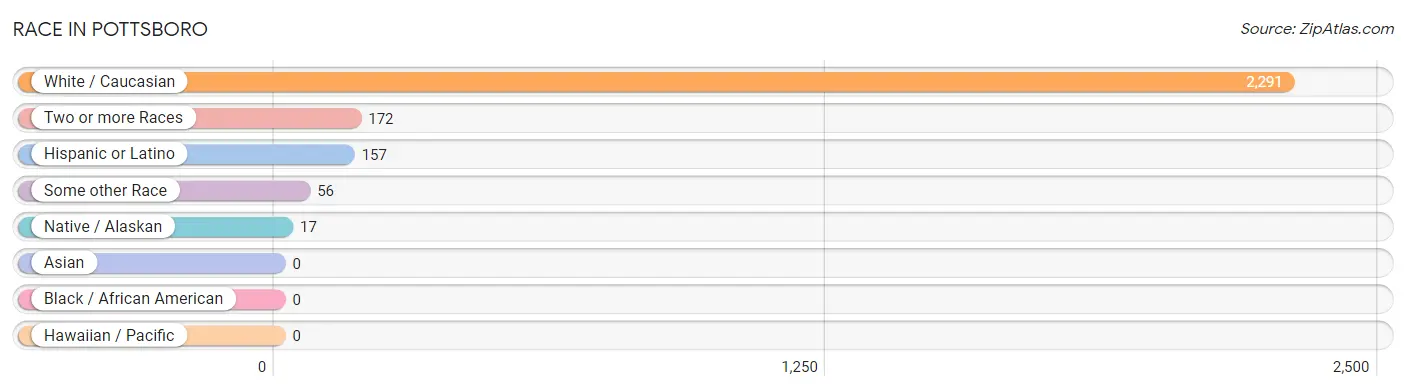
| Race | # Population | % Population |
| Asian | 0 | 0.0% |
| Black / African American | 0 | 0.0% |
| Hawaiian / Pacific | 0 | 0.0% |
| Hispanic or Latino | 157 | 6.2% |
| Native / Alaskan | 17 | 0.7% |
| White / Caucasian | 2,291 | 90.3% |
| Two or more Races | 172 | 6.8% |
| Some other Race | 56 | 2.2% |
| Total | 2,536 | 100.0% |
Ancestry in Pottsboro
The most populous ancestries reported in Pottsboro are English (478 | 18.9%), German (422 | 16.6%), Irish (238 | 9.4%), Mexican (130 | 5.1%), and Russian (127 | 5.0%), together accounting for 55.0% of all Pottsboro residents.
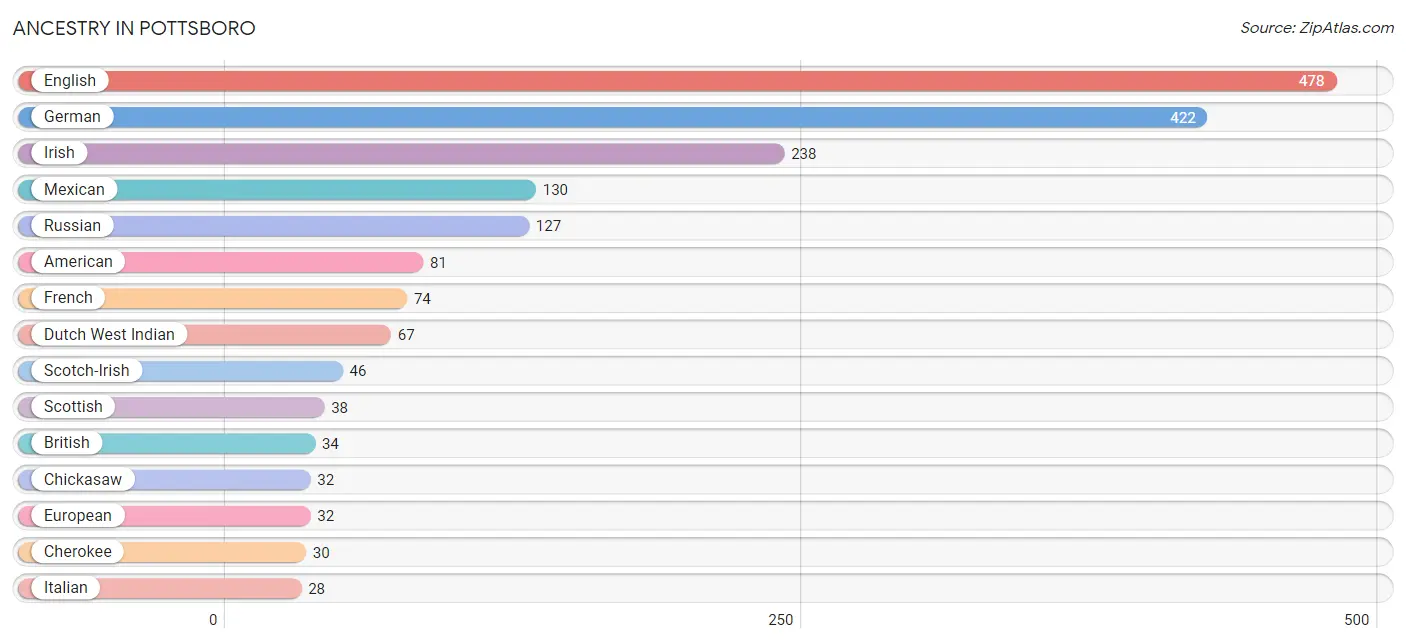
| Ancestry | # Population | % Population |
| American | 81 | 3.2% |
| Bhutanese | 8 | 0.3% |
| British | 34 | 1.3% |
| Bulgarian | 9 | 0.4% |
| Cajun | 6 | 0.2% |
| Celtic | 6 | 0.2% |
| Central American | 10 | 0.4% |
| Cherokee | 30 | 1.2% |
| Chickasaw | 32 | 1.3% |
| Choctaw | 7 | 0.3% |
| Comanche | 10 | 0.4% |
| Czech | 26 | 1.0% |
| Dutch | 12 | 0.5% |
| Dutch West Indian | 67 | 2.6% |
| English | 478 | 18.9% |
| European | 32 | 1.3% |
| French | 74 | 2.9% |
| German | 422 | 16.6% |
| Guatemalan | 10 | 0.4% |
| Irish | 238 | 9.4% |
| Italian | 28 | 1.1% |
| Mexican | 130 | 5.1% |
| Norwegian | 16 | 0.6% |
| Polish | 12 | 0.5% |
| Russian | 127 | 5.0% |
| Scotch-Irish | 46 | 1.8% |
| Scottish | 38 | 1.5% |
| Spaniard | 5 | 0.2% |
| Welsh | 5 | 0.2% | View All 29 Rows |
Immigrants in Pottsboro
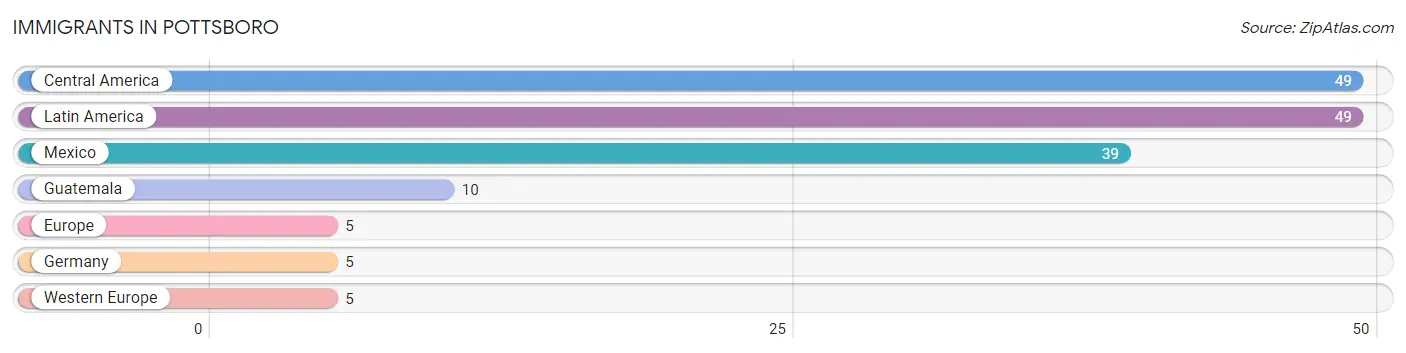
The most numerous immigrant groups reported in Pottsboro came from Central America (49 | 1.9%), Latin America (49 | 1.9%), Mexico (39 | 1.5%), Guatemala (10 | 0.4%), and Europe (5 | 0.2%), together accounting for 6.0% of all Pottsboro residents.
| Immigration Origin | # Population | % Population |
| Central America | 49 | 1.9% |
| Europe | 5 | 0.2% |
| Germany | 5 | 0.2% |
| Guatemala | 10 | 0.4% |
| Latin America | 49 | 1.9% |
| Mexico | 39 | 1.5% |
| Western Europe | 5 | 0.2% | View All 7 Rows |
Sex and Age in Pottsboro
Sex and Age in Pottsboro
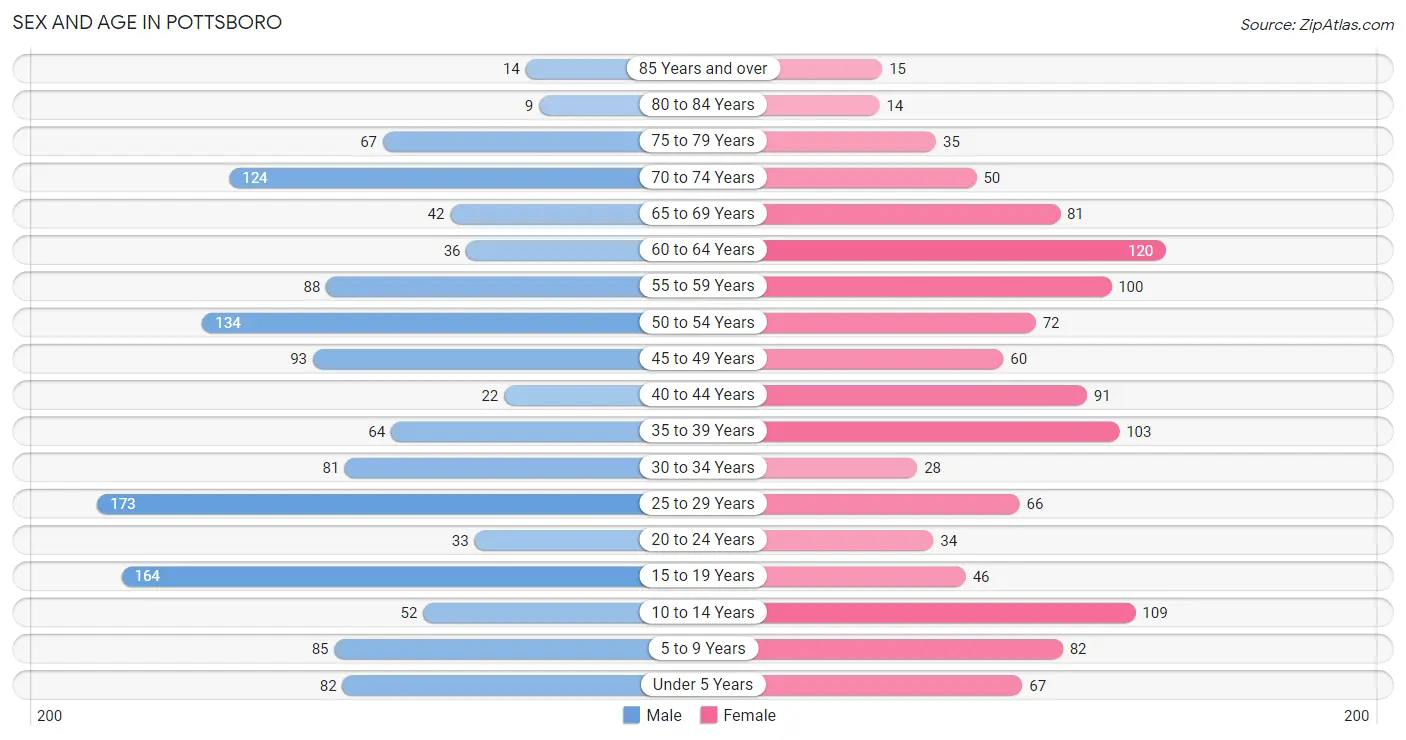
The most populous age groups in Pottsboro are 25 to 29 Years (173 | 12.7%) for men and 60 to 64 Years (120 | 10.2%) for women.
| Age Bracket | Male | Female |
| Under 5 Years | 82 (6.0%) | 67 (5.7%) |
| 5 to 9 Years | 85 (6.2%) | 82 (7.0%) |
| 10 to 14 Years | 52 (3.8%) | 109 (9.3%) |
| 15 to 19 Years | 164 (12.0%) | 46 (3.9%) |
| 20 to 24 Years | 33 (2.4%) | 34 (2.9%) |
| 25 to 29 Years | 173 (12.7%) | 66 (5.6%) |
| 30 to 34 Years | 81 (5.9%) | 28 (2.4%) |
| 35 to 39 Years | 64 (4.7%) | 103 (8.8%) |
| 40 to 44 Years | 22 (1.6%) | 91 (7.8%) |
| 45 to 49 Years | 93 (6.8%) | 60 (5.1%) |
| 50 to 54 Years | 134 (9.8%) | 72 (6.1%) |
| 55 to 59 Years | 88 (6.5%) | 100 (8.5%) |
| 60 to 64 Years | 36 (2.6%) | 120 (10.2%) |
| 65 to 69 Years | 42 (3.1%) | 81 (6.9%) |
| 70 to 74 Years | 124 (9.1%) | 50 (4.3%) |
| 75 to 79 Years | 67 (4.9%) | 35 (3.0%) |
| 80 to 84 Years | 9 (0.7%) | 14 (1.2%) |
| 85 Years and over | 14 (1.0%) | 15 (1.3%) |
| Total | 1,363 (100.0%) | 1,173 (100.0%) |
Families and Households in Pottsboro
Median Family Size in Pottsboro
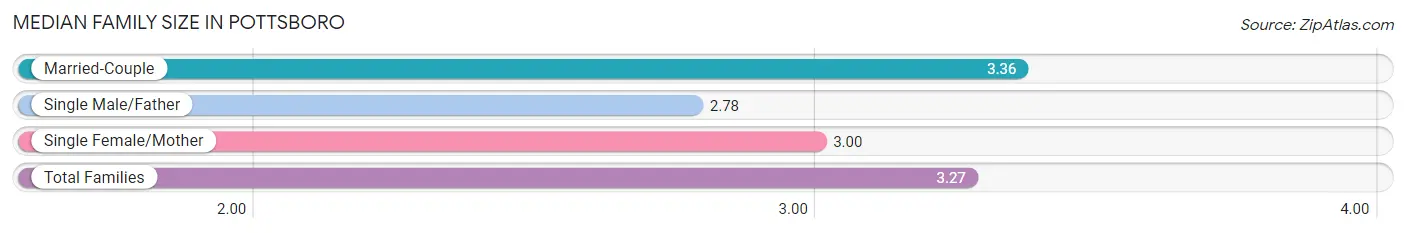
The median family size in Pottsboro is 3.27 persons per family, with married-couple families (487 | 77.1%) accounting for the largest median family size of 3.36 persons per family. On the other hand, single male/father families (18 | 2.9%) represent the smallest median family size with 2.78 persons per family.
| Family Type | # Families | Family Size |
| Married-Couple | 487 (77.1%) | 3.36 |
| Single Male/Father | 18 (2.9%) | 2.78 |
| Single Female/Mother | 127 (20.1%) | 3.00 |
| Total Families | 632 (100.0%) | 3.27 |
Median Household Size in Pottsboro
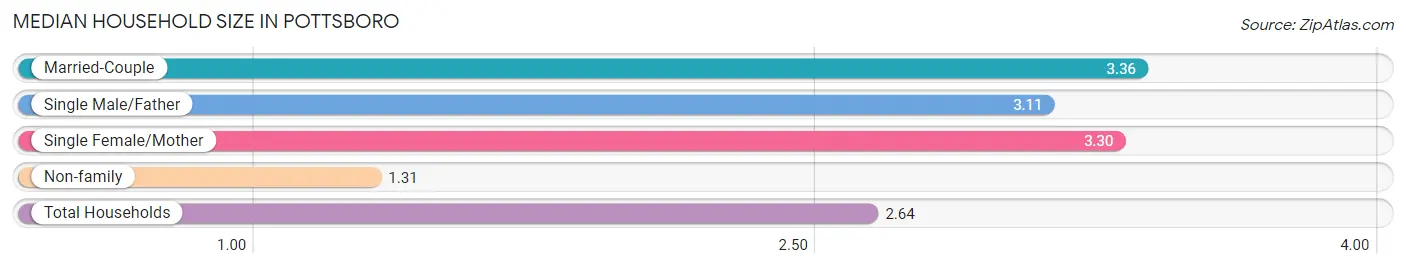
The median household size in Pottsboro is 2.64 persons per household, with married-couple households (487 | 50.8%) accounting for the largest median household size of 3.36 persons per household. non-family households (327 | 34.1%) represent the smallest median household size with 1.31 persons per household.
| Household Type | # Households | Household Size |
| Married-Couple | 487 (50.8%) | 3.36 |
| Single Male/Father | 18 (1.9%) | 3.11 |
| Single Female/Mother | 127 (13.2%) | 3.30 |
| Non-family | 327 (34.1%) | 1.31 |
| Total Households | 959 (100.0%) | 2.64 |
Household Size by Marriage Status in Pottsboro
Out of a total of 959 households in Pottsboro, 632 (65.9%) are family households, while 327 (34.1%) are nonfamily households. The most numerous type of family households are 2-person households, comprising 249, and the most common type of nonfamily households are 1-person households, comprising 253.
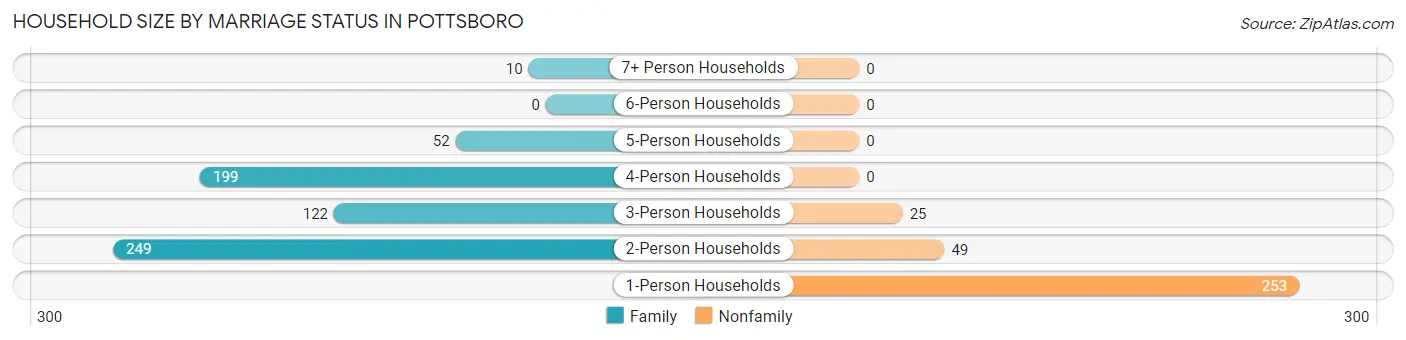
| Household Size | Family Households | Nonfamily Households |
| 1-Person Households | - | 253 (26.4%) |
| 2-Person Households | 249 (26.0%) | 49 (5.1%) |
| 3-Person Households | 122 (12.7%) | 25 (2.6%) |
| 4-Person Households | 199 (20.7%) | 0 (0.0%) |
| 5-Person Households | 52 (5.4%) | 0 (0.0%) |
| 6-Person Households | 0 (0.0%) | 0 (0.0%) |
| 7+ Person Households | 10 (1.0%) | 0 (0.0%) |
| Total | 632 (65.9%) | 327 (34.1%) |
Female Fertility in Pottsboro
Fertility by Age in Pottsboro
Average fertility rate in Pottsboro is 58.0 births per 1,000 women. Women in the age bracket of 20 to 34 years have the highest fertility rate with 195.0 births per 1,000 women. Women in the age bracket of 20 to 34 years acount for 100.0% of all women with births.
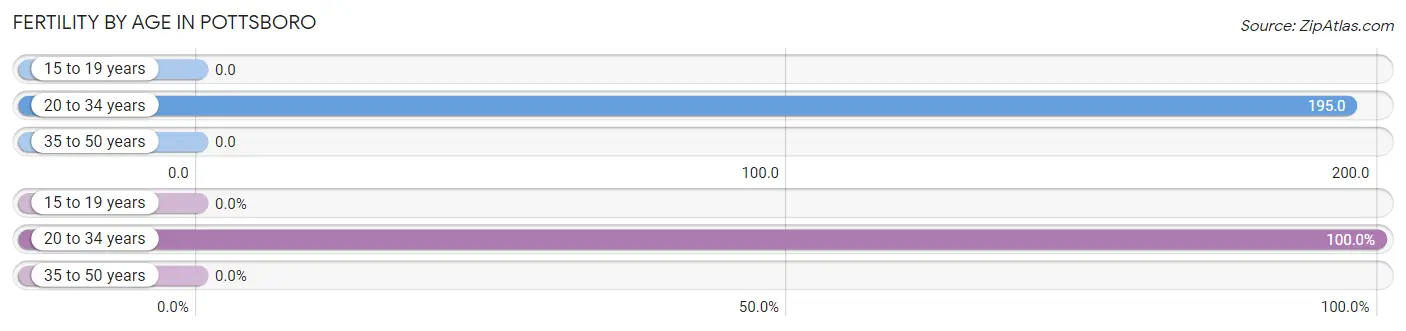
| Age Bracket | Women with Births | Births / 1,000 Women |
| 15 to 19 years | 0 (0.0%) | 0.0 |
| 20 to 34 years | 25 (100.0%) | 195.0 |
| 35 to 50 years | 0 (0.0%) | 0.0 |
| Total | 25 (100.0%) | 58.0 |
Fertility by Age by Marriage Status in Pottsboro
68.0% of women with births (25) in Pottsboro are married. The highest percentage of unmarried women with births falls into 20 to 34 years age bracket with 32.0% of them unmarried at the time of birth, while the lowest percentage of unmarried women with births belong to 20 to 34 years age bracket with 32.0% of them unmarried.
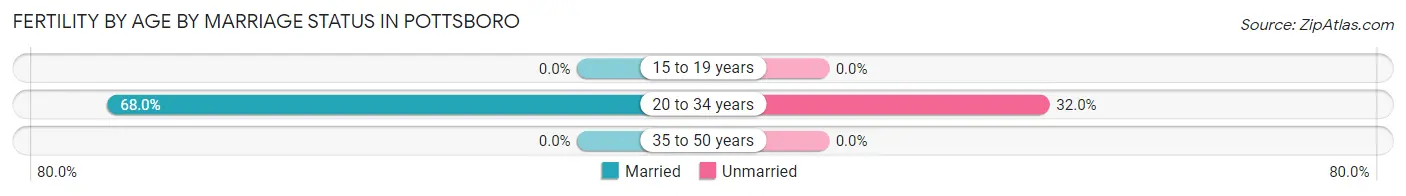
| Age Bracket | Married | Unmarried |
| 15 to 19 years | 0 (0.0%) | 0 (0.0%) |
| 20 to 34 years | 17 (68.0%) | 8 (32.0%) |
| 35 to 50 years | 0 (0.0%) | 0 (0.0%) |
| Total | 17 (68.0%) | 8 (32.0%) |
Fertility by Education in Pottsboro
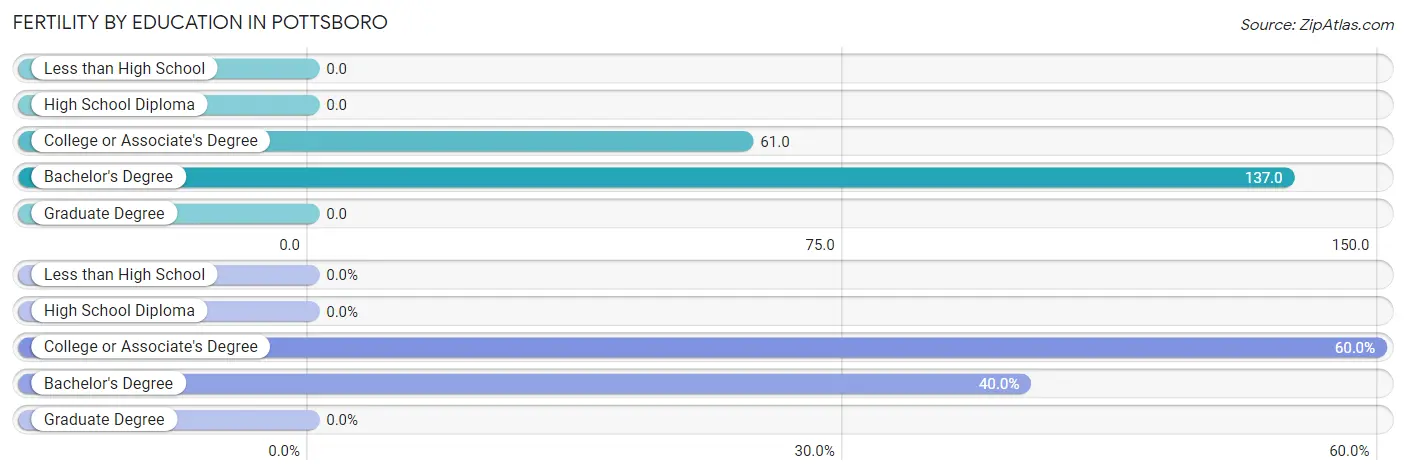
| Educational Attainment | Women with Births | Births / 1,000 Women |
| Less than High School | 0 (0.0%) | 0.0 |
| High School Diploma | 0 (0.0%) | 0.0 |
| College or Associate's Degree | 15 (60.0%) | 61.0 |
| Bachelor's Degree | 10 (40.0%) | 137.0 |
| Graduate Degree | 0 (0.0%) | 0.0 |
| Total | 25 (100.0%) | 58.0 |
Fertility by Education by Marriage Status in Pottsboro
32.0% of women with births in Pottsboro are unmarried. Women with the educational attainment of bachelor's degree are most likely to be married with 100.0% of them married at childbirth, while women with the educational attainment of college or associate's degree are least likely to be married with 53.3% of them unmarried at childbirth.
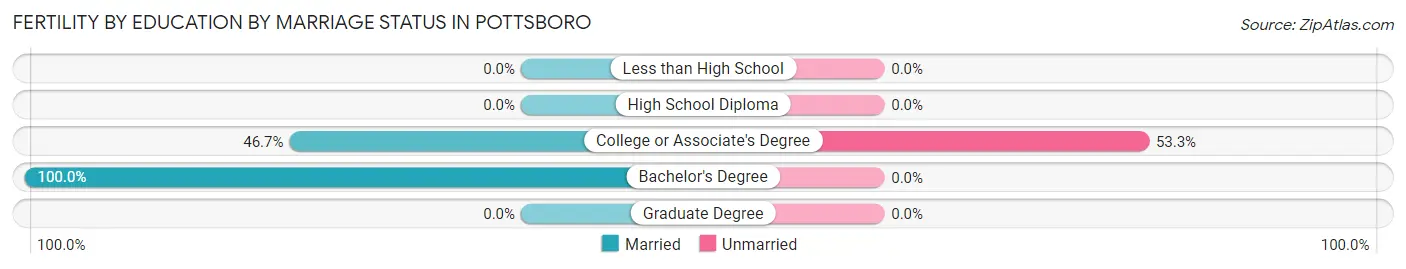
| Educational Attainment | Married | Unmarried |
| Less than High School | 0 (0.0%) | 0 (0.0%) |
| High School Diploma | 0 (0.0%) | 0 (0.0%) |
| College or Associate's Degree | 7 (46.7%) | 8 (53.3%) |
| Bachelor's Degree | 10 (100.0%) | 0 (0.0%) |
| Graduate Degree | 0 (0.0%) | 0 (0.0%) |
| Total | 17 (68.0%) | 8 (32.0%) |
Employment Characteristics in Pottsboro
Employment by Class of Employer in Pottsboro
Among the 1,280 employed individuals in Pottsboro, private company employees (980 | 76.6%), local government employees (107 | 8.4%), and not-for-profit organizations (66 | 5.2%) make up the most common classes of employment.
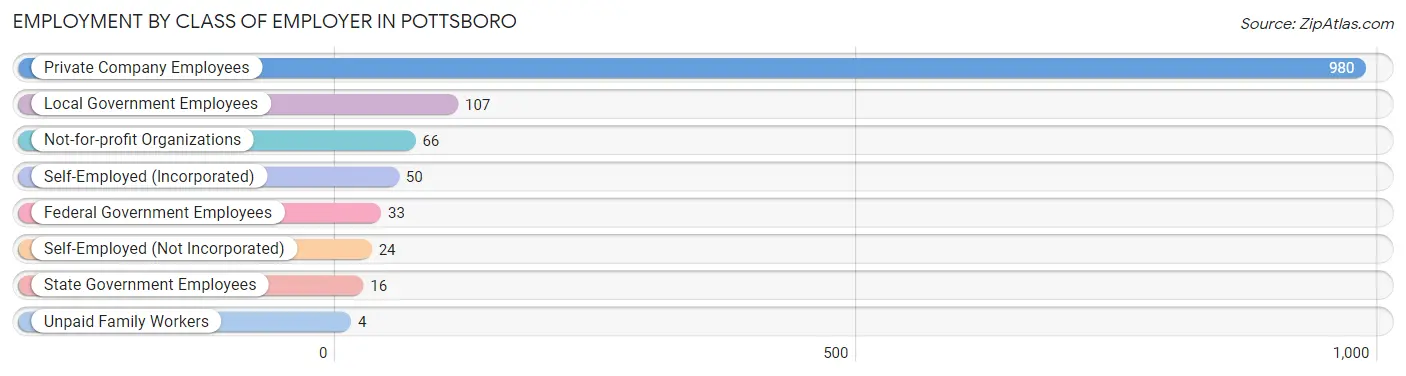
| Employer Class | # Employees | % Employees |
| Private Company Employees | 980 | 76.6% |
| Self-Employed (Incorporated) | 50 | 3.9% |
| Self-Employed (Not Incorporated) | 24 | 1.9% |
| Not-for-profit Organizations | 66 | 5.2% |
| Local Government Employees | 107 | 8.4% |
| State Government Employees | 16 | 1.3% |
| Federal Government Employees | 33 | 2.6% |
| Unpaid Family Workers | 4 | 0.3% |
| Total | 1,280 | 100.0% |
Employment Status by Age in Pottsboro
According to the labor force statistics for Pottsboro, out of the total population over 16 years of age (1,982), 68.1% or 1,350 individuals are in the labor force, with 4.8% or 65 of them unemployed. The age group with the highest labor force participation rate is 20 to 24 years, with 100.0% or 67 individuals in the labor force. Within the labor force, the 75 years and over age range has the highest percentage of unemployed individuals, with 50.0% or 7 of them being unemployed.
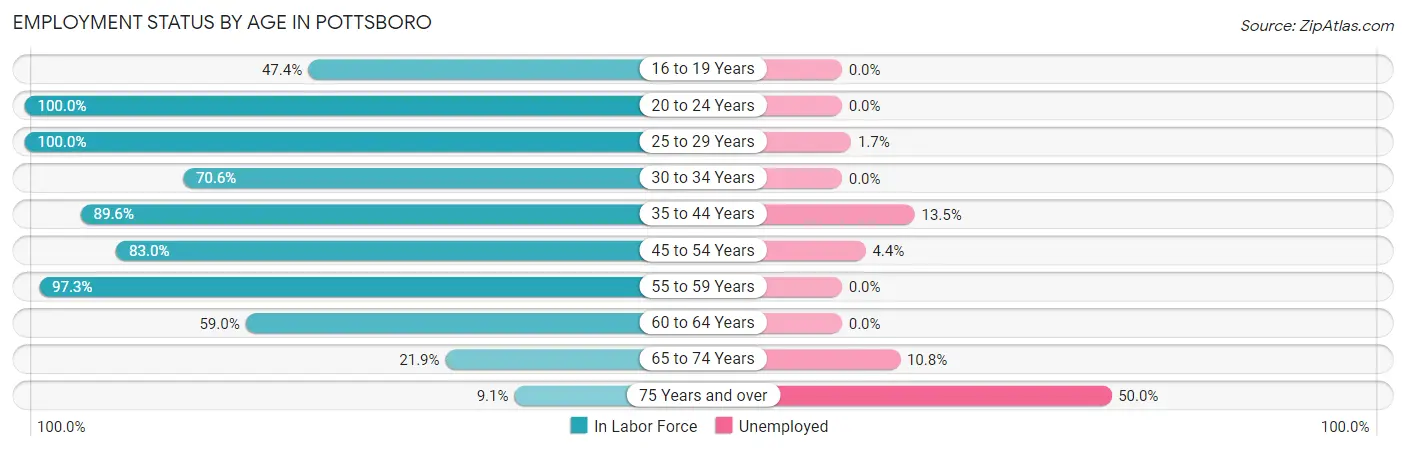
| Age Bracket | In Labor Force | Unemployed |
| 16 to 19 Years | 63 (47.4%) | 0 (0.0%) |
| 20 to 24 Years | 67 (100.0%) | 0 (0.0%) |
| 25 to 29 Years | 239 (100.0%) | 4 (1.7%) |
| 30 to 34 Years | 77 (70.6%) | 0 (0.0%) |
| 35 to 44 Years | 251 (89.6%) | 34 (13.5%) |
| 45 to 54 Years | 298 (83.0%) | 13 (4.4%) |
| 55 to 59 Years | 183 (97.3%) | 0 (0.0%) |
| 60 to 64 Years | 92 (59.0%) | 0 (0.0%) |
| 65 to 74 Years | 65 (21.9%) | 7 (10.8%) |
| 75 Years and over | 14 (9.1%) | 7 (50.0%) |
| Total | 1,350 (68.1%) | 65 (4.8%) |
Employment Status by Educational Attainment in Pottsboro
According to labor force statistics for Pottsboro, 85.6% of individuals (1,139) out of the total population between 25 and 64 years of age (1,331) are in the labor force, with 4.5% or 51 of them being unemployed. The group with the highest labor force participation rate are those with the educational attainment of college / associate degree, with 90.4% or 548 individuals in the labor force. Within the labor force, individuals with college / associate degree education have the highest percentage of unemployment, with 7.1% or 39 of them being unemployed.
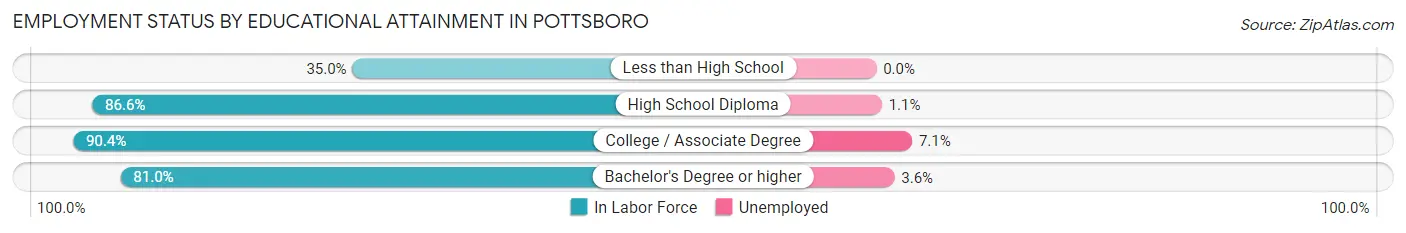
| Educational Attainment | In Labor Force | Unemployed |
| Less than High School | 14 (35.0%) | 0 (0.0%) |
| High School Diploma | 356 (86.6%) | 5 (1.1%) |
| College / Associate Degree | 548 (90.4%) | 43 (7.1%) |
| Bachelor's Degree or higher | 222 (81.0%) | 10 (3.6%) |
| Total | 1,139 (85.6%) | 60 (4.5%) |
Employment Occupations by Sex in Pottsboro
Management, Business, Science and Arts Occupations
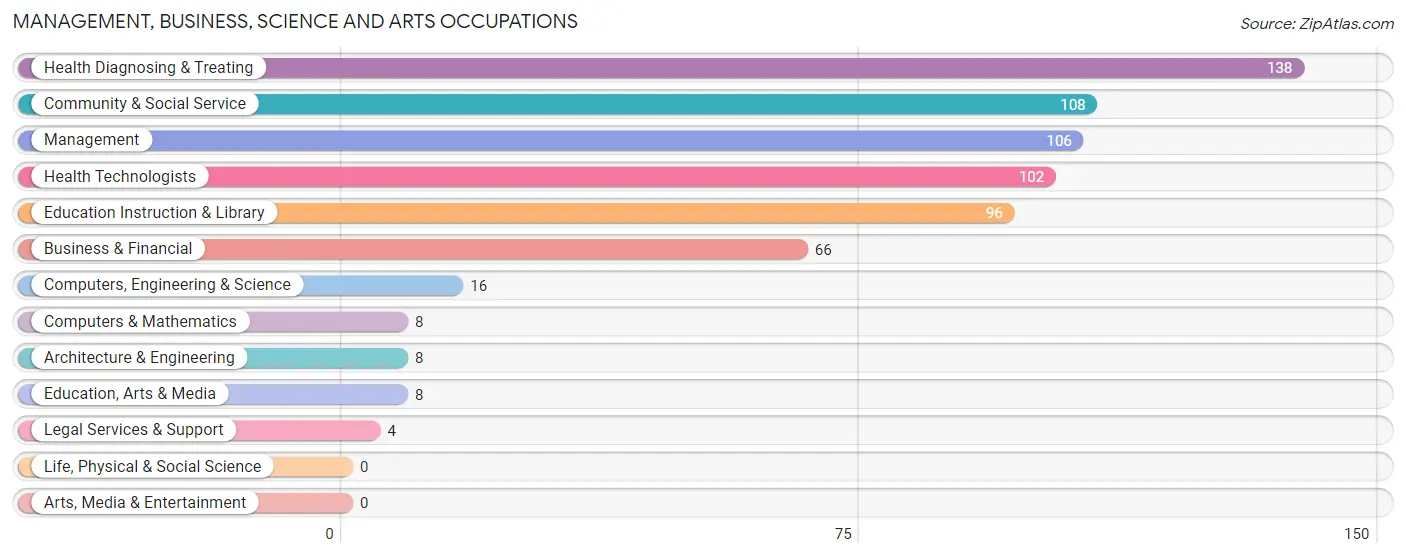
The most common Management, Business, Science and Arts occupations in Pottsboro are Health Diagnosing & Treating (138 | 10.7%), Community & Social Service (108 | 8.4%), Management (106 | 8.3%), Health Technologists (102 | 7.9%), and Education Instruction & Library (96 | 7.5%).
Management, Business, Science and Arts Occupations by Sex
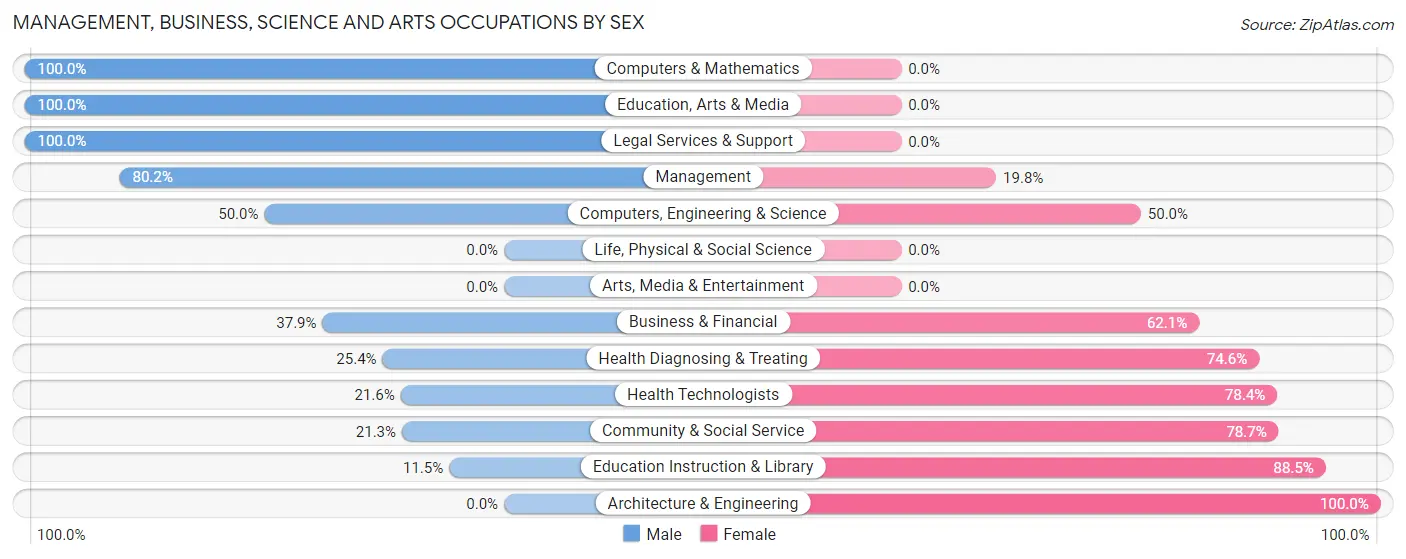
Within the Management, Business, Science and Arts occupations in Pottsboro, the most male-oriented occupations are Computers & Mathematics (100.0%), Education, Arts & Media (100.0%), and Legal Services & Support (100.0%), while the most female-oriented occupations are Architecture & Engineering (100.0%), Education Instruction & Library (88.5%), and Community & Social Service (78.7%).
| Occupation | Male | Female |
| Management | 85 (80.2%) | 21 (19.8%) |
| Business & Financial | 25 (37.9%) | 41 (62.1%) |
| Computers, Engineering & Science | 8 (50.0%) | 8 (50.0%) |
| Computers & Mathematics | 8 (100.0%) | 0 (0.0%) |
| Architecture & Engineering | 0 (0.0%) | 8 (100.0%) |
| Life, Physical & Social Science | 0 (0.0%) | 0 (0.0%) |
| Community & Social Service | 23 (21.3%) | 85 (78.7%) |
| Education, Arts & Media | 8 (100.0%) | 0 (0.0%) |
| Legal Services & Support | 4 (100.0%) | 0 (0.0%) |
| Education Instruction & Library | 11 (11.5%) | 85 (88.5%) |
| Arts, Media & Entertainment | 0 (0.0%) | 0 (0.0%) |
| Health Diagnosing & Treating | 35 (25.4%) | 103 (74.6%) |
| Health Technologists | 22 (21.6%) | 80 (78.4%) |
| Total (Category) | 176 (40.6%) | 258 (59.5%) |
| Total (Overall) | 729 (56.8%) | 555 (43.2%) |
Services Occupations
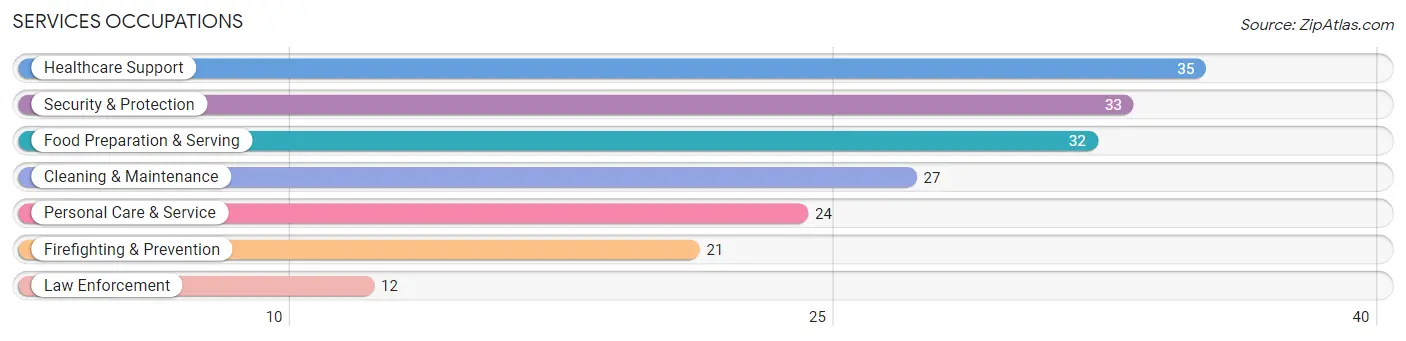
The most common Services occupations in Pottsboro are Healthcare Support (35 | 2.7%), Security & Protection (33 | 2.6%), Food Preparation & Serving (32 | 2.5%), Cleaning & Maintenance (27 | 2.1%), and Personal Care & Service (24 | 1.9%).
Services Occupations by Sex
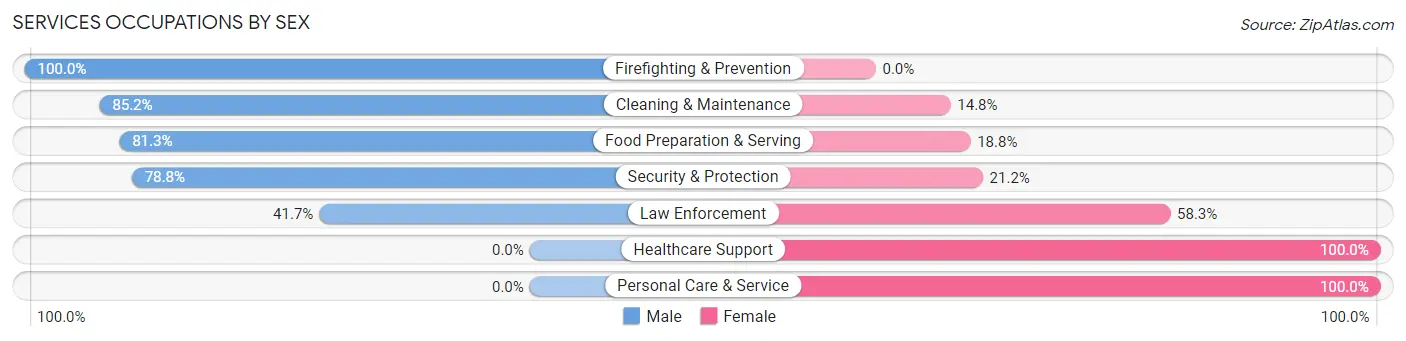
Within the Services occupations in Pottsboro, the most male-oriented occupations are Firefighting & Prevention (100.0%), Cleaning & Maintenance (85.2%), and Food Preparation & Serving (81.2%), while the most female-oriented occupations are Healthcare Support (100.0%), Personal Care & Service (100.0%), and Law Enforcement (58.3%).
| Occupation | Male | Female |
| Healthcare Support | 0 (0.0%) | 35 (100.0%) |
| Security & Protection | 26 (78.8%) | 7 (21.2%) |
| Firefighting & Prevention | 21 (100.0%) | 0 (0.0%) |
| Law Enforcement | 5 (41.7%) | 7 (58.3%) |
| Food Preparation & Serving | 26 (81.2%) | 6 (18.8%) |
| Cleaning & Maintenance | 23 (85.2%) | 4 (14.8%) |
| Personal Care & Service | 0 (0.0%) | 24 (100.0%) |
| Total (Category) | 75 (49.7%) | 76 (50.3%) |
| Total (Overall) | 729 (56.8%) | 555 (43.2%) |
Sales and Office Occupations
The most common Sales and Office occupations in Pottsboro are Office & Administration (193 | 15.0%), and Sales & Related (91 | 7.1%).
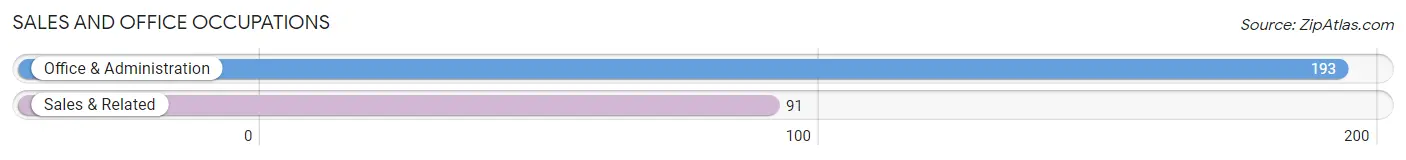
Sales and Office Occupations by Sex
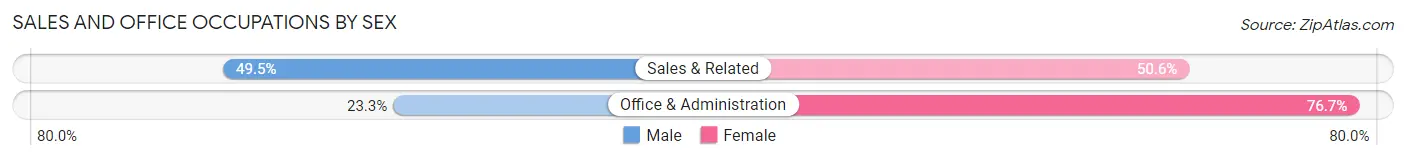
| Occupation | Male | Female |
| Sales & Related | 45 (49.4%) | 46 (50.5%) |
| Office & Administration | 45 (23.3%) | 148 (76.7%) |
| Total (Category) | 90 (31.7%) | 194 (68.3%) |
| Total (Overall) | 729 (56.8%) | 555 (43.2%) |
Natural Resources, Construction and Maintenance Occupations
The most common Natural Resources, Construction and Maintenance occupations in Pottsboro are Installation, Maintenance & Repair (74 | 5.8%), and Construction & Extraction (60 | 4.7%).
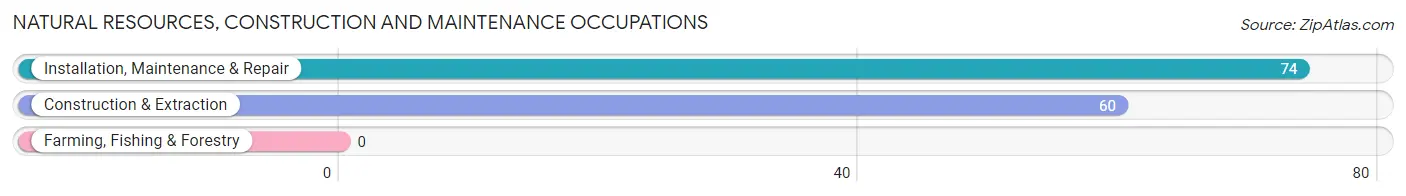
Natural Resources, Construction and Maintenance Occupations by Sex
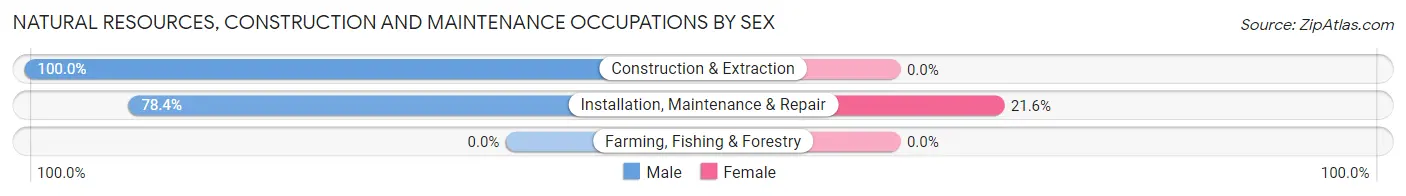
| Occupation | Male | Female |
| Farming, Fishing & Forestry | 0 (0.0%) | 0 (0.0%) |
| Construction & Extraction | 60 (100.0%) | 0 (0.0%) |
| Installation, Maintenance & Repair | 58 (78.4%) | 16 (21.6%) |
| Total (Category) | 118 (88.1%) | 16 (11.9%) |
| Total (Overall) | 729 (56.8%) | 555 (43.2%) |
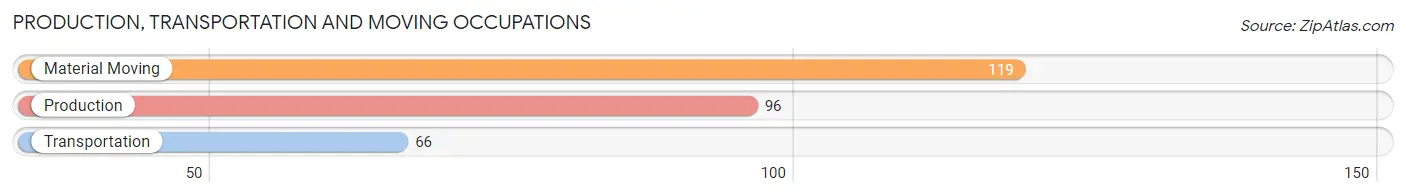
Production, Transportation and Moving Occupations
The most common Production, Transportation and Moving occupations in Pottsboro are Material Moving (119 | 9.3%), Production (96 | 7.5%), and Transportation (66 | 5.1%).
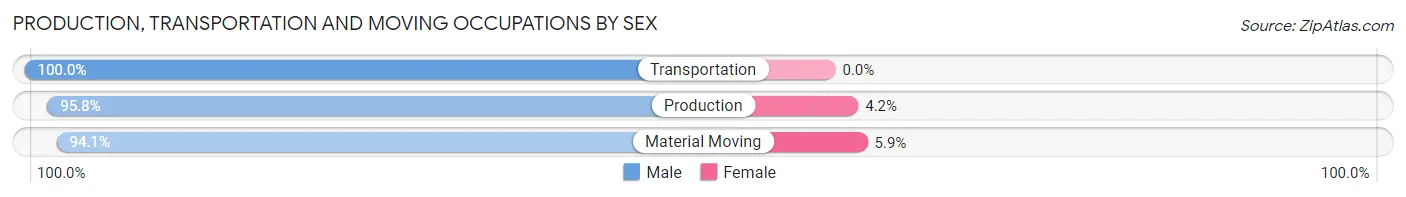
Production, Transportation and Moving Occupations by Sex
| Occupation | Male | Female |
| Production | 92 (95.8%) | 4 (4.2%) |
| Transportation | 66 (100.0%) | 0 (0.0%) |
| Material Moving | 112 (94.1%) | 7 (5.9%) |
| Total (Category) | 270 (96.1%) | 11 (3.9%) |
| Total (Overall) | 729 (56.8%) | 555 (43.2%) |
Employment Industries by Sex in Pottsboro
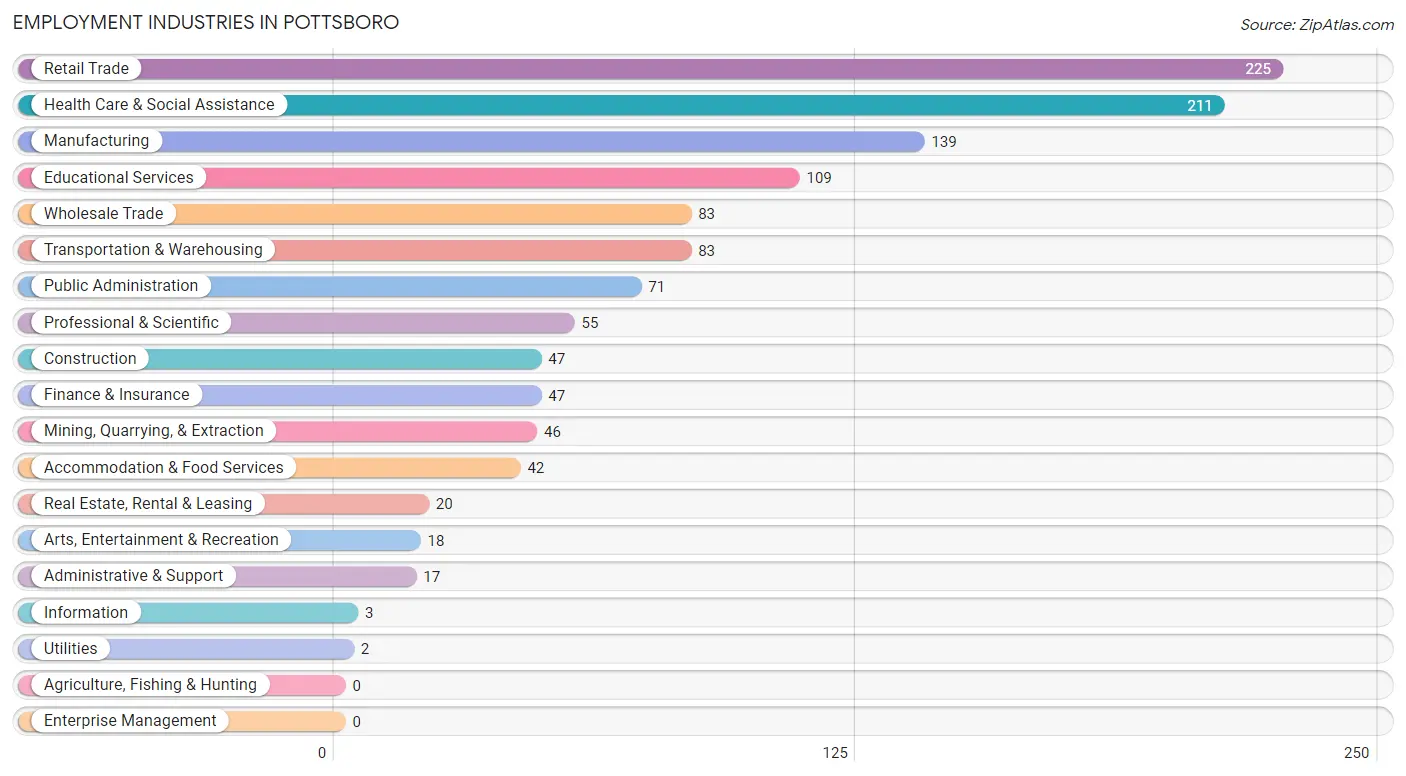
Employment Industries in Pottsboro
The major employment industries in Pottsboro include Retail Trade (225 | 17.5%), Health Care & Social Assistance (211 | 16.4%), Manufacturing (139 | 10.8%), Educational Services (109 | 8.5%), and Wholesale Trade (83 | 6.5%).
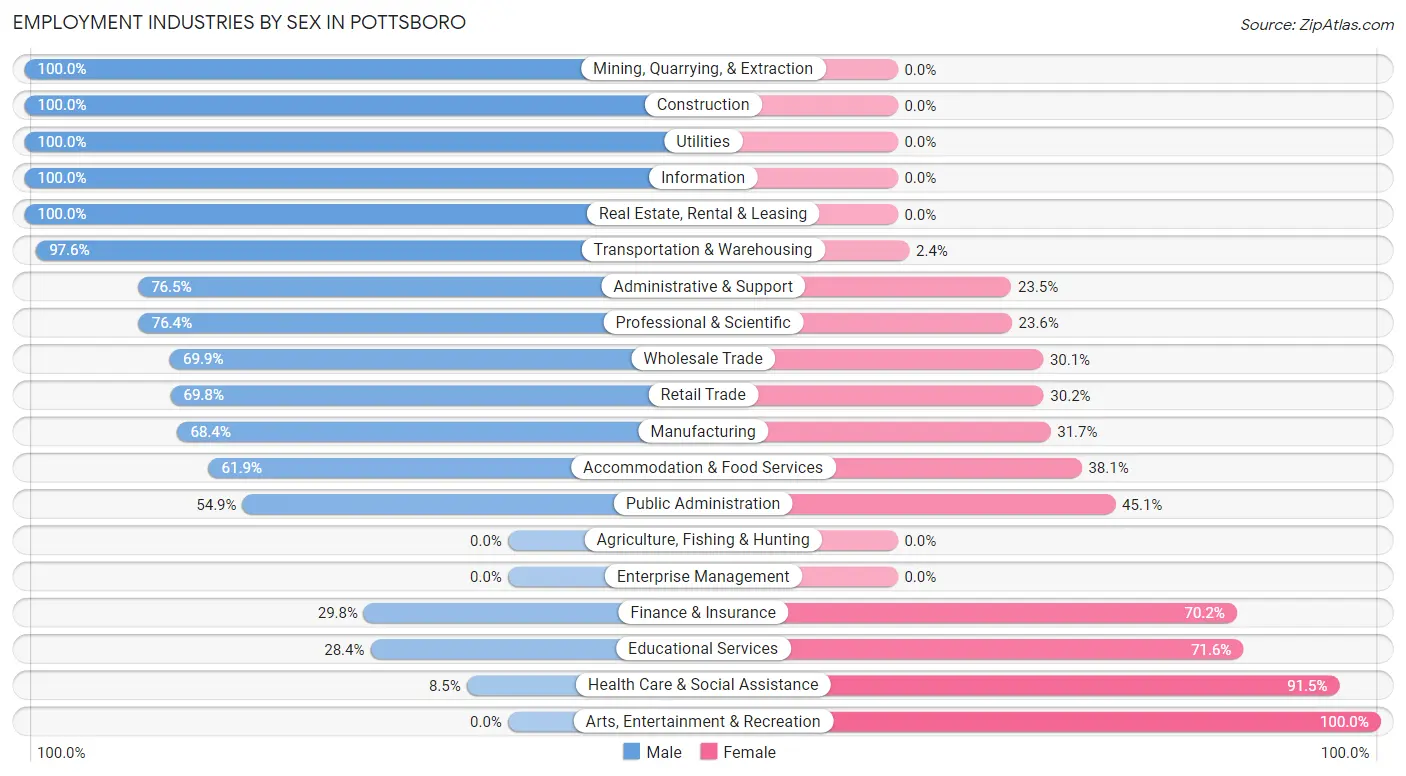
Employment Industries by Sex in Pottsboro
The Pottsboro industries that see more men than women are Mining, Quarrying, & Extraction (100.0%), Construction (100.0%), and Utilities (100.0%), whereas the industries that tend to have a higher number of women are Arts, Entertainment & Recreation (100.0%), Health Care & Social Assistance (91.5%), and Educational Services (71.6%).
| Industry | Male | Female |
| Agriculture, Fishing & Hunting | 0 (0.0%) | 0 (0.0%) |
| Mining, Quarrying, & Extraction | 46 (100.0%) | 0 (0.0%) |
| Construction | 47 (100.0%) | 0 (0.0%) |
| Manufacturing | 95 (68.3%) | 44 (31.7%) |
| Wholesale Trade | 58 (69.9%) | 25 (30.1%) |
| Retail Trade | 157 (69.8%) | 68 (30.2%) |
| Transportation & Warehousing | 81 (97.6%) | 2 (2.4%) |
| Utilities | 2 (100.0%) | 0 (0.0%) |
| Information | 3 (100.0%) | 0 (0.0%) |
| Finance & Insurance | 14 (29.8%) | 33 (70.2%) |
| Real Estate, Rental & Leasing | 20 (100.0%) | 0 (0.0%) |
| Professional & Scientific | 42 (76.4%) | 13 (23.6%) |
| Enterprise Management | 0 (0.0%) | 0 (0.0%) |
| Administrative & Support | 13 (76.5%) | 4 (23.5%) |
| Educational Services | 31 (28.4%) | 78 (71.6%) |
| Health Care & Social Assistance | 18 (8.5%) | 193 (91.5%) |
| Arts, Entertainment & Recreation | 0 (0.0%) | 18 (100.0%) |
| Accommodation & Food Services | 26 (61.9%) | 16 (38.1%) |
| Public Administration | 39 (54.9%) | 32 (45.1%) |
| Total | 729 (56.8%) | 555 (43.2%) |
Education in Pottsboro
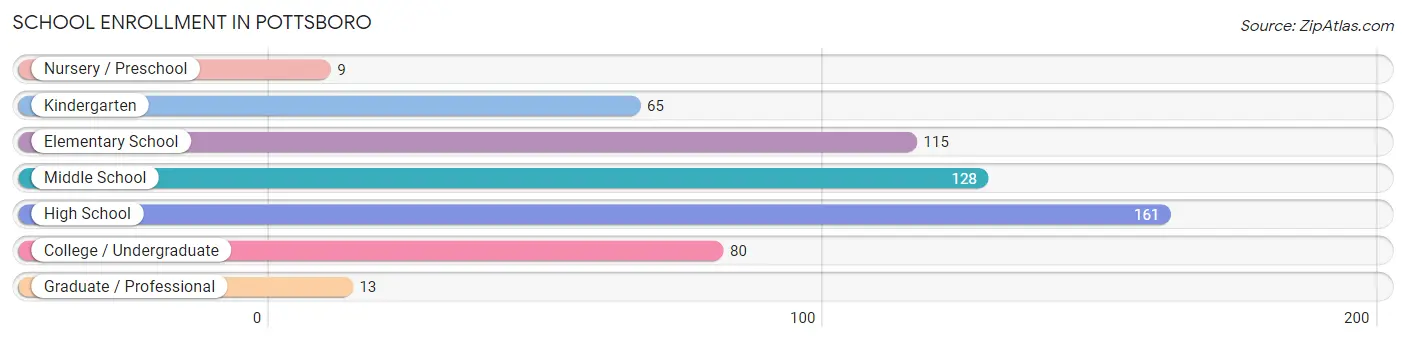
School Enrollment in Pottsboro
The most common levels of schooling among the 571 students in Pottsboro are high school (161 | 28.2%), middle school (128 | 22.4%), and elementary school (115 | 20.1%).
| School Level | # Students | % Students |
| Nursery / Preschool | 9 | 1.6% |
| Kindergarten | 65 | 11.4% |
| Elementary School | 115 | 20.1% |
| Middle School | 128 | 22.4% |
| High School | 161 | 28.2% |
| College / Undergraduate | 80 | 14.0% |
| Graduate / Professional | 13 | 2.3% |
| Total | 571 | 100.0% |
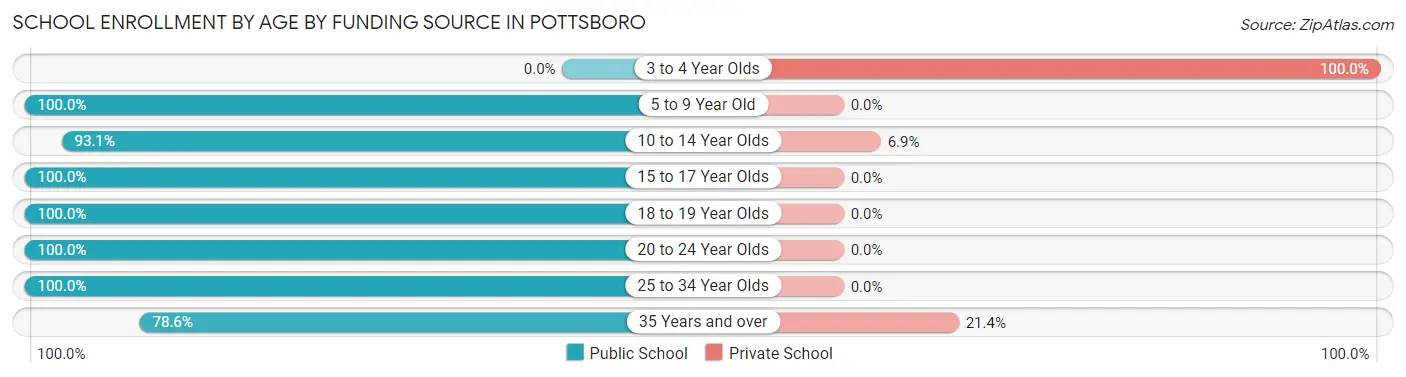
School Enrollment by Age by Funding Source in Pottsboro
Out of a total of 571 students who are enrolled in schools in Pottsboro, 28 (4.9%) attend a private institution, while the remaining 543 (95.1%) are enrolled in public schools. The age group of 3 to 4 year olds has the highest likelihood of being enrolled in private schools, with 9 (100.0% in the age bracket) enrolled. Conversely, the age group of 5 to 9 year old has the lowest likelihood of being enrolled in a private school, with 163 (100.0% in the age bracket) attending a public institution.
| Age Bracket | Public School | Private School |
| 3 to 4 Year Olds | 0 (0.0%) | 9 (100.0%) |
| 5 to 9 Year Old | 163 (100.0%) | 0 (0.0%) |
| 10 to 14 Year Olds | 135 (93.1%) | 10 (6.9%) |
| 15 to 17 Year Olds | 157 (100.0%) | 0 (0.0%) |
| 18 to 19 Year Olds | 4 (100.0%) | 0 (0.0%) |
| 20 to 24 Year Olds | 4 (100.0%) | 0 (0.0%) |
| 25 to 34 Year Olds | 47 (100.0%) | 0 (0.0%) |
| 35 Years and over | 33 (78.6%) | 9 (21.4%) |
| Total | 543 (95.1%) | 28 (4.9%) |
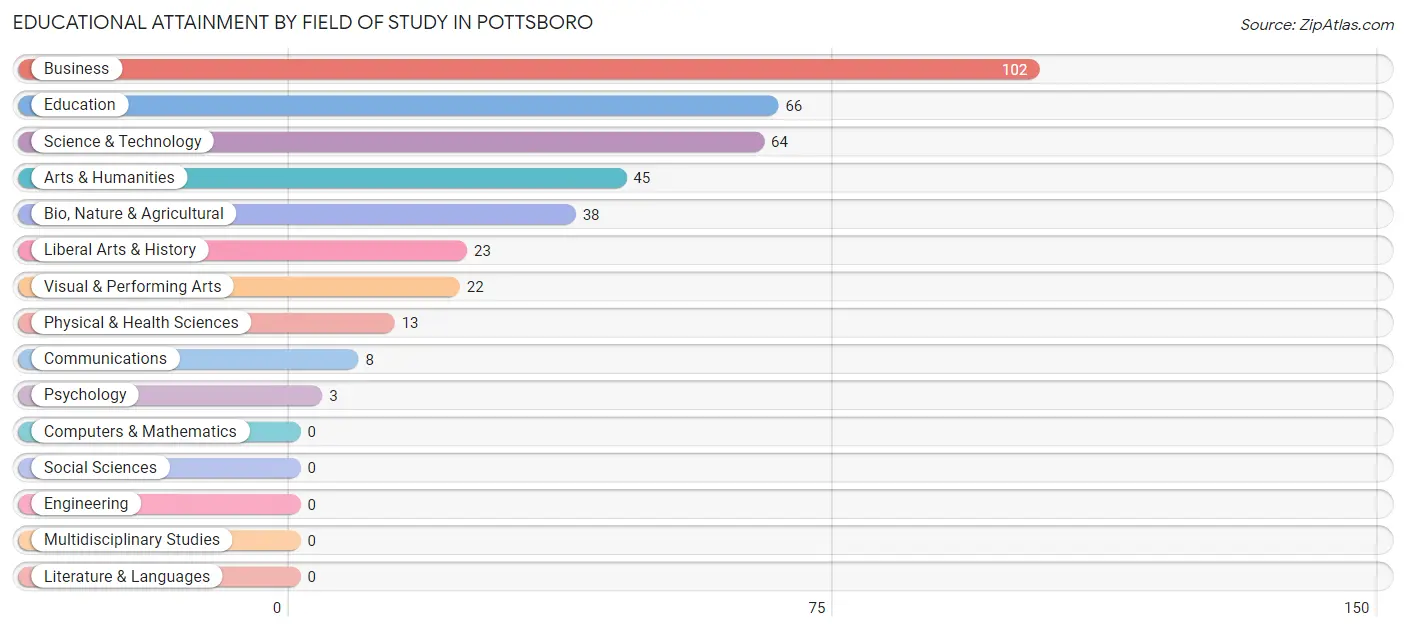
Educational Attainment by Field of Study in Pottsboro
Business (102 | 26.6%), education (66 | 17.2%), science & technology (64 | 16.7%), arts & humanities (45 | 11.7%), and bio, nature & agricultural (38 | 9.9%) are the most common fields of study among 384 individuals in Pottsboro who have obtained a bachelor's degree or higher.
| Field of Study | # Graduates | % Graduates |
| Computers & Mathematics | 0 | 0.0% |
| Bio, Nature & Agricultural | 38 | 9.9% |
| Physical & Health Sciences | 13 | 3.4% |
| Psychology | 3 | 0.8% |
| Social Sciences | 0 | 0.0% |
| Engineering | 0 | 0.0% |
| Multidisciplinary Studies | 0 | 0.0% |
| Science & Technology | 64 | 16.7% |
| Business | 102 | 26.6% |
| Education | 66 | 17.2% |
| Literature & Languages | 0 | 0.0% |
| Liberal Arts & History | 23 | 6.0% |
| Visual & Performing Arts | 22 | 5.7% |
| Communications | 8 | 2.1% |
| Arts & Humanities | 45 | 11.7% |
| Total | 384 | 100.0% |
Transportation & Commute in Pottsboro
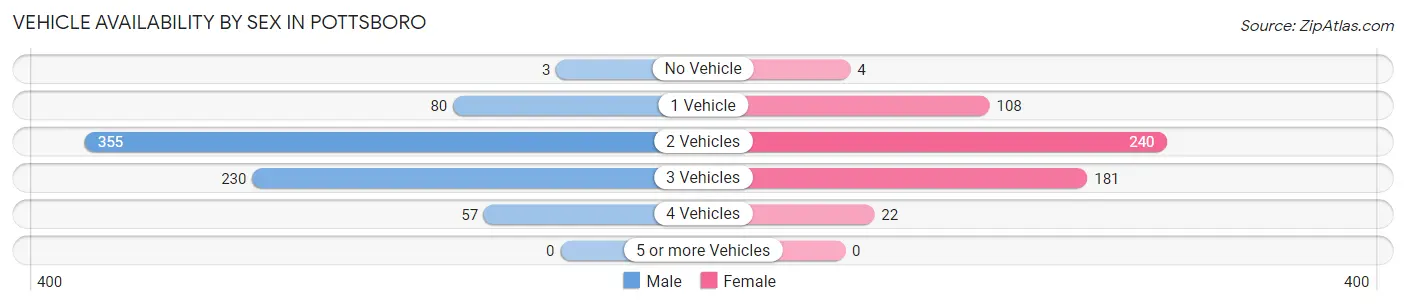
Vehicle Availability by Sex in Pottsboro
The most prevalent vehicle ownership categories in Pottsboro are males with 2 vehicles (355, accounting for 49.0%) and females with 2 vehicles (240, making up 64.0%).
| Vehicles Available | Male | Female |
| No Vehicle | 3 (0.4%) | 4 (0.7%) |
| 1 Vehicle | 80 (11.0%) | 108 (19.5%) |
| 2 Vehicles | 355 (49.0%) | 240 (43.2%) |
| 3 Vehicles | 230 (31.7%) | 181 (32.6%) |
| 4 Vehicles | 57 (7.9%) | 22 (4.0%) |
| 5 or more Vehicles | 0 (0.0%) | 0 (0.0%) |
| Total | 725 (100.0%) | 555 (100.0%) |
Commute Time in Pottsboro
The most frequently occuring commute durations in Pottsboro are 15 to 19 minutes (320 commuters, 27.8%), less than 5 minutes (160 commuters, 13.9%), and 30 to 34 minutes (129 commuters, 11.2%).
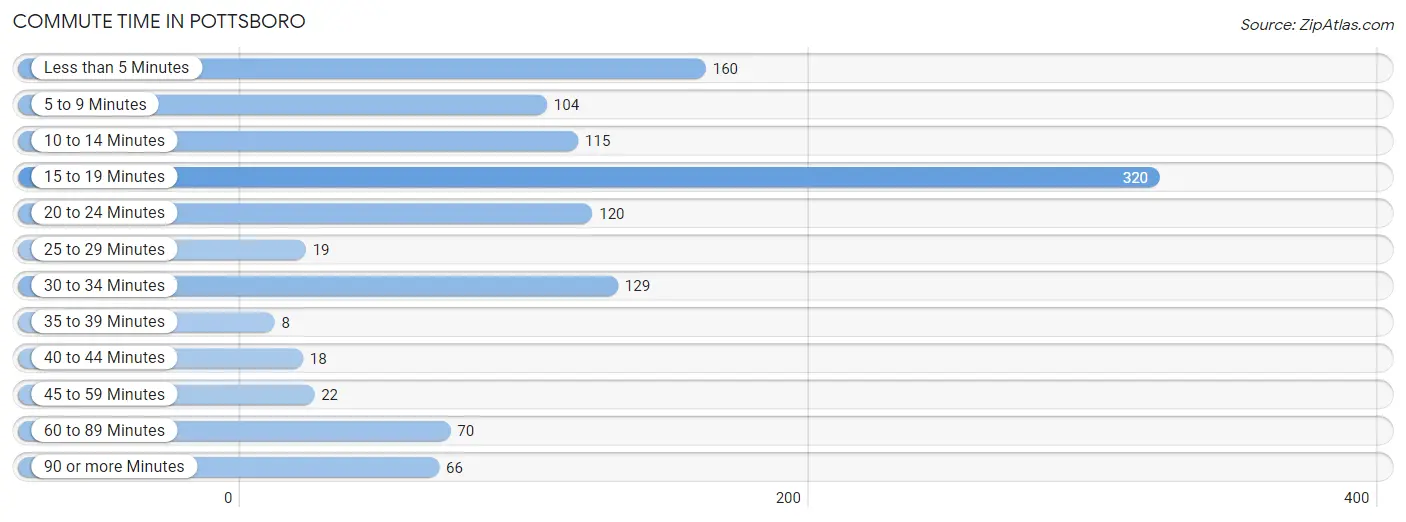
| Commute Time | # Commuters | % Commuters |
| Less than 5 Minutes | 160 | 13.9% |
| 5 to 9 Minutes | 104 | 9.0% |
| 10 to 14 Minutes | 115 | 10.0% |
| 15 to 19 Minutes | 320 | 27.8% |
| 20 to 24 Minutes | 120 | 10.4% |
| 25 to 29 Minutes | 19 | 1.7% |
| 30 to 34 Minutes | 129 | 11.2% |
| 35 to 39 Minutes | 8 | 0.7% |
| 40 to 44 Minutes | 18 | 1.6% |
| 45 to 59 Minutes | 22 | 1.9% |
| 60 to 89 Minutes | 70 | 6.1% |
| 90 or more Minutes | 66 | 5.7% |
Commute Time by Sex in Pottsboro
The most common commute times in Pottsboro are 15 to 19 minutes (207 commuters, 29.5%) for males and 15 to 19 minutes (113 commuters, 25.2%) for females.
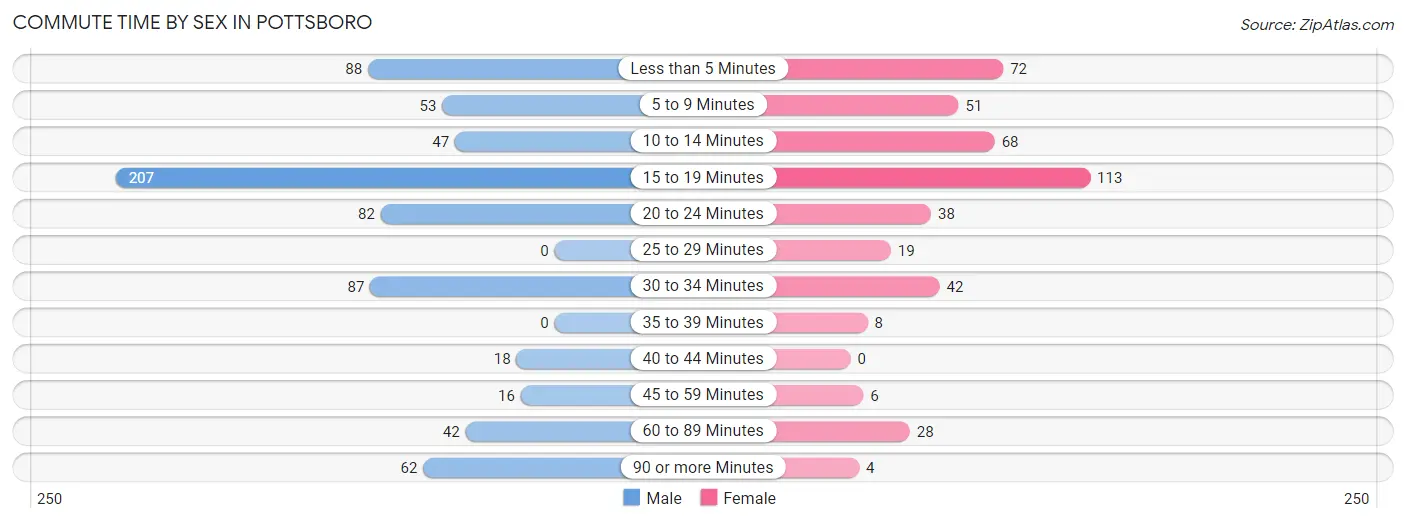
| Commute Time | Male | Female |
| Less than 5 Minutes | 88 (12.5%) | 72 (16.0%) |
| 5 to 9 Minutes | 53 (7.5%) | 51 (11.4%) |
| 10 to 14 Minutes | 47 (6.7%) | 68 (15.1%) |
| 15 to 19 Minutes | 207 (29.5%) | 113 (25.2%) |
| 20 to 24 Minutes | 82 (11.7%) | 38 (8.5%) |
| 25 to 29 Minutes | 0 (0.0%) | 19 (4.2%) |
| 30 to 34 Minutes | 87 (12.4%) | 42 (9.3%) |
| 35 to 39 Minutes | 0 (0.0%) | 8 (1.8%) |
| 40 to 44 Minutes | 18 (2.6%) | 0 (0.0%) |
| 45 to 59 Minutes | 16 (2.3%) | 6 (1.3%) |
| 60 to 89 Minutes | 42 (6.0%) | 28 (6.2%) |
| 90 or more Minutes | 62 (8.8%) | 4 (0.9%) |
Time of Departure to Work by Sex in Pottsboro
The most frequent times of departure to work in Pottsboro are 7:30 AM to 7:59 AM (104, 14.8%) for males and 7:00 AM to 7:29 AM (84, 18.7%) for females.
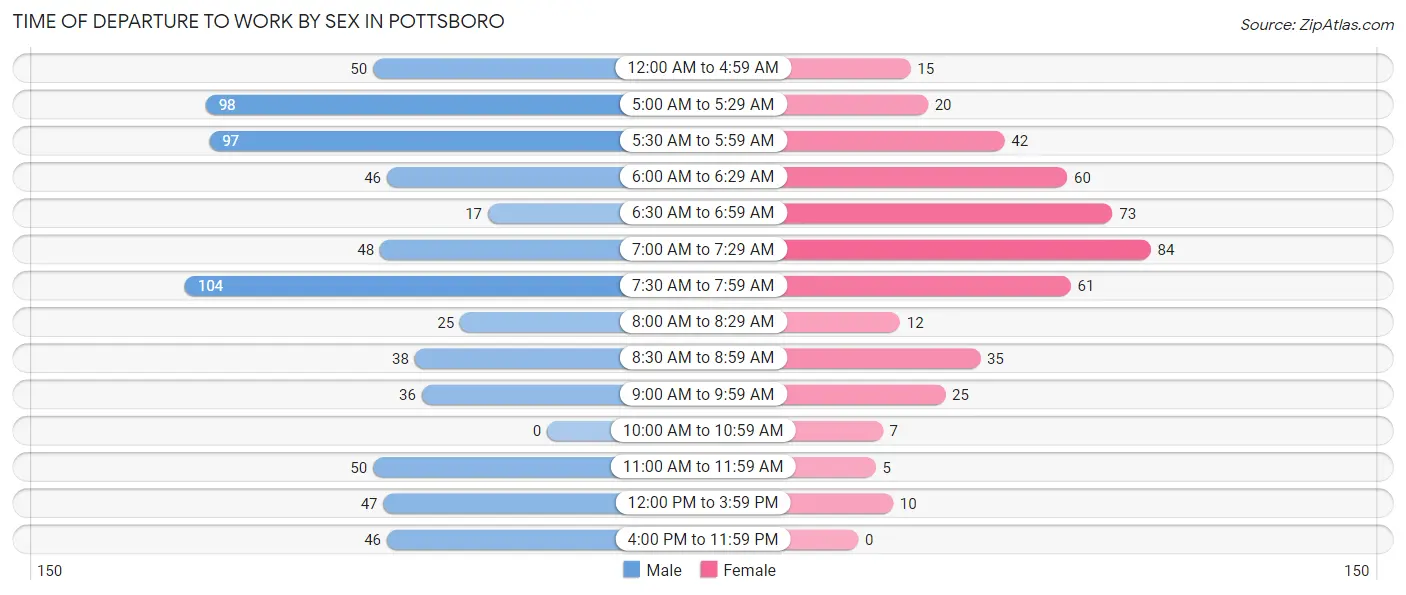
| Time of Departure | Male | Female |
| 12:00 AM to 4:59 AM | 50 (7.1%) | 15 (3.3%) |
| 5:00 AM to 5:29 AM | 98 (14.0%) | 20 (4.4%) |
| 5:30 AM to 5:59 AM | 97 (13.8%) | 42 (9.3%) |
| 6:00 AM to 6:29 AM | 46 (6.6%) | 60 (13.4%) |
| 6:30 AM to 6:59 AM | 17 (2.4%) | 73 (16.3%) |
| 7:00 AM to 7:29 AM | 48 (6.8%) | 84 (18.7%) |
| 7:30 AM to 7:59 AM | 104 (14.8%) | 61 (13.6%) |
| 8:00 AM to 8:29 AM | 25 (3.6%) | 12 (2.7%) |
| 8:30 AM to 8:59 AM | 38 (5.4%) | 35 (7.8%) |
| 9:00 AM to 9:59 AM | 36 (5.1%) | 25 (5.6%) |
| 10:00 AM to 10:59 AM | 0 (0.0%) | 7 (1.6%) |
| 11:00 AM to 11:59 AM | 50 (7.1%) | 5 (1.1%) |
| 12:00 PM to 3:59 PM | 47 (6.7%) | 10 (2.2%) |
| 4:00 PM to 11:59 PM | 46 (6.6%) | 0 (0.0%) |
| Total | 702 (100.0%) | 449 (100.0%) |
Housing Occupancy in Pottsboro
Occupancy by Ownership in Pottsboro
Of the total 959 dwellings in Pottsboro, owner-occupied units account for 673 (70.2%), while renter-occupied units make up 286 (29.8%).
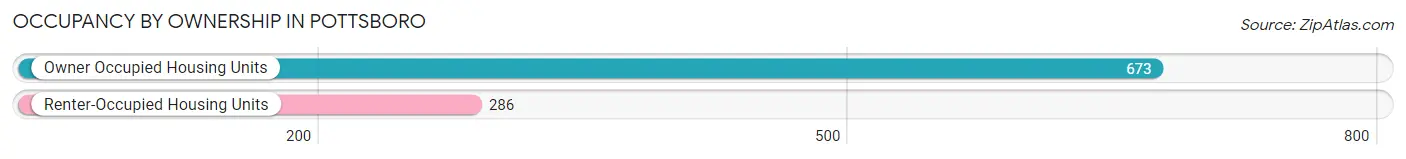
| Occupancy | # Housing Units | % Housing Units |
| Owner Occupied Housing Units | 673 | 70.2% |
| Renter-Occupied Housing Units | 286 | 29.8% |
| Total Occupied Housing Units | 959 | 100.0% |
Occupancy by Household Size in Pottsboro
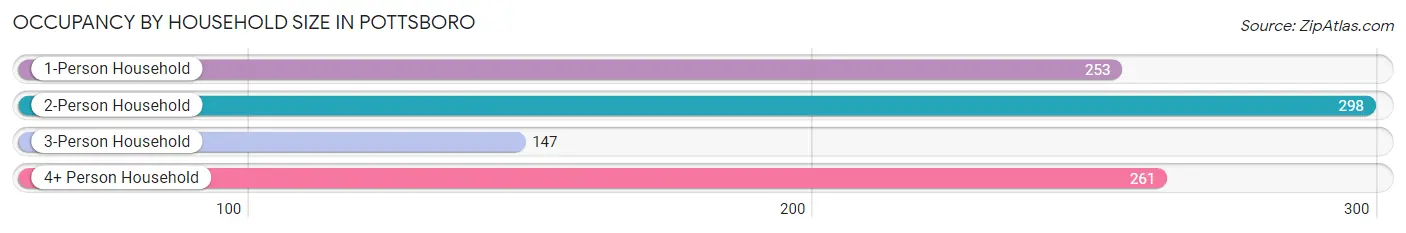
| Household Size | # Housing Units | % Housing Units |
| 1-Person Household | 253 | 26.4% |
| 2-Person Household | 298 | 31.1% |
| 3-Person Household | 147 | 15.3% |
| 4+ Person Household | 261 | 27.2% |
| Total Housing Units | 959 | 100.0% |
Occupancy by Ownership by Household Size in Pottsboro
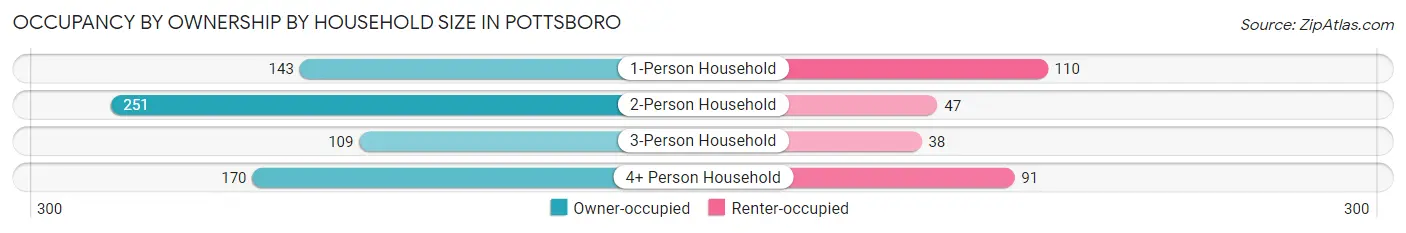
| Household Size | Owner-occupied | Renter-occupied |
| 1-Person Household | 143 (56.5%) | 110 (43.5%) |
| 2-Person Household | 251 (84.2%) | 47 (15.8%) |
| 3-Person Household | 109 (74.2%) | 38 (25.9%) |
| 4+ Person Household | 170 (65.1%) | 91 (34.9%) |
| Total Housing Units | 673 (70.2%) | 286 (29.8%) |
Occupancy by Educational Attainment in Pottsboro
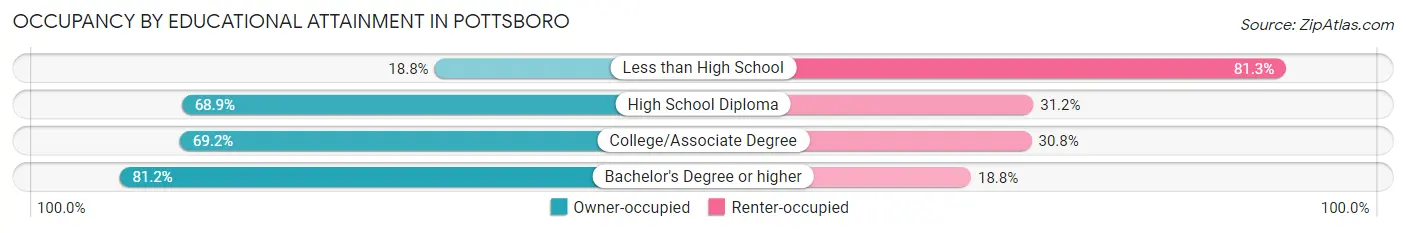
| Household Size | Owner-occupied | Renter-occupied |
| Less than High School | 6 (18.8%) | 26 (81.2%) |
| High School Diploma | 126 (68.9%) | 57 (31.1%) |
| College/Associate Degree | 364 (69.2%) | 162 (30.8%) |
| Bachelor's Degree or higher | 177 (81.2%) | 41 (18.8%) |
Occupancy by Age of Householder in Pottsboro
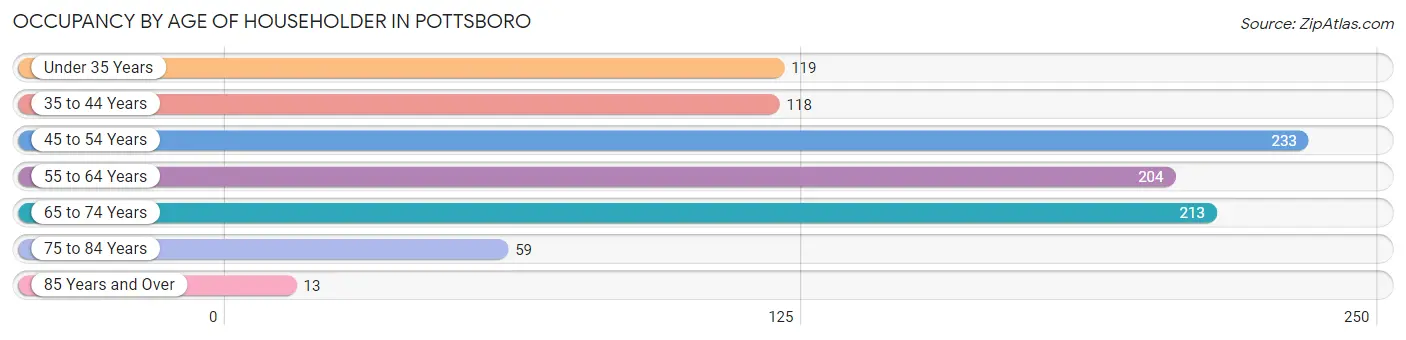
| Age Bracket | # Households | % Households |
| Under 35 Years | 119 | 12.4% |
| 35 to 44 Years | 118 | 12.3% |
| 45 to 54 Years | 233 | 24.3% |
| 55 to 64 Years | 204 | 21.3% |
| 65 to 74 Years | 213 | 22.2% |
| 75 to 84 Years | 59 | 6.1% |
| 85 Years and Over | 13 | 1.4% |
| Total | 959 | 100.0% |
Housing Finances in Pottsboro
Median Income by Occupancy in Pottsboro
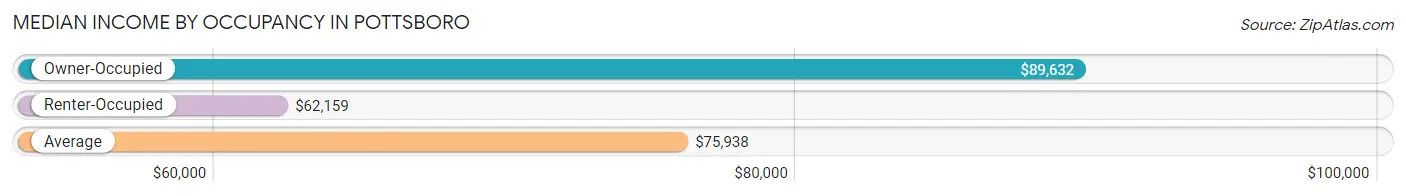
| Occupancy Type | # Households | Median Income |
| Owner-Occupied | 673 (70.2%) | $89,632 |
| Renter-Occupied | 286 (29.8%) | $62,159 |
| Average | 959 (100.0%) | $75,938 |
Occupancy by Householder Income Bracket in Pottsboro
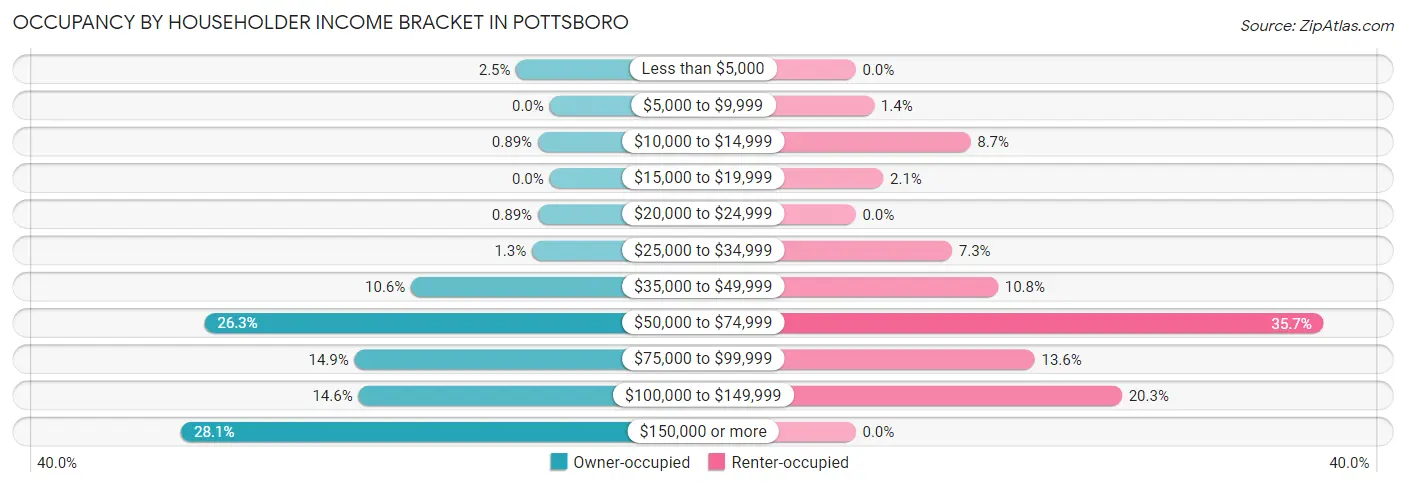
| Income Bracket | Owner-occupied | Renter-occupied |
| Less than $5,000 | 17 (2.5%) | 0 (0.0%) |
| $5,000 to $9,999 | 0 (0.0%) | 4 (1.4%) |
| $10,000 to $14,999 | 6 (0.9%) | 25 (8.7%) |
| $15,000 to $19,999 | 0 (0.0%) | 6 (2.1%) |
| $20,000 to $24,999 | 6 (0.9%) | 0 (0.0%) |
| $25,000 to $34,999 | 9 (1.3%) | 21 (7.3%) |
| $35,000 to $49,999 | 71 (10.5%) | 31 (10.8%) |
| $50,000 to $74,999 | 177 (26.3%) | 102 (35.7%) |
| $75,000 to $99,999 | 100 (14.9%) | 39 (13.6%) |
| $100,000 to $149,999 | 98 (14.6%) | 58 (20.3%) |
| $150,000 or more | 189 (28.1%) | 0 (0.0%) |
| Total | 673 (100.0%) | 286 (100.0%) |
Monthly Housing Cost Tiers in Pottsboro
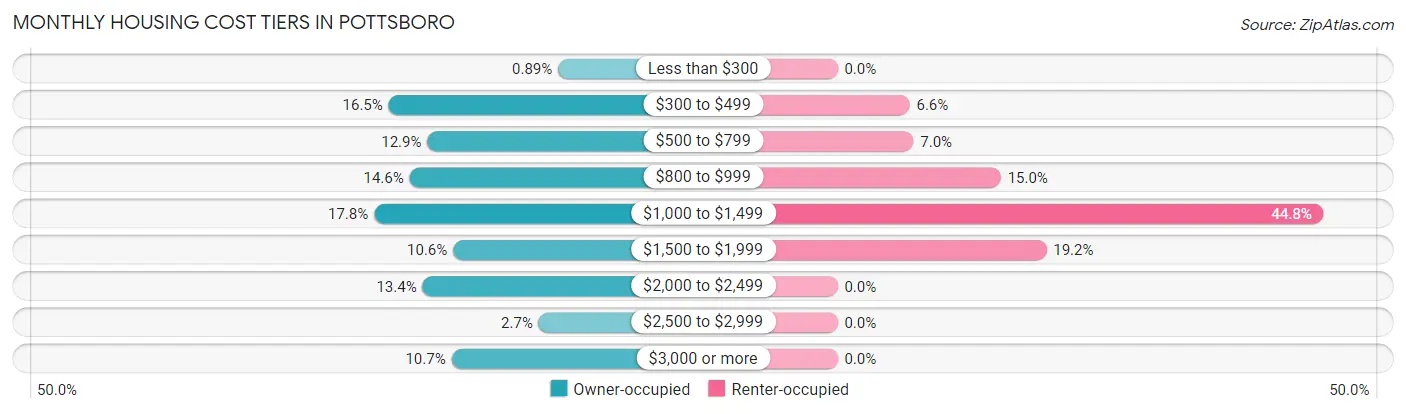
| Monthly Cost | Owner-occupied | Renter-occupied |
| Less than $300 | 6 (0.9%) | 0 (0.0%) |
| $300 to $499 | 111 (16.5%) | 19 (6.6%) |
| $500 to $799 | 87 (12.9%) | 20 (7.0%) |
| $800 to $999 | 98 (14.6%) | 43 (15.0%) |
| $1,000 to $1,499 | 120 (17.8%) | 128 (44.8%) |
| $1,500 to $1,999 | 71 (10.5%) | 55 (19.2%) |
| $2,000 to $2,499 | 90 (13.4%) | 0 (0.0%) |
| $2,500 to $2,999 | 18 (2.7%) | 0 (0.0%) |
| $3,000 or more | 72 (10.7%) | 0 (0.0%) |
| Total | 673 (100.0%) | 286 (100.0%) |
Physical Housing Characteristics in Pottsboro
Housing Structures in Pottsboro
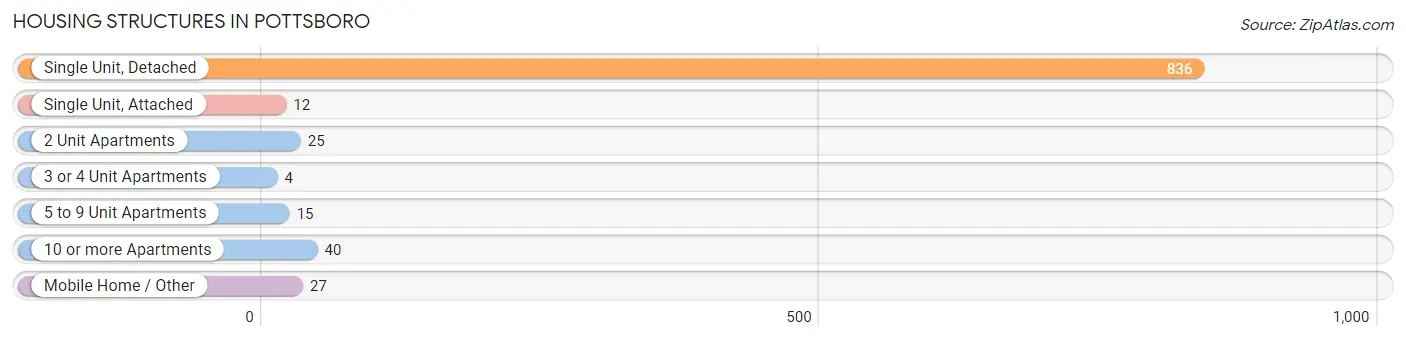
| Structure Type | # Housing Units | % Housing Units |
| Single Unit, Detached | 836 | 87.2% |
| Single Unit, Attached | 12 | 1.3% |
| 2 Unit Apartments | 25 | 2.6% |
| 3 or 4 Unit Apartments | 4 | 0.4% |
| 5 to 9 Unit Apartments | 15 | 1.6% |
| 10 or more Apartments | 40 | 4.2% |
| Mobile Home / Other | 27 | 2.8% |
| Total | 959 | 100.0% |
Housing Structures by Occupancy in Pottsboro
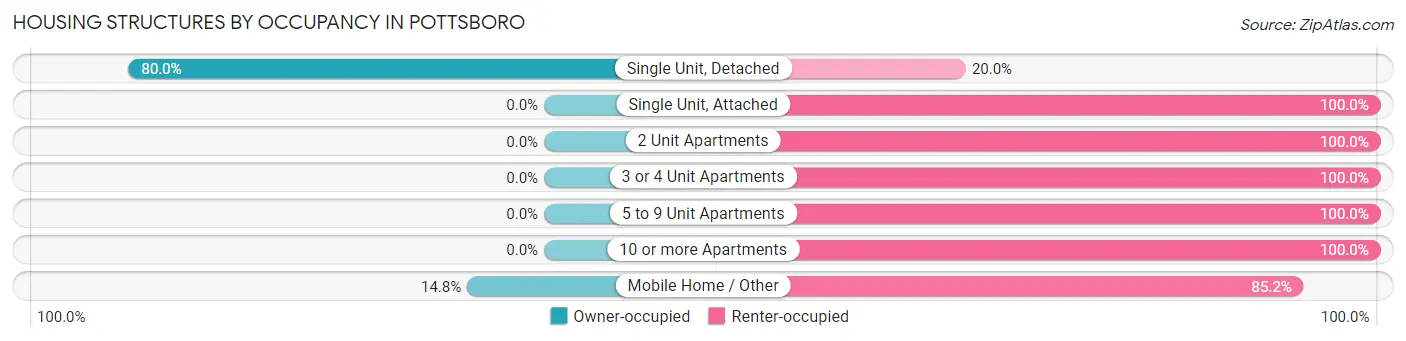
| Structure Type | Owner-occupied | Renter-occupied |
| Single Unit, Detached | 669 (80.0%) | 167 (20.0%) |
| Single Unit, Attached | 0 (0.0%) | 12 (100.0%) |
| 2 Unit Apartments | 0 (0.0%) | 25 (100.0%) |
| 3 or 4 Unit Apartments | 0 (0.0%) | 4 (100.0%) |
| 5 to 9 Unit Apartments | 0 (0.0%) | 15 (100.0%) |
| 10 or more Apartments | 0 (0.0%) | 40 (100.0%) |
| Mobile Home / Other | 4 (14.8%) | 23 (85.2%) |
| Total | 673 (70.2%) | 286 (29.8%) |
Housing Structures by Number of Rooms in Pottsboro
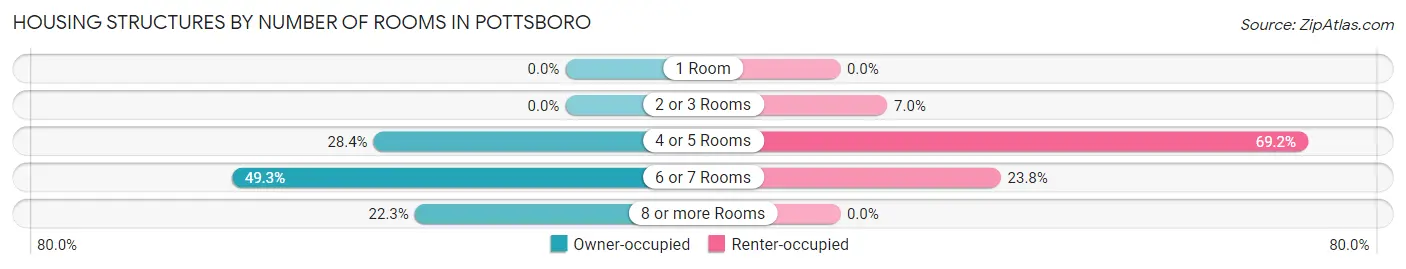
| Number of Rooms | Owner-occupied | Renter-occupied |
| 1 Room | 0 (0.0%) | 0 (0.0%) |
| 2 or 3 Rooms | 0 (0.0%) | 20 (7.0%) |
| 4 or 5 Rooms | 191 (28.4%) | 198 (69.2%) |
| 6 or 7 Rooms | 332 (49.3%) | 68 (23.8%) |
| 8 or more Rooms | 150 (22.3%) | 0 (0.0%) |
| Total | 673 (100.0%) | 286 (100.0%) |
Housing Structure by Heating Type in Pottsboro
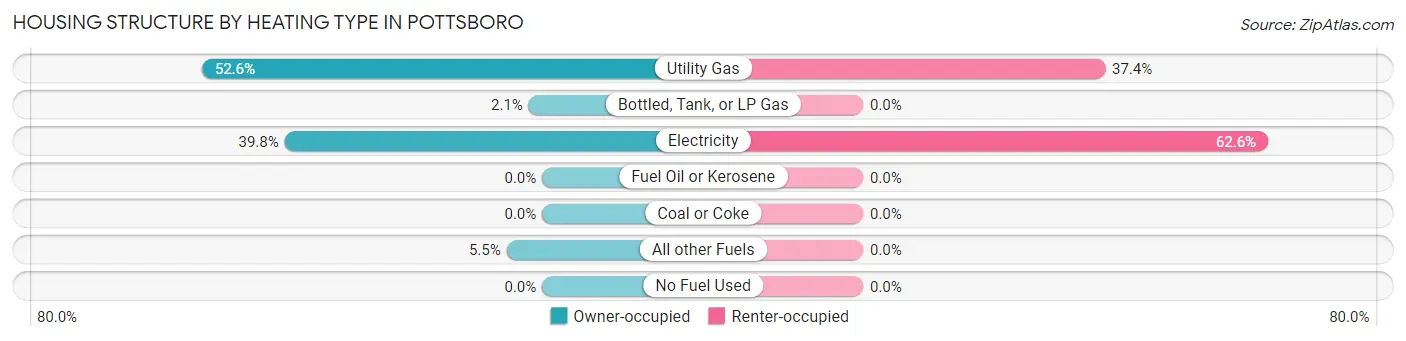
| Heating Type | Owner-occupied | Renter-occupied |
| Utility Gas | 354 (52.6%) | 107 (37.4%) |
| Bottled, Tank, or LP Gas | 14 (2.1%) | 0 (0.0%) |
| Electricity | 268 (39.8%) | 179 (62.6%) |
| Fuel Oil or Kerosene | 0 (0.0%) | 0 (0.0%) |
| Coal or Coke | 0 (0.0%) | 0 (0.0%) |
| All other Fuels | 37 (5.5%) | 0 (0.0%) |
| No Fuel Used | 0 (0.0%) | 0 (0.0%) |
| Total | 673 (100.0%) | 286 (100.0%) |
Household Vehicle Usage in Pottsboro
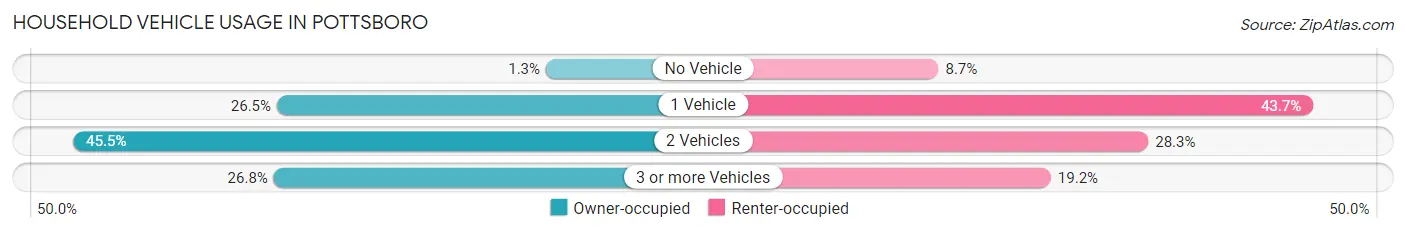
| Vehicles per Household | Owner-occupied | Renter-occupied |
| No Vehicle | 9 (1.3%) | 25 (8.7%) |
| 1 Vehicle | 178 (26.5%) | 125 (43.7%) |
| 2 Vehicles | 306 (45.5%) | 81 (28.3%) |
| 3 or more Vehicles | 180 (26.8%) | 55 (19.2%) |
| Total | 673 (100.0%) | 286 (100.0%) |
Real Estate & Mortgages in Pottsboro
Real Estate and Mortgage Overview in Pottsboro
| Characteristic | Without Mortgage | With Mortgage |
| Housing Units | 301 | 372 |
| Median Property Value | $178,500 | $245,800 |
| Median Household Income | $63,393 | $145 |
| Monthly Housing Costs | $577 | $72 |
| Real Estate Taxes | $2,375 | $0 |
Property Value by Mortgage Status in Pottsboro
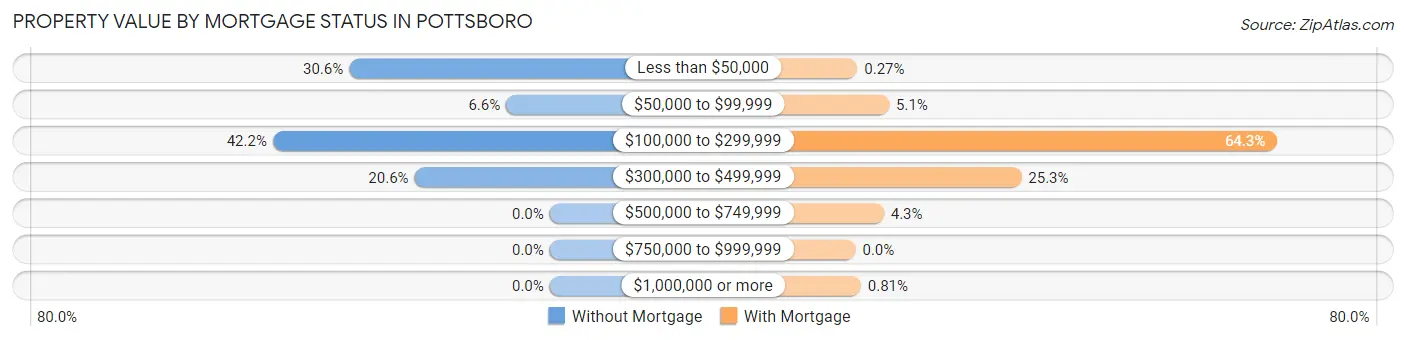
| Property Value | Without Mortgage | With Mortgage |
| Less than $50,000 | 92 (30.6%) | 1 (0.3%) |
| $50,000 to $99,999 | 20 (6.6%) | 19 (5.1%) |
| $100,000 to $299,999 | 127 (42.2%) | 239 (64.2%) |
| $300,000 to $499,999 | 62 (20.6%) | 94 (25.3%) |
| $500,000 to $749,999 | 0 (0.0%) | 16 (4.3%) |
| $750,000 to $999,999 | 0 (0.0%) | 0 (0.0%) |
| $1,000,000 or more | 0 (0.0%) | 3 (0.8%) |
| Total | 301 (100.0%) | 372 (100.0%) |
Household Income by Mortgage Status in Pottsboro
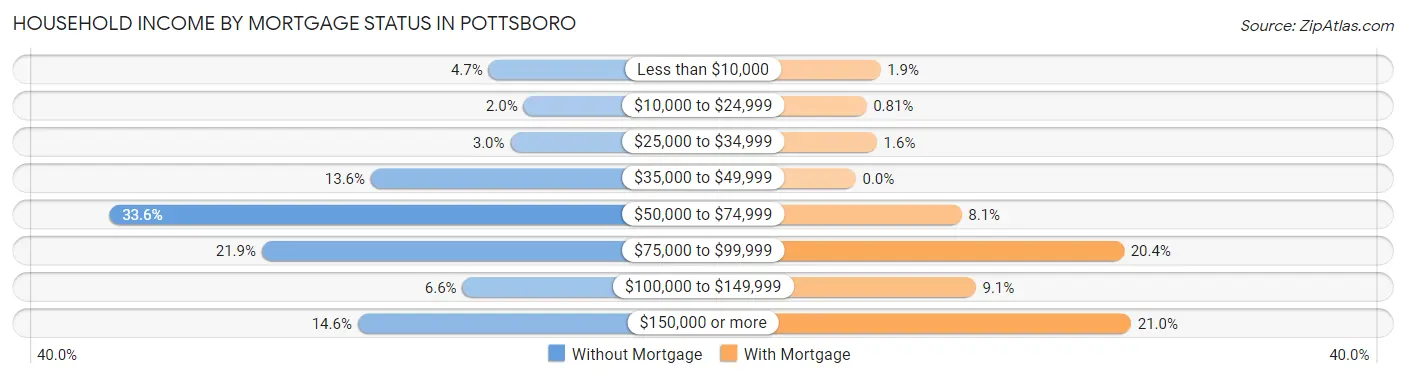
| Household Income | Without Mortgage | With Mortgage |
| Less than $10,000 | 14 (4.6%) | 7 (1.9%) |
| $10,000 to $24,999 | 6 (2.0%) | 3 (0.8%) |
| $25,000 to $34,999 | 9 (3.0%) | 6 (1.6%) |
| $35,000 to $49,999 | 41 (13.6%) | 0 (0.0%) |
| $50,000 to $74,999 | 101 (33.6%) | 30 (8.1%) |
| $75,000 to $99,999 | 66 (21.9%) | 76 (20.4%) |
| $100,000 to $149,999 | 20 (6.6%) | 34 (9.1%) |
| $150,000 or more | 44 (14.6%) | 78 (21.0%) |
| Total | 301 (100.0%) | 372 (100.0%) |
Property Value to Household Income Ratio in Pottsboro
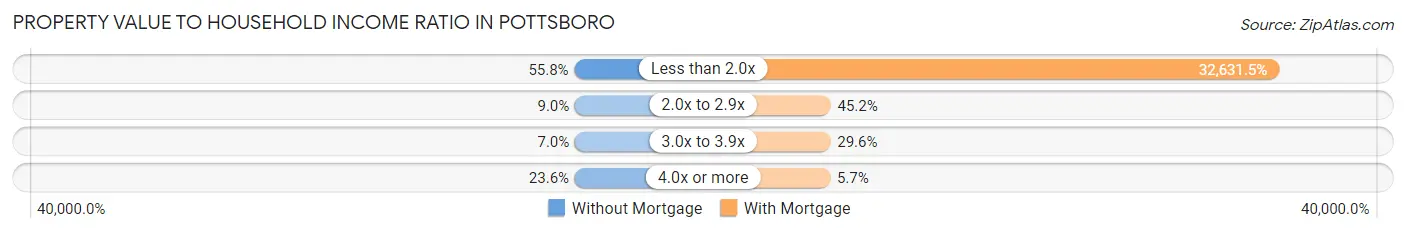
| Value-to-Income Ratio | Without Mortgage | With Mortgage |
| Less than 2.0x | 168 (55.8%) | 121,389 (32,631.5%) |
| 2.0x to 2.9x | 27 (9.0%) | 168 (45.2%) |
| 3.0x to 3.9x | 21 (7.0%) | 110 (29.6%) |
| 4.0x or more | 71 (23.6%) | 21 (5.7%) |
| Total | 301 (100.0%) | 372 (100.0%) |
Real Estate Taxes by Mortgage Status in Pottsboro
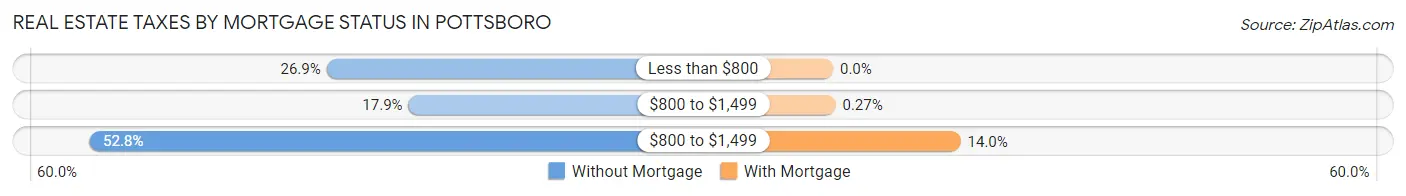
| Property Taxes | Without Mortgage | With Mortgage |
| Less than $800 | 81 (26.9%) | 0 (0.0%) |
| $800 to $1,499 | 54 (17.9%) | 1 (0.3%) |
| $800 to $1,499 | 159 (52.8%) | 52 (14.0%) |
| Total | 301 (100.0%) | 372 (100.0%) |
Health & Disability in Pottsboro
Health Insurance Coverage by Age in Pottsboro
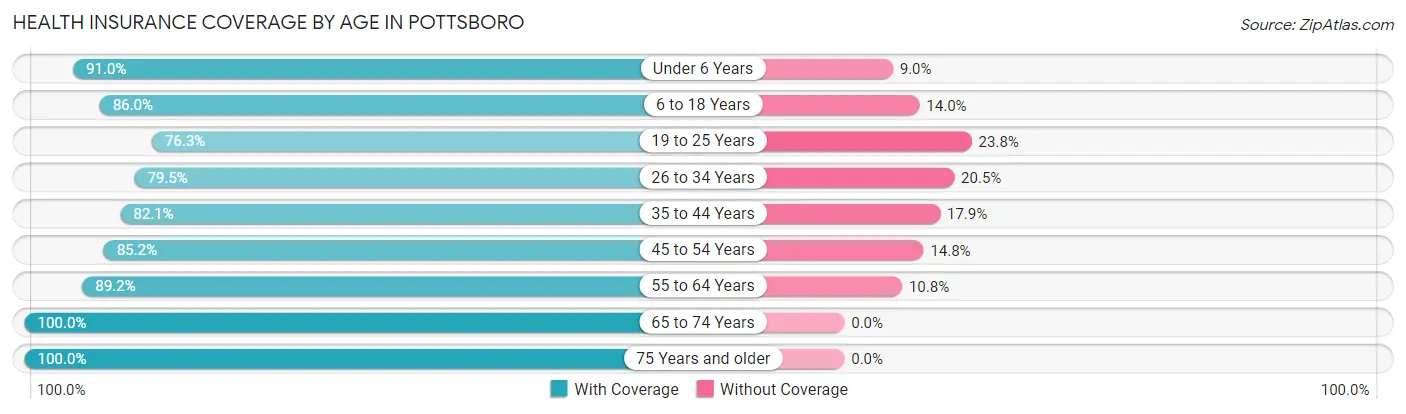
| Age Bracket | With Coverage | Without Coverage |
| Under 6 Years | 171 (91.0%) | 17 (9.0%) |
| 6 to 18 Years | 405 (86.0%) | 66 (14.0%) |
| 19 to 25 Years | 122 (76.2%) | 38 (23.7%) |
| 26 to 34 Years | 225 (79.5%) | 58 (20.5%) |
| 35 to 44 Years | 230 (82.1%) | 50 (17.9%) |
| 45 to 54 Years | 306 (85.2%) | 53 (14.8%) |
| 55 to 64 Years | 307 (89.2%) | 37 (10.8%) |
| 65 to 74 Years | 297 (100.0%) | 0 (0.0%) |
| 75 Years and older | 154 (100.0%) | 0 (0.0%) |
| Total | 2,217 (87.4%) | 319 (12.6%) |
Health Insurance Coverage by Citizenship Status in Pottsboro
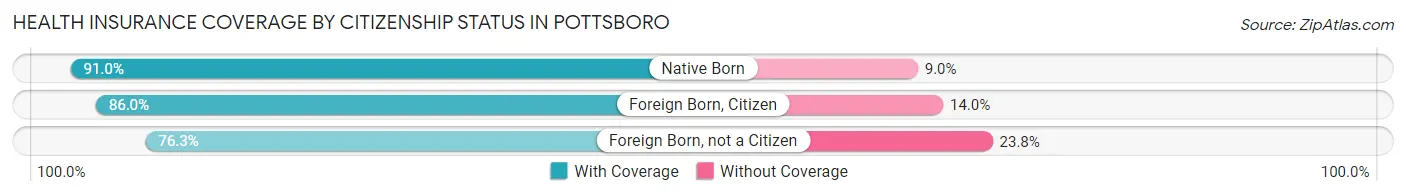
| Citizenship Status | With Coverage | Without Coverage |
| Native Born | 171 (91.0%) | 17 (9.0%) |
| Foreign Born, Citizen | 405 (86.0%) | 66 (14.0%) |
| Foreign Born, not a Citizen | 122 (76.2%) | 38 (23.7%) |
Health Insurance Coverage by Household Income in Pottsboro
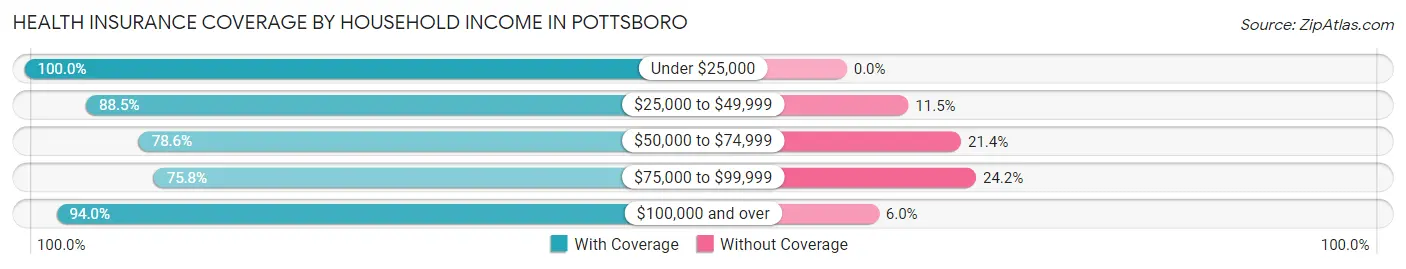
| Household Income | With Coverage | Without Coverage |
| Under $25,000 | 103 (100.0%) | 0 (0.0%) |
| $25,000 to $49,999 | 207 (88.5%) | 27 (11.5%) |
| $50,000 to $74,999 | 437 (78.6%) | 119 (21.4%) |
| $75,000 to $99,999 | 310 (75.8%) | 99 (24.2%) |
| $100,000 and over | 1,160 (94.0%) | 74 (6.0%) |
Public vs Private Health Insurance Coverage by Age in Pottsboro
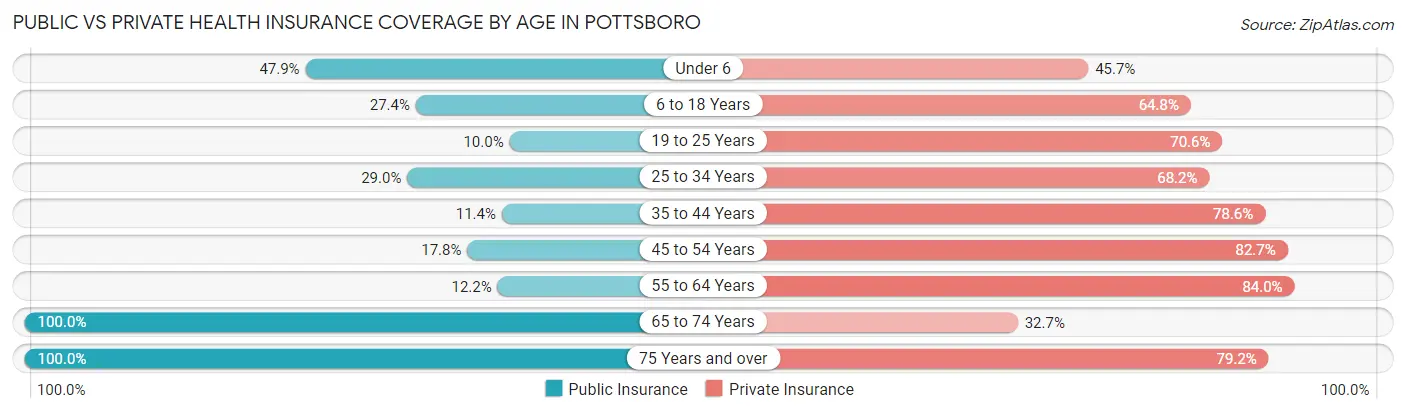
| Age Bracket | Public Insurance | Private Insurance |
| Under 6 | 90 (47.9%) | 86 (45.7%) |
| 6 to 18 Years | 129 (27.4%) | 305 (64.8%) |
| 19 to 25 Years | 16 (10.0%) | 113 (70.6%) |
| 25 to 34 Years | 82 (29.0%) | 193 (68.2%) |
| 35 to 44 Years | 32 (11.4%) | 220 (78.6%) |
| 45 to 54 Years | 64 (17.8%) | 297 (82.7%) |
| 55 to 64 Years | 42 (12.2%) | 289 (84.0%) |
| 65 to 74 Years | 297 (100.0%) | 97 (32.7%) |
| 75 Years and over | 154 (100.0%) | 122 (79.2%) |
| Total | 906 (35.7%) | 1,722 (67.9%) |
Disability Status by Sex by Age in Pottsboro
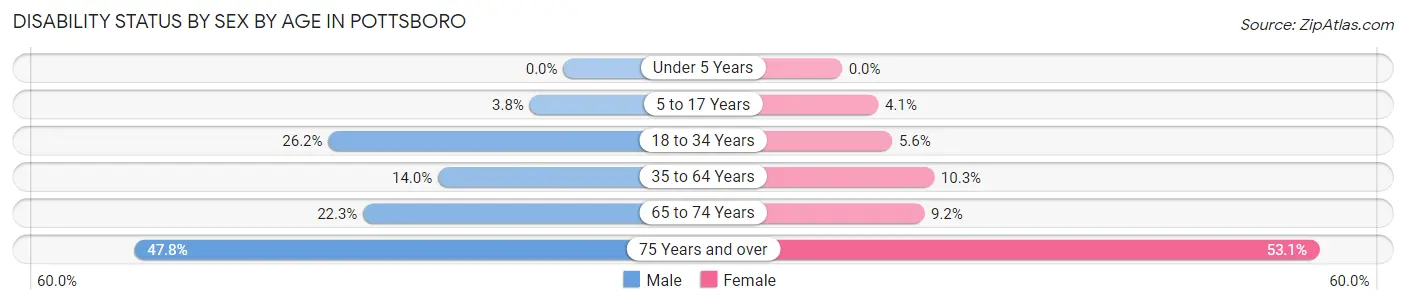
| Age Bracket | Male | Female |
| Under 5 Years | 0 (0.0%) | 0 (0.0%) |
| 5 to 17 Years | 10 (3.7%) | 9 (4.1%) |
| 18 to 34 Years | 84 (26.2%) | 8 (5.6%) |
| 35 to 64 Years | 61 (14.0%) | 56 (10.3%) |
| 65 to 74 Years | 37 (22.3%) | 12 (9.2%) |
| 75 Years and over | 43 (47.8%) | 34 (53.1%) |
Disability Class by Sex by Age in Pottsboro
Disability Class: Hearing Difficulty
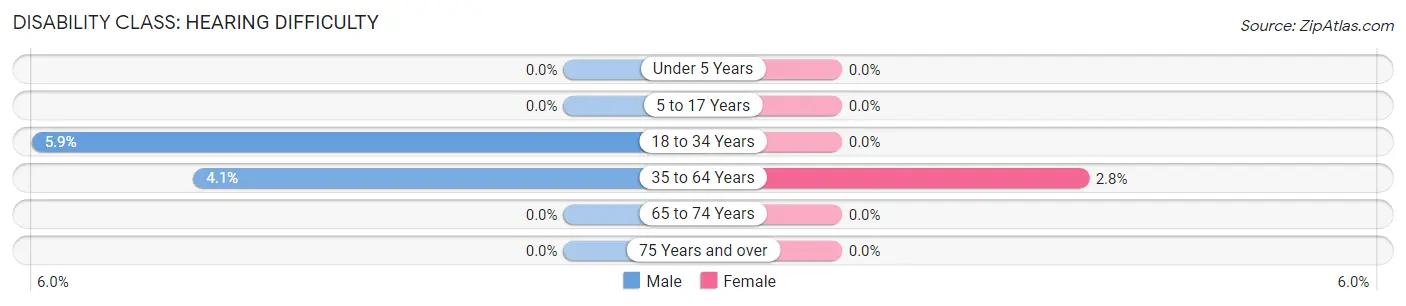
| Age Bracket | Male | Female |
| Under 5 Years | 0 (0.0%) | 0 (0.0%) |
| 5 to 17 Years | 0 (0.0%) | 0 (0.0%) |
| 18 to 34 Years | 19 (5.9%) | 0 (0.0%) |
| 35 to 64 Years | 18 (4.1%) | 15 (2.8%) |
| 65 to 74 Years | 0 (0.0%) | 0 (0.0%) |
| 75 Years and over | 0 (0.0%) | 0 (0.0%) |
Disability Class: Vision Difficulty
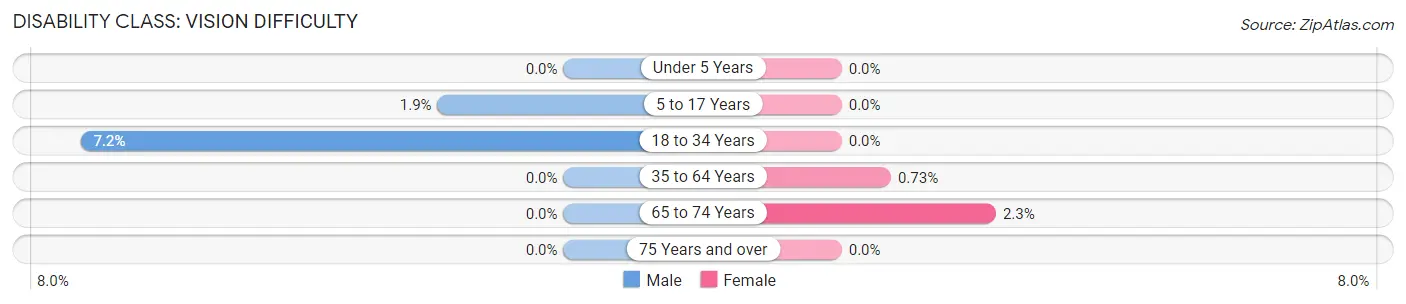
| Age Bracket | Male | Female |
| Under 5 Years | 0 (0.0%) | 0 (0.0%) |
| 5 to 17 Years | 5 (1.9%) | 0 (0.0%) |
| 18 to 34 Years | 23 (7.2%) | 0 (0.0%) |
| 35 to 64 Years | 0 (0.0%) | 4 (0.7%) |
| 65 to 74 Years | 0 (0.0%) | 3 (2.3%) |
| 75 Years and over | 0 (0.0%) | 0 (0.0%) |
Disability Class: Cognitive Difficulty
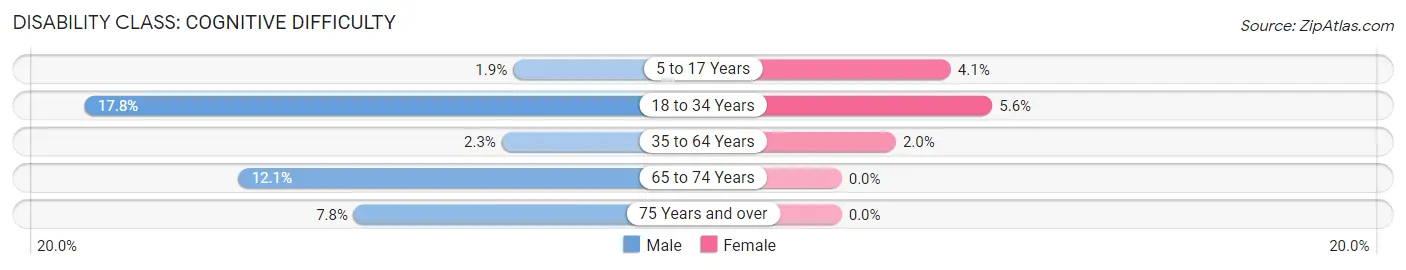
| Age Bracket | Male | Female |
| 5 to 17 Years | 5 (1.9%) | 9 (4.1%) |
| 18 to 34 Years | 57 (17.8%) | 8 (5.6%) |
| 35 to 64 Years | 10 (2.3%) | 11 (2.0%) |
| 65 to 74 Years | 20 (12.0%) | 0 (0.0%) |
| 75 Years and over | 7 (7.8%) | 0 (0.0%) |
Disability Class: Ambulatory Difficulty
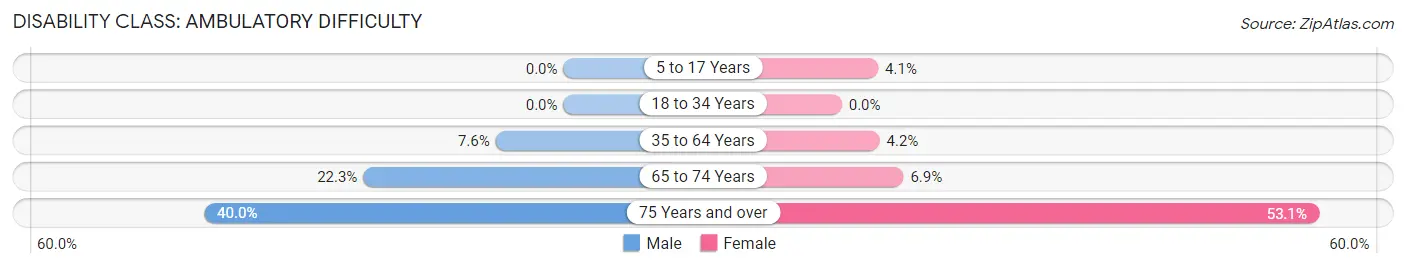
| Age Bracket | Male | Female |
| 5 to 17 Years | 0 (0.0%) | 9 (4.1%) |
| 18 to 34 Years | 0 (0.0%) | 0 (0.0%) |
| 35 to 64 Years | 33 (7.5%) | 23 (4.2%) |
| 65 to 74 Years | 37 (22.3%) | 9 (6.9%) |
| 75 Years and over | 36 (40.0%) | 34 (53.1%) |
Disability Class: Self-Care Difficulty
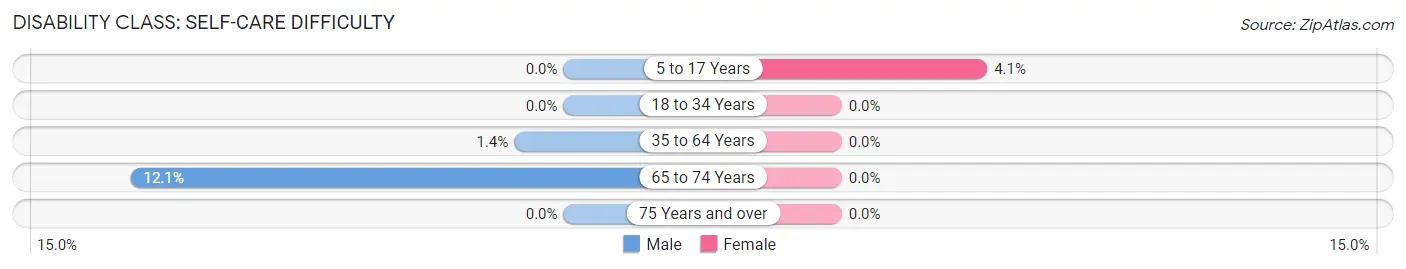
| Age Bracket | Male | Female |
| 5 to 17 Years | 0 (0.0%) | 9 (4.1%) |
| 18 to 34 Years | 0 (0.0%) | 0 (0.0%) |
| 35 to 64 Years | 6 (1.4%) | 0 (0.0%) |
| 65 to 74 Years | 20 (12.0%) | 0 (0.0%) |
| 75 Years and over | 0 (0.0%) | 0 (0.0%) |
Technology Access in Pottsboro
Computing Device Access in Pottsboro
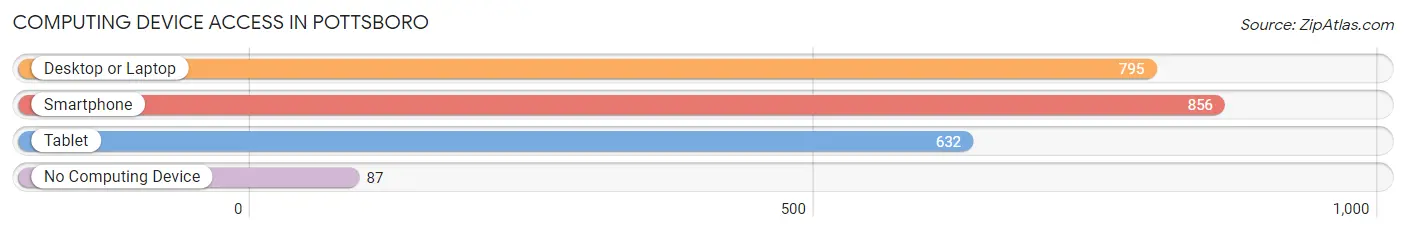
| Device Type | # Households | % Households |
| Desktop or Laptop | 795 | 82.9% |
| Smartphone | 856 | 89.3% |
| Tablet | 632 | 65.9% |
| No Computing Device | 87 | 9.1% |
| Total | 959 | 100.0% |
Internet Access in Pottsboro
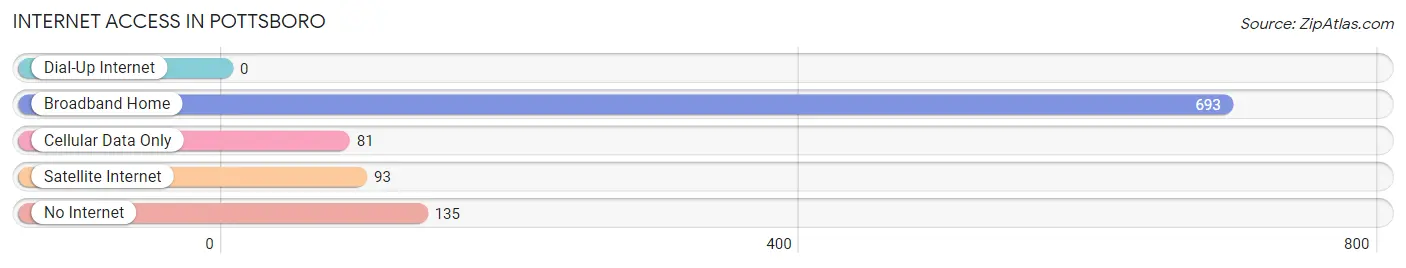
| Internet Type | # Households | % Households |
| Dial-Up Internet | 0 | 0.0% |
| Broadband Home | 693 | 72.3% |
| Cellular Data Only | 81 | 8.5% |
| Satellite Internet | 93 | 9.7% |
| No Internet | 135 | 14.1% |
| Total | 959 | 100.0% |
Pottsboro Summary
Pottsboro is a small town located in Grayson County, Texas, United States. It is situated on the western shore of Lake Texoma, about 15 miles north of Sherman and about 75 miles north of Dallas. The population of Pottsboro was 2,160 at the 2010 census.
History
The area that is now Pottsboro was first settled in the 1840s by the Potts family, who were among the first settlers in Grayson County. The town was originally known as Pottsboro, named after the Potts family. The town was officially incorporated in 1891.
In the early 1900s, Pottsboro was a thriving agricultural community, with cotton, corn, and wheat being the main crops. The town also had a number of businesses, including a bank, a hotel, a general store, and a blacksmith shop.
In the 1920s, the town began to experience a period of growth and prosperity. The town was connected to the outside world by the Texas and Pacific Railway, and the population grew to over 500 people.
In the 1940s, the town experienced a period of decline as the railroad ceased operations and the population began to decline. However, the town was revitalized in the 1950s when Lake Texoma was created. The lake brought new life to the town, and the population began to grow again.
Geography
Pottsboro is located at 33°45'25" North, 96°37'17" West (33.756944, -96.621389). The town is situated on the western shore of Lake Texoma, about 15 miles north of Sherman and about 75 miles north of Dallas.
The town has a total area of 2.2 square miles, all of which is land. The terrain is mostly flat, with some rolling hills.
Economy
The economy of Pottsboro is largely based on tourism and recreation. The town is a popular destination for fishing, boating, and other outdoor activities. The town also has a number of restaurants, shops, and other businesses catering to tourists.
The town is also home to a number of manufacturing and industrial businesses, including a plastics plant, a metal fabrication plant, and a printing company.
Demographics
As of the 2010 census, there were 2,160 people, 845 households, and 590 families residing in the town. The population density was 976.4 people per square mile. The racial makeup of the town was 94.2% White, 0.7% African American, 0.7% Native American, 0.5% Asian, 0.1% Pacific Islander, 2.2% from other races, and 1.7% from two or more races. Hispanic or Latino of any race were 5.2% of the population.
The median income for a household in the town was $41,250, and the median income for a family was $50,000. The per capita income for the town was $20,945. About 11.2% of families and 14.2% of the population were below the poverty line, including 19.2% of those under age 18 and 8.2% of those age 65 or over.
Common Questions
What is Per Capita Income in Pottsboro?
Per Capita income in Pottsboro is $36,586.
What is the Median Family Income in Pottsboro?
Median Family Income in Pottsboro is $99,605.
What is the Median Household income in Pottsboro?
Median Household Income in Pottsboro is $75,938.
What is Income or Wage Gap in Pottsboro?
Income or Wage Gap in Pottsboro is 34.2%.
Women in Pottsboro earn 65.8 cents for every dollar earned by a man.
What is Inequality or Gini Index in Pottsboro?
Inequality or Gini Index in Pottsboro is 0.35.
What is the Total Population of Pottsboro?
Total Population of Pottsboro is 2,536.
What is the Total Male Population of Pottsboro?
Total Male Population of Pottsboro is 1,363.
What is the Total Female Population of Pottsboro?
Total Female Population of Pottsboro is 1,173.
What is the Ratio of Males per 100 Females in Pottsboro?
There are 116.20 Males per 100 Females in Pottsboro.
What is the Ratio of Females per 100 Males in Pottsboro?
There are 86.06 Females per 100 Males in Pottsboro.
What is the Median Population Age in Pottsboro?
Median Population Age in Pottsboro is 40.0 Years.
What is the Average Family Size in Pottsboro
Average Family Size in Pottsboro is 3.3 People.
What is the Average Household Size in Pottsboro
Average Household Size in Pottsboro is 2.6 People.
How Large is the Labor Force in Pottsboro?
There are 1,350 People in the Labor Forcein in Pottsboro.
What is the Percentage of People in the Labor Force in Pottsboro?
68.1% of People are in the Labor Force in Pottsboro.
What is the Unemployment Rate in Pottsboro?
Unemployment Rate in Pottsboro is 4.8%.