Penelope, TX Map & Demographics
Penelope Map
Penelope Overview
$29,117
PER CAPITA INCOME
$101,250
AVG FAMILY INCOME
$55,000
AVG HOUSEHOLD INCOME
9.0%
WAGE / INCOME GAP [ % ]
91.0¢/ $1
WAGE / INCOME GAP [ $ ]
0.43
INEQUALITY / GINI INDEX
234
TOTAL POPULATION
98
MALE POPULATION
136
FEMALE POPULATION
72.06
MALES / 100 FEMALES
138.78
FEMALES / 100 MALES
41.5
MEDIAN AGE
3.4
AVG FAMILY SIZE
2.5
AVG HOUSEHOLD SIZE
104
LABOR FORCE [ PEOPLE ]
61.2%
PERCENT IN LABOR FORCE
2.9%
UNEMPLOYMENT RATE
Penelope Zip Codes
Penelope Area Codes
Income in Penelope
Income Overview in Penelope
Per Capita Income in Penelope is $29,117, while median incomes of families and households are $101,250 and $55,000 respectively.
| Characteristic | Number | Measure |
| Per Capita Income | 234 | $29,117 |
| Median Family Income | 58 | $101,250 |
| Mean Family Income | 58 | $103,110 |
| Median Household Income | 92 | $55,000 |
| Mean Household Income | 92 | $76,037 |
| Income Deficit | 58 | $0 |
| Wage / Income Gap (%) | 234 | 9.04% |
| Wage / Income Gap ($) | 234 | 90.96¢ per $1 |
| Gini / Inequality Index | 234 | 0.43 |
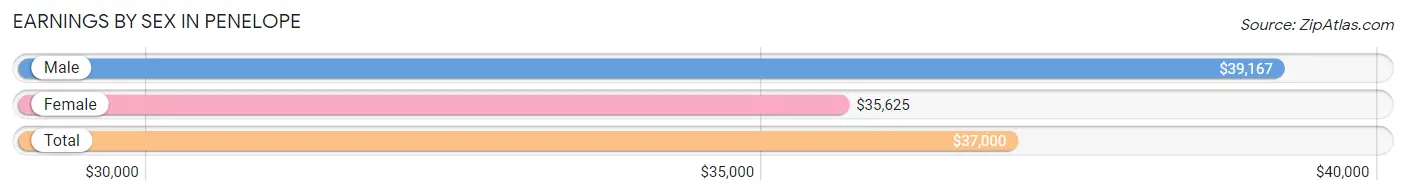
Earnings by Sex in Penelope
Average Earnings in Penelope are $37,000, $39,167 for men and $35,625 for women, a difference of 9.0%.
| Sex | Number | Average Earnings |
| Male | 56 (54.9%) | $39,167 |
| Female | 46 (45.1%) | $35,625 |
| Total | 102 (100.0%) | $37,000 |
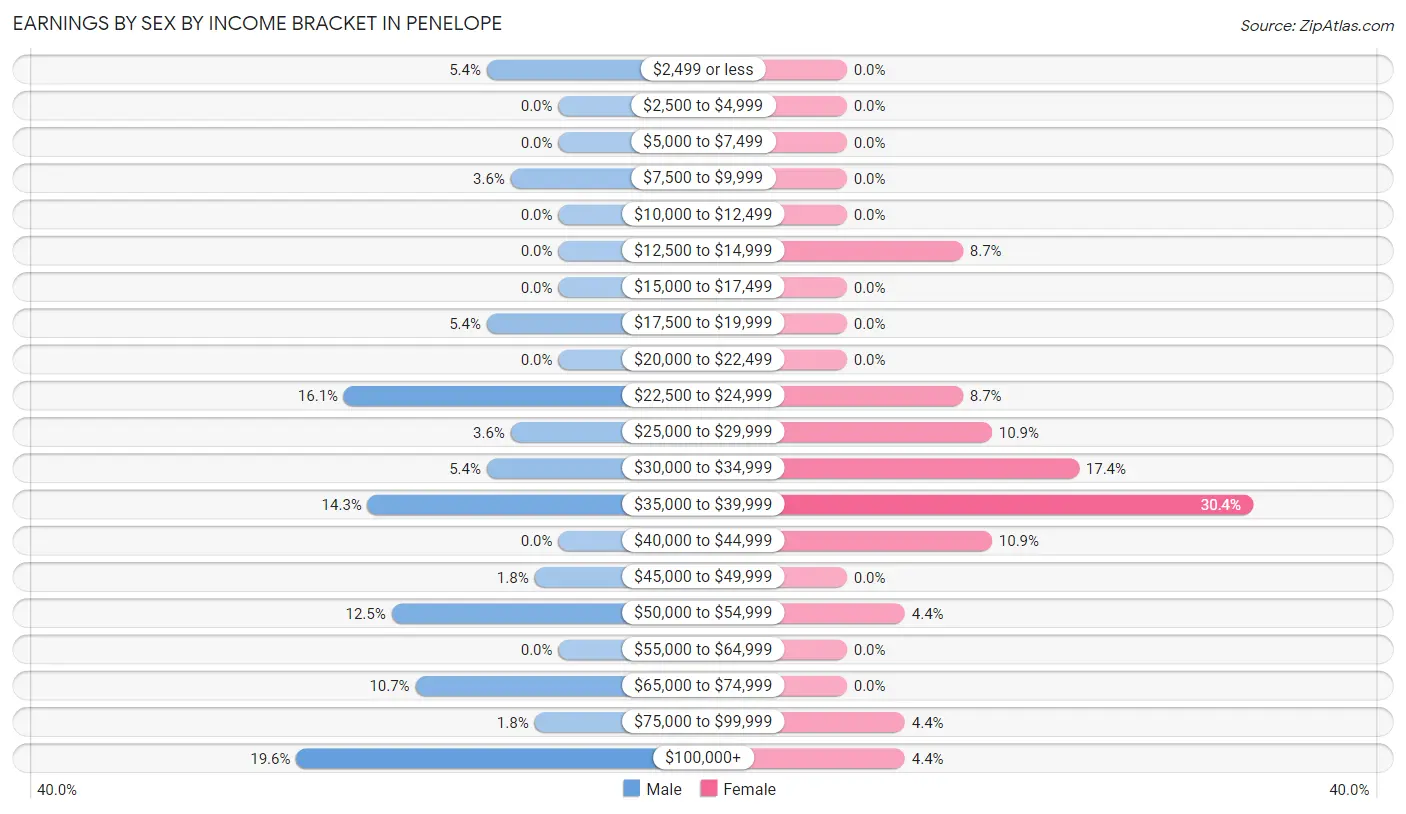
Earnings by Sex by Income Bracket in Penelope
The most common earnings brackets in Penelope are $100,000+ for men (11 | 19.6%) and $35,000 to $39,999 for women (14 | 30.4%).
| Income | Male | Female |
| $2,499 or less | 3 (5.4%) | 0 (0.0%) |
| $2,500 to $4,999 | 0 (0.0%) | 0 (0.0%) |
| $5,000 to $7,499 | 0 (0.0%) | 0 (0.0%) |
| $7,500 to $9,999 | 2 (3.6%) | 0 (0.0%) |
| $10,000 to $12,499 | 0 (0.0%) | 0 (0.0%) |
| $12,500 to $14,999 | 0 (0.0%) | 4 (8.7%) |
| $15,000 to $17,499 | 0 (0.0%) | 0 (0.0%) |
| $17,500 to $19,999 | 3 (5.4%) | 0 (0.0%) |
| $20,000 to $22,499 | 0 (0.0%) | 0 (0.0%) |
| $22,500 to $24,999 | 9 (16.1%) | 4 (8.7%) |
| $25,000 to $29,999 | 2 (3.6%) | 5 (10.9%) |
| $30,000 to $34,999 | 3 (5.4%) | 8 (17.4%) |
| $35,000 to $39,999 | 8 (14.3%) | 14 (30.4%) |
| $40,000 to $44,999 | 0 (0.0%) | 5 (10.9%) |
| $45,000 to $49,999 | 1 (1.8%) | 0 (0.0%) |
| $50,000 to $54,999 | 7 (12.5%) | 2 (4.3%) |
| $55,000 to $64,999 | 0 (0.0%) | 0 (0.0%) |
| $65,000 to $74,999 | 6 (10.7%) | 0 (0.0%) |
| $75,000 to $99,999 | 1 (1.8%) | 2 (4.3%) |
| $100,000+ | 11 (19.6%) | 2 (4.3%) |
| Total | 56 (100.0%) | 46 (100.0%) |
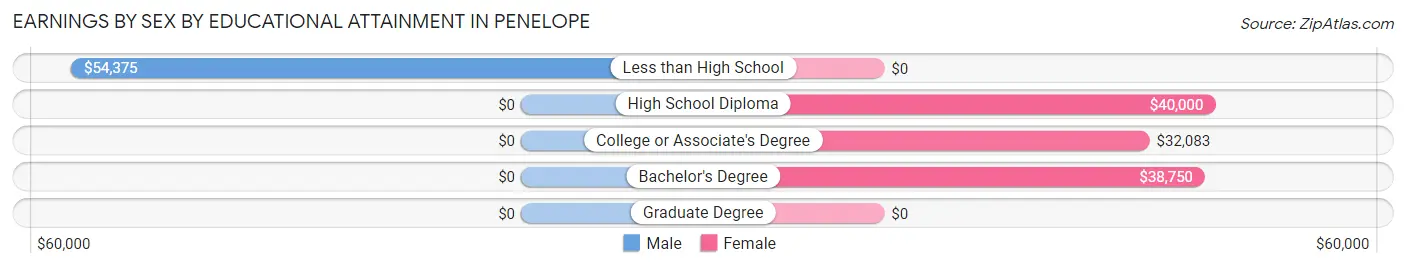
Earnings by Sex by Educational Attainment in Penelope
Average earnings in Penelope are $46,250 for men and $35,625 for women, a difference of 23.0%. Men with an educational attainment of less than high school enjoy the highest average annual earnings of $54,375, while those with less than high school education earn the least with $54,375. Women with an educational attainment of high school diploma earn the most with the average annual earnings of $40,000, while those with college or associate's degree education have the smallest earnings of $32,083.
| Educational Attainment | Male Income | Female Income |
| Less than High School | $54,375 | $0 |
| High School Diploma | - | - |
| College or Associate's Degree | - | - |
| Bachelor's Degree | - | - |
| Graduate Degree | - | - |
| Total | $46,250 | $35,625 |
Family Income in Penelope
Family Income Brackets in Penelope
According to the Penelope family income data, there are 19 families falling into the $100,000 to $149,999 income range, which is the most common income bracket and makes up 32.8% of all families.
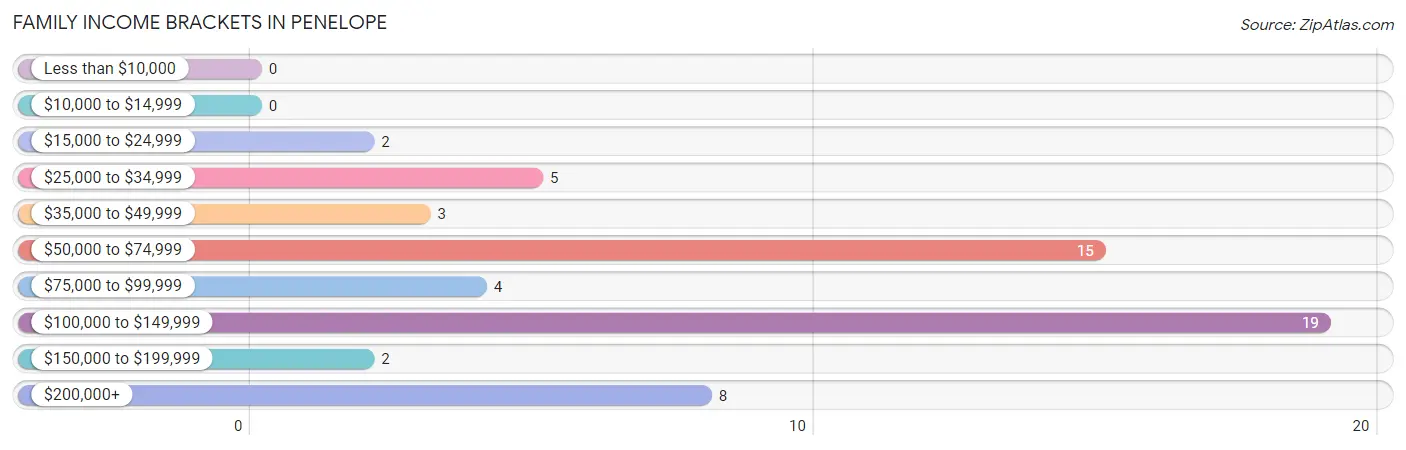
| Income Bracket | # Families | % Families |
| Less than $10,000 | 0 | 0.0% |
| $10,000 to $14,999 | 0 | 0.0% |
| $15,000 to $24,999 | 2 | 3.4% |
| $25,000 to $34,999 | 5 | 8.6% |
| $35,000 to $49,999 | 3 | 5.2% |
| $50,000 to $74,999 | 15 | 25.9% |
| $75,000 to $99,999 | 4 | 6.9% |
| $100,000 to $149,999 | 19 | 32.8% |
| $150,000 to $199,999 | 2 | 3.4% |
| $200,000+ | 8 | 13.8% |
Family Income by Famaliy Size in Penelope
2-person families (17 | 29.3%) account for the highest median family income in Penelope with $88,125 per family, while 2-person families (17 | 29.3%) have the highest median income of $44,062 per family member.
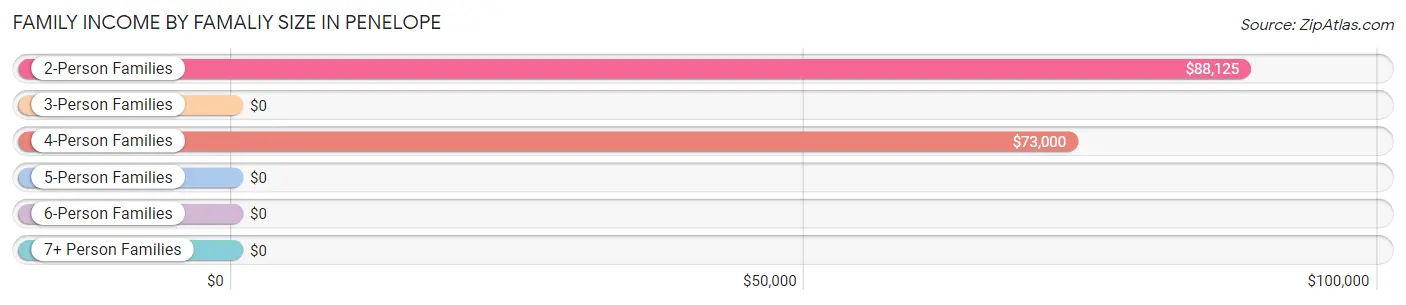
| Income Bracket | # Families | Median Income |
| 2-Person Families | 17 (29.3%) | $88,125 |
| 3-Person Families | 10 (17.2%) | $0 |
| 4-Person Families | 22 (37.9%) | $73,000 |
| 5-Person Families | 4 (6.9%) | $0 |
| 6-Person Families | 3 (5.2%) | $0 |
| 7+ Person Families | 2 (3.5%) | $0 |
| Total | 58 (100.0%) | $101,250 |
Family Income by Number of Earners in Penelope
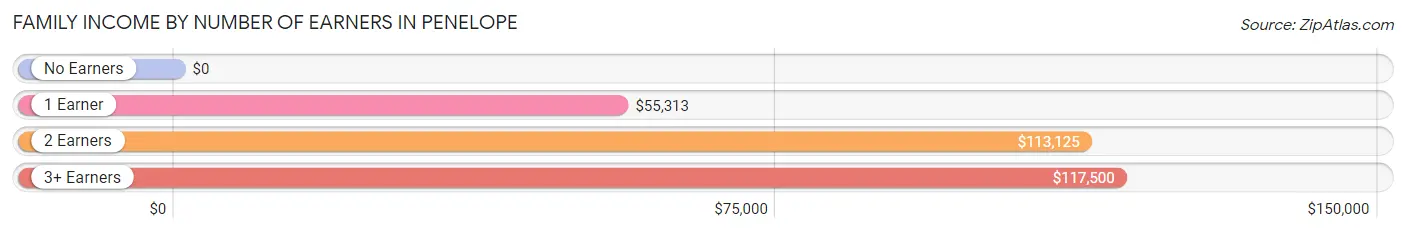
| Number of Earners | # Families | Median Income |
| No Earners | 8 (13.8%) | $0 |
| 1 Earner | 21 (36.2%) | $55,313 |
| 2 Earners | 21 (36.2%) | $113,125 |
| 3+ Earners | 8 (13.8%) | $117,500 |
| Total | 58 (100.0%) | $101,250 |
Household Income in Penelope
Household Income Brackets in Penelope
With 19 households falling in the category, the $100,000 to $149,999 income range is the most frequent in Penelope, accounting for 20.6% of all households. In contrast, only 2 households (2.2%) fall into the less than $10,000 income bracket, making it the least populous group.
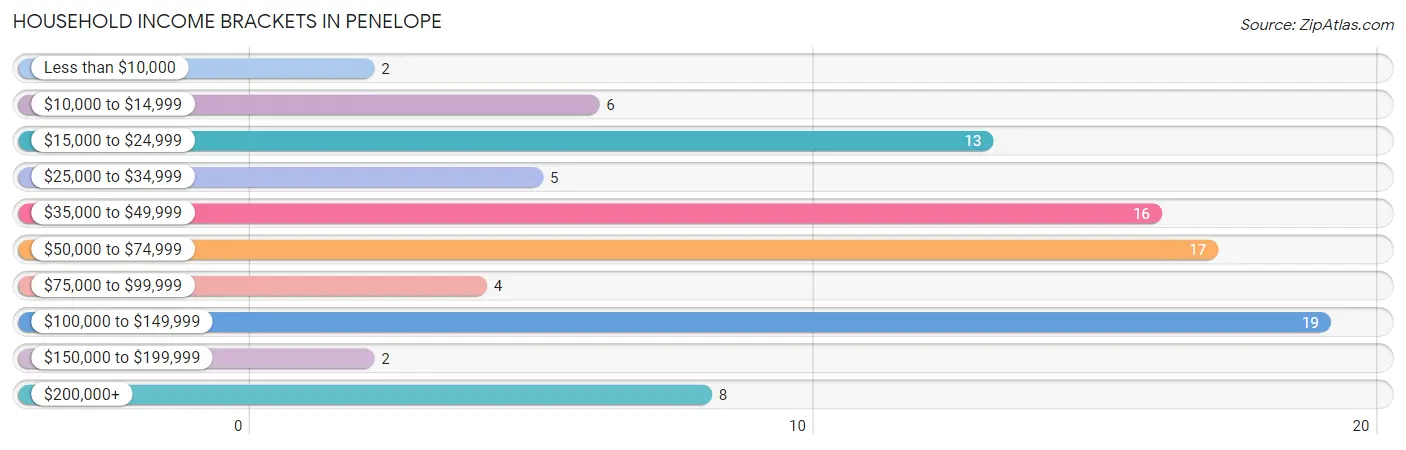
| Income Bracket | # Households | % Households |
| Less than $10,000 | 2 | 2.2% |
| $10,000 to $14,999 | 6 | 6.5% |
| $15,000 to $24,999 | 13 | 14.1% |
| $25,000 to $34,999 | 5 | 5.4% |
| $35,000 to $49,999 | 16 | 17.4% |
| $50,000 to $74,999 | 17 | 18.5% |
| $75,000 to $99,999 | 4 | 4.3% |
| $100,000 to $149,999 | 19 | 20.7% |
| $150,000 to $199,999 | 2 | 2.2% |
| $200,000+ | 8 | 8.7% |
Household Income by Householder Age in Penelope
The median household income in Penelope is $55,000, with the highest median household income of $113,889 found in the 25 to 44 years age bracket for the primary householder. A total of 30 households (32.6%) fall into this category.
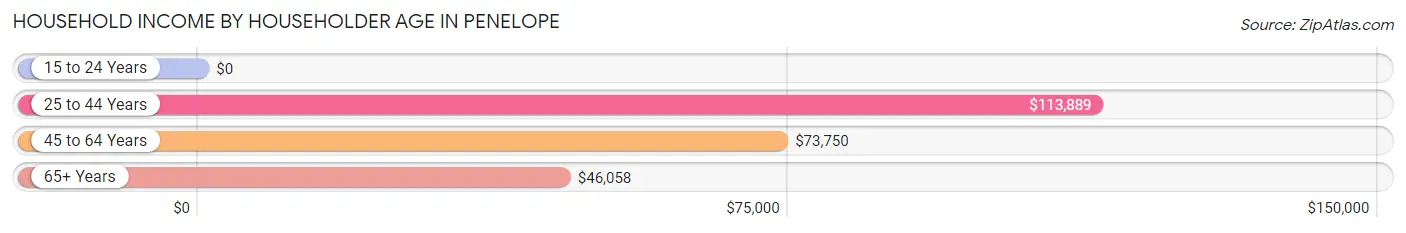
| Income Bracket | # Households | Median Income |
| 15 to 24 Years | 0 (0.0%) | $0 |
| 25 to 44 Years | 30 (32.6%) | $113,889 |
| 45 to 64 Years | 19 (20.6%) | $73,750 |
| 65+ Years | 43 (46.7%) | $46,058 |
| Total | 92 (100.0%) | $55,000 |
Poverty in Penelope
Income Below Poverty by Sex and Age in Penelope
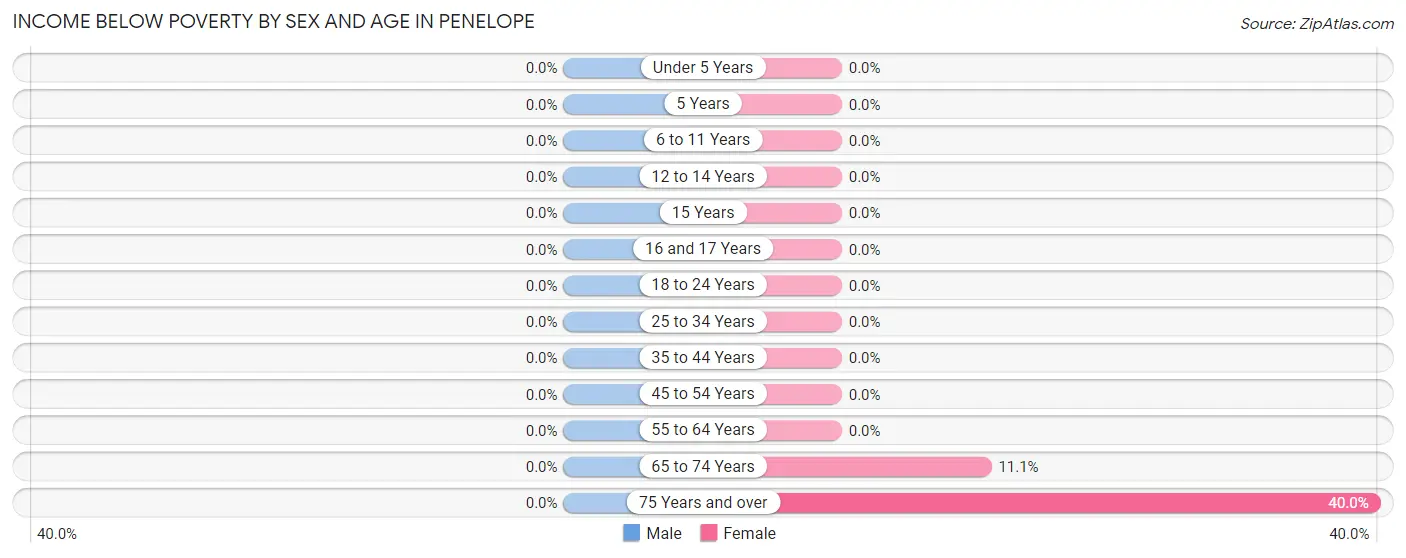
| Age Bracket | Male | Female |
| Under 5 Years | 0 (0.0%) | 0 (0.0%) |
| 5 Years | 0 (0.0%) | 0 (0.0%) |
| 6 to 11 Years | 0 (0.0%) | 0 (0.0%) |
| 12 to 14 Years | 0 (0.0%) | 0 (0.0%) |
| 15 Years | 0 (0.0%) | 0 (0.0%) |
| 16 and 17 Years | 0 (0.0%) | 0 (0.0%) |
| 18 to 24 Years | 0 (0.0%) | 0 (0.0%) |
| 25 to 34 Years | 0 (0.0%) | 0 (0.0%) |
| 35 to 44 Years | 0 (0.0%) | 0 (0.0%) |
| 45 to 54 Years | 0 (0.0%) | 0 (0.0%) |
| 55 to 64 Years | 0 (0.0%) | 0 (0.0%) |
| 65 to 74 Years | 0 (0.0%) | 1 (11.1%) |
| 75 Years and over | 0 (0.0%) | 10 (40.0%) |
| Total | 0 (0.0%) | 11 (8.1%) |
Income Above Poverty by Sex and Age in Penelope
According to the poverty statistics in Penelope, males aged 6 to 11 years and females aged under 5 years are the age groups that are most secure financially, with 100.0% of males and 100.0% of females in these age groups living above the poverty line.
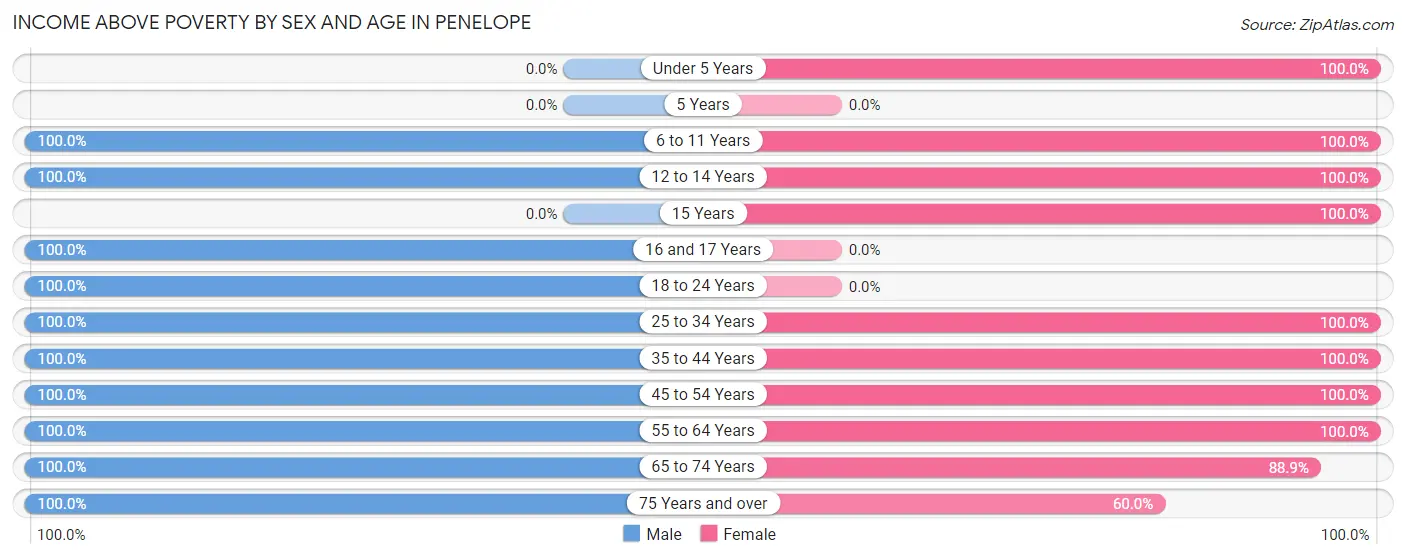
| Age Bracket | Male | Female |
| Under 5 Years | 0 (0.0%) | 26 (100.0%) |
| 5 Years | 0 (0.0%) | 0 (0.0%) |
| 6 to 11 Years | 16 (100.0%) | 11 (100.0%) |
| 12 to 14 Years | 3 (100.0%) | 4 (100.0%) |
| 15 Years | 0 (0.0%) | 4 (100.0%) |
| 16 and 17 Years | 4 (100.0%) | 0 (0.0%) |
| 18 to 24 Years | 6 (100.0%) | 0 (0.0%) |
| 25 to 34 Years | 14 (100.0%) | 11 (100.0%) |
| 35 to 44 Years | 17 (100.0%) | 16 (100.0%) |
| 45 to 54 Years | 6 (100.0%) | 11 (100.0%) |
| 55 to 64 Years | 13 (100.0%) | 19 (100.0%) |
| 65 to 74 Years | 14 (100.0%) | 8 (88.9%) |
| 75 Years and over | 5 (100.0%) | 15 (60.0%) |
| Total | 98 (100.0%) | 125 (91.9%) |
Income Below Poverty Among Married-Couple Families in Penelope
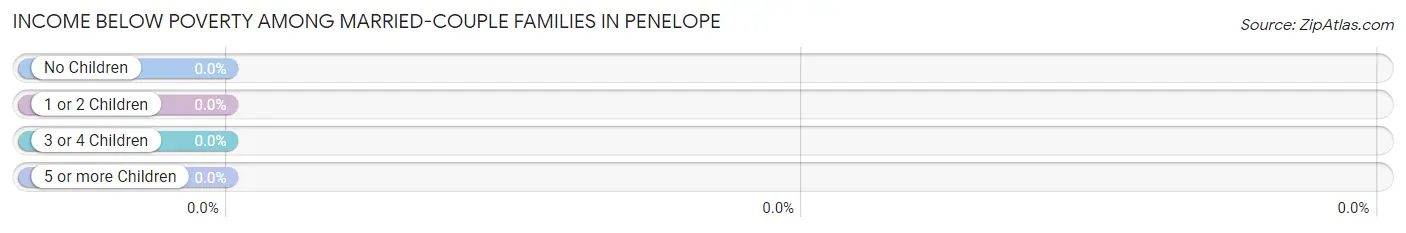
| Children | Above Poverty | Below Poverty |
| No Children | 18 (100.0%) | 0 (0.0%) |
| 1 or 2 Children | 29 (100.0%) | 0 (0.0%) |
| 3 or 4 Children | 2 (100.0%) | 0 (0.0%) |
| 5 or more Children | 0 (0.0%) | 0 (0.0%) |
| Total | 49 (100.0%) | 0 (0.0%) |
Income Below Poverty Among Single-Parent Households in Penelope
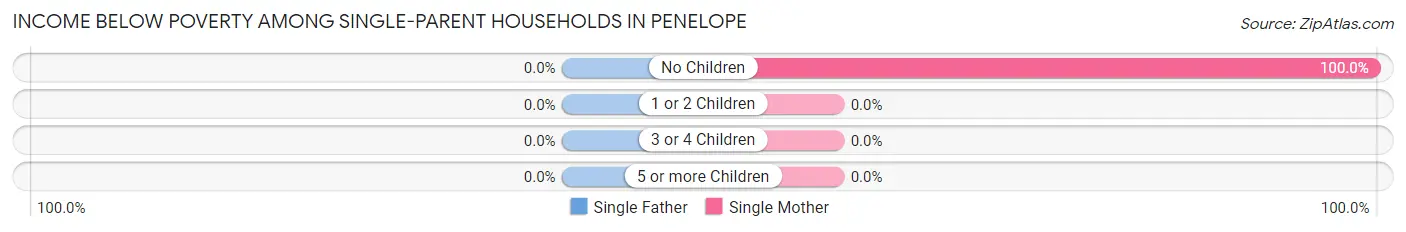
| Children | Single Father | Single Mother |
| No Children | 0 (0.0%) | 2 (100.0%) |
| 1 or 2 Children | 0 (0.0%) | 0 (0.0%) |
| 3 or 4 Children | 0 (0.0%) | 0 (0.0%) |
| 5 or more Children | 0 (0.0%) | 0 (0.0%) |
| Total | 0 (0.0%) | 2 (25.0%) |
Income Below Poverty Among Married-Couple vs Single-Parent Households in Penelope
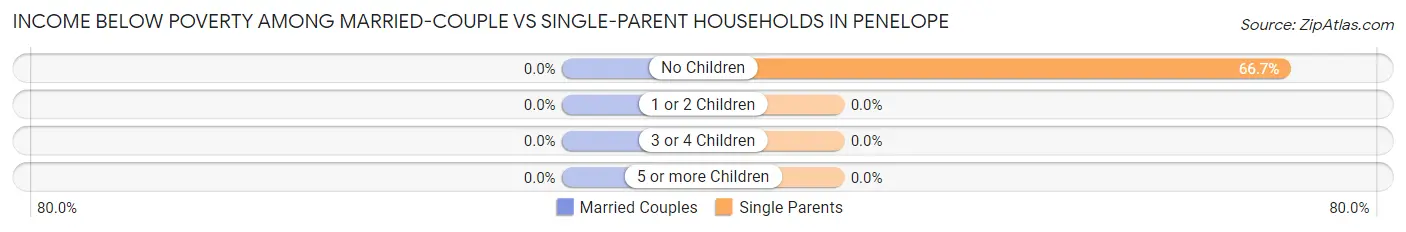
| Children | Married-Couple Families | Single-Parent Households |
| No Children | 0 (0.0%) | 2 (66.7%) |
| 1 or 2 Children | 0 (0.0%) | 0 (0.0%) |
| 3 or 4 Children | 0 (0.0%) | 0 (0.0%) |
| 5 or more Children | 0 (0.0%) | 0 (0.0%) |
| Total | 0 (0.0%) | 2 (22.2%) |
Race in Penelope
The most populous races in Penelope are White / Caucasian (190 | 81.2%), Hispanic or Latino (72 | 30.8%), and Two or more Races (30 | 12.8%).
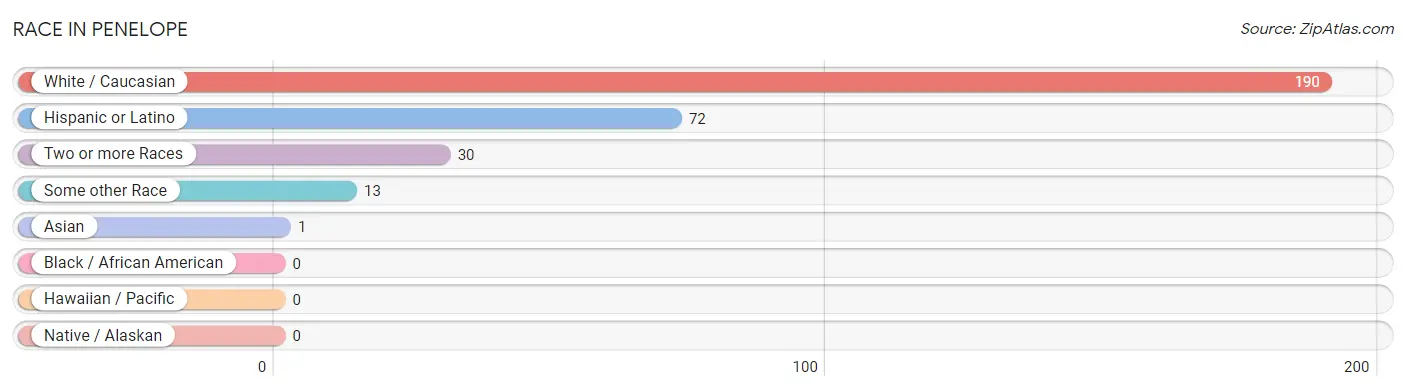
| Race | # Population | % Population |
| Asian | 1 | 0.4% |
| Black / African American | 0 | 0.0% |
| Hawaiian / Pacific | 0 | 0.0% |
| Hispanic or Latino | 72 | 30.8% |
| Native / Alaskan | 0 | 0.0% |
| White / Caucasian | 190 | 81.2% |
| Two or more Races | 30 | 12.8% |
| Some other Race | 13 | 5.6% |
| Total | 234 | 100.0% |
Ancestry in Penelope
The most populous ancestries reported in Penelope are Mexican (72 | 30.8%), German (58 | 24.8%), Czech (55 | 23.5%), Irish (12 | 5.1%), and Italian (9 | 3.8%), together accounting for 88.0% of all Penelope residents.
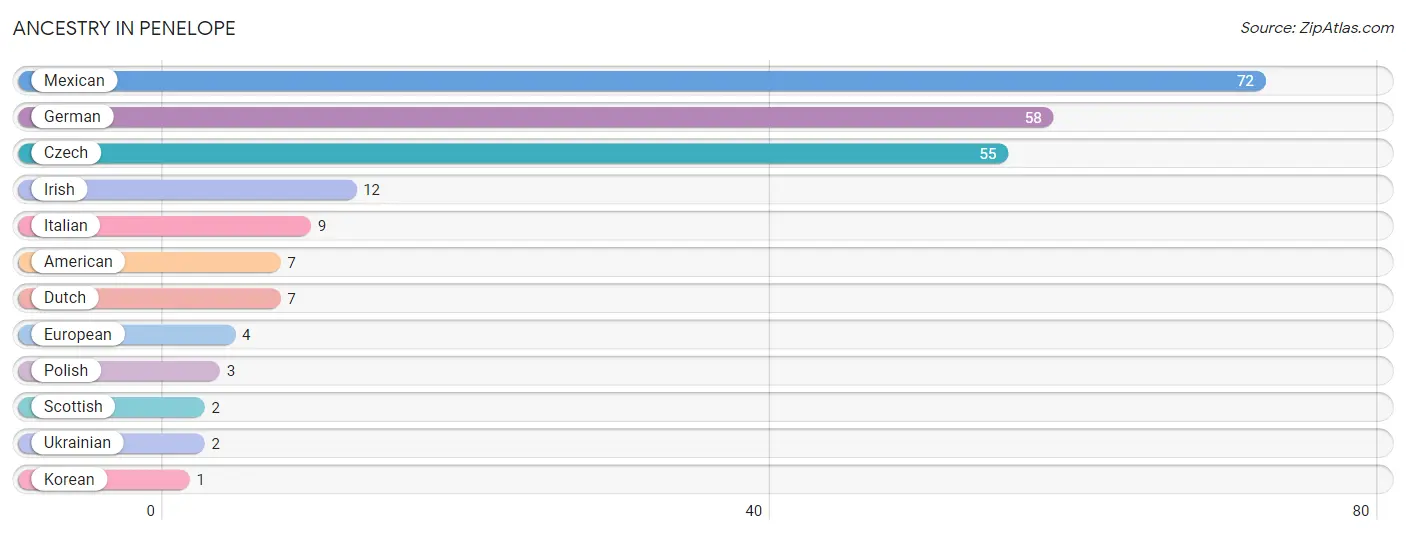
| Ancestry | # Population | % Population |
| American | 7 | 3.0% |
| Czech | 55 | 23.5% |
| Dutch | 7 | 3.0% |
| European | 4 | 1.7% |
| German | 58 | 24.8% |
| Irish | 12 | 5.1% |
| Italian | 9 | 3.8% |
| Korean | 1 | 0.4% |
| Mexican | 72 | 30.8% |
| Polish | 3 | 1.3% |
| Scottish | 2 | 0.9% |
| Ukrainian | 2 | 0.9% | View All 12 Rows |
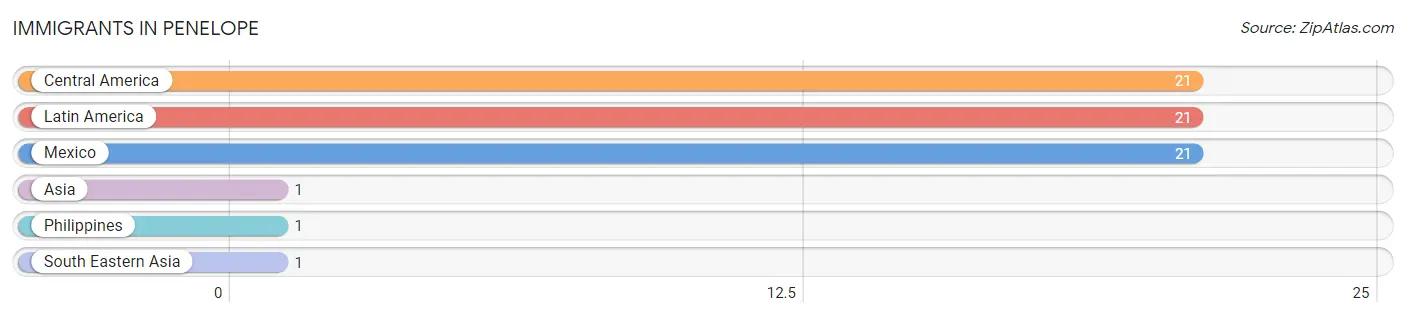
Immigrants in Penelope
The most numerous immigrant groups reported in Penelope came from Central America (21 | 9.0%), Latin America (21 | 9.0%), Mexico (21 | 9.0%), Asia (1 | 0.4%), and Philippines (1 | 0.4%), together accounting for 27.8% of all Penelope residents.
| Immigration Origin | # Population | % Population |
| Asia | 1 | 0.4% |
| Central America | 21 | 9.0% |
| Latin America | 21 | 9.0% |
| Mexico | 21 | 9.0% |
| Philippines | 1 | 0.4% |
| South Eastern Asia | 1 | 0.4% | View All 6 Rows |
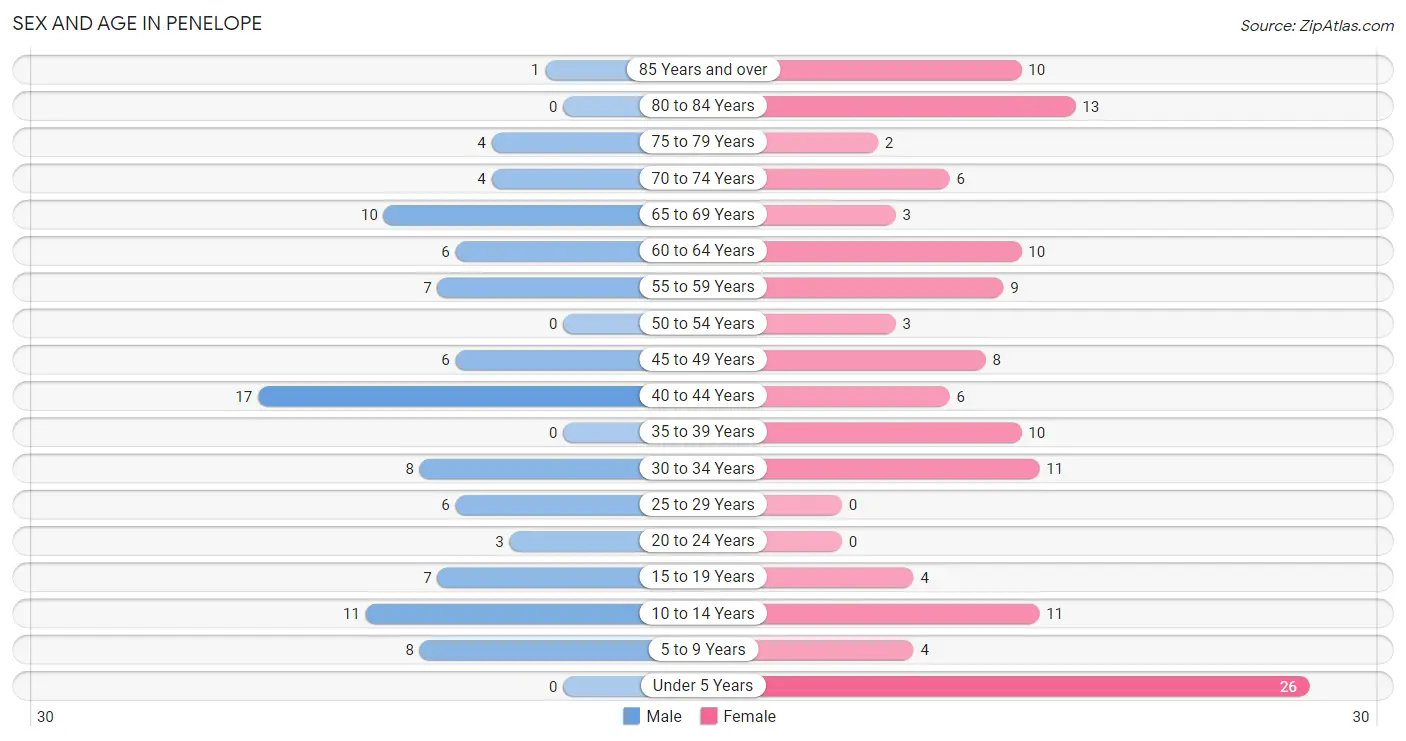
Sex and Age in Penelope
Sex and Age in Penelope
The most populous age groups in Penelope are 40 to 44 Years (17 | 17.3%) for men and Under 5 Years (26 | 19.1%) for women.
| Age Bracket | Male | Female |
| Under 5 Years | 0 (0.0%) | 26 (19.1%) |
| 5 to 9 Years | 8 (8.2%) | 4 (2.9%) |
| 10 to 14 Years | 11 (11.2%) | 11 (8.1%) |
| 15 to 19 Years | 7 (7.1%) | 4 (2.9%) |
| 20 to 24 Years | 3 (3.1%) | 0 (0.0%) |
| 25 to 29 Years | 6 (6.1%) | 0 (0.0%) |
| 30 to 34 Years | 8 (8.2%) | 11 (8.1%) |
| 35 to 39 Years | 0 (0.0%) | 10 (7.3%) |
| 40 to 44 Years | 17 (17.3%) | 6 (4.4%) |
| 45 to 49 Years | 6 (6.1%) | 8 (5.9%) |
| 50 to 54 Years | 0 (0.0%) | 3 (2.2%) |
| 55 to 59 Years | 7 (7.1%) | 9 (6.6%) |
| 60 to 64 Years | 6 (6.1%) | 10 (7.3%) |
| 65 to 69 Years | 10 (10.2%) | 3 (2.2%) |
| 70 to 74 Years | 4 (4.1%) | 6 (4.4%) |
| 75 to 79 Years | 4 (4.1%) | 2 (1.5%) |
| 80 to 84 Years | 0 (0.0%) | 13 (9.6%) |
| 85 Years and over | 1 (1.0%) | 10 (7.3%) |
| Total | 98 (100.0%) | 136 (100.0%) |
Families and Households in Penelope
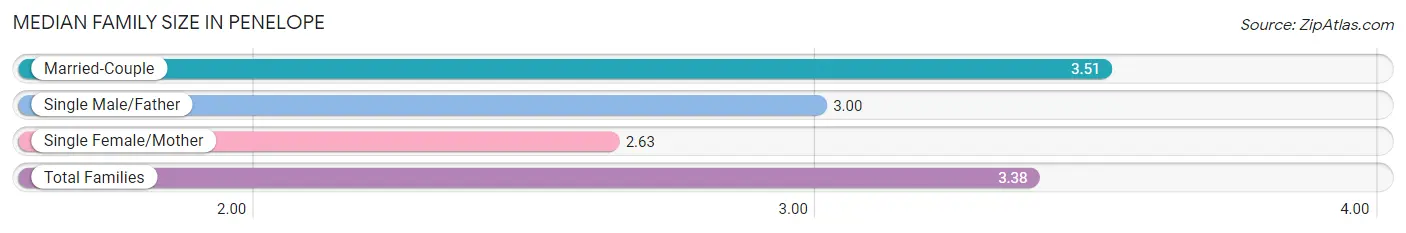
Median Family Size in Penelope
The median family size in Penelope is 3.38 persons per family, with married-couple families (49 | 84.5%) accounting for the largest median family size of 3.51 persons per family. On the other hand, single female/mother families (8 | 13.8%) represent the smallest median family size with 2.63 persons per family.
| Family Type | # Families | Family Size |
| Married-Couple | 49 (84.5%) | 3.51 |
| Single Male/Father | 1 (1.7%) | 3.00 |
| Single Female/Mother | 8 (13.8%) | 2.63 |
| Total Families | 58 (100.0%) | 3.38 |
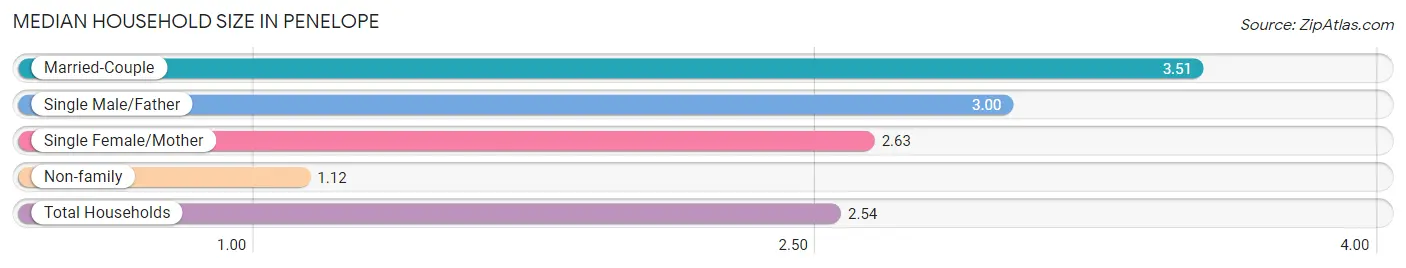
Median Household Size in Penelope
The median household size in Penelope is 2.54 persons per household, with married-couple households (49 | 53.3%) accounting for the largest median household size of 3.51 persons per household. non-family households (34 | 37.0%) represent the smallest median household size with 1.12 persons per household.
| Household Type | # Households | Household Size |
| Married-Couple | 49 (53.3%) | 3.51 |
| Single Male/Father | 1 (1.1%) | 3.00 |
| Single Female/Mother | 8 (8.7%) | 2.63 |
| Non-family | 34 (37.0%) | 1.12 |
| Total Households | 92 (100.0%) | 2.54 |
Household Size by Marriage Status in Penelope
Out of a total of 92 households in Penelope, 58 (63.0%) are family households, while 34 (37.0%) are nonfamily households. The most numerous type of family households are 4-person households, comprising 22, and the most common type of nonfamily households are 1-person households, comprising 32.
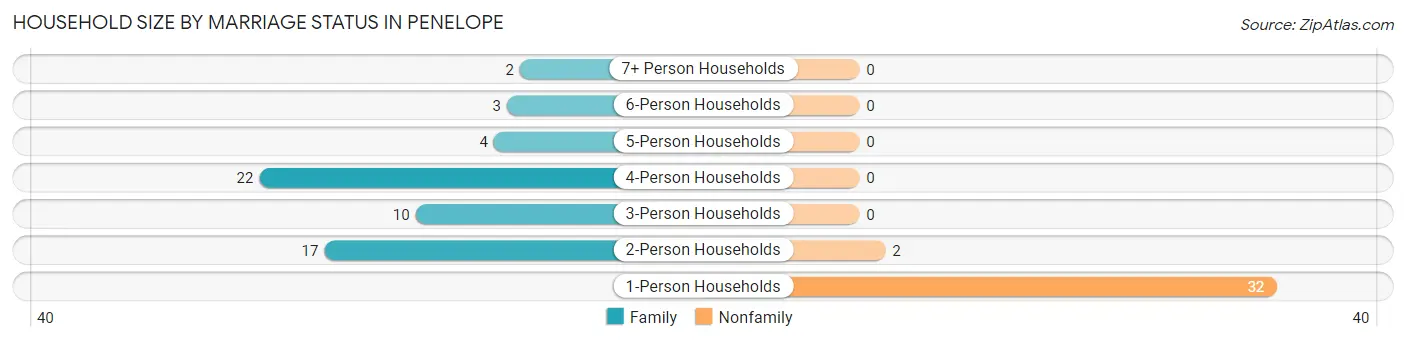
| Household Size | Family Households | Nonfamily Households |
| 1-Person Households | - | 32 (34.8%) |
| 2-Person Households | 17 (18.5%) | 2 (2.2%) |
| 3-Person Households | 10 (10.9%) | 0 (0.0%) |
| 4-Person Households | 22 (23.9%) | 0 (0.0%) |
| 5-Person Households | 4 (4.3%) | 0 (0.0%) |
| 6-Person Households | 3 (3.3%) | 0 (0.0%) |
| 7+ Person Households | 2 (2.2%) | 0 (0.0%) |
| Total | 58 (63.0%) | 34 (37.0%) |
Female Fertility in Penelope
Fertility by Age in Penelope
| Age Bracket | Women with Births | Births / 1,000 Women |
| 15 to 19 years | 0 (0.0%) | 0.0 |
| 20 to 34 years | 0 (0.0%) | 0.0 |
| 35 to 50 years | 0 (0.0%) | 0.0 |
| Total | 0 (0.0%) | 0.0 |
Fertility by Age by Marriage Status in Penelope
| Age Bracket | Married | Unmarried |
| 15 to 19 years | 0 (0.0%) | 0 (0.0%) |
| 20 to 34 years | 0 (0.0%) | 0 (0.0%) |
| 35 to 50 years | 0 (0.0%) | 0 (0.0%) |
| Total | 0 (0.0%) | 0 (0.0%) |
Fertility by Education in Penelope
| Educational Attainment | Women with Births | Births / 1,000 Women |
| Less than High School | 0 (0.0%) | 0.0 |
| High School Diploma | 0 (0.0%) | 0.0 |
| College or Associate's Degree | 0 (0.0%) | 0.0 |
| Bachelor's Degree | 0 (0.0%) | 0.0 |
| Graduate Degree | 0 (0.0%) | 0.0 |
| Total | 0 (0.0%) | 0.0 |
Fertility by Education by Marriage Status in Penelope
| Educational Attainment | Married | Unmarried |
| Less than High School | 0 (0.0%) | 0 (0.0%) |
| High School Diploma | 0 (0.0%) | 0 (0.0%) |
| College or Associate's Degree | 0 (0.0%) | 0 (0.0%) |
| Bachelor's Degree | 0 (0.0%) | 0 (0.0%) |
| Graduate Degree | 0 (0.0%) | 0 (0.0%) |
| Total | 0 (0.0%) | 0 (0.0%) |
Employment Characteristics in Penelope
Employment by Class of Employer in Penelope
Among the 101 employed individuals in Penelope, private company employees (55 | 54.5%), local government employees (20 | 19.8%), and state government employees (14 | 13.9%) make up the most common classes of employment.
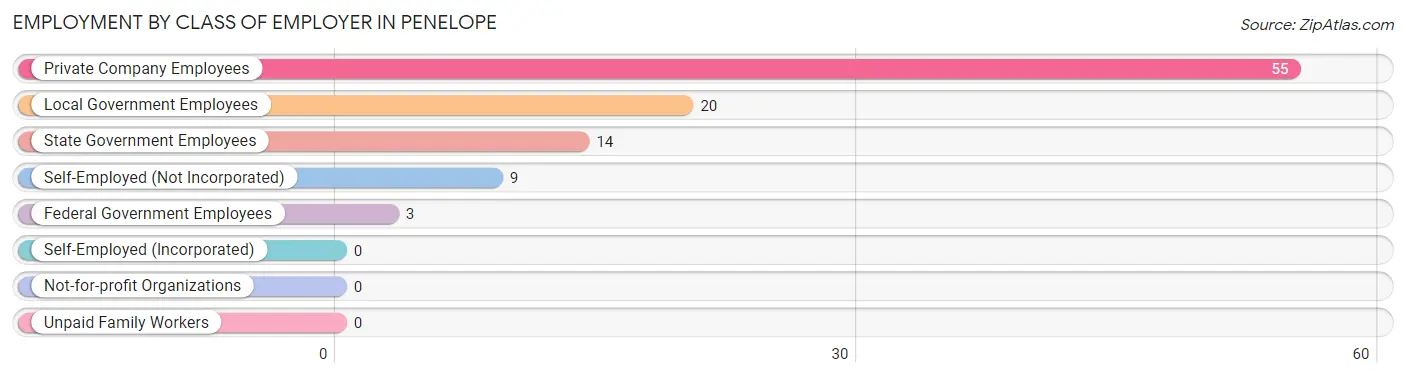
| Employer Class | # Employees | % Employees |
| Private Company Employees | 55 | 54.5% |
| Self-Employed (Incorporated) | 0 | 0.0% |
| Self-Employed (Not Incorporated) | 9 | 8.9% |
| Not-for-profit Organizations | 0 | 0.0% |
| Local Government Employees | 20 | 19.8% |
| State Government Employees | 14 | 13.9% |
| Federal Government Employees | 3 | 3.0% |
| Unpaid Family Workers | 0 | 0.0% |
| Total | 101 | 100.0% |
Employment Status by Age in Penelope
According to the labor force statistics for Penelope, out of the total population over 16 years of age (170), 61.2% or 104 individuals are in the labor force, with 2.9% or 3 of them unemployed. The age group with the highest labor force participation rate is 25 to 29 years, with 100.0% or 6 individuals in the labor force. Within the labor force, the 25 to 29 years age range has the highest percentage of unemployed individuals, with 50.0% or 3 of them being unemployed.
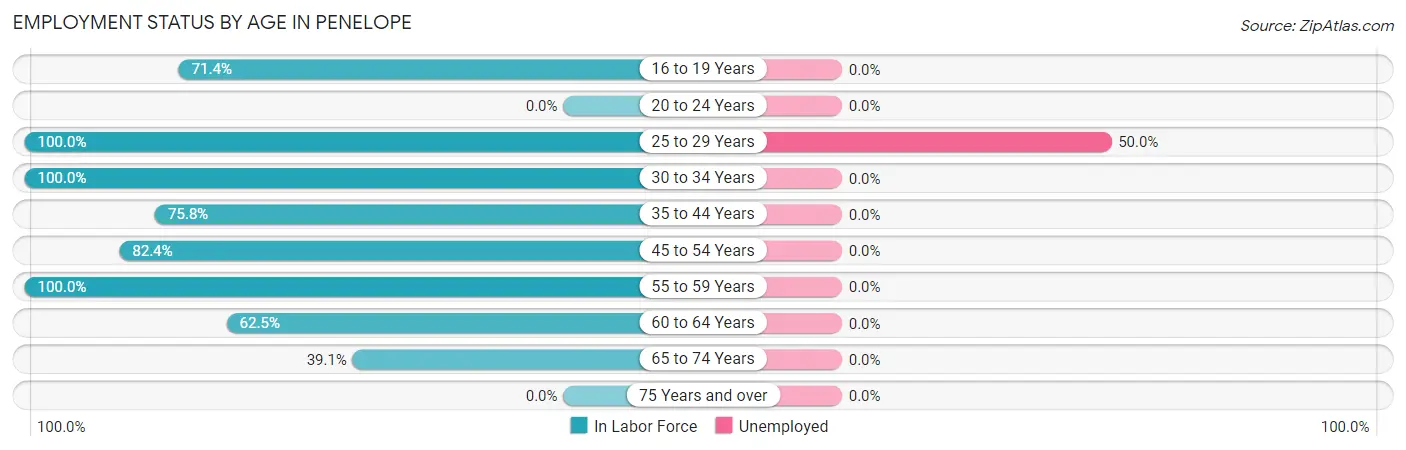
| Age Bracket | In Labor Force | Unemployed |
| 16 to 19 Years | 5 (71.4%) | 0 (0.0%) |
| 20 to 24 Years | 0 (0.0%) | 0 (0.0%) |
| 25 to 29 Years | 6 (100.0%) | 3 (50.0%) |
| 30 to 34 Years | 19 (100.0%) | 0 (0.0%) |
| 35 to 44 Years | 25 (75.8%) | 0 (0.0%) |
| 45 to 54 Years | 14 (82.4%) | 0 (0.0%) |
| 55 to 59 Years | 16 (100.0%) | 0 (0.0%) |
| 60 to 64 Years | 10 (62.5%) | 0 (0.0%) |
| 65 to 74 Years | 9 (39.1%) | 0 (0.0%) |
| 75 Years and over | 0 (0.0%) | 0 (0.0%) |
| Total | 104 (61.2%) | 3 (2.9%) |
Employment Status by Educational Attainment in Penelope
According to labor force statistics for Penelope, 84.1% of individuals (90) out of the total population between 25 and 64 years of age (107) are in the labor force, with 3.3% or 3 of them being unemployed. The group with the highest labor force participation rate are those with the educational attainment of college / associate degree, with 100.0% or 34 individuals in the labor force. Within the labor force, individuals with college / associate degree education have the highest percentage of unemployment, with 8.8% or 3 of them being unemployed.
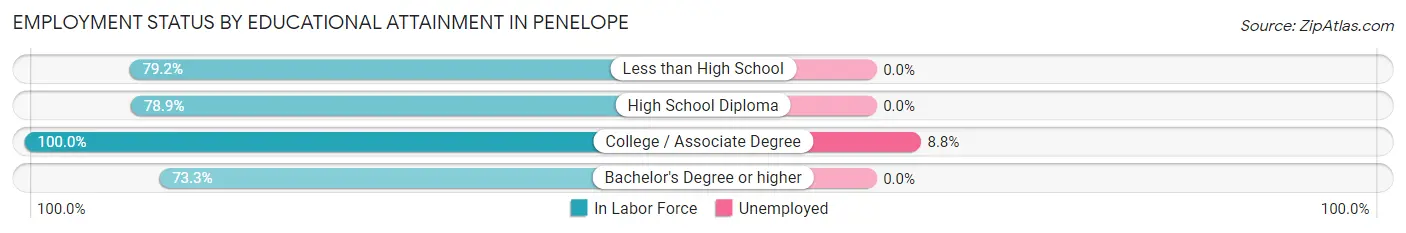
| Educational Attainment | In Labor Force | Unemployed |
| Less than High School | 19 (79.2%) | 0 (0.0%) |
| High School Diploma | 15 (78.9%) | 0 (0.0%) |
| College / Associate Degree | 34 (100.0%) | 3 (8.8%) |
| Bachelor's Degree or higher | 22 (73.3%) | 0 (0.0%) |
| Total | 90 (84.1%) | 4 (3.3%) |
Employment Occupations by Sex in Penelope
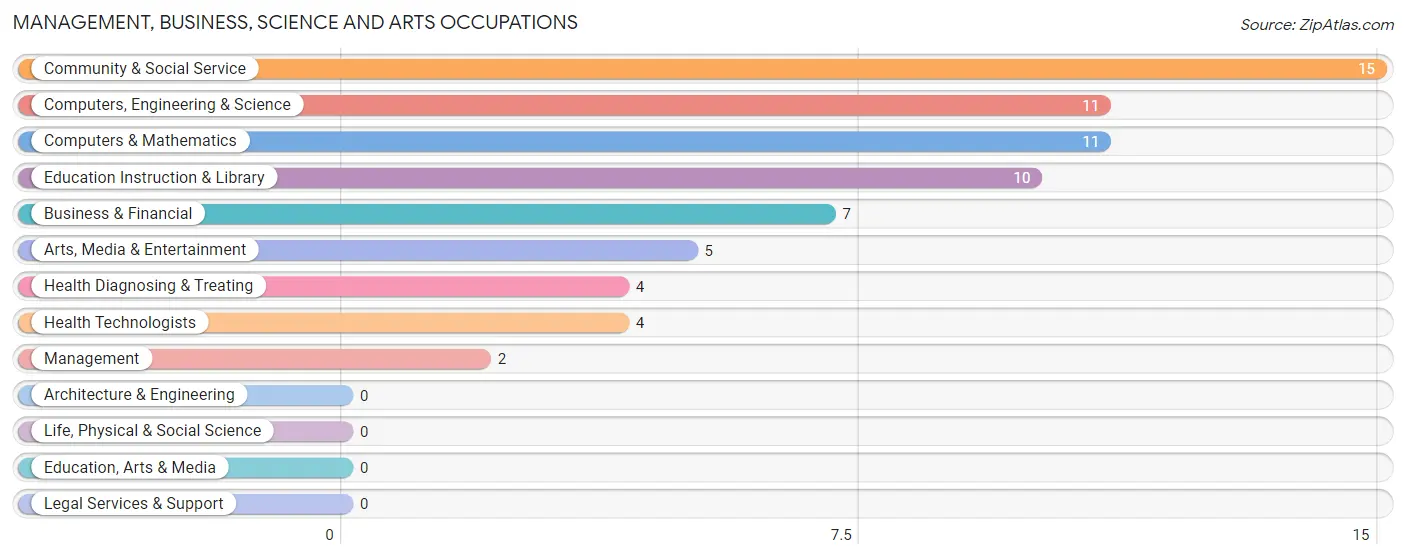
Management, Business, Science and Arts Occupations
The most common Management, Business, Science and Arts occupations in Penelope are Community & Social Service (15 | 14.8%), Computers, Engineering & Science (11 | 10.9%), Computers & Mathematics (11 | 10.9%), Education Instruction & Library (10 | 9.9%), and Business & Financial (7 | 6.9%).
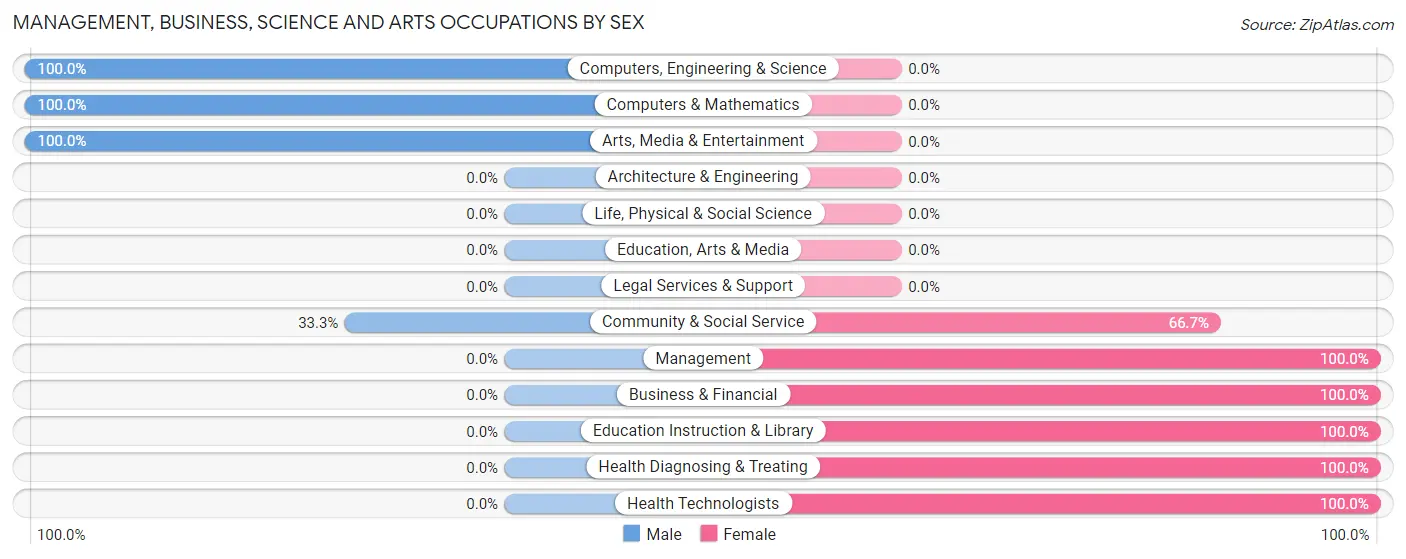
Management, Business, Science and Arts Occupations by Sex
Within the Management, Business, Science and Arts occupations in Penelope, the most male-oriented occupations are Computers, Engineering & Science (100.0%), Computers & Mathematics (100.0%), and Arts, Media & Entertainment (100.0%), while the most female-oriented occupations are Management (100.0%), Business & Financial (100.0%), and Education Instruction & Library (100.0%).
| Occupation | Male | Female |
| Management | 0 (0.0%) | 2 (100.0%) |
| Business & Financial | 0 (0.0%) | 7 (100.0%) |
| Computers, Engineering & Science | 11 (100.0%) | 0 (0.0%) |
| Computers & Mathematics | 11 (100.0%) | 0 (0.0%) |
| Architecture & Engineering | 0 (0.0%) | 0 (0.0%) |
| Life, Physical & Social Science | 0 (0.0%) | 0 (0.0%) |
| Community & Social Service | 5 (33.3%) | 10 (66.7%) |
| Education, Arts & Media | 0 (0.0%) | 0 (0.0%) |
| Legal Services & Support | 0 (0.0%) | 0 (0.0%) |
| Education Instruction & Library | 0 (0.0%) | 10 (100.0%) |
| Arts, Media & Entertainment | 5 (100.0%) | 0 (0.0%) |
| Health Diagnosing & Treating | 0 (0.0%) | 4 (100.0%) |
| Health Technologists | 0 (0.0%) | 4 (100.0%) |
| Total (Category) | 16 (41.0%) | 23 (59.0%) |
| Total (Overall) | 55 (54.5%) | 46 (45.5%) |
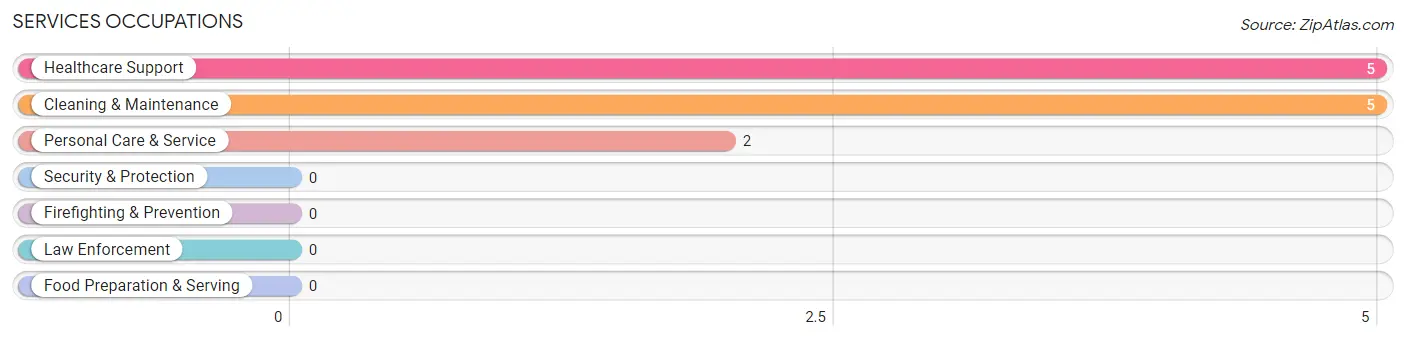
Services Occupations
The most common Services occupations in Penelope are Healthcare Support (5 | 5.0%), Cleaning & Maintenance (5 | 5.0%), and Personal Care & Service (2 | 2.0%).
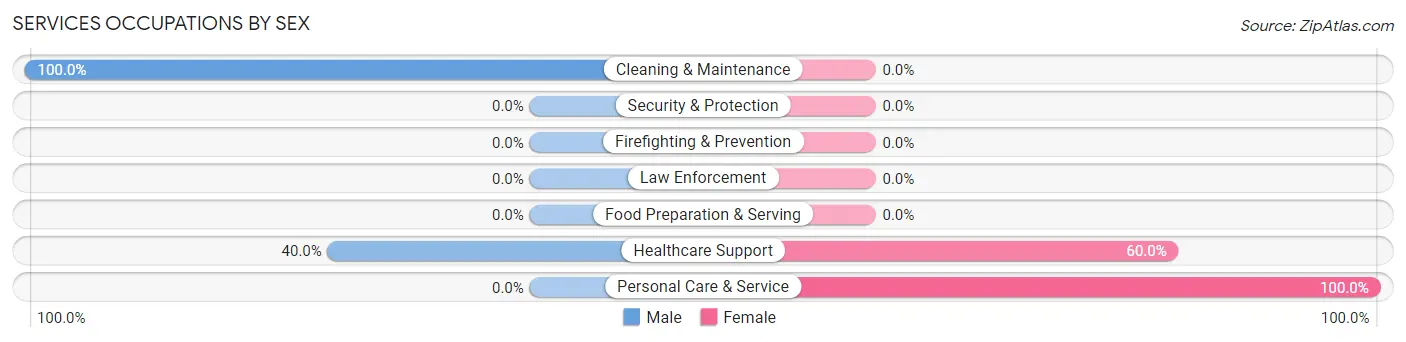
Services Occupations by Sex
Within the Services occupations in Penelope, the most male-oriented occupations are Cleaning & Maintenance (100.0%), and Healthcare Support (40.0%), while the most female-oriented occupations are Personal Care & Service (100.0%), and Healthcare Support (60.0%).
| Occupation | Male | Female |
| Healthcare Support | 2 (40.0%) | 3 (60.0%) |
| Security & Protection | 0 (0.0%) | 0 (0.0%) |
| Firefighting & Prevention | 0 (0.0%) | 0 (0.0%) |
| Law Enforcement | 0 (0.0%) | 0 (0.0%) |
| Food Preparation & Serving | 0 (0.0%) | 0 (0.0%) |
| Cleaning & Maintenance | 5 (100.0%) | 0 (0.0%) |
| Personal Care & Service | 0 (0.0%) | 2 (100.0%) |
| Total (Category) | 7 (58.3%) | 5 (41.7%) |
| Total (Overall) | 55 (54.5%) | 46 (45.5%) |
Sales and Office Occupations
The most common Sales and Office occupations in Penelope are Sales & Related (6 | 5.9%), and Office & Administration (5 | 5.0%).
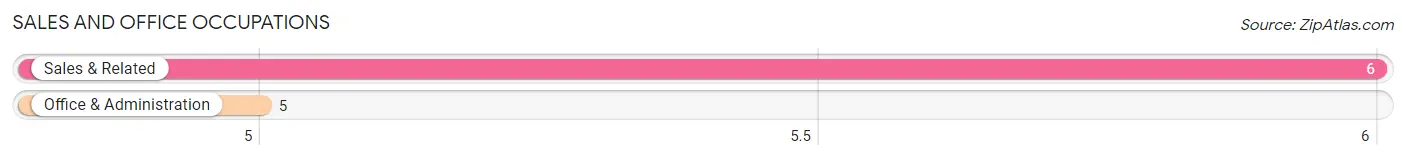
Sales and Office Occupations by Sex
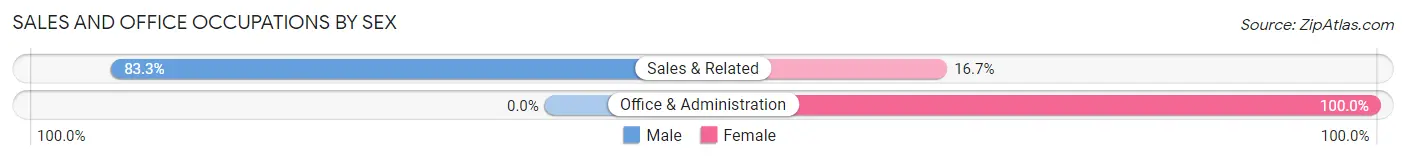
| Occupation | Male | Female |
| Sales & Related | 5 (83.3%) | 1 (16.7%) |
| Office & Administration | 0 (0.0%) | 5 (100.0%) |
| Total (Category) | 5 (45.5%) | 6 (54.5%) |
| Total (Overall) | 55 (54.5%) | 46 (45.5%) |
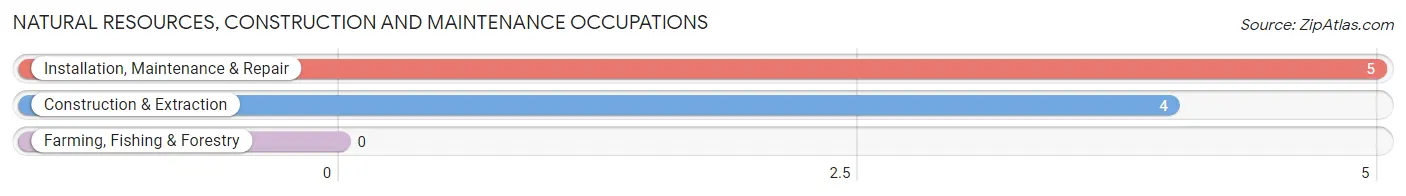
Natural Resources, Construction and Maintenance Occupations
The most common Natural Resources, Construction and Maintenance occupations in Penelope are Installation, Maintenance & Repair (5 | 5.0%), and Construction & Extraction (4 | 4.0%).
Natural Resources, Construction and Maintenance Occupations by Sex
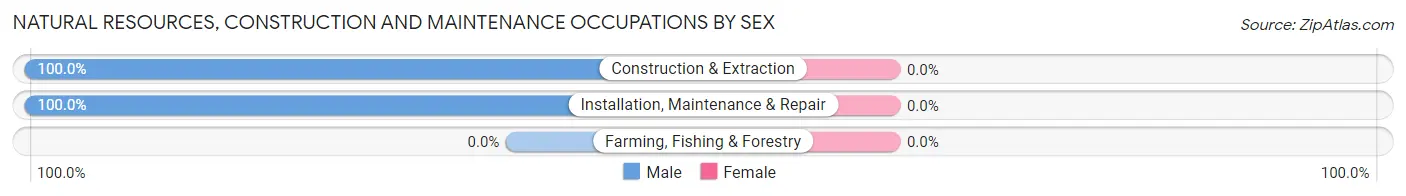
| Occupation | Male | Female |
| Farming, Fishing & Forestry | 0 (0.0%) | 0 (0.0%) |
| Construction & Extraction | 4 (100.0%) | 0 (0.0%) |
| Installation, Maintenance & Repair | 5 (100.0%) | 0 (0.0%) |
| Total (Category) | 9 (100.0%) | 0 (0.0%) |
| Total (Overall) | 55 (54.5%) | 46 (45.5%) |
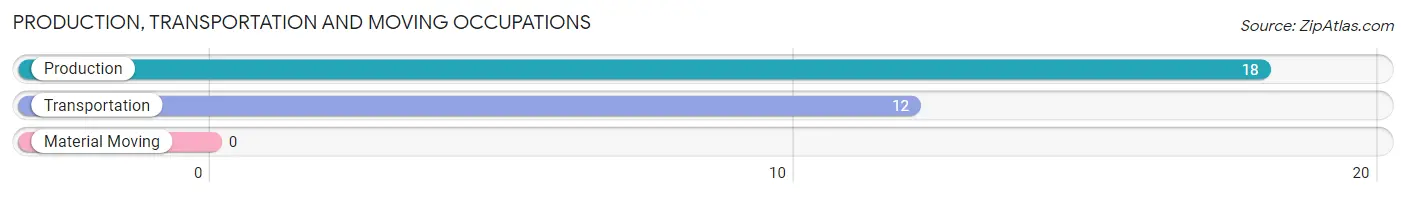
Production, Transportation and Moving Occupations
The most common Production, Transportation and Moving occupations in Penelope are Production (18 | 17.8%), and Transportation (12 | 11.9%).
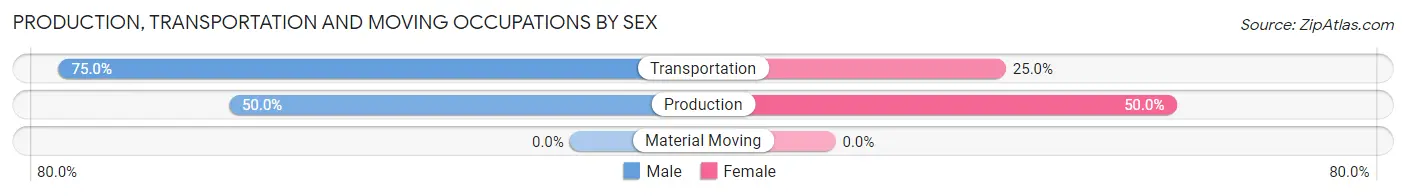
Production, Transportation and Moving Occupations by Sex
| Occupation | Male | Female |
| Production | 9 (50.0%) | 9 (50.0%) |
| Transportation | 9 (75.0%) | 3 (25.0%) |
| Material Moving | 0 (0.0%) | 0 (0.0%) |
| Total (Category) | 18 (60.0%) | 12 (40.0%) |
| Total (Overall) | 55 (54.5%) | 46 (45.5%) |
Employment Industries by Sex in Penelope
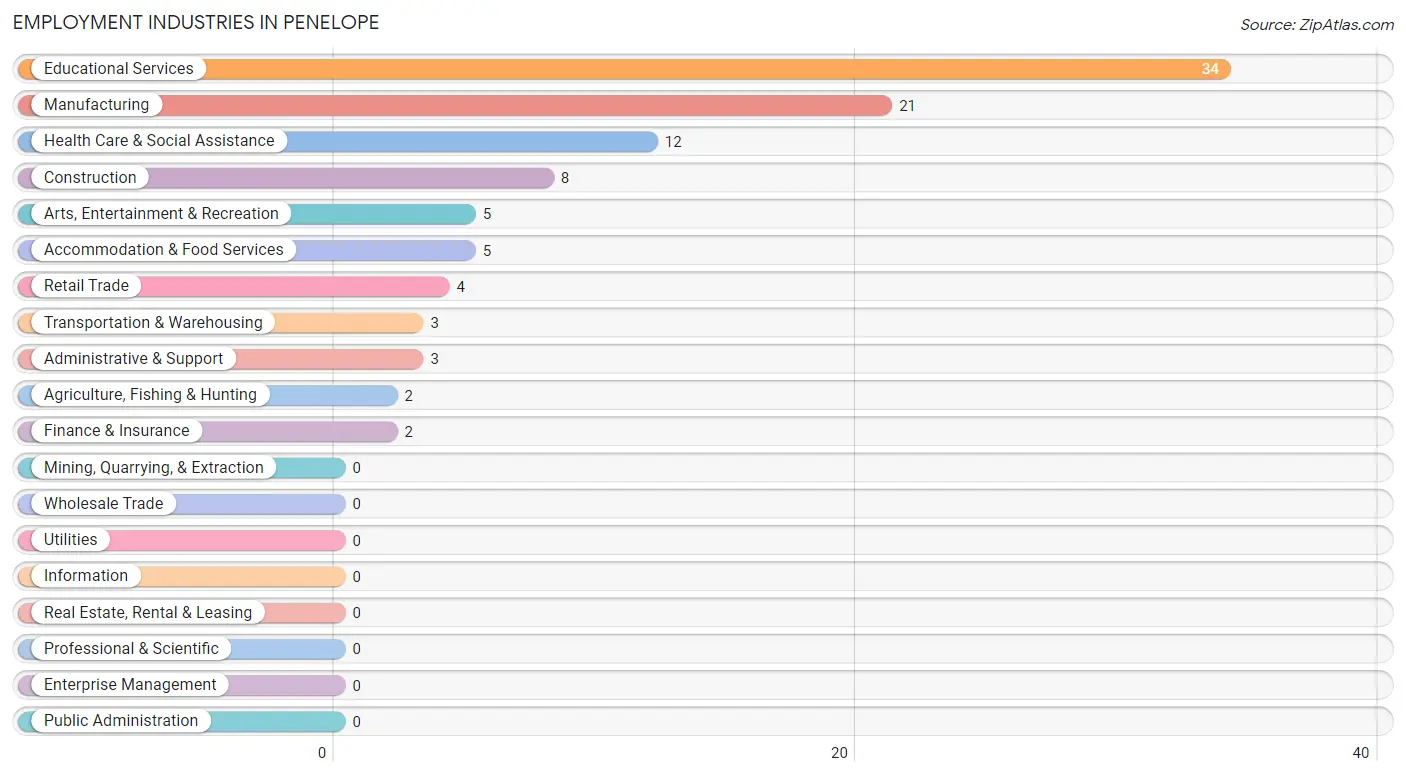
Employment Industries in Penelope
The major employment industries in Penelope include Educational Services (34 | 33.7%), Manufacturing (21 | 20.8%), Health Care & Social Assistance (12 | 11.9%), Construction (8 | 7.9%), and Arts, Entertainment & Recreation (5 | 5.0%).
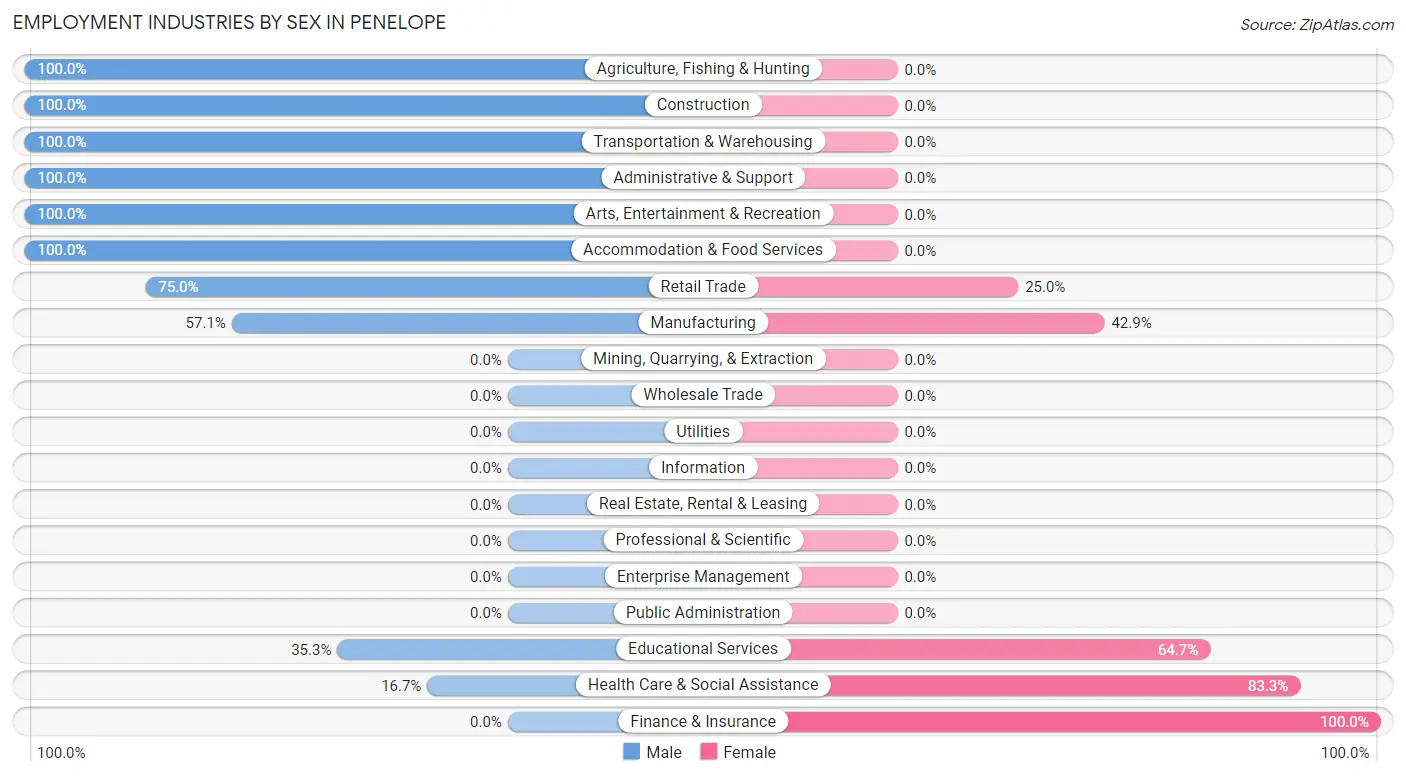
Employment Industries by Sex in Penelope
The Penelope industries that see more men than women are Agriculture, Fishing & Hunting (100.0%), Construction (100.0%), and Transportation & Warehousing (100.0%), whereas the industries that tend to have a higher number of women are Finance & Insurance (100.0%), Health Care & Social Assistance (83.3%), and Educational Services (64.7%).
| Industry | Male | Female |
| Agriculture, Fishing & Hunting | 2 (100.0%) | 0 (0.0%) |
| Mining, Quarrying, & Extraction | 0 (0.0%) | 0 (0.0%) |
| Construction | 8 (100.0%) | 0 (0.0%) |
| Manufacturing | 12 (57.1%) | 9 (42.9%) |
| Wholesale Trade | 0 (0.0%) | 0 (0.0%) |
| Retail Trade | 3 (75.0%) | 1 (25.0%) |
| Transportation & Warehousing | 3 (100.0%) | 0 (0.0%) |
| Utilities | 0 (0.0%) | 0 (0.0%) |
| Information | 0 (0.0%) | 0 (0.0%) |
| Finance & Insurance | 0 (0.0%) | 2 (100.0%) |
| Real Estate, Rental & Leasing | 0 (0.0%) | 0 (0.0%) |
| Professional & Scientific | 0 (0.0%) | 0 (0.0%) |
| Enterprise Management | 0 (0.0%) | 0 (0.0%) |
| Administrative & Support | 3 (100.0%) | 0 (0.0%) |
| Educational Services | 12 (35.3%) | 22 (64.7%) |
| Health Care & Social Assistance | 2 (16.7%) | 10 (83.3%) |
| Arts, Entertainment & Recreation | 5 (100.0%) | 0 (0.0%) |
| Accommodation & Food Services | 5 (100.0%) | 0 (0.0%) |
| Public Administration | 0 (0.0%) | 0 (0.0%) |
| Total | 55 (54.5%) | 46 (45.5%) |
Education in Penelope
School Enrollment in Penelope
The most common levels of schooling among the 59 students in Penelope are middle school (16 | 27.1%), elementary school (14 | 23.7%), and nursery / preschool (12 | 20.3%).
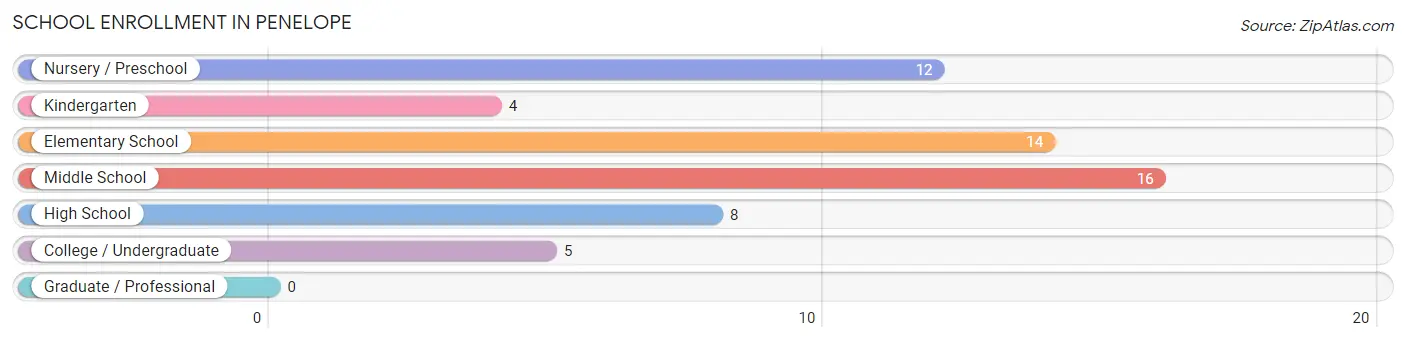
| School Level | # Students | % Students |
| Nursery / Preschool | 12 | 20.3% |
| Kindergarten | 4 | 6.8% |
| Elementary School | 14 | 23.7% |
| Middle School | 16 | 27.1% |
| High School | 8 | 13.6% |
| College / Undergraduate | 5 | 8.5% |
| Graduate / Professional | 0 | 0.0% |
| Total | 59 | 100.0% |
School Enrollment by Age by Funding Source in Penelope
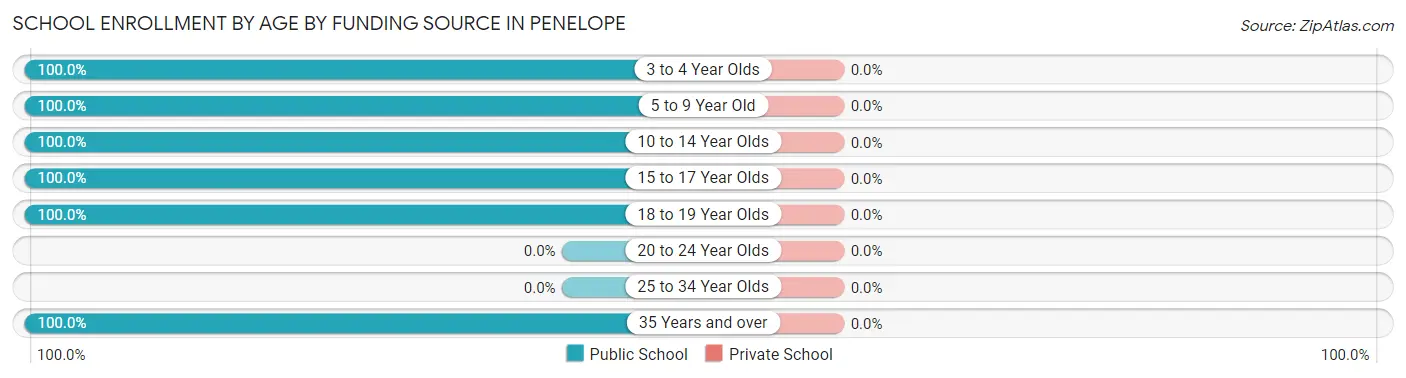
| Age Bracket | Public School | Private School |
| 3 to 4 Year Olds | 12 (100.0%) | 0 (0.0%) |
| 5 to 9 Year Old | 12 (100.0%) | 0 (0.0%) |
| 10 to 14 Year Olds | 22 (100.0%) | 0 (0.0%) |
| 15 to 17 Year Olds | 8 (100.0%) | 0 (0.0%) |
| 18 to 19 Year Olds | 3 (100.0%) | 0 (0.0%) |
| 20 to 24 Year Olds | 0 (0.0%) | 0 (0.0%) |
| 25 to 34 Year Olds | 0 (0.0%) | 0 (0.0%) |
| 35 Years and over | 2 (100.0%) | 0 (0.0%) |
| Total | 59 (100.0%) | 0 (0.0%) |
Educational Attainment by Field of Study in Penelope
Business (12 | 35.3%), education (12 | 35.3%), engineering (5 | 14.7%), bio, nature & agricultural (4 | 11.8%), and liberal arts & history (1 | 2.9%) are the most common fields of study among 34 individuals in Penelope who have obtained a bachelor's degree or higher.
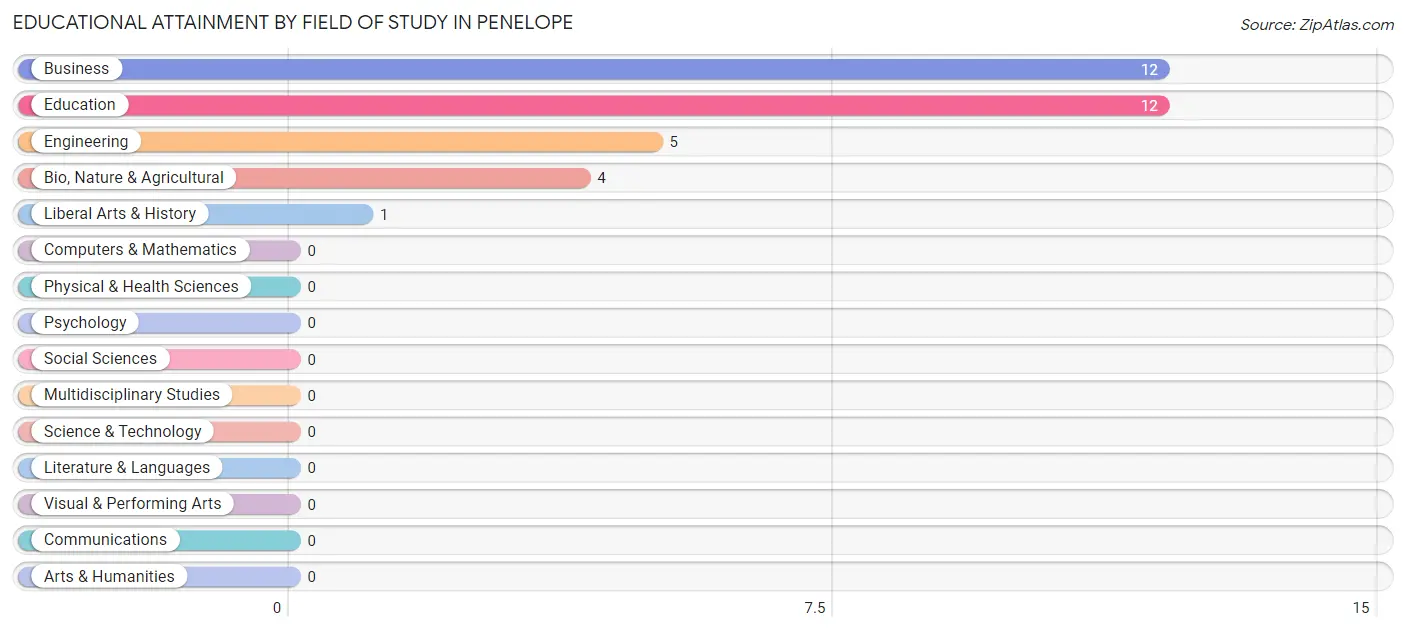
| Field of Study | # Graduates | % Graduates |
| Computers & Mathematics | 0 | 0.0% |
| Bio, Nature & Agricultural | 4 | 11.8% |
| Physical & Health Sciences | 0 | 0.0% |
| Psychology | 0 | 0.0% |
| Social Sciences | 0 | 0.0% |
| Engineering | 5 | 14.7% |
| Multidisciplinary Studies | 0 | 0.0% |
| Science & Technology | 0 | 0.0% |
| Business | 12 | 35.3% |
| Education | 12 | 35.3% |
| Literature & Languages | 0 | 0.0% |
| Liberal Arts & History | 1 | 2.9% |
| Visual & Performing Arts | 0 | 0.0% |
| Communications | 0 | 0.0% |
| Arts & Humanities | 0 | 0.0% |
| Total | 34 | 100.0% |
Transportation & Commute in Penelope
Vehicle Availability by Sex in Penelope
The most prevalent vehicle ownership categories in Penelope are males with 3 vehicles (25, accounting for 45.5%) and females with 3 vehicles (21, making up 54.3%).
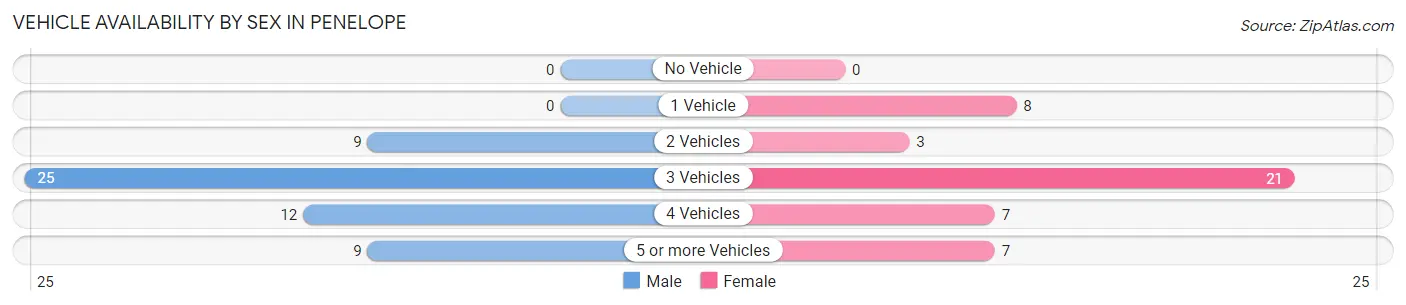
| Vehicles Available | Male | Female |
| No Vehicle | 0 (0.0%) | 0 (0.0%) |
| 1 Vehicle | 0 (0.0%) | 8 (17.4%) |
| 2 Vehicles | 9 (16.4%) | 3 (6.5%) |
| 3 Vehicles | 25 (45.5%) | 21 (45.7%) |
| 4 Vehicles | 12 (21.8%) | 7 (15.2%) |
| 5 or more Vehicles | 9 (16.4%) | 7 (15.2%) |
| Total | 55 (100.0%) | 46 (100.0%) |
Commute Time in Penelope
The most frequently occuring commute durations in Penelope are 30 to 34 minutes (16 commuters, 16.7%), less than 5 minutes (15 commuters, 15.6%), and 5 to 9 minutes (12 commuters, 12.5%).
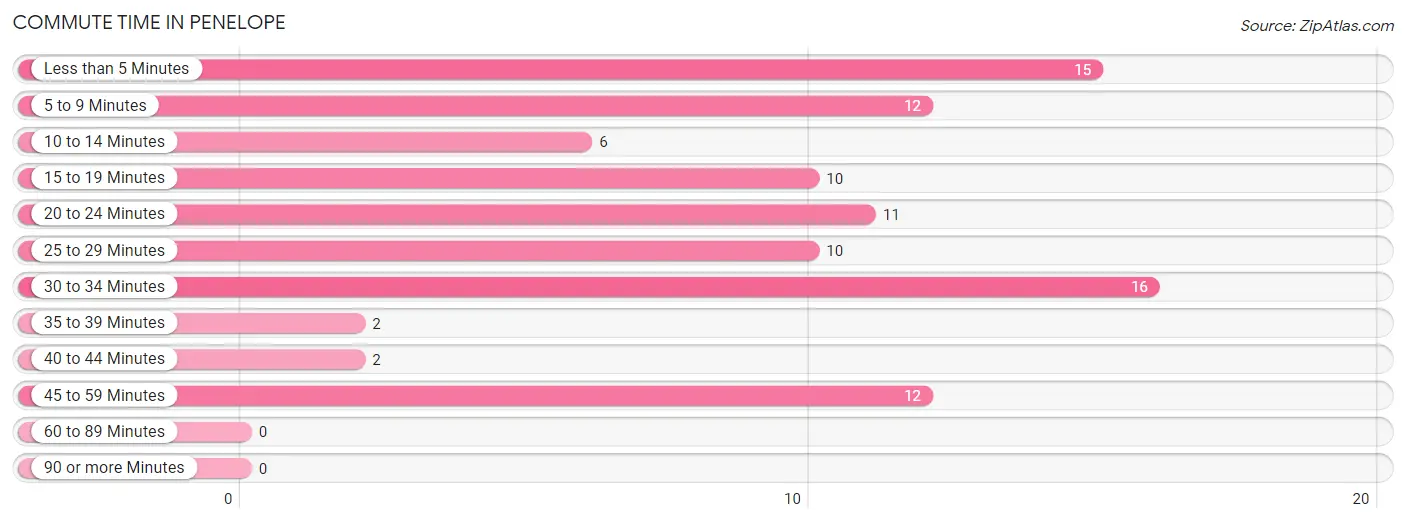
| Commute Time | # Commuters | % Commuters |
| Less than 5 Minutes | 15 | 15.6% |
| 5 to 9 Minutes | 12 | 12.5% |
| 10 to 14 Minutes | 6 | 6.2% |
| 15 to 19 Minutes | 10 | 10.4% |
| 20 to 24 Minutes | 11 | 11.5% |
| 25 to 29 Minutes | 10 | 10.4% |
| 30 to 34 Minutes | 16 | 16.7% |
| 35 to 39 Minutes | 2 | 2.1% |
| 40 to 44 Minutes | 2 | 2.1% |
| 45 to 59 Minutes | 12 | 12.5% |
| 60 to 89 Minutes | 0 | 0.0% |
| 90 or more Minutes | 0 | 0.0% |
Commute Time by Sex in Penelope
The most common commute times in Penelope are 25 to 29 minutes (10 commuters, 20.0%) for males and less than 5 minutes (15 commuters, 32.6%) for females.
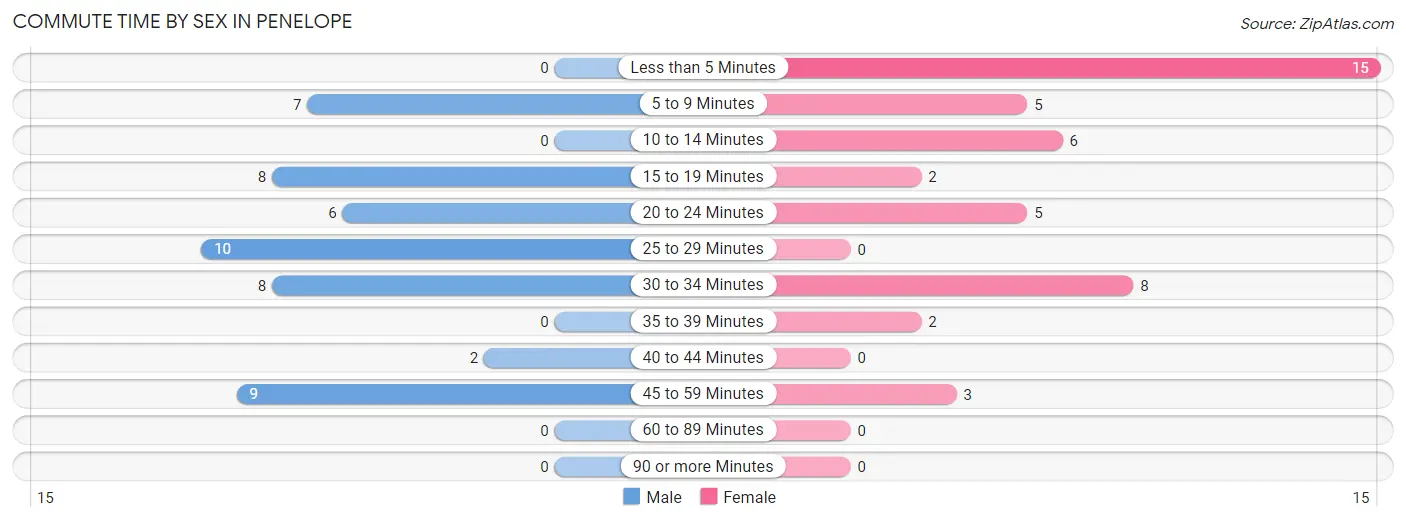
| Commute Time | Male | Female |
| Less than 5 Minutes | 0 (0.0%) | 15 (32.6%) |
| 5 to 9 Minutes | 7 (14.0%) | 5 (10.9%) |
| 10 to 14 Minutes | 0 (0.0%) | 6 (13.0%) |
| 15 to 19 Minutes | 8 (16.0%) | 2 (4.3%) |
| 20 to 24 Minutes | 6 (12.0%) | 5 (10.9%) |
| 25 to 29 Minutes | 10 (20.0%) | 0 (0.0%) |
| 30 to 34 Minutes | 8 (16.0%) | 8 (17.4%) |
| 35 to 39 Minutes | 0 (0.0%) | 2 (4.3%) |
| 40 to 44 Minutes | 2 (4.0%) | 0 (0.0%) |
| 45 to 59 Minutes | 9 (18.0%) | 3 (6.5%) |
| 60 to 89 Minutes | 0 (0.0%) | 0 (0.0%) |
| 90 or more Minutes | 0 (0.0%) | 0 (0.0%) |
Time of Departure to Work by Sex in Penelope
The most frequent times of departure to work in Penelope are 7:00 AM to 7:29 AM (11, 22.0%) for males and 7:00 AM to 7:29 AM (22, 47.8%) for females.
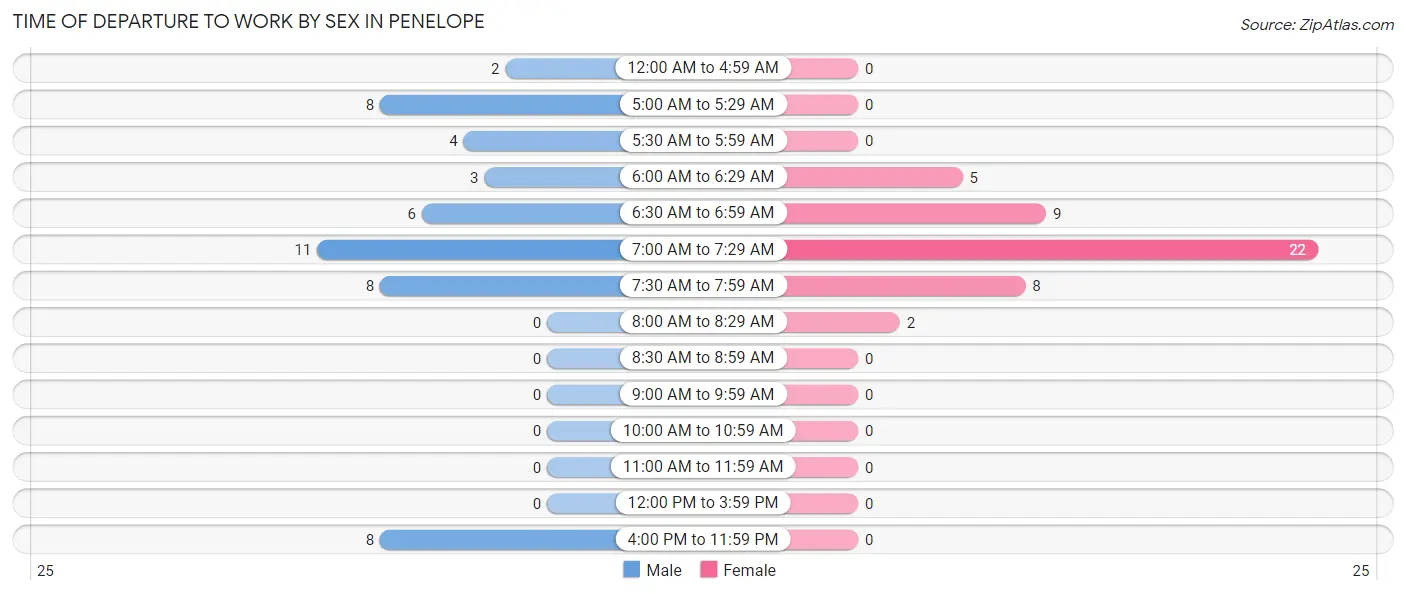
| Time of Departure | Male | Female |
| 12:00 AM to 4:59 AM | 2 (4.0%) | 0 (0.0%) |
| 5:00 AM to 5:29 AM | 8 (16.0%) | 0 (0.0%) |
| 5:30 AM to 5:59 AM | 4 (8.0%) | 0 (0.0%) |
| 6:00 AM to 6:29 AM | 3 (6.0%) | 5 (10.9%) |
| 6:30 AM to 6:59 AM | 6 (12.0%) | 9 (19.6%) |
| 7:00 AM to 7:29 AM | 11 (22.0%) | 22 (47.8%) |
| 7:30 AM to 7:59 AM | 8 (16.0%) | 8 (17.4%) |
| 8:00 AM to 8:29 AM | 0 (0.0%) | 2 (4.3%) |
| 8:30 AM to 8:59 AM | 0 (0.0%) | 0 (0.0%) |
| 9:00 AM to 9:59 AM | 0 (0.0%) | 0 (0.0%) |
| 10:00 AM to 10:59 AM | 0 (0.0%) | 0 (0.0%) |
| 11:00 AM to 11:59 AM | 0 (0.0%) | 0 (0.0%) |
| 12:00 PM to 3:59 PM | 0 (0.0%) | 0 (0.0%) |
| 4:00 PM to 11:59 PM | 8 (16.0%) | 0 (0.0%) |
| Total | 50 (100.0%) | 46 (100.0%) |
Housing Occupancy in Penelope
Occupancy by Ownership in Penelope
Of the total 92 dwellings in Penelope, owner-occupied units account for 82 (89.1%), while renter-occupied units make up 10 (10.9%).
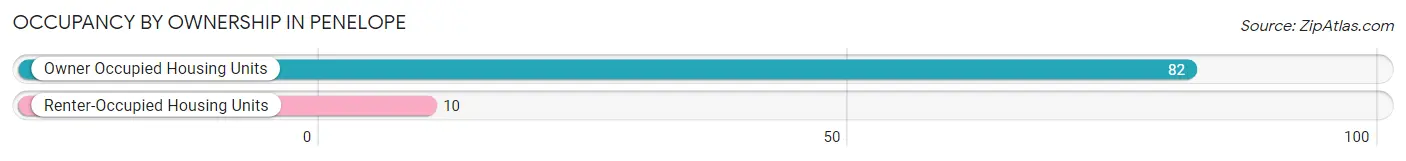
| Occupancy | # Housing Units | % Housing Units |
| Owner Occupied Housing Units | 82 | 89.1% |
| Renter-Occupied Housing Units | 10 | 10.9% |
| Total Occupied Housing Units | 92 | 100.0% |
Occupancy by Household Size in Penelope
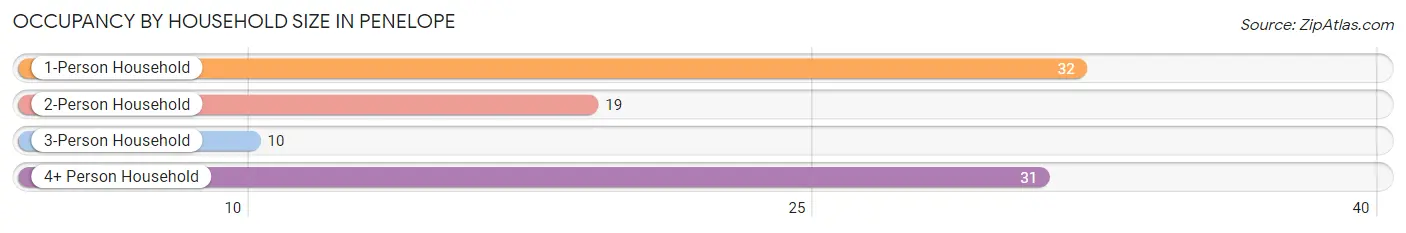
| Household Size | # Housing Units | % Housing Units |
| 1-Person Household | 32 | 34.8% |
| 2-Person Household | 19 | 20.6% |
| 3-Person Household | 10 | 10.9% |
| 4+ Person Household | 31 | 33.7% |
| Total Housing Units | 92 | 100.0% |
Occupancy by Ownership by Household Size in Penelope
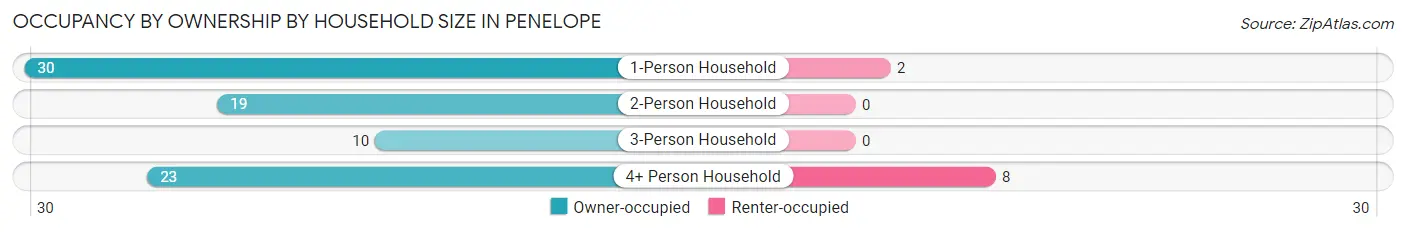
| Household Size | Owner-occupied | Renter-occupied |
| 1-Person Household | 30 (93.8%) | 2 (6.2%) |
| 2-Person Household | 19 (100.0%) | 0 (0.0%) |
| 3-Person Household | 10 (100.0%) | 0 (0.0%) |
| 4+ Person Household | 23 (74.2%) | 8 (25.8%) |
| Total Housing Units | 82 (89.1%) | 10 (10.9%) |
Occupancy by Educational Attainment in Penelope
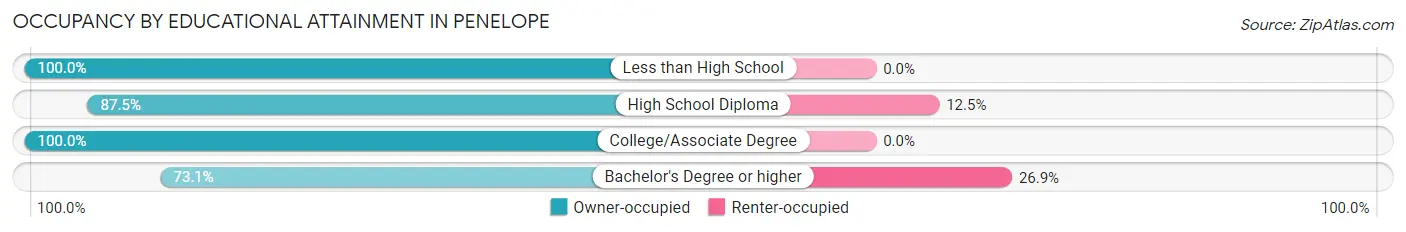
| Household Size | Owner-occupied | Renter-occupied |
| Less than High School | 18 (100.0%) | 0 (0.0%) |
| High School Diploma | 21 (87.5%) | 3 (12.5%) |
| College/Associate Degree | 24 (100.0%) | 0 (0.0%) |
| Bachelor's Degree or higher | 19 (73.1%) | 7 (26.9%) |
Occupancy by Age of Householder in Penelope
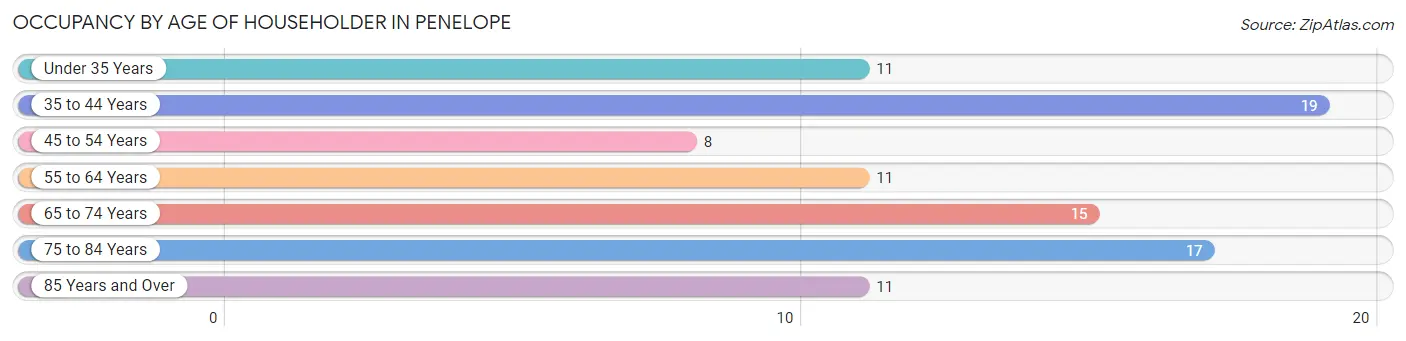
| Age Bracket | # Households | % Households |
| Under 35 Years | 11 | 12.0% |
| 35 to 44 Years | 19 | 20.6% |
| 45 to 54 Years | 8 | 8.7% |
| 55 to 64 Years | 11 | 12.0% |
| 65 to 74 Years | 15 | 16.3% |
| 75 to 84 Years | 17 | 18.5% |
| 85 Years and Over | 11 | 12.0% |
| Total | 92 | 100.0% |
Housing Finances in Penelope
Median Income by Occupancy in Penelope
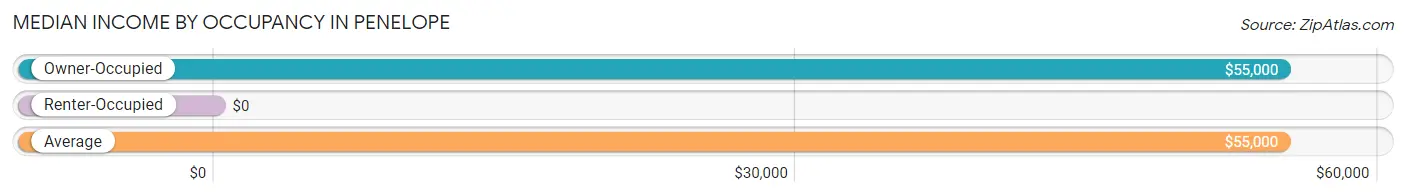
| Occupancy Type | # Households | Median Income |
| Owner-Occupied | 82 (89.1%) | $55,000 |
| Renter-Occupied | 10 (10.9%) | $0 |
| Average | 92 (100.0%) | $55,000 |
Occupancy by Householder Income Bracket in Penelope
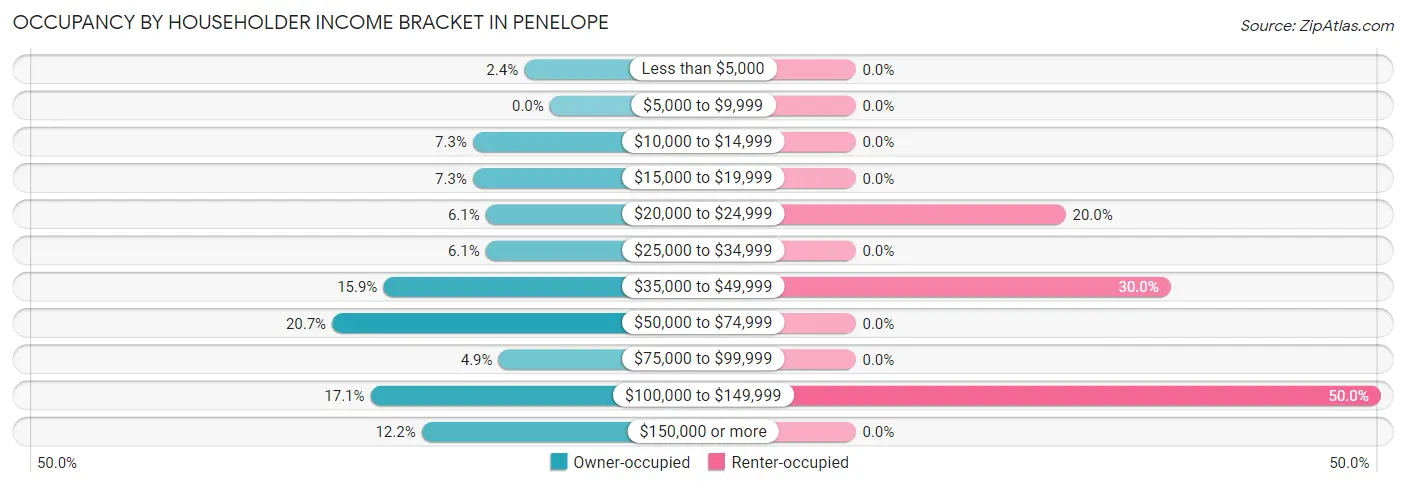
| Income Bracket | Owner-occupied | Renter-occupied |
| Less than $5,000 | 2 (2.4%) | 0 (0.0%) |
| $5,000 to $9,999 | 0 (0.0%) | 0 (0.0%) |
| $10,000 to $14,999 | 6 (7.3%) | 0 (0.0%) |
| $15,000 to $19,999 | 6 (7.3%) | 0 (0.0%) |
| $20,000 to $24,999 | 5 (6.1%) | 2 (20.0%) |
| $25,000 to $34,999 | 5 (6.1%) | 0 (0.0%) |
| $35,000 to $49,999 | 13 (15.9%) | 3 (30.0%) |
| $50,000 to $74,999 | 17 (20.7%) | 0 (0.0%) |
| $75,000 to $99,999 | 4 (4.9%) | 0 (0.0%) |
| $100,000 to $149,999 | 14 (17.1%) | 5 (50.0%) |
| $150,000 or more | 10 (12.2%) | 0 (0.0%) |
| Total | 82 (100.0%) | 10 (100.0%) |
Monthly Housing Cost Tiers in Penelope
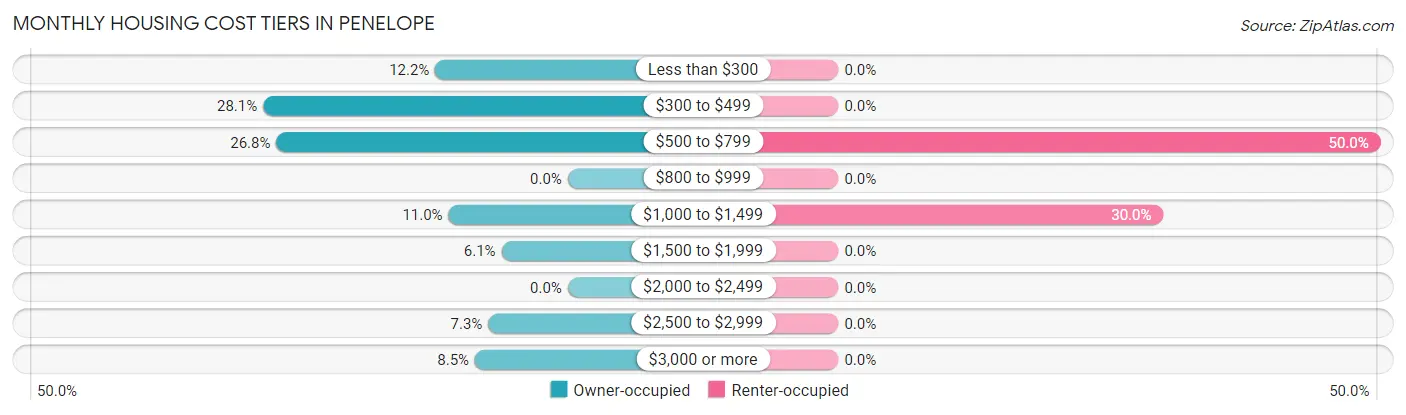
| Monthly Cost | Owner-occupied | Renter-occupied |
| Less than $300 | 10 (12.2%) | 0 (0.0%) |
| $300 to $499 | 23 (28.1%) | 0 (0.0%) |
| $500 to $799 | 22 (26.8%) | 5 (50.0%) |
| $800 to $999 | 0 (0.0%) | 0 (0.0%) |
| $1,000 to $1,499 | 9 (11.0%) | 3 (30.0%) |
| $1,500 to $1,999 | 5 (6.1%) | 0 (0.0%) |
| $2,000 to $2,499 | 0 (0.0%) | 0 (0.0%) |
| $2,500 to $2,999 | 6 (7.3%) | 0 (0.0%) |
| $3,000 or more | 7 (8.5%) | 0 (0.0%) |
| Total | 82 (100.0%) | 10 (100.0%) |
Physical Housing Characteristics in Penelope
Housing Structures in Penelope
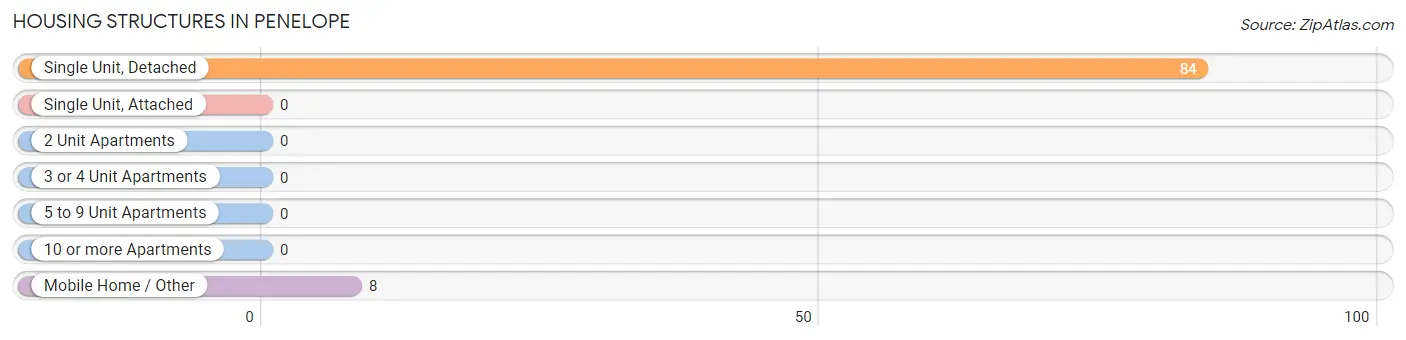
| Structure Type | # Housing Units | % Housing Units |
| Single Unit, Detached | 84 | 91.3% |
| Single Unit, Attached | 0 | 0.0% |
| 2 Unit Apartments | 0 | 0.0% |
| 3 or 4 Unit Apartments | 0 | 0.0% |
| 5 to 9 Unit Apartments | 0 | 0.0% |
| 10 or more Apartments | 0 | 0.0% |
| Mobile Home / Other | 8 | 8.7% |
| Total | 92 | 100.0% |
Housing Structures by Occupancy in Penelope
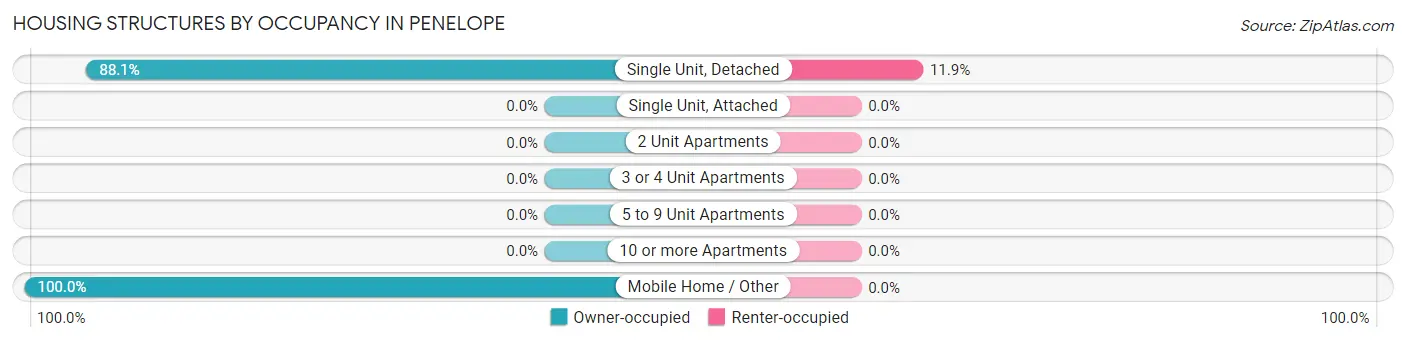
| Structure Type | Owner-occupied | Renter-occupied |
| Single Unit, Detached | 74 (88.1%) | 10 (11.9%) |
| Single Unit, Attached | 0 (0.0%) | 0 (0.0%) |
| 2 Unit Apartments | 0 (0.0%) | 0 (0.0%) |
| 3 or 4 Unit Apartments | 0 (0.0%) | 0 (0.0%) |
| 5 to 9 Unit Apartments | 0 (0.0%) | 0 (0.0%) |
| 10 or more Apartments | 0 (0.0%) | 0 (0.0%) |
| Mobile Home / Other | 8 (100.0%) | 0 (0.0%) |
| Total | 82 (89.1%) | 10 (10.9%) |
Housing Structures by Number of Rooms in Penelope
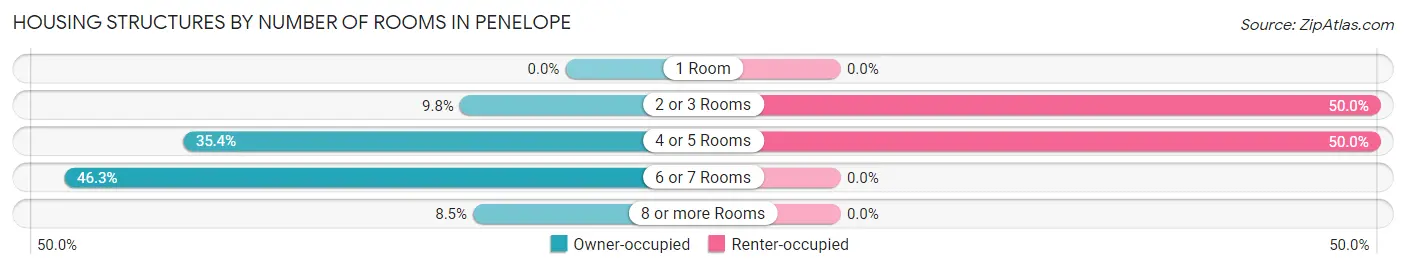
| Number of Rooms | Owner-occupied | Renter-occupied |
| 1 Room | 0 (0.0%) | 0 (0.0%) |
| 2 or 3 Rooms | 8 (9.8%) | 5 (50.0%) |
| 4 or 5 Rooms | 29 (35.4%) | 5 (50.0%) |
| 6 or 7 Rooms | 38 (46.3%) | 0 (0.0%) |
| 8 or more Rooms | 7 (8.5%) | 0 (0.0%) |
| Total | 82 (100.0%) | 10 (100.0%) |
Housing Structure by Heating Type in Penelope
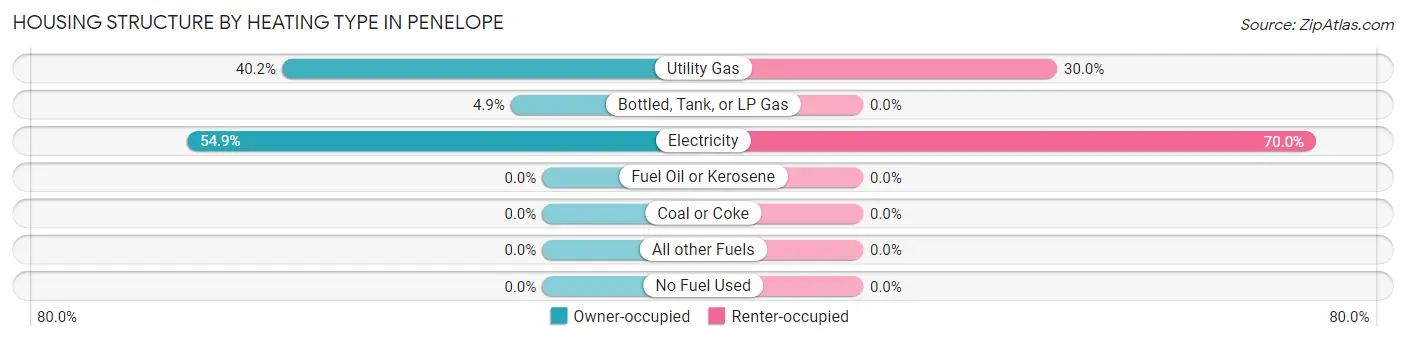
| Heating Type | Owner-occupied | Renter-occupied |
| Utility Gas | 33 (40.2%) | 3 (30.0%) |
| Bottled, Tank, or LP Gas | 4 (4.9%) | 0 (0.0%) |
| Electricity | 45 (54.9%) | 7 (70.0%) |
| Fuel Oil or Kerosene | 0 (0.0%) | 0 (0.0%) |
| Coal or Coke | 0 (0.0%) | 0 (0.0%) |
| All other Fuels | 0 (0.0%) | 0 (0.0%) |
| No Fuel Used | 0 (0.0%) | 0 (0.0%) |
| Total | 82 (100.0%) | 10 (100.0%) |
Household Vehicle Usage in Penelope
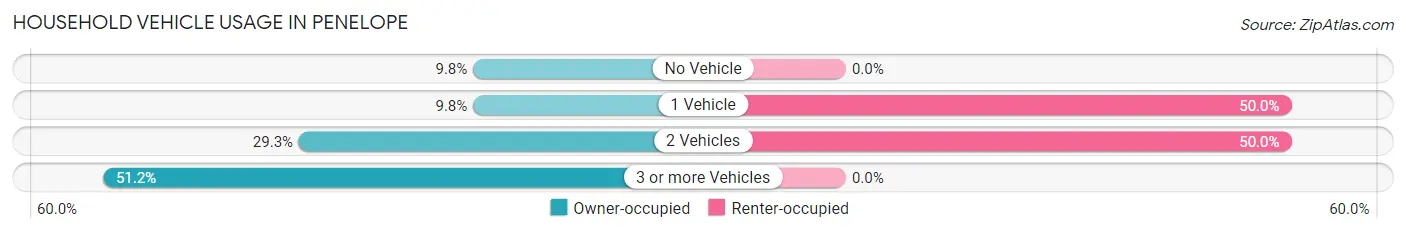
| Vehicles per Household | Owner-occupied | Renter-occupied |
| No Vehicle | 8 (9.8%) | 0 (0.0%) |
| 1 Vehicle | 8 (9.8%) | 5 (50.0%) |
| 2 Vehicles | 24 (29.3%) | 5 (50.0%) |
| 3 or more Vehicles | 42 (51.2%) | 0 (0.0%) |
| Total | 82 (100.0%) | 10 (100.0%) |
Real Estate & Mortgages in Penelope
Real Estate and Mortgage Overview in Penelope
| Characteristic | Without Mortgage | With Mortgage |
| Housing Units | 55 | 27 |
| Median Property Value | - | - |
| Median Household Income | $46,635 | $8 |
| Monthly Housing Costs | $431 | $7 |
| Real Estate Taxes | - | - |
Property Value by Mortgage Status in Penelope
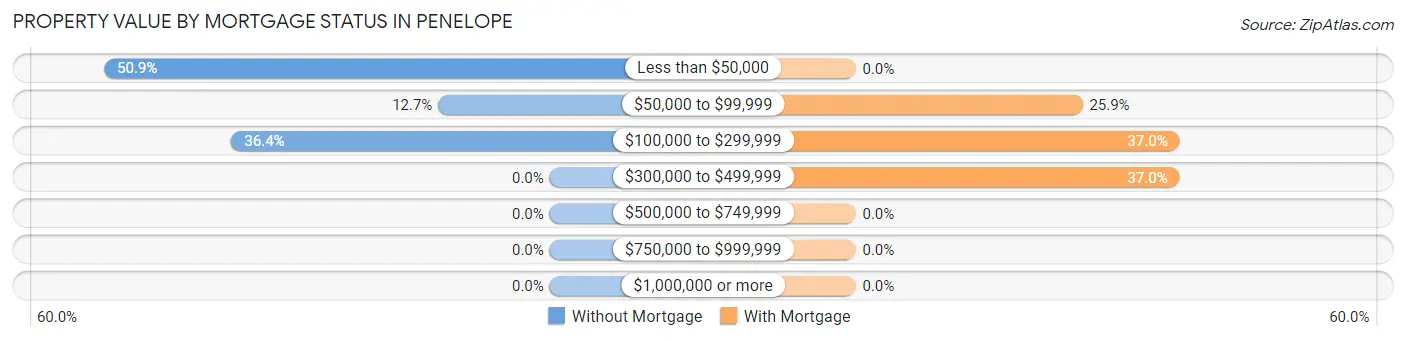
| Property Value | Without Mortgage | With Mortgage |
| Less than $50,000 | 28 (50.9%) | 0 (0.0%) |
| $50,000 to $99,999 | 7 (12.7%) | 7 (25.9%) |
| $100,000 to $299,999 | 20 (36.4%) | 10 (37.0%) |
| $300,000 to $499,999 | 0 (0.0%) | 10 (37.0%) |
| $500,000 to $749,999 | 0 (0.0%) | 0 (0.0%) |
| $750,000 to $999,999 | 0 (0.0%) | 0 (0.0%) |
| $1,000,000 or more | 0 (0.0%) | 0 (0.0%) |
| Total | 55 (100.0%) | 27 (100.0%) |
Household Income by Mortgage Status in Penelope
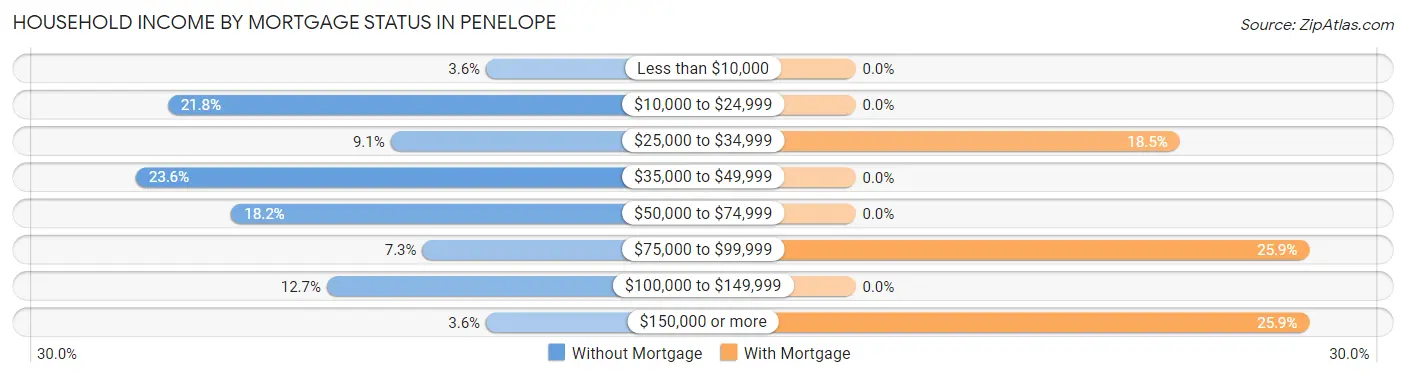
| Household Income | Without Mortgage | With Mortgage |
| Less than $10,000 | 2 (3.6%) | 0 (0.0%) |
| $10,000 to $24,999 | 12 (21.8%) | 0 (0.0%) |
| $25,000 to $34,999 | 5 (9.1%) | 5 (18.5%) |
| $35,000 to $49,999 | 13 (23.6%) | 0 (0.0%) |
| $50,000 to $74,999 | 10 (18.2%) | 0 (0.0%) |
| $75,000 to $99,999 | 4 (7.3%) | 7 (25.9%) |
| $100,000 to $149,999 | 7 (12.7%) | 0 (0.0%) |
| $150,000 or more | 2 (3.6%) | 7 (25.9%) |
| Total | 55 (100.0%) | 27 (100.0%) |
Property Value to Household Income Ratio in Penelope
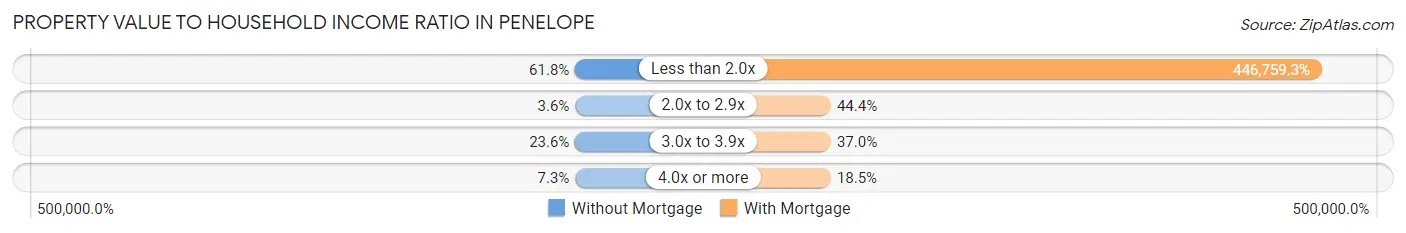
| Value-to-Income Ratio | Without Mortgage | With Mortgage |
| Less than 2.0x | 34 (61.8%) | 120,625 (446,759.3%) |
| 2.0x to 2.9x | 2 (3.6%) | 12 (44.4%) |
| 3.0x to 3.9x | 13 (23.6%) | 10 (37.0%) |
| 4.0x or more | 4 (7.3%) | 5 (18.5%) |
| Total | 55 (100.0%) | 27 (100.0%) |
Real Estate Taxes by Mortgage Status in Penelope
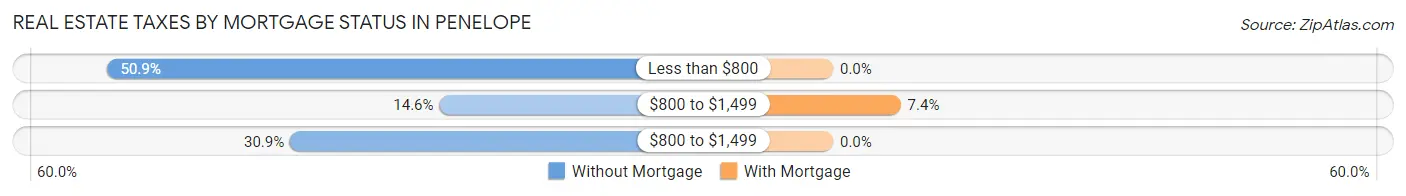
| Property Taxes | Without Mortgage | With Mortgage |
| Less than $800 | 28 (50.9%) | 0 (0.0%) |
| $800 to $1,499 | 8 (14.5%) | 2 (7.4%) |
| $800 to $1,499 | 17 (30.9%) | 0 (0.0%) |
| Total | 55 (100.0%) | 27 (100.0%) |
Health & Disability in Penelope
Health Insurance Coverage by Age in Penelope
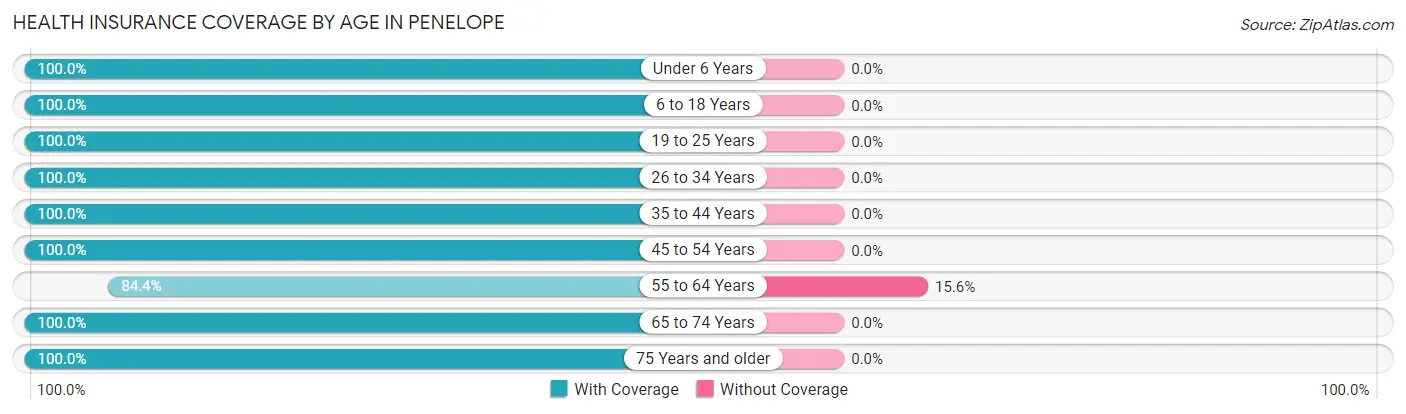
| Age Bracket | With Coverage | Without Coverage |
| Under 6 Years | 26 (100.0%) | 0 (0.0%) |
| 6 to 18 Years | 42 (100.0%) | 0 (0.0%) |
| 19 to 25 Years | 6 (100.0%) | 0 (0.0%) |
| 26 to 34 Years | 25 (100.0%) | 0 (0.0%) |
| 35 to 44 Years | 33 (100.0%) | 0 (0.0%) |
| 45 to 54 Years | 17 (100.0%) | 0 (0.0%) |
| 55 to 64 Years | 27 (84.4%) | 5 (15.6%) |
| 65 to 74 Years | 23 (100.0%) | 0 (0.0%) |
| 75 Years and older | 30 (100.0%) | 0 (0.0%) |
| Total | 229 (97.9%) | 5 (2.1%) |
Health Insurance Coverage by Citizenship Status in Penelope
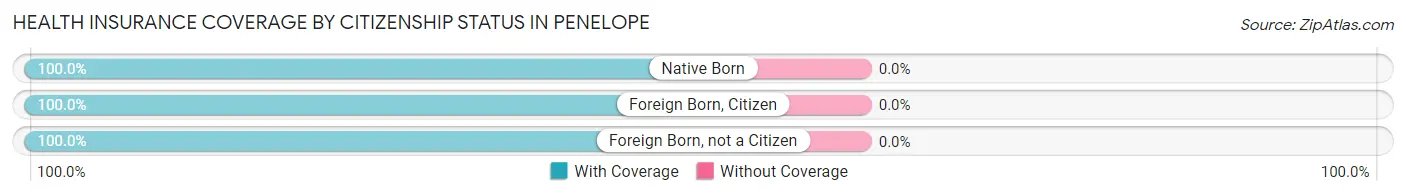
| Citizenship Status | With Coverage | Without Coverage |
| Native Born | 26 (100.0%) | 0 (0.0%) |
| Foreign Born, Citizen | 42 (100.0%) | 0 (0.0%) |
| Foreign Born, not a Citizen | 6 (100.0%) | 0 (0.0%) |
Health Insurance Coverage by Household Income in Penelope
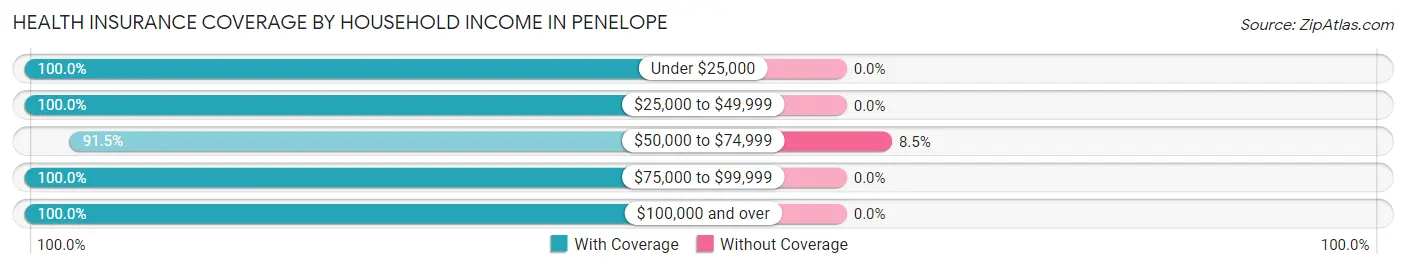
| Household Income | With Coverage | Without Coverage |
| Under $25,000 | 22 (100.0%) | 0 (0.0%) |
| $25,000 to $49,999 | 35 (100.0%) | 0 (0.0%) |
| $50,000 to $74,999 | 54 (91.5%) | 5 (8.5%) |
| $75,000 to $99,999 | 7 (100.0%) | 0 (0.0%) |
| $100,000 and over | 111 (100.0%) | 0 (0.0%) |
Public vs Private Health Insurance Coverage by Age in Penelope
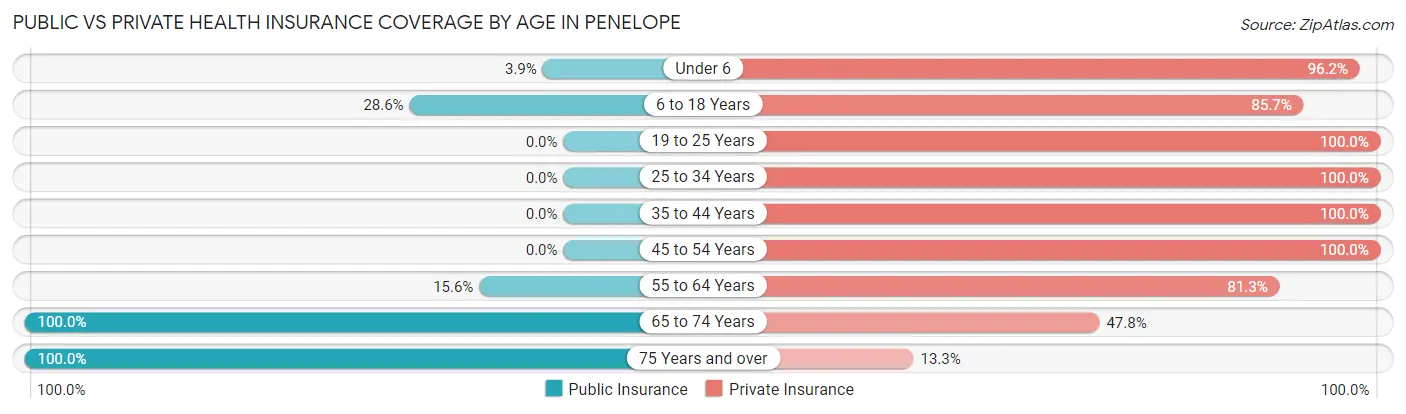
| Age Bracket | Public Insurance | Private Insurance |
| Under 6 | 1 (3.8%) | 25 (96.2%) |
| 6 to 18 Years | 12 (28.6%) | 36 (85.7%) |
| 19 to 25 Years | 0 (0.0%) | 6 (100.0%) |
| 25 to 34 Years | 0 (0.0%) | 25 (100.0%) |
| 35 to 44 Years | 0 (0.0%) | 33 (100.0%) |
| 45 to 54 Years | 0 (0.0%) | 17 (100.0%) |
| 55 to 64 Years | 5 (15.6%) | 26 (81.2%) |
| 65 to 74 Years | 23 (100.0%) | 11 (47.8%) |
| 75 Years and over | 30 (100.0%) | 4 (13.3%) |
| Total | 71 (30.3%) | 183 (78.2%) |
Disability Status by Sex by Age in Penelope
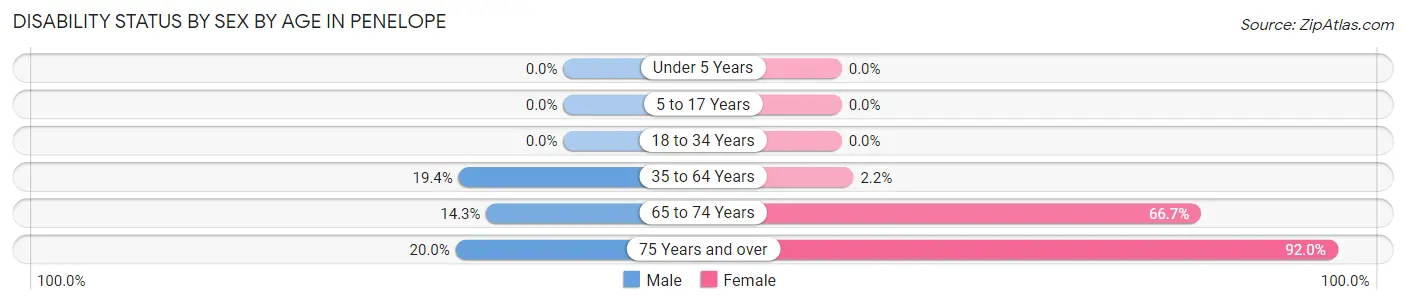
| Age Bracket | Male | Female |
| Under 5 Years | 0 (0.0%) | 0 (0.0%) |
| 5 to 17 Years | 0 (0.0%) | 0 (0.0%) |
| 18 to 34 Years | 0 (0.0%) | 0 (0.0%) |
| 35 to 64 Years | 7 (19.4%) | 1 (2.2%) |
| 65 to 74 Years | 2 (14.3%) | 6 (66.7%) |
| 75 Years and over | 1 (20.0%) | 23 (92.0%) |
Disability Class by Sex by Age in Penelope
Disability Class: Hearing Difficulty
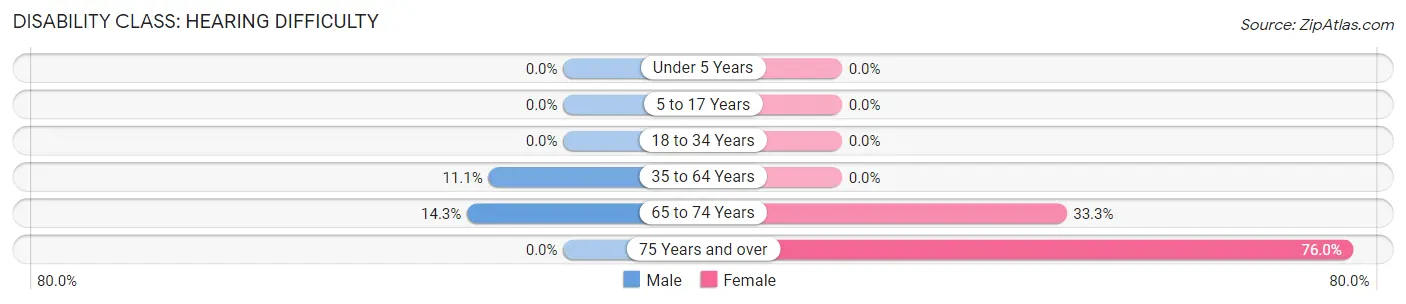
| Age Bracket | Male | Female |
| Under 5 Years | 0 (0.0%) | 0 (0.0%) |
| 5 to 17 Years | 0 (0.0%) | 0 (0.0%) |
| 18 to 34 Years | 0 (0.0%) | 0 (0.0%) |
| 35 to 64 Years | 4 (11.1%) | 0 (0.0%) |
| 65 to 74 Years | 2 (14.3%) | 3 (33.3%) |
| 75 Years and over | 0 (0.0%) | 19 (76.0%) |
Disability Class: Vision Difficulty
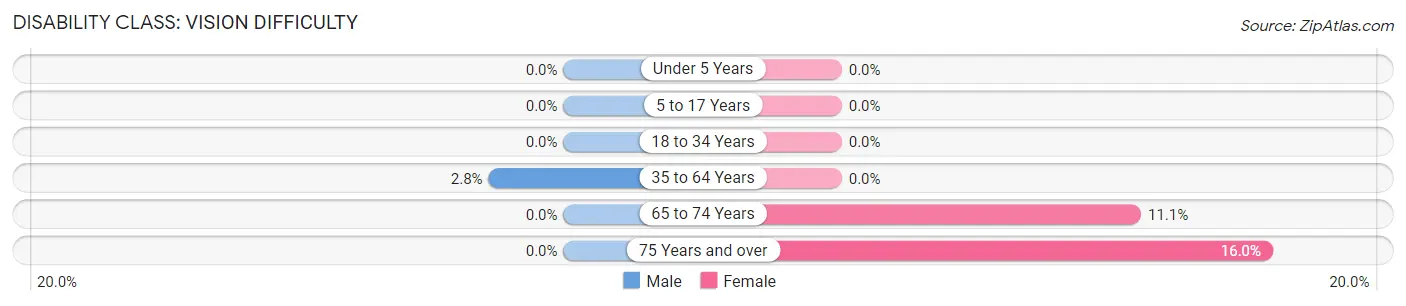
| Age Bracket | Male | Female |
| Under 5 Years | 0 (0.0%) | 0 (0.0%) |
| 5 to 17 Years | 0 (0.0%) | 0 (0.0%) |
| 18 to 34 Years | 0 (0.0%) | 0 (0.0%) |
| 35 to 64 Years | 1 (2.8%) | 0 (0.0%) |
| 65 to 74 Years | 0 (0.0%) | 1 (11.1%) |
| 75 Years and over | 0 (0.0%) | 4 (16.0%) |
Disability Class: Cognitive Difficulty
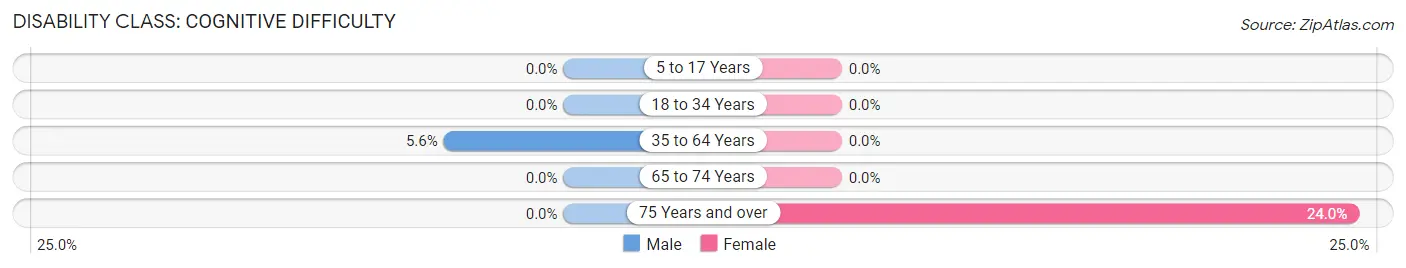
| Age Bracket | Male | Female |
| 5 to 17 Years | 0 (0.0%) | 0 (0.0%) |
| 18 to 34 Years | 0 (0.0%) | 0 (0.0%) |
| 35 to 64 Years | 2 (5.6%) | 0 (0.0%) |
| 65 to 74 Years | 0 (0.0%) | 0 (0.0%) |
| 75 Years and over | 0 (0.0%) | 6 (24.0%) |
Disability Class: Ambulatory Difficulty
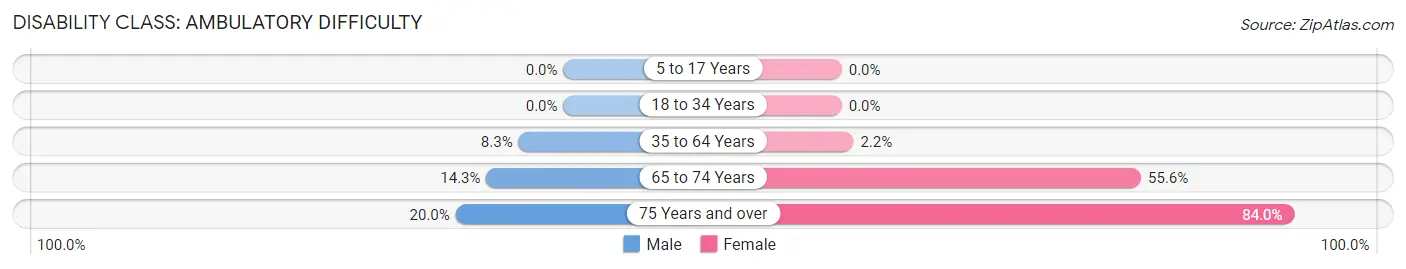
| Age Bracket | Male | Female |
| 5 to 17 Years | 0 (0.0%) | 0 (0.0%) |
| 18 to 34 Years | 0 (0.0%) | 0 (0.0%) |
| 35 to 64 Years | 3 (8.3%) | 1 (2.2%) |
| 65 to 74 Years | 2 (14.3%) | 5 (55.6%) |
| 75 Years and over | 1 (20.0%) | 21 (84.0%) |
Disability Class: Self-Care Difficulty
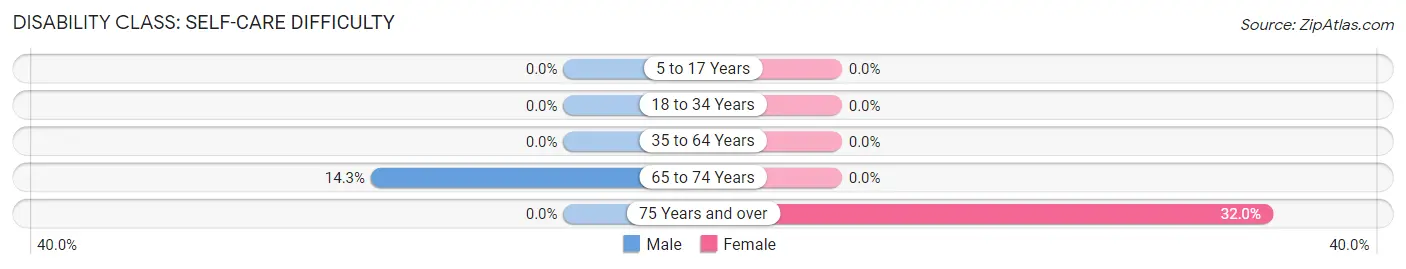
| Age Bracket | Male | Female |
| 5 to 17 Years | 0 (0.0%) | 0 (0.0%) |
| 18 to 34 Years | 0 (0.0%) | 0 (0.0%) |
| 35 to 64 Years | 0 (0.0%) | 0 (0.0%) |
| 65 to 74 Years | 2 (14.3%) | 0 (0.0%) |
| 75 Years and over | 0 (0.0%) | 8 (32.0%) |
Technology Access in Penelope
Computing Device Access in Penelope
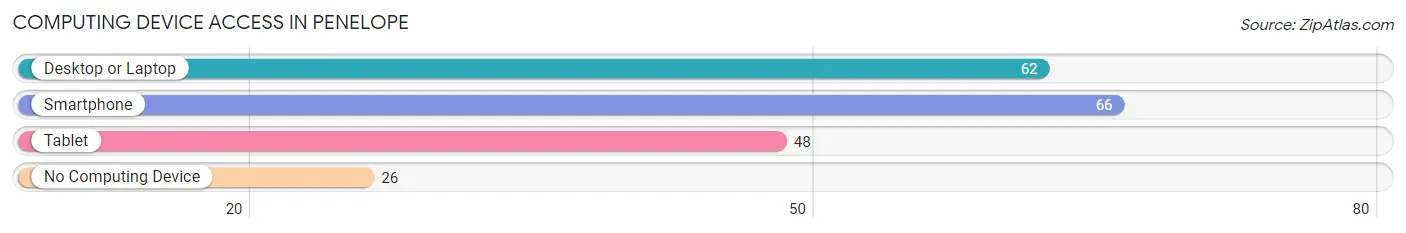
| Device Type | # Households | % Households |
| Desktop or Laptop | 62 | 67.4% |
| Smartphone | 66 | 71.7% |
| Tablet | 48 | 52.2% |
| No Computing Device | 26 | 28.3% |
| Total | 92 | 100.0% |
Internet Access in Penelope
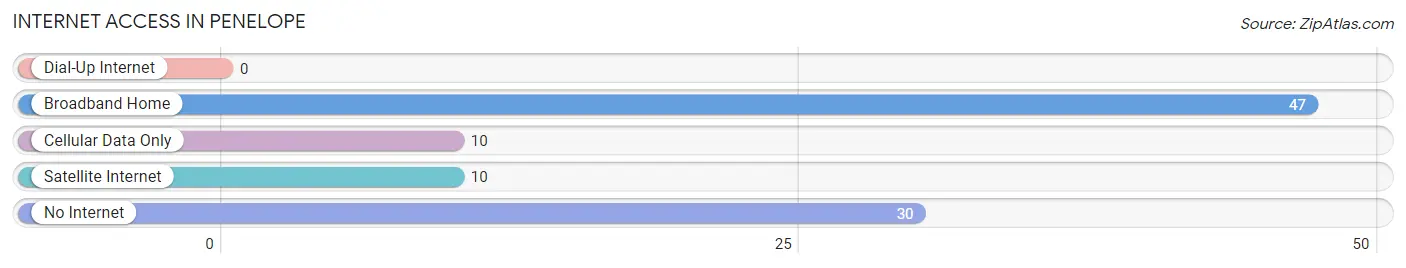
| Internet Type | # Households | % Households |
| Dial-Up Internet | 0 | 0.0% |
| Broadband Home | 47 | 51.1% |
| Cellular Data Only | 10 | 10.9% |
| Satellite Internet | 10 | 10.9% |
| No Internet | 30 | 32.6% |
| Total | 92 | 100.0% |
Penelope Summary
Penelope, Texas is a small town located in Hill County, Texas. It is situated about 25 miles south of Waco and about 50 miles north of Austin. The population of Penelope was estimated to be around 500 people in 2000.
Penelope was founded in 1881 by a group of settlers from the nearby town of Hillsboro. The town was named after Penelope, the wife of Odysseus in Greek mythology. The town was originally a farming community, but it soon became a center for the production of cotton and other agricultural products.
Geographically, Penelope is located in the rolling hills of Hill County. The town is situated on the banks of the Brazos River, which provides a source of water for the town and its surrounding area. The town is surrounded by farmland and is home to a variety of wildlife, including deer, wild turkeys, and other animals.
The economy of Penelope is largely based on agriculture. The town is home to several farms, which produce cotton, corn, wheat, and other crops. The town also has a few small businesses, including a grocery store, a hardware store, and a few restaurants.
The demographics of Penelope are largely rural. The majority of the population is white, with a small percentage of African Americans and Hispanics. The median household income in Penelope is around $30,000, which is lower than the national average. The town has a high rate of poverty, with nearly one-third of the population living below the poverty line.
Penelope is served by the Penelope Independent School District, which consists of two elementary schools, one middle school, and one high school. The town also has a library, a post office, and a few churches.
Penelope is a small town with a rich history and a unique culture. It is a great place to live and work, and it offers a variety of activities and attractions for visitors. The town is a great place to raise a family, and it is a great place to visit for those looking for a quiet, rural getaway.
Common Questions
What is Per Capita Income in Penelope?
Per Capita income in Penelope is $29,117.
What is the Median Family Income in Penelope?
Median Family Income in Penelope is $101,250.
What is the Median Household income in Penelope?
Median Household Income in Penelope is $55,000.
What is Income or Wage Gap in Penelope?
Income or Wage Gap in Penelope is 9.0%.
Women in Penelope earn 91.0 cents for every dollar earned by a man.
What is Inequality or Gini Index in Penelope?
Inequality or Gini Index in Penelope is 0.43.
What is the Total Population of Penelope?
Total Population of Penelope is 234.
What is the Total Male Population of Penelope?
Total Male Population of Penelope is 98.
What is the Total Female Population of Penelope?
Total Female Population of Penelope is 136.
What is the Ratio of Males per 100 Females in Penelope?
There are 72.06 Males per 100 Females in Penelope.
What is the Ratio of Females per 100 Males in Penelope?
There are 138.78 Females per 100 Males in Penelope.
What is the Median Population Age in Penelope?
Median Population Age in Penelope is 41.5 Years.
What is the Average Family Size in Penelope
Average Family Size in Penelope is 3.4 People.
What is the Average Household Size in Penelope
Average Household Size in Penelope is 2.5 People.
How Large is the Labor Force in Penelope?
There are 104 People in the Labor Forcein in Penelope.
What is the Percentage of People in the Labor Force in Penelope?
61.2% of People are in the Labor Force in Penelope.
What is the Unemployment Rate in Penelope?
Unemployment Rate in Penelope is 2.9%.