Palmer, TX Map & Demographics
Palmer Map
Palmer Overview
$10,293
PER CAPITA INCOME
$51,284
AVG FAMILY INCOME
$50,338
AVG HOUSEHOLD INCOME
8.9%
WAGE / INCOME GAP [ % ]
91.1¢/ $1
WAGE / INCOME GAP [ $ ]
0.32
INEQUALITY / GINI INDEX
1,523
TOTAL POPULATION
608
MALE POPULATION
915
FEMALE POPULATION
66.45
MALES / 100 FEMALES
150.49
FEMALES / 100 MALES
18.5
MEDIAN AGE
4.4
AVG FAMILY SIZE
4.3
AVG HOUSEHOLD SIZE
473
LABOR FORCE [ PEOPLE ]
49.1%
PERCENT IN LABOR FORCE
Palmer Zip Codes
Income in Palmer
Income Overview in Palmer
Per Capita Income in Palmer is $10,293, while median incomes of families and households are $51,284 and $50,338 respectively.
| Characteristic | Number | Measure |
| Per Capita Income | 1,523 | $10,293 |
| Median Family Income | 326 | $51,284 |
| Mean Family Income | 326 | $49,440 |
| Median Household Income | 354 | $50,338 |
| Mean Household Income | 354 | $47,436 |
| Income Deficit | 326 | $0 |
| Wage / Income Gap (%) | 1,523 | 8.94% |
| Wage / Income Gap ($) | 1,523 | 91.06¢ per $1 |
| Gini / Inequality Index | 1,523 | 0.32 |
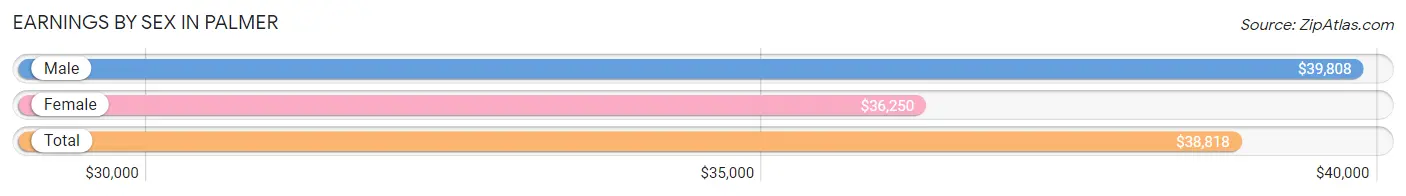
Earnings by Sex in Palmer
Average Earnings in Palmer are $38,818, $39,808 for men and $36,250 for women, a difference of 8.9%.
| Sex | Number | Average Earnings |
| Male | 253 (49.3%) | $39,808 |
| Female | 260 (50.7%) | $36,250 |
| Total | 513 (100.0%) | $38,818 |
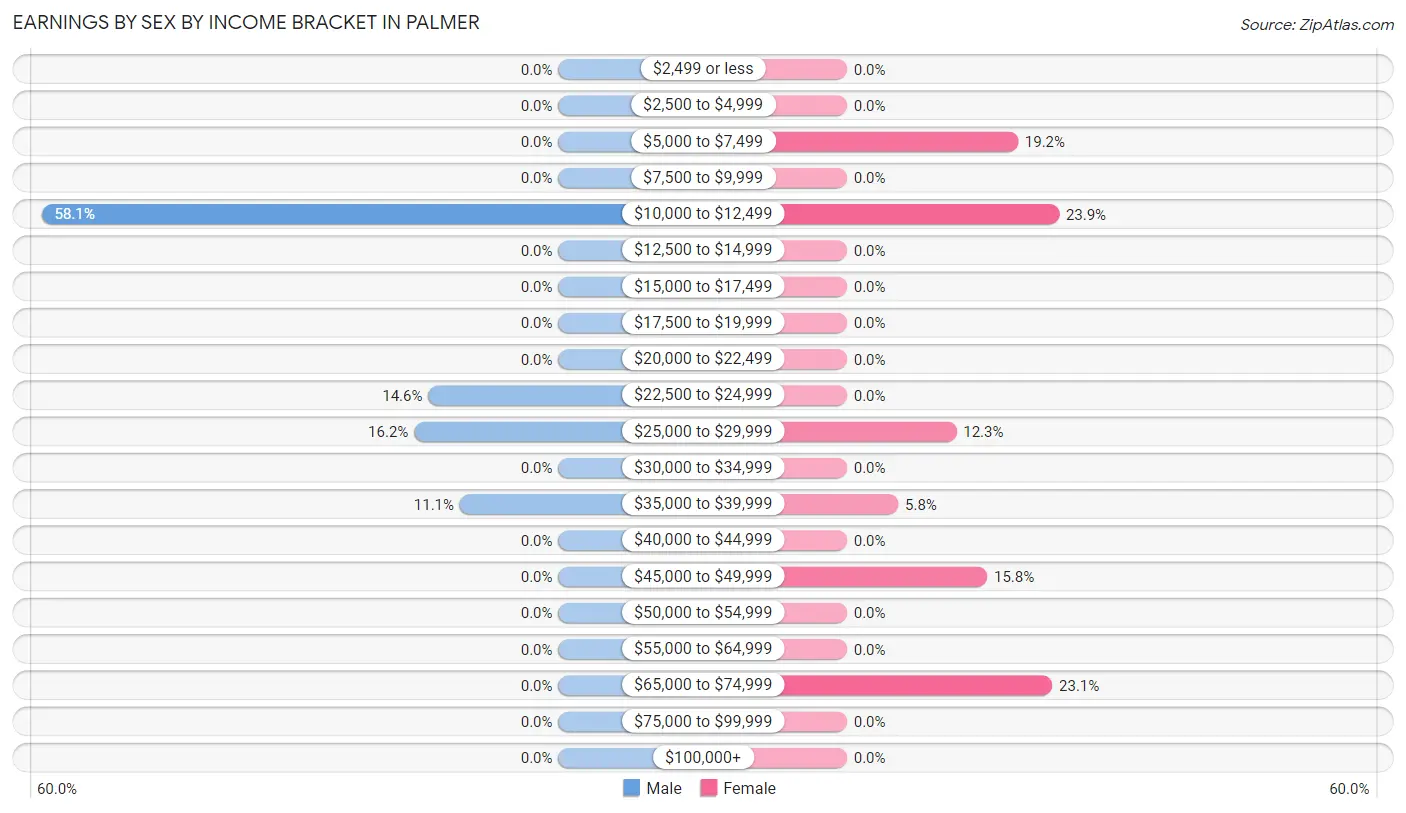
Earnings by Sex by Income Bracket in Palmer
The most common earnings brackets in Palmer are $10,000 to $12,499 for men (147 | 58.1%) and $10,000 to $12,499 for women (62 | 23.8%).
| Income | Male | Female |
| $2,499 or less | 0 (0.0%) | 0 (0.0%) |
| $2,500 to $4,999 | 0 (0.0%) | 0 (0.0%) |
| $5,000 to $7,499 | 0 (0.0%) | 50 (19.2%) |
| $7,500 to $9,999 | 0 (0.0%) | 0 (0.0%) |
| $10,000 to $12,499 | 147 (58.1%) | 62 (23.8%) |
| $12,500 to $14,999 | 0 (0.0%) | 0 (0.0%) |
| $15,000 to $17,499 | 0 (0.0%) | 0 (0.0%) |
| $17,500 to $19,999 | 0 (0.0%) | 0 (0.0%) |
| $20,000 to $22,499 | 0 (0.0%) | 0 (0.0%) |
| $22,500 to $24,999 | 37 (14.6%) | 0 (0.0%) |
| $25,000 to $29,999 | 41 (16.2%) | 32 (12.3%) |
| $30,000 to $34,999 | 0 (0.0%) | 0 (0.0%) |
| $35,000 to $39,999 | 28 (11.1%) | 15 (5.8%) |
| $40,000 to $44,999 | 0 (0.0%) | 0 (0.0%) |
| $45,000 to $49,999 | 0 (0.0%) | 41 (15.8%) |
| $50,000 to $54,999 | 0 (0.0%) | 0 (0.0%) |
| $55,000 to $64,999 | 0 (0.0%) | 0 (0.0%) |
| $65,000 to $74,999 | 0 (0.0%) | 60 (23.1%) |
| $75,000 to $99,999 | 0 (0.0%) | 0 (0.0%) |
| $100,000+ | 0 (0.0%) | 0 (0.0%) |
| Total | 253 (100.0%) | 260 (100.0%) |
Earnings by Sex by Educational Attainment in Palmer
| Educational Attainment | Male Income | Female Income |
| Less than High School | - | - |
| High School Diploma | - | - |
| College or Associate's Degree | - | - |
| Bachelor's Degree | - | - |
| Graduate Degree | - | - |
| Total | - | - |
Family Income in Palmer
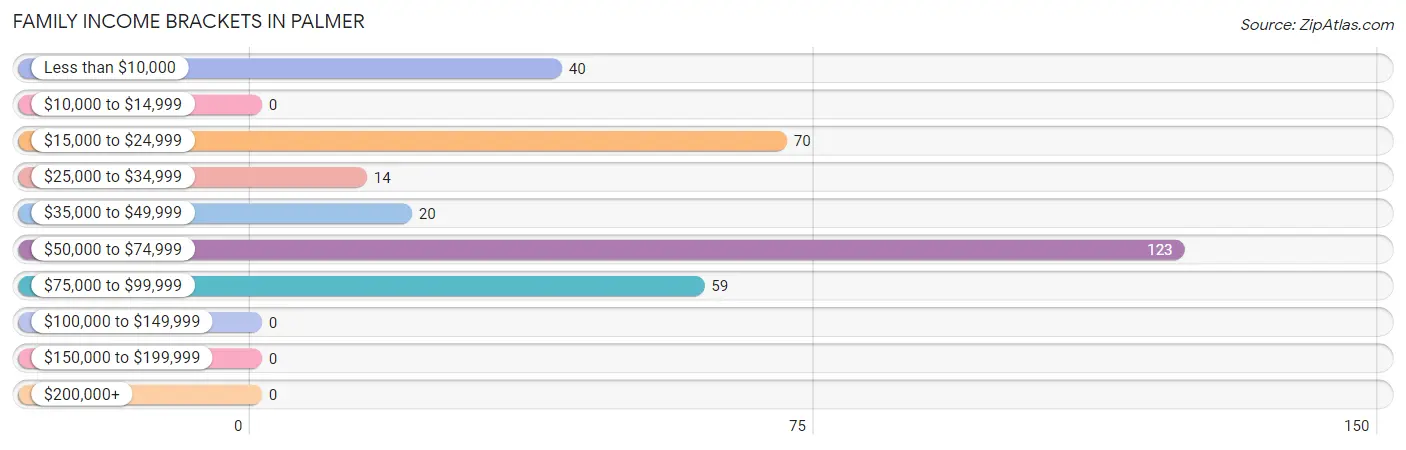
Family Income Brackets in Palmer
According to the Palmer family income data, there are 123 families falling into the $50,000 to $74,999 income range, which is the most common income bracket and makes up 37.7% of all families.
| Income Bracket | # Families | % Families |
| Less than $10,000 | 40 | 12.3% |
| $10,000 to $14,999 | 0 | 0.0% |
| $15,000 to $24,999 | 70 | 21.5% |
| $25,000 to $34,999 | 14 | 4.3% |
| $35,000 to $49,999 | 20 | 6.1% |
| $50,000 to $74,999 | 123 | 37.7% |
| $75,000 to $99,999 | 59 | 18.1% |
| $100,000 to $149,999 | 0 | 0.0% |
| $150,000 to $199,999 | 0 | 0.0% |
| $200,000+ | 0 | 0.0% |
Family Income by Famaliy Size in Palmer
| Income Bracket | # Families | Median Income |
| 2-Person Families | 22 (6.8%) | $0 |
| 3-Person Families | 0 (0.0%) | $0 |
| 4-Person Families | 247 (75.8%) | $0 |
| 5-Person Families | 10 (3.1%) | $0 |
| 6-Person Families | 0 (0.0%) | $0 |
| 7+ Person Families | 47 (14.4%) | $0 |
| Total | 326 (100.0%) | $51,284 |
Family Income by Number of Earners in Palmer
| Number of Earners | # Families | Median Income |
| No Earners | 22 (6.8%) | $0 |
| 1 Earner | 146 (44.8%) | $0 |
| 2 Earners | 158 (48.5%) | $0 |
| 3+ Earners | 0 (0.0%) | $0 |
| Total | 326 (100.0%) | $51,284 |
Household Income in Palmer
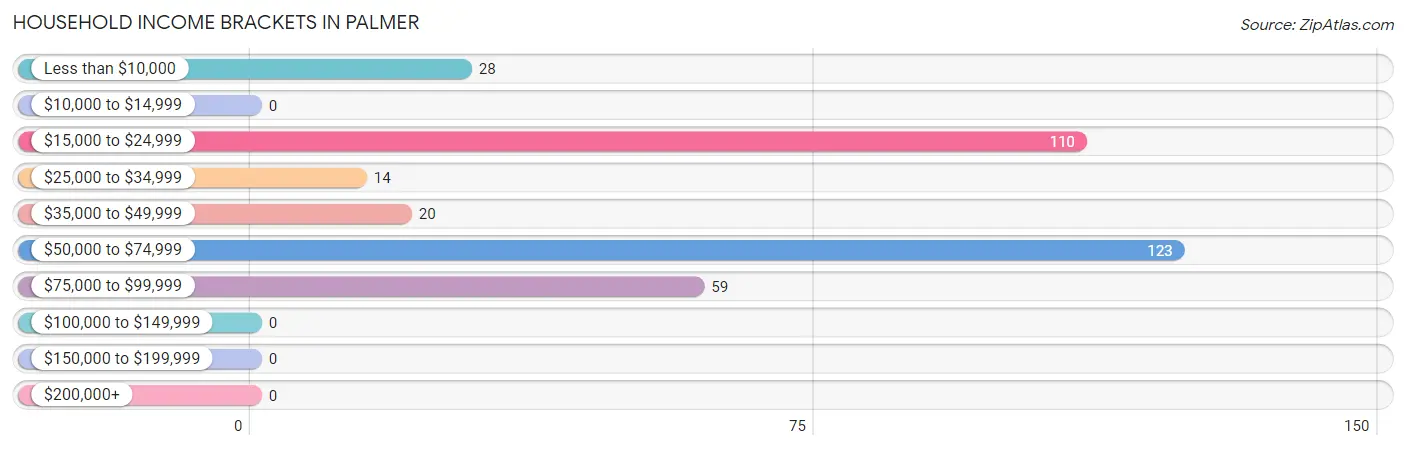
Household Income Brackets in Palmer
With 123 households falling in the category, the $50,000 to $74,999 income range is the most frequent in Palmer, accounting for 34.7% of all households.
| Income Bracket | # Households | % Households |
| Less than $10,000 | 28 | 7.9% |
| $10,000 to $14,999 | 0 | 0.0% |
| $15,000 to $24,999 | 110 | 31.1% |
| $25,000 to $34,999 | 14 | 4.0% |
| $35,000 to $49,999 | 20 | 5.6% |
| $50,000 to $74,999 | 123 | 34.7% |
| $75,000 to $99,999 | 59 | 16.7% |
| $100,000 to $149,999 | 0 | 0.0% |
| $150,000 to $199,999 | 0 | 0.0% |
| $200,000+ | 0 | 0.0% |
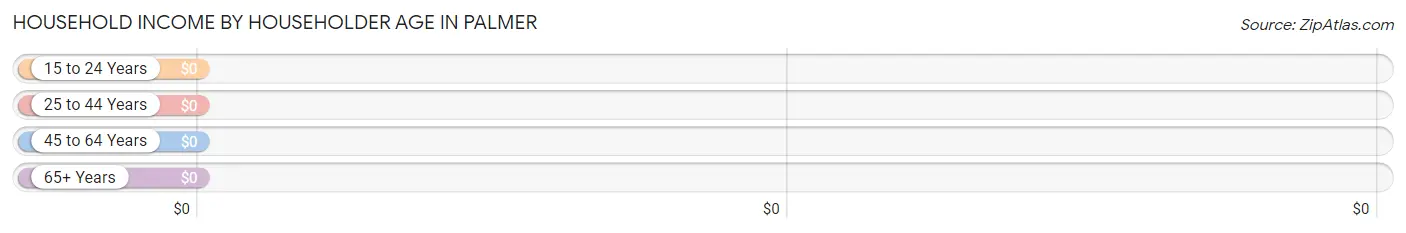
Household Income by Householder Age in Palmer
| Income Bracket | # Households | Median Income |
| 15 to 24 Years | 86 (24.3%) | $0 |
| 25 to 44 Years | 171 (48.3%) | $0 |
| 45 to 64 Years | 37 (10.4%) | $0 |
| 65+ Years | 60 (17.0%) | $0 |
| Total | 354 (100.0%) | $50,338 |
Poverty in Palmer
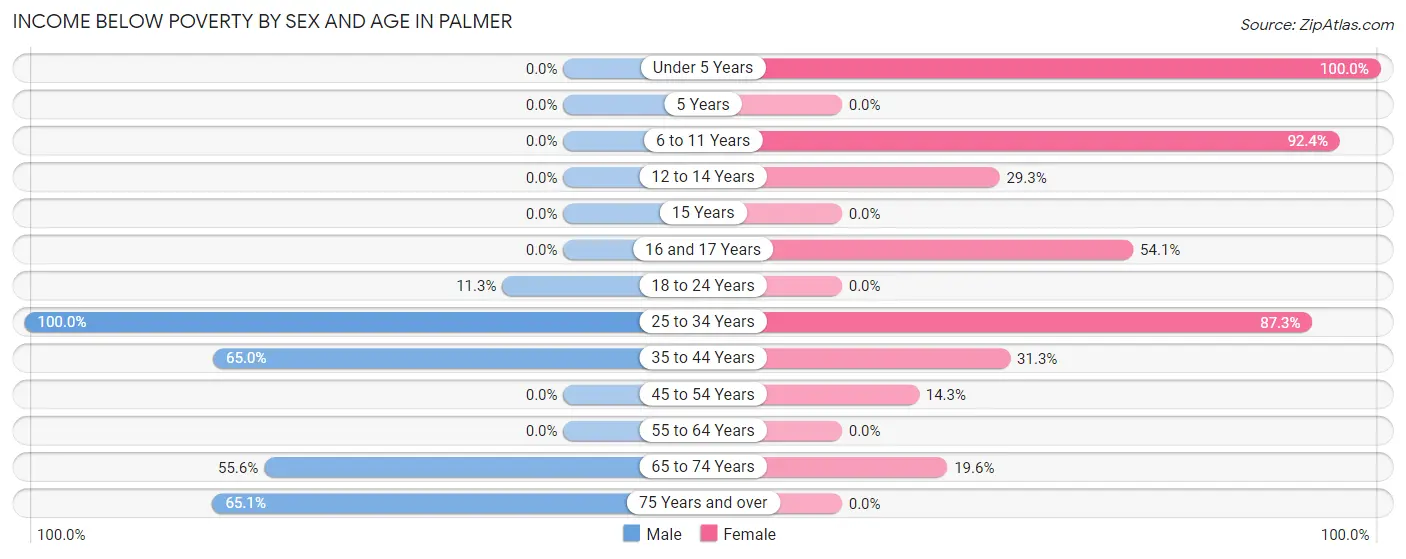
Income Below Poverty by Sex and Age in Palmer
With 32.2% poverty level for males and 48.3% for females among the residents of Palmer, 25 to 34 year old males and under 5 year old females are the most vulnerable to poverty, with 95 males (100.0%) and 98 females (100.0%) in their respective age groups living below the poverty level.
| Age Bracket | Male | Female |
| Under 5 Years | 0 (0.0%) | 98 (100.0%) |
| 5 Years | 0 (0.0%) | 0 (0.0%) |
| 6 to 11 Years | 0 (0.0%) | 122 (92.4%) |
| 12 to 14 Years | 0 (0.0%) | 48 (29.3%) |
| 15 Years | 0 (0.0%) | 0 (0.0%) |
| 16 and 17 Years | 0 (0.0%) | 53 (54.1%) |
| 18 to 24 Years | 11 (11.3%) | 0 (0.0%) |
| 25 to 34 Years | 95 (100.0%) | 62 (87.3%) |
| 35 to 44 Years | 52 (65.0%) | 40 (31.2%) |
| 45 to 54 Years | 0 (0.0%) | 10 (14.3%) |
| 55 to 64 Years | 0 (0.0%) | 0 (0.0%) |
| 65 to 74 Years | 10 (55.6%) | 9 (19.6%) |
| 75 Years and over | 28 (65.1%) | 0 (0.0%) |
| Total | 196 (32.2%) | 442 (48.3%) |
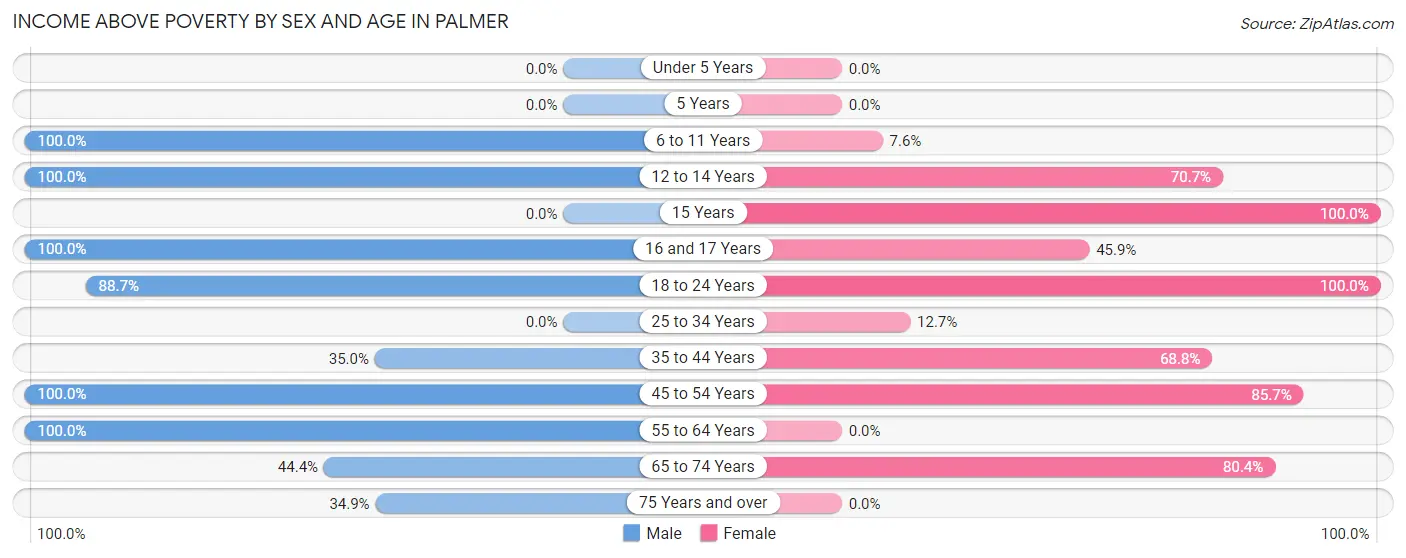
Income Above Poverty by Sex and Age in Palmer
According to the poverty statistics in Palmer, males aged 6 to 11 years and females aged 15 years are the age groups that are most secure financially, with 100.0% of males and 100.0% of females in these age groups living above the poverty line.
| Age Bracket | Male | Female |
| Under 5 Years | 0 (0.0%) | 0 (0.0%) |
| 5 Years | 0 (0.0%) | 0 (0.0%) |
| 6 to 11 Years | 81 (100.0%) | 10 (7.6%) |
| 12 to 14 Years | 59 (100.0%) | 116 (70.7%) |
| 15 Years | 0 (0.0%) | 25 (100.0%) |
| 16 and 17 Years | 57 (100.0%) | 45 (45.9%) |
| 18 to 24 Years | 86 (88.7%) | 83 (100.0%) |
| 25 to 34 Years | 0 (0.0%) | 9 (12.7%) |
| 35 to 44 Years | 28 (35.0%) | 88 (68.8%) |
| 45 to 54 Years | 37 (100.0%) | 60 (85.7%) |
| 55 to 64 Years | 41 (100.0%) | 0 (0.0%) |
| 65 to 74 Years | 8 (44.4%) | 37 (80.4%) |
| 75 Years and over | 15 (34.9%) | 0 (0.0%) |
| Total | 412 (67.8%) | 473 (51.7%) |
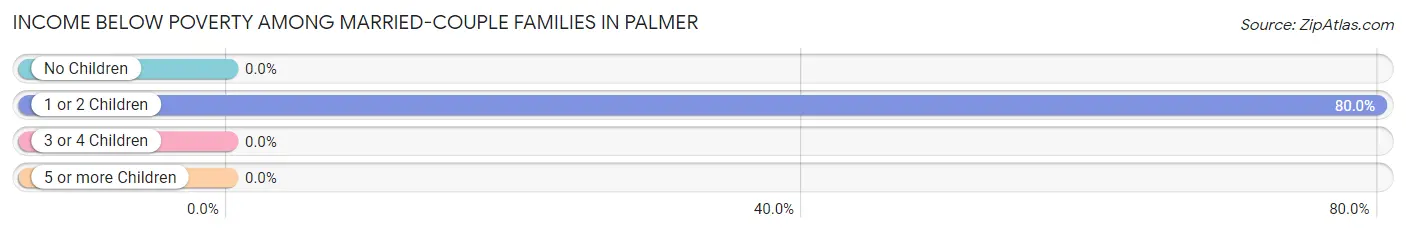
Income Below Poverty Among Married-Couple Families in Palmer
The poverty statistics for married-couple families in Palmer show that 45.3% or 72 of the total 159 families live below the poverty line. Families with 1 or 2 children have the highest poverty rate of 80.0%, comprising of 72 families. On the other hand, families with no children have the lowest poverty rate of 0.0%, which includes 0 families.
| Children | Above Poverty | Below Poverty |
| No Children | 22 (100.0%) | 0 (0.0%) |
| 1 or 2 Children | 18 (20.0%) | 72 (80.0%) |
| 3 or 4 Children | 0 (0.0%) | 0 (0.0%) |
| 5 or more Children | 47 (100.0%) | 0 (0.0%) |
| Total | 87 (54.7%) | 72 (45.3%) |
Income Below Poverty Among Single-Parent Households in Palmer
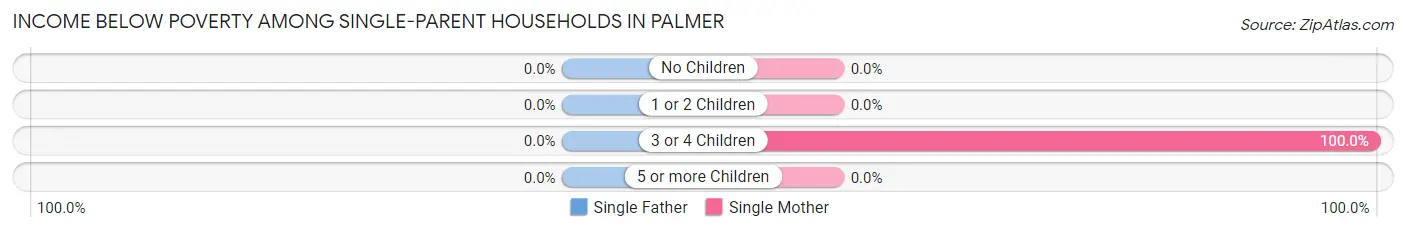
| Children | Single Father | Single Mother |
| No Children | 0 (0.0%) | 0 (0.0%) |
| 1 or 2 Children | 0 (0.0%) | 0 (0.0%) |
| 3 or 4 Children | 0 (0.0%) | 40 (100.0%) |
| 5 or more Children | 0 (0.0%) | 0 (0.0%) |
| Total | 0 (0.0%) | 40 (49.4%) |
Income Below Poverty Among Married-Couple vs Single-Parent Households in Palmer
The poverty data for Palmer shows that 72 of the married-couple family households (45.3%) and 40 of the single-parent households (23.9%) are living below the poverty level. Within the married-couple family households, those with 1 or 2 children have the highest poverty rate, with 72 households (80.0%) falling below the poverty line. Among the single-parent households, those with 3 or 4 children have the highest poverty rate, with 40 household (100.0%) living below poverty.
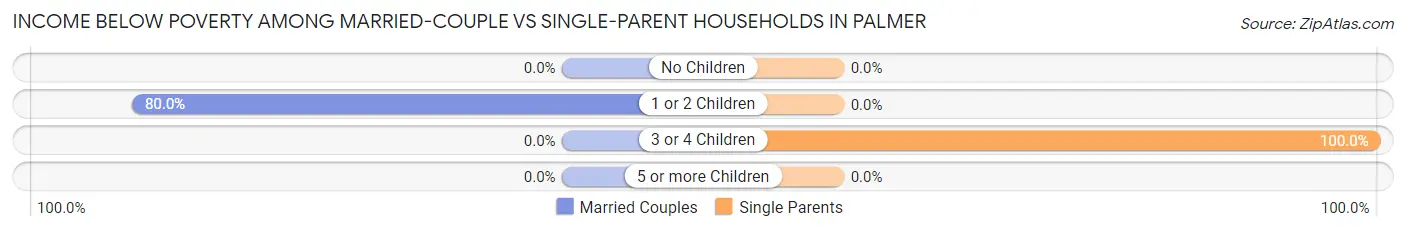
| Children | Married-Couple Families | Single-Parent Households |
| No Children | 0 (0.0%) | 0 (0.0%) |
| 1 or 2 Children | 72 (80.0%) | 0 (0.0%) |
| 3 or 4 Children | 0 (0.0%) | 40 (100.0%) |
| 5 or more Children | 0 (0.0%) | 0 (0.0%) |
| Total | 72 (45.3%) | 40 (23.9%) |
Race in Palmer
The most populous races in Palmer are Hispanic or Latino (1,523 | 100.0%), White / Caucasian (1,008 | 66.2%), and Two or more Races (449 | 29.5%).
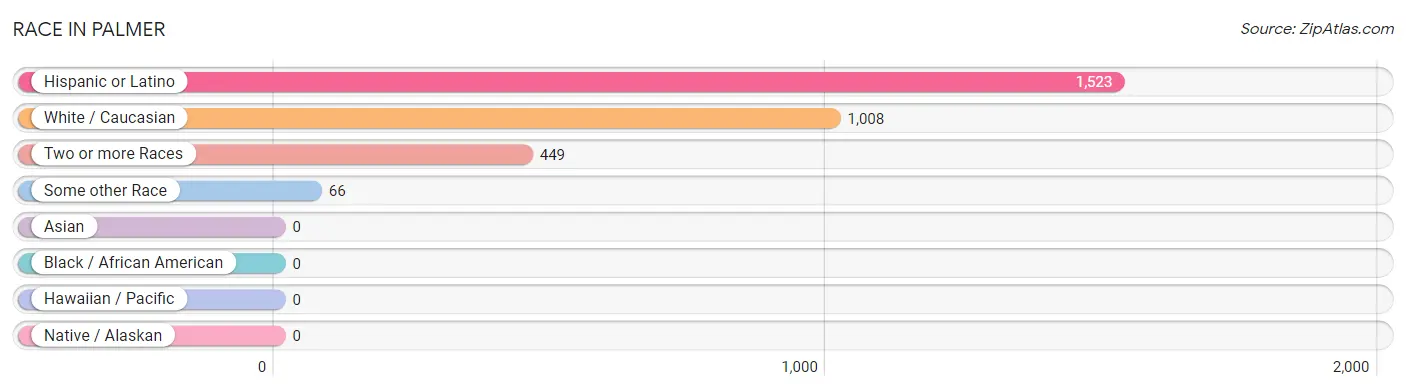
| Race | # Population | % Population |
| Asian | 0 | 0.0% |
| Black / African American | 0 | 0.0% |
| Hawaiian / Pacific | 0 | 0.0% |
| Hispanic or Latino | 1,523 | 100.0% |
| Native / Alaskan | 0 | 0.0% |
| White / Caucasian | 1,008 | 66.2% |
| Two or more Races | 449 | 29.5% |
| Some other Race | 66 | 4.3% |
| Total | 1,523 | 100.0% |
Ancestry in Palmer
The most populous ancestries reported in Palmer are Mexican (1,523 | 100.0%), and American (180 | 11.8%), together accounting for 111.8% of all Palmer residents.
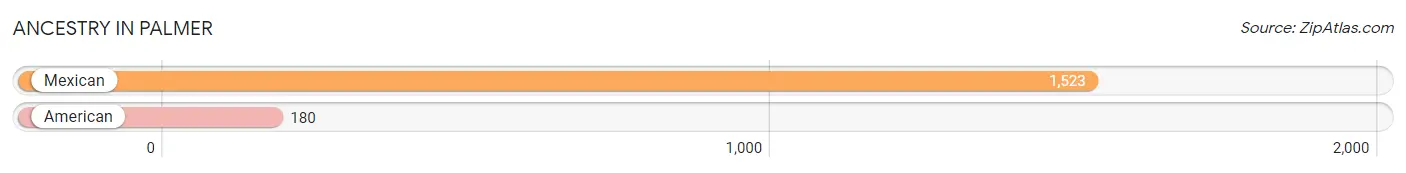
| Ancestry | # Population | % Population |
| American | 180 | 11.8% |
| Mexican | 1,523 | 100.0% | View All 2 Rows |
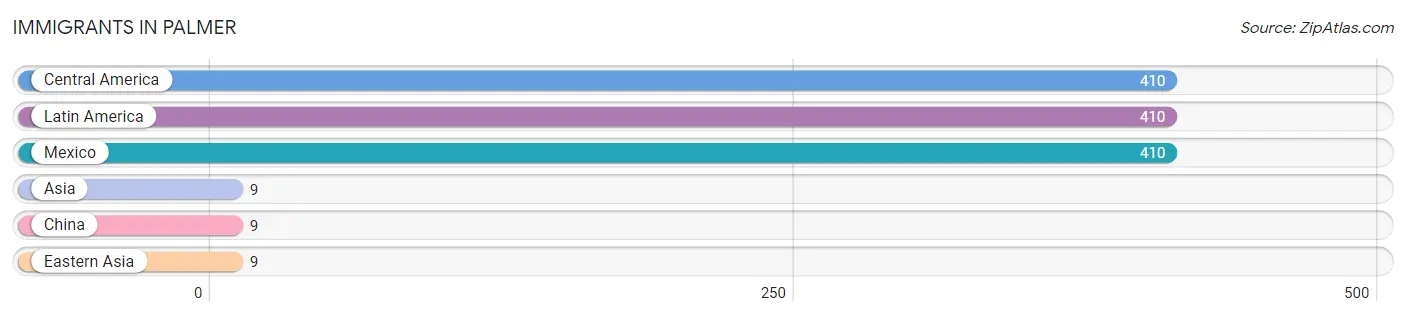
Immigrants in Palmer
The most numerous immigrant groups reported in Palmer came from Central America (410 | 26.9%), Latin America (410 | 26.9%), Mexico (410 | 26.9%), Asia (9 | 0.6%), and China (9 | 0.6%), together accounting for 81.9% of all Palmer residents.
| Immigration Origin | # Population | % Population |
| Asia | 9 | 0.6% |
| Central America | 410 | 26.9% |
| China | 9 | 0.6% |
| Eastern Asia | 9 | 0.6% |
| Latin America | 410 | 26.9% |
| Mexico | 410 | 26.9% | View All 6 Rows |
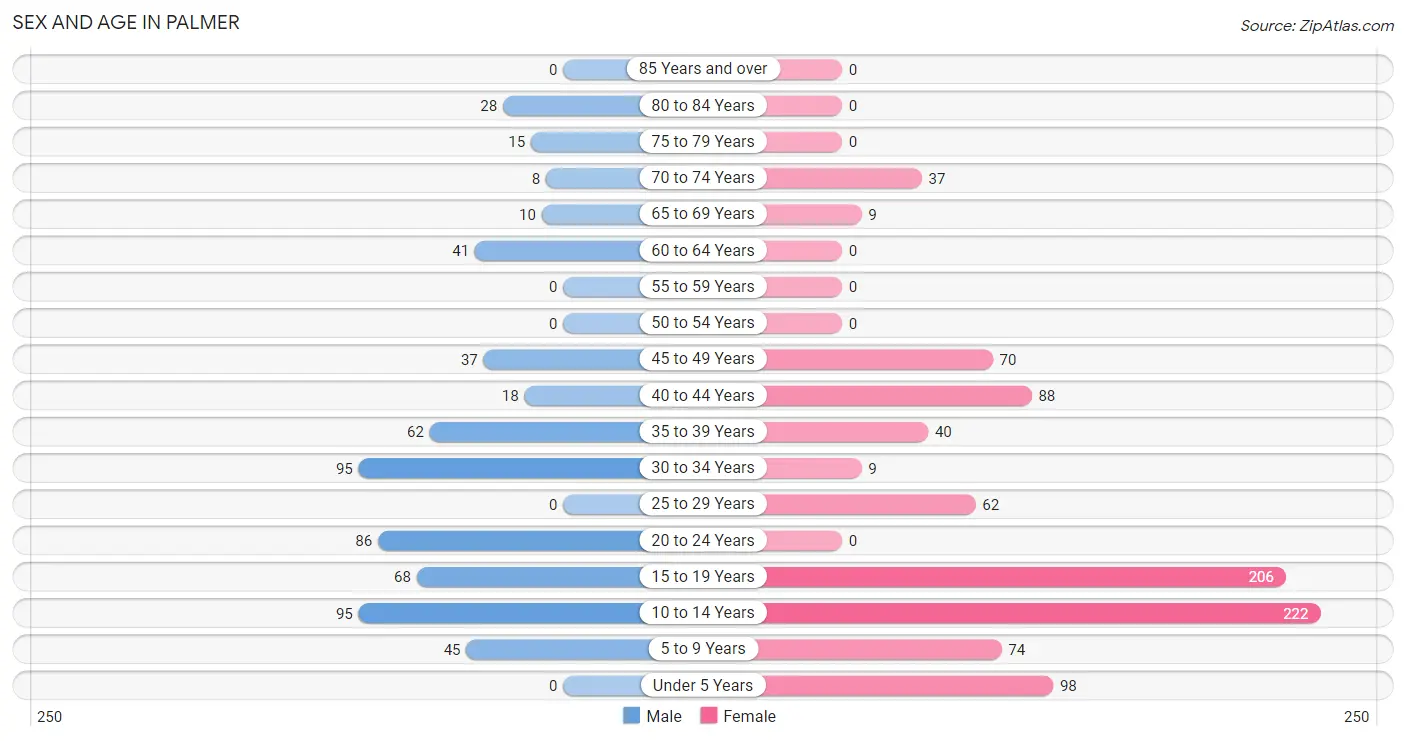
Sex and Age in Palmer
Sex and Age in Palmer
The most populous age groups in Palmer are 10 to 14 Years (95 | 15.6%) for men and 10 to 14 Years (222 | 24.3%) for women.
| Age Bracket | Male | Female |
| Under 5 Years | 0 (0.0%) | 98 (10.7%) |
| 5 to 9 Years | 45 (7.4%) | 74 (8.1%) |
| 10 to 14 Years | 95 (15.6%) | 222 (24.3%) |
| 15 to 19 Years | 68 (11.2%) | 206 (22.5%) |
| 20 to 24 Years | 86 (14.1%) | 0 (0.0%) |
| 25 to 29 Years | 0 (0.0%) | 62 (6.8%) |
| 30 to 34 Years | 95 (15.6%) | 9 (1.0%) |
| 35 to 39 Years | 62 (10.2%) | 40 (4.4%) |
| 40 to 44 Years | 18 (3.0%) | 88 (9.6%) |
| 45 to 49 Years | 37 (6.1%) | 70 (7.6%) |
| 50 to 54 Years | 0 (0.0%) | 0 (0.0%) |
| 55 to 59 Years | 0 (0.0%) | 0 (0.0%) |
| 60 to 64 Years | 41 (6.7%) | 0 (0.0%) |
| 65 to 69 Years | 10 (1.6%) | 9 (1.0%) |
| 70 to 74 Years | 8 (1.3%) | 37 (4.0%) |
| 75 to 79 Years | 15 (2.5%) | 0 (0.0%) |
| 80 to 84 Years | 28 (4.6%) | 0 (0.0%) |
| 85 Years and over | 0 (0.0%) | 0 (0.0%) |
| Total | 608 (100.0%) | 915 (100.0%) |
Families and Households in Palmer
Median Family Size in Palmer
The median family size in Palmer is 4.43 persons per family, with married-couple families (159 | 48.8%) accounting for the largest median family size of 5.05 persons per family. On the other hand, single male/father families (86 | 26.4%) represent the smallest median family size with 3.15 persons per family.
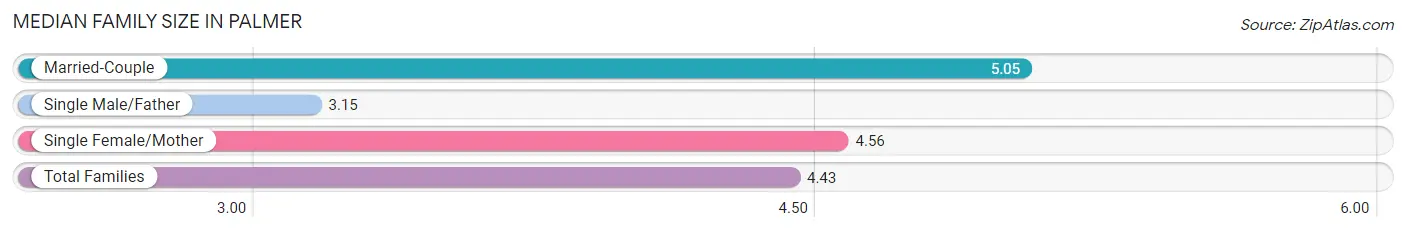
| Family Type | # Families | Family Size |
| Married-Couple | 159 (48.8%) | 5.05 |
| Single Male/Father | 86 (26.4%) | 3.15 |
| Single Female/Mother | 81 (24.8%) | 4.56 |
| Total Families | 326 (100.0%) | 4.43 |
Median Household Size in Palmer
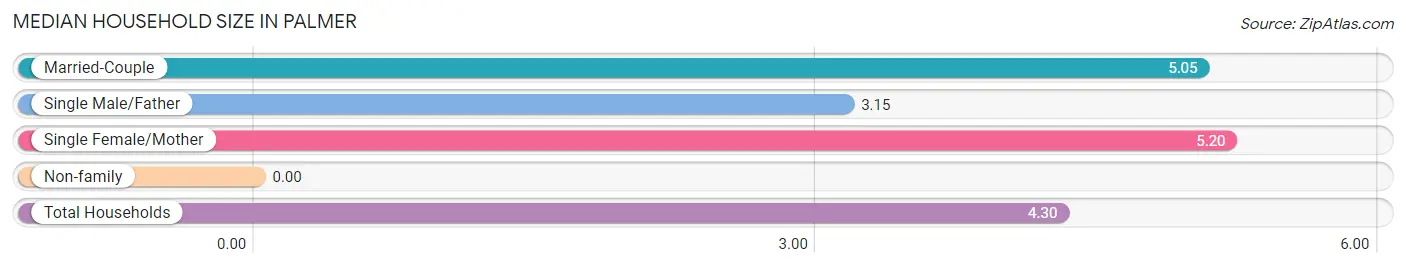
| Household Type | # Households | Household Size |
| Married-Couple | 159 (44.9%) | 5.05 |
| Single Male/Father | 86 (24.3%) | 3.15 |
| Single Female/Mother | 81 (22.9%) | 5.20 |
| Non-family | 28 (7.9%) | - |
| Total Households | 354 (100.0%) | 4.30 |
Household Size by Marriage Status in Palmer
Out of a total of 354 households in Palmer, 326 (92.1%) are family households, while 28 (7.9%) are nonfamily households. The most numerous type of family households are 4-person households, comprising 207, and the most common type of nonfamily households are 1-person households, comprising 28.
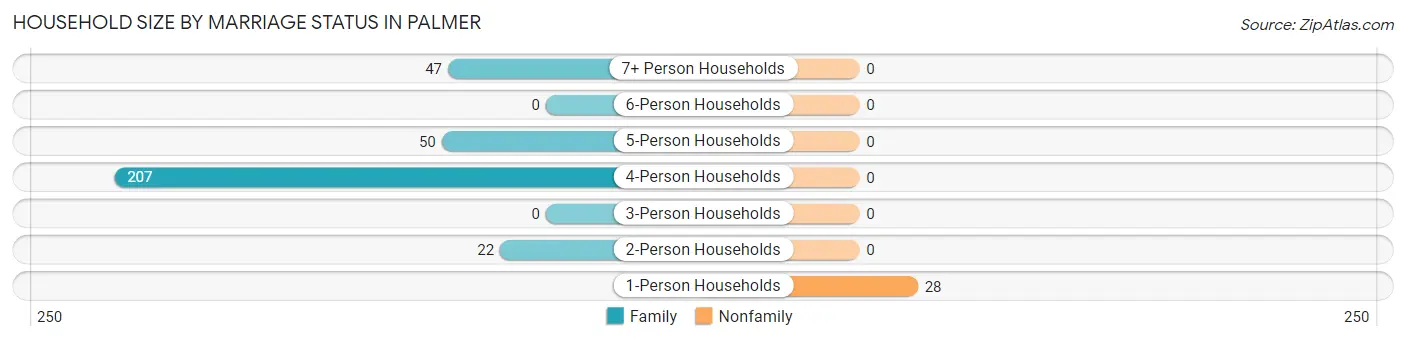
| Household Size | Family Households | Nonfamily Households |
| 1-Person Households | - | 28 (7.9%) |
| 2-Person Households | 22 (6.2%) | 0 (0.0%) |
| 3-Person Households | 0 (0.0%) | 0 (0.0%) |
| 4-Person Households | 207 (58.5%) | 0 (0.0%) |
| 5-Person Households | 50 (14.1%) | 0 (0.0%) |
| 6-Person Households | 0 (0.0%) | 0 (0.0%) |
| 7+ Person Households | 47 (13.3%) | 0 (0.0%) |
| Total | 326 (92.1%) | 28 (7.9%) |
Female Fertility in Palmer
Fertility by Age in Palmer
| Age Bracket | Women with Births | Births / 1,000 Women |
| 15 to 19 years | 0 (0.0%) | 0.0 |
| 20 to 34 years | 0 (0.0%) | 0.0 |
| 35 to 50 years | 0 (0.0%) | 0.0 |
| Total | 0 (0.0%) | 0.0 |
Fertility by Age by Marriage Status in Palmer
| Age Bracket | Married | Unmarried |
| 15 to 19 years | 0 (0.0%) | 0 (0.0%) |
| 20 to 34 years | 0 (0.0%) | 0 (0.0%) |
| 35 to 50 years | 0 (0.0%) | 0 (0.0%) |
| Total | 0 (0.0%) | 0 (0.0%) |
Fertility by Education in Palmer
| Educational Attainment | Women with Births | Births / 1,000 Women |
| Less than High School | 0 (0.0%) | 0.0 |
| High School Diploma | 0 (0.0%) | 0.0 |
| College or Associate's Degree | 0 (0.0%) | 0.0 |
| Bachelor's Degree | 0 (0.0%) | 0.0 |
| Graduate Degree | 0 (0.0%) | 0.0 |
| Total | 0 (0.0%) | 0.0 |
Fertility by Education by Marriage Status in Palmer
| Educational Attainment | Married | Unmarried |
| Less than High School | 0 (0.0%) | 0 (0.0%) |
| High School Diploma | 0 (0.0%) | 0 (0.0%) |
| College or Associate's Degree | 0 (0.0%) | 0 (0.0%) |
| Bachelor's Degree | 0 (0.0%) | 0 (0.0%) |
| Graduate Degree | 0 (0.0%) | 0 (0.0%) |
| Total | 0 (0.0%) | 0 (0.0%) |
Employment Characteristics in Palmer
Employment by Class of Employer in Palmer
Among the 473 employed individuals in Palmer, private company employees (228 | 48.2%), self-employed (not incorporated) (157 | 33.2%), and local government employees (88 | 18.6%) make up the most common classes of employment.
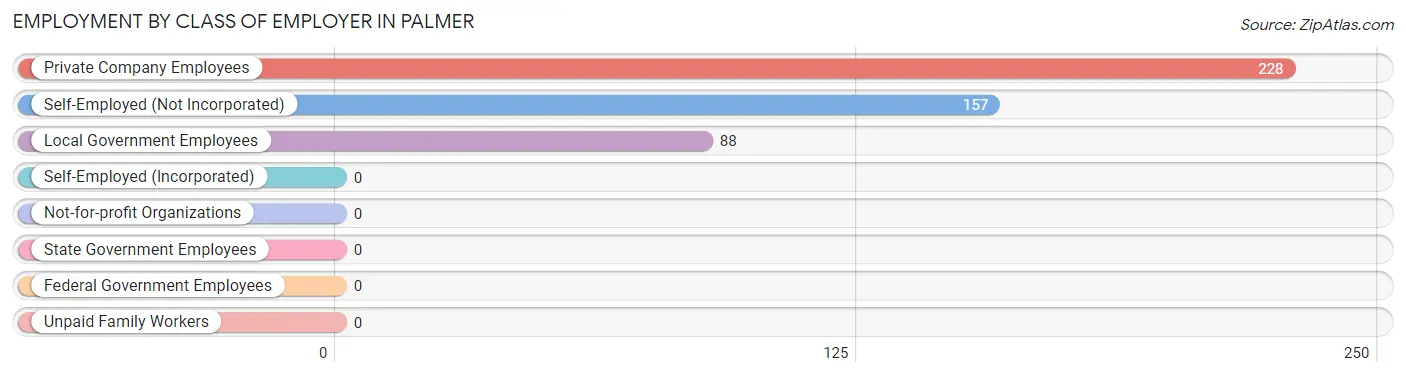
| Employer Class | # Employees | % Employees |
| Private Company Employees | 228 | 48.2% |
| Self-Employed (Incorporated) | 0 | 0.0% |
| Self-Employed (Not Incorporated) | 157 | 33.2% |
| Not-for-profit Organizations | 0 | 0.0% |
| Local Government Employees | 88 | 18.6% |
| State Government Employees | 0 | 0.0% |
| Federal Government Employees | 0 | 0.0% |
| Unpaid Family Workers | 0 | 0.0% |
| Total | 473 | 100.0% |
Employment Status by Age in Palmer
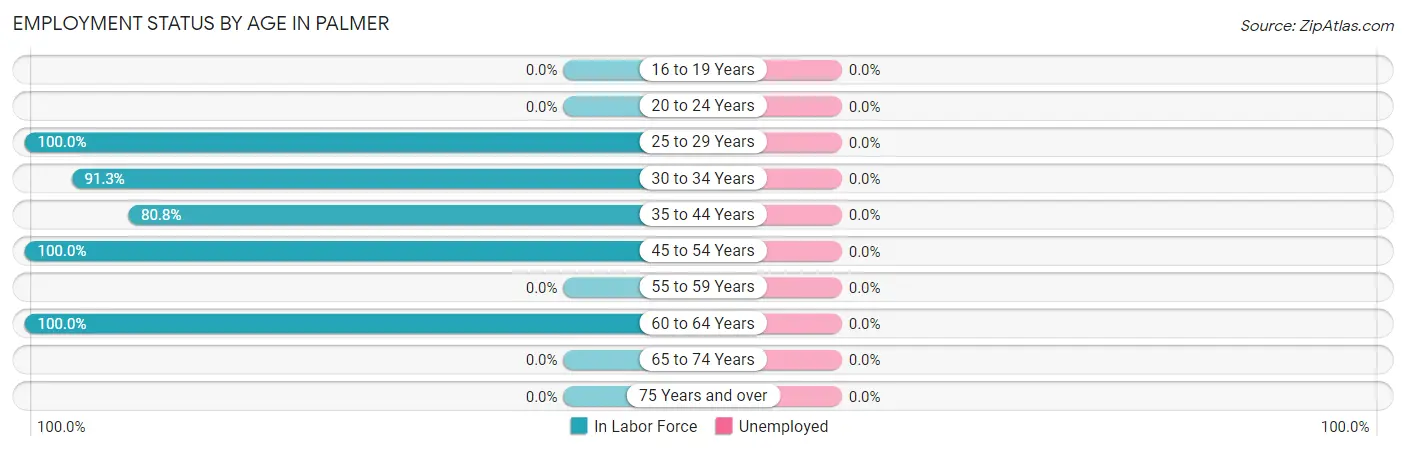
| Age Bracket | In Labor Force | Unemployed |
| 16 to 19 Years | 0 (0.0%) | 0 (0.0%) |
| 20 to 24 Years | 0 (0.0%) | 0 (0.0%) |
| 25 to 29 Years | 62 (100.0%) | 0 (0.0%) |
| 30 to 34 Years | 95 (91.3%) | 0 (0.0%) |
| 35 to 44 Years | 168 (80.8%) | 0 (0.0%) |
| 45 to 54 Years | 107 (100.0%) | 0 (0.0%) |
| 55 to 59 Years | 0 (0.0%) | 0 (0.0%) |
| 60 to 64 Years | 41 (100.0%) | 0 (0.0%) |
| 65 to 74 Years | 0 (0.0%) | 0 (0.0%) |
| 75 Years and over | 0 (0.0%) | 0 (0.0%) |
| Total | 473 (49.1%) | 0 (0.0%) |
Employment Status by Educational Attainment in Palmer
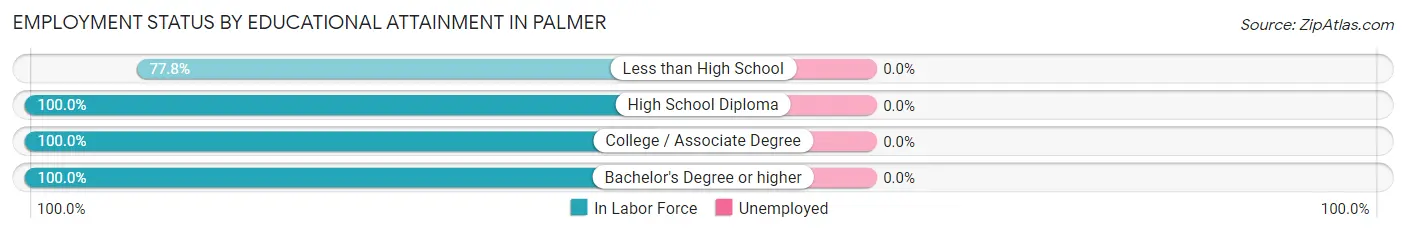
| Educational Attainment | In Labor Force | Unemployed |
| Less than High School | 172 (77.8%) | 0 (0.0%) |
| High School Diploma | 226 (100.0%) | 0 (0.0%) |
| College / Associate Degree | 15 (100.0%) | 0 (0.0%) |
| Bachelor's Degree or higher | 60 (100.0%) | 0 (0.0%) |
| Total | 473 (90.6%) | 0 (0.0%) |
Employment Occupations by Sex in Palmer
Management, Business, Science and Arts Occupations
Management, Business, Science and Arts Occupations by Sex
| Occupation | Male | Female |
| Management | 0 (0.0%) | 0 (0.0%) |
| Business & Financial | 0 (0.0%) | 0 (0.0%) |
| Computers, Engineering & Science | 0 (0.0%) | 0 (0.0%) |
| Computers & Mathematics | 0 (0.0%) | 0 (0.0%) |
| Architecture & Engineering | 0 (0.0%) | 0 (0.0%) |
| Life, Physical & Social Science | 0 (0.0%) | 0 (0.0%) |
| Community & Social Service | 0 (0.0%) | 0 (0.0%) |
| Education, Arts & Media | 0 (0.0%) | 0 (0.0%) |
| Legal Services & Support | 0 (0.0%) | 0 (0.0%) |
| Education Instruction & Library | 0 (0.0%) | 0 (0.0%) |
| Arts, Media & Entertainment | 0 (0.0%) | 0 (0.0%) |
| Health Diagnosing & Treating | 0 (0.0%) | 0 (0.0%) |
| Health Technologists | 0 (0.0%) | 0 (0.0%) |
| Total (Category) | 0 (0.0%) | 0 (0.0%) |
| Total (Overall) | 253 (53.5%) | 220 (46.5%) |
Services Occupations
The most common Services occupations in Palmer are Cleaning & Maintenance (99 | 20.9%), Healthcare Support (73 | 15.4%), and Food Preparation & Serving (62 | 13.1%).
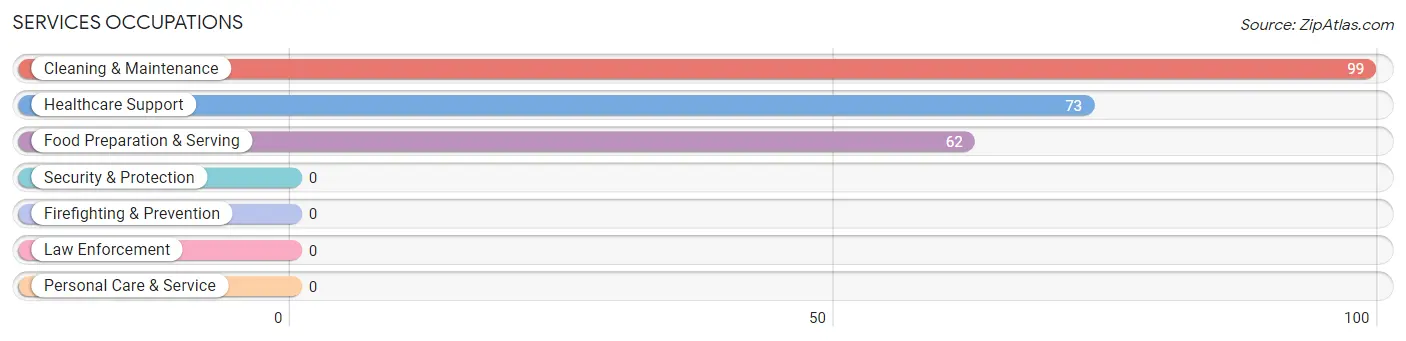
Services Occupations by Sex
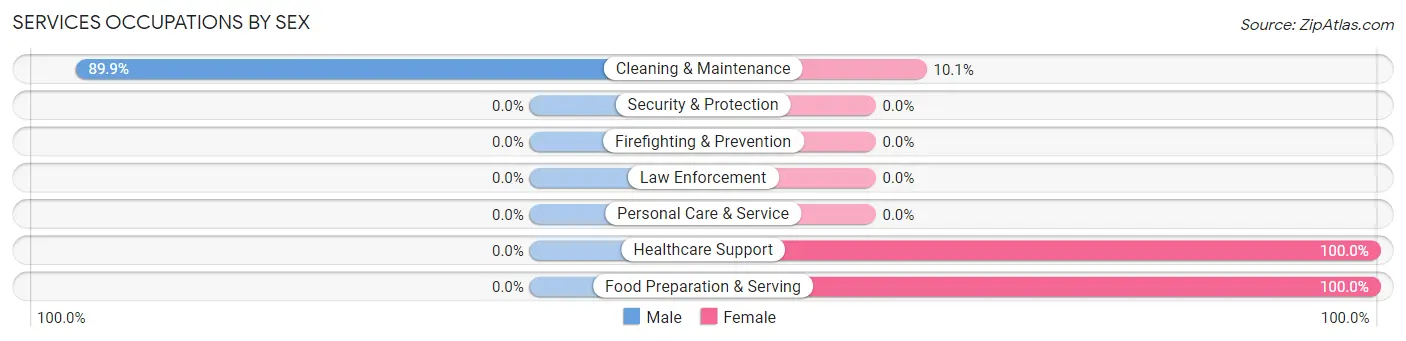
| Occupation | Male | Female |
| Healthcare Support | 0 (0.0%) | 73 (100.0%) |
| Security & Protection | 0 (0.0%) | 0 (0.0%) |
| Firefighting & Prevention | 0 (0.0%) | 0 (0.0%) |
| Law Enforcement | 0 (0.0%) | 0 (0.0%) |
| Food Preparation & Serving | 0 (0.0%) | 62 (100.0%) |
| Cleaning & Maintenance | 89 (89.9%) | 10 (10.1%) |
| Personal Care & Service | 0 (0.0%) | 0 (0.0%) |
| Total (Category) | 89 (38.0%) | 145 (62.0%) |
| Total (Overall) | 253 (53.5%) | 220 (46.5%) |
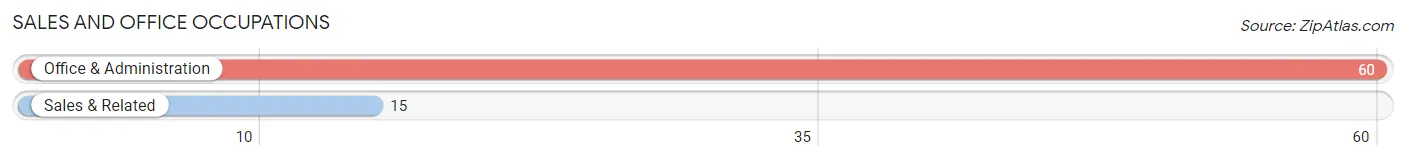
Sales and Office Occupations
The most common Sales and Office occupations in Palmer are Office & Administration (60 | 12.7%), and Sales & Related (15 | 3.2%).
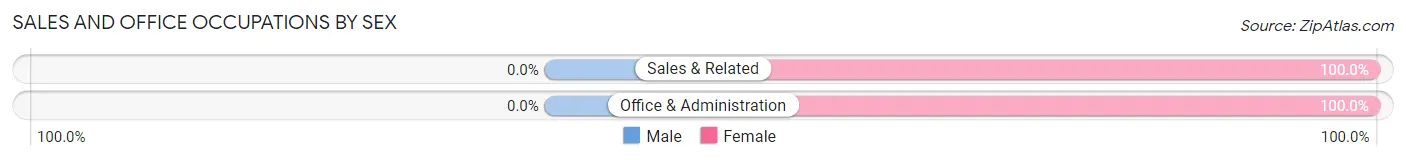
Sales and Office Occupations by Sex
| Occupation | Male | Female |
| Sales & Related | 0 (0.0%) | 15 (100.0%) |
| Office & Administration | 0 (0.0%) | 60 (100.0%) |
| Total (Category) | 0 (0.0%) | 75 (100.0%) |
| Total (Overall) | 253 (53.5%) | 220 (46.5%) |
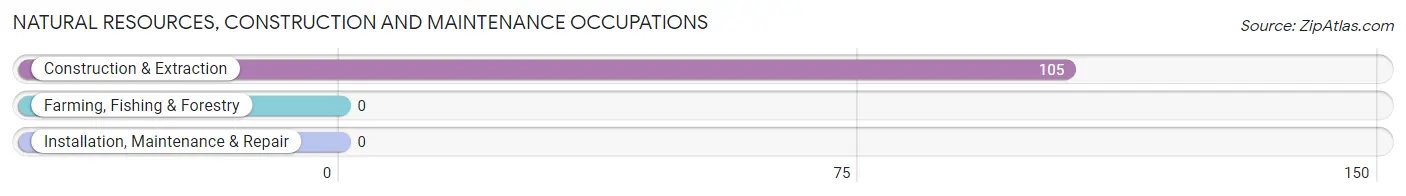
Natural Resources, Construction and Maintenance Occupations
The most common Natural Resources, Construction and Maintenance occupations in Palmer are , and Construction & Extraction (105 | 22.2%).
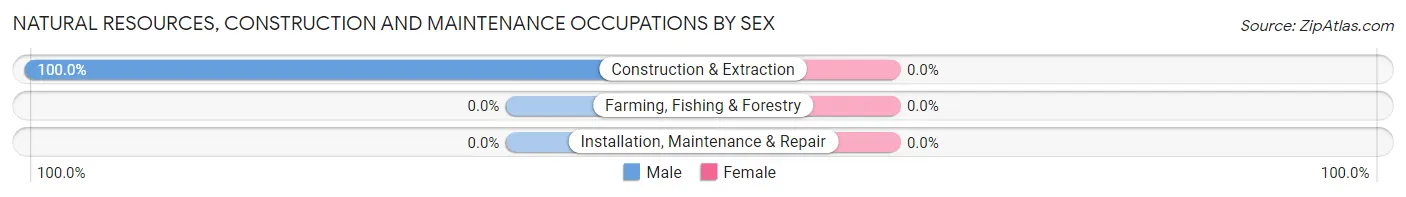
Natural Resources, Construction and Maintenance Occupations by Sex
| Occupation | Male | Female |
| Farming, Fishing & Forestry | 0 (0.0%) | 0 (0.0%) |
| Construction & Extraction | 105 (100.0%) | 0 (0.0%) |
| Installation, Maintenance & Repair | 0 (0.0%) | 0 (0.0%) |
| Total (Category) | 105 (100.0%) | 0 (0.0%) |
| Total (Overall) | 253 (53.5%) | 220 (46.5%) |
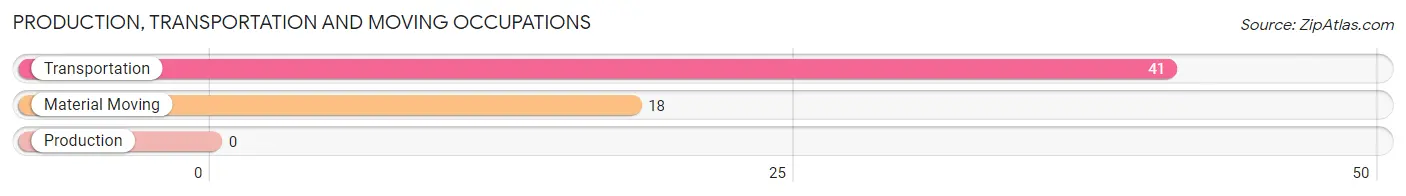
Production, Transportation and Moving Occupations
The most common Production, Transportation and Moving occupations in Palmer are Transportation (41 | 8.7%), and Material Moving (18 | 3.8%).
Production, Transportation and Moving Occupations by Sex
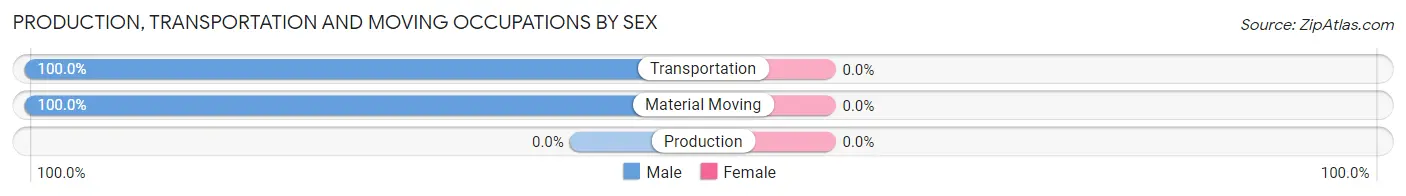
| Occupation | Male | Female |
| Production | 0 (0.0%) | 0 (0.0%) |
| Transportation | 41 (100.0%) | 0 (0.0%) |
| Material Moving | 18 (100.0%) | 0 (0.0%) |
| Total (Category) | 59 (100.0%) | 0 (0.0%) |
| Total (Overall) | 253 (53.5%) | 220 (46.5%) |
Employment Industries by Sex in Palmer
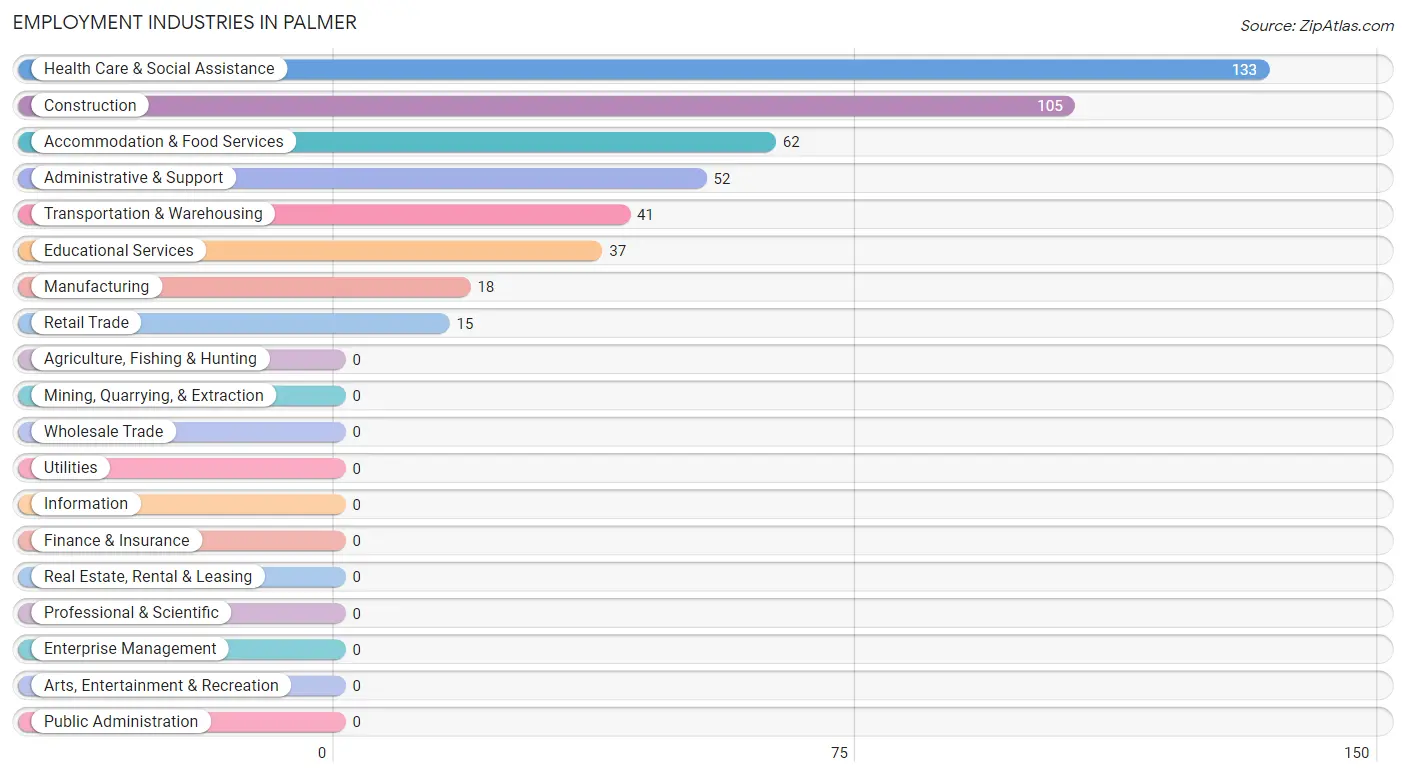
Employment Industries in Palmer
The major employment industries in Palmer include Health Care & Social Assistance (133 | 28.1%), Construction (105 | 22.2%), Accommodation & Food Services (62 | 13.1%), Administrative & Support (52 | 11.0%), and Transportation & Warehousing (41 | 8.7%).
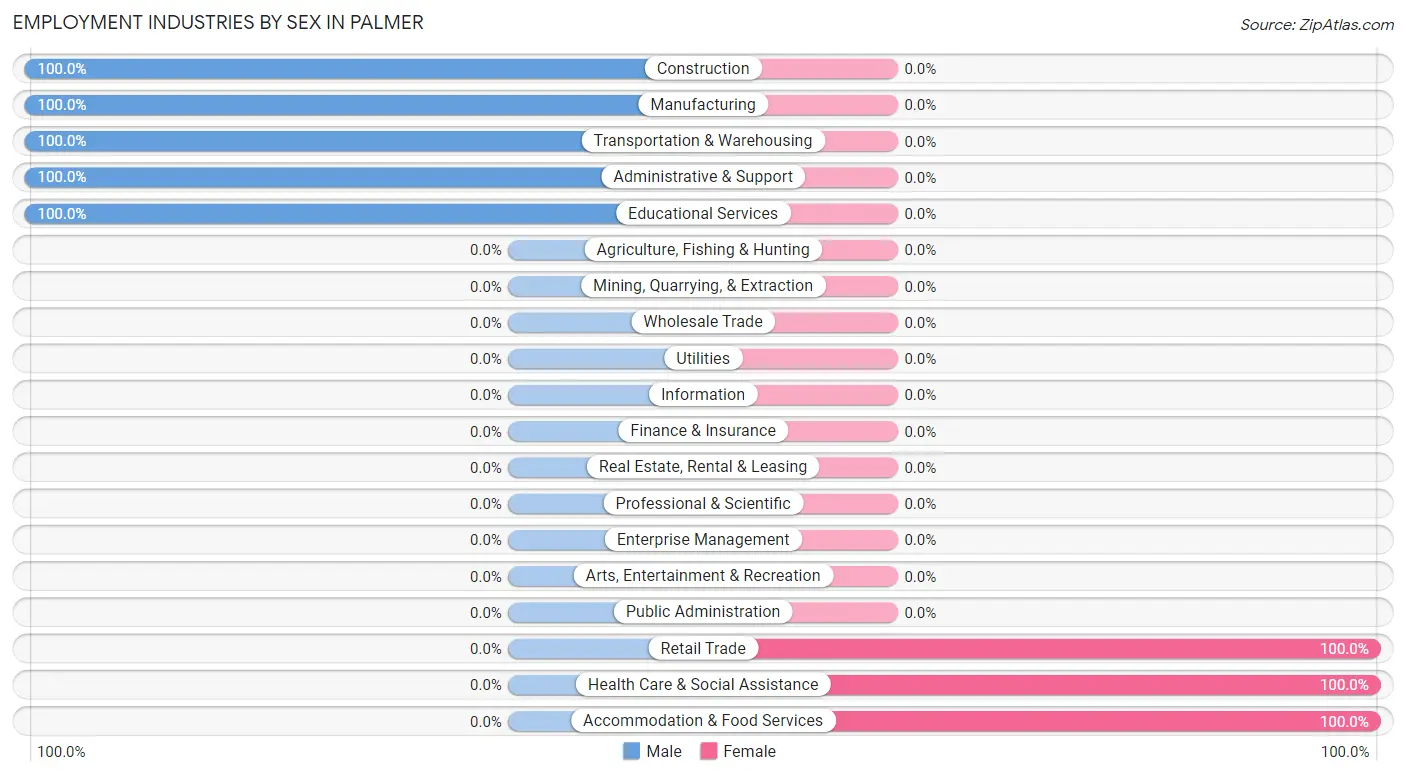
Employment Industries by Sex in Palmer
The Palmer industries that see more men than women are Construction (100.0%), Manufacturing (100.0%), and Transportation & Warehousing (100.0%), whereas the industries that tend to have a higher number of women are Retail Trade (100.0%), Health Care & Social Assistance (100.0%), and Accommodation & Food Services (100.0%).
| Industry | Male | Female |
| Agriculture, Fishing & Hunting | 0 (0.0%) | 0 (0.0%) |
| Mining, Quarrying, & Extraction | 0 (0.0%) | 0 (0.0%) |
| Construction | 105 (100.0%) | 0 (0.0%) |
| Manufacturing | 18 (100.0%) | 0 (0.0%) |
| Wholesale Trade | 0 (0.0%) | 0 (0.0%) |
| Retail Trade | 0 (0.0%) | 15 (100.0%) |
| Transportation & Warehousing | 41 (100.0%) | 0 (0.0%) |
| Utilities | 0 (0.0%) | 0 (0.0%) |
| Information | 0 (0.0%) | 0 (0.0%) |
| Finance & Insurance | 0 (0.0%) | 0 (0.0%) |
| Real Estate, Rental & Leasing | 0 (0.0%) | 0 (0.0%) |
| Professional & Scientific | 0 (0.0%) | 0 (0.0%) |
| Enterprise Management | 0 (0.0%) | 0 (0.0%) |
| Administrative & Support | 52 (100.0%) | 0 (0.0%) |
| Educational Services | 37 (100.0%) | 0 (0.0%) |
| Health Care & Social Assistance | 0 (0.0%) | 133 (100.0%) |
| Arts, Entertainment & Recreation | 0 (0.0%) | 0 (0.0%) |
| Accommodation & Food Services | 0 (0.0%) | 62 (100.0%) |
| Public Administration | 0 (0.0%) | 0 (0.0%) |
| Total | 253 (53.5%) | 220 (46.5%) |
Education in Palmer
School Enrollment in Palmer
The most common levels of schooling among the 710 students in Palmer are middle school (271 | 38.2%), high school (180 | 25.4%), and college / undergraduate (94 | 13.2%).
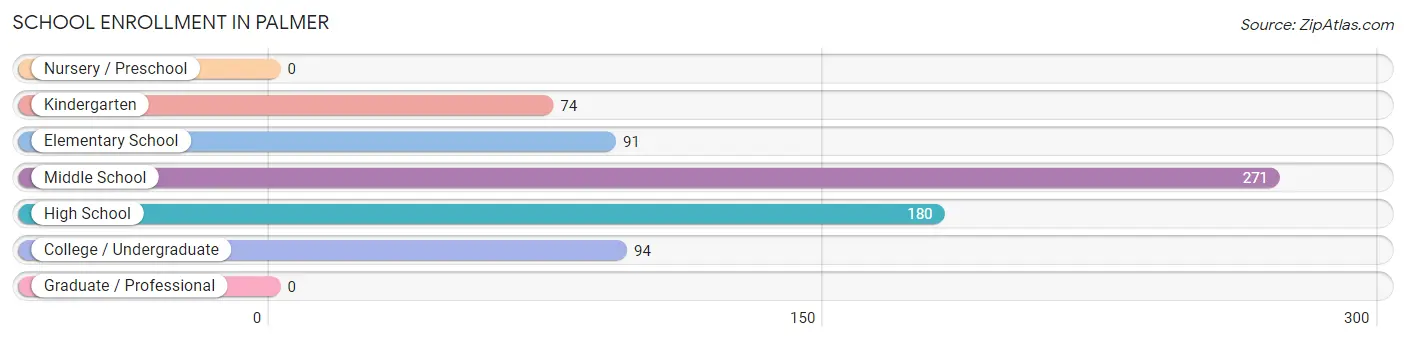
| School Level | # Students | % Students |
| Nursery / Preschool | 0 | 0.0% |
| Kindergarten | 74 | 10.4% |
| Elementary School | 91 | 12.8% |
| Middle School | 271 | 38.2% |
| High School | 180 | 25.4% |
| College / Undergraduate | 94 | 13.2% |
| Graduate / Professional | 0 | 0.0% |
| Total | 710 | 100.0% |
School Enrollment by Age by Funding Source in Palmer
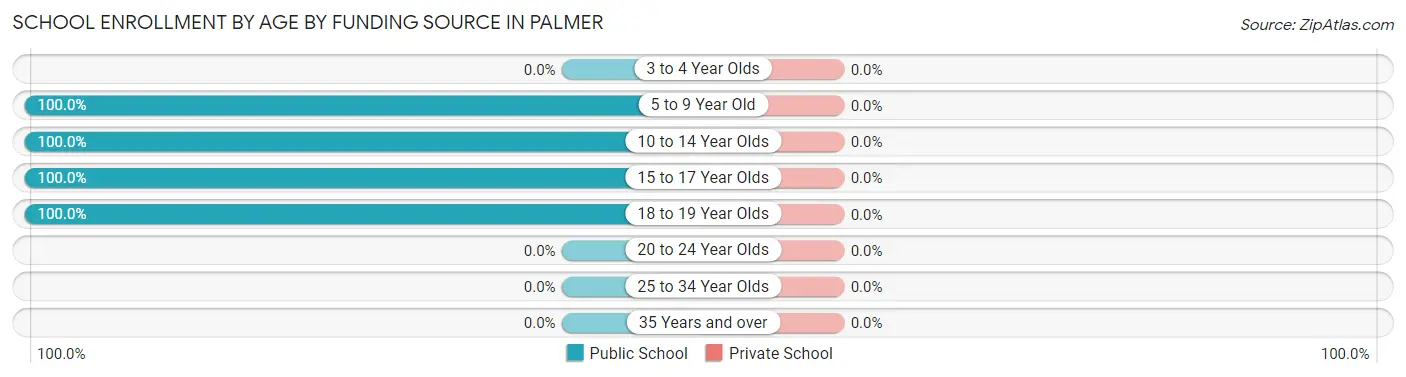
| Age Bracket | Public School | Private School |
| 3 to 4 Year Olds | 0 (0.0%) | 0 (0.0%) |
| 5 to 9 Year Old | 119 (100.0%) | 0 (0.0%) |
| 10 to 14 Year Olds | 317 (100.0%) | 0 (0.0%) |
| 15 to 17 Year Olds | 180 (100.0%) | 0 (0.0%) |
| 18 to 19 Year Olds | 94 (100.0%) | 0 (0.0%) |
| 20 to 24 Year Olds | 0 (0.0%) | 0 (0.0%) |
| 25 to 34 Year Olds | 0 (0.0%) | 0 (0.0%) |
| 35 Years and over | 0 (0.0%) | 0 (0.0%) |
| Total | 710 (100.0%) | 0 (0.0%) |
Educational Attainment by Field of Study in Palmer
, and education (60 | 100.0%) are the most common fields of study among 60 individuals in Palmer who have obtained a bachelor's degree or higher.
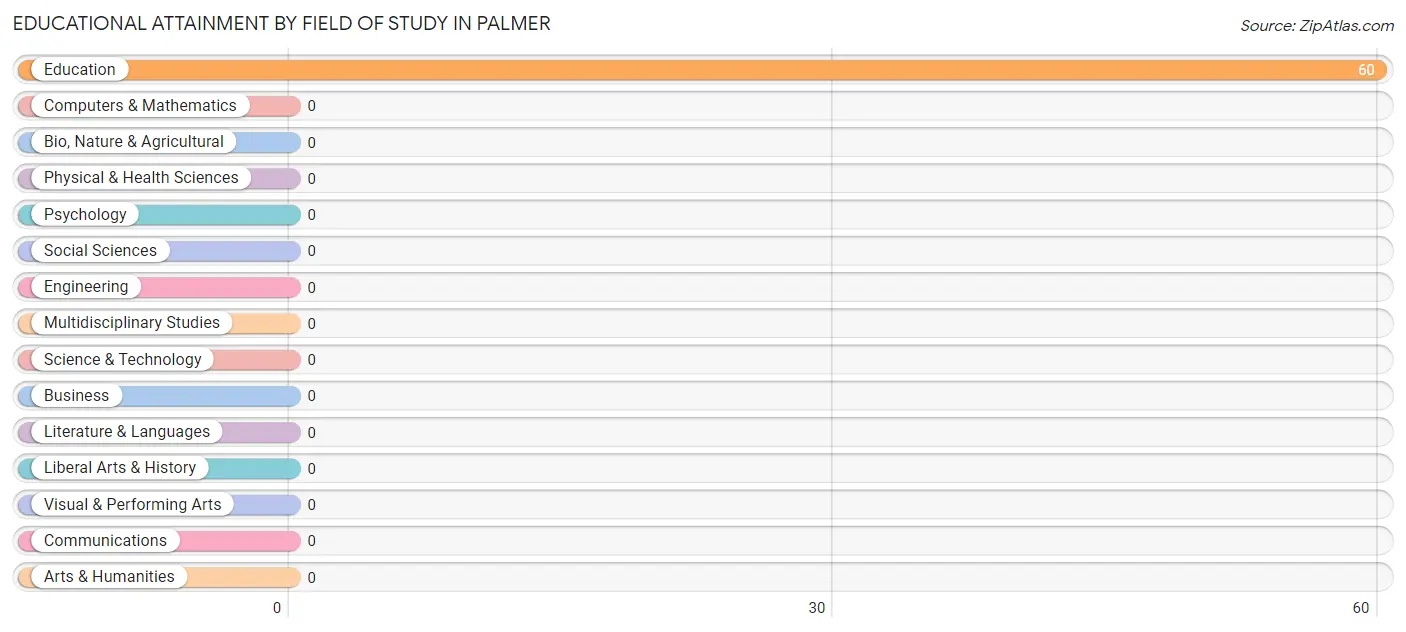
| Field of Study | # Graduates | % Graduates |
| Computers & Mathematics | 0 | 0.0% |
| Bio, Nature & Agricultural | 0 | 0.0% |
| Physical & Health Sciences | 0 | 0.0% |
| Psychology | 0 | 0.0% |
| Social Sciences | 0 | 0.0% |
| Engineering | 0 | 0.0% |
| Multidisciplinary Studies | 0 | 0.0% |
| Science & Technology | 0 | 0.0% |
| Business | 0 | 0.0% |
| Education | 60 | 100.0% |
| Literature & Languages | 0 | 0.0% |
| Liberal Arts & History | 0 | 0.0% |
| Visual & Performing Arts | 0 | 0.0% |
| Communications | 0 | 0.0% |
| Arts & Humanities | 0 | 0.0% |
| Total | 60 | 100.0% |
Transportation & Commute in Palmer
Vehicle Availability by Sex in Palmer
The most prevalent vehicle ownership categories in Palmer are males with 2 vehicles (146, accounting for 57.7%) and females with 2 vehicles (103, making up 66.4%).
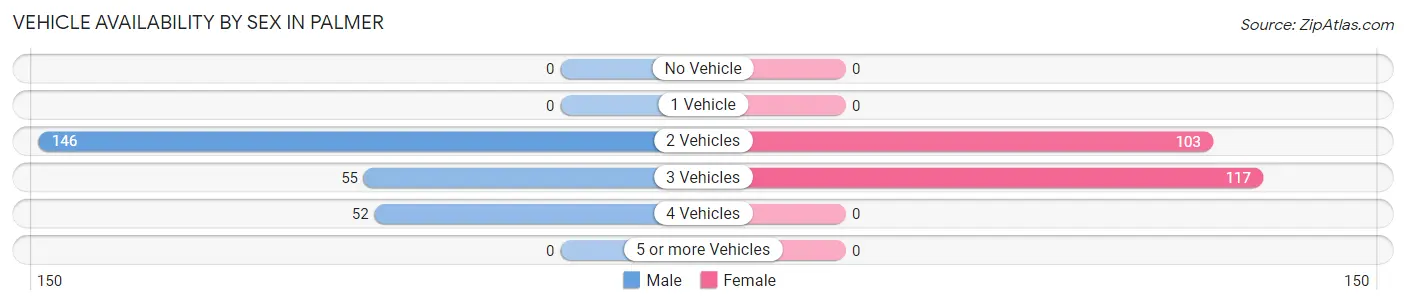
| Vehicles Available | Male | Female |
| No Vehicle | 0 (0.0%) | 0 (0.0%) |
| 1 Vehicle | 0 (0.0%) | 0 (0.0%) |
| 2 Vehicles | 146 (57.7%) | 103 (46.8%) |
| 3 Vehicles | 55 (21.7%) | 117 (53.2%) |
| 4 Vehicles | 52 (20.5%) | 0 (0.0%) |
| 5 or more Vehicles | 0 (0.0%) | 0 (0.0%) |
| Total | 253 (100.0%) | 220 (100.0%) |
Commute Time in Palmer
The most frequently occuring commute durations in Palmer are 20 to 24 minutes (273 commuters, 57.7%), 15 to 19 minutes (112 commuters, 23.7%), and 30 to 34 minutes (47 commuters, 9.9%).
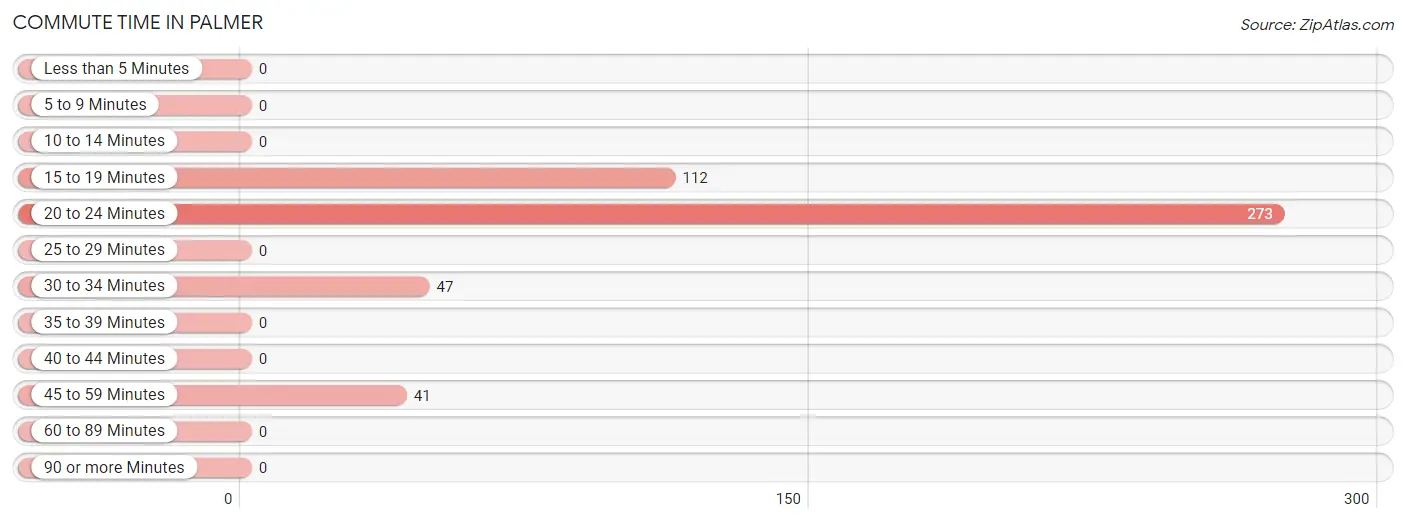
| Commute Time | # Commuters | % Commuters |
| Less than 5 Minutes | 0 | 0.0% |
| 5 to 9 Minutes | 0 | 0.0% |
| 10 to 14 Minutes | 0 | 0.0% |
| 15 to 19 Minutes | 112 | 23.7% |
| 20 to 24 Minutes | 273 | 57.7% |
| 25 to 29 Minutes | 0 | 0.0% |
| 30 to 34 Minutes | 47 | 9.9% |
| 35 to 39 Minutes | 0 | 0.0% |
| 40 to 44 Minutes | 0 | 0.0% |
| 45 to 59 Minutes | 41 | 8.7% |
| 60 to 89 Minutes | 0 | 0.0% |
| 90 or more Minutes | 0 | 0.0% |
Commute Time by Sex in Palmer
The most common commute times in Palmer are 20 to 24 minutes (147 commuters, 58.1%) for males and 20 to 24 minutes (126 commuters, 57.3%) for females.
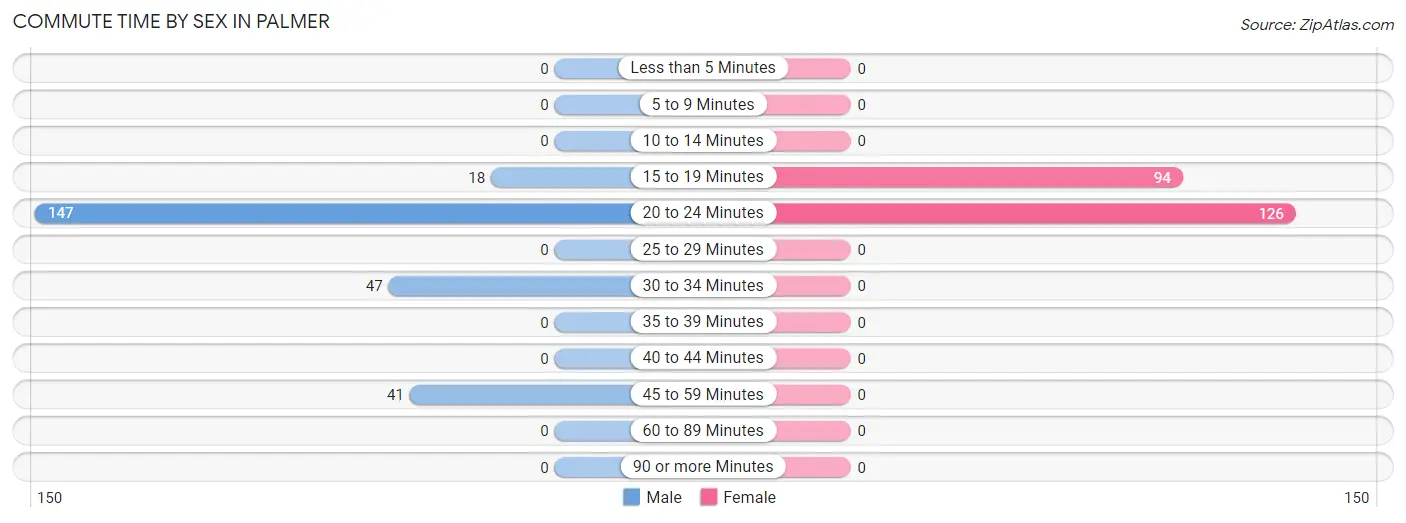
| Commute Time | Male | Female |
| Less than 5 Minutes | 0 (0.0%) | 0 (0.0%) |
| 5 to 9 Minutes | 0 (0.0%) | 0 (0.0%) |
| 10 to 14 Minutes | 0 (0.0%) | 0 (0.0%) |
| 15 to 19 Minutes | 18 (7.1%) | 94 (42.7%) |
| 20 to 24 Minutes | 147 (58.1%) | 126 (57.3%) |
| 25 to 29 Minutes | 0 (0.0%) | 0 (0.0%) |
| 30 to 34 Minutes | 47 (18.6%) | 0 (0.0%) |
| 35 to 39 Minutes | 0 (0.0%) | 0 (0.0%) |
| 40 to 44 Minutes | 0 (0.0%) | 0 (0.0%) |
| 45 to 59 Minutes | 41 (16.2%) | 0 (0.0%) |
| 60 to 89 Minutes | 0 (0.0%) | 0 (0.0%) |
| 90 or more Minutes | 0 (0.0%) | 0 (0.0%) |
Time of Departure to Work by Sex in Palmer
The most frequent times of departure to work in Palmer are 6:30 AM to 6:59 AM (105, 41.5%) for males and 8:00 AM to 8:29 AM (62, 28.2%) for females.
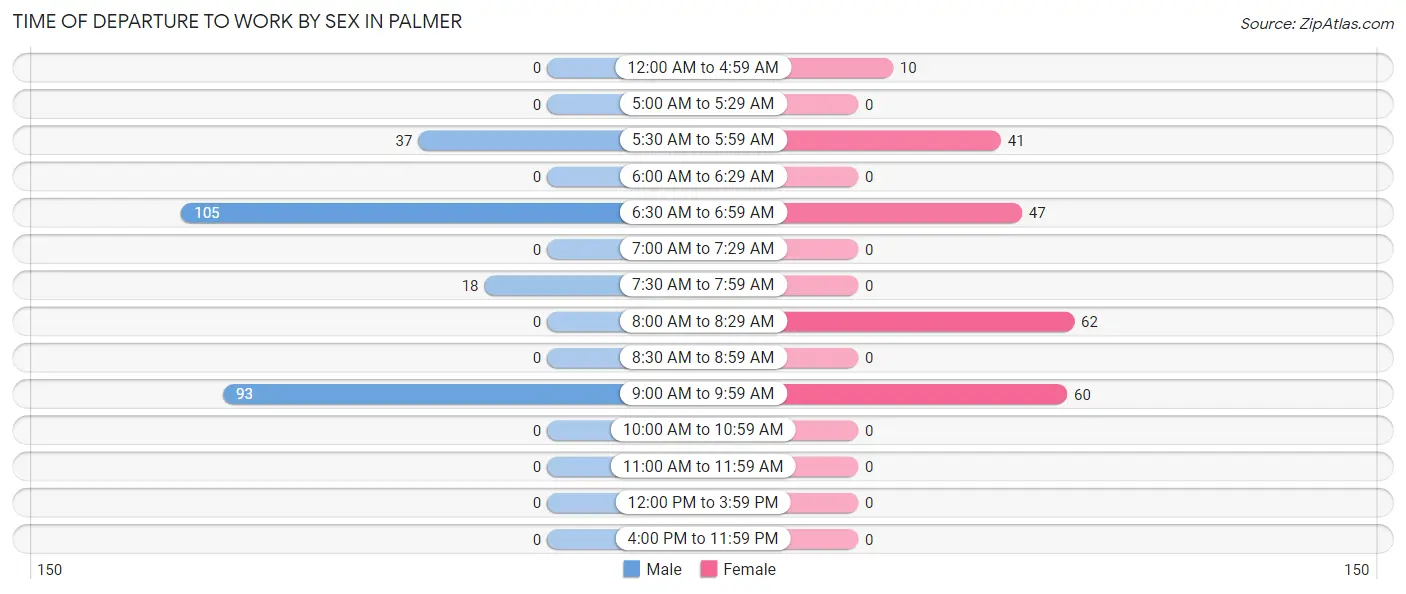
| Time of Departure | Male | Female |
| 12:00 AM to 4:59 AM | 0 (0.0%) | 10 (4.5%) |
| 5:00 AM to 5:29 AM | 0 (0.0%) | 0 (0.0%) |
| 5:30 AM to 5:59 AM | 37 (14.6%) | 41 (18.6%) |
| 6:00 AM to 6:29 AM | 0 (0.0%) | 0 (0.0%) |
| 6:30 AM to 6:59 AM | 105 (41.5%) | 47 (21.4%) |
| 7:00 AM to 7:29 AM | 0 (0.0%) | 0 (0.0%) |
| 7:30 AM to 7:59 AM | 18 (7.1%) | 0 (0.0%) |
| 8:00 AM to 8:29 AM | 0 (0.0%) | 62 (28.2%) |
| 8:30 AM to 8:59 AM | 0 (0.0%) | 0 (0.0%) |
| 9:00 AM to 9:59 AM | 93 (36.8%) | 60 (27.3%) |
| 10:00 AM to 10:59 AM | 0 (0.0%) | 0 (0.0%) |
| 11:00 AM to 11:59 AM | 0 (0.0%) | 0 (0.0%) |
| 12:00 PM to 3:59 PM | 0 (0.0%) | 0 (0.0%) |
| 4:00 PM to 11:59 PM | 0 (0.0%) | 0 (0.0%) |
| Total | 253 (100.0%) | 220 (100.0%) |
Housing Occupancy in Palmer
Occupancy by Ownership in Palmer
Of the total 786 dwellings in Palmer, owner-occupied units account for 523 (66.5%), while renter-occupied units make up 263 (33.5%).
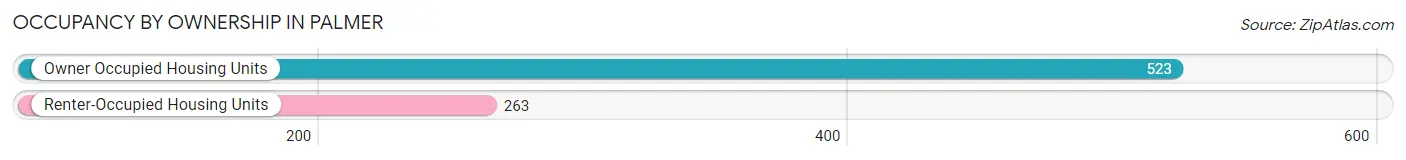
| Occupancy | # Housing Units | % Housing Units |
| Owner Occupied Housing Units | 523 | 66.5% |
| Renter-Occupied Housing Units | 263 | 33.5% |
| Total Occupied Housing Units | 786 | 100.0% |
Occupancy by Household Size in Palmer
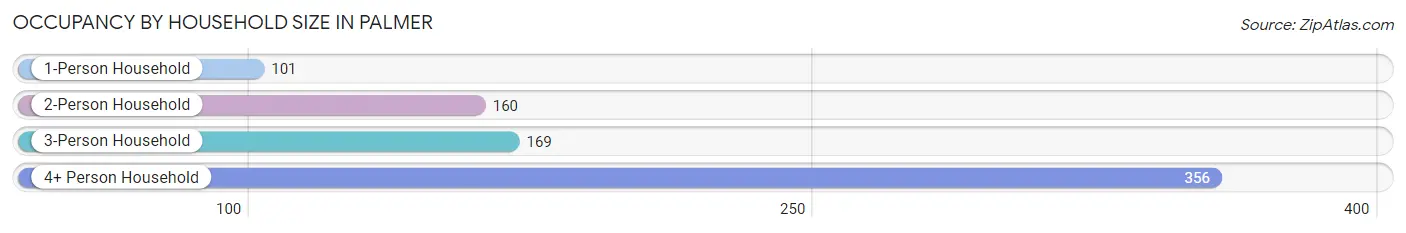
| Household Size | # Housing Units | % Housing Units |
| 1-Person Household | 101 | 12.9% |
| 2-Person Household | 160 | 20.4% |
| 3-Person Household | 169 | 21.5% |
| 4+ Person Household | 356 | 45.3% |
| Total Housing Units | 786 | 100.0% |
Occupancy by Ownership by Household Size in Palmer
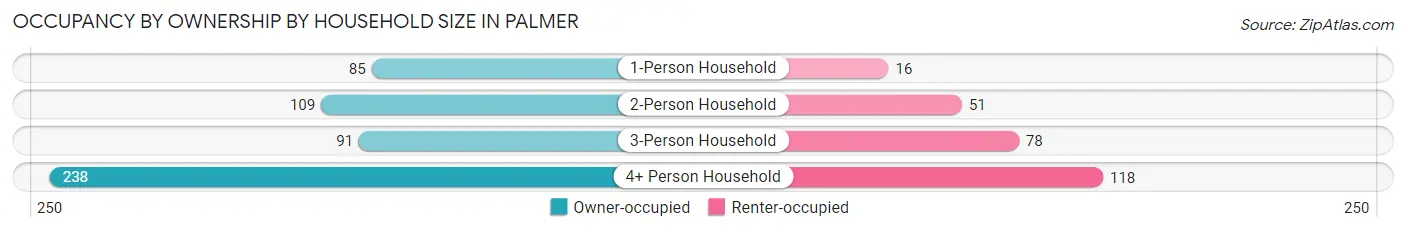
| Household Size | Owner-occupied | Renter-occupied |
| 1-Person Household | 85 (84.2%) | 16 (15.8%) |
| 2-Person Household | 109 (68.1%) | 51 (31.9%) |
| 3-Person Household | 91 (53.8%) | 78 (46.2%) |
| 4+ Person Household | 238 (66.8%) | 118 (33.2%) |
| Total Housing Units | 523 (66.5%) | 263 (33.5%) |
Occupancy by Educational Attainment in Palmer
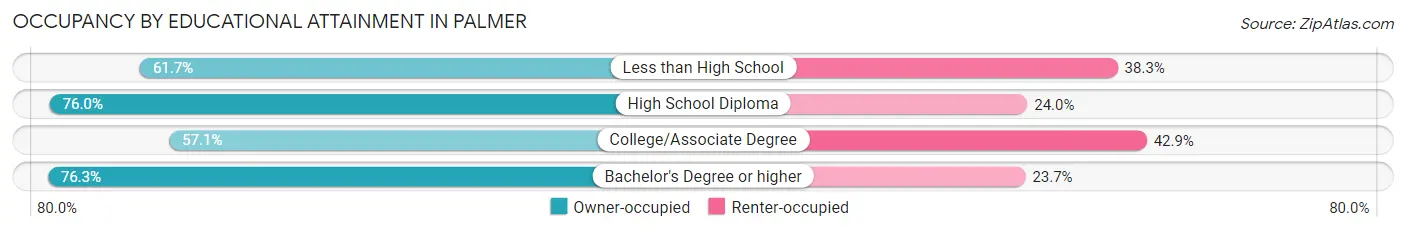
| Household Size | Owner-occupied | Renter-occupied |
| Less than High School | 87 (61.7%) | 54 (38.3%) |
| High School Diploma | 184 (76.0%) | 58 (24.0%) |
| College/Associate Degree | 165 (57.1%) | 124 (42.9%) |
| Bachelor's Degree or higher | 87 (76.3%) | 27 (23.7%) |
Occupancy by Age of Householder in Palmer
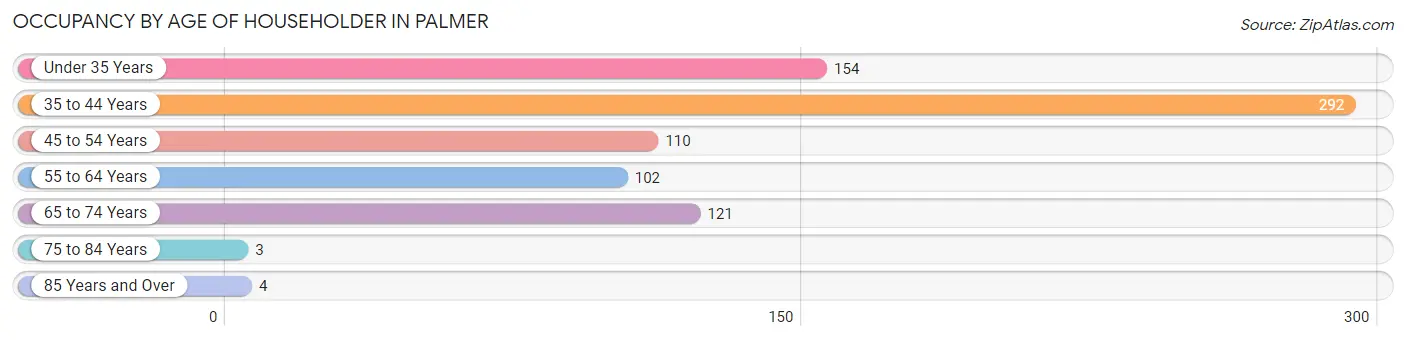
| Age Bracket | # Households | % Households |
| Under 35 Years | 154 | 19.6% |
| 35 to 44 Years | 292 | 37.1% |
| 45 to 54 Years | 110 | 14.0% |
| 55 to 64 Years | 102 | 13.0% |
| 65 to 74 Years | 121 | 15.4% |
| 75 to 84 Years | 3 | 0.4% |
| 85 Years and Over | 4 | 0.5% |
| Total | 786 | 100.0% |
Housing Finances in Palmer
Median Income by Occupancy in Palmer
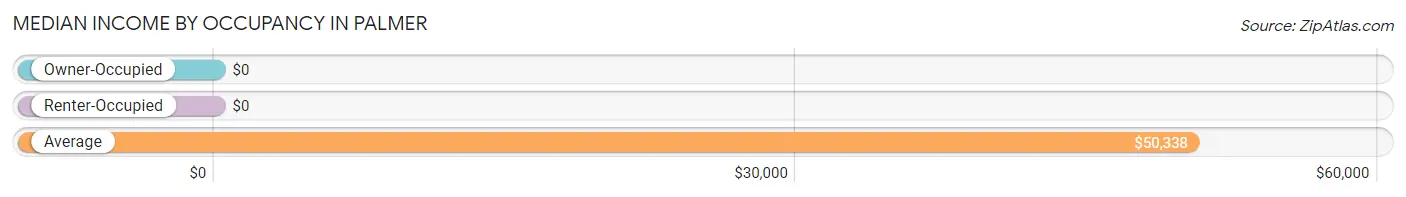
| Occupancy Type | # Households | Median Income |
| Owner-Occupied | 289 (81.6%) | $0 |
| Renter-Occupied | 65 (18.4%) | $0 |
| Average | 354 (100.0%) | $50,338 |
Occupancy by Householder Income Bracket in Palmer
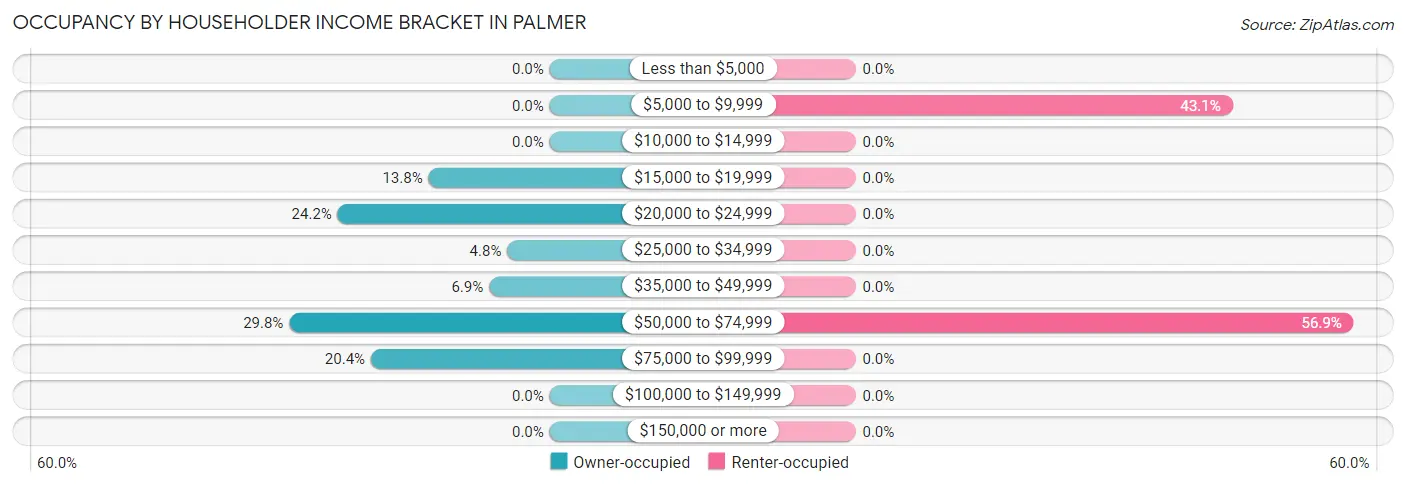
| Income Bracket | Owner-occupied | Renter-occupied |
| Less than $5,000 | 0 (0.0%) | 0 (0.0%) |
| $5,000 to $9,999 | 0 (0.0%) | 28 (43.1%) |
| $10,000 to $14,999 | 0 (0.0%) | 0 (0.0%) |
| $15,000 to $19,999 | 40 (13.8%) | 0 (0.0%) |
| $20,000 to $24,999 | 70 (24.2%) | 0 (0.0%) |
| $25,000 to $34,999 | 14 (4.8%) | 0 (0.0%) |
| $35,000 to $49,999 | 20 (6.9%) | 0 (0.0%) |
| $50,000 to $74,999 | 86 (29.8%) | 37 (56.9%) |
| $75,000 to $99,999 | 59 (20.4%) | 0 (0.0%) |
| $100,000 to $149,999 | 0 (0.0%) | 0 (0.0%) |
| $150,000 or more | 0 (0.0%) | 0 (0.0%) |
| Total | 289 (100.0%) | 65 (100.0%) |
Monthly Housing Cost Tiers in Palmer
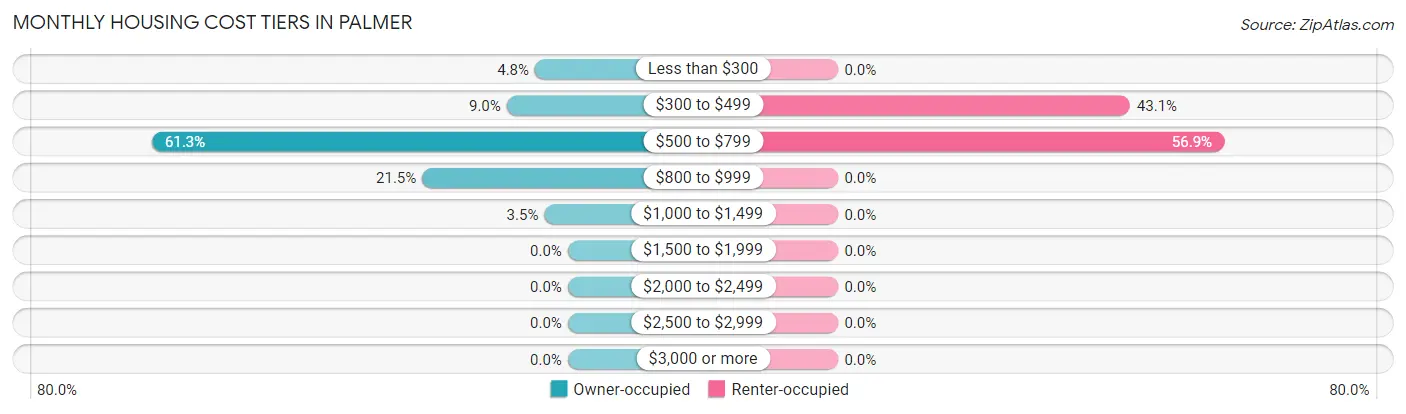
| Monthly Cost | Owner-occupied | Renter-occupied |
| Less than $300 | 14 (4.8%) | 0 (0.0%) |
| $300 to $499 | 26 (9.0%) | 28 (43.1%) |
| $500 to $799 | 177 (61.3%) | 37 (56.9%) |
| $800 to $999 | 62 (21.4%) | 0 (0.0%) |
| $1,000 to $1,499 | 10 (3.5%) | 0 (0.0%) |
| $1,500 to $1,999 | 0 (0.0%) | 0 (0.0%) |
| $2,000 to $2,499 | 0 (0.0%) | 0 (0.0%) |
| $2,500 to $2,999 | 0 (0.0%) | 0 (0.0%) |
| $3,000 or more | 0 (0.0%) | 0 (0.0%) |
| Total | 289 (100.0%) | 65 (100.0%) |
Physical Housing Characteristics in Palmer
Housing Structures in Palmer
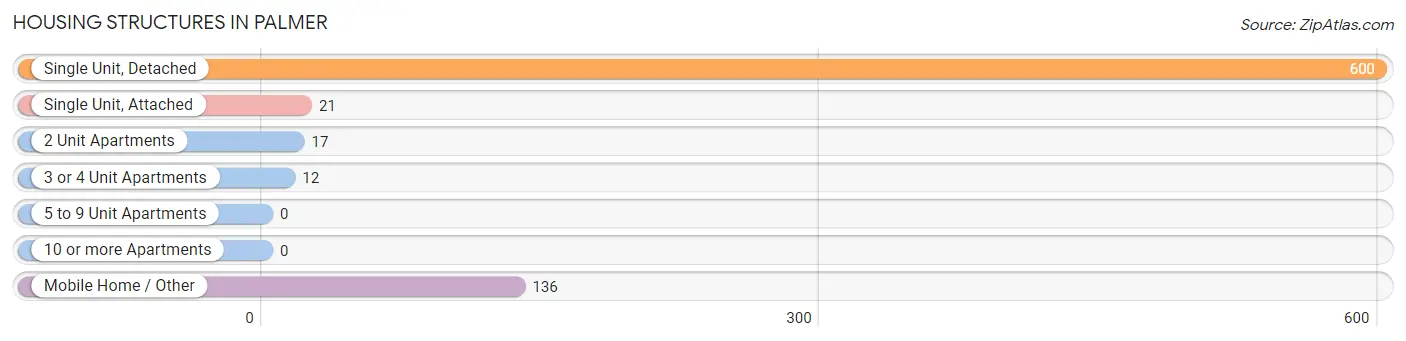
| Structure Type | # Housing Units | % Housing Units |
| Single Unit, Detached | 600 | 76.3% |
| Single Unit, Attached | 21 | 2.7% |
| 2 Unit Apartments | 17 | 2.2% |
| 3 or 4 Unit Apartments | 12 | 1.5% |
| 5 to 9 Unit Apartments | 0 | 0.0% |
| 10 or more Apartments | 0 | 0.0% |
| Mobile Home / Other | 136 | 17.3% |
| Total | 786 | 100.0% |
Housing Structures by Occupancy in Palmer
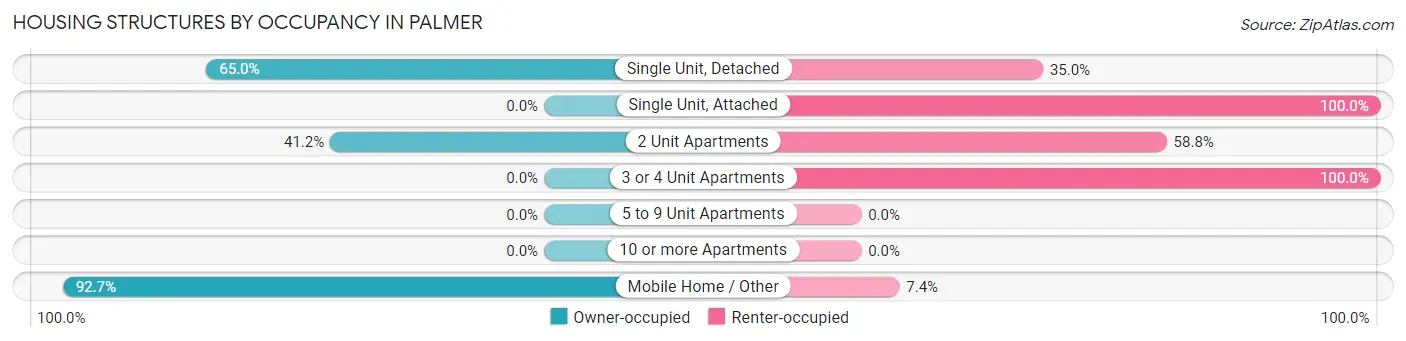
| Structure Type | Owner-occupied | Renter-occupied |
| Single Unit, Detached | 390 (65.0%) | 210 (35.0%) |
| Single Unit, Attached | 0 (0.0%) | 21 (100.0%) |
| 2 Unit Apartments | 7 (41.2%) | 10 (58.8%) |
| 3 or 4 Unit Apartments | 0 (0.0%) | 12 (100.0%) |
| 5 to 9 Unit Apartments | 0 (0.0%) | 0 (0.0%) |
| 10 or more Apartments | 0 (0.0%) | 0 (0.0%) |
| Mobile Home / Other | 126 (92.6%) | 10 (7.3%) |
| Total | 523 (66.5%) | 263 (33.5%) |
Housing Structures by Number of Rooms in Palmer
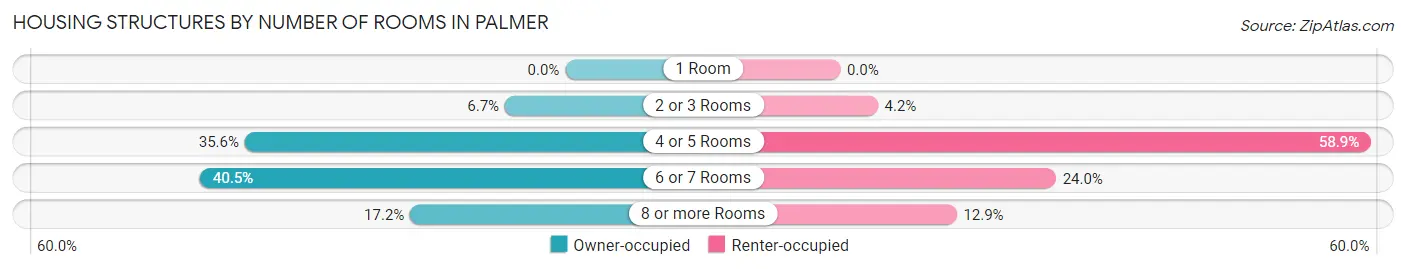
| Number of Rooms | Owner-occupied | Renter-occupied |
| 1 Room | 0 (0.0%) | 0 (0.0%) |
| 2 or 3 Rooms | 35 (6.7%) | 11 (4.2%) |
| 4 or 5 Rooms | 186 (35.6%) | 155 (58.9%) |
| 6 or 7 Rooms | 212 (40.5%) | 63 (23.9%) |
| 8 or more Rooms | 90 (17.2%) | 34 (12.9%) |
| Total | 523 (100.0%) | 263 (100.0%) |
Housing Structure by Heating Type in Palmer
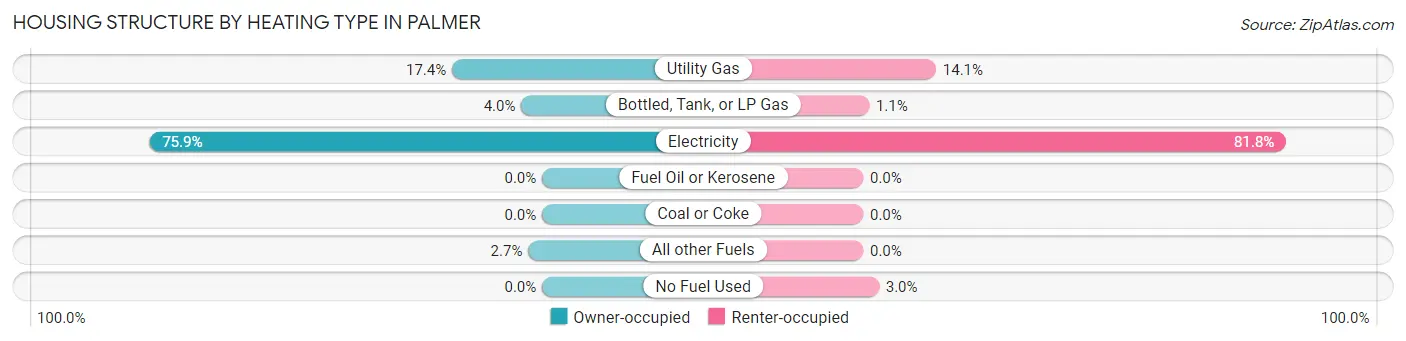
| Heating Type | Owner-occupied | Renter-occupied |
| Utility Gas | 91 (17.4%) | 37 (14.1%) |
| Bottled, Tank, or LP Gas | 21 (4.0%) | 3 (1.1%) |
| Electricity | 397 (75.9%) | 215 (81.8%) |
| Fuel Oil or Kerosene | 0 (0.0%) | 0 (0.0%) |
| Coal or Coke | 0 (0.0%) | 0 (0.0%) |
| All other Fuels | 14 (2.7%) | 0 (0.0%) |
| No Fuel Used | 0 (0.0%) | 8 (3.0%) |
| Total | 523 (100.0%) | 263 (100.0%) |
Household Vehicle Usage in Palmer
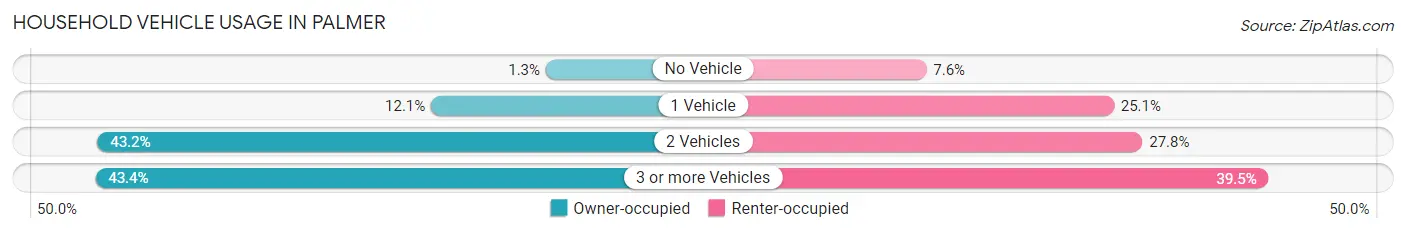
| Vehicles per Household | Owner-occupied | Renter-occupied |
| No Vehicle | 7 (1.3%) | 20 (7.6%) |
| 1 Vehicle | 63 (12.0%) | 66 (25.1%) |
| 2 Vehicles | 226 (43.2%) | 73 (27.8%) |
| 3 or more Vehicles | 227 (43.4%) | 104 (39.5%) |
| Total | 523 (100.0%) | 263 (100.0%) |
Real Estate & Mortgages in Palmer
Real Estate and Mortgage Overview in Palmer
| Characteristic | Without Mortgage | With Mortgage |
| Housing Units | 164 | 113 |
| Median Property Value | $127,800 | $0 |
| Median Household Income | $52,857 | $0 |
| Monthly Housing Costs | $563 | $0 |
| Real Estate Taxes | $2,643 | $0 |
Property Value by Mortgage Status in Palmer
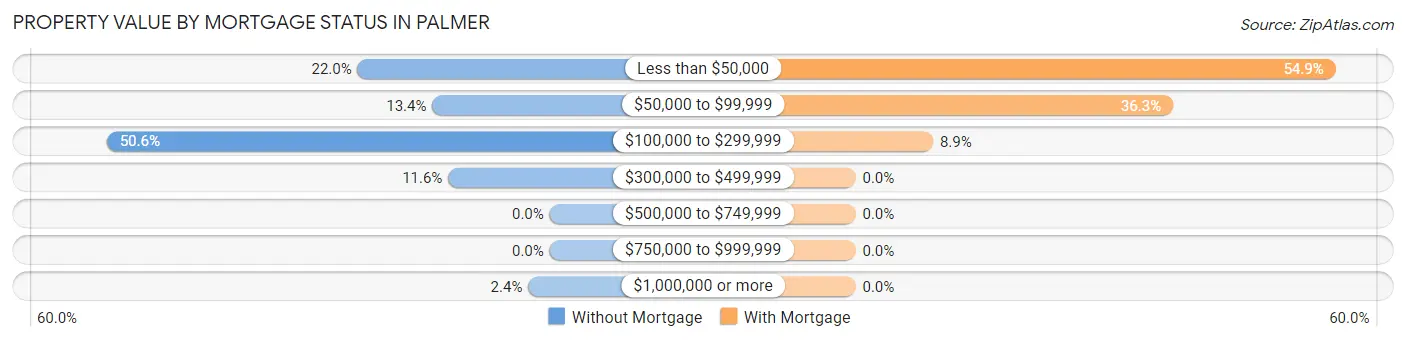
| Property Value | Without Mortgage | With Mortgage |
| Less than $50,000 | 36 (22.0%) | 62 (54.9%) |
| $50,000 to $99,999 | 22 (13.4%) | 41 (36.3%) |
| $100,000 to $299,999 | 83 (50.6%) | 10 (8.8%) |
| $300,000 to $499,999 | 19 (11.6%) | 0 (0.0%) |
| $500,000 to $749,999 | 0 (0.0%) | 0 (0.0%) |
| $750,000 to $999,999 | 0 (0.0%) | 0 (0.0%) |
| $1,000,000 or more | 4 (2.4%) | 0 (0.0%) |
| Total | 164 (100.0%) | 113 (100.0%) |
Household Income by Mortgage Status in Palmer
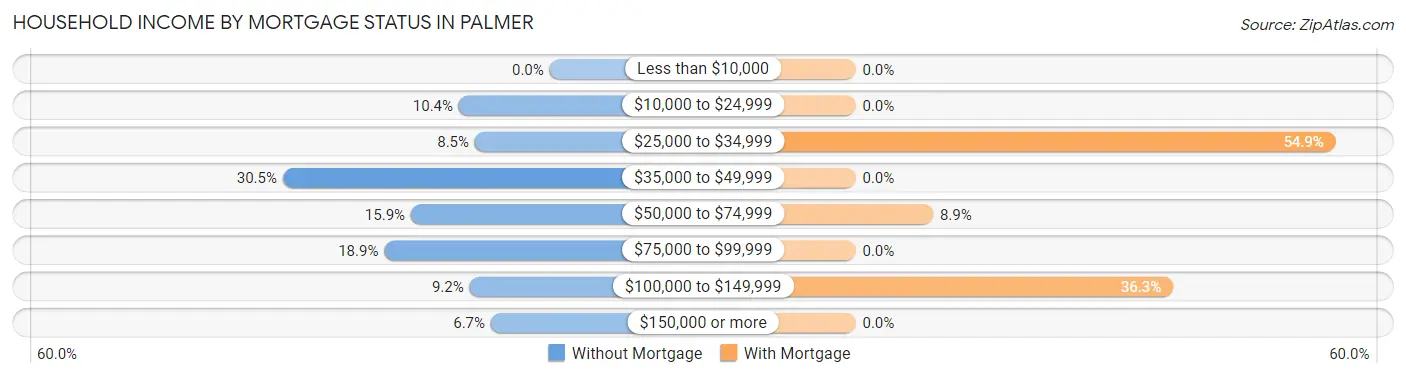
| Household Income | Without Mortgage | With Mortgage |
| Less than $10,000 | 0 (0.0%) | 0 (0.0%) |
| $10,000 to $24,999 | 17 (10.4%) | 0 (0.0%) |
| $25,000 to $34,999 | 14 (8.5%) | 62 (54.9%) |
| $35,000 to $49,999 | 50 (30.5%) | 0 (0.0%) |
| $50,000 to $74,999 | 26 (15.9%) | 10 (8.8%) |
| $75,000 to $99,999 | 31 (18.9%) | 0 (0.0%) |
| $100,000 to $149,999 | 15 (9.1%) | 41 (36.3%) |
| $150,000 or more | 11 (6.7%) | 0 (0.0%) |
| Total | 164 (100.0%) | 113 (100.0%) |
Property Value to Household Income Ratio in Palmer
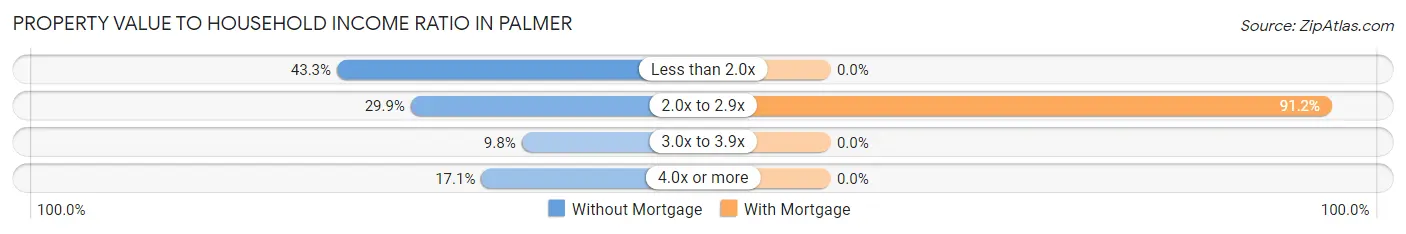
| Value-to-Income Ratio | Without Mortgage | With Mortgage |
| Less than 2.0x | 71 (43.3%) | 0 (0.0%) |
| 2.0x to 2.9x | 49 (29.9%) | 103 (91.1%) |
| 3.0x to 3.9x | 16 (9.8%) | 0 (0.0%) |
| 4.0x or more | 28 (17.1%) | 0 (0.0%) |
| Total | 164 (100.0%) | 113 (100.0%) |
Real Estate Taxes by Mortgage Status in Palmer
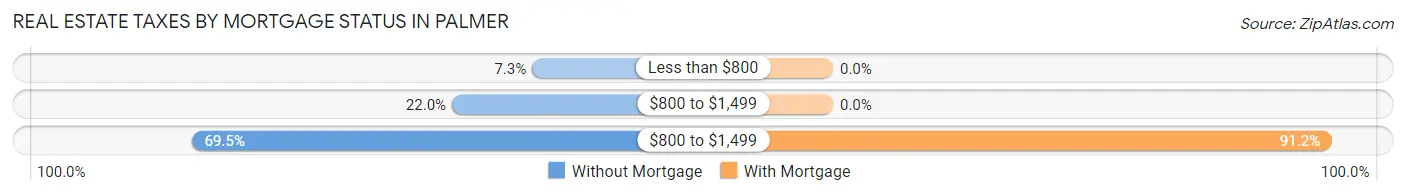
| Property Taxes | Without Mortgage | With Mortgage |
| Less than $800 | 12 (7.3%) | 0 (0.0%) |
| $800 to $1,499 | 36 (22.0%) | 0 (0.0%) |
| $800 to $1,499 | 114 (69.5%) | 103 (91.1%) |
| Total | 164 (100.0%) | 113 (100.0%) |
Health & Disability in Palmer
Health Insurance Coverage by Age in Palmer
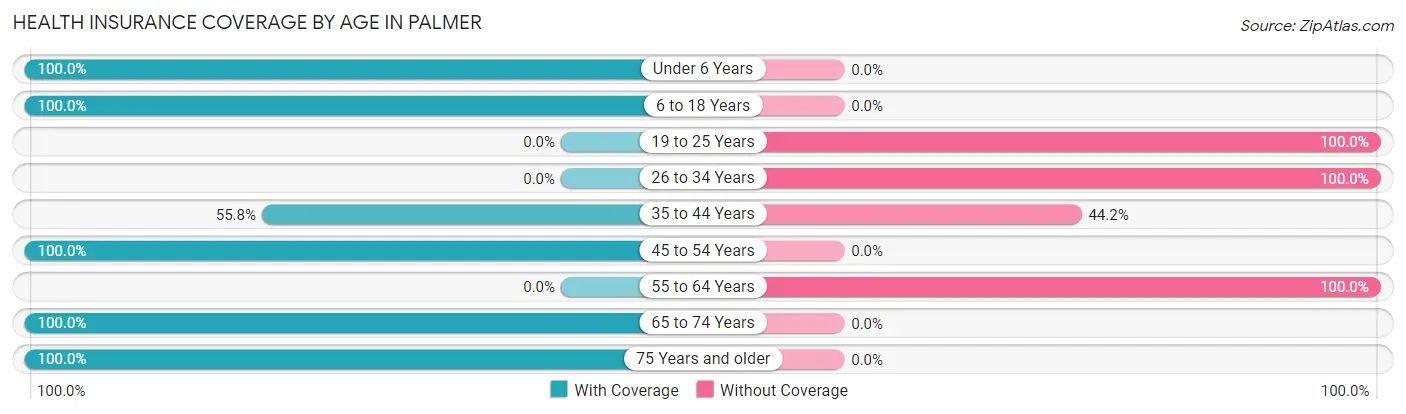
| Age Bracket | With Coverage | Without Coverage |
| Under 6 Years | 98 (100.0%) | 0 (0.0%) |
| 6 to 18 Years | 710 (100.0%) | 0 (0.0%) |
| 19 to 25 Years | 0 (0.0%) | 86 (100.0%) |
| 26 to 34 Years | 0 (0.0%) | 166 (100.0%) |
| 35 to 44 Years | 116 (55.8%) | 92 (44.2%) |
| 45 to 54 Years | 107 (100.0%) | 0 (0.0%) |
| 55 to 64 Years | 0 (0.0%) | 41 (100.0%) |
| 65 to 74 Years | 64 (100.0%) | 0 (0.0%) |
| 75 Years and older | 43 (100.0%) | 0 (0.0%) |
| Total | 1,138 (74.7%) | 385 (25.3%) |
Health Insurance Coverage by Citizenship Status in Palmer
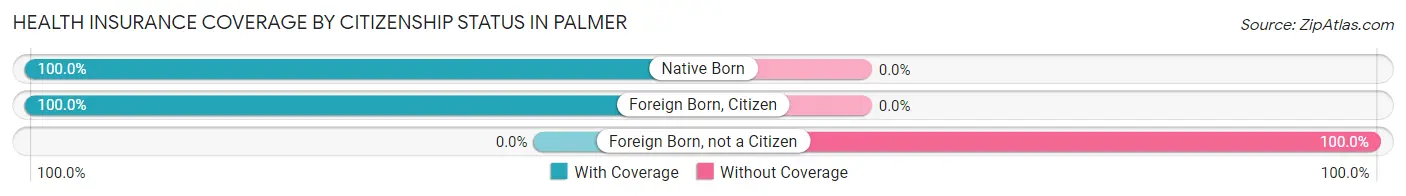
| Citizenship Status | With Coverage | Without Coverage |
| Native Born | 98 (100.0%) | 0 (0.0%) |
| Foreign Born, Citizen | 710 (100.0%) | 0 (0.0%) |
| Foreign Born, not a Citizen | 0 (0.0%) | 86 (100.0%) |
Health Insurance Coverage by Household Income in Palmer
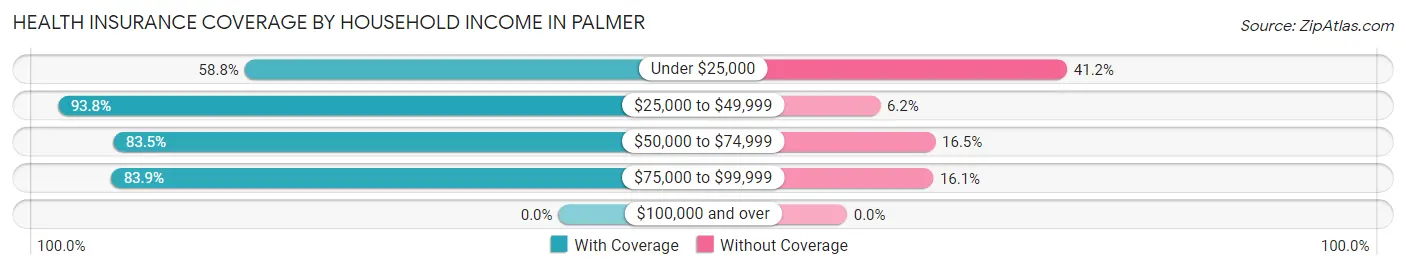
| Household Income | With Coverage | Without Coverage |
| Under $25,000 | 355 (58.8%) | 249 (41.2%) |
| $25,000 to $49,999 | 136 (93.8%) | 9 (6.2%) |
| $50,000 to $74,999 | 434 (83.5%) | 86 (16.5%) |
| $75,000 to $99,999 | 213 (83.9%) | 41 (16.1%) |
| $100,000 and over | 0 (0.0%) | 0 (0.0%) |
Public vs Private Health Insurance Coverage by Age in Palmer
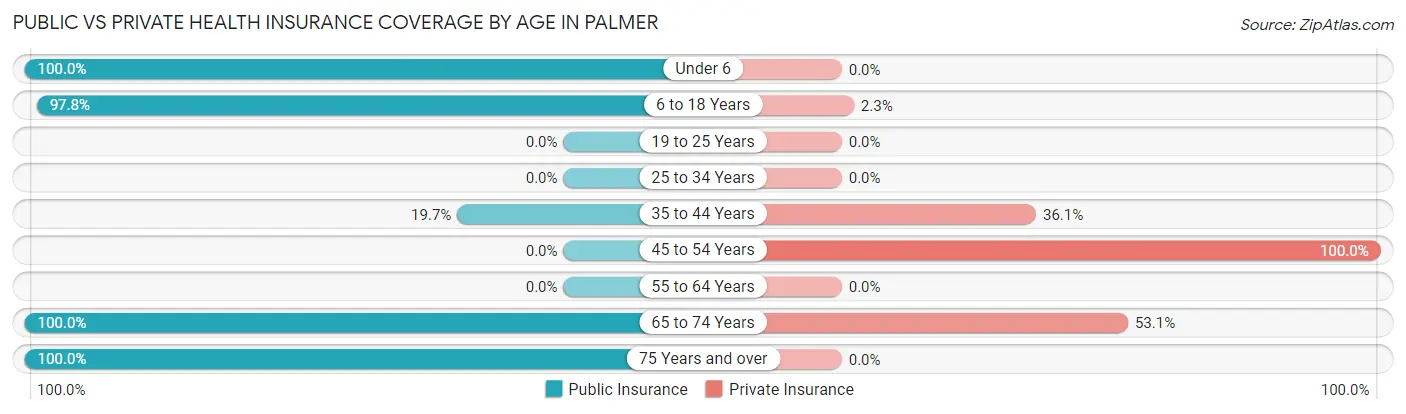
| Age Bracket | Public Insurance | Private Insurance |
| Under 6 | 98 (100.0%) | 0 (0.0%) |
| 6 to 18 Years | 694 (97.8%) | 16 (2.2%) |
| 19 to 25 Years | 0 (0.0%) | 0 (0.0%) |
| 25 to 34 Years | 0 (0.0%) | 0 (0.0%) |
| 35 to 44 Years | 41 (19.7%) | 75 (36.1%) |
| 45 to 54 Years | 0 (0.0%) | 107 (100.0%) |
| 55 to 64 Years | 0 (0.0%) | 0 (0.0%) |
| 65 to 74 Years | 64 (100.0%) | 34 (53.1%) |
| 75 Years and over | 43 (100.0%) | 0 (0.0%) |
| Total | 940 (61.7%) | 232 (15.2%) |
Disability Status by Sex by Age in Palmer
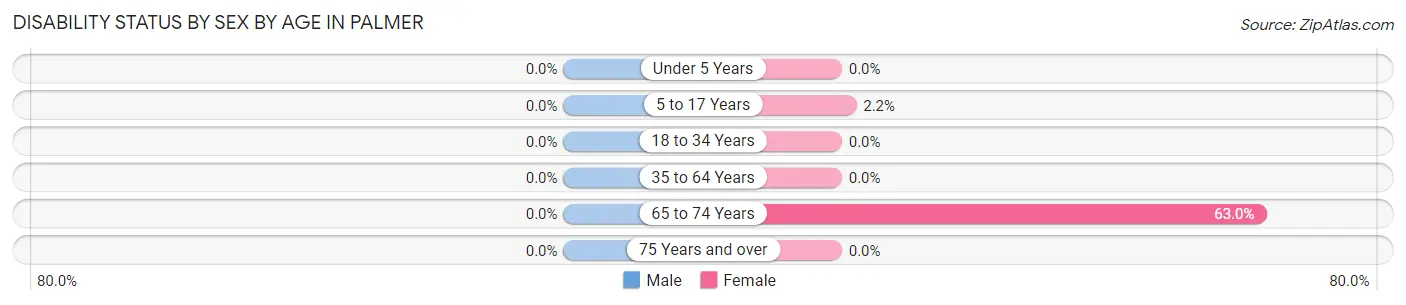
| Age Bracket | Male | Female |
| Under 5 Years | 0 (0.0%) | 0 (0.0%) |
| 5 to 17 Years | 0 (0.0%) | 9 (2.1%) |
| 18 to 34 Years | 0 (0.0%) | 0 (0.0%) |
| 35 to 64 Years | 0 (0.0%) | 0 (0.0%) |
| 65 to 74 Years | 0 (0.0%) | 29 (63.0%) |
| 75 Years and over | 0 (0.0%) | 0 (0.0%) |
Disability Class by Sex by Age in Palmer
Disability Class: Hearing Difficulty
| Age Bracket | Male | Female |
| Under 5 Years | 0 (0.0%) | 0 (0.0%) |
| 5 to 17 Years | 0 (0.0%) | 0 (0.0%) |
| 18 to 34 Years | 0 (0.0%) | 0 (0.0%) |
| 35 to 64 Years | 0 (0.0%) | 0 (0.0%) |
| 65 to 74 Years | 0 (0.0%) | 0 (0.0%) |
| 75 Years and over | 0 (0.0%) | 0 (0.0%) |
Disability Class: Vision Difficulty
| Age Bracket | Male | Female |
| Under 5 Years | 0 (0.0%) | 0 (0.0%) |
| 5 to 17 Years | 0 (0.0%) | 0 (0.0%) |
| 18 to 34 Years | 0 (0.0%) | 0 (0.0%) |
| 35 to 64 Years | 0 (0.0%) | 0 (0.0%) |
| 65 to 74 Years | 0 (0.0%) | 0 (0.0%) |
| 75 Years and over | 0 (0.0%) | 0 (0.0%) |
Disability Class: Cognitive Difficulty
| Age Bracket | Male | Female |
| 5 to 17 Years | 0 (0.0%) | 0 (0.0%) |
| 18 to 34 Years | 0 (0.0%) | 0 (0.0%) |
| 35 to 64 Years | 0 (0.0%) | 0 (0.0%) |
| 65 to 74 Years | 0 (0.0%) | 0 (0.0%) |
| 75 Years and over | 0 (0.0%) | 0 (0.0%) |
Disability Class: Ambulatory Difficulty
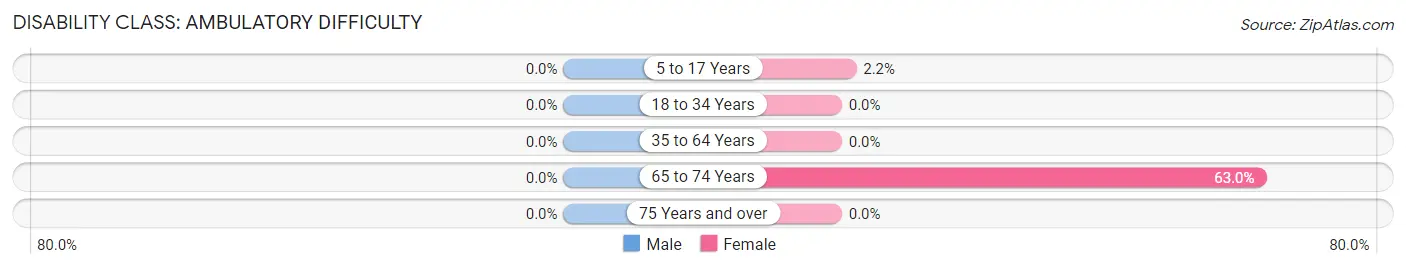
| Age Bracket | Male | Female |
| 5 to 17 Years | 0 (0.0%) | 9 (2.1%) |
| 18 to 34 Years | 0 (0.0%) | 0 (0.0%) |
| 35 to 64 Years | 0 (0.0%) | 0 (0.0%) |
| 65 to 74 Years | 0 (0.0%) | 29 (63.0%) |
| 75 Years and over | 0 (0.0%) | 0 (0.0%) |
Disability Class: Self-Care Difficulty
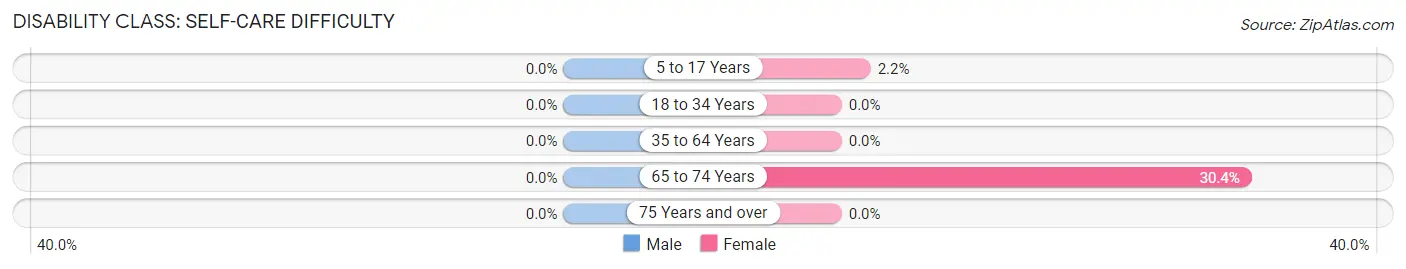
| Age Bracket | Male | Female |
| 5 to 17 Years | 0 (0.0%) | 9 (2.1%) |
| 18 to 34 Years | 0 (0.0%) | 0 (0.0%) |
| 35 to 64 Years | 0 (0.0%) | 0 (0.0%) |
| 65 to 74 Years | 0 (0.0%) | 14 (30.4%) |
| 75 Years and over | 0 (0.0%) | 0 (0.0%) |
Technology Access in Palmer
Computing Device Access in Palmer
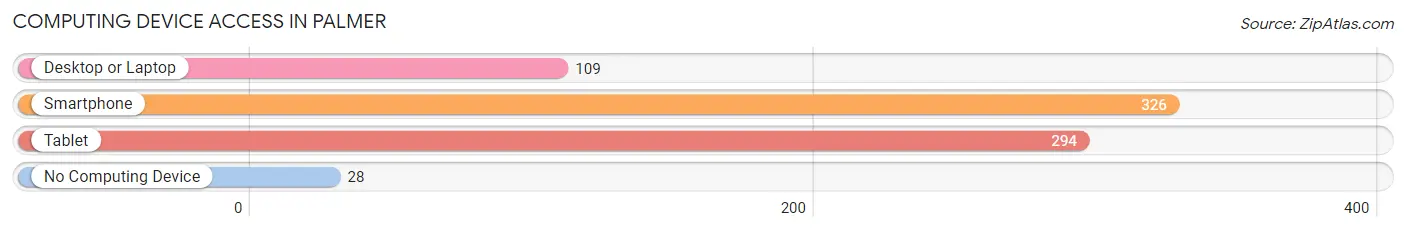
| Device Type | # Households | % Households |
| Desktop or Laptop | 109 | 30.8% |
| Smartphone | 326 | 92.1% |
| Tablet | 294 | 83.1% |
| No Computing Device | 28 | 7.9% |
| Total | 354 | 100.0% |
Internet Access in Palmer
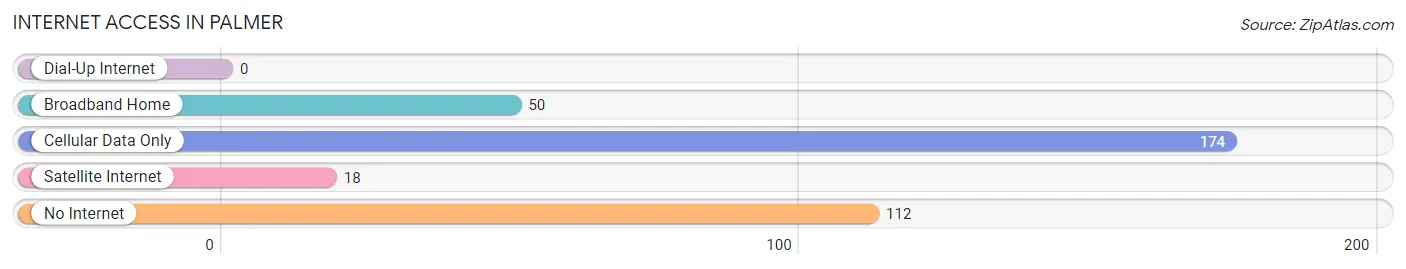
| Internet Type | # Households | % Households |
| Dial-Up Internet | 0 | 0.0% |
| Broadband Home | 50 | 14.1% |
| Cellular Data Only | 174 | 49.1% |
| Satellite Internet | 18 | 5.1% |
| No Internet | 112 | 31.6% |
| Total | 354 | 100.0% |
Palmer Summary
Palmer, Texas is a small town located in Ellis County, Texas, United States. It is situated about 20 miles south of Dallas and is part of the Dallas-Fort Worth metropolitan area. The population of Palmer was 1,845 at the 2010 census.
History
Palmer was founded in 1873 by a group of settlers from Kentucky. The town was named after the first postmaster, William Palmer. The town was originally a farming community, but it soon became a center for the cotton industry. The town was incorporated in 1876 and the first mayor was elected in 1877.
In the early 1900s, Palmer was a thriving community with a population of over 1,000. The town had a cotton gin, a bank, a hotel, a school, and several churches. The town also had a railroad station, which connected it to Dallas and other nearby towns.
In the 1920s, Palmer experienced a period of growth and prosperity. The town had a population of over 2,000 and was home to several businesses, including a movie theater, a grocery store, and a drug store.
In the 1950s, Palmer began to decline as the cotton industry moved away from the area. The population decreased to just over 1,000 by the 1970s.
Geography
Palmer is located at 32°37'45" North, 96°45'45" West (32.629, -96.7625). The town is situated on the western edge of Ellis County, about 20 miles south of Dallas.
The town has a total area of 1.2 square miles, all of which is land. The terrain is mostly flat, with some rolling hills. The town is located in the Blackland Prairie region of Texas, which is characterized by fertile soil and abundant rainfall.
Economy
The economy of Palmer is largely based on agriculture. The town is home to several farms, which produce cotton, corn, wheat, and other crops. The town also has several businesses, including a grocery store, a hardware store, and a restaurant.
The town is also home to several manufacturing companies, including a plastics factory and a metal fabrication plant.
Demographics
As of the 2010 census, the population of Palmer was 1,845. The racial makeup of the town was 79.2% White, 15.2% African American, 0.3% Native American, 0.7% Asian, 0.1% Pacific Islander, and 4.5% from other races. Hispanic or Latino of any race were 8.2% of the population.
The median household income in Palmer was $41,250, and the median family income was $50,000. The per capita income was $19,945. About 11.2% of families and 14.2% of the population were below the poverty line.
Common Questions
What is Per Capita Income in Palmer?
Per Capita income in Palmer is $10,293.
What is the Median Family Income in Palmer?
Median Family Income in Palmer is $51,284.
What is the Median Household income in Palmer?
Median Household Income in Palmer is $50,338.
What is Income or Wage Gap in Palmer?
Income or Wage Gap in Palmer is 8.9%.
Women in Palmer earn 91.1 cents for every dollar earned by a man.
What is Inequality or Gini Index in Palmer?
Inequality or Gini Index in Palmer is 0.32.
What is the Total Population of Palmer?
Total Population of Palmer is 1,523.
What is the Total Male Population of Palmer?
Total Male Population of Palmer is 608.
What is the Total Female Population of Palmer?
Total Female Population of Palmer is 915.
What is the Ratio of Males per 100 Females in Palmer?
There are 66.45 Males per 100 Females in Palmer.
What is the Ratio of Females per 100 Males in Palmer?
There are 150.49 Females per 100 Males in Palmer.
What is the Median Population Age in Palmer?
Median Population Age in Palmer is 18.5 Years.
What is the Average Family Size in Palmer
Average Family Size in Palmer is 4.4 People.
What is the Average Household Size in Palmer
Average Household Size in Palmer is 4.3 People.
How Large is the Labor Force in Palmer?
There are 473 People in the Labor Forcein in Palmer.
What is the Percentage of People in the Labor Force in Palmer?
49.1% of People are in the Labor Force in Palmer.