Ozona, TX Map & Demographics
Ozona Map
Ozona Overview
$37,958
PER CAPITA INCOME
$76,515
AVG FAMILY INCOME
$60,288
AVG HOUSEHOLD INCOME
48.2%
WAGE / INCOME GAP [ % ]
51.8¢/ $1
WAGE / INCOME GAP [ $ ]
0.38
INEQUALITY / GINI INDEX
2,306
TOTAL POPULATION
1,289
MALE POPULATION
1,017
FEMALE POPULATION
126.75
MALES / 100 FEMALES
78.90
FEMALES / 100 MALES
54.5
MEDIAN AGE
2.5
AVG FAMILY SIZE
2.0
AVG HOUSEHOLD SIZE
1,333
LABOR FORCE [ PEOPLE ]
62.9%
PERCENT IN LABOR FORCE
2.3%
UNEMPLOYMENT RATE
Ozona Zip Codes
Income in Ozona
Income Overview in Ozona
Per Capita Income in Ozona is $37,958, while median incomes of families and households are $76,515 and $60,288 respectively.
| Characteristic | Number | Measure |
| Per Capita Income | 2,306 | $37,958 |
| Median Family Income | 761 | $76,515 |
| Mean Family Income | 761 | $90,540 |
| Median Household Income | 1,115 | $60,288 |
| Mean Household Income | 1,115 | $77,868 |
| Income Deficit | 761 | $0 |
| Wage / Income Gap (%) | 2,306 | 48.17% |
| Wage / Income Gap ($) | 2,306 | 51.83¢ per $1 |
| Gini / Inequality Index | 2,306 | 0.38 |
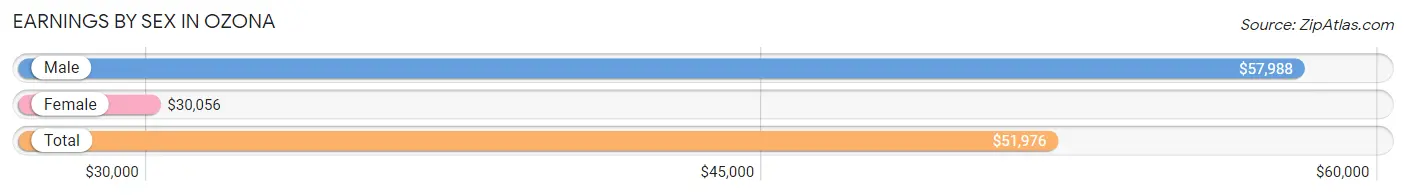
Earnings by Sex in Ozona
Average Earnings in Ozona are $51,976, $57,988 for men and $30,056 for women, a difference of 48.2%.
| Sex | Number | Average Earnings |
| Male | 795 (57.7%) | $57,988 |
| Female | 582 (42.3%) | $30,056 |
| Total | 1,377 (100.0%) | $51,976 |
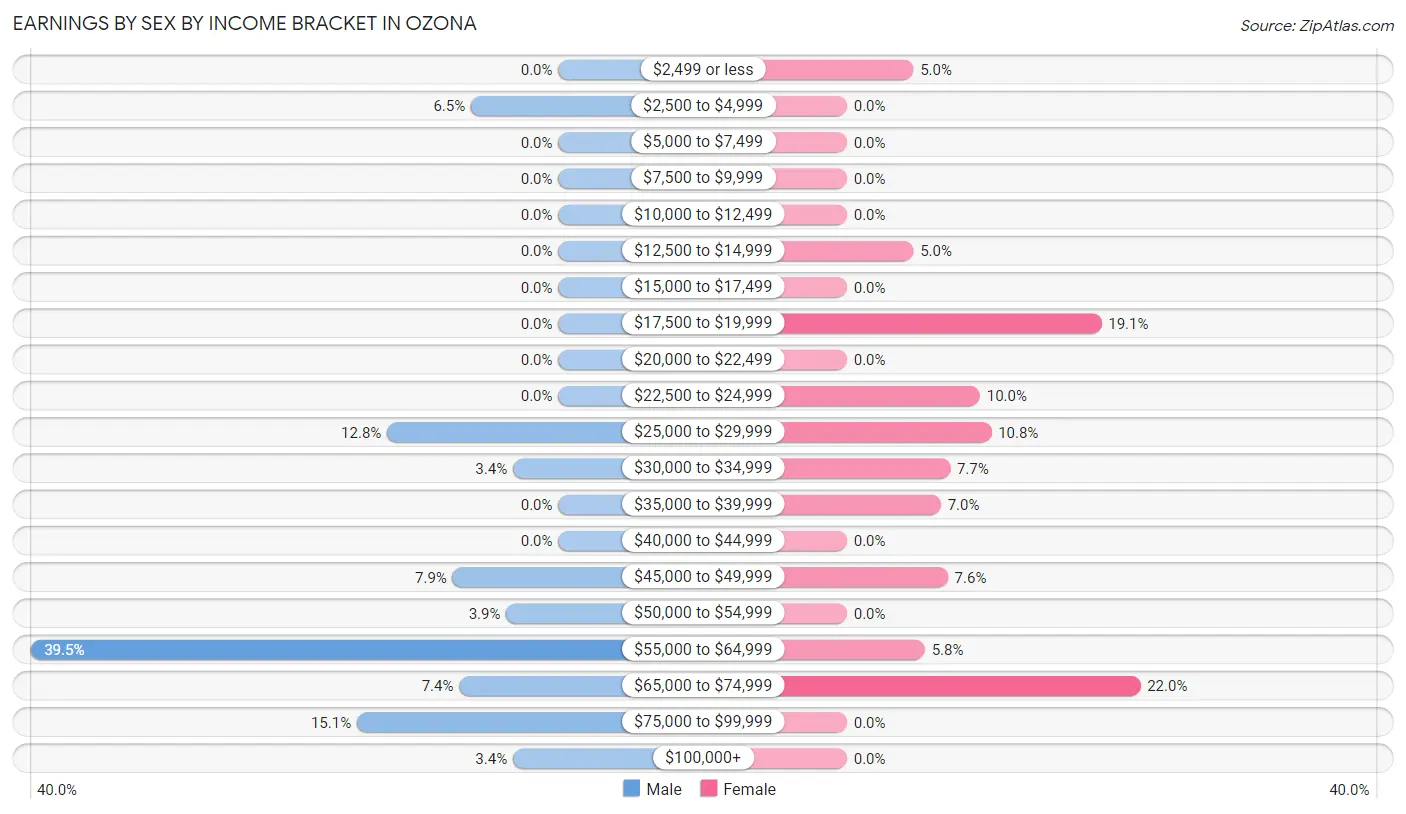
Earnings by Sex by Income Bracket in Ozona
The most common earnings brackets in Ozona are $55,000 to $64,999 for men (314 | 39.5%) and $65,000 to $74,999 for women (128 | 22.0%).
| Income | Male | Female |
| $2,499 or less | 0 (0.0%) | 29 (5.0%) |
| $2,500 to $4,999 | 52 (6.5%) | 0 (0.0%) |
| $5,000 to $7,499 | 0 (0.0%) | 0 (0.0%) |
| $7,500 to $9,999 | 0 (0.0%) | 0 (0.0%) |
| $10,000 to $12,499 | 0 (0.0%) | 0 (0.0%) |
| $12,500 to $14,999 | 0 (0.0%) | 29 (5.0%) |
| $15,000 to $17,499 | 0 (0.0%) | 0 (0.0%) |
| $17,500 to $19,999 | 0 (0.0%) | 111 (19.1%) |
| $20,000 to $22,499 | 0 (0.0%) | 0 (0.0%) |
| $22,500 to $24,999 | 0 (0.0%) | 58 (10.0%) |
| $25,000 to $29,999 | 102 (12.8%) | 63 (10.8%) |
| $30,000 to $34,999 | 27 (3.4%) | 45 (7.7%) |
| $35,000 to $39,999 | 0 (0.0%) | 41 (7.0%) |
| $40,000 to $44,999 | 0 (0.0%) | 0 (0.0%) |
| $45,000 to $49,999 | 63 (7.9%) | 44 (7.6%) |
| $50,000 to $54,999 | 31 (3.9%) | 0 (0.0%) |
| $55,000 to $64,999 | 314 (39.5%) | 34 (5.8%) |
| $65,000 to $74,999 | 59 (7.4%) | 128 (22.0%) |
| $75,000 to $99,999 | 120 (15.1%) | 0 (0.0%) |
| $100,000+ | 27 (3.4%) | 0 (0.0%) |
| Total | 795 (100.0%) | 582 (100.0%) |
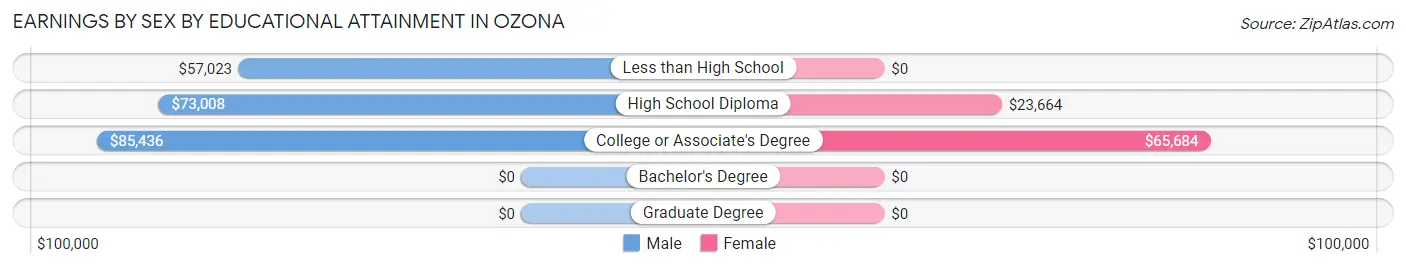
Earnings by Sex by Educational Attainment in Ozona
Average earnings in Ozona are $58,183 for men and $30,972 for women, a difference of 46.8%. Men with an educational attainment of college or associate's degree enjoy the highest average annual earnings of $85,436, while those with less than high school education earn the least with $57,023. Women with an educational attainment of college or associate's degree earn the most with the average annual earnings of $65,684, while those with high school diploma education have the smallest earnings of $23,664.
| Educational Attainment | Male Income | Female Income |
| Less than High School | $57,023 | $0 |
| High School Diploma | $73,008 | $23,664 |
| College or Associate's Degree | $85,436 | $65,684 |
| Bachelor's Degree | - | - |
| Graduate Degree | - | - |
| Total | $58,183 | $30,972 |
Family Income in Ozona
Family Income Brackets in Ozona
According to the Ozona family income data, there are 178 families falling into the $100,000 to $149,999 income range, which is the most common income bracket and makes up 23.4% of all families.
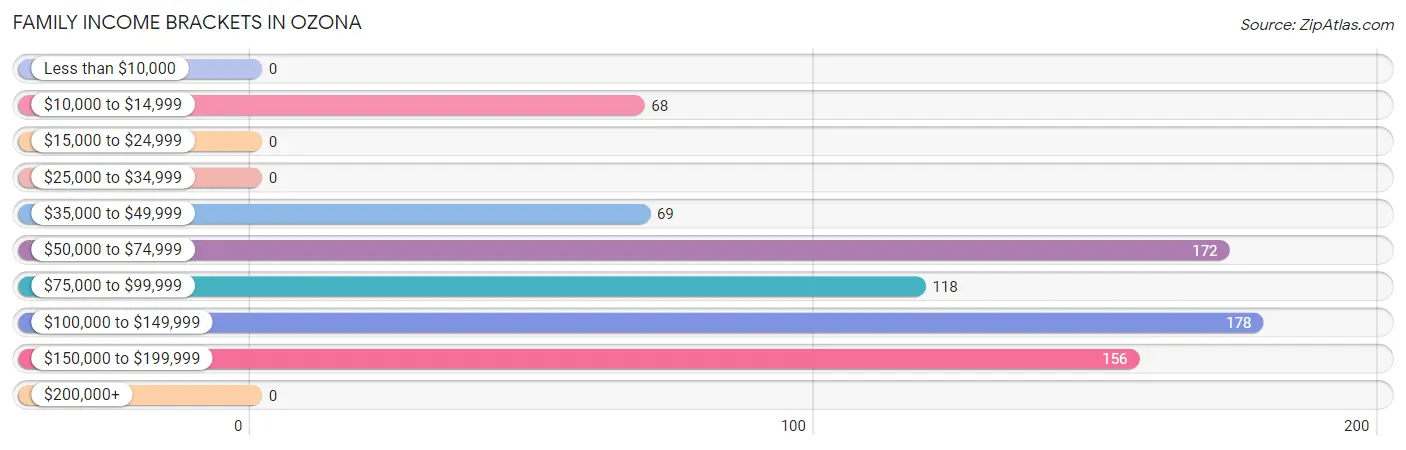
| Income Bracket | # Families | % Families |
| Less than $10,000 | 0 | 0.0% |
| $10,000 to $14,999 | 68 | 8.9% |
| $15,000 to $24,999 | 0 | 0.0% |
| $25,000 to $34,999 | 0 | 0.0% |
| $35,000 to $49,999 | 69 | 9.1% |
| $50,000 to $74,999 | 172 | 22.6% |
| $75,000 to $99,999 | 118 | 15.5% |
| $100,000 to $149,999 | 178 | 23.4% |
| $150,000 to $199,999 | 156 | 20.5% |
| $200,000+ | 0 | 0.0% |
Family Income by Famaliy Size in Ozona
3-person families (273 | 35.9%) account for the highest median family income in Ozona with $137,220 per family, while 3-person families (273 | 35.9%) have the highest median income of $45,740 per family member.
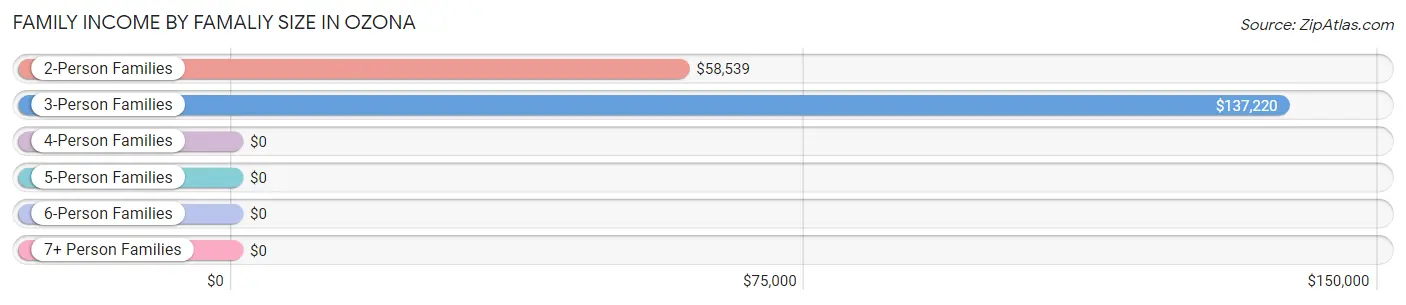
| Income Bracket | # Families | Median Income |
| 2-Person Families | 488 (64.1%) | $58,539 |
| 3-Person Families | 273 (35.9%) | $137,220 |
| 4-Person Families | 0 (0.0%) | $0 |
| 5-Person Families | 0 (0.0%) | $0 |
| 6-Person Families | 0 (0.0%) | $0 |
| 7+ Person Families | 0 (0.0%) | $0 |
| Total | 761 (100.0%) | $76,515 |
Family Income by Number of Earners in Ozona
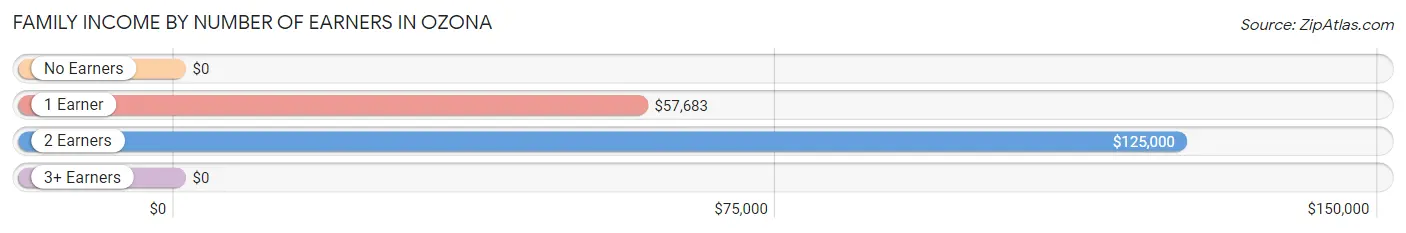
| Number of Earners | # Families | Median Income |
| No Earners | 34 (4.5%) | $0 |
| 1 Earner | 319 (41.9%) | $57,683 |
| 2 Earners | 408 (53.6%) | $125,000 |
| 3+ Earners | 0 (0.0%) | $0 |
| Total | 761 (100.0%) | $76,515 |
Household Income in Ozona
Household Income Brackets in Ozona
With 252 households falling in the category, the $50,000 to $74,999 income range is the most frequent in Ozona, accounting for 22.6% of all households.
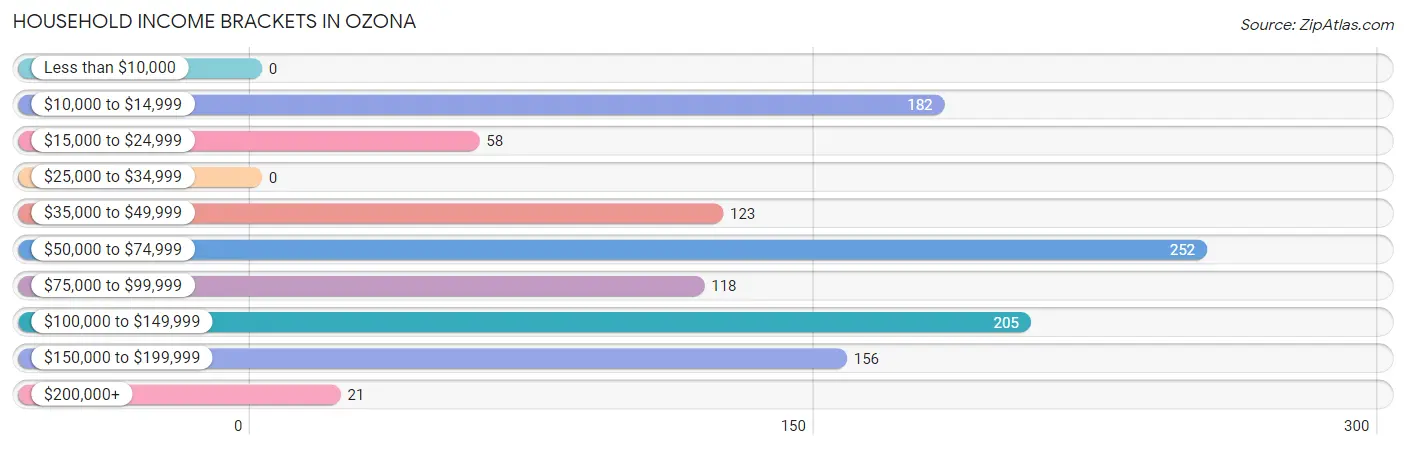
| Income Bracket | # Households | % Households |
| Less than $10,000 | 0 | 0.0% |
| $10,000 to $14,999 | 182 | 16.3% |
| $15,000 to $24,999 | 58 | 5.2% |
| $25,000 to $34,999 | 0 | 0.0% |
| $35,000 to $49,999 | 123 | 11.0% |
| $50,000 to $74,999 | 252 | 22.6% |
| $75,000 to $99,999 | 118 | 10.6% |
| $100,000 to $149,999 | 205 | 18.4% |
| $150,000 to $199,999 | 156 | 14.0% |
| $200,000+ | 21 | 1.9% |
Household Income by Householder Age in Ozona
The median household income in Ozona is $60,288, with the highest median household income of $75,944 found in the 65+ years age bracket for the primary householder. A total of 349 households (31.3%) fall into this category. Meanwhile, the 15 to 24 years age bracket for the primary householder has the lowest median household income of $0, with 43 households (3.9%) in this group.
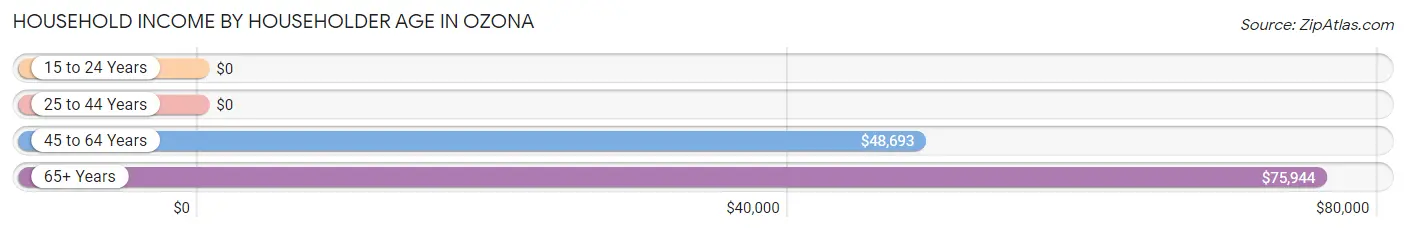
| Income Bracket | # Households | Median Income |
| 15 to 24 Years | 43 (3.9%) | $0 |
| 25 to 44 Years | 257 (23.1%) | $0 |
| 45 to 64 Years | 466 (41.8%) | $48,693 |
| 65+ Years | 349 (31.3%) | $75,944 |
| Total | 1,115 (100.0%) | $60,288 |
Poverty in Ozona
Income Below Poverty by Sex and Age in Ozona
With 14.8% poverty level for males and 8.2% for females among the residents of Ozona, 75 year old and over males and 75 year old and over females are the most vulnerable to poverty, with 21 males (70.0%) and 35 females (72.9%) in their respective age groups living below the poverty level.
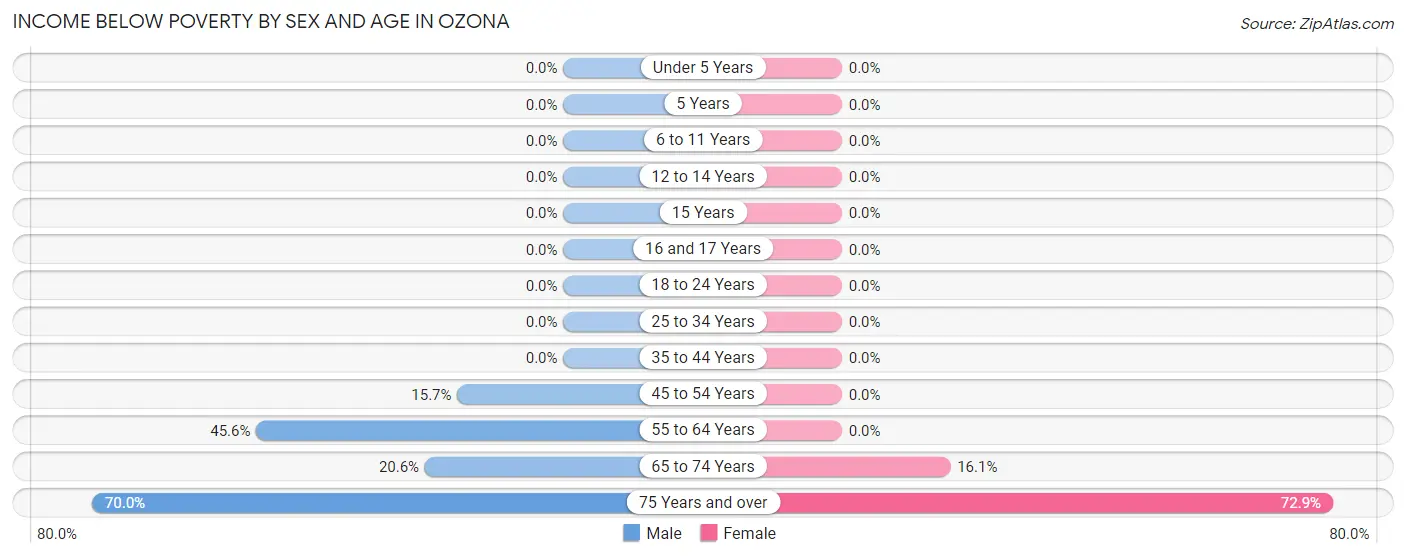
| Age Bracket | Male | Female |
| Under 5 Years | 0 (0.0%) | 0 (0.0%) |
| 5 Years | 0 (0.0%) | 0 (0.0%) |
| 6 to 11 Years | 0 (0.0%) | 0 (0.0%) |
| 12 to 14 Years | 0 (0.0%) | 0 (0.0%) |
| 15 Years | 0 (0.0%) | 0 (0.0%) |
| 16 and 17 Years | 0 (0.0%) | 0 (0.0%) |
| 18 to 24 Years | 0 (0.0%) | 0 (0.0%) |
| 25 to 34 Years | 0 (0.0%) | 0 (0.0%) |
| 35 to 44 Years | 0 (0.0%) | 0 (0.0%) |
| 45 to 54 Years | 31 (15.7%) | 0 (0.0%) |
| 55 to 64 Years | 83 (45.6%) | 0 (0.0%) |
| 65 to 74 Years | 52 (20.5%) | 47 (16.1%) |
| 75 Years and over | 21 (70.0%) | 35 (72.9%) |
| Total | 187 (14.8%) | 82 (8.2%) |
Income Above Poverty by Sex and Age in Ozona
According to the poverty statistics in Ozona, males aged 6 to 11 years and females aged 12 to 14 years are the age groups that are most secure financially, with 100.0% of males and 100.0% of females in these age groups living above the poverty line.
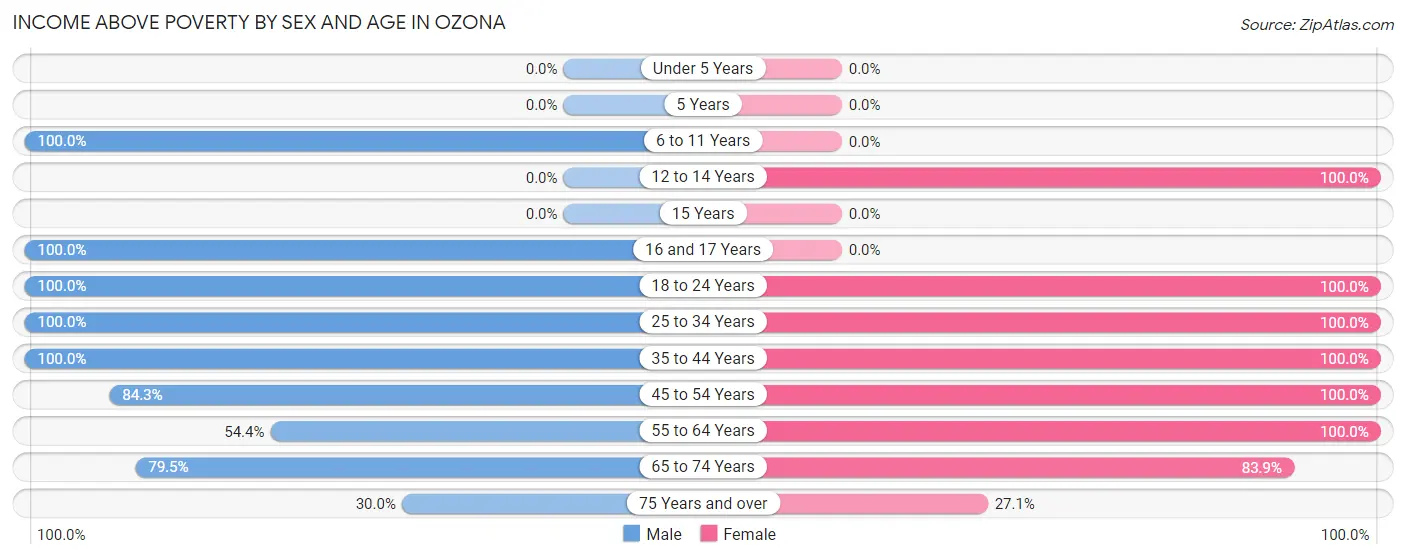
| Age Bracket | Male | Female |
| Under 5 Years | 0 (0.0%) | 0 (0.0%) |
| 5 Years | 0 (0.0%) | 0 (0.0%) |
| 6 to 11 Years | 108 (100.0%) | 0 (0.0%) |
| 12 to 14 Years | 0 (0.0%) | 79 (100.0%) |
| 15 Years | 0 (0.0%) | 0 (0.0%) |
| 16 and 17 Years | 72 (100.0%) | 0 (0.0%) |
| 18 to 24 Years | 37 (100.0%) | 33 (100.0%) |
| 25 to 34 Years | 328 (100.0%) | 128 (100.0%) |
| 35 to 44 Years | 58 (100.0%) | 71 (100.0%) |
| 45 to 54 Years | 166 (84.3%) | 98 (100.0%) |
| 55 to 64 Years | 99 (54.4%) | 251 (100.0%) |
| 65 to 74 Years | 201 (79.4%) | 245 (83.9%) |
| 75 Years and over | 9 (30.0%) | 13 (27.1%) |
| Total | 1,078 (85.2%) | 918 (91.8%) |
Income Below Poverty Among Married-Couple Families in Ozona
The poverty statistics for married-couple families in Ozona show that 10.1% or 68 of the total 672 families live below the poverty line. Families with no children have the highest poverty rate of 12.5%, comprising of 68 families. On the other hand, families with 1 or 2 children have the lowest poverty rate of 0.0%, which includes 0 families.
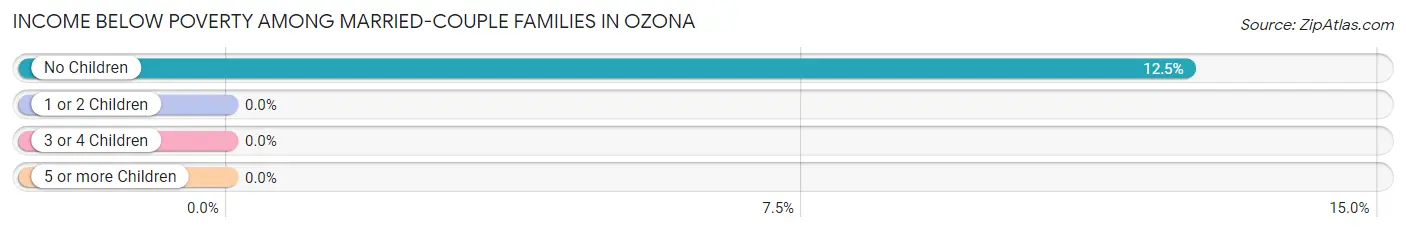
| Children | Above Poverty | Below Poverty |
| No Children | 476 (87.5%) | 68 (12.5%) |
| 1 or 2 Children | 128 (100.0%) | 0 (0.0%) |
| 3 or 4 Children | 0 (0.0%) | 0 (0.0%) |
| 5 or more Children | 0 (0.0%) | 0 (0.0%) |
| Total | 604 (89.9%) | 68 (10.1%) |
Income Below Poverty Among Single-Parent Households in Ozona
| Children | Single Father | Single Mother |
| No Children | 0 (0.0%) | 0 (0.0%) |
| 1 or 2 Children | 0 (0.0%) | 0 (0.0%) |
| 3 or 4 Children | 0 (0.0%) | 0 (0.0%) |
| 5 or more Children | 0 (0.0%) | 0 (0.0%) |
| Total | 0 (0.0%) | 0 (0.0%) |
Income Below Poverty Among Married-Couple vs Single-Parent Households in Ozona
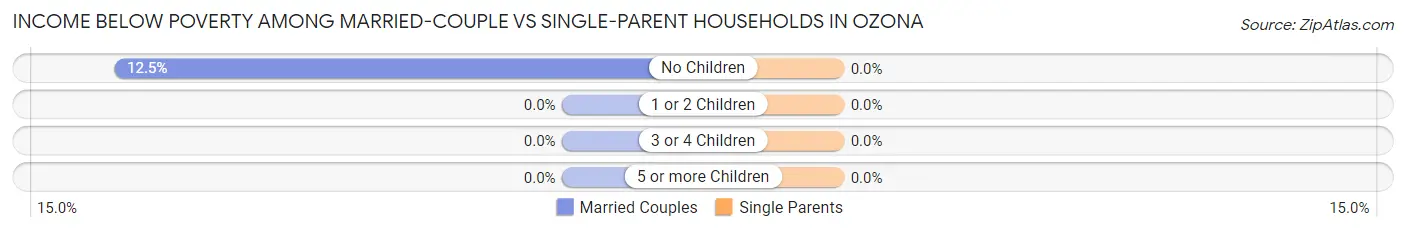
| Children | Married-Couple Families | Single-Parent Households |
| No Children | 68 (12.5%) | 0 (0.0%) |
| 1 or 2 Children | 0 (0.0%) | 0 (0.0%) |
| 3 or 4 Children | 0 (0.0%) | 0 (0.0%) |
| 5 or more Children | 0 (0.0%) | 0 (0.0%) |
| Total | 68 (10.1%) | 0 (0.0%) |
Race in Ozona
The most populous races in Ozona are Hispanic or Latino (1,617 | 70.1%), Some other Race (1,225 | 53.1%), and White / Caucasian (678 | 29.4%).
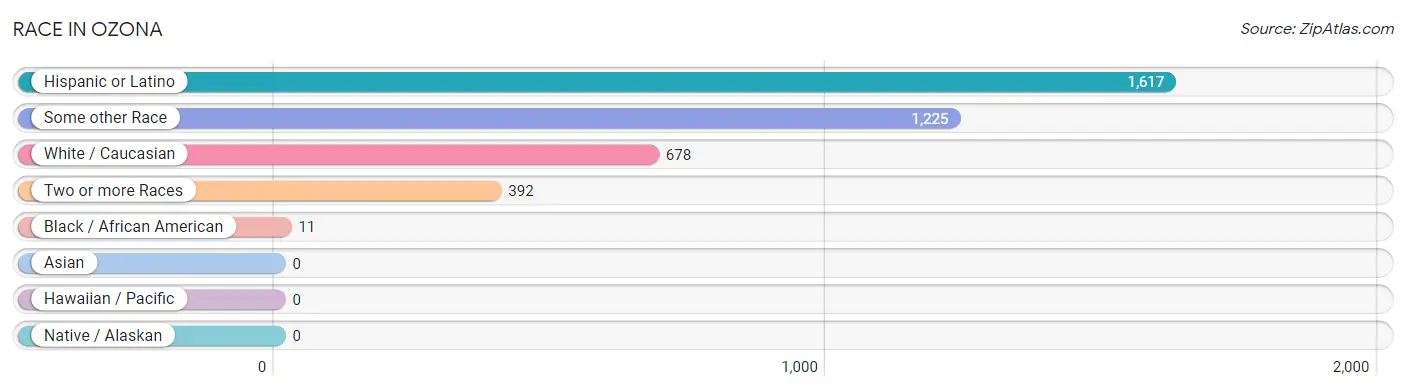
| Race | # Population | % Population |
| Asian | 0 | 0.0% |
| Black / African American | 11 | 0.5% |
| Hawaiian / Pacific | 0 | 0.0% |
| Hispanic or Latino | 1,617 | 70.1% |
| Native / Alaskan | 0 | 0.0% |
| White / Caucasian | 678 | 29.4% |
| Two or more Races | 392 | 17.0% |
| Some other Race | 1,225 | 53.1% |
| Total | 2,306 | 100.0% |
Ancestry in Ozona
The most populous ancestries reported in Ozona are Mexican (1,617 | 70.1%), German (114 | 4.9%), Irish (68 | 2.9%), English (67 | 2.9%), and French (34 | 1.5%), together accounting for 82.4% of all Ozona residents.
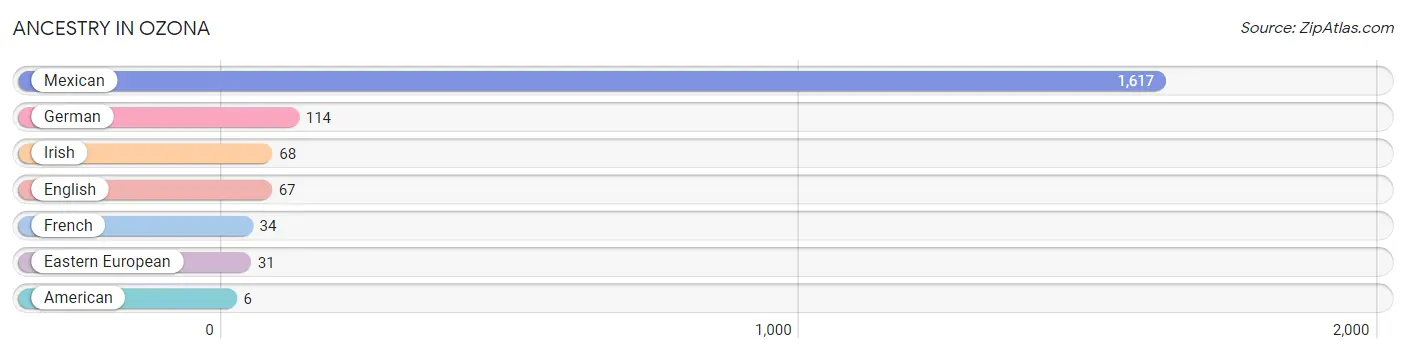
| Ancestry | # Population | % Population |
| American | 6 | 0.3% |
| Eastern European | 31 | 1.3% |
| English | 67 | 2.9% |
| French | 34 | 1.5% |
| German | 114 | 4.9% |
| Irish | 68 | 2.9% |
| Mexican | 1,617 | 70.1% | View All 7 Rows |
Immigrants in Ozona
The most numerous immigrant groups reported in Ozona came from Central America (263 | 11.4%), Latin America (263 | 11.4%), and Mexico (263 | 11.4%), together accounting for 34.2% of all Ozona residents.
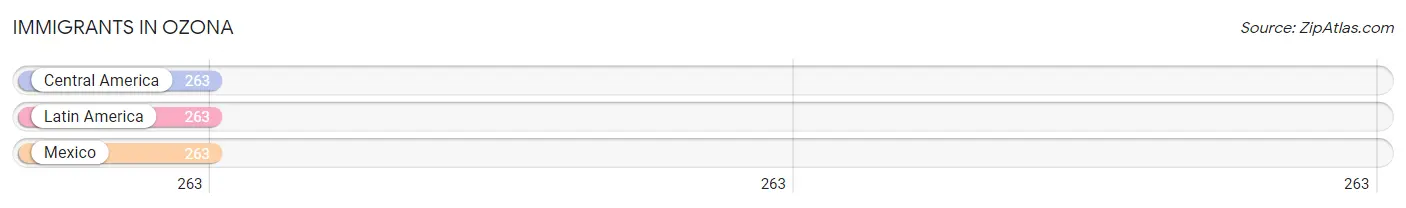
| Immigration Origin | # Population | % Population |
| Central America | 263 | 11.4% |
| Latin America | 263 | 11.4% |
| Mexico | 263 | 11.4% | View All 3 Rows |
Sex and Age in Ozona
Sex and Age in Ozona
The most populous age groups in Ozona are 70 to 74 Years (234 | 18.1%) for men and 70 to 74 Years (234 | 23.0%) for women.
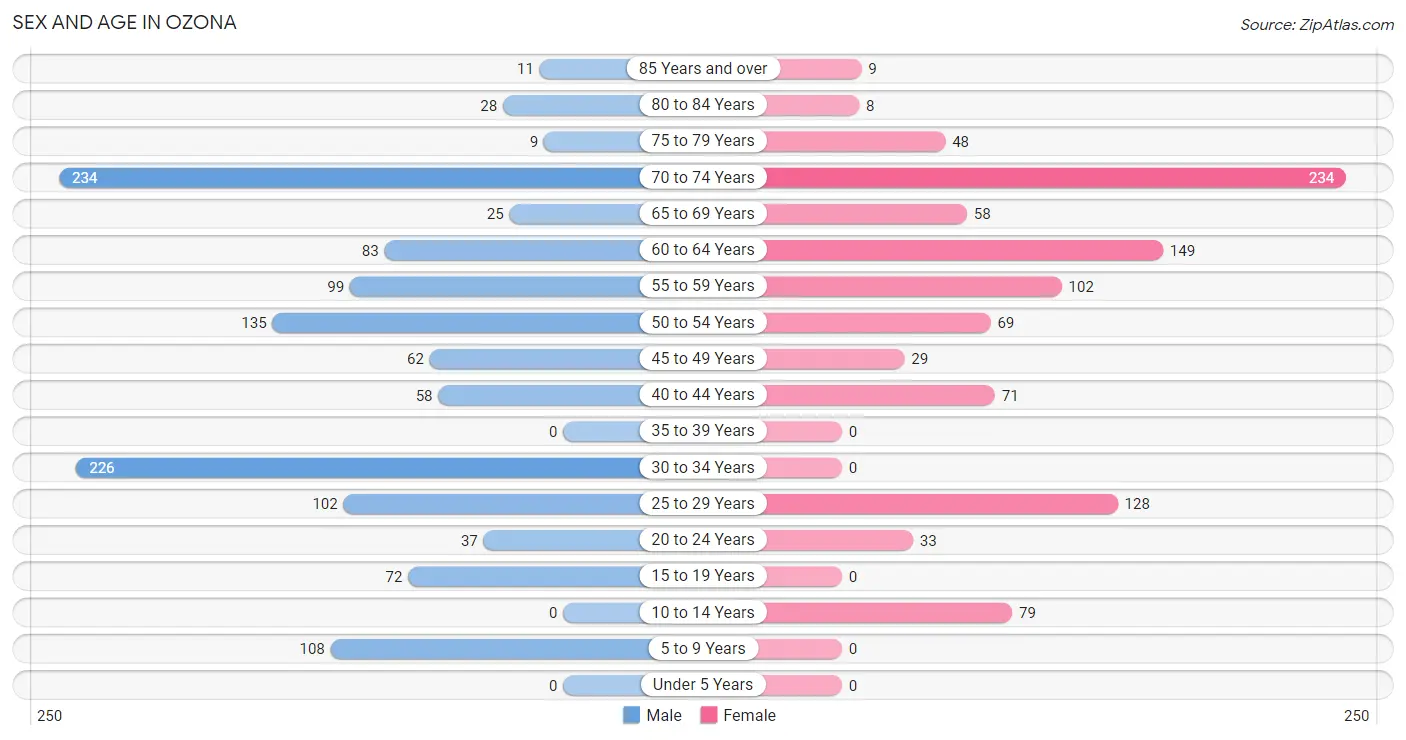
| Age Bracket | Male | Female |
| Under 5 Years | 0 (0.0%) | 0 (0.0%) |
| 5 to 9 Years | 108 (8.4%) | 0 (0.0%) |
| 10 to 14 Years | 0 (0.0%) | 79 (7.8%) |
| 15 to 19 Years | 72 (5.6%) | 0 (0.0%) |
| 20 to 24 Years | 37 (2.9%) | 33 (3.2%) |
| 25 to 29 Years | 102 (7.9%) | 128 (12.6%) |
| 30 to 34 Years | 226 (17.5%) | 0 (0.0%) |
| 35 to 39 Years | 0 (0.0%) | 0 (0.0%) |
| 40 to 44 Years | 58 (4.5%) | 71 (7.0%) |
| 45 to 49 Years | 62 (4.8%) | 29 (2.9%) |
| 50 to 54 Years | 135 (10.5%) | 69 (6.8%) |
| 55 to 59 Years | 99 (7.7%) | 102 (10.0%) |
| 60 to 64 Years | 83 (6.4%) | 149 (14.6%) |
| 65 to 69 Years | 25 (1.9%) | 58 (5.7%) |
| 70 to 74 Years | 234 (18.1%) | 234 (23.0%) |
| 75 to 79 Years | 9 (0.7%) | 48 (4.7%) |
| 80 to 84 Years | 28 (2.2%) | 8 (0.8%) |
| 85 Years and over | 11 (0.9%) | 9 (0.9%) |
| Total | 1,289 (100.0%) | 1,017 (100.0%) |
Families and Households in Ozona
Median Family Size in Ozona
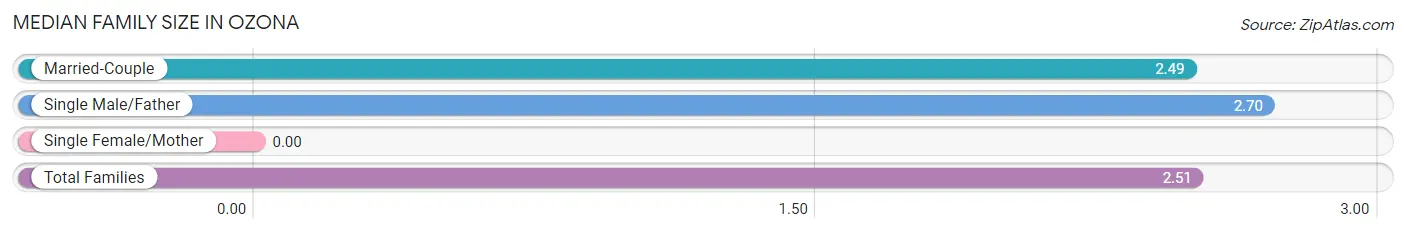
| Family Type | # Families | Family Size |
| Married-Couple | 672 (88.3%) | 2.49 |
| Single Male/Father | 89 (11.7%) | 2.70 |
| Single Female/Mother | 0 (0.0%) | - |
| Total Families | 761 (100.0%) | 2.51 |
Median Household Size in Ozona
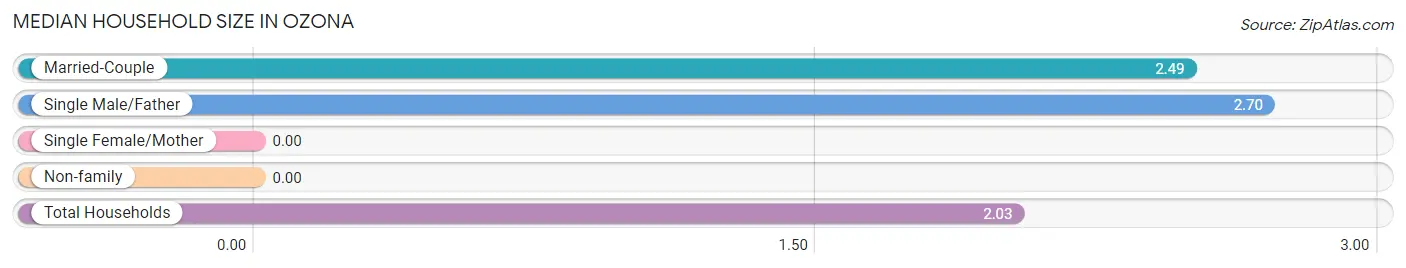
| Household Type | # Households | Household Size |
| Married-Couple | 672 (60.3%) | 2.49 |
| Single Male/Father | 89 (8.0%) | 2.70 |
| Single Female/Mother | 0 (0.0%) | - |
| Non-family | 354 (31.8%) | - |
| Total Households | 1,115 (100.0%) | 2.03 |
Household Size by Marriage Status in Ozona
Out of a total of 1,115 households in Ozona, 761 (68.2%) are family households, while 354 (31.8%) are nonfamily households. The most numerous type of family households are 2-person households, comprising 488, and the most common type of nonfamily households are 1-person households, comprising 354.
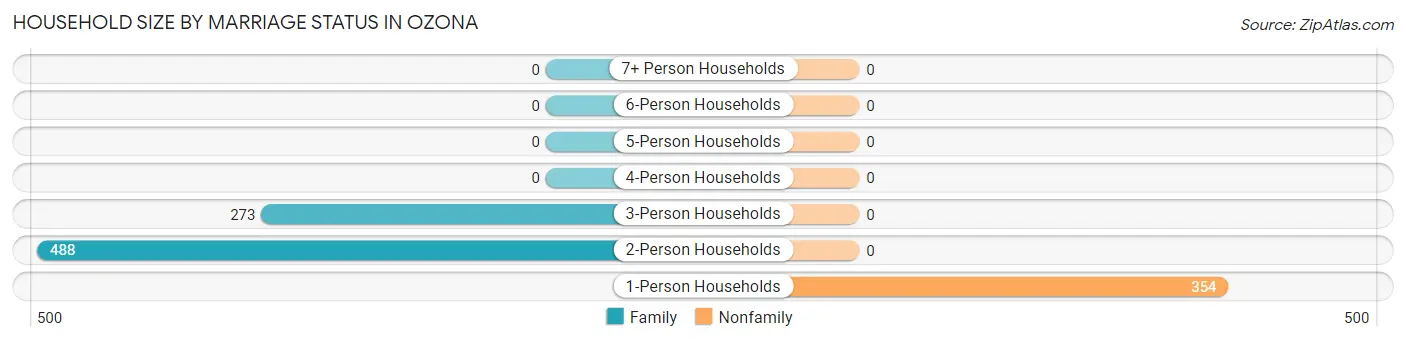
| Household Size | Family Households | Nonfamily Households |
| 1-Person Households | - | 354 (31.8%) |
| 2-Person Households | 488 (43.8%) | 0 (0.0%) |
| 3-Person Households | 273 (24.5%) | 0 (0.0%) |
| 4-Person Households | 0 (0.0%) | 0 (0.0%) |
| 5-Person Households | 0 (0.0%) | 0 (0.0%) |
| 6-Person Households | 0 (0.0%) | 0 (0.0%) |
| 7+ Person Households | 0 (0.0%) | 0 (0.0%) |
| Total | 761 (68.2%) | 354 (31.8%) |
Female Fertility in Ozona
Fertility by Age in Ozona
| Age Bracket | Women with Births | Births / 1,000 Women |
| 15 to 19 years | 0 (0.0%) | 0.0 |
| 20 to 34 years | 0 (0.0%) | 0.0 |
| 35 to 50 years | 0 (0.0%) | 0.0 |
| Total | 0 (0.0%) | 0.0 |
Fertility by Age by Marriage Status in Ozona
| Age Bracket | Married | Unmarried |
| 15 to 19 years | 0 (0.0%) | 0 (0.0%) |
| 20 to 34 years | 0 (0.0%) | 0 (0.0%) |
| 35 to 50 years | 0 (0.0%) | 0 (0.0%) |
| Total | 0 (0.0%) | 0 (0.0%) |
Fertility by Education in Ozona
| Educational Attainment | Women with Births | Births / 1,000 Women |
| Less than High School | 0 (0.0%) | 0.0 |
| High School Diploma | 0 (0.0%) | 0.0 |
| College or Associate's Degree | 0 (0.0%) | 0.0 |
| Bachelor's Degree | 0 (0.0%) | 0.0 |
| Graduate Degree | 0 (0.0%) | 0.0 |
| Total | 0 (0.0%) | 0.0 |
Fertility by Education by Marriage Status in Ozona
| Educational Attainment | Married | Unmarried |
| Less than High School | 0 (0.0%) | 0 (0.0%) |
| High School Diploma | 0 (0.0%) | 0 (0.0%) |
| College or Associate's Degree | 0 (0.0%) | 0 (0.0%) |
| Bachelor's Degree | 0 (0.0%) | 0 (0.0%) |
| Graduate Degree | 0 (0.0%) | 0 (0.0%) |
| Total | 0 (0.0%) | 0 (0.0%) |
Employment Characteristics in Ozona
Employment by Class of Employer in Ozona
Among the 1,301 employed individuals in Ozona, private company employees (626 | 48.1%), state government employees (252 | 19.4%), and self-employed (incorporated) (249 | 19.1%) make up the most common classes of employment.
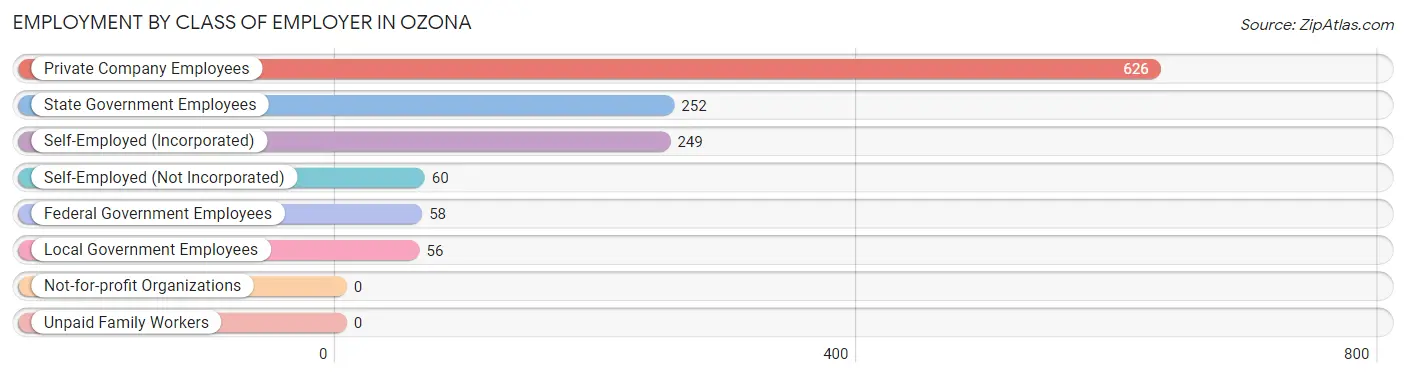
| Employer Class | # Employees | % Employees |
| Private Company Employees | 626 | 48.1% |
| Self-Employed (Incorporated) | 249 | 19.1% |
| Self-Employed (Not Incorporated) | 60 | 4.6% |
| Not-for-profit Organizations | 0 | 0.0% |
| Local Government Employees | 56 | 4.3% |
| State Government Employees | 252 | 19.4% |
| Federal Government Employees | 58 | 4.5% |
| Unpaid Family Workers | 0 | 0.0% |
| Total | 1,301 | 100.0% |
Employment Status by Age in Ozona
According to the labor force statistics for Ozona, out of the total population over 16 years of age (2,119), 62.9% or 1,333 individuals are in the labor force, with 2.3% or 31 of them unemployed. The age group with the highest labor force participation rate is 20 to 24 years, with 100.0% or 70 individuals in the labor force. Within the labor force, the 45 to 54 years age range has the highest percentage of unemployed individuals, with 13.7% or 31 of them being unemployed.
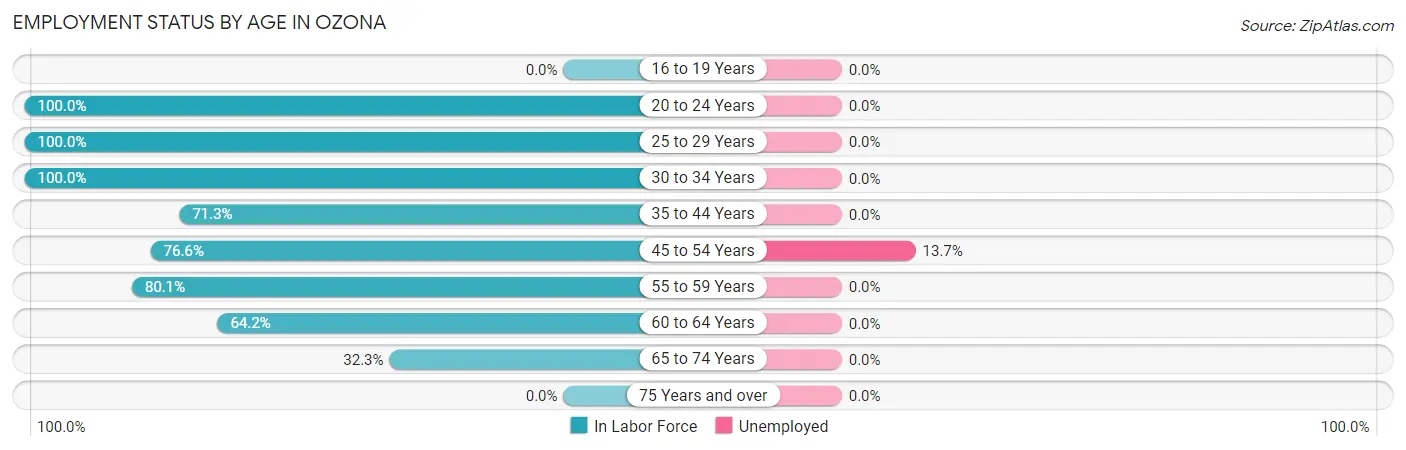
| Age Bracket | In Labor Force | Unemployed |
| 16 to 19 Years | 0 (0.0%) | 0 (0.0%) |
| 20 to 24 Years | 70 (100.0%) | 0 (0.0%) |
| 25 to 29 Years | 230 (100.0%) | 0 (0.0%) |
| 30 to 34 Years | 226 (100.0%) | 0 (0.0%) |
| 35 to 44 Years | 92 (71.3%) | 0 (0.0%) |
| 45 to 54 Years | 226 (76.6%) | 31 (13.7%) |
| 55 to 59 Years | 161 (80.1%) | 0 (0.0%) |
| 60 to 64 Years | 149 (64.2%) | 0 (0.0%) |
| 65 to 74 Years | 178 (32.3%) | 0 (0.0%) |
| 75 Years and over | 0 (0.0%) | 0 (0.0%) |
| Total | 1,333 (62.9%) | 31 (2.3%) |
Employment Status by Educational Attainment in Ozona
According to labor force statistics for Ozona, 82.6% of individuals (1,085) out of the total population between 25 and 64 years of age (1,313) are in the labor force, with 2.9% or 31 of them being unemployed. The group with the highest labor force participation rate are those with the educational attainment of college / associate degree, with 100.0% or 342 individuals in the labor force. Within the labor force, individuals with college / associate degree education have the highest percentage of unemployment, with 9.1% or 31 of them being unemployed.
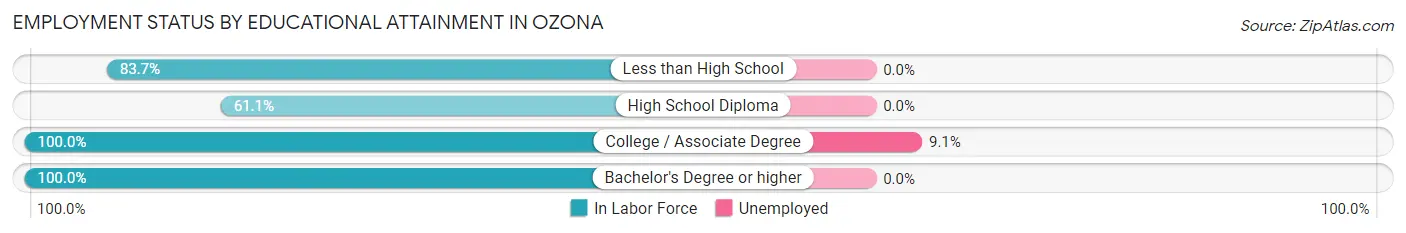
| Educational Attainment | In Labor Force | Unemployed |
| Less than High School | 355 (83.7%) | 0 (0.0%) |
| High School Diploma | 251 (61.1%) | 0 (0.0%) |
| College / Associate Degree | 342 (100.0%) | 31 (9.1%) |
| Bachelor's Degree or higher | 136 (100.0%) | 0 (0.0%) |
| Total | 1,085 (82.6%) | 38 (2.9%) |
Employment Occupations by Sex in Ozona
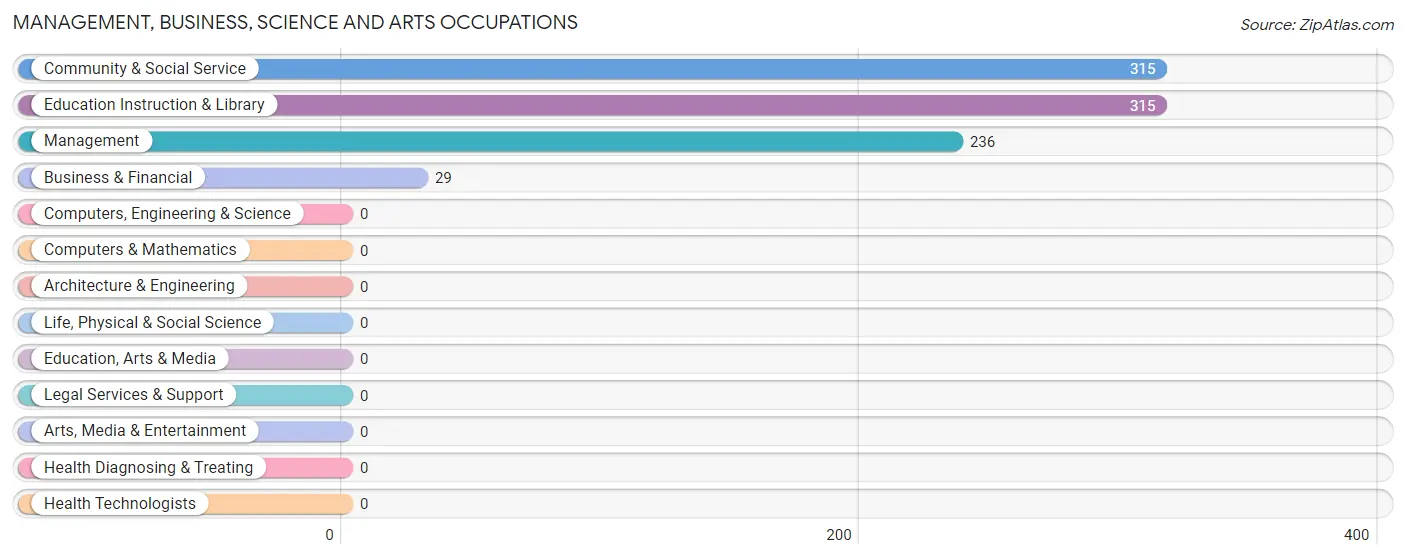
Management, Business, Science and Arts Occupations
The most common Management, Business, Science and Arts occupations in Ozona are Community & Social Service (315 | 24.2%), Education Instruction & Library (315 | 24.2%), Management (236 | 18.1%), and Business & Financial (29 | 2.2%).
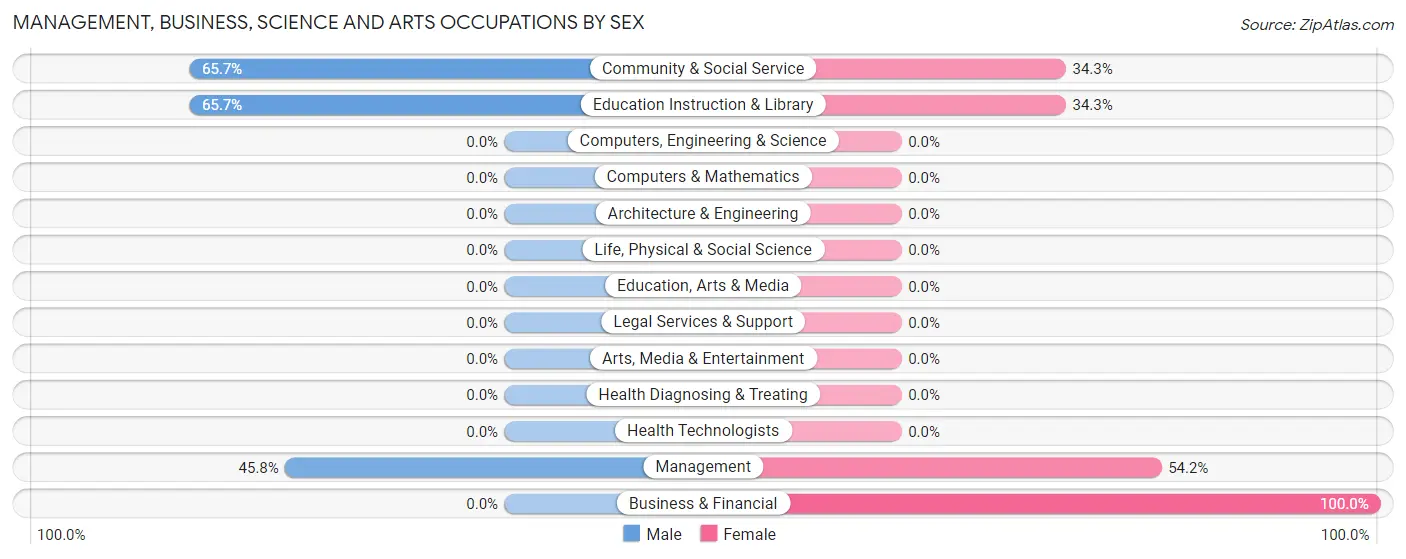
Management, Business, Science and Arts Occupations by Sex
Within the Management, Business, Science and Arts occupations in Ozona, the most male-oriented occupations are Community & Social Service (65.7%), Education Instruction & Library (65.7%), and Management (45.8%), while the most female-oriented occupations are Business & Financial (100.0%), Management (54.2%), and Community & Social Service (34.3%).
| Occupation | Male | Female |
| Management | 108 (45.8%) | 128 (54.2%) |
| Business & Financial | 0 (0.0%) | 29 (100.0%) |
| Computers, Engineering & Science | 0 (0.0%) | 0 (0.0%) |
| Computers & Mathematics | 0 (0.0%) | 0 (0.0%) |
| Architecture & Engineering | 0 (0.0%) | 0 (0.0%) |
| Life, Physical & Social Science | 0 (0.0%) | 0 (0.0%) |
| Community & Social Service | 207 (65.7%) | 108 (34.3%) |
| Education, Arts & Media | 0 (0.0%) | 0 (0.0%) |
| Legal Services & Support | 0 (0.0%) | 0 (0.0%) |
| Education Instruction & Library | 207 (65.7%) | 108 (34.3%) |
| Arts, Media & Entertainment | 0 (0.0%) | 0 (0.0%) |
| Health Diagnosing & Treating | 0 (0.0%) | 0 (0.0%) |
| Health Technologists | 0 (0.0%) | 0 (0.0%) |
| Total (Category) | 315 (54.3%) | 265 (45.7%) |
| Total (Overall) | 719 (55.3%) | 582 (44.7%) |
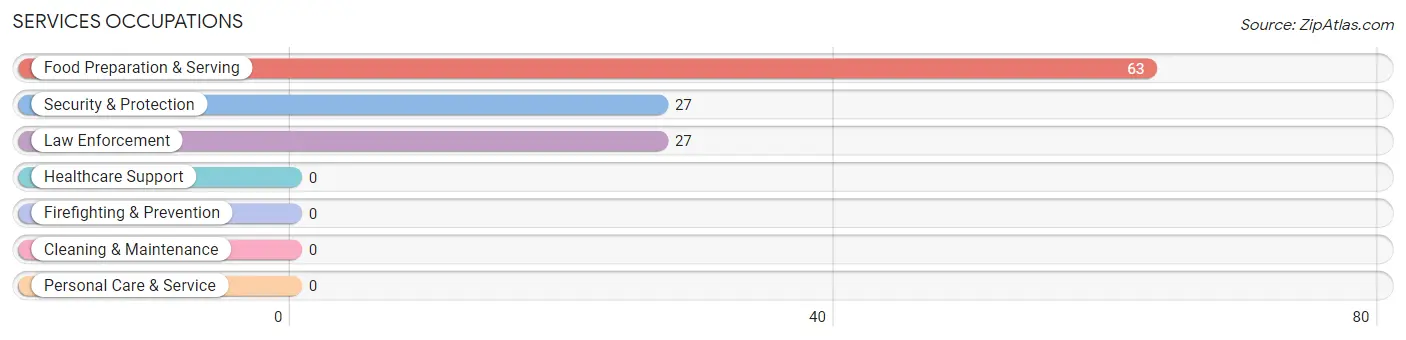
Services Occupations
The most common Services occupations in Ozona are Food Preparation & Serving (63 | 4.8%), Security & Protection (27 | 2.1%), and Law Enforcement (27 | 2.1%).
Services Occupations by Sex
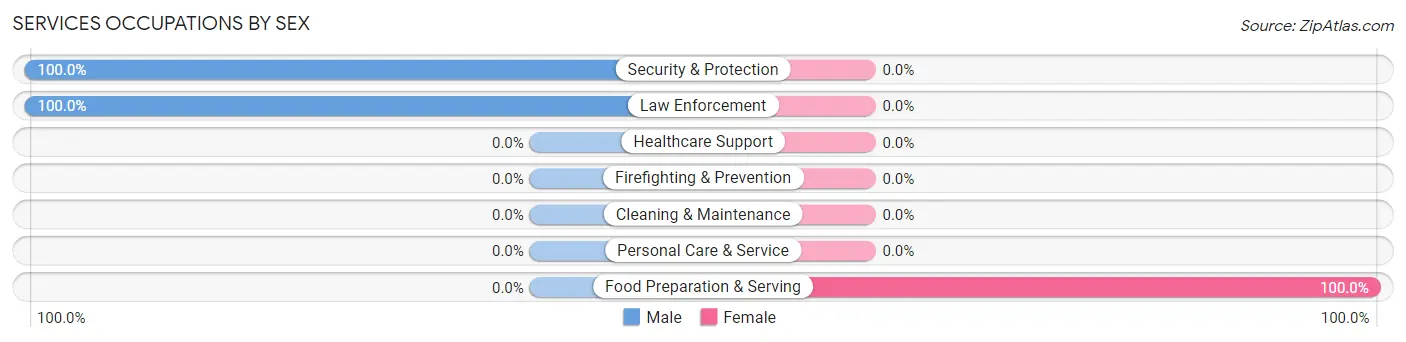
| Occupation | Male | Female |
| Healthcare Support | 0 (0.0%) | 0 (0.0%) |
| Security & Protection | 27 (100.0%) | 0 (0.0%) |
| Firefighting & Prevention | 0 (0.0%) | 0 (0.0%) |
| Law Enforcement | 27 (100.0%) | 0 (0.0%) |
| Food Preparation & Serving | 0 (0.0%) | 63 (100.0%) |
| Cleaning & Maintenance | 0 (0.0%) | 0 (0.0%) |
| Personal Care & Service | 0 (0.0%) | 0 (0.0%) |
| Total (Category) | 27 (30.0%) | 63 (70.0%) |
| Total (Overall) | 719 (55.3%) | 582 (44.7%) |
Sales and Office Occupations
The most common Sales and Office occupations in Ozona are Office & Administration (126 | 9.7%), and Sales & Related (62 | 4.8%).
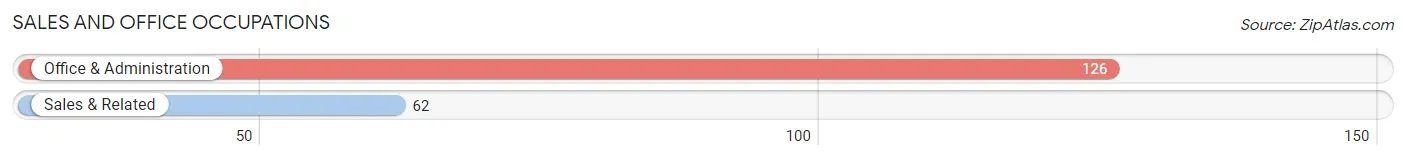
Sales and Office Occupations by Sex
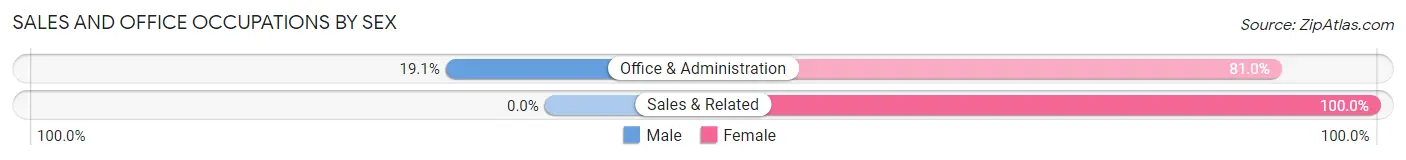
| Occupation | Male | Female |
| Sales & Related | 0 (0.0%) | 62 (100.0%) |
| Office & Administration | 24 (19.1%) | 102 (80.9%) |
| Total (Category) | 24 (12.8%) | 164 (87.2%) |
| Total (Overall) | 719 (55.3%) | 582 (44.7%) |
Natural Resources, Construction and Maintenance Occupations
The most common Natural Resources, Construction and Maintenance occupations in Ozona are Construction & Extraction (207 | 15.9%), and Installation, Maintenance & Repair (100 | 7.7%).
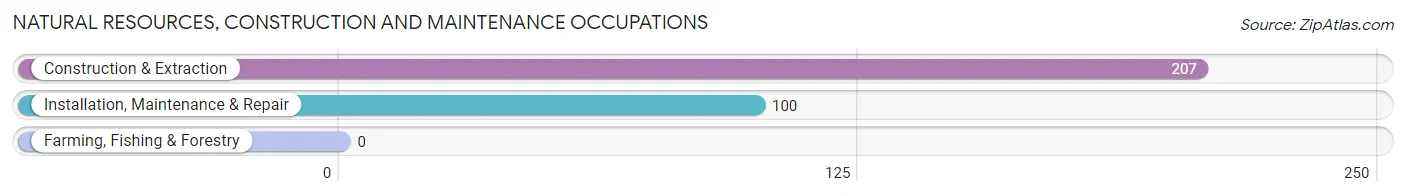
Natural Resources, Construction and Maintenance Occupations by Sex
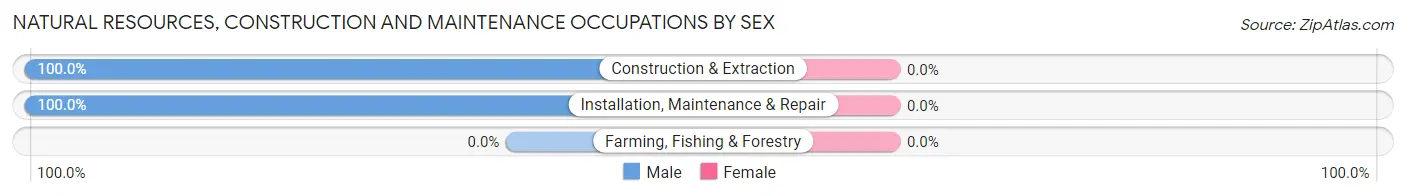
| Occupation | Male | Female |
| Farming, Fishing & Forestry | 0 (0.0%) | 0 (0.0%) |
| Construction & Extraction | 207 (100.0%) | 0 (0.0%) |
| Installation, Maintenance & Repair | 100 (100.0%) | 0 (0.0%) |
| Total (Category) | 307 (100.0%) | 0 (0.0%) |
| Total (Overall) | 719 (55.3%) | 582 (44.7%) |
Production, Transportation and Moving Occupations
The most common Production, Transportation and Moving occupations in Ozona are Transportation (90 | 6.9%), and Material Moving (46 | 3.5%).
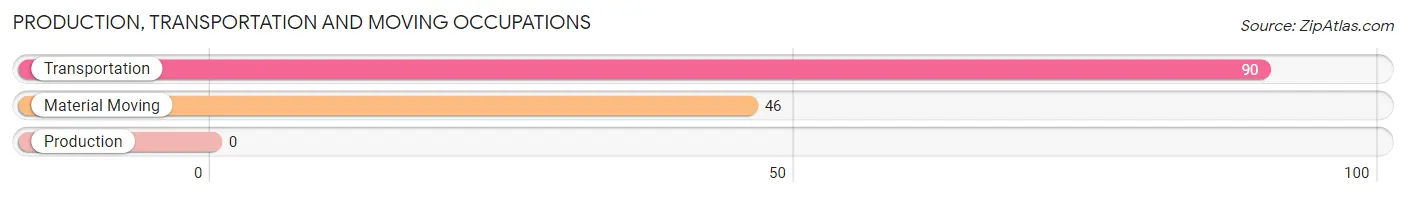
Production, Transportation and Moving Occupations by Sex
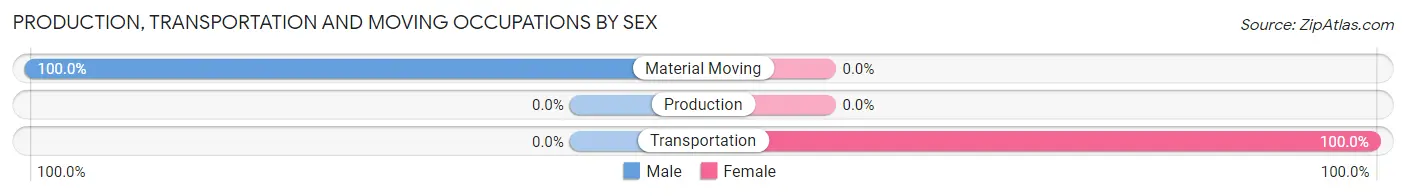
| Occupation | Male | Female |
| Production | 0 (0.0%) | 0 (0.0%) |
| Transportation | 0 (0.0%) | 90 (100.0%) |
| Material Moving | 46 (100.0%) | 0 (0.0%) |
| Total (Category) | 46 (33.8%) | 90 (66.2%) |
| Total (Overall) | 719 (55.3%) | 582 (44.7%) |
Employment Industries by Sex in Ozona
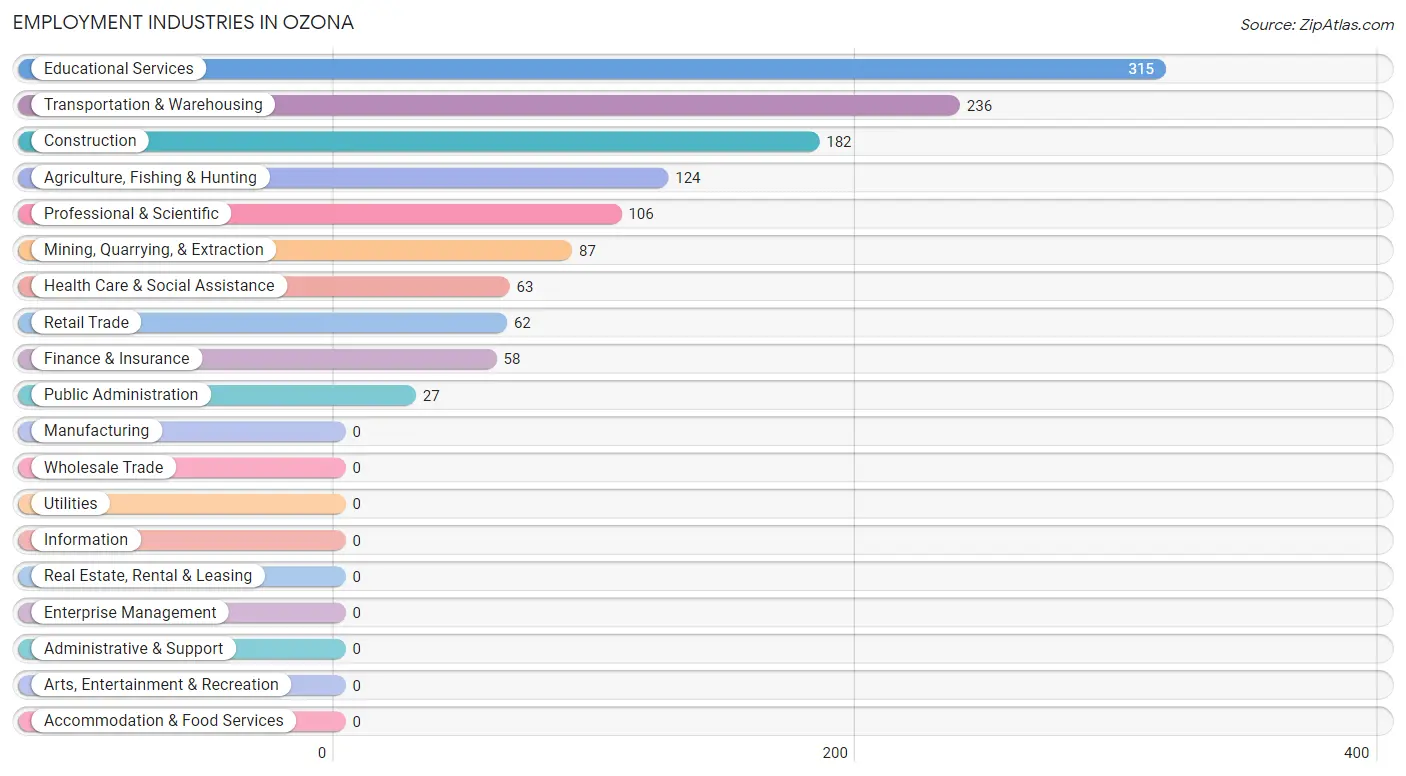
Employment Industries in Ozona
The major employment industries in Ozona include Educational Services (315 | 24.2%), Transportation & Warehousing (236 | 18.1%), Construction (182 | 14.0%), Agriculture, Fishing & Hunting (124 | 9.5%), and Professional & Scientific (106 | 8.2%).
Employment Industries by Sex in Ozona
The Ozona industries that see more men than women are Construction (100.0%), Public Administration (100.0%), and Professional & Scientific (72.6%), whereas the industries that tend to have a higher number of women are Retail Trade (100.0%), Finance & Insurance (100.0%), and Health Care & Social Assistance (100.0%).
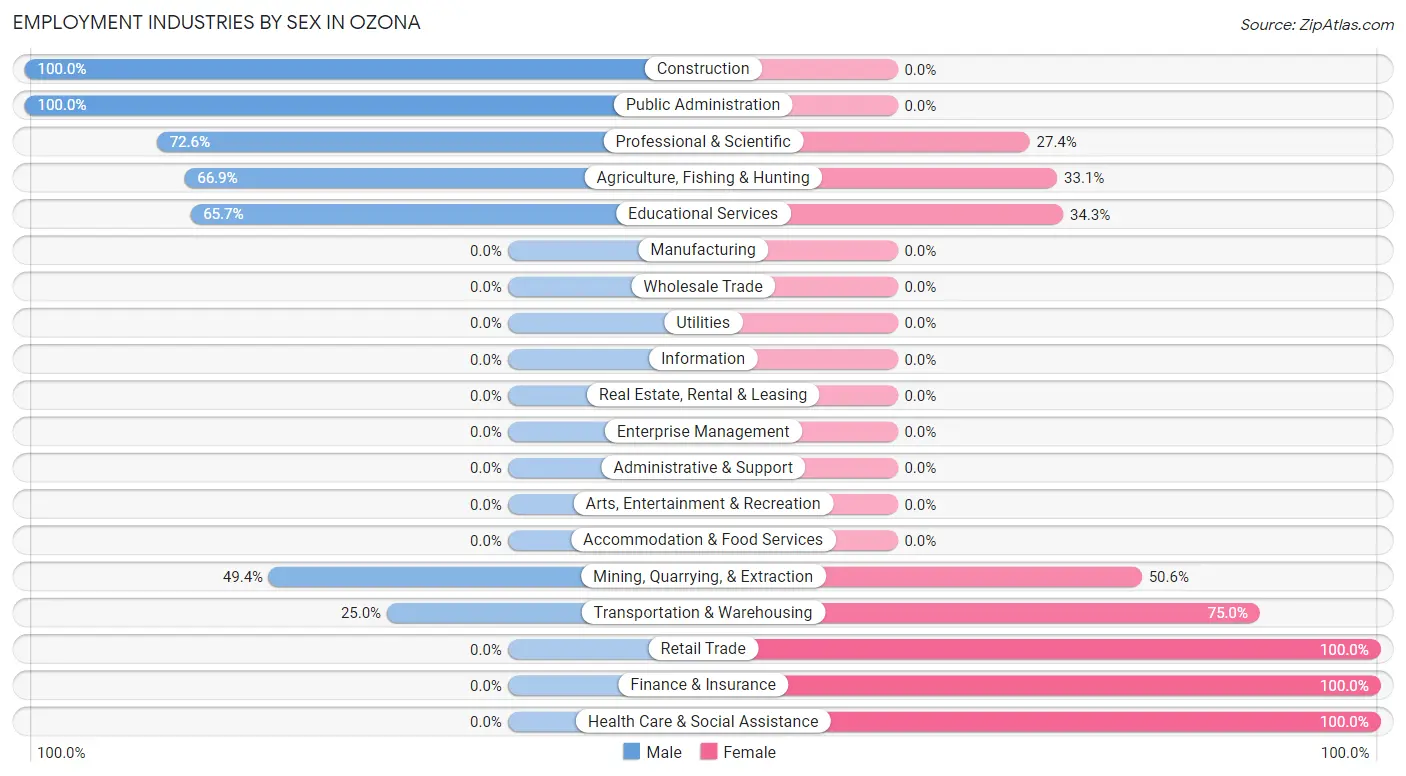
| Industry | Male | Female |
| Agriculture, Fishing & Hunting | 83 (66.9%) | 41 (33.1%) |
| Mining, Quarrying, & Extraction | 43 (49.4%) | 44 (50.6%) |
| Construction | 182 (100.0%) | 0 (0.0%) |
| Manufacturing | 0 (0.0%) | 0 (0.0%) |
| Wholesale Trade | 0 (0.0%) | 0 (0.0%) |
| Retail Trade | 0 (0.0%) | 62 (100.0%) |
| Transportation & Warehousing | 59 (25.0%) | 177 (75.0%) |
| Utilities | 0 (0.0%) | 0 (0.0%) |
| Information | 0 (0.0%) | 0 (0.0%) |
| Finance & Insurance | 0 (0.0%) | 58 (100.0%) |
| Real Estate, Rental & Leasing | 0 (0.0%) | 0 (0.0%) |
| Professional & Scientific | 77 (72.6%) | 29 (27.4%) |
| Enterprise Management | 0 (0.0%) | 0 (0.0%) |
| Administrative & Support | 0 (0.0%) | 0 (0.0%) |
| Educational Services | 207 (65.7%) | 108 (34.3%) |
| Health Care & Social Assistance | 0 (0.0%) | 63 (100.0%) |
| Arts, Entertainment & Recreation | 0 (0.0%) | 0 (0.0%) |
| Accommodation & Food Services | 0 (0.0%) | 0 (0.0%) |
| Public Administration | 27 (100.0%) | 0 (0.0%) |
| Total | 719 (55.3%) | 582 (44.7%) |
Education in Ozona
School Enrollment in Ozona
The most common levels of schooling among the 259 students in Ozona are elementary school (108 | 41.7%), middle school (79 | 30.5%), and high school (72 | 27.8%).
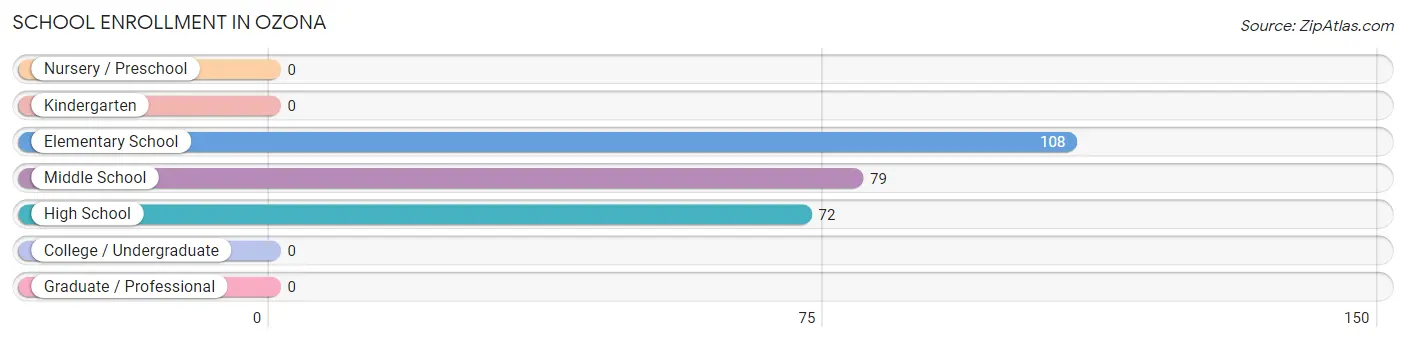
| School Level | # Students | % Students |
| Nursery / Preschool | 0 | 0.0% |
| Kindergarten | 0 | 0.0% |
| Elementary School | 108 | 41.7% |
| Middle School | 79 | 30.5% |
| High School | 72 | 27.8% |
| College / Undergraduate | 0 | 0.0% |
| Graduate / Professional | 0 | 0.0% |
| Total | 259 | 100.0% |
School Enrollment by Age by Funding Source in Ozona
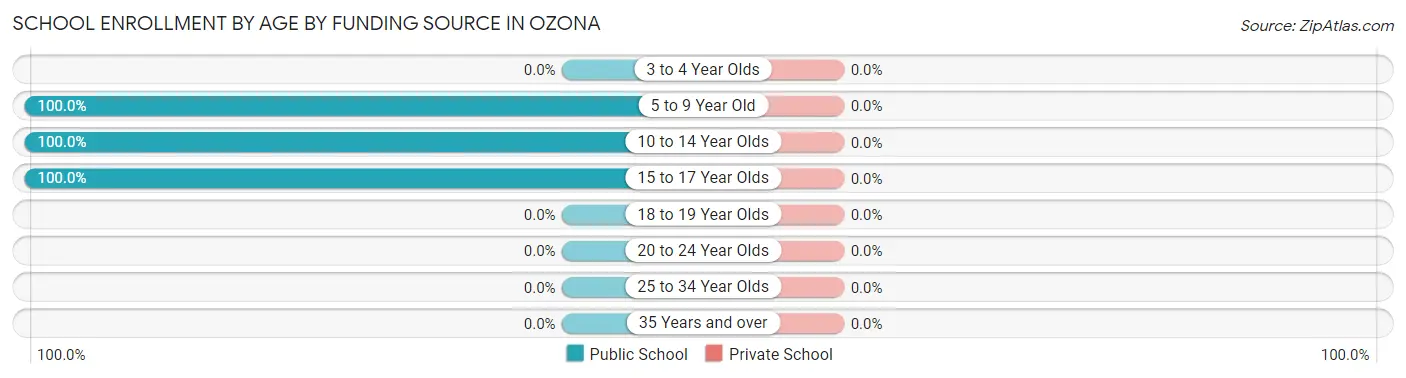
| Age Bracket | Public School | Private School |
| 3 to 4 Year Olds | 0 (0.0%) | 0 (0.0%) |
| 5 to 9 Year Old | 108 (100.0%) | 0 (0.0%) |
| 10 to 14 Year Olds | 79 (100.0%) | 0 (0.0%) |
| 15 to 17 Year Olds | 72 (100.0%) | 0 (0.0%) |
| 18 to 19 Year Olds | 0 (0.0%) | 0 (0.0%) |
| 20 to 24 Year Olds | 0 (0.0%) | 0 (0.0%) |
| 25 to 34 Year Olds | 0 (0.0%) | 0 (0.0%) |
| 35 Years and over | 0 (0.0%) | 0 (0.0%) |
| Total | 259 (100.0%) | 0 (0.0%) |
Educational Attainment by Field of Study in Ozona
Education (185 | 75.2%), literature & languages (32 | 13.0%), and business (29 | 11.8%) are the most common fields of study among 246 individuals in Ozona who have obtained a bachelor's degree or higher.
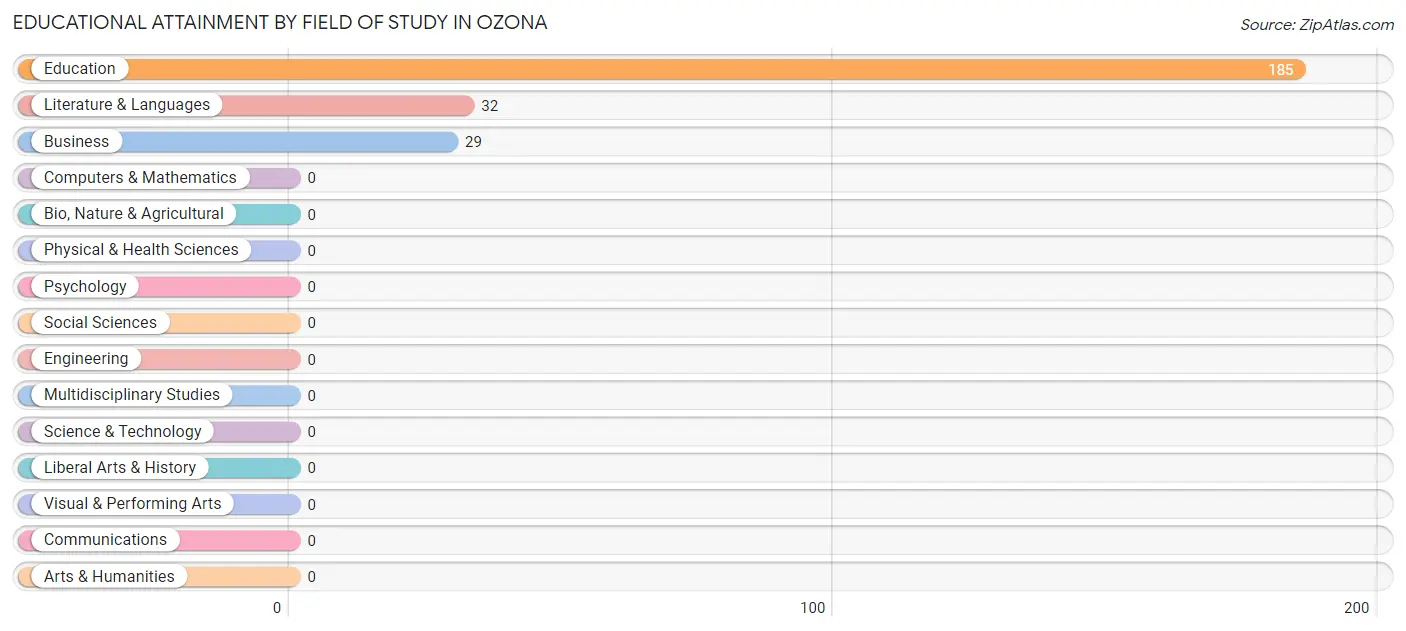
| Field of Study | # Graduates | % Graduates |
| Computers & Mathematics | 0 | 0.0% |
| Bio, Nature & Agricultural | 0 | 0.0% |
| Physical & Health Sciences | 0 | 0.0% |
| Psychology | 0 | 0.0% |
| Social Sciences | 0 | 0.0% |
| Engineering | 0 | 0.0% |
| Multidisciplinary Studies | 0 | 0.0% |
| Science & Technology | 0 | 0.0% |
| Business | 29 | 11.8% |
| Education | 185 | 75.2% |
| Literature & Languages | 32 | 13.0% |
| Liberal Arts & History | 0 | 0.0% |
| Visual & Performing Arts | 0 | 0.0% |
| Communications | 0 | 0.0% |
| Arts & Humanities | 0 | 0.0% |
| Total | 246 | 100.0% |
Transportation & Commute in Ozona
Vehicle Availability by Sex in Ozona
The most prevalent vehicle ownership categories in Ozona are males with 2 vehicles (334, accounting for 46.5%) and females with 2 vehicles (156, making up 57.4%).
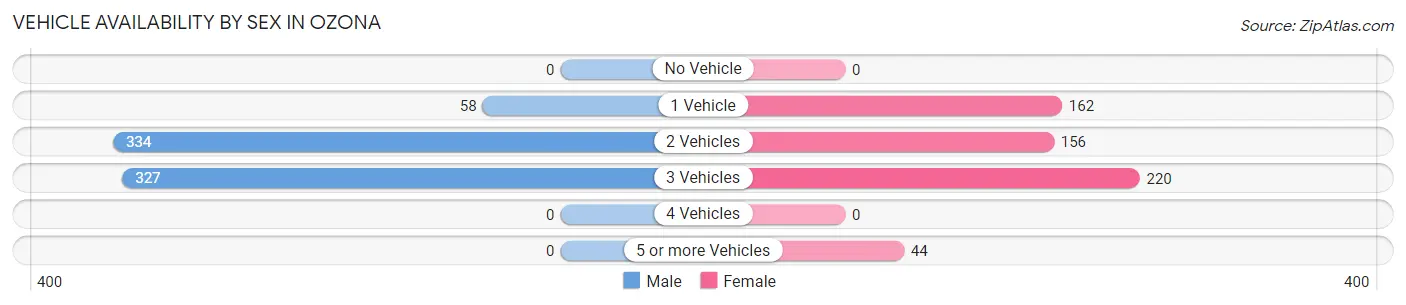
| Vehicles Available | Male | Female |
| No Vehicle | 0 (0.0%) | 0 (0.0%) |
| 1 Vehicle | 58 (8.1%) | 162 (27.8%) |
| 2 Vehicles | 334 (46.5%) | 156 (26.8%) |
| 3 Vehicles | 327 (45.5%) | 220 (37.8%) |
| 4 Vehicles | 0 (0.0%) | 0 (0.0%) |
| 5 or more Vehicles | 0 (0.0%) | 44 (7.6%) |
| Total | 719 (100.0%) | 582 (100.0%) |
Commute Time in Ozona
The most frequently occuring commute durations in Ozona are 5 to 9 minutes (417 commuters, 33.2%), less than 5 minutes (324 commuters, 25.8%), and 90 or more minutes (291 commuters, 23.2%).
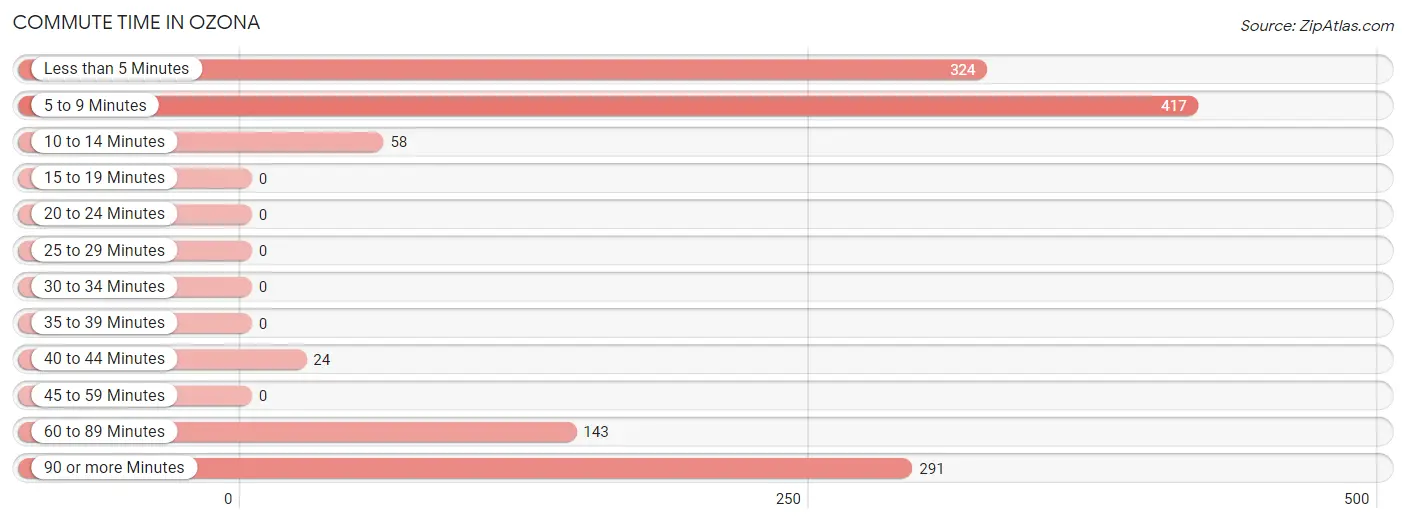
| Commute Time | # Commuters | % Commuters |
| Less than 5 Minutes | 324 | 25.8% |
| 5 to 9 Minutes | 417 | 33.2% |
| 10 to 14 Minutes | 58 | 4.6% |
| 15 to 19 Minutes | 0 | 0.0% |
| 20 to 24 Minutes | 0 | 0.0% |
| 25 to 29 Minutes | 0 | 0.0% |
| 30 to 34 Minutes | 0 | 0.0% |
| 35 to 39 Minutes | 0 | 0.0% |
| 40 to 44 Minutes | 24 | 1.9% |
| 45 to 59 Minutes | 0 | 0.0% |
| 60 to 89 Minutes | 143 | 11.4% |
| 90 or more Minutes | 291 | 23.2% |
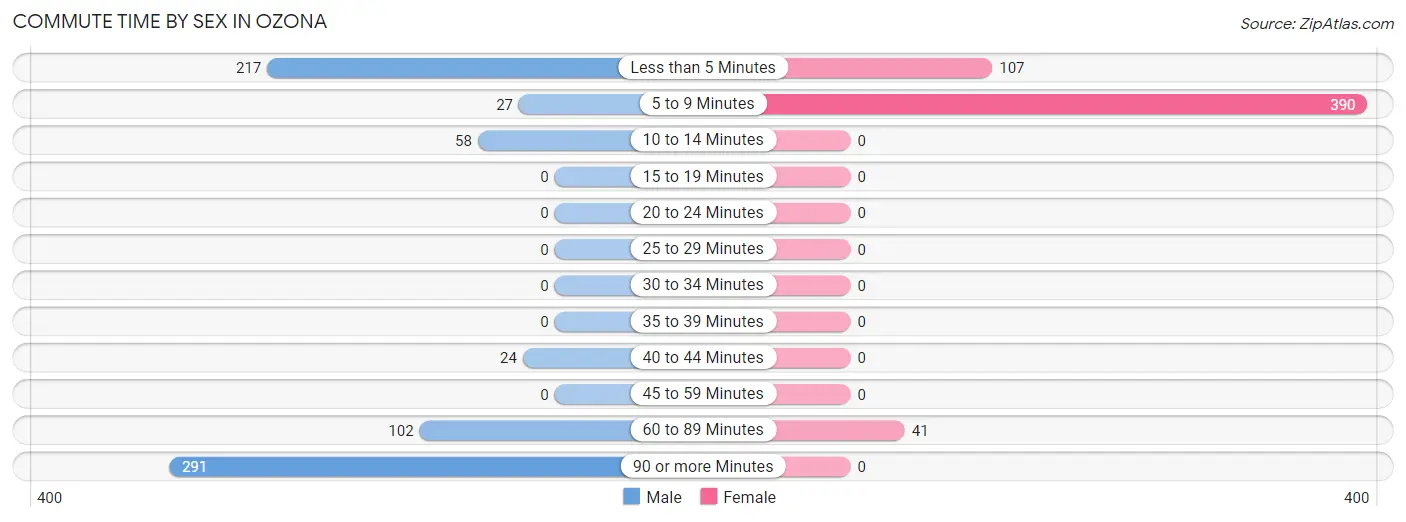
Commute Time by Sex in Ozona
The most common commute times in Ozona are 90 or more minutes (291 commuters, 40.5%) for males and 5 to 9 minutes (390 commuters, 72.5%) for females.
| Commute Time | Male | Female |
| Less than 5 Minutes | 217 (30.2%) | 107 (19.9%) |
| 5 to 9 Minutes | 27 (3.8%) | 390 (72.5%) |
| 10 to 14 Minutes | 58 (8.1%) | 0 (0.0%) |
| 15 to 19 Minutes | 0 (0.0%) | 0 (0.0%) |
| 20 to 24 Minutes | 0 (0.0%) | 0 (0.0%) |
| 25 to 29 Minutes | 0 (0.0%) | 0 (0.0%) |
| 30 to 34 Minutes | 0 (0.0%) | 0 (0.0%) |
| 35 to 39 Minutes | 0 (0.0%) | 0 (0.0%) |
| 40 to 44 Minutes | 24 (3.3%) | 0 (0.0%) |
| 45 to 59 Minutes | 0 (0.0%) | 0 (0.0%) |
| 60 to 89 Minutes | 102 (14.2%) | 41 (7.6%) |
| 90 or more Minutes | 291 (40.5%) | 0 (0.0%) |
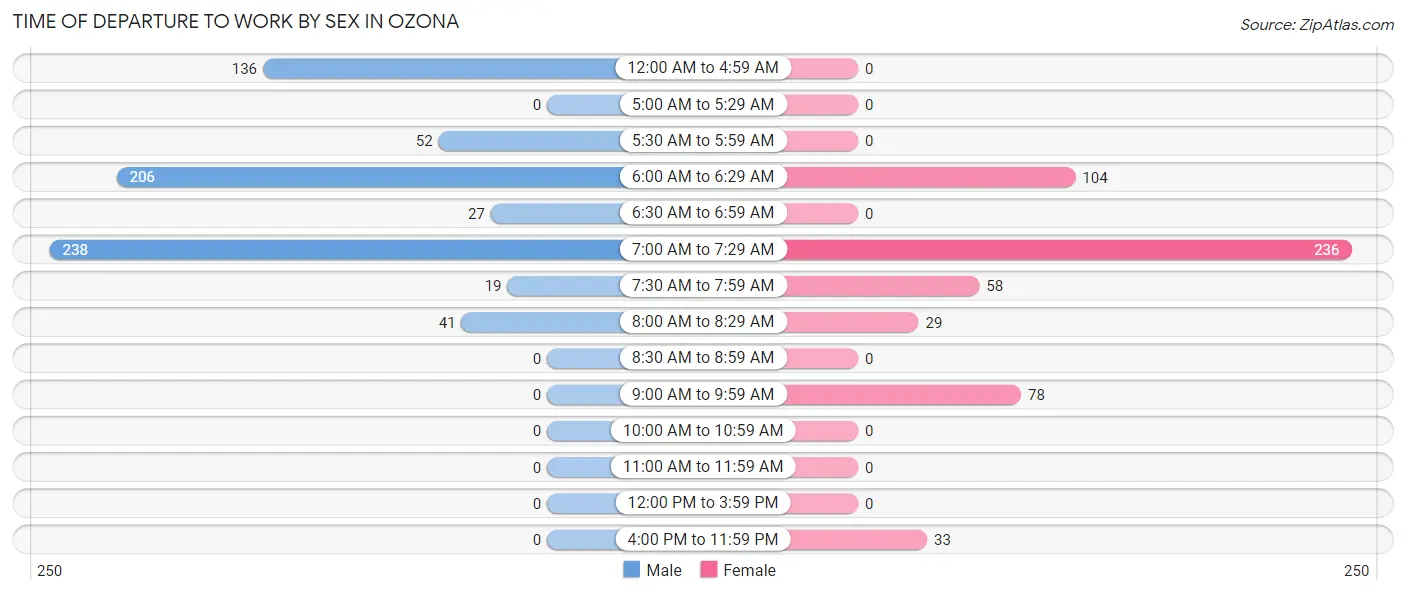
Time of Departure to Work by Sex in Ozona
The most frequent times of departure to work in Ozona are 7:00 AM to 7:29 AM (238, 33.1%) for males and 7:00 AM to 7:29 AM (236, 43.9%) for females.
| Time of Departure | Male | Female |
| 12:00 AM to 4:59 AM | 136 (18.9%) | 0 (0.0%) |
| 5:00 AM to 5:29 AM | 0 (0.0%) | 0 (0.0%) |
| 5:30 AM to 5:59 AM | 52 (7.2%) | 0 (0.0%) |
| 6:00 AM to 6:29 AM | 206 (28.6%) | 104 (19.3%) |
| 6:30 AM to 6:59 AM | 27 (3.8%) | 0 (0.0%) |
| 7:00 AM to 7:29 AM | 238 (33.1%) | 236 (43.9%) |
| 7:30 AM to 7:59 AM | 19 (2.6%) | 58 (10.8%) |
| 8:00 AM to 8:29 AM | 41 (5.7%) | 29 (5.4%) |
| 8:30 AM to 8:59 AM | 0 (0.0%) | 0 (0.0%) |
| 9:00 AM to 9:59 AM | 0 (0.0%) | 78 (14.5%) |
| 10:00 AM to 10:59 AM | 0 (0.0%) | 0 (0.0%) |
| 11:00 AM to 11:59 AM | 0 (0.0%) | 0 (0.0%) |
| 12:00 PM to 3:59 PM | 0 (0.0%) | 0 (0.0%) |
| 4:00 PM to 11:59 PM | 0 (0.0%) | 33 (6.1%) |
| Total | 719 (100.0%) | 538 (100.0%) |
Housing Occupancy in Ozona
Occupancy by Ownership in Ozona
Of the total 1,115 dwellings in Ozona, owner-occupied units account for 804 (72.1%), while renter-occupied units make up 311 (27.9%).
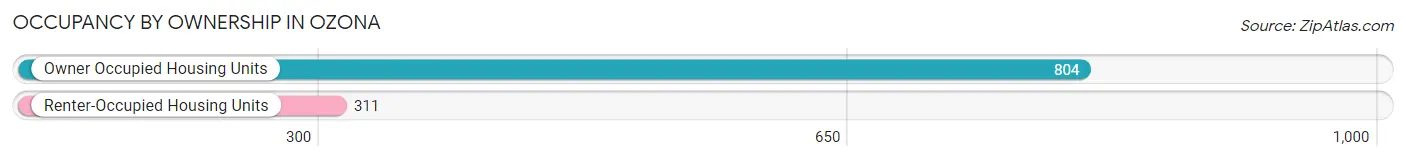
| Occupancy | # Housing Units | % Housing Units |
| Owner Occupied Housing Units | 804 | 72.1% |
| Renter-Occupied Housing Units | 311 | 27.9% |
| Total Occupied Housing Units | 1,115 | 100.0% |
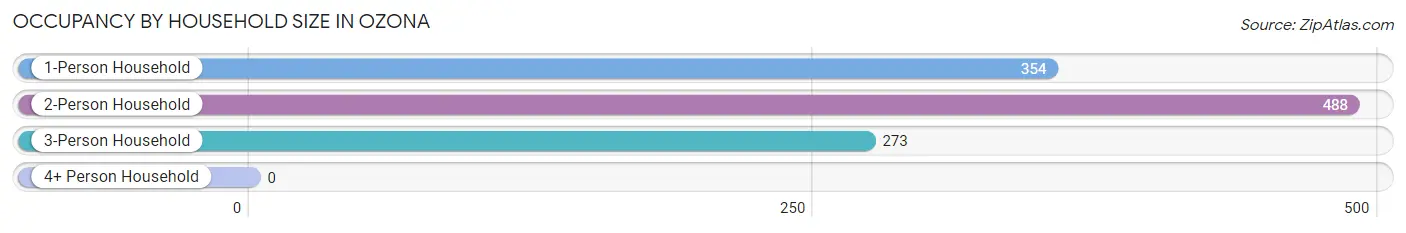
Occupancy by Household Size in Ozona
| Household Size | # Housing Units | % Housing Units |
| 1-Person Household | 354 | 31.8% |
| 2-Person Household | 488 | 43.8% |
| 3-Person Household | 273 | 24.5% |
| 4+ Person Household | 0 | 0.0% |
| Total Housing Units | 1,115 | 100.0% |
Occupancy by Ownership by Household Size in Ozona
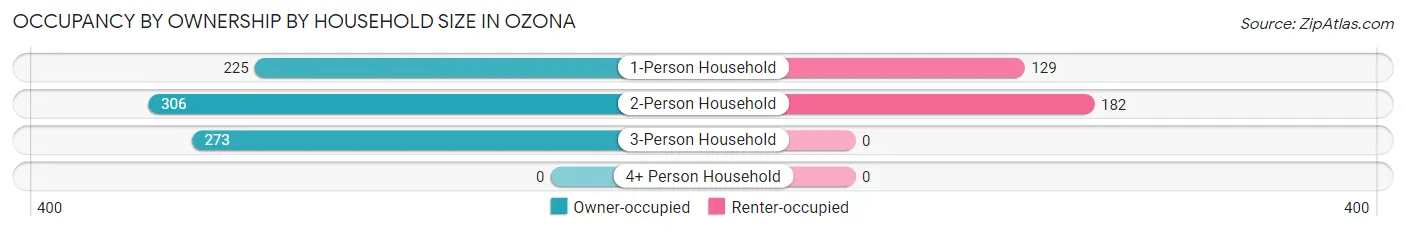
| Household Size | Owner-occupied | Renter-occupied |
| 1-Person Household | 225 (63.6%) | 129 (36.4%) |
| 2-Person Household | 306 (62.7%) | 182 (37.3%) |
| 3-Person Household | 273 (100.0%) | 0 (0.0%) |
| 4+ Person Household | 0 (0.0%) | 0 (0.0%) |
| Total Housing Units | 804 (72.1%) | 311 (27.9%) |
Occupancy by Educational Attainment in Ozona
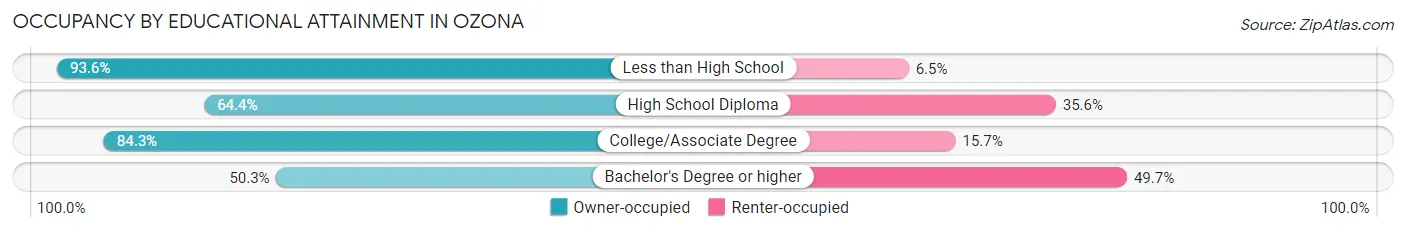
| Household Size | Owner-occupied | Renter-occupied |
| Less than High School | 145 (93.5%) | 10 (6.5%) |
| High School Diploma | 282 (64.4%) | 156 (35.6%) |
| College/Associate Degree | 284 (84.3%) | 53 (15.7%) |
| Bachelor's Degree or higher | 93 (50.3%) | 92 (49.7%) |
Occupancy by Age of Householder in Ozona
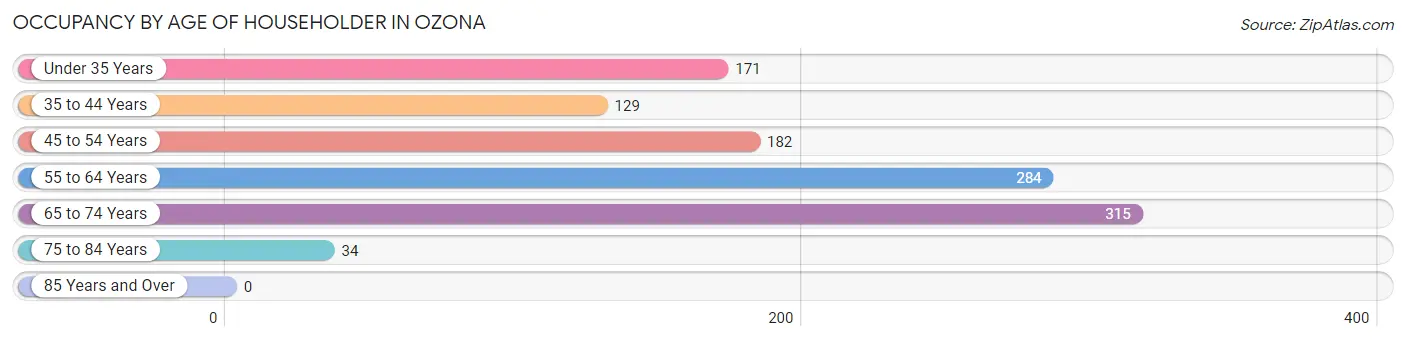
| Age Bracket | # Households | % Households |
| Under 35 Years | 171 | 15.3% |
| 35 to 44 Years | 129 | 11.6% |
| 45 to 54 Years | 182 | 16.3% |
| 55 to 64 Years | 284 | 25.5% |
| 65 to 74 Years | 315 | 28.2% |
| 75 to 84 Years | 34 | 3.0% |
| 85 Years and Over | 0 | 0.0% |
| Total | 1,115 | 100.0% |
Housing Finances in Ozona
Median Income by Occupancy in Ozona
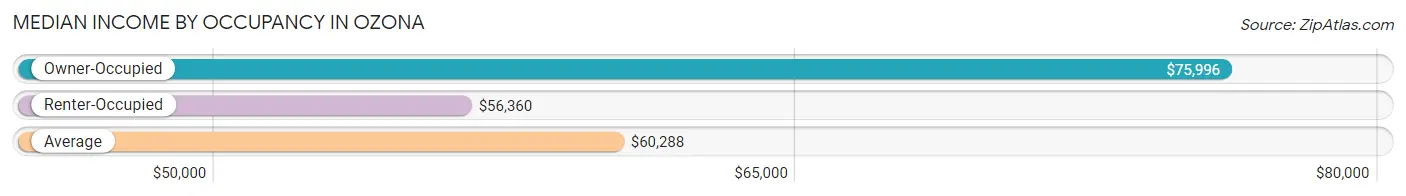
| Occupancy Type | # Households | Median Income |
| Owner-Occupied | 804 (72.1%) | $75,996 |
| Renter-Occupied | 311 (27.9%) | $56,360 |
| Average | 1,115 (100.0%) | $60,288 |
Occupancy by Householder Income Bracket in Ozona
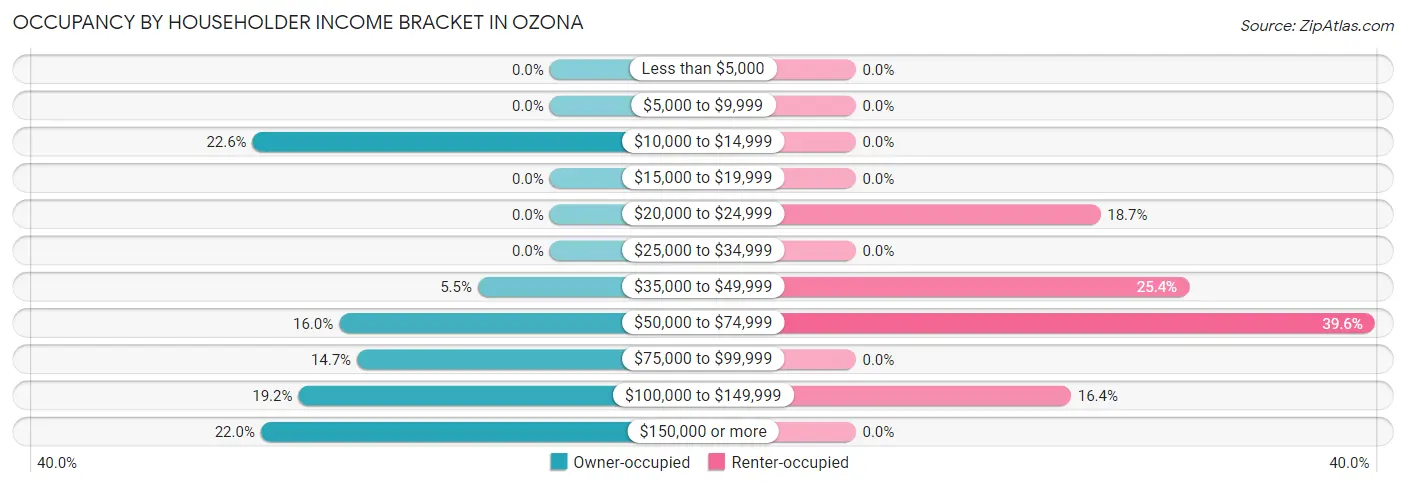
| Income Bracket | Owner-occupied | Renter-occupied |
| Less than $5,000 | 0 (0.0%) | 0 (0.0%) |
| $5,000 to $9,999 | 0 (0.0%) | 0 (0.0%) |
| $10,000 to $14,999 | 182 (22.6%) | 0 (0.0%) |
| $15,000 to $19,999 | 0 (0.0%) | 0 (0.0%) |
| $20,000 to $24,999 | 0 (0.0%) | 58 (18.6%) |
| $25,000 to $34,999 | 0 (0.0%) | 0 (0.0%) |
| $35,000 to $49,999 | 44 (5.5%) | 79 (25.4%) |
| $50,000 to $74,999 | 129 (16.0%) | 123 (39.6%) |
| $75,000 to $99,999 | 118 (14.7%) | 0 (0.0%) |
| $100,000 to $149,999 | 154 (19.2%) | 51 (16.4%) |
| $150,000 or more | 177 (22.0%) | 0 (0.0%) |
| Total | 804 (100.0%) | 311 (100.0%) |
Monthly Housing Cost Tiers in Ozona
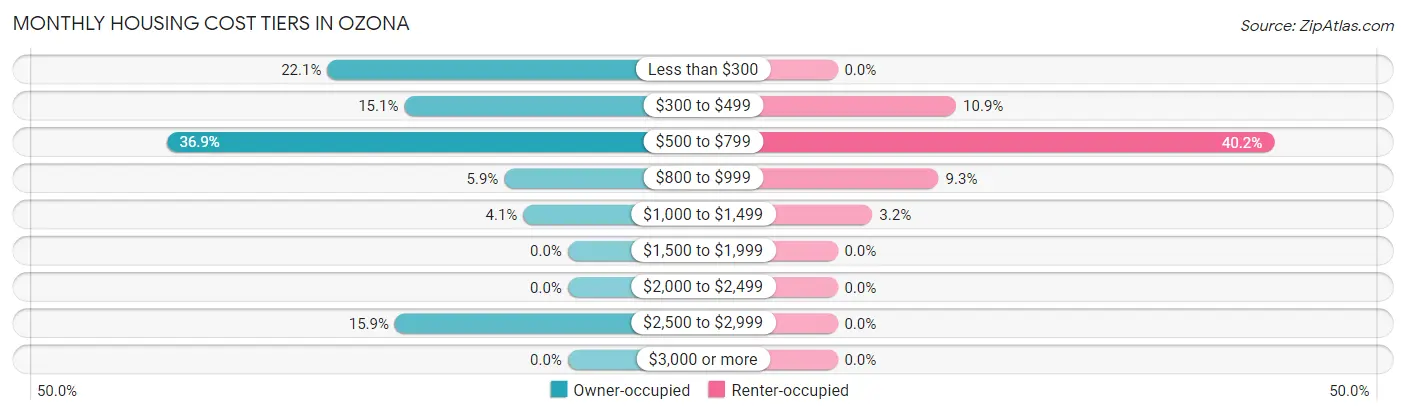
| Monthly Cost | Owner-occupied | Renter-occupied |
| Less than $300 | 178 (22.1%) | 0 (0.0%) |
| $300 to $499 | 121 (15.0%) | 34 (10.9%) |
| $500 to $799 | 297 (36.9%) | 125 (40.2%) |
| $800 to $999 | 47 (5.9%) | 29 (9.3%) |
| $1,000 to $1,499 | 33 (4.1%) | 10 (3.2%) |
| $1,500 to $1,999 | 0 (0.0%) | 0 (0.0%) |
| $2,000 to $2,499 | 0 (0.0%) | 0 (0.0%) |
| $2,500 to $2,999 | 128 (15.9%) | 0 (0.0%) |
| $3,000 or more | 0 (0.0%) | 0 (0.0%) |
| Total | 804 (100.0%) | 311 (100.0%) |
Physical Housing Characteristics in Ozona
Housing Structures in Ozona
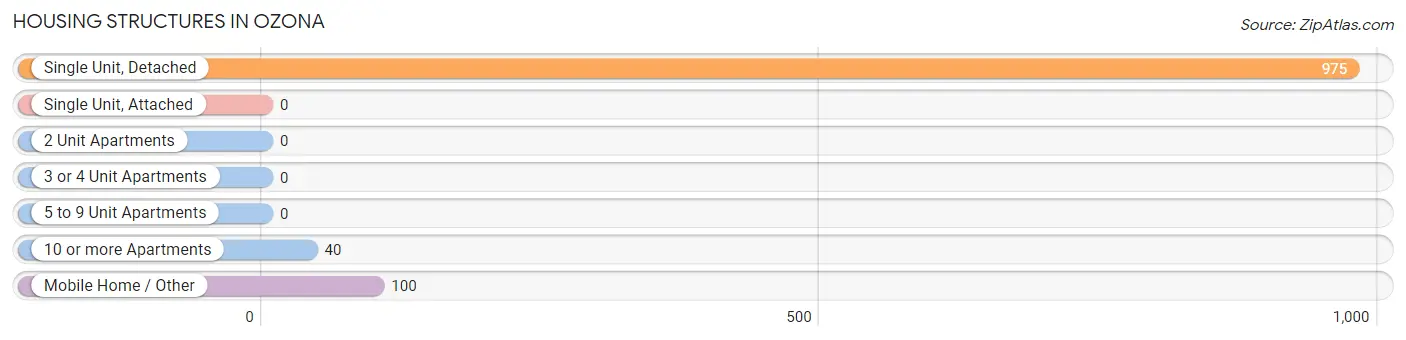
| Structure Type | # Housing Units | % Housing Units |
| Single Unit, Detached | 975 | 87.4% |
| Single Unit, Attached | 0 | 0.0% |
| 2 Unit Apartments | 0 | 0.0% |
| 3 or 4 Unit Apartments | 0 | 0.0% |
| 5 to 9 Unit Apartments | 0 | 0.0% |
| 10 or more Apartments | 40 | 3.6% |
| Mobile Home / Other | 100 | 9.0% |
| Total | 1,115 | 100.0% |
Housing Structures by Occupancy in Ozona
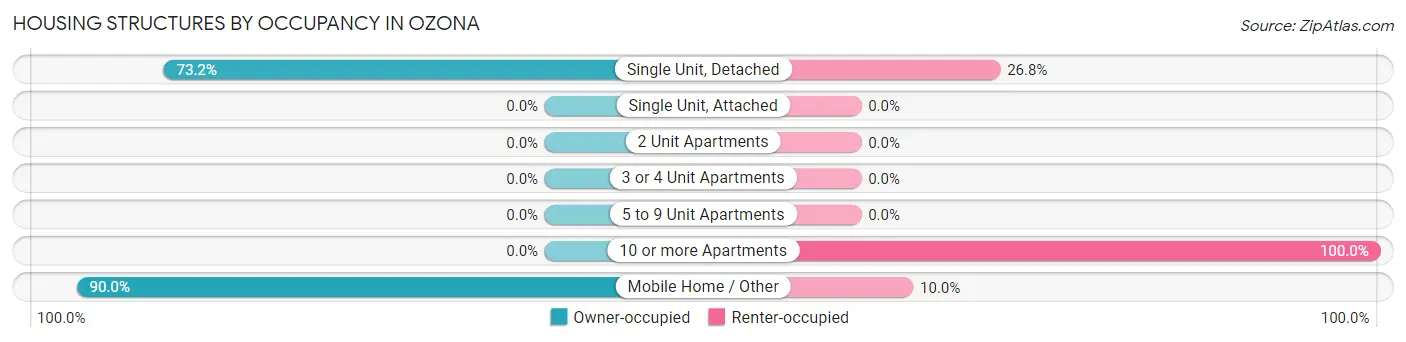
| Structure Type | Owner-occupied | Renter-occupied |
| Single Unit, Detached | 714 (73.2%) | 261 (26.8%) |
| Single Unit, Attached | 0 (0.0%) | 0 (0.0%) |
| 2 Unit Apartments | 0 (0.0%) | 0 (0.0%) |
| 3 or 4 Unit Apartments | 0 (0.0%) | 0 (0.0%) |
| 5 to 9 Unit Apartments | 0 (0.0%) | 0 (0.0%) |
| 10 or more Apartments | 0 (0.0%) | 40 (100.0%) |
| Mobile Home / Other | 90 (90.0%) | 10 (10.0%) |
| Total | 804 (72.1%) | 311 (27.9%) |
Housing Structures by Number of Rooms in Ozona
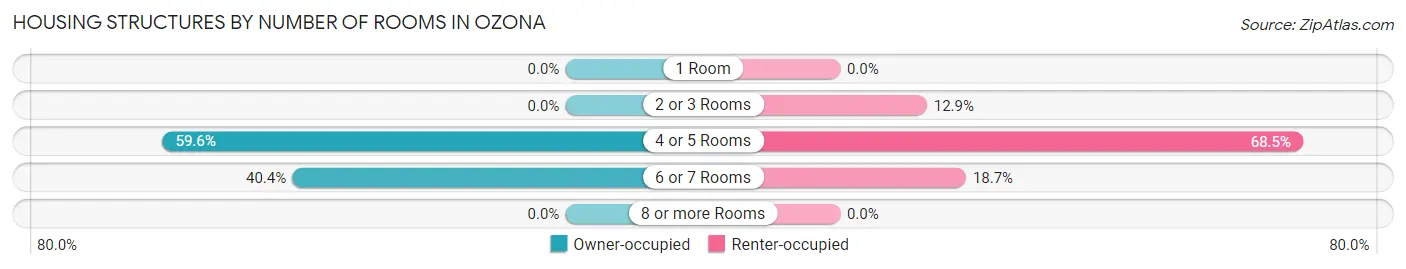
| Number of Rooms | Owner-occupied | Renter-occupied |
| 1 Room | 0 (0.0%) | 0 (0.0%) |
| 2 or 3 Rooms | 0 (0.0%) | 40 (12.9%) |
| 4 or 5 Rooms | 479 (59.6%) | 213 (68.5%) |
| 6 or 7 Rooms | 325 (40.4%) | 58 (18.6%) |
| 8 or more Rooms | 0 (0.0%) | 0 (0.0%) |
| Total | 804 (100.0%) | 311 (100.0%) |
Housing Structure by Heating Type in Ozona
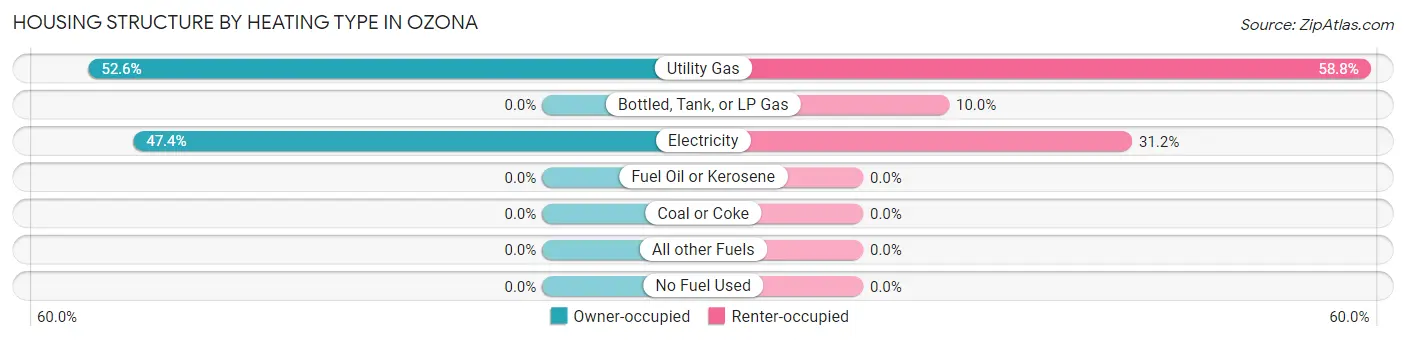
| Heating Type | Owner-occupied | Renter-occupied |
| Utility Gas | 423 (52.6%) | 183 (58.8%) |
| Bottled, Tank, or LP Gas | 0 (0.0%) | 31 (10.0%) |
| Electricity | 381 (47.4%) | 97 (31.2%) |
| Fuel Oil or Kerosene | 0 (0.0%) | 0 (0.0%) |
| Coal or Coke | 0 (0.0%) | 0 (0.0%) |
| All other Fuels | 0 (0.0%) | 0 (0.0%) |
| No Fuel Used | 0 (0.0%) | 0 (0.0%) |
| Total | 804 (100.0%) | 311 (100.0%) |
Household Vehicle Usage in Ozona
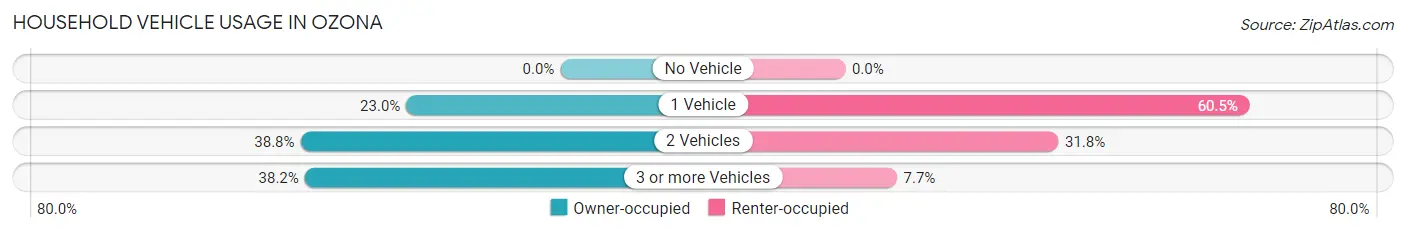
| Vehicles per Household | Owner-occupied | Renter-occupied |
| No Vehicle | 0 (0.0%) | 0 (0.0%) |
| 1 Vehicle | 185 (23.0%) | 188 (60.5%) |
| 2 Vehicles | 312 (38.8%) | 99 (31.8%) |
| 3 or more Vehicles | 307 (38.2%) | 24 (7.7%) |
| Total | 804 (100.0%) | 311 (100.0%) |
Real Estate & Mortgages in Ozona
Real Estate and Mortgage Overview in Ozona
| Characteristic | Without Mortgage | With Mortgage |
| Housing Units | 575 | 229 |
| Median Property Value | $140,400 | $0 |
| Median Household Income | $75,710 | $128 |
| Monthly Housing Costs | $463 | $0 |
| Real Estate Taxes | $655 | $0 |
Property Value by Mortgage Status in Ozona
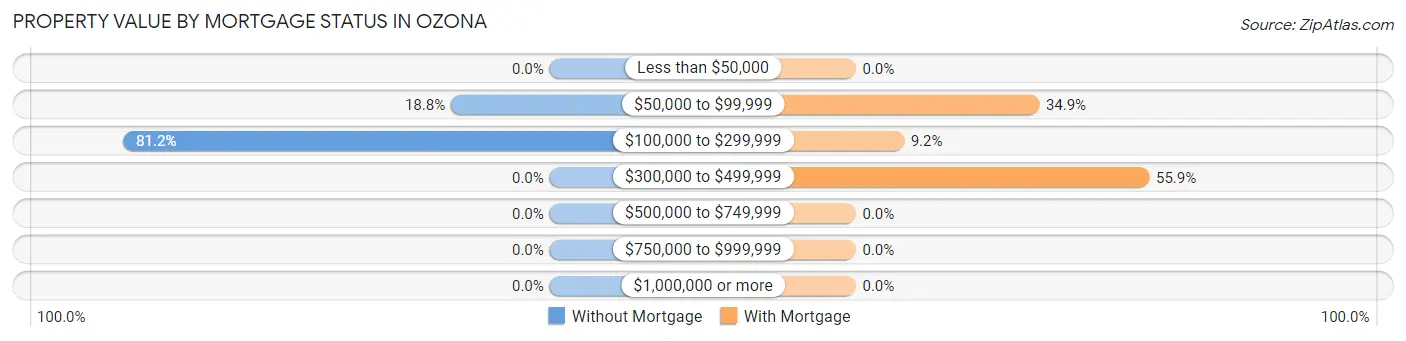
| Property Value | Without Mortgage | With Mortgage |
| Less than $50,000 | 0 (0.0%) | 0 (0.0%) |
| $50,000 to $99,999 | 108 (18.8%) | 80 (34.9%) |
| $100,000 to $299,999 | 467 (81.2%) | 21 (9.2%) |
| $300,000 to $499,999 | 0 (0.0%) | 128 (55.9%) |
| $500,000 to $749,999 | 0 (0.0%) | 0 (0.0%) |
| $750,000 to $999,999 | 0 (0.0%) | 0 (0.0%) |
| $1,000,000 or more | 0 (0.0%) | 0 (0.0%) |
| Total | 575 (100.0%) | 229 (100.0%) |
Household Income by Mortgage Status in Ozona
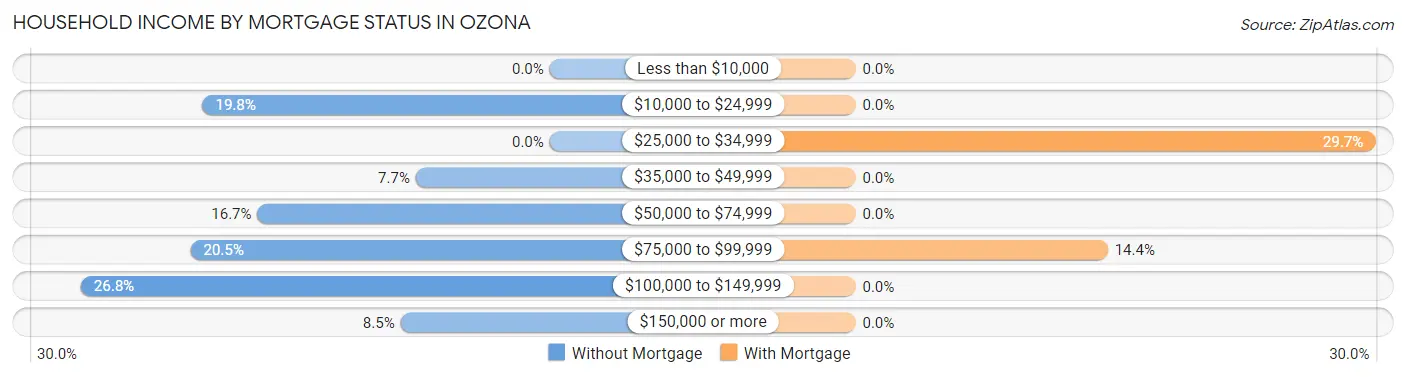
| Household Income | Without Mortgage | With Mortgage |
| Less than $10,000 | 0 (0.0%) | 0 (0.0%) |
| $10,000 to $24,999 | 114 (19.8%) | 0 (0.0%) |
| $25,000 to $34,999 | 0 (0.0%) | 68 (29.7%) |
| $35,000 to $49,999 | 44 (7.6%) | 0 (0.0%) |
| $50,000 to $74,999 | 96 (16.7%) | 0 (0.0%) |
| $75,000 to $99,999 | 118 (20.5%) | 33 (14.4%) |
| $100,000 to $149,999 | 154 (26.8%) | 0 (0.0%) |
| $150,000 or more | 49 (8.5%) | 0 (0.0%) |
| Total | 575 (100.0%) | 229 (100.0%) |
Property Value to Household Income Ratio in Ozona
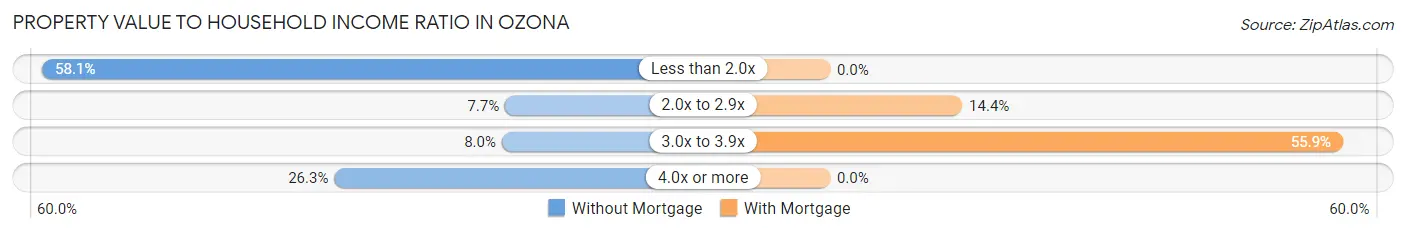
| Value-to-Income Ratio | Without Mortgage | With Mortgage |
| Less than 2.0x | 334 (58.1%) | 0 (0.0%) |
| 2.0x to 2.9x | 44 (7.6%) | 33 (14.4%) |
| 3.0x to 3.9x | 46 (8.0%) | 128 (55.9%) |
| 4.0x or more | 151 (26.3%) | 0 (0.0%) |
| Total | 575 (100.0%) | 229 (100.0%) |
Real Estate Taxes by Mortgage Status in Ozona
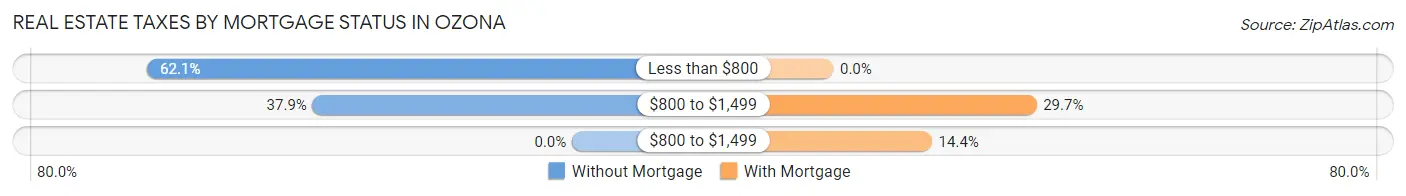
| Property Taxes | Without Mortgage | With Mortgage |
| Less than $800 | 357 (62.1%) | 0 (0.0%) |
| $800 to $1,499 | 218 (37.9%) | 68 (29.7%) |
| $800 to $1,499 | 0 (0.0%) | 33 (14.4%) |
| Total | 575 (100.0%) | 229 (100.0%) |
Health & Disability in Ozona
Health Insurance Coverage by Age in Ozona
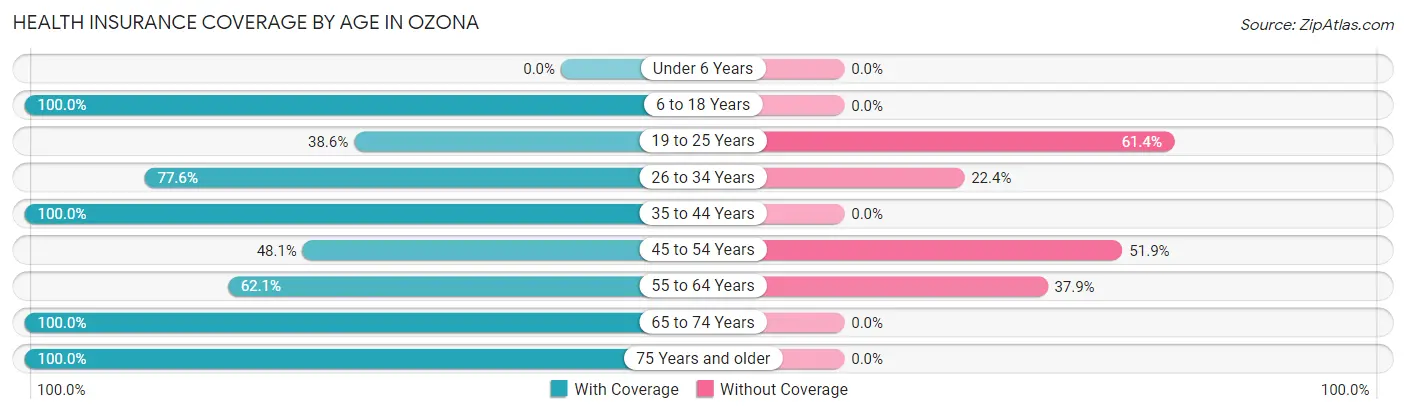
| Age Bracket | With Coverage | Without Coverage |
| Under 6 Years | 0 (0.0%) | 0 (0.0%) |
| 6 to 18 Years | 259 (100.0%) | 0 (0.0%) |
| 19 to 25 Years | 27 (38.6%) | 43 (61.4%) |
| 26 to 34 Years | 354 (77.6%) | 102 (22.4%) |
| 35 to 44 Years | 129 (100.0%) | 0 (0.0%) |
| 45 to 54 Years | 142 (48.1%) | 153 (51.9%) |
| 55 to 64 Years | 269 (62.1%) | 164 (37.9%) |
| 65 to 74 Years | 545 (100.0%) | 0 (0.0%) |
| 75 Years and older | 78 (100.0%) | 0 (0.0%) |
| Total | 1,803 (79.6%) | 462 (20.4%) |
Health Insurance Coverage by Citizenship Status in Ozona

| Citizenship Status | With Coverage | Without Coverage |
| Native Born | 0 (0.0%) | 0 (0.0%) |
| Foreign Born, Citizen | 259 (100.0%) | 0 (0.0%) |
| Foreign Born, not a Citizen | 27 (38.6%) | 43 (61.4%) |
Health Insurance Coverage by Household Income in Ozona
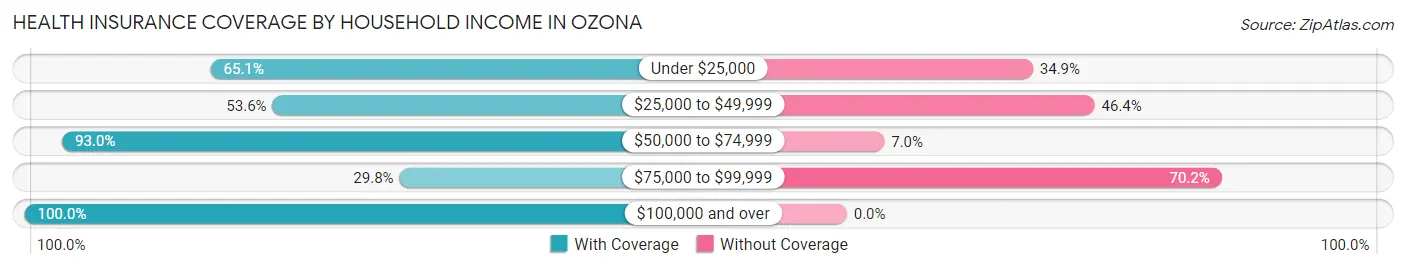
| Household Income | With Coverage | Without Coverage |
| Under $25,000 | 213 (65.1%) | 114 (34.9%) |
| $25,000 to $49,999 | 105 (53.6%) | 91 (46.4%) |
| $50,000 to $74,999 | 437 (93.0%) | 33 (7.0%) |
| $75,000 to $99,999 | 95 (29.8%) | 224 (70.2%) |
| $100,000 and over | 953 (100.0%) | 0 (0.0%) |
Public vs Private Health Insurance Coverage by Age in Ozona
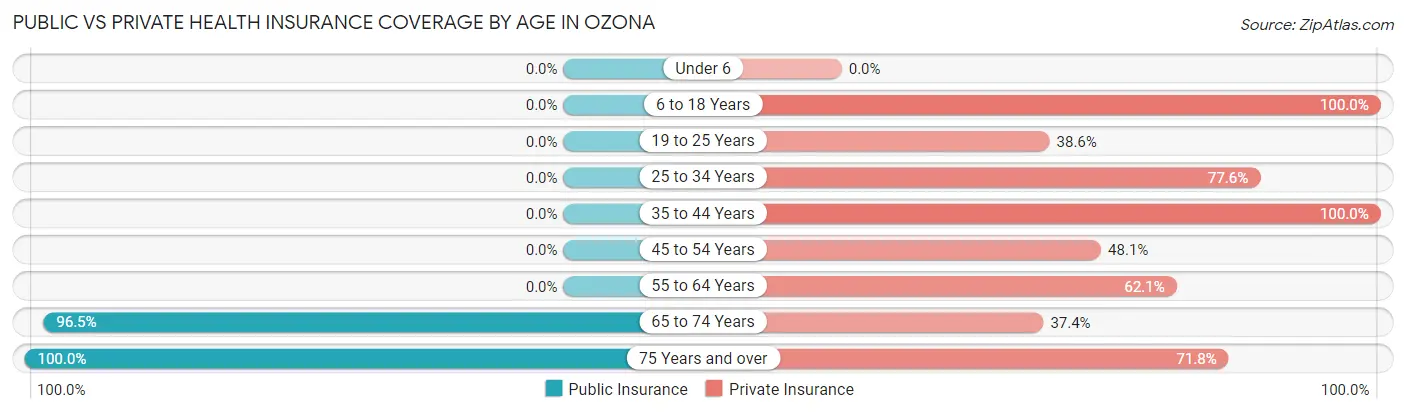
| Age Bracket | Public Insurance | Private Insurance |
| Under 6 | 0 (0.0%) | 0 (0.0%) |
| 6 to 18 Years | 0 (0.0%) | 259 (100.0%) |
| 19 to 25 Years | 0 (0.0%) | 27 (38.6%) |
| 25 to 34 Years | 0 (0.0%) | 354 (77.6%) |
| 35 to 44 Years | 0 (0.0%) | 129 (100.0%) |
| 45 to 54 Years | 0 (0.0%) | 142 (48.1%) |
| 55 to 64 Years | 0 (0.0%) | 269 (62.1%) |
| 65 to 74 Years | 526 (96.5%) | 204 (37.4%) |
| 75 Years and over | 78 (100.0%) | 56 (71.8%) |
| Total | 604 (26.7%) | 1,440 (63.6%) |
Disability Status by Sex by Age in Ozona
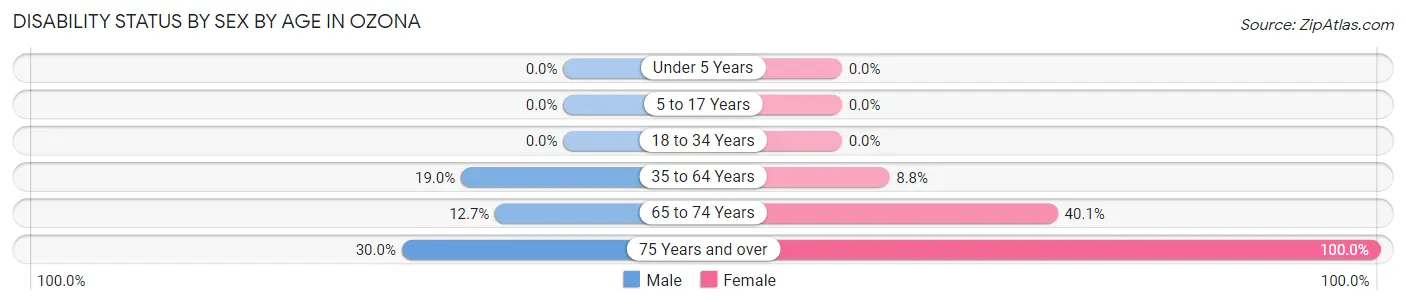
| Age Bracket | Male | Female |
| Under 5 Years | 0 (0.0%) | 0 (0.0%) |
| 5 to 17 Years | 0 (0.0%) | 0 (0.0%) |
| 18 to 34 Years | 0 (0.0%) | 0 (0.0%) |
| 35 to 64 Years | 83 (19.0%) | 37 (8.8%) |
| 65 to 74 Years | 32 (12.7%) | 117 (40.1%) |
| 75 Years and over | 9 (30.0%) | 48 (100.0%) |
Disability Class by Sex by Age in Ozona
Disability Class: Hearing Difficulty
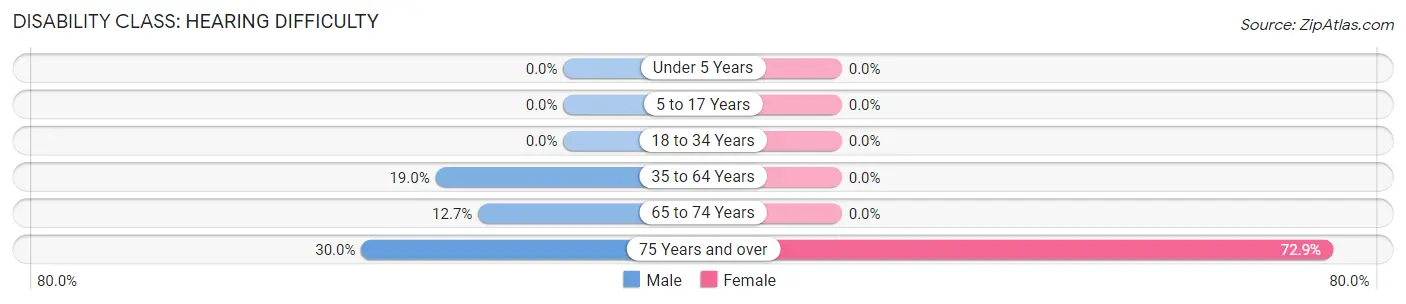
| Age Bracket | Male | Female |
| Under 5 Years | 0 (0.0%) | 0 (0.0%) |
| 5 to 17 Years | 0 (0.0%) | 0 (0.0%) |
| 18 to 34 Years | 0 (0.0%) | 0 (0.0%) |
| 35 to 64 Years | 83 (19.0%) | 0 (0.0%) |
| 65 to 74 Years | 32 (12.7%) | 0 (0.0%) |
| 75 Years and over | 9 (30.0%) | 35 (72.9%) |
Disability Class: Vision Difficulty
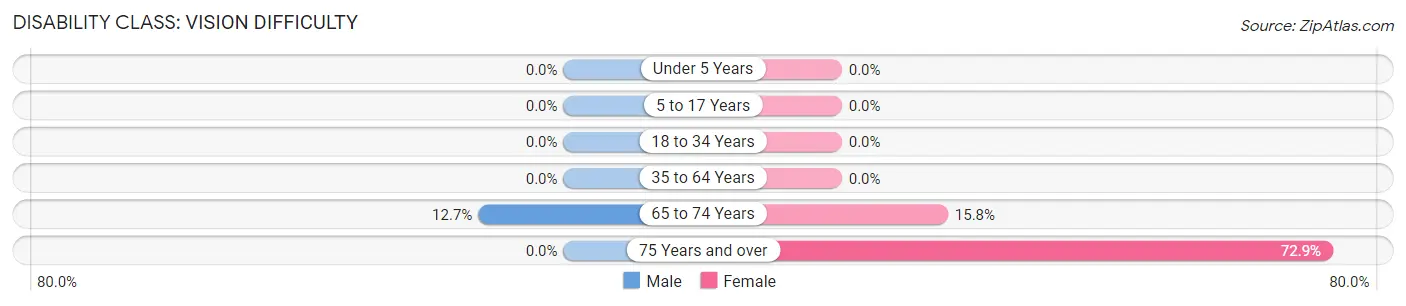
| Age Bracket | Male | Female |
| Under 5 Years | 0 (0.0%) | 0 (0.0%) |
| 5 to 17 Years | 0 (0.0%) | 0 (0.0%) |
| 18 to 34 Years | 0 (0.0%) | 0 (0.0%) |
| 35 to 64 Years | 0 (0.0%) | 0 (0.0%) |
| 65 to 74 Years | 32 (12.7%) | 46 (15.8%) |
| 75 Years and over | 0 (0.0%) | 35 (72.9%) |
Disability Class: Cognitive Difficulty
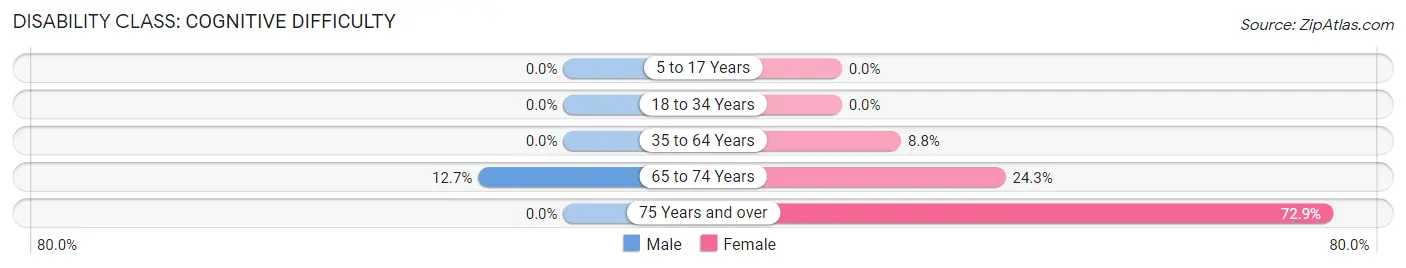
| Age Bracket | Male | Female |
| 5 to 17 Years | 0 (0.0%) | 0 (0.0%) |
| 18 to 34 Years | 0 (0.0%) | 0 (0.0%) |
| 35 to 64 Years | 0 (0.0%) | 37 (8.8%) |
| 65 to 74 Years | 32 (12.7%) | 71 (24.3%) |
| 75 Years and over | 0 (0.0%) | 35 (72.9%) |
Disability Class: Ambulatory Difficulty
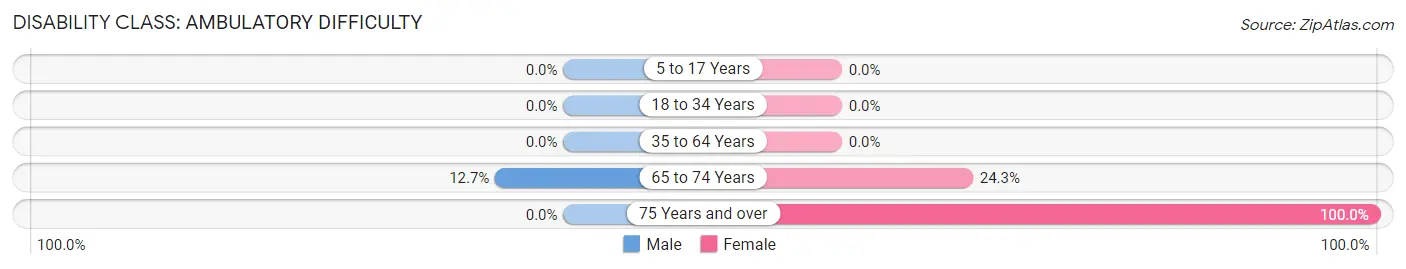
| Age Bracket | Male | Female |
| 5 to 17 Years | 0 (0.0%) | 0 (0.0%) |
| 18 to 34 Years | 0 (0.0%) | 0 (0.0%) |
| 35 to 64 Years | 0 (0.0%) | 0 (0.0%) |
| 65 to 74 Years | 32 (12.7%) | 71 (24.3%) |
| 75 Years and over | 0 (0.0%) | 48 (100.0%) |
Disability Class: Self-Care Difficulty
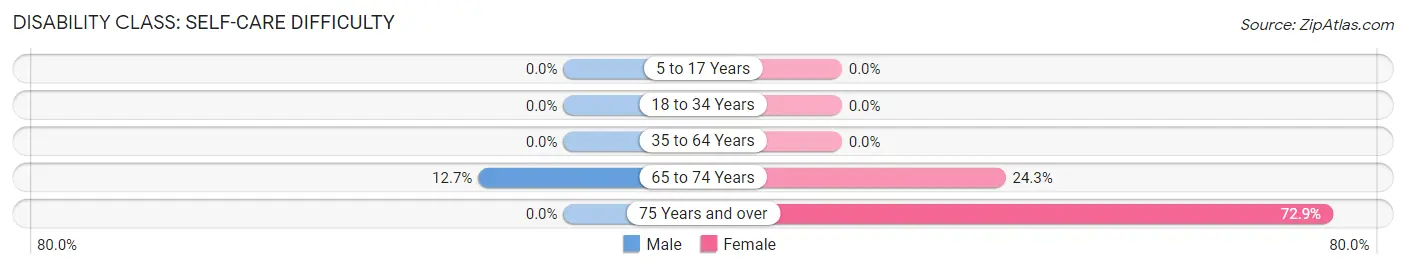
| Age Bracket | Male | Female |
| 5 to 17 Years | 0 (0.0%) | 0 (0.0%) |
| 18 to 34 Years | 0 (0.0%) | 0 (0.0%) |
| 35 to 64 Years | 0 (0.0%) | 0 (0.0%) |
| 65 to 74 Years | 32 (12.7%) | 71 (24.3%) |
| 75 Years and over | 0 (0.0%) | 35 (72.9%) |
Technology Access in Ozona
Computing Device Access in Ozona
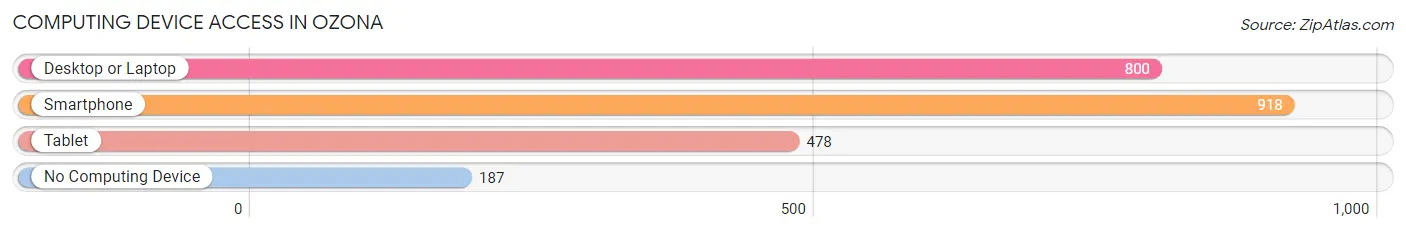
| Device Type | # Households | % Households |
| Desktop or Laptop | 800 | 71.8% |
| Smartphone | 918 | 82.3% |
| Tablet | 478 | 42.9% |
| No Computing Device | 187 | 16.8% |
| Total | 1,115 | 100.0% |
Internet Access in Ozona
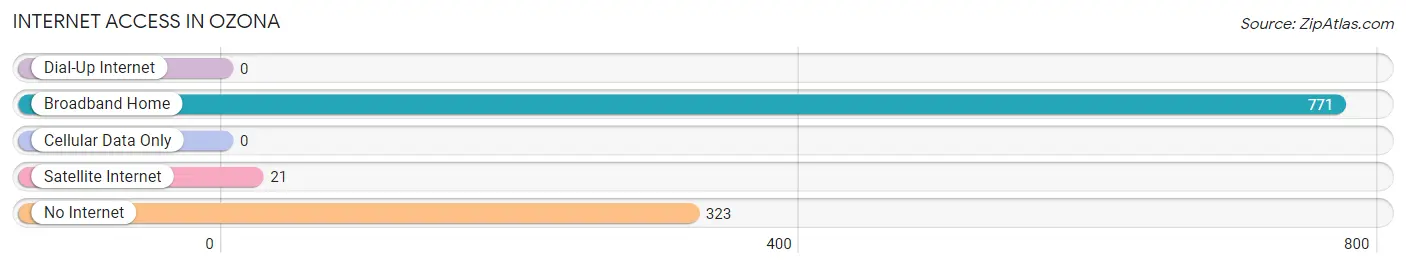
| Internet Type | # Households | % Households |
| Dial-Up Internet | 0 | 0.0% |
| Broadband Home | 771 | 69.2% |
| Cellular Data Only | 0 | 0.0% |
| Satellite Internet | 21 | 1.9% |
| No Internet | 323 | 29.0% |
| Total | 1,115 | 100.0% |
Ozona Summary
Ozona, Texas is a small town located in Crockett County, Texas. It is the county seat of Crockett County and is located about 90 miles southwest of San Angelo. The population of Ozona was 3,225 at the 2010 census.
History
Ozona was founded in 1891 by a group of settlers from the nearby town of San Angelo. The town was named after the nearby Ozona Creek, which was named after the Spanish word for “oasis”. The town was originally a stop on the San Antonio and Aransas Pass Railway, which was built in 1891.
The town grew quickly and by 1900, it had a population of 1,000. The town was incorporated in 1909 and by 1910, the population had grown to 1,500.
In the early 1900s, Ozona was a major center for sheep and goat ranching. The town was also home to several large cotton gins and a number of other businesses.
In the 1920s, the town began to decline as the railroad stopped running and the cotton industry declined. The population dropped to 1,000 by 1930.
In the 1940s, the town began to revive as the oil industry began to boom in the area. The population grew to 2,000 by 1950 and to 3,000 by 1960.
Geography
Ozona is located in the northern part of Crockett County, about 90 miles southwest of San Angelo. The town is situated on the banks of the Ozona Creek, which is a tributary of the Colorado River.
The terrain around Ozona is mostly flat with some rolling hills. The climate is semi-arid with hot summers and mild winters. The average annual temperature is 68 degrees Fahrenheit.
Economy
The economy of Ozona is largely based on agriculture and oil and gas production. The town is home to several large ranches and farms, as well as several oil and gas production companies.
The town is also home to several small businesses, including restaurants, retail stores, and service providers.
Demographics
As of the 2010 census, the population of Ozona was 3,225. The racial makeup of the town was 79.3% White, 0.7% African American, 0.3% Native American, 0.2% Asian, 0.1% Pacific Islander, 17.7% from other races, and 1.9% from two or more races. Hispanic or Latino of any race were 37.2% of the population.
The median income for a household in Ozona was $30,938, and the median income for a family was $35,938. The per capita income for the town was $15,938. About 18.2% of families and 22.2% of the population were below the poverty line, including 28.2% of those under age 18 and 16.2% of those age 65 or over.
Common Questions
What is Per Capita Income in Ozona?
Per Capita income in Ozona is $37,958.
What is the Median Family Income in Ozona?
Median Family Income in Ozona is $76,515.
What is the Median Household income in Ozona?
Median Household Income in Ozona is $60,288.
What is Income or Wage Gap in Ozona?
Income or Wage Gap in Ozona is 48.2%.
Women in Ozona earn 51.8 cents for every dollar earned by a man.
What is Inequality or Gini Index in Ozona?
Inequality or Gini Index in Ozona is 0.38.
What is the Total Population of Ozona?
Total Population of Ozona is 2,306.
What is the Total Male Population of Ozona?
Total Male Population of Ozona is 1,289.
What is the Total Female Population of Ozona?
Total Female Population of Ozona is 1,017.
What is the Ratio of Males per 100 Females in Ozona?
There are 126.75 Males per 100 Females in Ozona.
What is the Ratio of Females per 100 Males in Ozona?
There are 78.90 Females per 100 Males in Ozona.
What is the Median Population Age in Ozona?
Median Population Age in Ozona is 54.5 Years.
What is the Average Family Size in Ozona
Average Family Size in Ozona is 2.5 People.
What is the Average Household Size in Ozona
Average Household Size in Ozona is 2.0 People.
How Large is the Labor Force in Ozona?
There are 1,333 People in the Labor Forcein in Ozona.
What is the Percentage of People in the Labor Force in Ozona?
62.9% of People are in the Labor Force in Ozona.
What is the Unemployment Rate in Ozona?
Unemployment Rate in Ozona is 2.3%.