Ore City, TX Map & Demographics
Ore City Map
Ore City Overview
$18,411
PER CAPITA INCOME
$50,417
AVG FAMILY INCOME
$41,339
AVG HOUSEHOLD INCOME
44.5%
WAGE / INCOME GAP [ % ]
55.5¢/ $1
WAGE / INCOME GAP [ $ ]
0.42
INEQUALITY / GINI INDEX
929
TOTAL POPULATION
458
MALE POPULATION
471
FEMALE POPULATION
97.24
MALES / 100 FEMALES
102.84
FEMALES / 100 MALES
35.0
MEDIAN AGE
3.4
AVG FAMILY SIZE
3.0
AVG HOUSEHOLD SIZE
374
LABOR FORCE [ PEOPLE ]
57.5%
PERCENT IN LABOR FORCE
5.3%
UNEMPLOYMENT RATE
Ore City Zip Codes
Ore City Area Codes
Income in Ore City
Income Overview in Ore City
Per Capita Income in Ore City is $18,411, while median incomes of families and households are $50,417 and $41,339 respectively.
| Characteristic | Number | Measure |
| Per Capita Income | 929 | $18,411 |
| Median Family Income | 242 | $50,417 |
| Mean Family Income | 242 | $60,113 |
| Median Household Income | 313 | $41,339 |
| Mean Household Income | 313 | $54,983 |
| Income Deficit | 242 | $0 |
| Wage / Income Gap (%) | 929 | 44.51% |
| Wage / Income Gap ($) | 929 | 55.49¢ per $1 |
| Gini / Inequality Index | 929 | 0.42 |
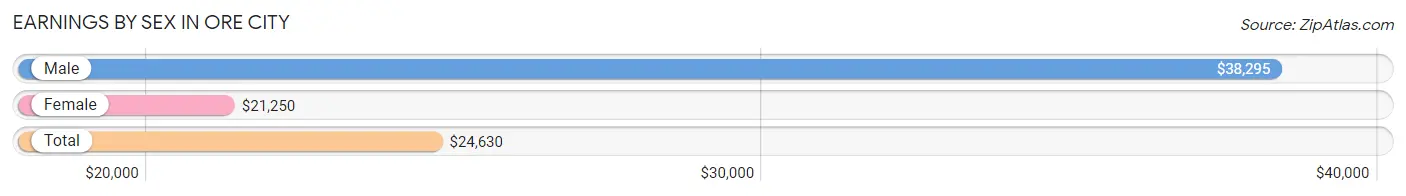
Earnings by Sex in Ore City
Average Earnings in Ore City are $24,630, $38,295 for men and $21,250 for women, a difference of 44.5%.
| Sex | Number | Average Earnings |
| Male | 181 (45.3%) | $38,295 |
| Female | 219 (54.7%) | $21,250 |
| Total | 400 (100.0%) | $24,630 |
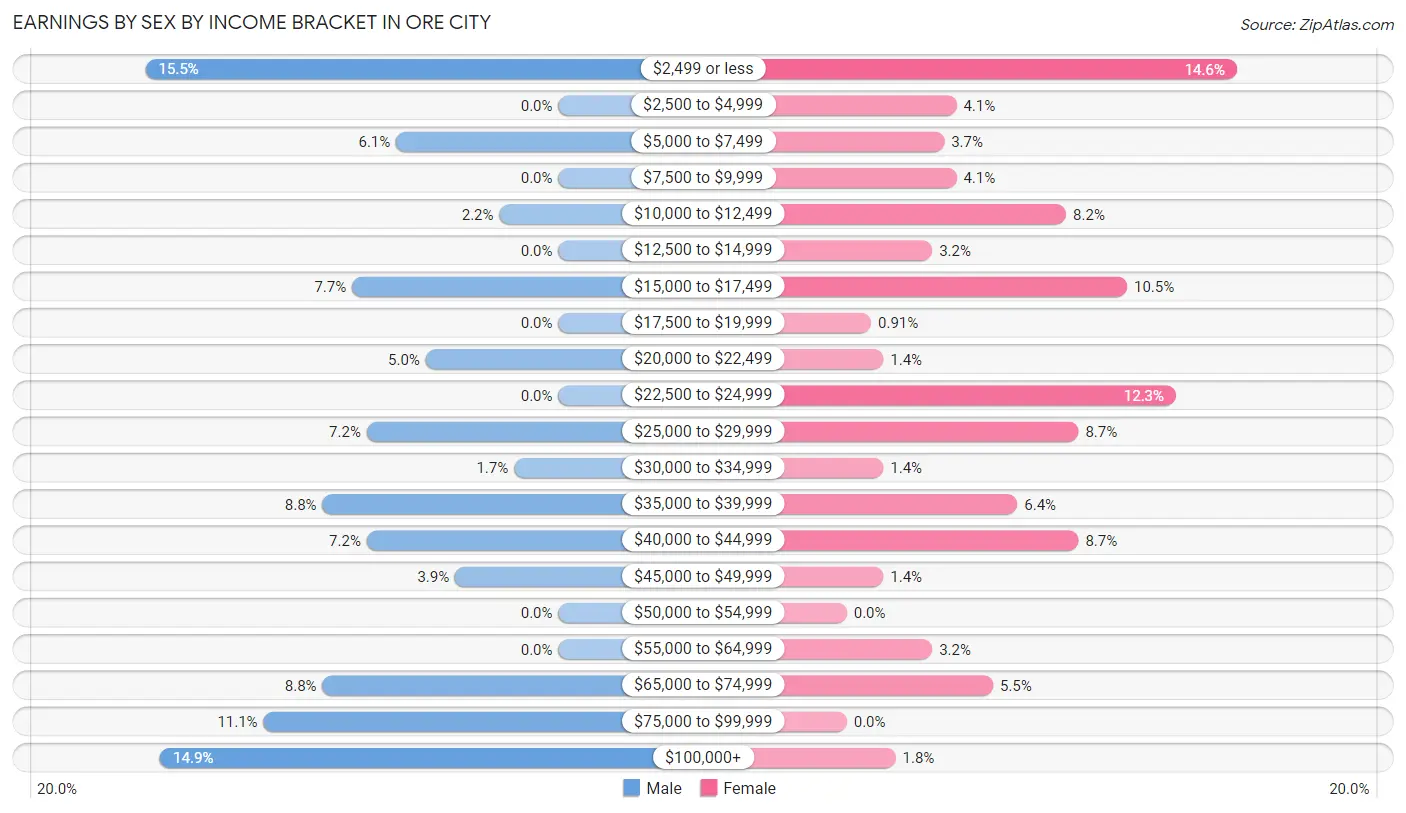
Earnings by Sex by Income Bracket in Ore City
The most common earnings brackets in Ore City are $2,499 or less for men (28 | 15.5%) and $2,499 or less for women (32 | 14.6%).
| Income | Male | Female |
| $2,499 or less | 28 (15.5%) | 32 (14.6%) |
| $2,500 to $4,999 | 0 (0.0%) | 9 (4.1%) |
| $5,000 to $7,499 | 11 (6.1%) | 8 (3.6%) |
| $7,500 to $9,999 | 0 (0.0%) | 9 (4.1%) |
| $10,000 to $12,499 | 4 (2.2%) | 18 (8.2%) |
| $12,500 to $14,999 | 0 (0.0%) | 7 (3.2%) |
| $15,000 to $17,499 | 14 (7.7%) | 23 (10.5%) |
| $17,500 to $19,999 | 0 (0.0%) | 2 (0.9%) |
| $20,000 to $22,499 | 9 (5.0%) | 3 (1.4%) |
| $22,500 to $24,999 | 0 (0.0%) | 27 (12.3%) |
| $25,000 to $29,999 | 13 (7.2%) | 19 (8.7%) |
| $30,000 to $34,999 | 3 (1.7%) | 3 (1.4%) |
| $35,000 to $39,999 | 16 (8.8%) | 14 (6.4%) |
| $40,000 to $44,999 | 13 (7.2%) | 19 (8.7%) |
| $45,000 to $49,999 | 7 (3.9%) | 3 (1.4%) |
| $50,000 to $54,999 | 0 (0.0%) | 0 (0.0%) |
| $55,000 to $64,999 | 0 (0.0%) | 7 (3.2%) |
| $65,000 to $74,999 | 16 (8.8%) | 12 (5.5%) |
| $75,000 to $99,999 | 20 (11.1%) | 0 (0.0%) |
| $100,000+ | 27 (14.9%) | 4 (1.8%) |
| Total | 181 (100.0%) | 219 (100.0%) |
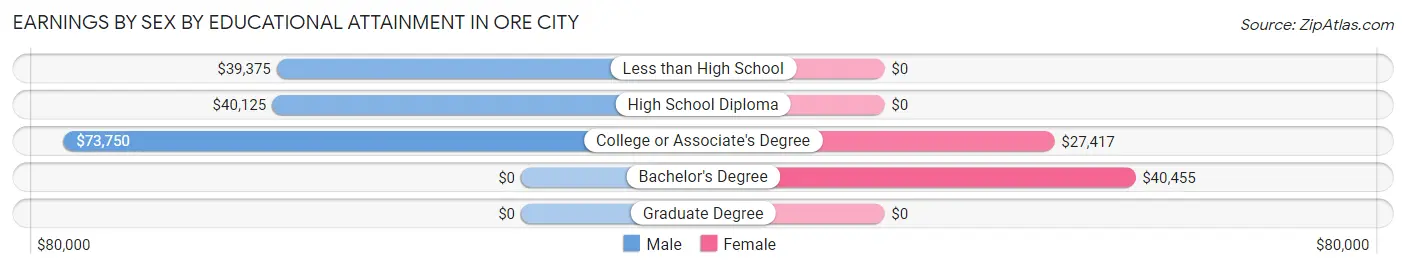
Earnings by Sex by Educational Attainment in Ore City
Average earnings in Ore City are $40,192 for men and $22,917 for women, a difference of 43.0%. Men with an educational attainment of college or associate's degree enjoy the highest average annual earnings of $73,750, while those with less than high school education earn the least with $39,375. Women with an educational attainment of bachelor's degree earn the most with the average annual earnings of $40,455, while those with college or associate's degree education have the smallest earnings of $27,417.
| Educational Attainment | Male Income | Female Income |
| Less than High School | $39,375 | $0 |
| High School Diploma | $40,125 | $0 |
| College or Associate's Degree | $73,750 | $27,417 |
| Bachelor's Degree | - | - |
| Graduate Degree | - | - |
| Total | $40,192 | $22,917 |
Family Income in Ore City
Family Income Brackets in Ore City
According to the Ore City family income data, there are 47 families falling into the $100,000 to $149,999 income range, which is the most common income bracket and makes up 19.4% of all families.
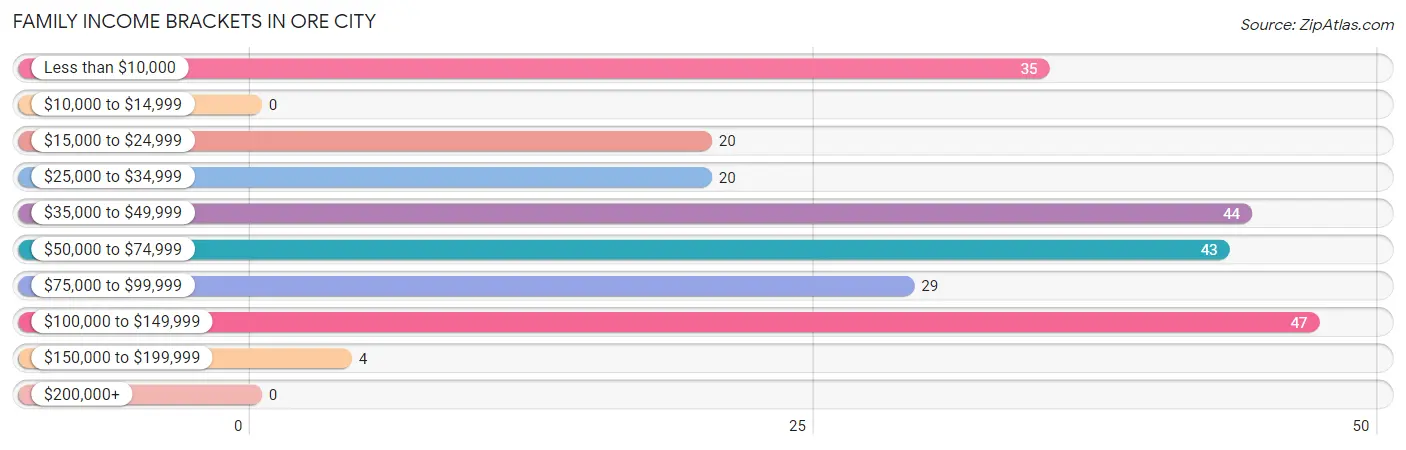
| Income Bracket | # Families | % Families |
| Less than $10,000 | 35 | 14.5% |
| $10,000 to $14,999 | 0 | 0.0% |
| $15,000 to $24,999 | 20 | 8.3% |
| $25,000 to $34,999 | 20 | 8.3% |
| $35,000 to $49,999 | 44 | 18.2% |
| $50,000 to $74,999 | 43 | 17.8% |
| $75,000 to $99,999 | 29 | 12.0% |
| $100,000 to $149,999 | 47 | 19.4% |
| $150,000 to $199,999 | 4 | 1.7% |
| $200,000+ | 0 | 0.0% |
Family Income by Famaliy Size in Ore City
5-person families (27 | 11.2%) account for the highest median family income in Ore City with $87,656 per family, while 2-person families (94 | 38.8%) have the highest median income of $27,500 per family member.
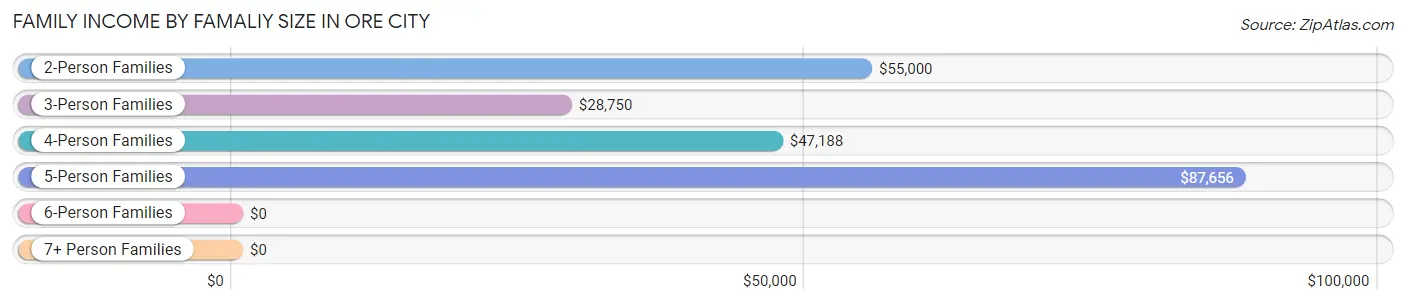
| Income Bracket | # Families | Median Income |
| 2-Person Families | 94 (38.8%) | $55,000 |
| 3-Person Families | 52 (21.5%) | $28,750 |
| 4-Person Families | 66 (27.3%) | $47,188 |
| 5-Person Families | 27 (11.2%) | $87,656 |
| 6-Person Families | 1 (0.4%) | $0 |
| 7+ Person Families | 2 (0.8%) | $0 |
| Total | 242 (100.0%) | $50,417 |
Family Income by Number of Earners in Ore City
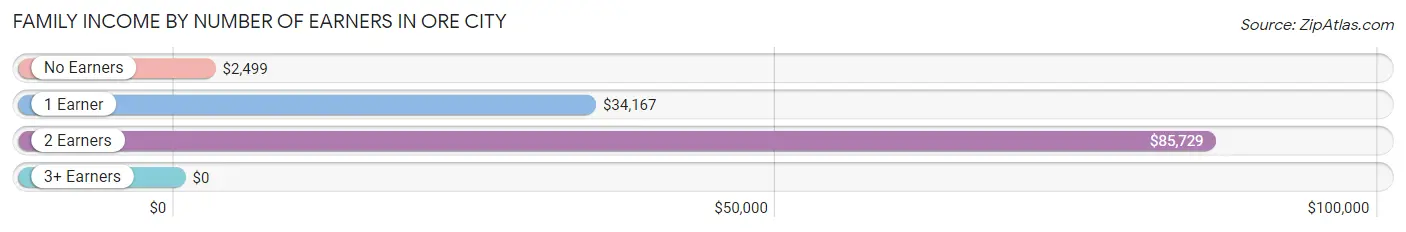
| Number of Earners | # Families | Median Income |
| No Earners | 44 (18.2%) | $2,499 |
| 1 Earner | 86 (35.5%) | $34,167 |
| 2 Earners | 97 (40.1%) | $85,729 |
| 3+ Earners | 15 (6.2%) | $0 |
| Total | 242 (100.0%) | $50,417 |
Household Income in Ore City
Household Income Brackets in Ore City
With 57 households falling in the category, the $100,000 to $149,999 income range is the most frequent in Ore City, accounting for 18.2% of all households.
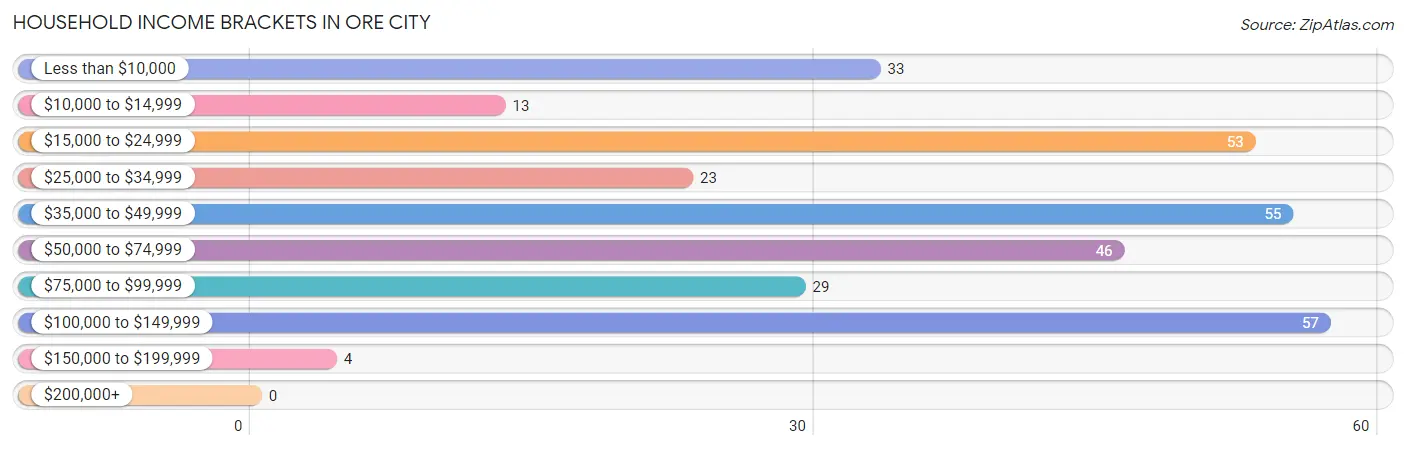
| Income Bracket | # Households | % Households |
| Less than $10,000 | 33 | 10.5% |
| $10,000 to $14,999 | 13 | 4.2% |
| $15,000 to $24,999 | 53 | 16.9% |
| $25,000 to $34,999 | 23 | 7.3% |
| $35,000 to $49,999 | 55 | 17.6% |
| $50,000 to $74,999 | 46 | 14.7% |
| $75,000 to $99,999 | 29 | 9.3% |
| $100,000 to $149,999 | 57 | 18.2% |
| $150,000 to $199,999 | 4 | 1.3% |
| $200,000+ | 0 | 0.0% |
Household Income by Householder Age in Ore City
The median household income in Ore City is $41,339, with the highest median household income of $79,375 found in the 45 to 64 years age bracket for the primary householder. A total of 91 households (29.1%) fall into this category.
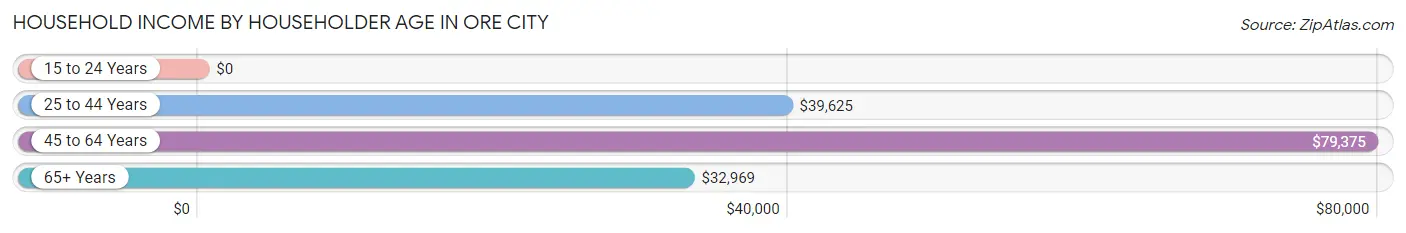
| Income Bracket | # Households | Median Income |
| 15 to 24 Years | 0 (0.0%) | $0 |
| 25 to 44 Years | 157 (50.2%) | $39,625 |
| 45 to 64 Years | 91 (29.1%) | $79,375 |
| 65+ Years | 65 (20.8%) | $32,969 |
| Total | 313 (100.0%) | $41,339 |
Poverty in Ore City
Income Below Poverty by Sex and Age in Ore City
With 16.2% poverty level for males and 24.6% for females among the residents of Ore City, 12 to 14 year old males and under 5 year old females are the most vulnerable to poverty, with 24 males (38.1%) and 12 females (66.7%) in their respective age groups living below the poverty level.
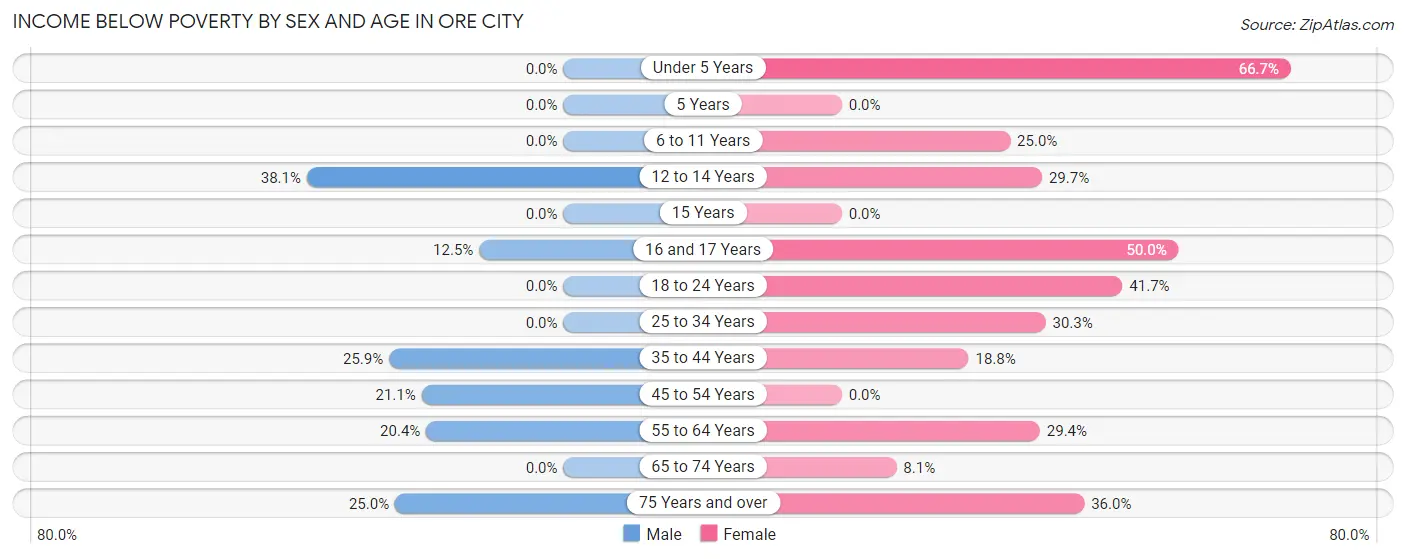
| Age Bracket | Male | Female |
| Under 5 Years | 0 (0.0%) | 12 (66.7%) |
| 5 Years | 0 (0.0%) | 0 (0.0%) |
| 6 to 11 Years | 0 (0.0%) | 17 (25.0%) |
| 12 to 14 Years | 24 (38.1%) | 11 (29.7%) |
| 15 Years | 0 (0.0%) | 0 (0.0%) |
| 16 and 17 Years | 3 (12.5%) | 10 (50.0%) |
| 18 to 24 Years | 0 (0.0%) | 5 (41.7%) |
| 25 to 34 Years | 0 (0.0%) | 23 (30.3%) |
| 35 to 44 Years | 22 (25.9%) | 16 (18.8%) |
| 45 to 54 Years | 8 (21.0%) | 0 (0.0%) |
| 55 to 64 Years | 11 (20.4%) | 10 (29.4%) |
| 65 to 74 Years | 0 (0.0%) | 3 (8.1%) |
| 75 Years and over | 5 (25.0%) | 9 (36.0%) |
| Total | 73 (16.2%) | 116 (24.6%) |
Income Above Poverty by Sex and Age in Ore City
According to the poverty statistics in Ore City, males aged under 5 years and females aged 15 years are the age groups that are most secure financially, with 100.0% of males and 100.0% of females in these age groups living above the poverty line.
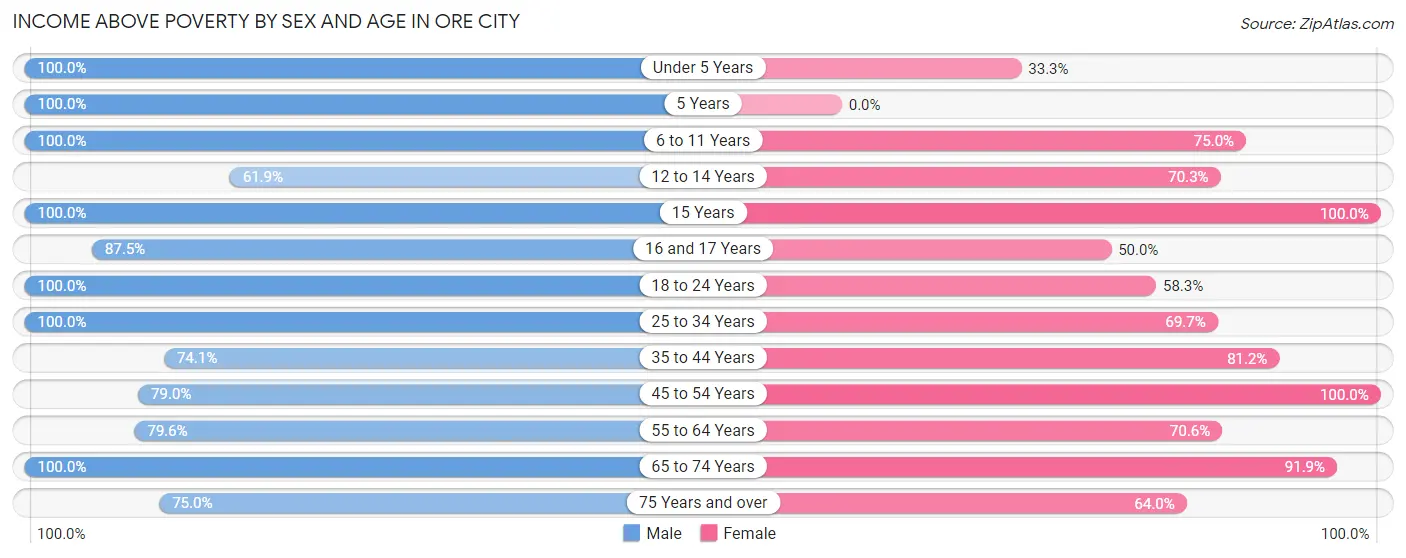
| Age Bracket | Male | Female |
| Under 5 Years | 25 (100.0%) | 6 (33.3%) |
| 5 Years | 1 (100.0%) | 0 (0.0%) |
| 6 to 11 Years | 42 (100.0%) | 51 (75.0%) |
| 12 to 14 Years | 39 (61.9%) | 26 (70.3%) |
| 15 Years | 6 (100.0%) | 12 (100.0%) |
| 16 and 17 Years | 21 (87.5%) | 10 (50.0%) |
| 18 to 24 Years | 13 (100.0%) | 7 (58.3%) |
| 25 to 34 Years | 42 (100.0%) | 53 (69.7%) |
| 35 to 44 Years | 63 (74.1%) | 69 (81.2%) |
| 45 to 54 Years | 30 (78.9%) | 47 (100.0%) |
| 55 to 64 Years | 43 (79.6%) | 24 (70.6%) |
| 65 to 74 Years | 39 (100.0%) | 34 (91.9%) |
| 75 Years and over | 15 (75.0%) | 16 (64.0%) |
| Total | 379 (83.9%) | 355 (75.4%) |
Income Below Poverty Among Married-Couple Families in Ore City
The poverty statistics for married-couple families in Ore City show that 7.1% or 11 of the total 154 families live below the poverty line. Families with no children have the highest poverty rate of 13.3%, comprising of 11 families. On the other hand, families with 1 or 2 children have the lowest poverty rate of 0.0%, which includes 0 families.
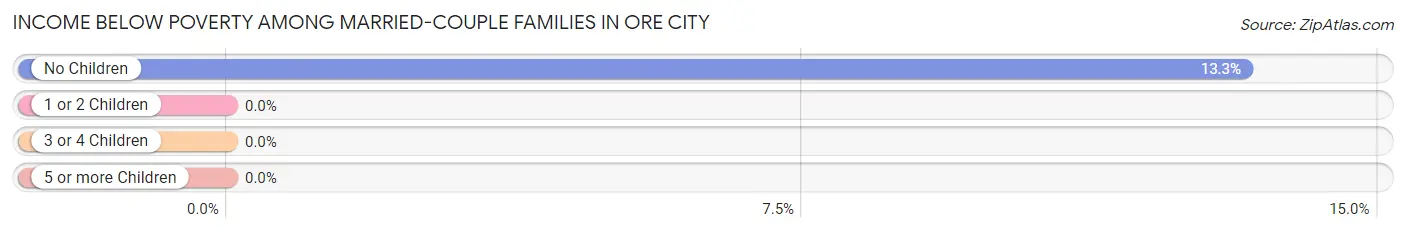
| Children | Above Poverty | Below Poverty |
| No Children | 72 (86.8%) | 11 (13.3%) |
| 1 or 2 Children | 47 (100.0%) | 0 (0.0%) |
| 3 or 4 Children | 24 (100.0%) | 0 (0.0%) |
| 5 or more Children | 0 (0.0%) | 0 (0.0%) |
| Total | 143 (92.9%) | 11 (7.1%) |
Income Below Poverty Among Single-Parent Households in Ore City
According to the poverty data in Ore City, 41.9% or 13 single-father households and 59.7% or 34 single-mother households are living below the poverty line. Among single-father households, those with 1 or 2 children have the highest poverty rate, with 13 households (100.0%) experiencing poverty. Likewise, among single-mother households, those with 1 or 2 children have the highest poverty rate, with 24 households (77.4%) falling below the poverty line.
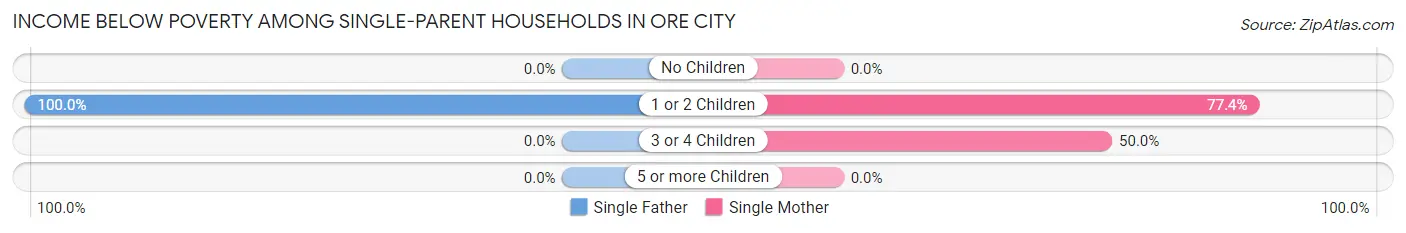
| Children | Single Father | Single Mother |
| No Children | 0 (0.0%) | 0 (0.0%) |
| 1 or 2 Children | 13 (100.0%) | 24 (77.4%) |
| 3 or 4 Children | 0 (0.0%) | 10 (50.0%) |
| 5 or more Children | 0 (0.0%) | 0 (0.0%) |
| Total | 13 (41.9%) | 34 (59.7%) |
Income Below Poverty Among Married-Couple vs Single-Parent Households in Ore City
The poverty data for Ore City shows that 11 of the married-couple family households (7.1%) and 47 of the single-parent households (53.4%) are living below the poverty level. Within the married-couple family households, those with no children have the highest poverty rate, with 11 households (13.3%) falling below the poverty line. Among the single-parent households, those with 1 or 2 children have the highest poverty rate, with 37 household (84.1%) living below poverty.
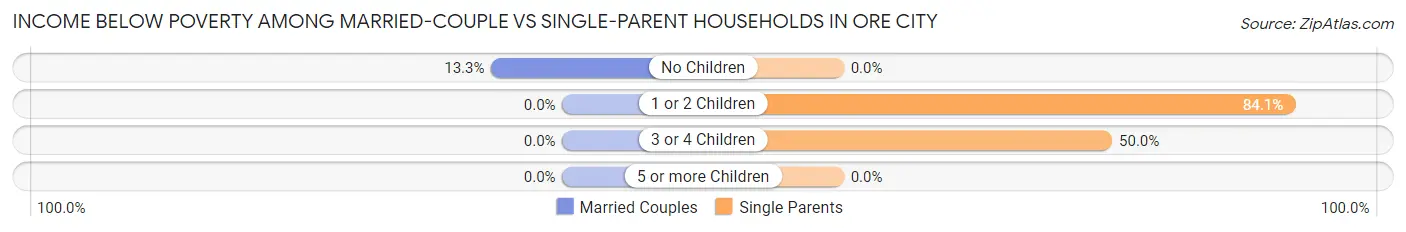
| Children | Married-Couple Families | Single-Parent Households |
| No Children | 11 (13.3%) | 0 (0.0%) |
| 1 or 2 Children | 0 (0.0%) | 37 (84.1%) |
| 3 or 4 Children | 0 (0.0%) | 10 (50.0%) |
| 5 or more Children | 0 (0.0%) | 0 (0.0%) |
| Total | 11 (7.1%) | 47 (53.4%) |
Race in Ore City
The most populous races in Ore City are White / Caucasian (739 | 79.5%), Hispanic or Latino (224 | 24.1%), and Two or more Races (101 | 10.9%).
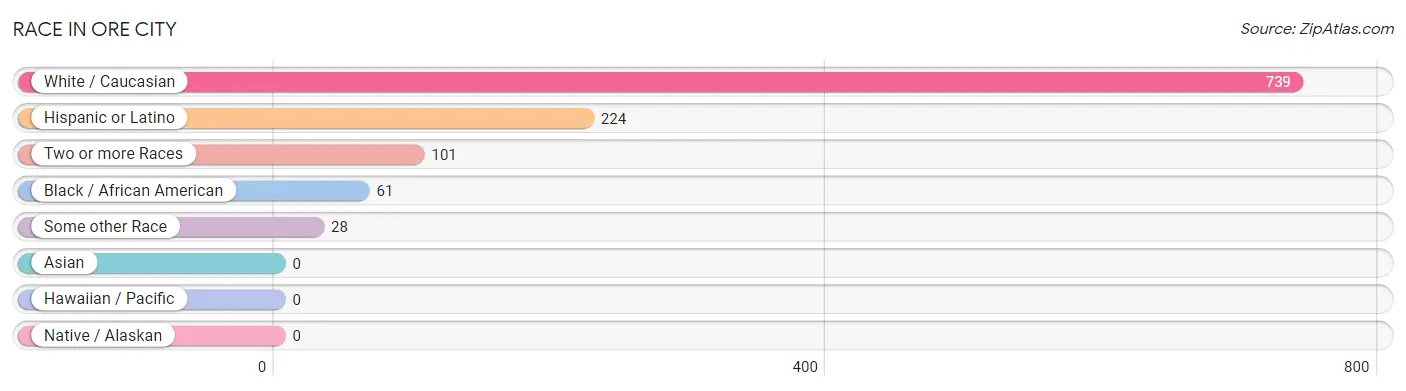
| Race | # Population | % Population |
| Asian | 0 | 0.0% |
| Black / African American | 61 | 6.6% |
| Hawaiian / Pacific | 0 | 0.0% |
| Hispanic or Latino | 224 | 24.1% |
| Native / Alaskan | 0 | 0.0% |
| White / Caucasian | 739 | 79.5% |
| Two or more Races | 101 | 10.9% |
| Some other Race | 28 | 3.0% |
| Total | 929 | 100.0% |
Ancestry in Ore City
The most populous ancestries reported in Ore City are Mexican (224 | 24.1%), American (123 | 13.2%), Irish (97 | 10.4%), German (65 | 7.0%), and Cherokee (30 | 3.2%), together accounting for 58.0% of all Ore City residents.
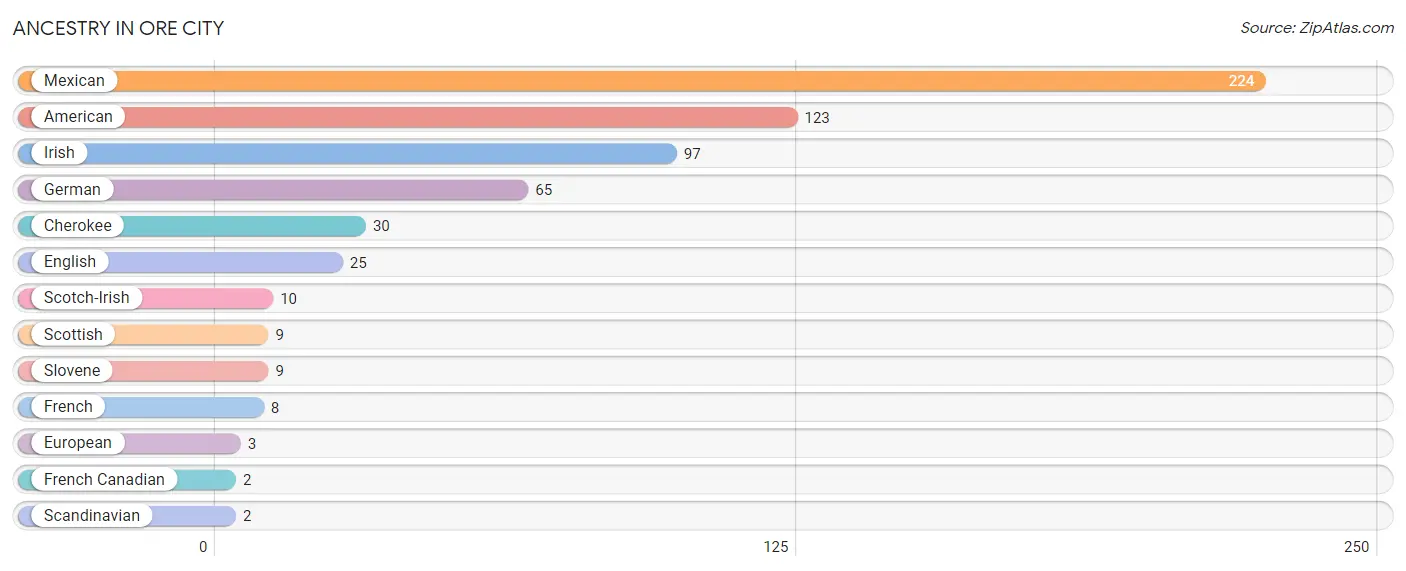
| Ancestry | # Population | % Population |
| American | 123 | 13.2% |
| Cherokee | 30 | 3.2% |
| English | 25 | 2.7% |
| European | 3 | 0.3% |
| French | 8 | 0.9% |
| French Canadian | 2 | 0.2% |
| German | 65 | 7.0% |
| Irish | 97 | 10.4% |
| Mexican | 224 | 24.1% |
| Scandinavian | 2 | 0.2% |
| Scotch-Irish | 10 | 1.1% |
| Scottish | 9 | 1.0% |
| Slovene | 9 | 1.0% | View All 13 Rows |
Immigrants in Ore City
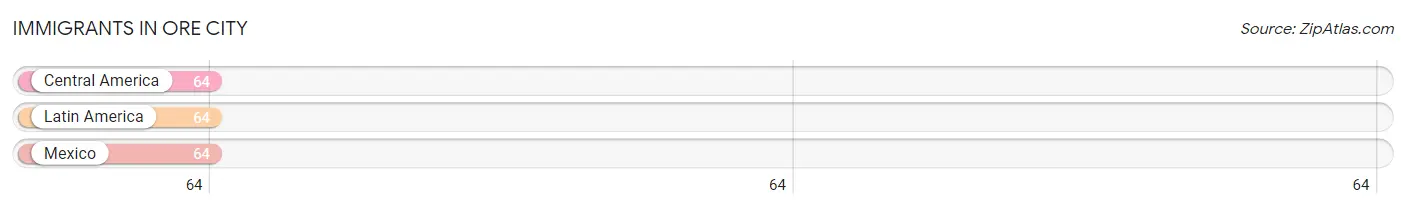
The most numerous immigrant groups reported in Ore City came from Central America (64 | 6.9%), Latin America (64 | 6.9%), and Mexico (64 | 6.9%), together accounting for 20.7% of all Ore City residents.
| Immigration Origin | # Population | % Population |
| Central America | 64 | 6.9% |
| Latin America | 64 | 6.9% |
| Mexico | 64 | 6.9% | View All 3 Rows |
Sex and Age in Ore City
Sex and Age in Ore City
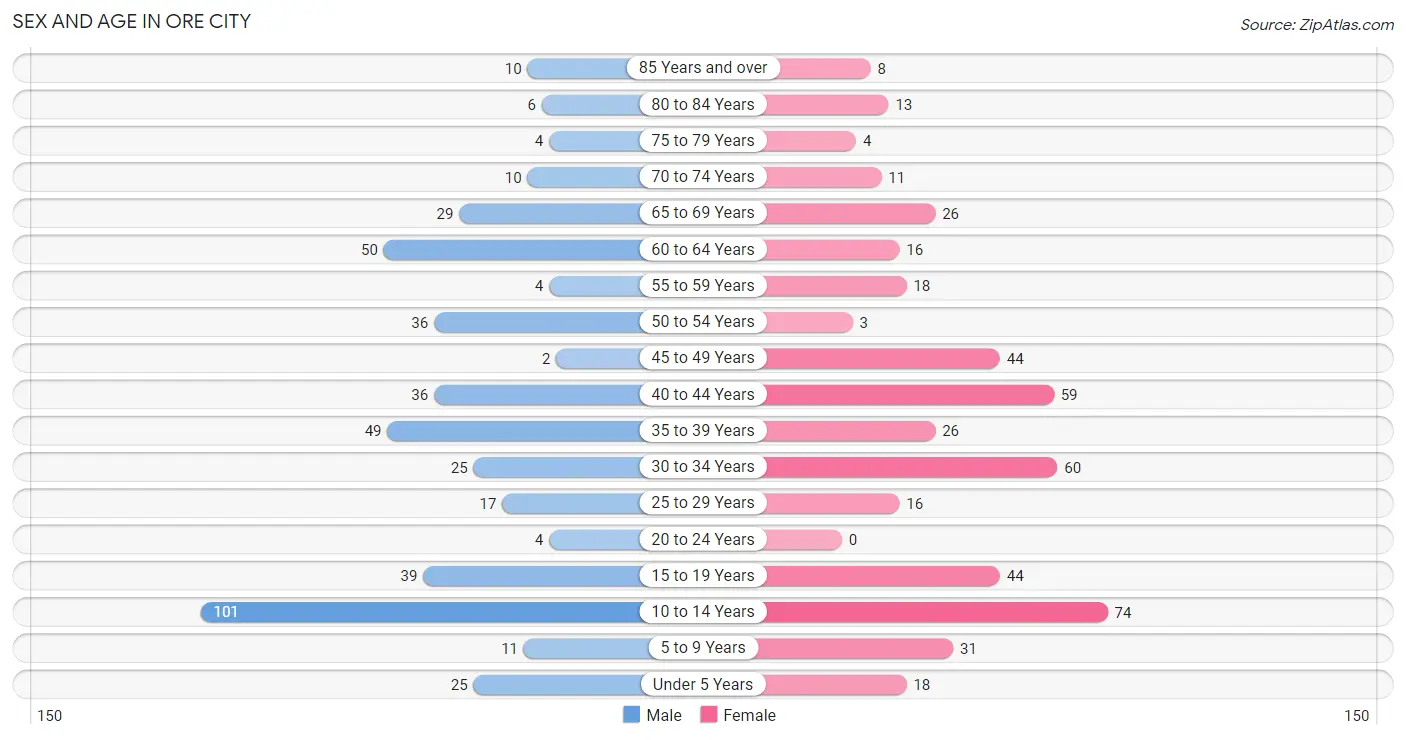
The most populous age groups in Ore City are 10 to 14 Years (101 | 22.1%) for men and 10 to 14 Years (74 | 15.7%) for women.
| Age Bracket | Male | Female |
| Under 5 Years | 25 (5.5%) | 18 (3.8%) |
| 5 to 9 Years | 11 (2.4%) | 31 (6.6%) |
| 10 to 14 Years | 101 (22.1%) | 74 (15.7%) |
| 15 to 19 Years | 39 (8.5%) | 44 (9.3%) |
| 20 to 24 Years | 4 (0.9%) | 0 (0.0%) |
| 25 to 29 Years | 17 (3.7%) | 16 (3.4%) |
| 30 to 34 Years | 25 (5.5%) | 60 (12.7%) |
| 35 to 39 Years | 49 (10.7%) | 26 (5.5%) |
| 40 to 44 Years | 36 (7.9%) | 59 (12.5%) |
| 45 to 49 Years | 2 (0.4%) | 44 (9.3%) |
| 50 to 54 Years | 36 (7.9%) | 3 (0.6%) |
| 55 to 59 Years | 4 (0.9%) | 18 (3.8%) |
| 60 to 64 Years | 50 (10.9%) | 16 (3.4%) |
| 65 to 69 Years | 29 (6.3%) | 26 (5.5%) |
| 70 to 74 Years | 10 (2.2%) | 11 (2.3%) |
| 75 to 79 Years | 4 (0.9%) | 4 (0.9%) |
| 80 to 84 Years | 6 (1.3%) | 13 (2.8%) |
| 85 Years and over | 10 (2.2%) | 8 (1.7%) |
| Total | 458 (100.0%) | 471 (100.0%) |
Families and Households in Ore City
Median Family Size in Ore City
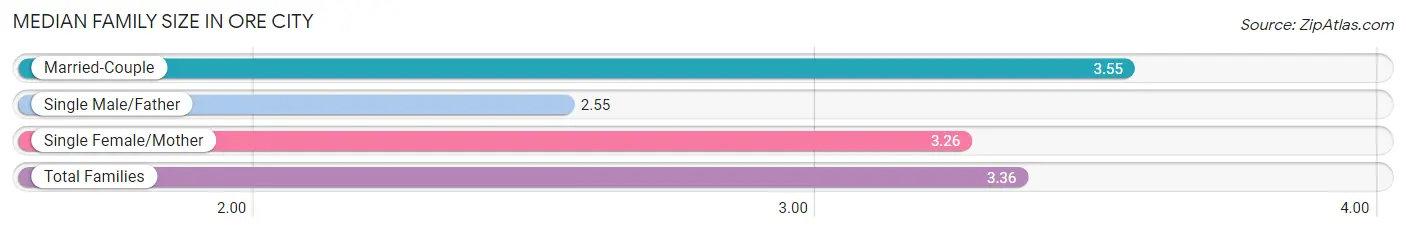
The median family size in Ore City is 3.36 persons per family, with married-couple families (154 | 63.6%) accounting for the largest median family size of 3.55 persons per family. On the other hand, single male/father families (31 | 12.8%) represent the smallest median family size with 2.55 persons per family.
| Family Type | # Families | Family Size |
| Married-Couple | 154 (63.6%) | 3.55 |
| Single Male/Father | 31 (12.8%) | 2.55 |
| Single Female/Mother | 57 (23.5%) | 3.26 |
| Total Families | 242 (100.0%) | 3.36 |
Median Household Size in Ore City
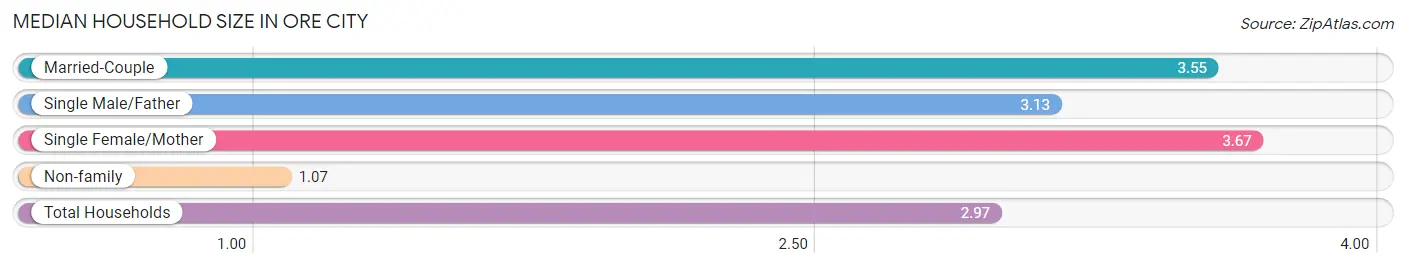
The median household size in Ore City is 2.97 persons per household, with single female/mother households (57 | 18.2%) accounting for the largest median household size of 3.67 persons per household. non-family households (71 | 22.7%) represent the smallest median household size with 1.07 persons per household.
| Household Type | # Households | Household Size |
| Married-Couple | 154 (49.2%) | 3.55 |
| Single Male/Father | 31 (9.9%) | 3.13 |
| Single Female/Mother | 57 (18.2%) | 3.67 |
| Non-family | 71 (22.7%) | 1.07 |
| Total Households | 313 (100.0%) | 2.97 |
Household Size by Marriage Status in Ore City
Out of a total of 313 households in Ore City, 242 (77.3%) are family households, while 71 (22.7%) are nonfamily households. The most numerous type of family households are 4-person households, comprising 82, and the most common type of nonfamily households are 1-person households, comprising 68.
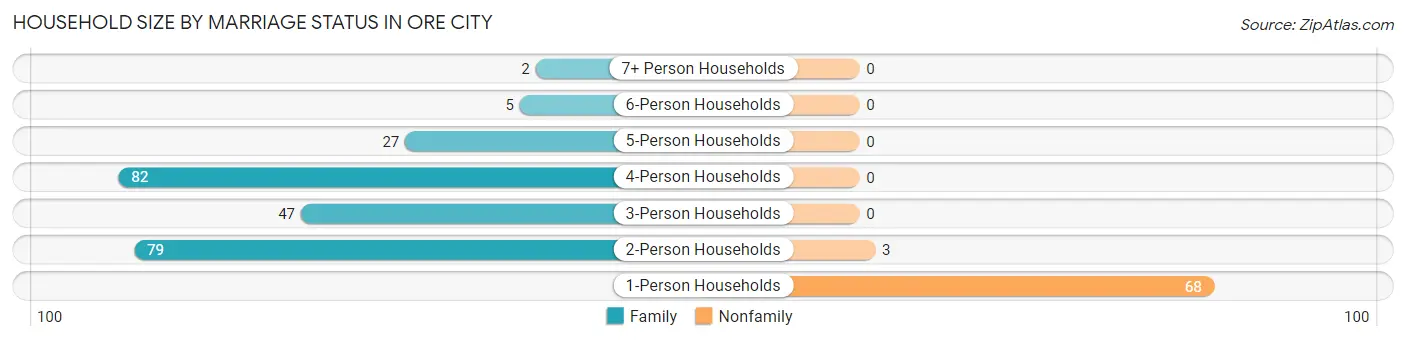
| Household Size | Family Households | Nonfamily Households |
| 1-Person Households | - | 68 (21.7%) |
| 2-Person Households | 79 (25.2%) | 3 (1.0%) |
| 3-Person Households | 47 (15.0%) | 0 (0.0%) |
| 4-Person Households | 82 (26.2%) | 0 (0.0%) |
| 5-Person Households | 27 (8.6%) | 0 (0.0%) |
| 6-Person Households | 5 (1.6%) | 0 (0.0%) |
| 7+ Person Households | 2 (0.6%) | 0 (0.0%) |
| Total | 242 (77.3%) | 71 (22.7%) |
Female Fertility in Ore City
Fertility by Age in Ore City
Average fertility rate in Ore City is 56.0 births per 1,000 women. Women in the age bracket of 35 to 50 years have the highest fertility rate with 101.0 births per 1,000 women. Women in the age bracket of 35 to 50 years acount for 92.9% of all women with births.
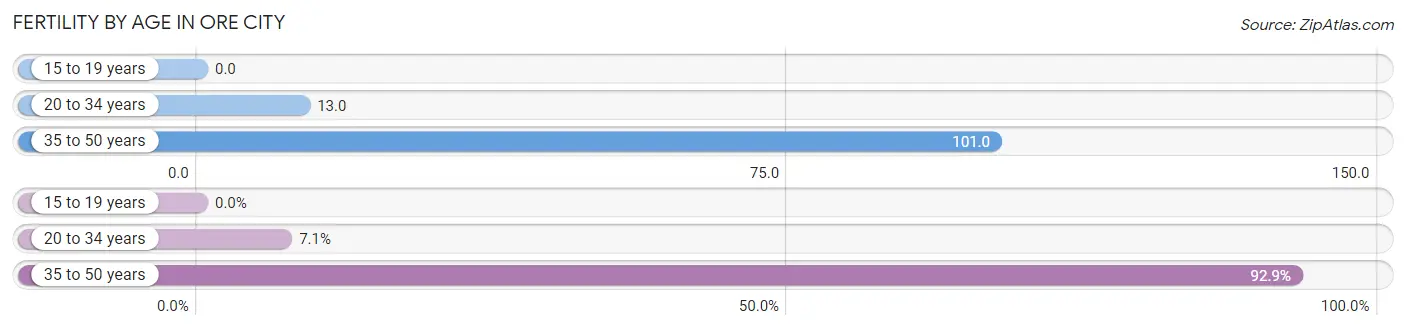
| Age Bracket | Women with Births | Births / 1,000 Women |
| 15 to 19 years | 0 (0.0%) | 0.0 |
| 20 to 34 years | 1 (7.1%) | 13.0 |
| 35 to 50 years | 13 (92.9%) | 101.0 |
| Total | 14 (100.0%) | 56.0 |
Fertility by Age by Marriage Status in Ore City
7.1% of women with births (14) in Ore City are married. The highest percentage of unmarried women with births falls into 35 to 50 years age bracket with 100.0% of them unmarried at the time of birth, while the lowest percentage of unmarried women with births belong to 20 to 34 years age bracket with 0.0% of them unmarried.
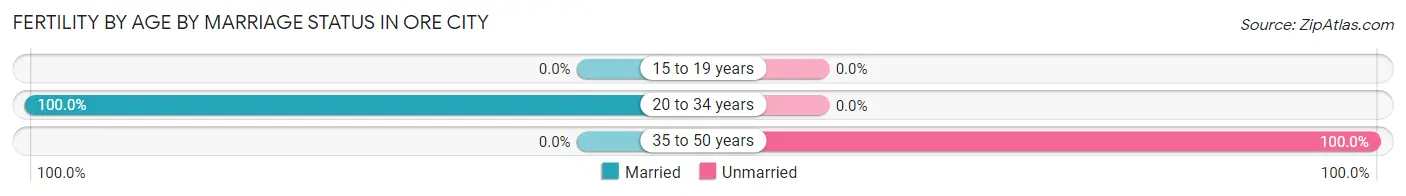
| Age Bracket | Married | Unmarried |
| 15 to 19 years | 0 (0.0%) | 0 (0.0%) |
| 20 to 34 years | 1 (100.0%) | 0 (0.0%) |
| 35 to 50 years | 0 (0.0%) | 13 (100.0%) |
| Total | 1 (7.1%) | 13 (92.9%) |
Fertility by Education in Ore City
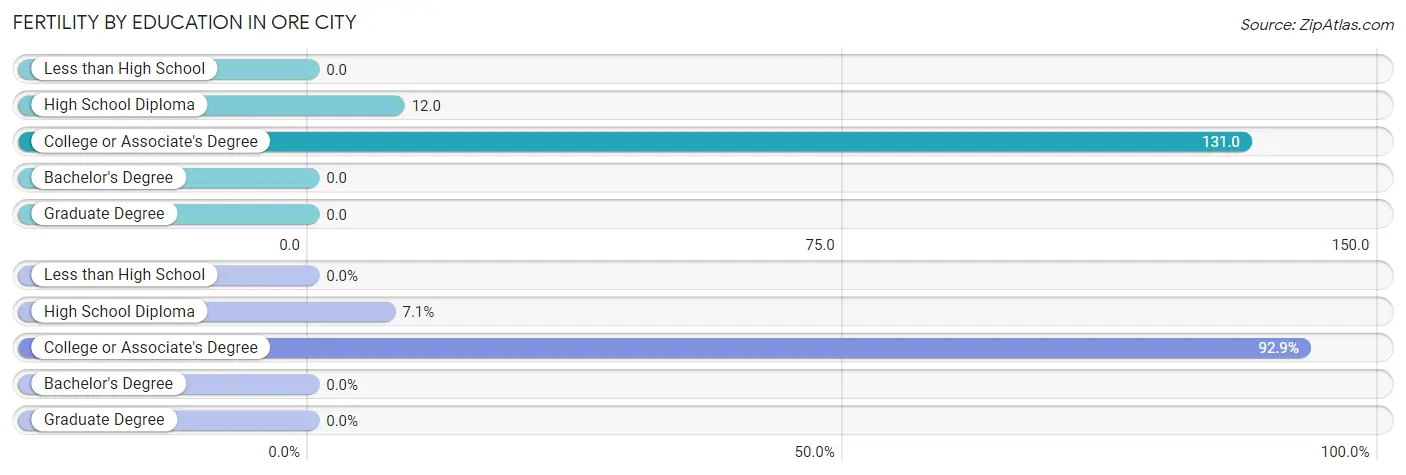
| Educational Attainment | Women with Births | Births / 1,000 Women |
| Less than High School | 0 (0.0%) | 0.0 |
| High School Diploma | 1 (7.1%) | 12.0 |
| College or Associate's Degree | 13 (92.9%) | 131.0 |
| Bachelor's Degree | 0 (0.0%) | 0.0 |
| Graduate Degree | 0 (0.0%) | 0.0 |
| Total | 14 (100.0%) | 56.0 |
Fertility by Education by Marriage Status in Ore City
92.9% of women with births in Ore City are unmarried. Women with the educational attainment of high school diploma are most likely to be married with 100.0% of them married at childbirth, while women with the educational attainment of college or associate's degree are least likely to be married with 100.0% of them unmarried at childbirth.
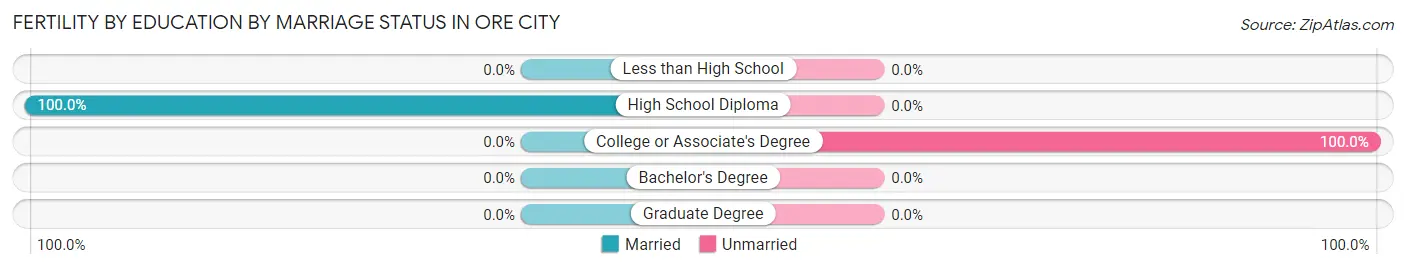
| Educational Attainment | Married | Unmarried |
| Less than High School | 0 (0.0%) | 0 (0.0%) |
| High School Diploma | 1 (100.0%) | 0 (0.0%) |
| College or Associate's Degree | 0 (0.0%) | 13 (100.0%) |
| Bachelor's Degree | 0 (0.0%) | 0 (0.0%) |
| Graduate Degree | 0 (0.0%) | 0 (0.0%) |
| Total | 1 (7.1%) | 13 (92.9%) |
Employment Characteristics in Ore City
Employment by Class of Employer in Ore City
Among the 354 employed individuals in Ore City, private company employees (288 | 81.4%), local government employees (30 | 8.5%), and not-for-profit organizations (16 | 4.5%) make up the most common classes of employment.
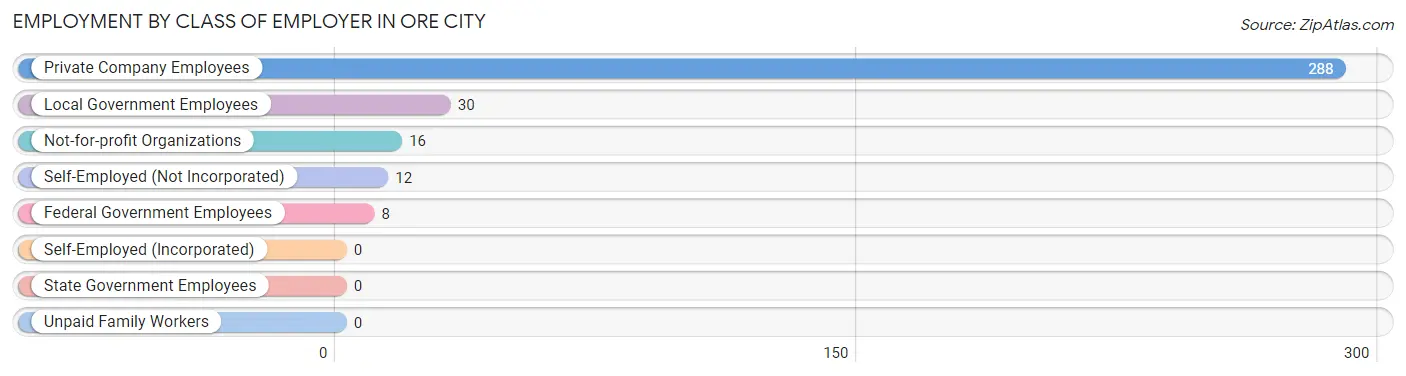
| Employer Class | # Employees | % Employees |
| Private Company Employees | 288 | 81.4% |
| Self-Employed (Incorporated) | 0 | 0.0% |
| Self-Employed (Not Incorporated) | 12 | 3.4% |
| Not-for-profit Organizations | 16 | 4.5% |
| Local Government Employees | 30 | 8.5% |
| State Government Employees | 0 | 0.0% |
| Federal Government Employees | 8 | 2.3% |
| Unpaid Family Workers | 0 | 0.0% |
| Total | 354 | 100.0% |
Employment Status by Age in Ore City
According to the labor force statistics for Ore City, out of the total population over 16 years of age (651), 57.5% or 374 individuals are in the labor force, with 5.3% or 20 of them unemployed. The age group with the highest labor force participation rate is 20 to 24 years, with 100.0% or 4 individuals in the labor force. Within the labor force, the 30 to 34 years age range has the highest percentage of unemployed individuals, with 17.9% or 10 of them being unemployed.
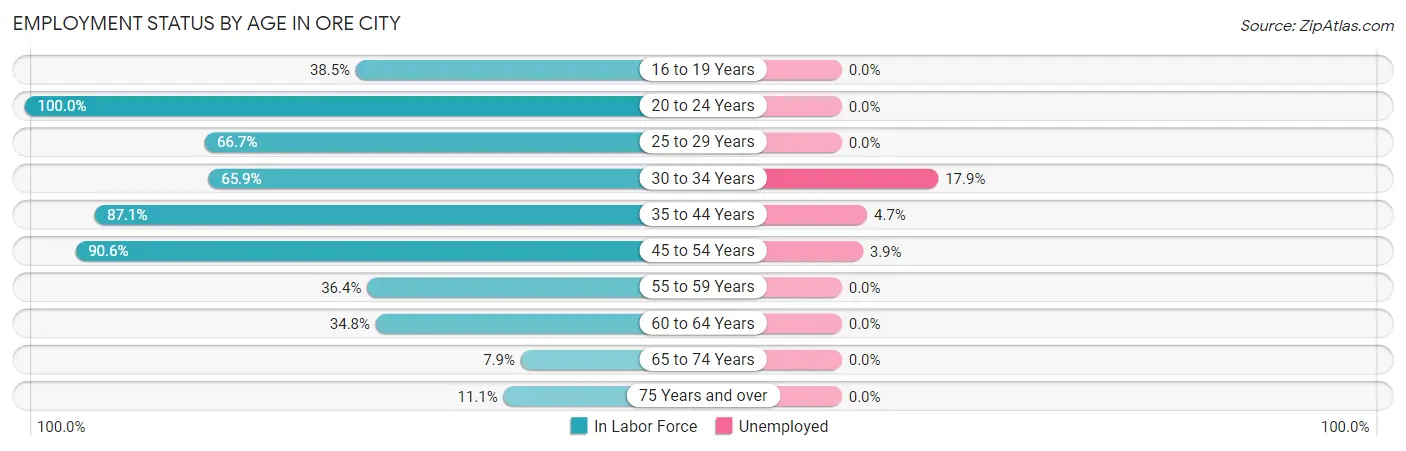
| Age Bracket | In Labor Force | Unemployed |
| 16 to 19 Years | 25 (38.5%) | 0 (0.0%) |
| 20 to 24 Years | 4 (100.0%) | 0 (0.0%) |
| 25 to 29 Years | 22 (66.7%) | 0 (0.0%) |
| 30 to 34 Years | 56 (65.9%) | 10 (17.9%) |
| 35 to 44 Years | 148 (87.1%) | 7 (4.7%) |
| 45 to 54 Years | 77 (90.6%) | 3 (3.9%) |
| 55 to 59 Years | 8 (36.4%) | 0 (0.0%) |
| 60 to 64 Years | 23 (34.8%) | 0 (0.0%) |
| 65 to 74 Years | 6 (7.9%) | 0 (0.0%) |
| 75 Years and over | 5 (11.1%) | 0 (0.0%) |
| Total | 374 (57.5%) | 20 (5.3%) |
Employment Status by Educational Attainment in Ore City
According to labor force statistics for Ore City, 72.5% of individuals (334) out of the total population between 25 and 64 years of age (461) are in the labor force, with 6.0% or 20 of them being unemployed. The group with the highest labor force participation rate are those with the educational attainment of bachelor's degree or higher, with 100.0% or 25 individuals in the labor force. Within the labor force, individuals with high school diploma education have the highest percentage of unemployment, with 9.2% or 10 of them being unemployed.
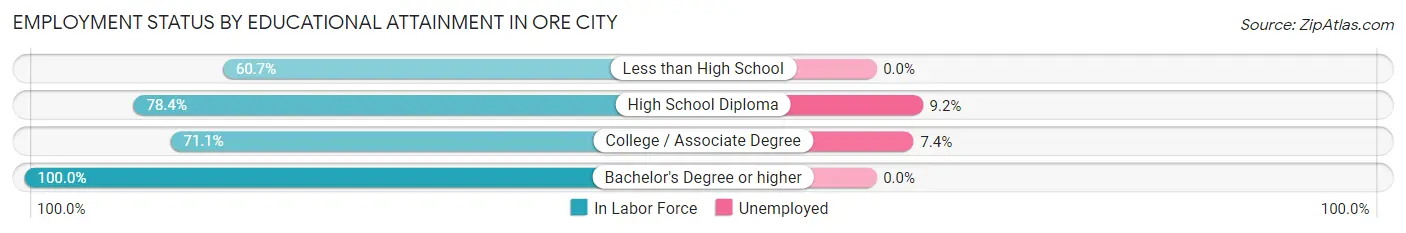
| Educational Attainment | In Labor Force | Unemployed |
| Less than High School | 65 (60.7%) | 0 (0.0%) |
| High School Diploma | 109 (78.4%) | 13 (9.2%) |
| College / Associate Degree | 135 (71.1%) | 14 (7.4%) |
| Bachelor's Degree or higher | 25 (100.0%) | 0 (0.0%) |
| Total | 334 (72.5%) | 28 (6.0%) |
Employment Occupations by Sex in Ore City
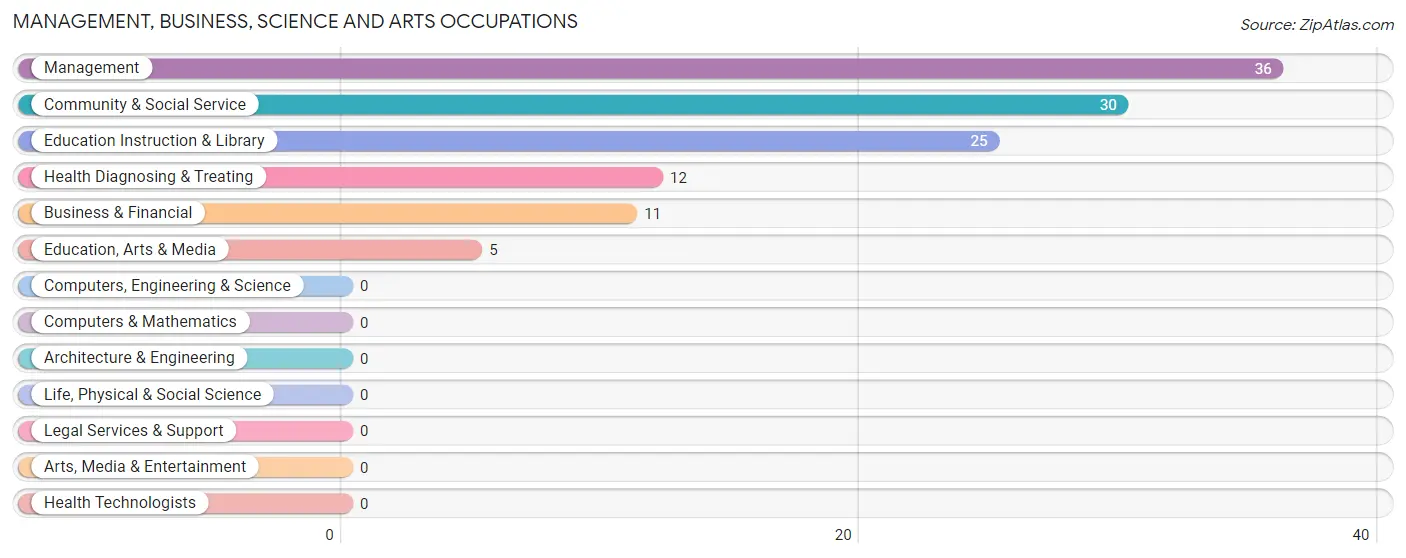
Management, Business, Science and Arts Occupations
The most common Management, Business, Science and Arts occupations in Ore City are Management (36 | 10.2%), Community & Social Service (30 | 8.5%), Education Instruction & Library (25 | 7.1%), Health Diagnosing & Treating (12 | 3.4%), and Business & Financial (11 | 3.1%).
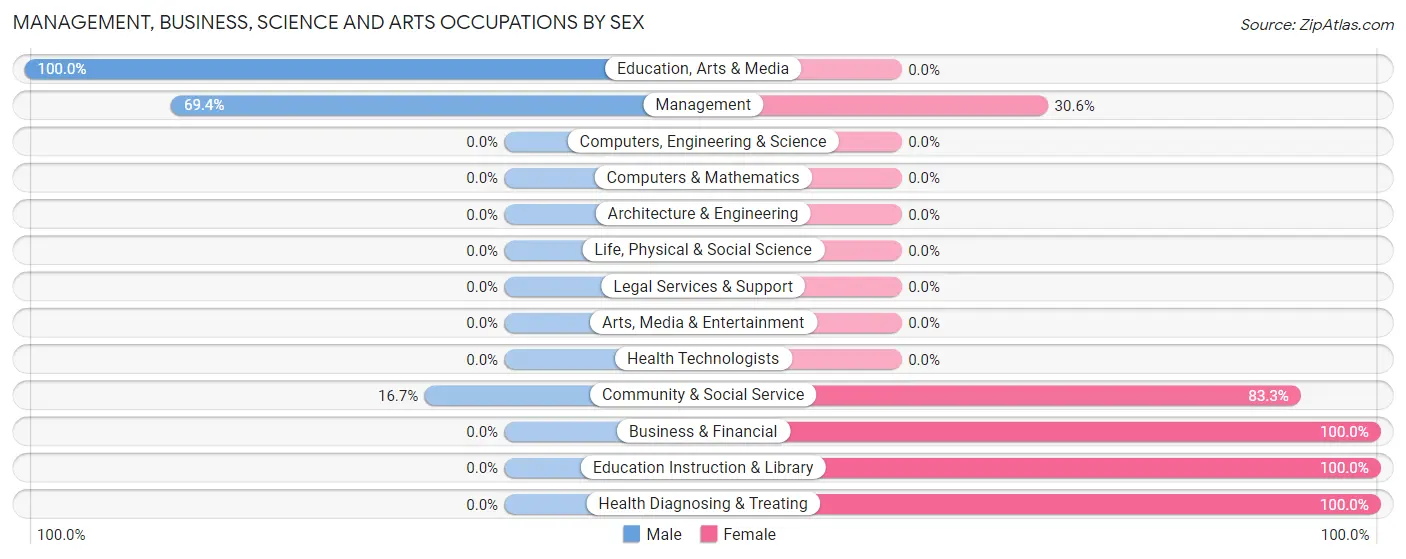
Management, Business, Science and Arts Occupations by Sex
Within the Management, Business, Science and Arts occupations in Ore City, the most male-oriented occupations are Education, Arts & Media (100.0%), Management (69.4%), and Community & Social Service (16.7%), while the most female-oriented occupations are Business & Financial (100.0%), Education Instruction & Library (100.0%), and Health Diagnosing & Treating (100.0%).
| Occupation | Male | Female |
| Management | 25 (69.4%) | 11 (30.6%) |
| Business & Financial | 0 (0.0%) | 11 (100.0%) |
| Computers, Engineering & Science | 0 (0.0%) | 0 (0.0%) |
| Computers & Mathematics | 0 (0.0%) | 0 (0.0%) |
| Architecture & Engineering | 0 (0.0%) | 0 (0.0%) |
| Life, Physical & Social Science | 0 (0.0%) | 0 (0.0%) |
| Community & Social Service | 5 (16.7%) | 25 (83.3%) |
| Education, Arts & Media | 5 (100.0%) | 0 (0.0%) |
| Legal Services & Support | 0 (0.0%) | 0 (0.0%) |
| Education Instruction & Library | 0 (0.0%) | 25 (100.0%) |
| Arts, Media & Entertainment | 0 (0.0%) | 0 (0.0%) |
| Health Diagnosing & Treating | 0 (0.0%) | 12 (100.0%) |
| Health Technologists | 0 (0.0%) | 0 (0.0%) |
| Total (Category) | 30 (33.7%) | 59 (66.3%) |
| Total (Overall) | 168 (47.5%) | 186 (52.5%) |
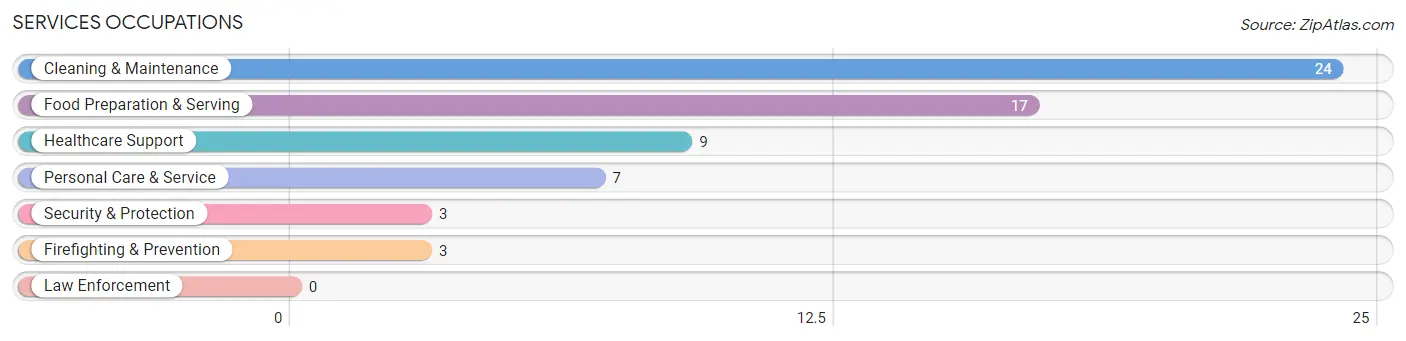
Services Occupations
The most common Services occupations in Ore City are Cleaning & Maintenance (24 | 6.8%), Food Preparation & Serving (17 | 4.8%), Healthcare Support (9 | 2.5%), Personal Care & Service (7 | 2.0%), and Security & Protection (3 | 0.9%).
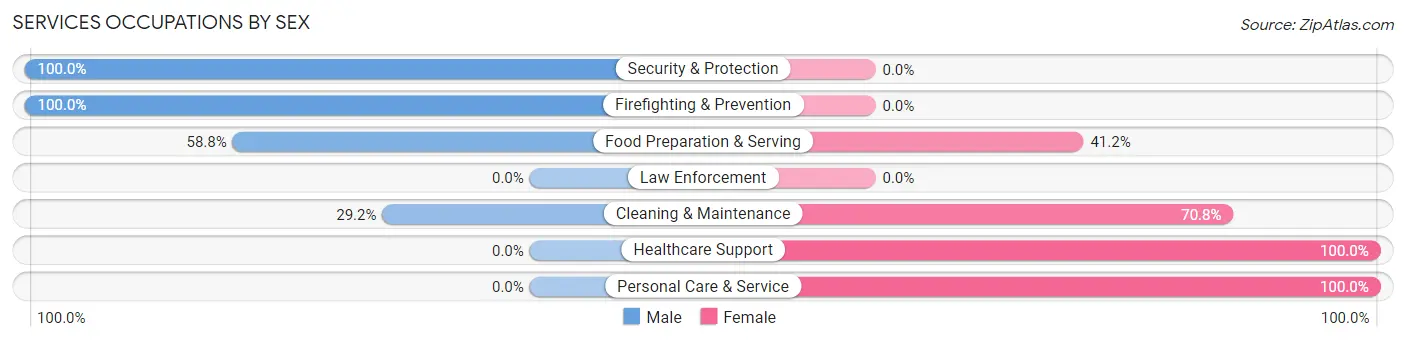
Services Occupations by Sex
Within the Services occupations in Ore City, the most male-oriented occupations are Security & Protection (100.0%), Firefighting & Prevention (100.0%), and Food Preparation & Serving (58.8%), while the most female-oriented occupations are Healthcare Support (100.0%), Personal Care & Service (100.0%), and Cleaning & Maintenance (70.8%).
| Occupation | Male | Female |
| Healthcare Support | 0 (0.0%) | 9 (100.0%) |
| Security & Protection | 3 (100.0%) | 0 (0.0%) |
| Firefighting & Prevention | 3 (100.0%) | 0 (0.0%) |
| Law Enforcement | 0 (0.0%) | 0 (0.0%) |
| Food Preparation & Serving | 10 (58.8%) | 7 (41.2%) |
| Cleaning & Maintenance | 7 (29.2%) | 17 (70.8%) |
| Personal Care & Service | 0 (0.0%) | 7 (100.0%) |
| Total (Category) | 20 (33.3%) | 40 (66.7%) |
| Total (Overall) | 168 (47.5%) | 186 (52.5%) |
Sales and Office Occupations
The most common Sales and Office occupations in Ore City are Office & Administration (50 | 14.1%), and Sales & Related (25 | 7.1%).
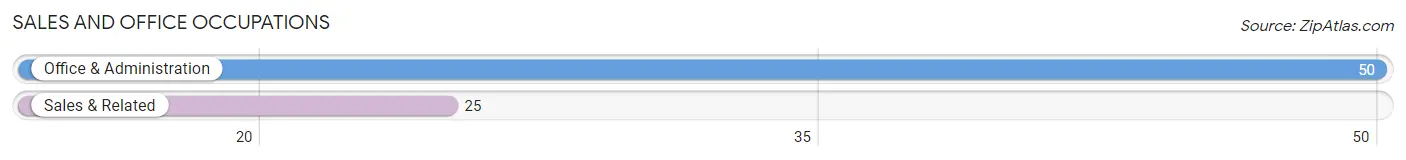
Sales and Office Occupations by Sex

| Occupation | Male | Female |
| Sales & Related | 13 (52.0%) | 12 (48.0%) |
| Office & Administration | 0 (0.0%) | 50 (100.0%) |
| Total (Category) | 13 (17.3%) | 62 (82.7%) |
| Total (Overall) | 168 (47.5%) | 186 (52.5%) |
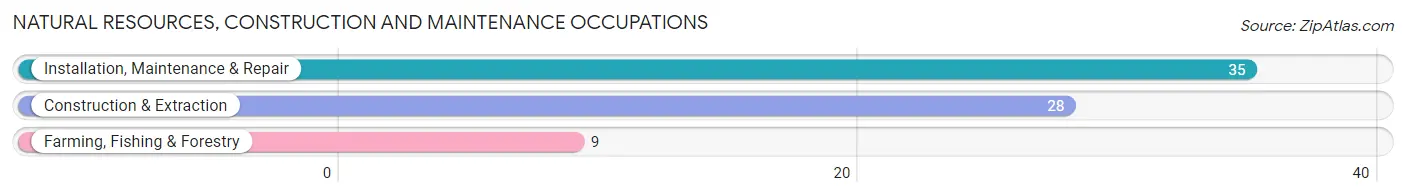
Natural Resources, Construction and Maintenance Occupations
The most common Natural Resources, Construction and Maintenance occupations in Ore City are Installation, Maintenance & Repair (35 | 9.9%), Construction & Extraction (28 | 7.9%), and Farming, Fishing & Forestry (9 | 2.5%).
Natural Resources, Construction and Maintenance Occupations by Sex
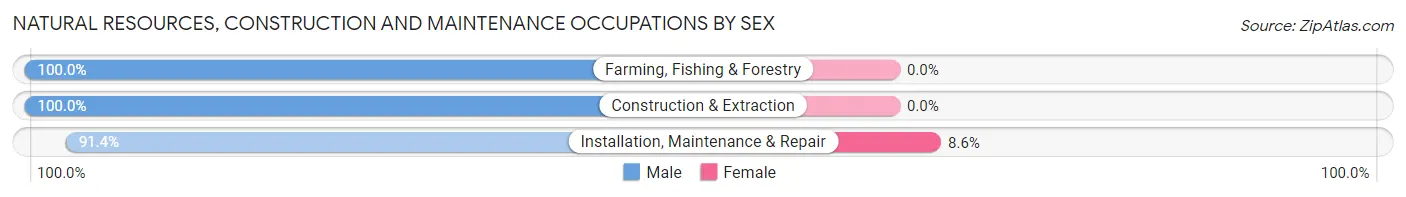
| Occupation | Male | Female |
| Farming, Fishing & Forestry | 9 (100.0%) | 0 (0.0%) |
| Construction & Extraction | 28 (100.0%) | 0 (0.0%) |
| Installation, Maintenance & Repair | 32 (91.4%) | 3 (8.6%) |
| Total (Category) | 69 (95.8%) | 3 (4.2%) |
| Total (Overall) | 168 (47.5%) | 186 (52.5%) |
Production, Transportation and Moving Occupations
The most common Production, Transportation and Moving occupations in Ore City are Production (36 | 10.2%), Material Moving (13 | 3.7%), and Transportation (9 | 2.5%).
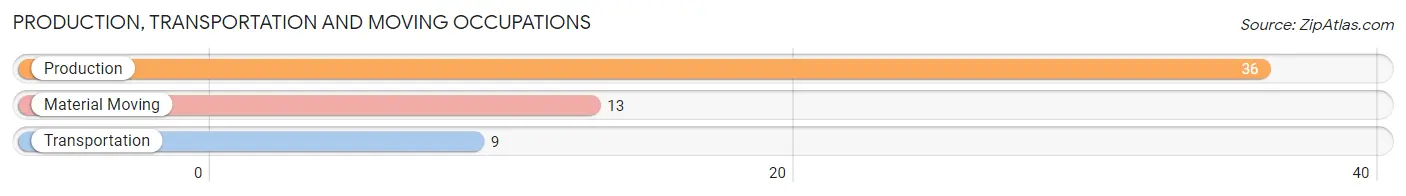
Production, Transportation and Moving Occupations by Sex
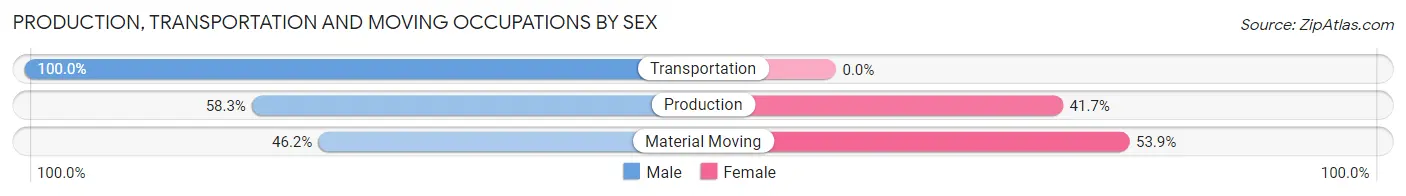
| Occupation | Male | Female |
| Production | 21 (58.3%) | 15 (41.7%) |
| Transportation | 9 (100.0%) | 0 (0.0%) |
| Material Moving | 6 (46.2%) | 7 (53.8%) |
| Total (Category) | 36 (62.1%) | 22 (37.9%) |
| Total (Overall) | 168 (47.5%) | 186 (52.5%) |
Employment Industries by Sex in Ore City
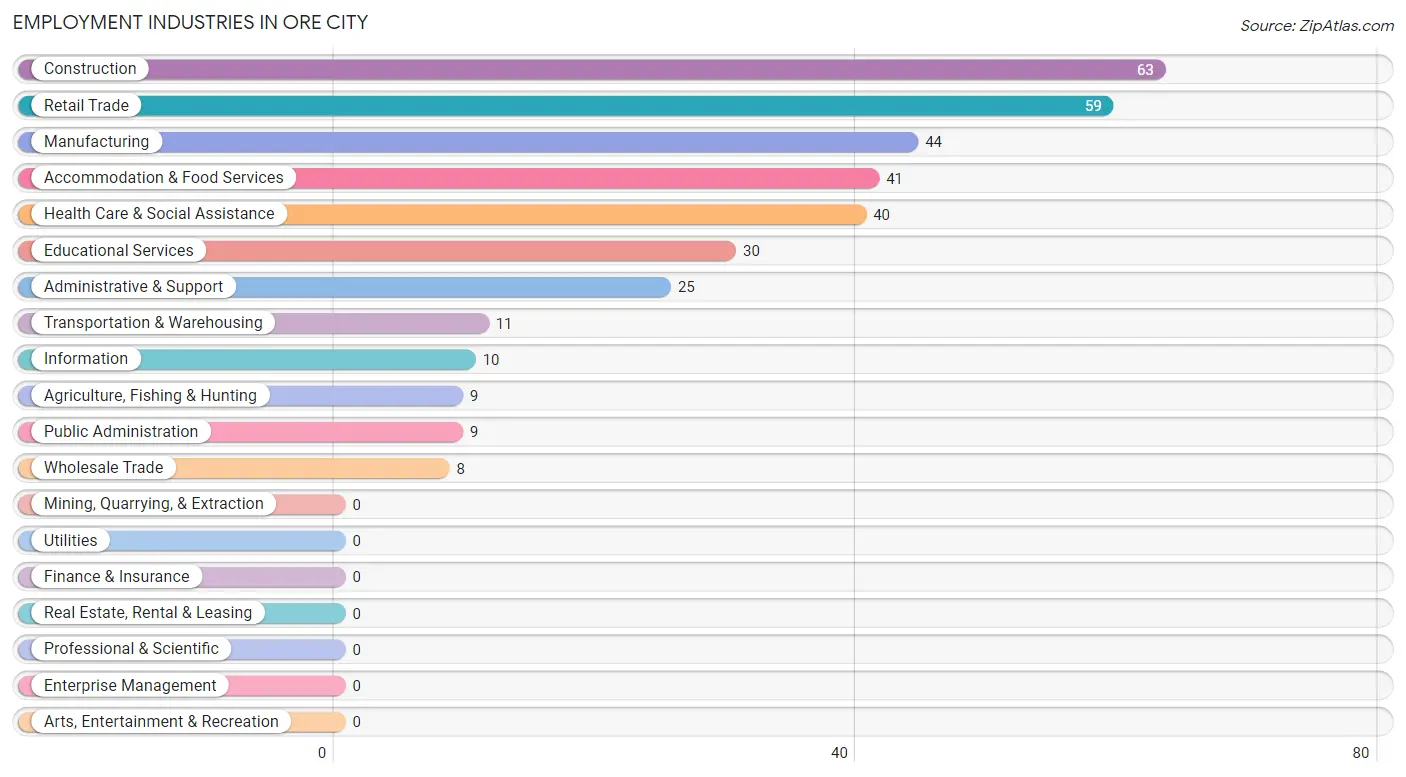
Employment Industries in Ore City
The major employment industries in Ore City include Construction (63 | 17.8%), Retail Trade (59 | 16.7%), Manufacturing (44 | 12.4%), Accommodation & Food Services (41 | 11.6%), and Health Care & Social Assistance (40 | 11.3%).
Employment Industries by Sex in Ore City
The Ore City industries that see more men than women are Agriculture, Fishing & Hunting (100.0%), Wholesale Trade (100.0%), and Information (100.0%), whereas the industries that tend to have a higher number of women are Educational Services (100.0%), Health Care & Social Assistance (100.0%), and Administrative & Support (72.0%).
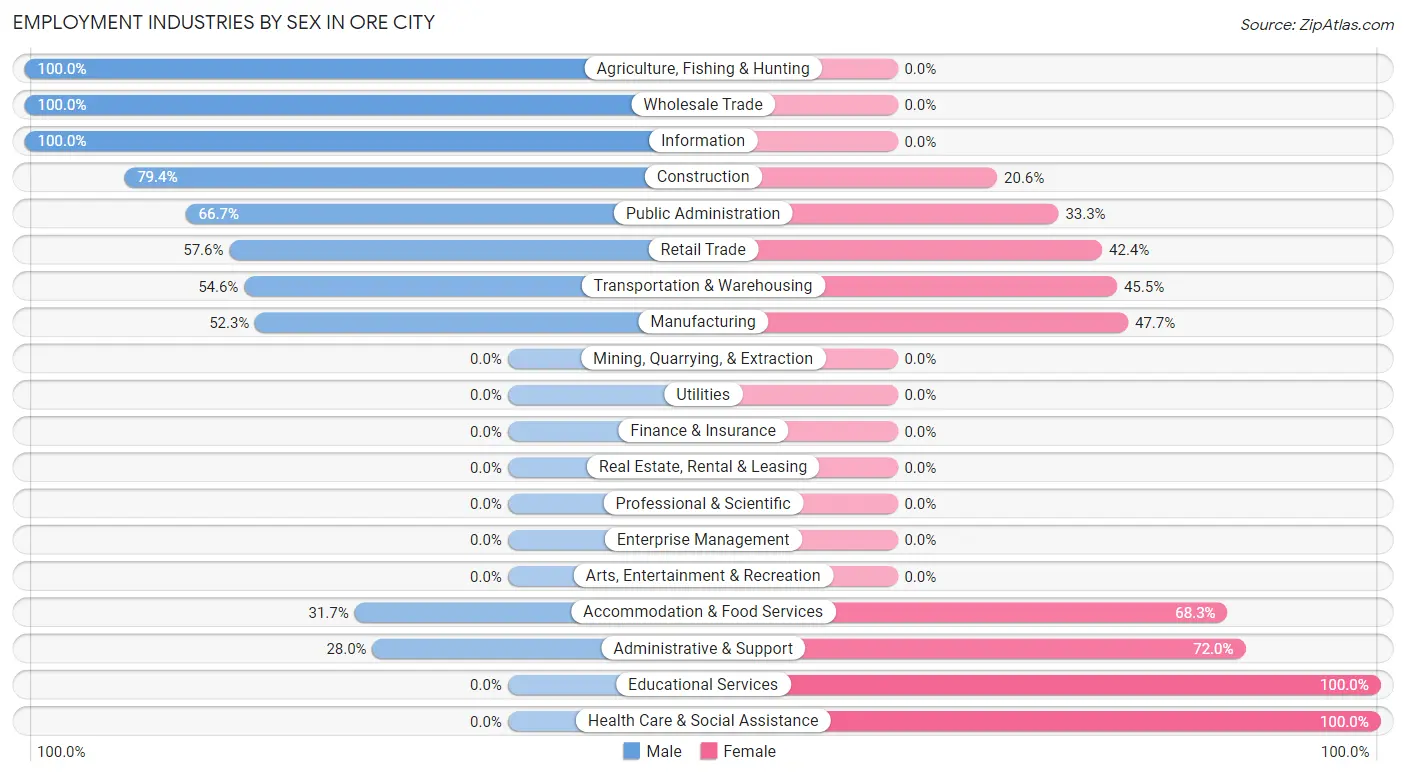
| Industry | Male | Female |
| Agriculture, Fishing & Hunting | 9 (100.0%) | 0 (0.0%) |
| Mining, Quarrying, & Extraction | 0 (0.0%) | 0 (0.0%) |
| Construction | 50 (79.4%) | 13 (20.6%) |
| Manufacturing | 23 (52.3%) | 21 (47.7%) |
| Wholesale Trade | 8 (100.0%) | 0 (0.0%) |
| Retail Trade | 34 (57.6%) | 25 (42.4%) |
| Transportation & Warehousing | 6 (54.5%) | 5 (45.5%) |
| Utilities | 0 (0.0%) | 0 (0.0%) |
| Information | 10 (100.0%) | 0 (0.0%) |
| Finance & Insurance | 0 (0.0%) | 0 (0.0%) |
| Real Estate, Rental & Leasing | 0 (0.0%) | 0 (0.0%) |
| Professional & Scientific | 0 (0.0%) | 0 (0.0%) |
| Enterprise Management | 0 (0.0%) | 0 (0.0%) |
| Administrative & Support | 7 (28.0%) | 18 (72.0%) |
| Educational Services | 0 (0.0%) | 30 (100.0%) |
| Health Care & Social Assistance | 0 (0.0%) | 40 (100.0%) |
| Arts, Entertainment & Recreation | 0 (0.0%) | 0 (0.0%) |
| Accommodation & Food Services | 13 (31.7%) | 28 (68.3%) |
| Public Administration | 6 (66.7%) | 3 (33.3%) |
| Total | 168 (47.5%) | 186 (52.5%) |
Education in Ore City
School Enrollment in Ore City
The most common levels of schooling among the 316 students in Ore City are middle school (129 | 40.8%), high school (96 | 30.4%), and elementary school (59 | 18.7%).
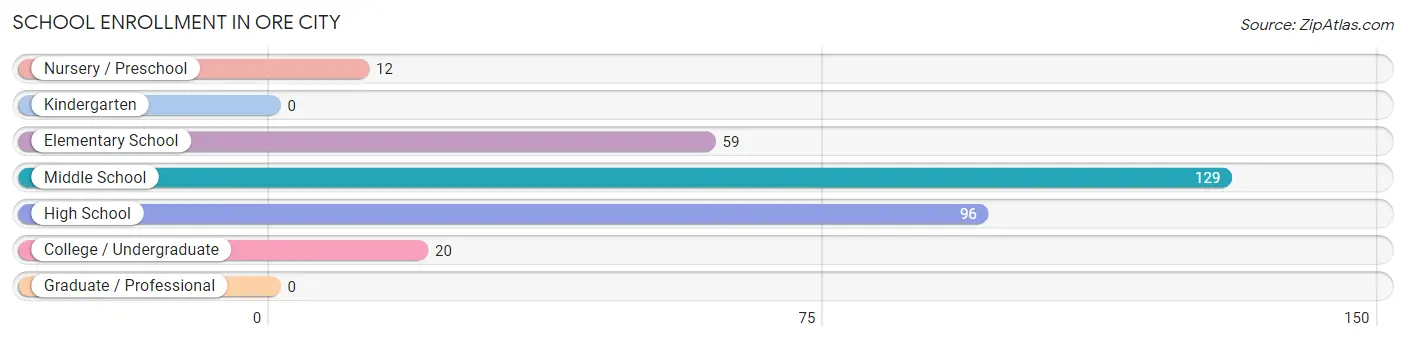
| School Level | # Students | % Students |
| Nursery / Preschool | 12 | 3.8% |
| Kindergarten | 0 | 0.0% |
| Elementary School | 59 | 18.7% |
| Middle School | 129 | 40.8% |
| High School | 96 | 30.4% |
| College / Undergraduate | 20 | 6.3% |
| Graduate / Professional | 0 | 0.0% |
| Total | 316 | 100.0% |
School Enrollment by Age by Funding Source in Ore City
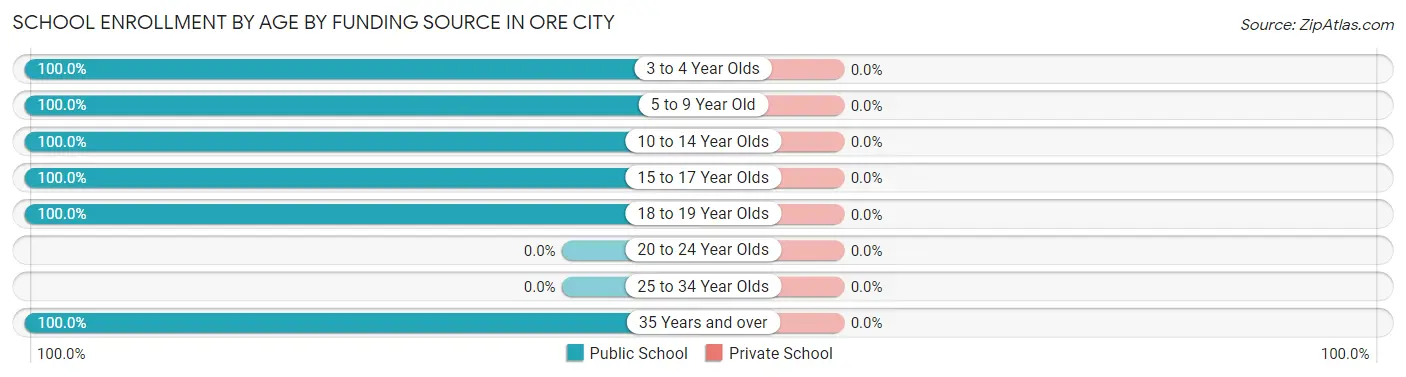
| Age Bracket | Public School | Private School |
| 3 to 4 Year Olds | 12 (100.0%) | 0 (0.0%) |
| 5 to 9 Year Old | 41 (100.0%) | 0 (0.0%) |
| 10 to 14 Year Olds | 175 (100.0%) | 0 (0.0%) |
| 15 to 17 Year Olds | 62 (100.0%) | 0 (0.0%) |
| 18 to 19 Year Olds | 16 (100.0%) | 0 (0.0%) |
| 20 to 24 Year Olds | 0 (0.0%) | 0 (0.0%) |
| 25 to 34 Year Olds | 0 (0.0%) | 0 (0.0%) |
| 35 Years and over | 10 (100.0%) | 0 (0.0%) |
| Total | 316 (100.0%) | 0 (0.0%) |
Educational Attainment by Field of Study in Ore City
Computers & mathematics (8 | 25.8%), arts & humanities (7 | 22.6%), business (5 | 16.1%), multidisciplinary studies (4 | 12.9%), and education (3 | 9.7%) are the most common fields of study among 31 individuals in Ore City who have obtained a bachelor's degree or higher.
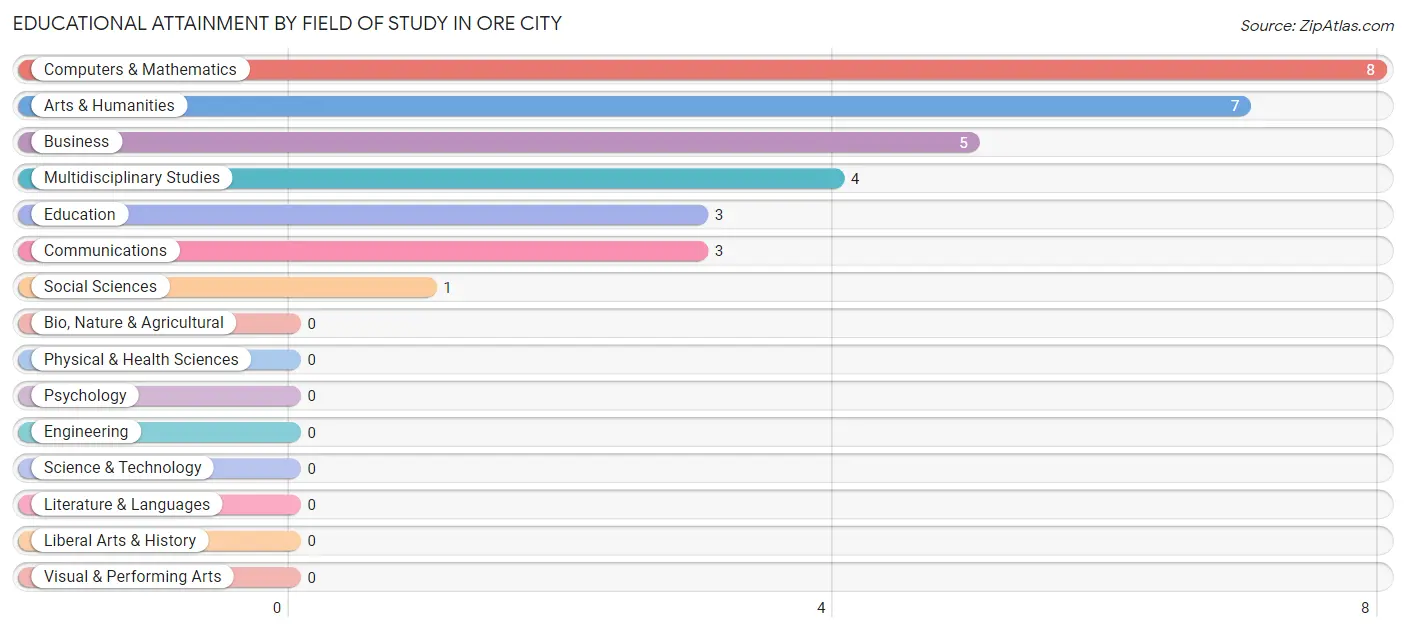
| Field of Study | # Graduates | % Graduates |
| Computers & Mathematics | 8 | 25.8% |
| Bio, Nature & Agricultural | 0 | 0.0% |
| Physical & Health Sciences | 0 | 0.0% |
| Psychology | 0 | 0.0% |
| Social Sciences | 1 | 3.2% |
| Engineering | 0 | 0.0% |
| Multidisciplinary Studies | 4 | 12.9% |
| Science & Technology | 0 | 0.0% |
| Business | 5 | 16.1% |
| Education | 3 | 9.7% |
| Literature & Languages | 0 | 0.0% |
| Liberal Arts & History | 0 | 0.0% |
| Visual & Performing Arts | 0 | 0.0% |
| Communications | 3 | 9.7% |
| Arts & Humanities | 7 | 22.6% |
| Total | 31 | 100.0% |
Transportation & Commute in Ore City
Vehicle Availability by Sex in Ore City
The most prevalent vehicle ownership categories in Ore City are males with 2 vehicles (65, accounting for 38.7%) and females with 2 vehicles (88, making up 34.9%).
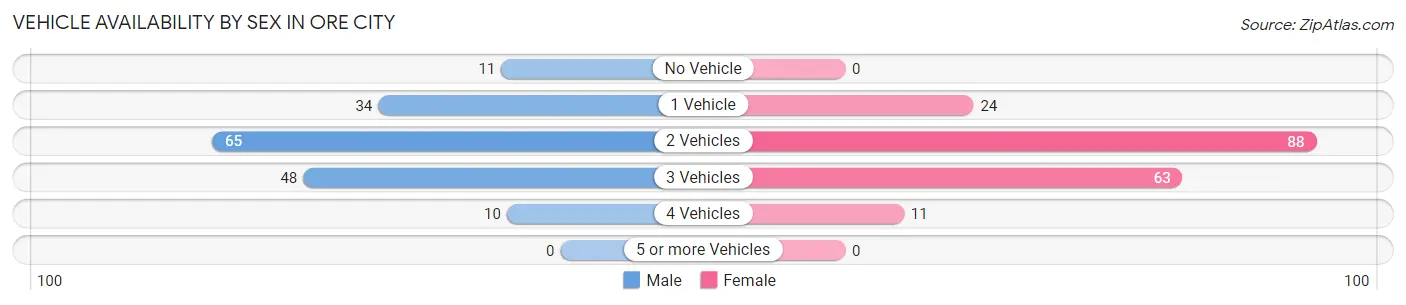
| Vehicles Available | Male | Female |
| No Vehicle | 11 (6.6%) | 0 (0.0%) |
| 1 Vehicle | 34 (20.2%) | 24 (12.9%) |
| 2 Vehicles | 65 (38.7%) | 88 (47.3%) |
| 3 Vehicles | 48 (28.6%) | 63 (33.9%) |
| 4 Vehicles | 10 (5.9%) | 11 (5.9%) |
| 5 or more Vehicles | 0 (0.0%) | 0 (0.0%) |
| Total | 168 (100.0%) | 186 (100.0%) |
Commute Time in Ore City
The most frequently occuring commute durations in Ore City are 30 to 34 minutes (69 commuters, 19.8%), 25 to 29 minutes (42 commuters, 12.0%), and 10 to 14 minutes (39 commuters, 11.2%).
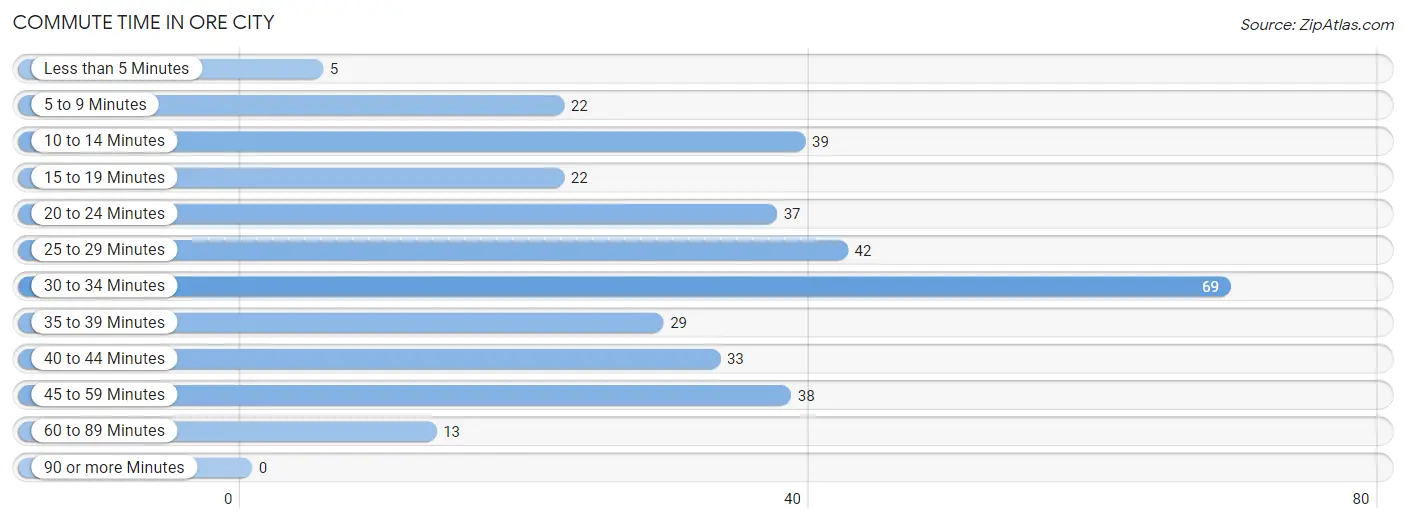
| Commute Time | # Commuters | % Commuters |
| Less than 5 Minutes | 5 | 1.4% |
| 5 to 9 Minutes | 22 | 6.3% |
| 10 to 14 Minutes | 39 | 11.2% |
| 15 to 19 Minutes | 22 | 6.3% |
| 20 to 24 Minutes | 37 | 10.6% |
| 25 to 29 Minutes | 42 | 12.0% |
| 30 to 34 Minutes | 69 | 19.8% |
| 35 to 39 Minutes | 29 | 8.3% |
| 40 to 44 Minutes | 33 | 9.5% |
| 45 to 59 Minutes | 38 | 10.9% |
| 60 to 89 Minutes | 13 | 3.7% |
| 90 or more Minutes | 0 | 0.0% |
Commute Time by Sex in Ore City
The most common commute times in Ore City are 30 to 34 minutes (35 commuters, 21.1%) for males and 30 to 34 minutes (34 commuters, 18.6%) for females.
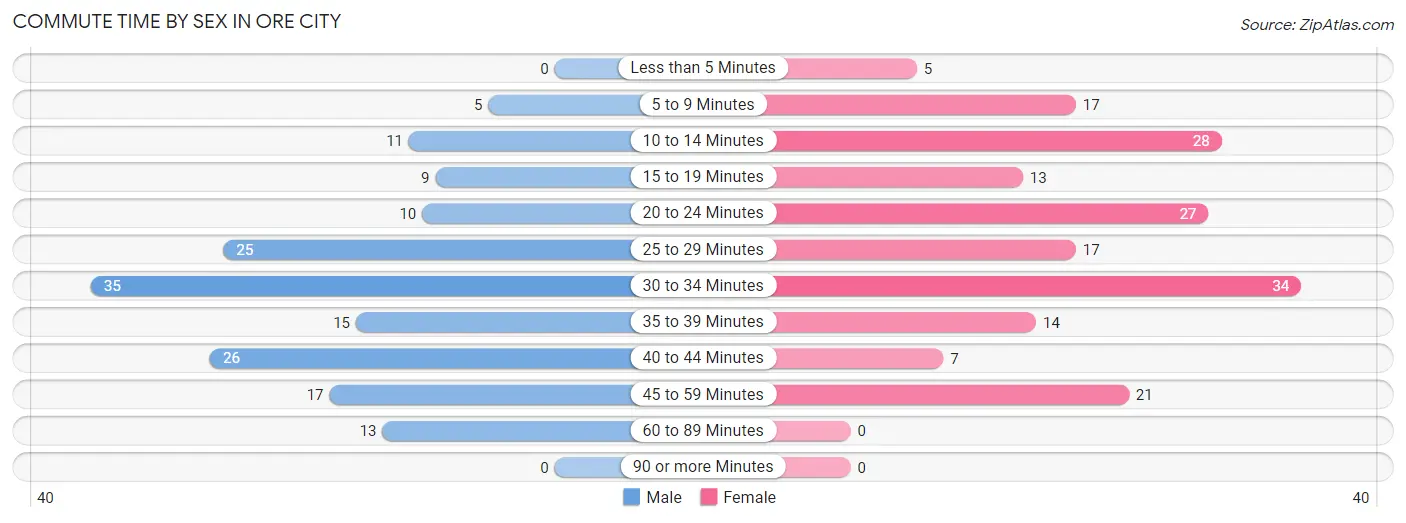
| Commute Time | Male | Female |
| Less than 5 Minutes | 0 (0.0%) | 5 (2.7%) |
| 5 to 9 Minutes | 5 (3.0%) | 17 (9.3%) |
| 10 to 14 Minutes | 11 (6.6%) | 28 (15.3%) |
| 15 to 19 Minutes | 9 (5.4%) | 13 (7.1%) |
| 20 to 24 Minutes | 10 (6.0%) | 27 (14.7%) |
| 25 to 29 Minutes | 25 (15.1%) | 17 (9.3%) |
| 30 to 34 Minutes | 35 (21.1%) | 34 (18.6%) |
| 35 to 39 Minutes | 15 (9.0%) | 14 (7.6%) |
| 40 to 44 Minutes | 26 (15.7%) | 7 (3.8%) |
| 45 to 59 Minutes | 17 (10.2%) | 21 (11.5%) |
| 60 to 89 Minutes | 13 (7.8%) | 0 (0.0%) |
| 90 or more Minutes | 0 (0.0%) | 0 (0.0%) |
Time of Departure to Work by Sex in Ore City
The most frequent times of departure to work in Ore City are 5:00 AM to 5:29 AM (26, 15.7%) for males and 6:30 AM to 6:59 AM (48, 26.2%) for females.
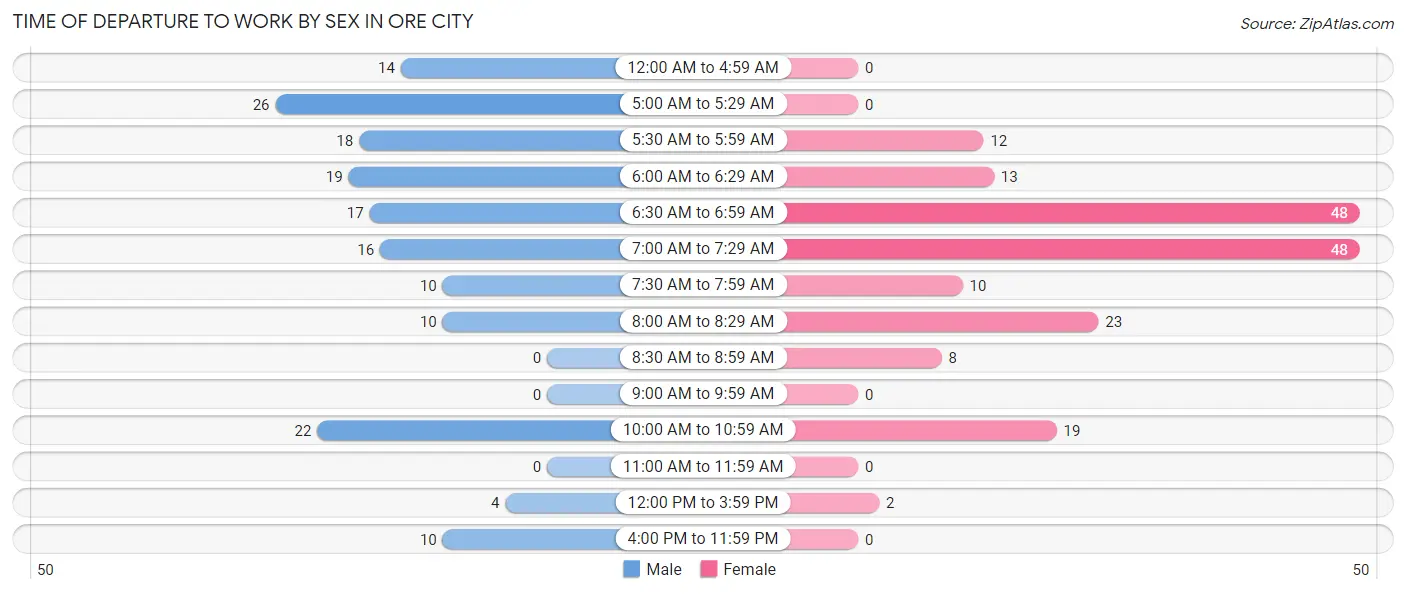
| Time of Departure | Male | Female |
| 12:00 AM to 4:59 AM | 14 (8.4%) | 0 (0.0%) |
| 5:00 AM to 5:29 AM | 26 (15.7%) | 0 (0.0%) |
| 5:30 AM to 5:59 AM | 18 (10.8%) | 12 (6.6%) |
| 6:00 AM to 6:29 AM | 19 (11.5%) | 13 (7.1%) |
| 6:30 AM to 6:59 AM | 17 (10.2%) | 48 (26.2%) |
| 7:00 AM to 7:29 AM | 16 (9.6%) | 48 (26.2%) |
| 7:30 AM to 7:59 AM | 10 (6.0%) | 10 (5.5%) |
| 8:00 AM to 8:29 AM | 10 (6.0%) | 23 (12.6%) |
| 8:30 AM to 8:59 AM | 0 (0.0%) | 8 (4.4%) |
| 9:00 AM to 9:59 AM | 0 (0.0%) | 0 (0.0%) |
| 10:00 AM to 10:59 AM | 22 (13.3%) | 19 (10.4%) |
| 11:00 AM to 11:59 AM | 0 (0.0%) | 0 (0.0%) |
| 12:00 PM to 3:59 PM | 4 (2.4%) | 2 (1.1%) |
| 4:00 PM to 11:59 PM | 10 (6.0%) | 0 (0.0%) |
| Total | 166 (100.0%) | 183 (100.0%) |
Housing Occupancy in Ore City
Occupancy by Ownership in Ore City
Of the total 313 dwellings in Ore City, owner-occupied units account for 204 (65.2%), while renter-occupied units make up 109 (34.8%).
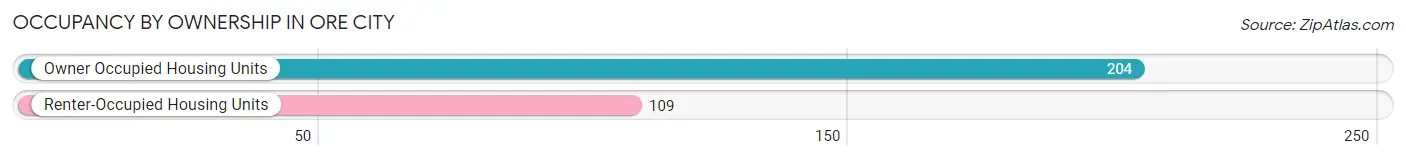
| Occupancy | # Housing Units | % Housing Units |
| Owner Occupied Housing Units | 204 | 65.2% |
| Renter-Occupied Housing Units | 109 | 34.8% |
| Total Occupied Housing Units | 313 | 100.0% |
Occupancy by Household Size in Ore City
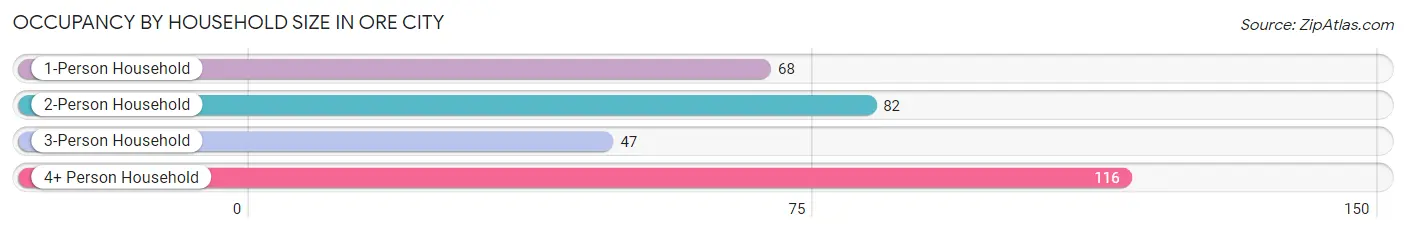
| Household Size | # Housing Units | % Housing Units |
| 1-Person Household | 68 | 21.7% |
| 2-Person Household | 82 | 26.2% |
| 3-Person Household | 47 | 15.0% |
| 4+ Person Household | 116 | 37.1% |
| Total Housing Units | 313 | 100.0% |
Occupancy by Ownership by Household Size in Ore City
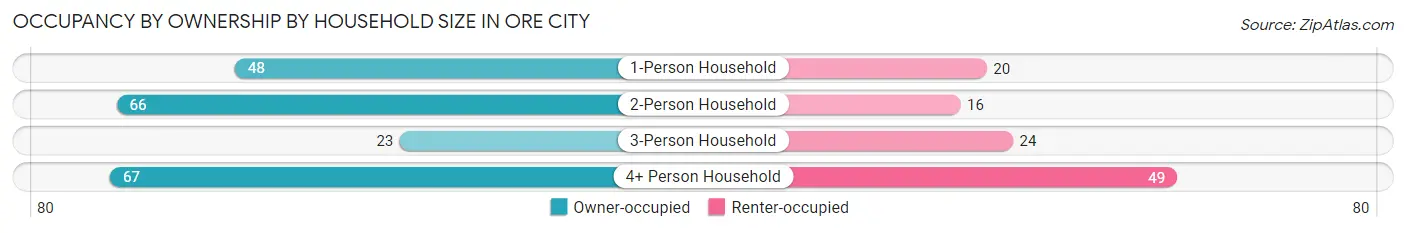
| Household Size | Owner-occupied | Renter-occupied |
| 1-Person Household | 48 (70.6%) | 20 (29.4%) |
| 2-Person Household | 66 (80.5%) | 16 (19.5%) |
| 3-Person Household | 23 (48.9%) | 24 (51.1%) |
| 4+ Person Household | 67 (57.8%) | 49 (42.2%) |
| Total Housing Units | 204 (65.2%) | 109 (34.8%) |
Occupancy by Educational Attainment in Ore City
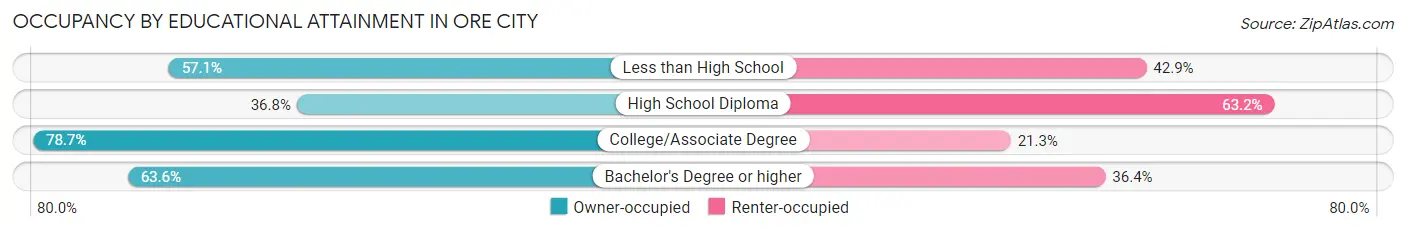
| Household Size | Owner-occupied | Renter-occupied |
| Less than High School | 40 (57.1%) | 30 (42.9%) |
| High School Diploma | 21 (36.8%) | 36 (63.2%) |
| College/Associate Degree | 129 (78.7%) | 35 (21.3%) |
| Bachelor's Degree or higher | 14 (63.6%) | 8 (36.4%) |
Occupancy by Age of Householder in Ore City
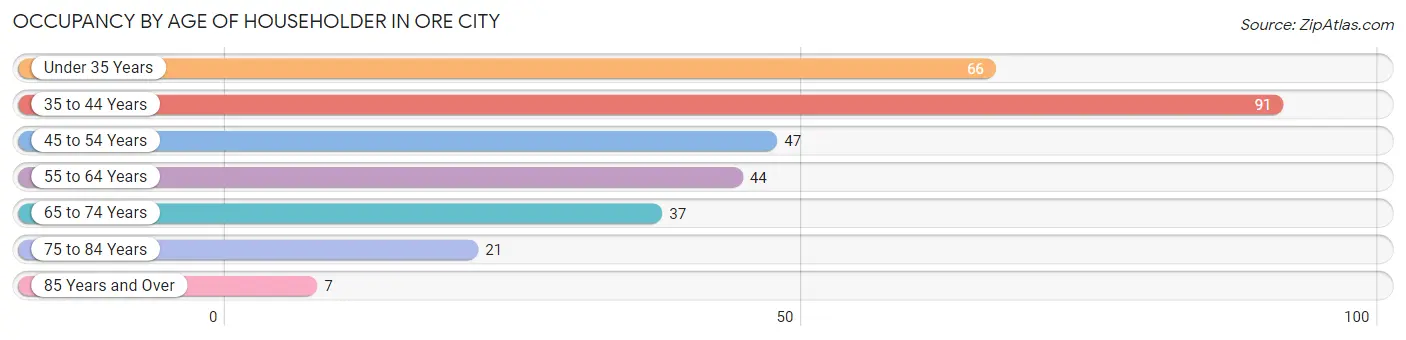
| Age Bracket | # Households | % Households |
| Under 35 Years | 66 | 21.1% |
| 35 to 44 Years | 91 | 29.1% |
| 45 to 54 Years | 47 | 15.0% |
| 55 to 64 Years | 44 | 14.1% |
| 65 to 74 Years | 37 | 11.8% |
| 75 to 84 Years | 21 | 6.7% |
| 85 Years and Over | 7 | 2.2% |
| Total | 313 | 100.0% |
Housing Finances in Ore City
Median Income by Occupancy in Ore City
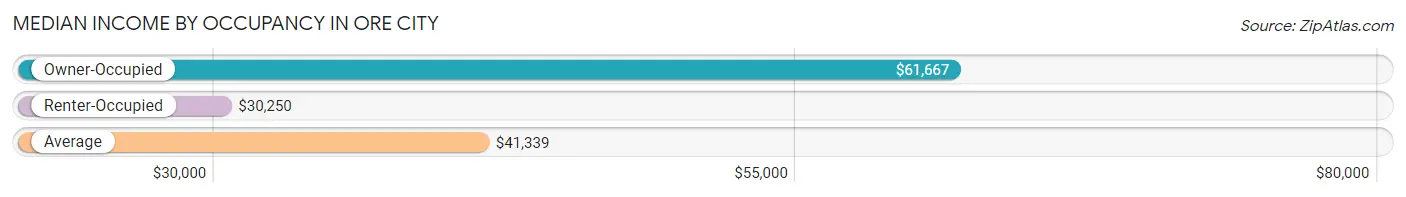
| Occupancy Type | # Households | Median Income |
| Owner-Occupied | 204 (65.2%) | $61,667 |
| Renter-Occupied | 109 (34.8%) | $30,250 |
| Average | 313 (100.0%) | $41,339 |
Occupancy by Householder Income Bracket in Ore City
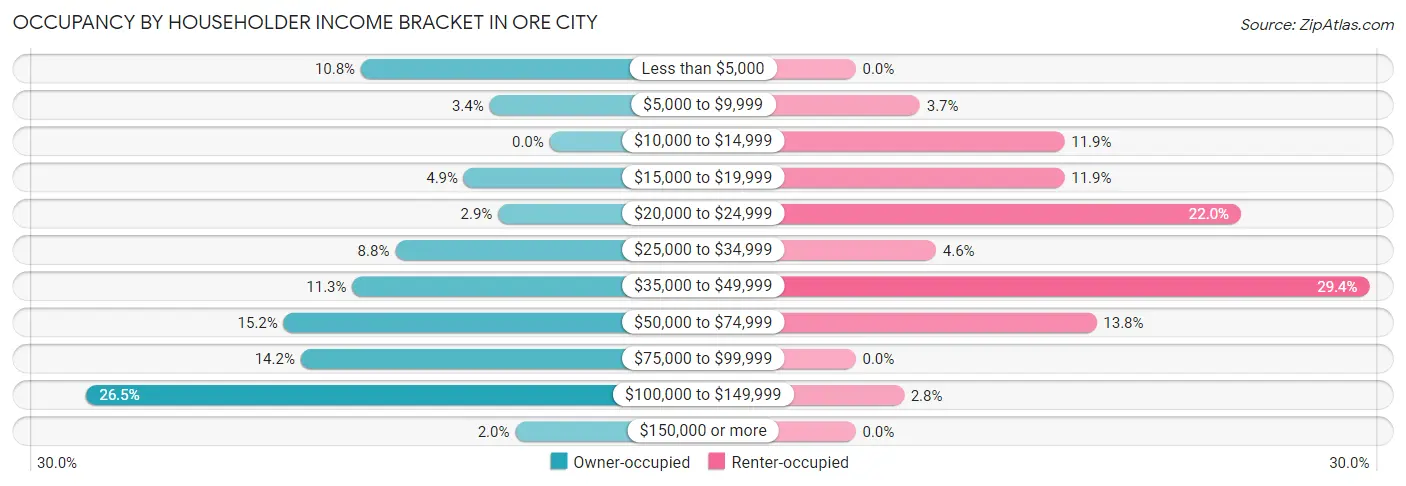
| Income Bracket | Owner-occupied | Renter-occupied |
| Less than $5,000 | 22 (10.8%) | 0 (0.0%) |
| $5,000 to $9,999 | 7 (3.4%) | 4 (3.7%) |
| $10,000 to $14,999 | 0 (0.0%) | 13 (11.9%) |
| $15,000 to $19,999 | 10 (4.9%) | 13 (11.9%) |
| $20,000 to $24,999 | 6 (2.9%) | 24 (22.0%) |
| $25,000 to $34,999 | 18 (8.8%) | 5 (4.6%) |
| $35,000 to $49,999 | 23 (11.3%) | 32 (29.4%) |
| $50,000 to $74,999 | 31 (15.2%) | 15 (13.8%) |
| $75,000 to $99,999 | 29 (14.2%) | 0 (0.0%) |
| $100,000 to $149,999 | 54 (26.5%) | 3 (2.8%) |
| $150,000 or more | 4 (2.0%) | 0 (0.0%) |
| Total | 204 (100.0%) | 109 (100.0%) |
Monthly Housing Cost Tiers in Ore City
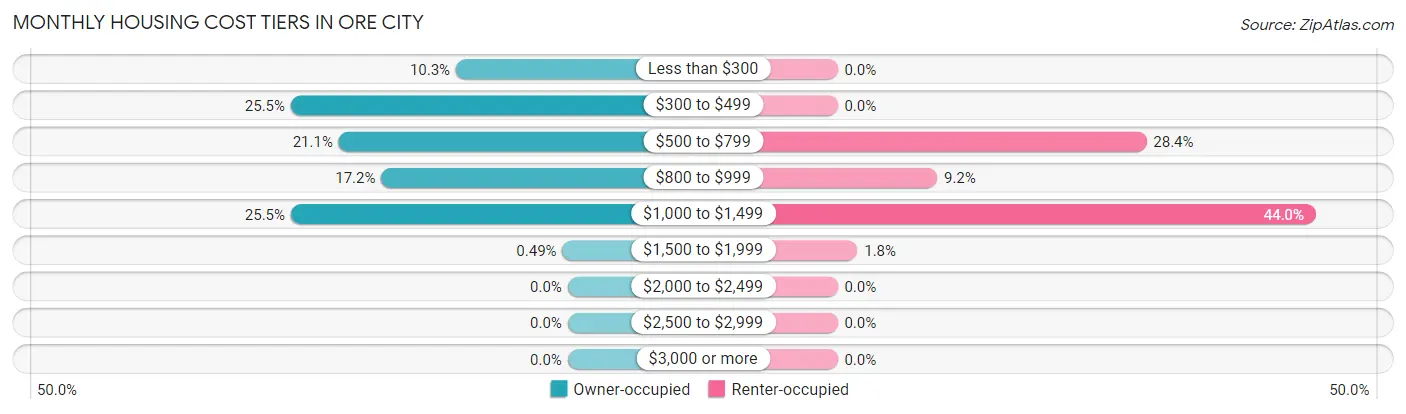
| Monthly Cost | Owner-occupied | Renter-occupied |
| Less than $300 | 21 (10.3%) | 0 (0.0%) |
| $300 to $499 | 52 (25.5%) | 0 (0.0%) |
| $500 to $799 | 43 (21.1%) | 31 (28.4%) |
| $800 to $999 | 35 (17.2%) | 10 (9.2%) |
| $1,000 to $1,499 | 52 (25.5%) | 48 (44.0%) |
| $1,500 to $1,999 | 1 (0.5%) | 2 (1.8%) |
| $2,000 to $2,499 | 0 (0.0%) | 0 (0.0%) |
| $2,500 to $2,999 | 0 (0.0%) | 0 (0.0%) |
| $3,000 or more | 0 (0.0%) | 0 (0.0%) |
| Total | 204 (100.0%) | 109 (100.0%) |
Physical Housing Characteristics in Ore City
Housing Structures in Ore City
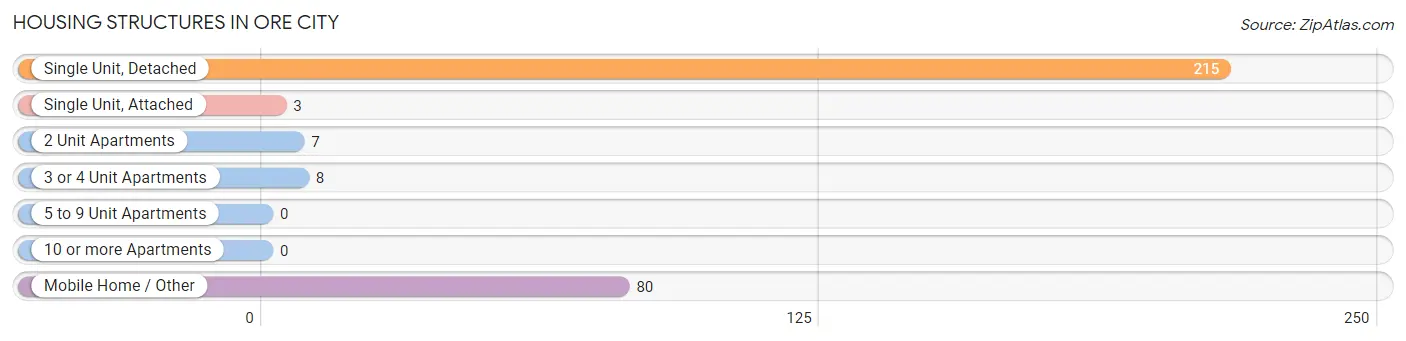
| Structure Type | # Housing Units | % Housing Units |
| Single Unit, Detached | 215 | 68.7% |
| Single Unit, Attached | 3 | 1.0% |
| 2 Unit Apartments | 7 | 2.2% |
| 3 or 4 Unit Apartments | 8 | 2.6% |
| 5 to 9 Unit Apartments | 0 | 0.0% |
| 10 or more Apartments | 0 | 0.0% |
| Mobile Home / Other | 80 | 25.6% |
| Total | 313 | 100.0% |
Housing Structures by Occupancy in Ore City
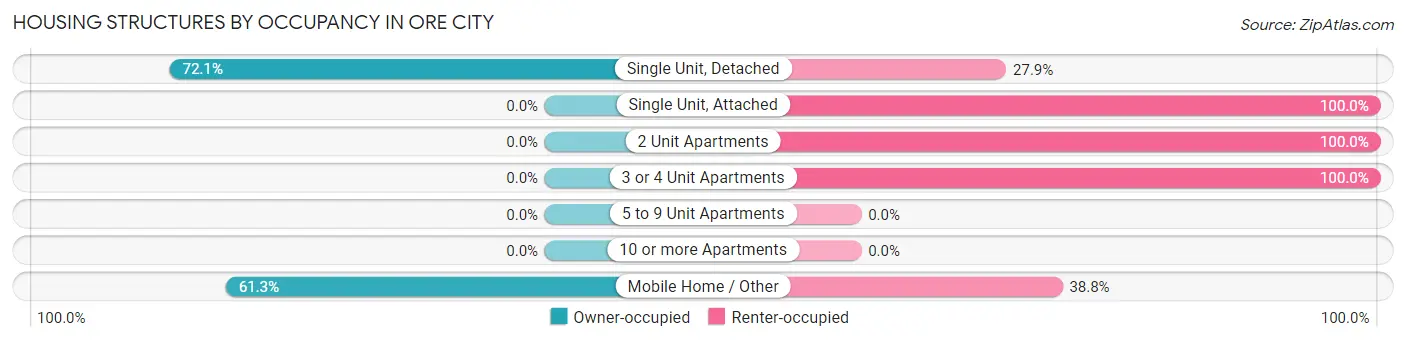
| Structure Type | Owner-occupied | Renter-occupied |
| Single Unit, Detached | 155 (72.1%) | 60 (27.9%) |
| Single Unit, Attached | 0 (0.0%) | 3 (100.0%) |
| 2 Unit Apartments | 0 (0.0%) | 7 (100.0%) |
| 3 or 4 Unit Apartments | 0 (0.0%) | 8 (100.0%) |
| 5 to 9 Unit Apartments | 0 (0.0%) | 0 (0.0%) |
| 10 or more Apartments | 0 (0.0%) | 0 (0.0%) |
| Mobile Home / Other | 49 (61.3%) | 31 (38.8%) |
| Total | 204 (65.2%) | 109 (34.8%) |
Housing Structures by Number of Rooms in Ore City
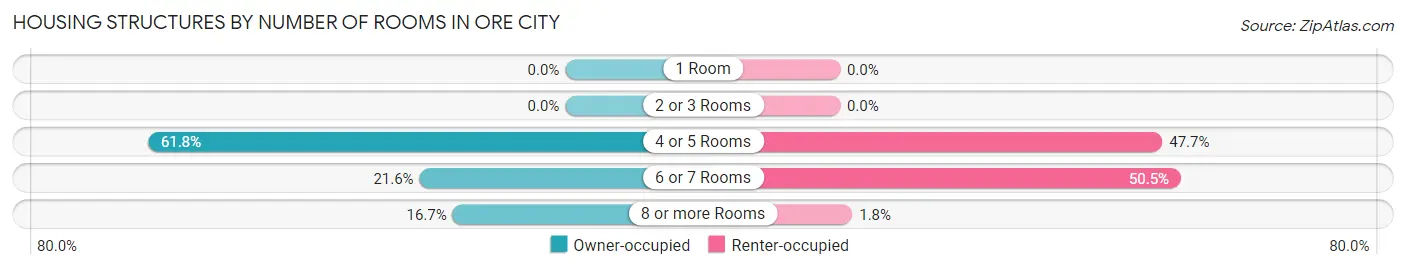
| Number of Rooms | Owner-occupied | Renter-occupied |
| 1 Room | 0 (0.0%) | 0 (0.0%) |
| 2 or 3 Rooms | 0 (0.0%) | 0 (0.0%) |
| 4 or 5 Rooms | 126 (61.8%) | 52 (47.7%) |
| 6 or 7 Rooms | 44 (21.6%) | 55 (50.5%) |
| 8 or more Rooms | 34 (16.7%) | 2 (1.8%) |
| Total | 204 (100.0%) | 109 (100.0%) |
Housing Structure by Heating Type in Ore City
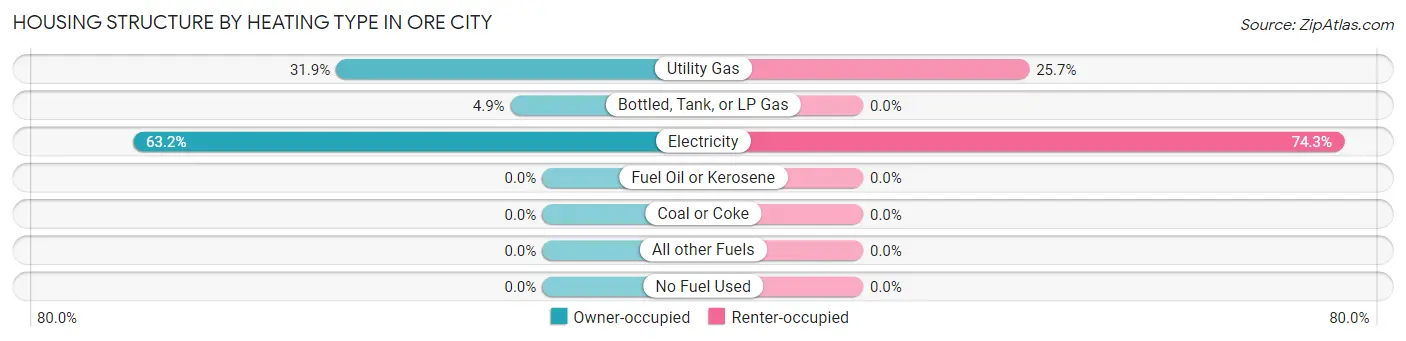
| Heating Type | Owner-occupied | Renter-occupied |
| Utility Gas | 65 (31.9%) | 28 (25.7%) |
| Bottled, Tank, or LP Gas | 10 (4.9%) | 0 (0.0%) |
| Electricity | 129 (63.2%) | 81 (74.3%) |
| Fuel Oil or Kerosene | 0 (0.0%) | 0 (0.0%) |
| Coal or Coke | 0 (0.0%) | 0 (0.0%) |
| All other Fuels | 0 (0.0%) | 0 (0.0%) |
| No Fuel Used | 0 (0.0%) | 0 (0.0%) |
| Total | 204 (100.0%) | 109 (100.0%) |
Household Vehicle Usage in Ore City
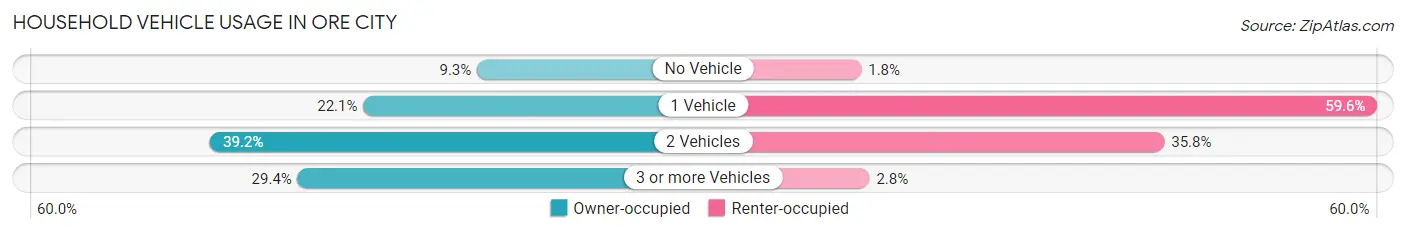
| Vehicles per Household | Owner-occupied | Renter-occupied |
| No Vehicle | 19 (9.3%) | 2 (1.8%) |
| 1 Vehicle | 45 (22.1%) | 65 (59.6%) |
| 2 Vehicles | 80 (39.2%) | 39 (35.8%) |
| 3 or more Vehicles | 60 (29.4%) | 3 (2.8%) |
| Total | 204 (100.0%) | 109 (100.0%) |
Real Estate & Mortgages in Ore City
Real Estate and Mortgage Overview in Ore City
| Characteristic | Without Mortgage | With Mortgage |
| Housing Units | 110 | 94 |
| Median Property Value | $88,000 | $88,500 |
| Median Household Income | $41,071 | $0 |
| Monthly Housing Costs | $449 | $0 |
| Real Estate Taxes | $1,120 | $7 |
Property Value by Mortgage Status in Ore City
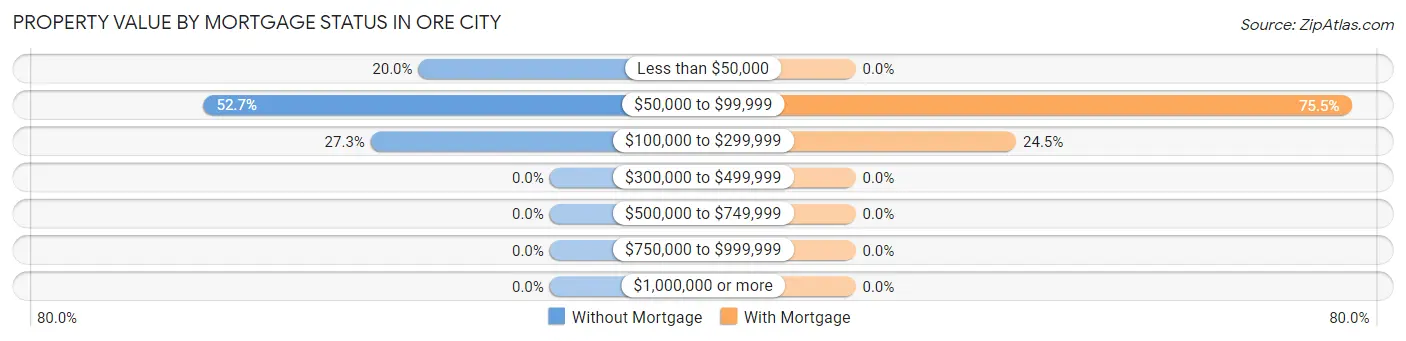
| Property Value | Without Mortgage | With Mortgage |
| Less than $50,000 | 22 (20.0%) | 0 (0.0%) |
| $50,000 to $99,999 | 58 (52.7%) | 71 (75.5%) |
| $100,000 to $299,999 | 30 (27.3%) | 23 (24.5%) |
| $300,000 to $499,999 | 0 (0.0%) | 0 (0.0%) |
| $500,000 to $749,999 | 0 (0.0%) | 0 (0.0%) |
| $750,000 to $999,999 | 0 (0.0%) | 0 (0.0%) |
| $1,000,000 or more | 0 (0.0%) | 0 (0.0%) |
| Total | 110 (100.0%) | 94 (100.0%) |
Household Income by Mortgage Status in Ore City
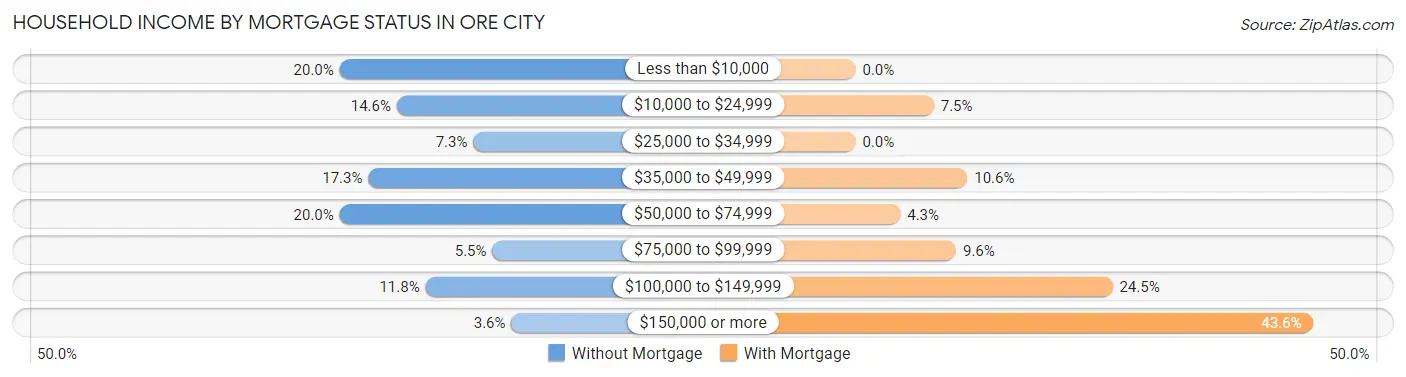
| Household Income | Without Mortgage | With Mortgage |
| Less than $10,000 | 22 (20.0%) | 0 (0.0%) |
| $10,000 to $24,999 | 16 (14.5%) | 7 (7.4%) |
| $25,000 to $34,999 | 8 (7.3%) | 0 (0.0%) |
| $35,000 to $49,999 | 19 (17.3%) | 10 (10.6%) |
| $50,000 to $74,999 | 22 (20.0%) | 4 (4.3%) |
| $75,000 to $99,999 | 6 (5.4%) | 9 (9.6%) |
| $100,000 to $149,999 | 13 (11.8%) | 23 (24.5%) |
| $150,000 or more | 4 (3.6%) | 41 (43.6%) |
| Total | 110 (100.0%) | 94 (100.0%) |
Property Value to Household Income Ratio in Ore City
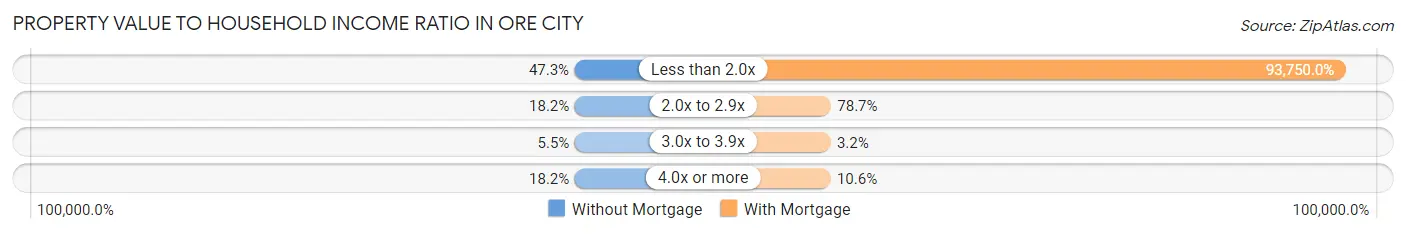
| Value-to-Income Ratio | Without Mortgage | With Mortgage |
| Less than 2.0x | 52 (47.3%) | 88,125 (93,750.0%) |
| 2.0x to 2.9x | 20 (18.2%) | 74 (78.7%) |
| 3.0x to 3.9x | 6 (5.4%) | 3 (3.2%) |
| 4.0x or more | 20 (18.2%) | 10 (10.6%) |
| Total | 110 (100.0%) | 94 (100.0%) |
Real Estate Taxes by Mortgage Status in Ore City
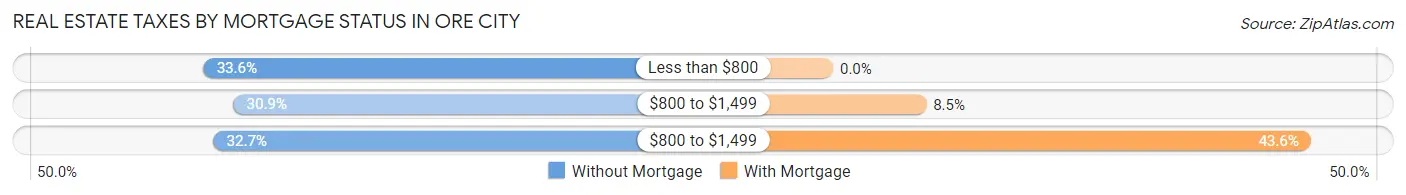
| Property Taxes | Without Mortgage | With Mortgage |
| Less than $800 | 37 (33.6%) | 0 (0.0%) |
| $800 to $1,499 | 34 (30.9%) | 8 (8.5%) |
| $800 to $1,499 | 36 (32.7%) | 41 (43.6%) |
| Total | 110 (100.0%) | 94 (100.0%) |
Health & Disability in Ore City
Health Insurance Coverage by Age in Ore City
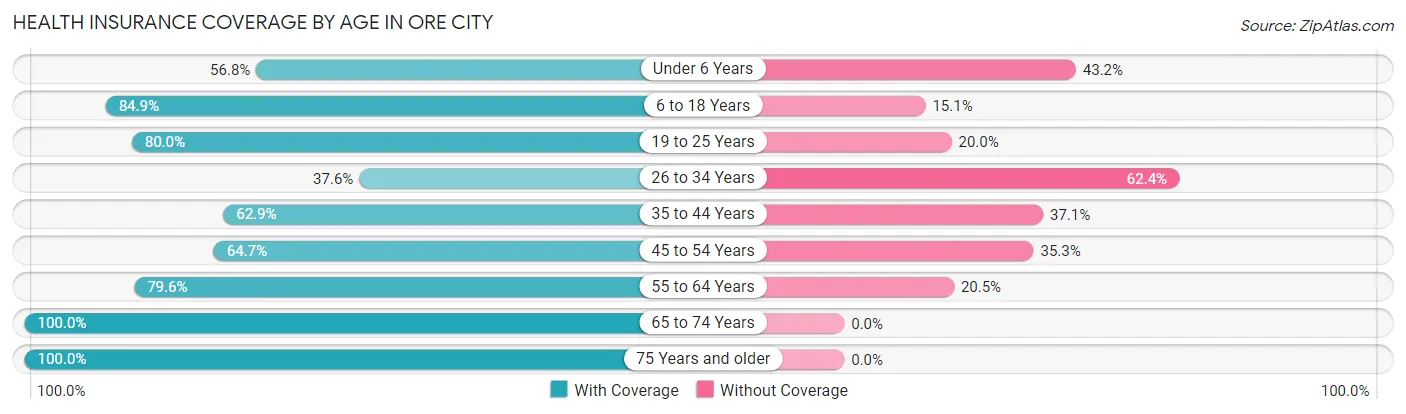
| Age Bracket | With Coverage | Without Coverage |
| Under 6 Years | 25 (56.8%) | 19 (43.2%) |
| 6 to 18 Years | 241 (84.9%) | 43 (15.1%) |
| 19 to 25 Years | 16 (80.0%) | 4 (20.0%) |
| 26 to 34 Years | 44 (37.6%) | 73 (62.4%) |
| 35 to 44 Years | 107 (62.9%) | 63 (37.1%) |
| 45 to 54 Years | 55 (64.7%) | 30 (35.3%) |
| 55 to 64 Years | 70 (79.5%) | 18 (20.4%) |
| 65 to 74 Years | 76 (100.0%) | 0 (0.0%) |
| 75 Years and older | 45 (100.0%) | 0 (0.0%) |
| Total | 679 (73.1%) | 250 (26.9%) |
Health Insurance Coverage by Citizenship Status in Ore City
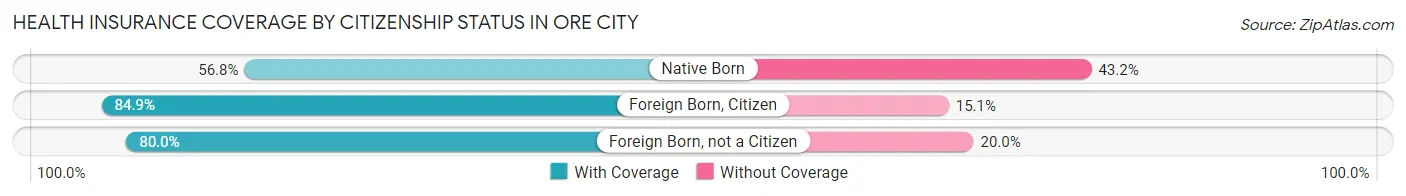
| Citizenship Status | With Coverage | Without Coverage |
| Native Born | 25 (56.8%) | 19 (43.2%) |
| Foreign Born, Citizen | 241 (84.9%) | 43 (15.1%) |
| Foreign Born, not a Citizen | 16 (80.0%) | 4 (20.0%) |
Health Insurance Coverage by Household Income in Ore City
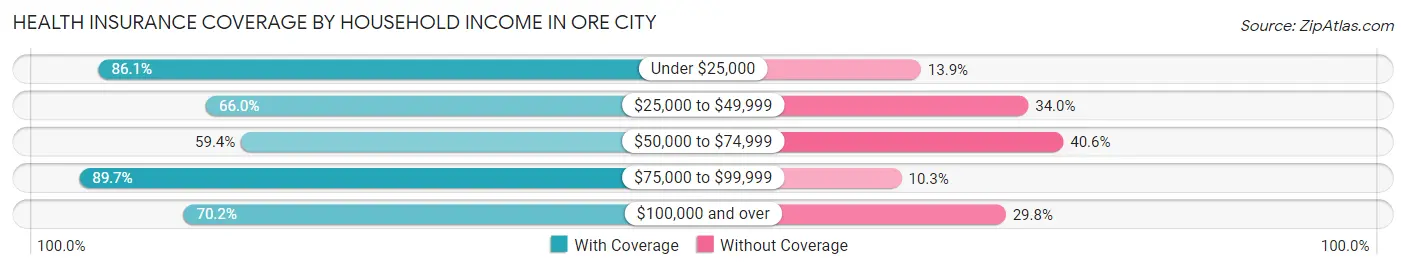
| Household Income | With Coverage | Without Coverage |
| Under $25,000 | 180 (86.1%) | 29 (13.9%) |
| $25,000 to $49,999 | 165 (66.0%) | 85 (34.0%) |
| $50,000 to $74,999 | 104 (59.4%) | 71 (40.6%) |
| $75,000 to $99,999 | 105 (89.7%) | 12 (10.3%) |
| $100,000 and over | 125 (70.2%) | 53 (29.8%) |
Public vs Private Health Insurance Coverage by Age in Ore City
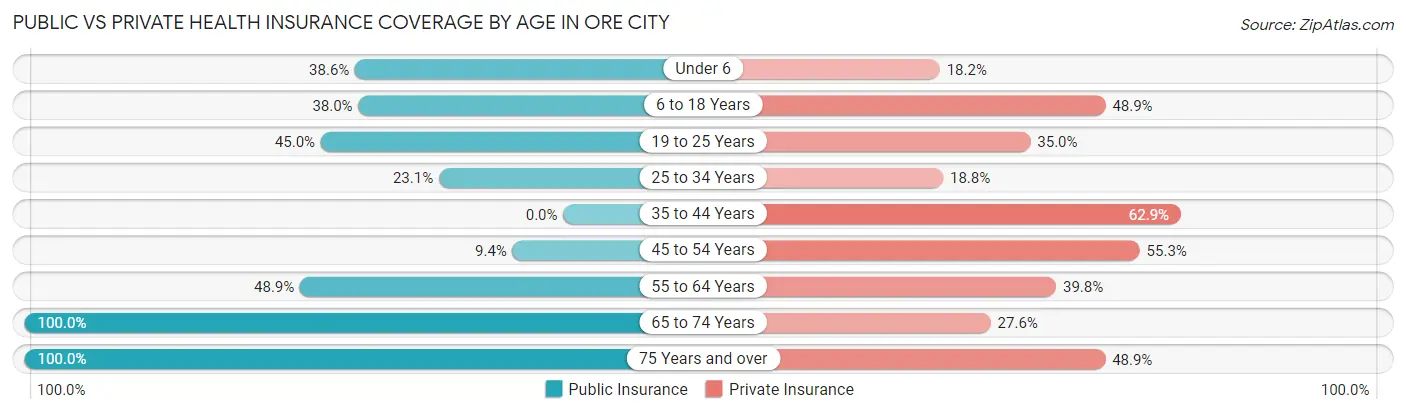
| Age Bracket | Public Insurance | Private Insurance |
| Under 6 | 17 (38.6%) | 8 (18.2%) |
| 6 to 18 Years | 108 (38.0%) | 139 (48.9%) |
| 19 to 25 Years | 9 (45.0%) | 7 (35.0%) |
| 25 to 34 Years | 27 (23.1%) | 22 (18.8%) |
| 35 to 44 Years | 0 (0.0%) | 107 (62.9%) |
| 45 to 54 Years | 8 (9.4%) | 47 (55.3%) |
| 55 to 64 Years | 43 (48.9%) | 35 (39.8%) |
| 65 to 74 Years | 76 (100.0%) | 21 (27.6%) |
| 75 Years and over | 45 (100.0%) | 22 (48.9%) |
| Total | 333 (35.8%) | 408 (43.9%) |
Disability Status by Sex by Age in Ore City
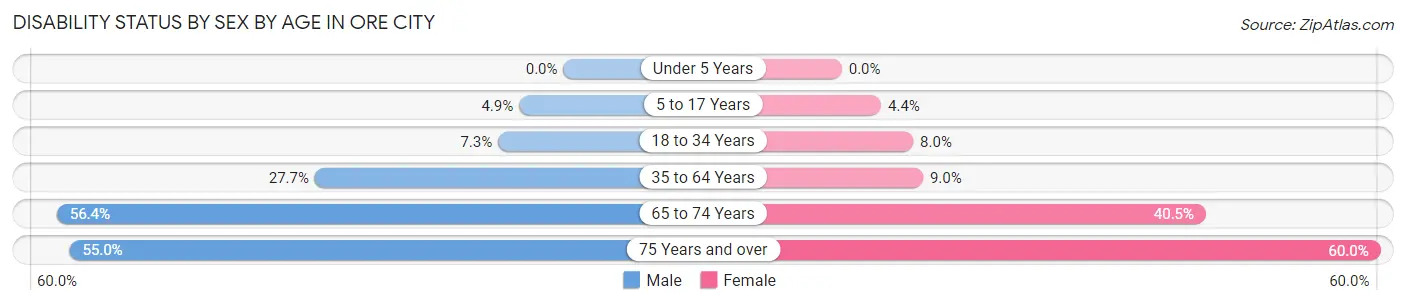
| Age Bracket | Male | Female |
| Under 5 Years | 0 (0.0%) | 0 (0.0%) |
| 5 to 17 Years | 7 (4.9%) | 6 (4.4%) |
| 18 to 34 Years | 4 (7.3%) | 7 (8.0%) |
| 35 to 64 Years | 49 (27.7%) | 15 (9.0%) |
| 65 to 74 Years | 22 (56.4%) | 15 (40.5%) |
| 75 Years and over | 11 (55.0%) | 15 (60.0%) |
Disability Class by Sex by Age in Ore City
Disability Class: Hearing Difficulty
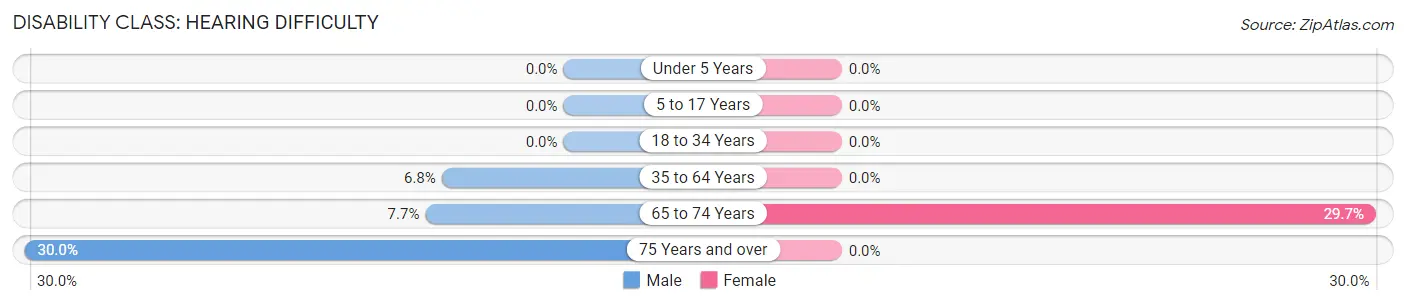
| Age Bracket | Male | Female |
| Under 5 Years | 0 (0.0%) | 0 (0.0%) |
| 5 to 17 Years | 0 (0.0%) | 0 (0.0%) |
| 18 to 34 Years | 0 (0.0%) | 0 (0.0%) |
| 35 to 64 Years | 12 (6.8%) | 0 (0.0%) |
| 65 to 74 Years | 3 (7.7%) | 11 (29.7%) |
| 75 Years and over | 6 (30.0%) | 0 (0.0%) |
Disability Class: Vision Difficulty
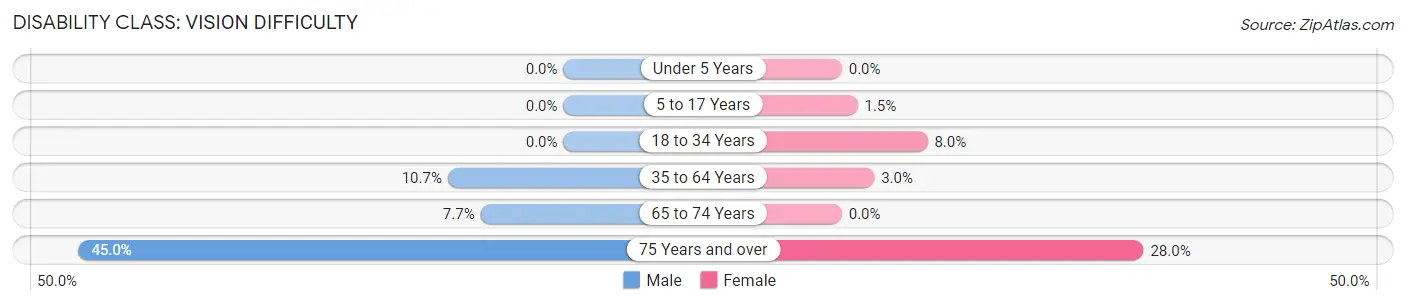
| Age Bracket | Male | Female |
| Under 5 Years | 0 (0.0%) | 0 (0.0%) |
| 5 to 17 Years | 0 (0.0%) | 2 (1.5%) |
| 18 to 34 Years | 0 (0.0%) | 7 (8.0%) |
| 35 to 64 Years | 19 (10.7%) | 5 (3.0%) |
| 65 to 74 Years | 3 (7.7%) | 0 (0.0%) |
| 75 Years and over | 9 (45.0%) | 7 (28.0%) |
Disability Class: Cognitive Difficulty
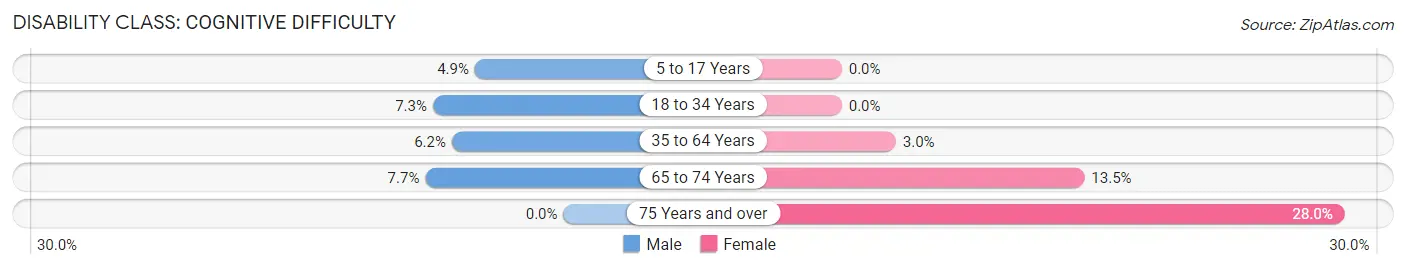
| Age Bracket | Male | Female |
| 5 to 17 Years | 7 (4.9%) | 0 (0.0%) |
| 18 to 34 Years | 4 (7.3%) | 0 (0.0%) |
| 35 to 64 Years | 11 (6.2%) | 5 (3.0%) |
| 65 to 74 Years | 3 (7.7%) | 5 (13.5%) |
| 75 Years and over | 0 (0.0%) | 7 (28.0%) |
Disability Class: Ambulatory Difficulty
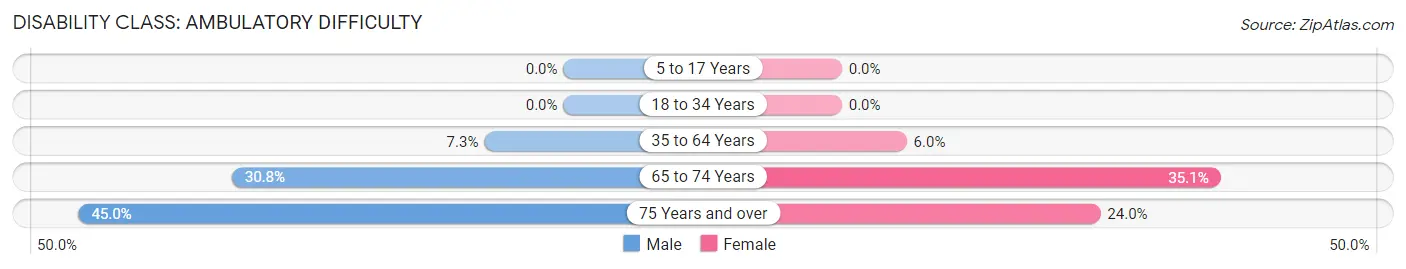
| Age Bracket | Male | Female |
| 5 to 17 Years | 0 (0.0%) | 0 (0.0%) |
| 18 to 34 Years | 0 (0.0%) | 0 (0.0%) |
| 35 to 64 Years | 13 (7.3%) | 10 (6.0%) |
| 65 to 74 Years | 12 (30.8%) | 13 (35.1%) |
| 75 Years and over | 9 (45.0%) | 6 (24.0%) |
Disability Class: Self-Care Difficulty
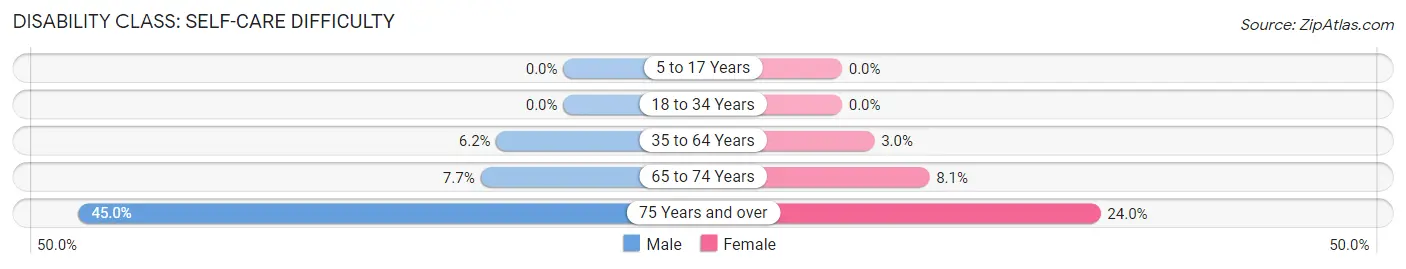
| Age Bracket | Male | Female |
| 5 to 17 Years | 0 (0.0%) | 0 (0.0%) |
| 18 to 34 Years | 0 (0.0%) | 0 (0.0%) |
| 35 to 64 Years | 11 (6.2%) | 5 (3.0%) |
| 65 to 74 Years | 3 (7.7%) | 3 (8.1%) |
| 75 Years and over | 9 (45.0%) | 6 (24.0%) |
Technology Access in Ore City
Computing Device Access in Ore City
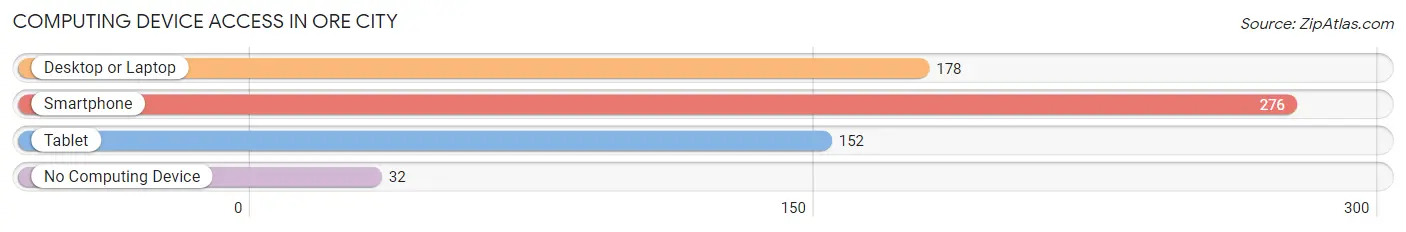
| Device Type | # Households | % Households |
| Desktop or Laptop | 178 | 56.9% |
| Smartphone | 276 | 88.2% |
| Tablet | 152 | 48.6% |
| No Computing Device | 32 | 10.2% |
| Total | 313 | 100.0% |
Internet Access in Ore City
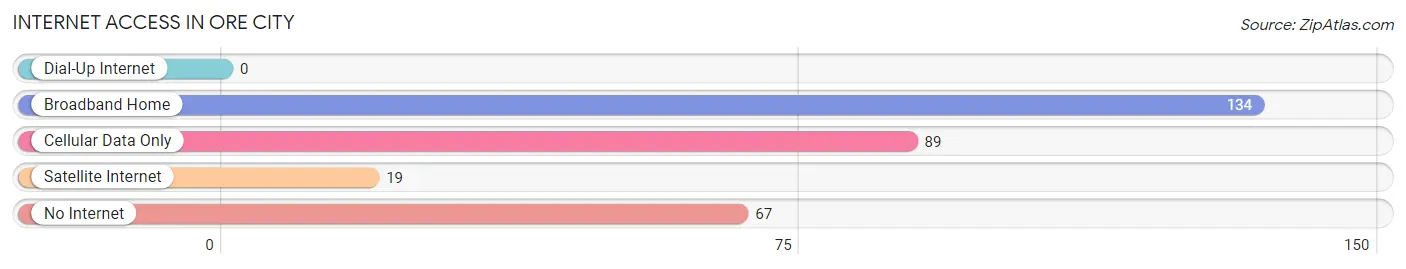
| Internet Type | # Households | % Households |
| Dial-Up Internet | 0 | 0.0% |
| Broadband Home | 134 | 42.8% |
| Cellular Data Only | 89 | 28.4% |
| Satellite Internet | 19 | 6.1% |
| No Internet | 67 | 21.4% |
| Total | 313 | 100.0% |
Ore City Summary
Geography
Oil City, Texas is located in the northeast corner of Morris County, Texas, approximately 100 miles east of Dallas and 100 miles northeast of Texarkana. The city is situated on the banks of the Sulphur River, which is a tributary of the Red River. Oil City is surrounded by the towns of Daingerfield, Lone Star, and Naples. The city is located in the Piney Woods region of East Texas, and is characterized by rolling hills, dense forests, and numerous lakes and rivers. The climate is humid subtropical, with hot summers and mild winters.
History
Oil City was founded in 1872 by the Texas and Pacific Railway Company. The town was named for the oil wells that were discovered in the area in the late 19th century. The oil industry quickly became the primary economic driver of the town, and Oil City soon became a major center for oil production in the region. The town was incorporated in 1891, and the population grew rapidly as the oil industry flourished.
In the early 20th century, Oil City was a bustling center of commerce and industry. The town was home to several oil refineries, as well as a number of other businesses, including a cotton gin, a lumber mill, and a brick factory. The town also had a number of churches, schools, and other civic organizations.
In the mid-20th century, the oil industry began to decline, and the town’s population began to decline as well. In the late 20th century, the town began to diversify its economy, and today Oil City is home to a variety of businesses, including a number of manufacturing companies.
Economy
Oil City’s economy is largely driven by the oil and gas industry. The town is home to several oil refineries, as well as a number of other businesses related to the oil and gas industry. The town is also home to a number of manufacturing companies, including a plastics manufacturer and a metal fabrication company.
The town is also home to a number of retail businesses, including a grocery store, a hardware store, and a number of restaurants. The town is also home to a number of service businesses, including a number of medical and dental offices, as well as a number of law firms.
Demographics
As of the 2010 census, Oil City had a population of 1,845. The population is predominantly white (90.2%), with a small African American population (4.2%) and a small Hispanic population (3.2%). The median household income is $37,917, and the median age is 38.7.
Conclusion
Oil City, Texas is a small town located in the northeast corner of Morris County, Texas. The town was founded in 1872 and was named for the oil wells that were discovered in the area. The town’s economy is largely driven by the oil and gas industry, and the town is also home to a number of manufacturing companies and retail businesses. The population of Oil City is predominantly white, with a small African American and Hispanic population.
Common Questions
What is Per Capita Income in Ore City?
Per Capita income in Ore City is $18,411.
What is the Median Family Income in Ore City?
Median Family Income in Ore City is $50,417.
What is the Median Household income in Ore City?
Median Household Income in Ore City is $41,339.
What is Income or Wage Gap in Ore City?
Income or Wage Gap in Ore City is 44.5%.
Women in Ore City earn 55.5 cents for every dollar earned by a man.
What is Inequality or Gini Index in Ore City?
Inequality or Gini Index in Ore City is 0.42.
What is the Total Population of Ore City?
Total Population of Ore City is 929.
What is the Total Male Population of Ore City?
Total Male Population of Ore City is 458.
What is the Total Female Population of Ore City?
Total Female Population of Ore City is 471.
What is the Ratio of Males per 100 Females in Ore City?
There are 97.24 Males per 100 Females in Ore City.
What is the Ratio of Females per 100 Males in Ore City?
There are 102.84 Females per 100 Males in Ore City.
What is the Median Population Age in Ore City?
Median Population Age in Ore City is 35.0 Years.
What is the Average Family Size in Ore City
Average Family Size in Ore City is 3.4 People.
What is the Average Household Size in Ore City
Average Household Size in Ore City is 3.0 People.
How Large is the Labor Force in Ore City?
There are 374 People in the Labor Forcein in Ore City.
What is the Percentage of People in the Labor Force in Ore City?
57.5% of People are in the Labor Force in Ore City.
What is the Unemployment Rate in Ore City?
Unemployment Rate in Ore City is 5.3%.