Orchard, TX Map & Demographics
Orchard Map
Orchard Overview
$21,058
PER CAPITA INCOME
$51,250
AVG FAMILY INCOME
$41,750
AVG HOUSEHOLD INCOME
36.1%
WAGE / INCOME GAP [ % ]
63.9¢/ $1
WAGE / INCOME GAP [ $ ]
0.31
INEQUALITY / GINI INDEX
248
TOTAL POPULATION
104
MALE POPULATION
144
FEMALE POPULATION
72.22
MALES / 100 FEMALES
138.46
FEMALES / 100 MALES
49.2
MEDIAN AGE
3.0
AVG FAMILY SIZE
2.4
AVG HOUSEHOLD SIZE
88
LABOR FORCE [ PEOPLE ]
43.6%
PERCENT IN LABOR FORCE
Orchard Zip Codes
Income in Orchard
Income Overview in Orchard
Per Capita Income in Orchard is $21,058, while median incomes of families and households are $51,250 and $41,750 respectively.
| Characteristic | Number | Measure |
| Per Capita Income | 248 | $21,058 |
| Median Family Income | 72 | $51,250 |
| Mean Family Income | 72 | $59,378 |
| Median Household Income | 103 | $41,750 |
| Mean Household Income | 103 | $52,959 |
| Income Deficit | 72 | $0 |
| Wage / Income Gap (%) | 248 | 36.13% |
| Wage / Income Gap ($) | 248 | 63.87¢ per $1 |
| Gini / Inequality Index | 248 | 0.31 |
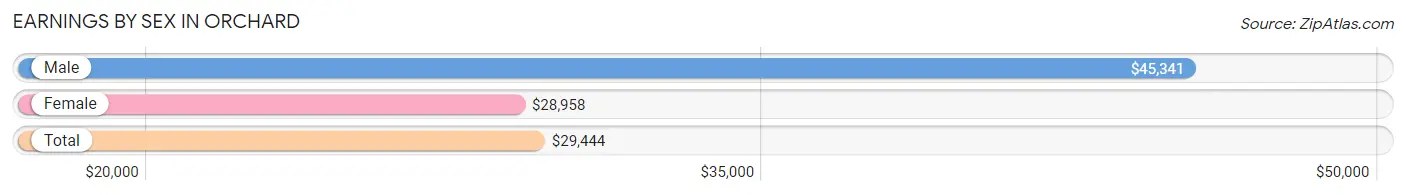
Earnings by Sex in Orchard
Average Earnings in Orchard are $29,444, $45,341 for men and $28,958 for women, a difference of 36.1%.
| Sex | Number | Average Earnings |
| Male | 47 (50.0%) | $45,341 |
| Female | 47 (50.0%) | $28,958 |
| Total | 94 (100.0%) | $29,444 |
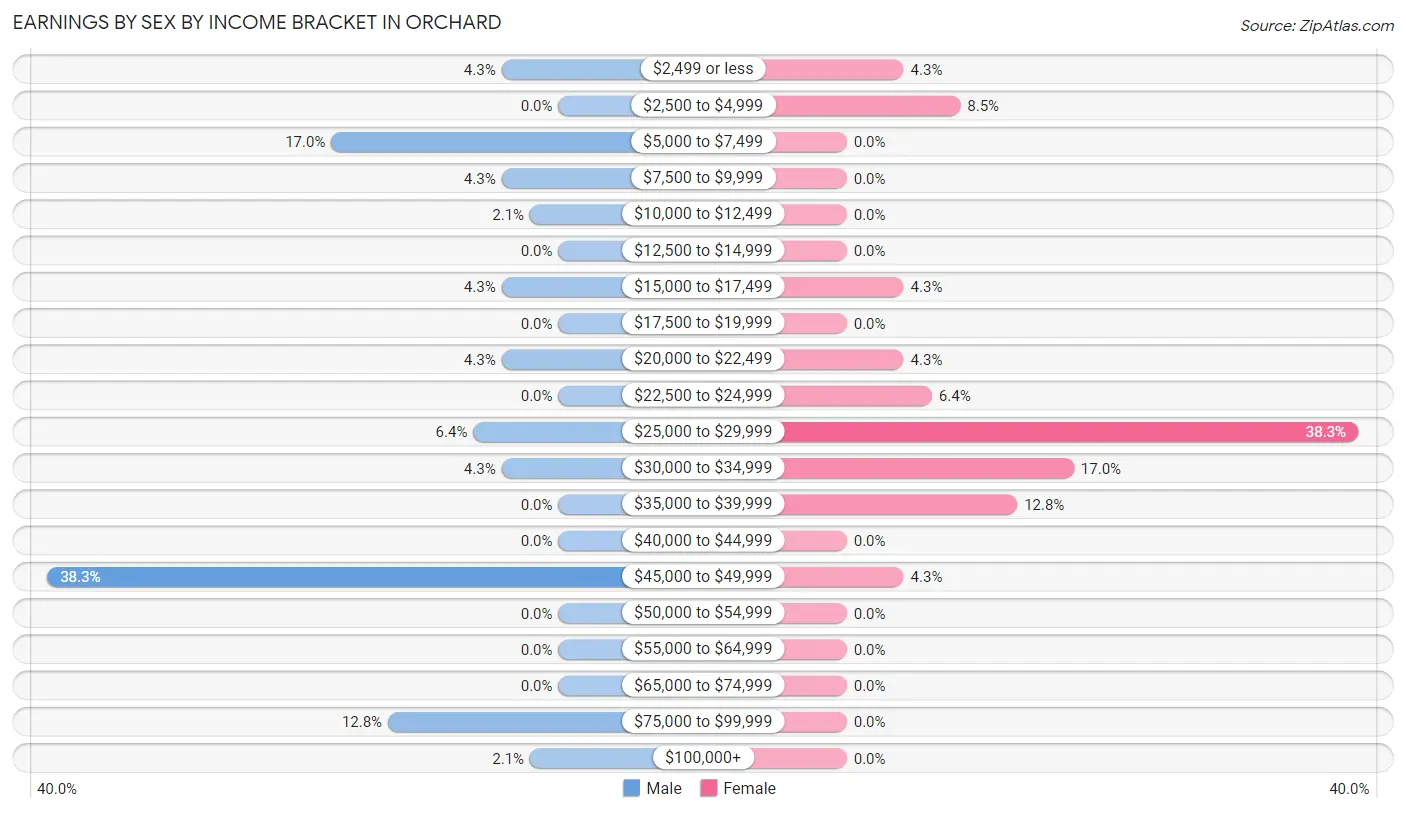
Earnings by Sex by Income Bracket in Orchard
The most common earnings brackets in Orchard are $45,000 to $49,999 for men (18 | 38.3%) and $25,000 to $29,999 for women (18 | 38.3%).
| Income | Male | Female |
| $2,499 or less | 2 (4.3%) | 2 (4.3%) |
| $2,500 to $4,999 | 0 (0.0%) | 4 (8.5%) |
| $5,000 to $7,499 | 8 (17.0%) | 0 (0.0%) |
| $7,500 to $9,999 | 2 (4.3%) | 0 (0.0%) |
| $10,000 to $12,499 | 1 (2.1%) | 0 (0.0%) |
| $12,500 to $14,999 | 0 (0.0%) | 0 (0.0%) |
| $15,000 to $17,499 | 2 (4.3%) | 2 (4.3%) |
| $17,500 to $19,999 | 0 (0.0%) | 0 (0.0%) |
| $20,000 to $22,499 | 2 (4.3%) | 2 (4.3%) |
| $22,500 to $24,999 | 0 (0.0%) | 3 (6.4%) |
| $25,000 to $29,999 | 3 (6.4%) | 18 (38.3%) |
| $30,000 to $34,999 | 2 (4.3%) | 8 (17.0%) |
| $35,000 to $39,999 | 0 (0.0%) | 6 (12.8%) |
| $40,000 to $44,999 | 0 (0.0%) | 0 (0.0%) |
| $45,000 to $49,999 | 18 (38.3%) | 2 (4.3%) |
| $50,000 to $54,999 | 0 (0.0%) | 0 (0.0%) |
| $55,000 to $64,999 | 0 (0.0%) | 0 (0.0%) |
| $65,000 to $74,999 | 0 (0.0%) | 0 (0.0%) |
| $75,000 to $99,999 | 6 (12.8%) | 0 (0.0%) |
| $100,000+ | 1 (2.1%) | 0 (0.0%) |
| Total | 47 (100.0%) | 47 (100.0%) |
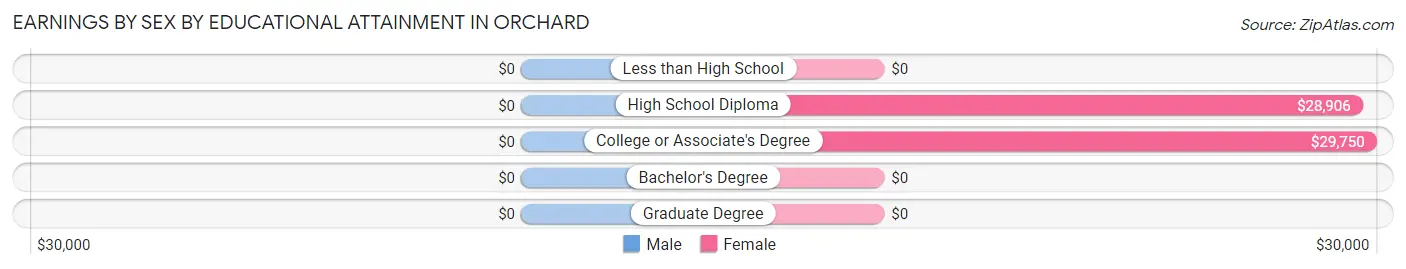
Earnings by Sex by Educational Attainment in Orchard
| Educational Attainment | Male Income | Female Income |
| Less than High School | - | - |
| High School Diploma | - | - |
| College or Associate's Degree | - | - |
| Bachelor's Degree | - | - |
| Graduate Degree | - | - |
| Total | $45,682 | $29,375 |
Family Income in Orchard
Family Income Brackets in Orchard
According to the Orchard family income data, there are 21 families falling into the $35,000 to $49,999 income range, which is the most common income bracket and makes up 29.2% of all families.
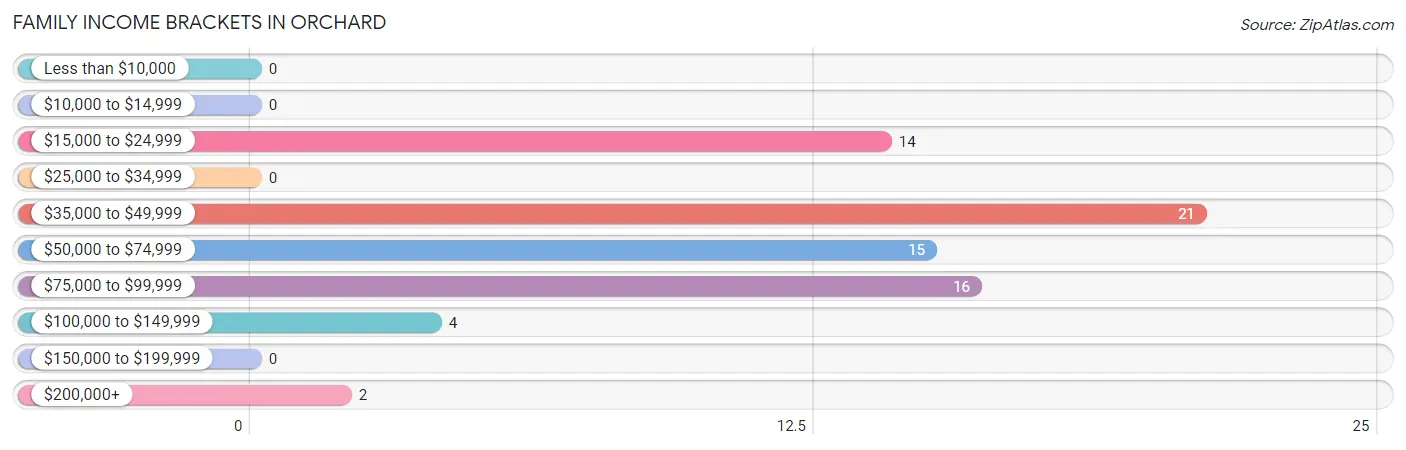
| Income Bracket | # Families | % Families |
| Less than $10,000 | 0 | 0.0% |
| $10,000 to $14,999 | 0 | 0.0% |
| $15,000 to $24,999 | 14 | 19.4% |
| $25,000 to $34,999 | 0 | 0.0% |
| $35,000 to $49,999 | 21 | 29.2% |
| $50,000 to $74,999 | 15 | 20.8% |
| $75,000 to $99,999 | 16 | 22.2% |
| $100,000 to $149,999 | 4 | 5.6% |
| $150,000 to $199,999 | 0 | 0.0% |
| $200,000+ | 2 | 2.8% |
Family Income by Famaliy Size in Orchard
2-person families (34 | 47.2%) account for the highest median family income in Orchard with $80,417 per family, while 2-person families (34 | 47.2%) have the highest median income of $40,208 per family member.
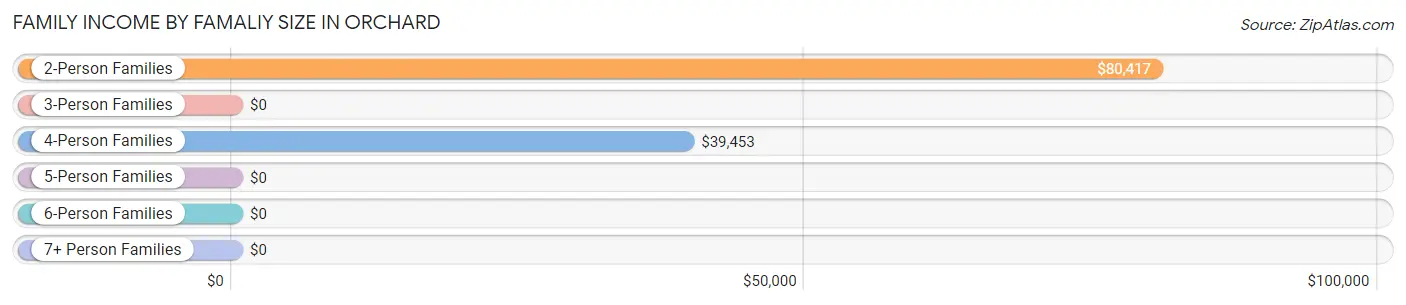
| Income Bracket | # Families | Median Income |
| 2-Person Families | 34 (47.2%) | $80,417 |
| 3-Person Families | 9 (12.5%) | $0 |
| 4-Person Families | 25 (34.7%) | $39,453 |
| 5-Person Families | 4 (5.6%) | $0 |
| 6-Person Families | 0 (0.0%) | $0 |
| 7+ Person Families | 0 (0.0%) | $0 |
| Total | 72 (100.0%) | $51,250 |
Family Income by Number of Earners in Orchard
The median family income in Orchard is $51,250, with families comprising 2 earners (14) having the highest median family income of $84,063, while families with no earners (22) have the lowest median family income of $38,929, accounting for 19.4% and 30.6% of families, respectively.
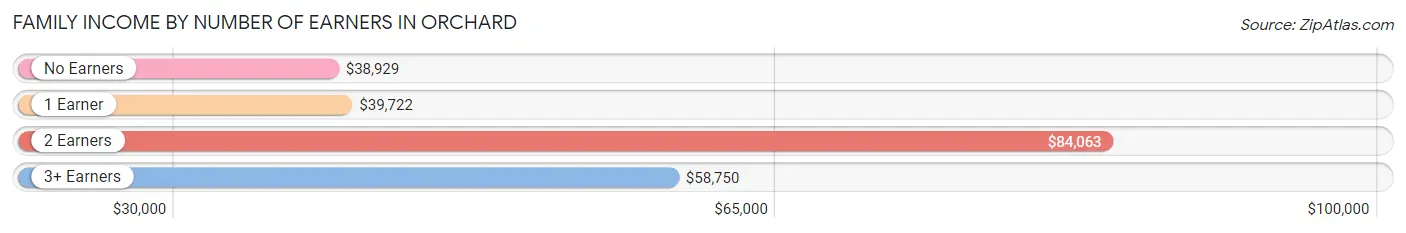
| Number of Earners | # Families | Median Income |
| No Earners | 22 (30.6%) | $38,929 |
| 1 Earner | 30 (41.7%) | $39,722 |
| 2 Earners | 14 (19.4%) | $84,063 |
| 3+ Earners | 6 (8.3%) | $58,750 |
| Total | 72 (100.0%) | $51,250 |
Household Income in Orchard
Household Income Brackets in Orchard
With 28 households falling in the category, the $35,000 to $49,999 income range is the most frequent in Orchard, accounting for 27.2% of all households.
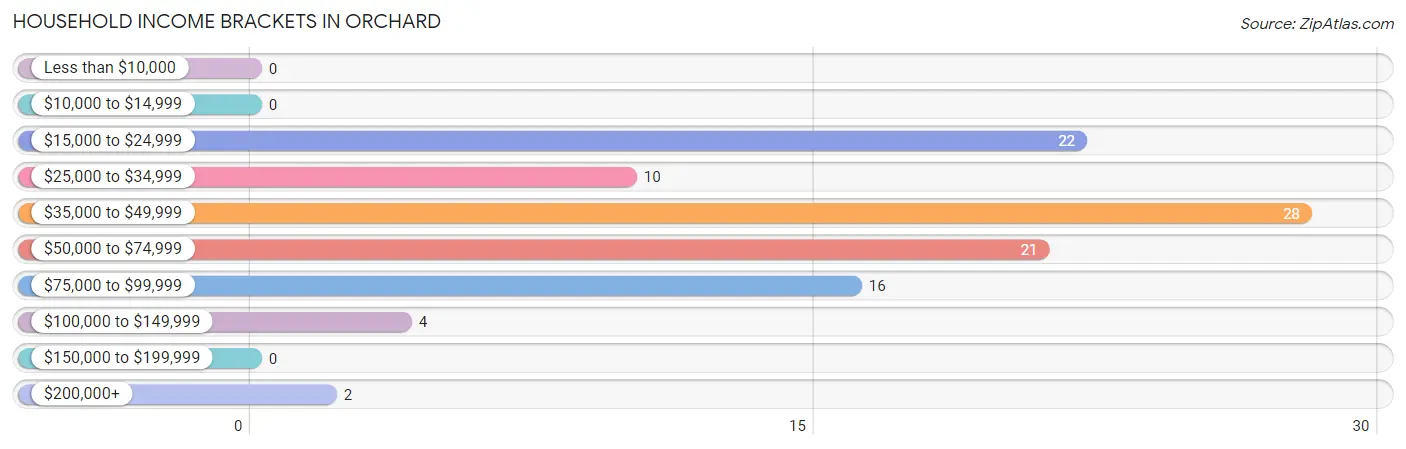
| Income Bracket | # Households | % Households |
| Less than $10,000 | 0 | 0.0% |
| $10,000 to $14,999 | 0 | 0.0% |
| $15,000 to $24,999 | 22 | 21.4% |
| $25,000 to $34,999 | 10 | 9.7% |
| $35,000 to $49,999 | 28 | 27.2% |
| $50,000 to $74,999 | 21 | 20.4% |
| $75,000 to $99,999 | 16 | 15.5% |
| $100,000 to $149,999 | 4 | 3.9% |
| $150,000 to $199,999 | 0 | 0.0% |
| $200,000+ | 2 | 1.9% |
Household Income by Householder Age in Orchard
The median household income in Orchard is $41,750, with the highest median household income of $81,042 found in the 45 to 64 years age bracket for the primary householder. A total of 31 households (30.1%) fall into this category.
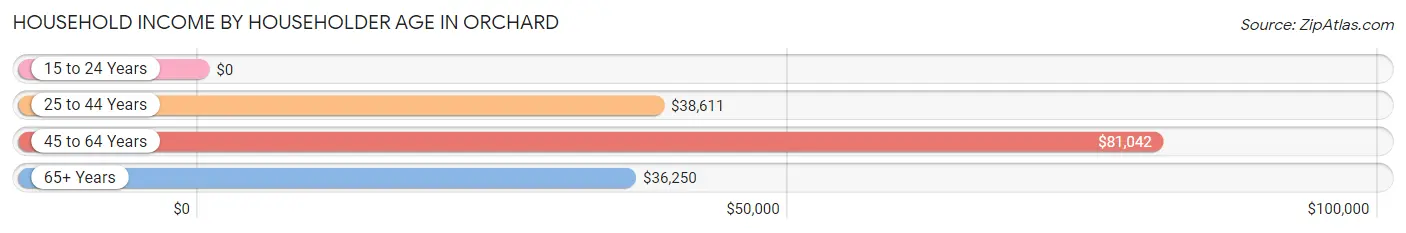
| Income Bracket | # Households | Median Income |
| 15 to 24 Years | 0 (0.0%) | $0 |
| 25 to 44 Years | 24 (23.3%) | $38,611 |
| 45 to 64 Years | 31 (30.1%) | $81,042 |
| 65+ Years | 48 (46.6%) | $36,250 |
| Total | 103 (100.0%) | $41,750 |
Poverty in Orchard
Income Below Poverty by Sex and Age in Orchard
With 7.7% poverty level for males and 9.7% for females among the residents of Orchard, 45 to 54 year old males and 75 year old and over females are the most vulnerable to poverty, with 8 males (25.0%) and 7 females (63.6%) in their respective age groups living below the poverty level.
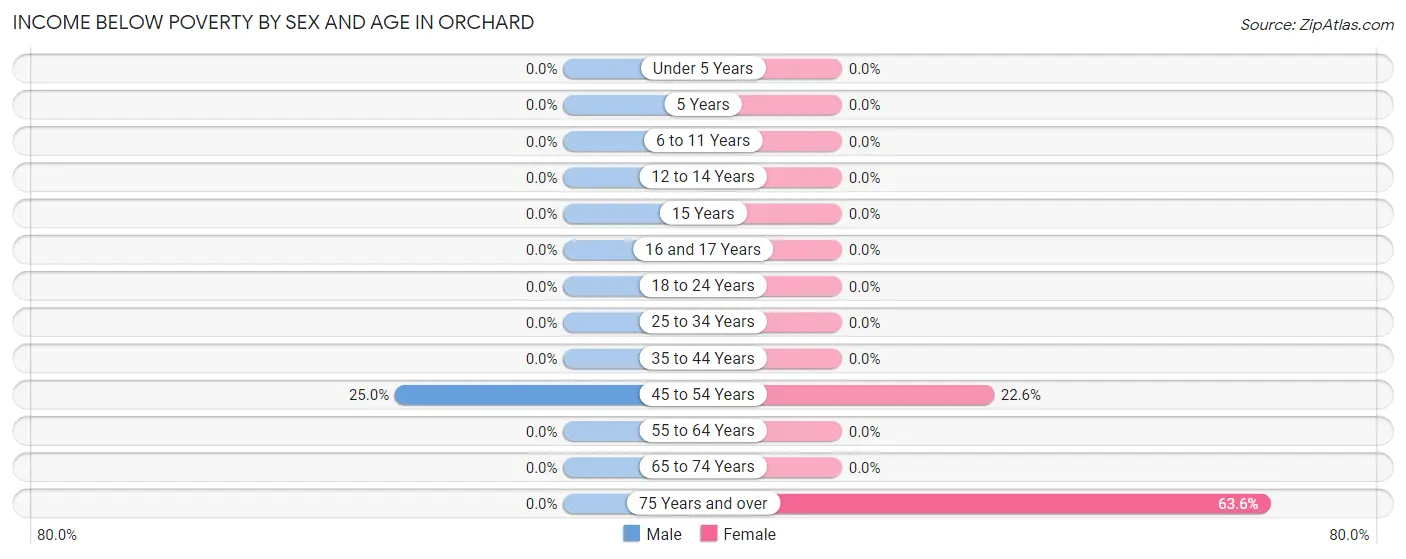
| Age Bracket | Male | Female |
| Under 5 Years | 0 (0.0%) | 0 (0.0%) |
| 5 Years | 0 (0.0%) | 0 (0.0%) |
| 6 to 11 Years | 0 (0.0%) | 0 (0.0%) |
| 12 to 14 Years | 0 (0.0%) | 0 (0.0%) |
| 15 Years | 0 (0.0%) | 0 (0.0%) |
| 16 and 17 Years | 0 (0.0%) | 0 (0.0%) |
| 18 to 24 Years | 0 (0.0%) | 0 (0.0%) |
| 25 to 34 Years | 0 (0.0%) | 0 (0.0%) |
| 35 to 44 Years | 0 (0.0%) | 0 (0.0%) |
| 45 to 54 Years | 8 (25.0%) | 7 (22.6%) |
| 55 to 64 Years | 0 (0.0%) | 0 (0.0%) |
| 65 to 74 Years | 0 (0.0%) | 0 (0.0%) |
| 75 Years and over | 0 (0.0%) | 7 (63.6%) |
| Total | 8 (7.7%) | 14 (9.7%) |
Income Above Poverty by Sex and Age in Orchard
According to the poverty statistics in Orchard, males aged under 5 years and females aged under 5 years are the age groups that are most secure financially, with 100.0% of males and 100.0% of females in these age groups living above the poverty line.
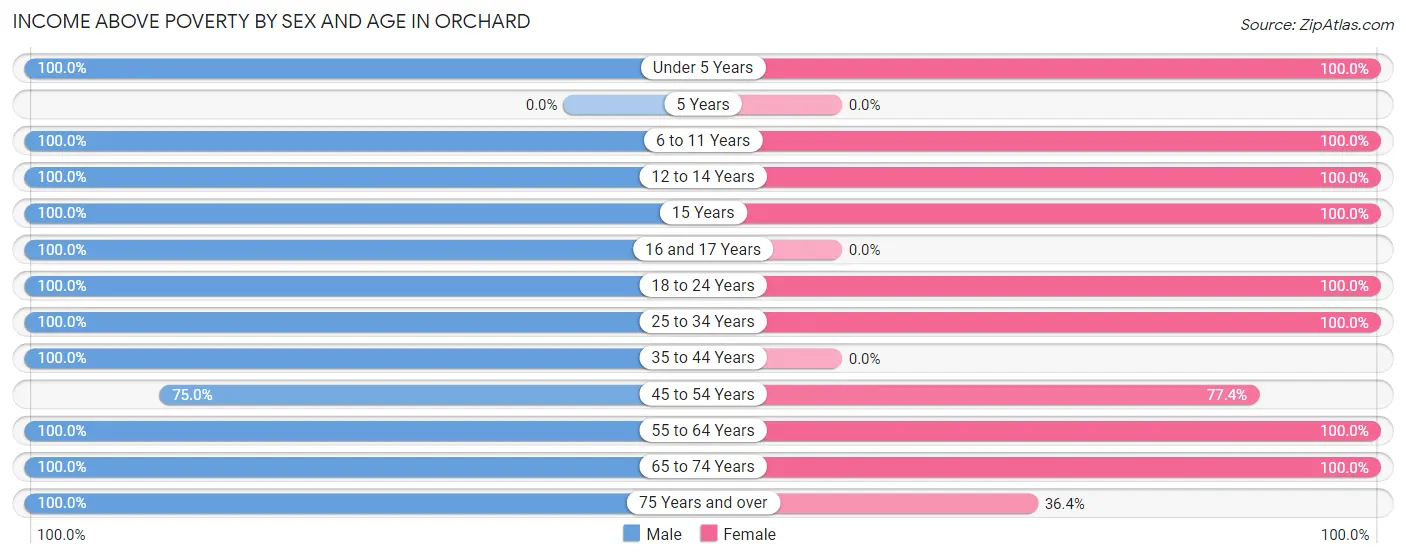
| Age Bracket | Male | Female |
| Under 5 Years | 2 (100.0%) | 7 (100.0%) |
| 5 Years | 0 (0.0%) | 0 (0.0%) |
| 6 to 11 Years | 9 (100.0%) | 8 (100.0%) |
| 12 to 14 Years | 1 (100.0%) | 7 (100.0%) |
| 15 Years | 6 (100.0%) | 6 (100.0%) |
| 16 and 17 Years | 2 (100.0%) | 0 (0.0%) |
| 18 to 24 Years | 6 (100.0%) | 6 (100.0%) |
| 25 to 34 Years | 2 (100.0%) | 17 (100.0%) |
| 35 to 44 Years | 9 (100.0%) | 0 (0.0%) |
| 45 to 54 Years | 24 (75.0%) | 24 (77.4%) |
| 55 to 64 Years | 8 (100.0%) | 8 (100.0%) |
| 65 to 74 Years | 16 (100.0%) | 43 (100.0%) |
| 75 Years and over | 11 (100.0%) | 4 (36.4%) |
| Total | 96 (92.3%) | 130 (90.3%) |
Income Below Poverty Among Married-Couple Families in Orchard
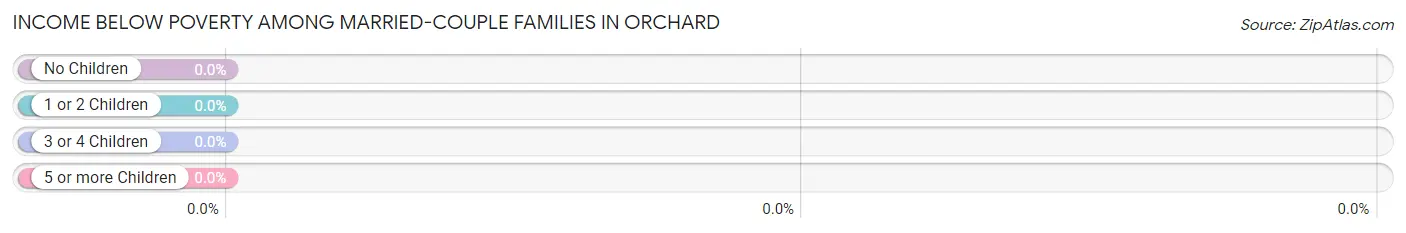
| Children | Above Poverty | Below Poverty |
| No Children | 22 (100.0%) | 0 (0.0%) |
| 1 or 2 Children | 4 (100.0%) | 0 (0.0%) |
| 3 or 4 Children | 2 (100.0%) | 0 (0.0%) |
| 5 or more Children | 0 (0.0%) | 0 (0.0%) |
| Total | 28 (100.0%) | 0 (0.0%) |
Income Below Poverty Among Single-Parent Households in Orchard
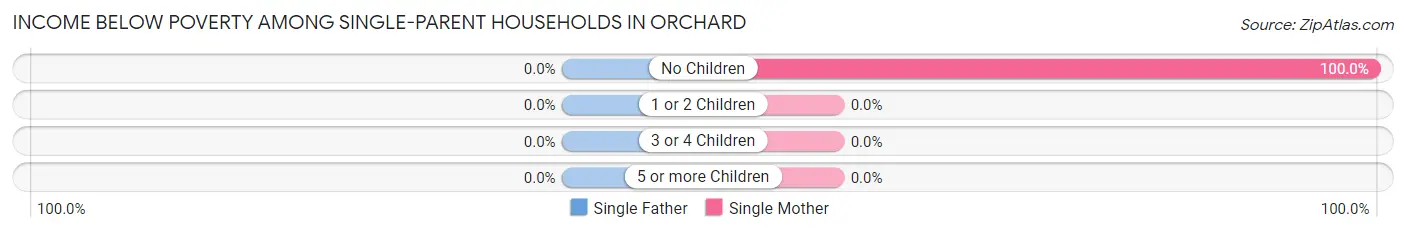
| Children | Single Father | Single Mother |
| No Children | 0 (0.0%) | 7 (100.0%) |
| 1 or 2 Children | 0 (0.0%) | 0 (0.0%) |
| 3 or 4 Children | 0 (0.0%) | 0 (0.0%) |
| 5 or more Children | 0 (0.0%) | 0 (0.0%) |
| Total | 0 (0.0%) | 7 (33.3%) |
Income Below Poverty Among Married-Couple vs Single-Parent Households in Orchard
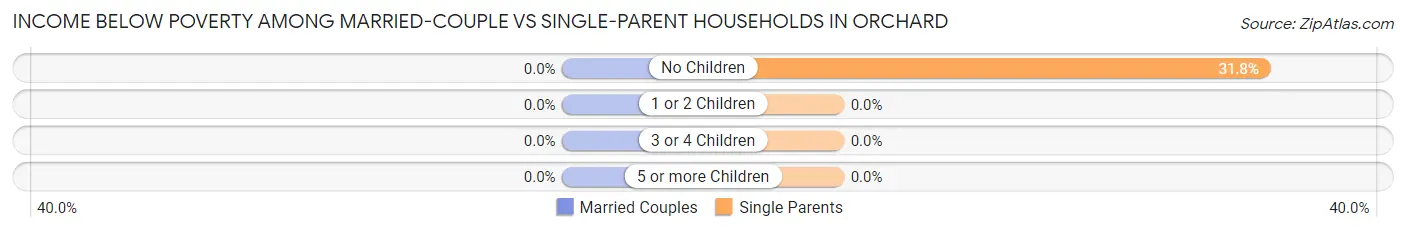
| Children | Married-Couple Families | Single-Parent Households |
| No Children | 0 (0.0%) | 7 (31.8%) |
| 1 or 2 Children | 0 (0.0%) | 0 (0.0%) |
| 3 or 4 Children | 0 (0.0%) | 0 (0.0%) |
| 5 or more Children | 0 (0.0%) | 0 (0.0%) |
| Total | 0 (0.0%) | 7 (15.9%) |
Race in Orchard
The most populous races in Orchard are Hispanic or Latino (165 | 66.5%), White / Caucasian (159 | 64.1%), and Two or more Races (64 | 25.8%).
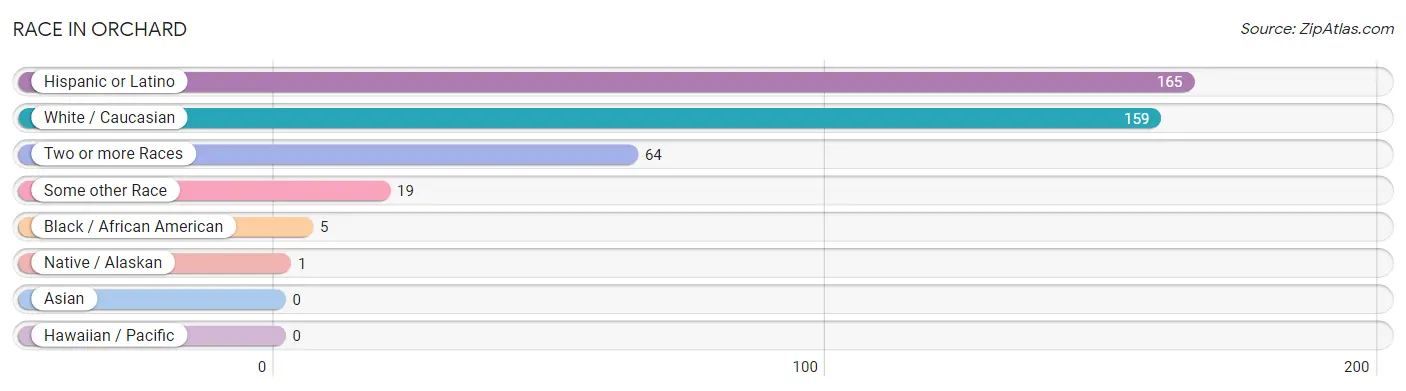
| Race | # Population | % Population |
| Asian | 0 | 0.0% |
| Black / African American | 5 | 2.0% |
| Hawaiian / Pacific | 0 | 0.0% |
| Hispanic or Latino | 165 | 66.5% |
| Native / Alaskan | 1 | 0.4% |
| White / Caucasian | 159 | 64.1% |
| Two or more Races | 64 | 25.8% |
| Some other Race | 19 | 7.7% |
| Total | 248 | 100.0% |
Ancestry in Orchard
The most populous ancestries reported in Orchard are Mexican (149 | 60.1%), American (35 | 14.1%), German (16 | 6.5%), Irish (12 | 4.8%), and English (9 | 3.6%), together accounting for 89.1% of all Orchard residents.
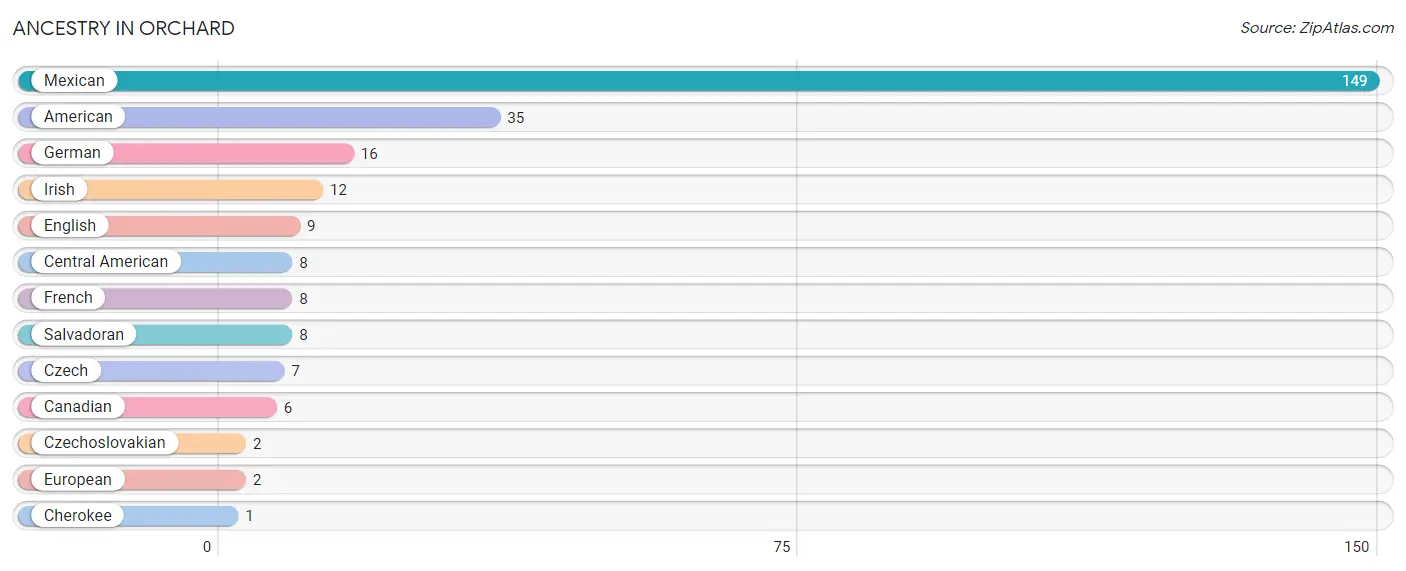
| Ancestry | # Population | % Population |
| American | 35 | 14.1% |
| Canadian | 6 | 2.4% |
| Central American | 8 | 3.2% |
| Cherokee | 1 | 0.4% |
| Czech | 7 | 2.8% |
| Czechoslovakian | 2 | 0.8% |
| English | 9 | 3.6% |
| European | 2 | 0.8% |
| French | 8 | 3.2% |
| German | 16 | 6.5% |
| Irish | 12 | 4.8% |
| Mexican | 149 | 60.1% |
| Salvadoran | 8 | 3.2% | View All 13 Rows |
Immigrants in Orchard
The most numerous immigrant groups reported in Orchard came from Central America (17 | 6.9%), Latin America (17 | 6.9%), Mexico (12 | 4.8%), and El Salvador (5 | 2.0%), together accounting for 20.6% of all Orchard residents.
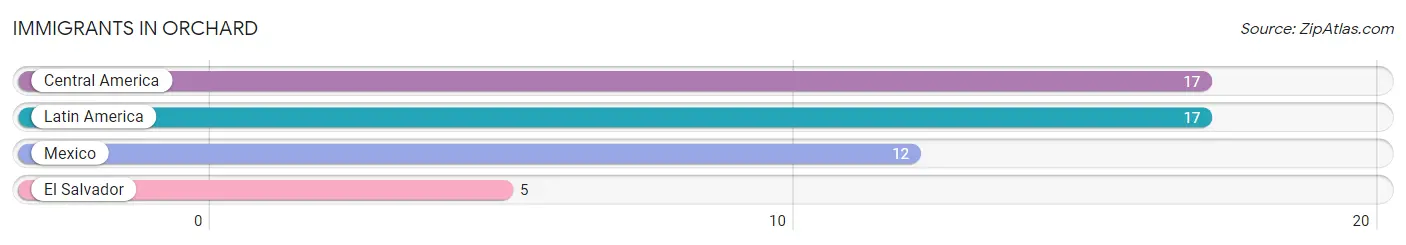
| Immigration Origin | # Population | % Population |
| Central America | 17 | 6.9% |
| El Salvador | 5 | 2.0% |
| Latin America | 17 | 6.9% |
| Mexico | 12 | 4.8% | View All 4 Rows |
Sex and Age in Orchard
Sex and Age in Orchard
The most populous age groups in Orchard are 45 to 49 Years (21 | 20.2%) for men and 65 to 69 Years (22 | 15.3%) for women.
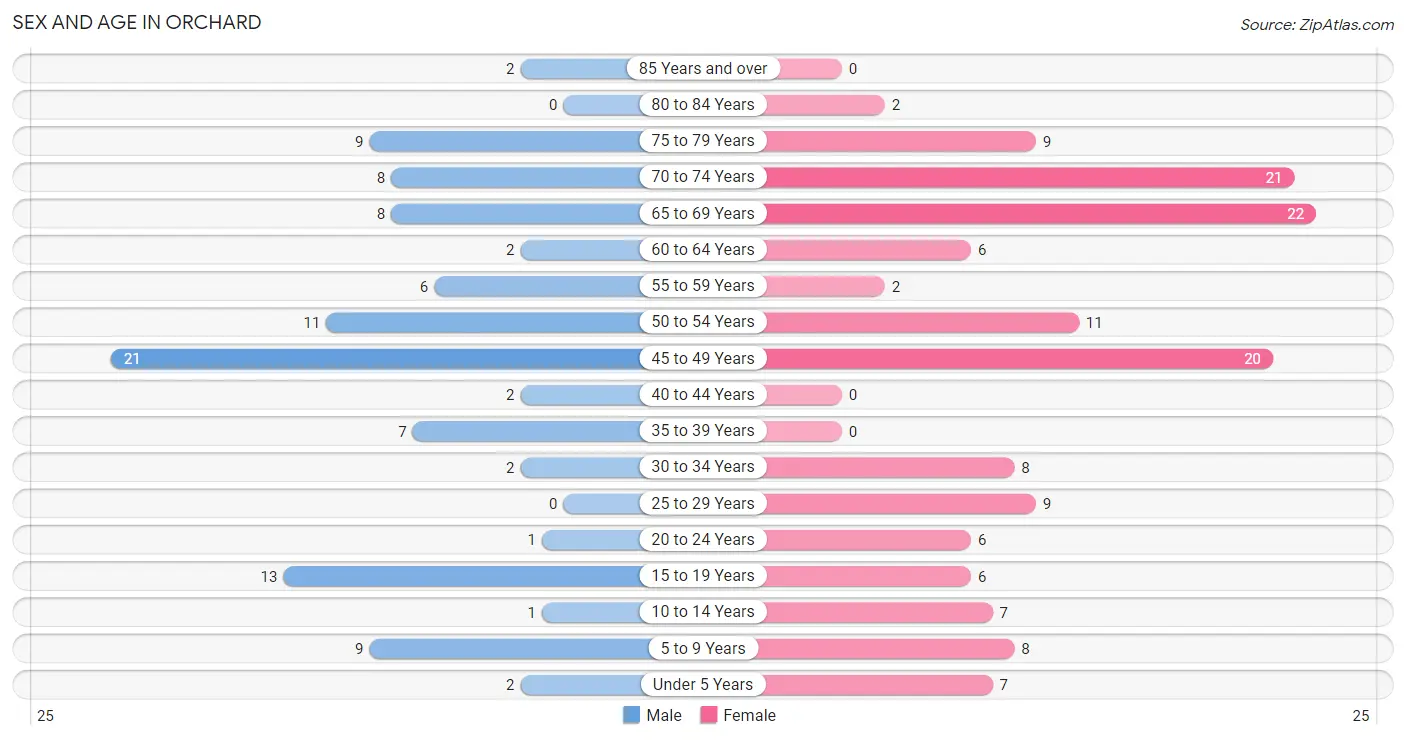
| Age Bracket | Male | Female |
| Under 5 Years | 2 (1.9%) | 7 (4.9%) |
| 5 to 9 Years | 9 (8.6%) | 8 (5.6%) |
| 10 to 14 Years | 1 (1.0%) | 7 (4.9%) |
| 15 to 19 Years | 13 (12.5%) | 6 (4.2%) |
| 20 to 24 Years | 1 (1.0%) | 6 (4.2%) |
| 25 to 29 Years | 0 (0.0%) | 9 (6.2%) |
| 30 to 34 Years | 2 (1.9%) | 8 (5.6%) |
| 35 to 39 Years | 7 (6.7%) | 0 (0.0%) |
| 40 to 44 Years | 2 (1.9%) | 0 (0.0%) |
| 45 to 49 Years | 21 (20.2%) | 20 (13.9%) |
| 50 to 54 Years | 11 (10.6%) | 11 (7.6%) |
| 55 to 59 Years | 6 (5.8%) | 2 (1.4%) |
| 60 to 64 Years | 2 (1.9%) | 6 (4.2%) |
| 65 to 69 Years | 8 (7.7%) | 22 (15.3%) |
| 70 to 74 Years | 8 (7.7%) | 21 (14.6%) |
| 75 to 79 Years | 9 (8.6%) | 9 (6.2%) |
| 80 to 84 Years | 0 (0.0%) | 2 (1.4%) |
| 85 Years and over | 2 (1.9%) | 0 (0.0%) |
| Total | 104 (100.0%) | 144 (100.0%) |
Families and Households in Orchard
Median Family Size in Orchard
The median family size in Orchard is 2.99 persons per family, with single female/mother families (21 | 29.2%) accounting for the largest median family size of 3.67 persons per family. On the other hand, single male/father families (23 | 31.9%) represent the smallest median family size with 2.65 persons per family.
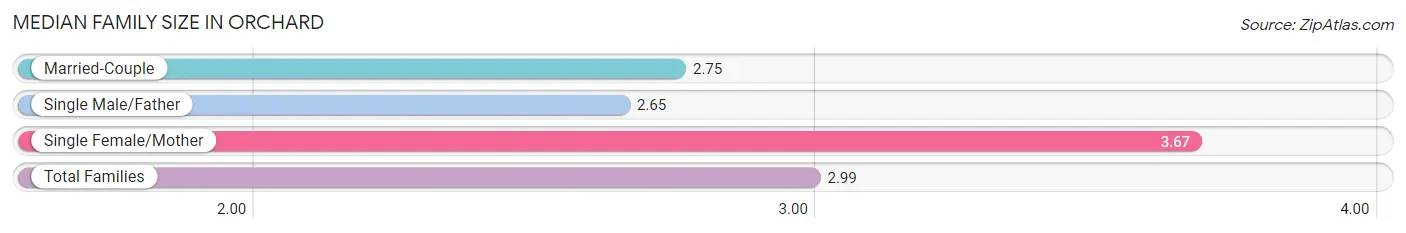
| Family Type | # Families | Family Size |
| Married-Couple | 28 (38.9%) | 2.75 |
| Single Male/Father | 23 (31.9%) | 2.65 |
| Single Female/Mother | 21 (29.2%) | 3.67 |
| Total Families | 72 (100.0%) | 2.99 |
Median Household Size in Orchard
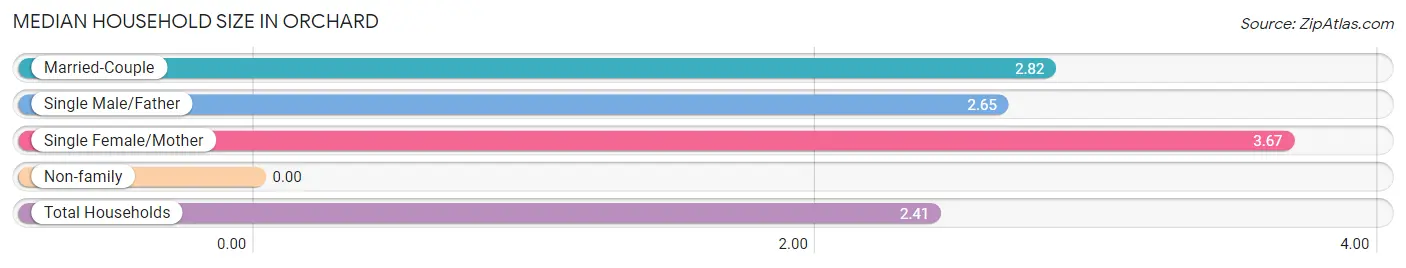
| Household Type | # Households | Household Size |
| Married-Couple | 28 (27.2%) | 2.82 |
| Single Male/Father | 23 (22.3%) | 2.65 |
| Single Female/Mother | 21 (20.4%) | 3.67 |
| Non-family | 31 (30.1%) | - |
| Total Households | 103 (100.0%) | 2.41 |
Household Size by Marriage Status in Orchard
Out of a total of 103 households in Orchard, 72 (69.9%) are family households, while 31 (30.1%) are nonfamily households. The most numerous type of family households are 2-person households, comprising 34, and the most common type of nonfamily households are 1-person households, comprising 31.
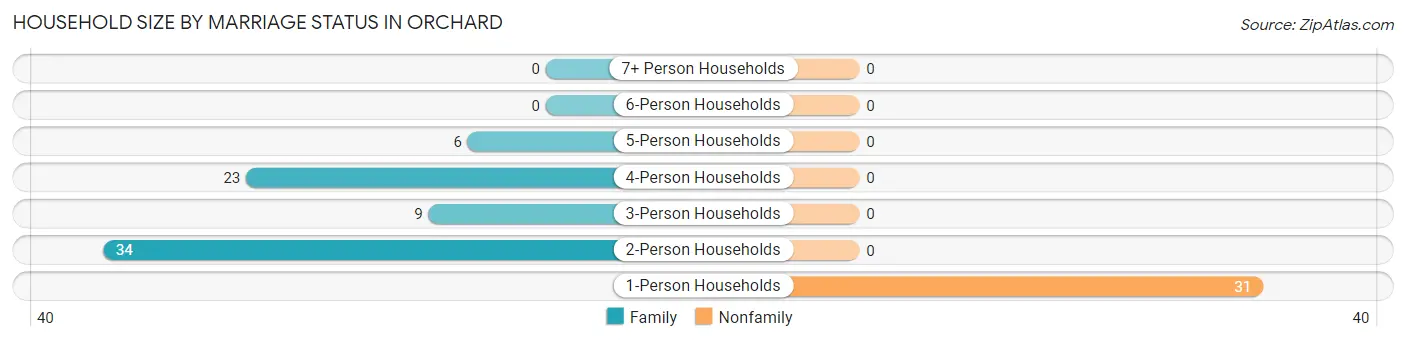
| Household Size | Family Households | Nonfamily Households |
| 1-Person Households | - | 31 (30.1%) |
| 2-Person Households | 34 (33.0%) | 0 (0.0%) |
| 3-Person Households | 9 (8.7%) | 0 (0.0%) |
| 4-Person Households | 23 (22.3%) | 0 (0.0%) |
| 5-Person Households | 6 (5.8%) | 0 (0.0%) |
| 6-Person Households | 0 (0.0%) | 0 (0.0%) |
| 7+ Person Households | 0 (0.0%) | 0 (0.0%) |
| Total | 72 (69.9%) | 31 (30.1%) |
Female Fertility in Orchard
Fertility by Age in Orchard
Average fertility rate in Orchard is 39.0 births per 1,000 women. Women in the age bracket of 20 to 34 years have the highest fertility rate with 87.0 births per 1,000 women. Women in the age bracket of 20 to 34 years acount for 100.0% of all women with births.
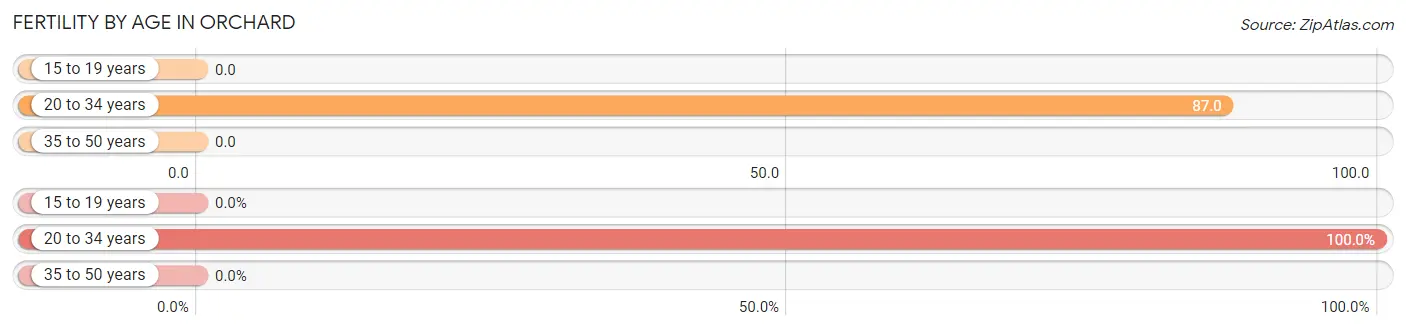
| Age Bracket | Women with Births | Births / 1,000 Women |
| 15 to 19 years | 0 (0.0%) | 0.0 |
| 20 to 34 years | 2 (100.0%) | 87.0 |
| 35 to 50 years | 0 (0.0%) | 0.0 |
| Total | 2 (100.0%) | 39.0 |
Fertility by Age by Marriage Status in Orchard
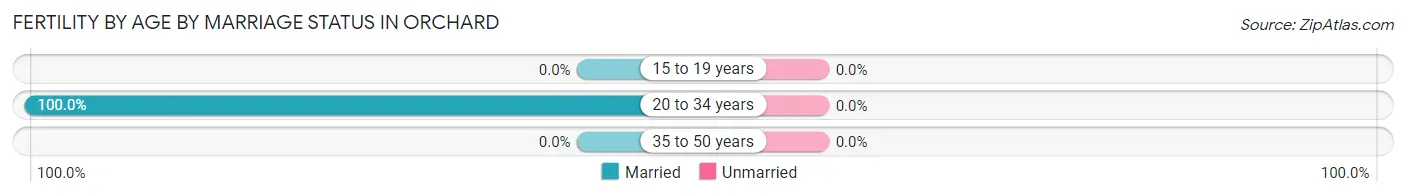
| Age Bracket | Married | Unmarried |
| 15 to 19 years | 0 (0.0%) | 0 (0.0%) |
| 20 to 34 years | 2 (100.0%) | 0 (0.0%) |
| 35 to 50 years | 0 (0.0%) | 0 (0.0%) |
| Total | 2 (100.0%) | 0 (0.0%) |
Fertility by Education in Orchard
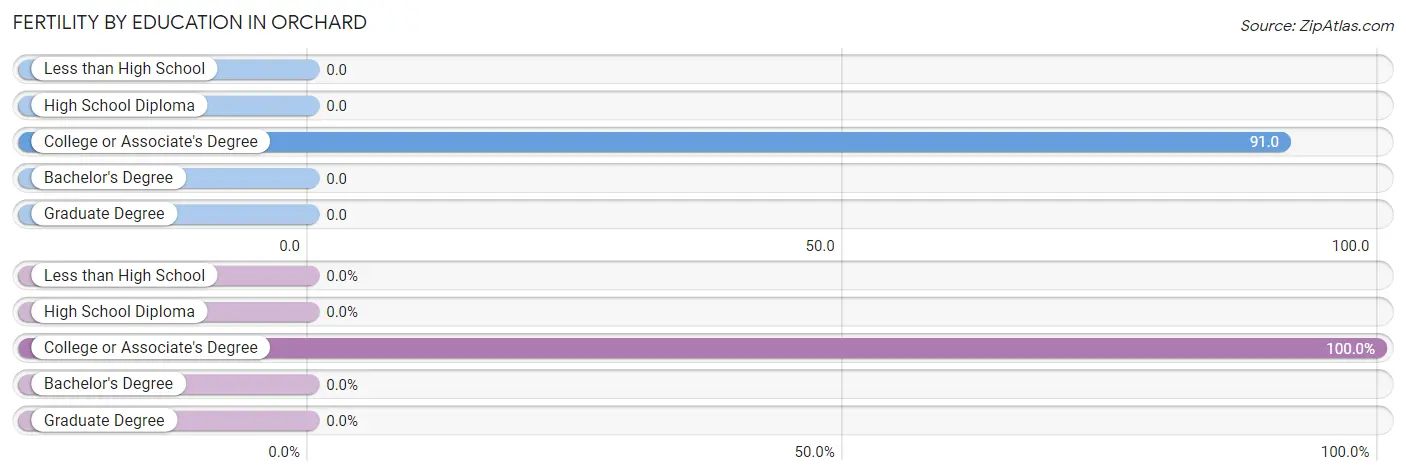
| Educational Attainment | Women with Births | Births / 1,000 Women |
| Less than High School | 0 (0.0%) | 0.0 |
| High School Diploma | 0 (0.0%) | 0.0 |
| College or Associate's Degree | 2 (100.0%) | 91.0 |
| Bachelor's Degree | 0 (0.0%) | 0.0 |
| Graduate Degree | 0 (0.0%) | 0.0 |
| Total | 2 (100.0%) | 39.0 |
Fertility by Education by Marriage Status in Orchard
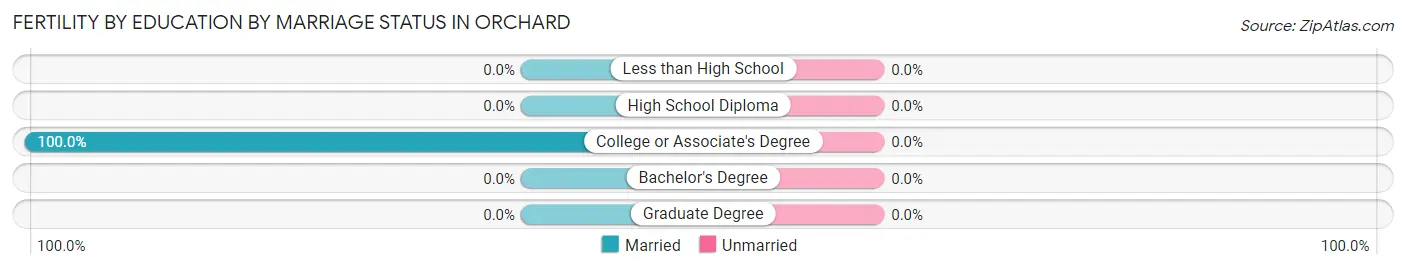
| Educational Attainment | Married | Unmarried |
| Less than High School | 0 (0.0%) | 0 (0.0%) |
| High School Diploma | 0 (0.0%) | 0 (0.0%) |
| College or Associate's Degree | 2 (100.0%) | 0 (0.0%) |
| Bachelor's Degree | 0 (0.0%) | 0 (0.0%) |
| Graduate Degree | 0 (0.0%) | 0 (0.0%) |
| Total | 2 (100.0%) | 0 (0.0%) |
Employment Characteristics in Orchard
Employment by Class of Employer in Orchard
Among the 86 employed individuals in Orchard, private company employees (58 | 67.4%), self-employed (incorporated) (10 | 11.6%), and self-employed (not incorporated) (8 | 9.3%) make up the most common classes of employment.
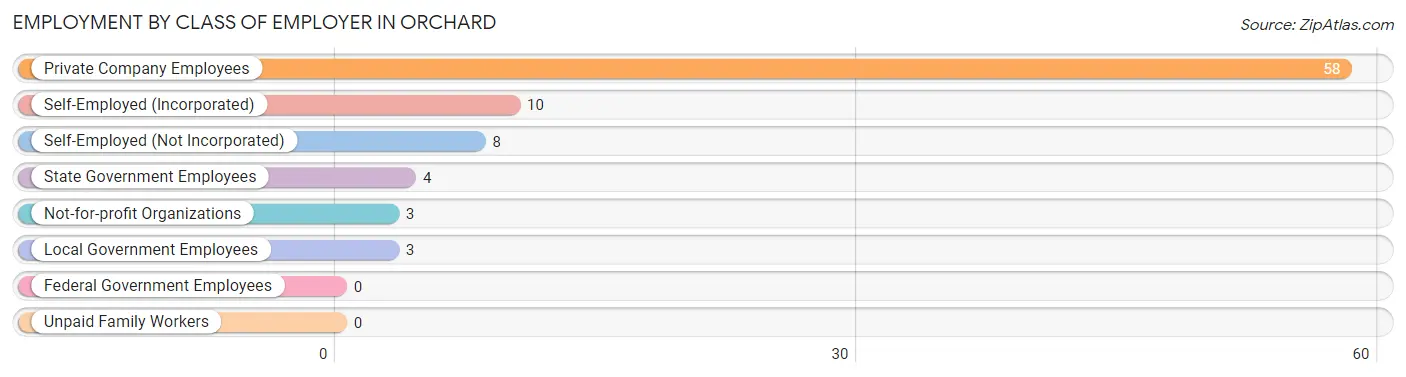
| Employer Class | # Employees | % Employees |
| Private Company Employees | 58 | 67.4% |
| Self-Employed (Incorporated) | 10 | 11.6% |
| Self-Employed (Not Incorporated) | 8 | 9.3% |
| Not-for-profit Organizations | 3 | 3.5% |
| Local Government Employees | 3 | 3.5% |
| State Government Employees | 4 | 4.6% |
| Federal Government Employees | 0 | 0.0% |
| Unpaid Family Workers | 0 | 0.0% |
| Total | 86 | 100.0% |
Employment Status by Age in Orchard
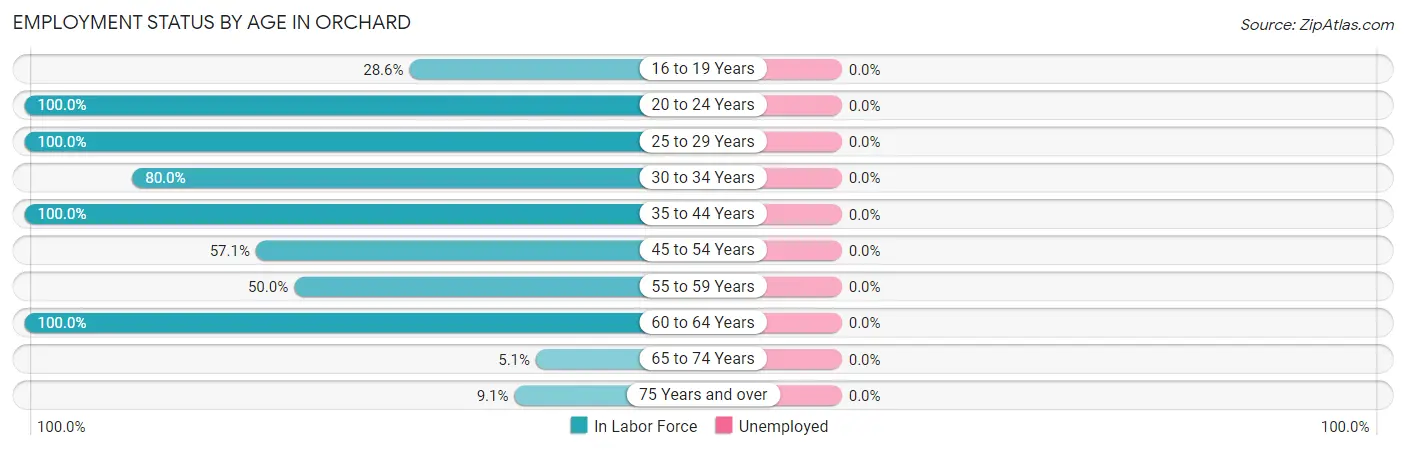
| Age Bracket | In Labor Force | Unemployed |
| 16 to 19 Years | 2 (28.6%) | 0 (0.0%) |
| 20 to 24 Years | 7 (100.0%) | 0 (0.0%) |
| 25 to 29 Years | 9 (100.0%) | 0 (0.0%) |
| 30 to 34 Years | 8 (80.0%) | 0 (0.0%) |
| 35 to 44 Years | 9 (100.0%) | 0 (0.0%) |
| 45 to 54 Years | 36 (57.1%) | 0 (0.0%) |
| 55 to 59 Years | 4 (50.0%) | 0 (0.0%) |
| 60 to 64 Years | 8 (100.0%) | 0 (0.0%) |
| 65 to 74 Years | 3 (5.1%) | 0 (0.0%) |
| 75 Years and over | 2 (9.1%) | 0 (0.0%) |
| Total | 88 (43.6%) | 0 (0.0%) |
Employment Status by Educational Attainment in Orchard
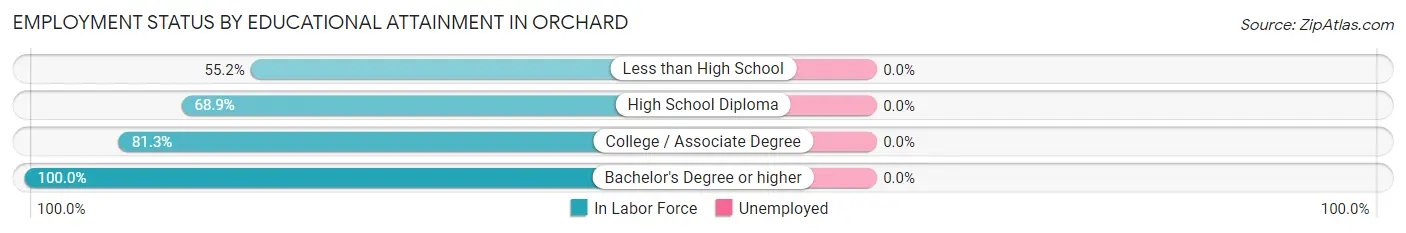
| Educational Attainment | In Labor Force | Unemployed |
| Less than High School | 16 (55.2%) | 0 (0.0%) |
| High School Diploma | 31 (68.9%) | 0 (0.0%) |
| College / Associate Degree | 26 (81.3%) | 0 (0.0%) |
| Bachelor's Degree or higher | 1 (100.0%) | 0 (0.0%) |
| Total | 74 (69.2%) | 0 (0.0%) |
Employment Occupations by Sex in Orchard
Management, Business, Science and Arts Occupations
The most common Management, Business, Science and Arts occupations in Orchard are , and Management (11 | 12.5%).
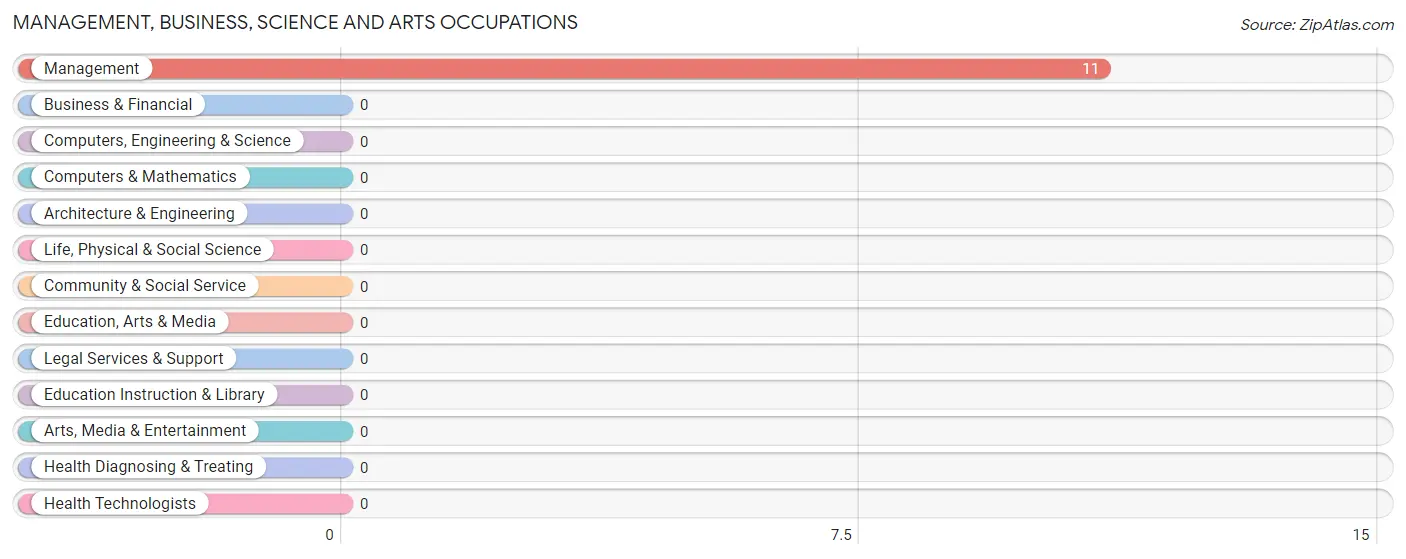
Management, Business, Science and Arts Occupations by Sex
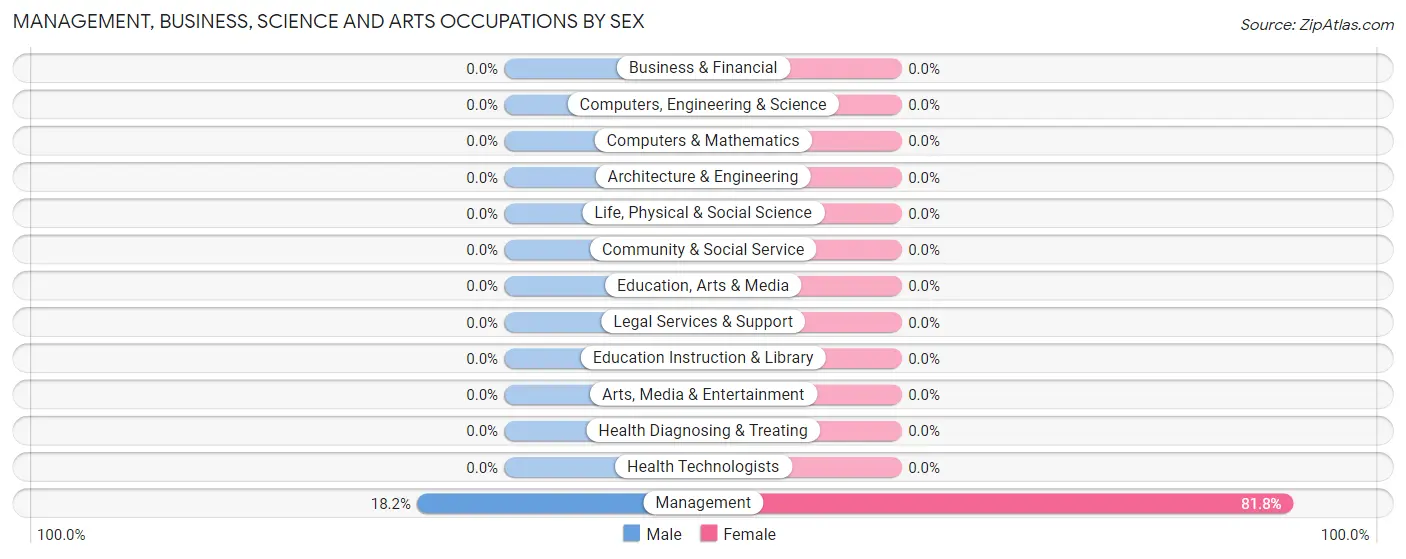
| Occupation | Male | Female |
| Management | 2 (18.2%) | 9 (81.8%) |
| Business & Financial | 0 (0.0%) | 0 (0.0%) |
| Computers, Engineering & Science | 0 (0.0%) | 0 (0.0%) |
| Computers & Mathematics | 0 (0.0%) | 0 (0.0%) |
| Architecture & Engineering | 0 (0.0%) | 0 (0.0%) |
| Life, Physical & Social Science | 0 (0.0%) | 0 (0.0%) |
| Community & Social Service | 0 (0.0%) | 0 (0.0%) |
| Education, Arts & Media | 0 (0.0%) | 0 (0.0%) |
| Legal Services & Support | 0 (0.0%) | 0 (0.0%) |
| Education Instruction & Library | 0 (0.0%) | 0 (0.0%) |
| Arts, Media & Entertainment | 0 (0.0%) | 0 (0.0%) |
| Health Diagnosing & Treating | 0 (0.0%) | 0 (0.0%) |
| Health Technologists | 0 (0.0%) | 0 (0.0%) |
| Total (Category) | 2 (18.2%) | 9 (81.8%) |
| Total (Overall) | 45 (51.1%) | 43 (48.9%) |
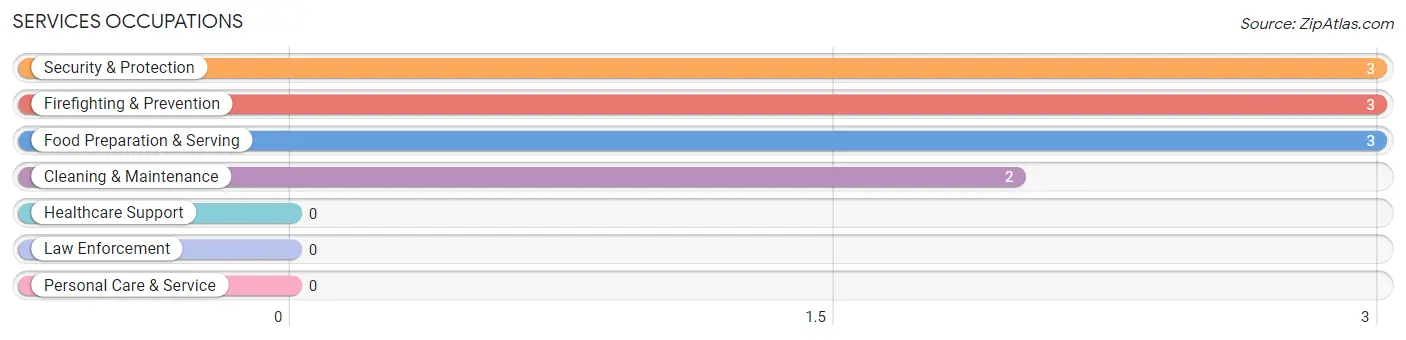
Services Occupations
The most common Services occupations in Orchard are Security & Protection (3 | 3.4%), Firefighting & Prevention (3 | 3.4%), Food Preparation & Serving (3 | 3.4%), and Cleaning & Maintenance (2 | 2.3%).
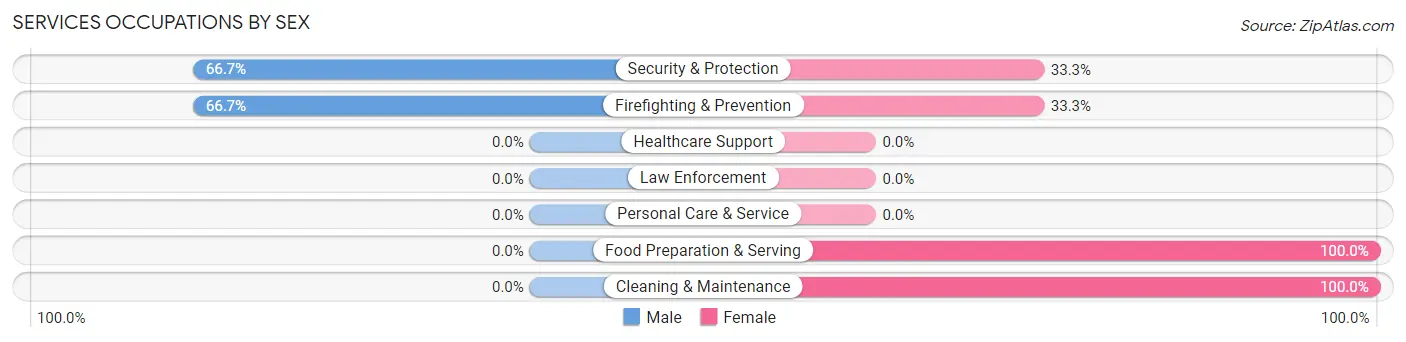
Services Occupations by Sex
Within the Services occupations in Orchard, the most male-oriented occupations are Security & Protection (66.7%), and Firefighting & Prevention (66.7%), while the most female-oriented occupations are Food Preparation & Serving (100.0%), Cleaning & Maintenance (100.0%), and Security & Protection (33.3%).
| Occupation | Male | Female |
| Healthcare Support | 0 (0.0%) | 0 (0.0%) |
| Security & Protection | 2 (66.7%) | 1 (33.3%) |
| Firefighting & Prevention | 2 (66.7%) | 1 (33.3%) |
| Law Enforcement | 0 (0.0%) | 0 (0.0%) |
| Food Preparation & Serving | 0 (0.0%) | 3 (100.0%) |
| Cleaning & Maintenance | 0 (0.0%) | 2 (100.0%) |
| Personal Care & Service | 0 (0.0%) | 0 (0.0%) |
| Total (Category) | 2 (25.0%) | 6 (75.0%) |
| Total (Overall) | 45 (51.1%) | 43 (48.9%) |
Sales and Office Occupations
The most common Sales and Office occupations in Orchard are Sales & Related (18 | 20.4%), and Office & Administration (6 | 6.8%).
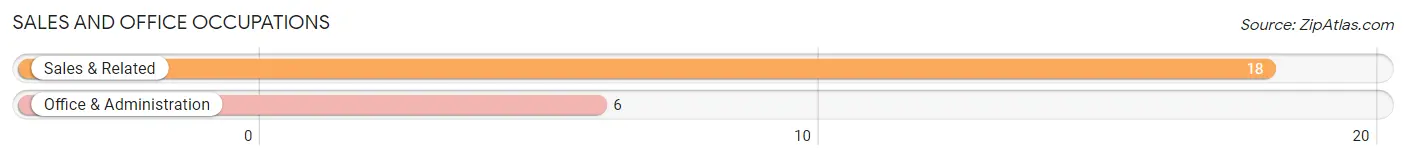
Sales and Office Occupations by Sex
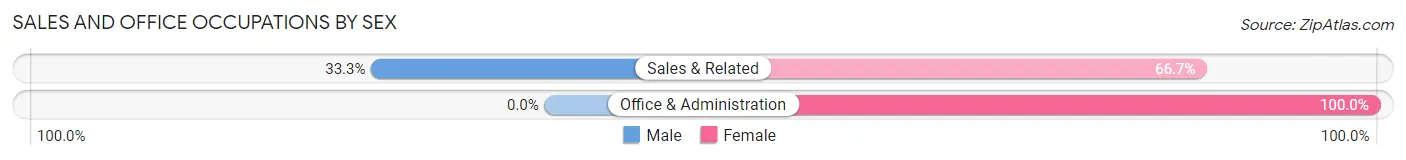
| Occupation | Male | Female |
| Sales & Related | 6 (33.3%) | 12 (66.7%) |
| Office & Administration | 0 (0.0%) | 6 (100.0%) |
| Total (Category) | 6 (25.0%) | 18 (75.0%) |
| Total (Overall) | 45 (51.1%) | 43 (48.9%) |
Natural Resources, Construction and Maintenance Occupations
The most common Natural Resources, Construction and Maintenance occupations in Orchard are Construction & Extraction (20 | 22.7%), and Installation, Maintenance & Repair (11 | 12.5%).
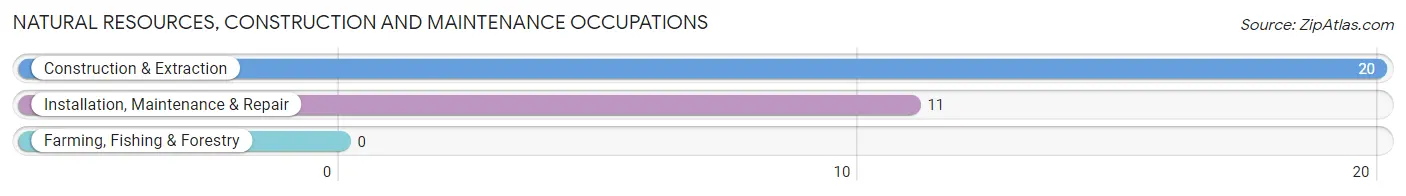
Natural Resources, Construction and Maintenance Occupations by Sex
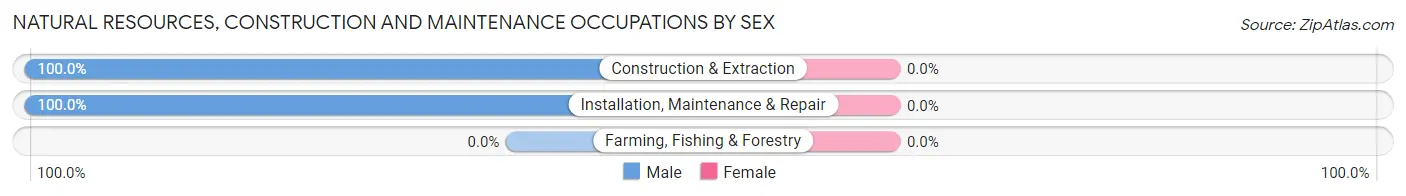
| Occupation | Male | Female |
| Farming, Fishing & Forestry | 0 (0.0%) | 0 (0.0%) |
| Construction & Extraction | 20 (100.0%) | 0 (0.0%) |
| Installation, Maintenance & Repair | 11 (100.0%) | 0 (0.0%) |
| Total (Category) | 31 (100.0%) | 0 (0.0%) |
| Total (Overall) | 45 (51.1%) | 43 (48.9%) |
Production, Transportation and Moving Occupations
The most common Production, Transportation and Moving occupations in Orchard are Transportation (10 | 11.4%), and Production (4 | 4.5%).
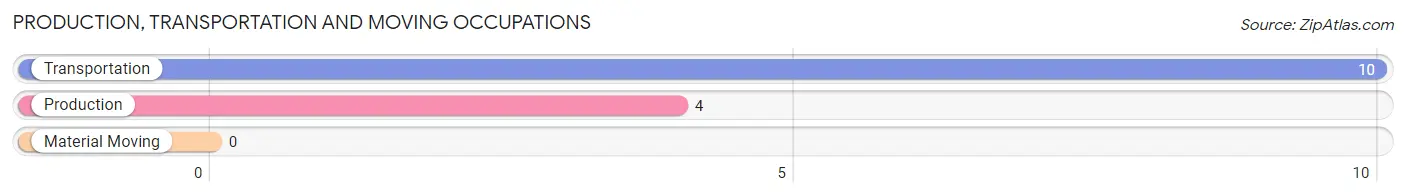
Production, Transportation and Moving Occupations by Sex
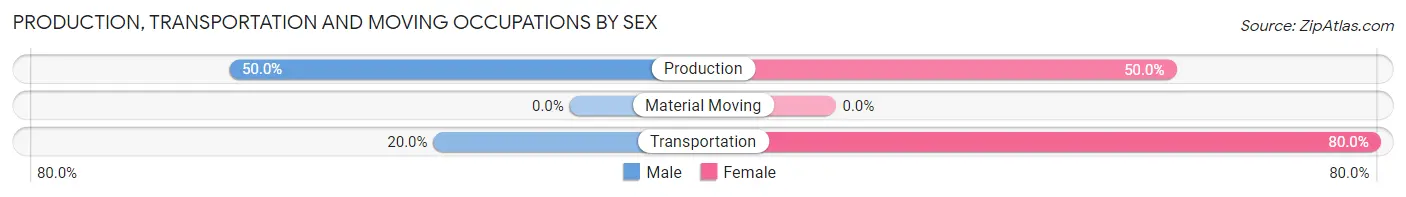
| Occupation | Male | Female |
| Production | 2 (50.0%) | 2 (50.0%) |
| Transportation | 2 (20.0%) | 8 (80.0%) |
| Material Moving | 0 (0.0%) | 0 (0.0%) |
| Total (Category) | 4 (28.6%) | 10 (71.4%) |
| Total (Overall) | 45 (51.1%) | 43 (48.9%) |
Employment Industries by Sex in Orchard
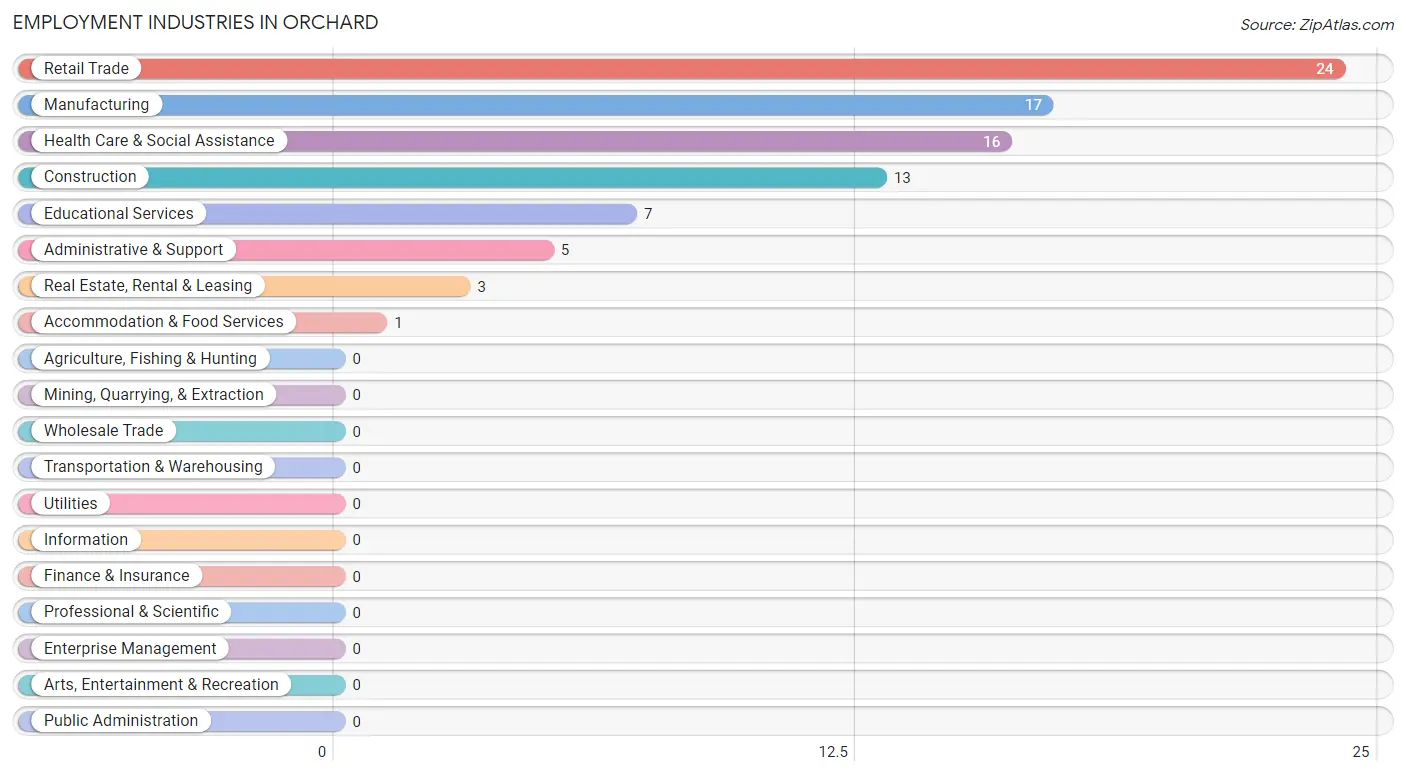
Employment Industries in Orchard
The major employment industries in Orchard include Retail Trade (24 | 27.3%), Manufacturing (17 | 19.3%), Health Care & Social Assistance (16 | 18.2%), Construction (13 | 14.8%), and Educational Services (7 | 8.0%).
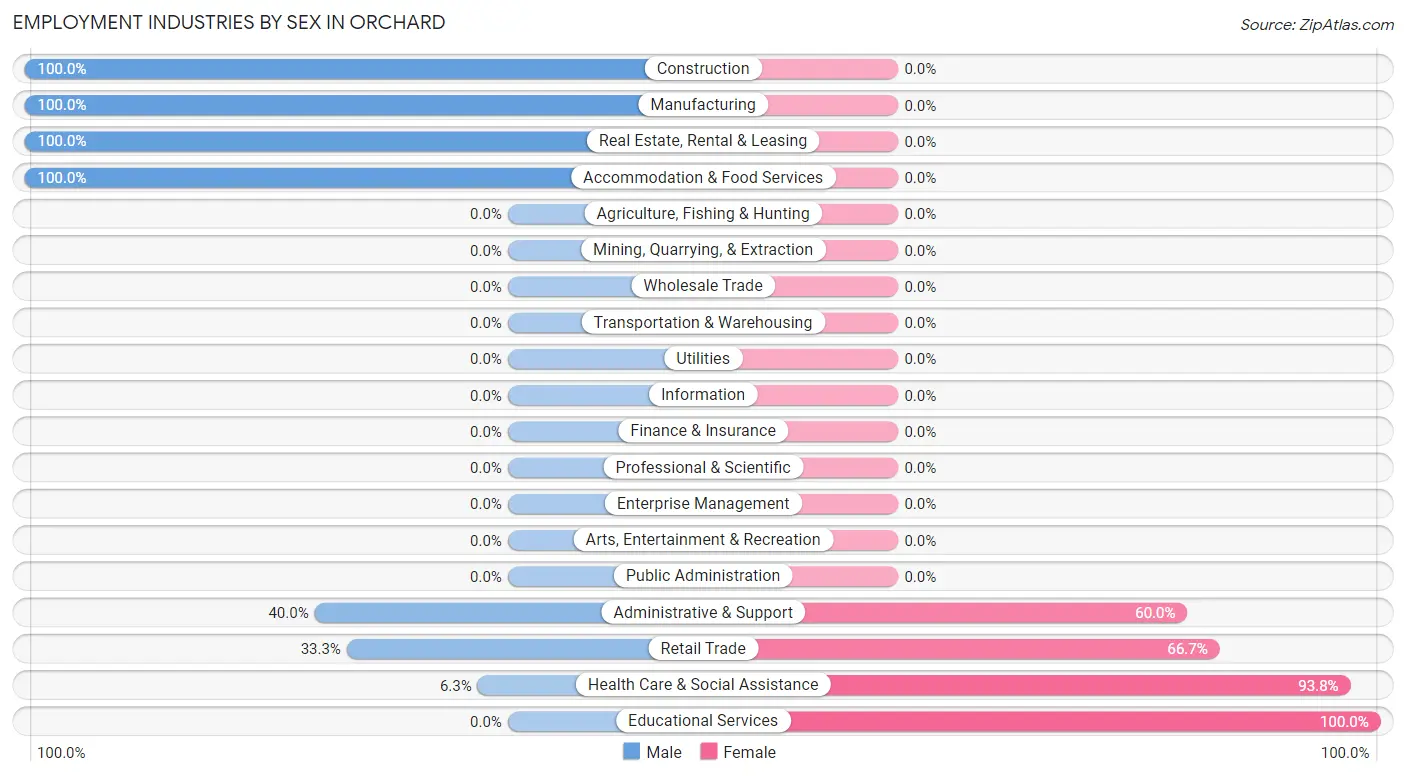
Employment Industries by Sex in Orchard
The Orchard industries that see more men than women are Construction (100.0%), Manufacturing (100.0%), and Real Estate, Rental & Leasing (100.0%), whereas the industries that tend to have a higher number of women are Educational Services (100.0%), Health Care & Social Assistance (93.8%), and Retail Trade (66.7%).
| Industry | Male | Female |
| Agriculture, Fishing & Hunting | 0 (0.0%) | 0 (0.0%) |
| Mining, Quarrying, & Extraction | 0 (0.0%) | 0 (0.0%) |
| Construction | 13 (100.0%) | 0 (0.0%) |
| Manufacturing | 17 (100.0%) | 0 (0.0%) |
| Wholesale Trade | 0 (0.0%) | 0 (0.0%) |
| Retail Trade | 8 (33.3%) | 16 (66.7%) |
| Transportation & Warehousing | 0 (0.0%) | 0 (0.0%) |
| Utilities | 0 (0.0%) | 0 (0.0%) |
| Information | 0 (0.0%) | 0 (0.0%) |
| Finance & Insurance | 0 (0.0%) | 0 (0.0%) |
| Real Estate, Rental & Leasing | 3 (100.0%) | 0 (0.0%) |
| Professional & Scientific | 0 (0.0%) | 0 (0.0%) |
| Enterprise Management | 0 (0.0%) | 0 (0.0%) |
| Administrative & Support | 2 (40.0%) | 3 (60.0%) |
| Educational Services | 0 (0.0%) | 7 (100.0%) |
| Health Care & Social Assistance | 1 (6.2%) | 15 (93.8%) |
| Arts, Entertainment & Recreation | 0 (0.0%) | 0 (0.0%) |
| Accommodation & Food Services | 1 (100.0%) | 0 (0.0%) |
| Public Administration | 0 (0.0%) | 0 (0.0%) |
| Total | 45 (51.1%) | 43 (48.9%) |
Education in Orchard
School Enrollment in Orchard
The most common levels of schooling among the 43 students in Orchard are elementary school (17 | 39.5%), high school (14 | 32.6%), and middle school (8 | 18.6%).
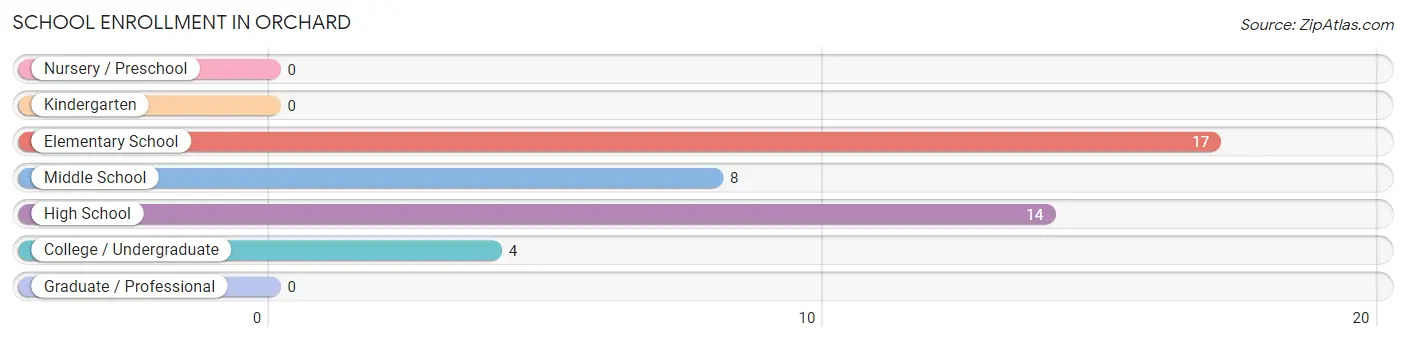
| School Level | # Students | % Students |
| Nursery / Preschool | 0 | 0.0% |
| Kindergarten | 0 | 0.0% |
| Elementary School | 17 | 39.5% |
| Middle School | 8 | 18.6% |
| High School | 14 | 32.6% |
| College / Undergraduate | 4 | 9.3% |
| Graduate / Professional | 0 | 0.0% |
| Total | 43 | 100.0% |
School Enrollment by Age by Funding Source in Orchard
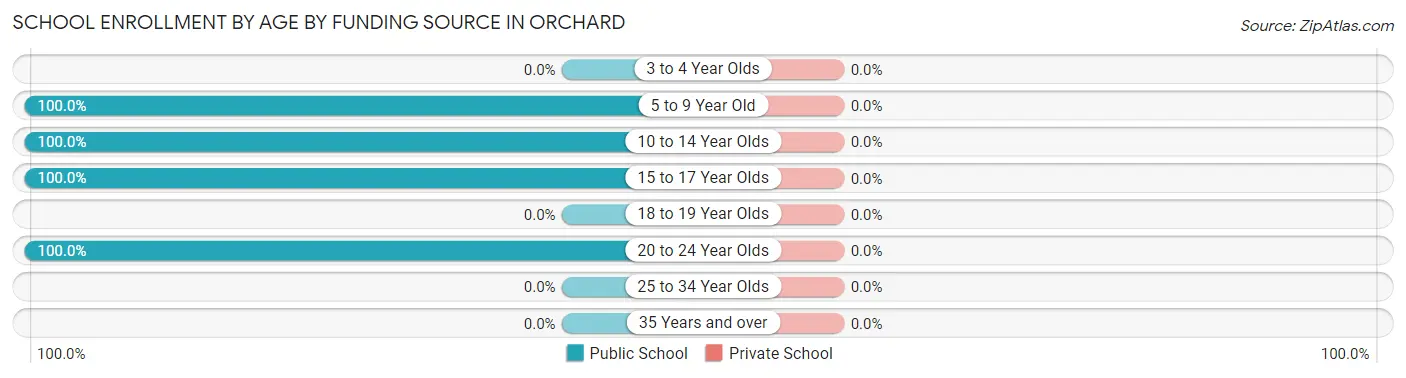
| Age Bracket | Public School | Private School |
| 3 to 4 Year Olds | 0 (0.0%) | 0 (0.0%) |
| 5 to 9 Year Old | 17 (100.0%) | 0 (0.0%) |
| 10 to 14 Year Olds | 8 (100.0%) | 0 (0.0%) |
| 15 to 17 Year Olds | 14 (100.0%) | 0 (0.0%) |
| 18 to 19 Year Olds | 0 (0.0%) | 0 (0.0%) |
| 20 to 24 Year Olds | 4 (100.0%) | 0 (0.0%) |
| 25 to 34 Year Olds | 0 (0.0%) | 0 (0.0%) |
| 35 Years and over | 0 (0.0%) | 0 (0.0%) |
| Total | 43 (100.0%) | 0 (0.0%) |
Educational Attainment by Field of Study in Orchard
Education (4 | 80.0%), and science & technology (1 | 20.0%) are the most common fields of study among 5 individuals in Orchard who have obtained a bachelor's degree or higher.
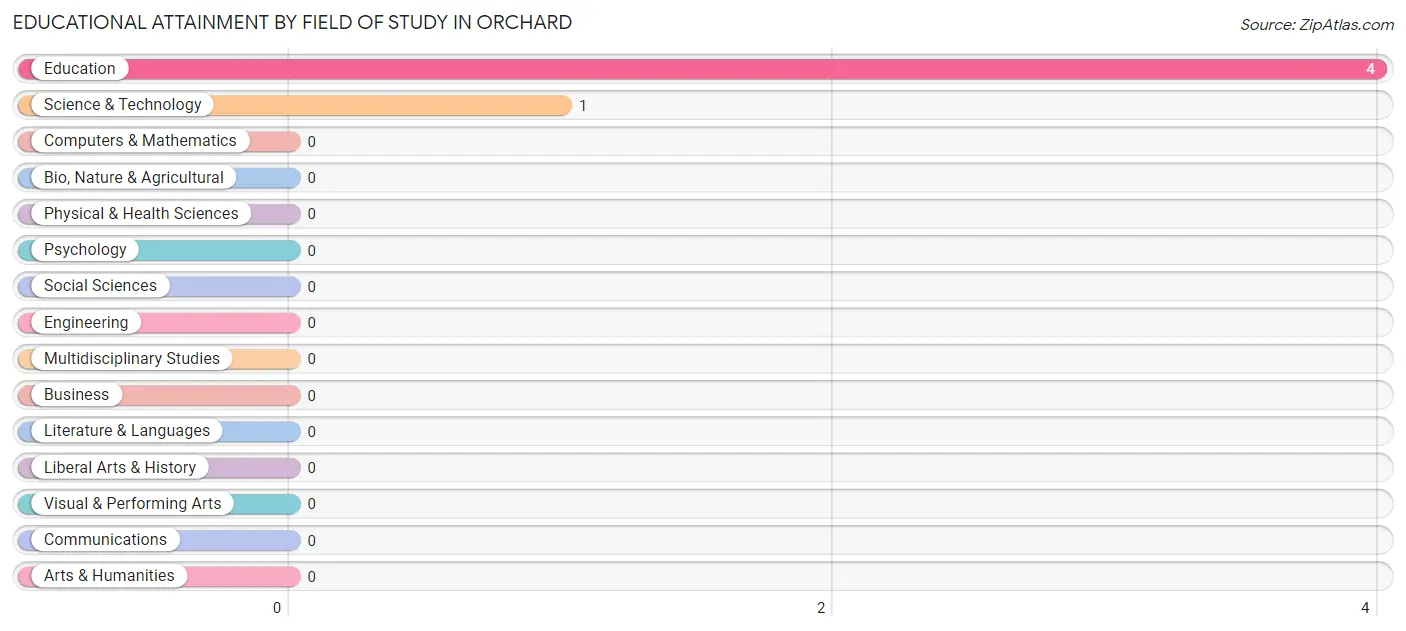
| Field of Study | # Graduates | % Graduates |
| Computers & Mathematics | 0 | 0.0% |
| Bio, Nature & Agricultural | 0 | 0.0% |
| Physical & Health Sciences | 0 | 0.0% |
| Psychology | 0 | 0.0% |
| Social Sciences | 0 | 0.0% |
| Engineering | 0 | 0.0% |
| Multidisciplinary Studies | 0 | 0.0% |
| Science & Technology | 1 | 20.0% |
| Business | 0 | 0.0% |
| Education | 4 | 80.0% |
| Literature & Languages | 0 | 0.0% |
| Liberal Arts & History | 0 | 0.0% |
| Visual & Performing Arts | 0 | 0.0% |
| Communications | 0 | 0.0% |
| Arts & Humanities | 0 | 0.0% |
| Total | 5 | 100.0% |
Transportation & Commute in Orchard
Vehicle Availability by Sex in Orchard
The most prevalent vehicle ownership categories in Orchard are males with 2 vehicles (14, accounting for 32.6%) and females with 2 vehicles (32, making up 32.6%).
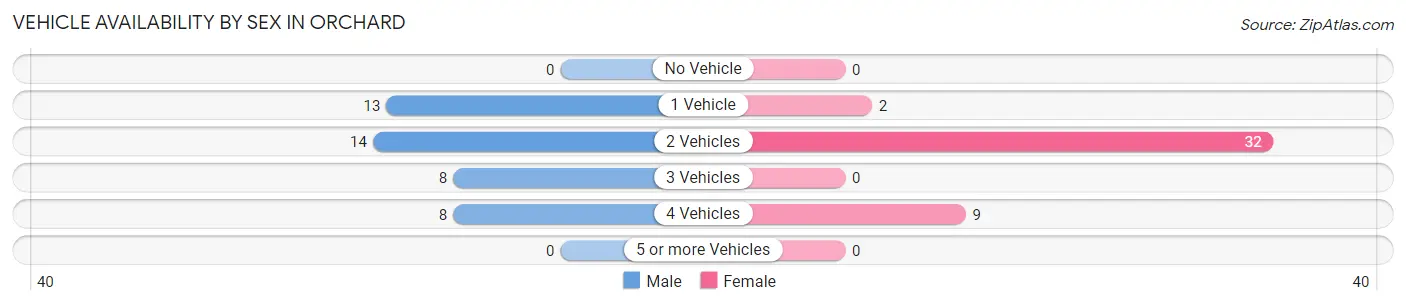
| Vehicles Available | Male | Female |
| No Vehicle | 0 (0.0%) | 0 (0.0%) |
| 1 Vehicle | 13 (30.2%) | 2 (4.6%) |
| 2 Vehicles | 14 (32.6%) | 32 (74.4%) |
| 3 Vehicles | 8 (18.6%) | 0 (0.0%) |
| 4 Vehicles | 8 (18.6%) | 9 (20.9%) |
| 5 or more Vehicles | 0 (0.0%) | 0 (0.0%) |
| Total | 43 (100.0%) | 43 (100.0%) |
Commute Time in Orchard
The most frequently occuring commute durations in Orchard are 10 to 14 minutes (14 commuters, 17.9%), less than 5 minutes (13 commuters, 16.7%), and 30 to 34 minutes (13 commuters, 16.7%).
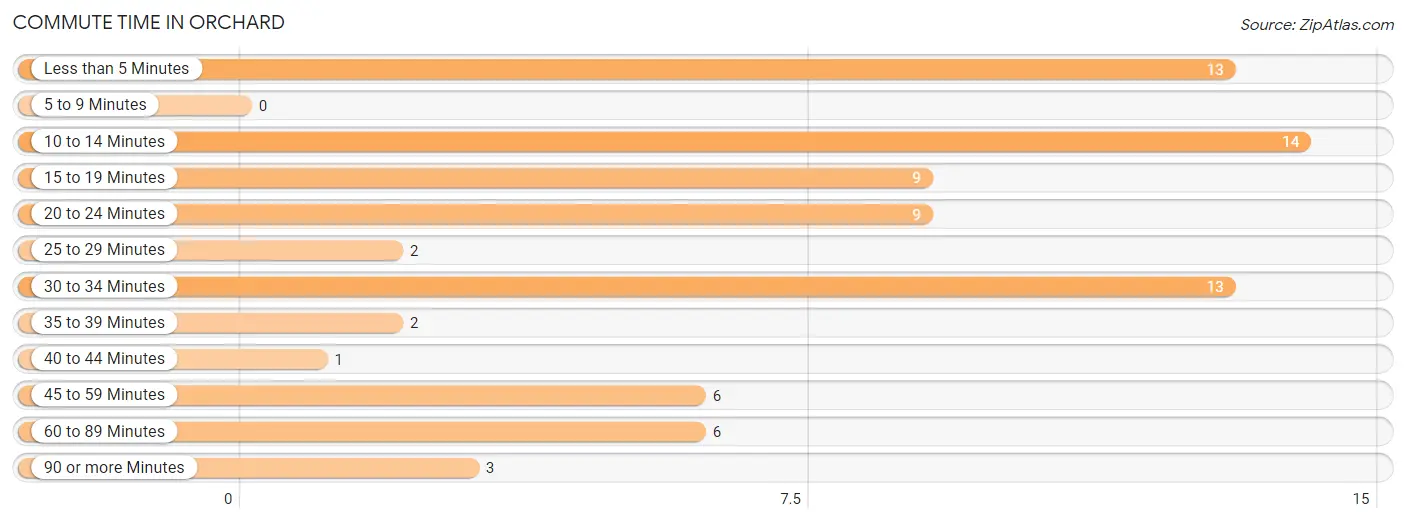
| Commute Time | # Commuters | % Commuters |
| Less than 5 Minutes | 13 | 16.7% |
| 5 to 9 Minutes | 0 | 0.0% |
| 10 to 14 Minutes | 14 | 17.9% |
| 15 to 19 Minutes | 9 | 11.5% |
| 20 to 24 Minutes | 9 | 11.5% |
| 25 to 29 Minutes | 2 | 2.6% |
| 30 to 34 Minutes | 13 | 16.7% |
| 35 to 39 Minutes | 2 | 2.6% |
| 40 to 44 Minutes | 1 | 1.3% |
| 45 to 59 Minutes | 6 | 7.7% |
| 60 to 89 Minutes | 6 | 7.7% |
| 90 or more Minutes | 3 | 3.8% |
Commute Time by Sex in Orchard
The most common commute times in Orchard are 30 to 34 minutes (13 commuters, 37.1%) for males and less than 5 minutes (10 commuters, 23.3%) for females.
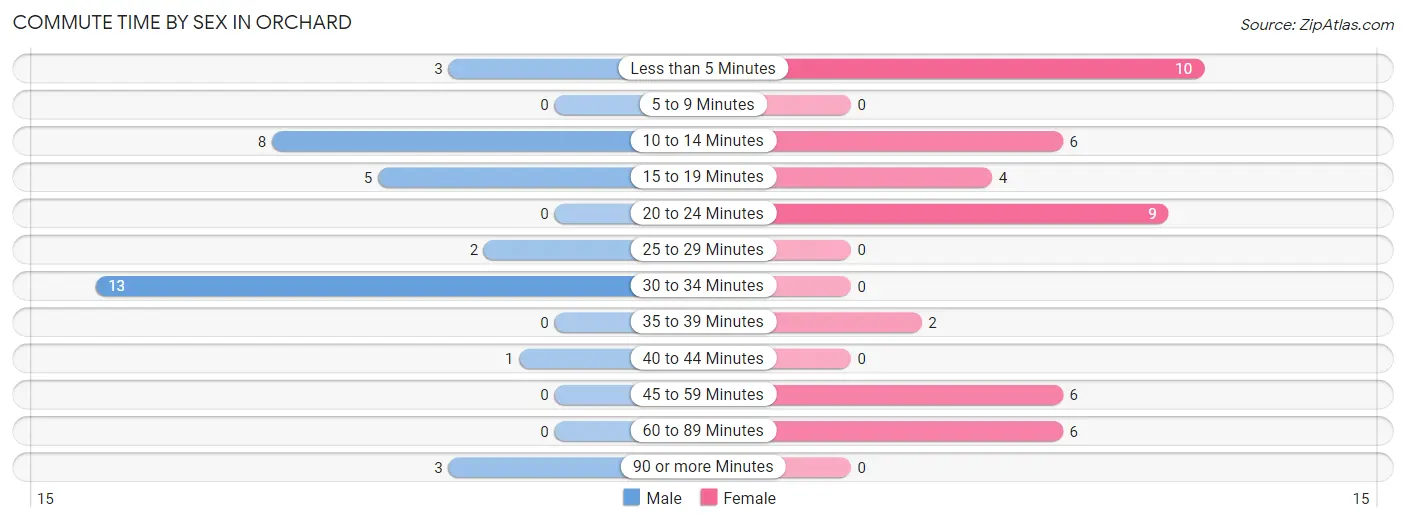
| Commute Time | Male | Female |
| Less than 5 Minutes | 3 (8.6%) | 10 (23.3%) |
| 5 to 9 Minutes | 0 (0.0%) | 0 (0.0%) |
| 10 to 14 Minutes | 8 (22.9%) | 6 (14.0%) |
| 15 to 19 Minutes | 5 (14.3%) | 4 (9.3%) |
| 20 to 24 Minutes | 0 (0.0%) | 9 (20.9%) |
| 25 to 29 Minutes | 2 (5.7%) | 0 (0.0%) |
| 30 to 34 Minutes | 13 (37.1%) | 0 (0.0%) |
| 35 to 39 Minutes | 0 (0.0%) | 2 (4.6%) |
| 40 to 44 Minutes | 1 (2.9%) | 0 (0.0%) |
| 45 to 59 Minutes | 0 (0.0%) | 6 (14.0%) |
| 60 to 89 Minutes | 0 (0.0%) | 6 (14.0%) |
| 90 or more Minutes | 3 (8.6%) | 0 (0.0%) |
Time of Departure to Work by Sex in Orchard
The most frequent times of departure to work in Orchard are 4:00 PM to 11:59 PM (15, 42.9%) for males and 7:00 AM to 7:29 AM (15, 34.9%) for females.
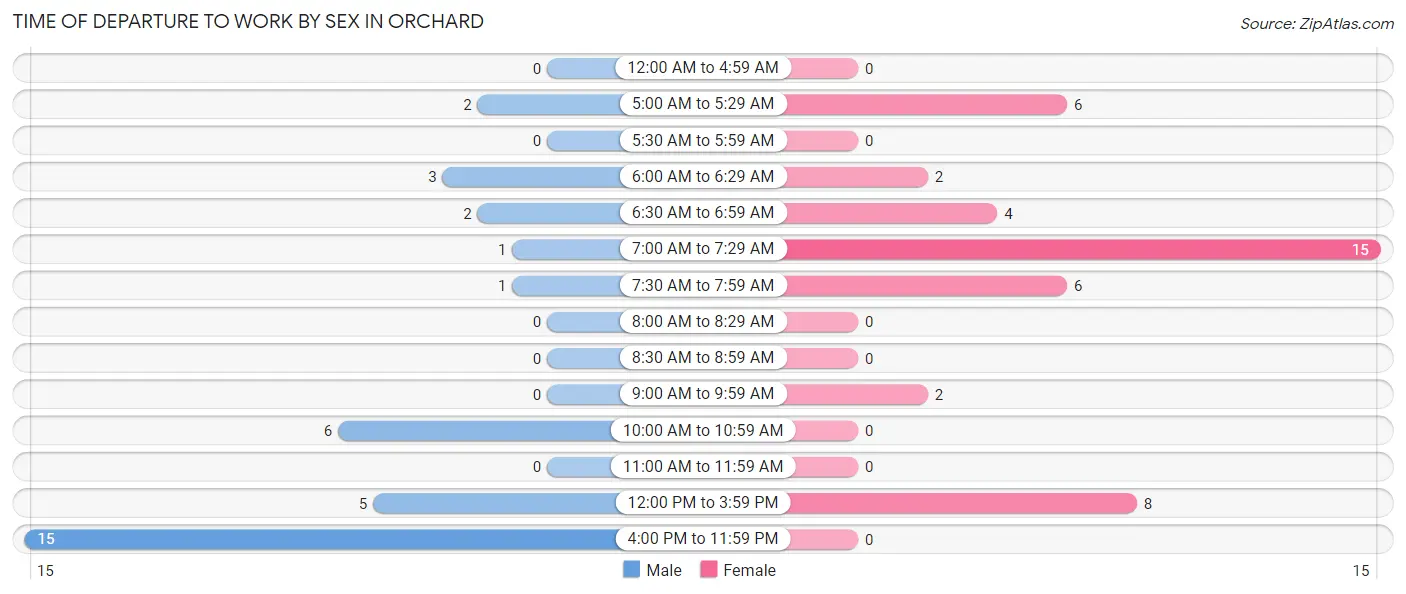
| Time of Departure | Male | Female |
| 12:00 AM to 4:59 AM | 0 (0.0%) | 0 (0.0%) |
| 5:00 AM to 5:29 AM | 2 (5.7%) | 6 (14.0%) |
| 5:30 AM to 5:59 AM | 0 (0.0%) | 0 (0.0%) |
| 6:00 AM to 6:29 AM | 3 (8.6%) | 2 (4.6%) |
| 6:30 AM to 6:59 AM | 2 (5.7%) | 4 (9.3%) |
| 7:00 AM to 7:29 AM | 1 (2.9%) | 15 (34.9%) |
| 7:30 AM to 7:59 AM | 1 (2.9%) | 6 (14.0%) |
| 8:00 AM to 8:29 AM | 0 (0.0%) | 0 (0.0%) |
| 8:30 AM to 8:59 AM | 0 (0.0%) | 0 (0.0%) |
| 9:00 AM to 9:59 AM | 0 (0.0%) | 2 (4.6%) |
| 10:00 AM to 10:59 AM | 6 (17.1%) | 0 (0.0%) |
| 11:00 AM to 11:59 AM | 0 (0.0%) | 0 (0.0%) |
| 12:00 PM to 3:59 PM | 5 (14.3%) | 8 (18.6%) |
| 4:00 PM to 11:59 PM | 15 (42.9%) | 0 (0.0%) |
| Total | 35 (100.0%) | 43 (100.0%) |
Housing Occupancy in Orchard
Occupancy by Ownership in Orchard
Of the total 103 dwellings in Orchard, owner-occupied units account for 58 (56.3%), while renter-occupied units make up 45 (43.7%).
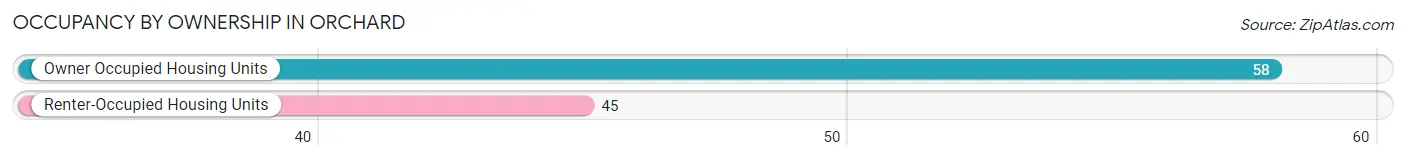
| Occupancy | # Housing Units | % Housing Units |
| Owner Occupied Housing Units | 58 | 56.3% |
| Renter-Occupied Housing Units | 45 | 43.7% |
| Total Occupied Housing Units | 103 | 100.0% |
Occupancy by Household Size in Orchard
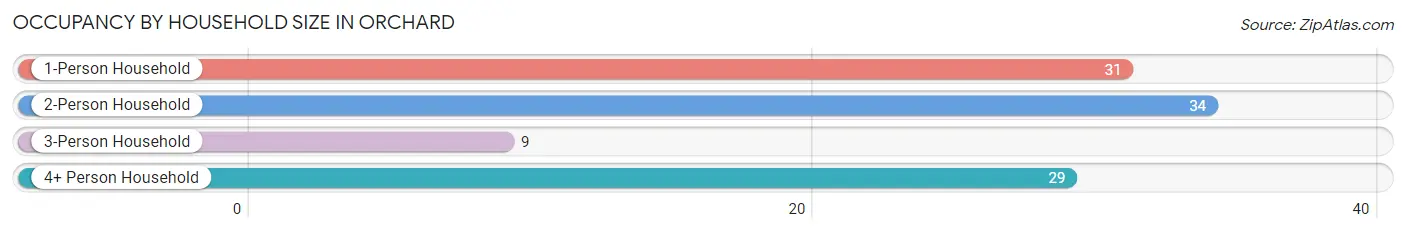
| Household Size | # Housing Units | % Housing Units |
| 1-Person Household | 31 | 30.1% |
| 2-Person Household | 34 | 33.0% |
| 3-Person Household | 9 | 8.7% |
| 4+ Person Household | 29 | 28.2% |
| Total Housing Units | 103 | 100.0% |
Occupancy by Ownership by Household Size in Orchard
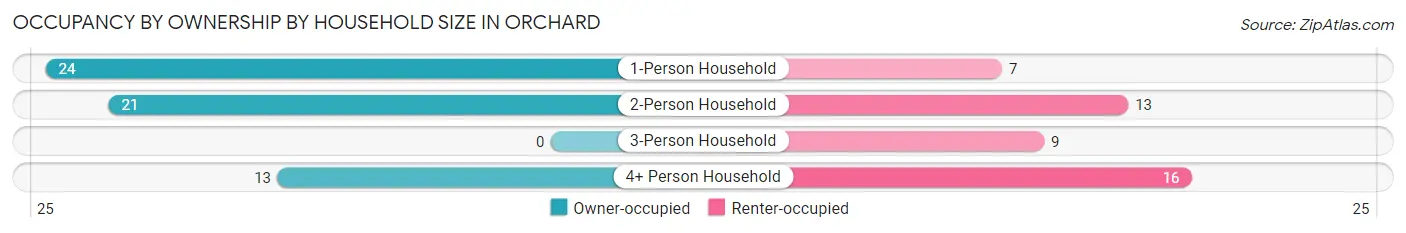
| Household Size | Owner-occupied | Renter-occupied |
| 1-Person Household | 24 (77.4%) | 7 (22.6%) |
| 2-Person Household | 21 (61.8%) | 13 (38.2%) |
| 3-Person Household | 0 (0.0%) | 9 (100.0%) |
| 4+ Person Household | 13 (44.8%) | 16 (55.2%) |
| Total Housing Units | 58 (56.3%) | 45 (43.7%) |
Occupancy by Educational Attainment in Orchard
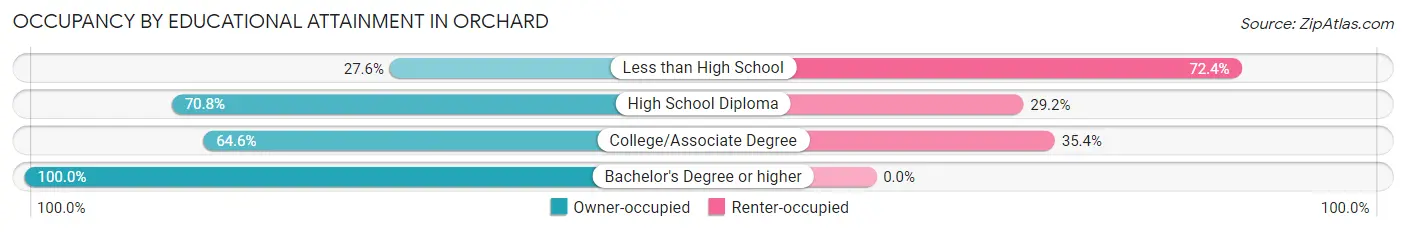
| Household Size | Owner-occupied | Renter-occupied |
| Less than High School | 8 (27.6%) | 21 (72.4%) |
| High School Diploma | 17 (70.8%) | 7 (29.2%) |
| College/Associate Degree | 31 (64.6%) | 17 (35.4%) |
| Bachelor's Degree or higher | 2 (100.0%) | 0 (0.0%) |
Occupancy by Age of Householder in Orchard
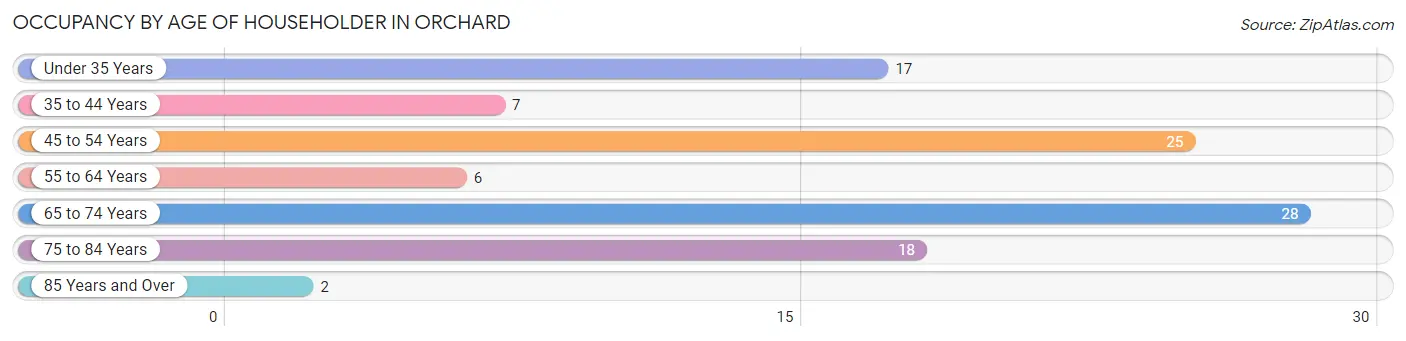
| Age Bracket | # Households | % Households |
| Under 35 Years | 17 | 16.5% |
| 35 to 44 Years | 7 | 6.8% |
| 45 to 54 Years | 25 | 24.3% |
| 55 to 64 Years | 6 | 5.8% |
| 65 to 74 Years | 28 | 27.2% |
| 75 to 84 Years | 18 | 17.5% |
| 85 Years and Over | 2 | 1.9% |
| Total | 103 | 100.0% |
Housing Finances in Orchard
Median Income by Occupancy in Orchard
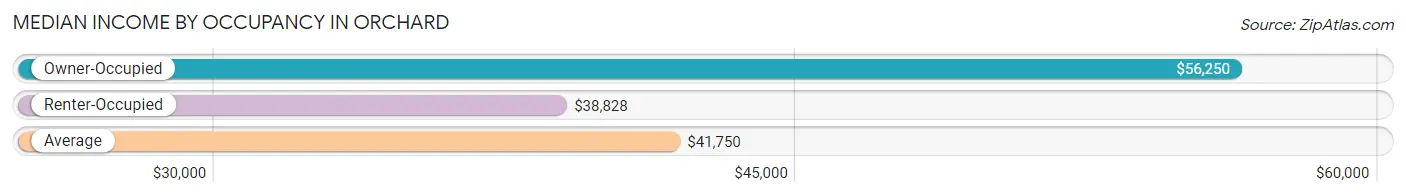
| Occupancy Type | # Households | Median Income |
| Owner-Occupied | 58 (56.3%) | $56,250 |
| Renter-Occupied | 45 (43.7%) | $38,828 |
| Average | 103 (100.0%) | $41,750 |
Occupancy by Householder Income Bracket in Orchard
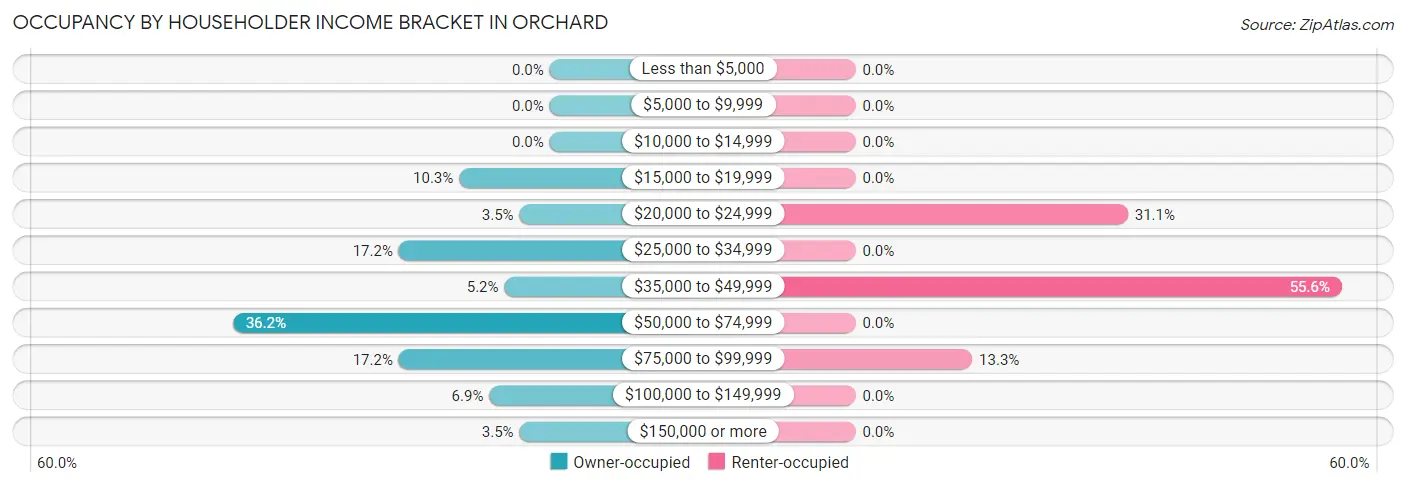
| Income Bracket | Owner-occupied | Renter-occupied |
| Less than $5,000 | 0 (0.0%) | 0 (0.0%) |
| $5,000 to $9,999 | 0 (0.0%) | 0 (0.0%) |
| $10,000 to $14,999 | 0 (0.0%) | 0 (0.0%) |
| $15,000 to $19,999 | 6 (10.3%) | 0 (0.0%) |
| $20,000 to $24,999 | 2 (3.5%) | 14 (31.1%) |
| $25,000 to $34,999 | 10 (17.2%) | 0 (0.0%) |
| $35,000 to $49,999 | 3 (5.2%) | 25 (55.6%) |
| $50,000 to $74,999 | 21 (36.2%) | 0 (0.0%) |
| $75,000 to $99,999 | 10 (17.2%) | 6 (13.3%) |
| $100,000 to $149,999 | 4 (6.9%) | 0 (0.0%) |
| $150,000 or more | 2 (3.5%) | 0 (0.0%) |
| Total | 58 (100.0%) | 45 (100.0%) |
Monthly Housing Cost Tiers in Orchard
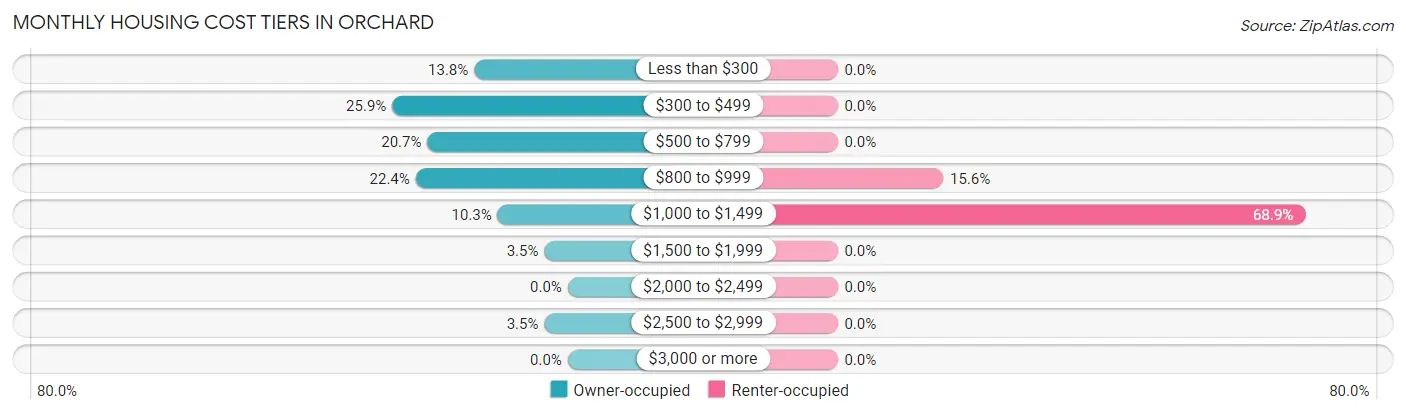
| Monthly Cost | Owner-occupied | Renter-occupied |
| Less than $300 | 8 (13.8%) | 0 (0.0%) |
| $300 to $499 | 15 (25.9%) | 0 (0.0%) |
| $500 to $799 | 12 (20.7%) | 0 (0.0%) |
| $800 to $999 | 13 (22.4%) | 7 (15.6%) |
| $1,000 to $1,499 | 6 (10.3%) | 31 (68.9%) |
| $1,500 to $1,999 | 2 (3.5%) | 0 (0.0%) |
| $2,000 to $2,499 | 0 (0.0%) | 0 (0.0%) |
| $2,500 to $2,999 | 2 (3.5%) | 0 (0.0%) |
| $3,000 or more | 0 (0.0%) | 0 (0.0%) |
| Total | 58 (100.0%) | 45 (100.0%) |
Physical Housing Characteristics in Orchard
Housing Structures in Orchard
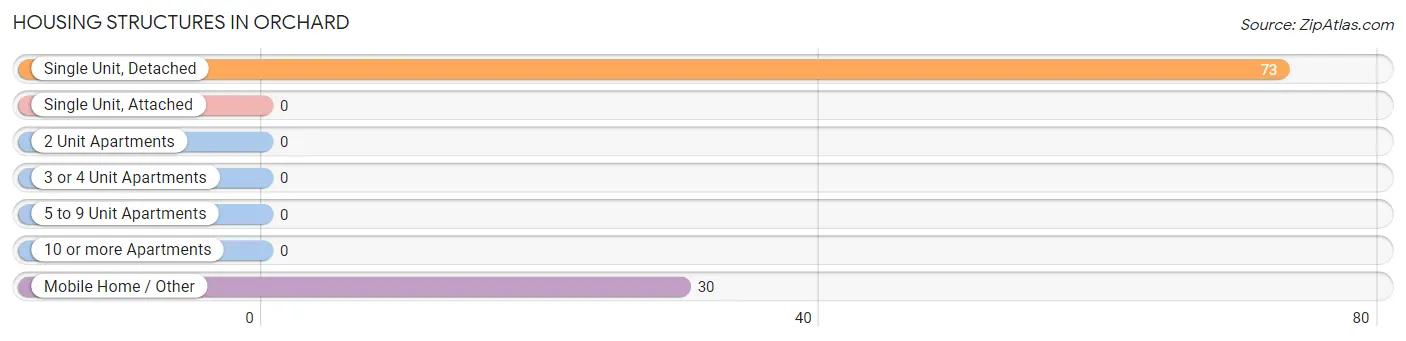
| Structure Type | # Housing Units | % Housing Units |
| Single Unit, Detached | 73 | 70.9% |
| Single Unit, Attached | 0 | 0.0% |
| 2 Unit Apartments | 0 | 0.0% |
| 3 or 4 Unit Apartments | 0 | 0.0% |
| 5 to 9 Unit Apartments | 0 | 0.0% |
| 10 or more Apartments | 0 | 0.0% |
| Mobile Home / Other | 30 | 29.1% |
| Total | 103 | 100.0% |
Housing Structures by Occupancy in Orchard
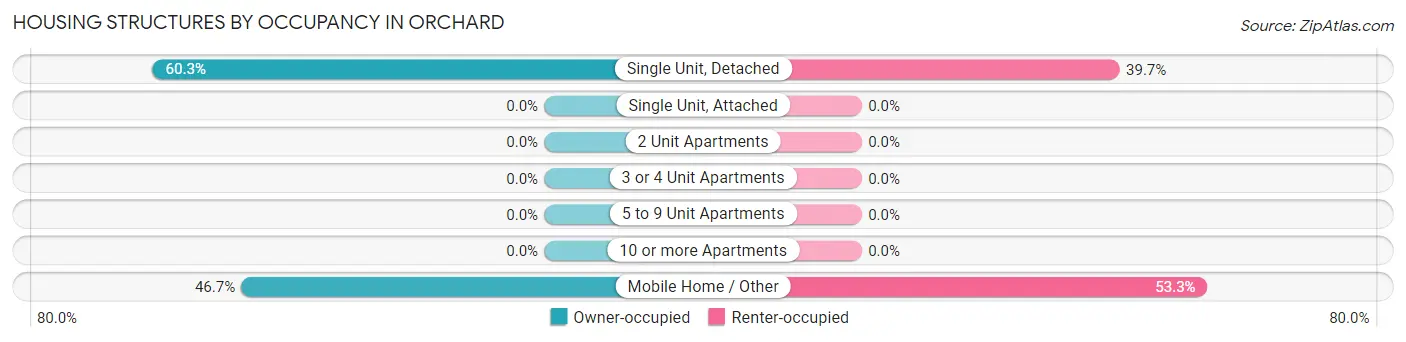
| Structure Type | Owner-occupied | Renter-occupied |
| Single Unit, Detached | 44 (60.3%) | 29 (39.7%) |
| Single Unit, Attached | 0 (0.0%) | 0 (0.0%) |
| 2 Unit Apartments | 0 (0.0%) | 0 (0.0%) |
| 3 or 4 Unit Apartments | 0 (0.0%) | 0 (0.0%) |
| 5 to 9 Unit Apartments | 0 (0.0%) | 0 (0.0%) |
| 10 or more Apartments | 0 (0.0%) | 0 (0.0%) |
| Mobile Home / Other | 14 (46.7%) | 16 (53.3%) |
| Total | 58 (56.3%) | 45 (43.7%) |
Housing Structures by Number of Rooms in Orchard
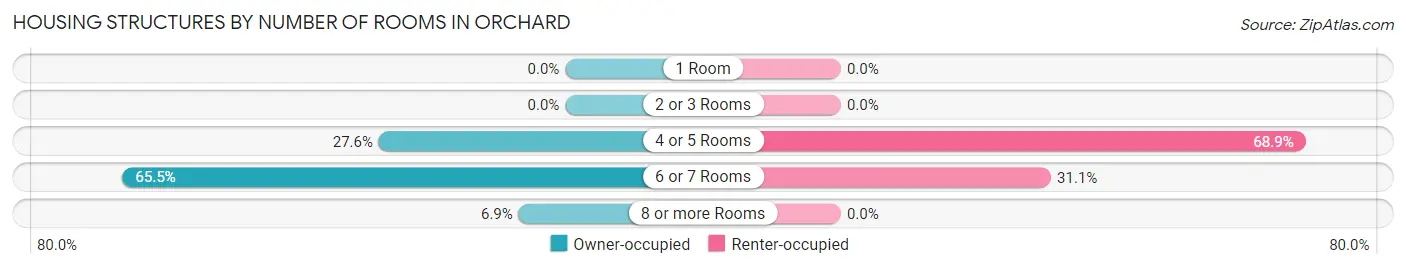
| Number of Rooms | Owner-occupied | Renter-occupied |
| 1 Room | 0 (0.0%) | 0 (0.0%) |
| 2 or 3 Rooms | 0 (0.0%) | 0 (0.0%) |
| 4 or 5 Rooms | 16 (27.6%) | 31 (68.9%) |
| 6 or 7 Rooms | 38 (65.5%) | 14 (31.1%) |
| 8 or more Rooms | 4 (6.9%) | 0 (0.0%) |
| Total | 58 (100.0%) | 45 (100.0%) |
Housing Structure by Heating Type in Orchard
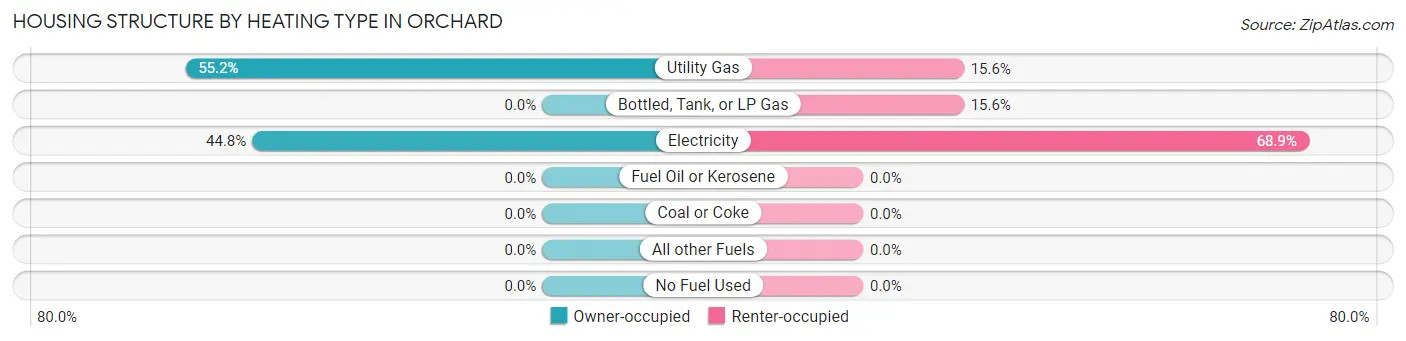
| Heating Type | Owner-occupied | Renter-occupied |
| Utility Gas | 32 (55.2%) | 7 (15.6%) |
| Bottled, Tank, or LP Gas | 0 (0.0%) | 7 (15.6%) |
| Electricity | 26 (44.8%) | 31 (68.9%) |
| Fuel Oil or Kerosene | 0 (0.0%) | 0 (0.0%) |
| Coal or Coke | 0 (0.0%) | 0 (0.0%) |
| All other Fuels | 0 (0.0%) | 0 (0.0%) |
| No Fuel Used | 0 (0.0%) | 0 (0.0%) |
| Total | 58 (100.0%) | 45 (100.0%) |
Household Vehicle Usage in Orchard
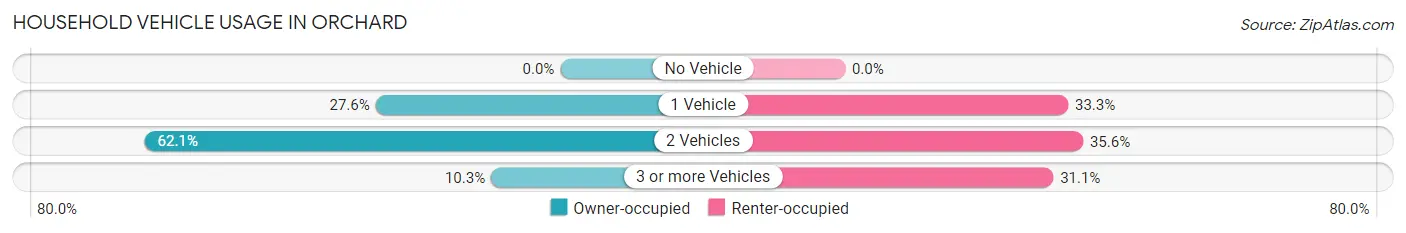
| Vehicles per Household | Owner-occupied | Renter-occupied |
| No Vehicle | 0 (0.0%) | 0 (0.0%) |
| 1 Vehicle | 16 (27.6%) | 15 (33.3%) |
| 2 Vehicles | 36 (62.1%) | 16 (35.6%) |
| 3 or more Vehicles | 6 (10.3%) | 14 (31.1%) |
| Total | 58 (100.0%) | 45 (100.0%) |
Real Estate & Mortgages in Orchard
Real Estate and Mortgage Overview in Orchard
| Characteristic | Without Mortgage | With Mortgage |
| Housing Units | 27 | 31 |
| Median Property Value | $102,100 | $203,100 |
| Median Household Income | - | - |
| Monthly Housing Costs | $363 | $0 |
| Real Estate Taxes | $1,542 | $0 |
Property Value by Mortgage Status in Orchard
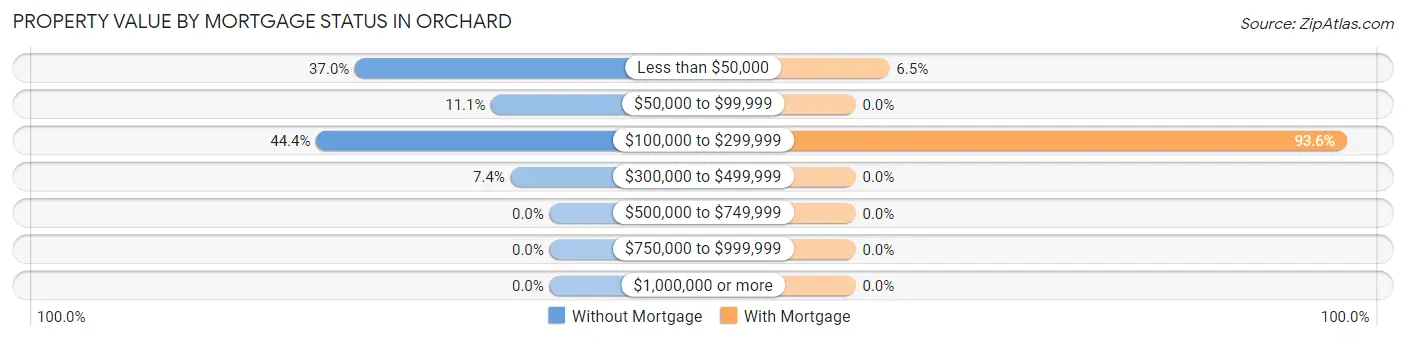
| Property Value | Without Mortgage | With Mortgage |
| Less than $50,000 | 10 (37.0%) | 2 (6.5%) |
| $50,000 to $99,999 | 3 (11.1%) | 0 (0.0%) |
| $100,000 to $299,999 | 12 (44.4%) | 29 (93.5%) |
| $300,000 to $499,999 | 2 (7.4%) | 0 (0.0%) |
| $500,000 to $749,999 | 0 (0.0%) | 0 (0.0%) |
| $750,000 to $999,999 | 0 (0.0%) | 0 (0.0%) |
| $1,000,000 or more | 0 (0.0%) | 0 (0.0%) |
| Total | 27 (100.0%) | 31 (100.0%) |
Household Income by Mortgage Status in Orchard
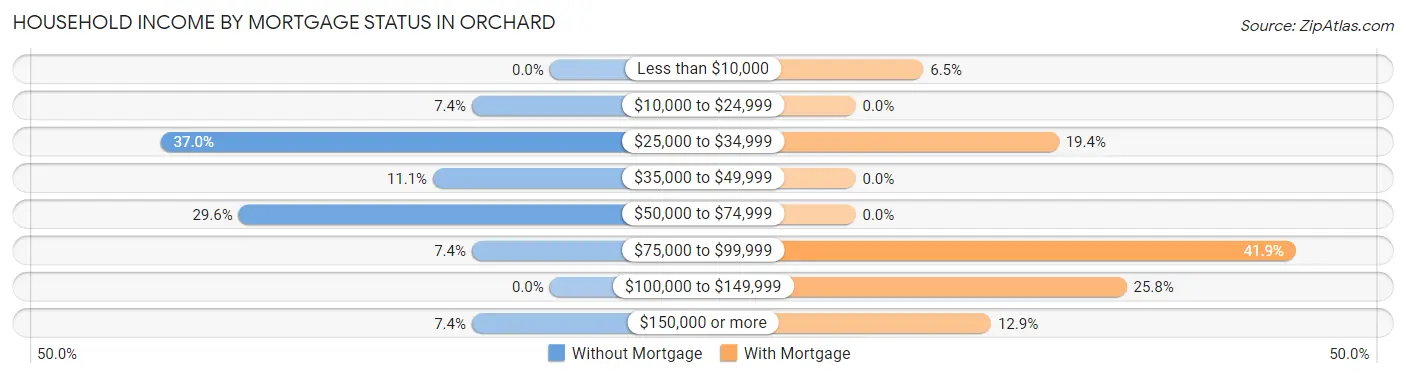
| Household Income | Without Mortgage | With Mortgage |
| Less than $10,000 | 0 (0.0%) | 2 (6.5%) |
| $10,000 to $24,999 | 2 (7.4%) | 0 (0.0%) |
| $25,000 to $34,999 | 10 (37.0%) | 6 (19.4%) |
| $35,000 to $49,999 | 3 (11.1%) | 0 (0.0%) |
| $50,000 to $74,999 | 8 (29.6%) | 0 (0.0%) |
| $75,000 to $99,999 | 2 (7.4%) | 13 (41.9%) |
| $100,000 to $149,999 | 0 (0.0%) | 8 (25.8%) |
| $150,000 or more | 2 (7.4%) | 4 (12.9%) |
| Total | 27 (100.0%) | 31 (100.0%) |
Property Value to Household Income Ratio in Orchard
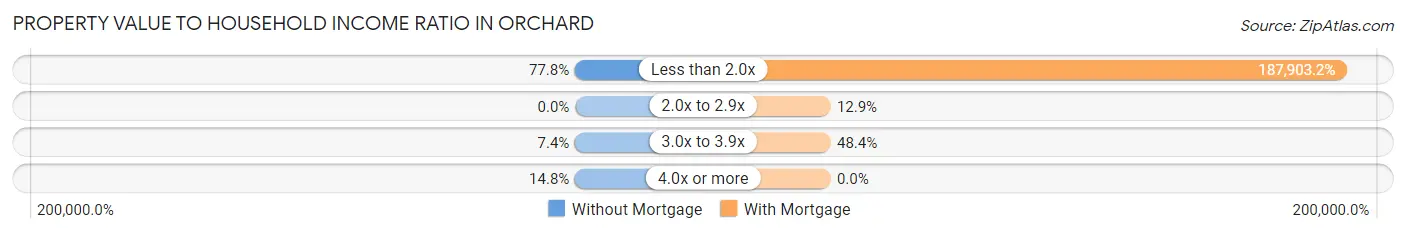
| Value-to-Income Ratio | Without Mortgage | With Mortgage |
| Less than 2.0x | 21 (77.8%) | 58,250 (187,903.2%) |
| 2.0x to 2.9x | 0 (0.0%) | 4 (12.9%) |
| 3.0x to 3.9x | 2 (7.4%) | 15 (48.4%) |
| 4.0x or more | 4 (14.8%) | 0 (0.0%) |
| Total | 27 (100.0%) | 31 (100.0%) |
Real Estate Taxes by Mortgage Status in Orchard
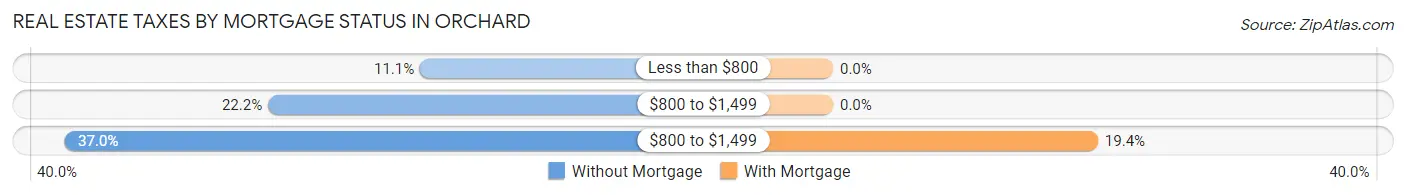
| Property Taxes | Without Mortgage | With Mortgage |
| Less than $800 | 3 (11.1%) | 0 (0.0%) |
| $800 to $1,499 | 6 (22.2%) | 0 (0.0%) |
| $800 to $1,499 | 10 (37.0%) | 6 (19.4%) |
| Total | 27 (100.0%) | 31 (100.0%) |
Health & Disability in Orchard
Health Insurance Coverage by Age in Orchard
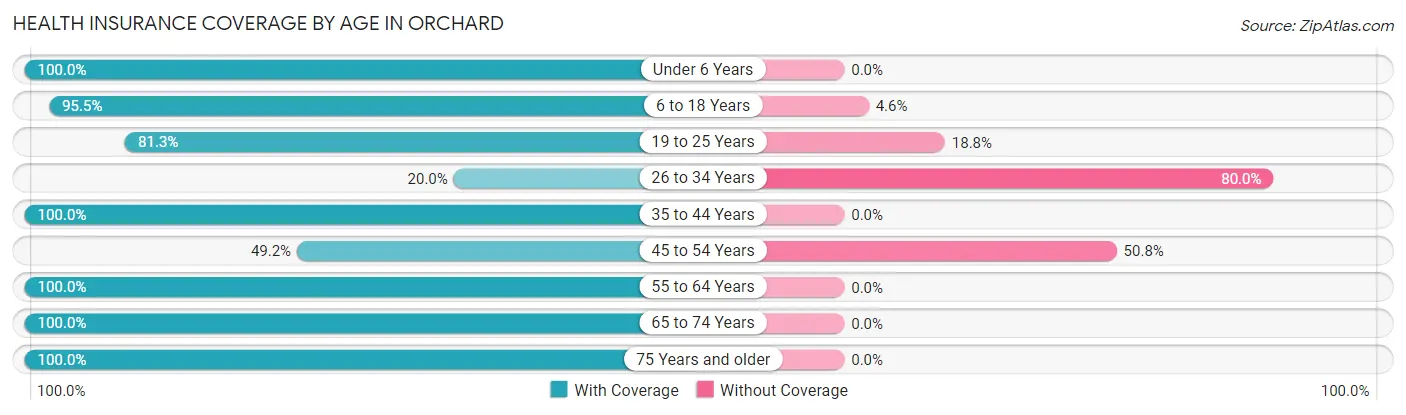
| Age Bracket | With Coverage | Without Coverage |
| Under 6 Years | 9 (100.0%) | 0 (0.0%) |
| 6 to 18 Years | 42 (95.5%) | 2 (4.5%) |
| 19 to 25 Years | 13 (81.2%) | 3 (18.8%) |
| 26 to 34 Years | 2 (20.0%) | 8 (80.0%) |
| 35 to 44 Years | 9 (100.0%) | 0 (0.0%) |
| 45 to 54 Years | 31 (49.2%) | 32 (50.8%) |
| 55 to 64 Years | 16 (100.0%) | 0 (0.0%) |
| 65 to 74 Years | 59 (100.0%) | 0 (0.0%) |
| 75 Years and older | 22 (100.0%) | 0 (0.0%) |
| Total | 203 (81.9%) | 45 (18.1%) |
Health Insurance Coverage by Citizenship Status in Orchard
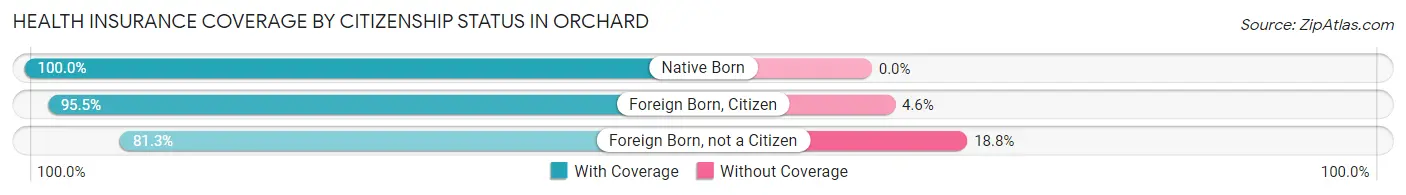
| Citizenship Status | With Coverage | Without Coverage |
| Native Born | 9 (100.0%) | 0 (0.0%) |
| Foreign Born, Citizen | 42 (95.5%) | 2 (4.5%) |
| Foreign Born, not a Citizen | 13 (81.2%) | 3 (18.8%) |
Health Insurance Coverage by Household Income in Orchard
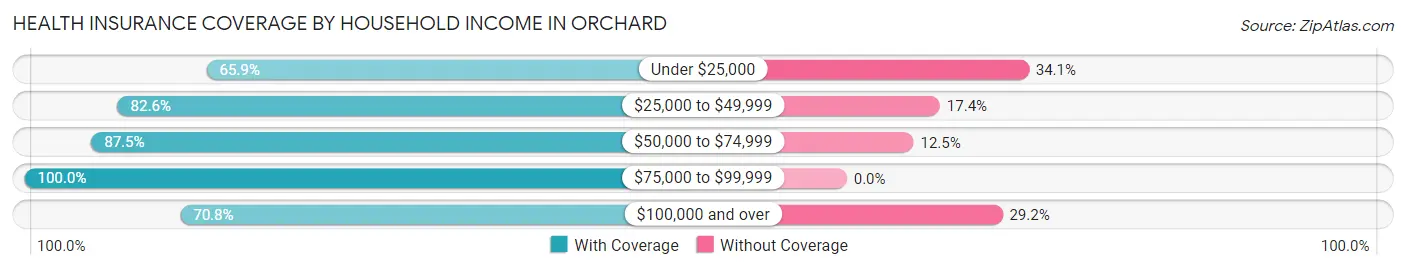
| Household Income | With Coverage | Without Coverage |
| Under $25,000 | 29 (65.9%) | 15 (34.1%) |
| $25,000 to $49,999 | 71 (82.6%) | 15 (17.4%) |
| $50,000 to $74,999 | 56 (87.5%) | 8 (12.5%) |
| $75,000 to $99,999 | 30 (100.0%) | 0 (0.0%) |
| $100,000 and over | 17 (70.8%) | 7 (29.2%) |
Public vs Private Health Insurance Coverage by Age in Orchard
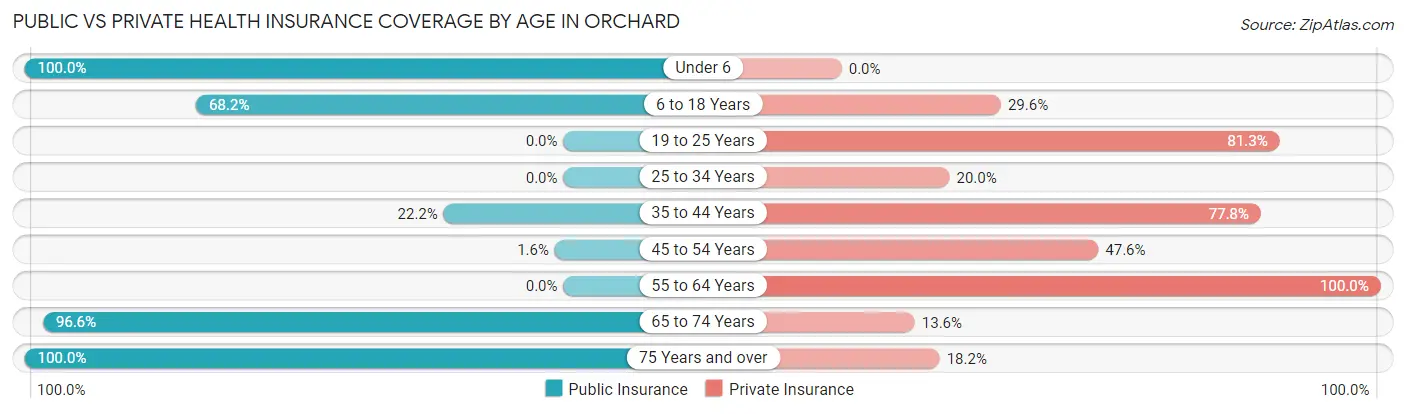
| Age Bracket | Public Insurance | Private Insurance |
| Under 6 | 9 (100.0%) | 0 (0.0%) |
| 6 to 18 Years | 30 (68.2%) | 13 (29.5%) |
| 19 to 25 Years | 0 (0.0%) | 13 (81.2%) |
| 25 to 34 Years | 0 (0.0%) | 2 (20.0%) |
| 35 to 44 Years | 2 (22.2%) | 7 (77.8%) |
| 45 to 54 Years | 1 (1.6%) | 30 (47.6%) |
| 55 to 64 Years | 0 (0.0%) | 16 (100.0%) |
| 65 to 74 Years | 57 (96.6%) | 8 (13.6%) |
| 75 Years and over | 22 (100.0%) | 4 (18.2%) |
| Total | 121 (48.8%) | 93 (37.5%) |
Disability Status by Sex by Age in Orchard
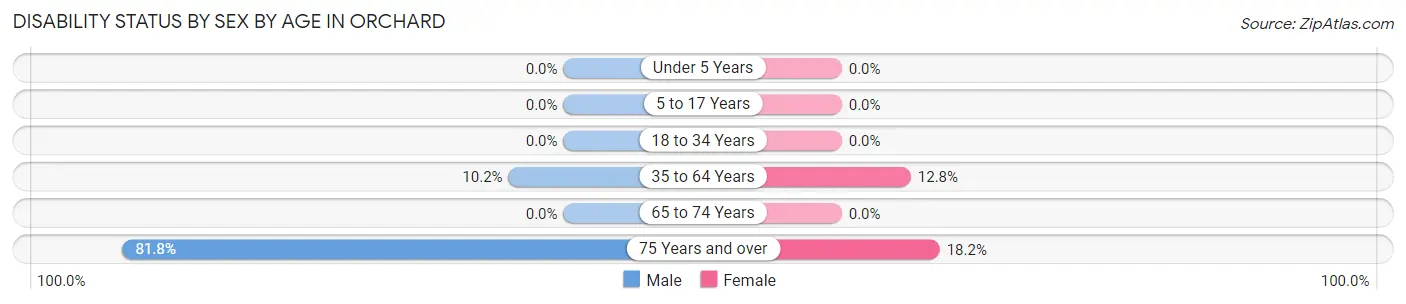
| Age Bracket | Male | Female |
| Under 5 Years | 0 (0.0%) | 0 (0.0%) |
| 5 to 17 Years | 0 (0.0%) | 0 (0.0%) |
| 18 to 34 Years | 0 (0.0%) | 0 (0.0%) |
| 35 to 64 Years | 5 (10.2%) | 5 (12.8%) |
| 65 to 74 Years | 0 (0.0%) | 0 (0.0%) |
| 75 Years and over | 9 (81.8%) | 2 (18.2%) |
Disability Class by Sex by Age in Orchard
Disability Class: Hearing Difficulty
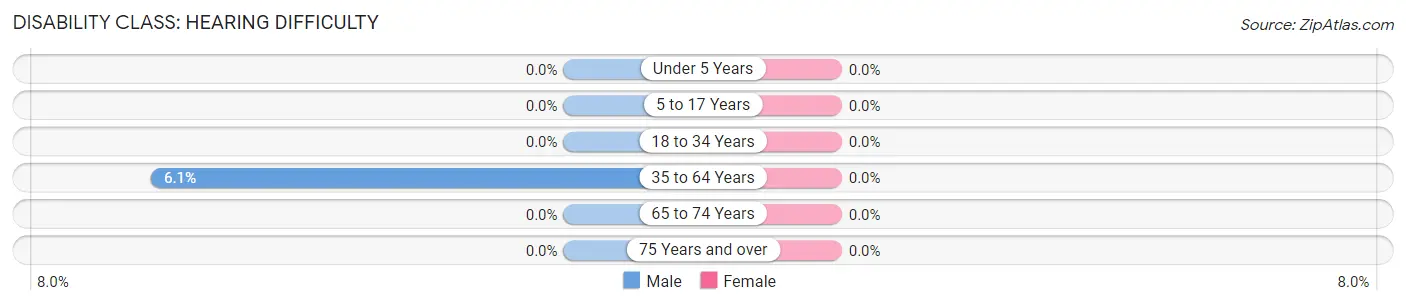
| Age Bracket | Male | Female |
| Under 5 Years | 0 (0.0%) | 0 (0.0%) |
| 5 to 17 Years | 0 (0.0%) | 0 (0.0%) |
| 18 to 34 Years | 0 (0.0%) | 0 (0.0%) |
| 35 to 64 Years | 3 (6.1%) | 0 (0.0%) |
| 65 to 74 Years | 0 (0.0%) | 0 (0.0%) |
| 75 Years and over | 0 (0.0%) | 0 (0.0%) |
Disability Class: Vision Difficulty
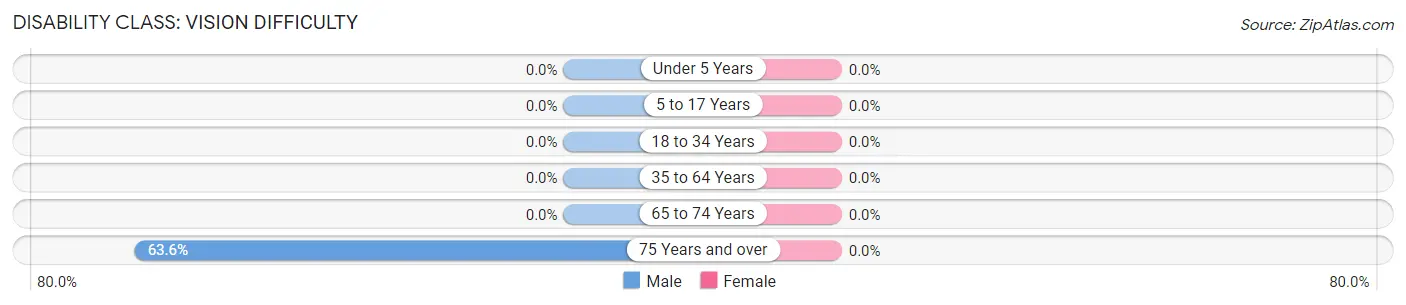
| Age Bracket | Male | Female |
| Under 5 Years | 0 (0.0%) | 0 (0.0%) |
| 5 to 17 Years | 0 (0.0%) | 0 (0.0%) |
| 18 to 34 Years | 0 (0.0%) | 0 (0.0%) |
| 35 to 64 Years | 0 (0.0%) | 0 (0.0%) |
| 65 to 74 Years | 0 (0.0%) | 0 (0.0%) |
| 75 Years and over | 7 (63.6%) | 0 (0.0%) |
Disability Class: Cognitive Difficulty
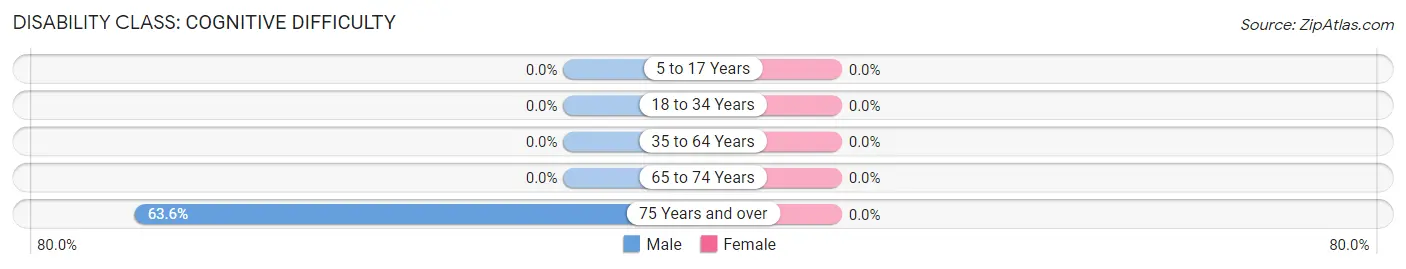
| Age Bracket | Male | Female |
| 5 to 17 Years | 0 (0.0%) | 0 (0.0%) |
| 18 to 34 Years | 0 (0.0%) | 0 (0.0%) |
| 35 to 64 Years | 0 (0.0%) | 0 (0.0%) |
| 65 to 74 Years | 0 (0.0%) | 0 (0.0%) |
| 75 Years and over | 7 (63.6%) | 0 (0.0%) |
Disability Class: Ambulatory Difficulty
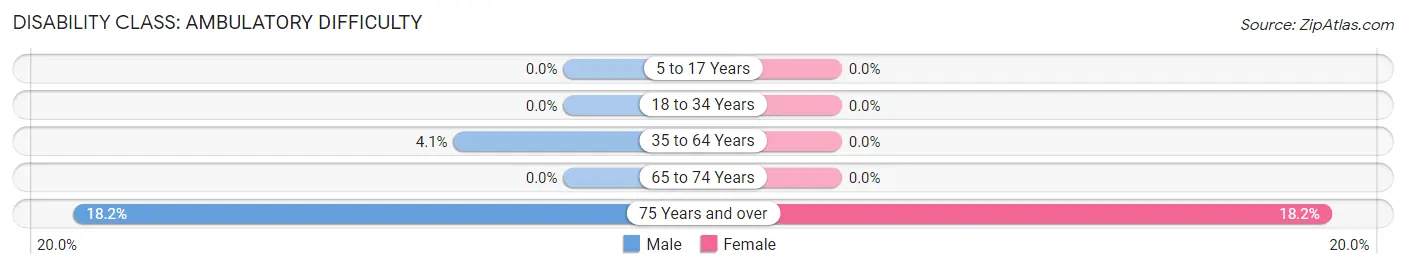
| Age Bracket | Male | Female |
| 5 to 17 Years | 0 (0.0%) | 0 (0.0%) |
| 18 to 34 Years | 0 (0.0%) | 0 (0.0%) |
| 35 to 64 Years | 2 (4.1%) | 0 (0.0%) |
| 65 to 74 Years | 0 (0.0%) | 0 (0.0%) |
| 75 Years and over | 2 (18.2%) | 2 (18.2%) |
Disability Class: Self-Care Difficulty
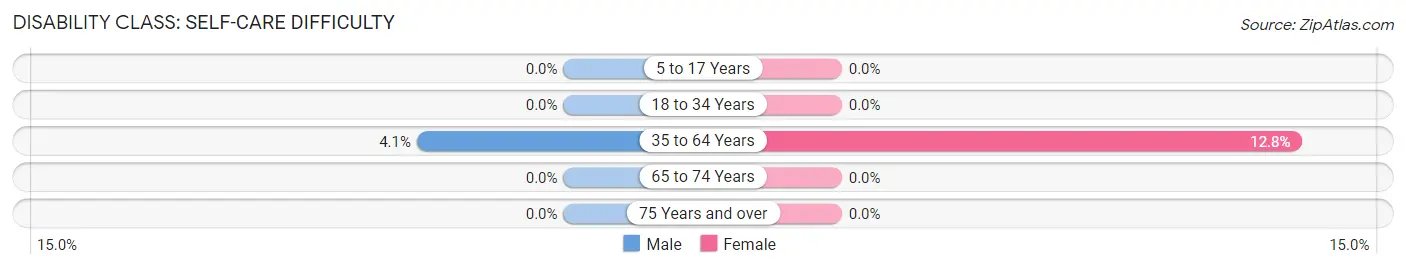
| Age Bracket | Male | Female |
| 5 to 17 Years | 0 (0.0%) | 0 (0.0%) |
| 18 to 34 Years | 0 (0.0%) | 0 (0.0%) |
| 35 to 64 Years | 2 (4.1%) | 5 (12.8%) |
| 65 to 74 Years | 0 (0.0%) | 0 (0.0%) |
| 75 Years and over | 0 (0.0%) | 0 (0.0%) |
Technology Access in Orchard
Computing Device Access in Orchard
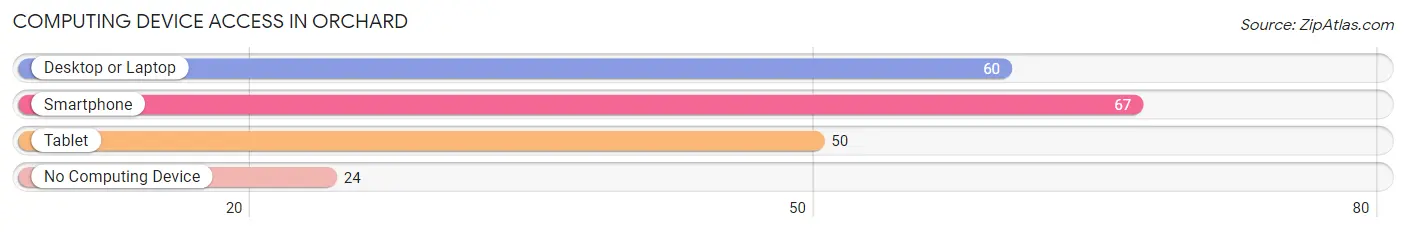
| Device Type | # Households | % Households |
| Desktop or Laptop | 60 | 58.3% |
| Smartphone | 67 | 65.0% |
| Tablet | 50 | 48.5% |
| No Computing Device | 24 | 23.3% |
| Total | 103 | 100.0% |
Internet Access in Orchard
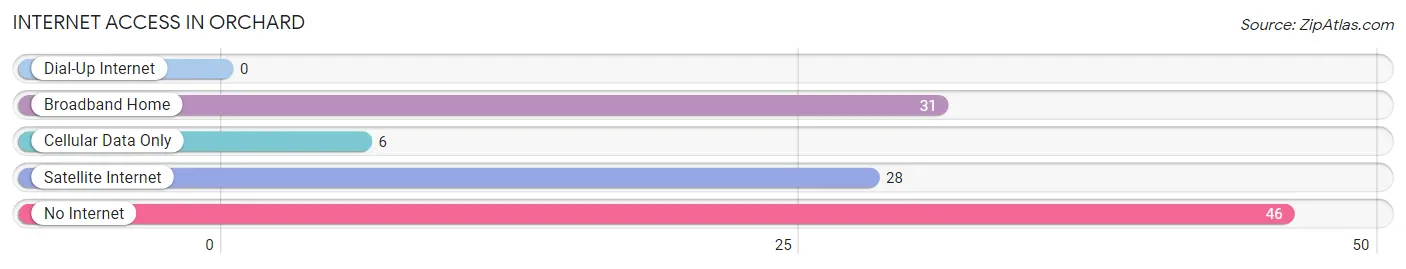
| Internet Type | # Households | % Households |
| Dial-Up Internet | 0 | 0.0% |
| Broadband Home | 31 | 30.1% |
| Cellular Data Only | 6 | 5.8% |
| Satellite Internet | 28 | 27.2% |
| No Internet | 46 | 44.7% |
| Total | 103 | 100.0% |
Orchard Summary
Orchard, Texas is a small town located in the southeastern corner of Texas, in the county of Nueces. It is situated on the Gulf Coast, approximately 30 miles south of Corpus Christi. The town has a population of approximately 1,500 people, and is known for its rural charm and friendly atmosphere.
History
The area that is now Orchard, Texas was first settled in the late 1800s by a group of German immigrants. The town was originally called “New Berlin”, and was founded in 1883. The town was renamed Orchard in 1891, after the abundance of fruit trees in the area.
The town grew slowly, but steadily, over the years. In the early 1900s, the town was home to a number of businesses, including a general store, a blacksmith shop, and a cotton gin. The town also had a post office, which opened in 1906.
In the 1920s, the town began to experience a period of growth. The population increased from around 500 people in 1920 to over 1,000 by 1930. This growth was largely due to the discovery of oil in the area. The oil boom brought a number of new businesses to the town, including a bank, a hotel, and a movie theater.
The town continued to grow throughout the mid-20th century. In the 1950s, the town was home to a number of businesses, including a grocery store, a hardware store, and a pharmacy. The town also had a number of churches, including a Catholic church, a Methodist church, and a Baptist church.
Geography
Orchard, Texas is located in the southeastern corner of Texas, in the county of Nueces. The town is situated on the Gulf Coast, approximately 30 miles south of Corpus Christi. The town is located on the banks of the Nueces River, and is surrounded by a number of small lakes and ponds.
The town is located in a flat, coastal plain, and is characterized by sandy soil and low-lying vegetation. The climate in the area is generally warm and humid, with temperatures ranging from the mid-60s in the winter to the mid-90s in the summer.
Economy
The economy of Orchard, Texas is largely based on agriculture and tourism. The town is home to a number of farms, which produce a variety of crops, including cotton, corn, and soybeans. The town is also home to a number of tourist attractions, including a number of beaches, a state park, and a wildlife refuge.
The town is also home to a number of businesses, including a grocery store, a hardware store, and a pharmacy. The town also has a number of restaurants, including a Mexican restaurant, a seafood restaurant, and a steakhouse.
Demographics
As of the 2010 census, the population of Orchard, Texas was 1,500 people. The town is predominantly white, with approximately 85% of the population identifying as white. The town is also home to a small Hispanic population, with approximately 10% of the population identifying as Hispanic. The town is also home to a small African American population, with approximately 5% of the population identifying as African American.
The median household income in Orchard, Texas is approximately $35,000, and the median home value is approximately $90,000. The town has a low unemployment rate, with approximately 4% of the population unemployed. The town also has a low poverty rate, with approximately 10% of the population living below the poverty line.
Common Questions
What is Per Capita Income in Orchard?
Per Capita income in Orchard is $21,058.
What is the Median Family Income in Orchard?
Median Family Income in Orchard is $51,250.
What is the Median Household income in Orchard?
Median Household Income in Orchard is $41,750.
What is Income or Wage Gap in Orchard?
Income or Wage Gap in Orchard is 36.1%.
Women in Orchard earn 63.9 cents for every dollar earned by a man.
What is Inequality or Gini Index in Orchard?
Inequality or Gini Index in Orchard is 0.31.
What is the Total Population of Orchard?
Total Population of Orchard is 248.
What is the Total Male Population of Orchard?
Total Male Population of Orchard is 104.
What is the Total Female Population of Orchard?
Total Female Population of Orchard is 144.
What is the Ratio of Males per 100 Females in Orchard?
There are 72.22 Males per 100 Females in Orchard.
What is the Ratio of Females per 100 Males in Orchard?
There are 138.46 Females per 100 Males in Orchard.
What is the Median Population Age in Orchard?
Median Population Age in Orchard is 49.2 Years.
What is the Average Family Size in Orchard
Average Family Size in Orchard is 3.0 People.
What is the Average Household Size in Orchard
Average Household Size in Orchard is 2.4 People.
How Large is the Labor Force in Orchard?
There are 88 People in the Labor Forcein in Orchard.
What is the Percentage of People in the Labor Force in Orchard?
43.6% of People are in the Labor Force in Orchard.