Onalaska, TX Map & Demographics
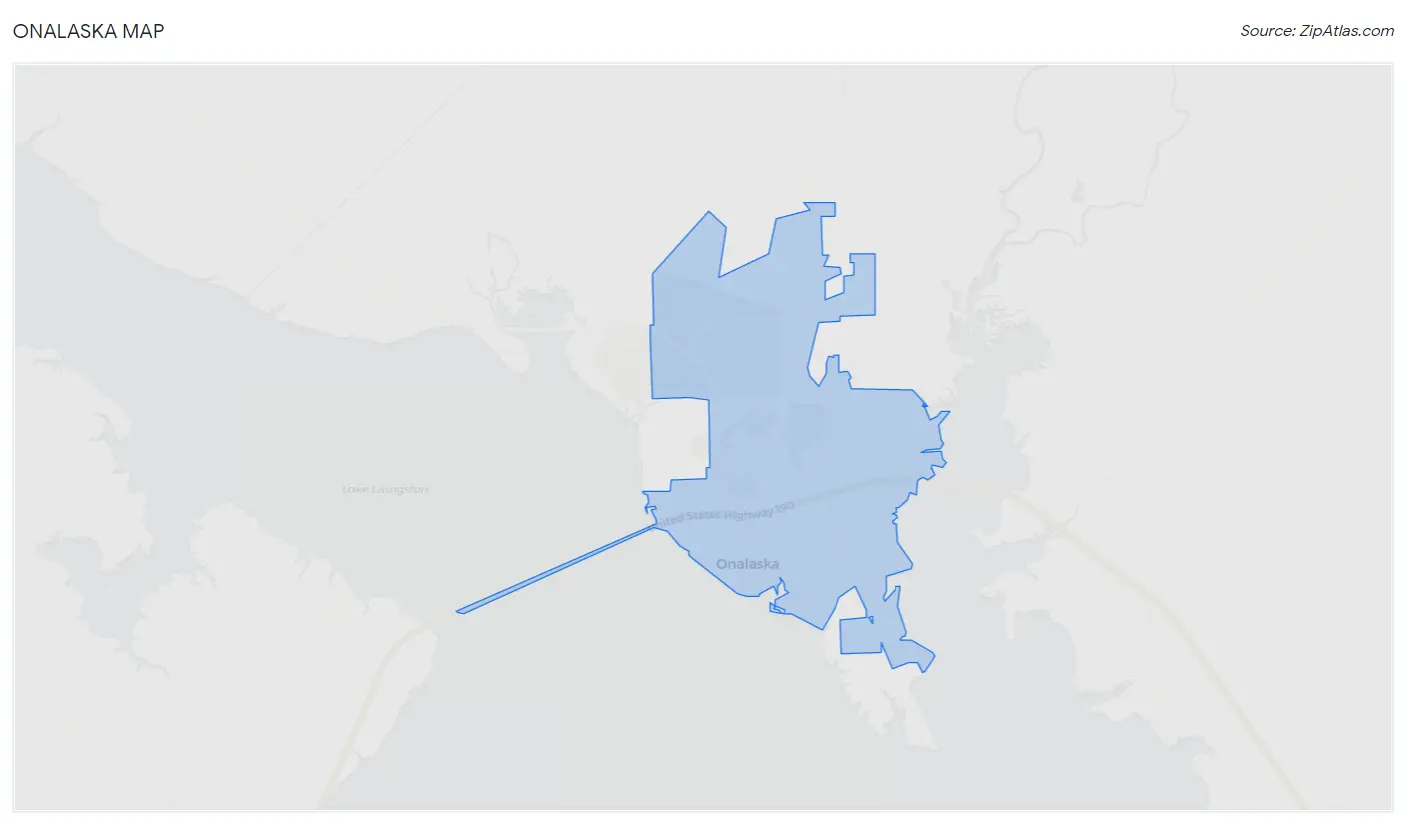
Onalaska Map
Onalaska Overview
$25,470
PER CAPITA INCOME
$66,484
AVG FAMILY INCOME
$56,168
AVG HOUSEHOLD INCOME
83.1%
WAGE / INCOME GAP [ % ]
16.9¢/ $1
WAGE / INCOME GAP [ $ ]
0.43
INEQUALITY / GINI INDEX
3,050
TOTAL POPULATION
1,355
MALE POPULATION
1,695
FEMALE POPULATION
79.94
MALES / 100 FEMALES
125.09
FEMALES / 100 MALES
45.2
MEDIAN AGE
3.1
AVG FAMILY SIZE
2.5
AVG HOUSEHOLD SIZE
1,277
LABOR FORCE [ PEOPLE ]
57.2%
PERCENT IN LABOR FORCE
9.5%
UNEMPLOYMENT RATE
Onalaska Zip Codes
Onalaska Area Codes
Income in Onalaska
Income Overview in Onalaska
Per Capita Income in Onalaska is $25,470, while median incomes of families and households are $66,484 and $56,168 respectively.
| Characteristic | Number | Measure |
| Per Capita Income | 3,050 | $25,470 |
| Median Family Income | 746 | $66,484 |
| Mean Family Income | 746 | $77,407 |
| Median Household Income | 1,220 | $56,168 |
| Mean Household Income | 1,220 | $61,854 |
| Income Deficit | 746 | $0 |
| Wage / Income Gap (%) | 3,050 | 83.09% |
| Wage / Income Gap ($) | 3,050 | 16.91¢ per $1 |
| Gini / Inequality Index | 3,050 | 0.43 |
Earnings by Sex in Onalaska
Average Earnings in Onalaska are $24,854, $63,182 for men and $10,681 for women, a difference of 83.1%.
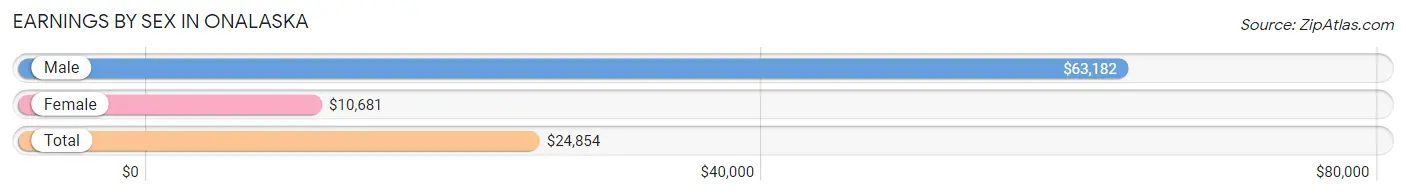
| Sex | Number | Average Earnings |
| Male | 810 (56.0%) | $63,182 |
| Female | 637 (44.0%) | $10,681 |
| Total | 1,447 (100.0%) | $24,854 |
Earnings by Sex by Income Bracket in Onalaska
The most common earnings brackets in Onalaska are $100,000+ for men (179 | 22.1%) and $2,499 or less for women (164 | 25.8%).
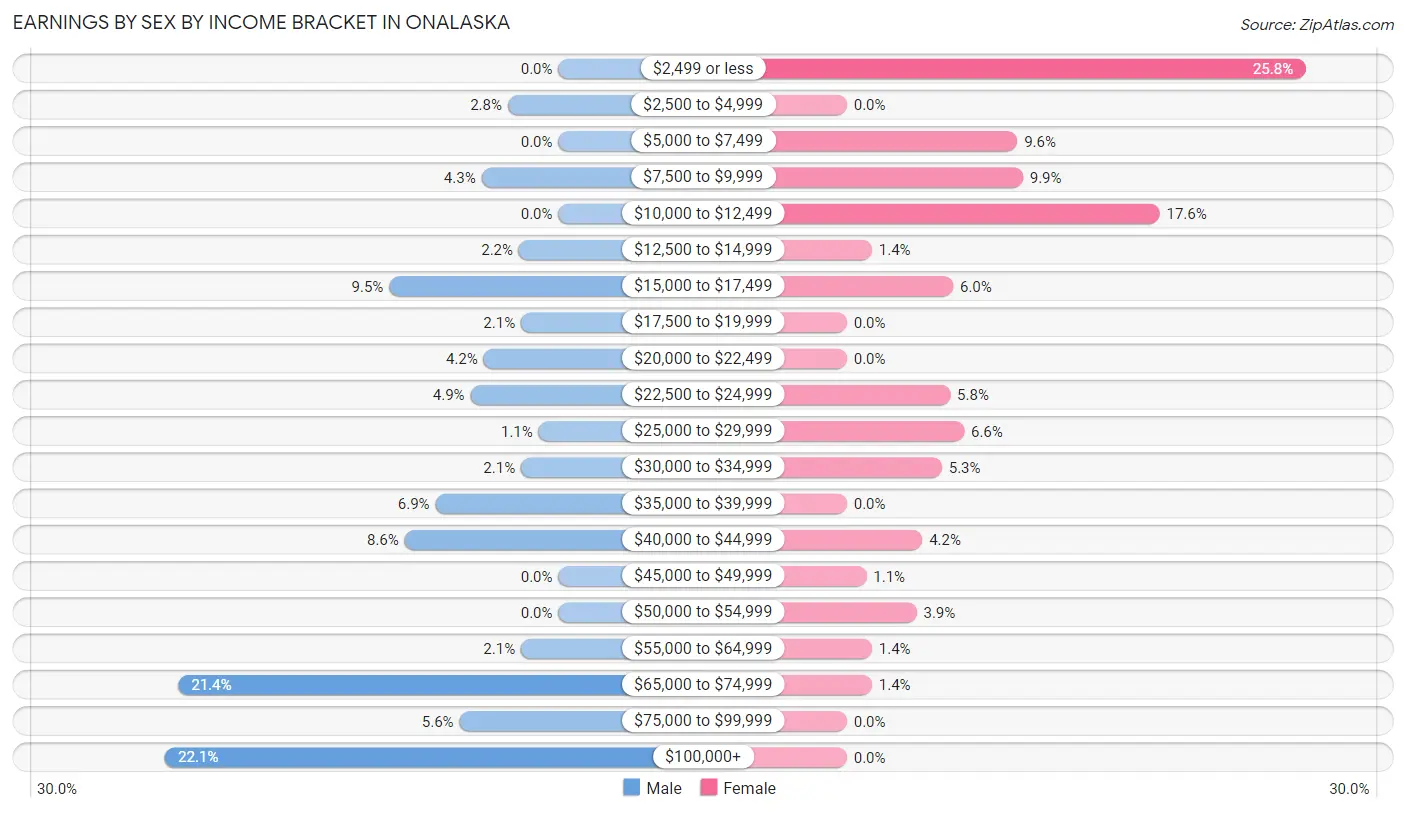
| Income | Male | Female |
| $2,499 or less | 0 (0.0%) | 164 (25.8%) |
| $2,500 to $4,999 | 23 (2.8%) | 0 (0.0%) |
| $5,000 to $7,499 | 0 (0.0%) | 61 (9.6%) |
| $7,500 to $9,999 | 35 (4.3%) | 63 (9.9%) |
| $10,000 to $12,499 | 0 (0.0%) | 112 (17.6%) |
| $12,500 to $14,999 | 18 (2.2%) | 9 (1.4%) |
| $15,000 to $17,499 | 77 (9.5%) | 38 (6.0%) |
| $17,500 to $19,999 | 17 (2.1%) | 0 (0.0%) |
| $20,000 to $22,499 | 34 (4.2%) | 0 (0.0%) |
| $22,500 to $24,999 | 40 (4.9%) | 37 (5.8%) |
| $25,000 to $29,999 | 9 (1.1%) | 42 (6.6%) |
| $30,000 to $34,999 | 17 (2.1%) | 34 (5.3%) |
| $35,000 to $39,999 | 56 (6.9%) | 0 (0.0%) |
| $40,000 to $44,999 | 70 (8.6%) | 27 (4.2%) |
| $45,000 to $49,999 | 0 (0.0%) | 7 (1.1%) |
| $50,000 to $54,999 | 0 (0.0%) | 25 (3.9%) |
| $55,000 to $64,999 | 17 (2.1%) | 9 (1.4%) |
| $65,000 to $74,999 | 173 (21.4%) | 9 (1.4%) |
| $75,000 to $99,999 | 45 (5.6%) | 0 (0.0%) |
| $100,000+ | 179 (22.1%) | 0 (0.0%) |
| Total | 810 (100.0%) | 637 (100.0%) |
Earnings by Sex by Educational Attainment in Onalaska
Average earnings in Onalaska are $44,893 for men and $10,888 for women, a difference of 75.7%. Men with an educational attainment of high school diploma enjoy the highest average annual earnings of $67,778, while those with college or associate's degree education earn the least with $65,457. Women with an educational attainment of high school diploma earn the most with the average annual earnings of $21,250, while those with less than high school education have the smallest earnings of $10,395.
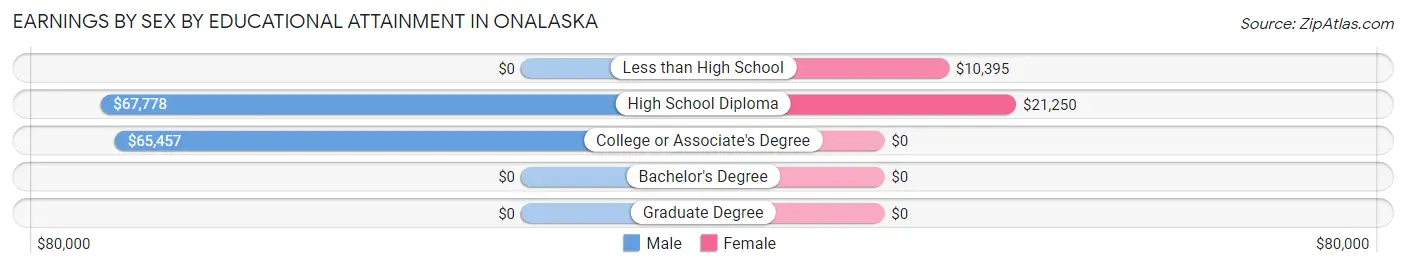
| Educational Attainment | Male Income | Female Income |
| Less than High School | - | - |
| High School Diploma | $67,778 | $21,250 |
| College or Associate's Degree | $65,457 | $0 |
| Bachelor's Degree | - | - |
| Graduate Degree | - | - |
| Total | $44,893 | $10,888 |
Family Income in Onalaska
Family Income Brackets in Onalaska
According to the Onalaska family income data, there are 278 families falling into the $50,000 to $74,999 income range, which is the most common income bracket and makes up 37.3% of all families.
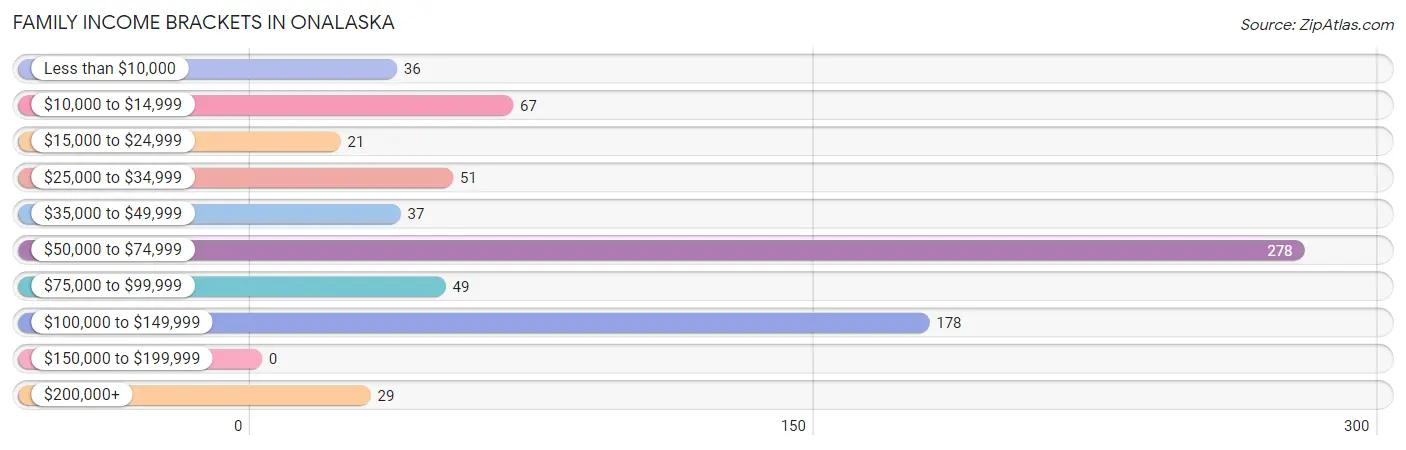
| Income Bracket | # Families | % Families |
| Less than $10,000 | 36 | 4.8% |
| $10,000 to $14,999 | 67 | 9.0% |
| $15,000 to $24,999 | 21 | 2.8% |
| $25,000 to $34,999 | 51 | 6.8% |
| $35,000 to $49,999 | 37 | 5.0% |
| $50,000 to $74,999 | 278 | 37.3% |
| $75,000 to $99,999 | 49 | 6.6% |
| $100,000 to $149,999 | 178 | 23.9% |
| $150,000 to $199,999 | 0 | 0.0% |
| $200,000+ | 29 | 3.9% |
Family Income by Famaliy Size in Onalaska
2-person families (233 | 31.2%) account for the highest median family income in Onalaska with $102,964 per family, while 2-person families (233 | 31.2%) have the highest median income of $51,482 per family member.
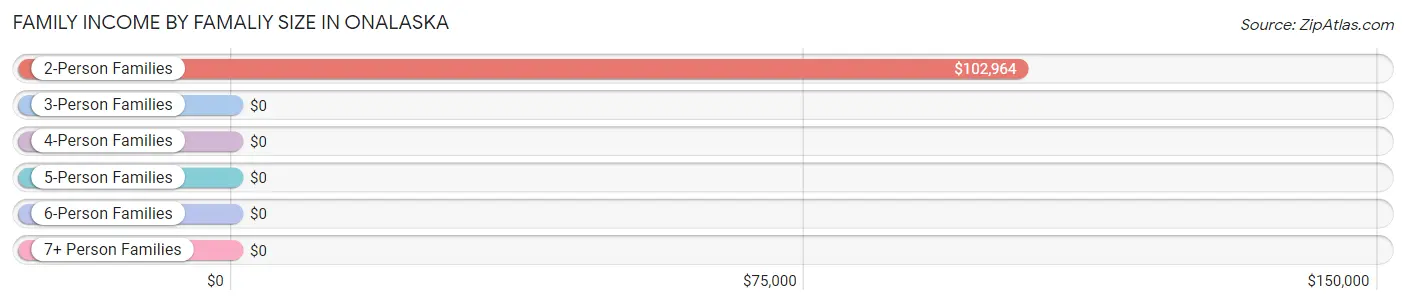
| Income Bracket | # Families | Median Income |
| 2-Person Families | 233 (31.2%) | $102,964 |
| 3-Person Families | 235 (31.5%) | $0 |
| 4-Person Families | 95 (12.7%) | $0 |
| 5-Person Families | 45 (6.0%) | $0 |
| 6-Person Families | 23 (3.1%) | $0 |
| 7+ Person Families | 115 (15.4%) | $0 |
| Total | 746 (100.0%) | $66,484 |
Family Income by Number of Earners in Onalaska
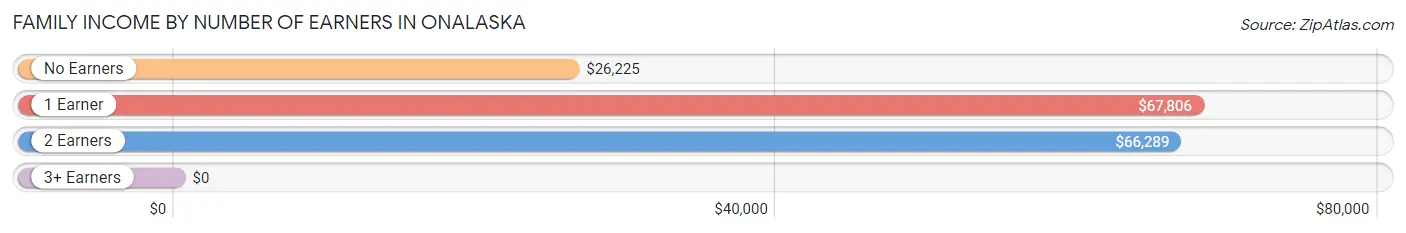
| Number of Earners | # Families | Median Income |
| No Earners | 174 (23.3%) | $26,225 |
| 1 Earner | 203 (27.2%) | $67,806 |
| 2 Earners | 272 (36.5%) | $66,289 |
| 3+ Earners | 97 (13.0%) | $0 |
| Total | 746 (100.0%) | $66,484 |
Household Income in Onalaska
Household Income Brackets in Onalaska
With 373 households falling in the category, the $50,000 to $74,999 income range is the most frequent in Onalaska, accounting for 30.6% of all households.
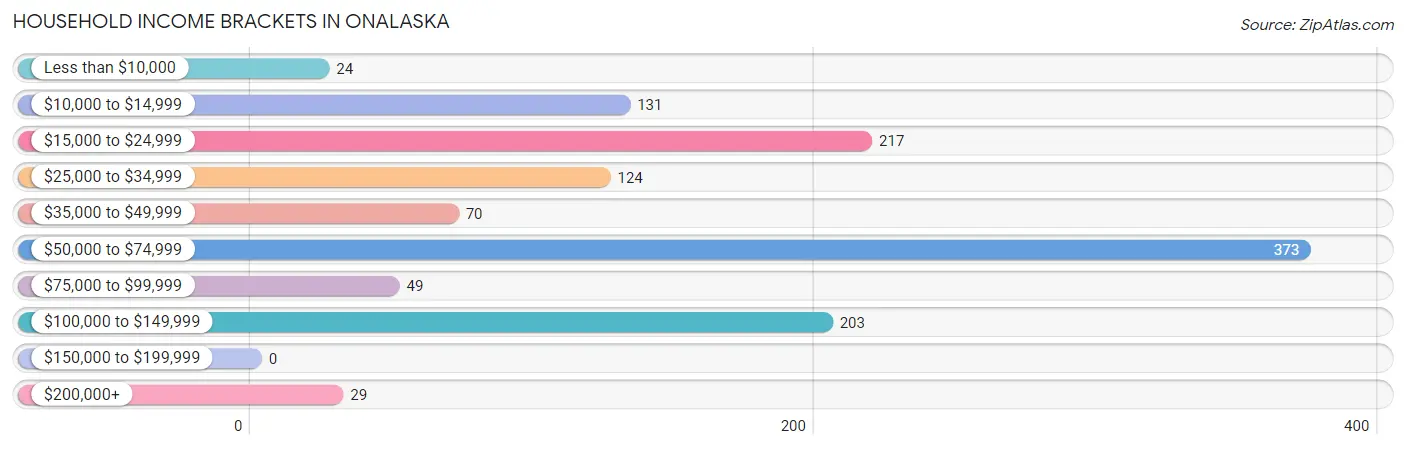
| Income Bracket | # Households | % Households |
| Less than $10,000 | 24 | 2.0% |
| $10,000 to $14,999 | 131 | 10.7% |
| $15,000 to $24,999 | 217 | 17.8% |
| $25,000 to $34,999 | 124 | 10.2% |
| $35,000 to $49,999 | 70 | 5.7% |
| $50,000 to $74,999 | 373 | 30.6% |
| $75,000 to $99,999 | 49 | 4.0% |
| $100,000 to $149,999 | 203 | 16.6% |
| $150,000 to $199,999 | 0 | 0.0% |
| $200,000+ | 29 | 2.4% |
Household Income by Householder Age in Onalaska
The median household income in Onalaska is $56,168, with the highest median household income of $64,205 found in the 45 to 64 years age bracket for the primary householder. A total of 569 households (46.6%) fall into this category. Meanwhile, the 15 to 24 years age bracket for the primary householder has the lowest median household income of $0, with 68 households (5.6%) in this group.
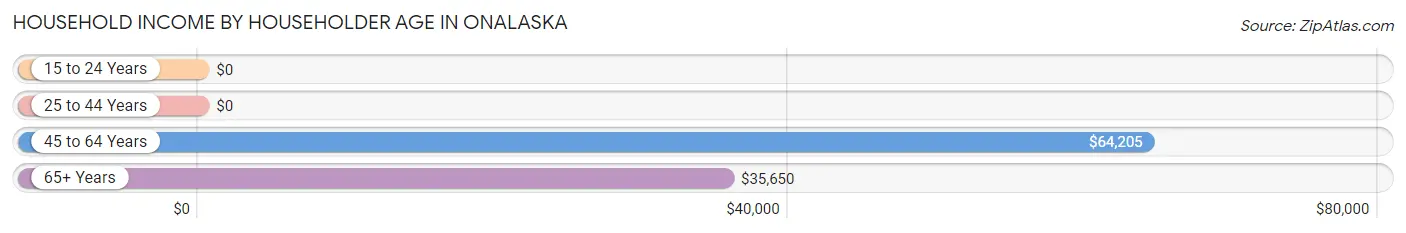
| Income Bracket | # Households | Median Income |
| 15 to 24 Years | 68 (5.6%) | $0 |
| 25 to 44 Years | 204 (16.7%) | $0 |
| 45 to 64 Years | 569 (46.6%) | $64,205 |
| 65+ Years | 379 (31.1%) | $35,650 |
| Total | 1,220 (100.0%) | $56,168 |
Poverty in Onalaska
Income Below Poverty by Sex and Age in Onalaska
With 19.9% poverty level for males and 24.1% for females among the residents of Onalaska, under 5 year old males and 75 year old and over females are the most vulnerable to poverty, with 56 males (59.6%) and 40 females (66.7%) in their respective age groups living below the poverty level.
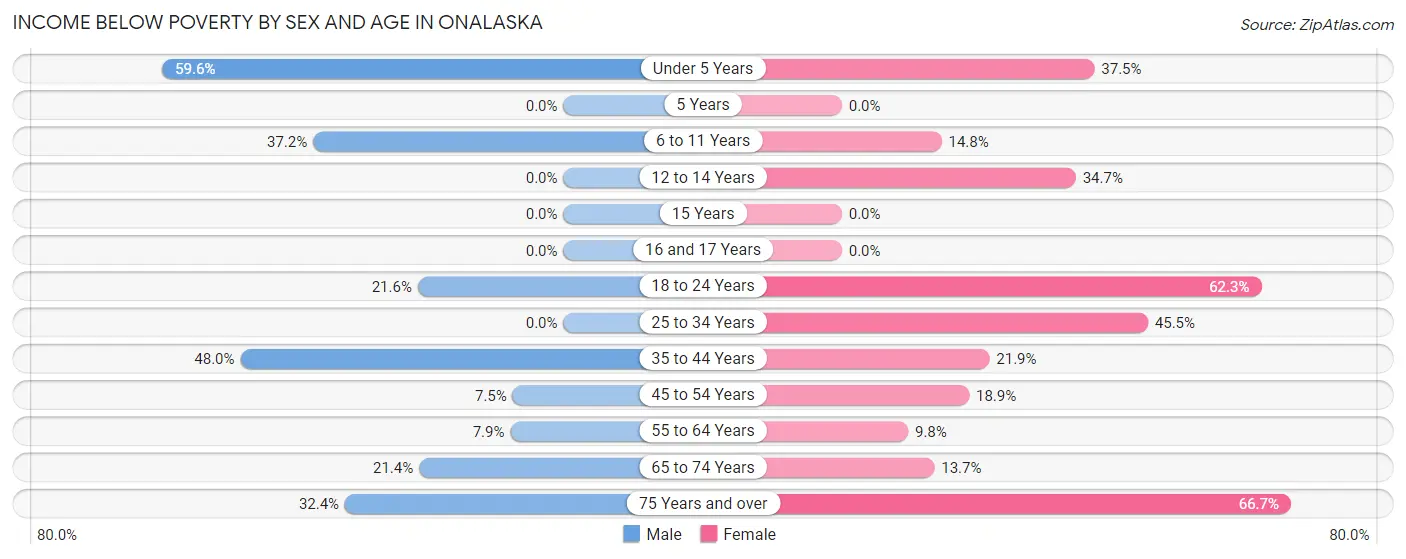
| Age Bracket | Male | Female |
| Under 5 Years | 56 (59.6%) | 27 (37.5%) |
| 5 Years | 0 (0.0%) | 0 (0.0%) |
| 6 to 11 Years | 71 (37.2%) | 24 (14.8%) |
| 12 to 14 Years | 0 (0.0%) | 66 (34.7%) |
| 15 Years | 0 (0.0%) | 0 (0.0%) |
| 16 and 17 Years | 0 (0.0%) | 0 (0.0%) |
| 18 to 24 Years | 8 (21.6%) | 71 (62.3%) |
| 25 to 34 Years | 0 (0.0%) | 20 (45.5%) |
| 35 to 44 Years | 47 (48.0%) | 62 (21.9%) |
| 45 to 54 Years | 33 (7.5%) | 48 (18.9%) |
| 55 to 64 Years | 19 (7.9%) | 12 (9.8%) |
| 65 to 74 Years | 24 (21.4%) | 39 (13.7%) |
| 75 Years and over | 12 (32.4%) | 40 (66.7%) |
| Total | 270 (19.9%) | 409 (24.1%) |
Income Above Poverty by Sex and Age in Onalaska
According to the poverty statistics in Onalaska, males aged 12 to 14 years and females aged 5 years are the age groups that are most secure financially, with 100.0% of males and 100.0% of females in these age groups living above the poverty line.
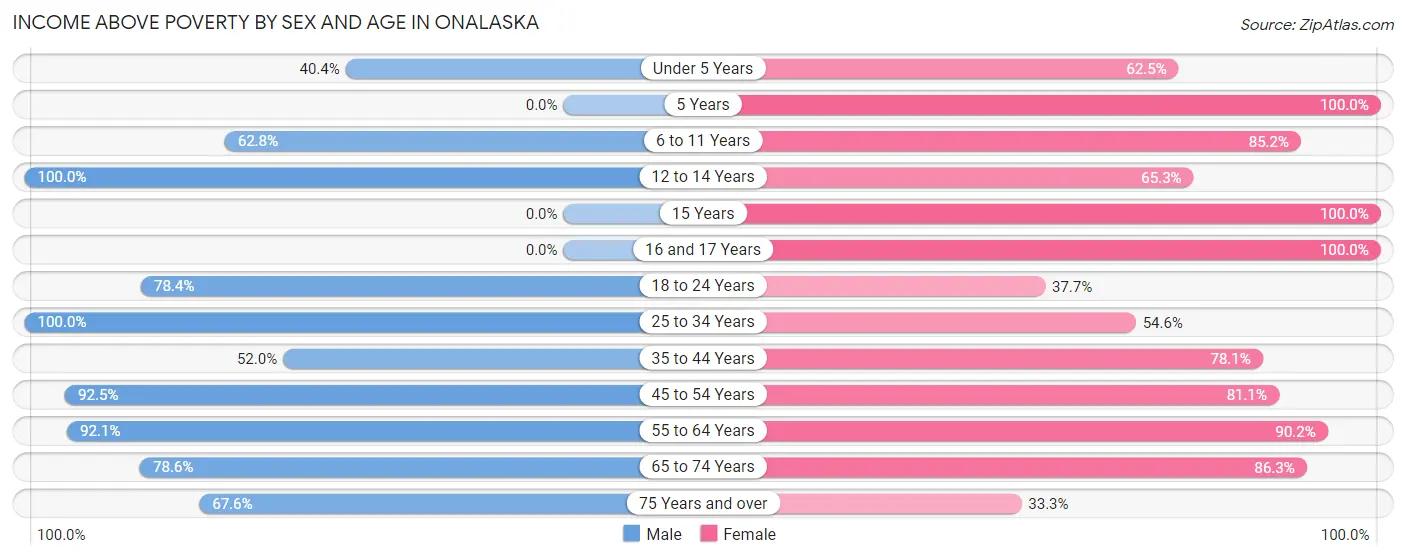
| Age Bracket | Male | Female |
| Under 5 Years | 38 (40.4%) | 45 (62.5%) |
| 5 Years | 0 (0.0%) | 88 (100.0%) |
| 6 to 11 Years | 120 (62.8%) | 138 (85.2%) |
| 12 to 14 Years | 15 (100.0%) | 124 (65.3%) |
| 15 Years | 0 (0.0%) | 5 (100.0%) |
| 16 and 17 Years | 0 (0.0%) | 17 (100.0%) |
| 18 to 24 Years | 29 (78.4%) | 43 (37.7%) |
| 25 to 34 Years | 92 (100.0%) | 24 (54.5%) |
| 35 to 44 Years | 51 (52.0%) | 221 (78.1%) |
| 45 to 54 Years | 405 (92.5%) | 206 (81.1%) |
| 55 to 64 Years | 222 (92.1%) | 110 (90.2%) |
| 65 to 74 Years | 88 (78.6%) | 245 (86.3%) |
| 75 Years and over | 25 (67.6%) | 20 (33.3%) |
| Total | 1,085 (80.1%) | 1,286 (75.9%) |
Income Below Poverty Among Married-Couple Families in Onalaska
The poverty statistics for married-couple families in Onalaska show that 3.2% or 17 of the total 539 families live below the poverty line. Families with 1 or 2 children have the highest poverty rate of 8.0%, comprising of 9 families. On the other hand, families with 3 or 4 children have the lowest poverty rate of 0.0%, which includes 0 families.
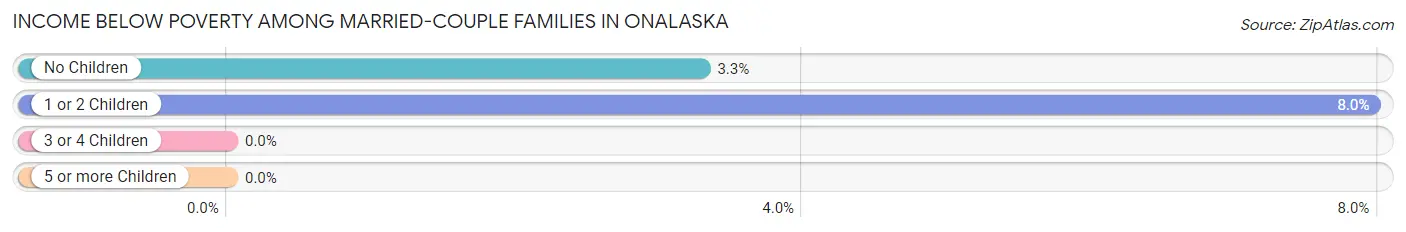
| Children | Above Poverty | Below Poverty |
| No Children | 235 (96.7%) | 8 (3.3%) |
| 1 or 2 Children | 104 (92.0%) | 9 (8.0%) |
| 3 or 4 Children | 68 (100.0%) | 0 (0.0%) |
| 5 or more Children | 115 (100.0%) | 0 (0.0%) |
| Total | 522 (96.9%) | 17 (3.2%) |
Income Below Poverty Among Single-Parent Households in Onalaska
According to the poverty data in Onalaska, 48.4% or 47 single-father households and 73.6% or 81 single-mother households are living below the poverty line. Among single-father households, those with 1 or 2 children have the highest poverty rate, with 47 households (100.0%) experiencing poverty. Likewise, among single-mother households, those with 1 or 2 children have the highest poverty rate, with 81 households (100.0%) falling below the poverty line.
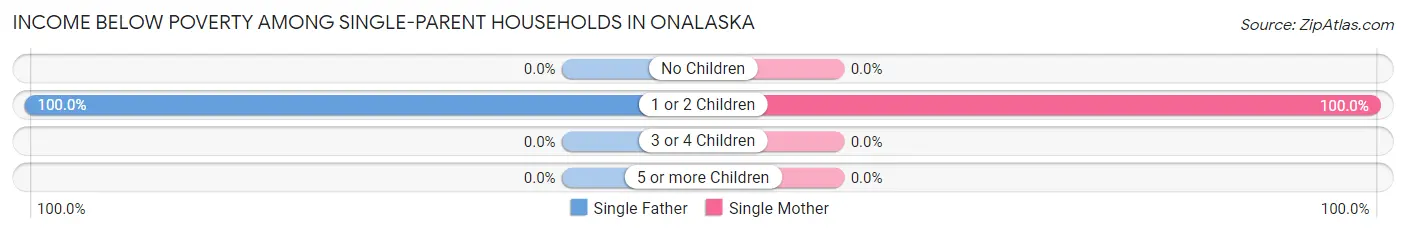
| Children | Single Father | Single Mother |
| No Children | 0 (0.0%) | 0 (0.0%) |
| 1 or 2 Children | 47 (100.0%) | 81 (100.0%) |
| 3 or 4 Children | 0 (0.0%) | 0 (0.0%) |
| 5 or more Children | 0 (0.0%) | 0 (0.0%) |
| Total | 47 (48.4%) | 81 (73.6%) |
Income Below Poverty Among Married-Couple vs Single-Parent Households in Onalaska
The poverty data for Onalaska shows that 17 of the married-couple family households (3.2%) and 128 of the single-parent households (61.8%) are living below the poverty level. Within the married-couple family households, those with 1 or 2 children have the highest poverty rate, with 9 households (8.0%) falling below the poverty line. Among the single-parent households, those with 1 or 2 children have the highest poverty rate, with 128 household (100.0%) living below poverty.
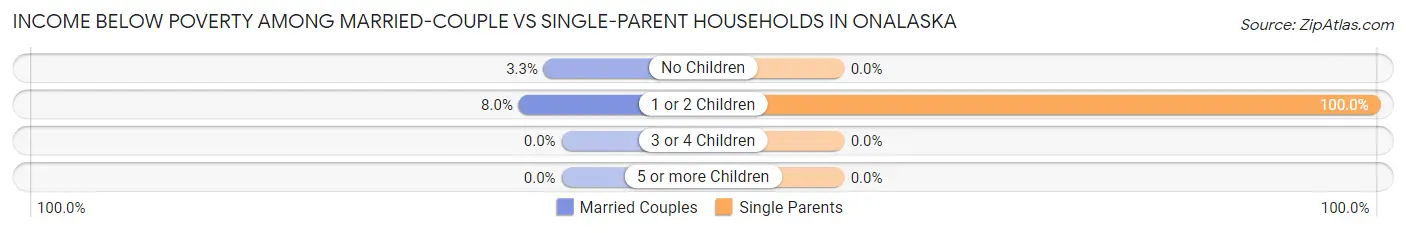
| Children | Married-Couple Families | Single-Parent Households |
| No Children | 8 (3.3%) | 0 (0.0%) |
| 1 or 2 Children | 9 (8.0%) | 128 (100.0%) |
| 3 or 4 Children | 0 (0.0%) | 0 (0.0%) |
| 5 or more Children | 0 (0.0%) | 0 (0.0%) |
| Total | 17 (3.2%) | 128 (61.8%) |
Race in Onalaska
The most populous races in Onalaska are White / Caucasian (2,836 | 93.0%), Two or more Races (165 | 5.4%), and Hispanic or Latino (103 | 3.4%).
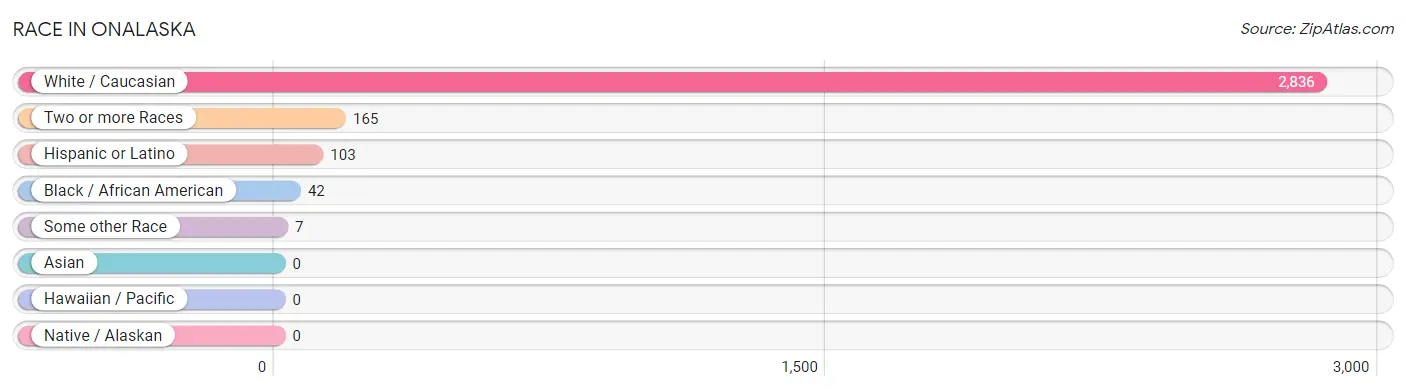
| Race | # Population | % Population |
| Asian | 0 | 0.0% |
| Black / African American | 42 | 1.4% |
| Hawaiian / Pacific | 0 | 0.0% |
| Hispanic or Latino | 103 | 3.4% |
| Native / Alaskan | 0 | 0.0% |
| White / Caucasian | 2,836 | 93.0% |
| Two or more Races | 165 | 5.4% |
| Some other Race | 7 | 0.2% |
| Total | 3,050 | 100.0% |
Ancestry in Onalaska
The most populous ancestries reported in Onalaska are Irish (517 | 17.0%), English (405 | 13.3%), German (363 | 11.9%), American (174 | 5.7%), and Pennsylvania German (90 | 2.9%), together accounting for 50.8% of all Onalaska residents.
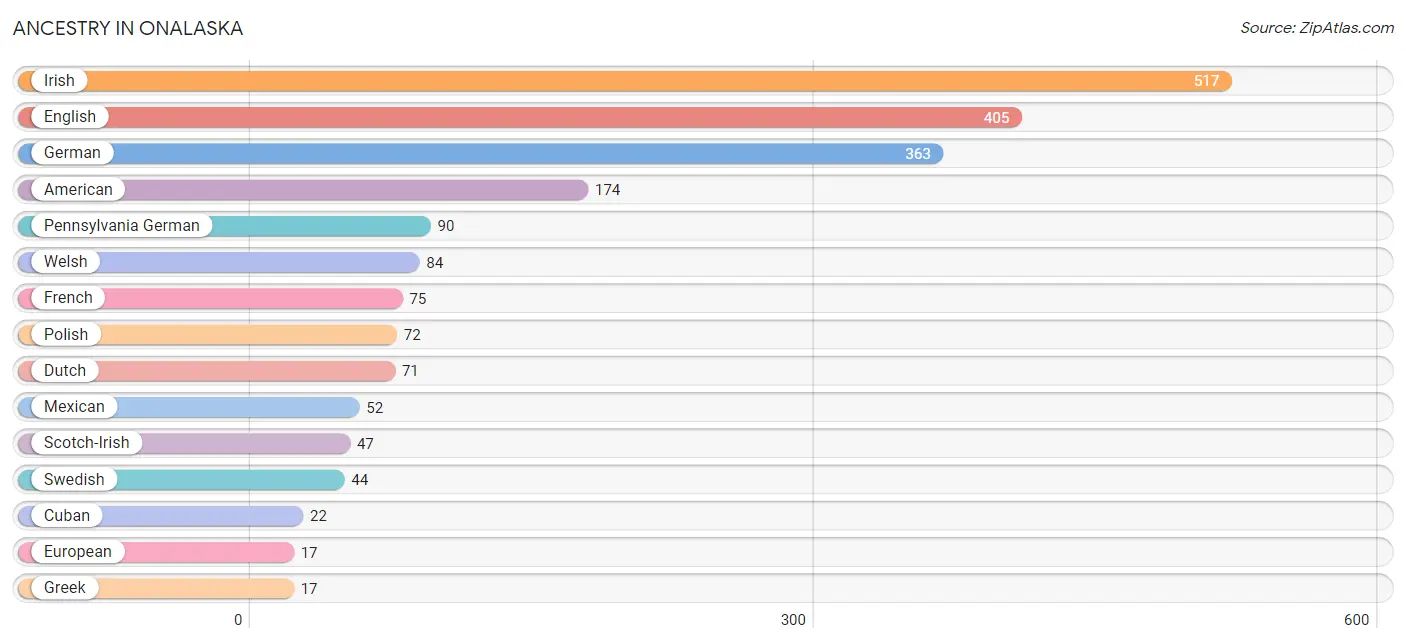
| Ancestry | # Population | % Population |
| American | 174 | 5.7% |
| British | 9 | 0.3% |
| Canadian | 9 | 0.3% |
| Cherokee | 3 | 0.1% |
| Choctaw | 3 | 0.1% |
| Cuban | 22 | 0.7% |
| Dutch | 71 | 2.3% |
| English | 405 | 13.3% |
| European | 17 | 0.6% |
| French | 75 | 2.5% |
| German | 363 | 11.9% |
| Greek | 17 | 0.6% |
| Irish | 517 | 17.0% |
| Italian | 17 | 0.6% |
| Mexican | 52 | 1.7% |
| Norwegian | 13 | 0.4% |
| Pennsylvania German | 90 | 2.9% |
| Polish | 72 | 2.4% |
| Scotch-Irish | 47 | 1.5% |
| Swedish | 44 | 1.4% |
| Welsh | 84 | 2.8% | View All 21 Rows |
Immigrants in Onalaska
The most numerous immigrant groups reported in Onalaska came from England (29 | 0.9%), Europe (29 | 0.9%), Northern Europe (29 | 0.9%), Canada (15 | 0.5%), and Central America (9 | 0.3%), together accounting for 3.6% of all Onalaska residents.
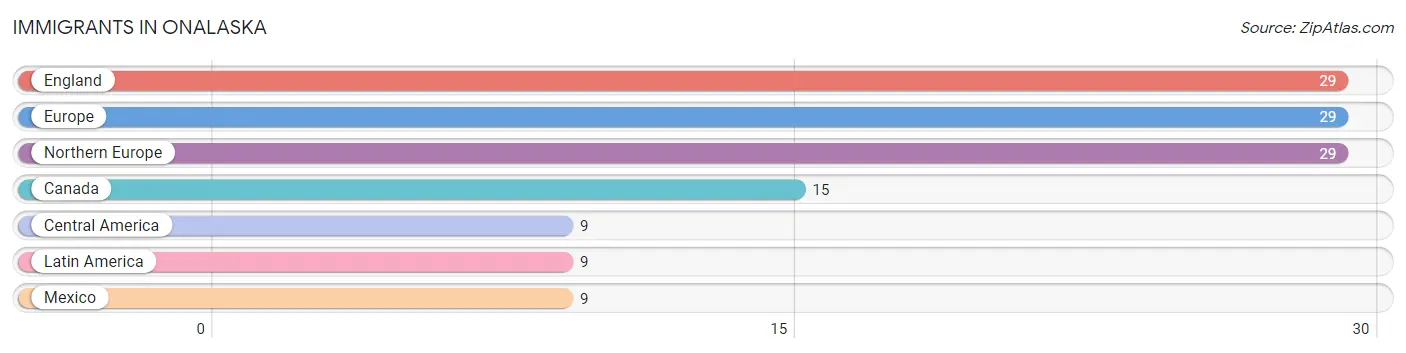
| Immigration Origin | # Population | % Population |
| Canada | 15 | 0.5% |
| Central America | 9 | 0.3% |
| England | 29 | 0.9% |
| Europe | 29 | 0.9% |
| Latin America | 9 | 0.3% |
| Mexico | 9 | 0.3% |
| Northern Europe | 29 | 0.9% | View All 7 Rows |
Sex and Age in Onalaska
Sex and Age in Onalaska
The most populous age groups in Onalaska are 45 to 49 Years (304 | 22.4%) for men and 10 to 14 Years (259 | 15.3%) for women.
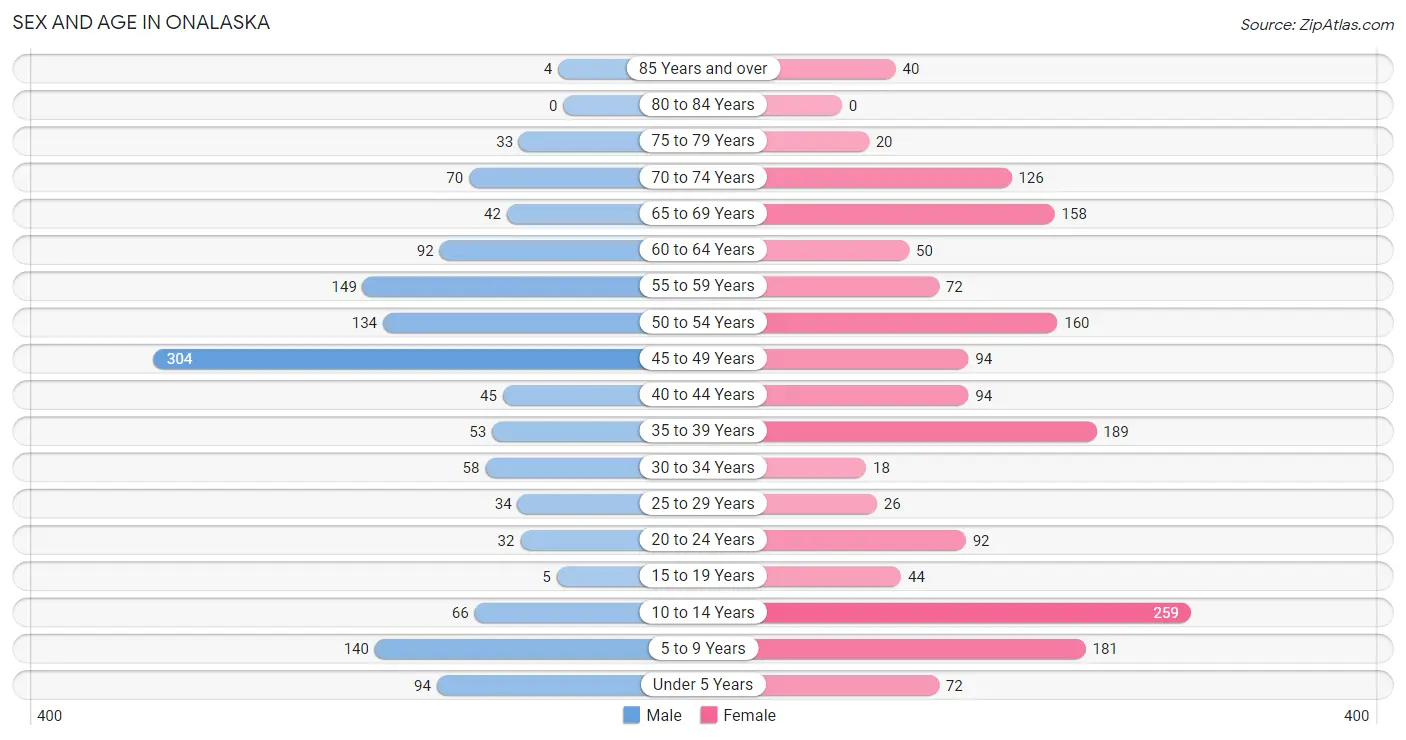
| Age Bracket | Male | Female |
| Under 5 Years | 94 (6.9%) | 72 (4.3%) |
| 5 to 9 Years | 140 (10.3%) | 181 (10.7%) |
| 10 to 14 Years | 66 (4.9%) | 259 (15.3%) |
| 15 to 19 Years | 5 (0.4%) | 44 (2.6%) |
| 20 to 24 Years | 32 (2.4%) | 92 (5.4%) |
| 25 to 29 Years | 34 (2.5%) | 26 (1.5%) |
| 30 to 34 Years | 58 (4.3%) | 18 (1.1%) |
| 35 to 39 Years | 53 (3.9%) | 189 (11.2%) |
| 40 to 44 Years | 45 (3.3%) | 94 (5.6%) |
| 45 to 49 Years | 304 (22.4%) | 94 (5.6%) |
| 50 to 54 Years | 134 (9.9%) | 160 (9.4%) |
| 55 to 59 Years | 149 (11.0%) | 72 (4.3%) |
| 60 to 64 Years | 92 (6.8%) | 50 (2.9%) |
| 65 to 69 Years | 42 (3.1%) | 158 (9.3%) |
| 70 to 74 Years | 70 (5.2%) | 126 (7.4%) |
| 75 to 79 Years | 33 (2.4%) | 20 (1.2%) |
| 80 to 84 Years | 0 (0.0%) | 0 (0.0%) |
| 85 Years and over | 4 (0.3%) | 40 (2.4%) |
| Total | 1,355 (100.0%) | 1,695 (100.0%) |
Families and Households in Onalaska
Median Family Size in Onalaska
The median family size in Onalaska is 3.14 persons per family, with single female/mother families (110 | 14.7%) accounting for the largest median family size of 3.36 persons per family. On the other hand, single male/father families (97 | 13.0%) represent the smallest median family size with 2.90 persons per family.
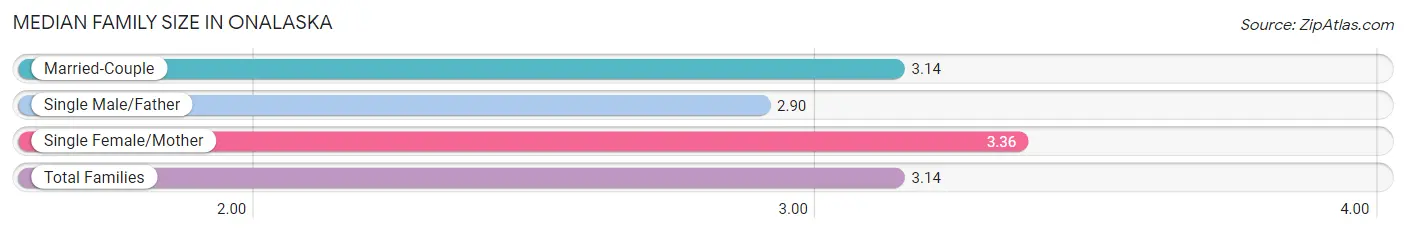
| Family Type | # Families | Family Size |
| Married-Couple | 539 (72.3%) | 3.14 |
| Single Male/Father | 97 (13.0%) | 2.90 |
| Single Female/Mother | 110 (14.7%) | 3.36 |
| Total Families | 746 (100.0%) | 3.14 |
Median Household Size in Onalaska
The median household size in Onalaska is 2.49 persons per household, with single female/mother households (110 | 9.0%) accounting for the largest median household size of 4.46 persons per household. non-family households (474 | 38.9%) represent the smallest median household size with 1.10 persons per household.
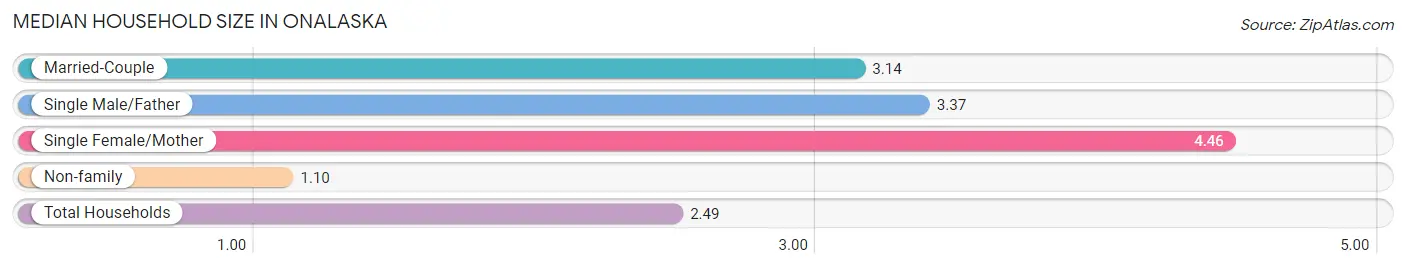
| Household Type | # Households | Household Size |
| Married-Couple | 539 (44.2%) | 3.14 |
| Single Male/Father | 97 (8.0%) | 3.37 |
| Single Female/Mother | 110 (9.0%) | 4.46 |
| Non-family | 474 (38.9%) | 1.10 |
| Total Households | 1,220 (100.0%) | 2.49 |
Household Size by Marriage Status in Onalaska
Out of a total of 1,220 households in Onalaska, 746 (61.2%) are family households, while 474 (38.9%) are nonfamily households. The most numerous type of family households are 2-person households, comprising 233, and the most common type of nonfamily households are 1-person households, comprising 419.
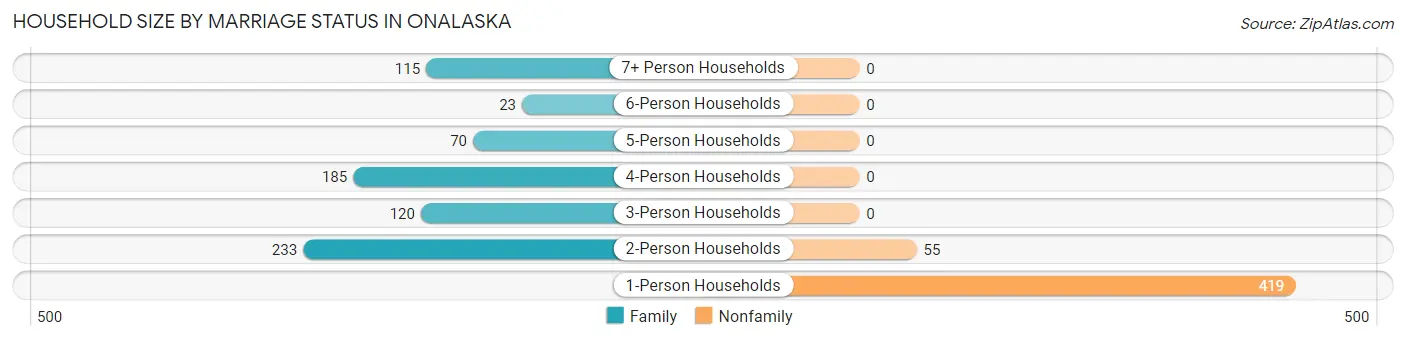
| Household Size | Family Households | Nonfamily Households |
| 1-Person Households | - | 419 (34.3%) |
| 2-Person Households | 233 (19.1%) | 55 (4.5%) |
| 3-Person Households | 120 (9.8%) | 0 (0.0%) |
| 4-Person Households | 185 (15.2%) | 0 (0.0%) |
| 5-Person Households | 70 (5.7%) | 0 (0.0%) |
| 6-Person Households | 23 (1.9%) | 0 (0.0%) |
| 7+ Person Households | 115 (9.4%) | 0 (0.0%) |
| Total | 746 (61.2%) | 474 (38.9%) |
Female Fertility in Onalaska
Fertility by Age in Onalaska
| Age Bracket | Women with Births | Births / 1,000 Women |
| 15 to 19 years | 0 (0.0%) | 0.0 |
| 20 to 34 years | 0 (0.0%) | 0.0 |
| 35 to 50 years | 0 (0.0%) | 0.0 |
| Total | 0 (0.0%) | 0.0 |
Fertility by Age by Marriage Status in Onalaska
| Age Bracket | Married | Unmarried |
| 15 to 19 years | 0 (0.0%) | 0 (0.0%) |
| 20 to 34 years | 0 (0.0%) | 0 (0.0%) |
| 35 to 50 years | 0 (0.0%) | 0 (0.0%) |
| Total | 0 (0.0%) | 0 (0.0%) |
Fertility by Education in Onalaska
| Educational Attainment | Women with Births | Births / 1,000 Women |
| Less than High School | 0 (0.0%) | 0.0 |
| High School Diploma | 0 (0.0%) | 0.0 |
| College or Associate's Degree | 0 (0.0%) | 0.0 |
| Bachelor's Degree | 0 (0.0%) | 0.0 |
| Graduate Degree | 0 (0.0%) | 0.0 |
| Total | 0 (0.0%) | 0.0 |
Fertility by Education by Marriage Status in Onalaska
| Educational Attainment | Married | Unmarried |
| Less than High School | 0 (0.0%) | 0 (0.0%) |
| High School Diploma | 0 (0.0%) | 0 (0.0%) |
| College or Associate's Degree | 0 (0.0%) | 0 (0.0%) |
| Bachelor's Degree | 0 (0.0%) | 0 (0.0%) |
| Graduate Degree | 0 (0.0%) | 0 (0.0%) |
| Total | 0 (0.0%) | 0 (0.0%) |
Employment Characteristics in Onalaska
Employment by Class of Employer in Onalaska
Among the 1,156 employed individuals in Onalaska, private company employees (694 | 60.0%), self-employed (not incorporated) (237 | 20.5%), and local government employees (115 | 10.0%) make up the most common classes of employment.
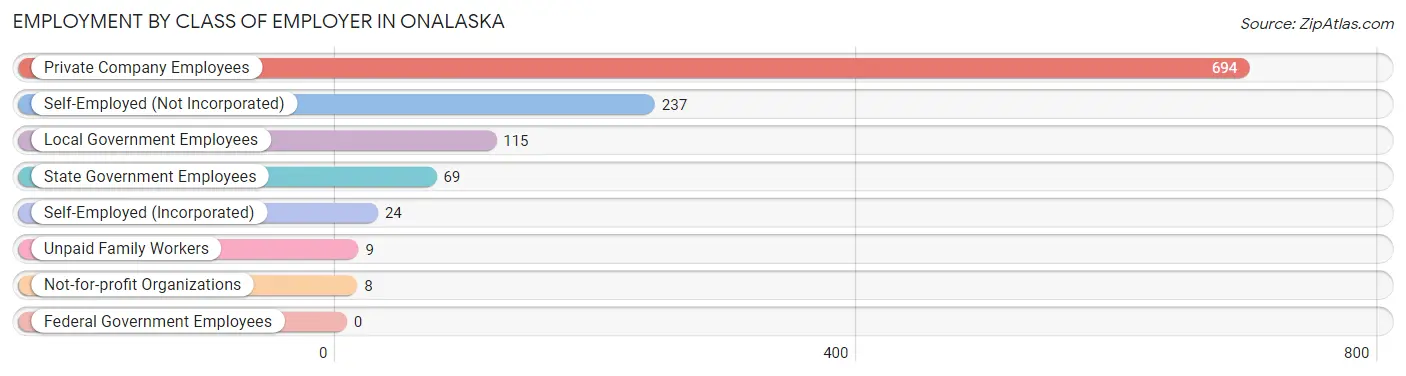
| Employer Class | # Employees | % Employees |
| Private Company Employees | 694 | 60.0% |
| Self-Employed (Incorporated) | 24 | 2.1% |
| Self-Employed (Not Incorporated) | 237 | 20.5% |
| Not-for-profit Organizations | 8 | 0.7% |
| Local Government Employees | 115 | 10.0% |
| State Government Employees | 69 | 6.0% |
| Federal Government Employees | 0 | 0.0% |
| Unpaid Family Workers | 9 | 0.8% |
| Total | 1,156 | 100.0% |
Employment Status by Age in Onalaska
According to the labor force statistics for Onalaska, out of the total population over 16 years of age (2,233), 57.2% or 1,277 individuals are in the labor force, with 9.5% or 121 of them unemployed. The age group with the highest labor force participation rate is 25 to 29 years, with 100.0% or 60 individuals in the labor force. Within the labor force, the 35 to 44 years age range has the highest percentage of unemployed individuals, with 37.7% or 80 of them being unemployed.
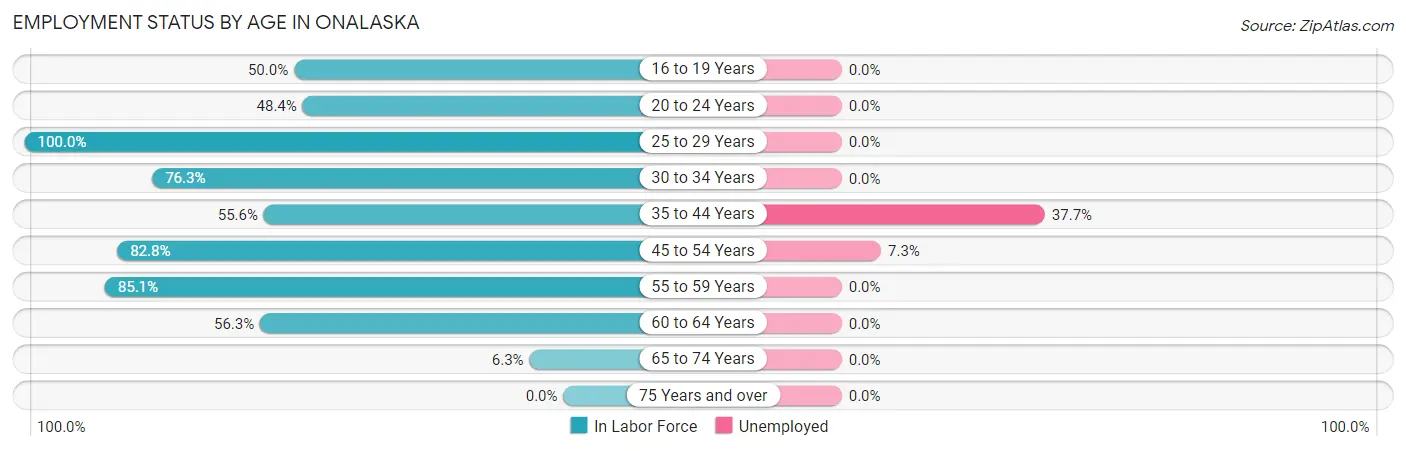
| Age Bracket | In Labor Force | Unemployed |
| 16 to 19 Years | 22 (50.0%) | 0 (0.0%) |
| 20 to 24 Years | 60 (48.4%) | 0 (0.0%) |
| 25 to 29 Years | 60 (100.0%) | 0 (0.0%) |
| 30 to 34 Years | 58 (76.3%) | 0 (0.0%) |
| 35 to 44 Years | 212 (55.6%) | 80 (37.7%) |
| 45 to 54 Years | 573 (82.8%) | 42 (7.3%) |
| 55 to 59 Years | 188 (85.1%) | 0 (0.0%) |
| 60 to 64 Years | 80 (56.3%) | 0 (0.0%) |
| 65 to 74 Years | 25 (6.3%) | 0 (0.0%) |
| 75 Years and over | 0 (0.0%) | 0 (0.0%) |
| Total | 1,277 (57.2%) | 121 (9.5%) |
Employment Status by Educational Attainment in Onalaska
According to labor force statistics for Onalaska, 74.5% of individuals (1,171) out of the total population between 25 and 64 years of age (1,572) are in the labor force, with 10.4% or 122 of them being unemployed. The group with the highest labor force participation rate are those with the educational attainment of bachelor's degree or higher, with 82.5% or 118 individuals in the labor force. Within the labor force, individuals with college / associate degree education have the highest percentage of unemployment, with 14.1% or 80 of them being unemployed.
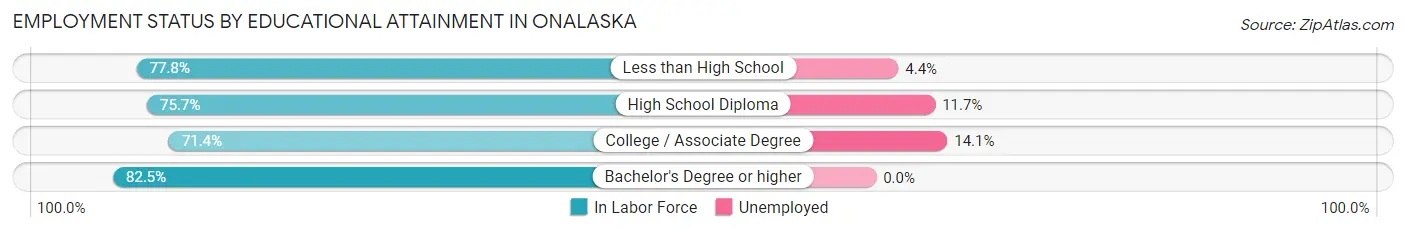
| Educational Attainment | In Labor Force | Unemployed |
| Less than High School | 203 (77.8%) | 11 (4.4%) |
| High School Diploma | 281 (75.7%) | 43 (11.7%) |
| College / Associate Degree | 569 (71.4%) | 112 (14.1%) |
| Bachelor's Degree or higher | 118 (82.5%) | 0 (0.0%) |
| Total | 1,171 (74.5%) | 163 (10.4%) |
Employment Occupations by Sex in Onalaska
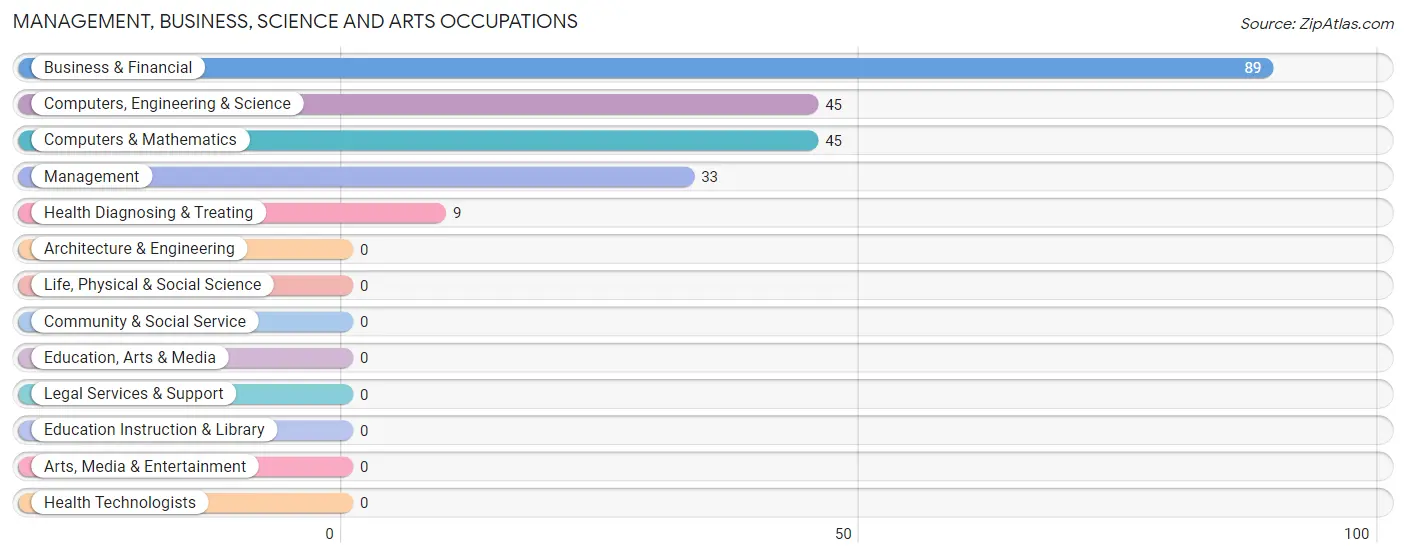
Management, Business, Science and Arts Occupations
The most common Management, Business, Science and Arts occupations in Onalaska are Business & Financial (89 | 7.7%), Computers, Engineering & Science (45 | 3.9%), Computers & Mathematics (45 | 3.9%), Management (33 | 2.9%), and Health Diagnosing & Treating (9 | 0.8%).
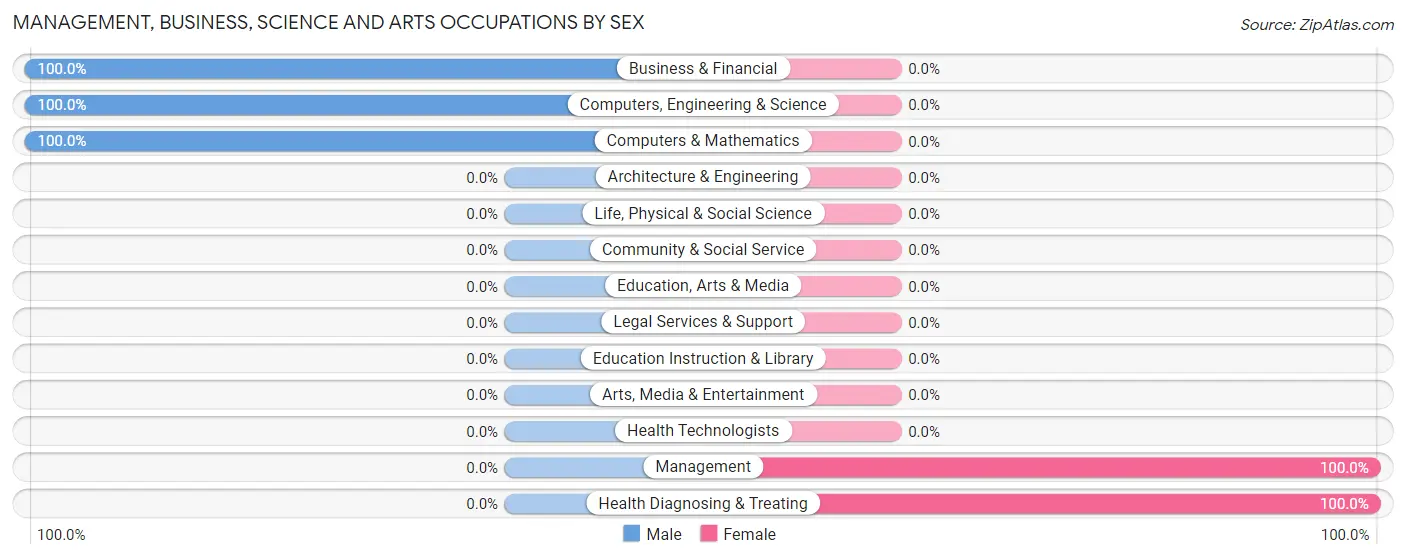
Management, Business, Science and Arts Occupations by Sex
Within the Management, Business, Science and Arts occupations in Onalaska, the most male-oriented occupations are Business & Financial (100.0%), Computers, Engineering & Science (100.0%), and Computers & Mathematics (100.0%), while the most female-oriented occupations are Management (100.0%), and Health Diagnosing & Treating (100.0%).
| Occupation | Male | Female |
| Management | 0 (0.0%) | 33 (100.0%) |
| Business & Financial | 89 (100.0%) | 0 (0.0%) |
| Computers, Engineering & Science | 45 (100.0%) | 0 (0.0%) |
| Computers & Mathematics | 45 (100.0%) | 0 (0.0%) |
| Architecture & Engineering | 0 (0.0%) | 0 (0.0%) |
| Life, Physical & Social Science | 0 (0.0%) | 0 (0.0%) |
| Community & Social Service | 0 (0.0%) | 0 (0.0%) |
| Education, Arts & Media | 0 (0.0%) | 0 (0.0%) |
| Legal Services & Support | 0 (0.0%) | 0 (0.0%) |
| Education Instruction & Library | 0 (0.0%) | 0 (0.0%) |
| Arts, Media & Entertainment | 0 (0.0%) | 0 (0.0%) |
| Health Diagnosing & Treating | 0 (0.0%) | 9 (100.0%) |
| Health Technologists | 0 (0.0%) | 0 (0.0%) |
| Total (Category) | 134 (76.1%) | 42 (23.9%) |
| Total (Overall) | 732 (63.3%) | 424 (36.7%) |
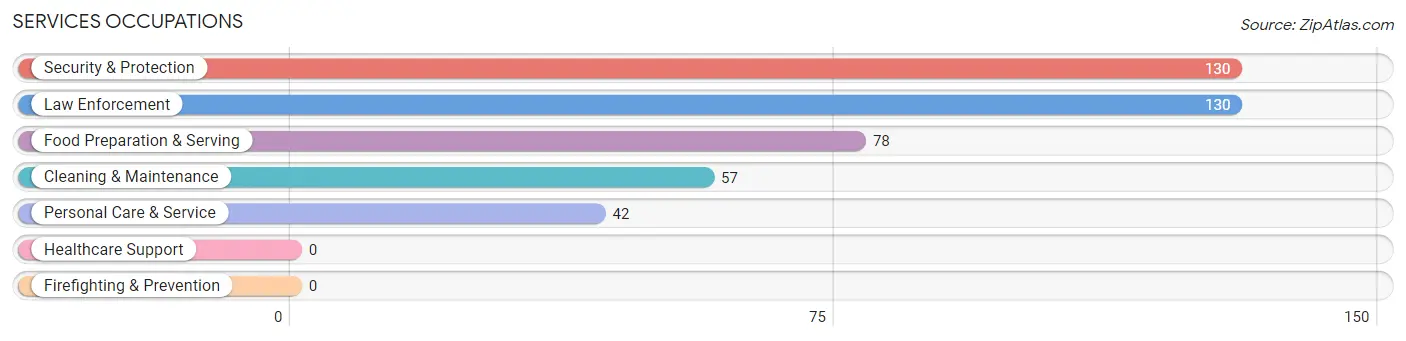
Services Occupations
The most common Services occupations in Onalaska are Security & Protection (130 | 11.3%), Law Enforcement (130 | 11.3%), Food Preparation & Serving (78 | 6.8%), Cleaning & Maintenance (57 | 4.9%), and Personal Care & Service (42 | 3.6%).
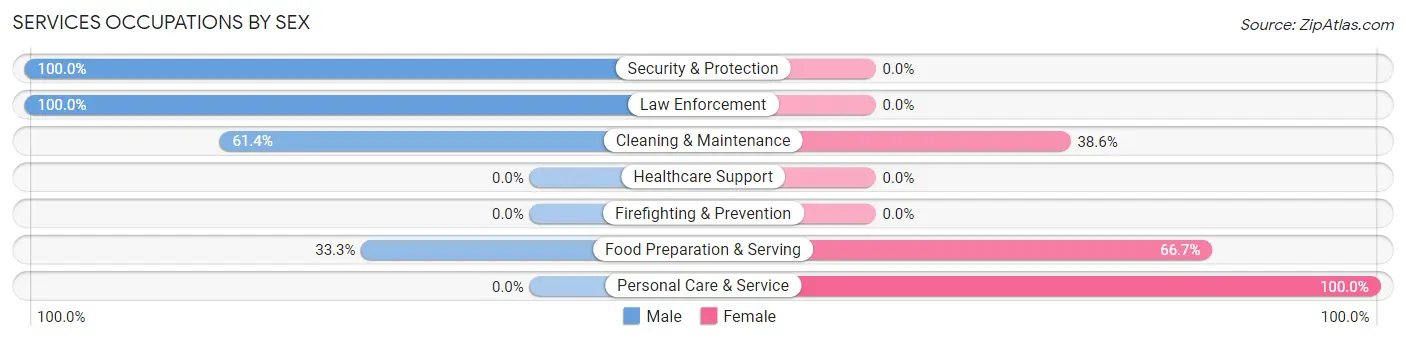
Services Occupations by Sex
Within the Services occupations in Onalaska, the most male-oriented occupations are Security & Protection (100.0%), Law Enforcement (100.0%), and Cleaning & Maintenance (61.4%), while the most female-oriented occupations are Personal Care & Service (100.0%), Food Preparation & Serving (66.7%), and Cleaning & Maintenance (38.6%).
| Occupation | Male | Female |
| Healthcare Support | 0 (0.0%) | 0 (0.0%) |
| Security & Protection | 130 (100.0%) | 0 (0.0%) |
| Firefighting & Prevention | 0 (0.0%) | 0 (0.0%) |
| Law Enforcement | 130 (100.0%) | 0 (0.0%) |
| Food Preparation & Serving | 26 (33.3%) | 52 (66.7%) |
| Cleaning & Maintenance | 35 (61.4%) | 22 (38.6%) |
| Personal Care & Service | 0 (0.0%) | 42 (100.0%) |
| Total (Category) | 191 (62.2%) | 116 (37.8%) |
| Total (Overall) | 732 (63.3%) | 424 (36.7%) |
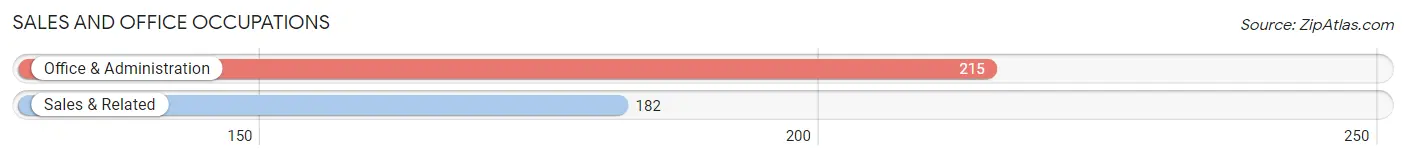
Sales and Office Occupations
The most common Sales and Office occupations in Onalaska are Office & Administration (215 | 18.6%), and Sales & Related (182 | 15.7%).
Sales and Office Occupations by Sex
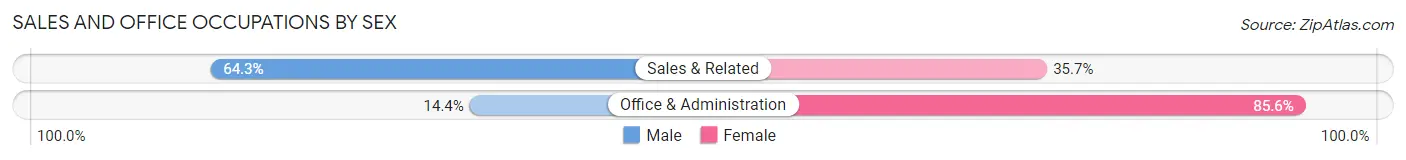
| Occupation | Male | Female |
| Sales & Related | 117 (64.3%) | 65 (35.7%) |
| Office & Administration | 31 (14.4%) | 184 (85.6%) |
| Total (Category) | 148 (37.3%) | 249 (62.7%) |
| Total (Overall) | 732 (63.3%) | 424 (36.7%) |
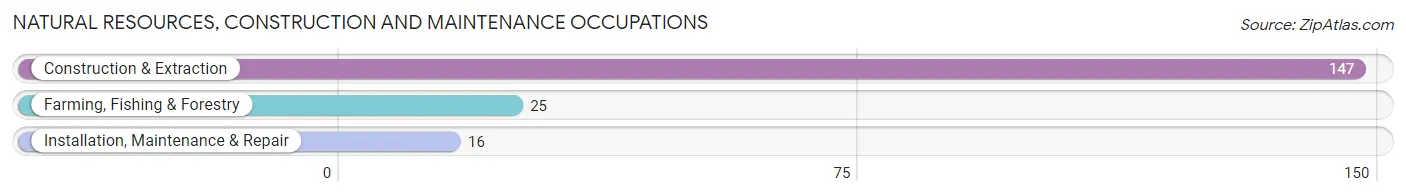
Natural Resources, Construction and Maintenance Occupations
The most common Natural Resources, Construction and Maintenance occupations in Onalaska are Construction & Extraction (147 | 12.7%), Farming, Fishing & Forestry (25 | 2.2%), and Installation, Maintenance & Repair (16 | 1.4%).
Natural Resources, Construction and Maintenance Occupations by Sex
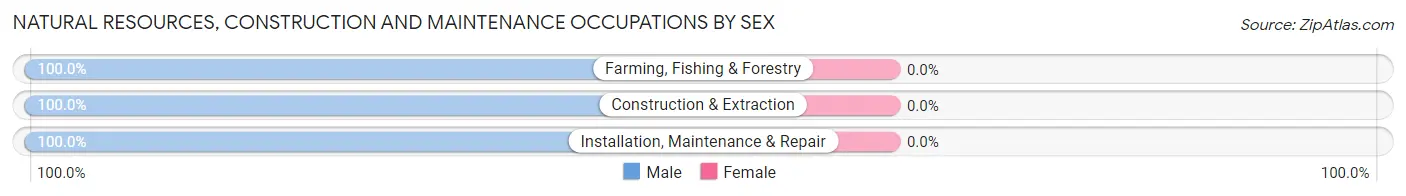
| Occupation | Male | Female |
| Farming, Fishing & Forestry | 25 (100.0%) | 0 (0.0%) |
| Construction & Extraction | 147 (100.0%) | 0 (0.0%) |
| Installation, Maintenance & Repair | 16 (100.0%) | 0 (0.0%) |
| Total (Category) | 188 (100.0%) | 0 (0.0%) |
| Total (Overall) | 732 (63.3%) | 424 (36.7%) |
Production, Transportation and Moving Occupations
The most common Production, Transportation and Moving occupations in Onalaska are Production (44 | 3.8%), Transportation (35 | 3.0%), and Material Moving (9 | 0.8%).
Production, Transportation and Moving Occupations by Sex
| Occupation | Male | Female |
| Production | 36 (81.8%) | 8 (18.2%) |
| Transportation | 35 (100.0%) | 0 (0.0%) |
| Material Moving | 0 (0.0%) | 9 (100.0%) |
| Total (Category) | 71 (80.7%) | 17 (19.3%) |
| Total (Overall) | 732 (63.3%) | 424 (36.7%) |
Employment Industries by Sex in Onalaska
Employment Industries in Onalaska
The major employment industries in Onalaska include Construction (319 | 27.6%), Public Administration (139 | 12.0%), Retail Trade (102 | 8.8%), Health Care & Social Assistance (87 | 7.5%), and Accommodation & Food Services (80 | 6.9%).
Employment Industries by Sex in Onalaska
The Onalaska industries that see more men than women are Agriculture, Fishing & Hunting (100.0%), Wholesale Trade (100.0%), and Transportation & Warehousing (100.0%), whereas the industries that tend to have a higher number of women are Professional & Scientific (100.0%), Health Care & Social Assistance (100.0%), and Arts, Entertainment & Recreation (100.0%).
| Industry | Male | Female |
| Agriculture, Fishing & Hunting | 25 (100.0%) | 0 (0.0%) |
| Mining, Quarrying, & Extraction | 5 (22.7%) | 17 (77.3%) |
| Construction | 262 (82.1%) | 57 (17.9%) |
| Manufacturing | 42 (84.0%) | 8 (16.0%) |
| Wholesale Trade | 19 (100.0%) | 0 (0.0%) |
| Retail Trade | 29 (28.4%) | 73 (71.6%) |
| Transportation & Warehousing | 13 (100.0%) | 0 (0.0%) |
| Utilities | 0 (0.0%) | 0 (0.0%) |
| Information | 0 (0.0%) | 0 (0.0%) |
| Finance & Insurance | 0 (0.0%) | 0 (0.0%) |
| Real Estate, Rental & Leasing | 55 (100.0%) | 0 (0.0%) |
| Professional & Scientific | 0 (0.0%) | 32 (100.0%) |
| Enterprise Management | 0 (0.0%) | 0 (0.0%) |
| Administrative & Support | 31 (100.0%) | 0 (0.0%) |
| Educational Services | 62 (100.0%) | 0 (0.0%) |
| Health Care & Social Assistance | 0 (0.0%) | 87 (100.0%) |
| Arts, Entertainment & Recreation | 0 (0.0%) | 9 (100.0%) |
| Accommodation & Food Services | 44 (55.0%) | 36 (45.0%) |
| Public Administration | 130 (93.5%) | 9 (6.5%) |
| Total | 732 (63.3%) | 424 (36.7%) |
Education in Onalaska
School Enrollment in Onalaska
The most common levels of schooling among the 730 students in Onalaska are elementary school (282 | 38.6%), middle school (214 | 29.3%), and nursery / preschool (94 | 12.9%).
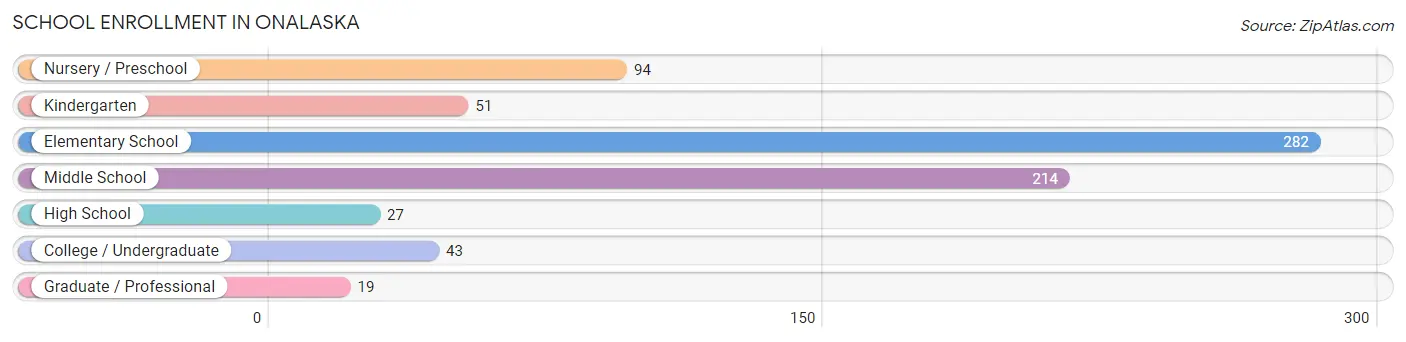
| School Level | # Students | % Students |
| Nursery / Preschool | 94 | 12.9% |
| Kindergarten | 51 | 7.0% |
| Elementary School | 282 | 38.6% |
| Middle School | 214 | 29.3% |
| High School | 27 | 3.7% |
| College / Undergraduate | 43 | 5.9% |
| Graduate / Professional | 19 | 2.6% |
| Total | 730 | 100.0% |
School Enrollment by Age by Funding Source in Onalaska
Out of a total of 730 students who are enrolled in schools in Onalaska, 156 (21.4%) attend a private institution, while the remaining 574 (78.6%) are enrolled in public schools. The age group of 10 to 14 year olds has the highest likelihood of being enrolled in private schools, with 92 (33.5% in the age bracket) enrolled. Conversely, the age group of 3 to 4 year olds has the lowest likelihood of being enrolled in a private school, with 45 (100.0% in the age bracket) attending a public institution.
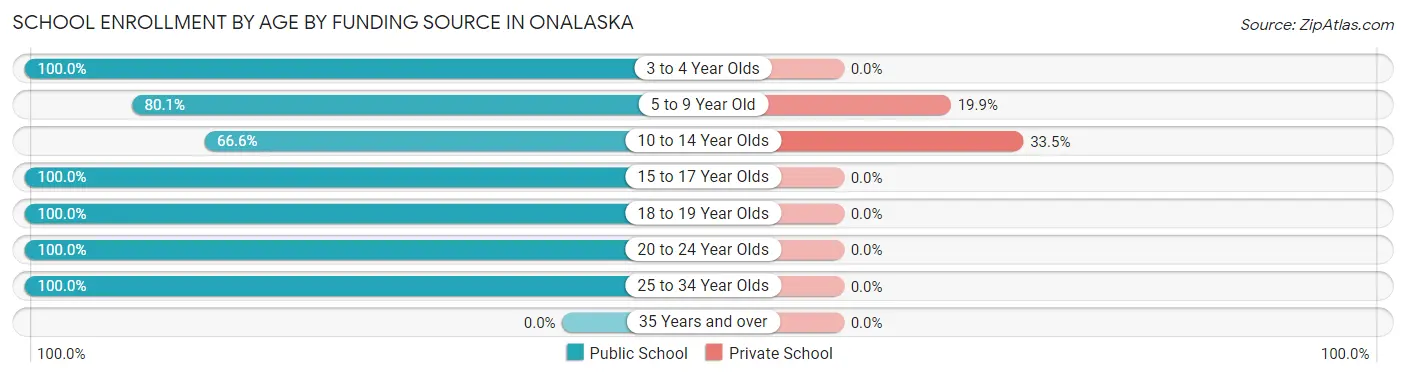
| Age Bracket | Public School | Private School |
| 3 to 4 Year Olds | 45 (100.0%) | 0 (0.0%) |
| 5 to 9 Year Old | 257 (80.1%) | 64 (19.9%) |
| 10 to 14 Year Olds | 183 (66.5%) | 92 (33.5%) |
| 15 to 17 Year Olds | 22 (100.0%) | 0 (0.0%) |
| 18 to 19 Year Olds | 5 (100.0%) | 0 (0.0%) |
| 20 to 24 Year Olds | 8 (100.0%) | 0 (0.0%) |
| 25 to 34 Year Olds | 54 (100.0%) | 0 (0.0%) |
| 35 Years and over | 0 (0.0%) | 0 (0.0%) |
| Total | 574 (78.6%) | 156 (21.4%) |
Educational Attainment by Field of Study in Onalaska
Liberal arts & history (70 | 36.8%), business (33 | 17.4%), computers & mathematics (29 | 15.3%), literature & languages (25 | 13.2%), and arts & humanities (19 | 10.0%) are the most common fields of study among 190 individuals in Onalaska who have obtained a bachelor's degree or higher.
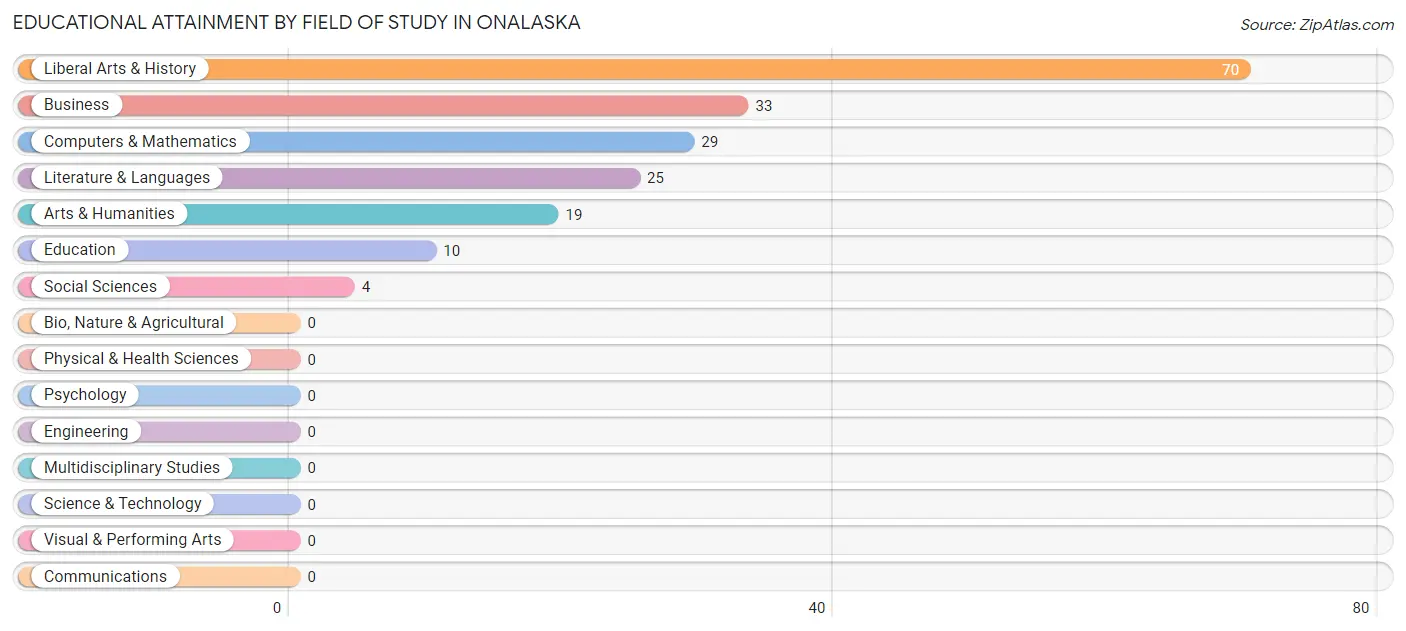
| Field of Study | # Graduates | % Graduates |
| Computers & Mathematics | 29 | 15.3% |
| Bio, Nature & Agricultural | 0 | 0.0% |
| Physical & Health Sciences | 0 | 0.0% |
| Psychology | 0 | 0.0% |
| Social Sciences | 4 | 2.1% |
| Engineering | 0 | 0.0% |
| Multidisciplinary Studies | 0 | 0.0% |
| Science & Technology | 0 | 0.0% |
| Business | 33 | 17.4% |
| Education | 10 | 5.3% |
| Literature & Languages | 25 | 13.2% |
| Liberal Arts & History | 70 | 36.8% |
| Visual & Performing Arts | 0 | 0.0% |
| Communications | 0 | 0.0% |
| Arts & Humanities | 19 | 10.0% |
| Total | 190 | 100.0% |
Transportation & Commute in Onalaska
Vehicle Availability by Sex in Onalaska
The most prevalent vehicle ownership categories in Onalaska are males with 2 vehicles (412, accounting for 56.3%) and females with 2 vehicles (152, making up 97.2%).
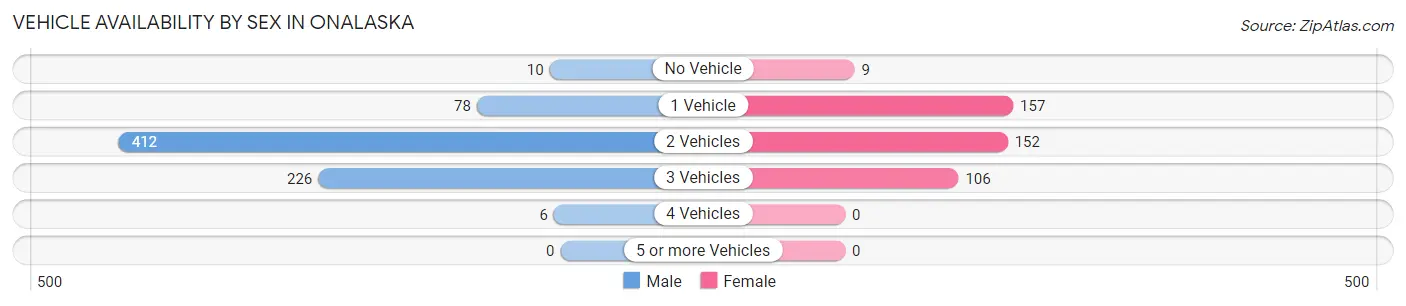
| Vehicles Available | Male | Female |
| No Vehicle | 10 (1.4%) | 9 (2.1%) |
| 1 Vehicle | 78 (10.7%) | 157 (37.0%) |
| 2 Vehicles | 412 (56.3%) | 152 (35.8%) |
| 3 Vehicles | 226 (30.9%) | 106 (25.0%) |
| 4 Vehicles | 6 (0.8%) | 0 (0.0%) |
| 5 or more Vehicles | 0 (0.0%) | 0 (0.0%) |
| Total | 732 (100.0%) | 424 (100.0%) |
Commute Time in Onalaska
The most frequently occuring commute durations in Onalaska are 15 to 19 minutes (262 commuters, 23.5%), 20 to 24 minutes (216 commuters, 19.4%), and less than 5 minutes (163 commuters, 14.6%).
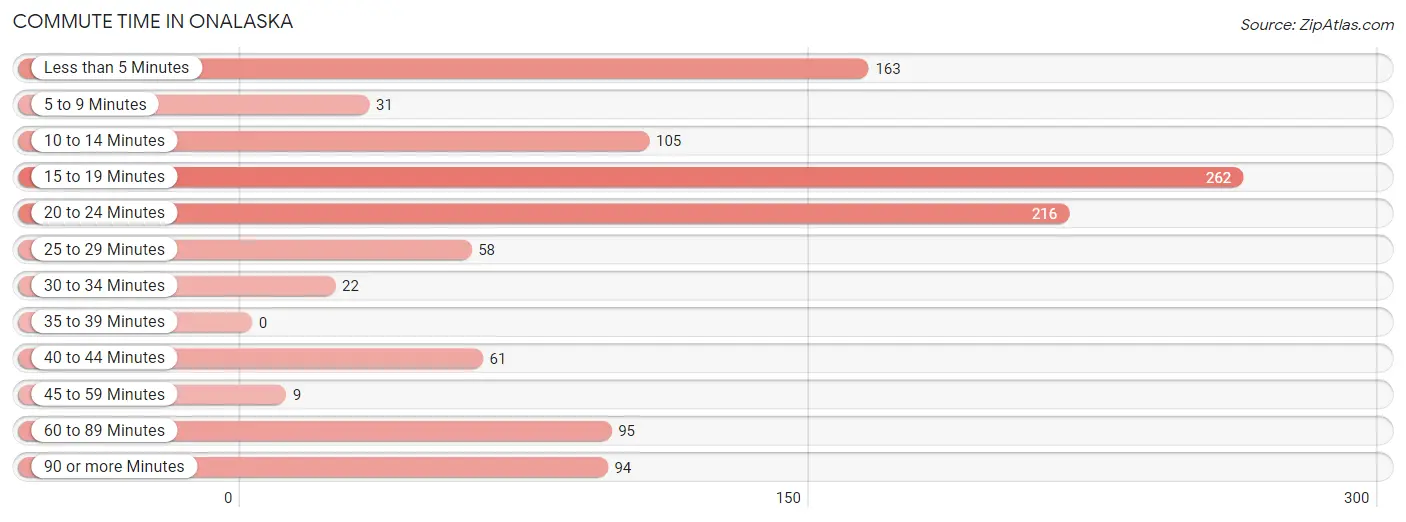
| Commute Time | # Commuters | % Commuters |
| Less than 5 Minutes | 163 | 14.6% |
| 5 to 9 Minutes | 31 | 2.8% |
| 10 to 14 Minutes | 105 | 9.4% |
| 15 to 19 Minutes | 262 | 23.5% |
| 20 to 24 Minutes | 216 | 19.4% |
| 25 to 29 Minutes | 58 | 5.2% |
| 30 to 34 Minutes | 22 | 2.0% |
| 35 to 39 Minutes | 0 | 0.0% |
| 40 to 44 Minutes | 61 | 5.5% |
| 45 to 59 Minutes | 9 | 0.8% |
| 60 to 89 Minutes | 95 | 8.5% |
| 90 or more Minutes | 94 | 8.4% |
Commute Time by Sex in Onalaska
The most common commute times in Onalaska are 20 to 24 minutes (171 commuters, 23.6%) for males and 15 to 19 minutes (111 commuters, 28.2%) for females.
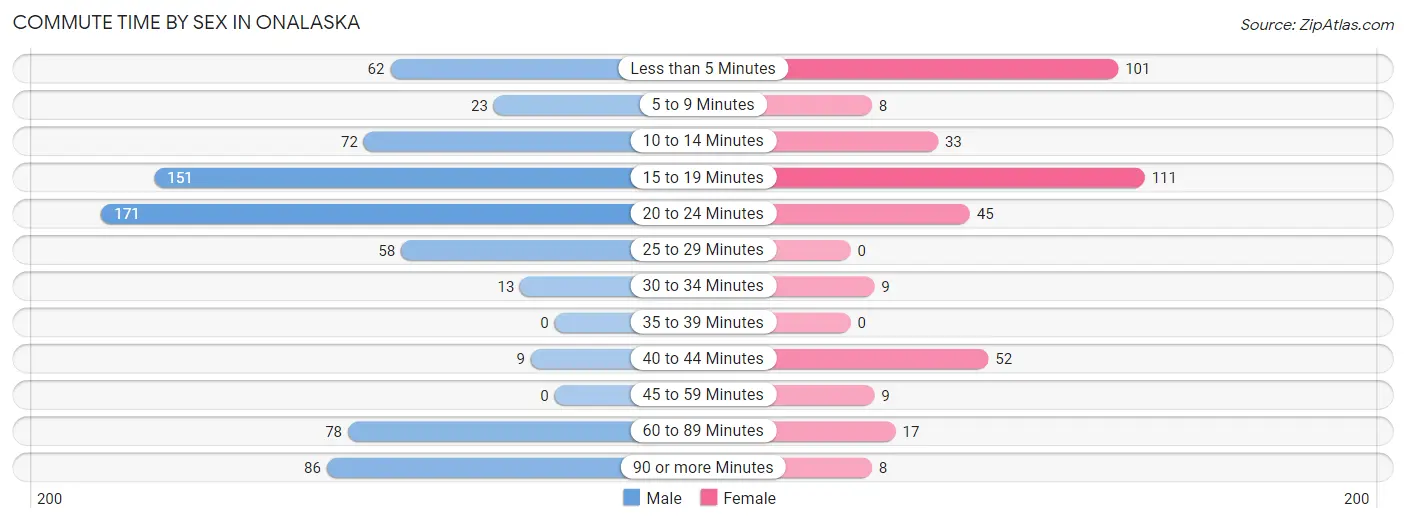
| Commute Time | Male | Female |
| Less than 5 Minutes | 62 (8.6%) | 101 (25.7%) |
| 5 to 9 Minutes | 23 (3.2%) | 8 (2.0%) |
| 10 to 14 Minutes | 72 (10.0%) | 33 (8.4%) |
| 15 to 19 Minutes | 151 (20.9%) | 111 (28.2%) |
| 20 to 24 Minutes | 171 (23.6%) | 45 (11.5%) |
| 25 to 29 Minutes | 58 (8.0%) | 0 (0.0%) |
| 30 to 34 Minutes | 13 (1.8%) | 9 (2.3%) |
| 35 to 39 Minutes | 0 (0.0%) | 0 (0.0%) |
| 40 to 44 Minutes | 9 (1.2%) | 52 (13.2%) |
| 45 to 59 Minutes | 0 (0.0%) | 9 (2.3%) |
| 60 to 89 Minutes | 78 (10.8%) | 17 (4.3%) |
| 90 or more Minutes | 86 (11.9%) | 8 (2.0%) |
Time of Departure to Work by Sex in Onalaska
The most frequent times of departure to work in Onalaska are 5:30 AM to 5:59 AM (157, 21.7%) for males and 7:00 AM to 7:29 AM (128, 32.6%) for females.
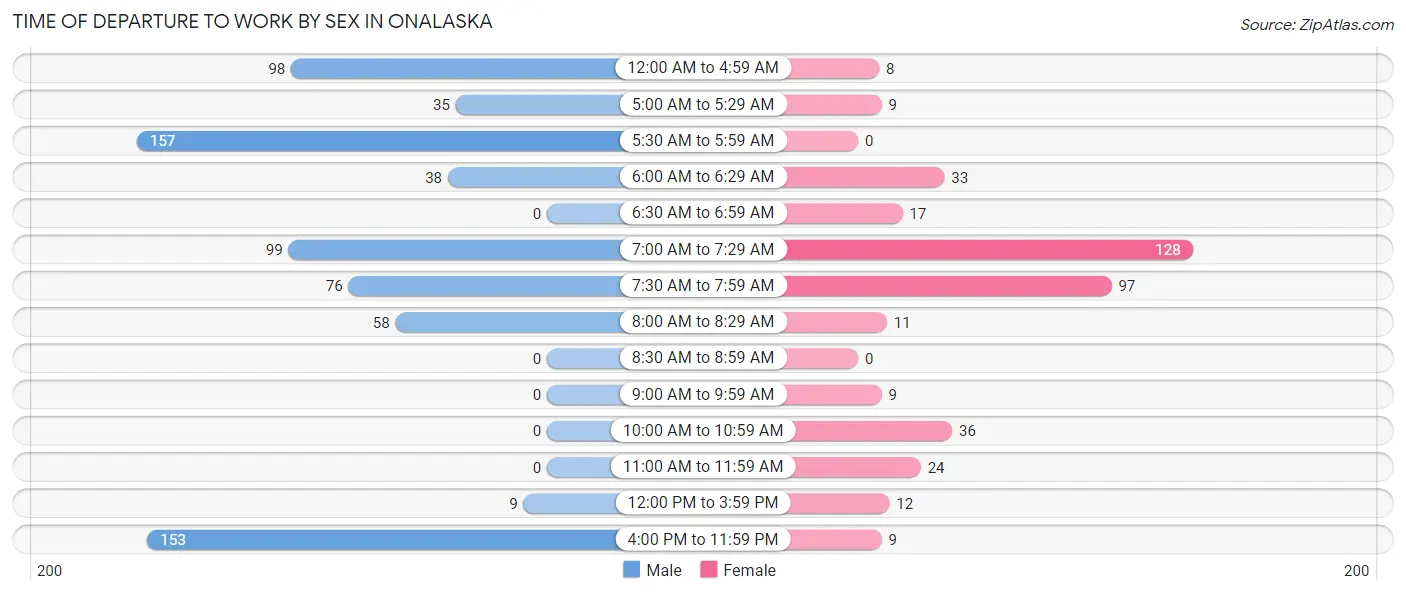
| Time of Departure | Male | Female |
| 12:00 AM to 4:59 AM | 98 (13.6%) | 8 (2.0%) |
| 5:00 AM to 5:29 AM | 35 (4.8%) | 9 (2.3%) |
| 5:30 AM to 5:59 AM | 157 (21.7%) | 0 (0.0%) |
| 6:00 AM to 6:29 AM | 38 (5.3%) | 33 (8.4%) |
| 6:30 AM to 6:59 AM | 0 (0.0%) | 17 (4.3%) |
| 7:00 AM to 7:29 AM | 99 (13.7%) | 128 (32.6%) |
| 7:30 AM to 7:59 AM | 76 (10.5%) | 97 (24.7%) |
| 8:00 AM to 8:29 AM | 58 (8.0%) | 11 (2.8%) |
| 8:30 AM to 8:59 AM | 0 (0.0%) | 0 (0.0%) |
| 9:00 AM to 9:59 AM | 0 (0.0%) | 9 (2.3%) |
| 10:00 AM to 10:59 AM | 0 (0.0%) | 36 (9.2%) |
| 11:00 AM to 11:59 AM | 0 (0.0%) | 24 (6.1%) |
| 12:00 PM to 3:59 PM | 9 (1.2%) | 12 (3.0%) |
| 4:00 PM to 11:59 PM | 153 (21.2%) | 9 (2.3%) |
| Total | 723 (100.0%) | 393 (100.0%) |
Housing Occupancy in Onalaska
Occupancy by Ownership in Onalaska
Of the total 1,220 dwellings in Onalaska, owner-occupied units account for 918 (75.2%), while renter-occupied units make up 302 (24.7%).
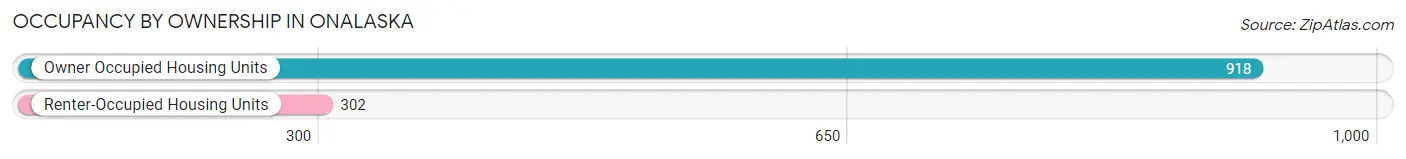
| Occupancy | # Housing Units | % Housing Units |
| Owner Occupied Housing Units | 918 | 75.2% |
| Renter-Occupied Housing Units | 302 | 24.7% |
| Total Occupied Housing Units | 1,220 | 100.0% |
Occupancy by Household Size in Onalaska
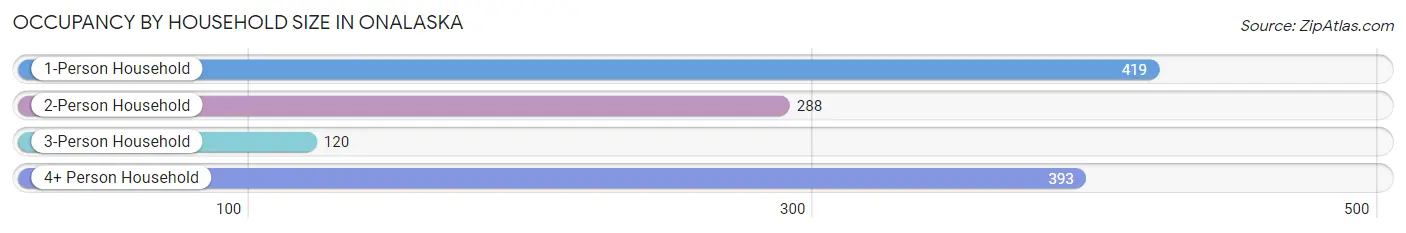
| Household Size | # Housing Units | % Housing Units |
| 1-Person Household | 419 | 34.3% |
| 2-Person Household | 288 | 23.6% |
| 3-Person Household | 120 | 9.8% |
| 4+ Person Household | 393 | 32.2% |
| Total Housing Units | 1,220 | 100.0% |
Occupancy by Ownership by Household Size in Onalaska
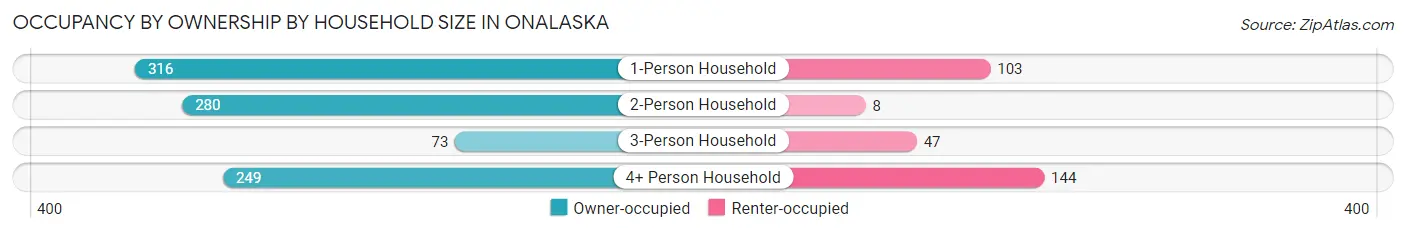
| Household Size | Owner-occupied | Renter-occupied |
| 1-Person Household | 316 (75.4%) | 103 (24.6%) |
| 2-Person Household | 280 (97.2%) | 8 (2.8%) |
| 3-Person Household | 73 (60.8%) | 47 (39.2%) |
| 4+ Person Household | 249 (63.4%) | 144 (36.6%) |
| Total Housing Units | 918 (75.2%) | 302 (24.7%) |
Occupancy by Educational Attainment in Onalaska
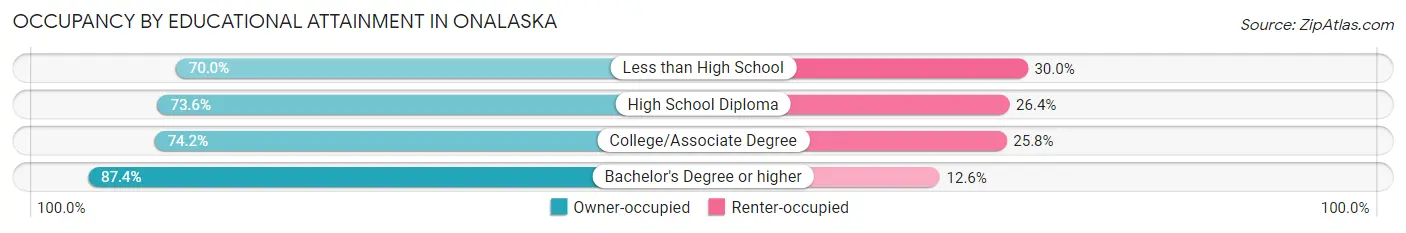
| Household Size | Owner-occupied | Renter-occupied |
| Less than High School | 84 (70.0%) | 36 (30.0%) |
| High School Diploma | 268 (73.6%) | 96 (26.4%) |
| College/Associate Degree | 434 (74.2%) | 151 (25.8%) |
| Bachelor's Degree or higher | 132 (87.4%) | 19 (12.6%) |
Occupancy by Age of Householder in Onalaska
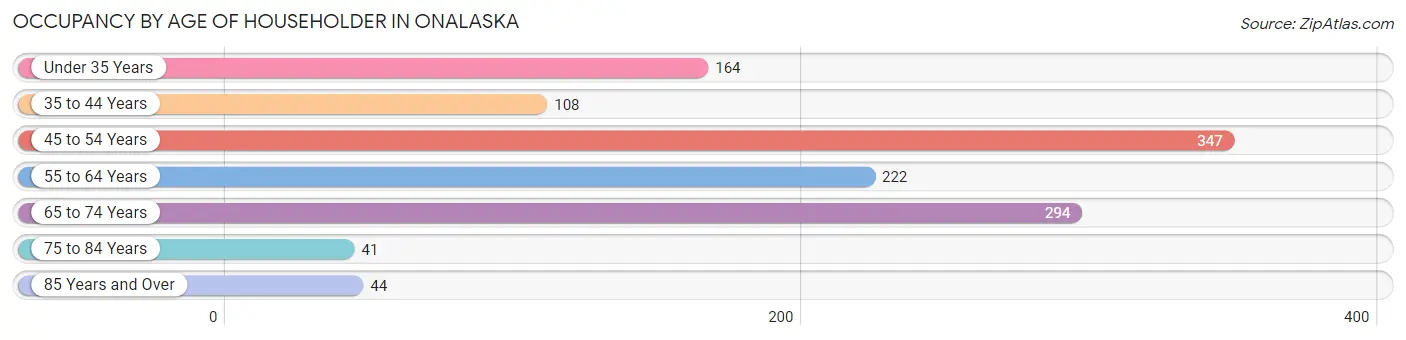
| Age Bracket | # Households | % Households |
| Under 35 Years | 164 | 13.4% |
| 35 to 44 Years | 108 | 8.8% |
| 45 to 54 Years | 347 | 28.4% |
| 55 to 64 Years | 222 | 18.2% |
| 65 to 74 Years | 294 | 24.1% |
| 75 to 84 Years | 41 | 3.4% |
| 85 Years and Over | 44 | 3.6% |
| Total | 1,220 | 100.0% |
Housing Finances in Onalaska
Median Income by Occupancy in Onalaska
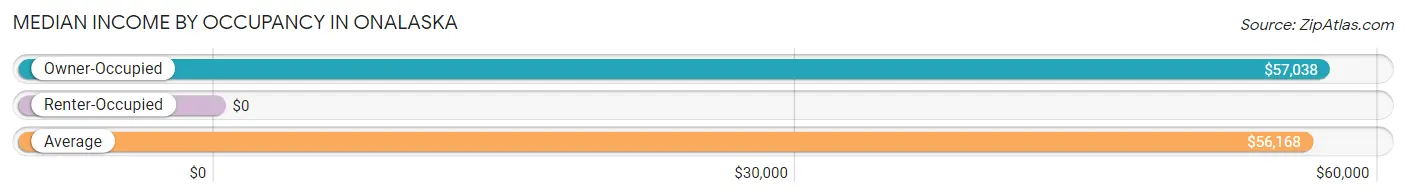
| Occupancy Type | # Households | Median Income |
| Owner-Occupied | 918 (75.2%) | $57,038 |
| Renter-Occupied | 302 (24.7%) | $0 |
| Average | 1,220 (100.0%) | $56,168 |
Occupancy by Householder Income Bracket in Onalaska
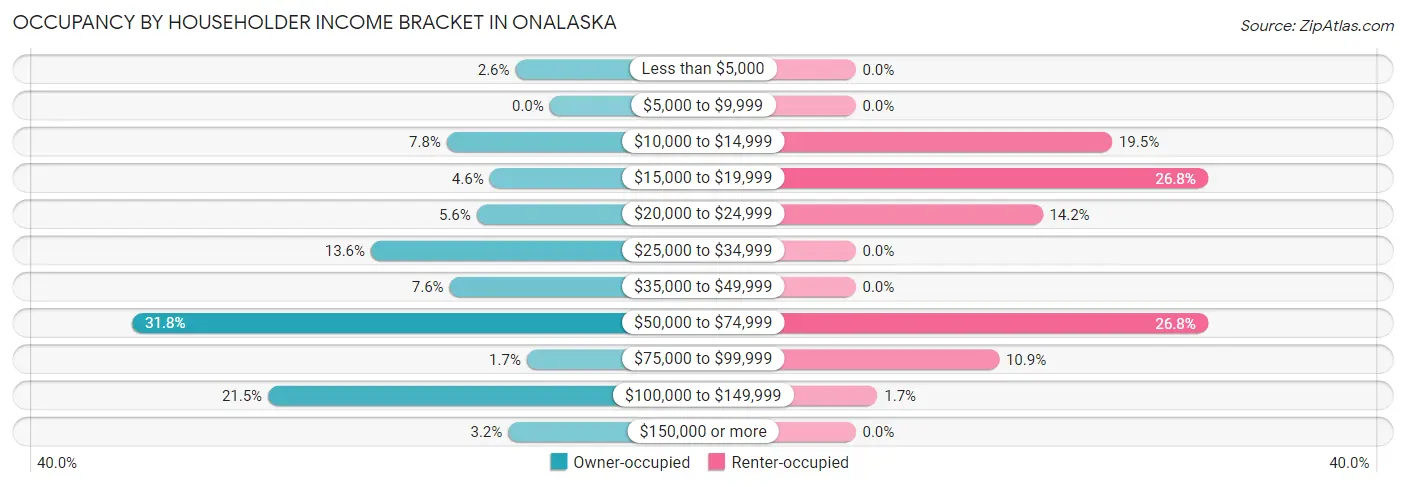
| Income Bracket | Owner-occupied | Renter-occupied |
| Less than $5,000 | 24 (2.6%) | 0 (0.0%) |
| $5,000 to $9,999 | 0 (0.0%) | 0 (0.0%) |
| $10,000 to $14,999 | 72 (7.8%) | 59 (19.5%) |
| $15,000 to $19,999 | 42 (4.6%) | 81 (26.8%) |
| $20,000 to $24,999 | 51 (5.6%) | 43 (14.2%) |
| $25,000 to $34,999 | 125 (13.6%) | 0 (0.0%) |
| $35,000 to $49,999 | 70 (7.6%) | 0 (0.0%) |
| $50,000 to $74,999 | 292 (31.8%) | 81 (26.8%) |
| $75,000 to $99,999 | 16 (1.7%) | 33 (10.9%) |
| $100,000 to $149,999 | 197 (21.5%) | 5 (1.7%) |
| $150,000 or more | 29 (3.2%) | 0 (0.0%) |
| Total | 918 (100.0%) | 302 (100.0%) |
Monthly Housing Cost Tiers in Onalaska
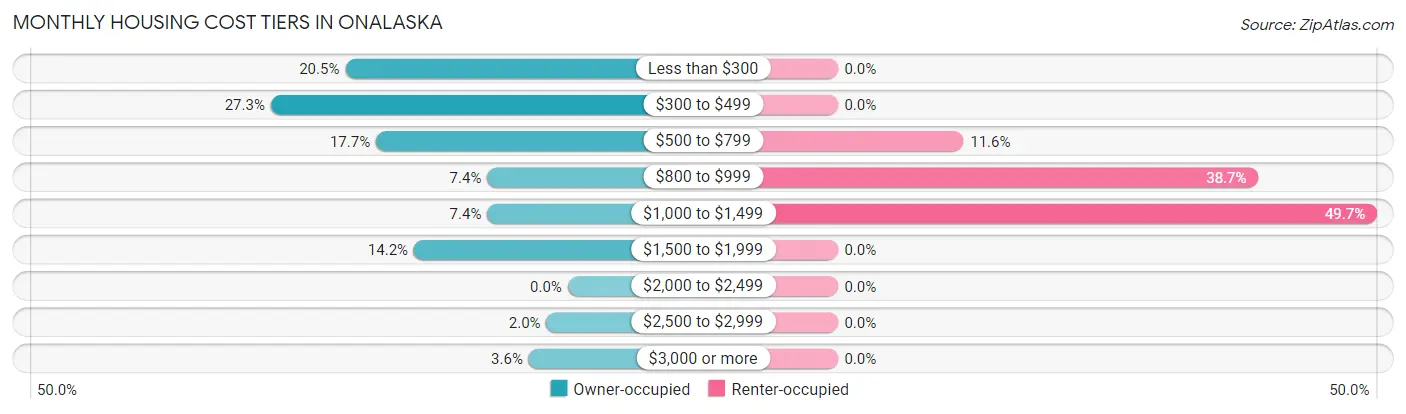
| Monthly Cost | Owner-occupied | Renter-occupied |
| Less than $300 | 188 (20.5%) | 0 (0.0%) |
| $300 to $499 | 251 (27.3%) | 0 (0.0%) |
| $500 to $799 | 162 (17.6%) | 35 (11.6%) |
| $800 to $999 | 68 (7.4%) | 117 (38.7%) |
| $1,000 to $1,499 | 68 (7.4%) | 150 (49.7%) |
| $1,500 to $1,999 | 130 (14.2%) | 0 (0.0%) |
| $2,000 to $2,499 | 0 (0.0%) | 0 (0.0%) |
| $2,500 to $2,999 | 18 (2.0%) | 0 (0.0%) |
| $3,000 or more | 33 (3.6%) | 0 (0.0%) |
| Total | 918 (100.0%) | 302 (100.0%) |
Physical Housing Characteristics in Onalaska
Housing Structures in Onalaska
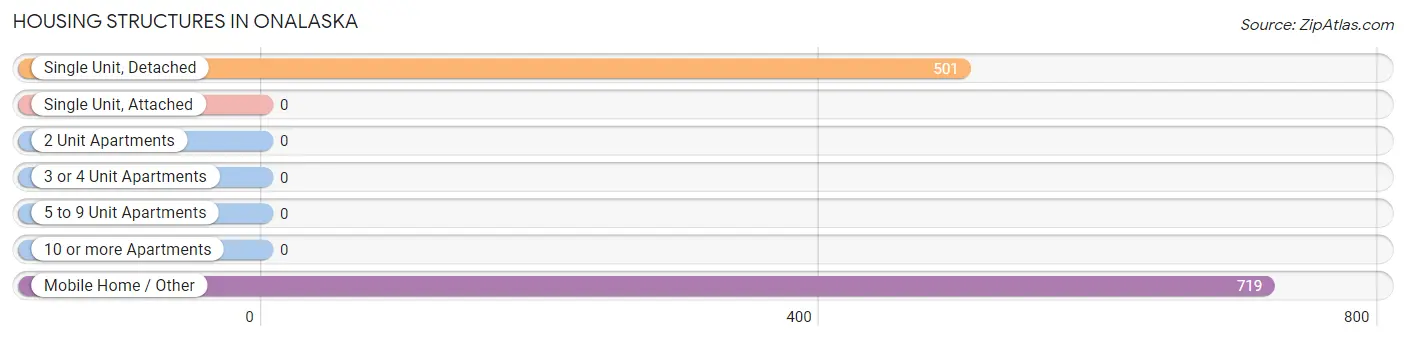
| Structure Type | # Housing Units | % Housing Units |
| Single Unit, Detached | 501 | 41.1% |
| Single Unit, Attached | 0 | 0.0% |
| 2 Unit Apartments | 0 | 0.0% |
| 3 or 4 Unit Apartments | 0 | 0.0% |
| 5 to 9 Unit Apartments | 0 | 0.0% |
| 10 or more Apartments | 0 | 0.0% |
| Mobile Home / Other | 719 | 58.9% |
| Total | 1,220 | 100.0% |
Housing Structures by Occupancy in Onalaska
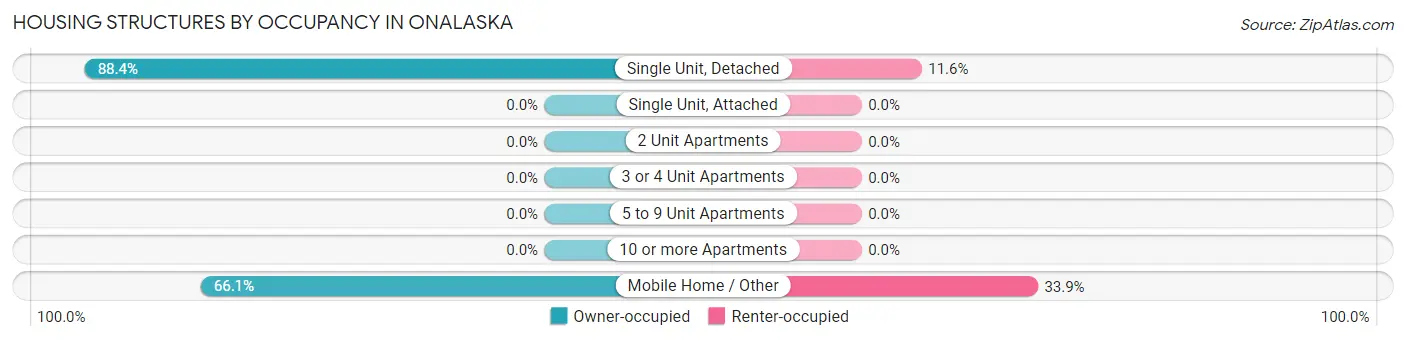
| Structure Type | Owner-occupied | Renter-occupied |
| Single Unit, Detached | 443 (88.4%) | 58 (11.6%) |
| Single Unit, Attached | 0 (0.0%) | 0 (0.0%) |
| 2 Unit Apartments | 0 (0.0%) | 0 (0.0%) |
| 3 or 4 Unit Apartments | 0 (0.0%) | 0 (0.0%) |
| 5 to 9 Unit Apartments | 0 (0.0%) | 0 (0.0%) |
| 10 or more Apartments | 0 (0.0%) | 0 (0.0%) |
| Mobile Home / Other | 475 (66.1%) | 244 (33.9%) |
| Total | 918 (75.2%) | 302 (24.7%) |
Housing Structures by Number of Rooms in Onalaska
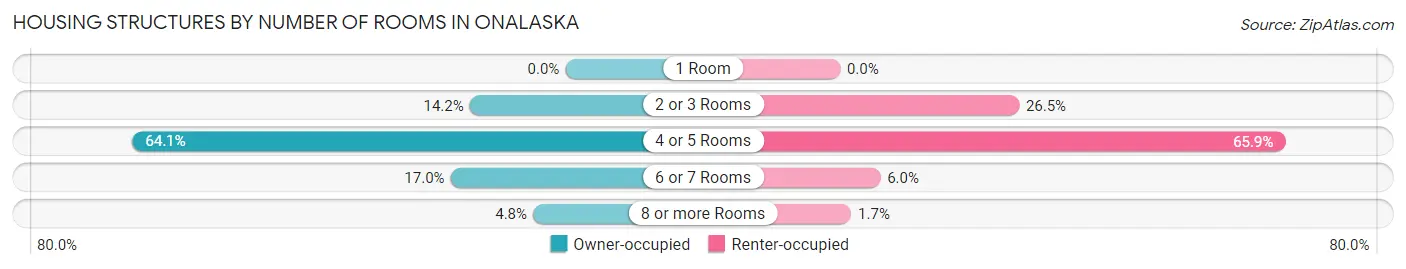
| Number of Rooms | Owner-occupied | Renter-occupied |
| 1 Room | 0 (0.0%) | 0 (0.0%) |
| 2 or 3 Rooms | 130 (14.2%) | 80 (26.5%) |
| 4 or 5 Rooms | 588 (64.0%) | 199 (65.9%) |
| 6 or 7 Rooms | 156 (17.0%) | 18 (6.0%) |
| 8 or more Rooms | 44 (4.8%) | 5 (1.7%) |
| Total | 918 (100.0%) | 302 (100.0%) |
Housing Structure by Heating Type in Onalaska
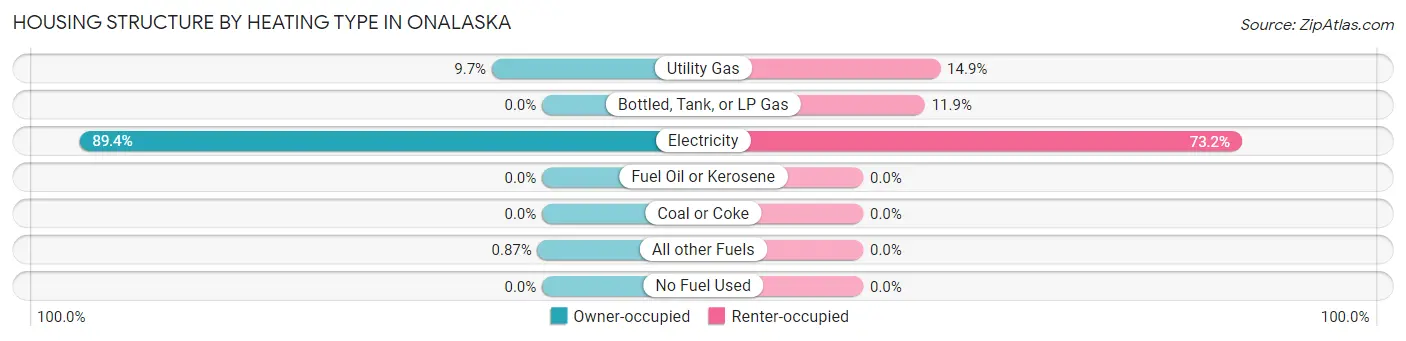
| Heating Type | Owner-occupied | Renter-occupied |
| Utility Gas | 89 (9.7%) | 45 (14.9%) |
| Bottled, Tank, or LP Gas | 0 (0.0%) | 36 (11.9%) |
| Electricity | 821 (89.4%) | 221 (73.2%) |
| Fuel Oil or Kerosene | 0 (0.0%) | 0 (0.0%) |
| Coal or Coke | 0 (0.0%) | 0 (0.0%) |
| All other Fuels | 8 (0.9%) | 0 (0.0%) |
| No Fuel Used | 0 (0.0%) | 0 (0.0%) |
| Total | 918 (100.0%) | 302 (100.0%) |
Household Vehicle Usage in Onalaska
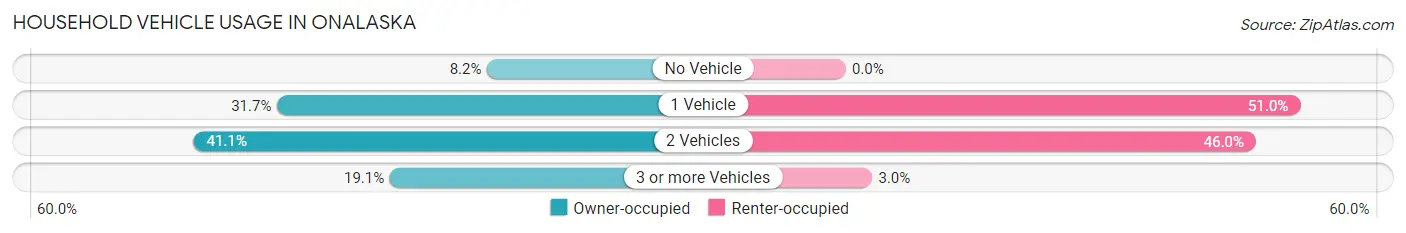
| Vehicles per Household | Owner-occupied | Renter-occupied |
| No Vehicle | 75 (8.2%) | 0 (0.0%) |
| 1 Vehicle | 291 (31.7%) | 154 (51.0%) |
| 2 Vehicles | 377 (41.1%) | 139 (46.0%) |
| 3 or more Vehicles | 175 (19.1%) | 9 (3.0%) |
| Total | 918 (100.0%) | 302 (100.0%) |
Real Estate & Mortgages in Onalaska
Real Estate and Mortgage Overview in Onalaska
| Characteristic | Without Mortgage | With Mortgage |
| Housing Units | 545 | 373 |
| Median Property Value | $47,500 | $213,700 |
| Median Household Income | $46,406 | $29 |
| Monthly Housing Costs | $391 | $33 |
| Real Estate Taxes | $449 | $16 |
Property Value by Mortgage Status in Onalaska
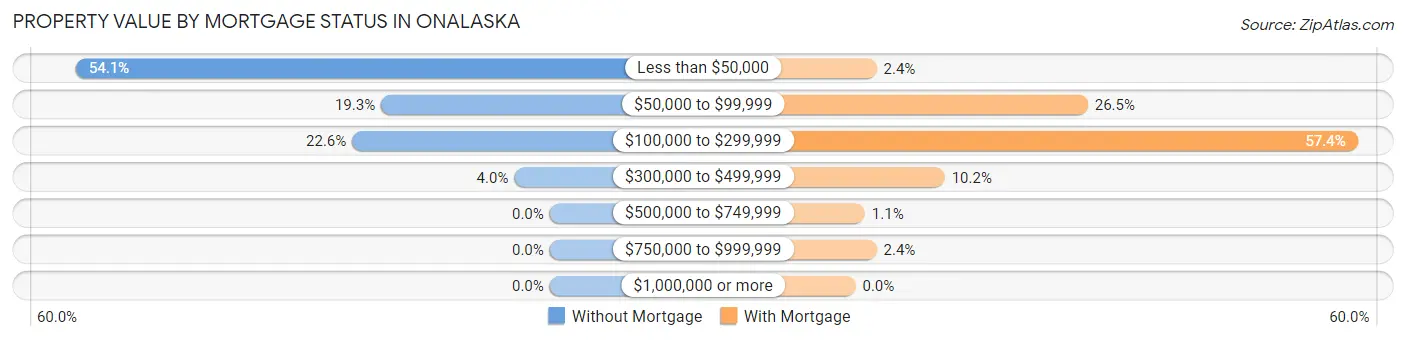
| Property Value | Without Mortgage | With Mortgage |
| Less than $50,000 | 295 (54.1%) | 9 (2.4%) |
| $50,000 to $99,999 | 105 (19.3%) | 99 (26.5%) |
| $100,000 to $299,999 | 123 (22.6%) | 214 (57.4%) |
| $300,000 to $499,999 | 22 (4.0%) | 38 (10.2%) |
| $500,000 to $749,999 | 0 (0.0%) | 4 (1.1%) |
| $750,000 to $999,999 | 0 (0.0%) | 9 (2.4%) |
| $1,000,000 or more | 0 (0.0%) | 0 (0.0%) |
| Total | 545 (100.0%) | 373 (100.0%) |
Household Income by Mortgage Status in Onalaska
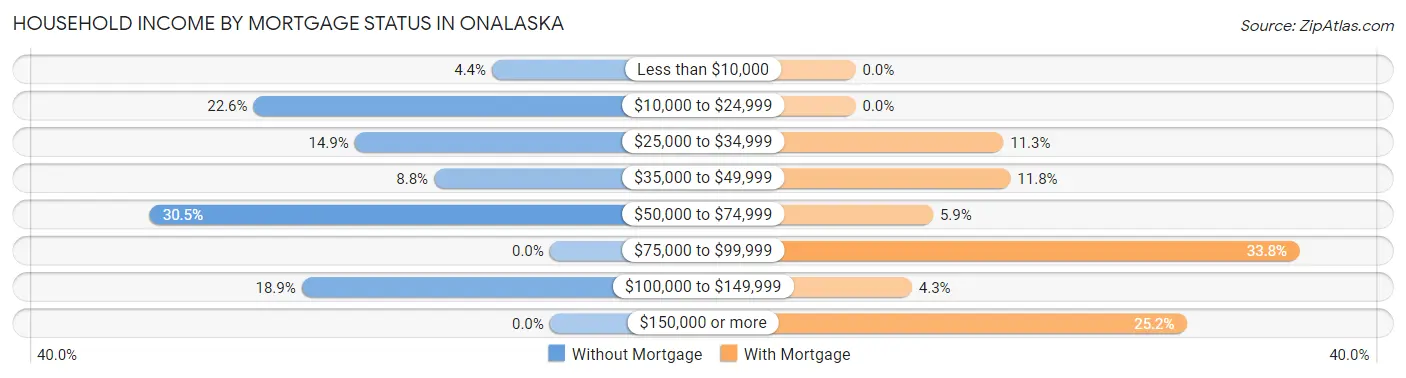
| Household Income | Without Mortgage | With Mortgage |
| Less than $10,000 | 24 (4.4%) | 0 (0.0%) |
| $10,000 to $24,999 | 123 (22.6%) | 0 (0.0%) |
| $25,000 to $34,999 | 81 (14.9%) | 42 (11.3%) |
| $35,000 to $49,999 | 48 (8.8%) | 44 (11.8%) |
| $50,000 to $74,999 | 166 (30.5%) | 22 (5.9%) |
| $75,000 to $99,999 | 0 (0.0%) | 126 (33.8%) |
| $100,000 to $149,999 | 103 (18.9%) | 16 (4.3%) |
| $150,000 or more | 0 (0.0%) | 94 (25.2%) |
| Total | 545 (100.0%) | 373 (100.0%) |
Property Value to Household Income Ratio in Onalaska
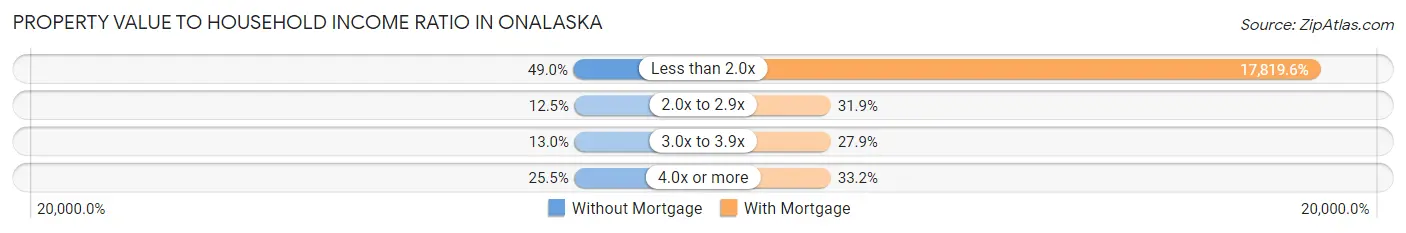
| Value-to-Income Ratio | Without Mortgage | With Mortgage |
| Less than 2.0x | 267 (49.0%) | 66,467 (17,819.6%) |
| 2.0x to 2.9x | 68 (12.5%) | 119 (31.9%) |
| 3.0x to 3.9x | 71 (13.0%) | 104 (27.9%) |
| 4.0x or more | 139 (25.5%) | 124 (33.2%) |
| Total | 545 (100.0%) | 373 (100.0%) |
Real Estate Taxes by Mortgage Status in Onalaska
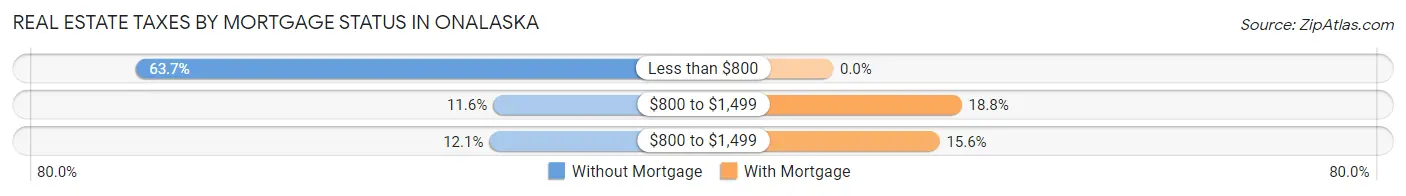
| Property Taxes | Without Mortgage | With Mortgage |
| Less than $800 | 347 (63.7%) | 0 (0.0%) |
| $800 to $1,499 | 63 (11.6%) | 70 (18.8%) |
| $800 to $1,499 | 66 (12.1%) | 58 (15.5%) |
| Total | 545 (100.0%) | 373 (100.0%) |
Health & Disability in Onalaska
Health Insurance Coverage by Age in Onalaska
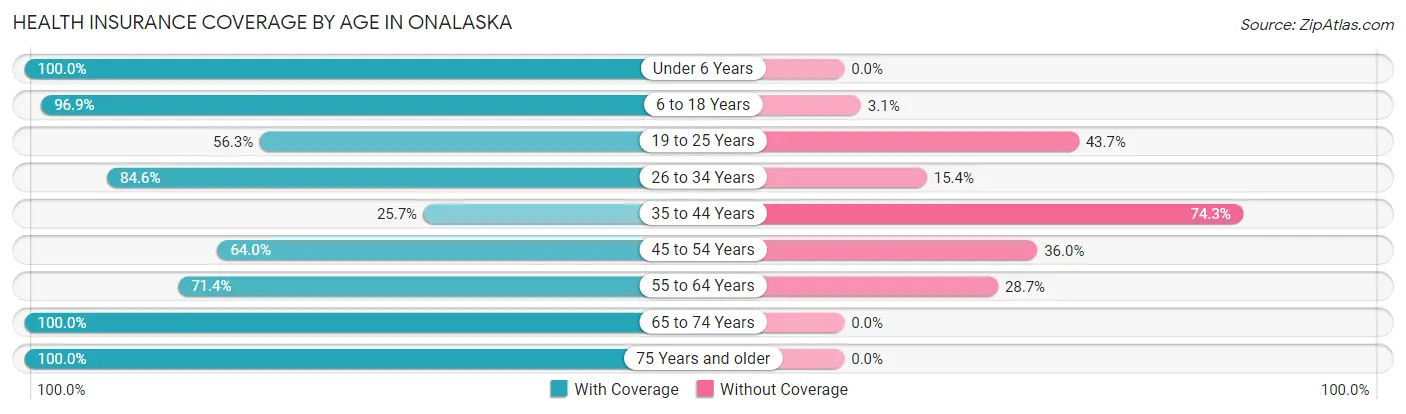
| Age Bracket | With Coverage | Without Coverage |
| Under 6 Years | 254 (100.0%) | 0 (0.0%) |
| 6 to 18 Years | 562 (96.9%) | 18 (3.1%) |
| 19 to 25 Years | 103 (56.3%) | 80 (43.7%) |
| 26 to 34 Years | 88 (84.6%) | 16 (15.4%) |
| 35 to 44 Years | 98 (25.7%) | 283 (74.3%) |
| 45 to 54 Years | 443 (64.0%) | 249 (36.0%) |
| 55 to 64 Years | 259 (71.4%) | 104 (28.6%) |
| 65 to 74 Years | 396 (100.0%) | 0 (0.0%) |
| 75 Years and older | 97 (100.0%) | 0 (0.0%) |
| Total | 2,300 (75.4%) | 750 (24.6%) |
Health Insurance Coverage by Citizenship Status in Onalaska
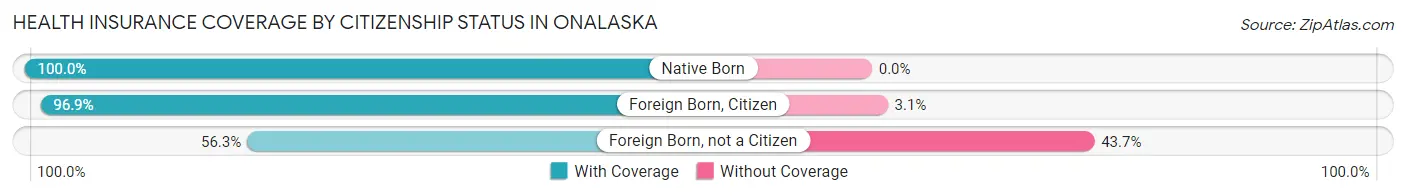
| Citizenship Status | With Coverage | Without Coverage |
| Native Born | 254 (100.0%) | 0 (0.0%) |
| Foreign Born, Citizen | 562 (96.9%) | 18 (3.1%) |
| Foreign Born, not a Citizen | 103 (56.3%) | 80 (43.7%) |
Health Insurance Coverage by Household Income in Onalaska
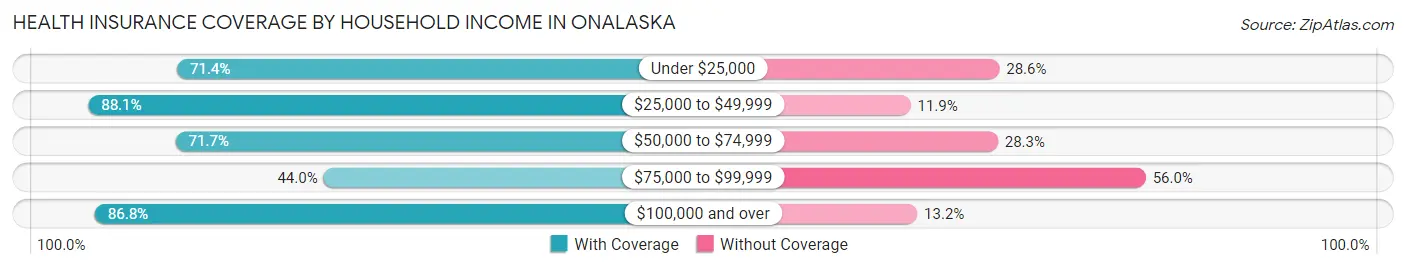
| Household Income | With Coverage | Without Coverage |
| Under $25,000 | 475 (71.4%) | 190 (28.6%) |
| $25,000 to $49,999 | 332 (88.1%) | 45 (11.9%) |
| $50,000 to $74,999 | 943 (71.7%) | 372 (28.3%) |
| $75,000 to $99,999 | 55 (44.0%) | 70 (56.0%) |
| $100,000 and over | 481 (86.8%) | 73 (13.2%) |
Public vs Private Health Insurance Coverage by Age in Onalaska
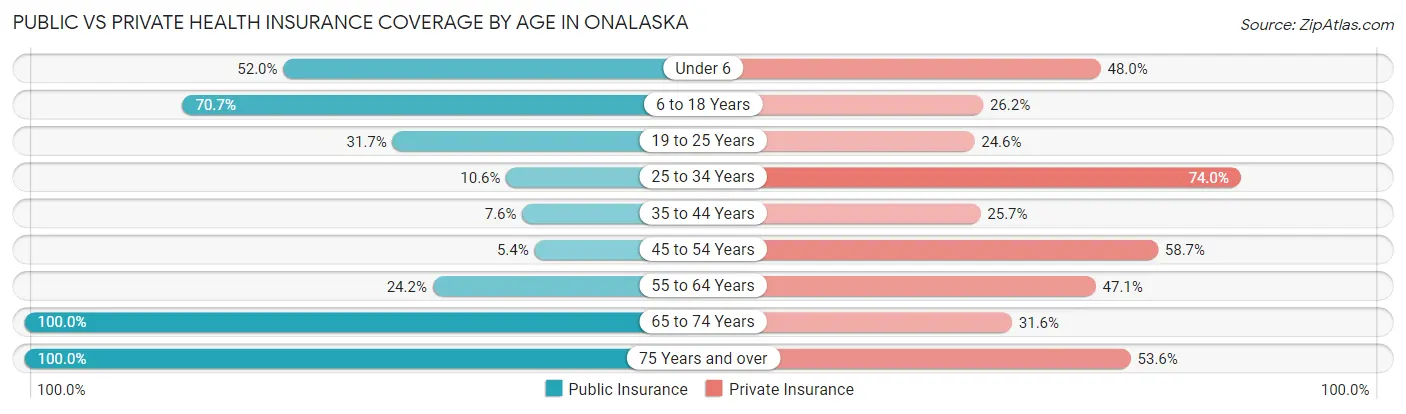
| Age Bracket | Public Insurance | Private Insurance |
| Under 6 | 132 (52.0%) | 122 (48.0%) |
| 6 to 18 Years | 410 (70.7%) | 152 (26.2%) |
| 19 to 25 Years | 58 (31.7%) | 45 (24.6%) |
| 25 to 34 Years | 11 (10.6%) | 77 (74.0%) |
| 35 to 44 Years | 29 (7.6%) | 98 (25.7%) |
| 45 to 54 Years | 37 (5.3%) | 406 (58.7%) |
| 55 to 64 Years | 88 (24.2%) | 171 (47.1%) |
| 65 to 74 Years | 396 (100.0%) | 125 (31.6%) |
| 75 Years and over | 97 (100.0%) | 52 (53.6%) |
| Total | 1,258 (41.2%) | 1,248 (40.9%) |
Disability Status by Sex by Age in Onalaska
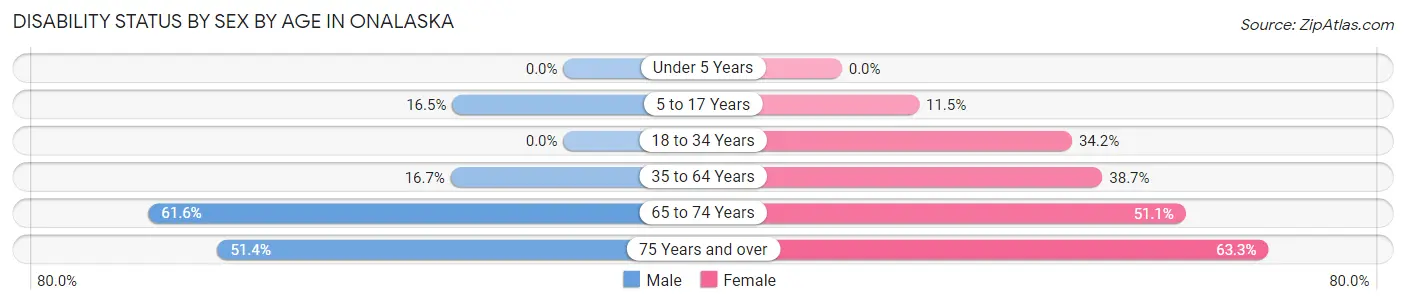
| Age Bracket | Male | Female |
| Under 5 Years | 0 (0.0%) | 0 (0.0%) |
| 5 to 17 Years | 34 (16.5%) | 53 (11.5%) |
| 18 to 34 Years | 0 (0.0%) | 54 (34.2%) |
| 35 to 64 Years | 130 (16.7%) | 255 (38.7%) |
| 65 to 74 Years | 69 (61.6%) | 145 (51.1%) |
| 75 Years and over | 19 (51.3%) | 38 (63.3%) |
Disability Class by Sex by Age in Onalaska
Disability Class: Hearing Difficulty
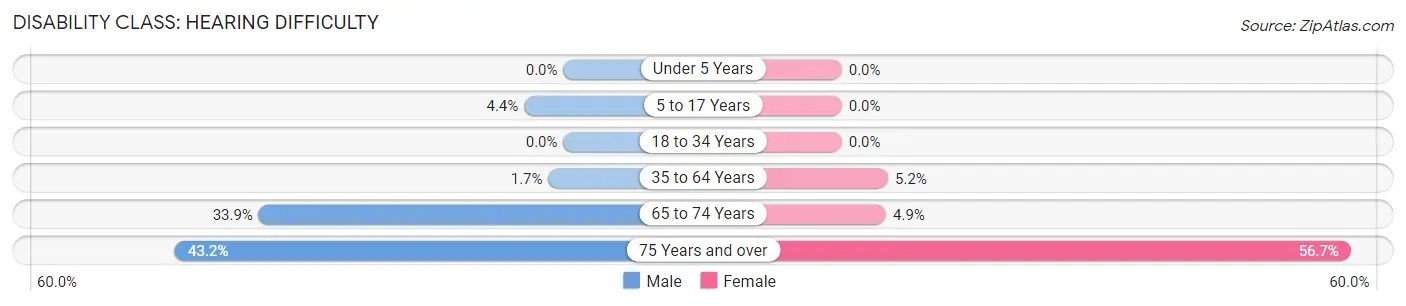
| Age Bracket | Male | Female |
| Under 5 Years | 0 (0.0%) | 0 (0.0%) |
| 5 to 17 Years | 9 (4.4%) | 0 (0.0%) |
| 18 to 34 Years | 0 (0.0%) | 0 (0.0%) |
| 35 to 64 Years | 13 (1.7%) | 34 (5.2%) |
| 65 to 74 Years | 38 (33.9%) | 14 (4.9%) |
| 75 Years and over | 16 (43.2%) | 34 (56.7%) |
Disability Class: Vision Difficulty
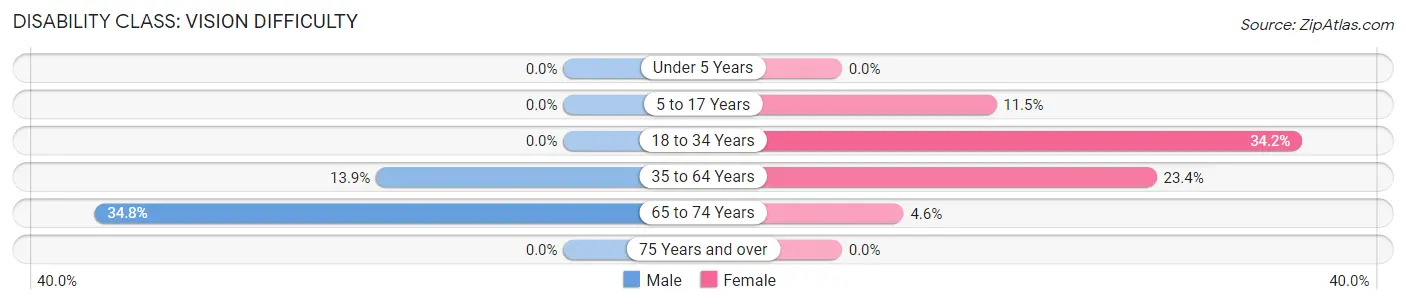
| Age Bracket | Male | Female |
| Under 5 Years | 0 (0.0%) | 0 (0.0%) |
| 5 to 17 Years | 0 (0.0%) | 53 (11.5%) |
| 18 to 34 Years | 0 (0.0%) | 54 (34.2%) |
| 35 to 64 Years | 108 (13.9%) | 154 (23.4%) |
| 65 to 74 Years | 39 (34.8%) | 13 (4.6%) |
| 75 Years and over | 0 (0.0%) | 0 (0.0%) |
Disability Class: Cognitive Difficulty
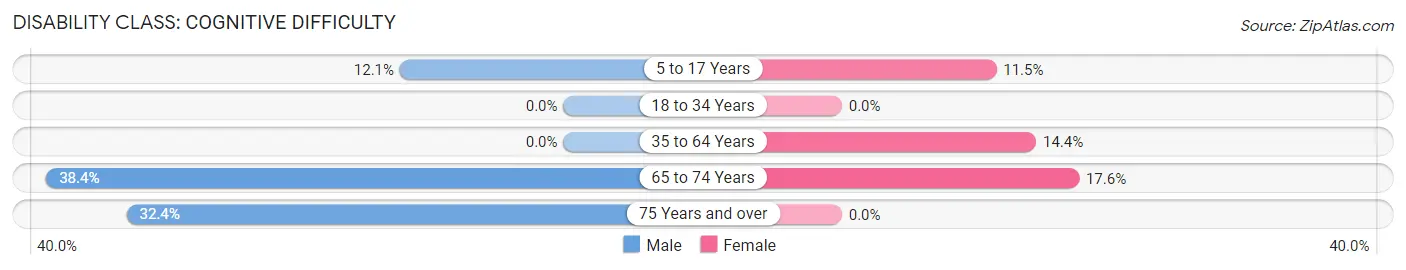
| Age Bracket | Male | Female |
| 5 to 17 Years | 25 (12.1%) | 53 (11.5%) |
| 18 to 34 Years | 0 (0.0%) | 0 (0.0%) |
| 35 to 64 Years | 0 (0.0%) | 95 (14.4%) |
| 65 to 74 Years | 43 (38.4%) | 50 (17.6%) |
| 75 Years and over | 12 (32.4%) | 0 (0.0%) |
Disability Class: Ambulatory Difficulty
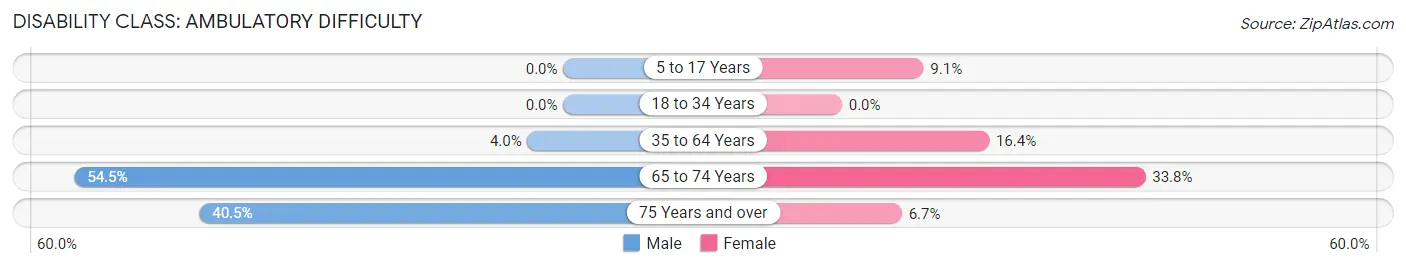
| Age Bracket | Male | Female |
| 5 to 17 Years | 0 (0.0%) | 42 (9.1%) |
| 18 to 34 Years | 0 (0.0%) | 0 (0.0%) |
| 35 to 64 Years | 31 (4.0%) | 108 (16.4%) |
| 65 to 74 Years | 61 (54.5%) | 96 (33.8%) |
| 75 Years and over | 15 (40.5%) | 4 (6.7%) |
Disability Class: Self-Care Difficulty
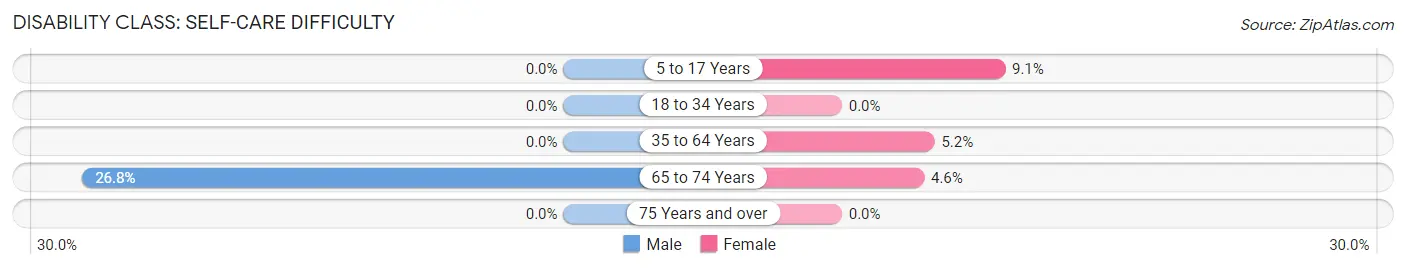
| Age Bracket | Male | Female |
| 5 to 17 Years | 0 (0.0%) | 42 (9.1%) |
| 18 to 34 Years | 0 (0.0%) | 0 (0.0%) |
| 35 to 64 Years | 0 (0.0%) | 34 (5.2%) |
| 65 to 74 Years | 30 (26.8%) | 13 (4.6%) |
| 75 Years and over | 0 (0.0%) | 0 (0.0%) |
Technology Access in Onalaska
Computing Device Access in Onalaska
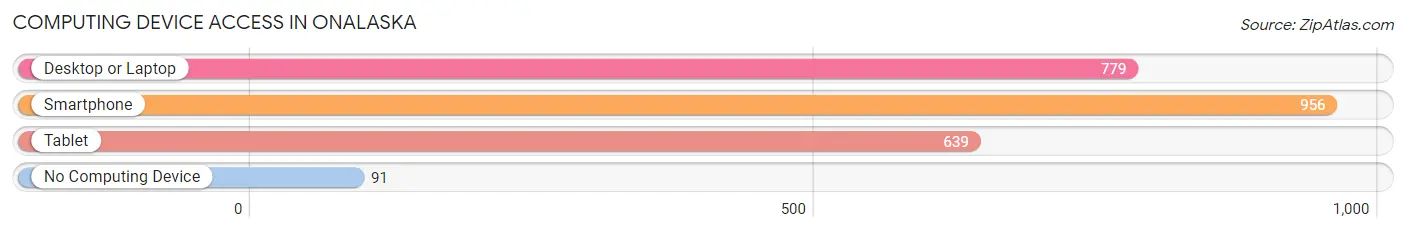
| Device Type | # Households | % Households |
| Desktop or Laptop | 779 | 63.8% |
| Smartphone | 956 | 78.4% |
| Tablet | 639 | 52.4% |
| No Computing Device | 91 | 7.5% |
| Total | 1,220 | 100.0% |
Internet Access in Onalaska
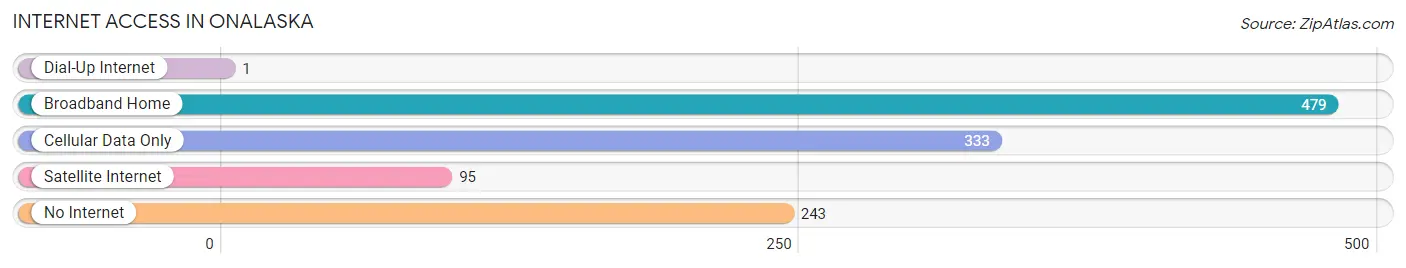
| Internet Type | # Households | % Households |
| Dial-Up Internet | 1 | 0.1% |
| Broadband Home | 479 | 39.3% |
| Cellular Data Only | 333 | 27.3% |
| Satellite Internet | 95 | 7.8% |
| No Internet | 243 | 19.9% |
| Total | 1,220 | 100.0% |
Onalaska Summary
Onalaska, Texas is a small town located in Polk County, Texas, United States. It is situated on the western edge of the Big Thicket National Preserve, and is part of the Houston–The Woodlands–Sugar Land metropolitan area. The population of Onalaska was 1,845 at the 2010 census.
History
Onalaska was founded in 1871 by a group of settlers from Onalaska, Wisconsin. The town was named after the Wisconsin city, which was in turn named after the Onalaska River in Wisconsin. The settlers were attracted to the area by the abundance of timber and the potential for farming.
The first post office in Onalaska was established in 1872, and the town was incorporated in 1876. The town grew slowly, and by the early 1900s, it had a population of around 500.
In the early 1900s, the timber industry began to boom in Onalaska, and the town became a major center for the production of lumber. The town also became a center for the production of turpentine and other products derived from the timber industry.
In the late 1940s, the timber industry began to decline, and the town's economy shifted to focus on agriculture. The town also began to attract tourists, as the Big Thicket National Preserve was established nearby in 1974.
Geography
Onalaska is located at the intersection of U.S. Route 190 and State Highway 146, about 25 miles (40 km) west of Livingston and about 50 miles (80 km) north of Beaumont. The town is situated on the western edge of the Big Thicket National Preserve, and is part of the Houston–The Woodlands–Sugar Land metropolitan area.
The town has a total area of 1.3 square miles (3.4 km2), all of which is land. The terrain is mostly flat, with some rolling hills. The town is located in the Piney Woods region of East Texas, and is surrounded by forests of pine and hardwood trees.
Economy
Onalaska's economy is largely based on agriculture and tourism. The town is home to several farms, which produce a variety of crops, including cotton, corn, soybeans, and hay. The town is also home to several tourist attractions, including the Big Thicket National Preserve, the Onalaska Wildlife Management Area, and the Onalaska State Park.
The town is also home to several small businesses, including restaurants, convenience stores, and gas stations. The town is served by the Onalaska Independent School District, which operates two elementary schools, one middle school, and one high school.
Demographics
As of the 2010 census, there were 1,845 people, 690 households, and 486 families residing in the town. The population density was 1,417.3 people per square mile (546.7/km2). There were 790 housing units at an average density of 602.3 per square mile (232.7/km2). The racial makeup of the town was 79.2% White, 15.2% African American, 0.2% Native American, 0.5% Asian, 0.1% Pacific Islander, 3.2% from other races, and 1.7% from two or more races. Hispanic or Latino of any race were 8.2% of the population.
There were 690 households, out of which 33.3% had children under the age of 18 living with them, 48.3% were married couples living together, 15.9% had a female householder with no husband present, and 30.3% were non-families. 25.2% of all households were made up of individuals, and 11.3% had someone living alone who was 65 years of age or older. The average household size was 2.67 and the average family size was 3.20.
In the town, the population was spread out, with 28.2% under the age of 18, 8.2% from 18 to 24, 25.7% from 25 to 44, 24.2% from 45 to 64, and 13.7% who were 65 years of age or older. The median age was 36 years. For every 100 females, there were 94.2 males. For every 100 females age 18 and over, there were 90.2 males.
The median income for a household in the town was $30,938, and the median income for a family was $35,625. Males had a median income of $30,000 versus $20,000 for females. The per capita income for the town was $14,945. About 14.2% of families and 17.2% of the population were below the poverty line, including 22.2% of those under age 18 and 14.3% of those age 65 or over.
Common Questions
What is Per Capita Income in Onalaska?
Per Capita income in Onalaska is $25,470.
What is the Median Family Income in Onalaska?
Median Family Income in Onalaska is $66,484.
What is the Median Household income in Onalaska?
Median Household Income in Onalaska is $56,168.
What is Income or Wage Gap in Onalaska?
Income or Wage Gap in Onalaska is 83.1%.
Women in Onalaska earn 16.9 cents for every dollar earned by a man.
What is Inequality or Gini Index in Onalaska?
Inequality or Gini Index in Onalaska is 0.43.
What is the Total Population of Onalaska?
Total Population of Onalaska is 3,050.
What is the Total Male Population of Onalaska?
Total Male Population of Onalaska is 1,355.
What is the Total Female Population of Onalaska?
Total Female Population of Onalaska is 1,695.
What is the Ratio of Males per 100 Females in Onalaska?
There are 79.94 Males per 100 Females in Onalaska.
What is the Ratio of Females per 100 Males in Onalaska?
There are 125.09 Females per 100 Males in Onalaska.
What is the Median Population Age in Onalaska?
Median Population Age in Onalaska is 45.2 Years.
What is the Average Family Size in Onalaska
Average Family Size in Onalaska is 3.1 People.
What is the Average Household Size in Onalaska
Average Household Size in Onalaska is 2.5 People.
How Large is the Labor Force in Onalaska?
There are 1,277 People in the Labor Forcein in Onalaska.
What is the Percentage of People in the Labor Force in Onalaska?
57.2% of People are in the Labor Force in Onalaska.
What is the Unemployment Rate in Onalaska?
Unemployment Rate in Onalaska is 9.5%.