Novice, TX Map & Demographics
Novice Map
Novice Overview
$24,838
PER CAPITA INCOME
$105,000
AVG FAMILY INCOME
0.47
INEQUALITY / GINI INDEX
86
TOTAL POPULATION
39
MALE POPULATION
47
FEMALE POPULATION
82.98
MALES / 100 FEMALES
120.51
FEMALES / 100 MALES
56.1
MEDIAN AGE
4.9
AVG FAMILY SIZE
3.7
AVG HOUSEHOLD SIZE
29
LABOR FORCE [ PEOPLE ]
37.7%
PERCENT IN LABOR FORCE
Novice Zip Codes
Novice Area Codes
Income in Novice
Income Overview in Novice
| Characteristic | Number | Measure |
| Per Capita Income | 86 | $24,838 |
| Median Family Income | 12 | $105,000 |
| Mean Family Income | 12 | $109,042 |
| Median Household Income | 23 | $0 |
| Mean Household Income | 23 | $70,009 |
| Income Deficit | 12 | $0 |
| Wage / Income Gap (%) | 86 | 0.00% |
| Wage / Income Gap ($) | 86 | 100.00¢ per $1 |
| Gini / Inequality Index | 86 | 0.47 |
Earnings by Sex in Novice
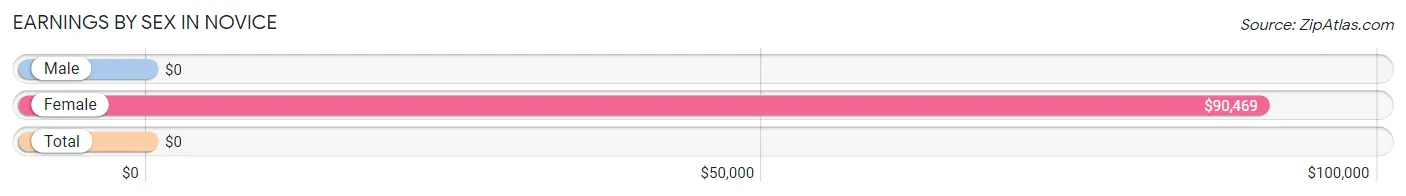
| Sex | Number | Average Earnings |
| Male | 17 (56.7%) | $0 |
| Female | 13 (43.3%) | $90,469 |
| Total | 30 (100.0%) | $0 |
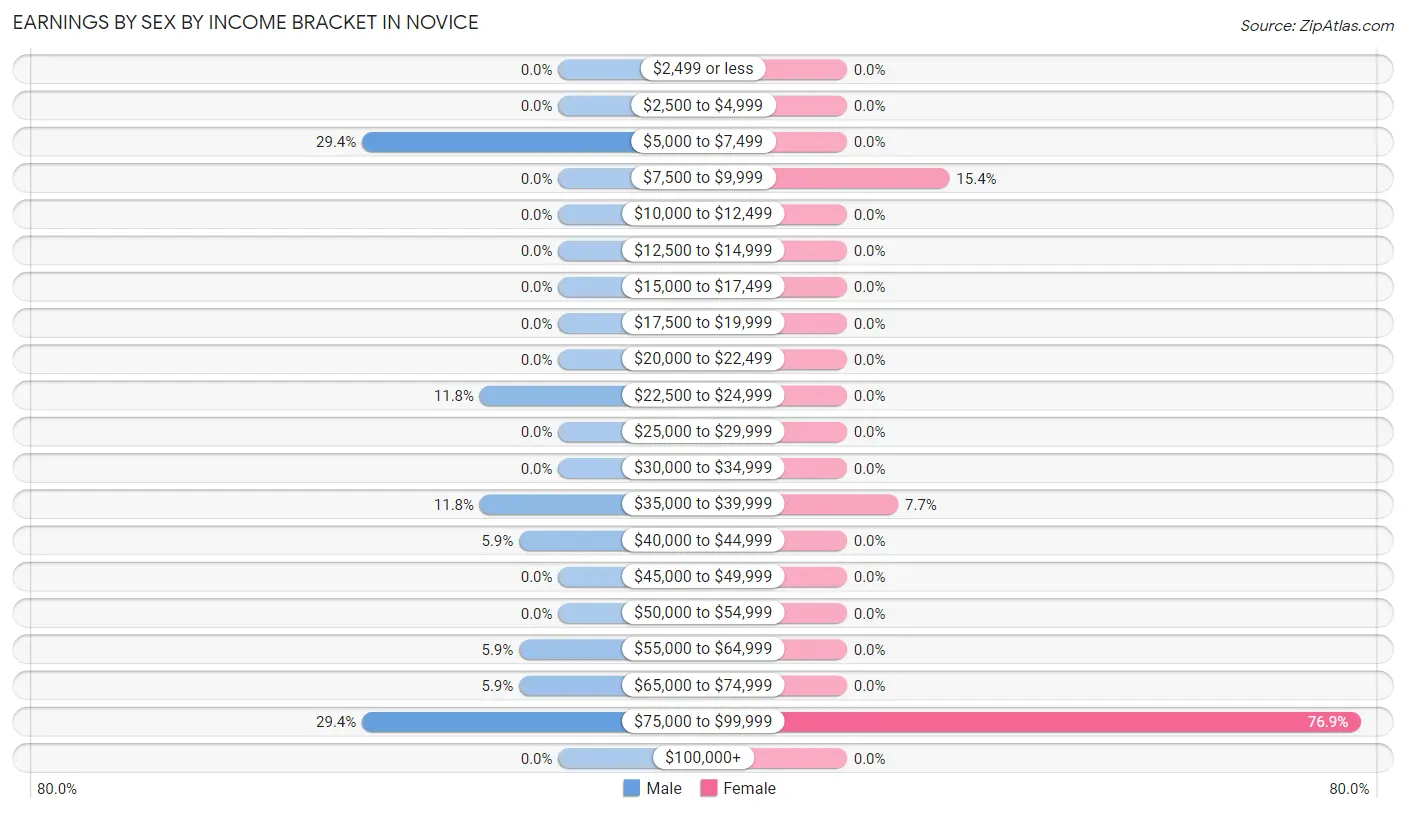
Earnings by Sex by Income Bracket in Novice
The most common earnings brackets in Novice are $5,000 to $7,499 for men (5 | 29.4%) and $75,000 to $99,999 for women (10 | 76.9%).
| Income | Male | Female |
| $2,499 or less | 0 (0.0%) | 0 (0.0%) |
| $2,500 to $4,999 | 0 (0.0%) | 0 (0.0%) |
| $5,000 to $7,499 | 5 (29.4%) | 0 (0.0%) |
| $7,500 to $9,999 | 0 (0.0%) | 2 (15.4%) |
| $10,000 to $12,499 | 0 (0.0%) | 0 (0.0%) |
| $12,500 to $14,999 | 0 (0.0%) | 0 (0.0%) |
| $15,000 to $17,499 | 0 (0.0%) | 0 (0.0%) |
| $17,500 to $19,999 | 0 (0.0%) | 0 (0.0%) |
| $20,000 to $22,499 | 0 (0.0%) | 0 (0.0%) |
| $22,500 to $24,999 | 2 (11.8%) | 0 (0.0%) |
| $25,000 to $29,999 | 0 (0.0%) | 0 (0.0%) |
| $30,000 to $34,999 | 0 (0.0%) | 0 (0.0%) |
| $35,000 to $39,999 | 2 (11.8%) | 1 (7.7%) |
| $40,000 to $44,999 | 1 (5.9%) | 0 (0.0%) |
| $45,000 to $49,999 | 0 (0.0%) | 0 (0.0%) |
| $50,000 to $54,999 | 0 (0.0%) | 0 (0.0%) |
| $55,000 to $64,999 | 1 (5.9%) | 0 (0.0%) |
| $65,000 to $74,999 | 1 (5.9%) | 0 (0.0%) |
| $75,000 to $99,999 | 5 (29.4%) | 10 (76.9%) |
| $100,000+ | 0 (0.0%) | 0 (0.0%) |
| Total | 17 (100.0%) | 13 (100.0%) |
Earnings by Sex by Educational Attainment in Novice
| Educational Attainment | Male Income | Female Income |
| Less than High School | - | - |
| High School Diploma | - | - |
| College or Associate's Degree | - | - |
| Bachelor's Degree | - | - |
| Graduate Degree | - | - |
| Total | - | - |
Family Income in Novice
Family Income Brackets in Novice
According to the Novice family income data, there are 3 families falling into the $75,000 to $99,999 income range, which is the most common income bracket and makes up 25.0% of all families.
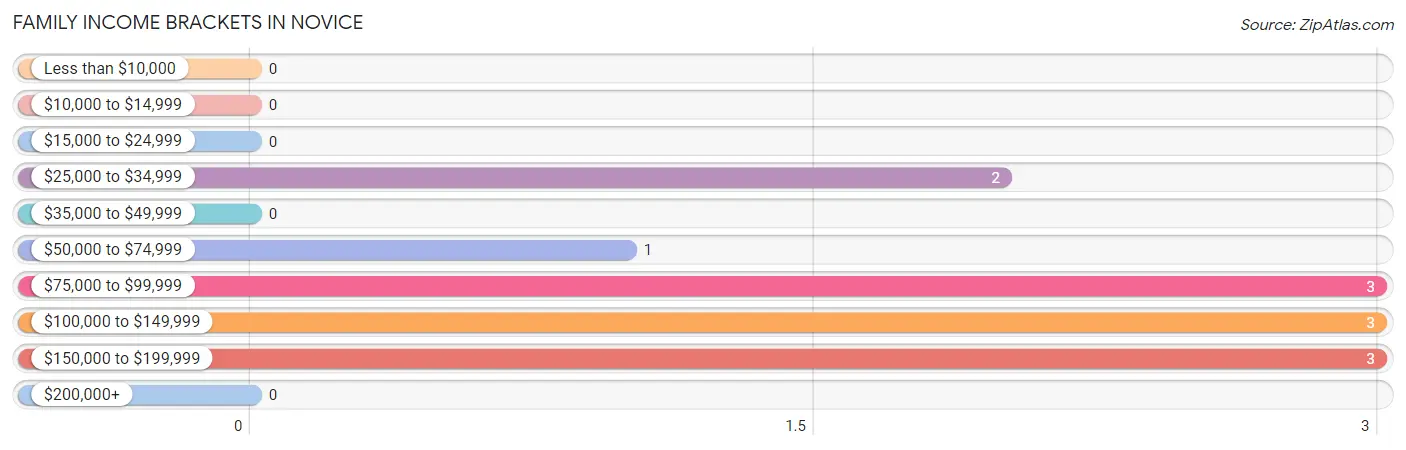
| Income Bracket | # Families | % Families |
| Less than $10,000 | 0 | 0.0% |
| $10,000 to $14,999 | 0 | 0.0% |
| $15,000 to $24,999 | 0 | 0.0% |
| $25,000 to $34,999 | 2 | 16.7% |
| $35,000 to $49,999 | 0 | 0.0% |
| $50,000 to $74,999 | 1 | 8.3% |
| $75,000 to $99,999 | 3 | 25.0% |
| $100,000 to $149,999 | 3 | 25.0% |
| $150,000 to $199,999 | 3 | 25.0% |
| $200,000+ | 0 | 0.0% |
Family Income by Famaliy Size in Novice
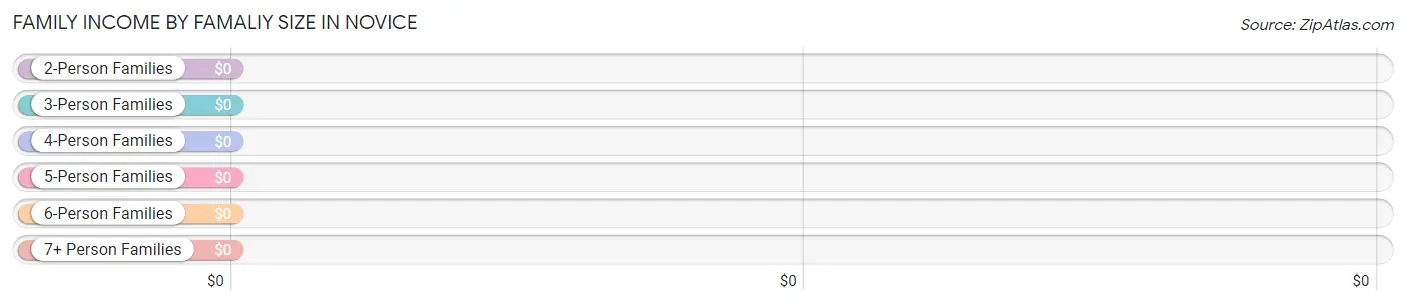
| Income Bracket | # Families | Median Income |
| 2-Person Families | 4 (33.3%) | $0 |
| 3-Person Families | 3 (25.0%) | $0 |
| 4-Person Families | 0 (0.0%) | $0 |
| 5-Person Families | 2 (16.7%) | $0 |
| 6-Person Families | 3 (25.0%) | $0 |
| 7+ Person Families | 0 (0.0%) | $0 |
| Total | 12 (100.0%) | $105,000 |
Family Income by Number of Earners in Novice
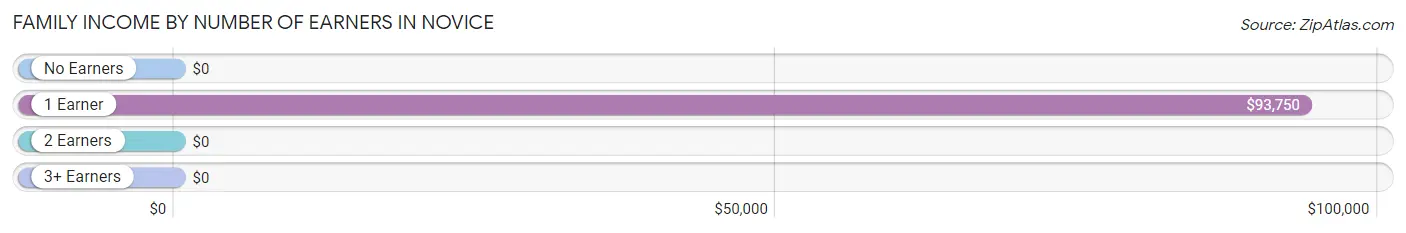
| Number of Earners | # Families | Median Income |
| No Earners | 0 (0.0%) | $0 |
| 1 Earner | 7 (58.3%) | $93,750 |
| 2 Earners | 2 (16.7%) | $0 |
| 3+ Earners | 3 (25.0%) | $0 |
| Total | 12 (100.0%) | $105,000 |
Household Income in Novice
Household Income Brackets in Novice
With 6 households falling in the category, the $15,000 to $24,999 income range is the most frequent in Novice, accounting for 26.1% of all households.
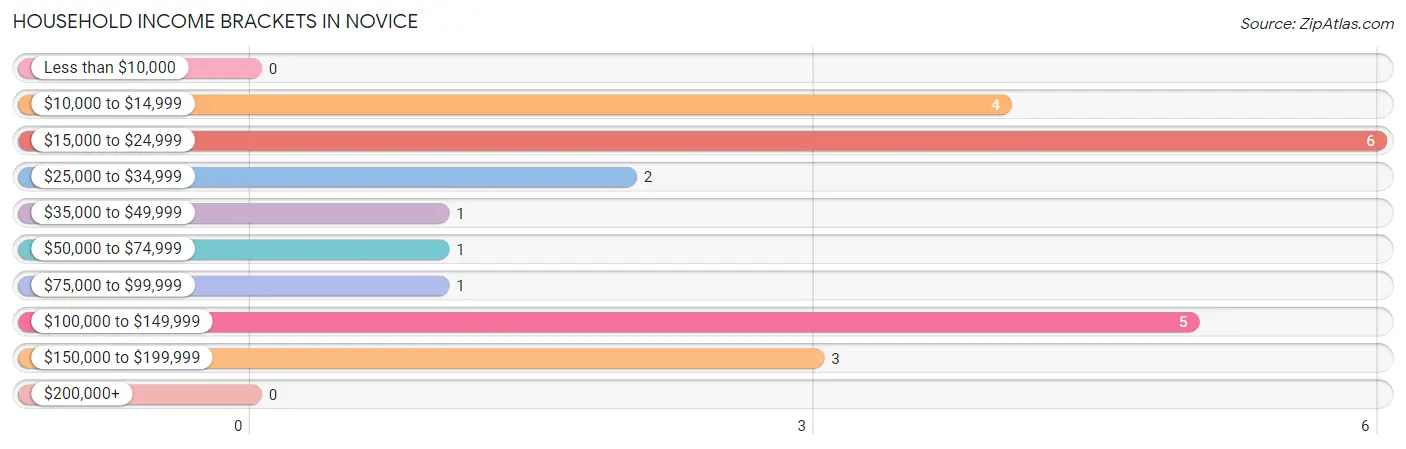
| Income Bracket | # Households | % Households |
| Less than $10,000 | 0 | 0.0% |
| $10,000 to $14,999 | 4 | 17.4% |
| $15,000 to $24,999 | 6 | 26.1% |
| $25,000 to $34,999 | 2 | 8.7% |
| $35,000 to $49,999 | 1 | 4.3% |
| $50,000 to $74,999 | 1 | 4.3% |
| $75,000 to $99,999 | 1 | 4.3% |
| $100,000 to $149,999 | 5 | 21.7% |
| $150,000 to $199,999 | 3 | 13.0% |
| $200,000+ | 0 | 0.0% |
Household Income by Householder Age in Novice
| Income Bracket | # Households | Median Income |
| 15 to 24 Years | 0 (0.0%) | $0 |
| 25 to 44 Years | 3 (13.0%) | $0 |
| 45 to 64 Years | 12 (52.2%) | $0 |
| 65+ Years | 8 (34.8%) | $0 |
| Total | 23 (100.0%) | $0 |
Poverty in Novice
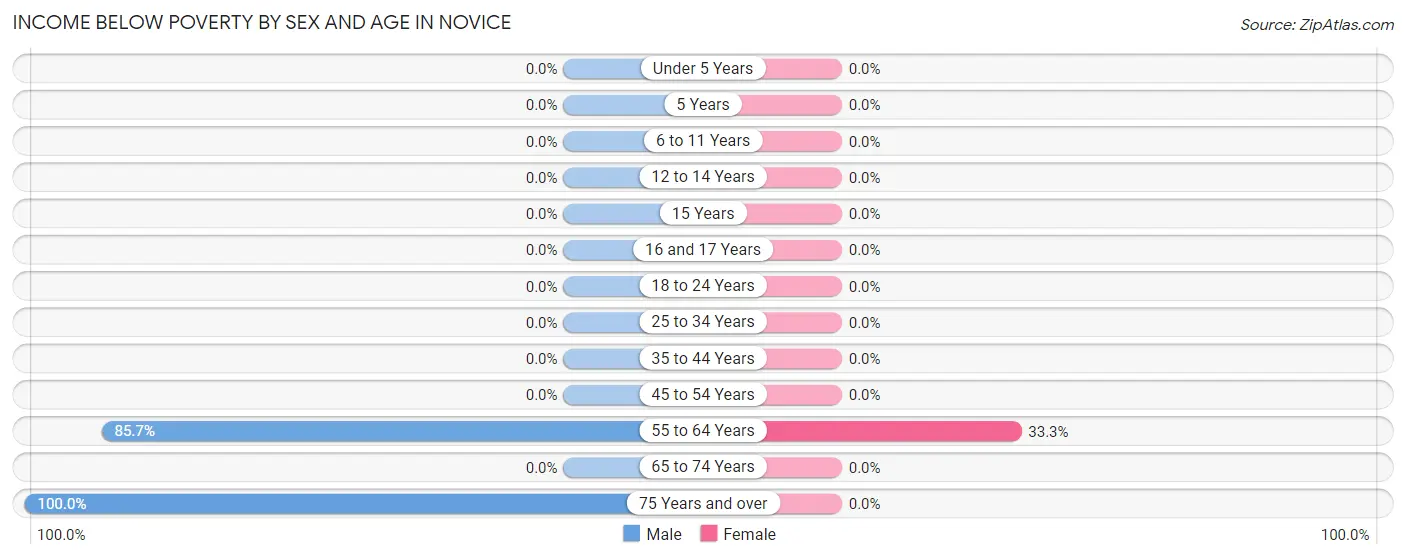
Income Below Poverty by Sex and Age in Novice
With 35.9% poverty level for males and 13.3% for females among the residents of Novice, 75 year old and over males and 55 to 64 year old females are the most vulnerable to poverty, with 2 males (100.0%) and 6 females (33.3%) in their respective age groups living below the poverty level.
| Age Bracket | Male | Female |
| Under 5 Years | 0 (0.0%) | 0 (0.0%) |
| 5 Years | 0 (0.0%) | 0 (0.0%) |
| 6 to 11 Years | 0 (0.0%) | 0 (0.0%) |
| 12 to 14 Years | 0 (0.0%) | 0 (0.0%) |
| 15 Years | 0 (0.0%) | 0 (0.0%) |
| 16 and 17 Years | 0 (0.0%) | 0 (0.0%) |
| 18 to 24 Years | 0 (0.0%) | 0 (0.0%) |
| 25 to 34 Years | 0 (0.0%) | 0 (0.0%) |
| 35 to 44 Years | 0 (0.0%) | 0 (0.0%) |
| 45 to 54 Years | 0 (0.0%) | 0 (0.0%) |
| 55 to 64 Years | 12 (85.7%) | 6 (33.3%) |
| 65 to 74 Years | 0 (0.0%) | 0 (0.0%) |
| 75 Years and over | 2 (100.0%) | 0 (0.0%) |
| Total | 14 (35.9%) | 6 (13.3%) |
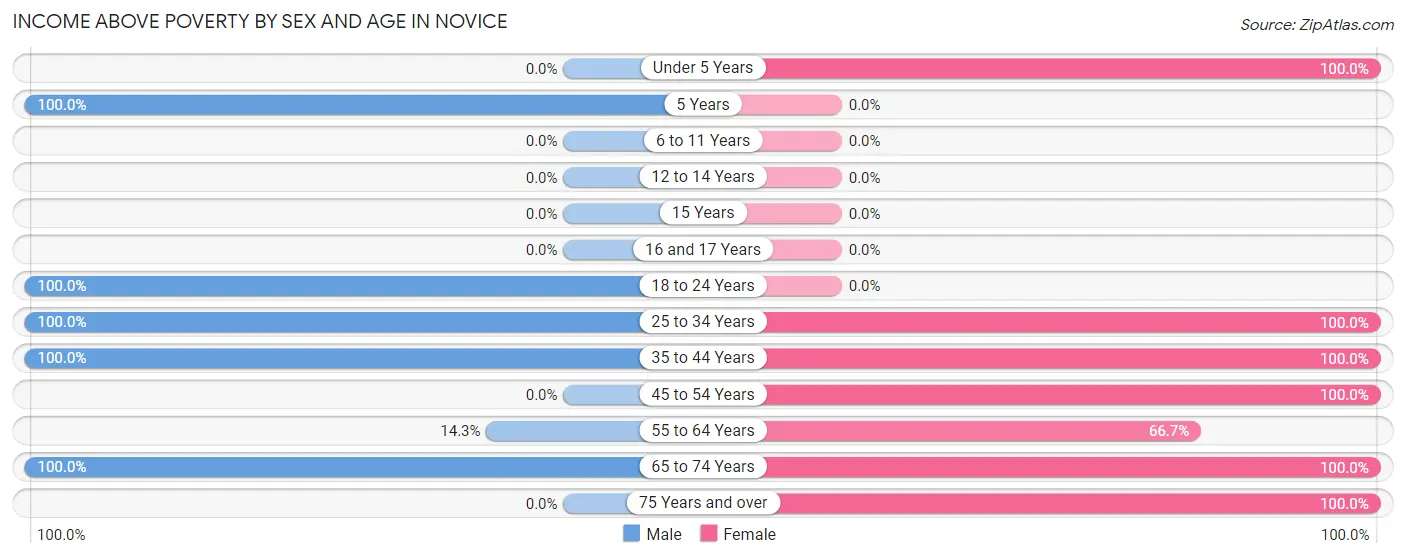
Income Above Poverty by Sex and Age in Novice
According to the poverty statistics in Novice, males aged 5 years and females aged under 5 years are the age groups that are most secure financially, with 100.0% of males and 100.0% of females in these age groups living above the poverty line.
| Age Bracket | Male | Female |
| Under 5 Years | 0 (0.0%) | 5 (100.0%) |
| 5 Years | 2 (100.0%) | 0 (0.0%) |
| 6 to 11 Years | 0 (0.0%) | 0 (0.0%) |
| 12 to 14 Years | 0 (0.0%) | 0 (0.0%) |
| 15 Years | 0 (0.0%) | 0 (0.0%) |
| 16 and 17 Years | 0 (0.0%) | 0 (0.0%) |
| 18 to 24 Years | 5 (100.0%) | 0 (0.0%) |
| 25 to 34 Years | 6 (100.0%) | 10 (100.0%) |
| 35 to 44 Years | 6 (100.0%) | 5 (100.0%) |
| 45 to 54 Years | 0 (0.0%) | 1 (100.0%) |
| 55 to 64 Years | 2 (14.3%) | 12 (66.7%) |
| 65 to 74 Years | 4 (100.0%) | 4 (100.0%) |
| 75 Years and over | 0 (0.0%) | 2 (100.0%) |
| Total | 25 (64.1%) | 39 (86.7%) |
Income Below Poverty Among Married-Couple Families in Novice
| Children | Above Poverty | Below Poverty |
| No Children | 6 (100.0%) | 0 (0.0%) |
| 1 or 2 Children | 3 (100.0%) | 0 (0.0%) |
| 3 or 4 Children | 0 (0.0%) | 0 (0.0%) |
| 5 or more Children | 0 (0.0%) | 0 (0.0%) |
| Total | 9 (100.0%) | 0 (0.0%) |
Income Below Poverty Among Single-Parent Households in Novice
| Children | Single Father | Single Mother |
| No Children | 0 (0.0%) | 0 (0.0%) |
| 1 or 2 Children | 0 (0.0%) | 0 (0.0%) |
| 3 or 4 Children | 0 (0.0%) | 0 (0.0%) |
| 5 or more Children | 0 (0.0%) | 0 (0.0%) |
| Total | 0 (0.0%) | 0 (0.0%) |
Income Below Poverty Among Married-Couple vs Single-Parent Households in Novice
| Children | Married-Couple Families | Single-Parent Households |
| No Children | 0 (0.0%) | 0 (0.0%) |
| 1 or 2 Children | 0 (0.0%) | 0 (0.0%) |
| 3 or 4 Children | 0 (0.0%) | 0 (0.0%) |
| 5 or more Children | 0 (0.0%) | 0 (0.0%) |
| Total | 0 (0.0%) | 0 (0.0%) |
Race in Novice
The most populous races in Novice are White / Caucasian (67 | 77.9%), Hispanic or Latino (17 | 19.8%), and Native / Alaskan (17 | 19.8%).
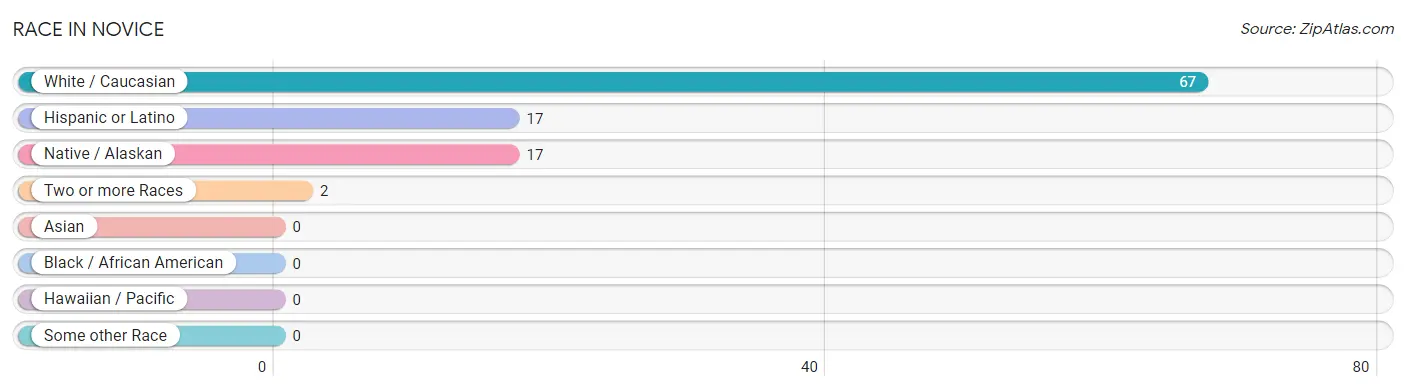
| Race | # Population | % Population |
| Asian | 0 | 0.0% |
| Black / African American | 0 | 0.0% |
| Hawaiian / Pacific | 0 | 0.0% |
| Hispanic or Latino | 17 | 19.8% |
| Native / Alaskan | 17 | 19.8% |
| White / Caucasian | 67 | 77.9% |
| Two or more Races | 2 | 2.3% |
| Some other Race | 0 | 0.0% |
| Total | 86 | 100.0% |
Ancestry in Novice
The most populous ancestries reported in Novice are Scotch-Irish (24 | 27.9%), Dutch (20 | 23.3%), Mexican (17 | 19.8%), Mexican American Indian (17 | 19.8%), and Norwegian (16 | 18.6%), together accounting for 109.3% of all Novice residents.
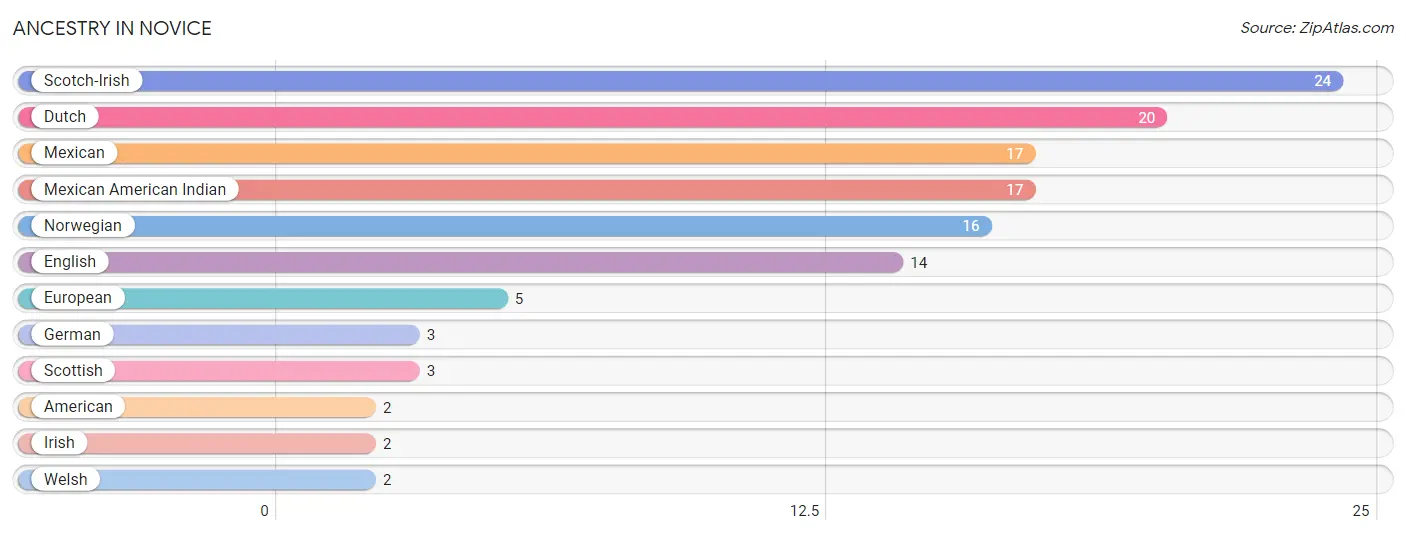
| Ancestry | # Population | % Population |
| American | 2 | 2.3% |
| Dutch | 20 | 23.3% |
| English | 14 | 16.3% |
| European | 5 | 5.8% |
| German | 3 | 3.5% |
| Irish | 2 | 2.3% |
| Mexican | 17 | 19.8% |
| Mexican American Indian | 17 | 19.8% |
| Norwegian | 16 | 18.6% |
| Scotch-Irish | 24 | 27.9% |
| Scottish | 3 | 3.5% |
| Welsh | 2 | 2.3% | View All 12 Rows |
Immigrants in Novice

| Immigration Origin | # Population | % Population | View All 0 Rows |
Sex and Age in Novice
Sex and Age in Novice
The most populous age groups in Novice are 60 to 64 Years (14 | 35.9%) for men and 55 to 59 Years (10 | 21.3%) for women.
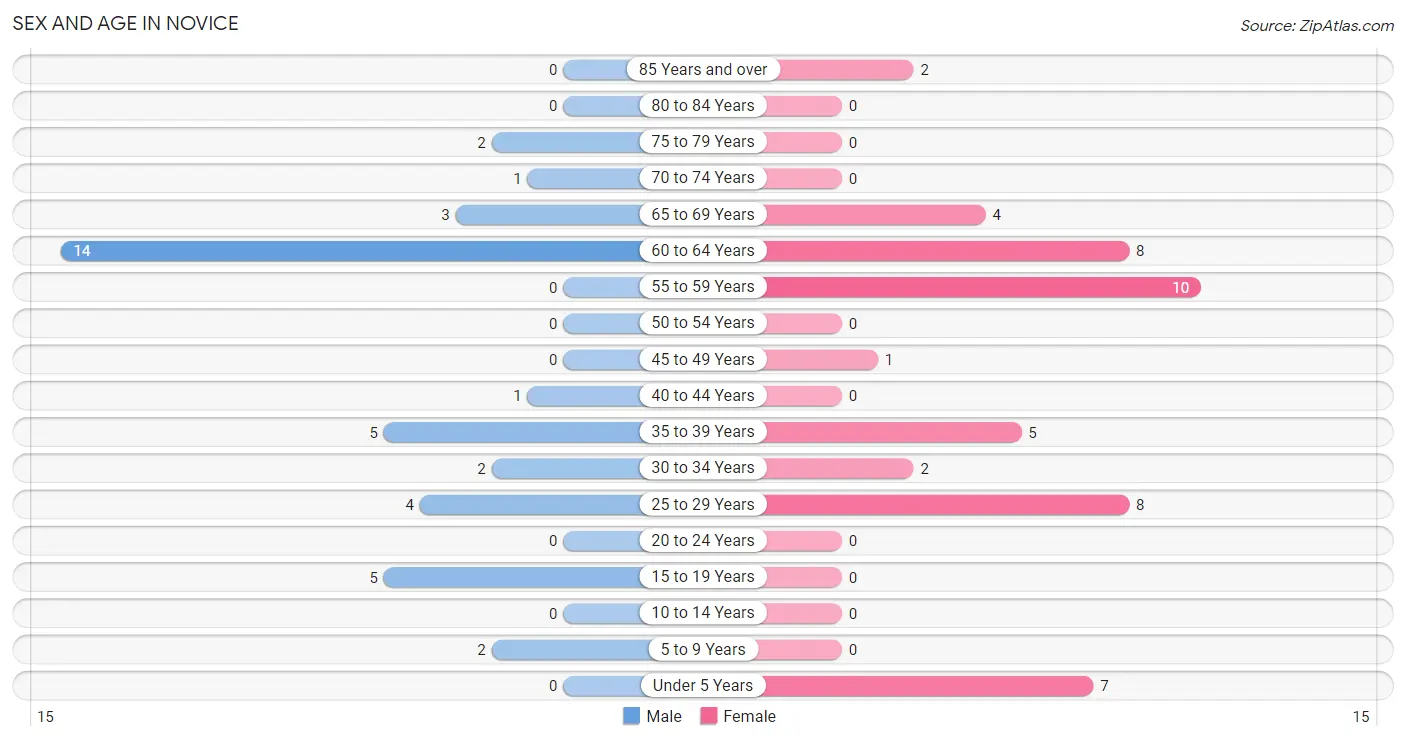
| Age Bracket | Male | Female |
| Under 5 Years | 0 (0.0%) | 7 (14.9%) |
| 5 to 9 Years | 2 (5.1%) | 0 (0.0%) |
| 10 to 14 Years | 0 (0.0%) | 0 (0.0%) |
| 15 to 19 Years | 5 (12.8%) | 0 (0.0%) |
| 20 to 24 Years | 0 (0.0%) | 0 (0.0%) |
| 25 to 29 Years | 4 (10.3%) | 8 (17.0%) |
| 30 to 34 Years | 2 (5.1%) | 2 (4.3%) |
| 35 to 39 Years | 5 (12.8%) | 5 (10.6%) |
| 40 to 44 Years | 1 (2.6%) | 0 (0.0%) |
| 45 to 49 Years | 0 (0.0%) | 1 (2.1%) |
| 50 to 54 Years | 0 (0.0%) | 0 (0.0%) |
| 55 to 59 Years | 0 (0.0%) | 10 (21.3%) |
| 60 to 64 Years | 14 (35.9%) | 8 (17.0%) |
| 65 to 69 Years | 3 (7.7%) | 4 (8.5%) |
| 70 to 74 Years | 1 (2.6%) | 0 (0.0%) |
| 75 to 79 Years | 2 (5.1%) | 0 (0.0%) |
| 80 to 84 Years | 0 (0.0%) | 0 (0.0%) |
| 85 Years and over | 0 (0.0%) | 2 (4.3%) |
| Total | 39 (100.0%) | 47 (100.0%) |
Families and Households in Novice
Median Family Size in Novice
The median family size in Novice is 4.92 persons per family, with single female/mother families (2 | 16.7%) accounting for the largest median family size of 8 persons per family. On the other hand, single male/father families (1 | 8.3%) represent the smallest median family size with 3.00 persons per family.
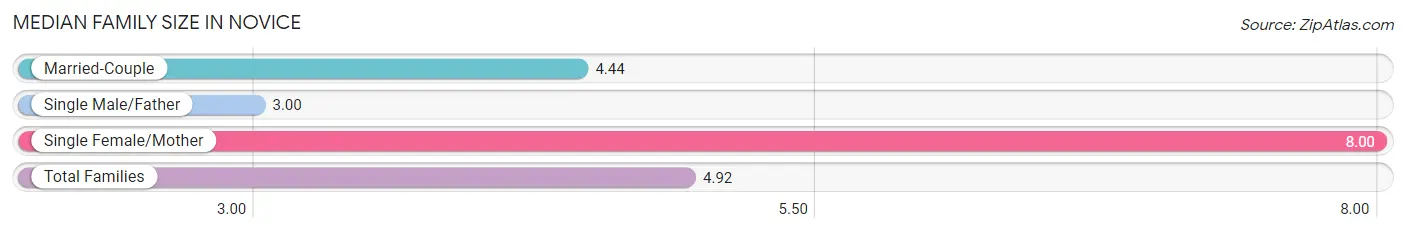
| Family Type | # Families | Family Size |
| Married-Couple | 9 (75.0%) | 4.44 |
| Single Male/Father | 1 (8.3%) | 3.00 |
| Single Female/Mother | 2 (16.7%) | 8.00 |
| Total Families | 12 (100.0%) | 4.92 |
Median Household Size in Novice
The median household size in Novice is 3.74 persons per household, with single female/mother households (2 | 8.7%) accounting for the largest median household size of 10 persons per household. non-family households (11 | 47.8%) represent the smallest median household size with 2.09 persons per household.
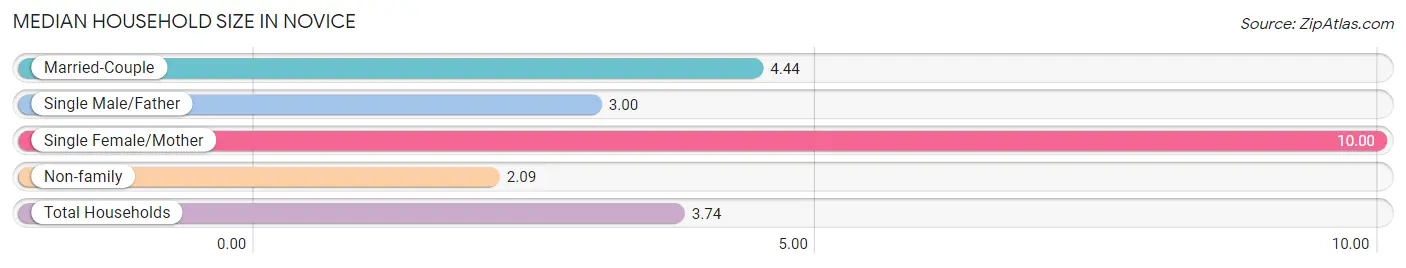
| Household Type | # Households | Household Size |
| Married-Couple | 9 (39.1%) | 4.44 |
| Single Male/Father | 1 (4.3%) | 3.00 |
| Single Female/Mother | 2 (8.7%) | 10.00 |
| Non-family | 11 (47.8%) | 2.09 |
| Total Households | 23 (100.0%) | 3.74 |
Household Size by Marriage Status in Novice
Out of a total of 23 households in Novice, 12 (52.2%) are family households, while 11 (47.8%) are nonfamily households. The most numerous type of family households are 2-person households, comprising 4, and the most common type of nonfamily households are 1-person households, comprising 7.
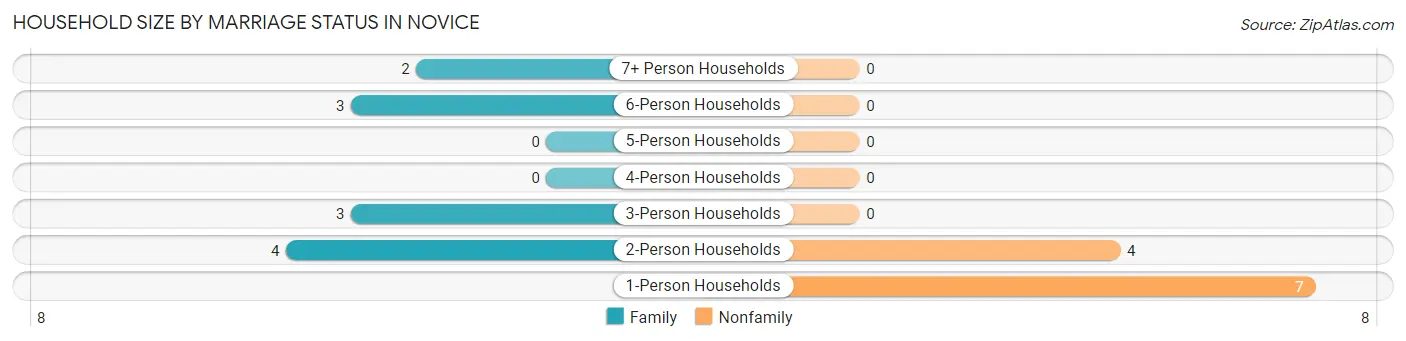
| Household Size | Family Households | Nonfamily Households |
| 1-Person Households | - | 7 (30.4%) |
| 2-Person Households | 4 (17.4%) | 4 (17.4%) |
| 3-Person Households | 3 (13.0%) | 0 (0.0%) |
| 4-Person Households | 0 (0.0%) | 0 (0.0%) |
| 5-Person Households | 0 (0.0%) | 0 (0.0%) |
| 6-Person Households | 3 (13.0%) | 0 (0.0%) |
| 7+ Person Households | 2 (8.7%) | 0 (0.0%) |
| Total | 12 (52.2%) | 11 (47.8%) |
Female Fertility in Novice
Fertility by Age in Novice
| Age Bracket | Women with Births | Births / 1,000 Women |
| 15 to 19 years | 0 (0.0%) | 0.0 |
| 20 to 34 years | 0 (0.0%) | 0.0 |
| 35 to 50 years | 0 (0.0%) | 0.0 |
| Total | 0 (0.0%) | 0.0 |
Fertility by Age by Marriage Status in Novice
| Age Bracket | Married | Unmarried |
| 15 to 19 years | 0 (0.0%) | 0 (0.0%) |
| 20 to 34 years | 0 (0.0%) | 0 (0.0%) |
| 35 to 50 years | 0 (0.0%) | 0 (0.0%) |
| Total | 0 (0.0%) | 0 (0.0%) |
Fertility by Education in Novice
| Educational Attainment | Women with Births | Births / 1,000 Women |
| Less than High School | 0 (0.0%) | 0.0 |
| High School Diploma | 0 (0.0%) | 0.0 |
| College or Associate's Degree | 0 (0.0%) | 0.0 |
| Bachelor's Degree | 0 (0.0%) | 0.0 |
| Graduate Degree | 0 (0.0%) | 0.0 |
| Total | 0 (0.0%) | 0.0 |
Fertility by Education by Marriage Status in Novice
| Educational Attainment | Married | Unmarried |
| Less than High School | 0 (0.0%) | 0 (0.0%) |
| High School Diploma | 0 (0.0%) | 0 (0.0%) |
| College or Associate's Degree | 0 (0.0%) | 0 (0.0%) |
| Bachelor's Degree | 0 (0.0%) | 0 (0.0%) |
| Graduate Degree | 0 (0.0%) | 0 (0.0%) |
| Total | 0 (0.0%) | 0 (0.0%) |
Employment Characteristics in Novice
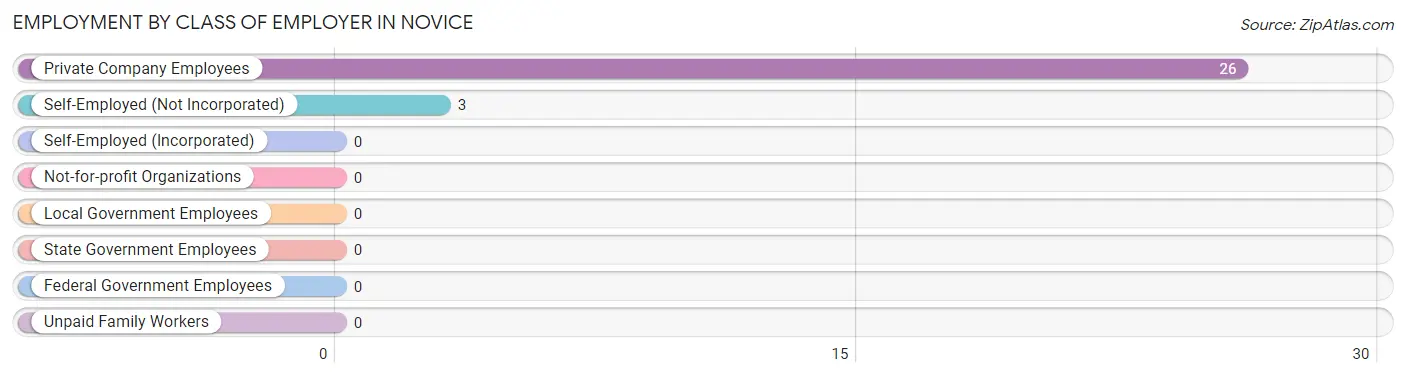
Employment by Class of Employer in Novice
Among the 29 employed individuals in Novice, private company employees (26 | 89.7%), and self-employed (not incorporated) (3 | 10.3%) make up the most common classes of employment.
| Employer Class | # Employees | % Employees |
| Private Company Employees | 26 | 89.7% |
| Self-Employed (Incorporated) | 0 | 0.0% |
| Self-Employed (Not Incorporated) | 3 | 10.3% |
| Not-for-profit Organizations | 0 | 0.0% |
| Local Government Employees | 0 | 0.0% |
| State Government Employees | 0 | 0.0% |
| Federal Government Employees | 0 | 0.0% |
| Unpaid Family Workers | 0 | 0.0% |
| Total | 29 | 100.0% |
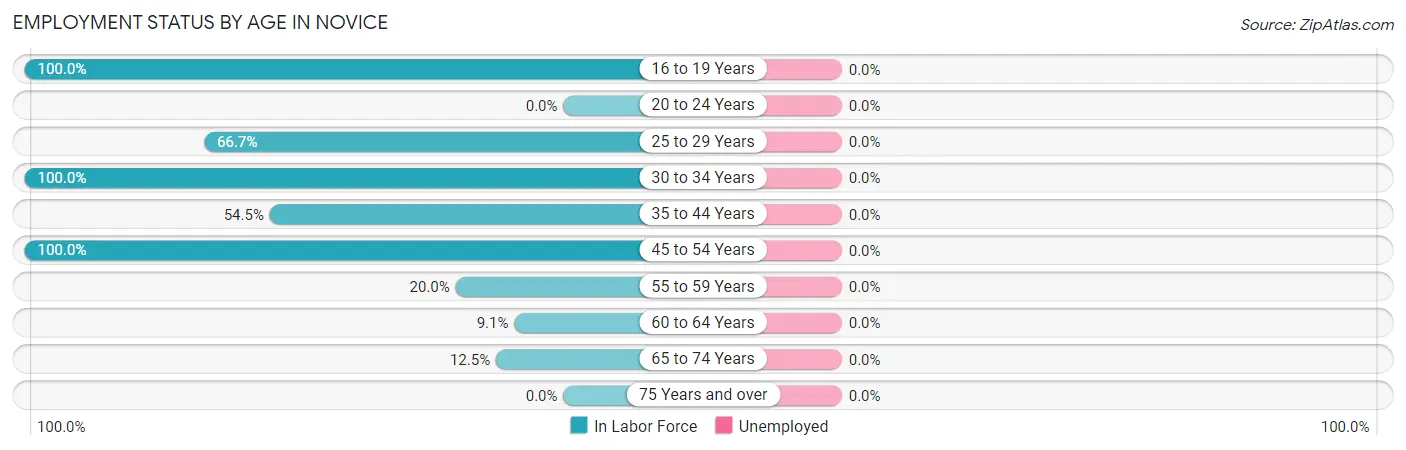
Employment Status by Age in Novice
| Age Bracket | In Labor Force | Unemployed |
| 16 to 19 Years | 5 (100.0%) | 0 (0.0%) |
| 20 to 24 Years | 0 (0.0%) | 0 (0.0%) |
| 25 to 29 Years | 8 (66.7%) | 0 (0.0%) |
| 30 to 34 Years | 4 (100.0%) | 0 (0.0%) |
| 35 to 44 Years | 6 (54.5%) | 0 (0.0%) |
| 45 to 54 Years | 1 (100.0%) | 0 (0.0%) |
| 55 to 59 Years | 2 (20.0%) | 0 (0.0%) |
| 60 to 64 Years | 2 (9.1%) | 0 (0.0%) |
| 65 to 74 Years | 1 (12.5%) | 0 (0.0%) |
| 75 Years and over | 0 (0.0%) | 0 (0.0%) |
| Total | 29 (37.7%) | 0 (0.0%) |
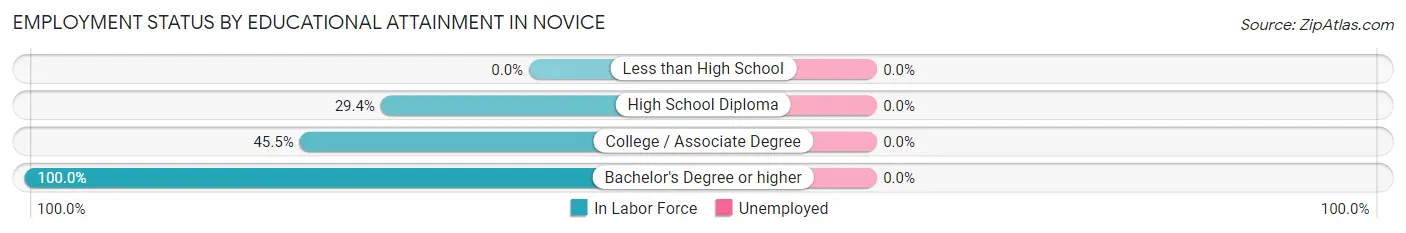
Employment Status by Educational Attainment in Novice
| Educational Attainment | In Labor Force | Unemployed |
| Less than High School | 0 (0.0%) | 0 (0.0%) |
| High School Diploma | 10 (29.4%) | 0 (0.0%) |
| College / Associate Degree | 5 (45.5%) | 0 (0.0%) |
| Bachelor's Degree or higher | 8 (100.0%) | 0 (0.0%) |
| Total | 23 (38.3%) | 0 (0.0%) |
Employment Occupations by Sex in Novice
Management, Business, Science and Arts Occupations
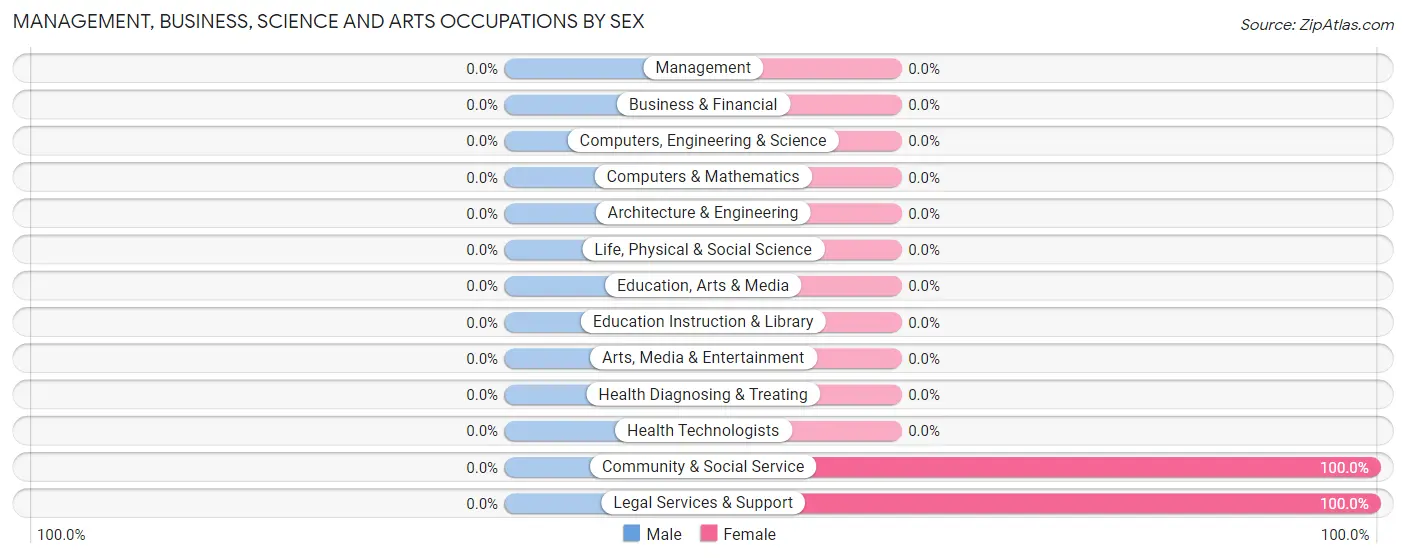
The most common Management, Business, Science and Arts occupations in Novice are Community & Social Service (1 | 3.5%), and Legal Services & Support (1 | 3.5%).
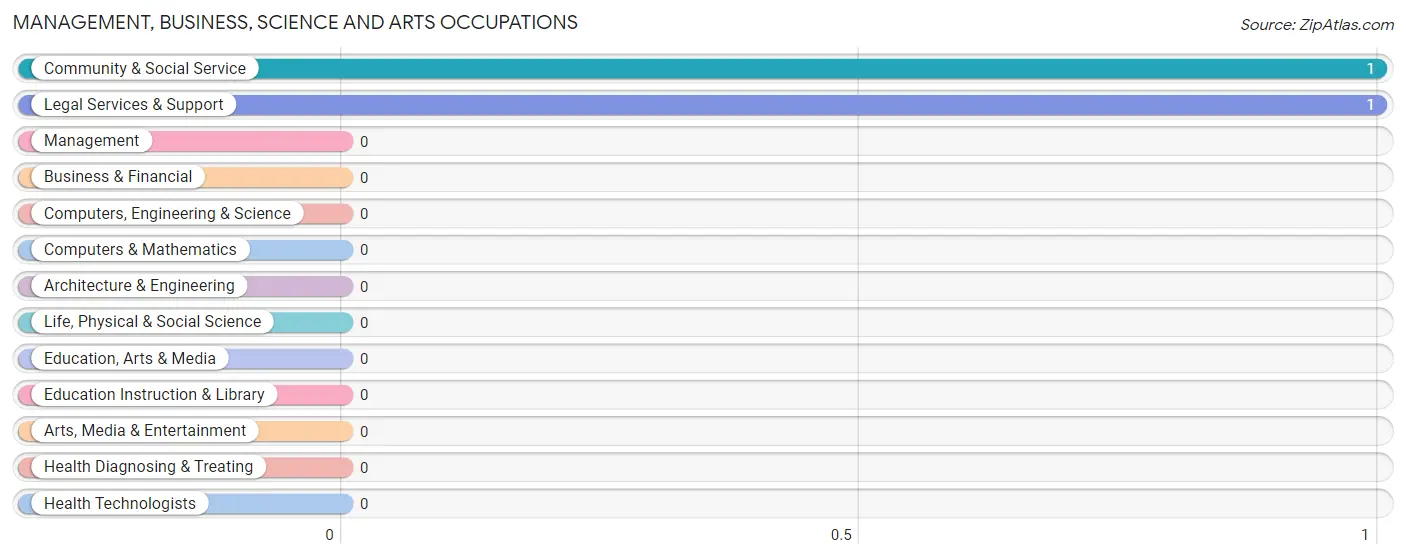
Management, Business, Science and Arts Occupations by Sex
| Occupation | Male | Female |
| Management | 0 (0.0%) | 0 (0.0%) |
| Business & Financial | 0 (0.0%) | 0 (0.0%) |
| Computers, Engineering & Science | 0 (0.0%) | 0 (0.0%) |
| Computers & Mathematics | 0 (0.0%) | 0 (0.0%) |
| Architecture & Engineering | 0 (0.0%) | 0 (0.0%) |
| Life, Physical & Social Science | 0 (0.0%) | 0 (0.0%) |
| Community & Social Service | 0 (0.0%) | 1 (100.0%) |
| Education, Arts & Media | 0 (0.0%) | 0 (0.0%) |
| Legal Services & Support | 0 (0.0%) | 1 (100.0%) |
| Education Instruction & Library | 0 (0.0%) | 0 (0.0%) |
| Arts, Media & Entertainment | 0 (0.0%) | 0 (0.0%) |
| Health Diagnosing & Treating | 0 (0.0%) | 0 (0.0%) |
| Health Technologists | 0 (0.0%) | 0 (0.0%) |
| Total (Category) | 0 (0.0%) | 1 (100.0%) |
| Total (Overall) | 16 (55.2%) | 13 (44.8%) |
Services Occupations
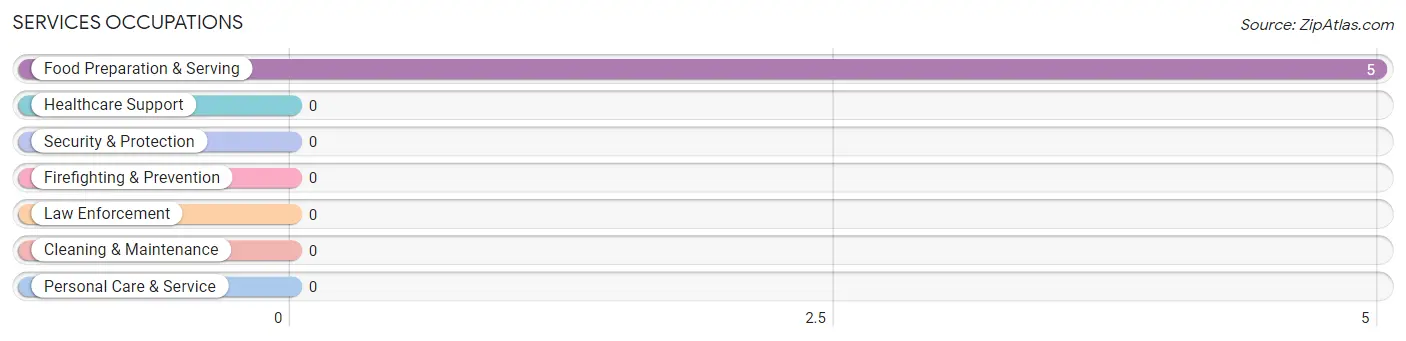
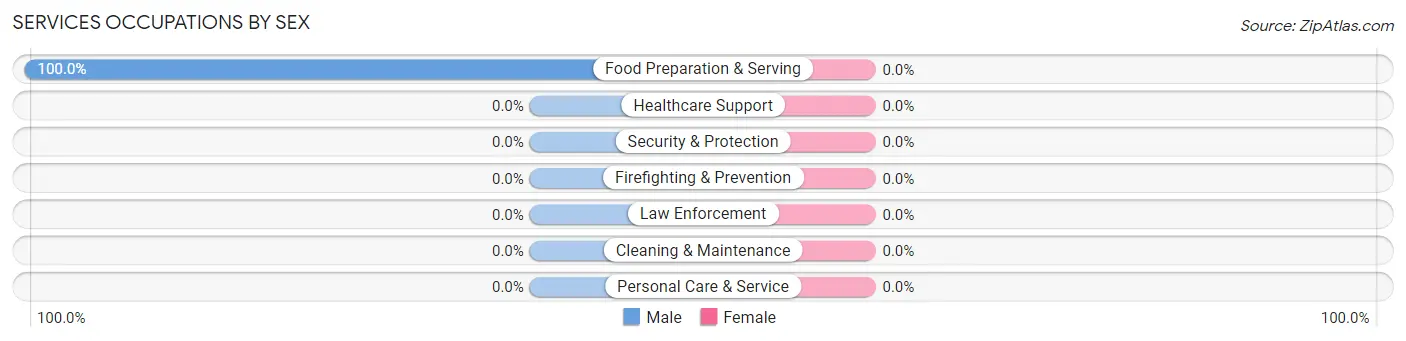
The most common Services occupations in Novice are , and Food Preparation & Serving (5 | 17.2%).
Services Occupations by Sex
| Occupation | Male | Female |
| Healthcare Support | 0 (0.0%) | 0 (0.0%) |
| Security & Protection | 0 (0.0%) | 0 (0.0%) |
| Firefighting & Prevention | 0 (0.0%) | 0 (0.0%) |
| Law Enforcement | 0 (0.0%) | 0 (0.0%) |
| Food Preparation & Serving | 5 (100.0%) | 0 (0.0%) |
| Cleaning & Maintenance | 0 (0.0%) | 0 (0.0%) |
| Personal Care & Service | 0 (0.0%) | 0 (0.0%) |
| Total (Category) | 5 (100.0%) | 0 (0.0%) |
| Total (Overall) | 16 (55.2%) | 13 (44.8%) |
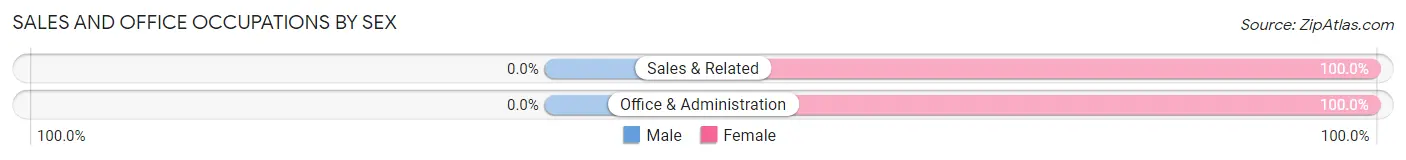
Sales and Office Occupations
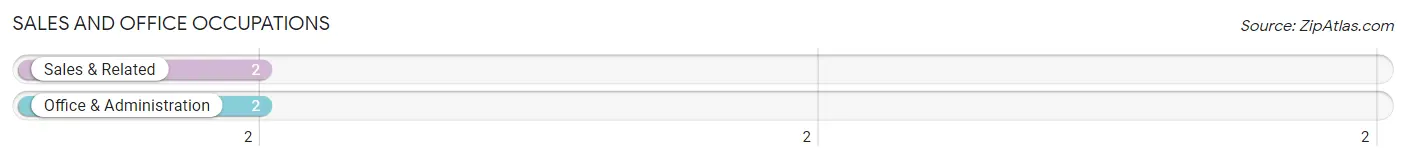
The most common Sales and Office occupations in Novice are Sales & Related (2 | 6.9%), and Office & Administration (2 | 6.9%).
Sales and Office Occupations by Sex
| Occupation | Male | Female |
| Sales & Related | 0 (0.0%) | 2 (100.0%) |
| Office & Administration | 0 (0.0%) | 2 (100.0%) |
| Total (Category) | 0 (0.0%) | 4 (100.0%) |
| Total (Overall) | 16 (55.2%) | 13 (44.8%) |
Natural Resources, Construction and Maintenance Occupations
The most common Natural Resources, Construction and Maintenance occupations in Novice are , and Construction & Extraction (5 | 17.2%).
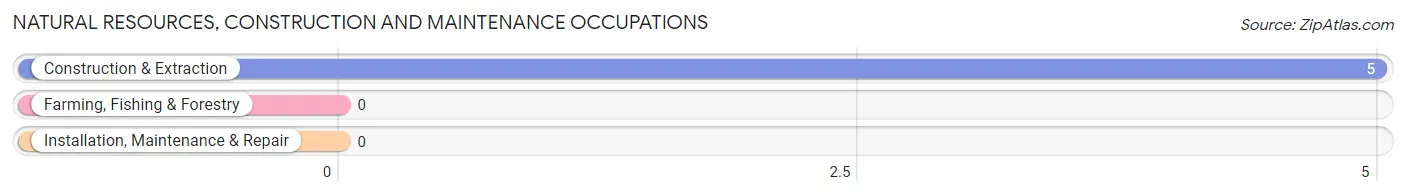
Natural Resources, Construction and Maintenance Occupations by Sex
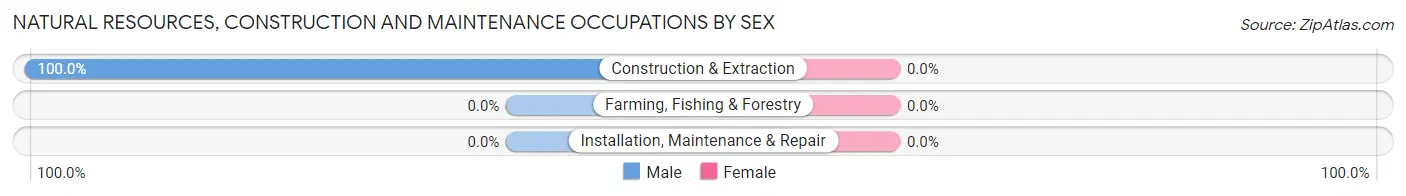
| Occupation | Male | Female |
| Farming, Fishing & Forestry | 0 (0.0%) | 0 (0.0%) |
| Construction & Extraction | 5 (100.0%) | 0 (0.0%) |
| Installation, Maintenance & Repair | 0 (0.0%) | 0 (0.0%) |
| Total (Category) | 5 (100.0%) | 0 (0.0%) |
| Total (Overall) | 16 (55.2%) | 13 (44.8%) |
Production, Transportation and Moving Occupations
The most common Production, Transportation and Moving occupations in Novice are Transportation (12 | 41.4%), and Production (2 | 6.9%).
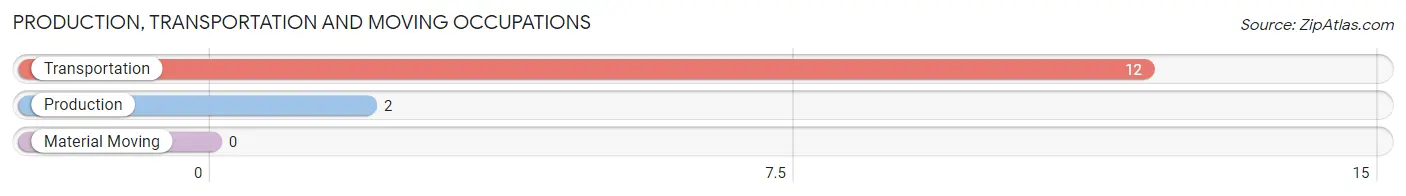
Production, Transportation and Moving Occupations by Sex
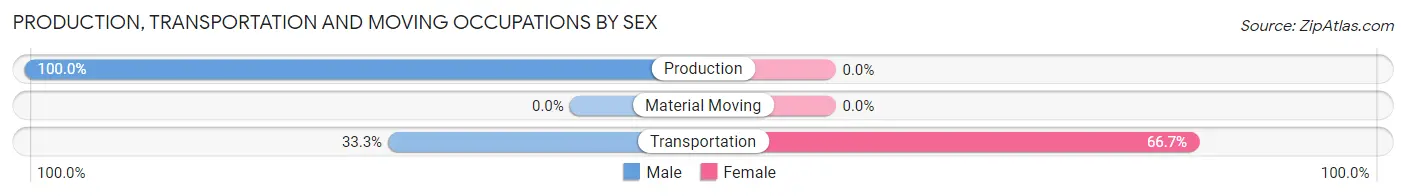
| Occupation | Male | Female |
| Production | 2 (100.0%) | 0 (0.0%) |
| Transportation | 4 (33.3%) | 8 (66.7%) |
| Material Moving | 0 (0.0%) | 0 (0.0%) |
| Total (Category) | 6 (42.9%) | 8 (57.1%) |
| Total (Overall) | 16 (55.2%) | 13 (44.8%) |
Employment Industries by Sex in Novice
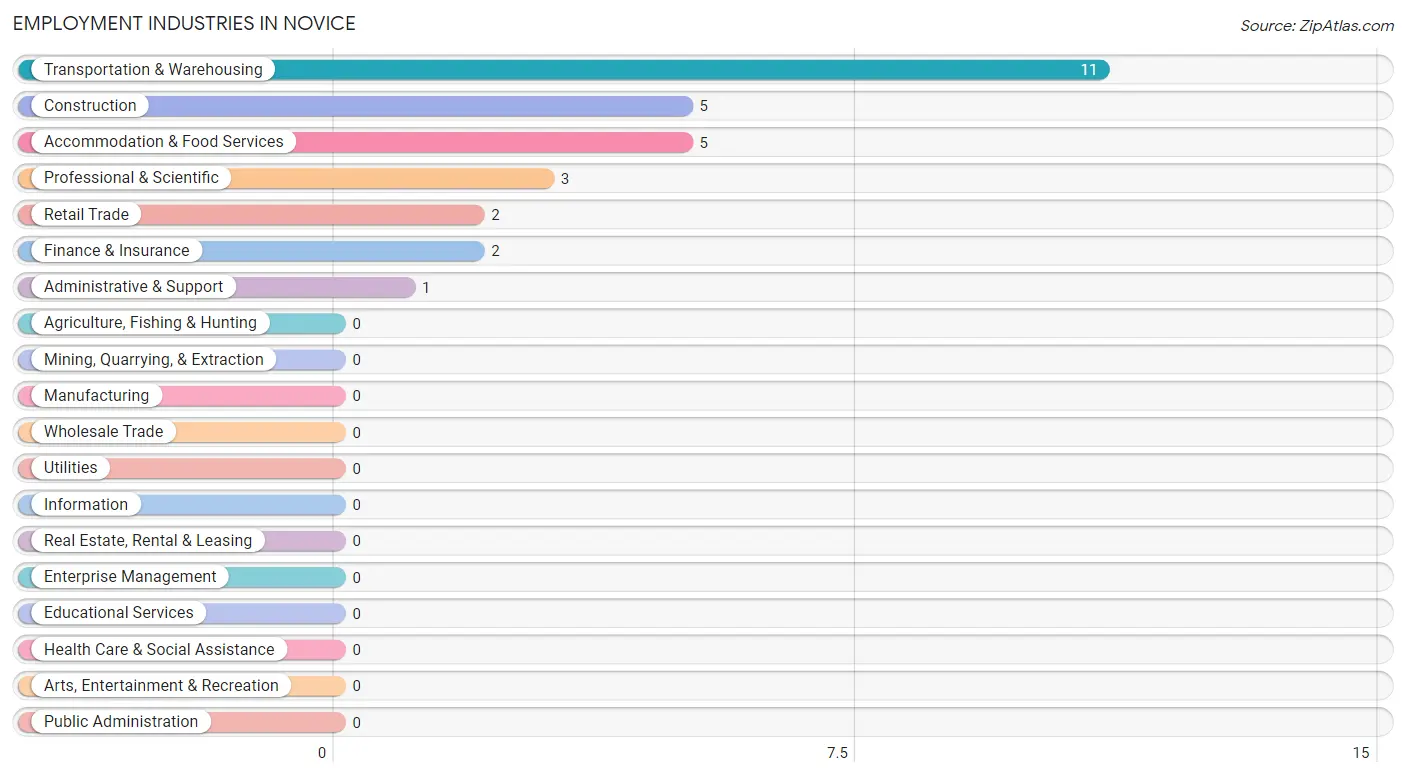
Employment Industries in Novice
The major employment industries in Novice include Transportation & Warehousing (11 | 37.9%), Construction (5 | 17.2%), Accommodation & Food Services (5 | 17.2%), Professional & Scientific (3 | 10.3%), and Retail Trade (2 | 6.9%).
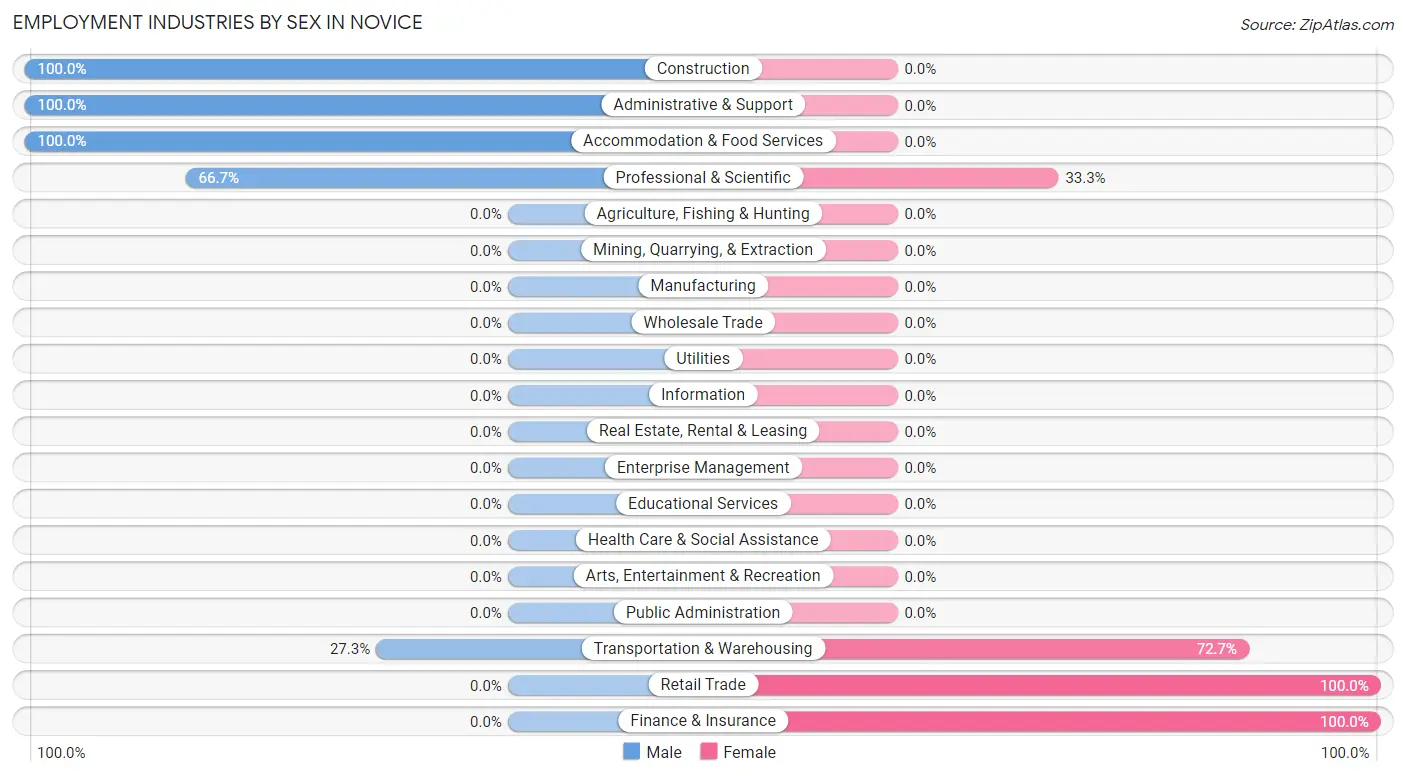
Employment Industries by Sex in Novice
The Novice industries that see more men than women are Construction (100.0%), Administrative & Support (100.0%), and Accommodation & Food Services (100.0%), whereas the industries that tend to have a higher number of women are Retail Trade (100.0%), Finance & Insurance (100.0%), and Transportation & Warehousing (72.7%).
| Industry | Male | Female |
| Agriculture, Fishing & Hunting | 0 (0.0%) | 0 (0.0%) |
| Mining, Quarrying, & Extraction | 0 (0.0%) | 0 (0.0%) |
| Construction | 5 (100.0%) | 0 (0.0%) |
| Manufacturing | 0 (0.0%) | 0 (0.0%) |
| Wholesale Trade | 0 (0.0%) | 0 (0.0%) |
| Retail Trade | 0 (0.0%) | 2 (100.0%) |
| Transportation & Warehousing | 3 (27.3%) | 8 (72.7%) |
| Utilities | 0 (0.0%) | 0 (0.0%) |
| Information | 0 (0.0%) | 0 (0.0%) |
| Finance & Insurance | 0 (0.0%) | 2 (100.0%) |
| Real Estate, Rental & Leasing | 0 (0.0%) | 0 (0.0%) |
| Professional & Scientific | 2 (66.7%) | 1 (33.3%) |
| Enterprise Management | 0 (0.0%) | 0 (0.0%) |
| Administrative & Support | 1 (100.0%) | 0 (0.0%) |
| Educational Services | 0 (0.0%) | 0 (0.0%) |
| Health Care & Social Assistance | 0 (0.0%) | 0 (0.0%) |
| Arts, Entertainment & Recreation | 0 (0.0%) | 0 (0.0%) |
| Accommodation & Food Services | 5 (100.0%) | 0 (0.0%) |
| Public Administration | 0 (0.0%) | 0 (0.0%) |
| Total | 16 (55.2%) | 13 (44.8%) |
Education in Novice
School Enrollment in Novice
The most common levels of schooling among the 7 students in Novice are high school (5 | 71.4%), and elementary school (2 | 28.6%).
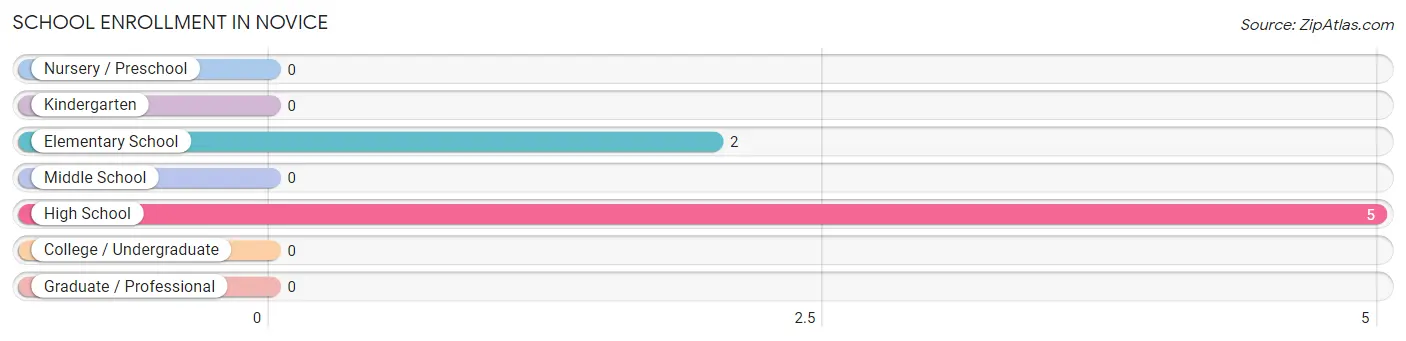
| School Level | # Students | % Students |
| Nursery / Preschool | 0 | 0.0% |
| Kindergarten | 0 | 0.0% |
| Elementary School | 2 | 28.6% |
| Middle School | 0 | 0.0% |
| High School | 5 | 71.4% |
| College / Undergraduate | 0 | 0.0% |
| Graduate / Professional | 0 | 0.0% |
| Total | 7 | 100.0% |
School Enrollment by Age by Funding Source in Novice
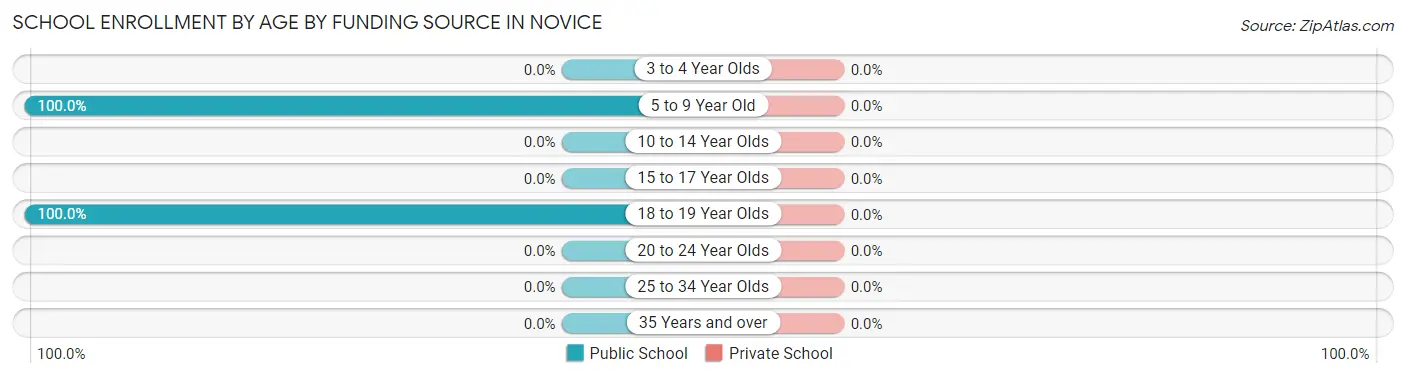
| Age Bracket | Public School | Private School |
| 3 to 4 Year Olds | 0 (0.0%) | 0 (0.0%) |
| 5 to 9 Year Old | 2 (100.0%) | 0 (0.0%) |
| 10 to 14 Year Olds | 0 (0.0%) | 0 (0.0%) |
| 15 to 17 Year Olds | 0 (0.0%) | 0 (0.0%) |
| 18 to 19 Year Olds | 5 (100.0%) | 0 (0.0%) |
| 20 to 24 Year Olds | 0 (0.0%) | 0 (0.0%) |
| 25 to 34 Year Olds | 0 (0.0%) | 0 (0.0%) |
| 35 Years and over | 0 (0.0%) | 0 (0.0%) |
| Total | 7 (100.0%) | 0 (0.0%) |
Educational Attainment by Field of Study in Novice
, and arts & humanities (8 | 100.0%) are the most common fields of study among 8 individuals in Novice who have obtained a bachelor's degree or higher.
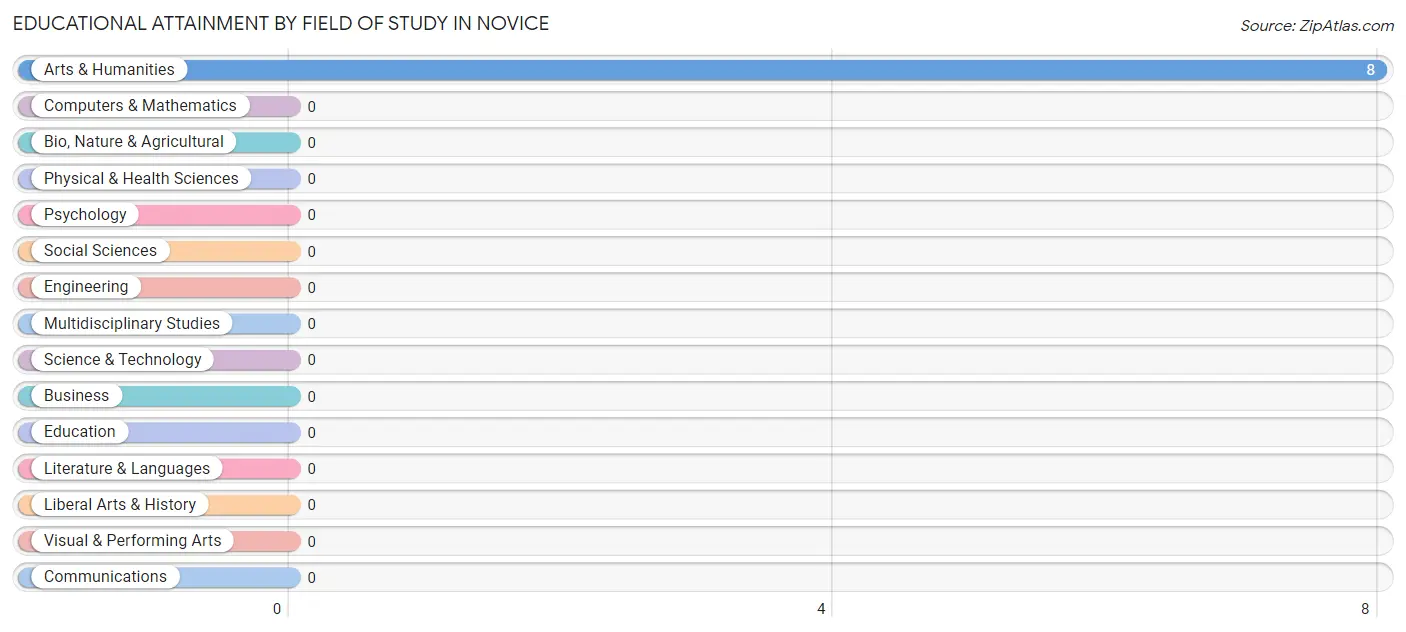
| Field of Study | # Graduates | % Graduates |
| Computers & Mathematics | 0 | 0.0% |
| Bio, Nature & Agricultural | 0 | 0.0% |
| Physical & Health Sciences | 0 | 0.0% |
| Psychology | 0 | 0.0% |
| Social Sciences | 0 | 0.0% |
| Engineering | 0 | 0.0% |
| Multidisciplinary Studies | 0 | 0.0% |
| Science & Technology | 0 | 0.0% |
| Business | 0 | 0.0% |
| Education | 0 | 0.0% |
| Literature & Languages | 0 | 0.0% |
| Liberal Arts & History | 0 | 0.0% |
| Visual & Performing Arts | 0 | 0.0% |
| Communications | 0 | 0.0% |
| Arts & Humanities | 8 | 100.0% |
| Total | 8 | 100.0% |
Transportation & Commute in Novice
Vehicle Availability by Sex in Novice
The most prevalent vehicle ownership categories in Novice are males with 5 or more vehicles (6, accounting for 37.5%) and females with 5 or more vehicles (8, making up 46.2%).
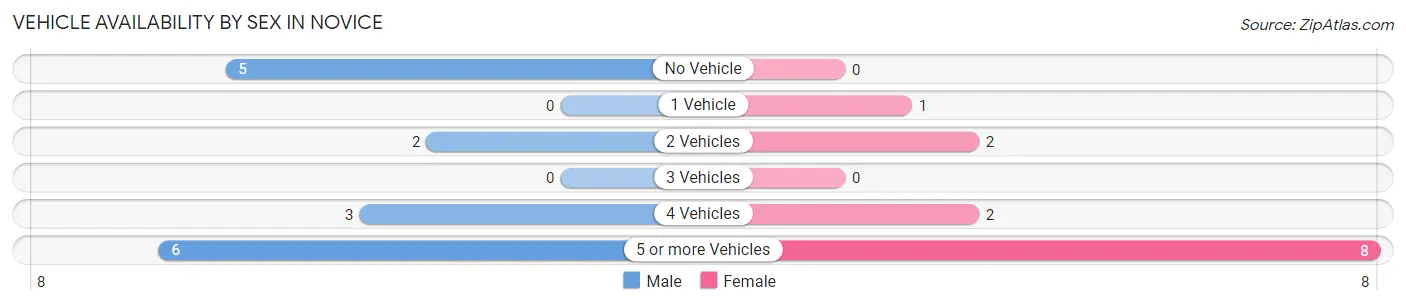
| Vehicles Available | Male | Female |
| No Vehicle | 5 (31.2%) | 0 (0.0%) |
| 1 Vehicle | 0 (0.0%) | 1 (7.7%) |
| 2 Vehicles | 2 (12.5%) | 2 (15.4%) |
| 3 Vehicles | 0 (0.0%) | 0 (0.0%) |
| 4 Vehicles | 3 (18.8%) | 2 (15.4%) |
| 5 or more Vehicles | 6 (37.5%) | 8 (61.5%) |
| Total | 16 (100.0%) | 13 (100.0%) |
Commute Time in Novice
The most frequently occuring commute durations in Novice are 35 to 39 minutes (8 commuters, 27.6%), 25 to 29 minutes (7 commuters, 24.1%), and 60 to 89 minutes (5 commuters, 17.2%).
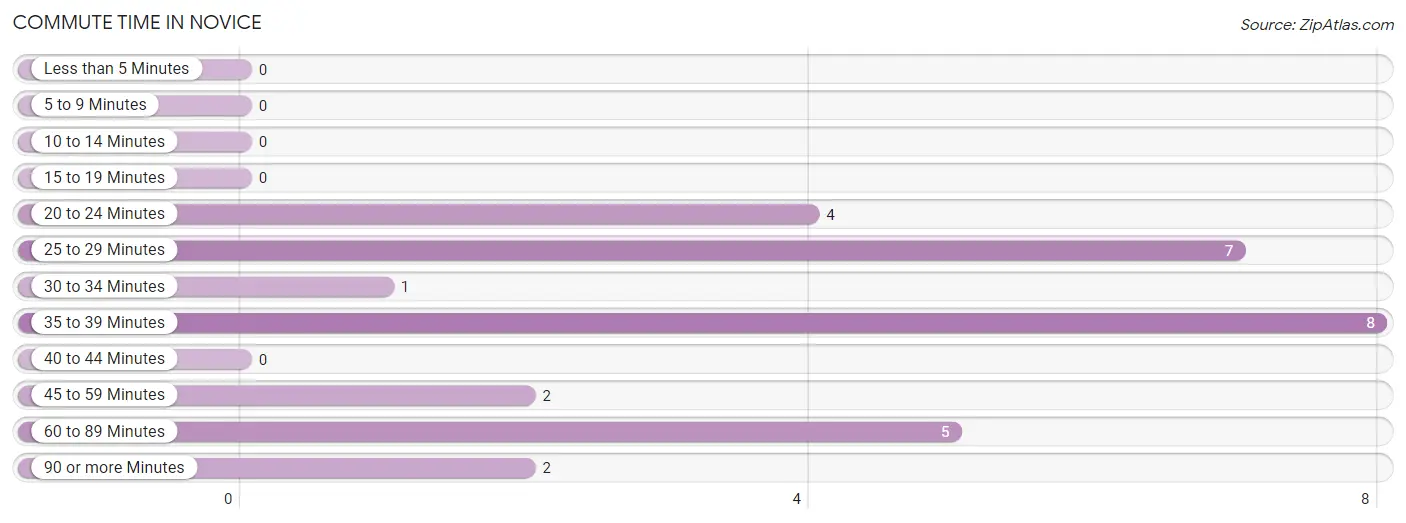
| Commute Time | # Commuters | % Commuters |
| Less than 5 Minutes | 0 | 0.0% |
| 5 to 9 Minutes | 0 | 0.0% |
| 10 to 14 Minutes | 0 | 0.0% |
| 15 to 19 Minutes | 0 | 0.0% |
| 20 to 24 Minutes | 4 | 13.8% |
| 25 to 29 Minutes | 7 | 24.1% |
| 30 to 34 Minutes | 1 | 3.5% |
| 35 to 39 Minutes | 8 | 27.6% |
| 40 to 44 Minutes | 0 | 0.0% |
| 45 to 59 Minutes | 2 | 6.9% |
| 60 to 89 Minutes | 5 | 17.2% |
| 90 or more Minutes | 2 | 6.9% |
Commute Time by Sex in Novice
The most common commute times in Novice are 25 to 29 minutes (5 commuters, 31.2%) for males and 35 to 39 minutes (8 commuters, 61.5%) for females.
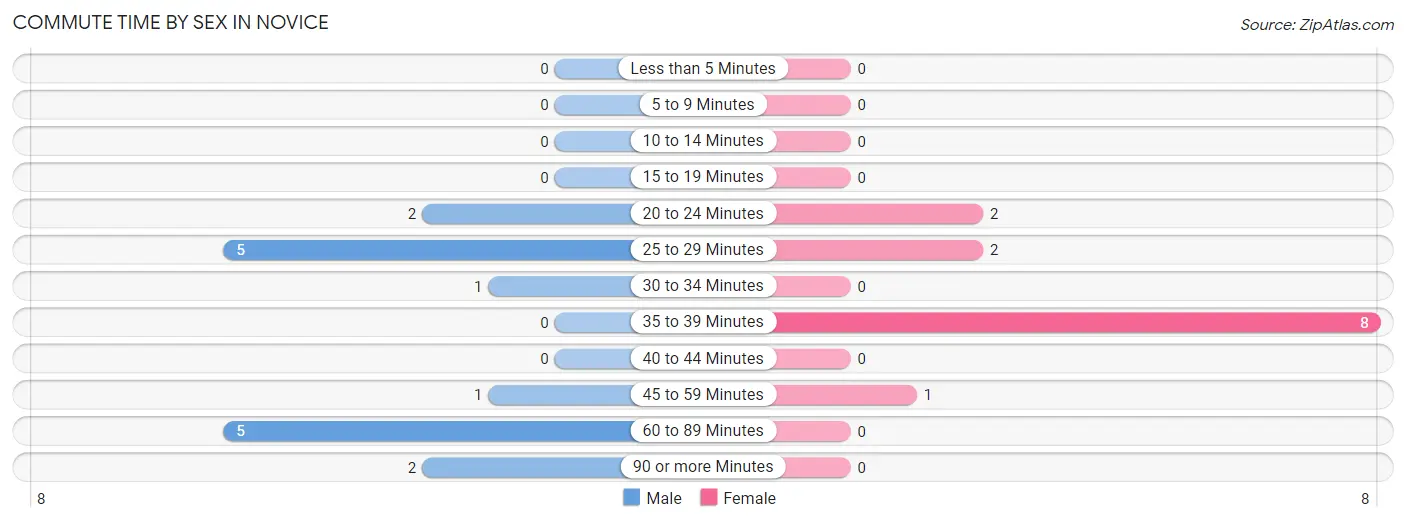
| Commute Time | Male | Female |
| Less than 5 Minutes | 0 (0.0%) | 0 (0.0%) |
| 5 to 9 Minutes | 0 (0.0%) | 0 (0.0%) |
| 10 to 14 Minutes | 0 (0.0%) | 0 (0.0%) |
| 15 to 19 Minutes | 0 (0.0%) | 0 (0.0%) |
| 20 to 24 Minutes | 2 (12.5%) | 2 (15.4%) |
| 25 to 29 Minutes | 5 (31.2%) | 2 (15.4%) |
| 30 to 34 Minutes | 1 (6.2%) | 0 (0.0%) |
| 35 to 39 Minutes | 0 (0.0%) | 8 (61.5%) |
| 40 to 44 Minutes | 0 (0.0%) | 0 (0.0%) |
| 45 to 59 Minutes | 1 (6.2%) | 1 (7.7%) |
| 60 to 89 Minutes | 5 (31.2%) | 0 (0.0%) |
| 90 or more Minutes | 2 (12.5%) | 0 (0.0%) |
Time of Departure to Work by Sex in Novice
The most frequent times of departure to work in Novice are 6:00 AM to 6:29 AM (5, 31.2%) for males and 8:00 AM to 8:29 AM (8, 61.5%) for females.
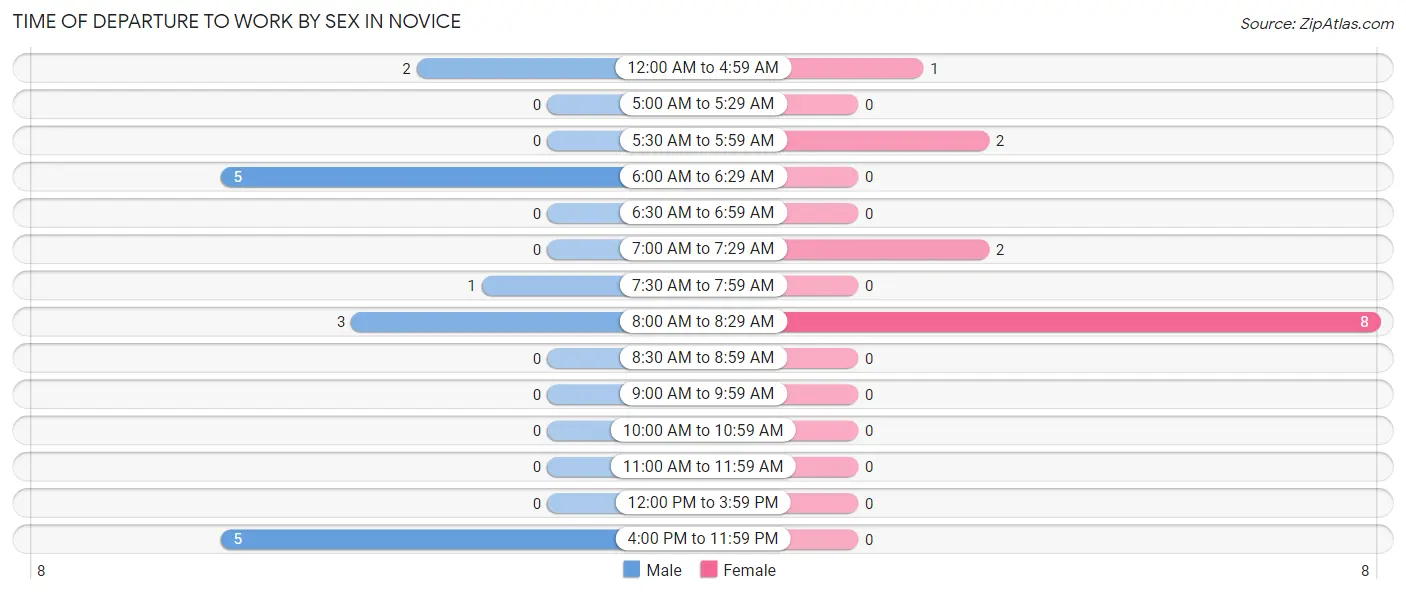
| Time of Departure | Male | Female |
| 12:00 AM to 4:59 AM | 2 (12.5%) | 1 (7.7%) |
| 5:00 AM to 5:29 AM | 0 (0.0%) | 0 (0.0%) |
| 5:30 AM to 5:59 AM | 0 (0.0%) | 2 (15.4%) |
| 6:00 AM to 6:29 AM | 5 (31.2%) | 0 (0.0%) |
| 6:30 AM to 6:59 AM | 0 (0.0%) | 0 (0.0%) |
| 7:00 AM to 7:29 AM | 0 (0.0%) | 2 (15.4%) |
| 7:30 AM to 7:59 AM | 1 (6.2%) | 0 (0.0%) |
| 8:00 AM to 8:29 AM | 3 (18.8%) | 8 (61.5%) |
| 8:30 AM to 8:59 AM | 0 (0.0%) | 0 (0.0%) |
| 9:00 AM to 9:59 AM | 0 (0.0%) | 0 (0.0%) |
| 10:00 AM to 10:59 AM | 0 (0.0%) | 0 (0.0%) |
| 11:00 AM to 11:59 AM | 0 (0.0%) | 0 (0.0%) |
| 12:00 PM to 3:59 PM | 0 (0.0%) | 0 (0.0%) |
| 4:00 PM to 11:59 PM | 5 (31.2%) | 0 (0.0%) |
| Total | 16 (100.0%) | 13 (100.0%) |
Housing Occupancy in Novice
Occupancy by Ownership in Novice
Of the total 23 dwellings in Novice, owner-occupied units account for 19 (82.6%), while renter-occupied units make up 4 (17.4%).
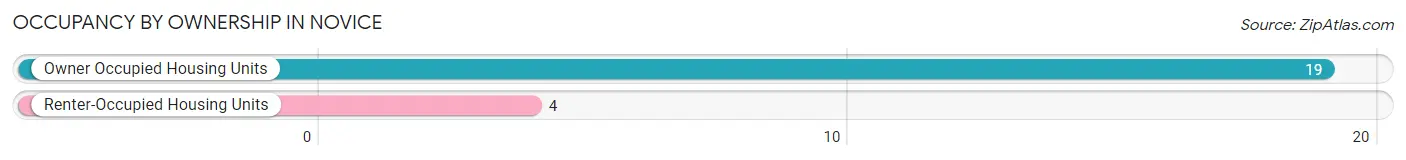
| Occupancy | # Housing Units | % Housing Units |
| Owner Occupied Housing Units | 19 | 82.6% |
| Renter-Occupied Housing Units | 4 | 17.4% |
| Total Occupied Housing Units | 23 | 100.0% |
Occupancy by Household Size in Novice
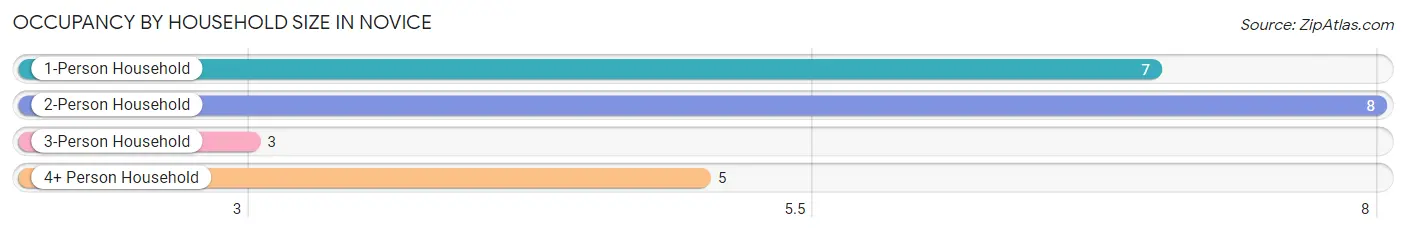
| Household Size | # Housing Units | % Housing Units |
| 1-Person Household | 7 | 30.4% |
| 2-Person Household | 8 | 34.8% |
| 3-Person Household | 3 | 13.0% |
| 4+ Person Household | 5 | 21.7% |
| Total Housing Units | 23 | 100.0% |
Occupancy by Ownership by Household Size in Novice
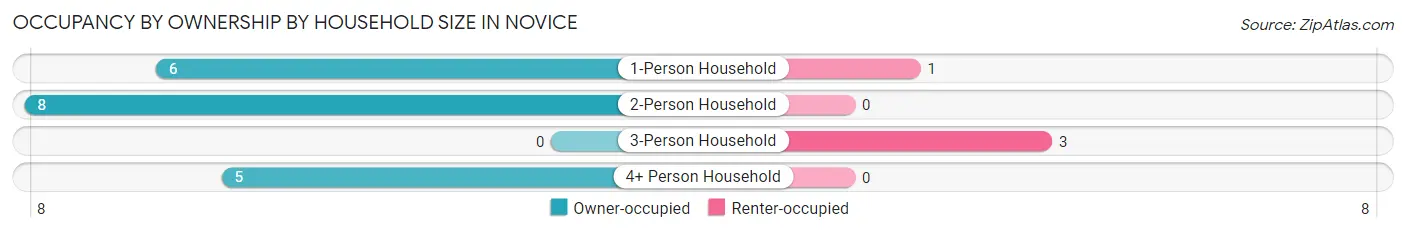
| Household Size | Owner-occupied | Renter-occupied |
| 1-Person Household | 6 (85.7%) | 1 (14.3%) |
| 2-Person Household | 8 (100.0%) | 0 (0.0%) |
| 3-Person Household | 0 (0.0%) | 3 (100.0%) |
| 4+ Person Household | 5 (100.0%) | 0 (0.0%) |
| Total Housing Units | 19 (82.6%) | 4 (17.4%) |
Occupancy by Educational Attainment in Novice
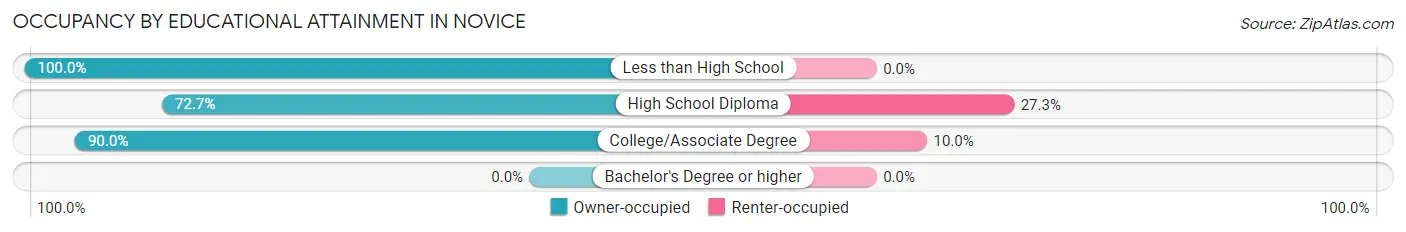
| Household Size | Owner-occupied | Renter-occupied |
| Less than High School | 2 (100.0%) | 0 (0.0%) |
| High School Diploma | 8 (72.7%) | 3 (27.3%) |
| College/Associate Degree | 9 (90.0%) | 1 (10.0%) |
| Bachelor's Degree or higher | 0 (0.0%) | 0 (0.0%) |
Occupancy by Age of Householder in Novice
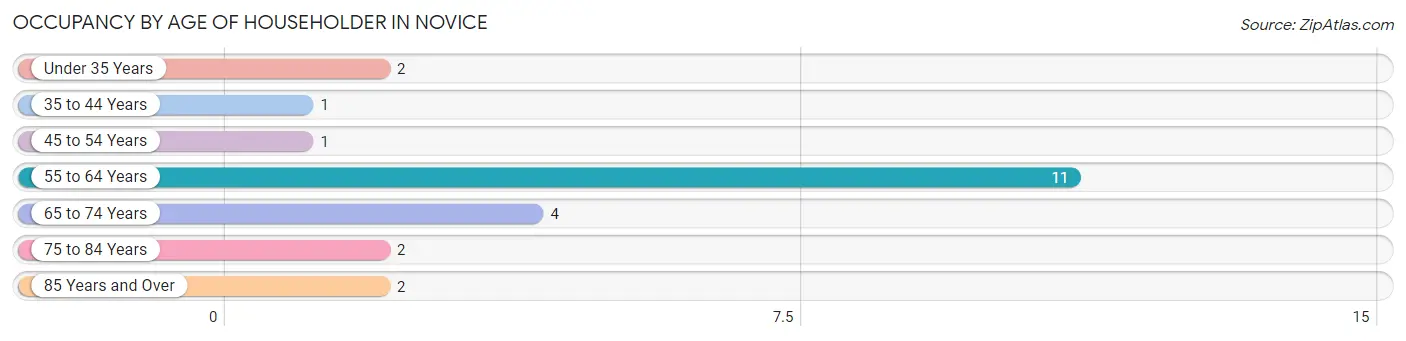
| Age Bracket | # Households | % Households |
| Under 35 Years | 2 | 8.7% |
| 35 to 44 Years | 1 | 4.3% |
| 45 to 54 Years | 1 | 4.3% |
| 55 to 64 Years | 11 | 47.8% |
| 65 to 74 Years | 4 | 17.4% |
| 75 to 84 Years | 2 | 8.7% |
| 85 Years and Over | 2 | 8.7% |
| Total | 23 | 100.0% |
Housing Finances in Novice
Median Income by Occupancy in Novice
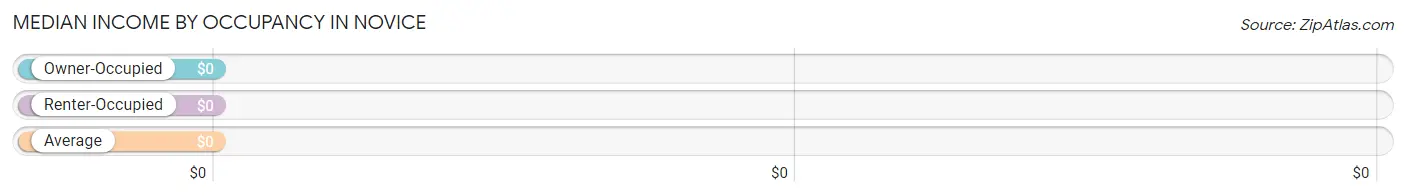
| Occupancy Type | # Households | Median Income |
| Owner-Occupied | 19 (82.6%) | $0 |
| Renter-Occupied | 4 (17.4%) | $0 |
| Average | 23 (100.0%) | $0 |
Occupancy by Householder Income Bracket in Novice
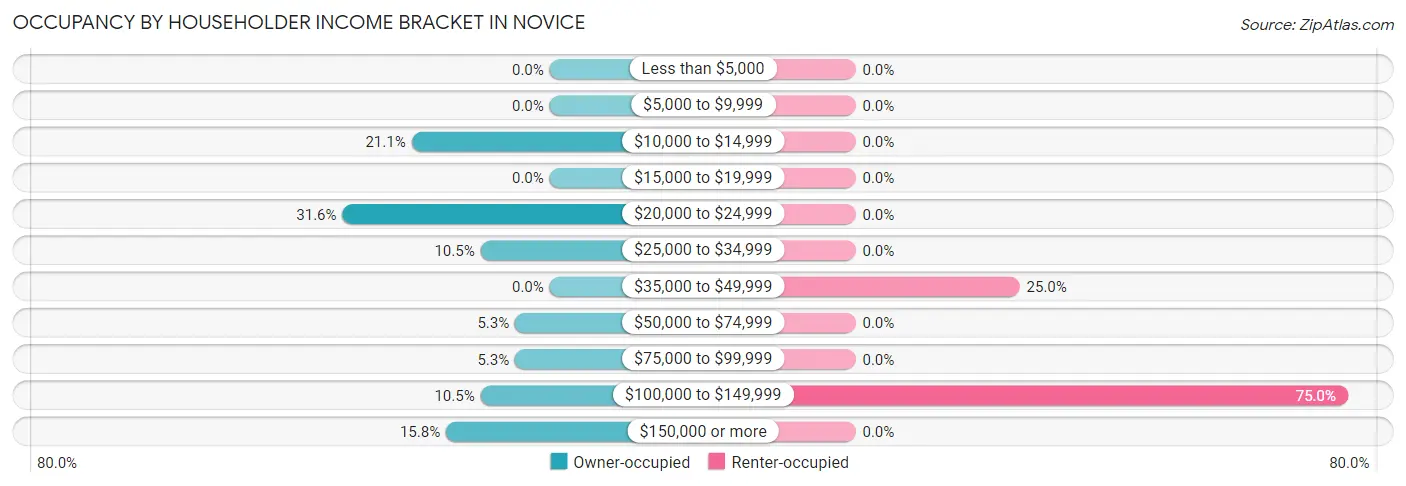
| Income Bracket | Owner-occupied | Renter-occupied |
| Less than $5,000 | 0 (0.0%) | 0 (0.0%) |
| $5,000 to $9,999 | 0 (0.0%) | 0 (0.0%) |
| $10,000 to $14,999 | 4 (21.0%) | 0 (0.0%) |
| $15,000 to $19,999 | 0 (0.0%) | 0 (0.0%) |
| $20,000 to $24,999 | 6 (31.6%) | 0 (0.0%) |
| $25,000 to $34,999 | 2 (10.5%) | 0 (0.0%) |
| $35,000 to $49,999 | 0 (0.0%) | 1 (25.0%) |
| $50,000 to $74,999 | 1 (5.3%) | 0 (0.0%) |
| $75,000 to $99,999 | 1 (5.3%) | 0 (0.0%) |
| $100,000 to $149,999 | 2 (10.5%) | 3 (75.0%) |
| $150,000 or more | 3 (15.8%) | 0 (0.0%) |
| Total | 19 (100.0%) | 4 (100.0%) |
Monthly Housing Cost Tiers in Novice
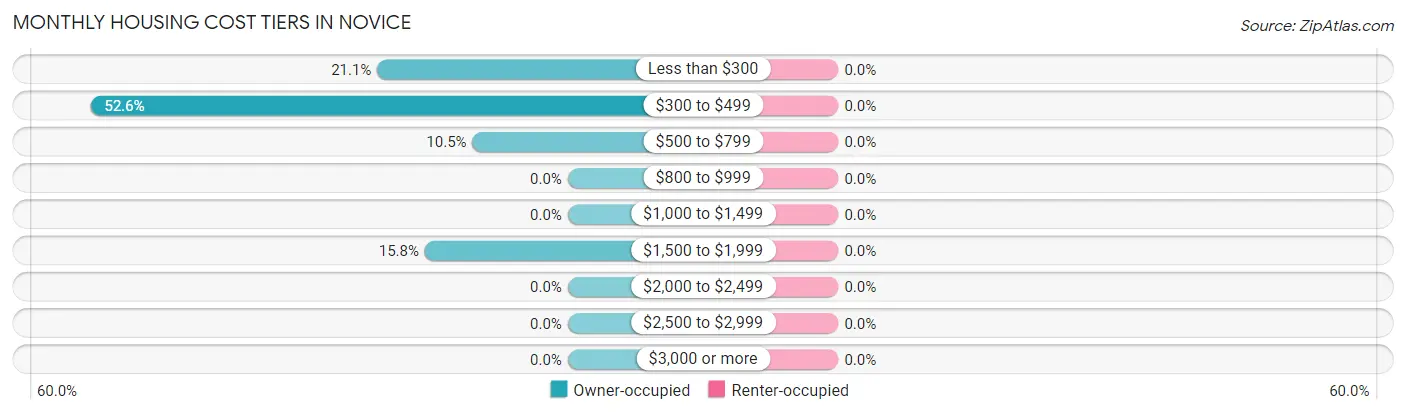
| Monthly Cost | Owner-occupied | Renter-occupied |
| Less than $300 | 4 (21.0%) | 0 (0.0%) |
| $300 to $499 | 10 (52.6%) | 0 (0.0%) |
| $500 to $799 | 2 (10.5%) | 0 (0.0%) |
| $800 to $999 | 0 (0.0%) | 0 (0.0%) |
| $1,000 to $1,499 | 0 (0.0%) | 0 (0.0%) |
| $1,500 to $1,999 | 3 (15.8%) | 0 (0.0%) |
| $2,000 to $2,499 | 0 (0.0%) | 0 (0.0%) |
| $2,500 to $2,999 | 0 (0.0%) | 0 (0.0%) |
| $3,000 or more | 0 (0.0%) | 0 (0.0%) |
| Total | 19 (100.0%) | 4 (100.0%) |
Physical Housing Characteristics in Novice
Housing Structures in Novice
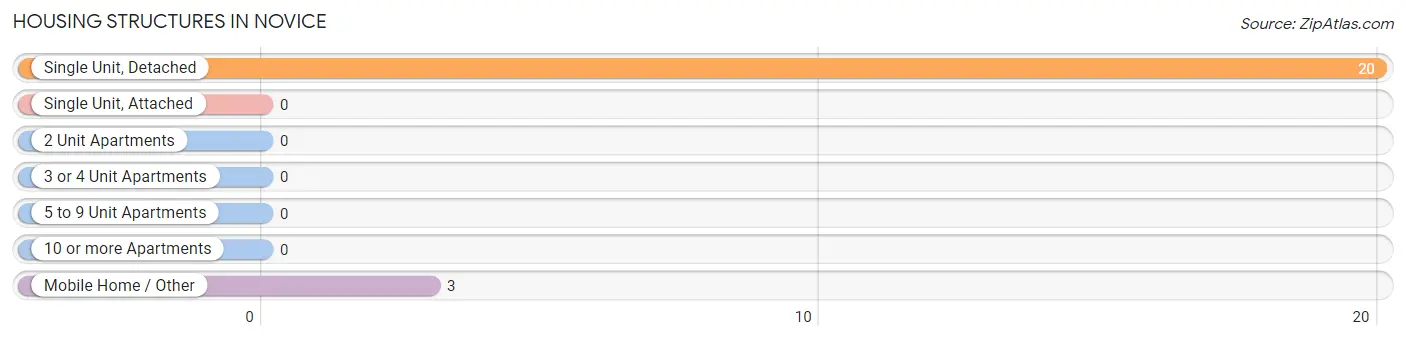
| Structure Type | # Housing Units | % Housing Units |
| Single Unit, Detached | 20 | 87.0% |
| Single Unit, Attached | 0 | 0.0% |
| 2 Unit Apartments | 0 | 0.0% |
| 3 or 4 Unit Apartments | 0 | 0.0% |
| 5 to 9 Unit Apartments | 0 | 0.0% |
| 10 or more Apartments | 0 | 0.0% |
| Mobile Home / Other | 3 | 13.0% |
| Total | 23 | 100.0% |
Housing Structures by Occupancy in Novice
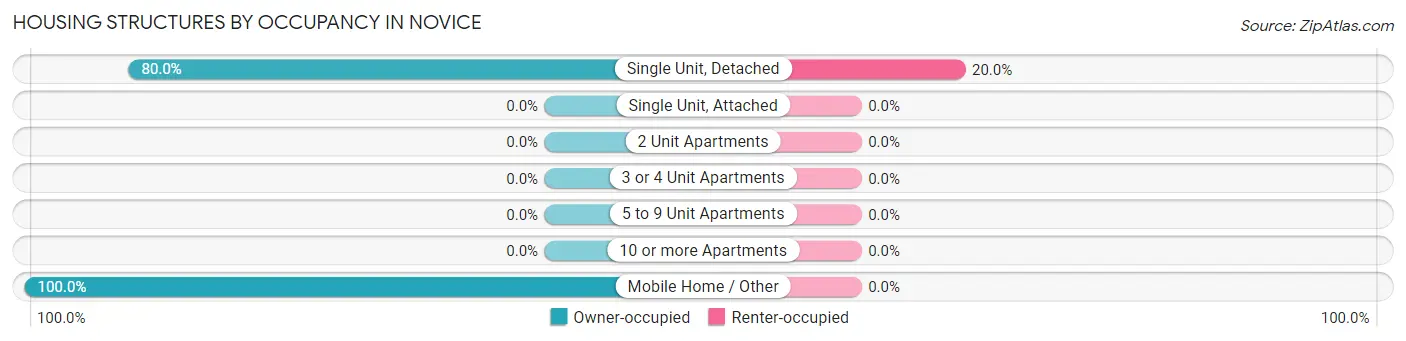
| Structure Type | Owner-occupied | Renter-occupied |
| Single Unit, Detached | 16 (80.0%) | 4 (20.0%) |
| Single Unit, Attached | 0 (0.0%) | 0 (0.0%) |
| 2 Unit Apartments | 0 (0.0%) | 0 (0.0%) |
| 3 or 4 Unit Apartments | 0 (0.0%) | 0 (0.0%) |
| 5 to 9 Unit Apartments | 0 (0.0%) | 0 (0.0%) |
| 10 or more Apartments | 0 (0.0%) | 0 (0.0%) |
| Mobile Home / Other | 3 (100.0%) | 0 (0.0%) |
| Total | 19 (82.6%) | 4 (17.4%) |
Housing Structures by Number of Rooms in Novice
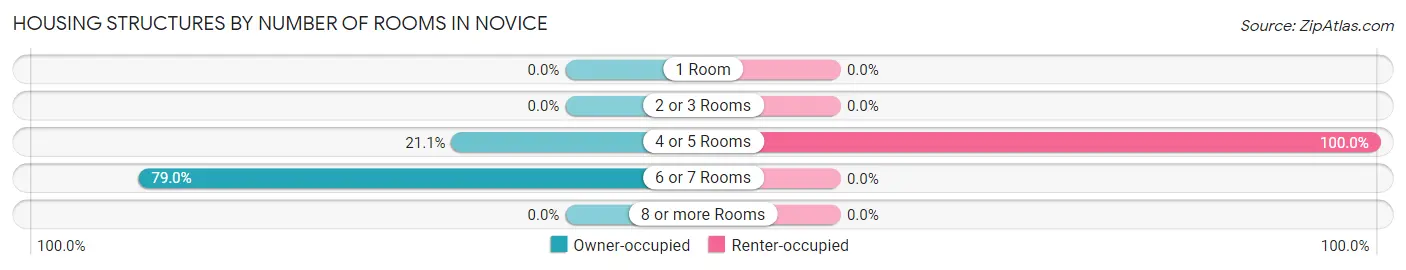
| Number of Rooms | Owner-occupied | Renter-occupied |
| 1 Room | 0 (0.0%) | 0 (0.0%) |
| 2 or 3 Rooms | 0 (0.0%) | 0 (0.0%) |
| 4 or 5 Rooms | 4 (21.0%) | 4 (100.0%) |
| 6 or 7 Rooms | 15 (78.9%) | 0 (0.0%) |
| 8 or more Rooms | 0 (0.0%) | 0 (0.0%) |
| Total | 19 (100.0%) | 4 (100.0%) |
Housing Structure by Heating Type in Novice
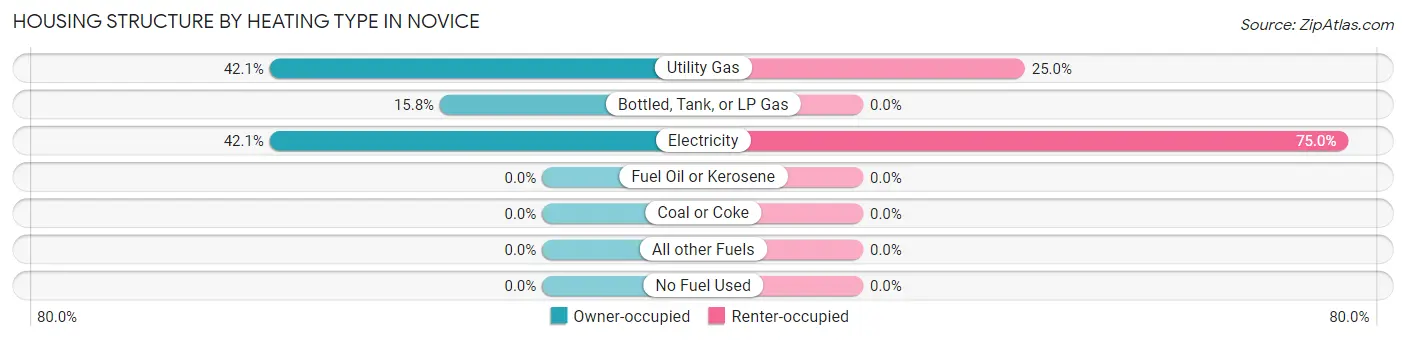
| Heating Type | Owner-occupied | Renter-occupied |
| Utility Gas | 8 (42.1%) | 1 (25.0%) |
| Bottled, Tank, or LP Gas | 3 (15.8%) | 0 (0.0%) |
| Electricity | 8 (42.1%) | 3 (75.0%) |
| Fuel Oil or Kerosene | 0 (0.0%) | 0 (0.0%) |
| Coal or Coke | 0 (0.0%) | 0 (0.0%) |
| All other Fuels | 0 (0.0%) | 0 (0.0%) |
| No Fuel Used | 0 (0.0%) | 0 (0.0%) |
| Total | 19 (100.0%) | 4 (100.0%) |
Household Vehicle Usage in Novice
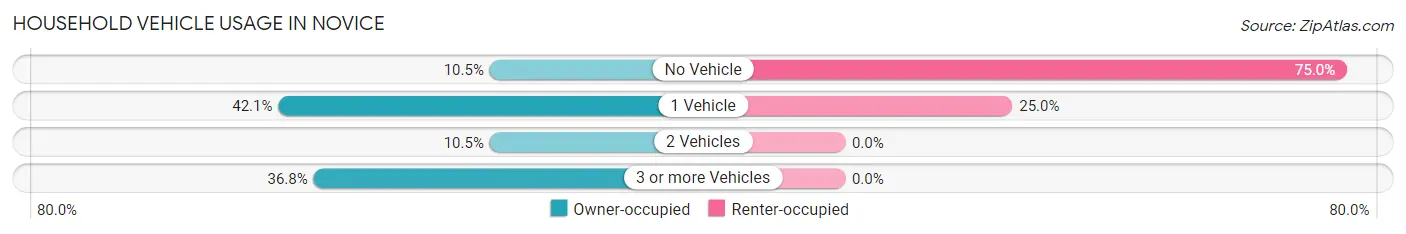
| Vehicles per Household | Owner-occupied | Renter-occupied |
| No Vehicle | 2 (10.5%) | 3 (75.0%) |
| 1 Vehicle | 8 (42.1%) | 1 (25.0%) |
| 2 Vehicles | 2 (10.5%) | 0 (0.0%) |
| 3 or more Vehicles | 7 (36.8%) | 0 (0.0%) |
| Total | 19 (100.0%) | 4 (100.0%) |
Real Estate & Mortgages in Novice
Real Estate and Mortgage Overview in Novice
| Characteristic | Without Mortgage | With Mortgage |
| Housing Units | 14 | 5 |
| Median Property Value | $18,800 | $0 |
| Median Household Income | $24,375 | $0 |
| Monthly Housing Costs | $317 | $0 |
| Real Estate Taxes | $550 | $0 |
Property Value by Mortgage Status in Novice
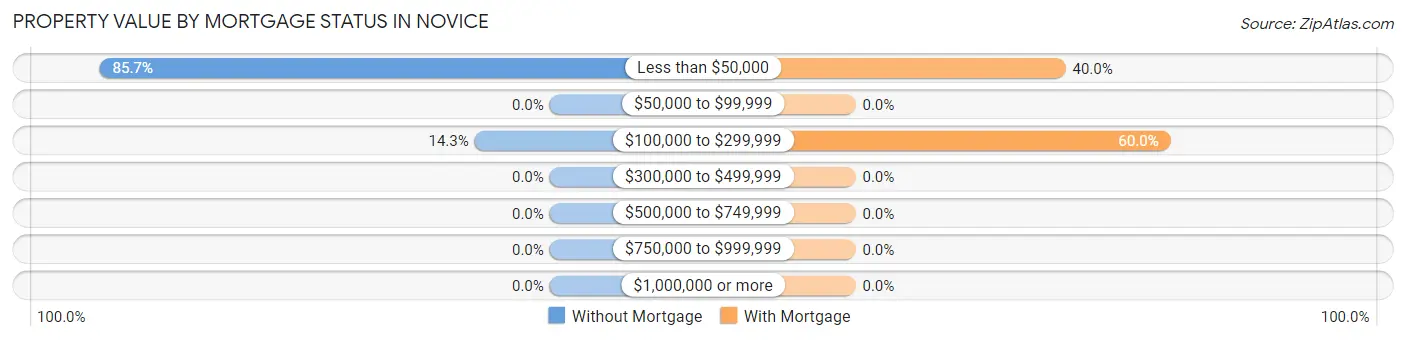
| Property Value | Without Mortgage | With Mortgage |
| Less than $50,000 | 12 (85.7%) | 2 (40.0%) |
| $50,000 to $99,999 | 0 (0.0%) | 0 (0.0%) |
| $100,000 to $299,999 | 2 (14.3%) | 3 (60.0%) |
| $300,000 to $499,999 | 0 (0.0%) | 0 (0.0%) |
| $500,000 to $749,999 | 0 (0.0%) | 0 (0.0%) |
| $750,000 to $999,999 | 0 (0.0%) | 0 (0.0%) |
| $1,000,000 or more | 0 (0.0%) | 0 (0.0%) |
| Total | 14 (100.0%) | 5 (100.0%) |
Household Income by Mortgage Status in Novice
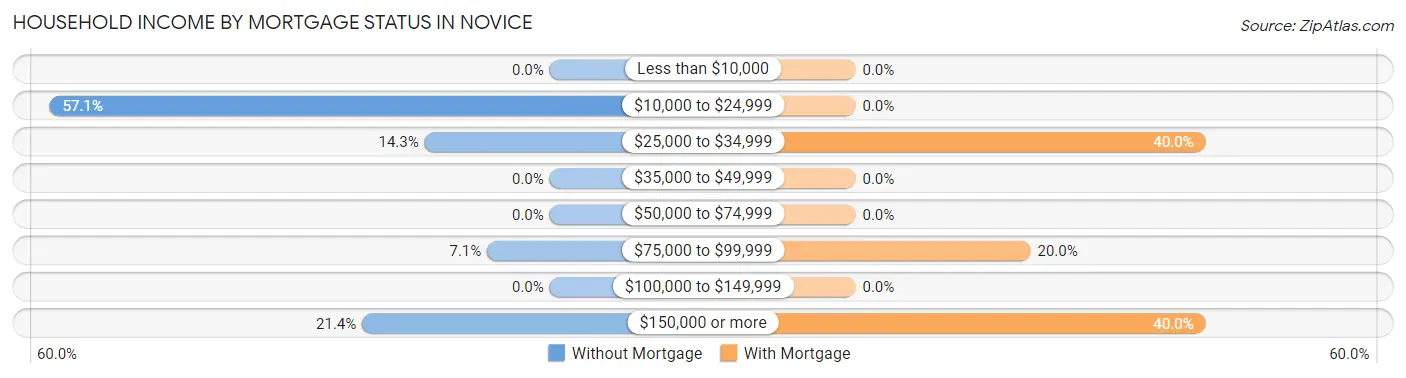
| Household Income | Without Mortgage | With Mortgage |
| Less than $10,000 | 0 (0.0%) | 0 (0.0%) |
| $10,000 to $24,999 | 8 (57.1%) | 0 (0.0%) |
| $25,000 to $34,999 | 2 (14.3%) | 2 (40.0%) |
| $35,000 to $49,999 | 0 (0.0%) | 0 (0.0%) |
| $50,000 to $74,999 | 0 (0.0%) | 0 (0.0%) |
| $75,000 to $99,999 | 1 (7.1%) | 1 (20.0%) |
| $100,000 to $149,999 | 0 (0.0%) | 0 (0.0%) |
| $150,000 or more | 3 (21.4%) | 2 (40.0%) |
| Total | 14 (100.0%) | 5 (100.0%) |
Property Value to Household Income Ratio in Novice
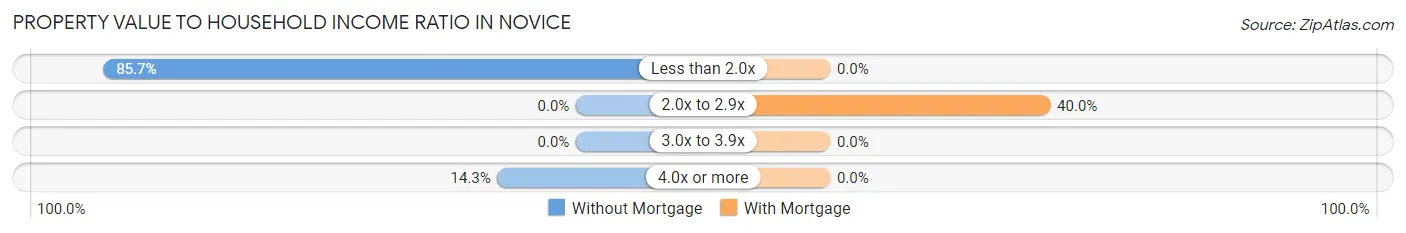
| Value-to-Income Ratio | Without Mortgage | With Mortgage |
| Less than 2.0x | 12 (85.7%) | 0 (0.0%) |
| 2.0x to 2.9x | 0 (0.0%) | 2 (40.0%) |
| 3.0x to 3.9x | 0 (0.0%) | 0 (0.0%) |
| 4.0x or more | 2 (14.3%) | 0 (0.0%) |
| Total | 14 (100.0%) | 5 (100.0%) |
Real Estate Taxes by Mortgage Status in Novice
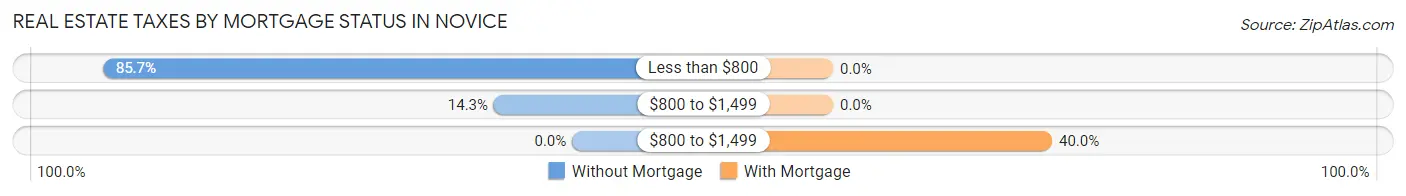
| Property Taxes | Without Mortgage | With Mortgage |
| Less than $800 | 12 (85.7%) | 0 (0.0%) |
| $800 to $1,499 | 2 (14.3%) | 0 (0.0%) |
| $800 to $1,499 | 0 (0.0%) | 2 (40.0%) |
| Total | 14 (100.0%) | 5 (100.0%) |
Health & Disability in Novice
Health Insurance Coverage by Age in Novice
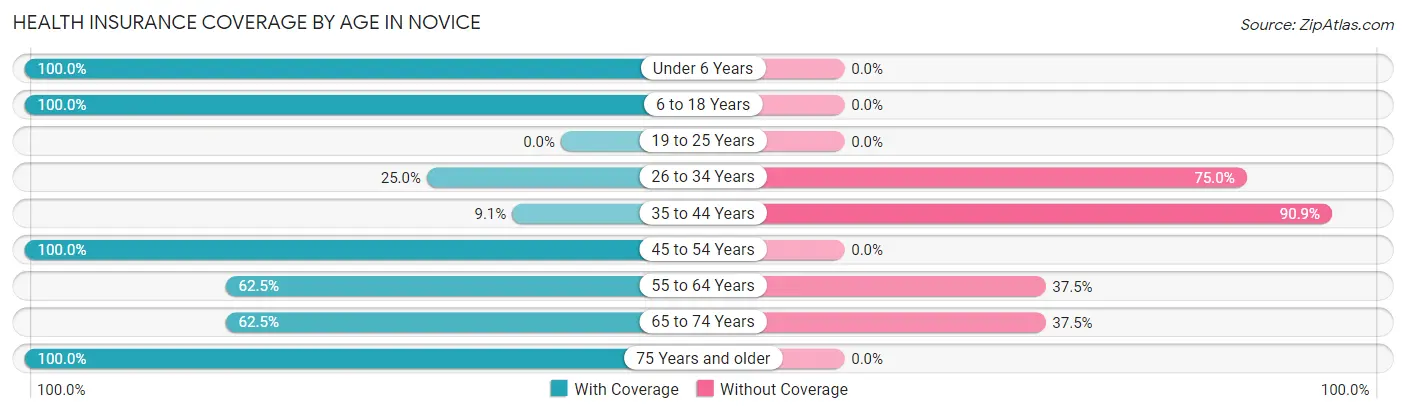
| Age Bracket | With Coverage | Without Coverage |
| Under 6 Years | 9 (100.0%) | 0 (0.0%) |
| 6 to 18 Years | 5 (100.0%) | 0 (0.0%) |
| 19 to 25 Years | 0 (0.0%) | 0 (0.0%) |
| 26 to 34 Years | 4 (25.0%) | 12 (75.0%) |
| 35 to 44 Years | 1 (9.1%) | 10 (90.9%) |
| 45 to 54 Years | 1 (100.0%) | 0 (0.0%) |
| 55 to 64 Years | 20 (62.5%) | 12 (37.5%) |
| 65 to 74 Years | 5 (62.5%) | 3 (37.5%) |
| 75 Years and older | 4 (100.0%) | 0 (0.0%) |
| Total | 49 (57.0%) | 37 (43.0%) |
Health Insurance Coverage by Citizenship Status in Novice
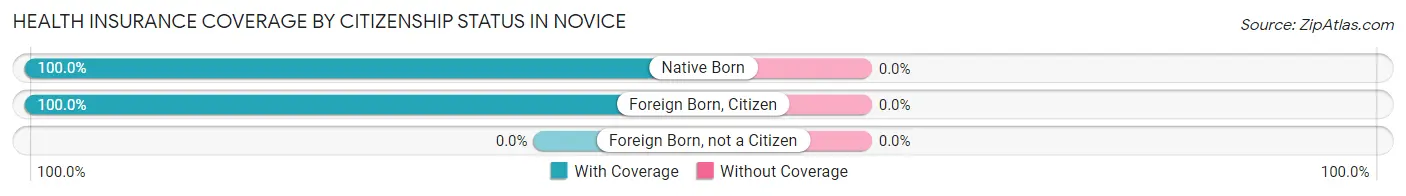
| Citizenship Status | With Coverage | Without Coverage |
| Native Born | 9 (100.0%) | 0 (0.0%) |
| Foreign Born, Citizen | 5 (100.0%) | 0 (0.0%) |
| Foreign Born, not a Citizen | 0 (0.0%) | 0 (0.0%) |
Health Insurance Coverage by Household Income in Novice
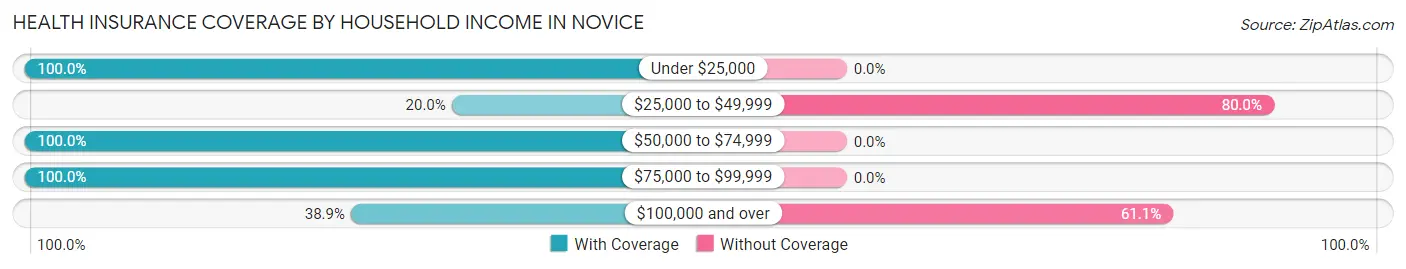
| Household Income | With Coverage | Without Coverage |
| Under $25,000 | 22 (100.0%) | 0 (0.0%) |
| $25,000 to $49,999 | 1 (20.0%) | 4 (80.0%) |
| $50,000 to $74,999 | 3 (100.0%) | 0 (0.0%) |
| $75,000 to $99,999 | 2 (100.0%) | 0 (0.0%) |
| $100,000 and over | 21 (38.9%) | 33 (61.1%) |
Public vs Private Health Insurance Coverage by Age in Novice
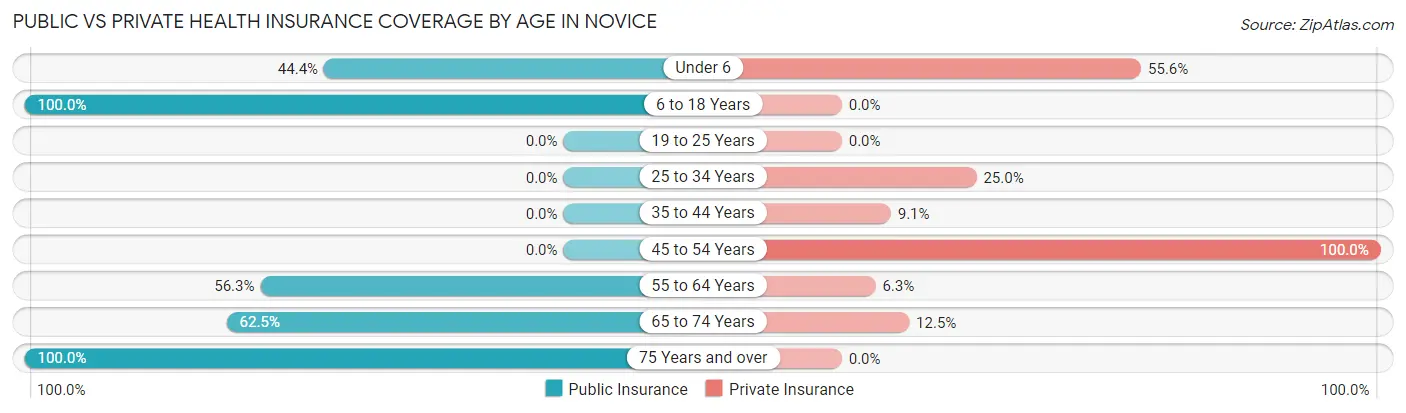
| Age Bracket | Public Insurance | Private Insurance |
| Under 6 | 4 (44.4%) | 5 (55.6%) |
| 6 to 18 Years | 5 (100.0%) | 0 (0.0%) |
| 19 to 25 Years | 0 (0.0%) | 0 (0.0%) |
| 25 to 34 Years | 0 (0.0%) | 4 (25.0%) |
| 35 to 44 Years | 0 (0.0%) | 1 (9.1%) |
| 45 to 54 Years | 0 (0.0%) | 1 (100.0%) |
| 55 to 64 Years | 18 (56.2%) | 2 (6.2%) |
| 65 to 74 Years | 5 (62.5%) | 1 (12.5%) |
| 75 Years and over | 4 (100.0%) | 0 (0.0%) |
| Total | 36 (41.9%) | 14 (16.3%) |
Disability Status by Sex by Age in Novice
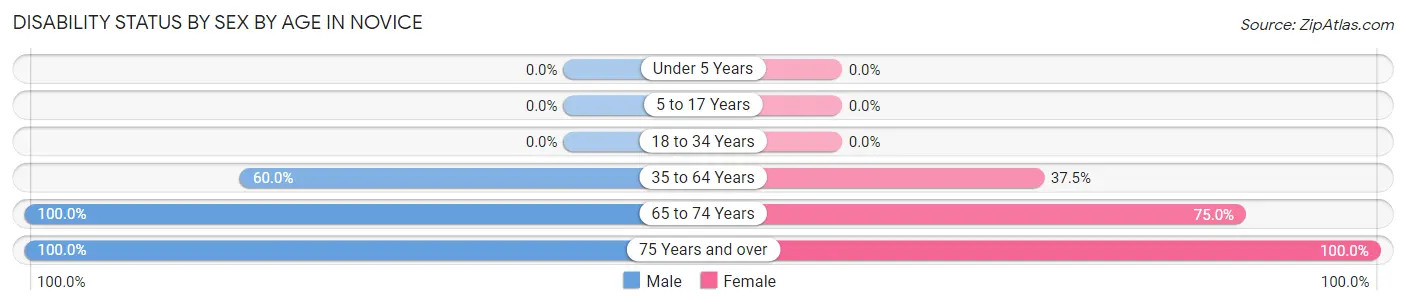
| Age Bracket | Male | Female |
| Under 5 Years | 0 (0.0%) | 0 (0.0%) |
| 5 to 17 Years | 0 (0.0%) | 0 (0.0%) |
| 18 to 34 Years | 0 (0.0%) | 0 (0.0%) |
| 35 to 64 Years | 12 (60.0%) | 9 (37.5%) |
| 65 to 74 Years | 4 (100.0%) | 3 (75.0%) |
| 75 Years and over | 2 (100.0%) | 2 (100.0%) |
Disability Class by Sex by Age in Novice
Disability Class: Hearing Difficulty
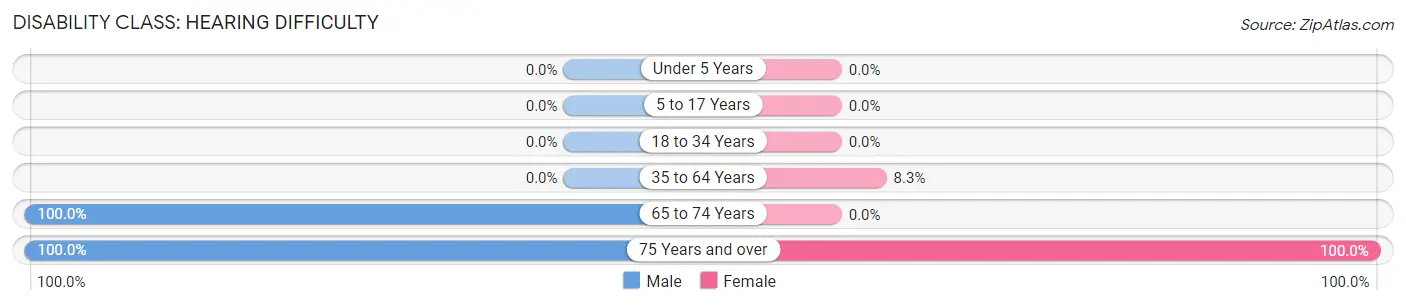
| Age Bracket | Male | Female |
| Under 5 Years | 0 (0.0%) | 0 (0.0%) |
| 5 to 17 Years | 0 (0.0%) | 0 (0.0%) |
| 18 to 34 Years | 0 (0.0%) | 0 (0.0%) |
| 35 to 64 Years | 0 (0.0%) | 2 (8.3%) |
| 65 to 74 Years | 4 (100.0%) | 0 (0.0%) |
| 75 Years and over | 2 (100.0%) | 2 (100.0%) |
Disability Class: Vision Difficulty
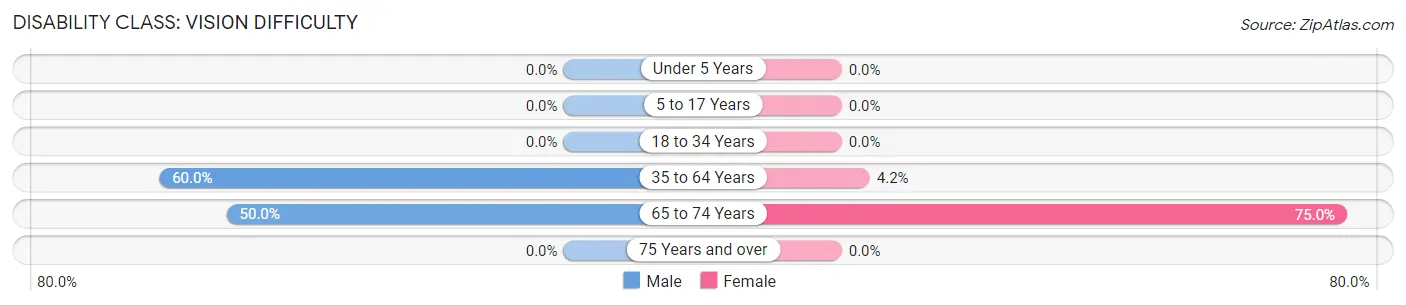
| Age Bracket | Male | Female |
| Under 5 Years | 0 (0.0%) | 0 (0.0%) |
| 5 to 17 Years | 0 (0.0%) | 0 (0.0%) |
| 18 to 34 Years | 0 (0.0%) | 0 (0.0%) |
| 35 to 64 Years | 12 (60.0%) | 1 (4.2%) |
| 65 to 74 Years | 2 (50.0%) | 3 (75.0%) |
| 75 Years and over | 0 (0.0%) | 0 (0.0%) |
Disability Class: Cognitive Difficulty
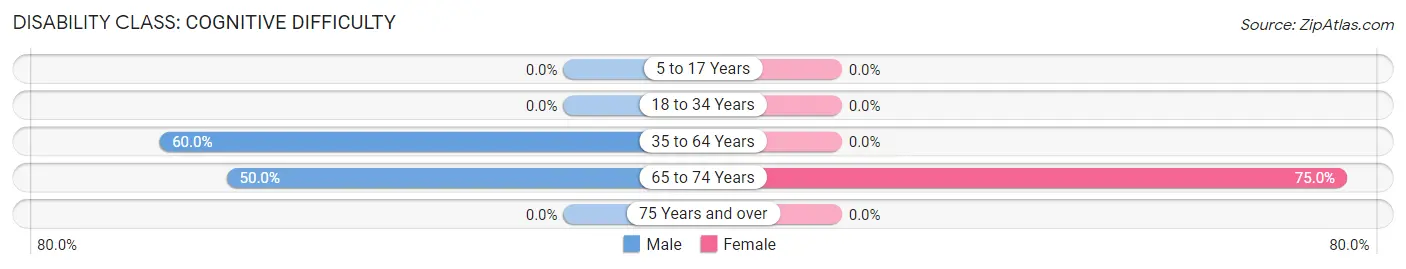
| Age Bracket | Male | Female |
| 5 to 17 Years | 0 (0.0%) | 0 (0.0%) |
| 18 to 34 Years | 0 (0.0%) | 0 (0.0%) |
| 35 to 64 Years | 12 (60.0%) | 0 (0.0%) |
| 65 to 74 Years | 2 (50.0%) | 3 (75.0%) |
| 75 Years and over | 0 (0.0%) | 0 (0.0%) |
Disability Class: Ambulatory Difficulty
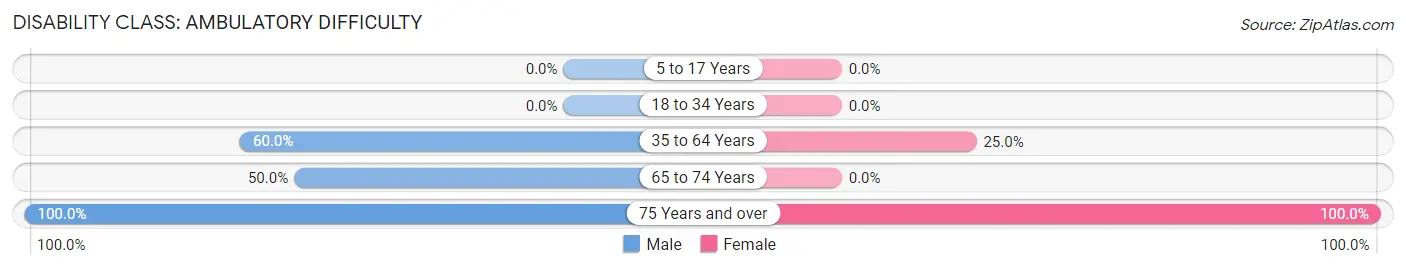
| Age Bracket | Male | Female |
| 5 to 17 Years | 0 (0.0%) | 0 (0.0%) |
| 18 to 34 Years | 0 (0.0%) | 0 (0.0%) |
| 35 to 64 Years | 12 (60.0%) | 6 (25.0%) |
| 65 to 74 Years | 2 (50.0%) | 0 (0.0%) |
| 75 Years and over | 2 (100.0%) | 2 (100.0%) |
Disability Class: Self-Care Difficulty
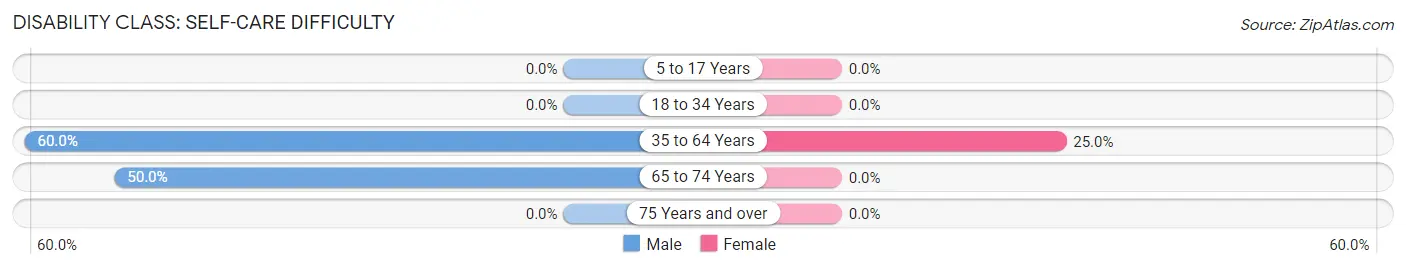
| Age Bracket | Male | Female |
| 5 to 17 Years | 0 (0.0%) | 0 (0.0%) |
| 18 to 34 Years | 0 (0.0%) | 0 (0.0%) |
| 35 to 64 Years | 12 (60.0%) | 6 (25.0%) |
| 65 to 74 Years | 2 (50.0%) | 0 (0.0%) |
| 75 Years and over | 0 (0.0%) | 0 (0.0%) |
Technology Access in Novice
Computing Device Access in Novice
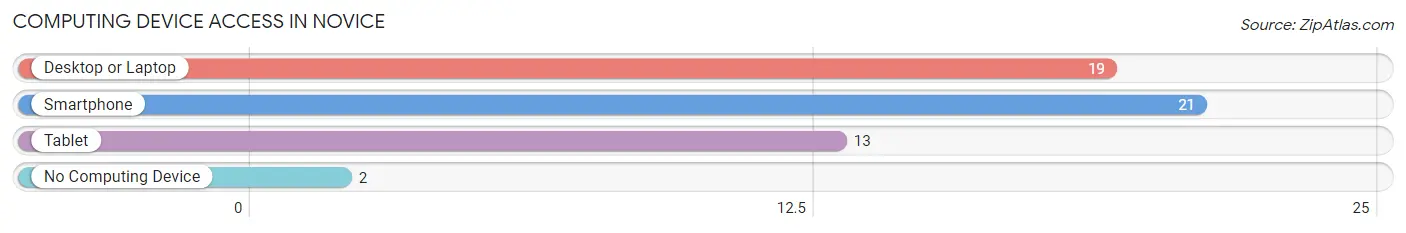
| Device Type | # Households | % Households |
| Desktop or Laptop | 19 | 82.6% |
| Smartphone | 21 | 91.3% |
| Tablet | 13 | 56.5% |
| No Computing Device | 2 | 8.7% |
| Total | 23 | 100.0% |
Internet Access in Novice
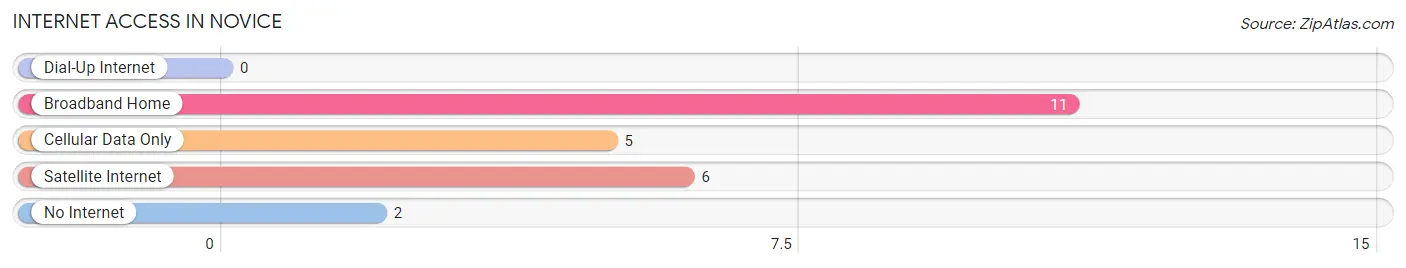
| Internet Type | # Households | % Households |
| Dial-Up Internet | 0 | 0.0% |
| Broadband Home | 11 | 47.8% |
| Cellular Data Only | 5 | 21.7% |
| Satellite Internet | 6 | 26.1% |
| No Internet | 2 | 8.7% |
| Total | 23 | 100.0% |
Novice Summary
History
Novice is a small unincorporated community located in Coleman County, Texas. It is situated about 10 miles south of Coleman, the county seat. The town was founded in the late 1800s by a group of settlers from the nearby town of Santa Anna. The settlers were looking for a place to settle and start a new life.
The town was originally called “New Hope”, but the name was changed to Novice in 1891. The name was chosen to reflect the fact that the settlers were new to the area and were starting a new life.
The town grew slowly but steadily over the years, and by the early 1900s it had a population of around 200 people. The town was home to a variety of businesses, including a general store, a blacksmith shop, a cotton gin, and a school.
The town was also home to a number of churches, including the First Baptist Church of Novice, which was founded in 1891. The church is still active today and is the oldest church in the town.
The town was also home to a number of fraternal organizations, including the Masonic Lodge, the Odd Fellows, and the Knights of Pythias.
The town was also home to a number of social clubs, including the Novice Social Club, which was founded in 1895. The club was a popular gathering place for the town’s residents and was the site of many dances and other social events.
The town was also home to a number of businesses, including a cotton gin, a general store, a blacksmith shop, and a school.
Geography
Novice is located in Coleman County, Texas, about 10 miles south of Coleman, the county seat. The town is situated on the banks of the Colorado River, which flows through the area.
The town is located in a rural area, surrounded by rolling hills and farmland. The area is known for its beautiful scenery and is a popular destination for outdoor activities such as fishing, hunting, and camping.
The town is located in a temperate climate, with hot summers and mild winters. The average temperature in the summer is around 90 degrees Fahrenheit, while the average temperature in the winter is around 50 degrees Fahrenheit.
Economy
The economy of Novice is largely based on agriculture. The town is home to a number of farms, which produce a variety of crops, including cotton, corn, wheat, and hay.
The town is also home to a number of businesses, including a general store, a blacksmith shop, and a cotton gin. The town is also home to a number of restaurants, which serve a variety of local dishes.
Demographics
As of the 2010 census, the population of Novice was estimated to be around 200 people. The town is predominantly white, with a small Hispanic population. The median household income in the town is around $30,000.
The town is served by the Novice Independent School District, which serves students in grades K-12. The town is also home to a number of churches, including the First Baptist Church of Novice, which was founded in 1891.
Common Questions
What is Per Capita Income in Novice?
Per Capita income in Novice is $24,838.
What is the Median Family Income in Novice?
Median Family Income in Novice is $105,000.
What is Inequality or Gini Index in Novice?
Inequality or Gini Index in Novice is 0.47.
What is the Total Population of Novice?
Total Population of Novice is 86.
What is the Total Male Population of Novice?
Total Male Population of Novice is 39.
What is the Total Female Population of Novice?
Total Female Population of Novice is 47.
What is the Ratio of Males per 100 Females in Novice?
There are 82.98 Males per 100 Females in Novice.
What is the Ratio of Females per 100 Males in Novice?
There are 120.51 Females per 100 Males in Novice.
What is the Median Population Age in Novice?
Median Population Age in Novice is 56.1 Years.
What is the Average Family Size in Novice
Average Family Size in Novice is 4.9 People.
What is the Average Household Size in Novice
Average Household Size in Novice is 3.7 People.
How Large is the Labor Force in Novice?
There are 29 People in the Labor Forcein in Novice.
What is the Percentage of People in the Labor Force in Novice?
37.7% of People are in the Labor Force in Novice.