Newark, TX Map & Demographics
Newark Map
Newark Overview
$26,912
PER CAPITA INCOME
$46,806
AVG FAMILY INCOME
$51,607
AVG HOUSEHOLD INCOME
48.7%
WAGE / INCOME GAP [ % ]
51.3¢/ $1
WAGE / INCOME GAP [ $ ]
0.47
INEQUALITY / GINI INDEX
1,232
TOTAL POPULATION
660
MALE POPULATION
572
FEMALE POPULATION
115.38
MALES / 100 FEMALES
86.67
FEMALES / 100 MALES
31.4
MEDIAN AGE
3.4
AVG FAMILY SIZE
3.0
AVG HOUSEHOLD SIZE
552
LABOR FORCE [ PEOPLE ]
62.7%
PERCENT IN LABOR FORCE
7.1%
UNEMPLOYMENT RATE
Newark Zip Codes
Newark Area Codes
Income in Newark
Income Overview in Newark
Per Capita Income in Newark is $26,912, while median incomes of families and households are $46,806 and $51,607 respectively.
| Characteristic | Number | Measure |
| Per Capita Income | 1,232 | $26,912 |
| Median Family Income | 317 | $46,806 |
| Mean Family Income | 317 | $80,947 |
| Median Household Income | 406 | $51,607 |
| Mean Household Income | 406 | $81,446 |
| Income Deficit | 317 | $0 |
| Wage / Income Gap (%) | 1,232 | 48.72% |
| Wage / Income Gap ($) | 1,232 | 51.28¢ per $1 |
| Gini / Inequality Index | 1,232 | 0.47 |
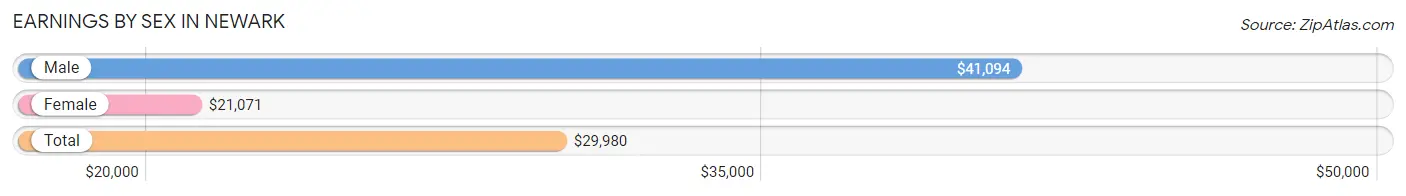
Earnings by Sex in Newark
Average Earnings in Newark are $29,980, $41,094 for men and $21,071 for women, a difference of 48.7%.
| Sex | Number | Average Earnings |
| Male | 359 (62.4%) | $41,094 |
| Female | 216 (37.6%) | $21,071 |
| Total | 575 (100.0%) | $29,980 |
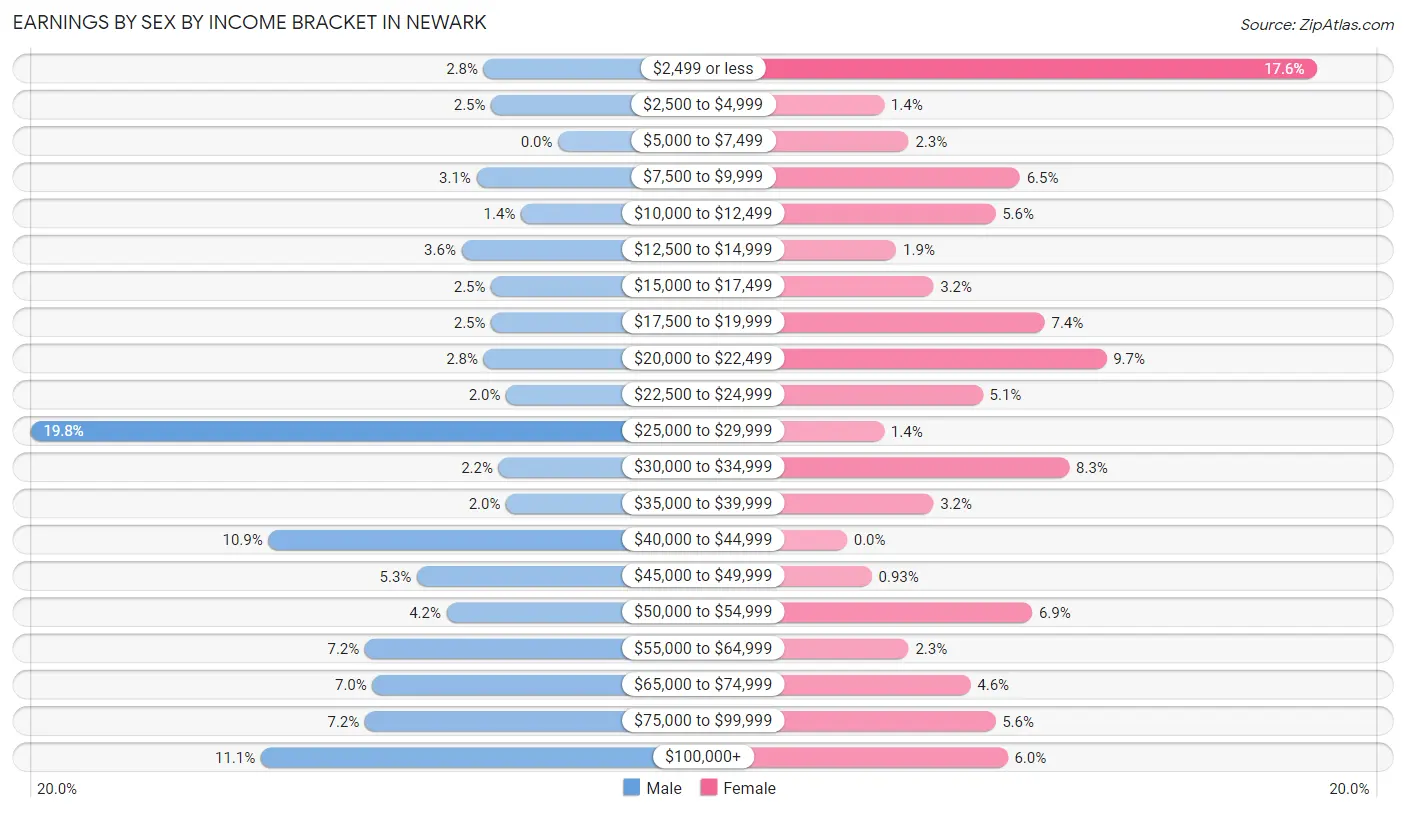
Earnings by Sex by Income Bracket in Newark
The most common earnings brackets in Newark are $25,000 to $29,999 for men (71 | 19.8%) and $2,499 or less for women (38 | 17.6%).
| Income | Male | Female |
| $2,499 or less | 10 (2.8%) | 38 (17.6%) |
| $2,500 to $4,999 | 9 (2.5%) | 3 (1.4%) |
| $5,000 to $7,499 | 0 (0.0%) | 5 (2.3%) |
| $7,500 to $9,999 | 11 (3.1%) | 14 (6.5%) |
| $10,000 to $12,499 | 5 (1.4%) | 12 (5.6%) |
| $12,500 to $14,999 | 13 (3.6%) | 4 (1.8%) |
| $15,000 to $17,499 | 9 (2.5%) | 7 (3.2%) |
| $17,500 to $19,999 | 9 (2.5%) | 16 (7.4%) |
| $20,000 to $22,499 | 10 (2.8%) | 21 (9.7%) |
| $22,500 to $24,999 | 7 (1.9%) | 11 (5.1%) |
| $25,000 to $29,999 | 71 (19.8%) | 3 (1.4%) |
| $30,000 to $34,999 | 8 (2.2%) | 18 (8.3%) |
| $35,000 to $39,999 | 7 (1.9%) | 7 (3.2%) |
| $40,000 to $44,999 | 39 (10.9%) | 0 (0.0%) |
| $45,000 to $49,999 | 19 (5.3%) | 2 (0.9%) |
| $50,000 to $54,999 | 15 (4.2%) | 15 (6.9%) |
| $55,000 to $64,999 | 26 (7.2%) | 5 (2.3%) |
| $65,000 to $74,999 | 25 (7.0%) | 10 (4.6%) |
| $75,000 to $99,999 | 26 (7.2%) | 12 (5.6%) |
| $100,000+ | 40 (11.1%) | 13 (6.0%) |
| Total | 359 (100.0%) | 216 (100.0%) |
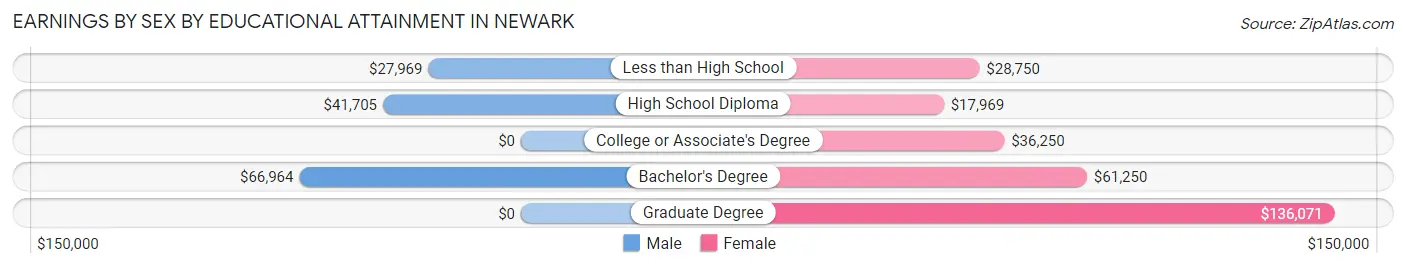
Earnings by Sex by Educational Attainment in Newark
Average earnings in Newark are $43,250 for men and $23,295 for women, a difference of 46.1%. Men with an educational attainment of bachelor's degree enjoy the highest average annual earnings of $66,964, while those with less than high school education earn the least with $27,969. Women with an educational attainment of graduate degree earn the most with the average annual earnings of $136,071, while those with high school diploma education have the smallest earnings of $17,969.
| Educational Attainment | Male Income | Female Income |
| Less than High School | $27,969 | $28,750 |
| High School Diploma | $41,705 | $17,969 |
| College or Associate's Degree | - | - |
| Bachelor's Degree | $66,964 | $61,250 |
| Graduate Degree | - | - |
| Total | $43,250 | $23,295 |
Family Income in Newark
Family Income Brackets in Newark
According to the Newark family income data, there are 73 families falling into the $25,000 to $34,999 income range, which is the most common income bracket and makes up 23.0% of all families. Conversely, the less than $10,000 income bracket is the least frequent group with only 14 families (4.4%) belonging to this category.
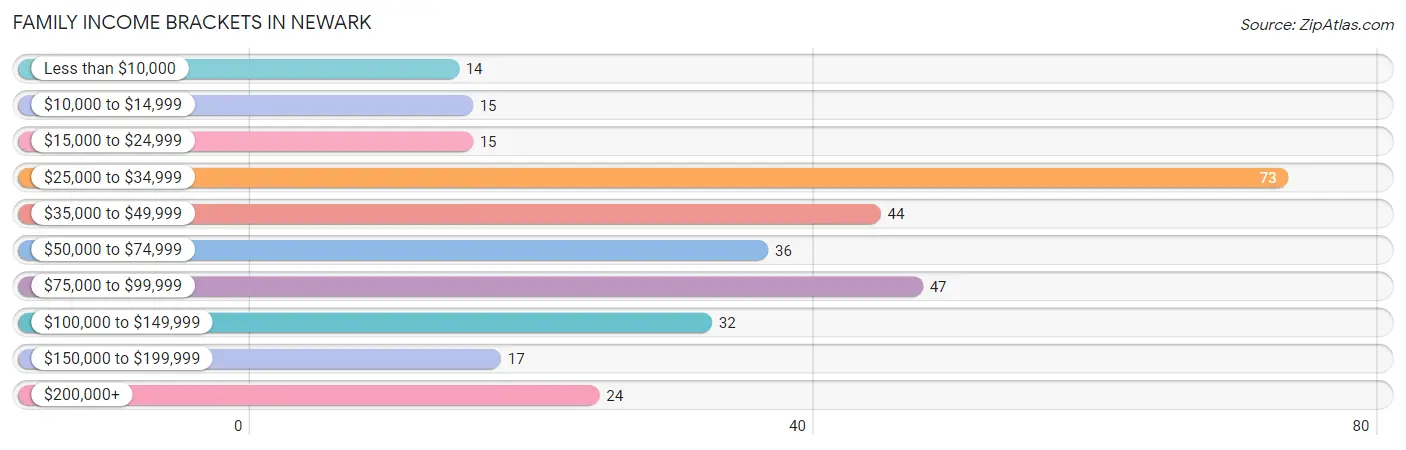
| Income Bracket | # Families | % Families |
| Less than $10,000 | 14 | 4.4% |
| $10,000 to $14,999 | 15 | 4.7% |
| $15,000 to $24,999 | 15 | 4.7% |
| $25,000 to $34,999 | 73 | 23.0% |
| $35,000 to $49,999 | 44 | 13.9% |
| $50,000 to $74,999 | 36 | 11.4% |
| $75,000 to $99,999 | 47 | 14.8% |
| $100,000 to $149,999 | 32 | 10.1% |
| $150,000 to $199,999 | 17 | 5.4% |
| $200,000+ | 24 | 7.6% |
Family Income by Famaliy Size in Newark
6-person families (8 | 2.5%) account for the highest median family income in Newark with $136,250 per family, while 2-person families (122 | 38.5%) have the highest median income of $25,416 per family member.
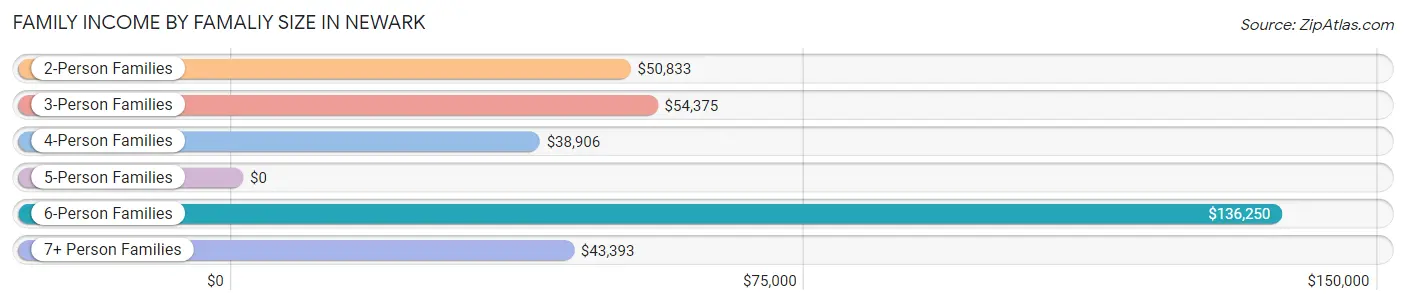
| Income Bracket | # Families | Median Income |
| 2-Person Families | 122 (38.5%) | $50,833 |
| 3-Person Families | 78 (24.6%) | $54,375 |
| 4-Person Families | 67 (21.1%) | $38,906 |
| 5-Person Families | 16 (5.1%) | $0 |
| 6-Person Families | 8 (2.5%) | $136,250 |
| 7+ Person Families | 26 (8.2%) | $43,393 |
| Total | 317 (100.0%) | $46,806 |
Family Income by Number of Earners in Newark
The median family income in Newark is $46,806, with families comprising 3+ earners (22) having the highest median family income of $136,250, while families with no earners (31) have the lowest median family income of $33,750, accounting for 6.9% and 9.8% of families, respectively.
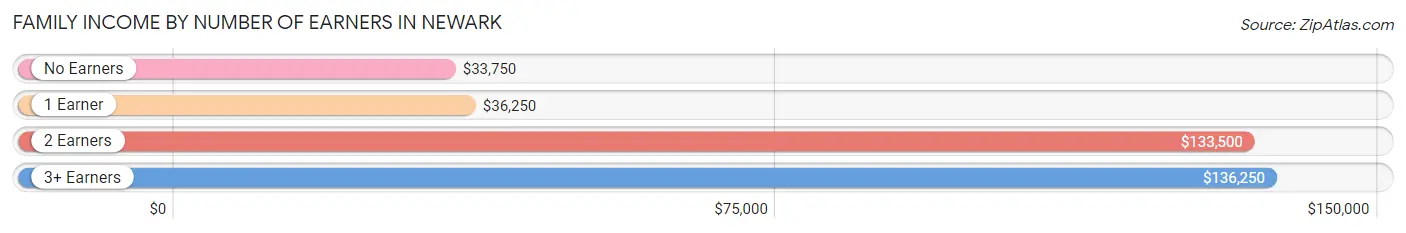
| Number of Earners | # Families | Median Income |
| No Earners | 31 (9.8%) | $33,750 |
| 1 Earner | 196 (61.8%) | $36,250 |
| 2 Earners | 68 (21.4%) | $133,500 |
| 3+ Earners | 22 (6.9%) | $136,250 |
| Total | 317 (100.0%) | $46,806 |
Household Income in Newark
Household Income Brackets in Newark
With 88 households falling in the category, the $25,000 to $34,999 income range is the most frequent in Newark, accounting for 21.7% of all households. In contrast, only 10 households (2.5%) fall into the $10,000 to $14,999 income bracket, making it the least populous group.
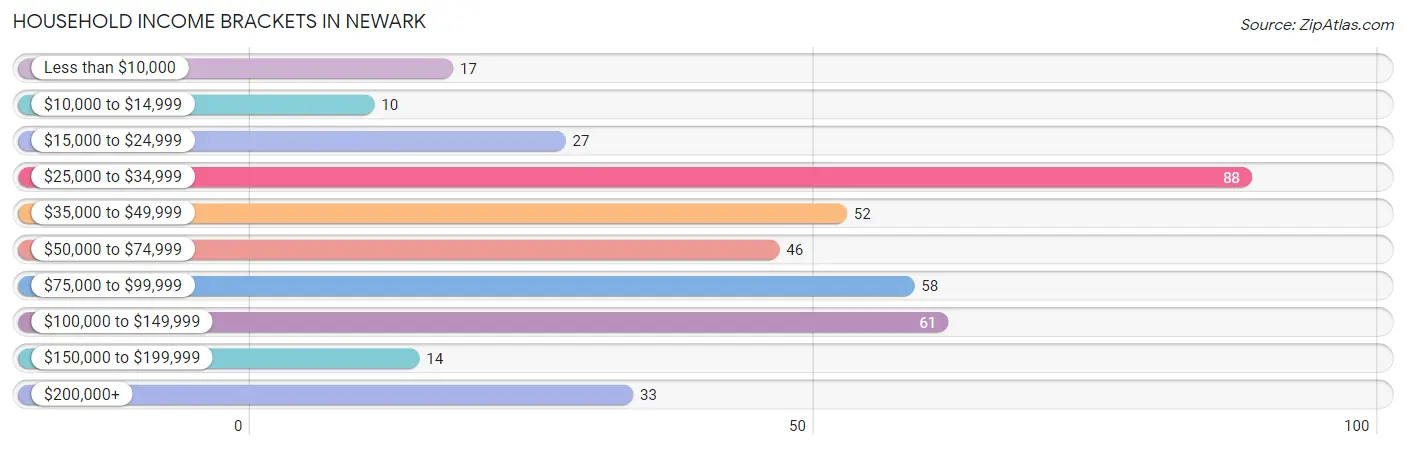
| Income Bracket | # Households | % Households |
| Less than $10,000 | 17 | 4.2% |
| $10,000 to $14,999 | 10 | 2.5% |
| $15,000 to $24,999 | 27 | 6.7% |
| $25,000 to $34,999 | 88 | 21.7% |
| $35,000 to $49,999 | 52 | 12.8% |
| $50,000 to $74,999 | 46 | 11.3% |
| $75,000 to $99,999 | 58 | 14.3% |
| $100,000 to $149,999 | 61 | 15.0% |
| $150,000 to $199,999 | 14 | 3.4% |
| $200,000+ | 33 | 8.1% |
Household Income by Householder Age in Newark
The median household income in Newark is $51,607, with the highest median household income of $76,667 found in the 65+ years age bracket for the primary householder. A total of 74 households (18.2%) fall into this category. Meanwhile, the 45 to 64 years age bracket for the primary householder has the lowest median household income of $0, with 154 households (37.9%) in this group.
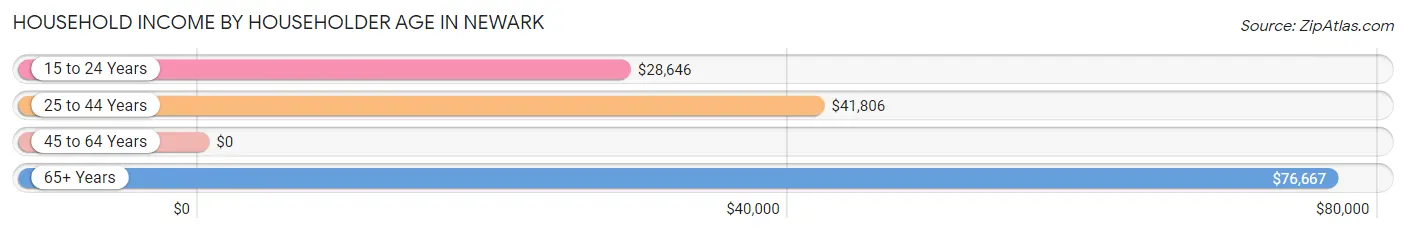
| Income Bracket | # Households | Median Income |
| 15 to 24 Years | 15 (3.7%) | $28,646 |
| 25 to 44 Years | 163 (40.2%) | $41,806 |
| 45 to 64 Years | 154 (37.9%) | $0 |
| 65+ Years | 74 (18.2%) | $76,667 |
| Total | 406 (100.0%) | $51,607 |
Poverty in Newark
Income Below Poverty by Sex and Age in Newark
With 25.6% poverty level for males and 34.9% for females among the residents of Newark, 5 year old males and 16 and 17 year old females are the most vulnerable to poverty, with 1 males (100.0%) and 2 females (100.0%) in their respective age groups living below the poverty level.
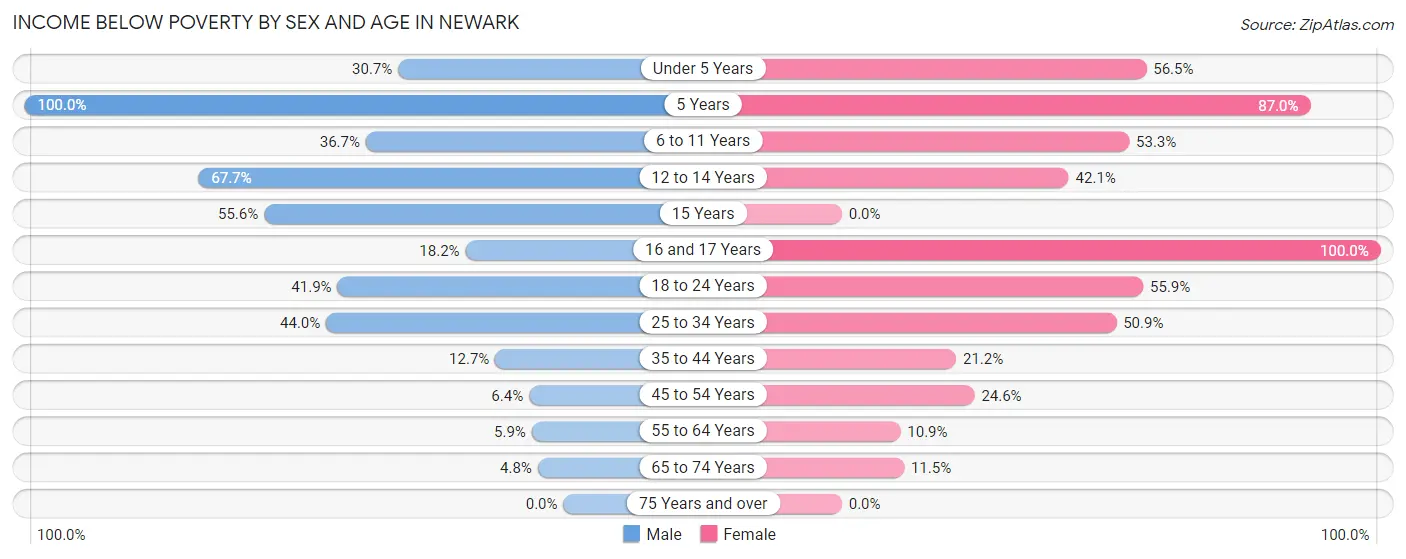
| Age Bracket | Male | Female |
| Under 5 Years | 23 (30.7%) | 26 (56.5%) |
| 5 Years | 1 (100.0%) | 20 (87.0%) |
| 6 to 11 Years | 22 (36.7%) | 32 (53.3%) |
| 12 to 14 Years | 21 (67.7%) | 16 (42.1%) |
| 15 Years | 5 (55.6%) | 0 (0.0%) |
| 16 and 17 Years | 2 (18.2%) | 2 (100.0%) |
| 18 to 24 Years | 26 (41.9%) | 33 (55.9%) |
| 25 to 34 Years | 48 (44.0%) | 27 (50.9%) |
| 35 to 44 Years | 10 (12.7%) | 14 (21.2%) |
| 45 to 54 Years | 3 (6.4%) | 16 (24.6%) |
| 55 to 64 Years | 5 (5.9%) | 10 (10.9%) |
| 65 to 74 Years | 3 (4.8%) | 3 (11.5%) |
| 75 Years and over | 0 (0.0%) | 0 (0.0%) |
| Total | 169 (25.6%) | 199 (34.9%) |
Income Above Poverty by Sex and Age in Newark
According to the poverty statistics in Newark, males aged 75 years and over and females aged 15 years are the age groups that are most secure financially, with 100.0% of males and 100.0% of females in these age groups living above the poverty line.
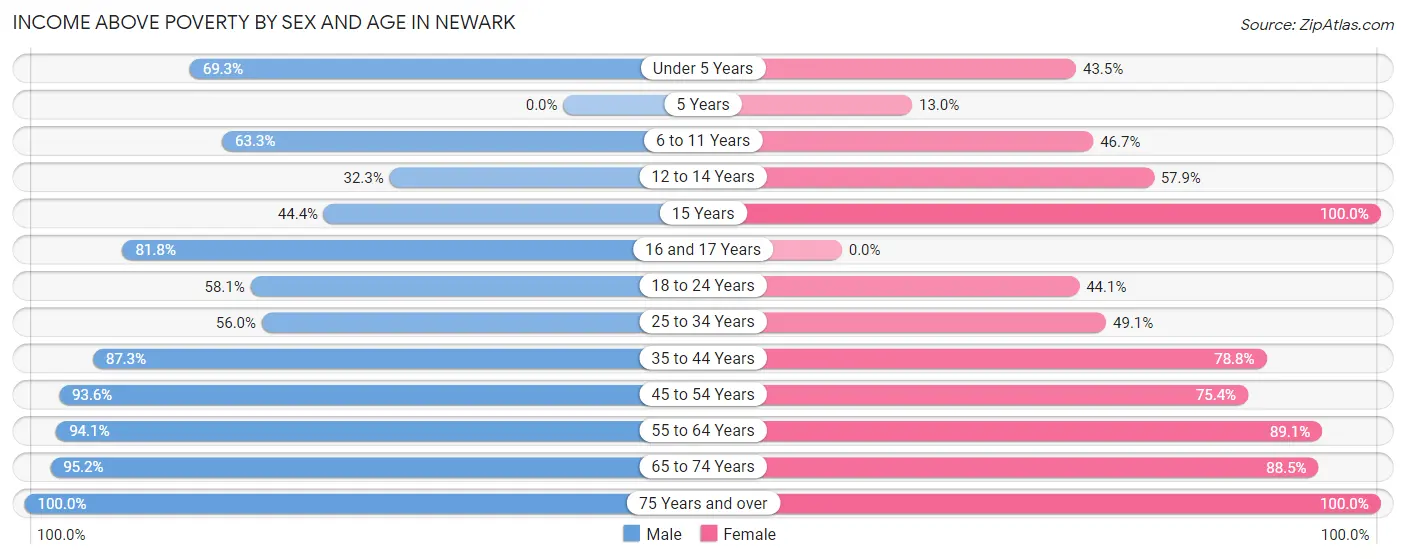
| Age Bracket | Male | Female |
| Under 5 Years | 52 (69.3%) | 20 (43.5%) |
| 5 Years | 0 (0.0%) | 3 (13.0%) |
| 6 to 11 Years | 38 (63.3%) | 28 (46.7%) |
| 12 to 14 Years | 10 (32.3%) | 22 (57.9%) |
| 15 Years | 4 (44.4%) | 6 (100.0%) |
| 16 and 17 Years | 9 (81.8%) | 0 (0.0%) |
| 18 to 24 Years | 36 (58.1%) | 26 (44.1%) |
| 25 to 34 Years | 61 (56.0%) | 26 (49.1%) |
| 35 to 44 Years | 69 (87.3%) | 52 (78.8%) |
| 45 to 54 Years | 44 (93.6%) | 49 (75.4%) |
| 55 to 64 Years | 80 (94.1%) | 82 (89.1%) |
| 65 to 74 Years | 60 (95.2%) | 23 (88.5%) |
| 75 Years and over | 28 (100.0%) | 34 (100.0%) |
| Total | 491 (74.4%) | 371 (65.1%) |
Income Below Poverty Among Married-Couple Families in Newark
The poverty statistics for married-couple families in Newark show that 19.7% or 45 of the total 229 families live below the poverty line. Families with 5 or more children have the highest poverty rate of 76.9%, comprising of 10 families. On the other hand, families with no children have the lowest poverty rate of 2.5%, which includes 3 families.
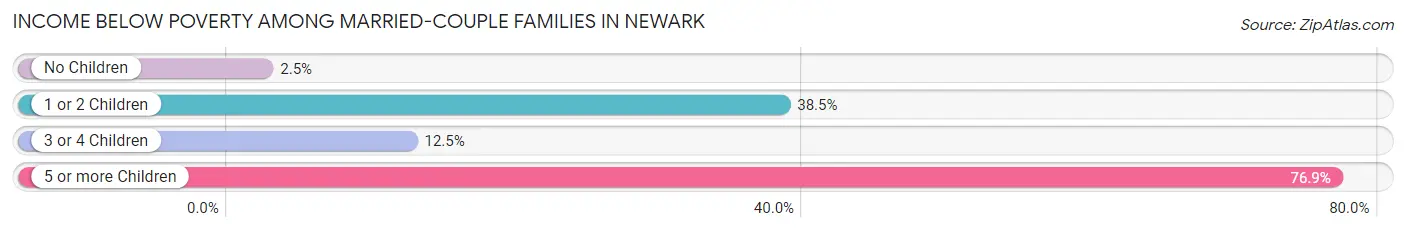
| Children | Above Poverty | Below Poverty |
| No Children | 119 (97.5%) | 3 (2.5%) |
| 1 or 2 Children | 48 (61.5%) | 30 (38.5%) |
| 3 or 4 Children | 14 (87.5%) | 2 (12.5%) |
| 5 or more Children | 3 (23.1%) | 10 (76.9%) |
| Total | 184 (80.3%) | 45 (19.7%) |
Income Below Poverty Among Single-Parent Households in Newark
According to the poverty data in Newark, 30.8% or 12 single-father households and 65.3% or 32 single-mother households are living below the poverty line. Among single-father households, those with 5 or more children have the highest poverty rate, with 12 households (100.0%) experiencing poverty. Likewise, among single-mother households, those with 1 or 2 children have the highest poverty rate, with 28 households (66.7%) falling below the poverty line.
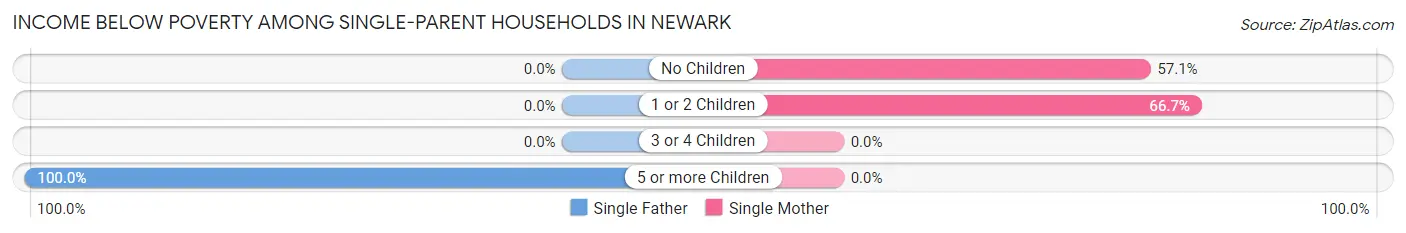
| Children | Single Father | Single Mother |
| No Children | 0 (0.0%) | 4 (57.1%) |
| 1 or 2 Children | 0 (0.0%) | 28 (66.7%) |
| 3 or 4 Children | 0 (0.0%) | 0 (0.0%) |
| 5 or more Children | 12 (100.0%) | 0 (0.0%) |
| Total | 12 (30.8%) | 32 (65.3%) |
Income Below Poverty Among Married-Couple vs Single-Parent Households in Newark
The poverty data for Newark shows that 45 of the married-couple family households (19.7%) and 44 of the single-parent households (50.0%) are living below the poverty level. Within the married-couple family households, those with 5 or more children have the highest poverty rate, with 10 households (76.9%) falling below the poverty line. Among the single-parent households, those with 5 or more children have the highest poverty rate, with 12 household (100.0%) living below poverty.
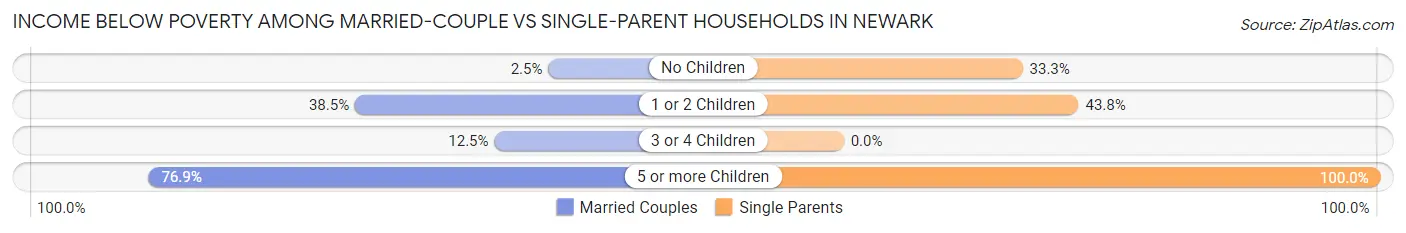
| Children | Married-Couple Families | Single-Parent Households |
| No Children | 3 (2.5%) | 4 (33.3%) |
| 1 or 2 Children | 30 (38.5%) | 28 (43.8%) |
| 3 or 4 Children | 2 (12.5%) | 0 (0.0%) |
| 5 or more Children | 10 (76.9%) | 12 (100.0%) |
| Total | 45 (19.7%) | 44 (50.0%) |
Race in Newark
The most populous races in Newark are White / Caucasian (881 | 71.5%), Hispanic or Latino (593 | 48.1%), and Two or more Races (246 | 20.0%).
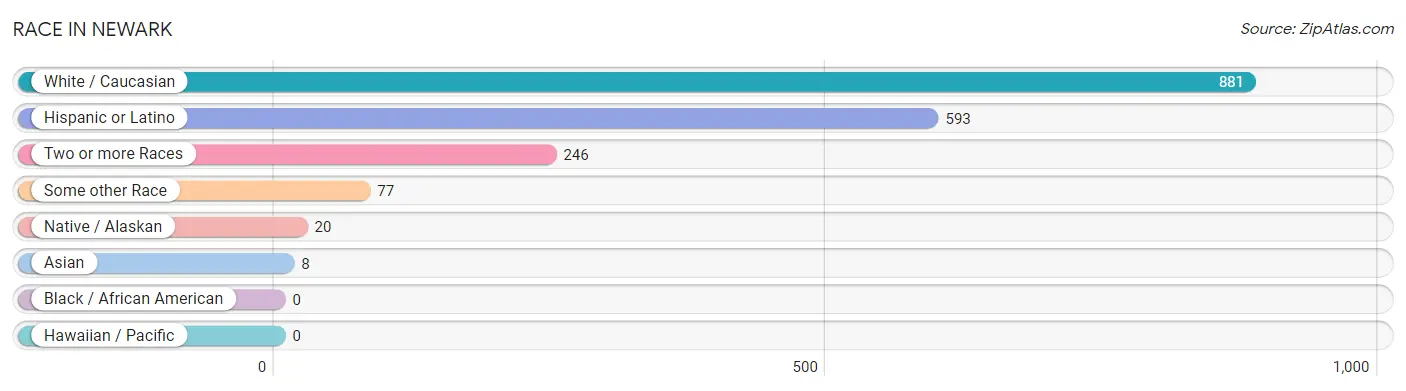
| Race | # Population | % Population |
| Asian | 8 | 0.6% |
| Black / African American | 0 | 0.0% |
| Hawaiian / Pacific | 0 | 0.0% |
| Hispanic or Latino | 593 | 48.1% |
| Native / Alaskan | 20 | 1.6% |
| White / Caucasian | 881 | 71.5% |
| Two or more Races | 246 | 20.0% |
| Some other Race | 77 | 6.2% |
| Total | 1,232 | 100.0% |
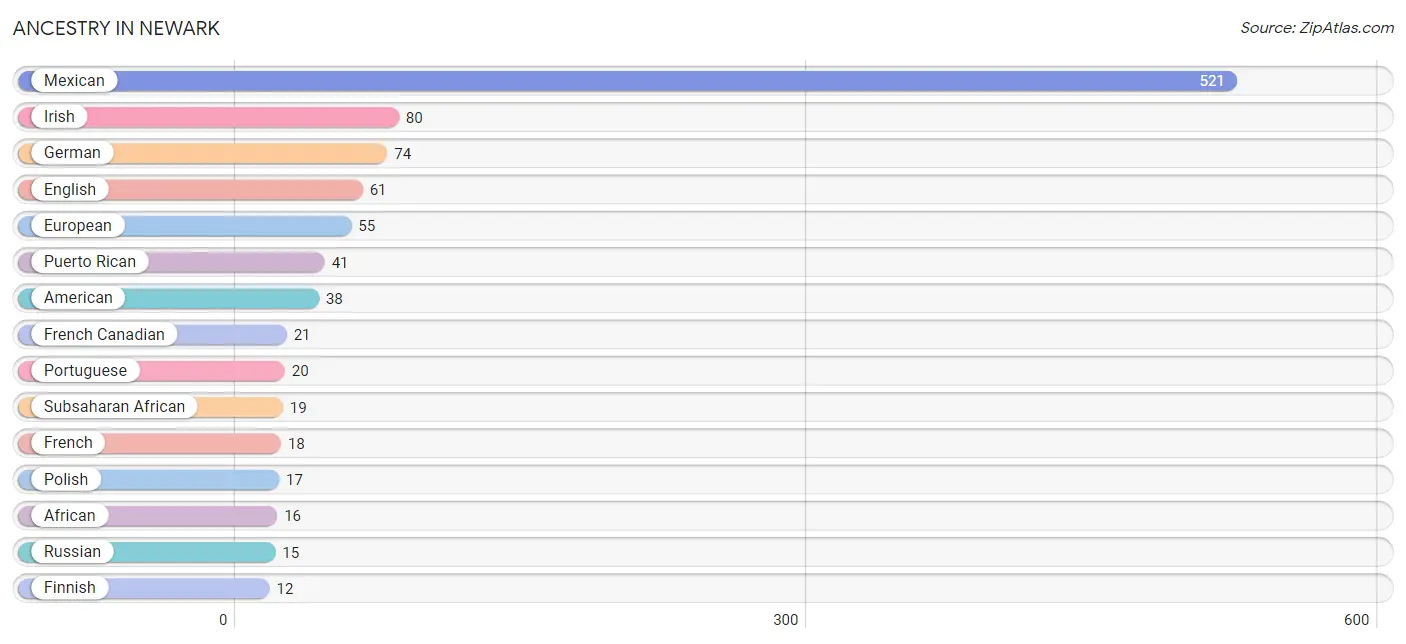
Ancestry in Newark
The most populous ancestries reported in Newark are Mexican (521 | 42.3%), Irish (80 | 6.5%), German (74 | 6.0%), English (61 | 5.0%), and European (55 | 4.5%), together accounting for 64.2% of all Newark residents.
| Ancestry | # Population | % Population |
| African | 16 | 1.3% |
| American | 38 | 3.1% |
| Apache | 10 | 0.8% |
| Central American | 3 | 0.2% |
| Cherokee | 10 | 0.8% |
| Choctaw | 1 | 0.1% |
| Comanche | 2 | 0.2% |
| Czech | 5 | 0.4% |
| Danish | 5 | 0.4% |
| Dominican | 6 | 0.5% |
| English | 61 | 5.0% |
| European | 55 | 4.5% |
| Finnish | 12 | 1.0% |
| French | 18 | 1.5% |
| French Canadian | 21 | 1.7% |
| German | 74 | 6.0% |
| Honduran | 3 | 0.2% |
| Hungarian | 6 | 0.5% |
| Irish | 80 | 6.5% |
| Italian | 9 | 0.7% |
| Korean | 8 | 0.6% |
| Mexican | 521 | 42.3% |
| Polish | 17 | 1.4% |
| Portuguese | 20 | 1.6% |
| Puerto Rican | 41 | 3.3% |
| Russian | 15 | 1.2% |
| Scottish | 7 | 0.6% |
| South African | 3 | 0.2% |
| Subsaharan African | 19 | 1.5% |
| Swedish | 3 | 0.2% |
| Thai | 3 | 0.2% | View All 31 Rows |
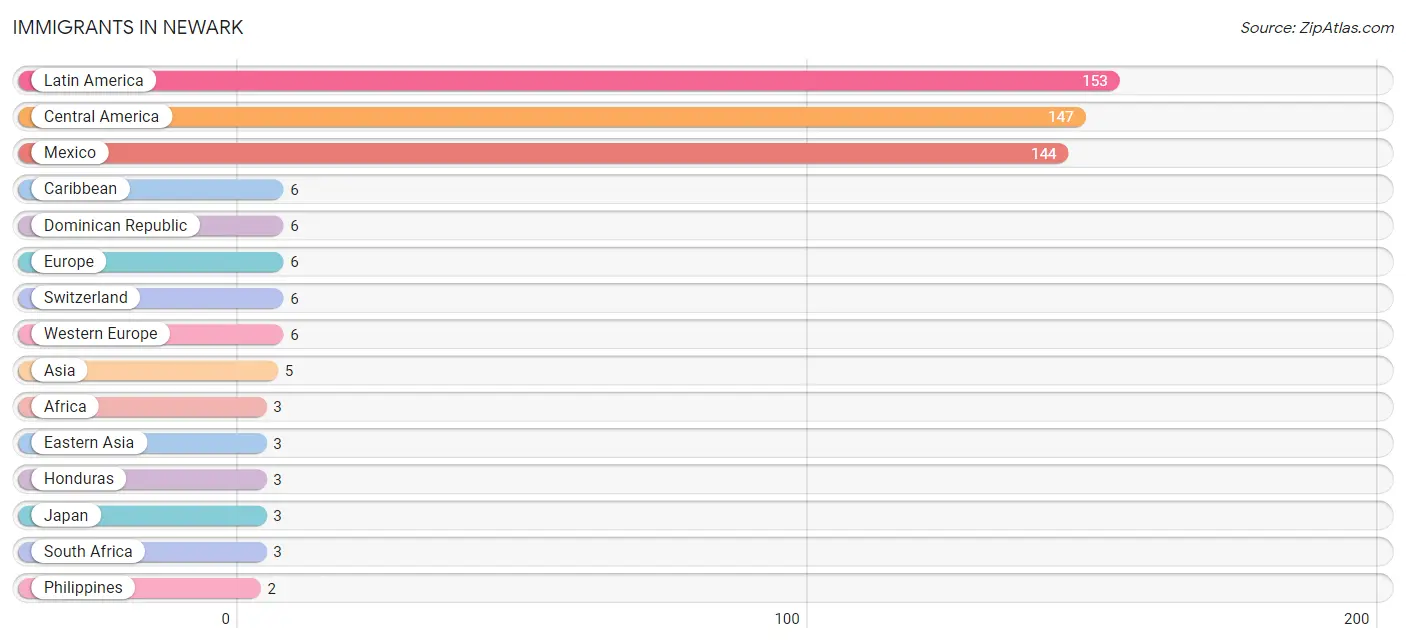
Immigrants in Newark
The most numerous immigrant groups reported in Newark came from Latin America (153 | 12.4%), Central America (147 | 11.9%), Mexico (144 | 11.7%), Caribbean (6 | 0.5%), and Dominican Republic (6 | 0.5%), together accounting for 37.0% of all Newark residents.
| Immigration Origin | # Population | % Population |
| Africa | 3 | 0.2% |
| Asia | 5 | 0.4% |
| Caribbean | 6 | 0.5% |
| Central America | 147 | 11.9% |
| Dominican Republic | 6 | 0.5% |
| Eastern Asia | 3 | 0.2% |
| Europe | 6 | 0.5% |
| Honduras | 3 | 0.2% |
| Japan | 3 | 0.2% |
| Latin America | 153 | 12.4% |
| Mexico | 144 | 11.7% |
| Philippines | 2 | 0.2% |
| South Africa | 3 | 0.2% |
| South Eastern Asia | 2 | 0.2% |
| Switzerland | 6 | 0.5% |
| Western Europe | 6 | 0.5% | View All 16 Rows |
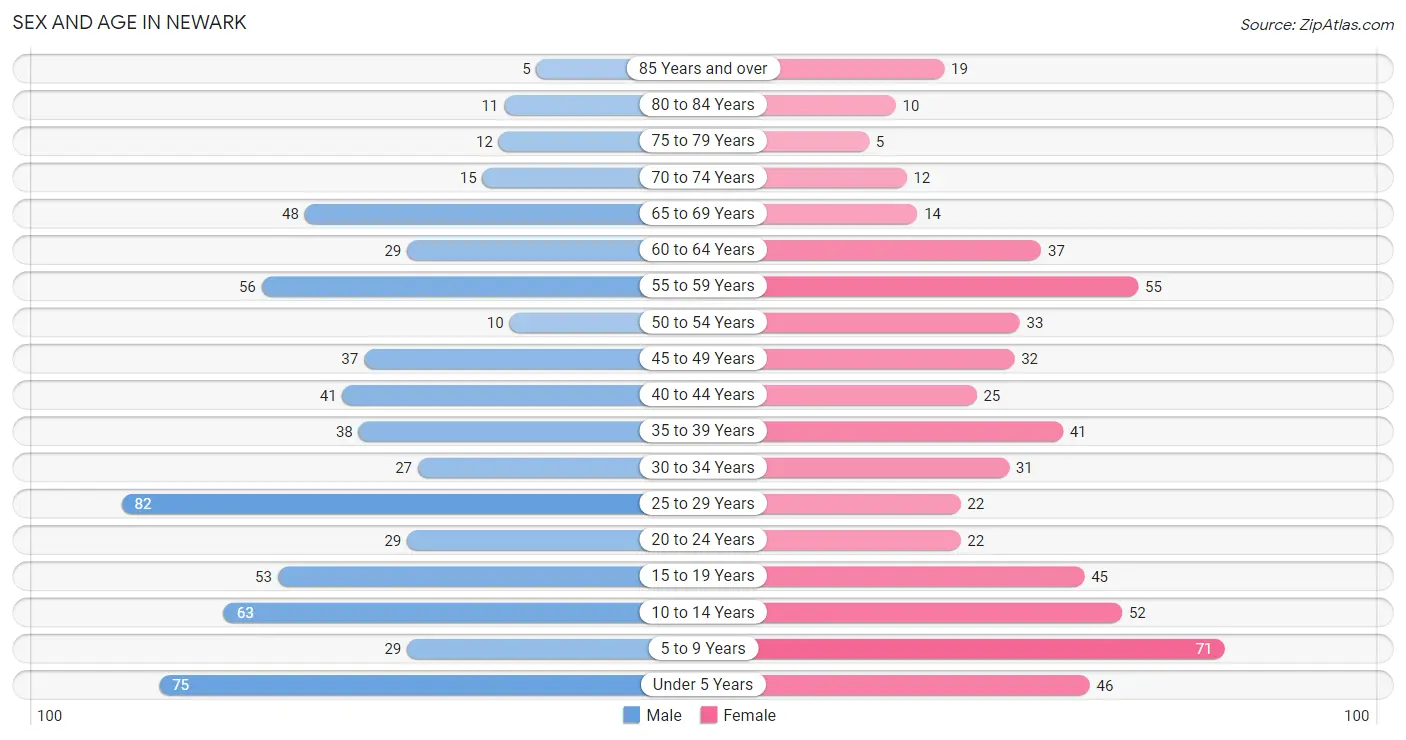
Sex and Age in Newark
Sex and Age in Newark
The most populous age groups in Newark are 25 to 29 Years (82 | 12.4%) for men and 5 to 9 Years (71 | 12.4%) for women.
| Age Bracket | Male | Female |
| Under 5 Years | 75 (11.4%) | 46 (8.0%) |
| 5 to 9 Years | 29 (4.4%) | 71 (12.4%) |
| 10 to 14 Years | 63 (9.6%) | 52 (9.1%) |
| 15 to 19 Years | 53 (8.0%) | 45 (7.9%) |
| 20 to 24 Years | 29 (4.4%) | 22 (3.8%) |
| 25 to 29 Years | 82 (12.4%) | 22 (3.8%) |
| 30 to 34 Years | 27 (4.1%) | 31 (5.4%) |
| 35 to 39 Years | 38 (5.8%) | 41 (7.2%) |
| 40 to 44 Years | 41 (6.2%) | 25 (4.4%) |
| 45 to 49 Years | 37 (5.6%) | 32 (5.6%) |
| 50 to 54 Years | 10 (1.5%) | 33 (5.8%) |
| 55 to 59 Years | 56 (8.5%) | 55 (9.6%) |
| 60 to 64 Years | 29 (4.4%) | 37 (6.5%) |
| 65 to 69 Years | 48 (7.3%) | 14 (2.5%) |
| 70 to 74 Years | 15 (2.3%) | 12 (2.1%) |
| 75 to 79 Years | 12 (1.8%) | 5 (0.9%) |
| 80 to 84 Years | 11 (1.7%) | 10 (1.8%) |
| 85 Years and over | 5 (0.8%) | 19 (3.3%) |
| Total | 660 (100.0%) | 572 (100.0%) |
Families and Households in Newark
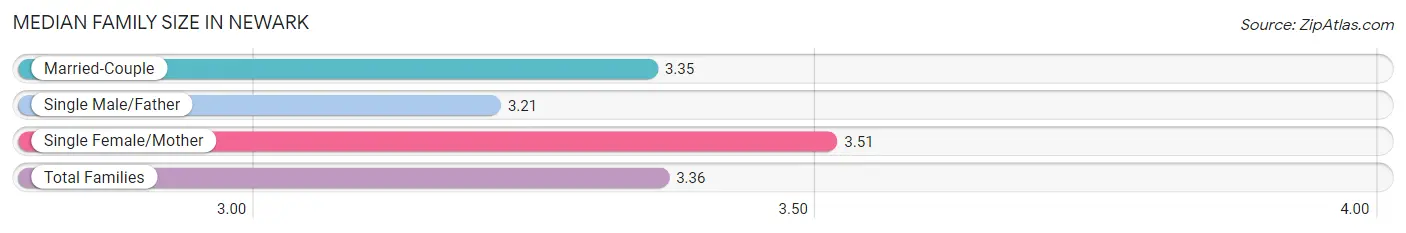
Median Family Size in Newark
The median family size in Newark is 3.36 persons per family, with single female/mother families (49 | 15.5%) accounting for the largest median family size of 3.51 persons per family. On the other hand, single male/father families (39 | 12.3%) represent the smallest median family size with 3.21 persons per family.
| Family Type | # Families | Family Size |
| Married-Couple | 229 (72.2%) | 3.35 |
| Single Male/Father | 39 (12.3%) | 3.21 |
| Single Female/Mother | 49 (15.5%) | 3.51 |
| Total Families | 317 (100.0%) | 3.36 |
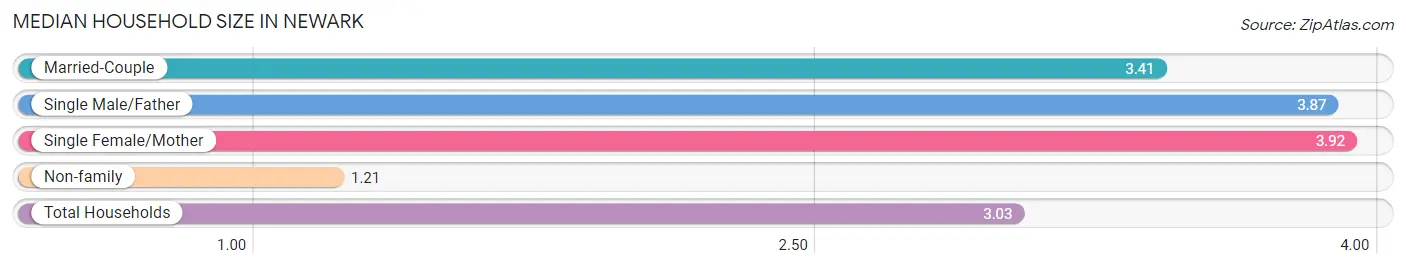
Median Household Size in Newark
The median household size in Newark is 3.03 persons per household, with single female/mother households (49 | 12.1%) accounting for the largest median household size of 3.92 persons per household. non-family households (89 | 21.9%) represent the smallest median household size with 1.21 persons per household.
| Household Type | # Households | Household Size |
| Married-Couple | 229 (56.4%) | 3.41 |
| Single Male/Father | 39 (9.6%) | 3.87 |
| Single Female/Mother | 49 (12.1%) | 3.92 |
| Non-family | 89 (21.9%) | 1.21 |
| Total Households | 406 (100.0%) | 3.03 |
Household Size by Marriage Status in Newark
Out of a total of 406 households in Newark, 317 (78.1%) are family households, while 89 (21.9%) are nonfamily households. The most numerous type of family households are 2-person households, comprising 99, and the most common type of nonfamily households are 1-person households, comprising 75.
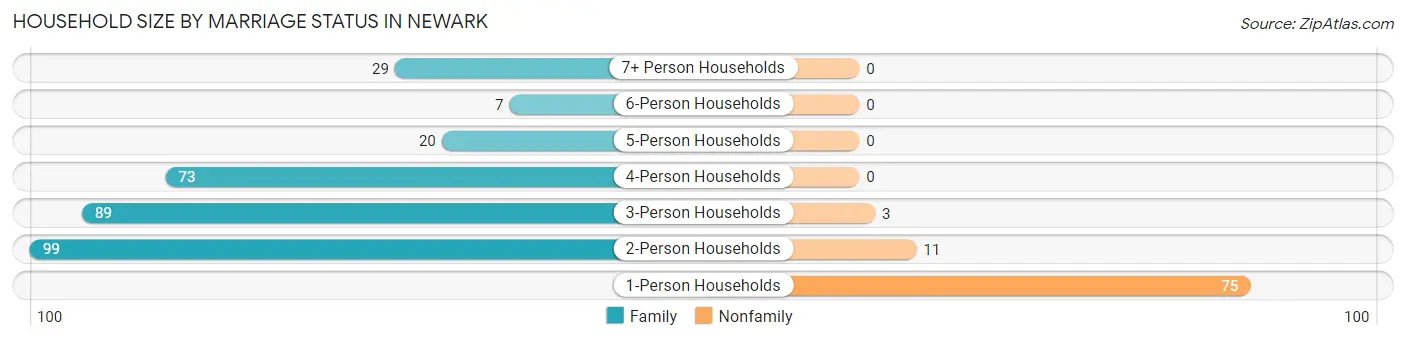
| Household Size | Family Households | Nonfamily Households |
| 1-Person Households | - | 75 (18.5%) |
| 2-Person Households | 99 (24.4%) | 11 (2.7%) |
| 3-Person Households | 89 (21.9%) | 3 (0.7%) |
| 4-Person Households | 73 (18.0%) | 0 (0.0%) |
| 5-Person Households | 20 (4.9%) | 0 (0.0%) |
| 6-Person Households | 7 (1.7%) | 0 (0.0%) |
| 7+ Person Households | 29 (7.1%) | 0 (0.0%) |
| Total | 317 (78.1%) | 89 (21.9%) |
Female Fertility in Newark
Fertility by Age in Newark
Average fertility rate in Newark is 77.0 births per 1,000 women. Women in the age bracket of 20 to 34 years have the highest fertility rate with 200.0 births per 1,000 women. Women in the age bracket of 20 to 34 years acount for 88.2% of all women with births.
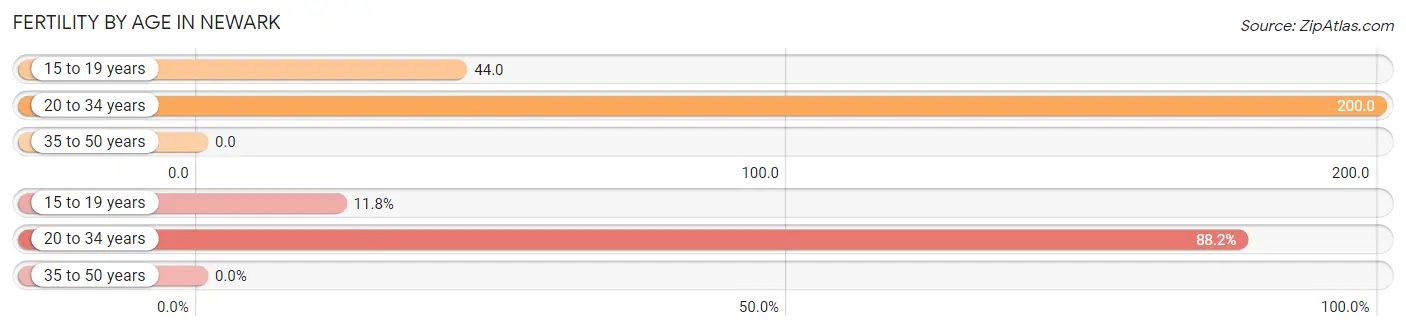
| Age Bracket | Women with Births | Births / 1,000 Women |
| 15 to 19 years | 2 (11.8%) | 44.0 |
| 20 to 34 years | 15 (88.2%) | 200.0 |
| 35 to 50 years | 0 (0.0%) | 0.0 |
| Total | 17 (100.0%) | 77.0 |
Fertility by Age by Marriage Status in Newark
64.7% of women with births (17) in Newark are married. The highest percentage of unmarried women with births falls into 15 to 19 years age bracket with 100.0% of them unmarried at the time of birth, while the lowest percentage of unmarried women with births belong to 20 to 34 years age bracket with 26.7% of them unmarried.
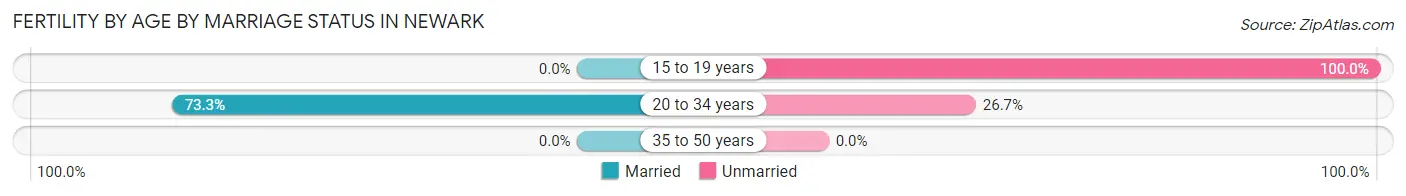
| Age Bracket | Married | Unmarried |
| 15 to 19 years | 0 (0.0%) | 2 (100.0%) |
| 20 to 34 years | 11 (73.3%) | 4 (26.7%) |
| 35 to 50 years | 0 (0.0%) | 0 (0.0%) |
| Total | 11 (64.7%) | 6 (35.3%) |
Fertility by Education in Newark
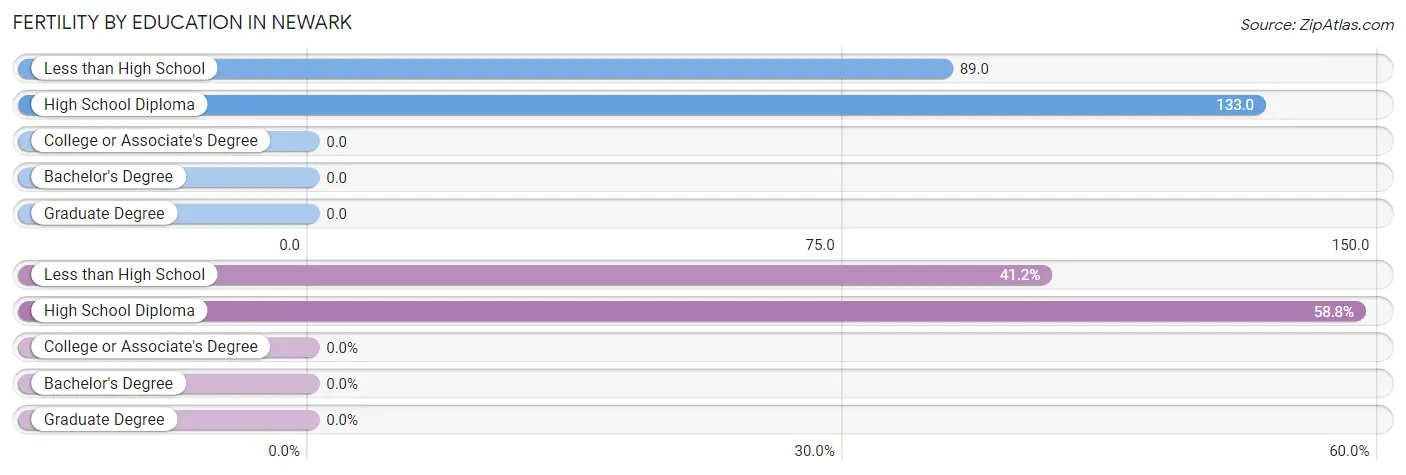
| Educational Attainment | Women with Births | Births / 1,000 Women |
| Less than High School | 7 (41.2%) | 89.0 |
| High School Diploma | 10 (58.8%) | 133.0 |
| College or Associate's Degree | 0 (0.0%) | 0.0 |
| Bachelor's Degree | 0 (0.0%) | 0.0 |
| Graduate Degree | 0 (0.0%) | 0.0 |
| Total | 17 (100.0%) | 77.0 |
Fertility by Education by Marriage Status in Newark
35.3% of women with births in Newark are unmarried. Women with the educational attainment of less than high school are most likely to be married with 71.4% of them married at childbirth, while women with the educational attainment of high school diploma are least likely to be married with 40.0% of them unmarried at childbirth.
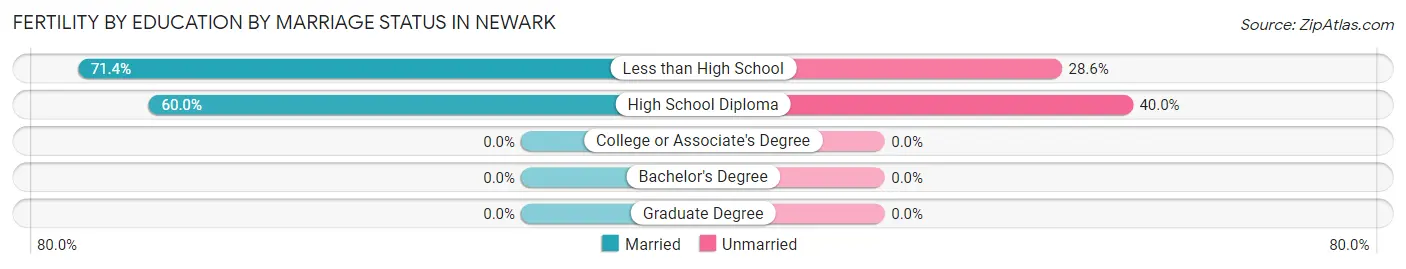
| Educational Attainment | Married | Unmarried |
| Less than High School | 5 (71.4%) | 2 (28.6%) |
| High School Diploma | 6 (60.0%) | 4 (40.0%) |
| College or Associate's Degree | 0 (0.0%) | 0 (0.0%) |
| Bachelor's Degree | 0 (0.0%) | 0 (0.0%) |
| Graduate Degree | 0 (0.0%) | 0 (0.0%) |
| Total | 11 (64.7%) | 6 (35.3%) |
Employment Characteristics in Newark
Employment by Class of Employer in Newark
Among the 490 employed individuals in Newark, private company employees (347 | 70.8%), local government employees (38 | 7.8%), and self-employed (not incorporated) (35 | 7.1%) make up the most common classes of employment.
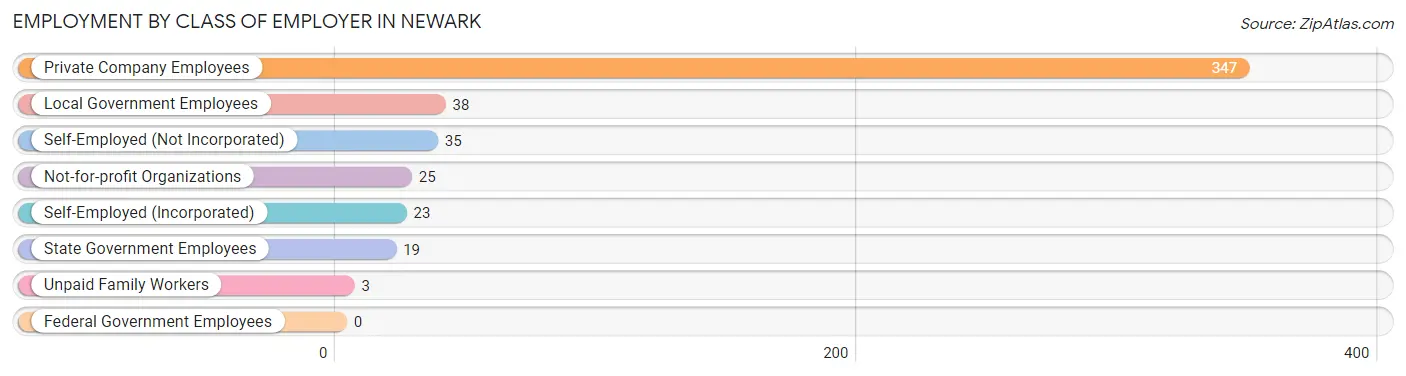
| Employer Class | # Employees | % Employees |
| Private Company Employees | 347 | 70.8% |
| Self-Employed (Incorporated) | 23 | 4.7% |
| Self-Employed (Not Incorporated) | 35 | 7.1% |
| Not-for-profit Organizations | 25 | 5.1% |
| Local Government Employees | 38 | 7.8% |
| State Government Employees | 19 | 3.9% |
| Federal Government Employees | 0 | 0.0% |
| Unpaid Family Workers | 3 | 0.6% |
| Total | 490 | 100.0% |
Employment Status by Age in Newark
According to the labor force statistics for Newark, out of the total population over 16 years of age (881), 62.7% or 552 individuals are in the labor force, with 7.1% or 39 of them unemployed. The age group with the highest labor force participation rate is 55 to 59 years, with 87.4% or 97 individuals in the labor force. Within the labor force, the 16 to 19 years age range has the highest percentage of unemployed individuals, with 34.8% or 16 of them being unemployed.
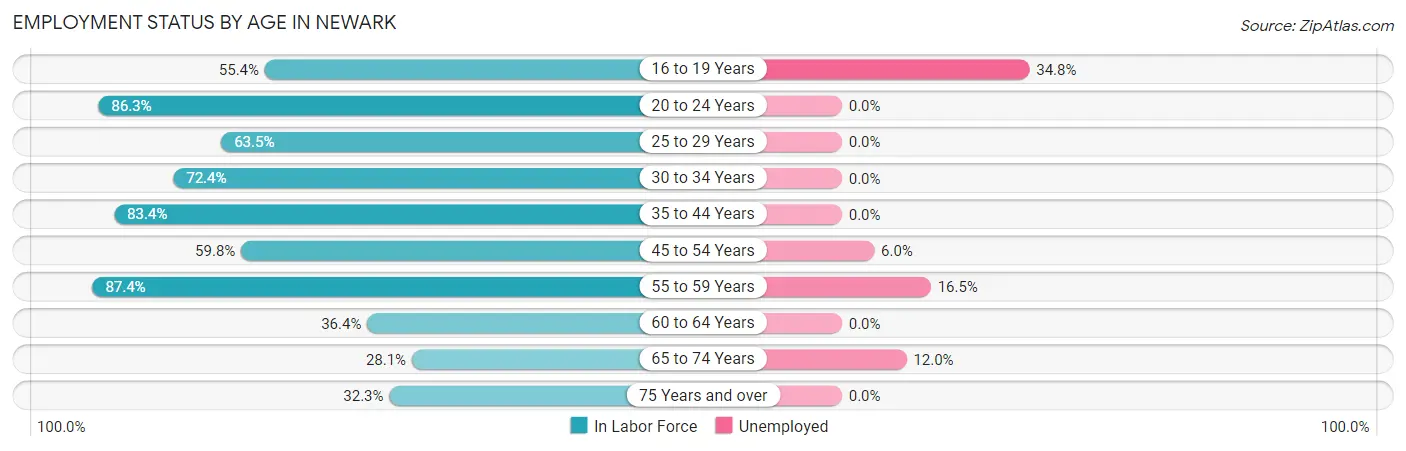
| Age Bracket | In Labor Force | Unemployed |
| 16 to 19 Years | 46 (55.4%) | 16 (34.8%) |
| 20 to 24 Years | 44 (86.3%) | 0 (0.0%) |
| 25 to 29 Years | 66 (63.5%) | 0 (0.0%) |
| 30 to 34 Years | 42 (72.4%) | 0 (0.0%) |
| 35 to 44 Years | 121 (83.4%) | 0 (0.0%) |
| 45 to 54 Years | 67 (59.8%) | 4 (6.0%) |
| 55 to 59 Years | 97 (87.4%) | 16 (16.5%) |
| 60 to 64 Years | 24 (36.4%) | 0 (0.0%) |
| 65 to 74 Years | 25 (28.1%) | 3 (12.0%) |
| 75 Years and over | 20 (32.3%) | 0 (0.0%) |
| Total | 552 (62.7%) | 39 (7.1%) |
Employment Status by Educational Attainment in Newark
According to labor force statistics for Newark, 70.0% of individuals (417) out of the total population between 25 and 64 years of age (596) are in the labor force, with 4.8% or 20 of them being unemployed. The group with the highest labor force participation rate are those with the educational attainment of bachelor's degree or higher, with 95.7% or 67 individuals in the labor force. Within the labor force, individuals with less than high school education have the highest percentage of unemployment, with 9.0% or 7 of them being unemployed.
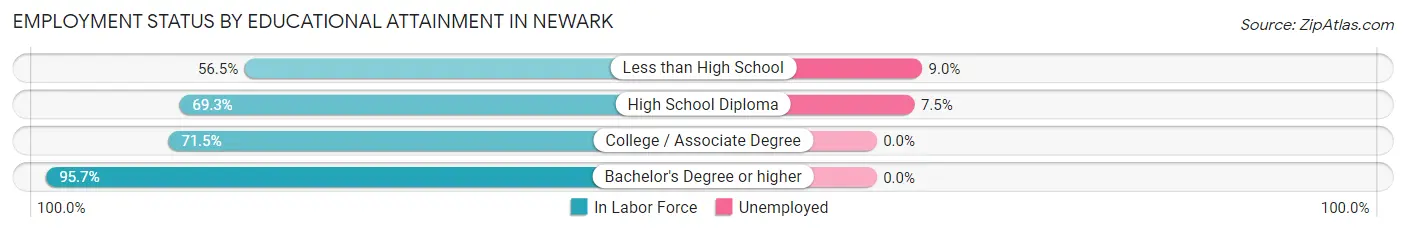
| Educational Attainment | In Labor Force | Unemployed |
| Less than High School | 78 (56.5%) | 12 (9.0%) |
| High School Diploma | 174 (69.3%) | 19 (7.5%) |
| College / Associate Degree | 98 (71.5%) | 0 (0.0%) |
| Bachelor's Degree or higher | 67 (95.7%) | 0 (0.0%) |
| Total | 417 (70.0%) | 29 (4.8%) |
Employment Occupations by Sex in Newark
Management, Business, Science and Arts Occupations
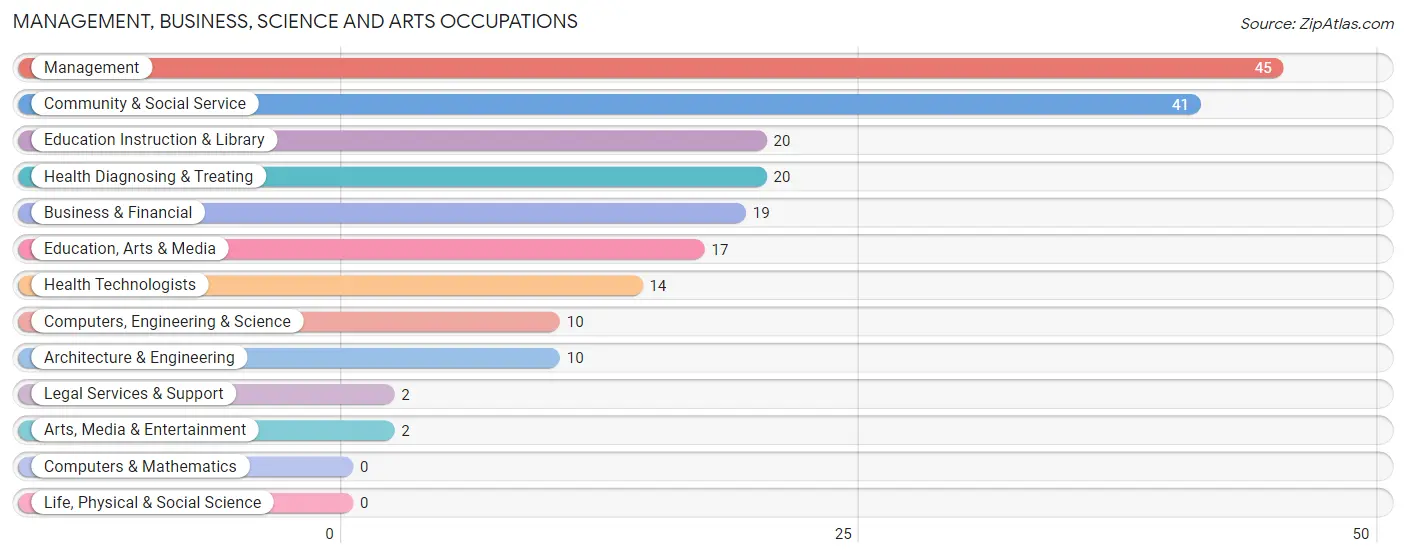
The most common Management, Business, Science and Arts occupations in Newark are Management (45 | 8.8%), Community & Social Service (41 | 8.0%), Education Instruction & Library (20 | 3.9%), Health Diagnosing & Treating (20 | 3.9%), and Business & Financial (19 | 3.7%).
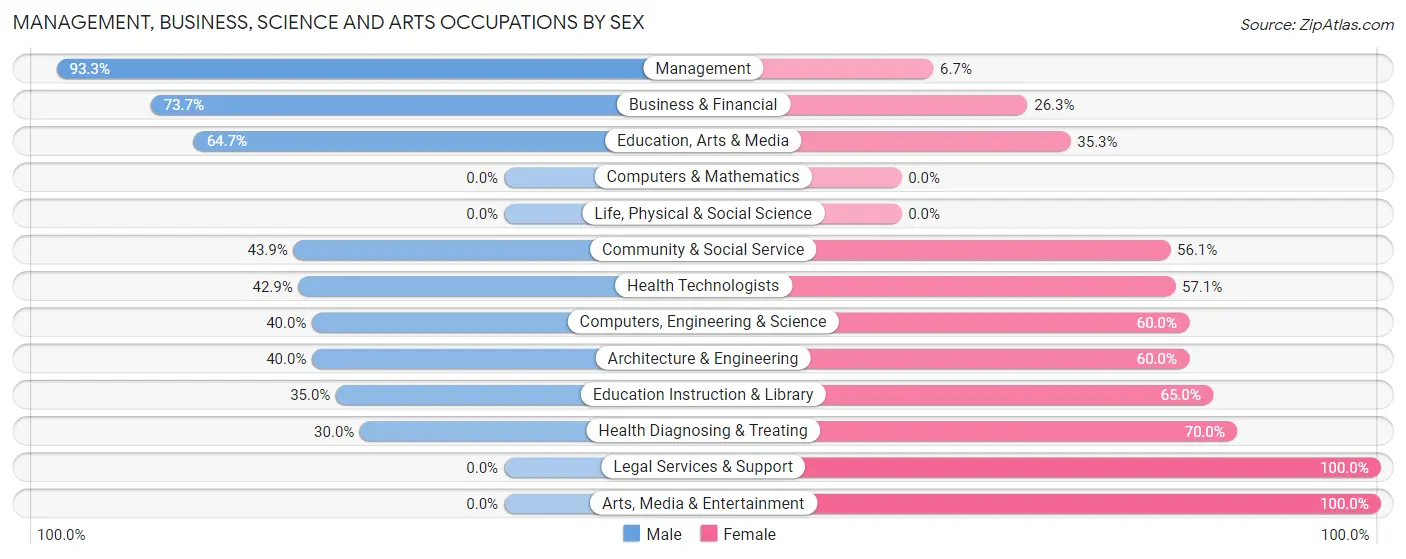
Management, Business, Science and Arts Occupations by Sex
Within the Management, Business, Science and Arts occupations in Newark, the most male-oriented occupations are Management (93.3%), Business & Financial (73.7%), and Education, Arts & Media (64.7%), while the most female-oriented occupations are Legal Services & Support (100.0%), Arts, Media & Entertainment (100.0%), and Health Diagnosing & Treating (70.0%).
| Occupation | Male | Female |
| Management | 42 (93.3%) | 3 (6.7%) |
| Business & Financial | 14 (73.7%) | 5 (26.3%) |
| Computers, Engineering & Science | 4 (40.0%) | 6 (60.0%) |
| Computers & Mathematics | 0 (0.0%) | 0 (0.0%) |
| Architecture & Engineering | 4 (40.0%) | 6 (60.0%) |
| Life, Physical & Social Science | 0 (0.0%) | 0 (0.0%) |
| Community & Social Service | 18 (43.9%) | 23 (56.1%) |
| Education, Arts & Media | 11 (64.7%) | 6 (35.3%) |
| Legal Services & Support | 0 (0.0%) | 2 (100.0%) |
| Education Instruction & Library | 7 (35.0%) | 13 (65.0%) |
| Arts, Media & Entertainment | 0 (0.0%) | 2 (100.0%) |
| Health Diagnosing & Treating | 6 (30.0%) | 14 (70.0%) |
| Health Technologists | 6 (42.9%) | 8 (57.1%) |
| Total (Category) | 84 (62.2%) | 51 (37.8%) |
| Total (Overall) | 322 (62.8%) | 191 (37.2%) |
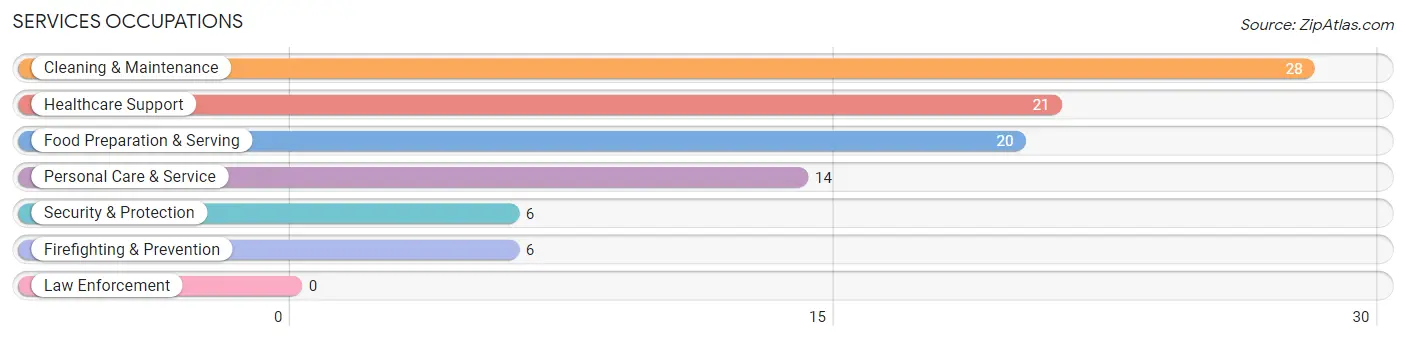
Services Occupations
The most common Services occupations in Newark are Cleaning & Maintenance (28 | 5.5%), Healthcare Support (21 | 4.1%), Food Preparation & Serving (20 | 3.9%), Personal Care & Service (14 | 2.7%), and Security & Protection (6 | 1.2%).
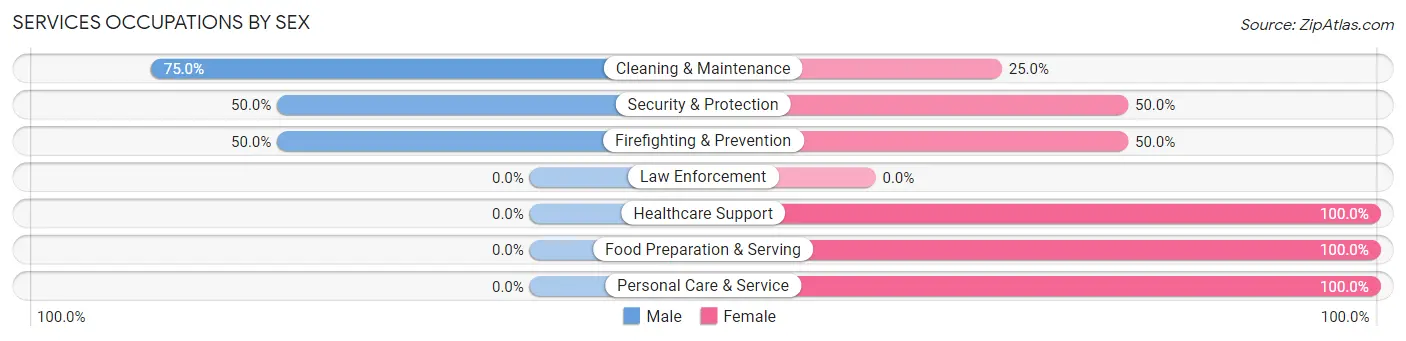
Services Occupations by Sex
Within the Services occupations in Newark, the most male-oriented occupations are Cleaning & Maintenance (75.0%), Security & Protection (50.0%), and Firefighting & Prevention (50.0%), while the most female-oriented occupations are Healthcare Support (100.0%), Food Preparation & Serving (100.0%), and Personal Care & Service (100.0%).
| Occupation | Male | Female |
| Healthcare Support | 0 (0.0%) | 21 (100.0%) |
| Security & Protection | 3 (50.0%) | 3 (50.0%) |
| Firefighting & Prevention | 3 (50.0%) | 3 (50.0%) |
| Law Enforcement | 0 (0.0%) | 0 (0.0%) |
| Food Preparation & Serving | 0 (0.0%) | 20 (100.0%) |
| Cleaning & Maintenance | 21 (75.0%) | 7 (25.0%) |
| Personal Care & Service | 0 (0.0%) | 14 (100.0%) |
| Total (Category) | 24 (27.0%) | 65 (73.0%) |
| Total (Overall) | 322 (62.8%) | 191 (37.2%) |
Sales and Office Occupations
The most common Sales and Office occupations in Newark are Office & Administration (48 | 9.4%), and Sales & Related (32 | 6.2%).
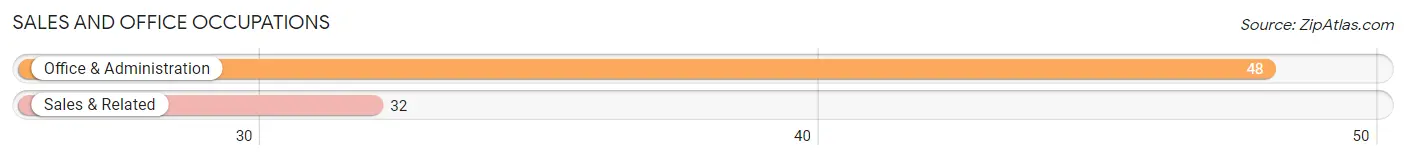
Sales and Office Occupations by Sex
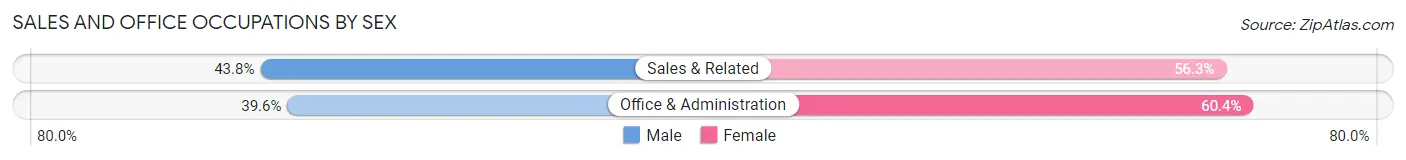
| Occupation | Male | Female |
| Sales & Related | 14 (43.8%) | 18 (56.2%) |
| Office & Administration | 19 (39.6%) | 29 (60.4%) |
| Total (Category) | 33 (41.2%) | 47 (58.8%) |
| Total (Overall) | 322 (62.8%) | 191 (37.2%) |
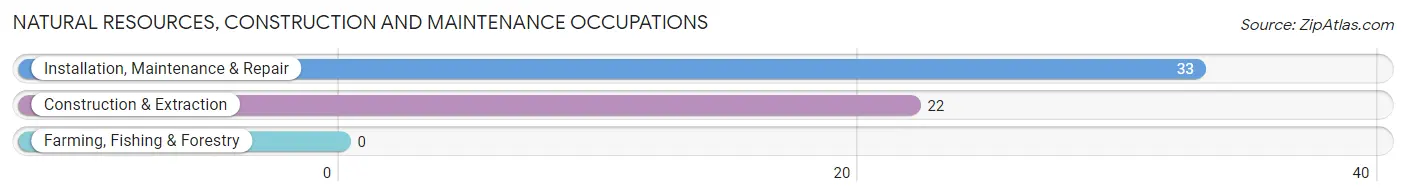
Natural Resources, Construction and Maintenance Occupations
The most common Natural Resources, Construction and Maintenance occupations in Newark are Installation, Maintenance & Repair (33 | 6.4%), and Construction & Extraction (22 | 4.3%).
Natural Resources, Construction and Maintenance Occupations by Sex
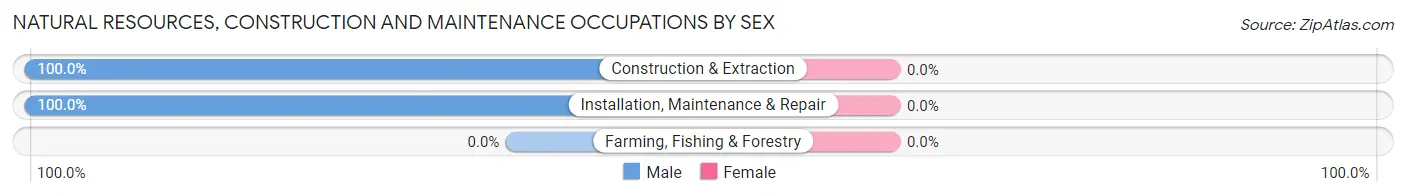
| Occupation | Male | Female |
| Farming, Fishing & Forestry | 0 (0.0%) | 0 (0.0%) |
| Construction & Extraction | 22 (100.0%) | 0 (0.0%) |
| Installation, Maintenance & Repair | 33 (100.0%) | 0 (0.0%) |
| Total (Category) | 55 (100.0%) | 0 (0.0%) |
| Total (Overall) | 322 (62.8%) | 191 (37.2%) |
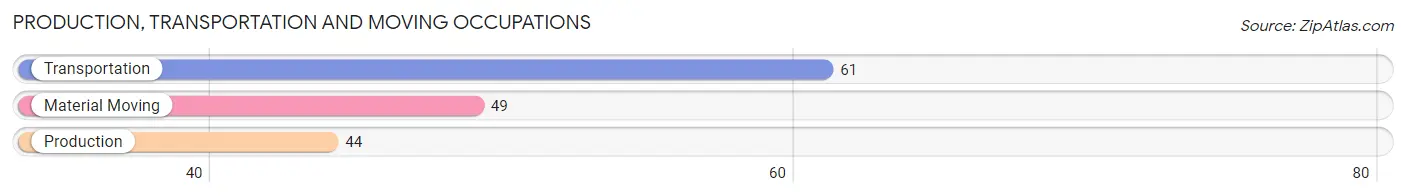
Production, Transportation and Moving Occupations
The most common Production, Transportation and Moving occupations in Newark are Transportation (61 | 11.9%), Material Moving (49 | 9.6%), and Production (44 | 8.6%).
Production, Transportation and Moving Occupations by Sex
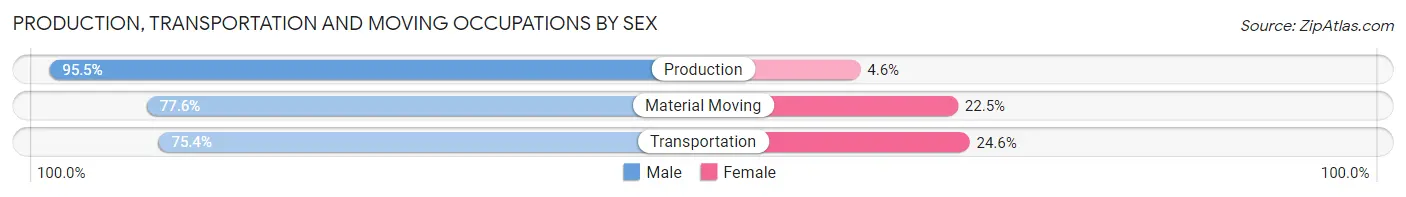
| Occupation | Male | Female |
| Production | 42 (95.5%) | 2 (4.5%) |
| Transportation | 46 (75.4%) | 15 (24.6%) |
| Material Moving | 38 (77.5%) | 11 (22.5%) |
| Total (Category) | 126 (81.8%) | 28 (18.2%) |
| Total (Overall) | 322 (62.8%) | 191 (37.2%) |
Employment Industries by Sex in Newark
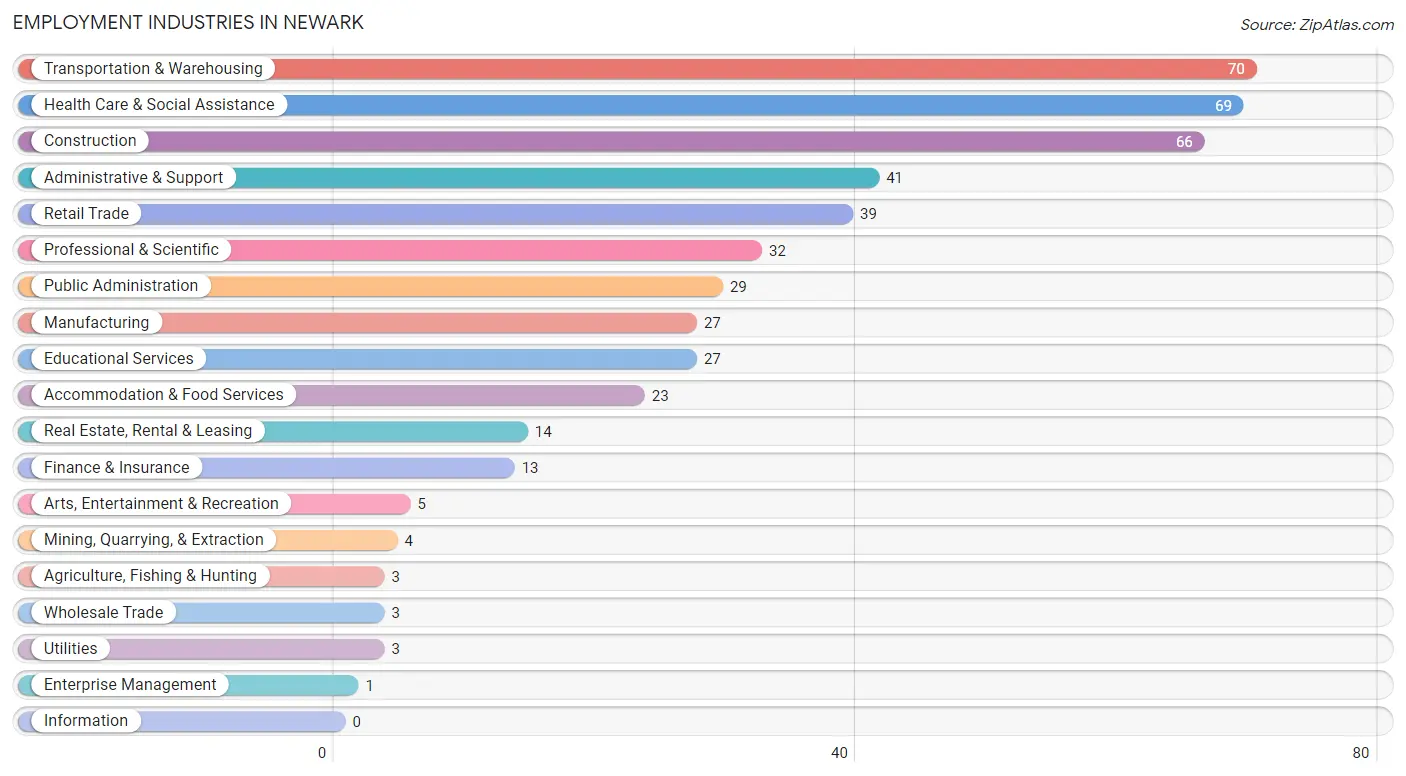
Employment Industries in Newark
The major employment industries in Newark include Transportation & Warehousing (70 | 13.7%), Health Care & Social Assistance (69 | 13.5%), Construction (66 | 12.9%), Administrative & Support (41 | 8.0%), and Retail Trade (39 | 7.6%).
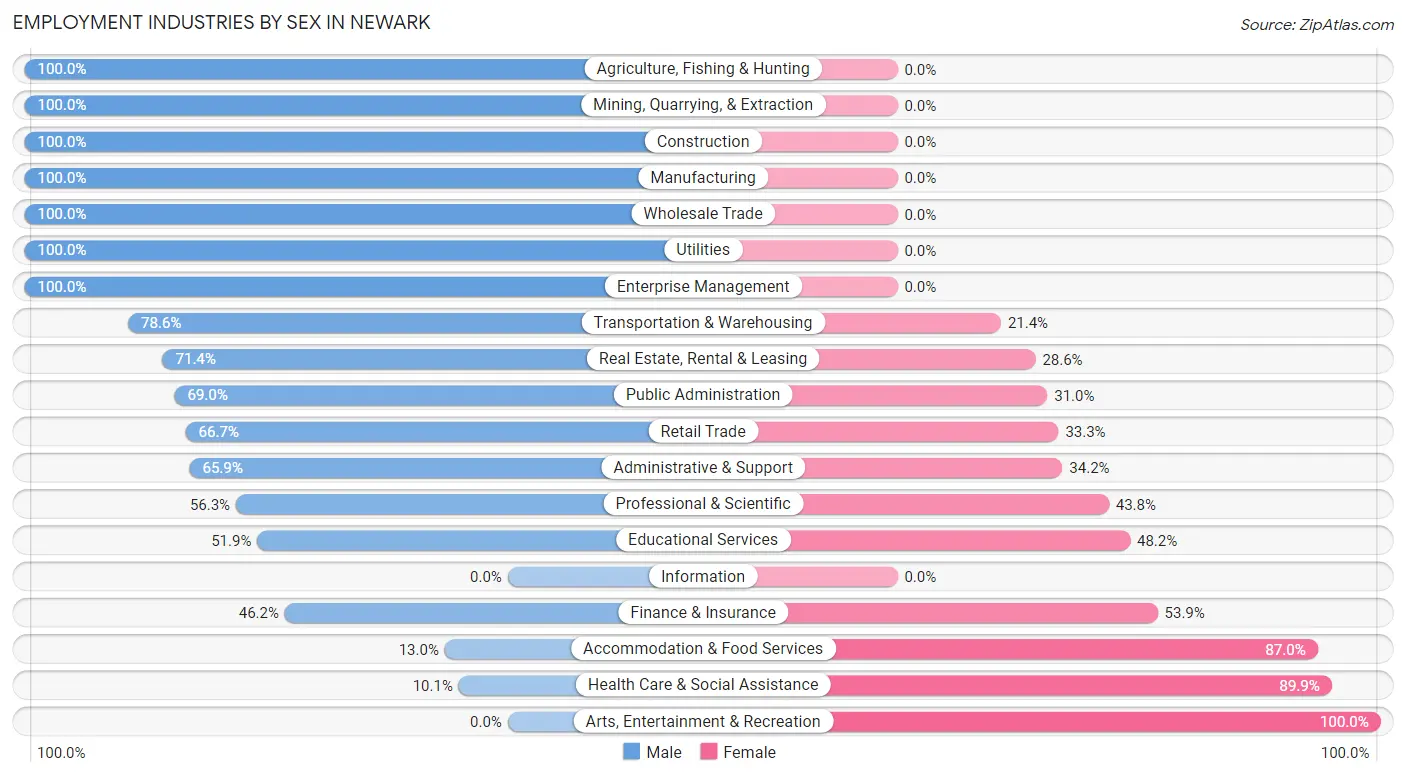
Employment Industries by Sex in Newark
The Newark industries that see more men than women are Agriculture, Fishing & Hunting (100.0%), Mining, Quarrying, & Extraction (100.0%), and Construction (100.0%), whereas the industries that tend to have a higher number of women are Arts, Entertainment & Recreation (100.0%), Health Care & Social Assistance (89.9%), and Accommodation & Food Services (87.0%).
| Industry | Male | Female |
| Agriculture, Fishing & Hunting | 3 (100.0%) | 0 (0.0%) |
| Mining, Quarrying, & Extraction | 4 (100.0%) | 0 (0.0%) |
| Construction | 66 (100.0%) | 0 (0.0%) |
| Manufacturing | 27 (100.0%) | 0 (0.0%) |
| Wholesale Trade | 3 (100.0%) | 0 (0.0%) |
| Retail Trade | 26 (66.7%) | 13 (33.3%) |
| Transportation & Warehousing | 55 (78.6%) | 15 (21.4%) |
| Utilities | 3 (100.0%) | 0 (0.0%) |
| Information | 0 (0.0%) | 0 (0.0%) |
| Finance & Insurance | 6 (46.2%) | 7 (53.8%) |
| Real Estate, Rental & Leasing | 10 (71.4%) | 4 (28.6%) |
| Professional & Scientific | 18 (56.2%) | 14 (43.8%) |
| Enterprise Management | 1 (100.0%) | 0 (0.0%) |
| Administrative & Support | 27 (65.8%) | 14 (34.2%) |
| Educational Services | 14 (51.8%) | 13 (48.1%) |
| Health Care & Social Assistance | 7 (10.1%) | 62 (89.9%) |
| Arts, Entertainment & Recreation | 0 (0.0%) | 5 (100.0%) |
| Accommodation & Food Services | 3 (13.0%) | 20 (87.0%) |
| Public Administration | 20 (69.0%) | 9 (31.0%) |
| Total | 322 (62.8%) | 191 (37.2%) |
Education in Newark
School Enrollment in Newark
The most common levels of schooling among the 320 students in Newark are high school (91 | 28.4%), middle school (89 | 27.8%), and elementary school (79 | 24.7%).
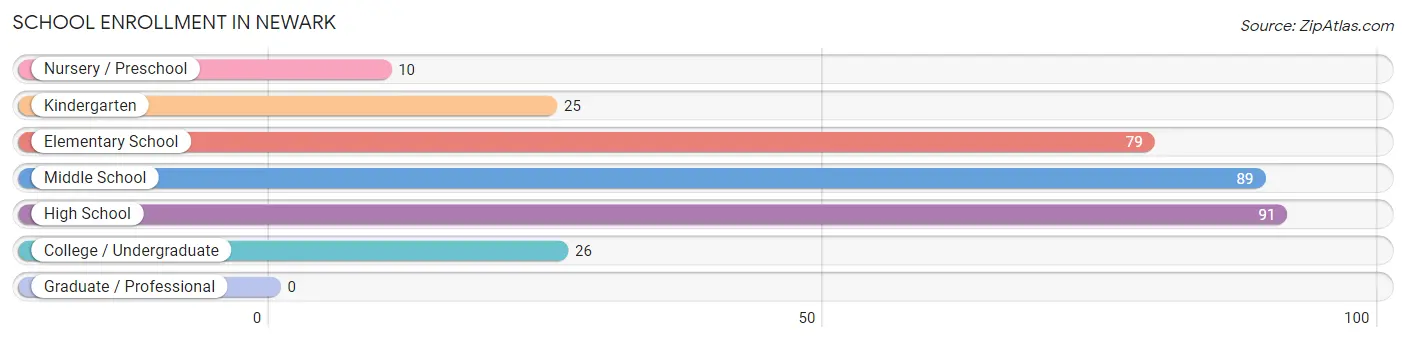
| School Level | # Students | % Students |
| Nursery / Preschool | 10 | 3.1% |
| Kindergarten | 25 | 7.8% |
| Elementary School | 79 | 24.7% |
| Middle School | 89 | 27.8% |
| High School | 91 | 28.4% |
| College / Undergraduate | 26 | 8.1% |
| Graduate / Professional | 0 | 0.0% |
| Total | 320 | 100.0% |
School Enrollment by Age by Funding Source in Newark
Out of a total of 320 students who are enrolled in schools in Newark, 15 (4.7%) attend a private institution, while the remaining 305 (95.3%) are enrolled in public schools. The age group of 3 to 4 year olds has the highest likelihood of being enrolled in private schools, with 1 (100.0% in the age bracket) enrolled. Conversely, the age group of 20 to 24 year olds has the lowest likelihood of being enrolled in a private school, with 10 (100.0% in the age bracket) attending a public institution.
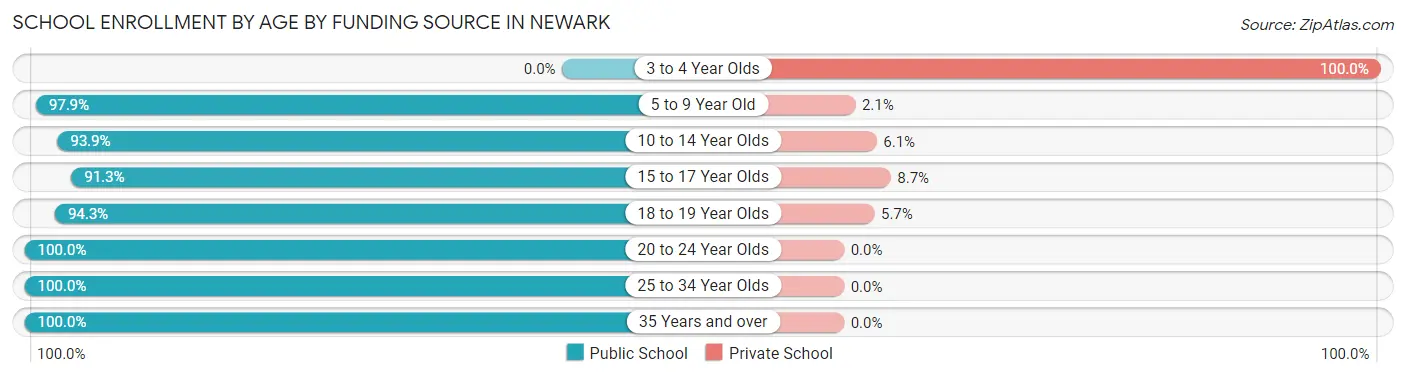
| Age Bracket | Public School | Private School |
| 3 to 4 Year Olds | 0 (0.0%) | 1 (100.0%) |
| 5 to 9 Year Old | 93 (97.9%) | 2 (2.1%) |
| 10 to 14 Year Olds | 108 (93.9%) | 7 (6.1%) |
| 15 to 17 Year Olds | 21 (91.3%) | 2 (8.7%) |
| 18 to 19 Year Olds | 50 (94.3%) | 3 (5.7%) |
| 20 to 24 Year Olds | 10 (100.0%) | 0 (0.0%) |
| 25 to 34 Year Olds | 6 (100.0%) | 0 (0.0%) |
| 35 Years and over | 17 (100.0%) | 0 (0.0%) |
| Total | 305 (95.3%) | 15 (4.7%) |
Educational Attainment by Field of Study in Newark
Education (19 | 22.9%), liberal arts & history (11 | 13.3%), science & technology (9 | 10.8%), business (9 | 10.8%), and social sciences (6 | 7.2%) are the most common fields of study among 83 individuals in Newark who have obtained a bachelor's degree or higher.
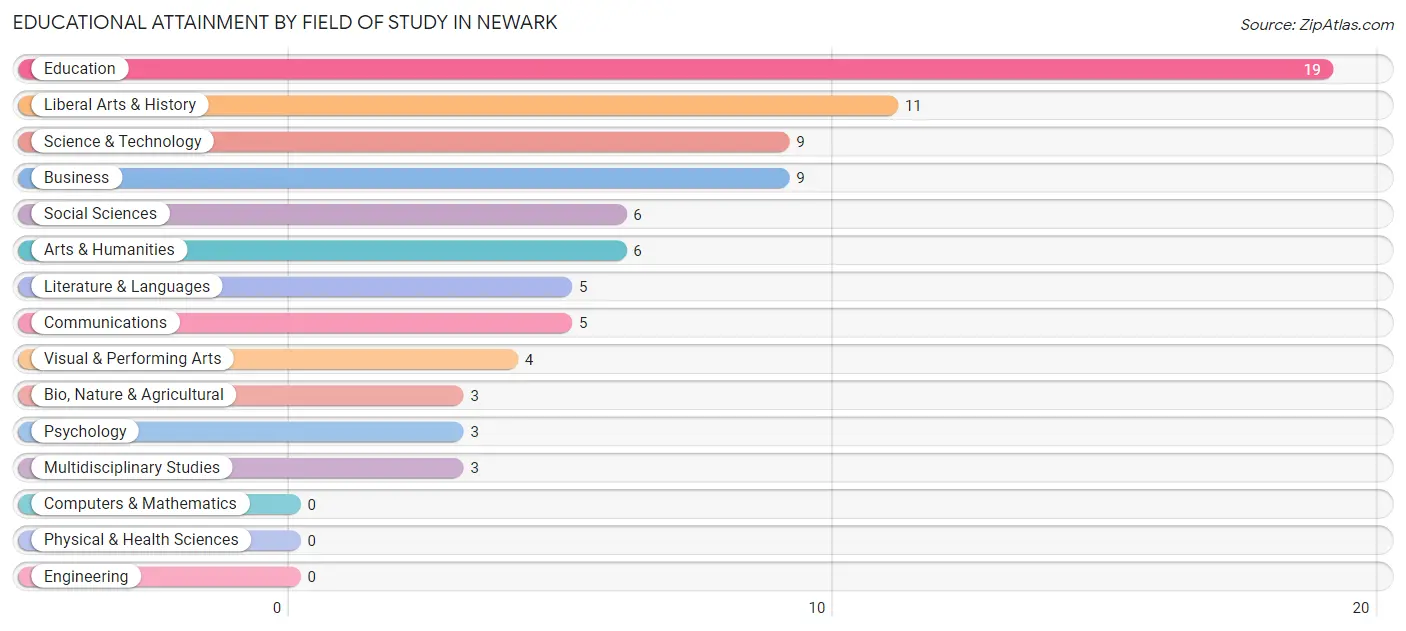
| Field of Study | # Graduates | % Graduates |
| Computers & Mathematics | 0 | 0.0% |
| Bio, Nature & Agricultural | 3 | 3.6% |
| Physical & Health Sciences | 0 | 0.0% |
| Psychology | 3 | 3.6% |
| Social Sciences | 6 | 7.2% |
| Engineering | 0 | 0.0% |
| Multidisciplinary Studies | 3 | 3.6% |
| Science & Technology | 9 | 10.8% |
| Business | 9 | 10.8% |
| Education | 19 | 22.9% |
| Literature & Languages | 5 | 6.0% |
| Liberal Arts & History | 11 | 13.3% |
| Visual & Performing Arts | 4 | 4.8% |
| Communications | 5 | 6.0% |
| Arts & Humanities | 6 | 7.2% |
| Total | 83 | 100.0% |
Transportation & Commute in Newark
Vehicle Availability by Sex in Newark
The most prevalent vehicle ownership categories in Newark are males with 2 vehicles (142, accounting for 47.5%) and females with 2 vehicles (82, making up 74.4%).
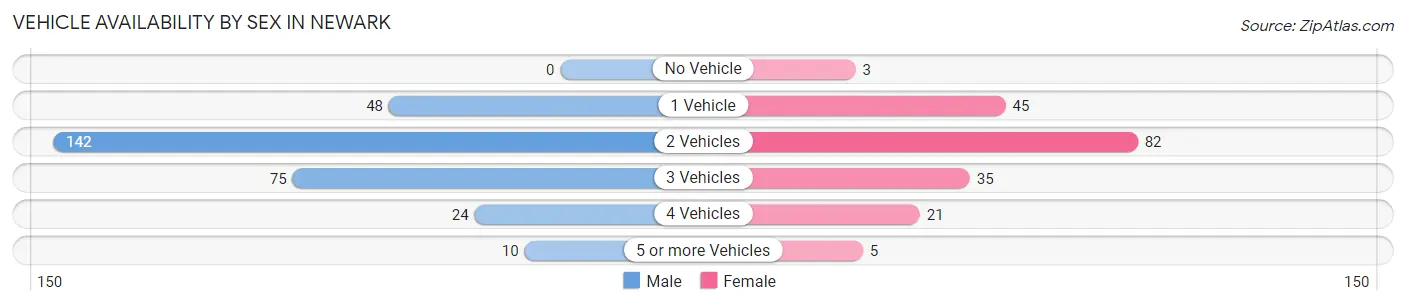
| Vehicles Available | Male | Female |
| No Vehicle | 0 (0.0%) | 3 (1.6%) |
| 1 Vehicle | 48 (16.1%) | 45 (23.6%) |
| 2 Vehicles | 142 (47.5%) | 82 (42.9%) |
| 3 Vehicles | 75 (25.1%) | 35 (18.3%) |
| 4 Vehicles | 24 (8.0%) | 21 (11.0%) |
| 5 or more Vehicles | 10 (3.3%) | 5 (2.6%) |
| Total | 299 (100.0%) | 191 (100.0%) |
Commute Time in Newark
The most frequently occuring commute durations in Newark are 45 to 59 minutes (71 commuters, 15.5%), 15 to 19 minutes (61 commuters, 13.3%), and 30 to 34 minutes (60 commuters, 13.1%).
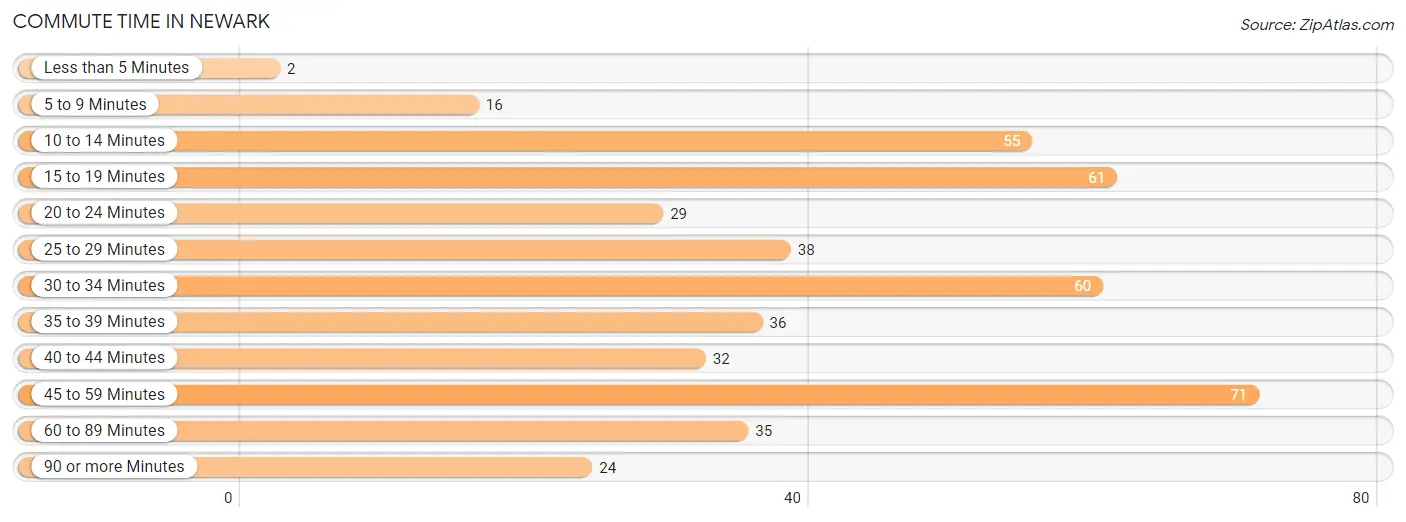
| Commute Time | # Commuters | % Commuters |
| Less than 5 Minutes | 2 | 0.4% |
| 5 to 9 Minutes | 16 | 3.5% |
| 10 to 14 Minutes | 55 | 12.0% |
| 15 to 19 Minutes | 61 | 13.3% |
| 20 to 24 Minutes | 29 | 6.3% |
| 25 to 29 Minutes | 38 | 8.3% |
| 30 to 34 Minutes | 60 | 13.1% |
| 35 to 39 Minutes | 36 | 7.8% |
| 40 to 44 Minutes | 32 | 7.0% |
| 45 to 59 Minutes | 71 | 15.5% |
| 60 to 89 Minutes | 35 | 7.6% |
| 90 or more Minutes | 24 | 5.2% |
Commute Time by Sex in Newark
The most common commute times in Newark are 45 to 59 minutes (44 commuters, 15.7%) for males and 15 to 19 minutes (38 commuters, 21.3%) for females.
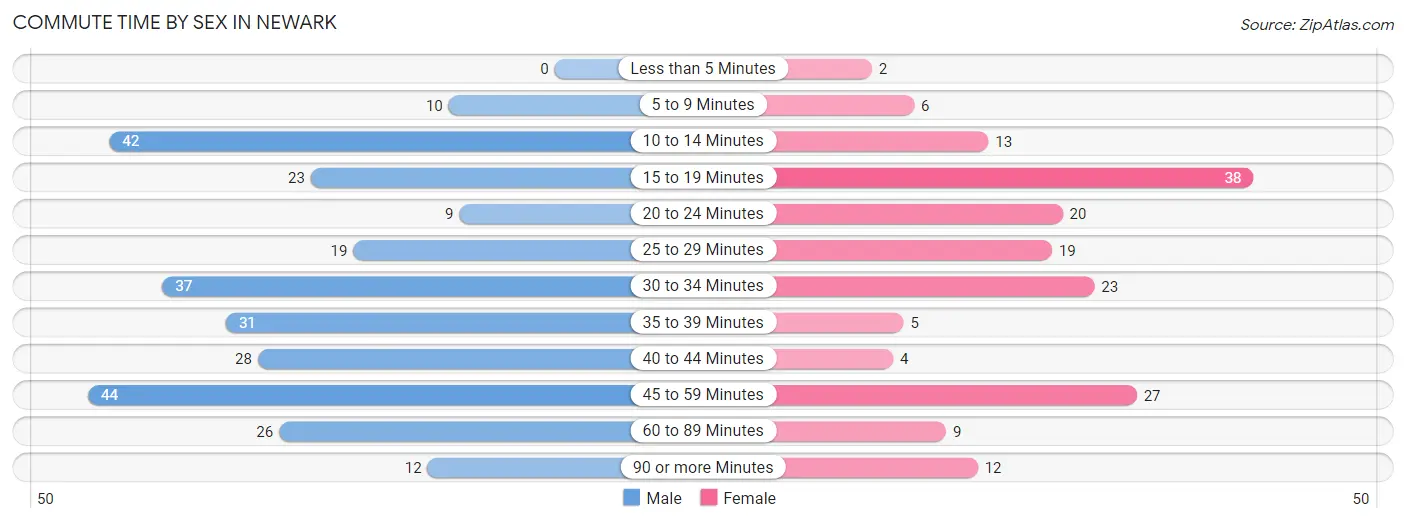
| Commute Time | Male | Female |
| Less than 5 Minutes | 0 (0.0%) | 2 (1.1%) |
| 5 to 9 Minutes | 10 (3.6%) | 6 (3.4%) |
| 10 to 14 Minutes | 42 (14.9%) | 13 (7.3%) |
| 15 to 19 Minutes | 23 (8.2%) | 38 (21.3%) |
| 20 to 24 Minutes | 9 (3.2%) | 20 (11.2%) |
| 25 to 29 Minutes | 19 (6.8%) | 19 (10.7%) |
| 30 to 34 Minutes | 37 (13.2%) | 23 (12.9%) |
| 35 to 39 Minutes | 31 (11.0%) | 5 (2.8%) |
| 40 to 44 Minutes | 28 (10.0%) | 4 (2.2%) |
| 45 to 59 Minutes | 44 (15.7%) | 27 (15.2%) |
| 60 to 89 Minutes | 26 (9.2%) | 9 (5.1%) |
| 90 or more Minutes | 12 (4.3%) | 12 (6.7%) |
Time of Departure to Work by Sex in Newark
The most frequent times of departure to work in Newark are 6:30 AM to 6:59 AM (63, 22.4%) for males and 7:30 AM to 7:59 AM (26, 14.6%) for females.
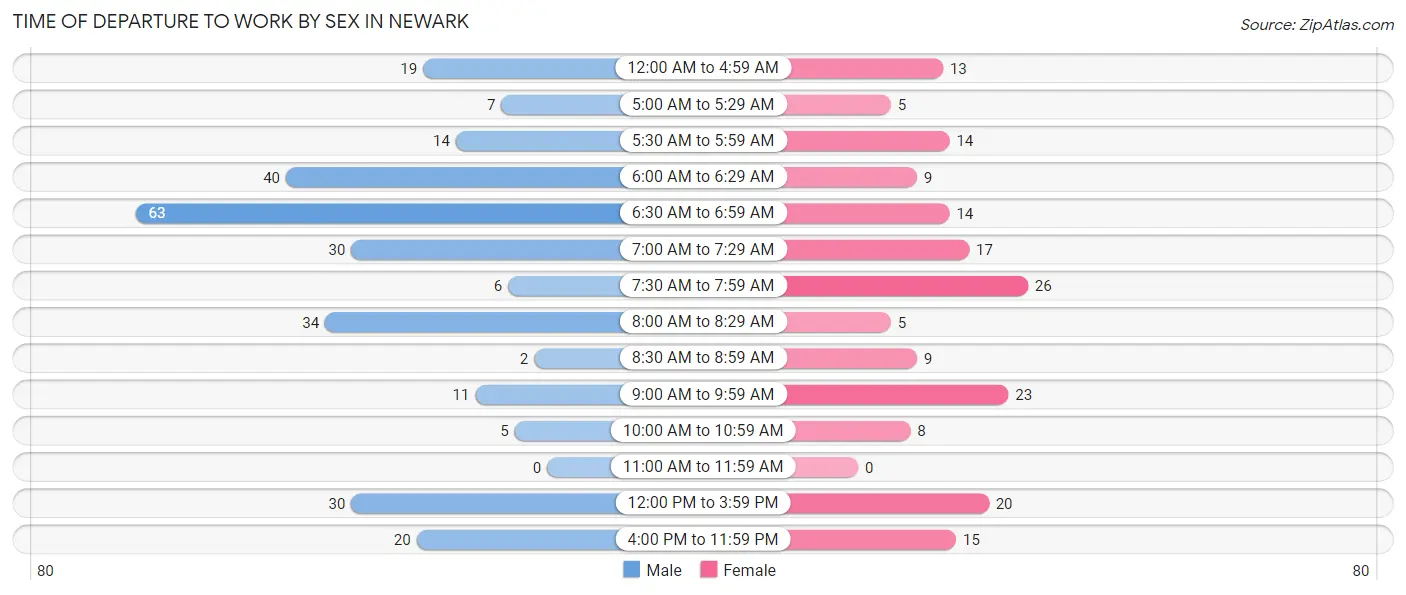
| Time of Departure | Male | Female |
| 12:00 AM to 4:59 AM | 19 (6.8%) | 13 (7.3%) |
| 5:00 AM to 5:29 AM | 7 (2.5%) | 5 (2.8%) |
| 5:30 AM to 5:59 AM | 14 (5.0%) | 14 (7.9%) |
| 6:00 AM to 6:29 AM | 40 (14.2%) | 9 (5.1%) |
| 6:30 AM to 6:59 AM | 63 (22.4%) | 14 (7.9%) |
| 7:00 AM to 7:29 AM | 30 (10.7%) | 17 (9.6%) |
| 7:30 AM to 7:59 AM | 6 (2.1%) | 26 (14.6%) |
| 8:00 AM to 8:29 AM | 34 (12.1%) | 5 (2.8%) |
| 8:30 AM to 8:59 AM | 2 (0.7%) | 9 (5.1%) |
| 9:00 AM to 9:59 AM | 11 (3.9%) | 23 (12.9%) |
| 10:00 AM to 10:59 AM | 5 (1.8%) | 8 (4.5%) |
| 11:00 AM to 11:59 AM | 0 (0.0%) | 0 (0.0%) |
| 12:00 PM to 3:59 PM | 30 (10.7%) | 20 (11.2%) |
| 4:00 PM to 11:59 PM | 20 (7.1%) | 15 (8.4%) |
| Total | 281 (100.0%) | 178 (100.0%) |
Housing Occupancy in Newark
Occupancy by Ownership in Newark
Of the total 406 dwellings in Newark, owner-occupied units account for 299 (73.7%), while renter-occupied units make up 107 (26.4%).
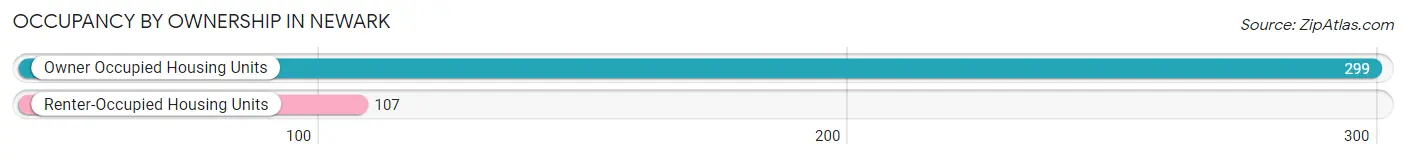
| Occupancy | # Housing Units | % Housing Units |
| Owner Occupied Housing Units | 299 | 73.7% |
| Renter-Occupied Housing Units | 107 | 26.4% |
| Total Occupied Housing Units | 406 | 100.0% |
Occupancy by Household Size in Newark
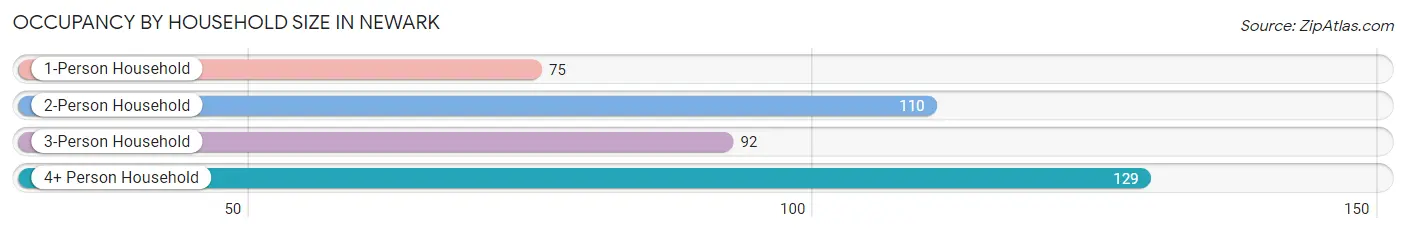
| Household Size | # Housing Units | % Housing Units |
| 1-Person Household | 75 | 18.5% |
| 2-Person Household | 110 | 27.1% |
| 3-Person Household | 92 | 22.7% |
| 4+ Person Household | 129 | 31.8% |
| Total Housing Units | 406 | 100.0% |
Occupancy by Ownership by Household Size in Newark
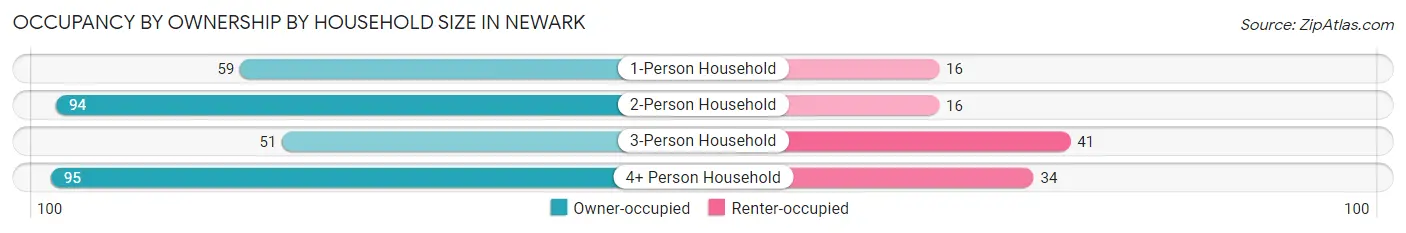
| Household Size | Owner-occupied | Renter-occupied |
| 1-Person Household | 59 (78.7%) | 16 (21.3%) |
| 2-Person Household | 94 (85.5%) | 16 (14.5%) |
| 3-Person Household | 51 (55.4%) | 41 (44.6%) |
| 4+ Person Household | 95 (73.6%) | 34 (26.4%) |
| Total Housing Units | 299 (73.7%) | 107 (26.4%) |
Occupancy by Educational Attainment in Newark
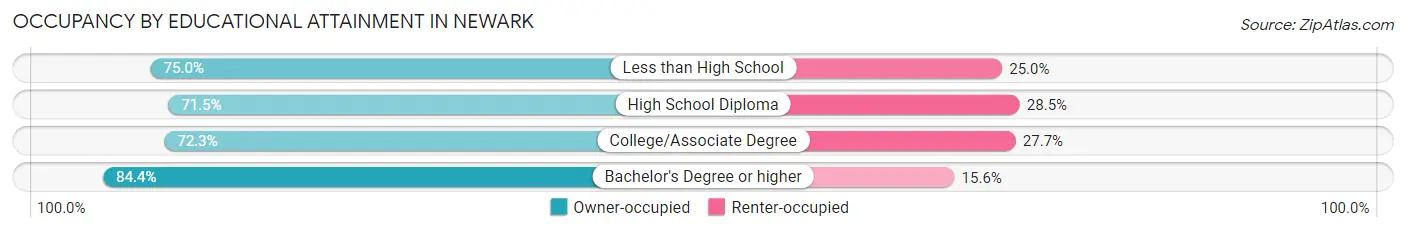
| Household Size | Owner-occupied | Renter-occupied |
| Less than High School | 48 (75.0%) | 16 (25.0%) |
| High School Diploma | 153 (71.5%) | 61 (28.5%) |
| College/Associate Degree | 60 (72.3%) | 23 (27.7%) |
| Bachelor's Degree or higher | 38 (84.4%) | 7 (15.6%) |
Occupancy by Age of Householder in Newark
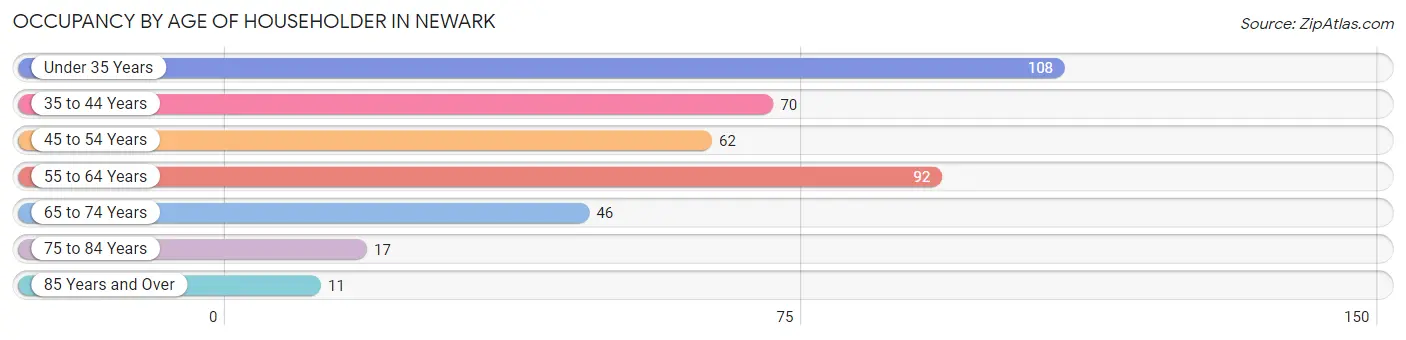
| Age Bracket | # Households | % Households |
| Under 35 Years | 108 | 26.6% |
| 35 to 44 Years | 70 | 17.2% |
| 45 to 54 Years | 62 | 15.3% |
| 55 to 64 Years | 92 | 22.7% |
| 65 to 74 Years | 46 | 11.3% |
| 75 to 84 Years | 17 | 4.2% |
| 85 Years and Over | 11 | 2.7% |
| Total | 406 | 100.0% |
Housing Finances in Newark
Median Income by Occupancy in Newark
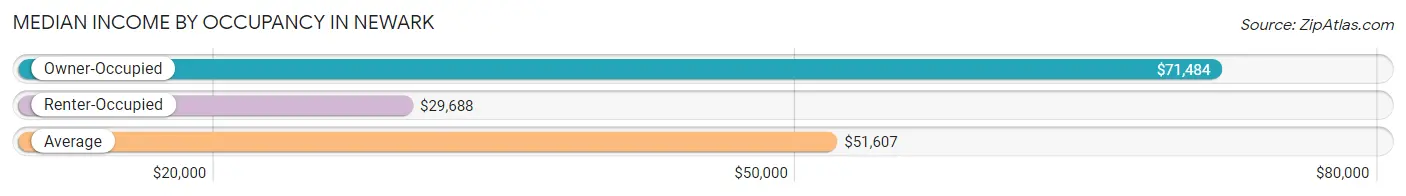
| Occupancy Type | # Households | Median Income |
| Owner-Occupied | 299 (73.7%) | $71,484 |
| Renter-Occupied | 107 (26.4%) | $29,688 |
| Average | 406 (100.0%) | $51,607 |
Occupancy by Householder Income Bracket in Newark
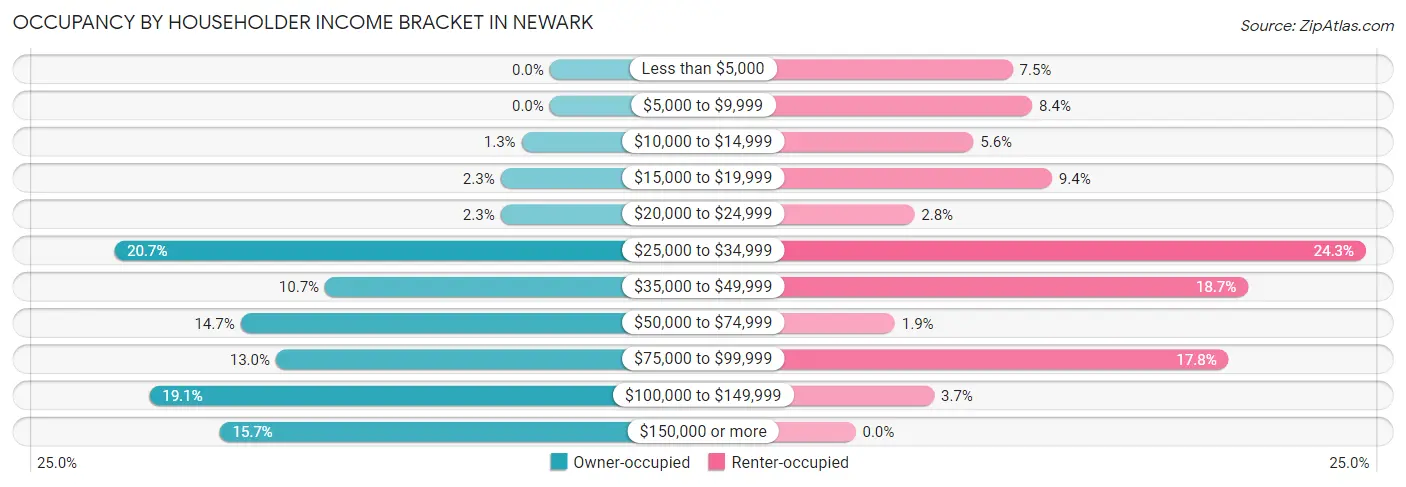
| Income Bracket | Owner-occupied | Renter-occupied |
| Less than $5,000 | 0 (0.0%) | 8 (7.5%) |
| $5,000 to $9,999 | 0 (0.0%) | 9 (8.4%) |
| $10,000 to $14,999 | 4 (1.3%) | 6 (5.6%) |
| $15,000 to $19,999 | 7 (2.3%) | 10 (9.3%) |
| $20,000 to $24,999 | 7 (2.3%) | 3 (2.8%) |
| $25,000 to $34,999 | 62 (20.7%) | 26 (24.3%) |
| $35,000 to $49,999 | 32 (10.7%) | 20 (18.7%) |
| $50,000 to $74,999 | 44 (14.7%) | 2 (1.9%) |
| $75,000 to $99,999 | 39 (13.0%) | 19 (17.8%) |
| $100,000 to $149,999 | 57 (19.1%) | 4 (3.7%) |
| $150,000 or more | 47 (15.7%) | 0 (0.0%) |
| Total | 299 (100.0%) | 107 (100.0%) |
Monthly Housing Cost Tiers in Newark
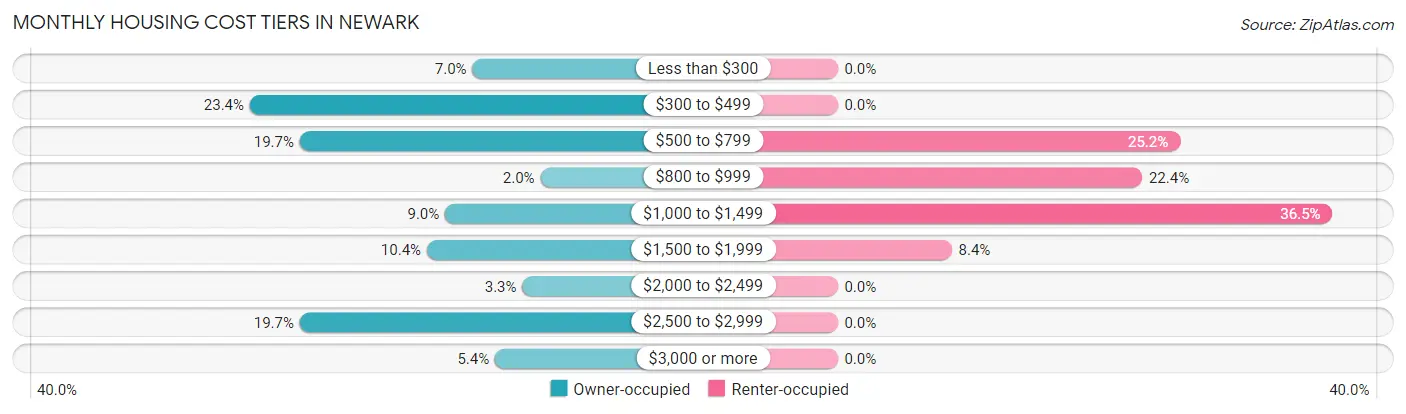
| Monthly Cost | Owner-occupied | Renter-occupied |
| Less than $300 | 21 (7.0%) | 0 (0.0%) |
| $300 to $499 | 70 (23.4%) | 0 (0.0%) |
| $500 to $799 | 59 (19.7%) | 27 (25.2%) |
| $800 to $999 | 6 (2.0%) | 24 (22.4%) |
| $1,000 to $1,499 | 27 (9.0%) | 39 (36.4%) |
| $1,500 to $1,999 | 31 (10.4%) | 9 (8.4%) |
| $2,000 to $2,499 | 10 (3.3%) | 0 (0.0%) |
| $2,500 to $2,999 | 59 (19.7%) | 0 (0.0%) |
| $3,000 or more | 16 (5.3%) | 0 (0.0%) |
| Total | 299 (100.0%) | 107 (100.0%) |
Physical Housing Characteristics in Newark
Housing Structures in Newark
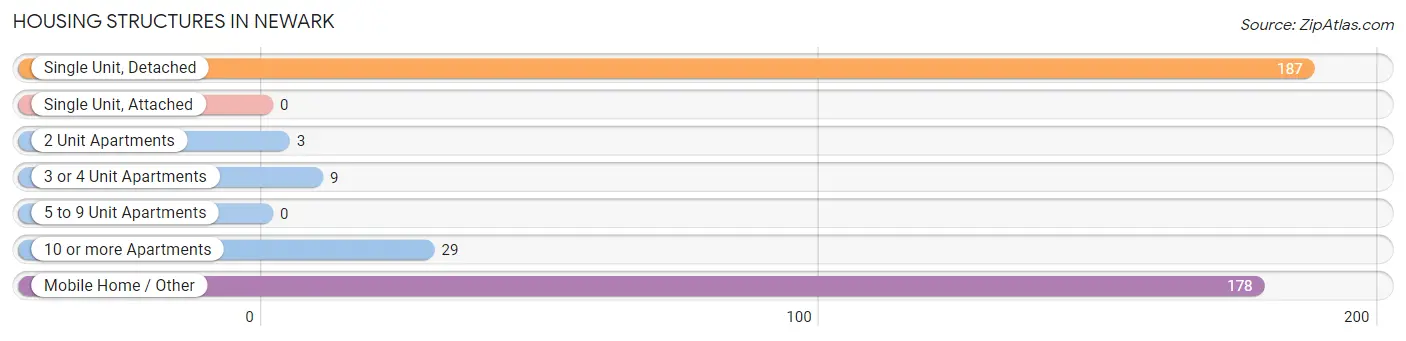
| Structure Type | # Housing Units | % Housing Units |
| Single Unit, Detached | 187 | 46.1% |
| Single Unit, Attached | 0 | 0.0% |
| 2 Unit Apartments | 3 | 0.7% |
| 3 or 4 Unit Apartments | 9 | 2.2% |
| 5 to 9 Unit Apartments | 0 | 0.0% |
| 10 or more Apartments | 29 | 7.1% |
| Mobile Home / Other | 178 | 43.8% |
| Total | 406 | 100.0% |
Housing Structures by Occupancy in Newark
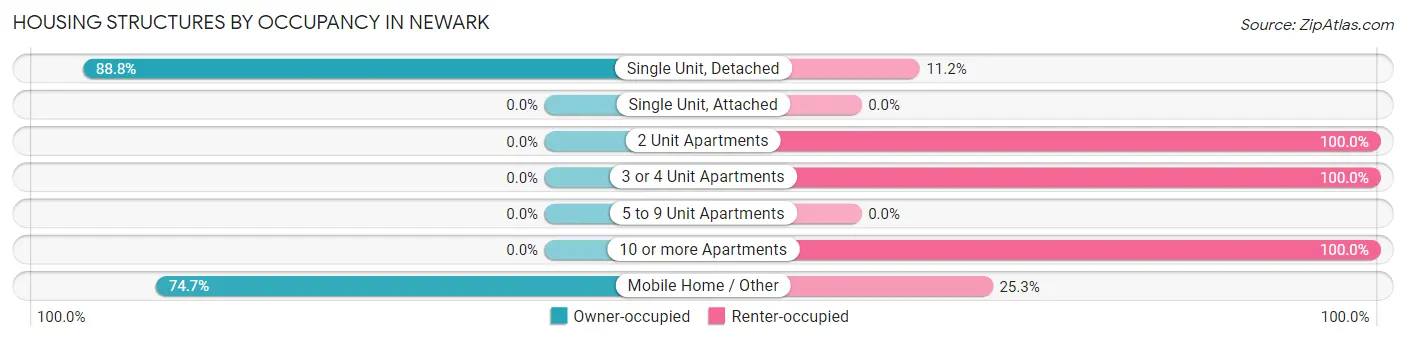
| Structure Type | Owner-occupied | Renter-occupied |
| Single Unit, Detached | 166 (88.8%) | 21 (11.2%) |
| Single Unit, Attached | 0 (0.0%) | 0 (0.0%) |
| 2 Unit Apartments | 0 (0.0%) | 3 (100.0%) |
| 3 or 4 Unit Apartments | 0 (0.0%) | 9 (100.0%) |
| 5 to 9 Unit Apartments | 0 (0.0%) | 0 (0.0%) |
| 10 or more Apartments | 0 (0.0%) | 29 (100.0%) |
| Mobile Home / Other | 133 (74.7%) | 45 (25.3%) |
| Total | 299 (73.7%) | 107 (26.4%) |
Housing Structures by Number of Rooms in Newark
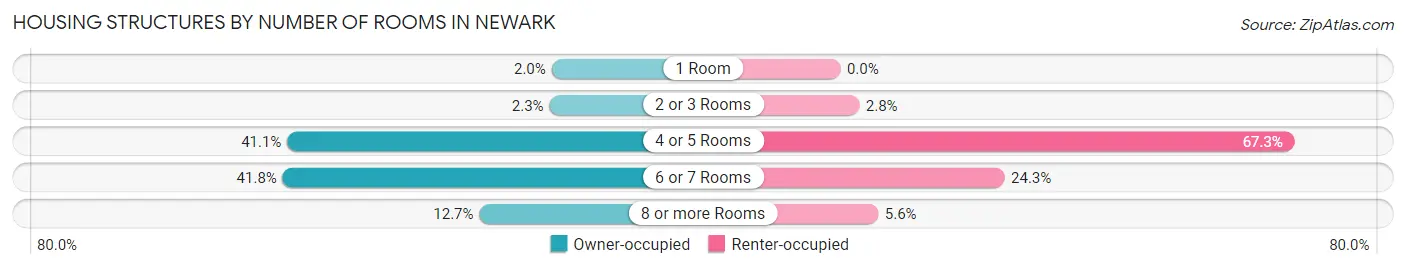
| Number of Rooms | Owner-occupied | Renter-occupied |
| 1 Room | 6 (2.0%) | 0 (0.0%) |
| 2 or 3 Rooms | 7 (2.3%) | 3 (2.8%) |
| 4 or 5 Rooms | 123 (41.1%) | 72 (67.3%) |
| 6 or 7 Rooms | 125 (41.8%) | 26 (24.3%) |
| 8 or more Rooms | 38 (12.7%) | 6 (5.6%) |
| Total | 299 (100.0%) | 107 (100.0%) |
Housing Structure by Heating Type in Newark
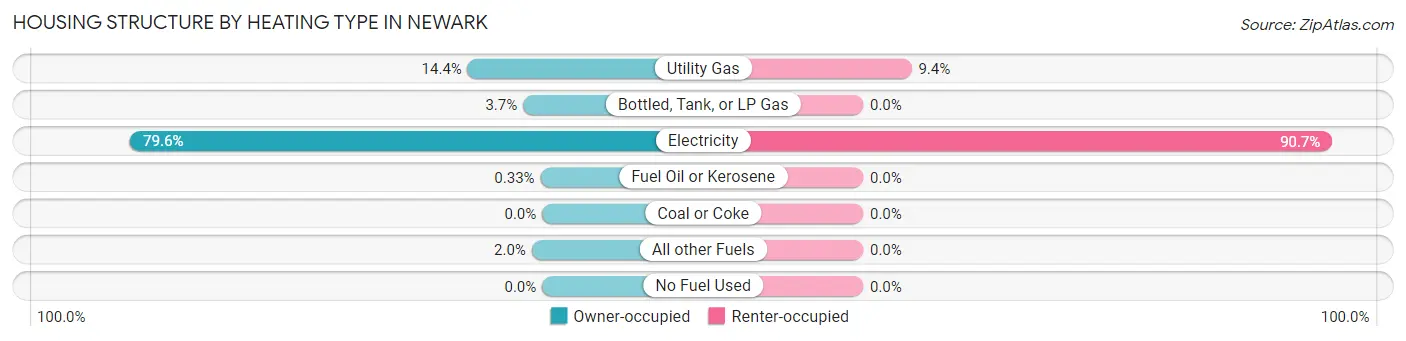
| Heating Type | Owner-occupied | Renter-occupied |
| Utility Gas | 43 (14.4%) | 10 (9.3%) |
| Bottled, Tank, or LP Gas | 11 (3.7%) | 0 (0.0%) |
| Electricity | 238 (79.6%) | 97 (90.6%) |
| Fuel Oil or Kerosene | 1 (0.3%) | 0 (0.0%) |
| Coal or Coke | 0 (0.0%) | 0 (0.0%) |
| All other Fuels | 6 (2.0%) | 0 (0.0%) |
| No Fuel Used | 0 (0.0%) | 0 (0.0%) |
| Total | 299 (100.0%) | 107 (100.0%) |
Household Vehicle Usage in Newark
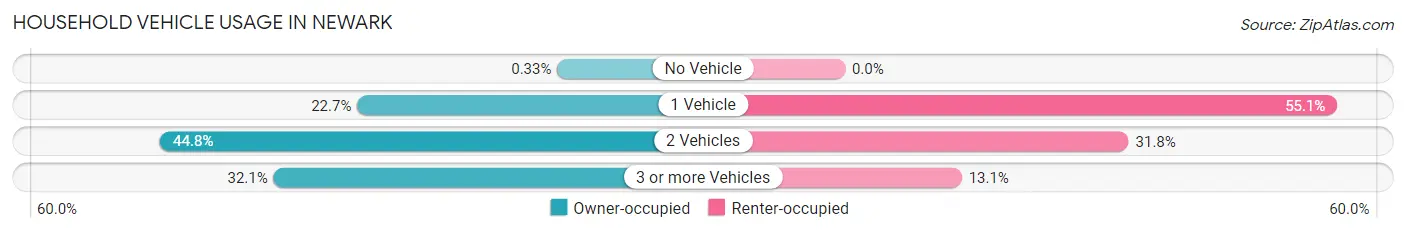
| Vehicles per Household | Owner-occupied | Renter-occupied |
| No Vehicle | 1 (0.3%) | 0 (0.0%) |
| 1 Vehicle | 68 (22.7%) | 59 (55.1%) |
| 2 Vehicles | 134 (44.8%) | 34 (31.8%) |
| 3 or more Vehicles | 96 (32.1%) | 14 (13.1%) |
| Total | 299 (100.0%) | 107 (100.0%) |
Real Estate & Mortgages in Newark
Real Estate and Mortgage Overview in Newark
| Characteristic | Without Mortgage | With Mortgage |
| Housing Units | 153 | 146 |
| Median Property Value | $84,700 | $0 |
| Median Household Income | $52,159 | $33 |
| Monthly Housing Costs | $450 | $16 |
| Real Estate Taxes | $2,130 | $3 |
Property Value by Mortgage Status in Newark
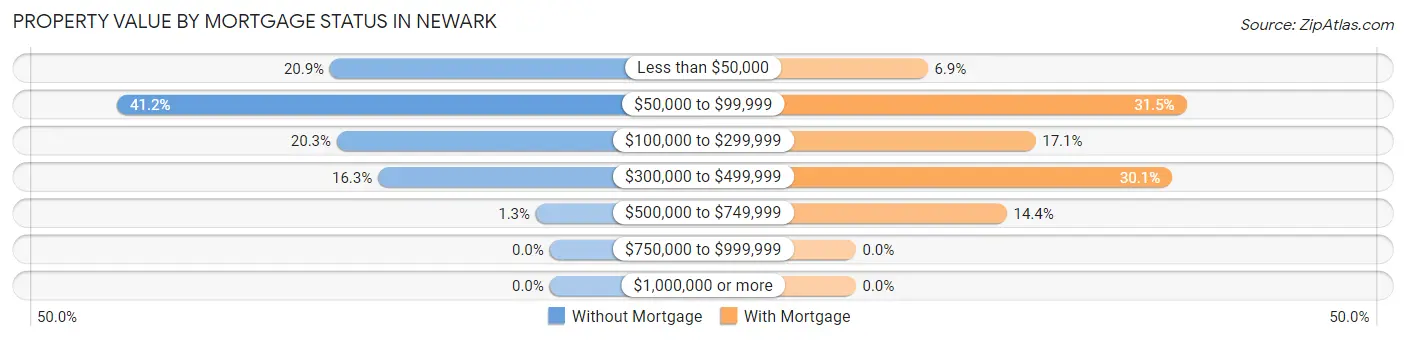
| Property Value | Without Mortgage | With Mortgage |
| Less than $50,000 | 32 (20.9%) | 10 (6.9%) |
| $50,000 to $99,999 | 63 (41.2%) | 46 (31.5%) |
| $100,000 to $299,999 | 31 (20.3%) | 25 (17.1%) |
| $300,000 to $499,999 | 25 (16.3%) | 44 (30.1%) |
| $500,000 to $749,999 | 2 (1.3%) | 21 (14.4%) |
| $750,000 to $999,999 | 0 (0.0%) | 0 (0.0%) |
| $1,000,000 or more | 0 (0.0%) | 0 (0.0%) |
| Total | 153 (100.0%) | 146 (100.0%) |
Household Income by Mortgage Status in Newark
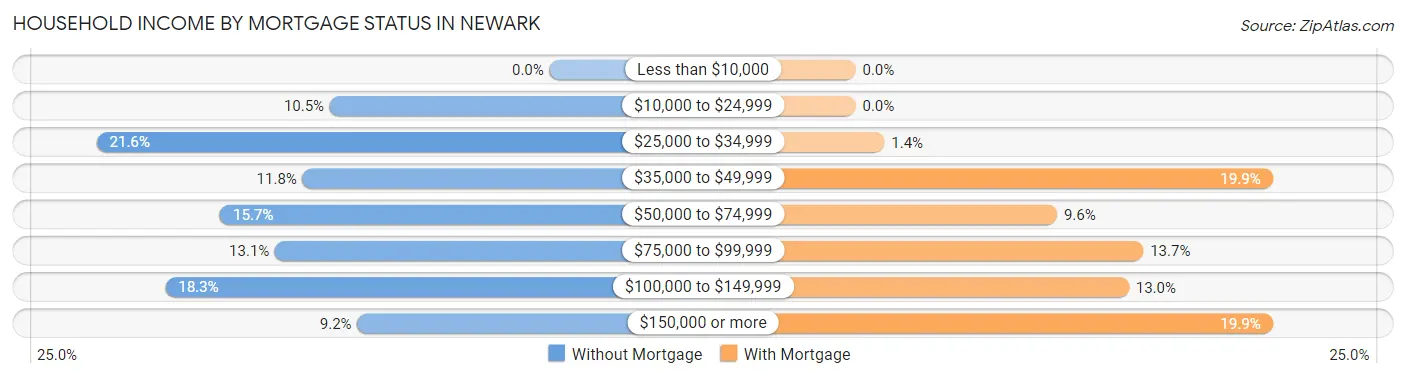
| Household Income | Without Mortgage | With Mortgage |
| Less than $10,000 | 0 (0.0%) | 0 (0.0%) |
| $10,000 to $24,999 | 16 (10.5%) | 0 (0.0%) |
| $25,000 to $34,999 | 33 (21.6%) | 2 (1.4%) |
| $35,000 to $49,999 | 18 (11.8%) | 29 (19.9%) |
| $50,000 to $74,999 | 24 (15.7%) | 14 (9.6%) |
| $75,000 to $99,999 | 20 (13.1%) | 20 (13.7%) |
| $100,000 to $149,999 | 28 (18.3%) | 19 (13.0%) |
| $150,000 or more | 14 (9.1%) | 29 (19.9%) |
| Total | 153 (100.0%) | 146 (100.0%) |
Property Value to Household Income Ratio in Newark
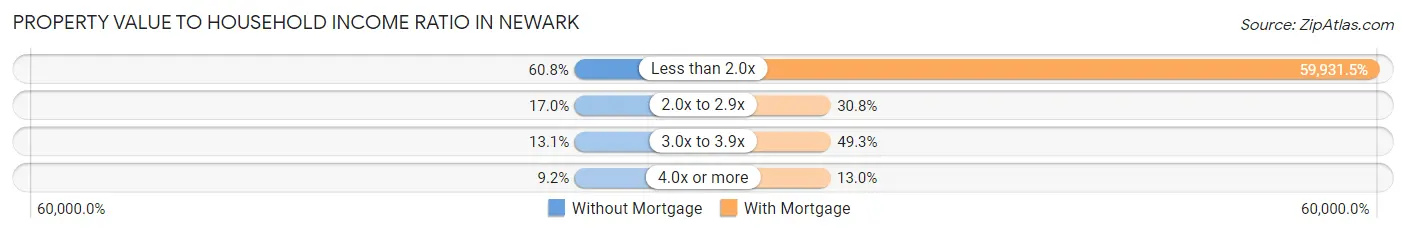
| Value-to-Income Ratio | Without Mortgage | With Mortgage |
| Less than 2.0x | 93 (60.8%) | 87,500 (59,931.5%) |
| 2.0x to 2.9x | 26 (17.0%) | 45 (30.8%) |
| 3.0x to 3.9x | 20 (13.1%) | 72 (49.3%) |
| 4.0x or more | 14 (9.1%) | 19 (13.0%) |
| Total | 153 (100.0%) | 146 (100.0%) |
Real Estate Taxes by Mortgage Status in Newark
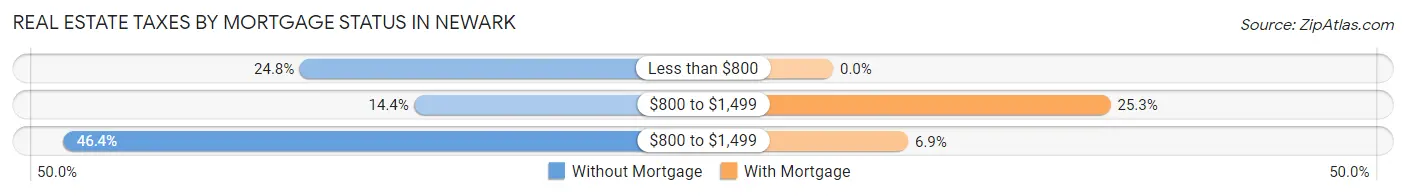
| Property Taxes | Without Mortgage | With Mortgage |
| Less than $800 | 38 (24.8%) | 0 (0.0%) |
| $800 to $1,499 | 22 (14.4%) | 37 (25.3%) |
| $800 to $1,499 | 71 (46.4%) | 10 (6.9%) |
| Total | 153 (100.0%) | 146 (100.0%) |
Health & Disability in Newark
Health Insurance Coverage by Age in Newark
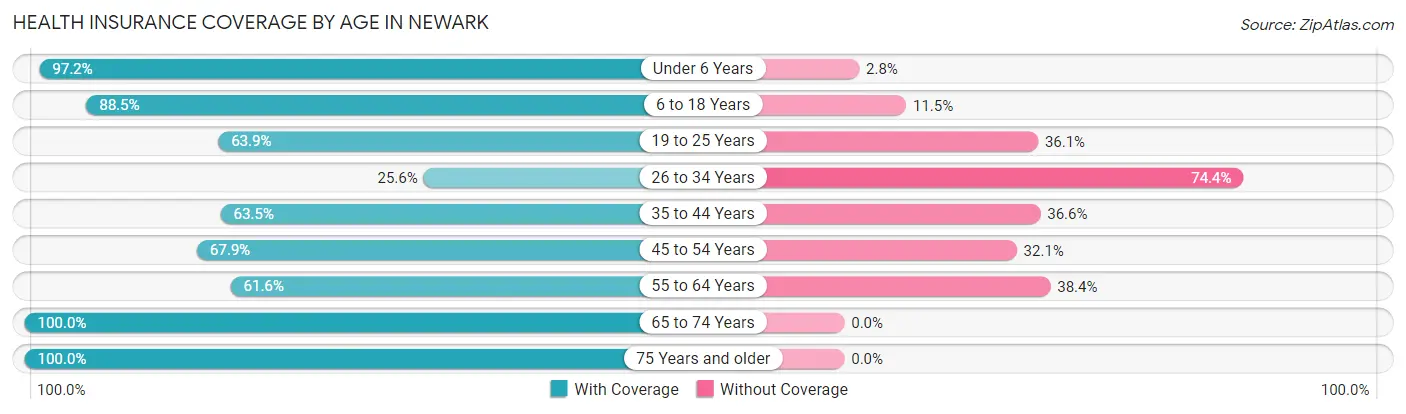
| Age Bracket | With Coverage | Without Coverage |
| Under 6 Years | 141 (97.2%) | 4 (2.8%) |
| 6 to 18 Years | 238 (88.5%) | 31 (11.5%) |
| 19 to 25 Years | 69 (63.9%) | 39 (36.1%) |
| 26 to 34 Years | 32 (25.6%) | 93 (74.4%) |
| 35 to 44 Years | 92 (63.4%) | 53 (36.5%) |
| 45 to 54 Years | 76 (67.9%) | 36 (32.1%) |
| 55 to 64 Years | 109 (61.6%) | 68 (38.4%) |
| 65 to 74 Years | 89 (100.0%) | 0 (0.0%) |
| 75 Years and older | 62 (100.0%) | 0 (0.0%) |
| Total | 908 (73.7%) | 324 (26.3%) |
Health Insurance Coverage by Citizenship Status in Newark
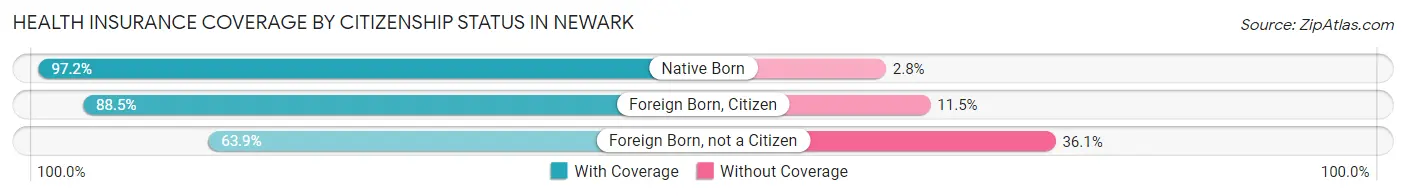
| Citizenship Status | With Coverage | Without Coverage |
| Native Born | 141 (97.2%) | 4 (2.8%) |
| Foreign Born, Citizen | 238 (88.5%) | 31 (11.5%) |
| Foreign Born, not a Citizen | 69 (63.9%) | 39 (36.1%) |
Health Insurance Coverage by Household Income in Newark
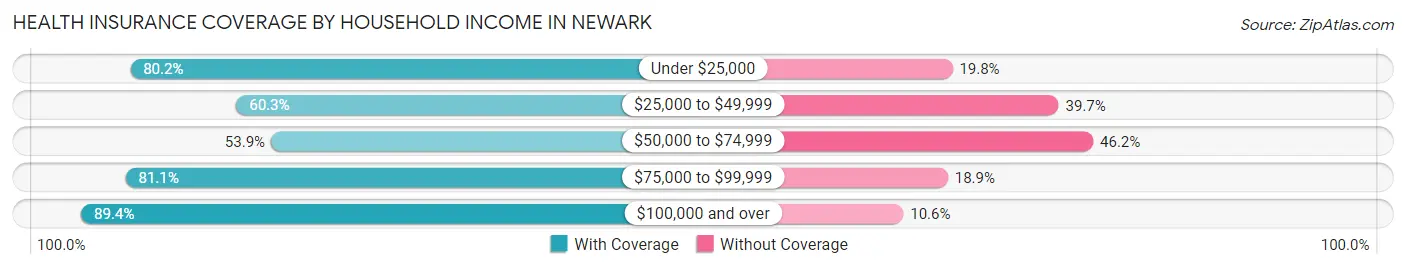
| Household Income | With Coverage | Without Coverage |
| Under $25,000 | 150 (80.2%) | 37 (19.8%) |
| $25,000 to $49,999 | 254 (60.3%) | 167 (39.7%) |
| $50,000 to $74,999 | 63 (53.8%) | 54 (46.2%) |
| $75,000 to $99,999 | 120 (81.1%) | 28 (18.9%) |
| $100,000 and over | 321 (89.4%) | 38 (10.6%) |
Public vs Private Health Insurance Coverage by Age in Newark
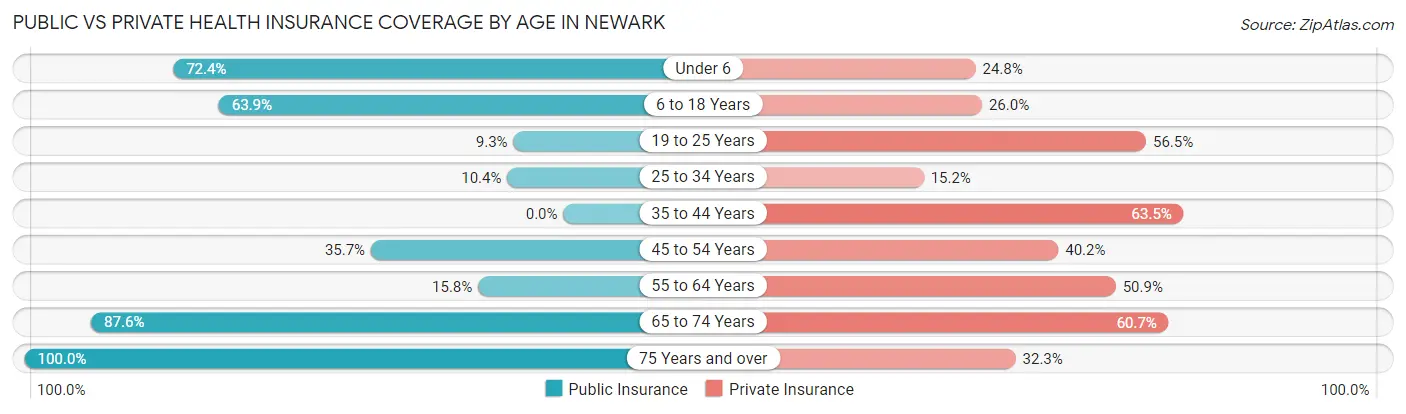
| Age Bracket | Public Insurance | Private Insurance |
| Under 6 | 105 (72.4%) | 36 (24.8%) |
| 6 to 18 Years | 172 (63.9%) | 70 (26.0%) |
| 19 to 25 Years | 10 (9.3%) | 61 (56.5%) |
| 25 to 34 Years | 13 (10.4%) | 19 (15.2%) |
| 35 to 44 Years | 0 (0.0%) | 92 (63.4%) |
| 45 to 54 Years | 40 (35.7%) | 45 (40.2%) |
| 55 to 64 Years | 28 (15.8%) | 90 (50.8%) |
| 65 to 74 Years | 78 (87.6%) | 54 (60.7%) |
| 75 Years and over | 62 (100.0%) | 20 (32.3%) |
| Total | 508 (41.2%) | 487 (39.5%) |
Disability Status by Sex by Age in Newark
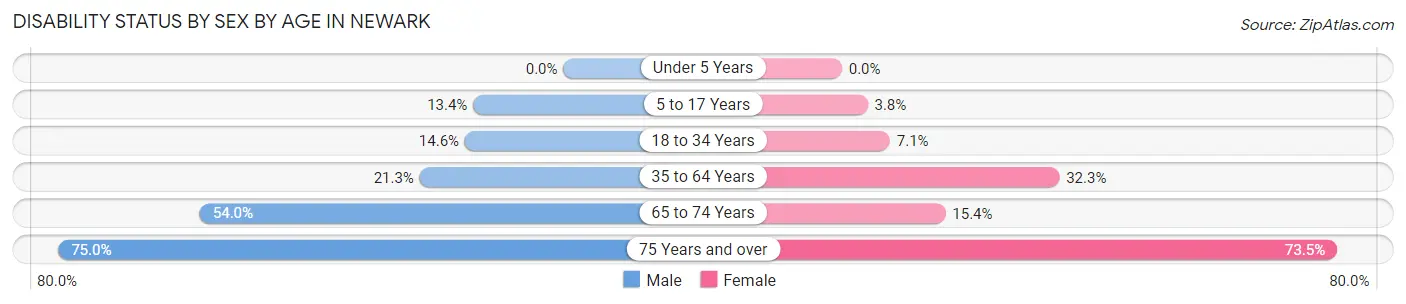
| Age Bracket | Male | Female |
| Under 5 Years | 0 (0.0%) | 0 (0.0%) |
| 5 to 17 Years | 15 (13.4%) | 5 (3.8%) |
| 18 to 34 Years | 25 (14.6%) | 8 (7.1%) |
| 35 to 64 Years | 45 (21.3%) | 72 (32.3%) |
| 65 to 74 Years | 34 (54.0%) | 4 (15.4%) |
| 75 Years and over | 21 (75.0%) | 25 (73.5%) |
Disability Class by Sex by Age in Newark
Disability Class: Hearing Difficulty
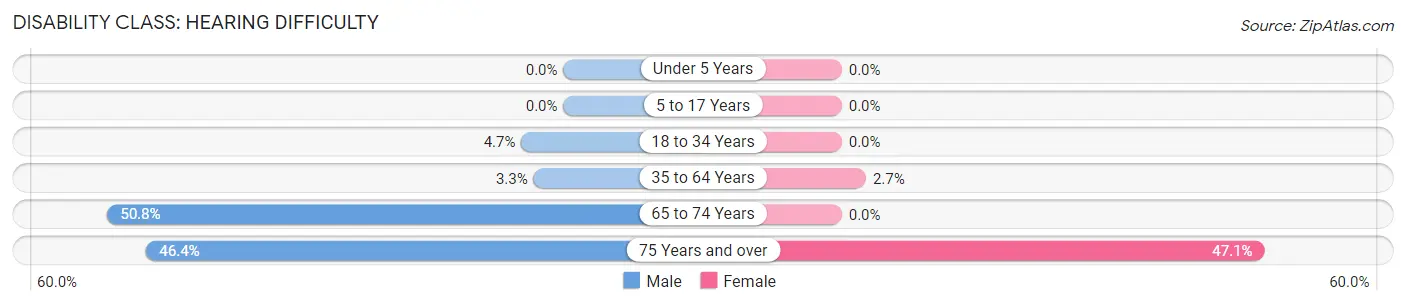
| Age Bracket | Male | Female |
| Under 5 Years | 0 (0.0%) | 0 (0.0%) |
| 5 to 17 Years | 0 (0.0%) | 0 (0.0%) |
| 18 to 34 Years | 8 (4.7%) | 0 (0.0%) |
| 35 to 64 Years | 7 (3.3%) | 6 (2.7%) |
| 65 to 74 Years | 32 (50.8%) | 0 (0.0%) |
| 75 Years and over | 13 (46.4%) | 16 (47.1%) |
Disability Class: Vision Difficulty
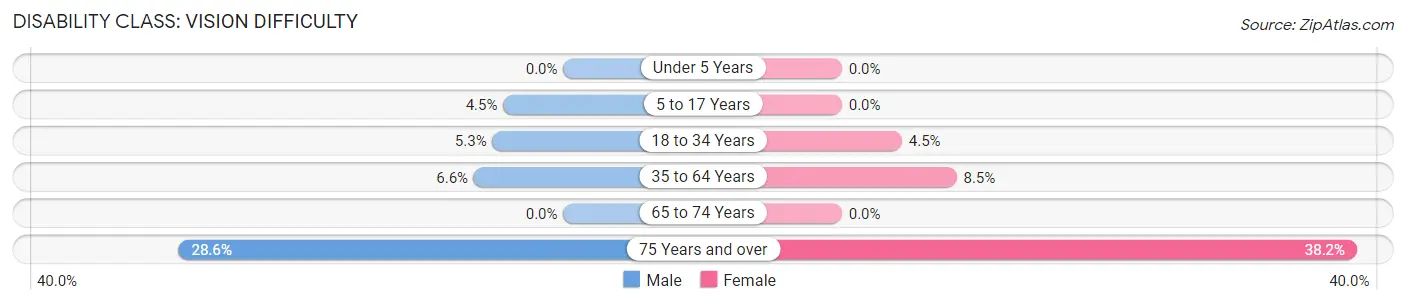
| Age Bracket | Male | Female |
| Under 5 Years | 0 (0.0%) | 0 (0.0%) |
| 5 to 17 Years | 5 (4.5%) | 0 (0.0%) |
| 18 to 34 Years | 9 (5.3%) | 5 (4.5%) |
| 35 to 64 Years | 14 (6.6%) | 19 (8.5%) |
| 65 to 74 Years | 0 (0.0%) | 0 (0.0%) |
| 75 Years and over | 8 (28.6%) | 13 (38.2%) |
Disability Class: Cognitive Difficulty
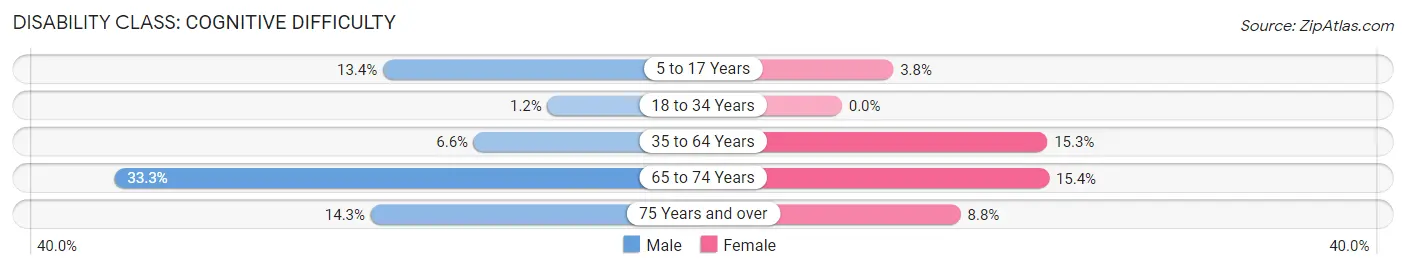
| Age Bracket | Male | Female |
| 5 to 17 Years | 15 (13.4%) | 5 (3.8%) |
| 18 to 34 Years | 2 (1.2%) | 0 (0.0%) |
| 35 to 64 Years | 14 (6.6%) | 34 (15.2%) |
| 65 to 74 Years | 21 (33.3%) | 4 (15.4%) |
| 75 Years and over | 4 (14.3%) | 3 (8.8%) |
Disability Class: Ambulatory Difficulty
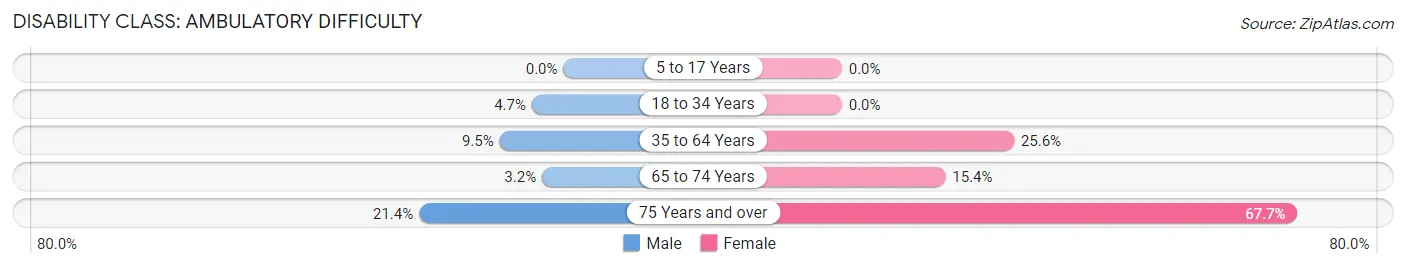
| Age Bracket | Male | Female |
| 5 to 17 Years | 0 (0.0%) | 0 (0.0%) |
| 18 to 34 Years | 8 (4.7%) | 0 (0.0%) |
| 35 to 64 Years | 20 (9.5%) | 57 (25.6%) |
| 65 to 74 Years | 2 (3.2%) | 4 (15.4%) |
| 75 Years and over | 6 (21.4%) | 23 (67.6%) |
Disability Class: Self-Care Difficulty
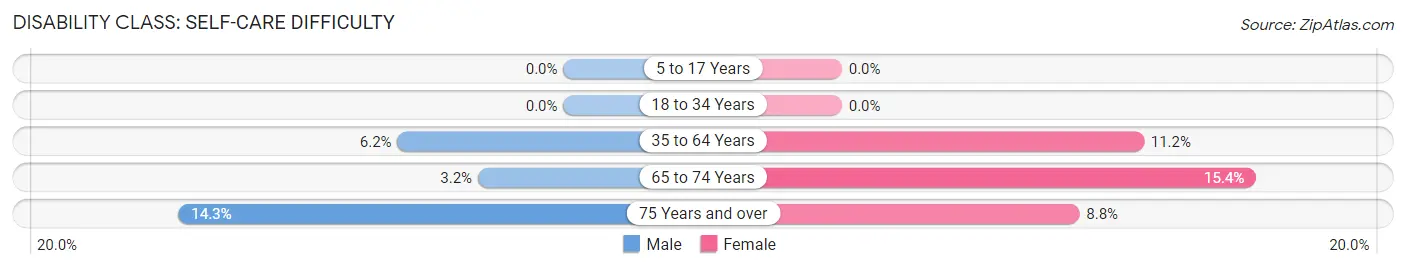
| Age Bracket | Male | Female |
| 5 to 17 Years | 0 (0.0%) | 0 (0.0%) |
| 18 to 34 Years | 0 (0.0%) | 0 (0.0%) |
| 35 to 64 Years | 13 (6.2%) | 25 (11.2%) |
| 65 to 74 Years | 2 (3.2%) | 4 (15.4%) |
| 75 Years and over | 4 (14.3%) | 3 (8.8%) |
Technology Access in Newark
Computing Device Access in Newark
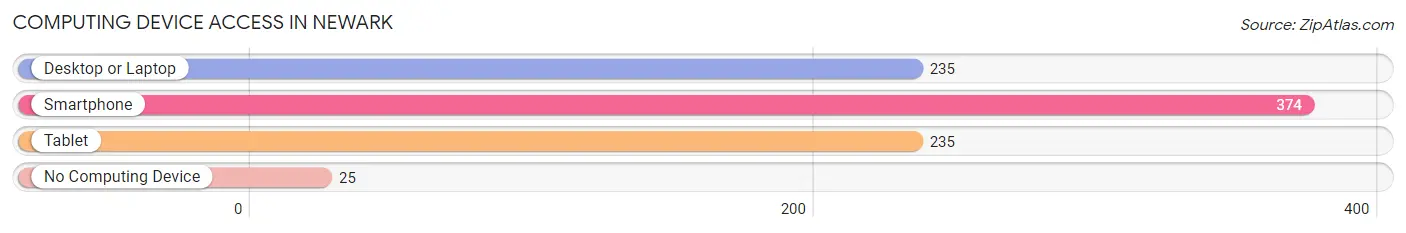
| Device Type | # Households | % Households |
| Desktop or Laptop | 235 | 57.9% |
| Smartphone | 374 | 92.1% |
| Tablet | 235 | 57.9% |
| No Computing Device | 25 | 6.2% |
| Total | 406 | 100.0% |
Internet Access in Newark
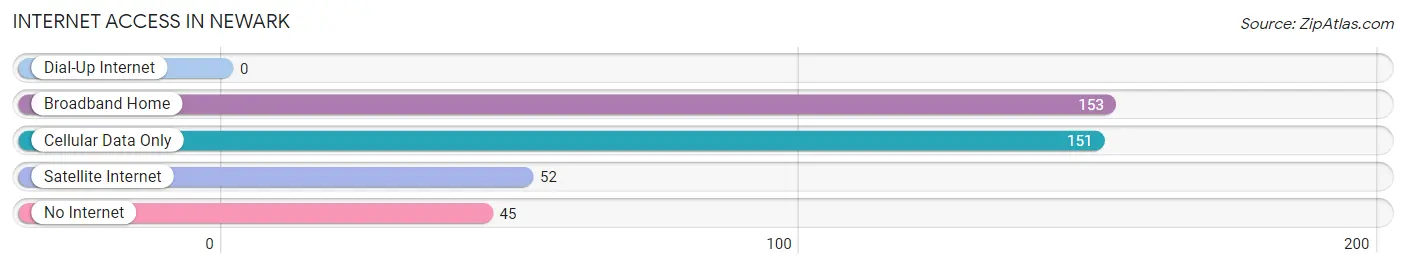
| Internet Type | # Households | % Households |
| Dial-Up Internet | 0 | 0.0% |
| Broadband Home | 153 | 37.7% |
| Cellular Data Only | 151 | 37.2% |
| Satellite Internet | 52 | 12.8% |
| No Internet | 45 | 11.1% |
| Total | 406 | 100.0% |
Newark Summary
Newark is a small town located in the state of Texas, in the United States. It is situated in the county of Wise, and is part of the Dallas-Fort Worth-Arlington metropolitan area. The town has a population of approximately 1,400 people, and is located about 40 miles northwest of Fort Worth.
History
The area that is now Newark was first settled in the late 1800s by a group of settlers from the nearby town of Decatur. The settlers named the area Newark after the city of Newark, New Jersey. The town was officially incorporated in 1891, and the first post office was established in 1892.
In the early 1900s, the town began to grow and prosper. The population increased, and the town became a center for farming and ranching. The town also became a popular stop for travelers on the Texas and Pacific Railway.
In the 1920s, the town experienced a period of growth and development. The population increased, and the town was home to several businesses, including a bank, a hotel, a grocery store, and a movie theater.
Geography
Newark is located in the north-central part of Texas, in Wise County. It is situated about 40 miles northwest of Fort Worth, and is part of the Dallas-Fort Worth-Arlington metropolitan area. The town is located at the intersection of State Highway 114 and State Highway 199.
The town is situated on the edge of the Cross Timbers region of Texas, and is surrounded by rolling hills and prairies. The town is located in a region of Texas known as the Blackland Prairie, which is characterized by rich, fertile soil.
Economy
The economy of Newark is largely based on agriculture and ranching. The town is home to several farms and ranches, and the surrounding area is known for its production of wheat, corn, and other crops.
The town is also home to several small businesses, including a bank, a grocery store, and a movie theater. The town is also home to a few manufacturing companies, including a furniture factory and a plastics factory.
Demographics
As of the 2010 census, the population of Newark was 1,400 people. The racial makeup of the town was 94.3% White, 0.7% African American, 0.3% Native American, 0.3% Asian, 0.1% Pacific Islander, 2.6% from other races, and 1.7% from two or more races. Hispanic or Latino of any race were 5.3% of the population.
The median household income in Newark was $37,500, and the median family income was $41,250. The per capita income for the town was $17,857. About 11.3% of families and 13.2% of the population were below the poverty line, including 17.2% of those under age 18 and 8.3% of those age 65 or over.
Common Questions
What is Per Capita Income in Newark?
Per Capita income in Newark is $26,912.
What is the Median Family Income in Newark?
Median Family Income in Newark is $46,806.
What is the Median Household income in Newark?
Median Household Income in Newark is $51,607.
What is Income or Wage Gap in Newark?
Income or Wage Gap in Newark is 48.7%.
Women in Newark earn 51.3 cents for every dollar earned by a man.
What is Inequality or Gini Index in Newark?
Inequality or Gini Index in Newark is 0.47.
What is the Total Population of Newark?
Total Population of Newark is 1,232.
What is the Total Male Population of Newark?
Total Male Population of Newark is 660.
What is the Total Female Population of Newark?
Total Female Population of Newark is 572.
What is the Ratio of Males per 100 Females in Newark?
There are 115.38 Males per 100 Females in Newark.
What is the Ratio of Females per 100 Males in Newark?
There are 86.67 Females per 100 Males in Newark.
What is the Median Population Age in Newark?
Median Population Age in Newark is 31.4 Years.
What is the Average Family Size in Newark
Average Family Size in Newark is 3.4 People.
What is the Average Household Size in Newark
Average Household Size in Newark is 3.0 People.
How Large is the Labor Force in Newark?
There are 552 People in the Labor Forcein in Newark.
What is the Percentage of People in the Labor Force in Newark?
62.7% of People are in the Labor Force in Newark.
What is the Unemployment Rate in Newark?
Unemployment Rate in Newark is 7.1%.