Navasota, TX Map & Demographics
Navasota Map
Navasota Overview
$22,663
PER CAPITA INCOME
$54,801
AVG FAMILY INCOME
$47,793
AVG HOUSEHOLD INCOME
20.9%
WAGE / INCOME GAP [ % ]
79.1¢/ $1
WAGE / INCOME GAP [ $ ]
$11,823
FAMILY INCOME DEFICIT
0.44
INEQUALITY / GINI INDEX
7,843
TOTAL POPULATION
3,655
MALE POPULATION
4,188
FEMALE POPULATION
87.27
MALES / 100 FEMALES
114.58
FEMALES / 100 MALES
33.0
MEDIAN AGE
3.5
AVG FAMILY SIZE
2.7
AVG HOUSEHOLD SIZE
3,795
LABOR FORCE [ PEOPLE ]
68.1%
PERCENT IN LABOR FORCE
8.5%
UNEMPLOYMENT RATE
Navasota Zip Codes
Navasota Area Codes
Income in Navasota
Income Overview in Navasota
Per Capita Income in Navasota is $22,663, while median incomes of families and households are $54,801 and $47,793 respectively.
| Characteristic | Number | Measure |
| Per Capita Income | 7,843 | $22,663 |
| Median Family Income | 1,917 | $54,801 |
| Mean Family Income | 1,917 | $68,586 |
| Median Household Income | 2,789 | $47,793 |
| Mean Household Income | 2,789 | $63,122 |
| Income Deficit | 1,917 | $11,823 |
| Wage / Income Gap (%) | 7,843 | 20.94% |
| Wage / Income Gap ($) | 7,843 | 79.06¢ per $1 |
| Gini / Inequality Index | 7,843 | 0.44 |
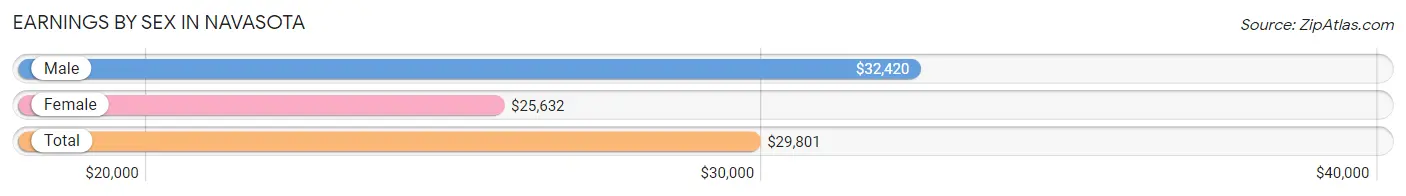
Earnings by Sex in Navasota
Average Earnings in Navasota are $29,801, $32,420 for men and $25,632 for women, a difference of 20.9%.
| Sex | Number | Average Earnings |
| Male | 1,959 (50.2%) | $32,420 |
| Female | 1,940 (49.8%) | $25,632 |
| Total | 3,899 (100.0%) | $29,801 |
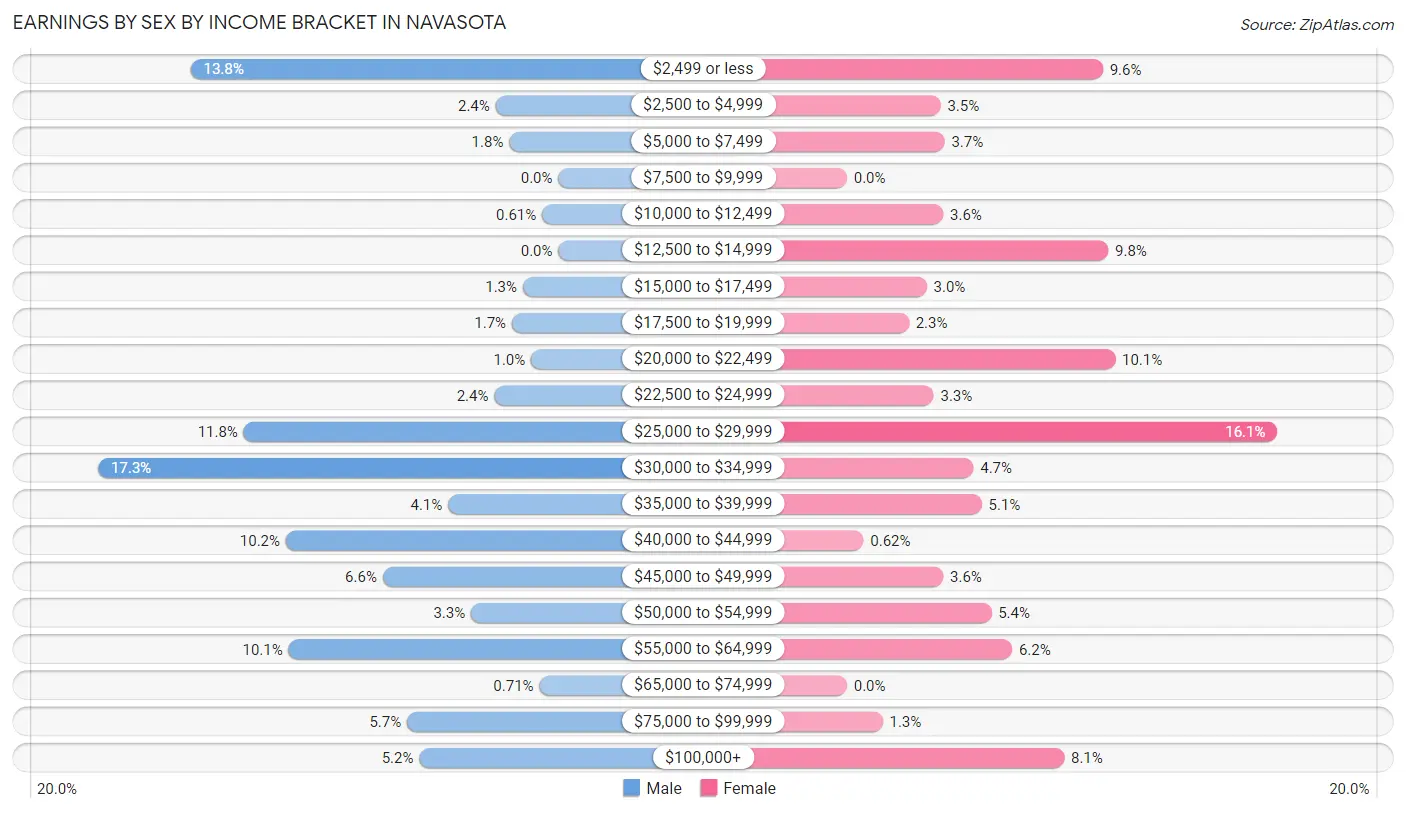
Earnings by Sex by Income Bracket in Navasota
The most common earnings brackets in Navasota are $30,000 to $34,999 for men (338 | 17.2%) and $25,000 to $29,999 for women (313 | 16.1%).
| Income | Male | Female |
| $2,499 or less | 270 (13.8%) | 186 (9.6%) |
| $2,500 to $4,999 | 46 (2.4%) | 68 (3.5%) |
| $5,000 to $7,499 | 36 (1.8%) | 71 (3.7%) |
| $7,500 to $9,999 | 0 (0.0%) | 0 (0.0%) |
| $10,000 to $12,499 | 12 (0.6%) | 70 (3.6%) |
| $12,500 to $14,999 | 0 (0.0%) | 190 (9.8%) |
| $15,000 to $17,499 | 26 (1.3%) | 58 (3.0%) |
| $17,500 to $19,999 | 34 (1.7%) | 45 (2.3%) |
| $20,000 to $22,499 | 20 (1.0%) | 195 (10.1%) |
| $22,500 to $24,999 | 47 (2.4%) | 63 (3.3%) |
| $25,000 to $29,999 | 231 (11.8%) | 313 (16.1%) |
| $30,000 to $34,999 | 338 (17.2%) | 92 (4.7%) |
| $35,000 to $39,999 | 81 (4.1%) | 98 (5.1%) |
| $40,000 to $44,999 | 200 (10.2%) | 12 (0.6%) |
| $45,000 to $49,999 | 129 (6.6%) | 70 (3.6%) |
| $50,000 to $54,999 | 64 (3.3%) | 105 (5.4%) |
| $55,000 to $64,999 | 198 (10.1%) | 120 (6.2%) |
| $65,000 to $74,999 | 14 (0.7%) | 0 (0.0%) |
| $75,000 to $99,999 | 111 (5.7%) | 26 (1.3%) |
| $100,000+ | 102 (5.2%) | 158 (8.1%) |
| Total | 1,959 (100.0%) | 1,940 (100.0%) |
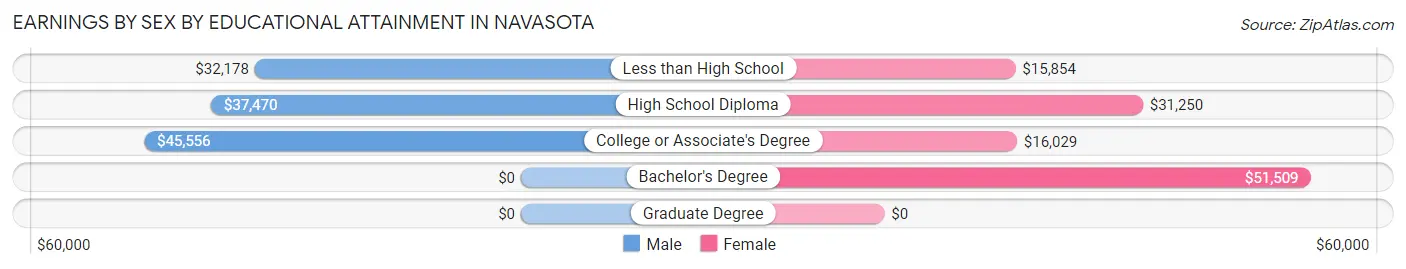
Earnings by Sex by Educational Attainment in Navasota
Average earnings in Navasota are $42,548 for men and $28,347 for women, a difference of 33.4%. Men with an educational attainment of college or associate's degree enjoy the highest average annual earnings of $45,556, while those with less than high school education earn the least with $32,178. Women with an educational attainment of bachelor's degree earn the most with the average annual earnings of $51,509, while those with less than high school education have the smallest earnings of $15,854.
| Educational Attainment | Male Income | Female Income |
| Less than High School | $32,178 | $15,854 |
| High School Diploma | $37,470 | $31,250 |
| College or Associate's Degree | $45,556 | $16,029 |
| Bachelor's Degree | - | - |
| Graduate Degree | - | - |
| Total | $42,548 | $28,347 |
Family Income in Navasota
Family Income Brackets in Navasota
According to the Navasota family income data, there are 330 families falling into the $100,000 to $149,999 income range, which is the most common income bracket and makes up 17.2% of all families. Conversely, the $15,000 to $24,999 income bracket is the least frequent group with only 29 families (1.5%) belonging to this category.
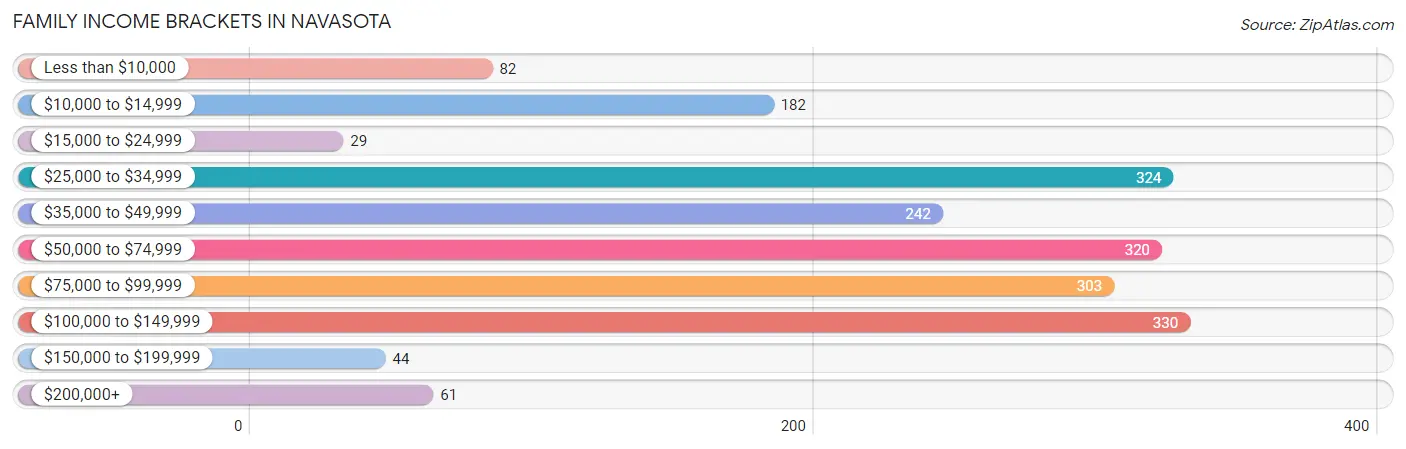
| Income Bracket | # Families | % Families |
| Less than $10,000 | 82 | 4.3% |
| $10,000 to $14,999 | 182 | 9.5% |
| $15,000 to $24,999 | 29 | 1.5% |
| $25,000 to $34,999 | 324 | 16.9% |
| $35,000 to $49,999 | 242 | 12.6% |
| $50,000 to $74,999 | 320 | 16.7% |
| $75,000 to $99,999 | 303 | 15.8% |
| $100,000 to $149,999 | 330 | 17.2% |
| $150,000 to $199,999 | 44 | 2.3% |
| $200,000+ | 61 | 3.2% |
Family Income by Famaliy Size in Navasota
5-person families (383 | 20.0%) account for the highest median family income in Navasota with $77,832 per family, while 2-person families (595 | 31.0%) have the highest median income of $25,656 per family member.
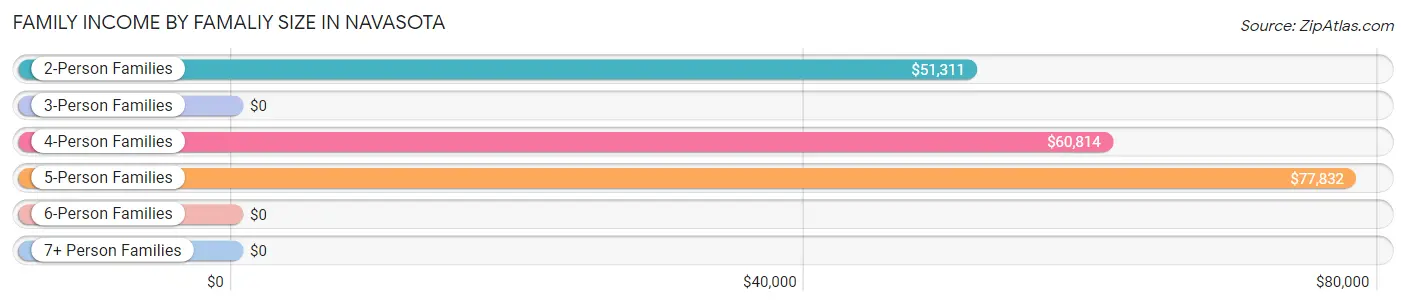
| Income Bracket | # Families | Median Income |
| 2-Person Families | 595 (31.0%) | $51,311 |
| 3-Person Families | 315 (16.4%) | $0 |
| 4-Person Families | 568 (29.6%) | $60,814 |
| 5-Person Families | 383 (20.0%) | $77,832 |
| 6-Person Families | 0 (0.0%) | $0 |
| 7+ Person Families | 56 (2.9%) | $0 |
| Total | 1,917 (100.0%) | $54,801 |
Family Income by Number of Earners in Navasota
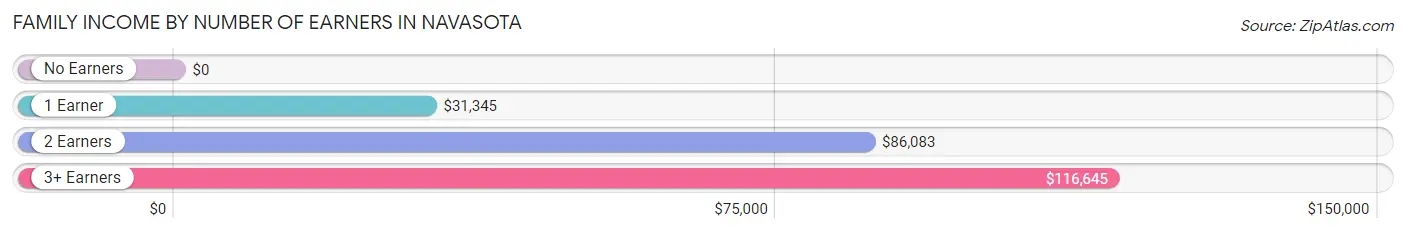
| Number of Earners | # Families | Median Income |
| No Earners | 205 (10.7%) | $0 |
| 1 Earner | 646 (33.7%) | $31,345 |
| 2 Earners | 933 (48.7%) | $86,083 |
| 3+ Earners | 133 (6.9%) | $116,645 |
| Total | 1,917 (100.0%) | $54,801 |
Household Income in Navasota
Household Income Brackets in Navasota
With 538 households falling in the category, the $25,000 to $34,999 income range is the most frequent in Navasota, accounting for 19.3% of all households. In contrast, only 53 households (1.9%) fall into the $150,000 to $199,999 income bracket, making it the least populous group.
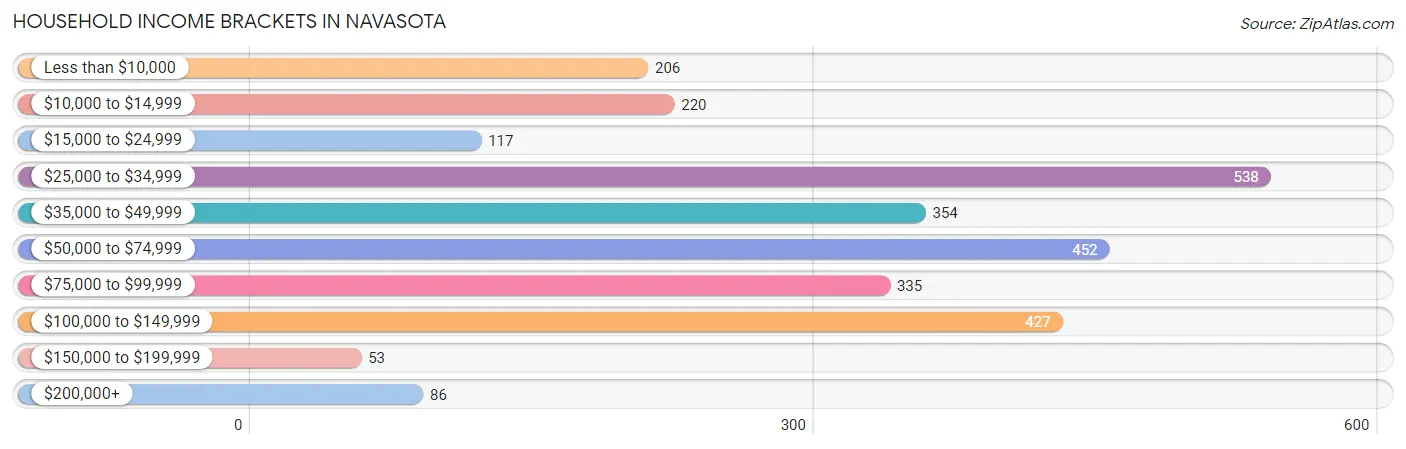
| Income Bracket | # Households | % Households |
| Less than $10,000 | 206 | 7.4% |
| $10,000 to $14,999 | 220 | 7.9% |
| $15,000 to $24,999 | 117 | 4.2% |
| $25,000 to $34,999 | 538 | 19.3% |
| $35,000 to $49,999 | 354 | 12.7% |
| $50,000 to $74,999 | 452 | 16.2% |
| $75,000 to $99,999 | 335 | 12.0% |
| $100,000 to $149,999 | 427 | 15.3% |
| $150,000 to $199,999 | 53 | 1.9% |
| $200,000+ | 86 | 3.1% |
Household Income by Householder Age in Navasota
The median household income in Navasota is $47,793, with the highest median household income of $64,125 found in the 45 to 64 years age bracket for the primary householder. A total of 949 households (34.0%) fall into this category.
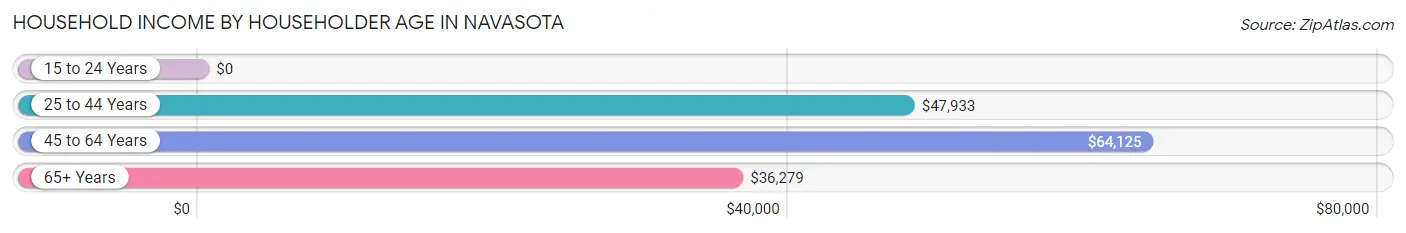
| Income Bracket | # Households | Median Income |
| 15 to 24 Years | 0 (0.0%) | $0 |
| 25 to 44 Years | 1,089 (39.1%) | $47,933 |
| 45 to 64 Years | 949 (34.0%) | $64,125 |
| 65+ Years | 751 (26.9%) | $36,279 |
| Total | 2,789 (100.0%) | $47,793 |
Poverty in Navasota
Income Below Poverty by Sex and Age in Navasota
With 18.1% poverty level for males and 20.8% for females among the residents of Navasota, 6 to 11 year old males and 12 to 14 year old females are the most vulnerable to poverty, with 209 males (54.0%) and 67 females (56.3%) in their respective age groups living below the poverty level.
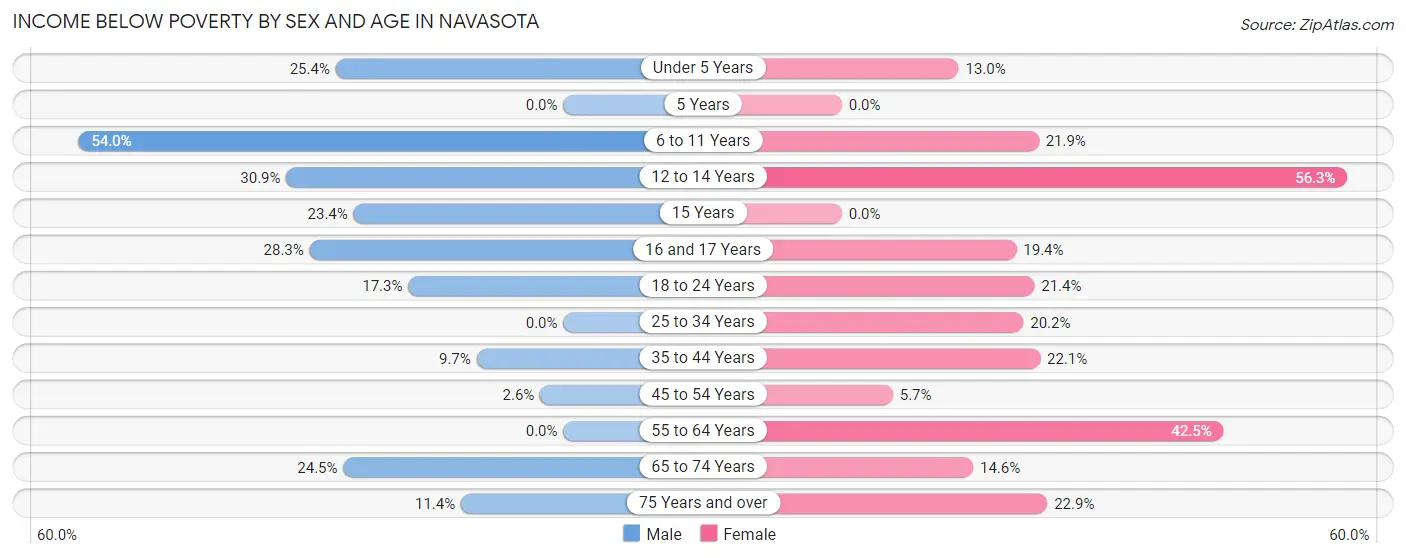
| Age Bracket | Male | Female |
| Under 5 Years | 54 (25.4%) | 49 (13.0%) |
| 5 Years | 0 (0.0%) | 0 (0.0%) |
| 6 to 11 Years | 209 (54.0%) | 107 (21.9%) |
| 12 to 14 Years | 87 (30.8%) | 67 (56.3%) |
| 15 Years | 50 (23.4%) | 0 (0.0%) |
| 16 and 17 Years | 13 (28.3%) | 14 (19.4%) |
| 18 to 24 Years | 91 (17.3%) | 104 (21.4%) |
| 25 to 34 Years | 0 (0.0%) | 78 (20.2%) |
| 35 to 44 Years | 34 (9.7%) | 134 (22.1%) |
| 45 to 54 Years | 13 (2.6%) | 26 (5.7%) |
| 55 to 64 Years | 0 (0.0%) | 162 (42.5%) |
| 65 to 74 Years | 61 (24.5%) | 50 (14.6%) |
| 75 Years and over | 23 (11.4%) | 54 (22.9%) |
| Total | 635 (18.1%) | 845 (20.8%) |
Income Above Poverty by Sex and Age in Navasota
According to the poverty statistics in Navasota, males aged 25 to 34 years and females aged 5 years are the age groups that are most secure financially, with 100.0% of males and 100.0% of females in these age groups living above the poverty line.
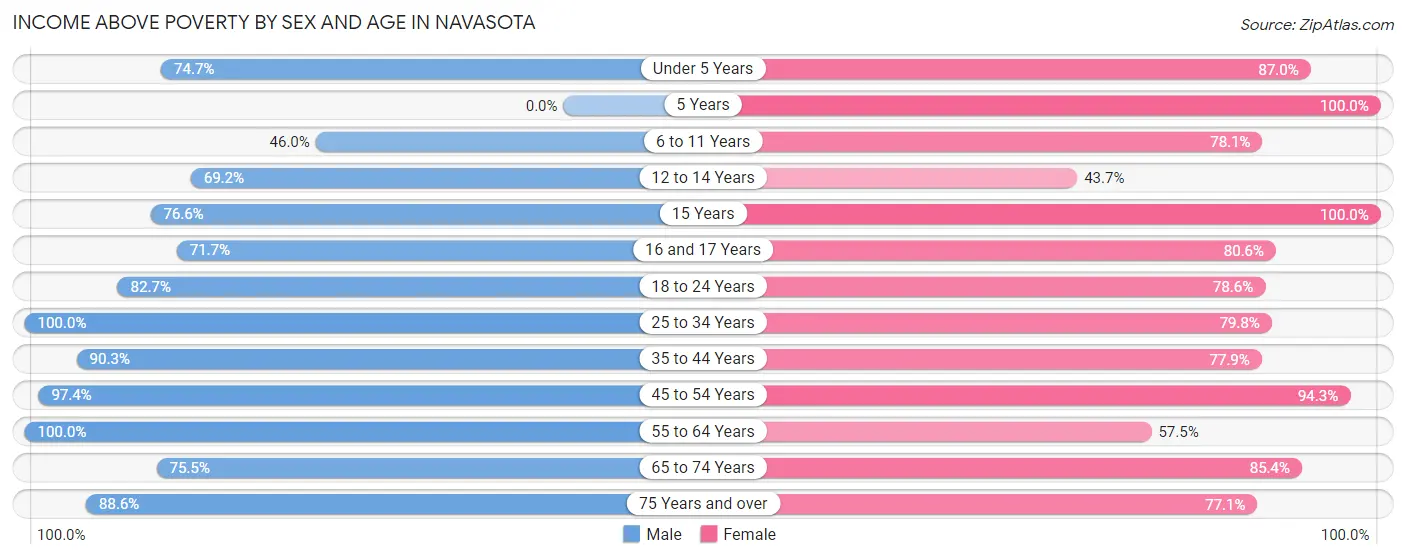
| Age Bracket | Male | Female |
| Under 5 Years | 159 (74.7%) | 328 (87.0%) |
| 5 Years | 0 (0.0%) | 48 (100.0%) |
| 6 to 11 Years | 178 (46.0%) | 381 (78.1%) |
| 12 to 14 Years | 195 (69.2%) | 52 (43.7%) |
| 15 Years | 164 (76.6%) | 69 (100.0%) |
| 16 and 17 Years | 33 (71.7%) | 58 (80.6%) |
| 18 to 24 Years | 436 (82.7%) | 381 (78.6%) |
| 25 to 34 Years | 398 (100.0%) | 308 (79.8%) |
| 35 to 44 Years | 318 (90.3%) | 473 (77.9%) |
| 45 to 54 Years | 491 (97.4%) | 432 (94.3%) |
| 55 to 64 Years | 134 (100.0%) | 219 (57.5%) |
| 65 to 74 Years | 188 (75.5%) | 292 (85.4%) |
| 75 Years and over | 179 (88.6%) | 182 (77.1%) |
| Total | 2,873 (81.9%) | 3,223 (79.2%) |
Income Below Poverty Among Married-Couple Families in Navasota
The poverty statistics for married-couple families in Navasota show that 4.6% or 64 of the total 1,376 families live below the poverty line. Families with 5 or more children have the highest poverty rate of 100.0%, comprising of 24 families. On the other hand, families with 3 or 4 children have the lowest poverty rate of 0.0%, which includes 0 families.
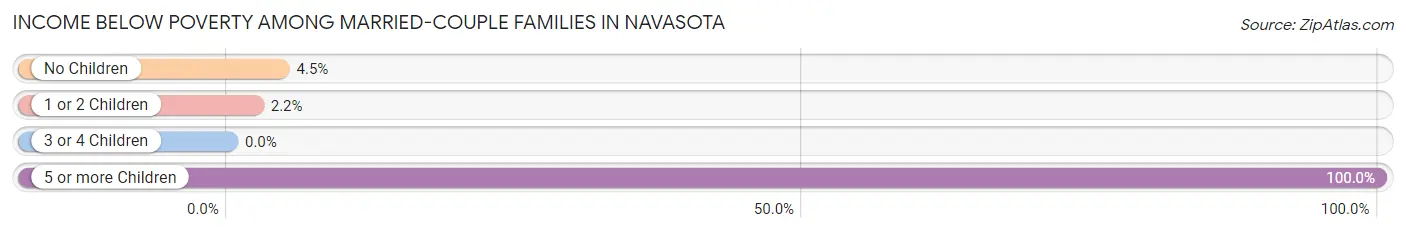
| Children | Above Poverty | Below Poverty |
| No Children | 574 (95.5%) | 27 (4.5%) |
| 1 or 2 Children | 568 (97.8%) | 13 (2.2%) |
| 3 or 4 Children | 170 (100.0%) | 0 (0.0%) |
| 5 or more Children | 0 (0.0%) | 24 (100.0%) |
| Total | 1,312 (95.4%) | 64 (4.6%) |
Income Below Poverty Among Single-Parent Households in Navasota
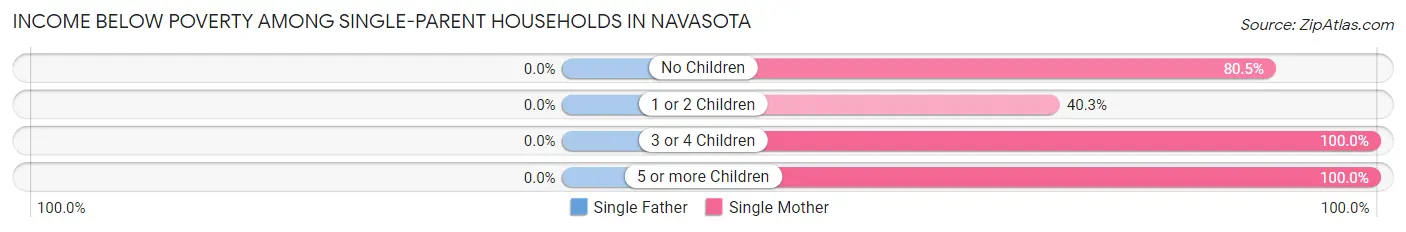
| Children | Single Father | Single Mother |
| No Children | 0 (0.0%) | 103 (80.5%) |
| 1 or 2 Children | 0 (0.0%) | 89 (40.3%) |
| 3 or 4 Children | 0 (0.0%) | 98 (100.0%) |
| 5 or more Children | 0 (0.0%) | 10 (100.0%) |
| Total | 0 (0.0%) | 300 (65.6%) |
Income Below Poverty Among Married-Couple vs Single-Parent Households in Navasota
The poverty data for Navasota shows that 64 of the married-couple family households (4.6%) and 300 of the single-parent households (55.4%) are living below the poverty level. Within the married-couple family households, those with 5 or more children have the highest poverty rate, with 24 households (100.0%) falling below the poverty line. Among the single-parent households, those with 3 or 4 children have the highest poverty rate, with 98 household (100.0%) living below poverty.
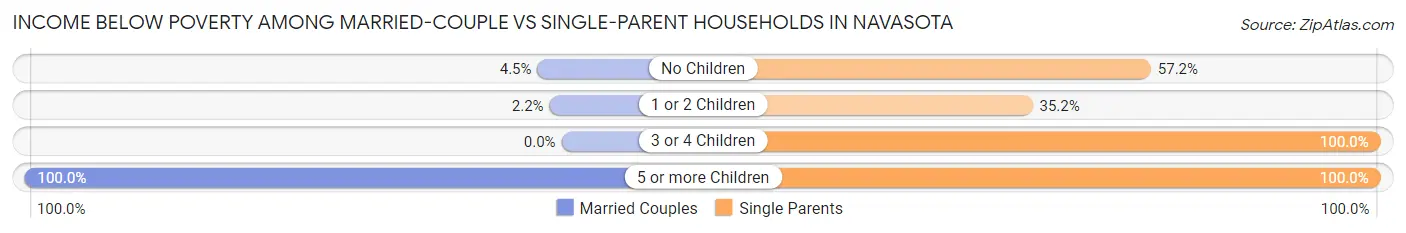
| Children | Married-Couple Families | Single-Parent Households |
| No Children | 27 (4.5%) | 103 (57.2%) |
| 1 or 2 Children | 13 (2.2%) | 89 (35.2%) |
| 3 or 4 Children | 0 (0.0%) | 98 (100.0%) |
| 5 or more Children | 24 (100.0%) | 10 (100.0%) |
| Total | 64 (4.6%) | 300 (55.4%) |
Race in Navasota
The most populous races in Navasota are White / Caucasian (4,030 | 51.4%), Hispanic or Latino (3,620 | 46.2%), and Two or more Races (1,760 | 22.4%).
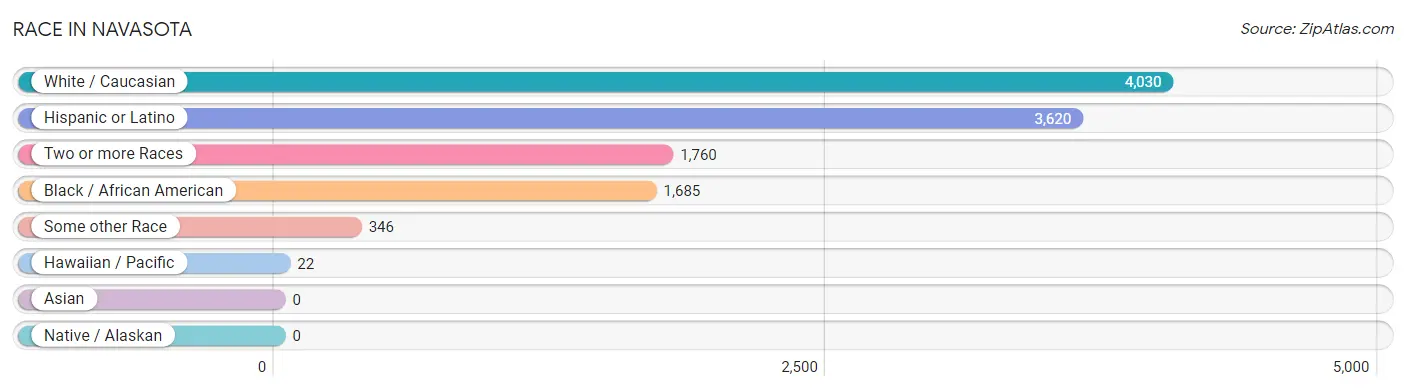
| Race | # Population | % Population |
| Asian | 0 | 0.0% |
| Black / African American | 1,685 | 21.5% |
| Hawaiian / Pacific | 22 | 0.3% |
| Hispanic or Latino | 3,620 | 46.2% |
| Native / Alaskan | 0 | 0.0% |
| White / Caucasian | 4,030 | 51.4% |
| Two or more Races | 1,760 | 22.4% |
| Some other Race | 346 | 4.4% |
| Total | 7,843 | 100.0% |
Ancestry in Navasota
The most populous ancestries reported in Navasota are Mexican (3,493 | 44.5%), English (797 | 10.2%), German (584 | 7.4%), Irish (467 | 5.9%), and African (338 | 4.3%), together accounting for 72.4% of all Navasota residents.
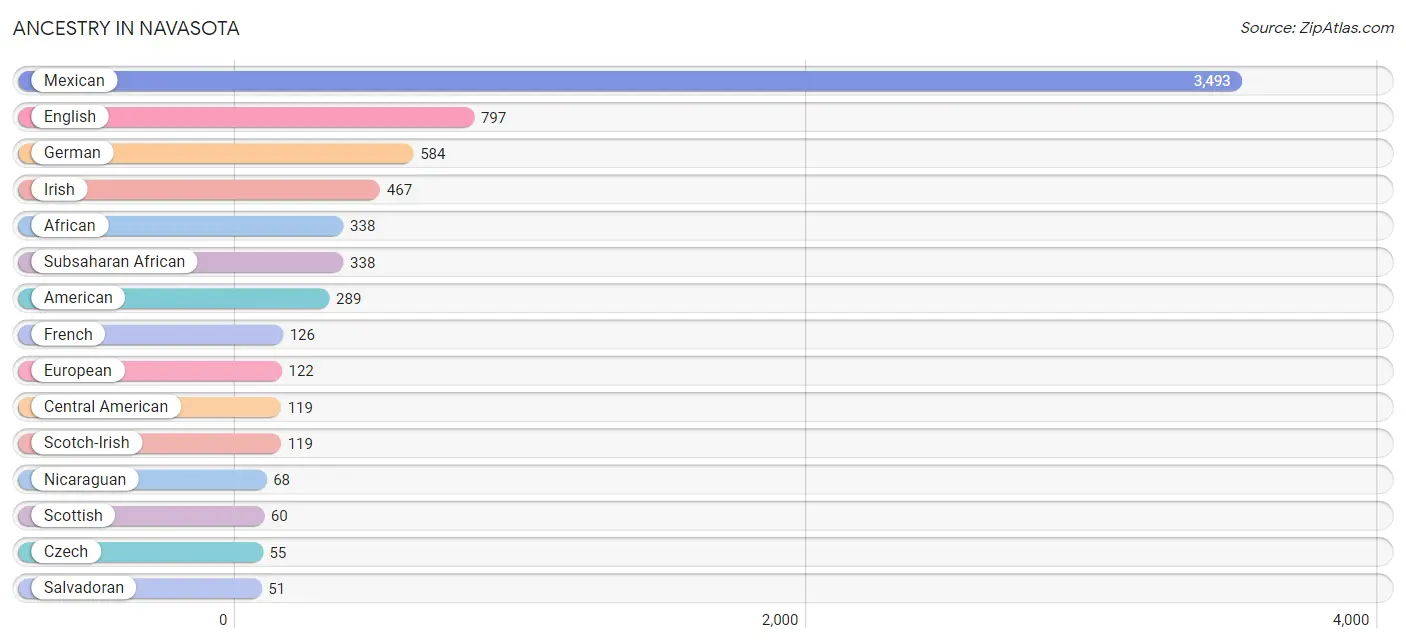
| Ancestry | # Population | % Population |
| African | 338 | 4.3% |
| American | 289 | 3.7% |
| British | 34 | 0.4% |
| Canadian | 5 | 0.1% |
| Central American | 119 | 1.5% |
| Cherokee | 32 | 0.4% |
| Choctaw | 17 | 0.2% |
| Czech | 55 | 0.7% |
| Danish | 10 | 0.1% |
| Dutch | 20 | 0.3% |
| English | 797 | 10.2% |
| European | 122 | 1.6% |
| Finnish | 32 | 0.4% |
| French | 126 | 1.6% |
| German | 584 | 7.4% |
| Irish | 467 | 5.9% |
| Italian | 5 | 0.1% |
| Mexican | 3,493 | 44.5% |
| Nicaraguan | 68 | 0.9% |
| Polish | 28 | 0.4% |
| Puerto Rican | 8 | 0.1% |
| Salvadoran | 51 | 0.6% |
| Samoan | 22 | 0.3% |
| Scotch-Irish | 119 | 1.5% |
| Scottish | 60 | 0.8% |
| Subsaharan African | 338 | 4.3% |
| Swedish | 15 | 0.2% |
| Swiss | 5 | 0.1% | View All 28 Rows |
Immigrants in Navasota
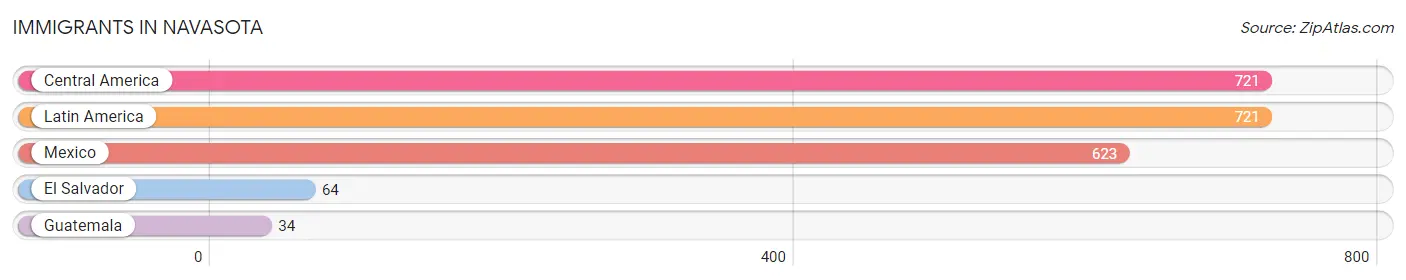
The most numerous immigrant groups reported in Navasota came from Central America (721 | 9.2%), Latin America (721 | 9.2%), Mexico (623 | 7.9%), El Salvador (64 | 0.8%), and Guatemala (34 | 0.4%), together accounting for 27.6% of all Navasota residents.
| Immigration Origin | # Population | % Population |
| Central America | 721 | 9.2% |
| El Salvador | 64 | 0.8% |
| Guatemala | 34 | 0.4% |
| Latin America | 721 | 9.2% |
| Mexico | 623 | 7.9% | View All 5 Rows |
Sex and Age in Navasota
Sex and Age in Navasota
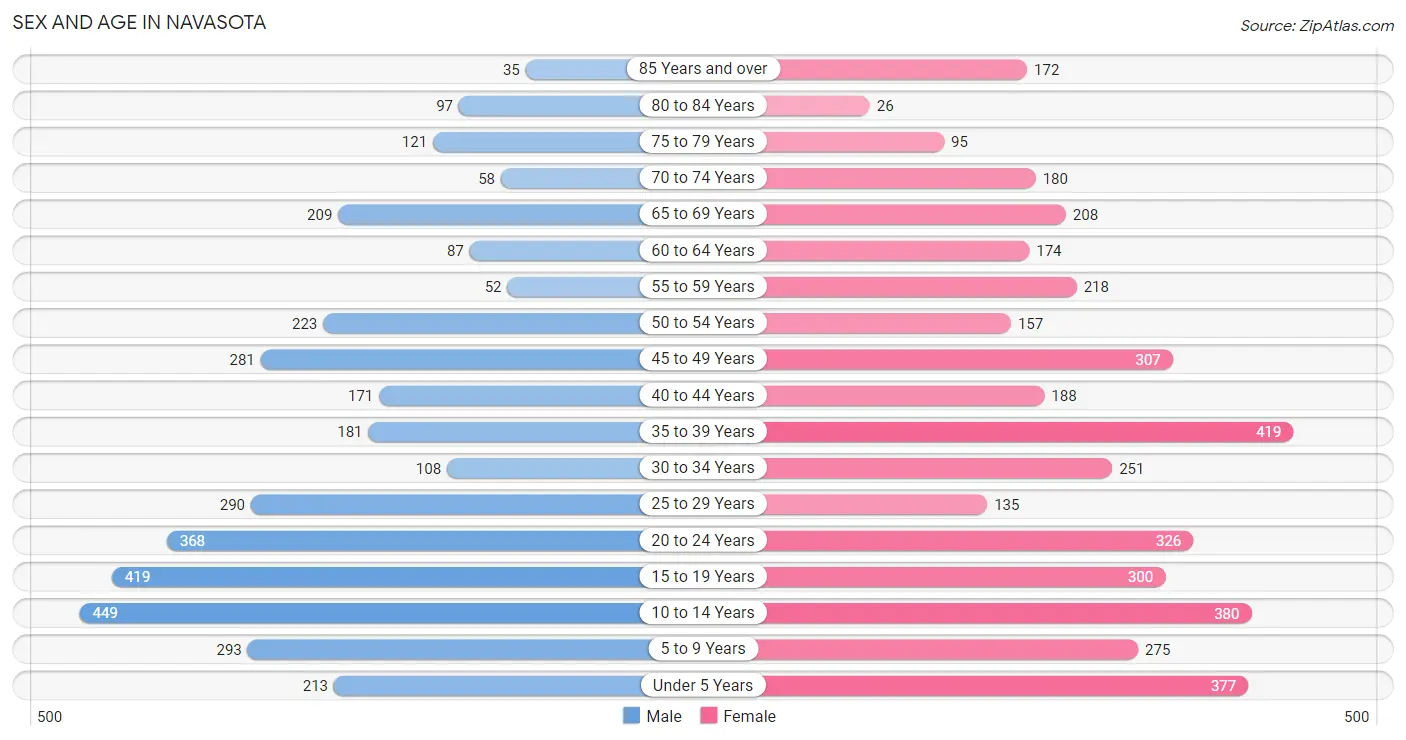
The most populous age groups in Navasota are 10 to 14 Years (449 | 12.3%) for men and 35 to 39 Years (419 | 10.0%) for women.
| Age Bracket | Male | Female |
| Under 5 Years | 213 (5.8%) | 377 (9.0%) |
| 5 to 9 Years | 293 (8.0%) | 275 (6.6%) |
| 10 to 14 Years | 449 (12.3%) | 380 (9.1%) |
| 15 to 19 Years | 419 (11.5%) | 300 (7.2%) |
| 20 to 24 Years | 368 (10.1%) | 326 (7.8%) |
| 25 to 29 Years | 290 (7.9%) | 135 (3.2%) |
| 30 to 34 Years | 108 (2.9%) | 251 (6.0%) |
| 35 to 39 Years | 181 (5.0%) | 419 (10.0%) |
| 40 to 44 Years | 171 (4.7%) | 188 (4.5%) |
| 45 to 49 Years | 281 (7.7%) | 307 (7.3%) |
| 50 to 54 Years | 223 (6.1%) | 157 (3.7%) |
| 55 to 59 Years | 52 (1.4%) | 218 (5.2%) |
| 60 to 64 Years | 87 (2.4%) | 174 (4.2%) |
| 65 to 69 Years | 209 (5.7%) | 208 (5.0%) |
| 70 to 74 Years | 58 (1.6%) | 180 (4.3%) |
| 75 to 79 Years | 121 (3.3%) | 95 (2.3%) |
| 80 to 84 Years | 97 (2.6%) | 26 (0.6%) |
| 85 Years and over | 35 (1.0%) | 172 (4.1%) |
| Total | 3,655 (100.0%) | 4,188 (100.0%) |
Families and Households in Navasota
Median Family Size in Navasota
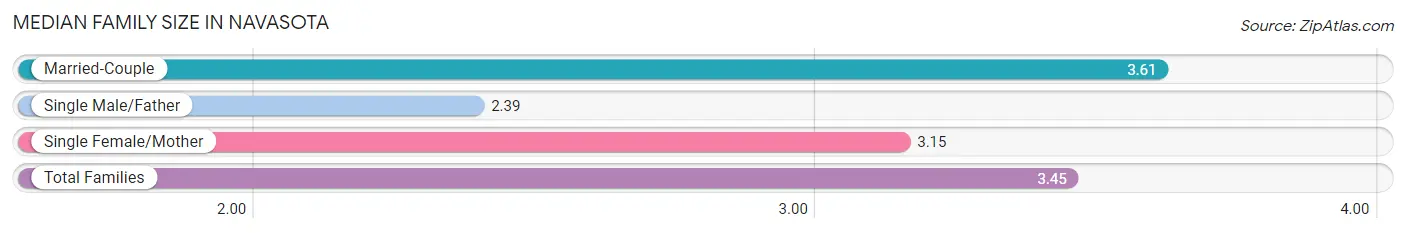
The median family size in Navasota is 3.45 persons per family, with married-couple families (1,376 | 71.8%) accounting for the largest median family size of 3.61 persons per family. On the other hand, single male/father families (84 | 4.4%) represent the smallest median family size with 2.39 persons per family.
| Family Type | # Families | Family Size |
| Married-Couple | 1,376 (71.8%) | 3.61 |
| Single Male/Father | 84 (4.4%) | 2.39 |
| Single Female/Mother | 457 (23.8%) | 3.15 |
| Total Families | 1,917 (100.0%) | 3.45 |
Median Household Size in Navasota
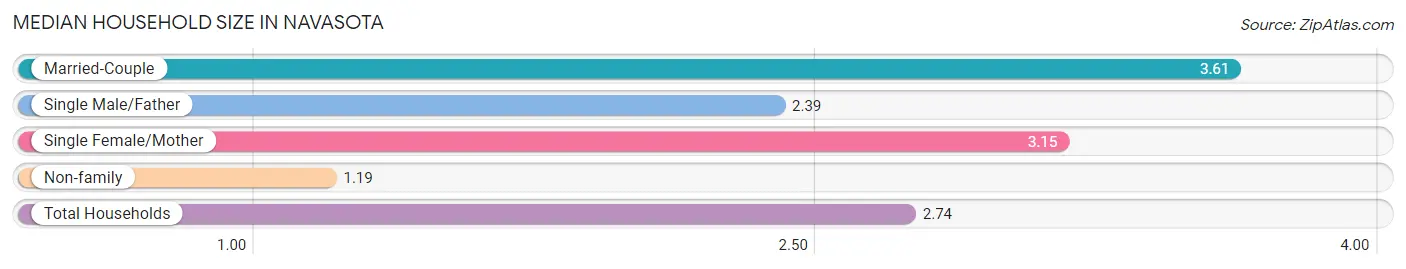
The median household size in Navasota is 2.74 persons per household, with married-couple households (1,376 | 49.3%) accounting for the largest median household size of 3.61 persons per household. non-family households (872 | 31.3%) represent the smallest median household size with 1.19 persons per household.
| Household Type | # Households | Household Size |
| Married-Couple | 1,376 (49.3%) | 3.61 |
| Single Male/Father | 84 (3.0%) | 2.39 |
| Single Female/Mother | 457 (16.4%) | 3.15 |
| Non-family | 872 (31.3%) | 1.19 |
| Total Households | 2,789 (100.0%) | 2.74 |
Household Size by Marriage Status in Navasota
Out of a total of 2,789 households in Navasota, 1,917 (68.7%) are family households, while 872 (31.3%) are nonfamily households. The most numerous type of family households are 2-person households, comprising 595, and the most common type of nonfamily households are 1-person households, comprising 805.
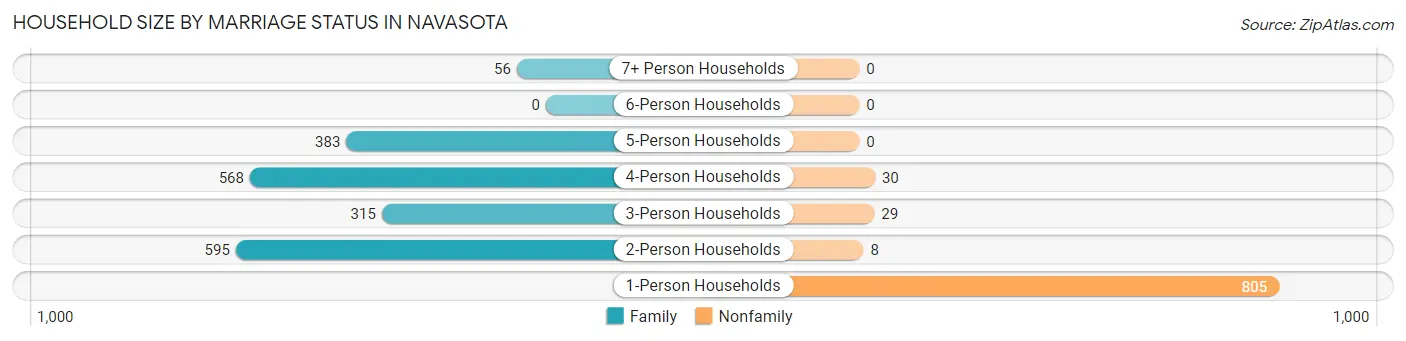
| Household Size | Family Households | Nonfamily Households |
| 1-Person Households | - | 805 (28.9%) |
| 2-Person Households | 595 (21.3%) | 8 (0.3%) |
| 3-Person Households | 315 (11.3%) | 29 (1.0%) |
| 4-Person Households | 568 (20.4%) | 30 (1.1%) |
| 5-Person Households | 383 (13.7%) | 0 (0.0%) |
| 6-Person Households | 0 (0.0%) | 0 (0.0%) |
| 7+ Person Households | 56 (2.0%) | 0 (0.0%) |
| Total | 1,917 (68.7%) | 872 (31.3%) |
Female Fertility in Navasota
Fertility by Age in Navasota
Average fertility rate in Navasota is 23.0 births per 1,000 women. Women in the age bracket of 20 to 34 years have the highest fertility rate with 37.0 births per 1,000 women. Women in the age bracket of 20 to 34 years acount for 57.8% of all women with births.
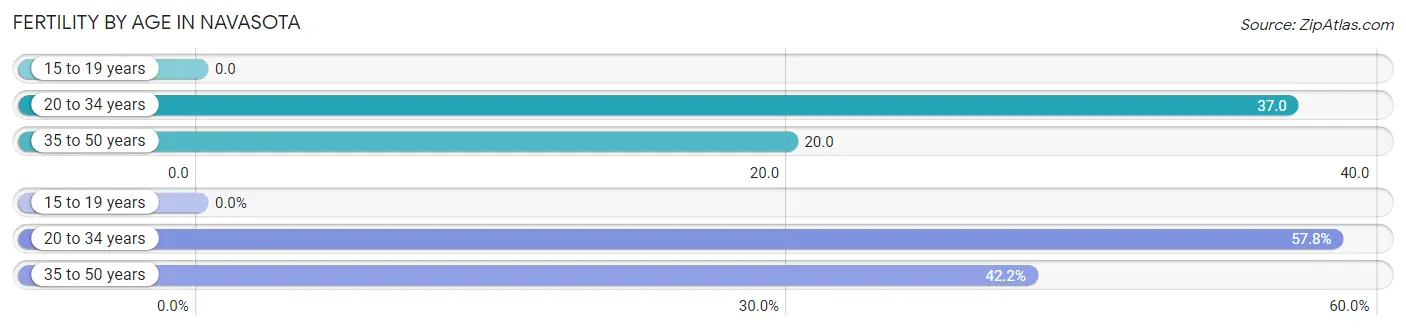
| Age Bracket | Women with Births | Births / 1,000 Women |
| 15 to 19 years | 0 (0.0%) | 0.0 |
| 20 to 34 years | 26 (57.8%) | 37.0 |
| 35 to 50 years | 19 (42.2%) | 20.0 |
| Total | 45 (100.0%) | 23.0 |
Fertility by Age by Marriage Status in Navasota
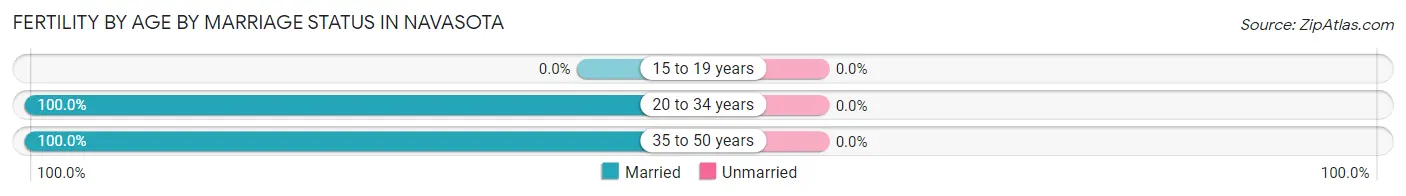
| Age Bracket | Married | Unmarried |
| 15 to 19 years | 0 (0.0%) | 0 (0.0%) |
| 20 to 34 years | 26 (100.0%) | 0 (0.0%) |
| 35 to 50 years | 19 (100.0%) | 0 (0.0%) |
| Total | 45 (100.0%) | 0 (0.0%) |
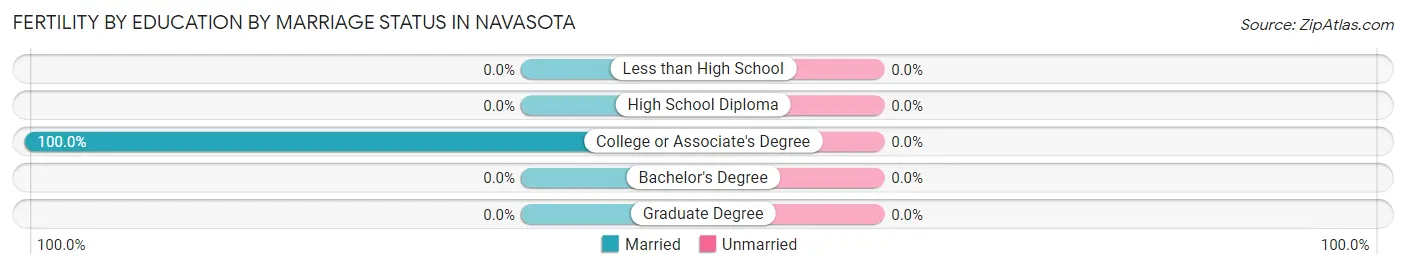
Fertility by Education in Navasota
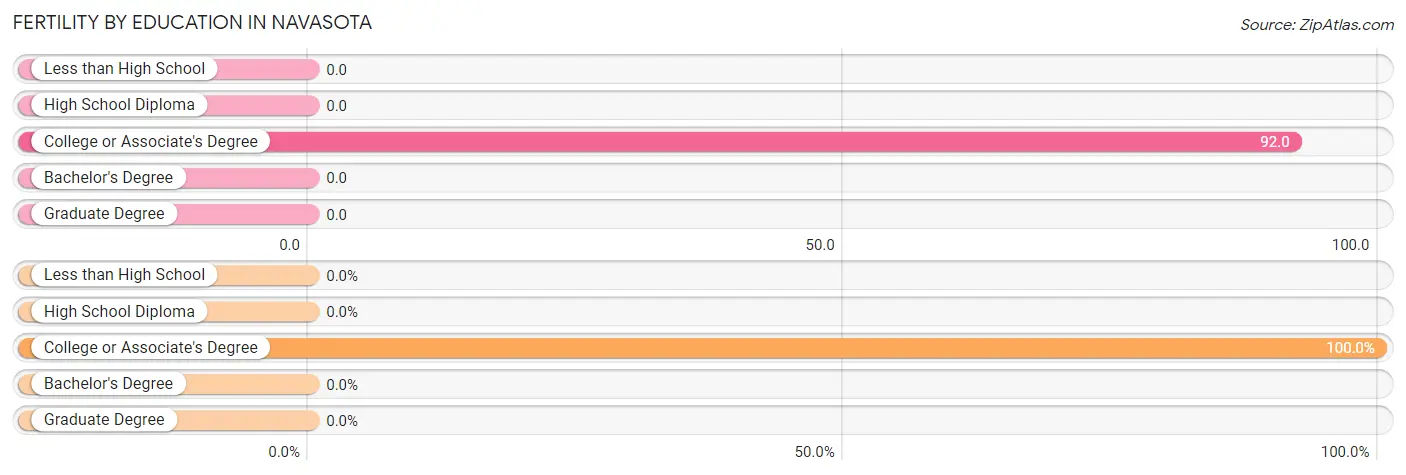
| Educational Attainment | Women with Births | Births / 1,000 Women |
| Less than High School | 0 (0.0%) | 0.0 |
| High School Diploma | 0 (0.0%) | 0.0 |
| College or Associate's Degree | 45 (100.0%) | 92.0 |
| Bachelor's Degree | 0 (0.0%) | 0.0 |
| Graduate Degree | 0 (0.0%) | 0.0 |
| Total | 45 (100.0%) | 23.0 |
Fertility by Education by Marriage Status in Navasota
| Educational Attainment | Married | Unmarried |
| Less than High School | 0 (0.0%) | 0 (0.0%) |
| High School Diploma | 0 (0.0%) | 0 (0.0%) |
| College or Associate's Degree | 45 (100.0%) | 0 (0.0%) |
| Bachelor's Degree | 0 (0.0%) | 0 (0.0%) |
| Graduate Degree | 0 (0.0%) | 0 (0.0%) |
| Total | 45 (100.0%) | 0 (0.0%) |
Employment Characteristics in Navasota
Employment by Class of Employer in Navasota
Among the 3,371 employed individuals in Navasota, private company employees (2,311 | 68.6%), state government employees (343 | 10.2%), and self-employed (not incorporated) (300 | 8.9%) make up the most common classes of employment.
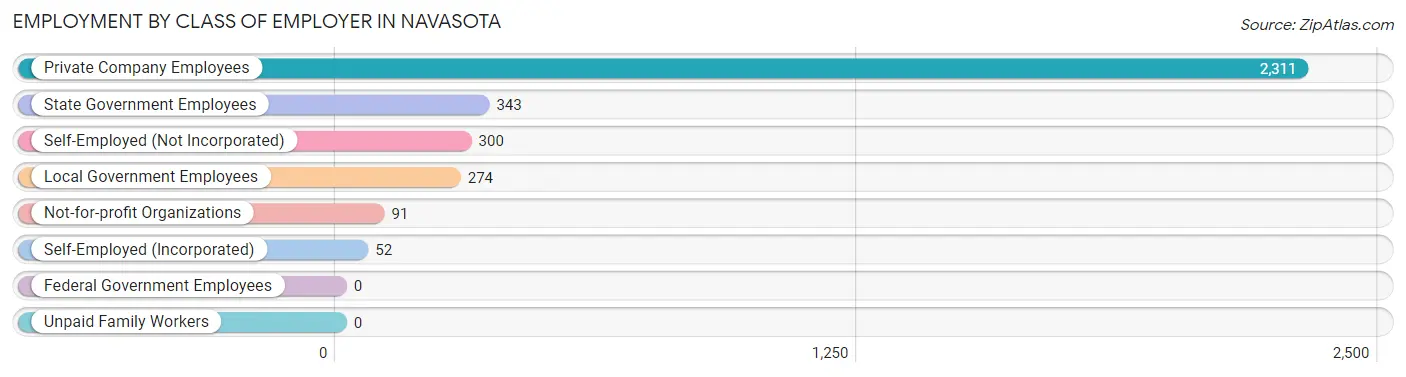
| Employer Class | # Employees | % Employees |
| Private Company Employees | 2,311 | 68.6% |
| Self-Employed (Incorporated) | 52 | 1.5% |
| Self-Employed (Not Incorporated) | 300 | 8.9% |
| Not-for-profit Organizations | 91 | 2.7% |
| Local Government Employees | 274 | 8.1% |
| State Government Employees | 343 | 10.2% |
| Federal Government Employees | 0 | 0.0% |
| Unpaid Family Workers | 0 | 0.0% |
| Total | 3,371 | 100.0% |
Employment Status by Age in Navasota
According to the labor force statistics for Navasota, out of the total population over 16 years of age (5,573), 68.1% or 3,795 individuals are in the labor force, with 8.5% or 323 of them unemployed. The age group with the highest labor force participation rate is 25 to 29 years, with 97.6% or 415 individuals in the labor force. Within the labor force, the 16 to 19 years age range has the highest percentage of unemployed individuals, with 38.6% or 91 of them being unemployed.
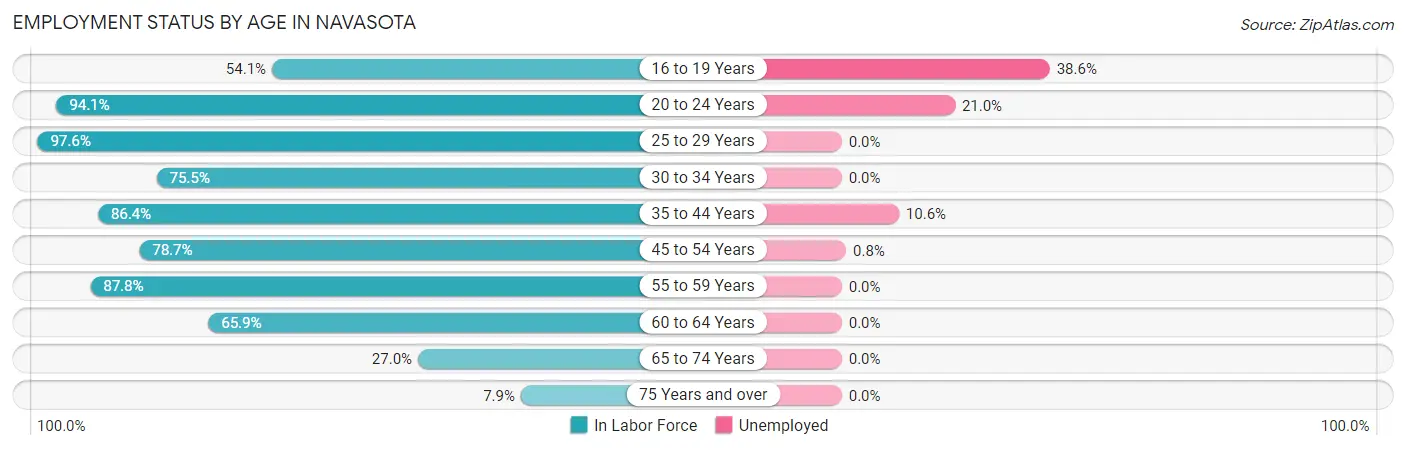
| Age Bracket | In Labor Force | Unemployed |
| 16 to 19 Years | 236 (54.1%) | 91 (38.6%) |
| 20 to 24 Years | 653 (94.1%) | 137 (21.0%) |
| 25 to 29 Years | 415 (97.6%) | 0 (0.0%) |
| 30 to 34 Years | 271 (75.5%) | 0 (0.0%) |
| 35 to 44 Years | 829 (86.4%) | 88 (10.6%) |
| 45 to 54 Years | 762 (78.7%) | 6 (0.8%) |
| 55 to 59 Years | 237 (87.8%) | 0 (0.0%) |
| 60 to 64 Years | 172 (65.9%) | 0 (0.0%) |
| 65 to 74 Years | 177 (27.0%) | 0 (0.0%) |
| 75 Years and over | 43 (7.9%) | 0 (0.0%) |
| Total | 3,795 (68.1%) | 323 (8.5%) |
Employment Status by Educational Attainment in Navasota
According to labor force statistics for Navasota, 82.9% of individuals (2,688) out of the total population between 25 and 64 years of age (3,242) are in the labor force, with 3.5% or 94 of them being unemployed. The group with the highest labor force participation rate are those with the educational attainment of bachelor's degree or higher, with 95.5% or 504 individuals in the labor force. Within the labor force, individuals with college / associate degree education have the highest percentage of unemployment, with 7.1% or 54 of them being unemployed.
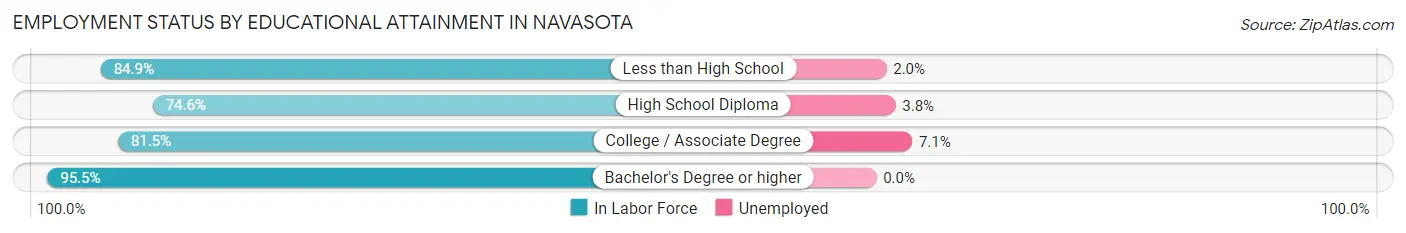
| Educational Attainment | In Labor Force | Unemployed |
| Less than High School | 765 (84.9%) | 18 (2.0%) |
| High School Diploma | 659 (74.6%) | 34 (3.8%) |
| College / Associate Degree | 758 (81.5%) | 66 (7.1%) |
| Bachelor's Degree or higher | 504 (95.5%) | 0 (0.0%) |
| Total | 2,688 (82.9%) | 113 (3.5%) |
Employment Occupations by Sex in Navasota
Management, Business, Science and Arts Occupations
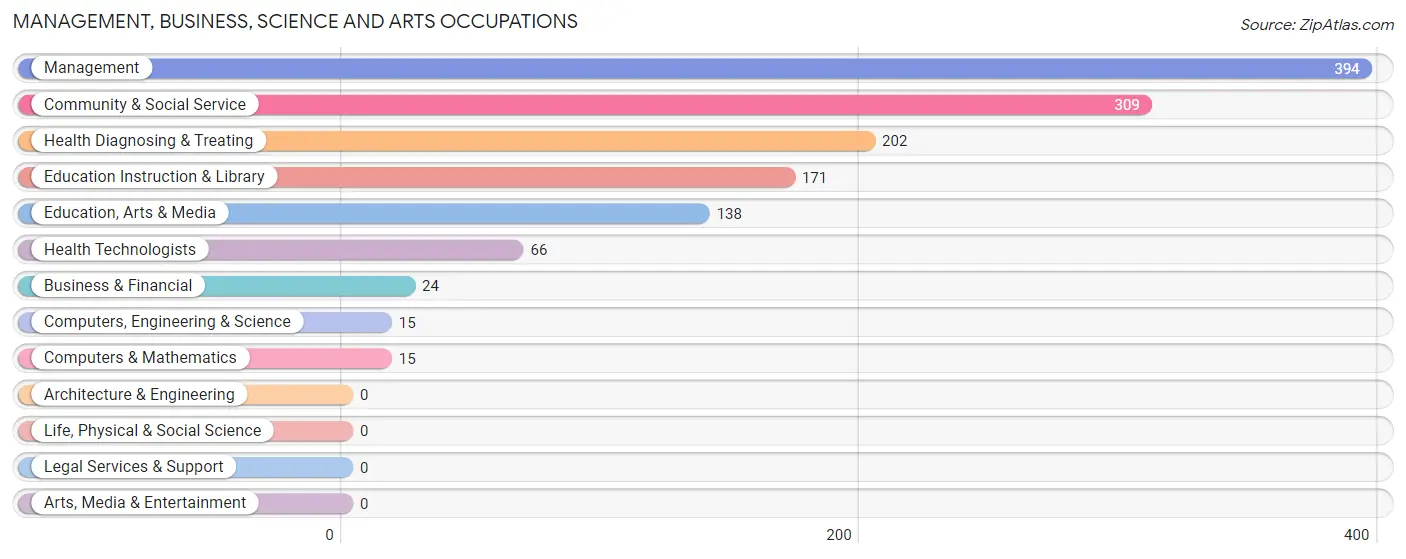
The most common Management, Business, Science and Arts occupations in Navasota are Management (394 | 11.3%), Community & Social Service (309 | 8.9%), Health Diagnosing & Treating (202 | 5.8%), Education Instruction & Library (171 | 4.9%), and Education, Arts & Media (138 | 4.0%).
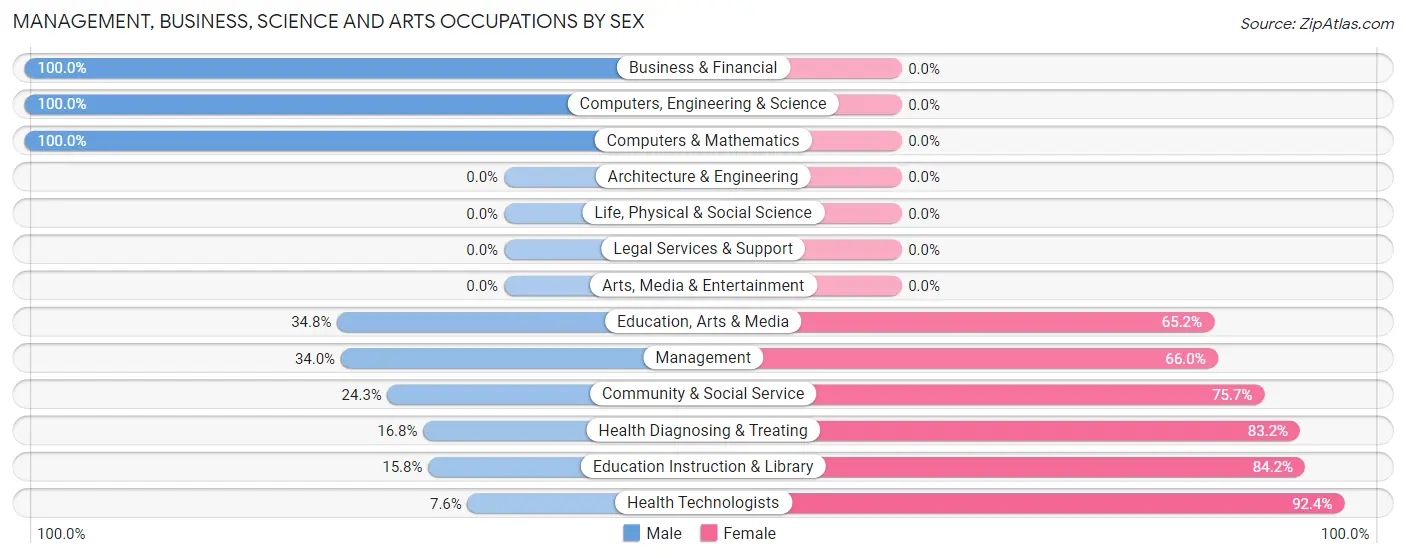
Management, Business, Science and Arts Occupations by Sex
Within the Management, Business, Science and Arts occupations in Navasota, the most male-oriented occupations are Business & Financial (100.0%), Computers, Engineering & Science (100.0%), and Computers & Mathematics (100.0%), while the most female-oriented occupations are Health Technologists (92.4%), Education Instruction & Library (84.2%), and Health Diagnosing & Treating (83.2%).
| Occupation | Male | Female |
| Management | 134 (34.0%) | 260 (66.0%) |
| Business & Financial | 24 (100.0%) | 0 (0.0%) |
| Computers, Engineering & Science | 15 (100.0%) | 0 (0.0%) |
| Computers & Mathematics | 15 (100.0%) | 0 (0.0%) |
| Architecture & Engineering | 0 (0.0%) | 0 (0.0%) |
| Life, Physical & Social Science | 0 (0.0%) | 0 (0.0%) |
| Community & Social Service | 75 (24.3%) | 234 (75.7%) |
| Education, Arts & Media | 48 (34.8%) | 90 (65.2%) |
| Legal Services & Support | 0 (0.0%) | 0 (0.0%) |
| Education Instruction & Library | 27 (15.8%) | 144 (84.2%) |
| Arts, Media & Entertainment | 0 (0.0%) | 0 (0.0%) |
| Health Diagnosing & Treating | 34 (16.8%) | 168 (83.2%) |
| Health Technologists | 5 (7.6%) | 61 (92.4%) |
| Total (Category) | 282 (29.9%) | 662 (70.1%) |
| Total (Overall) | 1,674 (48.2%) | 1,799 (51.8%) |
Services Occupations
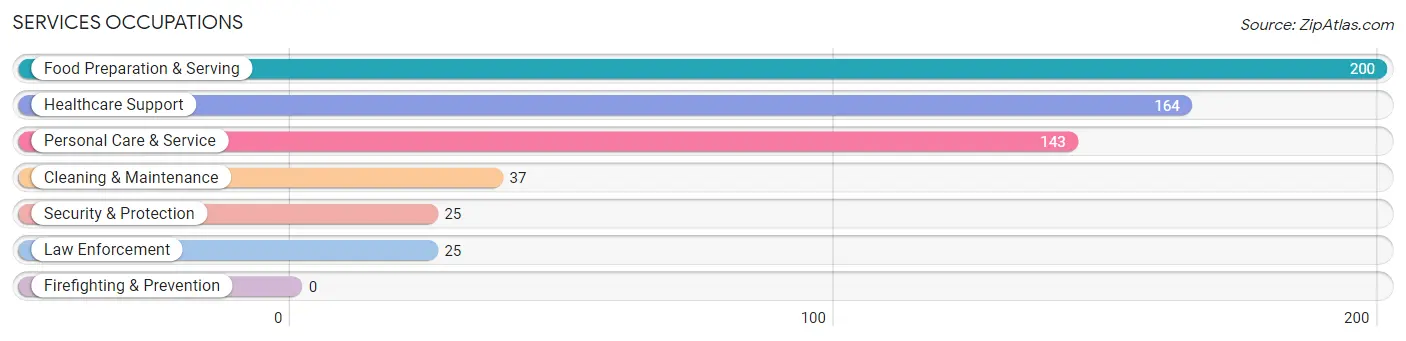
The most common Services occupations in Navasota are Food Preparation & Serving (200 | 5.8%), Healthcare Support (164 | 4.7%), Personal Care & Service (143 | 4.1%), Cleaning & Maintenance (37 | 1.1%), and Security & Protection (25 | 0.7%).
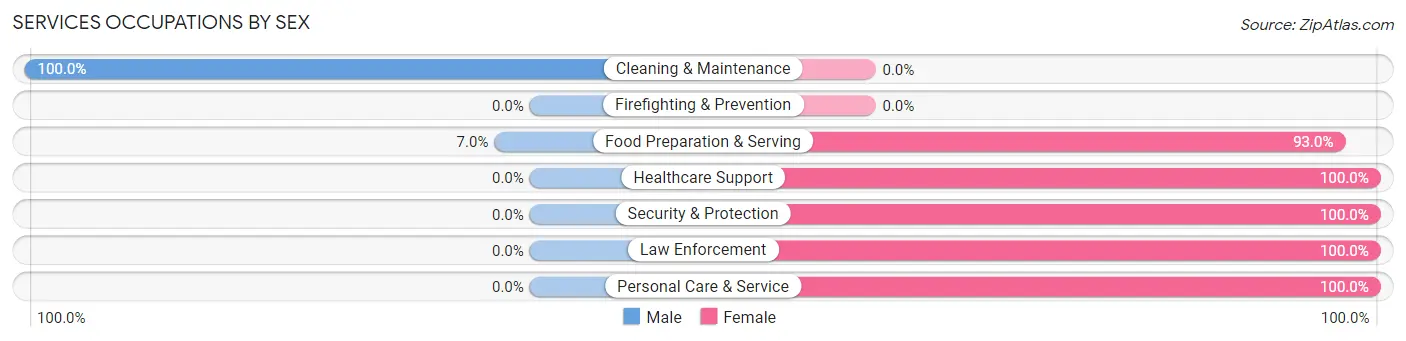
Services Occupations by Sex
Within the Services occupations in Navasota, the most male-oriented occupations are Cleaning & Maintenance (100.0%), and Food Preparation & Serving (7.0%), while the most female-oriented occupations are Healthcare Support (100.0%), Security & Protection (100.0%), and Law Enforcement (100.0%).
| Occupation | Male | Female |
| Healthcare Support | 0 (0.0%) | 164 (100.0%) |
| Security & Protection | 0 (0.0%) | 25 (100.0%) |
| Firefighting & Prevention | 0 (0.0%) | 0 (0.0%) |
| Law Enforcement | 0 (0.0%) | 25 (100.0%) |
| Food Preparation & Serving | 14 (7.0%) | 186 (93.0%) |
| Cleaning & Maintenance | 37 (100.0%) | 0 (0.0%) |
| Personal Care & Service | 0 (0.0%) | 143 (100.0%) |
| Total (Category) | 51 (9.0%) | 518 (91.0%) |
| Total (Overall) | 1,674 (48.2%) | 1,799 (51.8%) |
Sales and Office Occupations
The most common Sales and Office occupations in Navasota are Sales & Related (469 | 13.5%), and Office & Administration (276 | 8.0%).
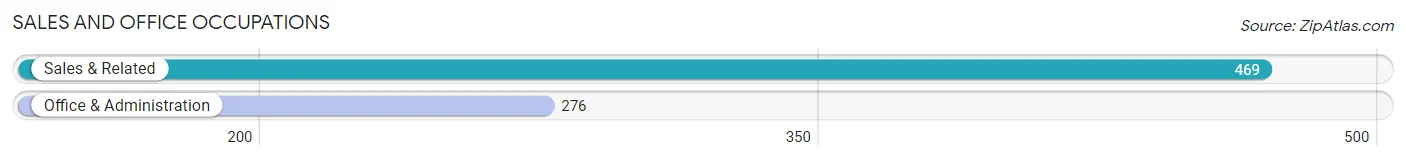
Sales and Office Occupations by Sex

| Occupation | Male | Female |
| Sales & Related | 125 (26.7%) | 344 (73.4%) |
| Office & Administration | 34 (12.3%) | 242 (87.7%) |
| Total (Category) | 159 (21.3%) | 586 (78.7%) |
| Total (Overall) | 1,674 (48.2%) | 1,799 (51.8%) |
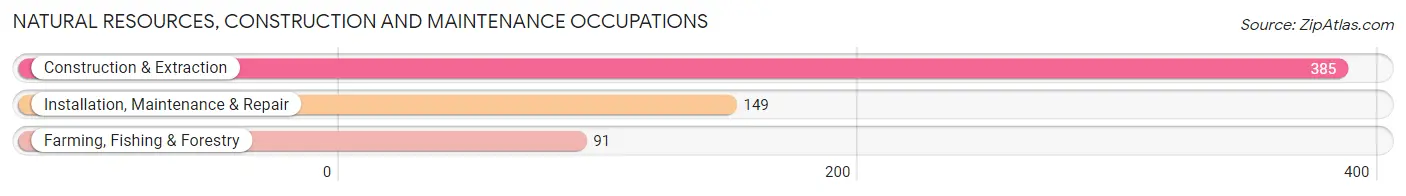
Natural Resources, Construction and Maintenance Occupations
The most common Natural Resources, Construction and Maintenance occupations in Navasota are Construction & Extraction (385 | 11.1%), Installation, Maintenance & Repair (149 | 4.3%), and Farming, Fishing & Forestry (91 | 2.6%).
Natural Resources, Construction and Maintenance Occupations by Sex
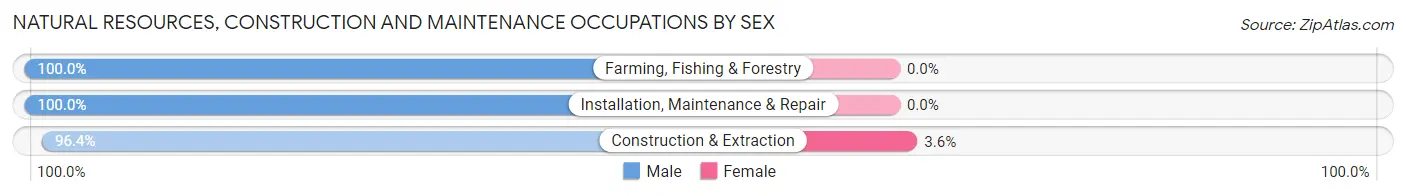
| Occupation | Male | Female |
| Farming, Fishing & Forestry | 91 (100.0%) | 0 (0.0%) |
| Construction & Extraction | 371 (96.4%) | 14 (3.6%) |
| Installation, Maintenance & Repair | 149 (100.0%) | 0 (0.0%) |
| Total (Category) | 611 (97.8%) | 14 (2.2%) |
| Total (Overall) | 1,674 (48.2%) | 1,799 (51.8%) |
Production, Transportation and Moving Occupations
The most common Production, Transportation and Moving occupations in Navasota are Production (383 | 11.0%), Material Moving (112 | 3.2%), and Transportation (95 | 2.7%).
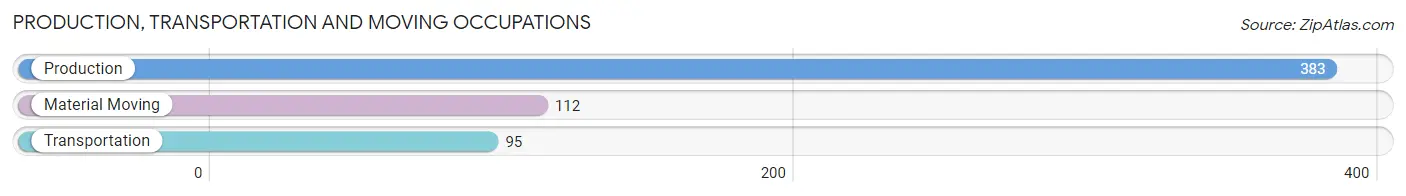
Production, Transportation and Moving Occupations by Sex
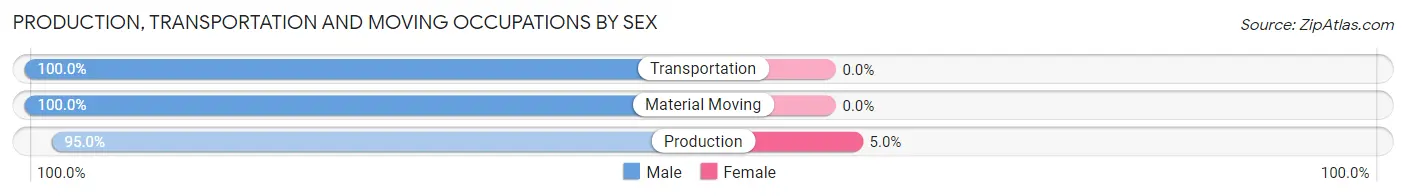
| Occupation | Male | Female |
| Production | 364 (95.0%) | 19 (5.0%) |
| Transportation | 95 (100.0%) | 0 (0.0%) |
| Material Moving | 112 (100.0%) | 0 (0.0%) |
| Total (Category) | 571 (96.8%) | 19 (3.2%) |
| Total (Overall) | 1,674 (48.2%) | 1,799 (51.8%) |
Employment Industries by Sex in Navasota
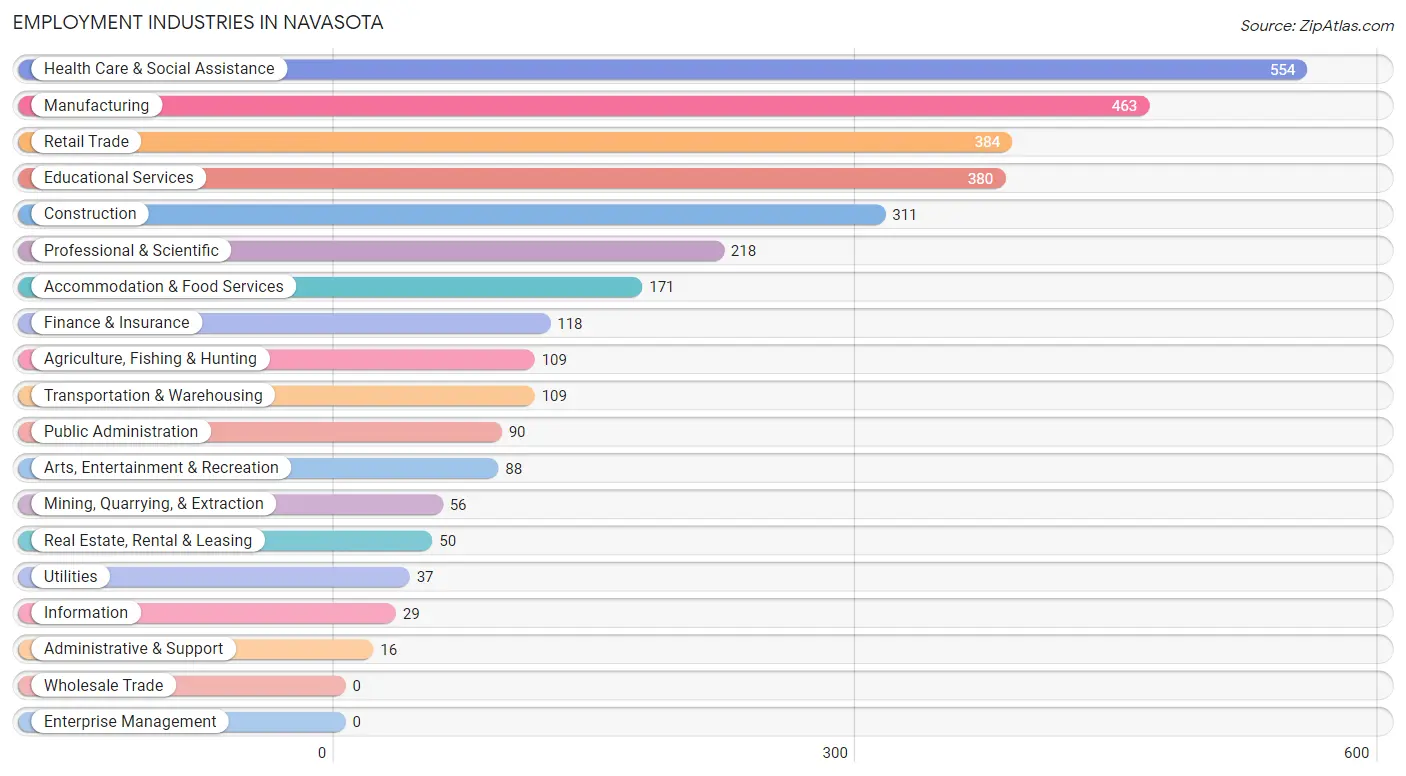
Employment Industries in Navasota
The major employment industries in Navasota include Health Care & Social Assistance (554 | 16.0%), Manufacturing (463 | 13.3%), Retail Trade (384 | 11.1%), Educational Services (380 | 10.9%), and Construction (311 | 8.9%).
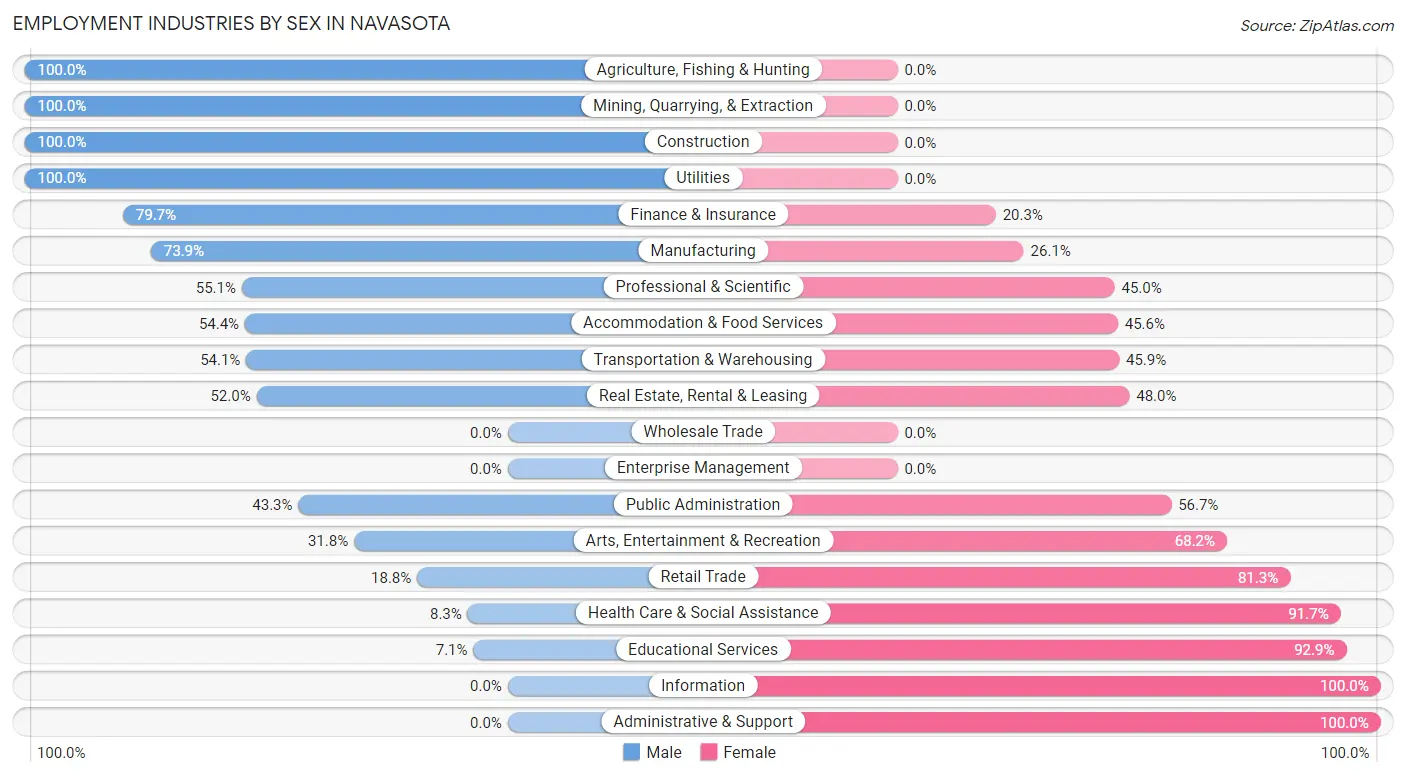
Employment Industries by Sex in Navasota
The Navasota industries that see more men than women are Agriculture, Fishing & Hunting (100.0%), Mining, Quarrying, & Extraction (100.0%), and Construction (100.0%), whereas the industries that tend to have a higher number of women are Information (100.0%), Administrative & Support (100.0%), and Educational Services (92.9%).
| Industry | Male | Female |
| Agriculture, Fishing & Hunting | 109 (100.0%) | 0 (0.0%) |
| Mining, Quarrying, & Extraction | 56 (100.0%) | 0 (0.0%) |
| Construction | 311 (100.0%) | 0 (0.0%) |
| Manufacturing | 342 (73.9%) | 121 (26.1%) |
| Wholesale Trade | 0 (0.0%) | 0 (0.0%) |
| Retail Trade | 72 (18.8%) | 312 (81.2%) |
| Transportation & Warehousing | 59 (54.1%) | 50 (45.9%) |
| Utilities | 37 (100.0%) | 0 (0.0%) |
| Information | 0 (0.0%) | 29 (100.0%) |
| Finance & Insurance | 94 (79.7%) | 24 (20.3%) |
| Real Estate, Rental & Leasing | 26 (52.0%) | 24 (48.0%) |
| Professional & Scientific | 120 (55.0%) | 98 (45.0%) |
| Enterprise Management | 0 (0.0%) | 0 (0.0%) |
| Administrative & Support | 0 (0.0%) | 16 (100.0%) |
| Educational Services | 27 (7.1%) | 353 (92.9%) |
| Health Care & Social Assistance | 46 (8.3%) | 508 (91.7%) |
| Arts, Entertainment & Recreation | 28 (31.8%) | 60 (68.2%) |
| Accommodation & Food Services | 93 (54.4%) | 78 (45.6%) |
| Public Administration | 39 (43.3%) | 51 (56.7%) |
| Total | 1,674 (48.2%) | 1,799 (51.8%) |
Education in Navasota
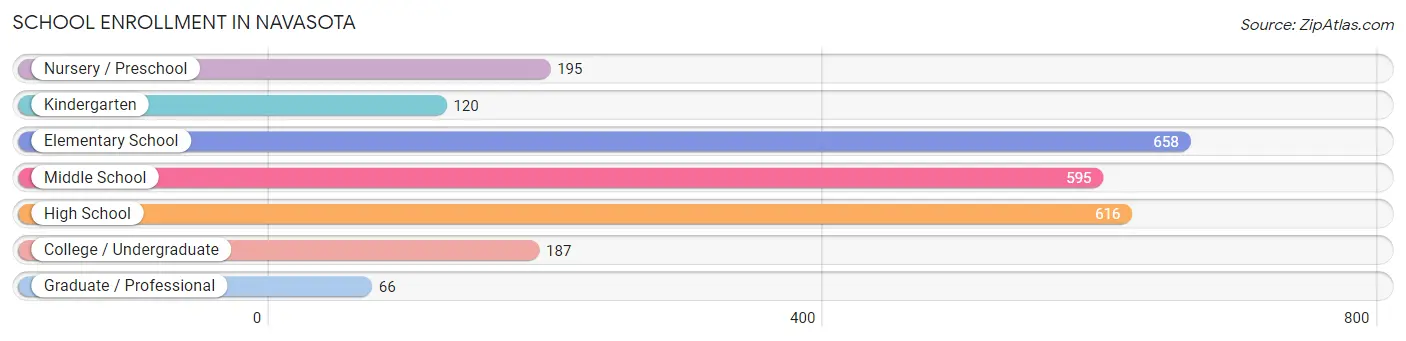
School Enrollment in Navasota
The most common levels of schooling among the 2,437 students in Navasota are elementary school (658 | 27.0%), high school (616 | 25.3%), and middle school (595 | 24.4%).
| School Level | # Students | % Students |
| Nursery / Preschool | 195 | 8.0% |
| Kindergarten | 120 | 4.9% |
| Elementary School | 658 | 27.0% |
| Middle School | 595 | 24.4% |
| High School | 616 | 25.3% |
| College / Undergraduate | 187 | 7.7% |
| Graduate / Professional | 66 | 2.7% |
| Total | 2,437 | 100.0% |
School Enrollment by Age by Funding Source in Navasota
Out of a total of 2,437 students who are enrolled in schools in Navasota, 224 (9.2%) attend a private institution, while the remaining 2,213 (90.8%) are enrolled in public schools. The age group of 18 to 19 year olds has the highest likelihood of being enrolled in private schools, with 91 (34.2% in the age bracket) enrolled. Conversely, the age group of 20 to 24 year olds has the lowest likelihood of being enrolled in a private school, with 50 (100.0% in the age bracket) attending a public institution.
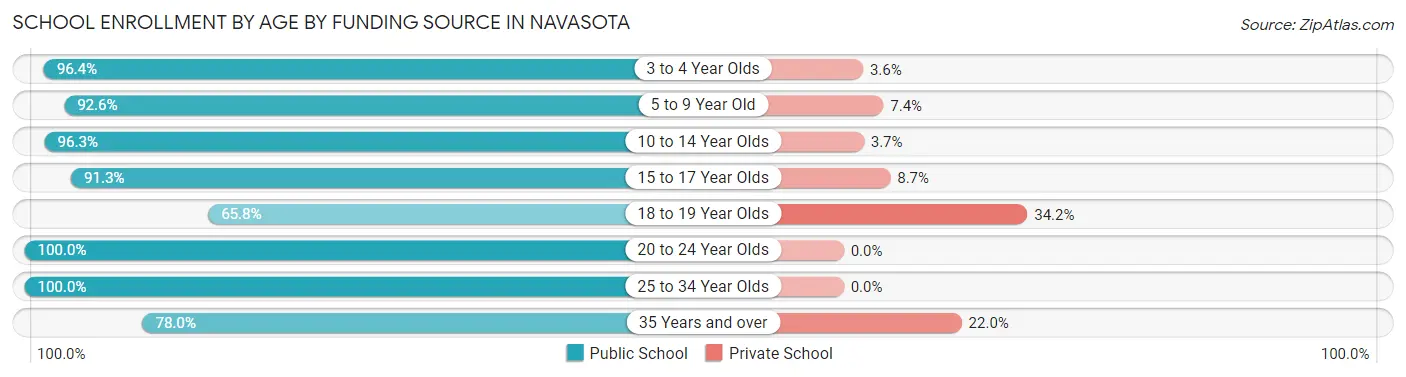
| Age Bracket | Public School | Private School |
| 3 to 4 Year Olds | 188 (96.4%) | 7 (3.6%) |
| 5 to 9 Year Old | 526 (92.6%) | 42 (7.4%) |
| 10 to 14 Year Olds | 798 (96.3%) | 31 (3.7%) |
| 15 to 17 Year Olds | 347 (91.3%) | 33 (8.7%) |
| 18 to 19 Year Olds | 175 (65.8%) | 91 (34.2%) |
| 20 to 24 Year Olds | 50 (100.0%) | 0 (0.0%) |
| 25 to 34 Year Olds | 58 (100.0%) | 0 (0.0%) |
| 35 Years and over | 71 (78.0%) | 20 (22.0%) |
| Total | 2,213 (90.8%) | 224 (9.2%) |
Educational Attainment by Field of Study in Navasota
Education (158 | 22.2%), business (122 | 17.1%), arts & humanities (87 | 12.2%), social sciences (68 | 9.6%), and engineering (61 | 8.6%) are the most common fields of study among 712 individuals in Navasota who have obtained a bachelor's degree or higher.
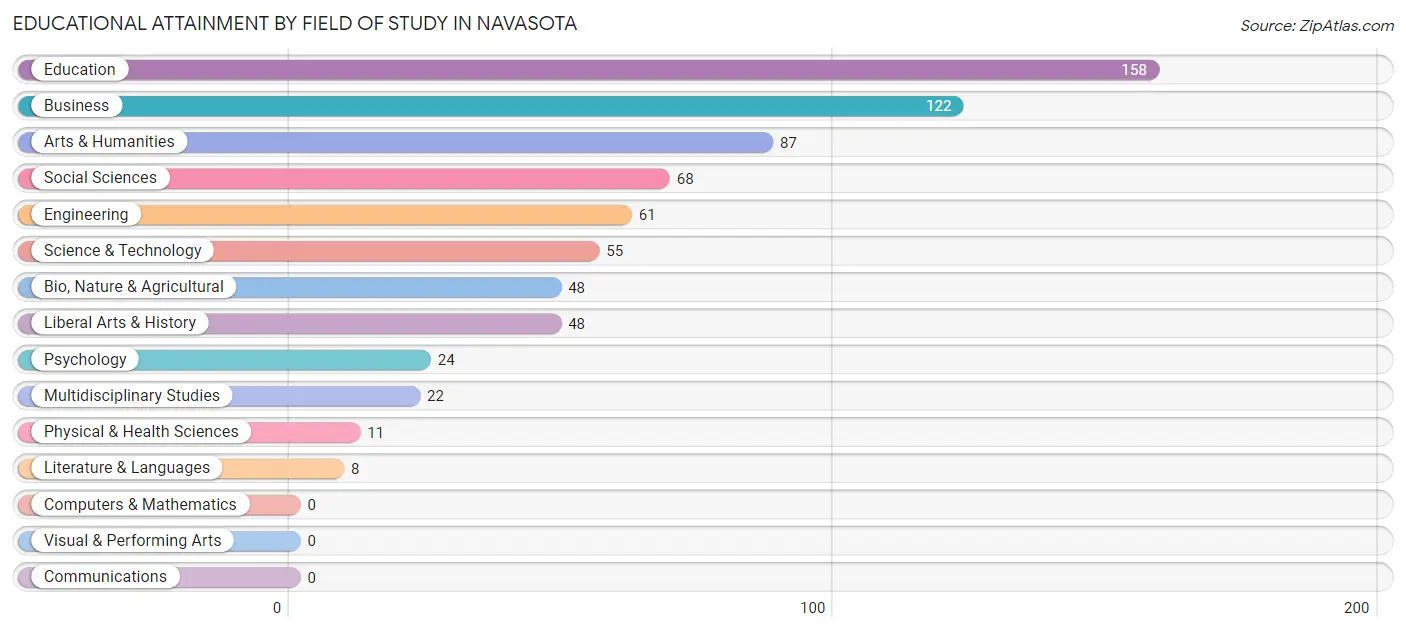
| Field of Study | # Graduates | % Graduates |
| Computers & Mathematics | 0 | 0.0% |
| Bio, Nature & Agricultural | 48 | 6.7% |
| Physical & Health Sciences | 11 | 1.5% |
| Psychology | 24 | 3.4% |
| Social Sciences | 68 | 9.6% |
| Engineering | 61 | 8.6% |
| Multidisciplinary Studies | 22 | 3.1% |
| Science & Technology | 55 | 7.7% |
| Business | 122 | 17.1% |
| Education | 158 | 22.2% |
| Literature & Languages | 8 | 1.1% |
| Liberal Arts & History | 48 | 6.7% |
| Visual & Performing Arts | 0 | 0.0% |
| Communications | 0 | 0.0% |
| Arts & Humanities | 87 | 12.2% |
| Total | 712 | 100.0% |
Transportation & Commute in Navasota
Vehicle Availability by Sex in Navasota
The most prevalent vehicle ownership categories in Navasota are males with 2 vehicles (762, accounting for 46.1%) and females with 2 vehicles (738, making up 44.4%).
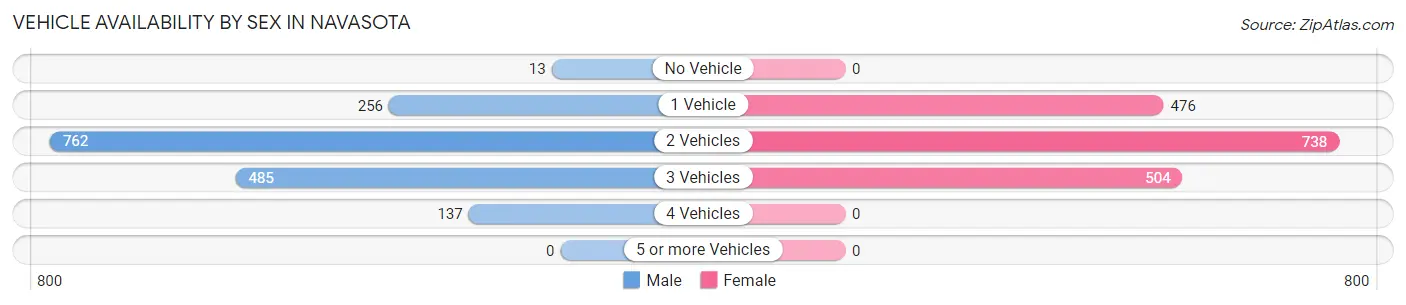
| Vehicles Available | Male | Female |
| No Vehicle | 13 (0.8%) | 0 (0.0%) |
| 1 Vehicle | 256 (15.5%) | 476 (27.7%) |
| 2 Vehicles | 762 (46.1%) | 738 (43.0%) |
| 3 Vehicles | 485 (29.3%) | 504 (29.3%) |
| 4 Vehicles | 137 (8.3%) | 0 (0.0%) |
| 5 or more Vehicles | 0 (0.0%) | 0 (0.0%) |
| Total | 1,653 (100.0%) | 1,718 (100.0%) |
Commute Time in Navasota
The most frequently occuring commute durations in Navasota are 5 to 9 minutes (694 commuters, 21.2%), 30 to 34 minutes (559 commuters, 17.1%), and 10 to 14 minutes (507 commuters, 15.5%).
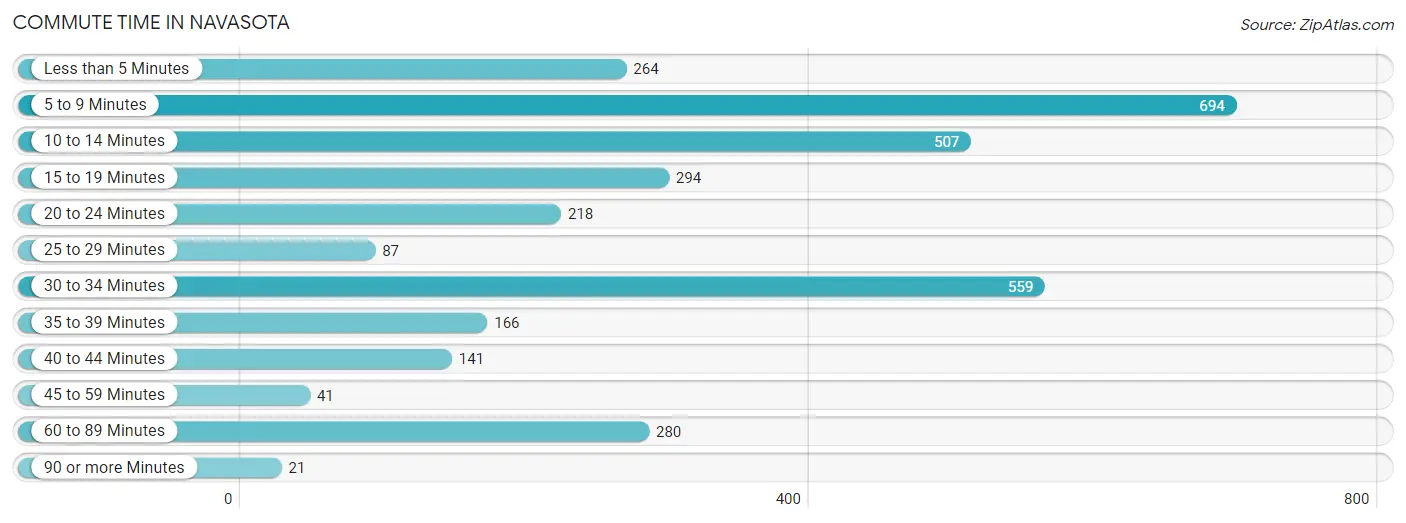
| Commute Time | # Commuters | % Commuters |
| Less than 5 Minutes | 264 | 8.1% |
| 5 to 9 Minutes | 694 | 21.2% |
| 10 to 14 Minutes | 507 | 15.5% |
| 15 to 19 Minutes | 294 | 9.0% |
| 20 to 24 Minutes | 218 | 6.7% |
| 25 to 29 Minutes | 87 | 2.7% |
| 30 to 34 Minutes | 559 | 17.1% |
| 35 to 39 Minutes | 166 | 5.1% |
| 40 to 44 Minutes | 141 | 4.3% |
| 45 to 59 Minutes | 41 | 1.3% |
| 60 to 89 Minutes | 280 | 8.6% |
| 90 or more Minutes | 21 | 0.6% |
Commute Time by Sex in Navasota
The most common commute times in Navasota are 30 to 34 minutes (305 commuters, 19.2%) for males and 5 to 9 minutes (405 commuters, 24.1%) for females.
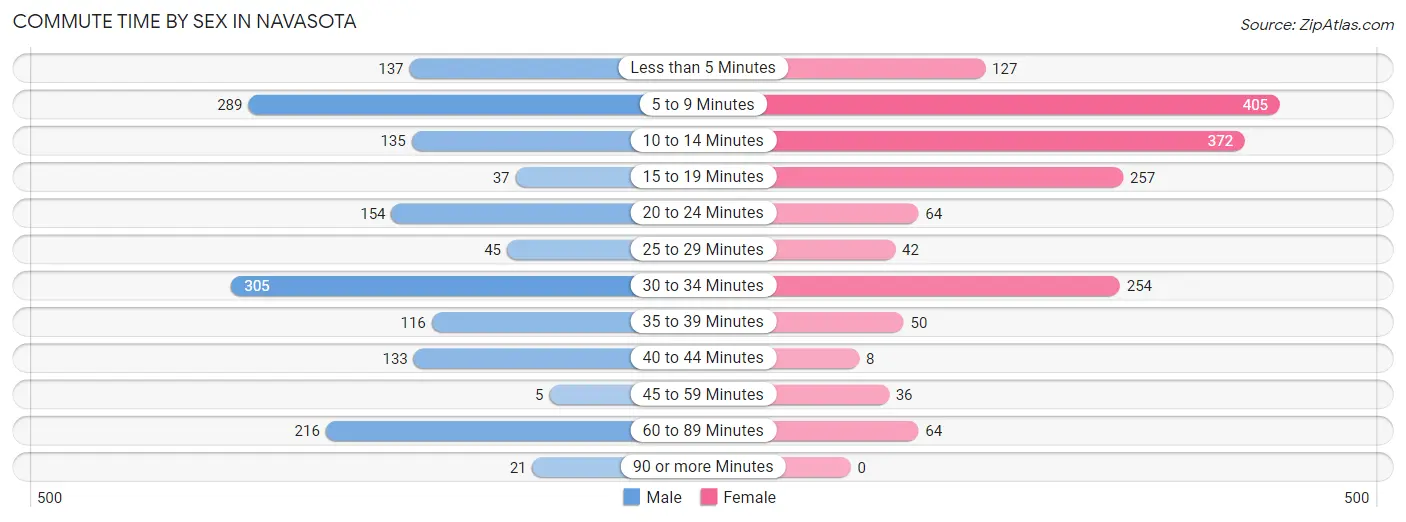
| Commute Time | Male | Female |
| Less than 5 Minutes | 137 (8.6%) | 127 (7.6%) |
| 5 to 9 Minutes | 289 (18.1%) | 405 (24.1%) |
| 10 to 14 Minutes | 135 (8.5%) | 372 (22.2%) |
| 15 to 19 Minutes | 37 (2.3%) | 257 (15.3%) |
| 20 to 24 Minutes | 154 (9.7%) | 64 (3.8%) |
| 25 to 29 Minutes | 45 (2.8%) | 42 (2.5%) |
| 30 to 34 Minutes | 305 (19.2%) | 254 (15.1%) |
| 35 to 39 Minutes | 116 (7.3%) | 50 (3.0%) |
| 40 to 44 Minutes | 133 (8.4%) | 8 (0.5%) |
| 45 to 59 Minutes | 5 (0.3%) | 36 (2.1%) |
| 60 to 89 Minutes | 216 (13.6%) | 64 (3.8%) |
| 90 or more Minutes | 21 (1.3%) | 0 (0.0%) |
Time of Departure to Work by Sex in Navasota
The most frequent times of departure to work in Navasota are 6:00 AM to 6:29 AM (346, 21.7%) for males and 7:00 AM to 7:29 AM (502, 29.9%) for females.
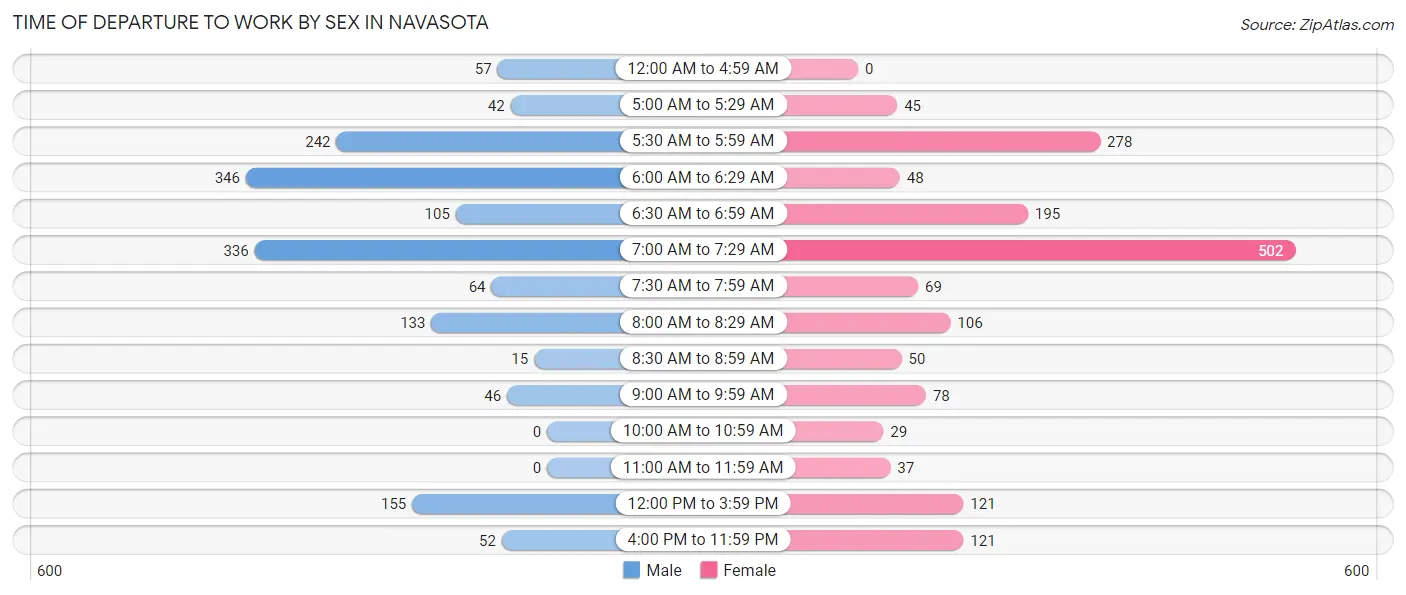
| Time of Departure | Male | Female |
| 12:00 AM to 4:59 AM | 57 (3.6%) | 0 (0.0%) |
| 5:00 AM to 5:29 AM | 42 (2.6%) | 45 (2.7%) |
| 5:30 AM to 5:59 AM | 242 (15.2%) | 278 (16.6%) |
| 6:00 AM to 6:29 AM | 346 (21.7%) | 48 (2.9%) |
| 6:30 AM to 6:59 AM | 105 (6.6%) | 195 (11.6%) |
| 7:00 AM to 7:29 AM | 336 (21.1%) | 502 (29.9%) |
| 7:30 AM to 7:59 AM | 64 (4.0%) | 69 (4.1%) |
| 8:00 AM to 8:29 AM | 133 (8.4%) | 106 (6.3%) |
| 8:30 AM to 8:59 AM | 15 (0.9%) | 50 (3.0%) |
| 9:00 AM to 9:59 AM | 46 (2.9%) | 78 (4.6%) |
| 10:00 AM to 10:59 AM | 0 (0.0%) | 29 (1.7%) |
| 11:00 AM to 11:59 AM | 0 (0.0%) | 37 (2.2%) |
| 12:00 PM to 3:59 PM | 155 (9.7%) | 121 (7.2%) |
| 4:00 PM to 11:59 PM | 52 (3.3%) | 121 (7.2%) |
| Total | 1,593 (100.0%) | 1,679 (100.0%) |
Housing Occupancy in Navasota
Occupancy by Ownership in Navasota
Of the total 2,789 dwellings in Navasota, owner-occupied units account for 1,747 (62.6%), while renter-occupied units make up 1,042 (37.4%).
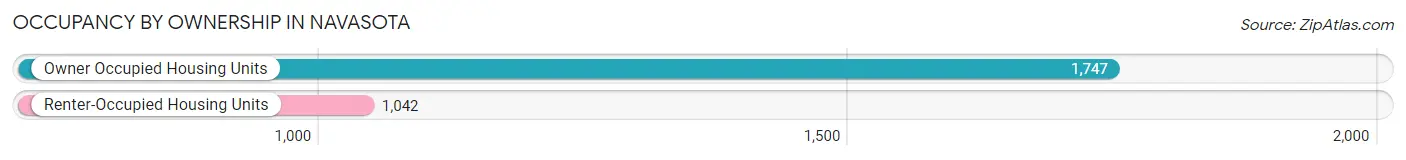
| Occupancy | # Housing Units | % Housing Units |
| Owner Occupied Housing Units | 1,747 | 62.6% |
| Renter-Occupied Housing Units | 1,042 | 37.4% |
| Total Occupied Housing Units | 2,789 | 100.0% |
Occupancy by Household Size in Navasota
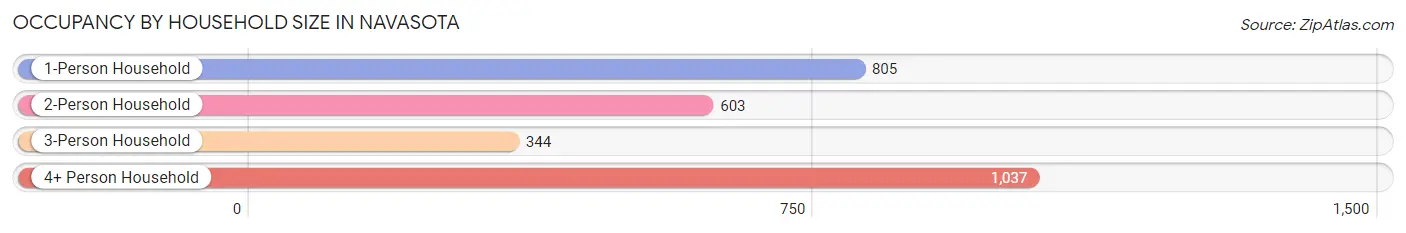
| Household Size | # Housing Units | % Housing Units |
| 1-Person Household | 805 | 28.9% |
| 2-Person Household | 603 | 21.6% |
| 3-Person Household | 344 | 12.3% |
| 4+ Person Household | 1,037 | 37.2% |
| Total Housing Units | 2,789 | 100.0% |
Occupancy by Ownership by Household Size in Navasota
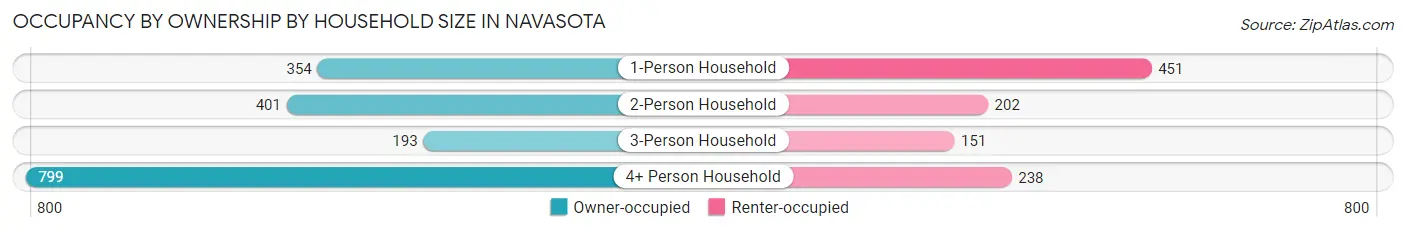
| Household Size | Owner-occupied | Renter-occupied |
| 1-Person Household | 354 (44.0%) | 451 (56.0%) |
| 2-Person Household | 401 (66.5%) | 202 (33.5%) |
| 3-Person Household | 193 (56.1%) | 151 (43.9%) |
| 4+ Person Household | 799 (77.0%) | 238 (23.0%) |
| Total Housing Units | 1,747 (62.6%) | 1,042 (37.4%) |
Occupancy by Educational Attainment in Navasota
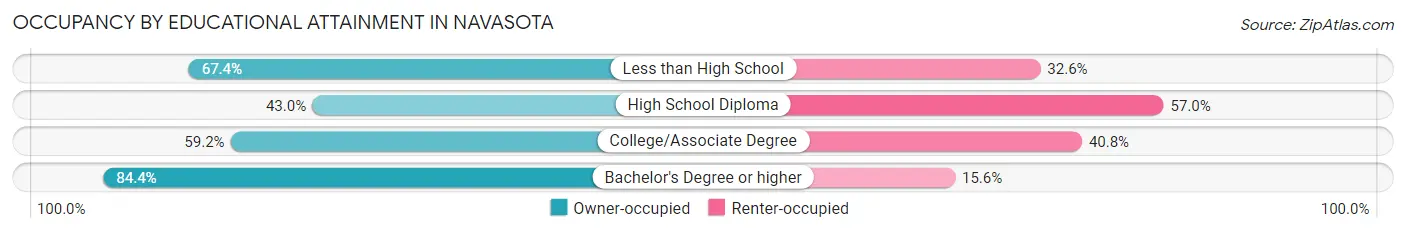
| Household Size | Owner-occupied | Renter-occupied |
| Less than High School | 582 (67.4%) | 281 (32.6%) |
| High School Diploma | 268 (43.0%) | 355 (57.0%) |
| College/Associate Degree | 476 (59.2%) | 328 (40.8%) |
| Bachelor's Degree or higher | 421 (84.4%) | 78 (15.6%) |
Occupancy by Age of Householder in Navasota
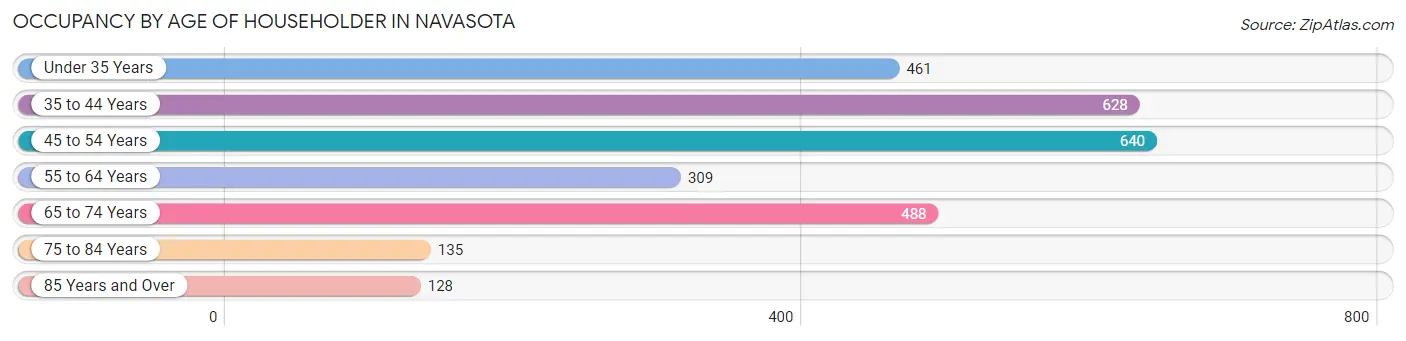
| Age Bracket | # Households | % Households |
| Under 35 Years | 461 | 16.5% |
| 35 to 44 Years | 628 | 22.5% |
| 45 to 54 Years | 640 | 23.0% |
| 55 to 64 Years | 309 | 11.1% |
| 65 to 74 Years | 488 | 17.5% |
| 75 to 84 Years | 135 | 4.8% |
| 85 Years and Over | 128 | 4.6% |
| Total | 2,789 | 100.0% |
Housing Finances in Navasota
Median Income by Occupancy in Navasota
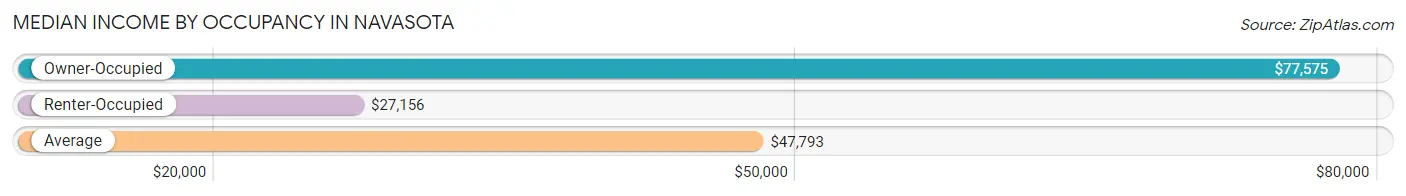
| Occupancy Type | # Households | Median Income |
| Owner-Occupied | 1,747 (62.6%) | $77,575 |
| Renter-Occupied | 1,042 (37.4%) | $27,156 |
| Average | 2,789 (100.0%) | $47,793 |
Occupancy by Householder Income Bracket in Navasota
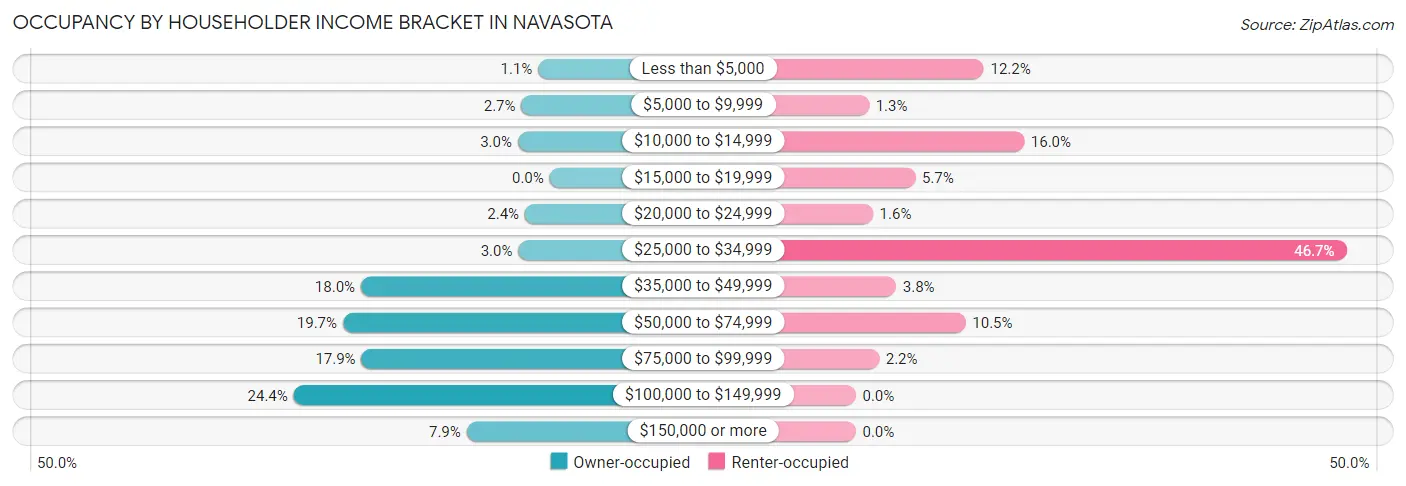
| Income Bracket | Owner-occupied | Renter-occupied |
| Less than $5,000 | 19 (1.1%) | 127 (12.2%) |
| $5,000 to $9,999 | 47 (2.7%) | 13 (1.3%) |
| $10,000 to $14,999 | 53 (3.0%) | 167 (16.0%) |
| $15,000 to $19,999 | 0 (0.0%) | 59 (5.7%) |
| $20,000 to $24,999 | 41 (2.4%) | 17 (1.6%) |
| $25,000 to $34,999 | 52 (3.0%) | 487 (46.7%) |
| $35,000 to $49,999 | 314 (18.0%) | 40 (3.8%) |
| $50,000 to $74,999 | 344 (19.7%) | 109 (10.5%) |
| $75,000 to $99,999 | 313 (17.9%) | 23 (2.2%) |
| $100,000 to $149,999 | 426 (24.4%) | 0 (0.0%) |
| $150,000 or more | 138 (7.9%) | 0 (0.0%) |
| Total | 1,747 (100.0%) | 1,042 (100.0%) |
Monthly Housing Cost Tiers in Navasota
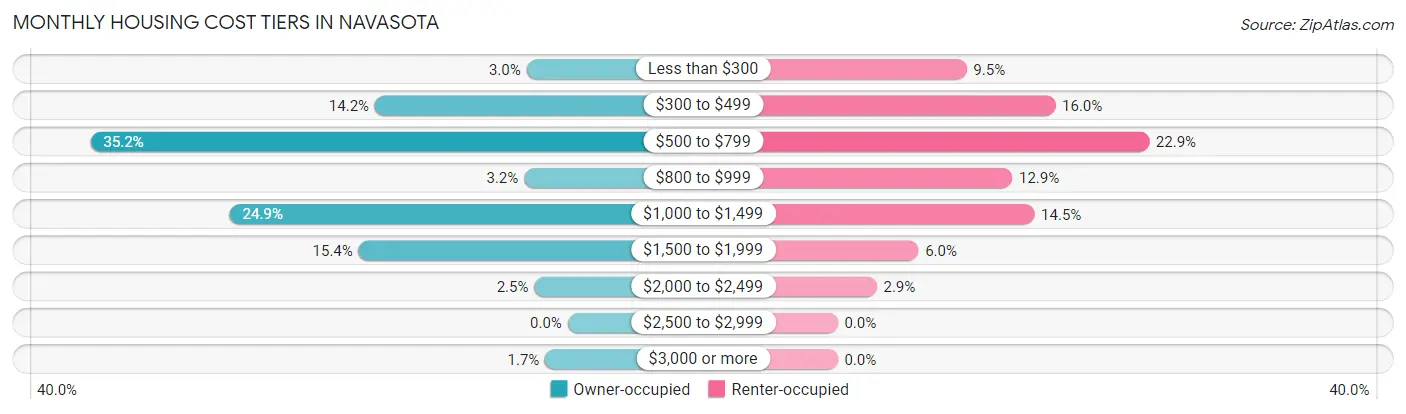
| Monthly Cost | Owner-occupied | Renter-occupied |
| Less than $300 | 53 (3.0%) | 99 (9.5%) |
| $300 to $499 | 248 (14.2%) | 167 (16.0%) |
| $500 to $799 | 614 (35.1%) | 239 (22.9%) |
| $800 to $999 | 56 (3.2%) | 134 (12.9%) |
| $1,000 to $1,499 | 435 (24.9%) | 151 (14.5%) |
| $1,500 to $1,999 | 269 (15.4%) | 62 (5.9%) |
| $2,000 to $2,499 | 43 (2.5%) | 30 (2.9%) |
| $2,500 to $2,999 | 0 (0.0%) | 0 (0.0%) |
| $3,000 or more | 29 (1.7%) | 0 (0.0%) |
| Total | 1,747 (100.0%) | 1,042 (100.0%) |
Physical Housing Characteristics in Navasota
Housing Structures in Navasota
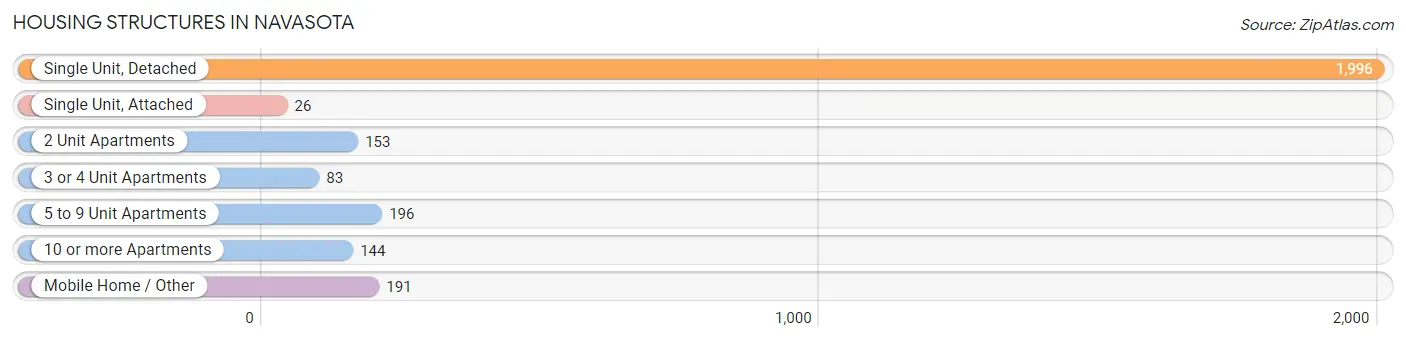
| Structure Type | # Housing Units | % Housing Units |
| Single Unit, Detached | 1,996 | 71.6% |
| Single Unit, Attached | 26 | 0.9% |
| 2 Unit Apartments | 153 | 5.5% |
| 3 or 4 Unit Apartments | 83 | 3.0% |
| 5 to 9 Unit Apartments | 196 | 7.0% |
| 10 or more Apartments | 144 | 5.2% |
| Mobile Home / Other | 191 | 6.9% |
| Total | 2,789 | 100.0% |
Housing Structures by Occupancy in Navasota
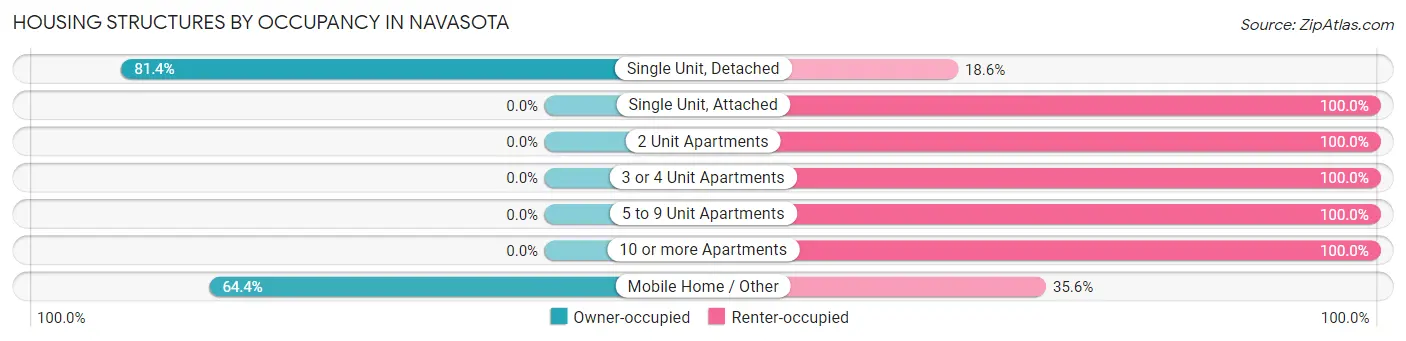
| Structure Type | Owner-occupied | Renter-occupied |
| Single Unit, Detached | 1,624 (81.4%) | 372 (18.6%) |
| Single Unit, Attached | 0 (0.0%) | 26 (100.0%) |
| 2 Unit Apartments | 0 (0.0%) | 153 (100.0%) |
| 3 or 4 Unit Apartments | 0 (0.0%) | 83 (100.0%) |
| 5 to 9 Unit Apartments | 0 (0.0%) | 196 (100.0%) |
| 10 or more Apartments | 0 (0.0%) | 144 (100.0%) |
| Mobile Home / Other | 123 (64.4%) | 68 (35.6%) |
| Total | 1,747 (62.6%) | 1,042 (37.4%) |
Housing Structures by Number of Rooms in Navasota
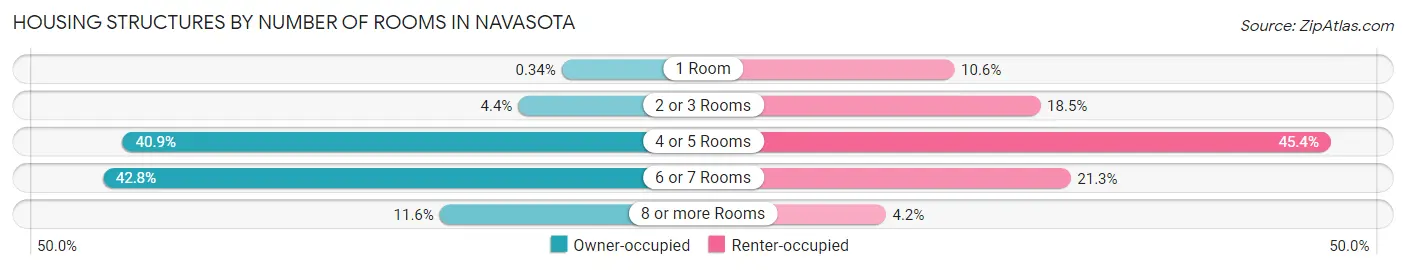
| Number of Rooms | Owner-occupied | Renter-occupied |
| 1 Room | 6 (0.3%) | 110 (10.6%) |
| 2 or 3 Rooms | 76 (4.3%) | 193 (18.5%) |
| 4 or 5 Rooms | 715 (40.9%) | 473 (45.4%) |
| 6 or 7 Rooms | 747 (42.8%) | 222 (21.3%) |
| 8 or more Rooms | 203 (11.6%) | 44 (4.2%) |
| Total | 1,747 (100.0%) | 1,042 (100.0%) |
Housing Structure by Heating Type in Navasota
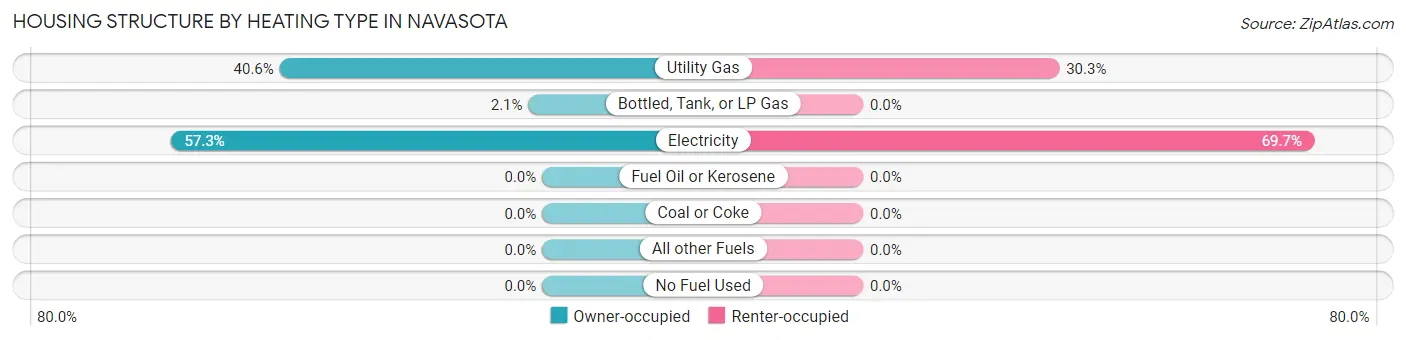
| Heating Type | Owner-occupied | Renter-occupied |
| Utility Gas | 709 (40.6%) | 316 (30.3%) |
| Bottled, Tank, or LP Gas | 37 (2.1%) | 0 (0.0%) |
| Electricity | 1,001 (57.3%) | 726 (69.7%) |
| Fuel Oil or Kerosene | 0 (0.0%) | 0 (0.0%) |
| Coal or Coke | 0 (0.0%) | 0 (0.0%) |
| All other Fuels | 0 (0.0%) | 0 (0.0%) |
| No Fuel Used | 0 (0.0%) | 0 (0.0%) |
| Total | 1,747 (100.0%) | 1,042 (100.0%) |
Household Vehicle Usage in Navasota
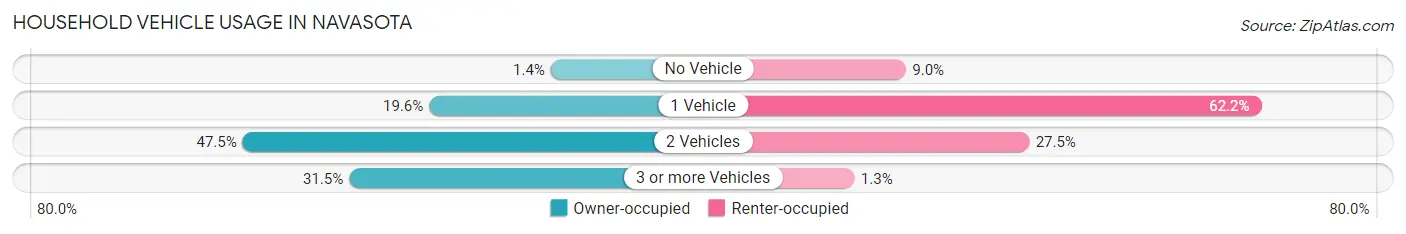
| Vehicles per Household | Owner-occupied | Renter-occupied |
| No Vehicle | 25 (1.4%) | 94 (9.0%) |
| 1 Vehicle | 342 (19.6%) | 648 (62.2%) |
| 2 Vehicles | 829 (47.4%) | 286 (27.5%) |
| 3 or more Vehicles | 551 (31.5%) | 14 (1.3%) |
| Total | 1,747 (100.0%) | 1,042 (100.0%) |
Real Estate & Mortgages in Navasota
Real Estate and Mortgage Overview in Navasota
| Characteristic | Without Mortgage | With Mortgage |
| Housing Units | 950 | 797 |
| Median Property Value | $125,700 | $171,900 |
| Median Household Income | $50,172 | $100 |
| Monthly Housing Costs | $543 | $29 |
| Real Estate Taxes | $2,206 | $48 |
Property Value by Mortgage Status in Navasota
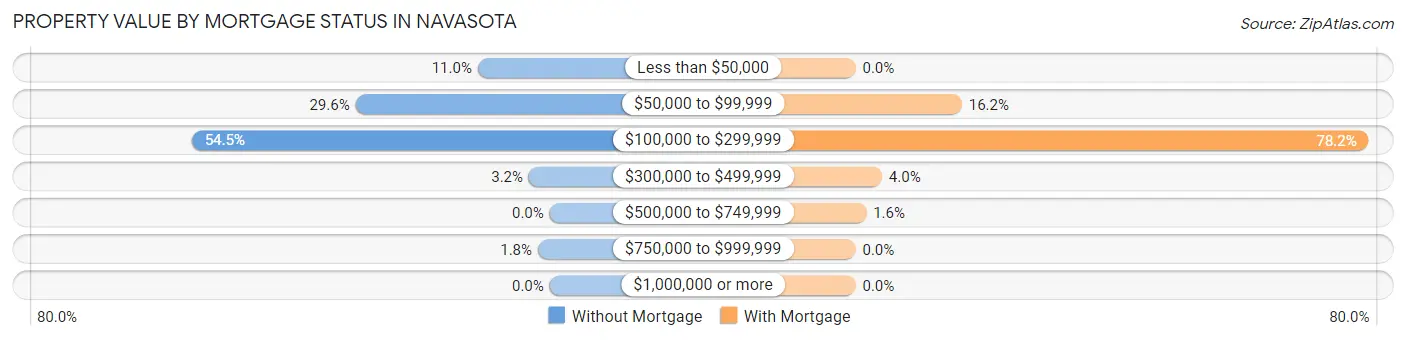
| Property Value | Without Mortgage | With Mortgage |
| Less than $50,000 | 104 (11.0%) | 0 (0.0%) |
| $50,000 to $99,999 | 281 (29.6%) | 129 (16.2%) |
| $100,000 to $299,999 | 518 (54.5%) | 623 (78.2%) |
| $300,000 to $499,999 | 30 (3.2%) | 32 (4.0%) |
| $500,000 to $749,999 | 0 (0.0%) | 13 (1.6%) |
| $750,000 to $999,999 | 17 (1.8%) | 0 (0.0%) |
| $1,000,000 or more | 0 (0.0%) | 0 (0.0%) |
| Total | 950 (100.0%) | 797 (100.0%) |
Household Income by Mortgage Status in Navasota
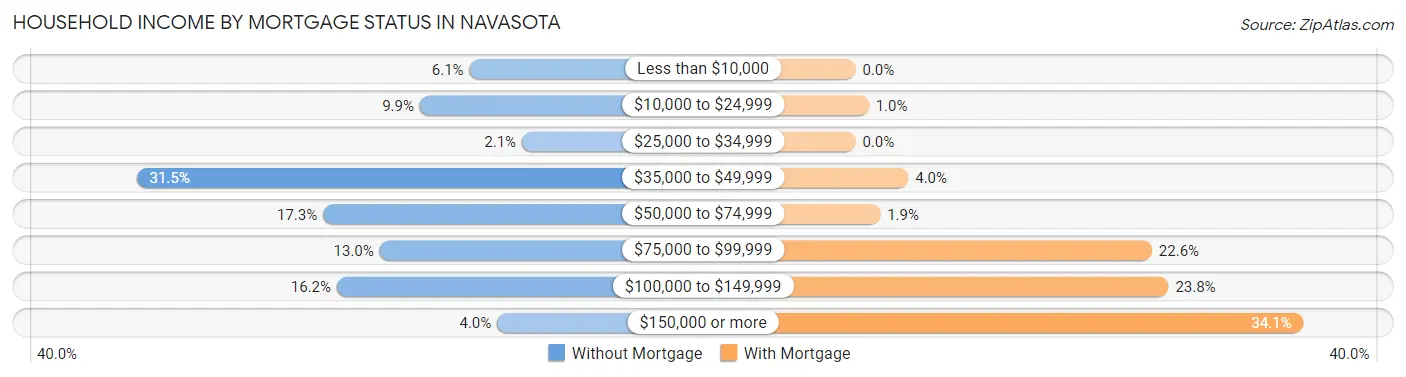
| Household Income | Without Mortgage | With Mortgage |
| Less than $10,000 | 58 (6.1%) | 0 (0.0%) |
| $10,000 to $24,999 | 94 (9.9%) | 8 (1.0%) |
| $25,000 to $34,999 | 20 (2.1%) | 0 (0.0%) |
| $35,000 to $49,999 | 299 (31.5%) | 32 (4.0%) |
| $50,000 to $74,999 | 164 (17.3%) | 15 (1.9%) |
| $75,000 to $99,999 | 123 (13.0%) | 180 (22.6%) |
| $100,000 to $149,999 | 154 (16.2%) | 190 (23.8%) |
| $150,000 or more | 38 (4.0%) | 272 (34.1%) |
| Total | 950 (100.0%) | 797 (100.0%) |
Property Value to Household Income Ratio in Navasota
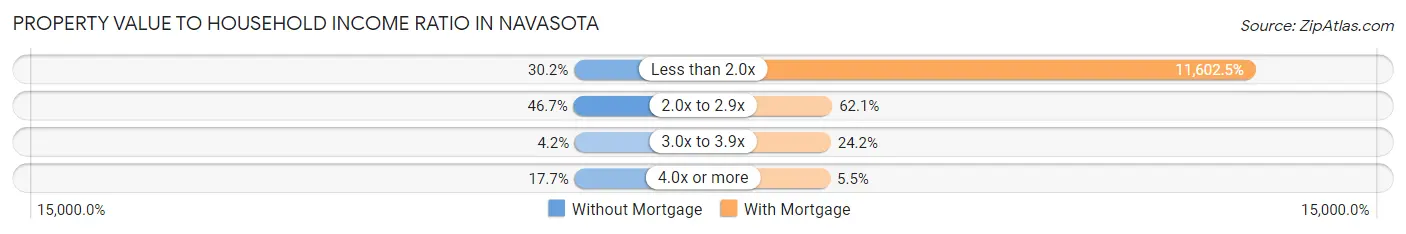
| Value-to-Income Ratio | Without Mortgage | With Mortgage |
| Less than 2.0x | 287 (30.2%) | 92,472 (11,602.5%) |
| 2.0x to 2.9x | 444 (46.7%) | 495 (62.1%) |
| 3.0x to 3.9x | 40 (4.2%) | 193 (24.2%) |
| 4.0x or more | 168 (17.7%) | 44 (5.5%) |
| Total | 950 (100.0%) | 797 (100.0%) |
Real Estate Taxes by Mortgage Status in Navasota
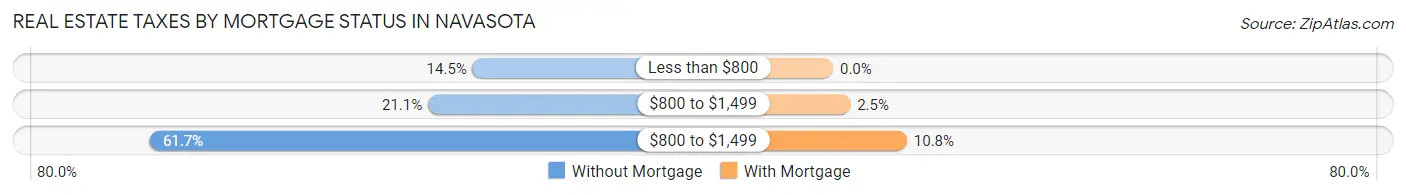
| Property Taxes | Without Mortgage | With Mortgage |
| Less than $800 | 138 (14.5%) | 0 (0.0%) |
| $800 to $1,499 | 200 (21.0%) | 20 (2.5%) |
| $800 to $1,499 | 586 (61.7%) | 86 (10.8%) |
| Total | 950 (100.0%) | 797 (100.0%) |
Health & Disability in Navasota
Health Insurance Coverage by Age in Navasota
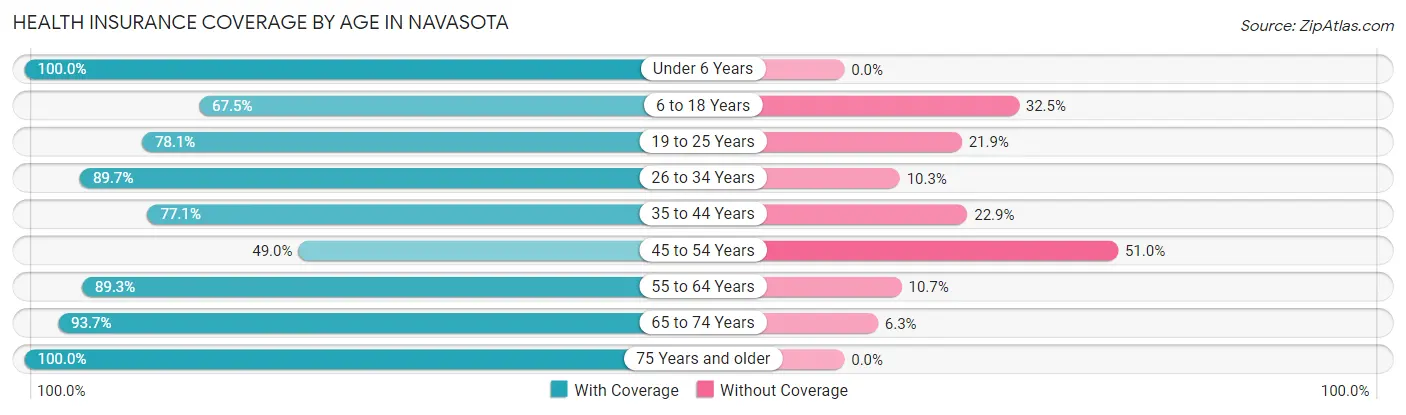
| Age Bracket | With Coverage | Without Coverage |
| Under 6 Years | 638 (100.0%) | 0 (0.0%) |
| 6 to 18 Years | 1,308 (67.5%) | 631 (32.5%) |
| 19 to 25 Years | 703 (78.1%) | 197 (21.9%) |
| 26 to 34 Years | 634 (89.7%) | 73 (10.3%) |
| 35 to 44 Years | 739 (77.1%) | 220 (22.9%) |
| 45 to 54 Years | 471 (49.0%) | 491 (51.0%) |
| 55 to 64 Years | 460 (89.3%) | 55 (10.7%) |
| 65 to 74 Years | 554 (93.7%) | 37 (6.3%) |
| 75 Years and older | 438 (100.0%) | 0 (0.0%) |
| Total | 5,945 (77.7%) | 1,704 (22.3%) |
Health Insurance Coverage by Citizenship Status in Navasota
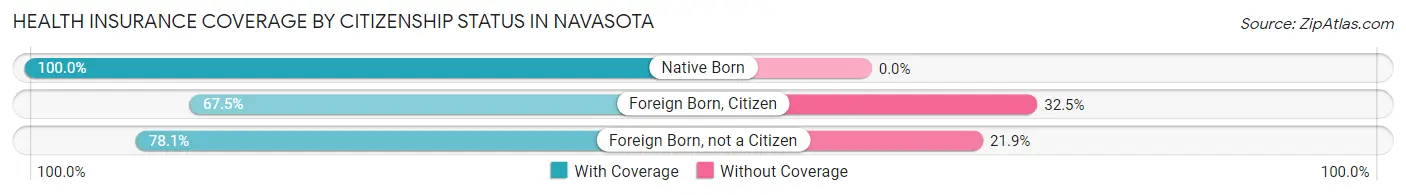
| Citizenship Status | With Coverage | Without Coverage |
| Native Born | 638 (100.0%) | 0 (0.0%) |
| Foreign Born, Citizen | 1,308 (67.5%) | 631 (32.5%) |
| Foreign Born, not a Citizen | 703 (78.1%) | 197 (21.9%) |
Health Insurance Coverage by Household Income in Navasota
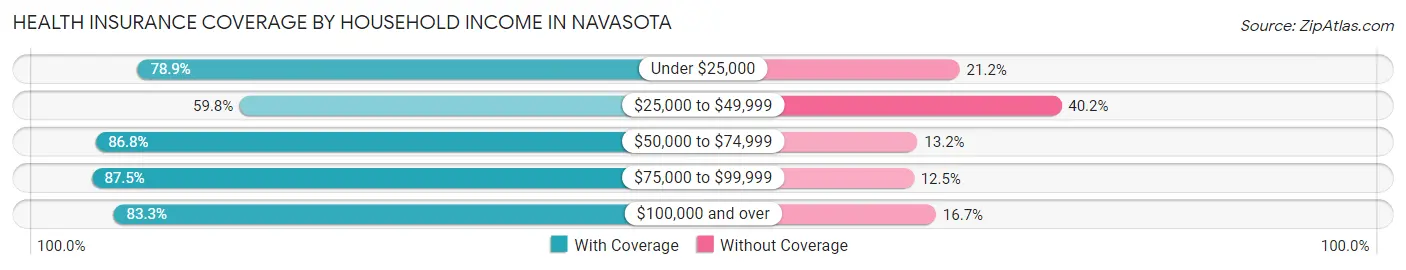
| Household Income | With Coverage | Without Coverage |
| Under $25,000 | 891 (78.8%) | 239 (21.1%) |
| $25,000 to $49,999 | 1,222 (59.8%) | 821 (40.2%) |
| $50,000 to $74,999 | 1,233 (86.8%) | 188 (13.2%) |
| $75,000 to $99,999 | 1,131 (87.5%) | 162 (12.5%) |
| $100,000 and over | 1,468 (83.3%) | 294 (16.7%) |
Public vs Private Health Insurance Coverage by Age in Navasota
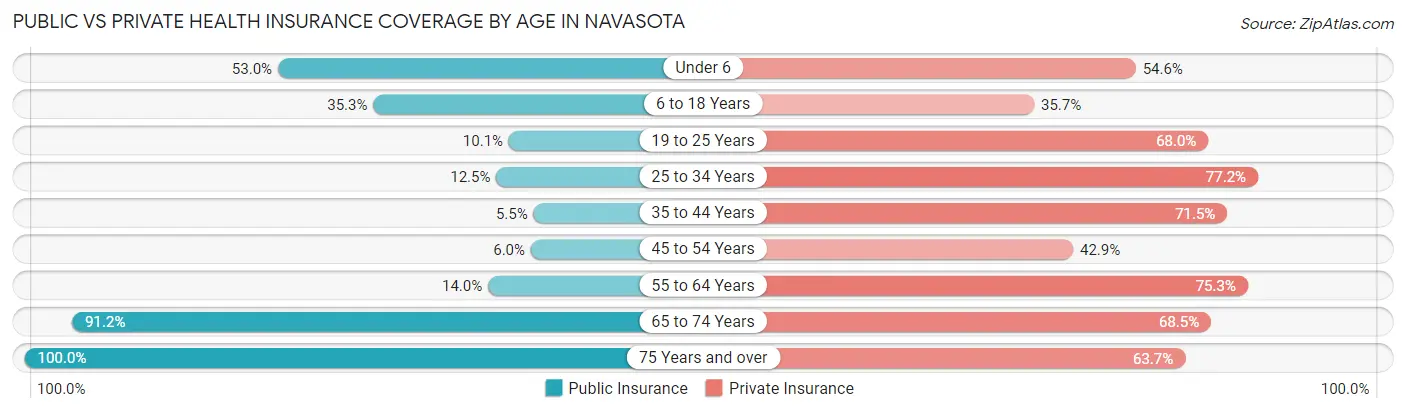
| Age Bracket | Public Insurance | Private Insurance |
| Under 6 | 338 (53.0%) | 348 (54.5%) |
| 6 to 18 Years | 684 (35.3%) | 692 (35.7%) |
| 19 to 25 Years | 91 (10.1%) | 612 (68.0%) |
| 25 to 34 Years | 88 (12.4%) | 546 (77.2%) |
| 35 to 44 Years | 53 (5.5%) | 686 (71.5%) |
| 45 to 54 Years | 58 (6.0%) | 413 (42.9%) |
| 55 to 64 Years | 72 (14.0%) | 388 (75.3%) |
| 65 to 74 Years | 539 (91.2%) | 405 (68.5%) |
| 75 Years and over | 438 (100.0%) | 279 (63.7%) |
| Total | 2,361 (30.9%) | 4,369 (57.1%) |
Disability Status by Sex by Age in Navasota
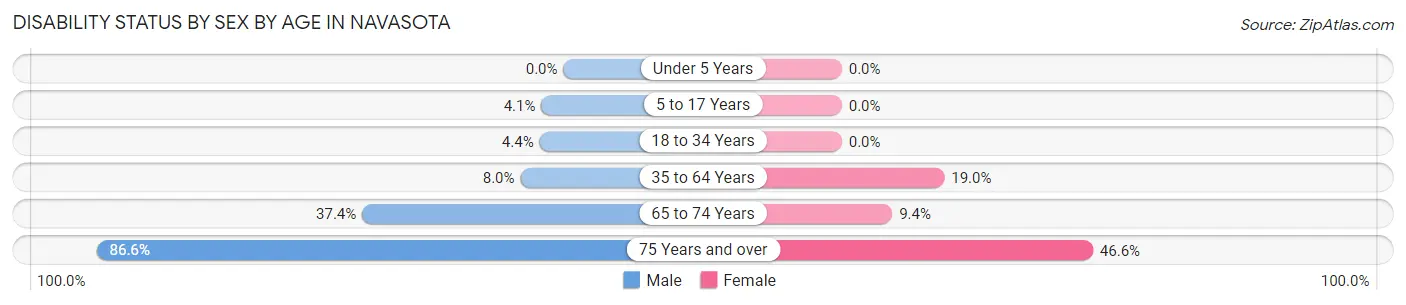
| Age Bracket | Male | Female |
| Under 5 Years | 0 (0.0%) | 0 (0.0%) |
| 5 to 17 Years | 41 (4.1%) | 0 (0.0%) |
| 18 to 34 Years | 41 (4.4%) | 0 (0.0%) |
| 35 to 64 Years | 79 (8.0%) | 275 (19.0%) |
| 65 to 74 Years | 93 (37.3%) | 32 (9.4%) |
| 75 Years and over | 175 (86.6%) | 110 (46.6%) |
Disability Class by Sex by Age in Navasota
Disability Class: Hearing Difficulty
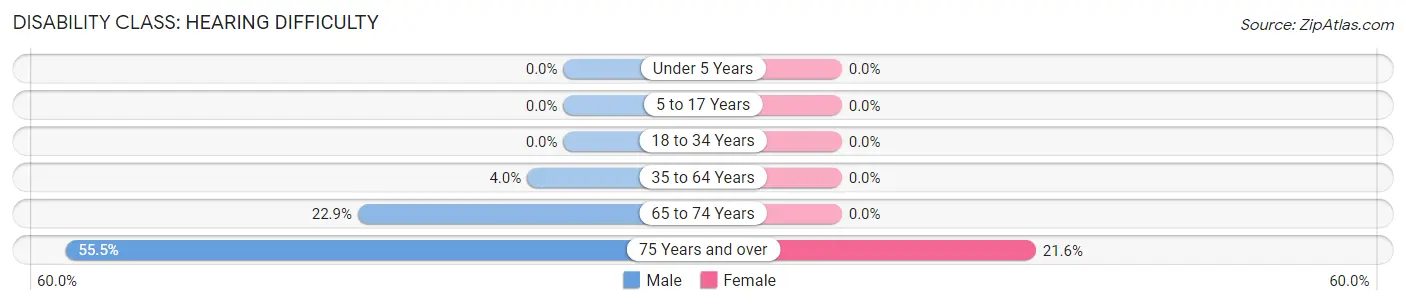
| Age Bracket | Male | Female |
| Under 5 Years | 0 (0.0%) | 0 (0.0%) |
| 5 to 17 Years | 0 (0.0%) | 0 (0.0%) |
| 18 to 34 Years | 0 (0.0%) | 0 (0.0%) |
| 35 to 64 Years | 40 (4.0%) | 0 (0.0%) |
| 65 to 74 Years | 57 (22.9%) | 0 (0.0%) |
| 75 Years and over | 112 (55.4%) | 51 (21.6%) |
Disability Class: Vision Difficulty
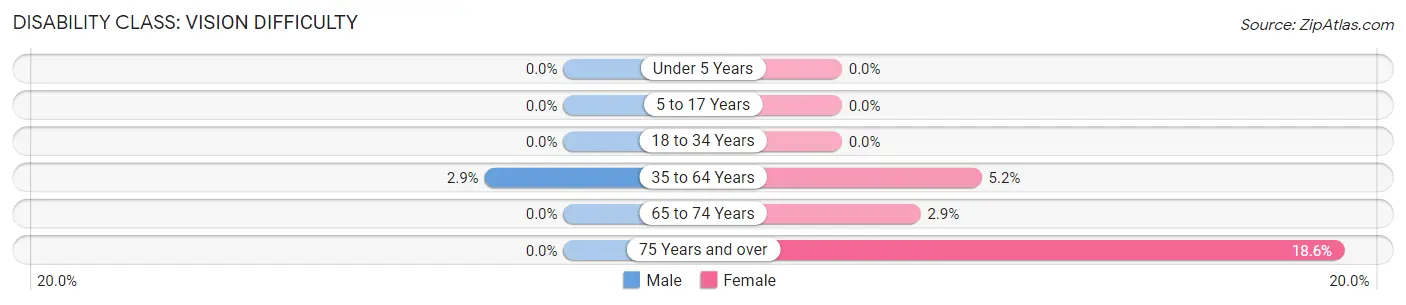
| Age Bracket | Male | Female |
| Under 5 Years | 0 (0.0%) | 0 (0.0%) |
| 5 to 17 Years | 0 (0.0%) | 0 (0.0%) |
| 18 to 34 Years | 0 (0.0%) | 0 (0.0%) |
| 35 to 64 Years | 29 (2.9%) | 75 (5.2%) |
| 65 to 74 Years | 0 (0.0%) | 10 (2.9%) |
| 75 Years and over | 0 (0.0%) | 44 (18.6%) |
Disability Class: Cognitive Difficulty
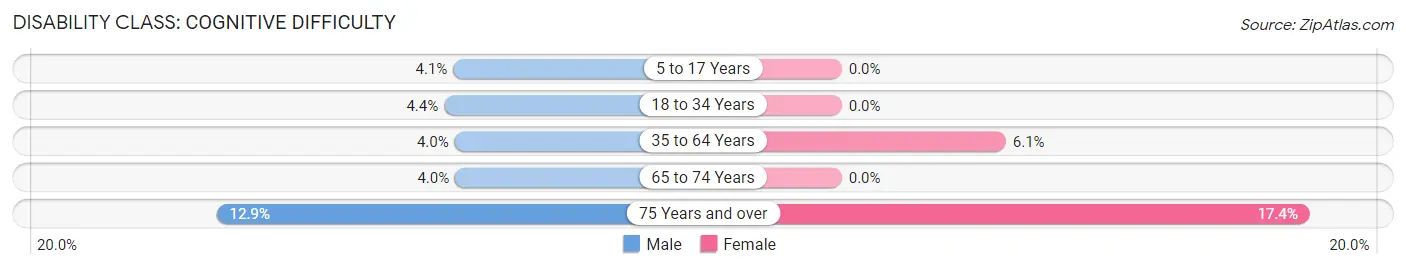
| Age Bracket | Male | Female |
| 5 to 17 Years | 41 (4.1%) | 0 (0.0%) |
| 18 to 34 Years | 41 (4.4%) | 0 (0.0%) |
| 35 to 64 Years | 40 (4.0%) | 88 (6.1%) |
| 65 to 74 Years | 10 (4.0%) | 0 (0.0%) |
| 75 Years and over | 26 (12.9%) | 41 (17.4%) |
Disability Class: Ambulatory Difficulty
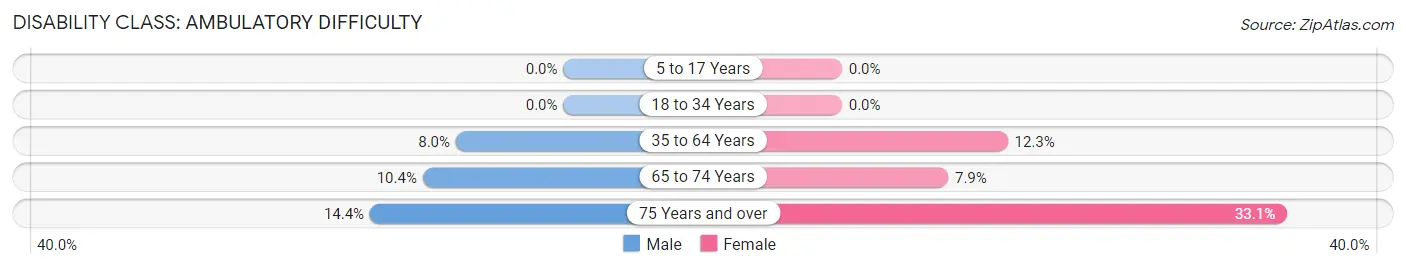
| Age Bracket | Male | Female |
| 5 to 17 Years | 0 (0.0%) | 0 (0.0%) |
| 18 to 34 Years | 0 (0.0%) | 0 (0.0%) |
| 35 to 64 Years | 79 (8.0%) | 178 (12.3%) |
| 65 to 74 Years | 26 (10.4%) | 27 (7.9%) |
| 75 Years and over | 29 (14.4%) | 78 (33.1%) |
Disability Class: Self-Care Difficulty
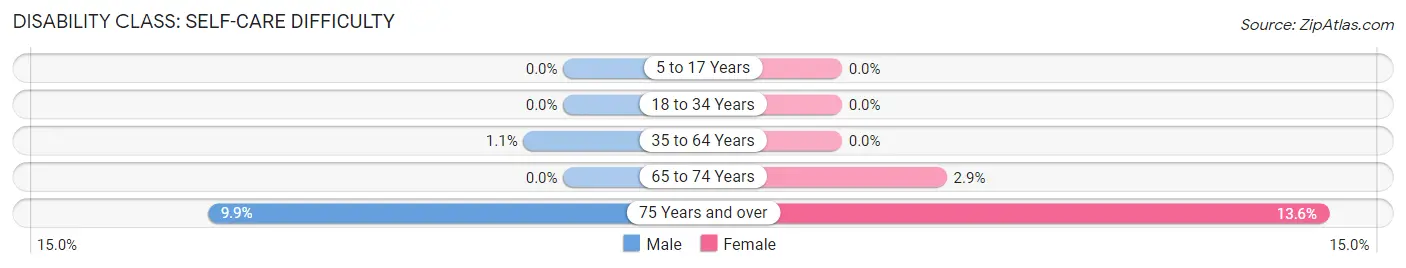
| Age Bracket | Male | Female |
| 5 to 17 Years | 0 (0.0%) | 0 (0.0%) |
| 18 to 34 Years | 0 (0.0%) | 0 (0.0%) |
| 35 to 64 Years | 11 (1.1%) | 0 (0.0%) |
| 65 to 74 Years | 0 (0.0%) | 10 (2.9%) |
| 75 Years and over | 20 (9.9%) | 32 (13.6%) |
Technology Access in Navasota
Computing Device Access in Navasota
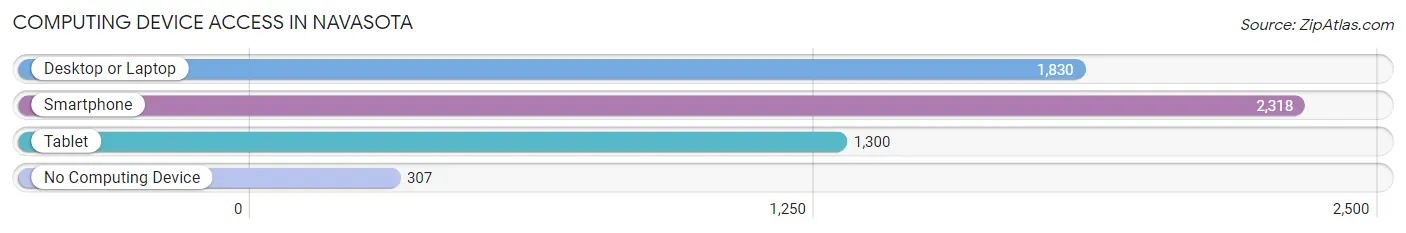
| Device Type | # Households | % Households |
| Desktop or Laptop | 1,830 | 65.6% |
| Smartphone | 2,318 | 83.1% |
| Tablet | 1,300 | 46.6% |
| No Computing Device | 307 | 11.0% |
| Total | 2,789 | 100.0% |
Internet Access in Navasota
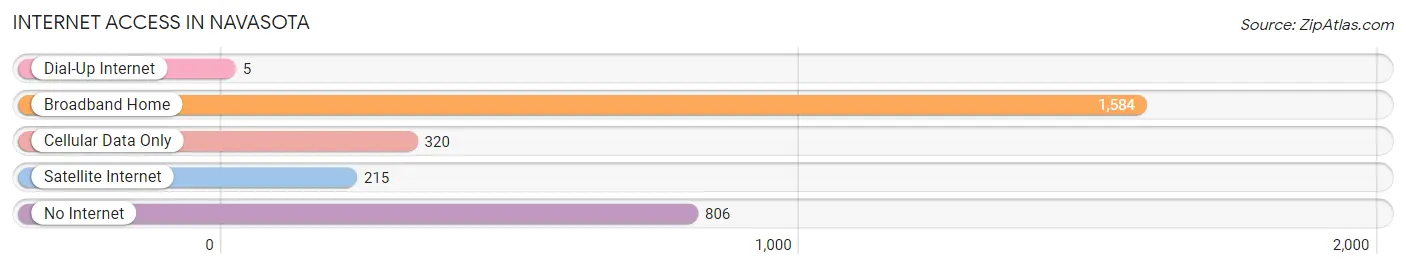
| Internet Type | # Households | % Households |
| Dial-Up Internet | 5 | 0.2% |
| Broadband Home | 1,584 | 56.8% |
| Cellular Data Only | 320 | 11.5% |
| Satellite Internet | 215 | 7.7% |
| No Internet | 806 | 28.9% |
| Total | 2,789 | 100.0% |
Navasota Summary
Navasota, Texas is a small city located in Grimes County, Texas, United States. It is situated along the Brazos River, approximately 70 miles northwest of Houston. The city is the county seat of Grimes County and is part of the Bryan-College Station metropolitan area. As of the 2010 census, the population of Navasota was 7,049, making it the largest city in Grimes County.
History
Navasota was founded in 1831 by John Austin, a settler from Tennessee. Austin named the town after the local Native American tribe, the Navasota. The town was incorporated in 1858 and was the county seat of Grimes County.
Navasota was an important stop on the Chisholm Trail, a cattle trail that ran from Texas to Kansas. The town was also a major stop on the Houston and Texas Central Railway, which connected Houston to Dallas.
Navasota was an important center of the cotton industry in the late 19th and early 20th centuries. The town was home to several cotton gins and warehouses, as well as a cottonseed oil mill.
Geography
Navasota is located in Grimes County, Texas, approximately 70 miles northwest of Houston. The city is situated along the Brazos River, which forms the eastern boundary of the city. The city has a total area of 5.3 square miles, all of which is land.
Navasota is located in the humid subtropical climate zone, with hot summers and mild winters. The average annual temperature is 68°F, and the average annual precipitation is 39.3 inches.
Economy
Navasota’s economy is largely based on agriculture and manufacturing. The city is home to several cotton gins and warehouses, as well as a cottonseed oil mill. The city is also home to several manufacturing companies, including a steel mill, a paper mill, and a plastics plant.
Navasota is also home to several retail stores, restaurants, and other businesses. The city is home to several hotels, motels, and bed and breakfasts.
Demographics
As of the 2010 census, the population of Navasota was 7,049. The racial makeup of the city was 73.3% White, 19.2% African American, 0.7% Native American, 0.4% Asian, 0.1% Pacific Islander, 4.2% from other races, and 2.1% from two or more races. Hispanic or Latino of any race were 11.3% of the population.
The median income for a household in Navasota was $37,917, and the median income for a family was $45,938. The per capita income for the city was $19,945. About 17.2% of families and 20.7% of the population were below the poverty line, including 28.2% of those under age 18 and 14.2% of those age 65 or over.
Common Questions
What is Per Capita Income in Navasota?
Per Capita income in Navasota is $22,663.
What is the Median Family Income in Navasota?
Median Family Income in Navasota is $54,801.
What is the Median Household income in Navasota?
Median Household Income in Navasota is $47,793.
What is Income or Wage Gap in Navasota?
Income or Wage Gap in Navasota is 20.9%.
Women in Navasota earn 79.1 cents for every dollar earned by a man.
What is Family Income Deficit in Navasota?
Family Income Deficit in Navasota is $11,823.
Families that are below poverty line in Navasota earn $11,823 less on average than the poverty threshold level.
What is Inequality or Gini Index in Navasota?
Inequality or Gini Index in Navasota is 0.44.
What is the Total Population of Navasota?
Total Population of Navasota is 7,843.
What is the Total Male Population of Navasota?
Total Male Population of Navasota is 3,655.
What is the Total Female Population of Navasota?
Total Female Population of Navasota is 4,188.
What is the Ratio of Males per 100 Females in Navasota?
There are 87.27 Males per 100 Females in Navasota.
What is the Ratio of Females per 100 Males in Navasota?
There are 114.58 Females per 100 Males in Navasota.
What is the Median Population Age in Navasota?
Median Population Age in Navasota is 33.0 Years.
What is the Average Family Size in Navasota
Average Family Size in Navasota is 3.5 People.
What is the Average Household Size in Navasota
Average Household Size in Navasota is 2.7 People.
How Large is the Labor Force in Navasota?
There are 3,795 People in the Labor Forcein in Navasota.
What is the Percentage of People in the Labor Force in Navasota?
68.1% of People are in the Labor Force in Navasota.
What is the Unemployment Rate in Navasota?
Unemployment Rate in Navasota is 8.5%.