Mount Vernon, TX Map & Demographics
Mount Vernon Map
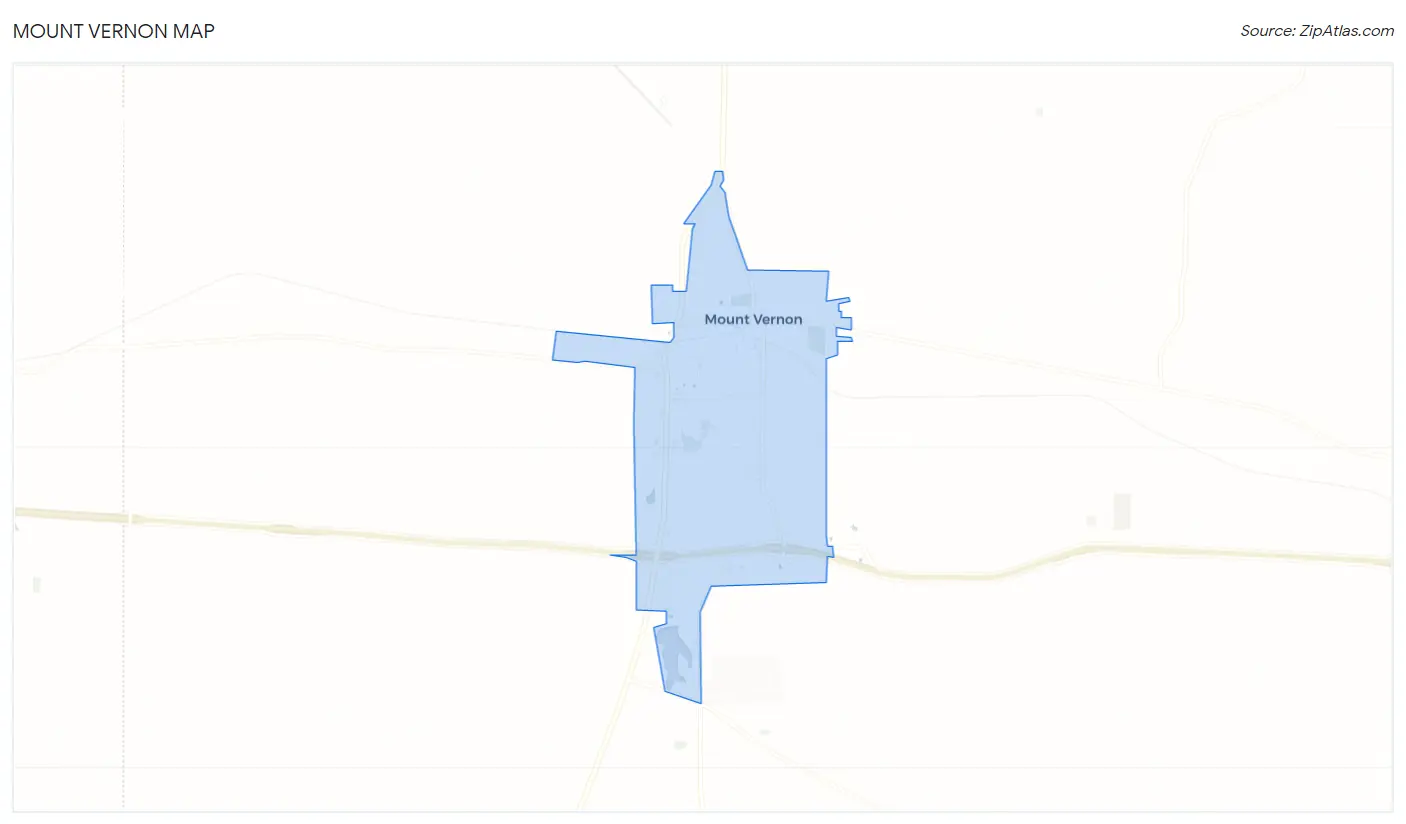
Mount Vernon Overview
$27,767
PER CAPITA INCOME
$69,844
AVG FAMILY INCOME
$63,750
AVG HOUSEHOLD INCOME
25.7%
WAGE / INCOME GAP [ % ]
74.3¢/ $1
WAGE / INCOME GAP [ $ ]
0.43
INEQUALITY / GINI INDEX
2,527
TOTAL POPULATION
1,371
MALE POPULATION
1,156
FEMALE POPULATION
118.60
MALES / 100 FEMALES
84.32
FEMALES / 100 MALES
31.1
MEDIAN AGE
4.0
AVG FAMILY SIZE
3.2
AVG HOUSEHOLD SIZE
1,126
LABOR FORCE [ PEOPLE ]
65.7%
PERCENT IN LABOR FORCE
6.0%
UNEMPLOYMENT RATE
Mount Vernon Zip Codes
Mount Vernon Area Codes
Income in Mount Vernon
Income Overview in Mount Vernon
Per Capita Income in Mount Vernon is $27,767, while median incomes of families and households are $69,844 and $63,750 respectively.
| Characteristic | Number | Measure |
| Per Capita Income | 2,527 | $27,767 |
| Median Family Income | 543 | $69,844 |
| Mean Family Income | 543 | $102,601 |
| Median Household Income | 748 | $63,750 |
| Mean Household Income | 748 | $88,311 |
| Income Deficit | 543 | $0 |
| Wage / Income Gap (%) | 2,527 | 25.66% |
| Wage / Income Gap ($) | 2,527 | 74.34¢ per $1 |
| Gini / Inequality Index | 2,527 | 0.43 |
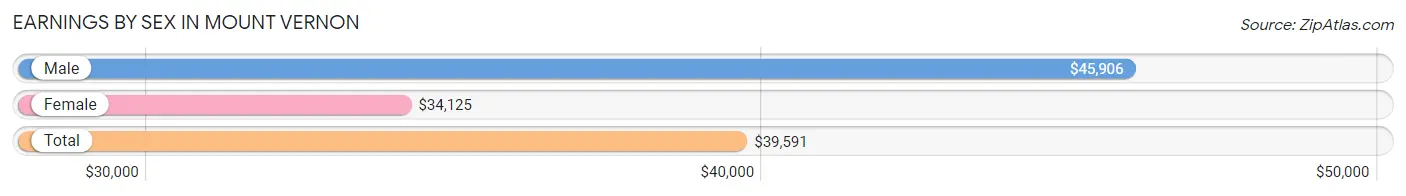
Earnings by Sex in Mount Vernon
Average Earnings in Mount Vernon are $39,591, $45,906 for men and $34,125 for women, a difference of 25.7%.
| Sex | Number | Average Earnings |
| Male | 623 (53.8%) | $45,906 |
| Female | 534 (46.2%) | $34,125 |
| Total | 1,157 (100.0%) | $39,591 |
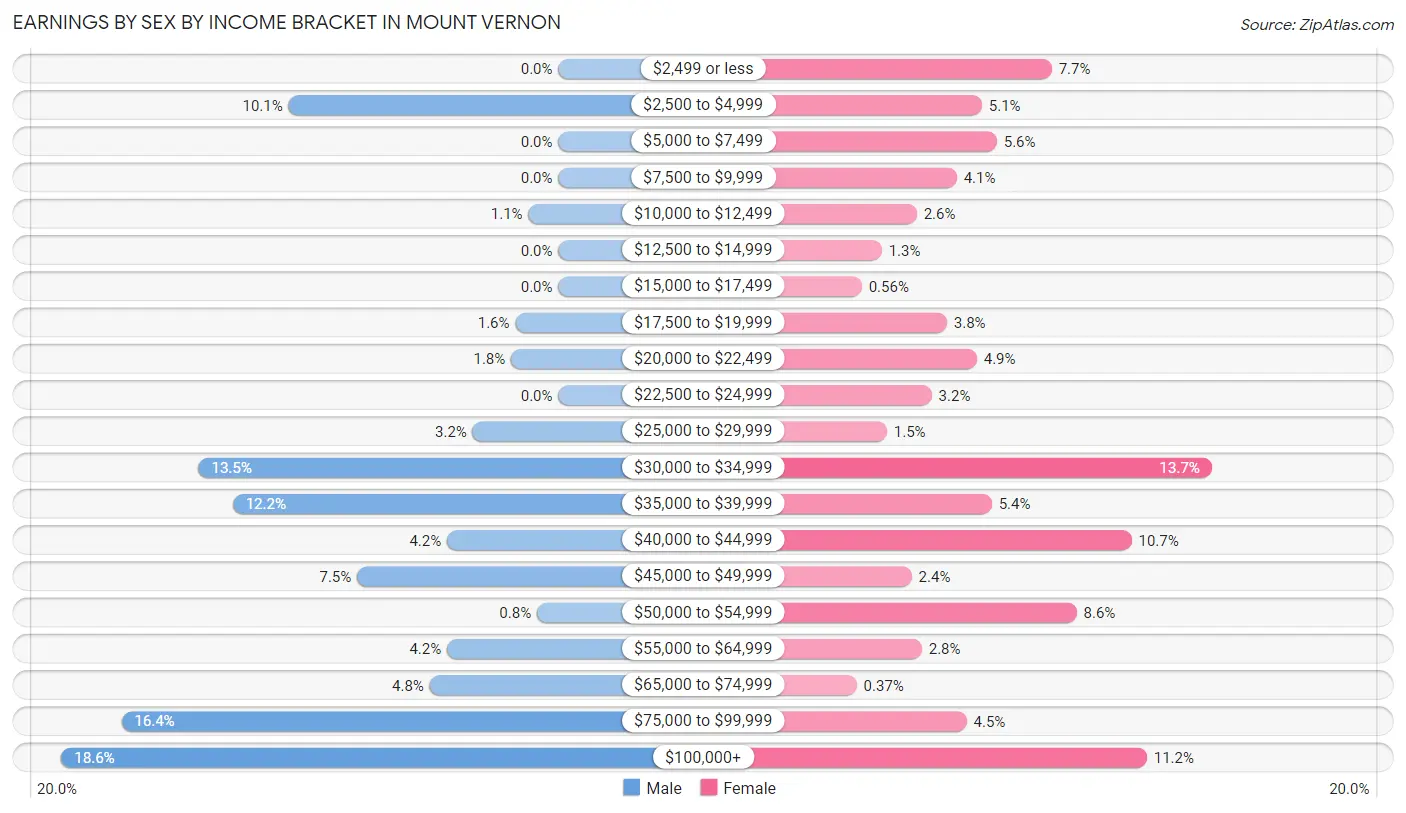
Earnings by Sex by Income Bracket in Mount Vernon
The most common earnings brackets in Mount Vernon are $100,000+ for men (116 | 18.6%) and $30,000 to $34,999 for women (73 | 13.7%).
| Income | Male | Female |
| $2,499 or less | 0 (0.0%) | 41 (7.7%) |
| $2,500 to $4,999 | 63 (10.1%) | 27 (5.1%) |
| $5,000 to $7,499 | 0 (0.0%) | 30 (5.6%) |
| $7,500 to $9,999 | 0 (0.0%) | 22 (4.1%) |
| $10,000 to $12,499 | 7 (1.1%) | 14 (2.6%) |
| $12,500 to $14,999 | 0 (0.0%) | 7 (1.3%) |
| $15,000 to $17,499 | 0 (0.0%) | 3 (0.6%) |
| $17,500 to $19,999 | 10 (1.6%) | 20 (3.7%) |
| $20,000 to $22,499 | 11 (1.8%) | 26 (4.9%) |
| $22,500 to $24,999 | 0 (0.0%) | 17 (3.2%) |
| $25,000 to $29,999 | 20 (3.2%) | 8 (1.5%) |
| $30,000 to $34,999 | 84 (13.5%) | 73 (13.7%) |
| $35,000 to $39,999 | 76 (12.2%) | 29 (5.4%) |
| $40,000 to $44,999 | 26 (4.2%) | 57 (10.7%) |
| $45,000 to $49,999 | 47 (7.5%) | 13 (2.4%) |
| $50,000 to $54,999 | 5 (0.8%) | 46 (8.6%) |
| $55,000 to $64,999 | 26 (4.2%) | 15 (2.8%) |
| $65,000 to $74,999 | 30 (4.8%) | 2 (0.4%) |
| $75,000 to $99,999 | 102 (16.4%) | 24 (4.5%) |
| $100,000+ | 116 (18.6%) | 60 (11.2%) |
| Total | 623 (100.0%) | 534 (100.0%) |
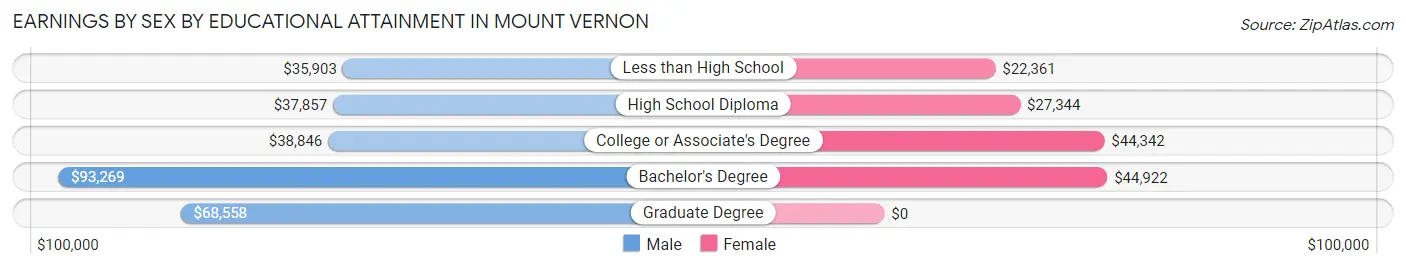
Earnings by Sex by Educational Attainment in Mount Vernon
Average earnings in Mount Vernon are $39,969 for men and $39,583 for women, a difference of 1.0%. Men with an educational attainment of bachelor's degree enjoy the highest average annual earnings of $93,269, while those with less than high school education earn the least with $35,903. Women with an educational attainment of bachelor's degree earn the most with the average annual earnings of $44,922, while those with less than high school education have the smallest earnings of $22,361.
| Educational Attainment | Male Income | Female Income |
| Less than High School | $35,903 | $22,361 |
| High School Diploma | $37,857 | $27,344 |
| College or Associate's Degree | $38,846 | $44,342 |
| Bachelor's Degree | $93,269 | $44,922 |
| Graduate Degree | $68,558 | $0 |
| Total | $39,969 | $39,583 |
Family Income in Mount Vernon
Family Income Brackets in Mount Vernon
According to the Mount Vernon family income data, there are 124 families falling into the $50,000 to $74,999 income range, which is the most common income bracket and makes up 22.8% of all families. Conversely, the $10,000 to $14,999 income bracket is the least frequent group with only 5 families (0.9%) belonging to this category.
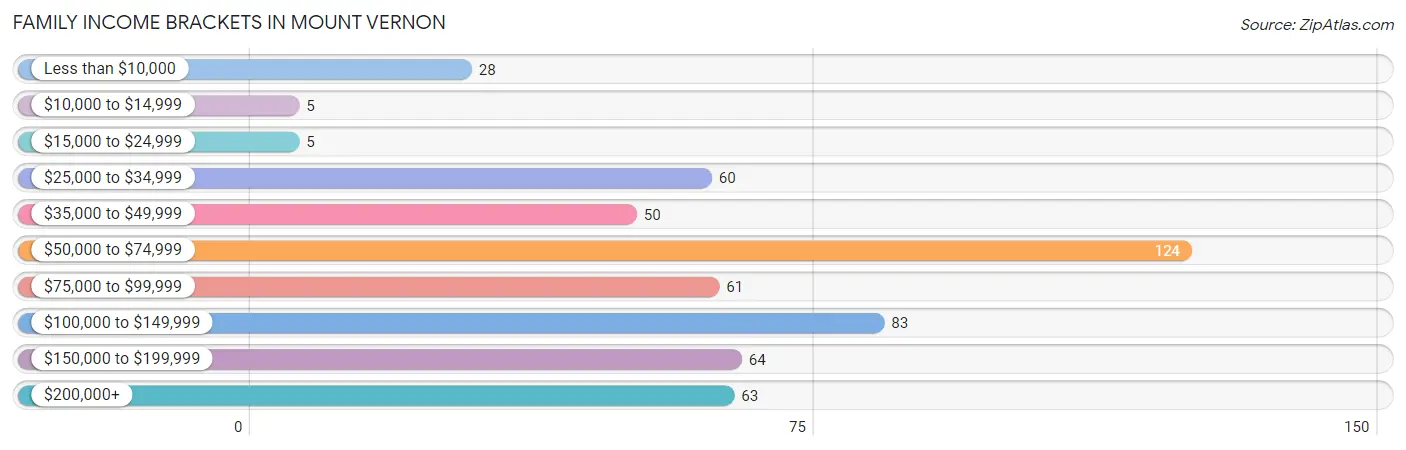
| Income Bracket | # Families | % Families |
| Less than $10,000 | 28 | 5.2% |
| $10,000 to $14,999 | 5 | 0.9% |
| $15,000 to $24,999 | 5 | 0.9% |
| $25,000 to $34,999 | 60 | 11.0% |
| $35,000 to $49,999 | 50 | 9.2% |
| $50,000 to $74,999 | 124 | 22.8% |
| $75,000 to $99,999 | 61 | 11.2% |
| $100,000 to $149,999 | 83 | 15.3% |
| $150,000 to $199,999 | 64 | 11.8% |
| $200,000+ | 63 | 11.6% |
Family Income by Famaliy Size in Mount Vernon
6-person families (36 | 6.6%) account for the highest median family income in Mount Vernon with $128,750 per family, while 2-person families (143 | 26.3%) have the highest median income of $27,875 per family member.
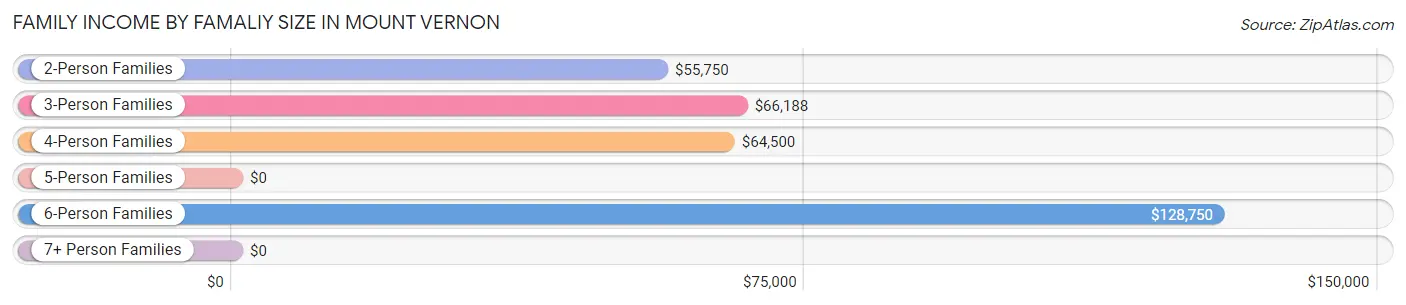
| Income Bracket | # Families | Median Income |
| 2-Person Families | 143 (26.3%) | $55,750 |
| 3-Person Families | 136 (25.1%) | $66,188 |
| 4-Person Families | 100 (18.4%) | $64,500 |
| 5-Person Families | 128 (23.6%) | $0 |
| 6-Person Families | 36 (6.6%) | $128,750 |
| 7+ Person Families | 0 (0.0%) | $0 |
| Total | 543 (100.0%) | $69,844 |
Family Income by Number of Earners in Mount Vernon
The median family income in Mount Vernon is $69,844, with families comprising 3+ earners (107) having the highest median family income of $250,001, while families with no earners (40) have the lowest median family income of $34,531, accounting for 19.7% and 7.4% of families, respectively.
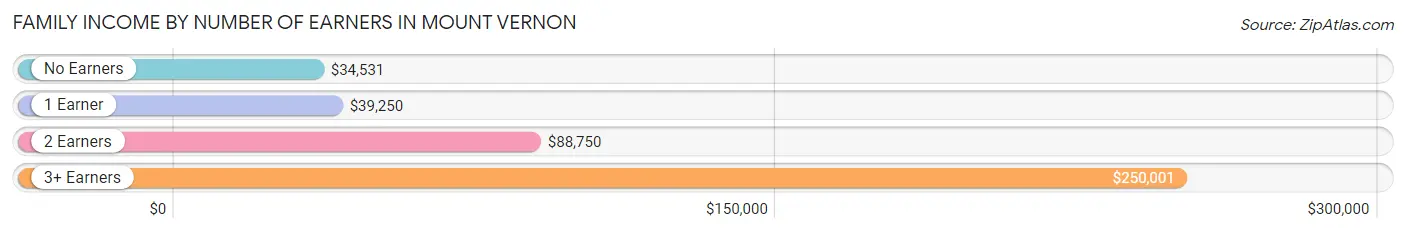
| Number of Earners | # Families | Median Income |
| No Earners | 40 (7.4%) | $34,531 |
| 1 Earner | 157 (28.9%) | $39,250 |
| 2 Earners | 239 (44.0%) | $88,750 |
| 3+ Earners | 107 (19.7%) | $250,001 |
| Total | 543 (100.0%) | $69,844 |
Household Income in Mount Vernon
Household Income Brackets in Mount Vernon
With 146 households falling in the category, the $50,000 to $74,999 income range is the most frequent in Mount Vernon, accounting for 19.5% of all households. In contrast, only 23 households (3.1%) fall into the $15,000 to $24,999 income bracket, making it the least populous group.
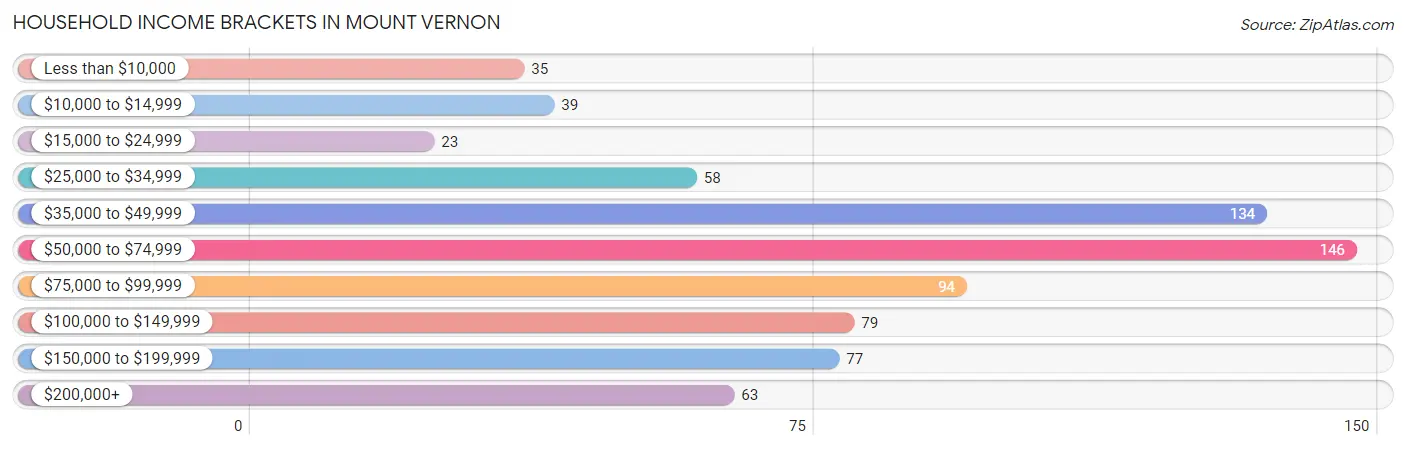
| Income Bracket | # Households | % Households |
| Less than $10,000 | 35 | 4.7% |
| $10,000 to $14,999 | 39 | 5.2% |
| $15,000 to $24,999 | 23 | 3.1% |
| $25,000 to $34,999 | 58 | 7.8% |
| $35,000 to $49,999 | 134 | 17.9% |
| $50,000 to $74,999 | 146 | 19.5% |
| $75,000 to $99,999 | 94 | 12.6% |
| $100,000 to $149,999 | 79 | 10.6% |
| $150,000 to $199,999 | 77 | 10.3% |
| $200,000+ | 63 | 8.4% |
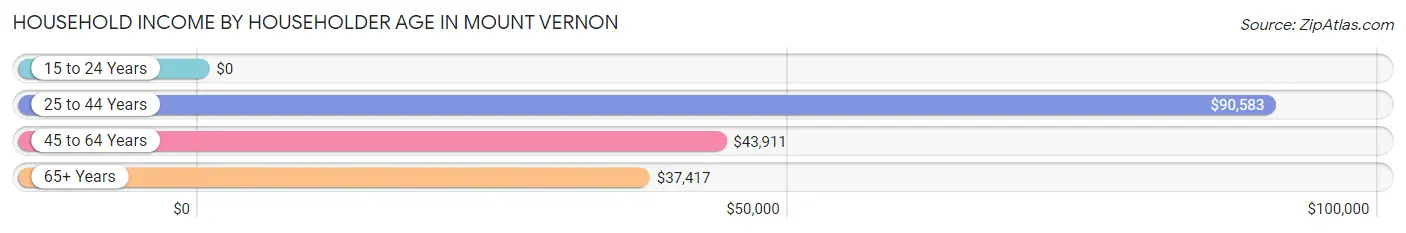
Household Income by Householder Age in Mount Vernon
The median household income in Mount Vernon is $63,750, with the highest median household income of $90,583 found in the 25 to 44 years age bracket for the primary householder. A total of 374 households (50.0%) fall into this category.
| Income Bracket | # Households | Median Income |
| 15 to 24 Years | 0 (0.0%) | $0 |
| 25 to 44 Years | 374 (50.0%) | $90,583 |
| 45 to 64 Years | 243 (32.5%) | $43,911 |
| 65+ Years | 131 (17.5%) | $37,417 |
| Total | 748 (100.0%) | $63,750 |
Poverty in Mount Vernon
Income Below Poverty by Sex and Age in Mount Vernon
With 12.2% poverty level for males and 12.4% for females among the residents of Mount Vernon, 18 to 24 year old males and 5 year old females are the most vulnerable to poverty, with 13 males (44.8%) and 11 females (64.7%) in their respective age groups living below the poverty level.
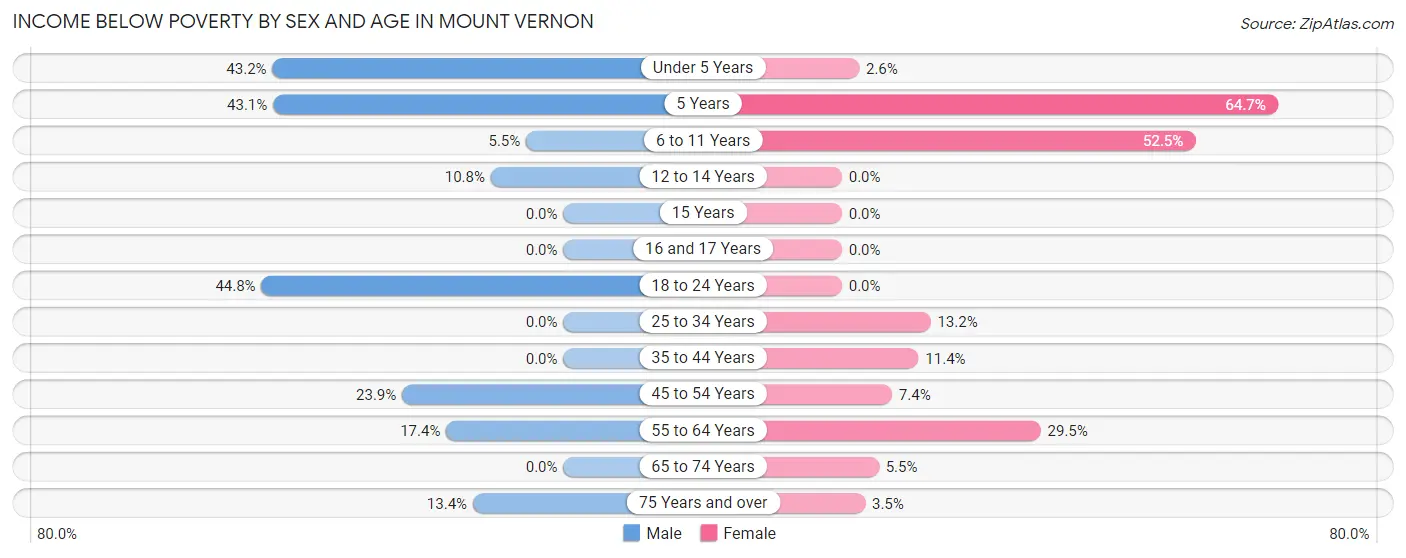
| Age Bracket | Male | Female |
| Under 5 Years | 54 (43.2%) | 2 (2.6%) |
| 5 Years | 25 (43.1%) | 11 (64.7%) |
| 6 to 11 Years | 12 (5.5%) | 32 (52.5%) |
| 12 to 14 Years | 11 (10.8%) | 0 (0.0%) |
| 15 Years | 0 (0.0%) | 0 (0.0%) |
| 16 and 17 Years | 0 (0.0%) | 0 (0.0%) |
| 18 to 24 Years | 13 (44.8%) | 0 (0.0%) |
| 25 to 34 Years | 0 (0.0%) | 22 (13.2%) |
| 35 to 44 Years | 0 (0.0%) | 19 (11.4%) |
| 45 to 54 Years | 17 (23.9%) | 9 (7.4%) |
| 55 to 64 Years | 24 (17.4%) | 31 (29.5%) |
| 65 to 74 Years | 0 (0.0%) | 4 (5.5%) |
| 75 Years and over | 9 (13.4%) | 2 (3.5%) |
| Total | 165 (12.2%) | 132 (12.4%) |
Income Above Poverty by Sex and Age in Mount Vernon
According to the poverty statistics in Mount Vernon, males aged 15 years and females aged 12 to 14 years are the age groups that are most secure financially, with 100.0% of males and 100.0% of females in these age groups living above the poverty line.
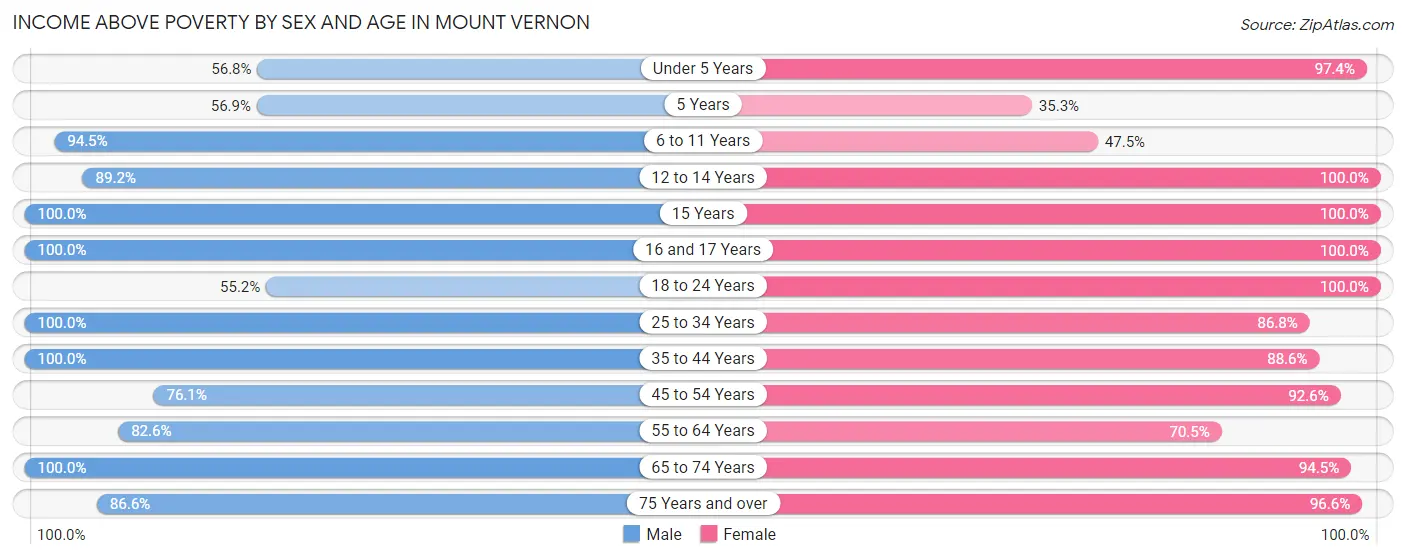
| Age Bracket | Male | Female |
| Under 5 Years | 71 (56.8%) | 76 (97.4%) |
| 5 Years | 33 (56.9%) | 6 (35.3%) |
| 6 to 11 Years | 205 (94.5%) | 29 (47.5%) |
| 12 to 14 Years | 91 (89.2%) | 34 (100.0%) |
| 15 Years | 30 (100.0%) | 77 (100.0%) |
| 16 and 17 Years | 90 (100.0%) | 52 (100.0%) |
| 18 to 24 Years | 16 (55.2%) | 52 (100.0%) |
| 25 to 34 Years | 233 (100.0%) | 145 (86.8%) |
| 35 to 44 Years | 183 (100.0%) | 148 (88.6%) |
| 45 to 54 Years | 54 (76.1%) | 112 (92.6%) |
| 55 to 64 Years | 114 (82.6%) | 74 (70.5%) |
| 65 to 74 Years | 9 (100.0%) | 69 (94.5%) |
| 75 Years and over | 58 (86.6%) | 56 (96.6%) |
| Total | 1,187 (87.8%) | 930 (87.6%) |
Income Below Poverty Among Married-Couple Families in Mount Vernon
The poverty statistics for married-couple families in Mount Vernon show that 3.2% or 14 of the total 432 families live below the poverty line. Families with 3 or 4 children have the highest poverty rate of 7.2%, comprising of 11 families. On the other hand, families with 1 or 2 children have the lowest poverty rate of 0.0%, which includes 0 families.
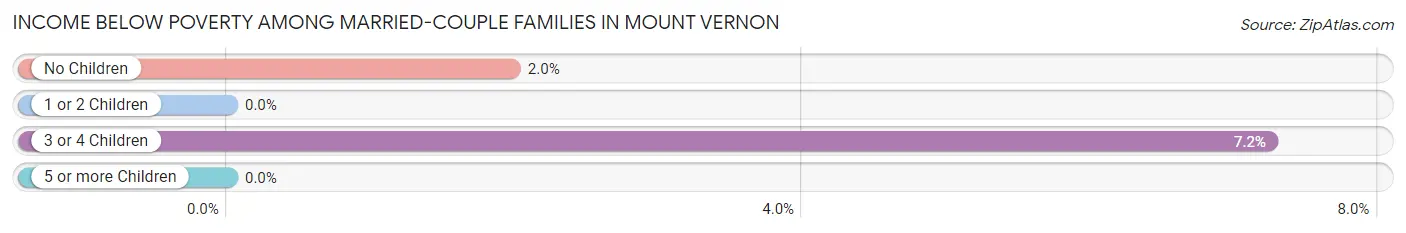
| Children | Above Poverty | Below Poverty |
| No Children | 149 (98.0%) | 3 (2.0%) |
| 1 or 2 Children | 128 (100.0%) | 0 (0.0%) |
| 3 or 4 Children | 141 (92.8%) | 11 (7.2%) |
| 5 or more Children | 0 (0.0%) | 0 (0.0%) |
| Total | 418 (96.8%) | 14 (3.2%) |
Income Below Poverty Among Single-Parent Households in Mount Vernon
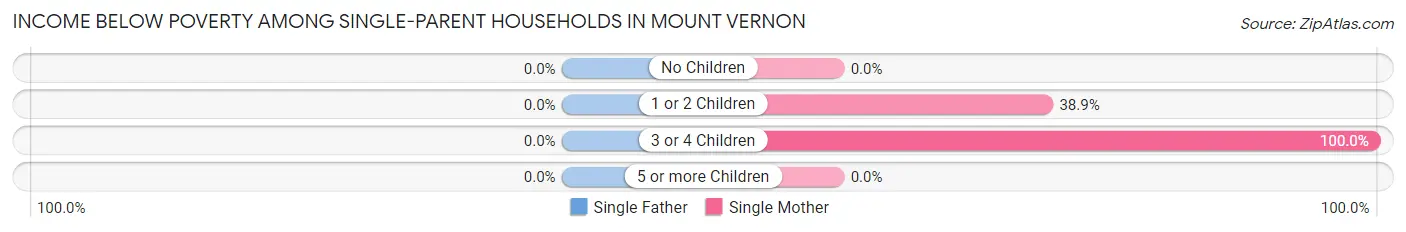
| Children | Single Father | Single Mother |
| No Children | 0 (0.0%) | 0 (0.0%) |
| 1 or 2 Children | 0 (0.0%) | 28 (38.9%) |
| 3 or 4 Children | 0 (0.0%) | 3 (100.0%) |
| 5 or more Children | 0 (0.0%) | 0 (0.0%) |
| Total | 0 (0.0%) | 31 (34.1%) |
Income Below Poverty Among Married-Couple vs Single-Parent Households in Mount Vernon
The poverty data for Mount Vernon shows that 14 of the married-couple family households (3.2%) and 31 of the single-parent households (27.9%) are living below the poverty level. Within the married-couple family households, those with 3 or 4 children have the highest poverty rate, with 11 households (7.2%) falling below the poverty line. Among the single-parent households, those with 3 or 4 children have the highest poverty rate, with 3 household (100.0%) living below poverty.
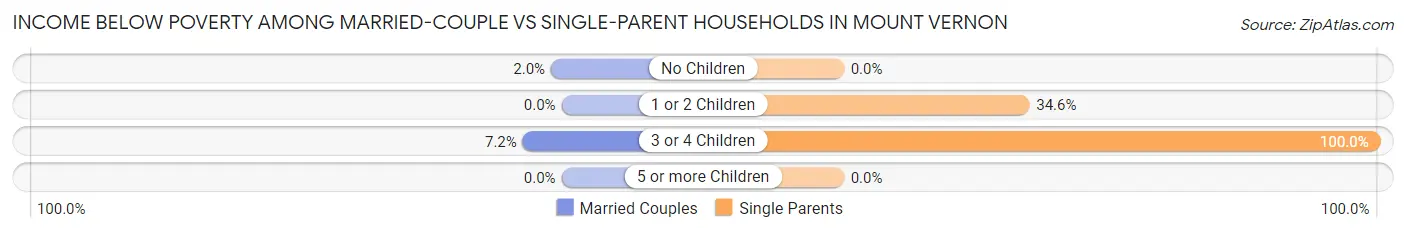
| Children | Married-Couple Families | Single-Parent Households |
| No Children | 3 (2.0%) | 0 (0.0%) |
| 1 or 2 Children | 0 (0.0%) | 28 (34.6%) |
| 3 or 4 Children | 11 (7.2%) | 3 (100.0%) |
| 5 or more Children | 0 (0.0%) | 0 (0.0%) |
| Total | 14 (3.2%) | 31 (27.9%) |
Race in Mount Vernon
The most populous races in Mount Vernon are White / Caucasian (1,641 | 64.9%), Hispanic or Latino (530 | 21.0%), and Black / African American (377 | 14.9%).
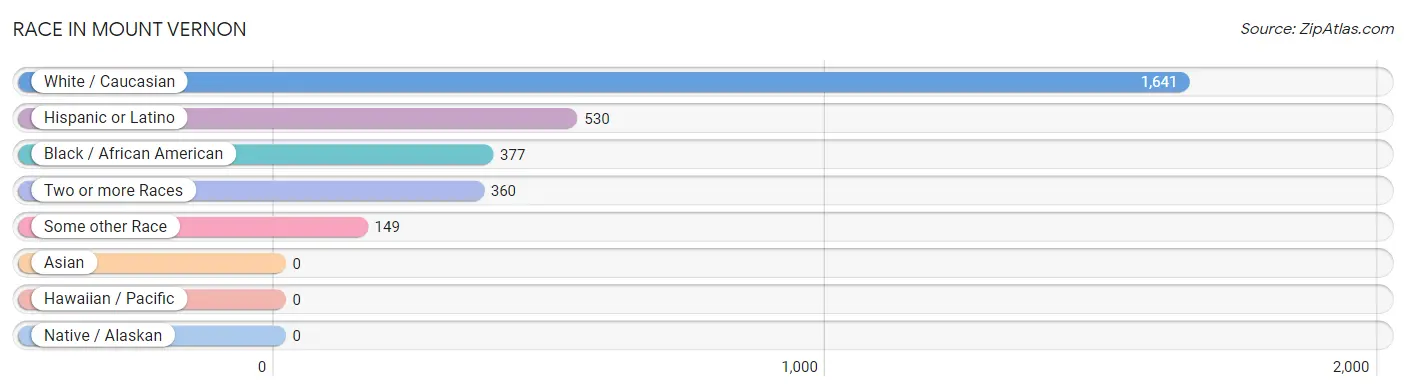
| Race | # Population | % Population |
| Asian | 0 | 0.0% |
| Black / African American | 377 | 14.9% |
| Hawaiian / Pacific | 0 | 0.0% |
| Hispanic or Latino | 530 | 21.0% |
| Native / Alaskan | 0 | 0.0% |
| White / Caucasian | 1,641 | 64.9% |
| Two or more Races | 360 | 14.2% |
| Some other Race | 149 | 5.9% |
| Total | 2,527 | 100.0% |
Ancestry in Mount Vernon
The most populous ancestries reported in Mount Vernon are Mexican (516 | 20.4%), European (231 | 9.1%), German (136 | 5.4%), American (109 | 4.3%), and English (107 | 4.2%), together accounting for 43.5% of all Mount Vernon residents.
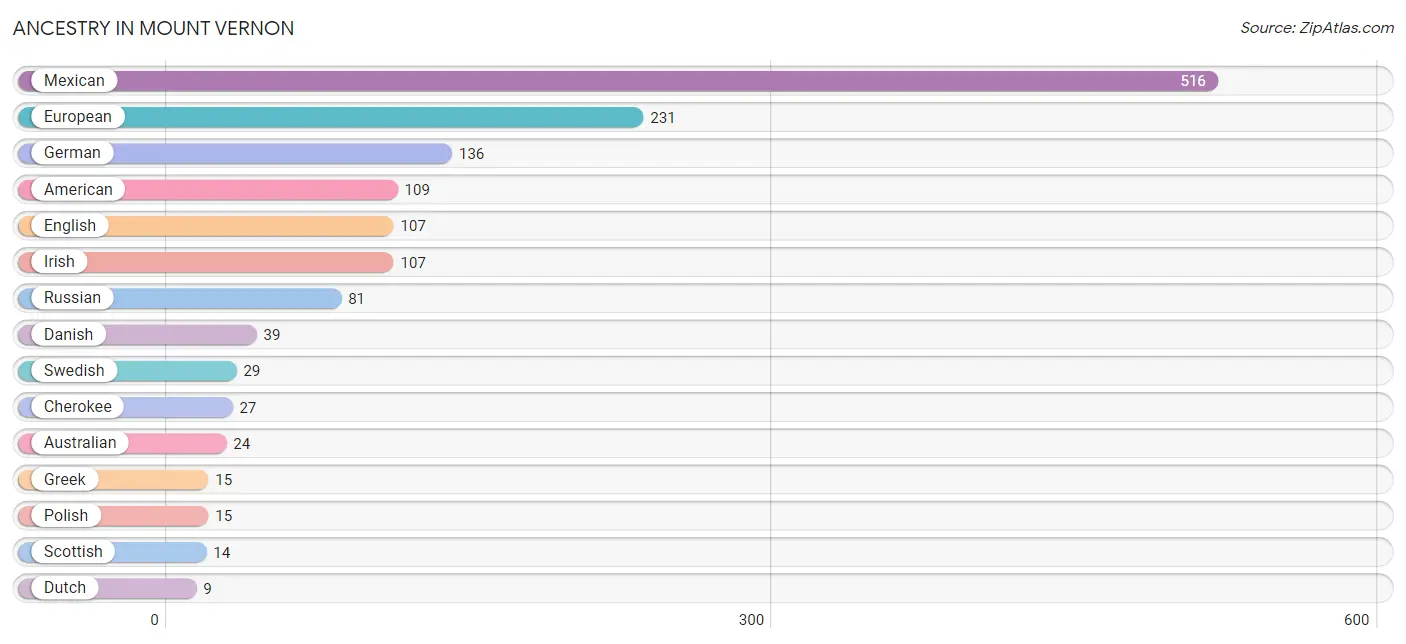
| Ancestry | # Population | % Population |
| American | 109 | 4.3% |
| Australian | 24 | 0.9% |
| Bhutanese | 2 | 0.1% |
| British | 7 | 0.3% |
| Burmese | 8 | 0.3% |
| Cherokee | 27 | 1.1% |
| Choctaw | 2 | 0.1% |
| Danish | 39 | 1.5% |
| Dutch | 9 | 0.4% |
| Eastern European | 5 | 0.2% |
| English | 107 | 4.2% |
| European | 231 | 9.1% |
| French Canadian | 4 | 0.2% |
| German | 136 | 5.4% |
| Greek | 15 | 0.6% |
| Irish | 107 | 4.2% |
| Mexican | 516 | 20.4% |
| Polish | 15 | 0.6% |
| Russian | 81 | 3.2% |
| Scottish | 14 | 0.5% |
| Swedish | 29 | 1.1% | View All 21 Rows |
Immigrants in Mount Vernon
The most numerous immigrant groups reported in Mount Vernon came from Central America (190 | 7.5%), Latin America (190 | 7.5%), Mexico (190 | 7.5%), Africa (26 | 1.0%), and Eastern Africa (26 | 1.0%), together accounting for 24.6% of all Mount Vernon residents.
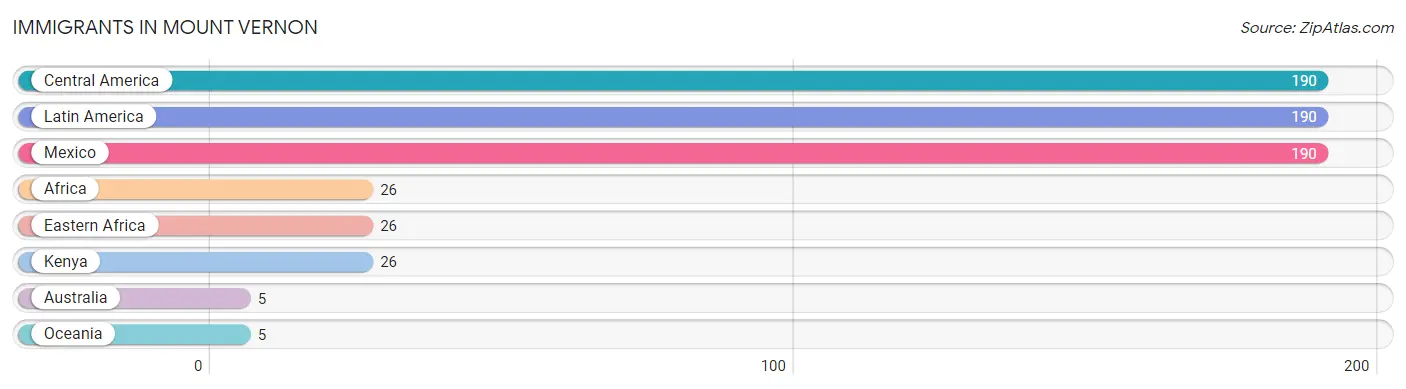
| Immigration Origin | # Population | % Population |
| Africa | 26 | 1.0% |
| Australia | 5 | 0.2% |
| Central America | 190 | 7.5% |
| Eastern Africa | 26 | 1.0% |
| Kenya | 26 | 1.0% |
| Latin America | 190 | 7.5% |
| Mexico | 190 | 7.5% |
| Oceania | 5 | 0.2% | View All 8 Rows |
Sex and Age in Mount Vernon
Sex and Age in Mount Vernon
The most populous age groups in Mount Vernon are 10 to 14 Years (212 | 15.5%) for men and 15 to 19 Years (142 | 12.3%) for women.
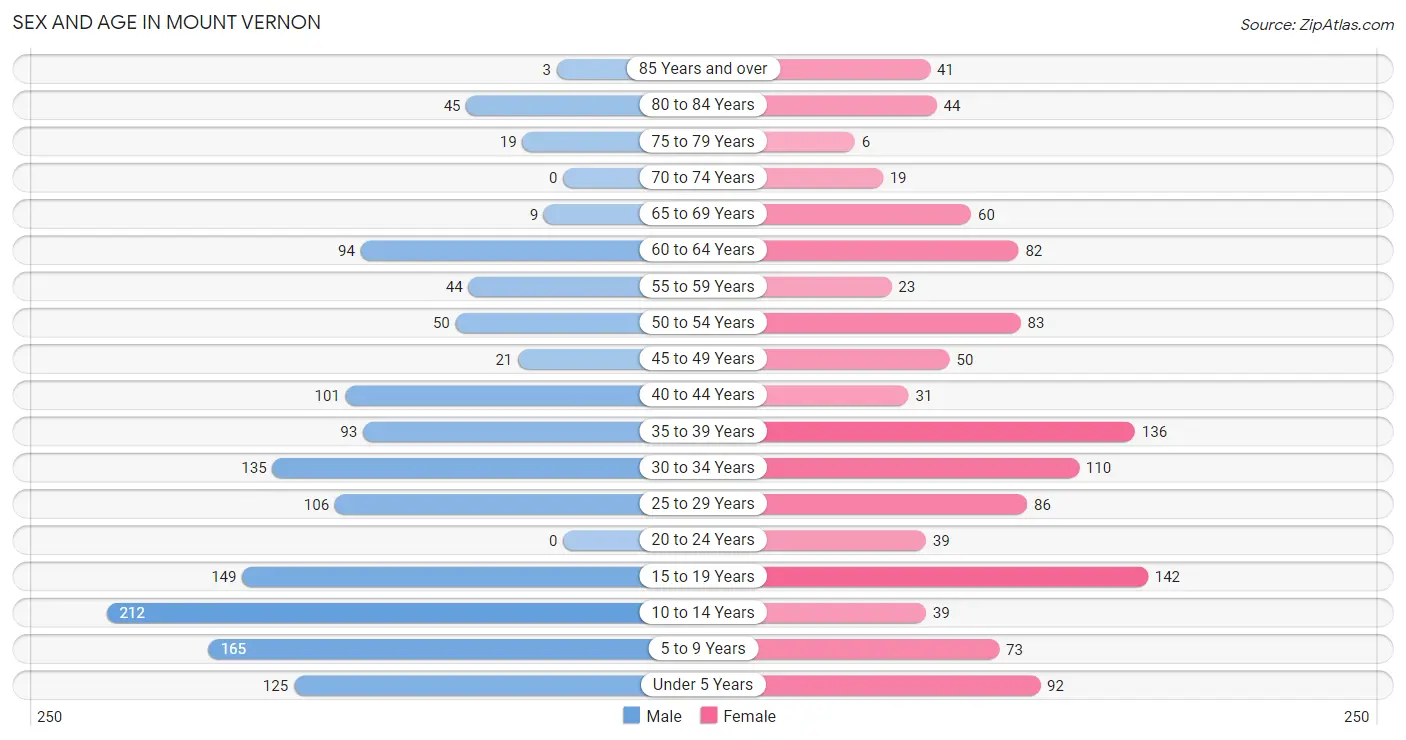
| Age Bracket | Male | Female |
| Under 5 Years | 125 (9.1%) | 92 (8.0%) |
| 5 to 9 Years | 165 (12.0%) | 73 (6.3%) |
| 10 to 14 Years | 212 (15.5%) | 39 (3.4%) |
| 15 to 19 Years | 149 (10.9%) | 142 (12.3%) |
| 20 to 24 Years | 0 (0.0%) | 39 (3.4%) |
| 25 to 29 Years | 106 (7.7%) | 86 (7.4%) |
| 30 to 34 Years | 135 (9.9%) | 110 (9.5%) |
| 35 to 39 Years | 93 (6.8%) | 136 (11.8%) |
| 40 to 44 Years | 101 (7.4%) | 31 (2.7%) |
| 45 to 49 Years | 21 (1.5%) | 50 (4.3%) |
| 50 to 54 Years | 50 (3.6%) | 83 (7.2%) |
| 55 to 59 Years | 44 (3.2%) | 23 (2.0%) |
| 60 to 64 Years | 94 (6.9%) | 82 (7.1%) |
| 65 to 69 Years | 9 (0.7%) | 60 (5.2%) |
| 70 to 74 Years | 0 (0.0%) | 19 (1.6%) |
| 75 to 79 Years | 19 (1.4%) | 6 (0.5%) |
| 80 to 84 Years | 45 (3.3%) | 44 (3.8%) |
| 85 Years and over | 3 (0.2%) | 41 (3.5%) |
| Total | 1,371 (100.0%) | 1,156 (100.0%) |
Families and Households in Mount Vernon
Median Family Size in Mount Vernon
The median family size in Mount Vernon is 3.97 persons per family, with single male/father families (20 | 3.7%) accounting for the largest median family size of 5.45 persons per family. On the other hand, single female/mother families (91 | 16.8%) represent the smallest median family size with 3.42 persons per family.
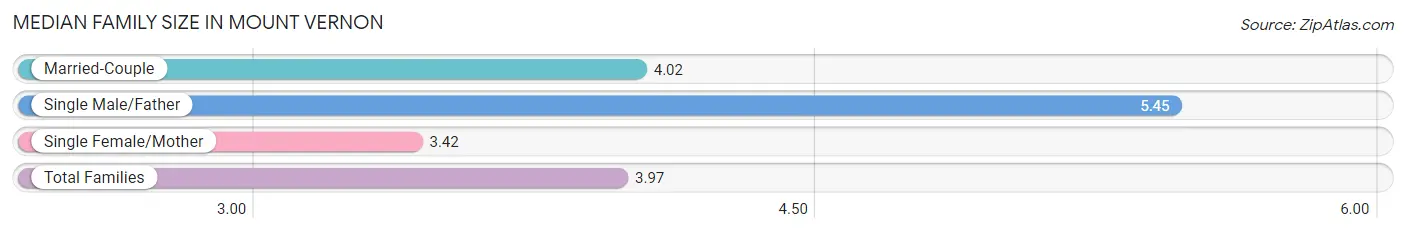
| Family Type | # Families | Family Size |
| Married-Couple | 432 (79.6%) | 4.02 |
| Single Male/Father | 20 (3.7%) | 5.45 |
| Single Female/Mother | 91 (16.8%) | 3.42 |
| Total Families | 543 (100.0%) | 3.97 |
Median Household Size in Mount Vernon
The median household size in Mount Vernon is 3.25 persons per household, with single male/father households (20 | 2.7%) accounting for the largest median household size of 5.8 persons per household. non-family households (205 | 27.4%) represent the smallest median household size with 1.14 persons per household.
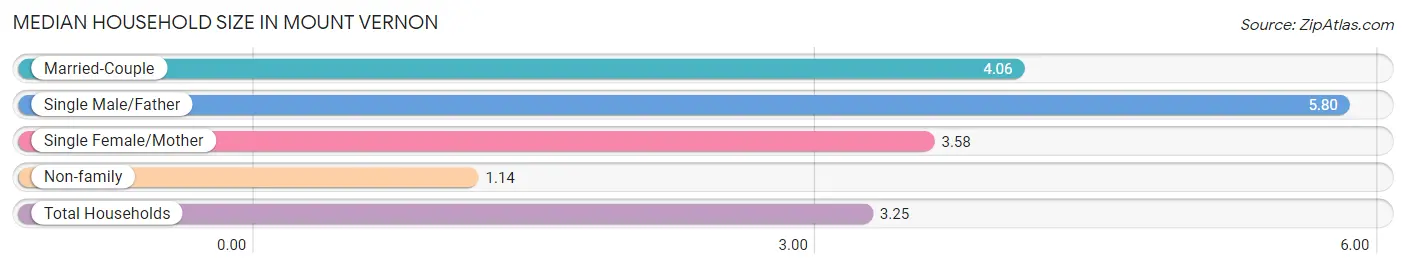
| Household Type | # Households | Household Size |
| Married-Couple | 432 (57.8%) | 4.06 |
| Single Male/Father | 20 (2.7%) | 5.80 |
| Single Female/Mother | 91 (12.2%) | 3.58 |
| Non-family | 205 (27.4%) | 1.14 |
| Total Households | 748 (100.0%) | 3.25 |
Household Size by Marriage Status in Mount Vernon
Out of a total of 748 households in Mount Vernon, 543 (72.6%) are family households, while 205 (27.4%) are nonfamily households. The most numerous type of family households are 3-person households, comprising 152, and the most common type of nonfamily households are 1-person households, comprising 169.
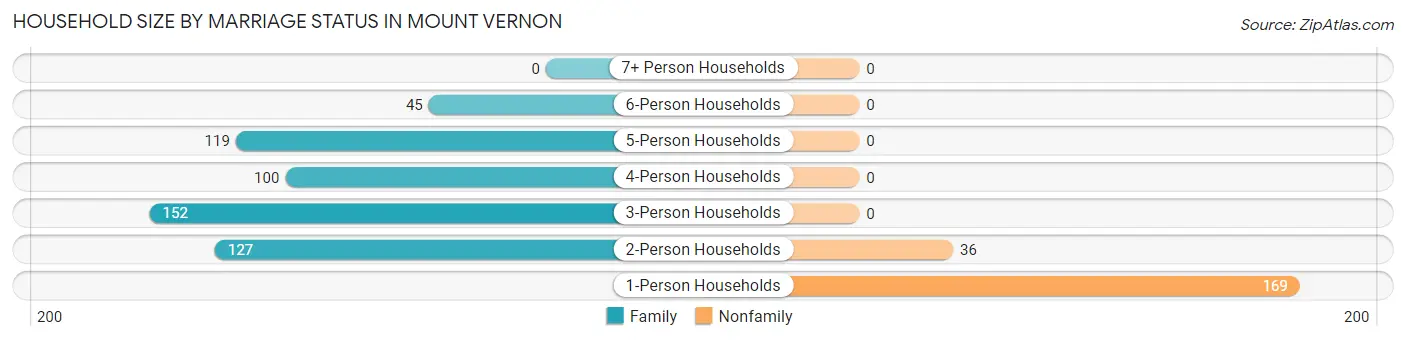
| Household Size | Family Households | Nonfamily Households |
| 1-Person Households | - | 169 (22.6%) |
| 2-Person Households | 127 (17.0%) | 36 (4.8%) |
| 3-Person Households | 152 (20.3%) | 0 (0.0%) |
| 4-Person Households | 100 (13.4%) | 0 (0.0%) |
| 5-Person Households | 119 (15.9%) | 0 (0.0%) |
| 6-Person Households | 45 (6.0%) | 0 (0.0%) |
| 7+ Person Households | 0 (0.0%) | 0 (0.0%) |
| Total | 543 (72.6%) | 205 (27.4%) |
Female Fertility in Mount Vernon
Fertility by Age in Mount Vernon
Average fertility rate in Mount Vernon is 17.0 births per 1,000 women. Women in the age bracket of 20 to 34 years have the highest fertility rate with 43.0 births per 1,000 women. Women in the age bracket of 20 to 34 years acount for 100.0% of all women with births.
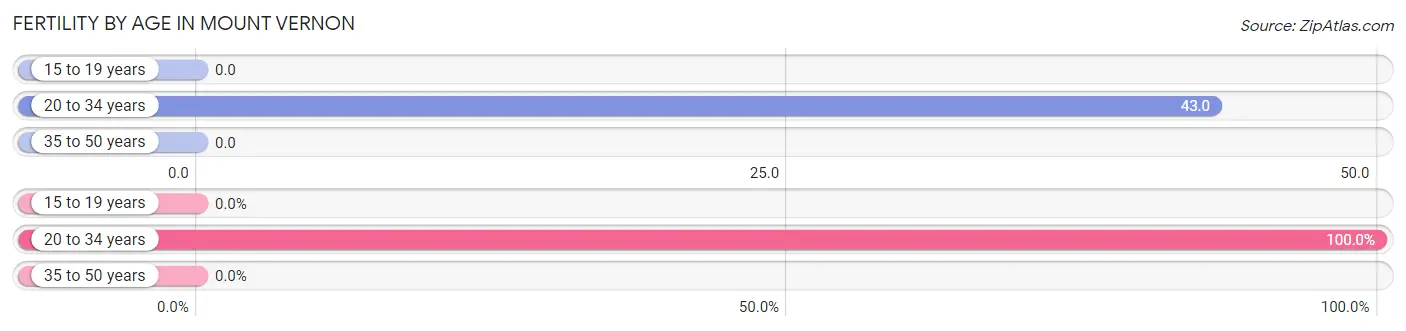
| Age Bracket | Women with Births | Births / 1,000 Women |
| 15 to 19 years | 0 (0.0%) | 0.0 |
| 20 to 34 years | 10 (100.0%) | 43.0 |
| 35 to 50 years | 0 (0.0%) | 0.0 |
| Total | 10 (100.0%) | 17.0 |
Fertility by Age by Marriage Status in Mount Vernon
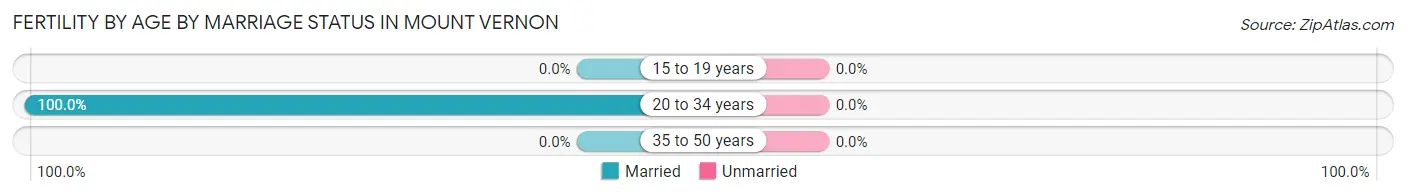
| Age Bracket | Married | Unmarried |
| 15 to 19 years | 0 (0.0%) | 0 (0.0%) |
| 20 to 34 years | 10 (100.0%) | 0 (0.0%) |
| 35 to 50 years | 0 (0.0%) | 0 (0.0%) |
| Total | 10 (100.0%) | 0 (0.0%) |
Fertility by Education in Mount Vernon
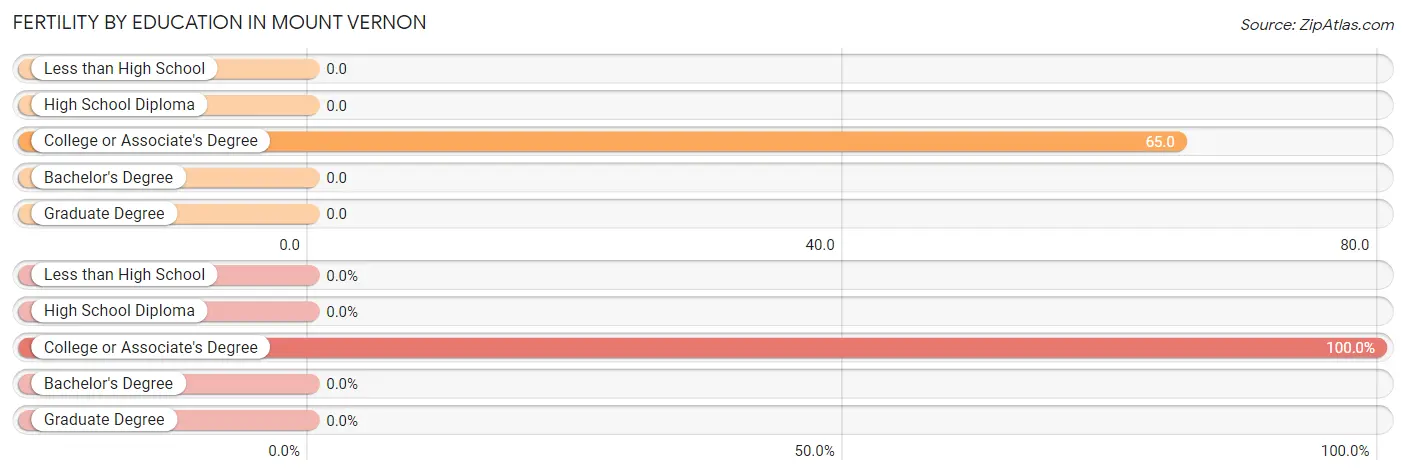
| Educational Attainment | Women with Births | Births / 1,000 Women |
| Less than High School | 0 (0.0%) | 0.0 |
| High School Diploma | 0 (0.0%) | 0.0 |
| College or Associate's Degree | 10 (100.0%) | 65.0 |
| Bachelor's Degree | 0 (0.0%) | 0.0 |
| Graduate Degree | 0 (0.0%) | 0.0 |
| Total | 10 (100.0%) | 17.0 |
Fertility by Education by Marriage Status in Mount Vernon
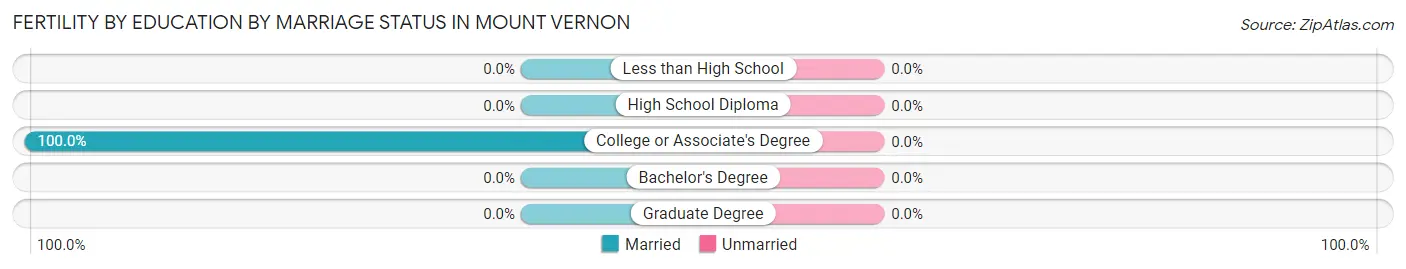
| Educational Attainment | Married | Unmarried |
| Less than High School | 0 (0.0%) | 0 (0.0%) |
| High School Diploma | 0 (0.0%) | 0 (0.0%) |
| College or Associate's Degree | 10 (100.0%) | 0 (0.0%) |
| Bachelor's Degree | 0 (0.0%) | 0 (0.0%) |
| Graduate Degree | 0 (0.0%) | 0 (0.0%) |
| Total | 10 (100.0%) | 0 (0.0%) |
Employment Characteristics in Mount Vernon
Employment by Class of Employer in Mount Vernon
Among the 1,052 employed individuals in Mount Vernon, private company employees (745 | 70.8%), local government employees (124 | 11.8%), and state government employees (105 | 10.0%) make up the most common classes of employment.
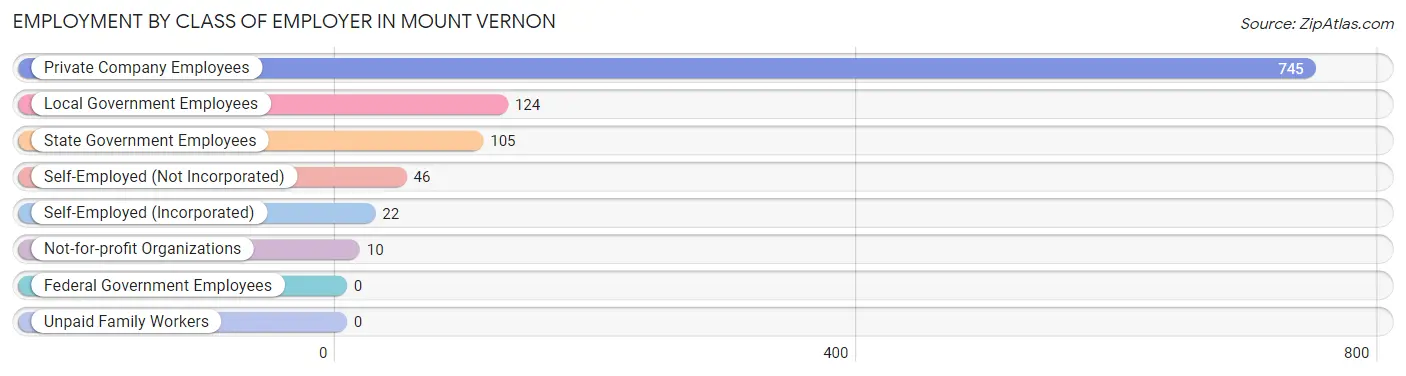
| Employer Class | # Employees | % Employees |
| Private Company Employees | 745 | 70.8% |
| Self-Employed (Incorporated) | 22 | 2.1% |
| Self-Employed (Not Incorporated) | 46 | 4.4% |
| Not-for-profit Organizations | 10 | 0.9% |
| Local Government Employees | 124 | 11.8% |
| State Government Employees | 105 | 10.0% |
| Federal Government Employees | 0 | 0.0% |
| Unpaid Family Workers | 0 | 0.0% |
| Total | 1,052 | 100.0% |
Employment Status by Age in Mount Vernon
According to the labor force statistics for Mount Vernon, out of the total population over 16 years of age (1,714), 65.7% or 1,126 individuals are in the labor force, with 6.0% or 68 of them unemployed. The age group with the highest labor force participation rate is 20 to 24 years, with 92.3% or 36 individuals in the labor force. Within the labor force, the 20 to 24 years age range has the highest percentage of unemployed individuals, with 100.0% or 36 of them being unemployed.
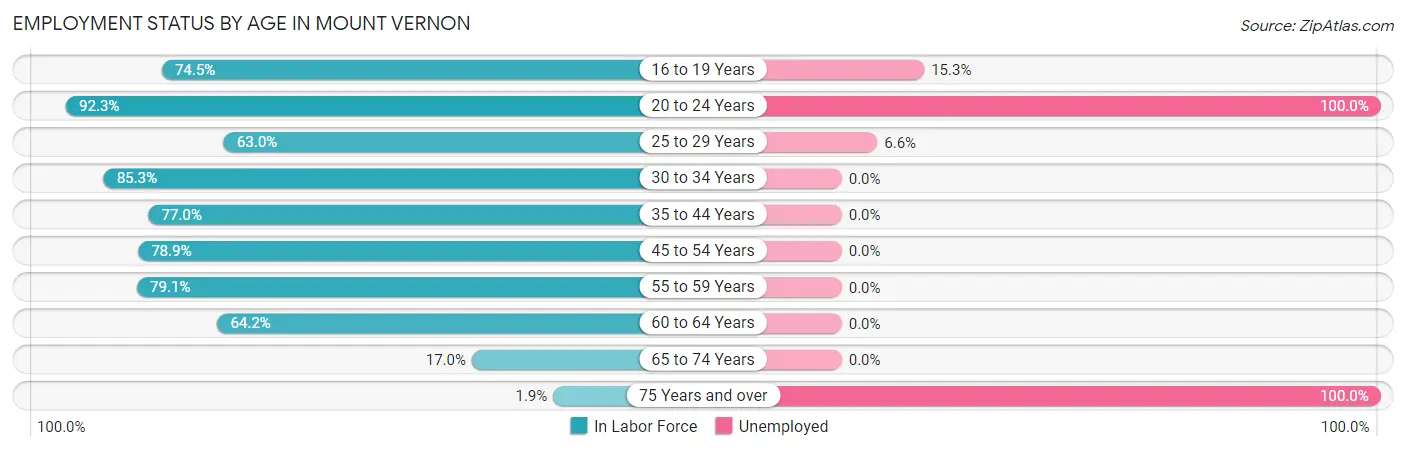
| Age Bracket | In Labor Force | Unemployed |
| 16 to 19 Years | 137 (74.5%) | 21 (15.3%) |
| 20 to 24 Years | 36 (92.3%) | 36 (100.0%) |
| 25 to 29 Years | 121 (63.0%) | 8 (6.6%) |
| 30 to 34 Years | 209 (85.3%) | 0 (0.0%) |
| 35 to 44 Years | 278 (77.0%) | 0 (0.0%) |
| 45 to 54 Years | 161 (78.9%) | 0 (0.0%) |
| 55 to 59 Years | 53 (79.1%) | 0 (0.0%) |
| 60 to 64 Years | 113 (64.2%) | 0 (0.0%) |
| 65 to 74 Years | 15 (17.0%) | 0 (0.0%) |
| 75 Years and over | 3 (1.9%) | 3 (100.0%) |
| Total | 1,126 (65.7%) | 68 (6.0%) |
Employment Status by Educational Attainment in Mount Vernon
According to labor force statistics for Mount Vernon, 75.1% of individuals (935) out of the total population between 25 and 64 years of age (1,245) are in the labor force, with 0.9% or 8 of them being unemployed. The group with the highest labor force participation rate are those with the educational attainment of bachelor's degree or higher, with 86.9% or 192 individuals in the labor force. Within the labor force, individuals with high school diploma education have the highest percentage of unemployment, with 4.3% or 8 of them being unemployed.
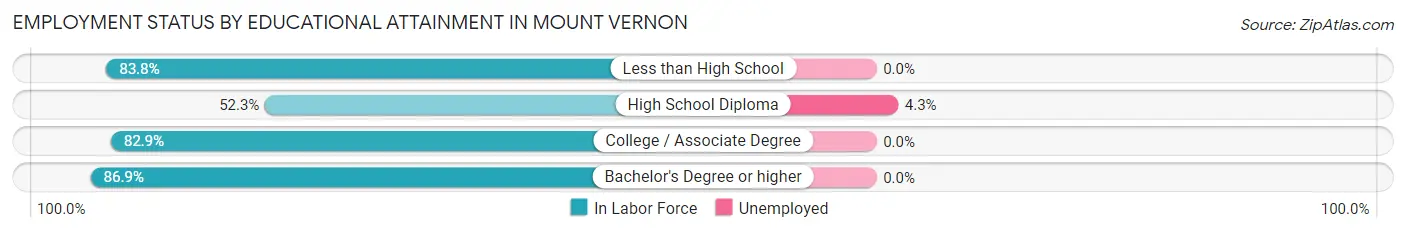
| Educational Attainment | In Labor Force | Unemployed |
| Less than High School | 196 (83.8%) | 0 (0.0%) |
| High School Diploma | 184 (52.3%) | 15 (4.3%) |
| College / Associate Degree | 363 (82.9%) | 0 (0.0%) |
| Bachelor's Degree or higher | 192 (86.9%) | 0 (0.0%) |
| Total | 935 (75.1%) | 11 (0.9%) |
Employment Occupations by Sex in Mount Vernon
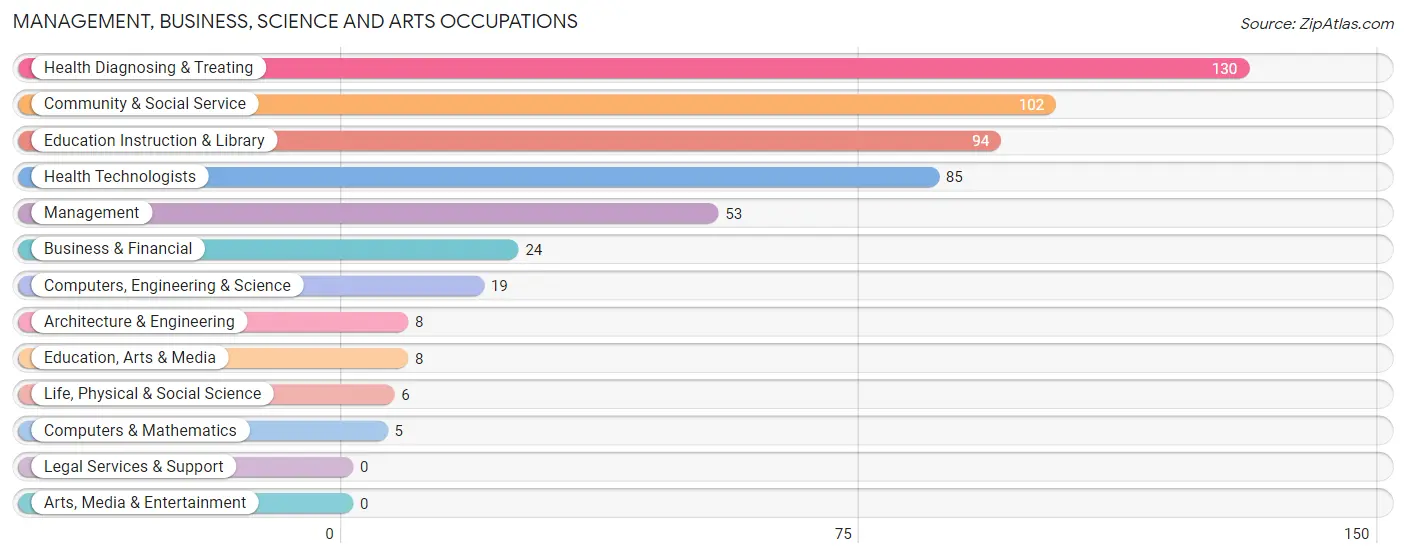
Management, Business, Science and Arts Occupations
The most common Management, Business, Science and Arts occupations in Mount Vernon are Health Diagnosing & Treating (130 | 12.3%), Community & Social Service (102 | 9.6%), Education Instruction & Library (94 | 8.9%), Health Technologists (85 | 8.0%), and Management (53 | 5.0%).
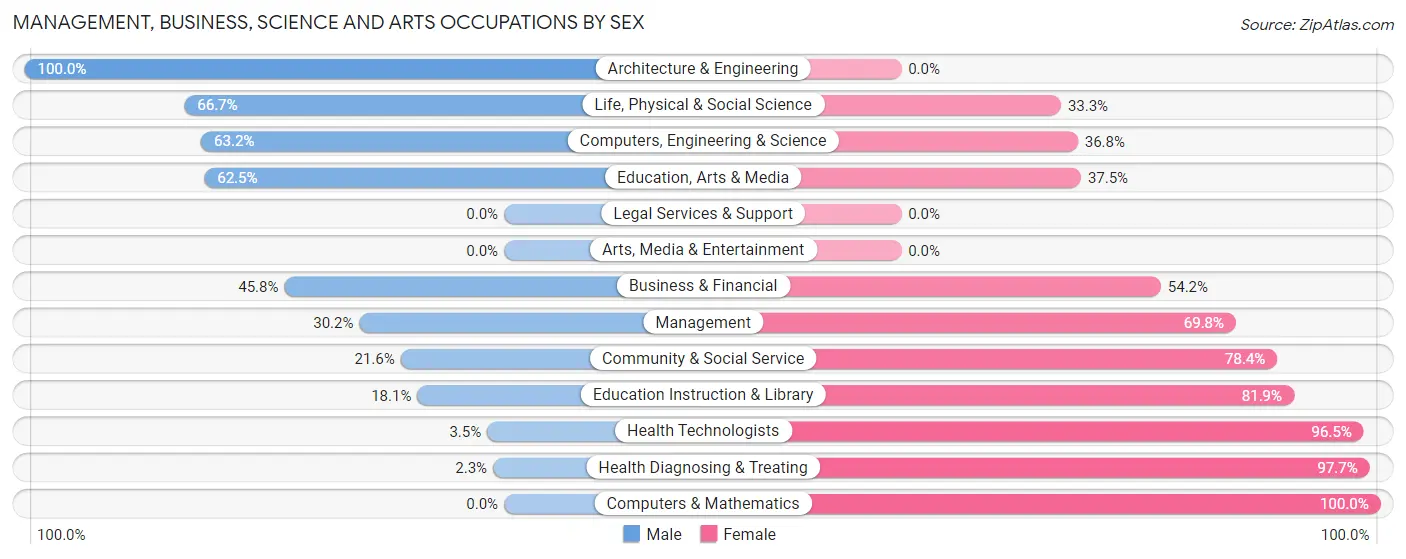
Management, Business, Science and Arts Occupations by Sex
Within the Management, Business, Science and Arts occupations in Mount Vernon, the most male-oriented occupations are Architecture & Engineering (100.0%), Life, Physical & Social Science (66.7%), and Computers, Engineering & Science (63.2%), while the most female-oriented occupations are Computers & Mathematics (100.0%), Health Diagnosing & Treating (97.7%), and Health Technologists (96.5%).
| Occupation | Male | Female |
| Management | 16 (30.2%) | 37 (69.8%) |
| Business & Financial | 11 (45.8%) | 13 (54.2%) |
| Computers, Engineering & Science | 12 (63.2%) | 7 (36.8%) |
| Computers & Mathematics | 0 (0.0%) | 5 (100.0%) |
| Architecture & Engineering | 8 (100.0%) | 0 (0.0%) |
| Life, Physical & Social Science | 4 (66.7%) | 2 (33.3%) |
| Community & Social Service | 22 (21.6%) | 80 (78.4%) |
| Education, Arts & Media | 5 (62.5%) | 3 (37.5%) |
| Legal Services & Support | 0 (0.0%) | 0 (0.0%) |
| Education Instruction & Library | 17 (18.1%) | 77 (81.9%) |
| Arts, Media & Entertainment | 0 (0.0%) | 0 (0.0%) |
| Health Diagnosing & Treating | 3 (2.3%) | 127 (97.7%) |
| Health Technologists | 3 (3.5%) | 82 (96.5%) |
| Total (Category) | 64 (19.5%) | 264 (80.5%) |
| Total (Overall) | 611 (57.8%) | 447 (42.2%) |
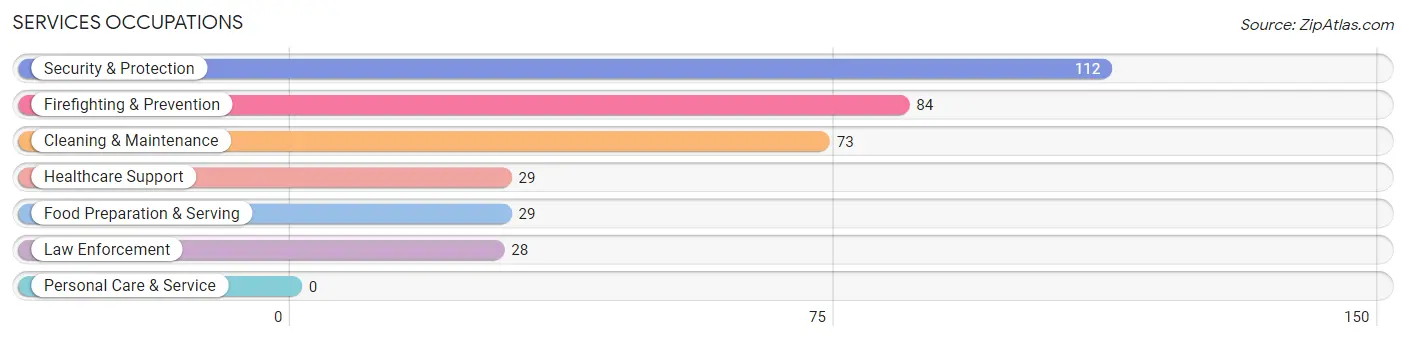
Services Occupations
The most common Services occupations in Mount Vernon are Security & Protection (112 | 10.6%), Firefighting & Prevention (84 | 7.9%), Cleaning & Maintenance (73 | 6.9%), Healthcare Support (29 | 2.7%), and Food Preparation & Serving (29 | 2.7%).
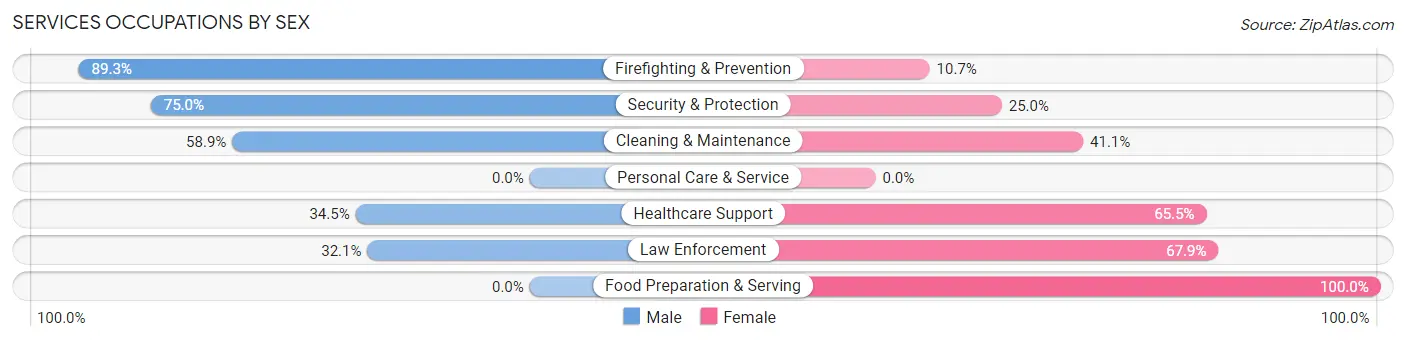
Services Occupations by Sex
Within the Services occupations in Mount Vernon, the most male-oriented occupations are Firefighting & Prevention (89.3%), Security & Protection (75.0%), and Cleaning & Maintenance (58.9%), while the most female-oriented occupations are Food Preparation & Serving (100.0%), Law Enforcement (67.9%), and Healthcare Support (65.5%).
| Occupation | Male | Female |
| Healthcare Support | 10 (34.5%) | 19 (65.5%) |
| Security & Protection | 84 (75.0%) | 28 (25.0%) |
| Firefighting & Prevention | 75 (89.3%) | 9 (10.7%) |
| Law Enforcement | 9 (32.1%) | 19 (67.9%) |
| Food Preparation & Serving | 0 (0.0%) | 29 (100.0%) |
| Cleaning & Maintenance | 43 (58.9%) | 30 (41.1%) |
| Personal Care & Service | 0 (0.0%) | 0 (0.0%) |
| Total (Category) | 137 (56.4%) | 106 (43.6%) |
| Total (Overall) | 611 (57.8%) | 447 (42.2%) |
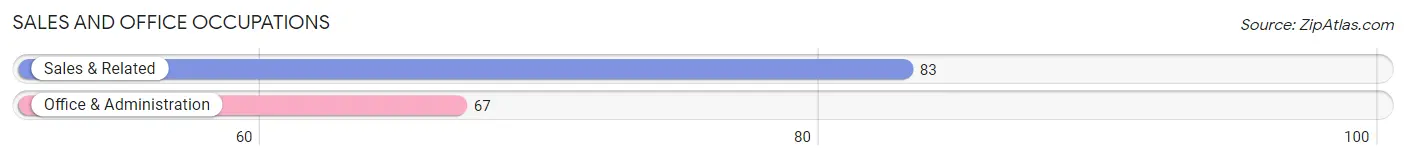
Sales and Office Occupations
The most common Sales and Office occupations in Mount Vernon are Sales & Related (83 | 7.8%), and Office & Administration (67 | 6.3%).
Sales and Office Occupations by Sex
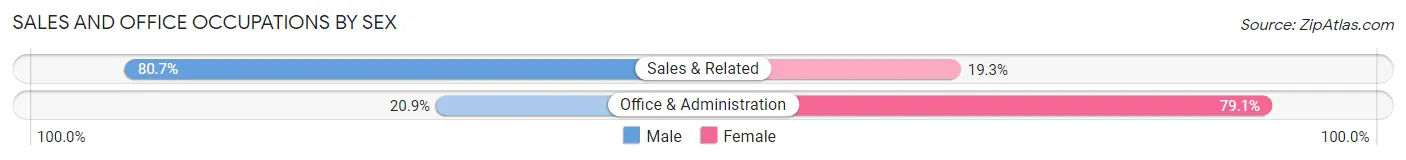
| Occupation | Male | Female |
| Sales & Related | 67 (80.7%) | 16 (19.3%) |
| Office & Administration | 14 (20.9%) | 53 (79.1%) |
| Total (Category) | 81 (54.0%) | 69 (46.0%) |
| Total (Overall) | 611 (57.8%) | 447 (42.2%) |
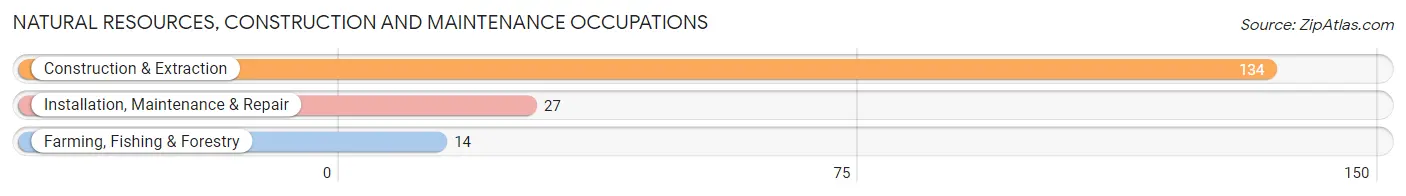
Natural Resources, Construction and Maintenance Occupations
The most common Natural Resources, Construction and Maintenance occupations in Mount Vernon are Construction & Extraction (134 | 12.7%), Installation, Maintenance & Repair (27 | 2.5%), and Farming, Fishing & Forestry (14 | 1.3%).
Natural Resources, Construction and Maintenance Occupations by Sex
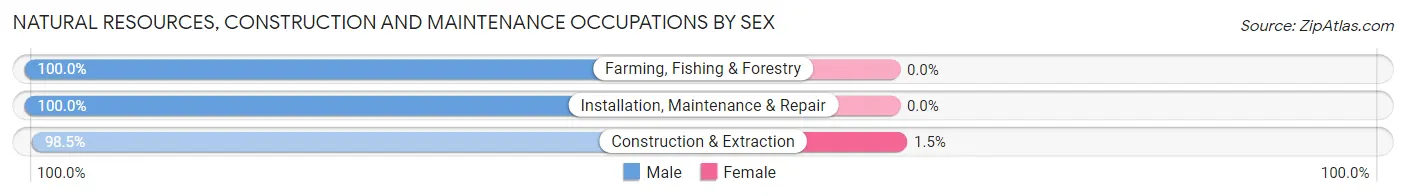
| Occupation | Male | Female |
| Farming, Fishing & Forestry | 14 (100.0%) | 0 (0.0%) |
| Construction & Extraction | 132 (98.5%) | 2 (1.5%) |
| Installation, Maintenance & Repair | 27 (100.0%) | 0 (0.0%) |
| Total (Category) | 173 (98.9%) | 2 (1.1%) |
| Total (Overall) | 611 (57.8%) | 447 (42.2%) |
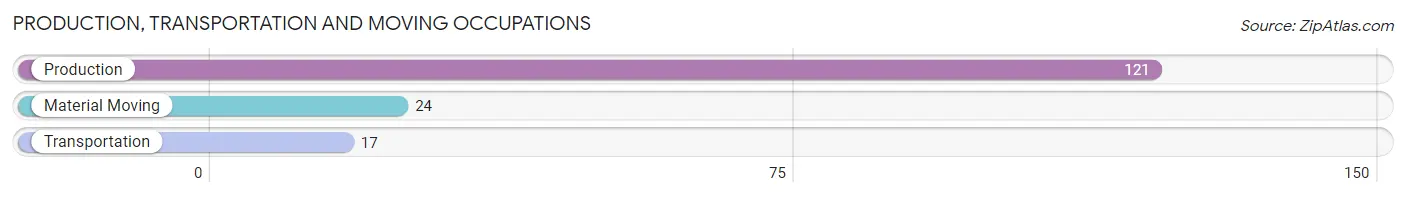
Production, Transportation and Moving Occupations
The most common Production, Transportation and Moving occupations in Mount Vernon are Production (121 | 11.4%), Material Moving (24 | 2.3%), and Transportation (17 | 1.6%).
Production, Transportation and Moving Occupations by Sex
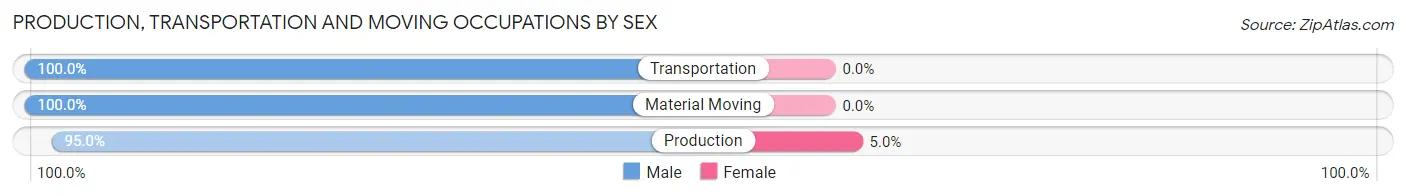
| Occupation | Male | Female |
| Production | 115 (95.0%) | 6 (5.0%) |
| Transportation | 17 (100.0%) | 0 (0.0%) |
| Material Moving | 24 (100.0%) | 0 (0.0%) |
| Total (Category) | 156 (96.3%) | 6 (3.7%) |
| Total (Overall) | 611 (57.8%) | 447 (42.2%) |
Employment Industries by Sex in Mount Vernon
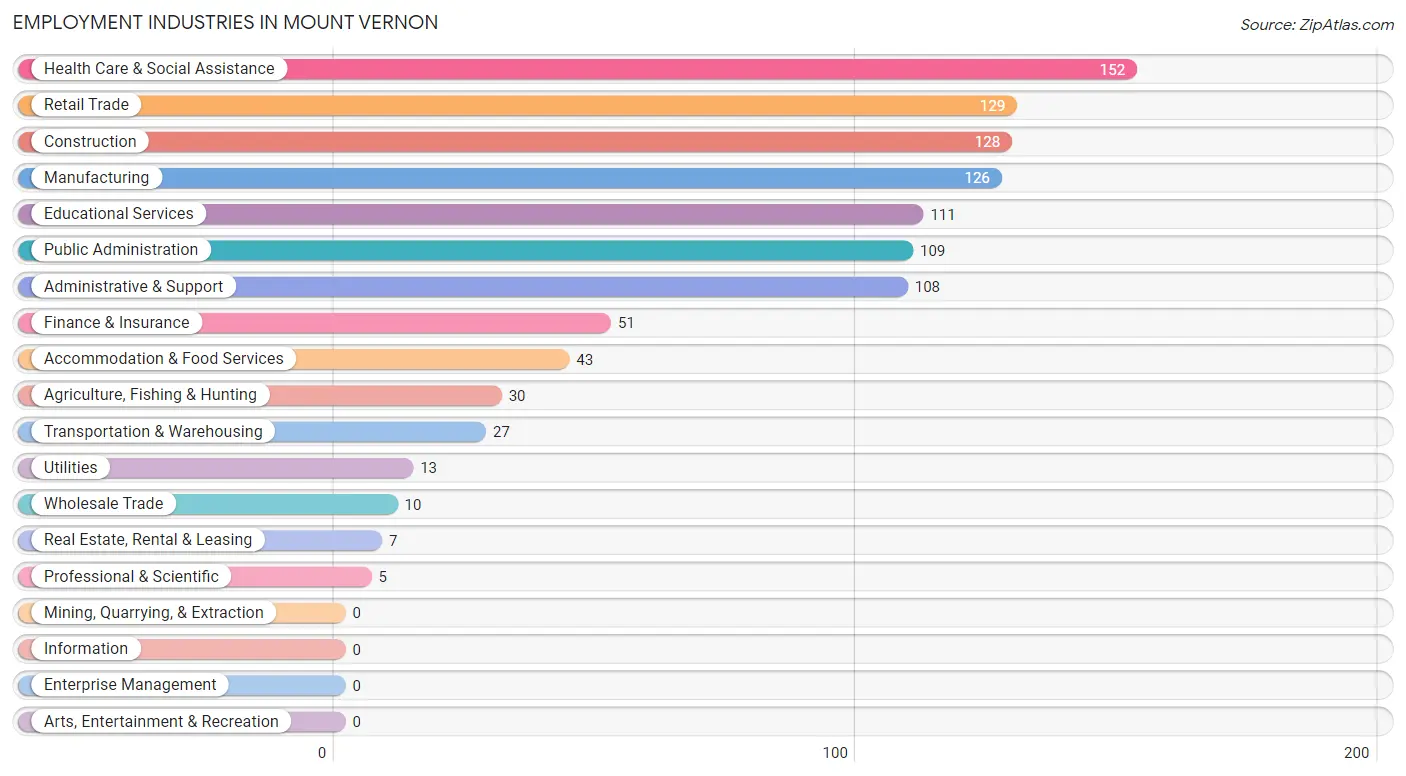
Employment Industries in Mount Vernon
The major employment industries in Mount Vernon include Health Care & Social Assistance (152 | 14.4%), Retail Trade (129 | 12.2%), Construction (128 | 12.1%), Manufacturing (126 | 11.9%), and Educational Services (111 | 10.5%).
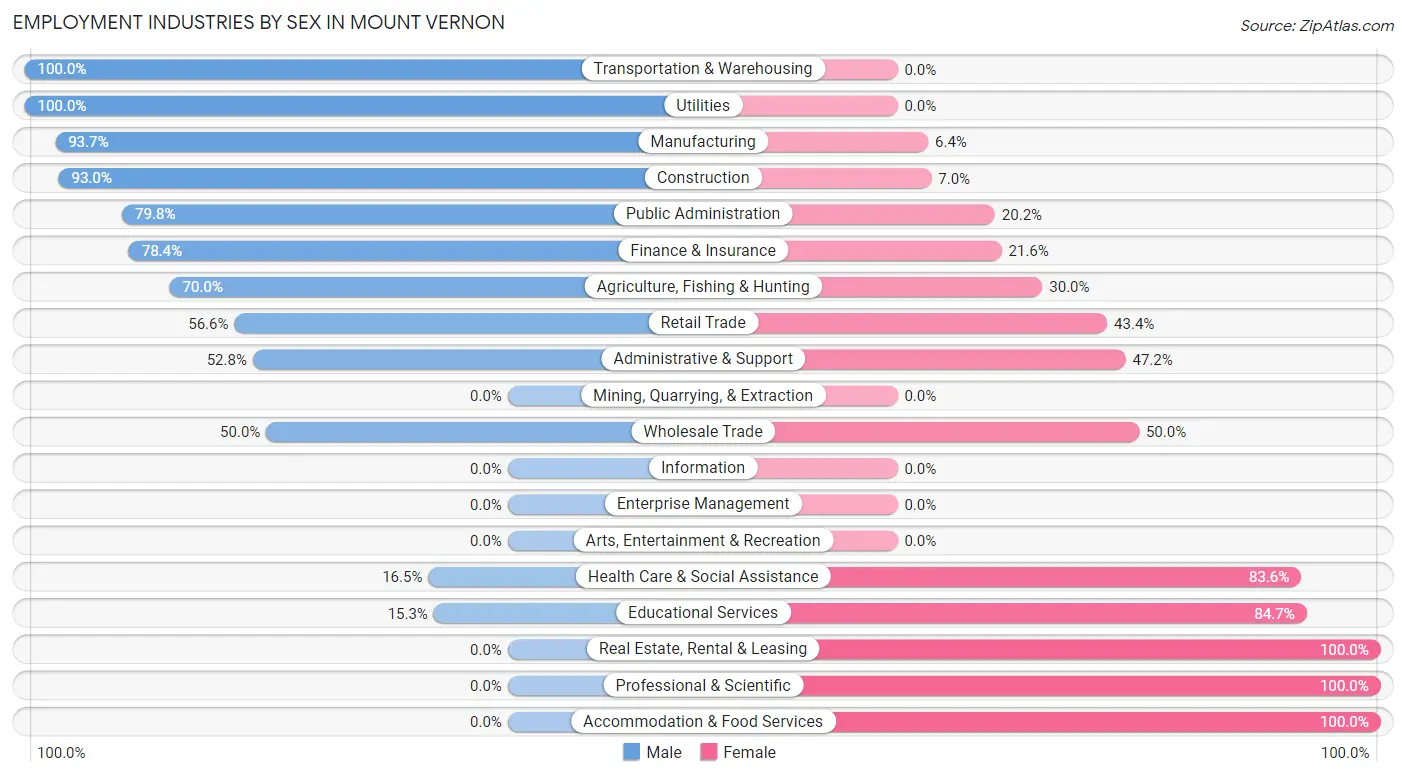
Employment Industries by Sex in Mount Vernon
The Mount Vernon industries that see more men than women are Transportation & Warehousing (100.0%), Utilities (100.0%), and Manufacturing (93.6%), whereas the industries that tend to have a higher number of women are Real Estate, Rental & Leasing (100.0%), Professional & Scientific (100.0%), and Accommodation & Food Services (100.0%).
| Industry | Male | Female |
| Agriculture, Fishing & Hunting | 21 (70.0%) | 9 (30.0%) |
| Mining, Quarrying, & Extraction | 0 (0.0%) | 0 (0.0%) |
| Construction | 119 (93.0%) | 9 (7.0%) |
| Manufacturing | 118 (93.6%) | 8 (6.4%) |
| Wholesale Trade | 5 (50.0%) | 5 (50.0%) |
| Retail Trade | 73 (56.6%) | 56 (43.4%) |
| Transportation & Warehousing | 27 (100.0%) | 0 (0.0%) |
| Utilities | 13 (100.0%) | 0 (0.0%) |
| Information | 0 (0.0%) | 0 (0.0%) |
| Finance & Insurance | 40 (78.4%) | 11 (21.6%) |
| Real Estate, Rental & Leasing | 0 (0.0%) | 7 (100.0%) |
| Professional & Scientific | 0 (0.0%) | 5 (100.0%) |
| Enterprise Management | 0 (0.0%) | 0 (0.0%) |
| Administrative & Support | 57 (52.8%) | 51 (47.2%) |
| Educational Services | 17 (15.3%) | 94 (84.7%) |
| Health Care & Social Assistance | 25 (16.5%) | 127 (83.6%) |
| Arts, Entertainment & Recreation | 0 (0.0%) | 0 (0.0%) |
| Accommodation & Food Services | 0 (0.0%) | 43 (100.0%) |
| Public Administration | 87 (79.8%) | 22 (20.2%) |
| Total | 611 (57.8%) | 447 (42.2%) |
Education in Mount Vernon
School Enrollment in Mount Vernon
The most common levels of schooling among the 716 students in Mount Vernon are high school (276 | 38.6%), middle school (206 | 28.8%), and elementary school (106 | 14.8%).
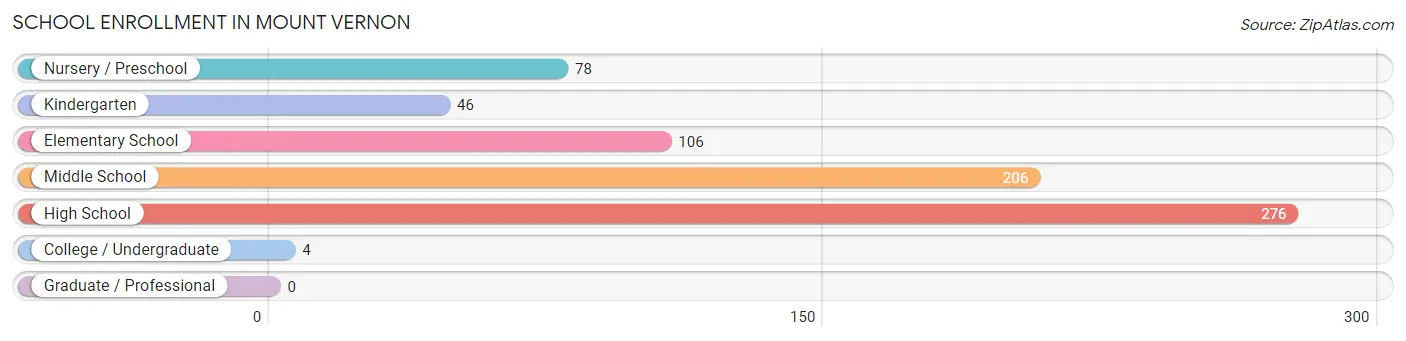
| School Level | # Students | % Students |
| Nursery / Preschool | 78 | 10.9% |
| Kindergarten | 46 | 6.4% |
| Elementary School | 106 | 14.8% |
| Middle School | 206 | 28.8% |
| High School | 276 | 38.6% |
| College / Undergraduate | 4 | 0.6% |
| Graduate / Professional | 0 | 0.0% |
| Total | 716 | 100.0% |
School Enrollment by Age by Funding Source in Mount Vernon
Out of a total of 716 students who are enrolled in schools in Mount Vernon, 18 (2.5%) attend a private institution, while the remaining 698 (97.5%) are enrolled in public schools. The age group of 15 to 17 year olds has the highest likelihood of being enrolled in private schools, with 10 (5.5% in the age bracket) enrolled. Conversely, the age group of 3 to 4 year olds has the lowest likelihood of being enrolled in a private school, with 47 (100.0% in the age bracket) attending a public institution.
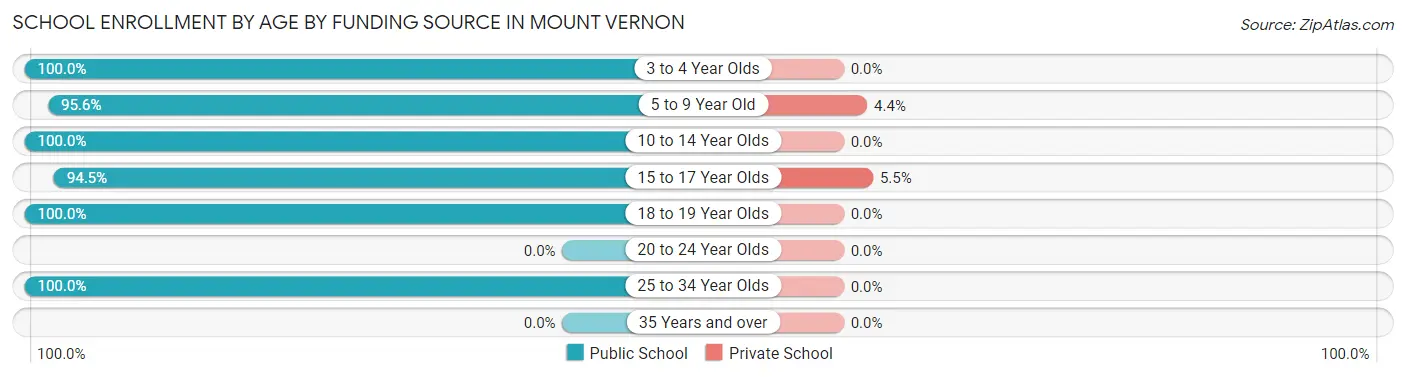
| Age Bracket | Public School | Private School |
| 3 to 4 Year Olds | 47 (100.0%) | 0 (0.0%) |
| 5 to 9 Year Old | 175 (95.6%) | 8 (4.4%) |
| 10 to 14 Year Olds | 251 (100.0%) | 0 (0.0%) |
| 15 to 17 Year Olds | 173 (94.5%) | 10 (5.5%) |
| 18 to 19 Year Olds | 42 (100.0%) | 0 (0.0%) |
| 20 to 24 Year Olds | 0 (0.0%) | 0 (0.0%) |
| 25 to 34 Year Olds | 10 (100.0%) | 0 (0.0%) |
| 35 Years and over | 0 (0.0%) | 0 (0.0%) |
| Total | 698 (97.5%) | 18 (2.5%) |
Educational Attainment by Field of Study in Mount Vernon
Education (93 | 30.7%), bio, nature & agricultural (39 | 12.9%), science & technology (39 | 12.9%), business (34 | 11.2%), and communications (30 | 9.9%) are the most common fields of study among 303 individuals in Mount Vernon who have obtained a bachelor's degree or higher.
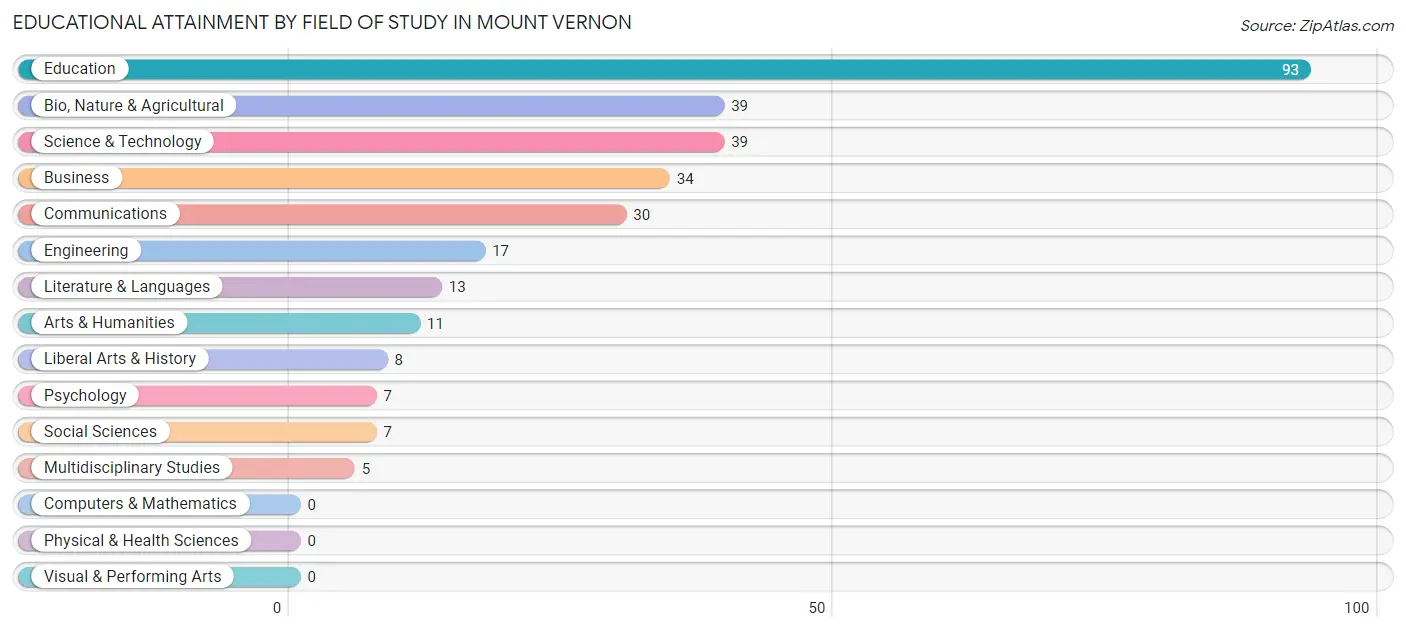
| Field of Study | # Graduates | % Graduates |
| Computers & Mathematics | 0 | 0.0% |
| Bio, Nature & Agricultural | 39 | 12.9% |
| Physical & Health Sciences | 0 | 0.0% |
| Psychology | 7 | 2.3% |
| Social Sciences | 7 | 2.3% |
| Engineering | 17 | 5.6% |
| Multidisciplinary Studies | 5 | 1.7% |
| Science & Technology | 39 | 12.9% |
| Business | 34 | 11.2% |
| Education | 93 | 30.7% |
| Literature & Languages | 13 | 4.3% |
| Liberal Arts & History | 8 | 2.6% |
| Visual & Performing Arts | 0 | 0.0% |
| Communications | 30 | 9.9% |
| Arts & Humanities | 11 | 3.6% |
| Total | 303 | 100.0% |
Transportation & Commute in Mount Vernon
Vehicle Availability by Sex in Mount Vernon
The most prevalent vehicle ownership categories in Mount Vernon are males with 2 vehicles (213, accounting for 34.9%) and females with 2 vehicles (174, making up 48.3%).
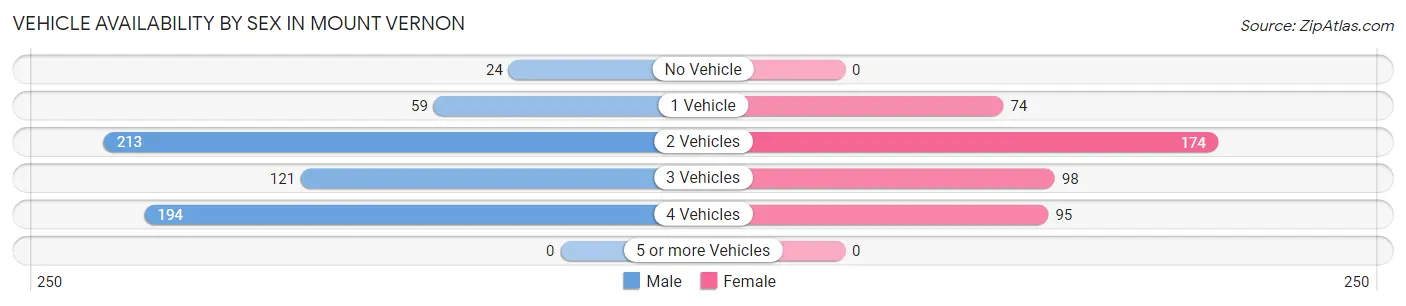
| Vehicles Available | Male | Female |
| No Vehicle | 24 (3.9%) | 0 (0.0%) |
| 1 Vehicle | 59 (9.7%) | 74 (16.8%) |
| 2 Vehicles | 213 (34.9%) | 174 (39.5%) |
| 3 Vehicles | 121 (19.8%) | 98 (22.2%) |
| 4 Vehicles | 194 (31.8%) | 95 (21.5%) |
| 5 or more Vehicles | 0 (0.0%) | 0 (0.0%) |
| Total | 611 (100.0%) | 441 (100.0%) |
Commute Time in Mount Vernon
The most frequently occuring commute durations in Mount Vernon are 5 to 9 minutes (280 commuters, 27.8%), 15 to 19 minutes (236 commuters, 23.5%), and 90 or more minutes (117 commuters, 11.6%).
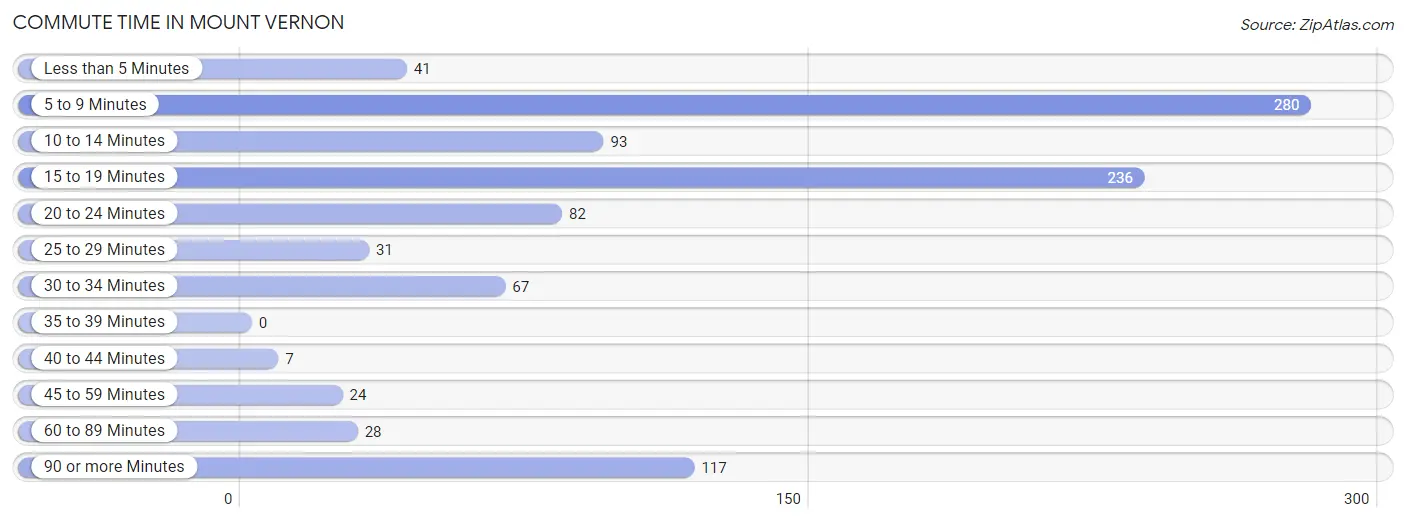
| Commute Time | # Commuters | % Commuters |
| Less than 5 Minutes | 41 | 4.1% |
| 5 to 9 Minutes | 280 | 27.8% |
| 10 to 14 Minutes | 93 | 9.2% |
| 15 to 19 Minutes | 236 | 23.5% |
| 20 to 24 Minutes | 82 | 8.2% |
| 25 to 29 Minutes | 31 | 3.1% |
| 30 to 34 Minutes | 67 | 6.7% |
| 35 to 39 Minutes | 0 | 0.0% |
| 40 to 44 Minutes | 7 | 0.7% |
| 45 to 59 Minutes | 24 | 2.4% |
| 60 to 89 Minutes | 28 | 2.8% |
| 90 or more Minutes | 117 | 11.6% |
Commute Time by Sex in Mount Vernon
The most common commute times in Mount Vernon are 15 to 19 minutes (191 commuters, 31.8%) for males and 5 to 9 minutes (200 commuters, 49.4%) for females.
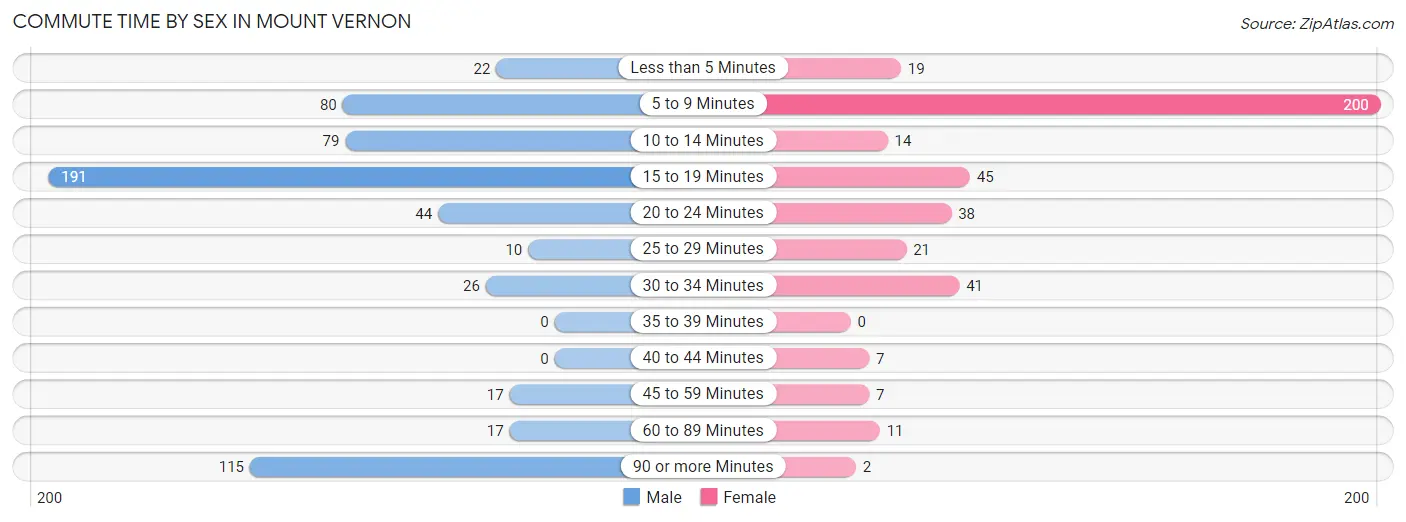
| Commute Time | Male | Female |
| Less than 5 Minutes | 22 (3.7%) | 19 (4.7%) |
| 5 to 9 Minutes | 80 (13.3%) | 200 (49.4%) |
| 10 to 14 Minutes | 79 (13.1%) | 14 (3.5%) |
| 15 to 19 Minutes | 191 (31.8%) | 45 (11.1%) |
| 20 to 24 Minutes | 44 (7.3%) | 38 (9.4%) |
| 25 to 29 Minutes | 10 (1.7%) | 21 (5.2%) |
| 30 to 34 Minutes | 26 (4.3%) | 41 (10.1%) |
| 35 to 39 Minutes | 0 (0.0%) | 0 (0.0%) |
| 40 to 44 Minutes | 0 (0.0%) | 7 (1.7%) |
| 45 to 59 Minutes | 17 (2.8%) | 7 (1.7%) |
| 60 to 89 Minutes | 17 (2.8%) | 11 (2.7%) |
| 90 or more Minutes | 115 (19.1%) | 2 (0.5%) |
Time of Departure to Work by Sex in Mount Vernon
The most frequent times of departure to work in Mount Vernon are 12:00 AM to 4:59 AM (114, 19.0%) for males and 7:00 AM to 7:29 AM (119, 29.4%) for females.
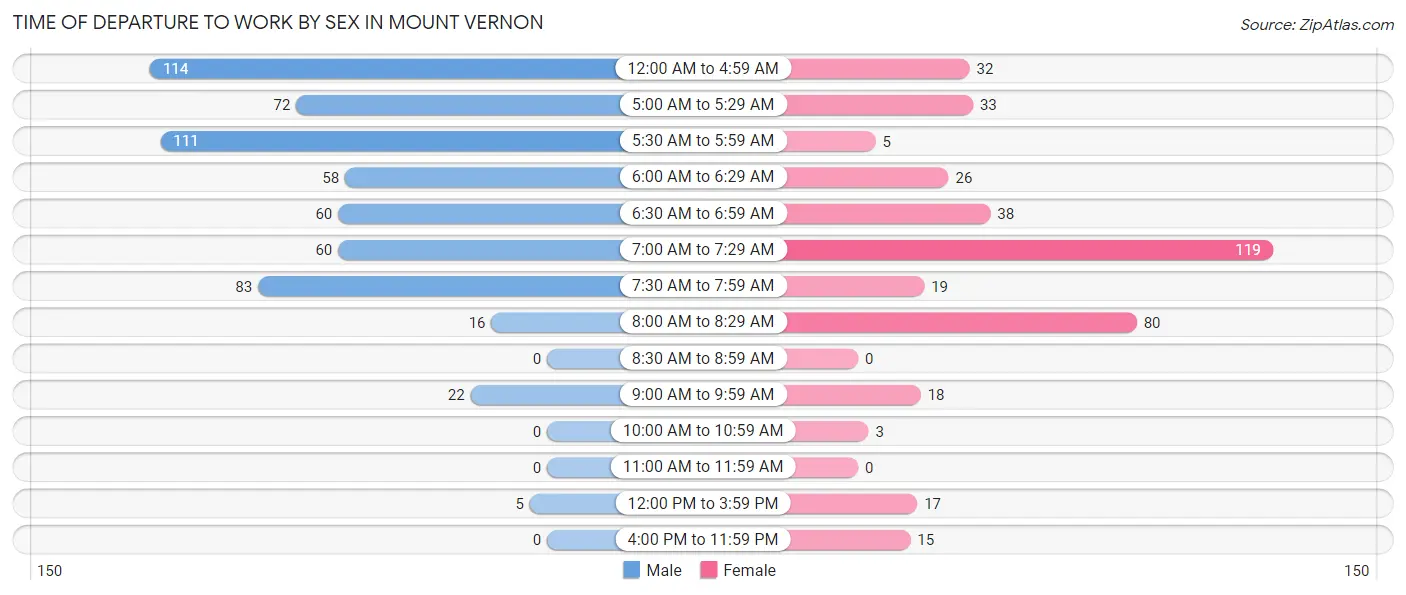
| Time of Departure | Male | Female |
| 12:00 AM to 4:59 AM | 114 (19.0%) | 32 (7.9%) |
| 5:00 AM to 5:29 AM | 72 (12.0%) | 33 (8.2%) |
| 5:30 AM to 5:59 AM | 111 (18.5%) | 5 (1.2%) |
| 6:00 AM to 6:29 AM | 58 (9.7%) | 26 (6.4%) |
| 6:30 AM to 6:59 AM | 60 (10.0%) | 38 (9.4%) |
| 7:00 AM to 7:29 AM | 60 (10.0%) | 119 (29.4%) |
| 7:30 AM to 7:59 AM | 83 (13.8%) | 19 (4.7%) |
| 8:00 AM to 8:29 AM | 16 (2.7%) | 80 (19.8%) |
| 8:30 AM to 8:59 AM | 0 (0.0%) | 0 (0.0%) |
| 9:00 AM to 9:59 AM | 22 (3.7%) | 18 (4.4%) |
| 10:00 AM to 10:59 AM | 0 (0.0%) | 3 (0.7%) |
| 11:00 AM to 11:59 AM | 0 (0.0%) | 0 (0.0%) |
| 12:00 PM to 3:59 PM | 5 (0.8%) | 17 (4.2%) |
| 4:00 PM to 11:59 PM | 0 (0.0%) | 15 (3.7%) |
| Total | 601 (100.0%) | 405 (100.0%) |
Housing Occupancy in Mount Vernon
Occupancy by Ownership in Mount Vernon
Of the total 748 dwellings in Mount Vernon, owner-occupied units account for 460 (61.5%), while renter-occupied units make up 288 (38.5%).
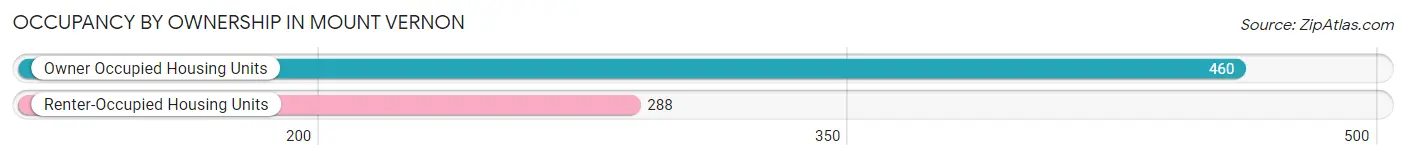
| Occupancy | # Housing Units | % Housing Units |
| Owner Occupied Housing Units | 460 | 61.5% |
| Renter-Occupied Housing Units | 288 | 38.5% |
| Total Occupied Housing Units | 748 | 100.0% |
Occupancy by Household Size in Mount Vernon
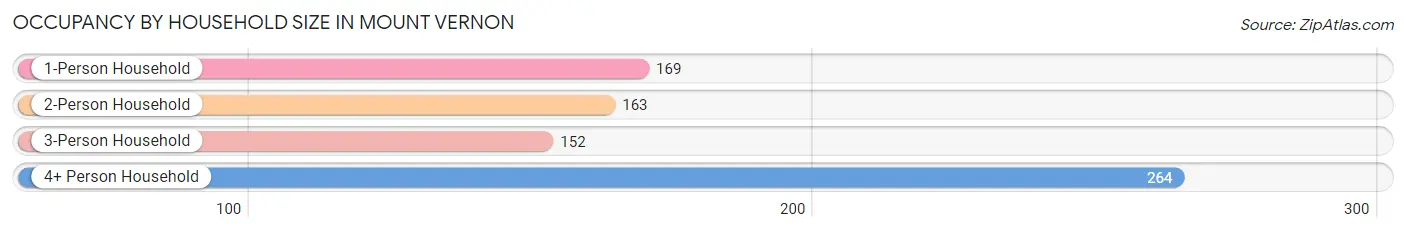
| Household Size | # Housing Units | % Housing Units |
| 1-Person Household | 169 | 22.6% |
| 2-Person Household | 163 | 21.8% |
| 3-Person Household | 152 | 20.3% |
| 4+ Person Household | 264 | 35.3% |
| Total Housing Units | 748 | 100.0% |
Occupancy by Ownership by Household Size in Mount Vernon
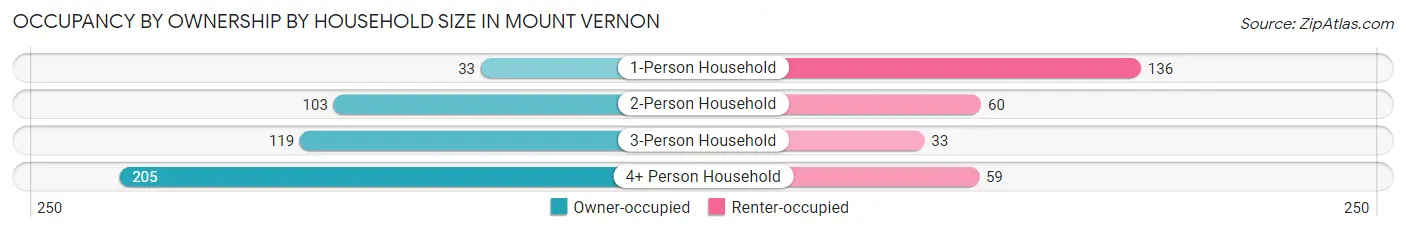
| Household Size | Owner-occupied | Renter-occupied |
| 1-Person Household | 33 (19.5%) | 136 (80.5%) |
| 2-Person Household | 103 (63.2%) | 60 (36.8%) |
| 3-Person Household | 119 (78.3%) | 33 (21.7%) |
| 4+ Person Household | 205 (77.6%) | 59 (22.4%) |
| Total Housing Units | 460 (61.5%) | 288 (38.5%) |
Occupancy by Educational Attainment in Mount Vernon
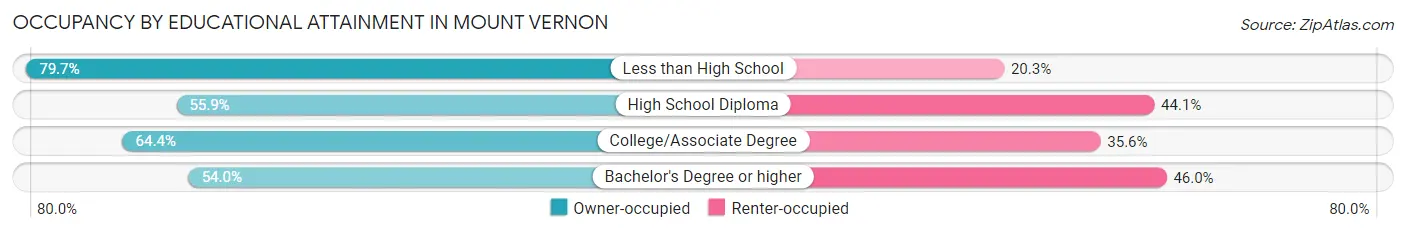
| Household Size | Owner-occupied | Renter-occupied |
| Less than High School | 59 (79.7%) | 15 (20.3%) |
| High School Diploma | 123 (55.9%) | 97 (44.1%) |
| College/Associate Degree | 203 (64.4%) | 112 (35.6%) |
| Bachelor's Degree or higher | 75 (54.0%) | 64 (46.0%) |
Occupancy by Age of Householder in Mount Vernon
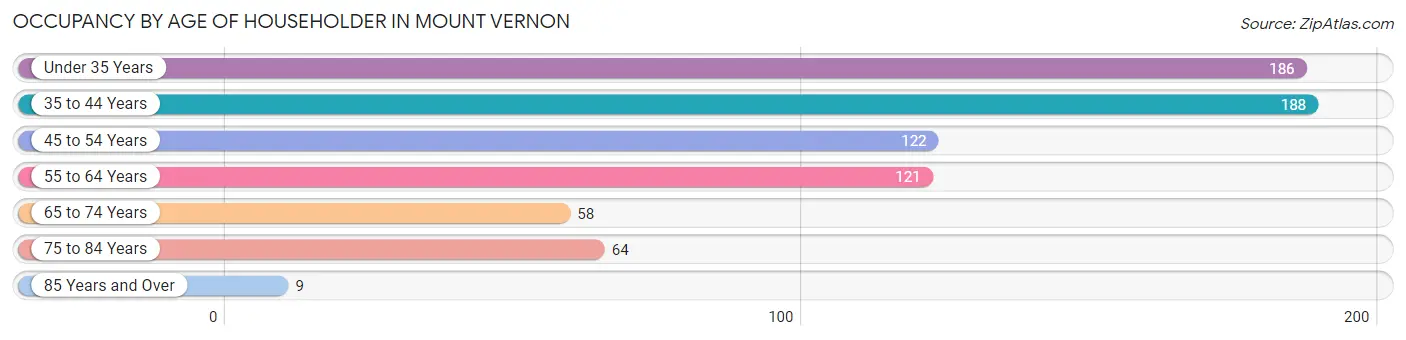
| Age Bracket | # Households | % Households |
| Under 35 Years | 186 | 24.9% |
| 35 to 44 Years | 188 | 25.1% |
| 45 to 54 Years | 122 | 16.3% |
| 55 to 64 Years | 121 | 16.2% |
| 65 to 74 Years | 58 | 7.7% |
| 75 to 84 Years | 64 | 8.6% |
| 85 Years and Over | 9 | 1.2% |
| Total | 748 | 100.0% |
Housing Finances in Mount Vernon
Median Income by Occupancy in Mount Vernon
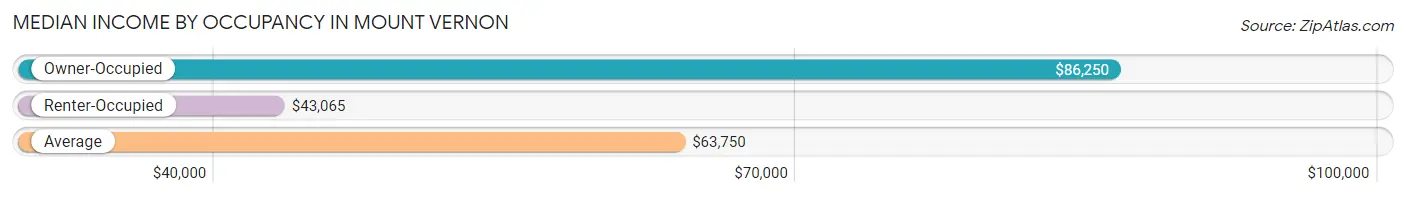
| Occupancy Type | # Households | Median Income |
| Owner-Occupied | 460 (61.5%) | $86,250 |
| Renter-Occupied | 288 (38.5%) | $43,065 |
| Average | 748 (100.0%) | $63,750 |
Occupancy by Householder Income Bracket in Mount Vernon
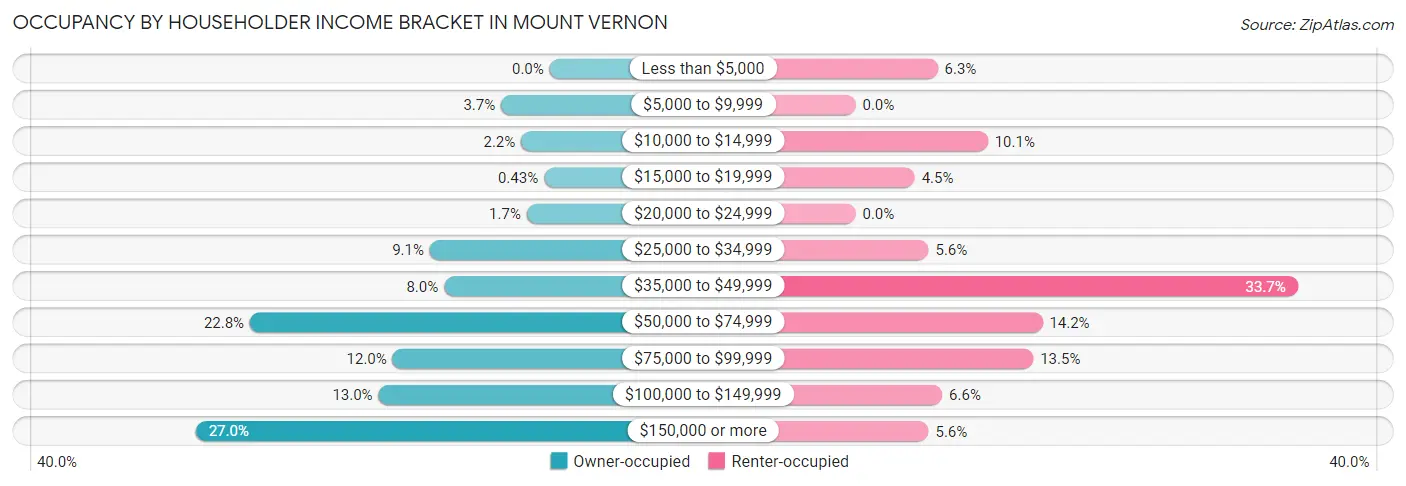
| Income Bracket | Owner-occupied | Renter-occupied |
| Less than $5,000 | 0 (0.0%) | 18 (6.2%) |
| $5,000 to $9,999 | 17 (3.7%) | 0 (0.0%) |
| $10,000 to $14,999 | 10 (2.2%) | 29 (10.1%) |
| $15,000 to $19,999 | 2 (0.4%) | 13 (4.5%) |
| $20,000 to $24,999 | 8 (1.7%) | 0 (0.0%) |
| $25,000 to $34,999 | 42 (9.1%) | 16 (5.6%) |
| $35,000 to $49,999 | 37 (8.0%) | 97 (33.7%) |
| $50,000 to $74,999 | 105 (22.8%) | 41 (14.2%) |
| $75,000 to $99,999 | 55 (12.0%) | 39 (13.5%) |
| $100,000 to $149,999 | 60 (13.0%) | 19 (6.6%) |
| $150,000 or more | 124 (27.0%) | 16 (5.6%) |
| Total | 460 (100.0%) | 288 (100.0%) |
Monthly Housing Cost Tiers in Mount Vernon
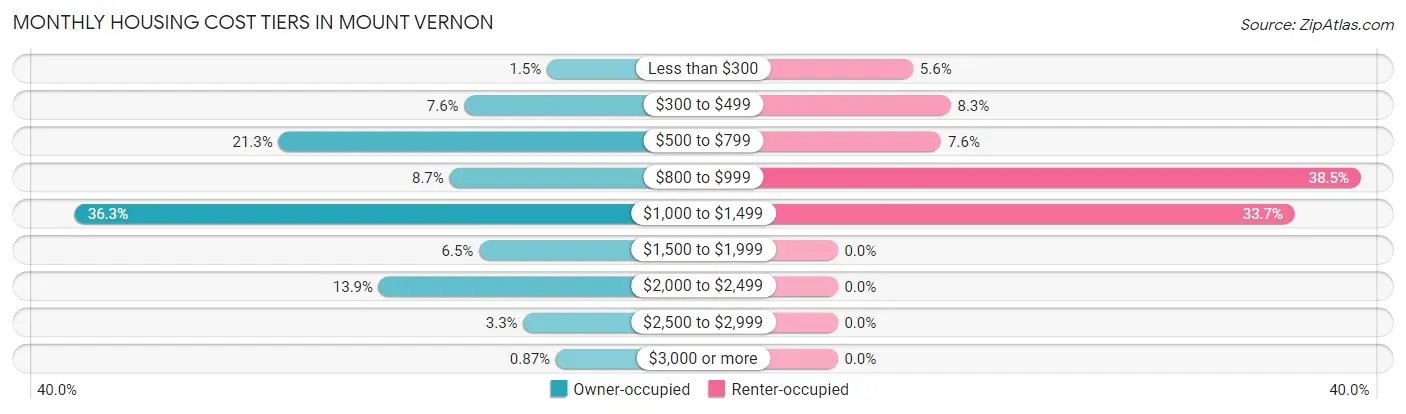
| Monthly Cost | Owner-occupied | Renter-occupied |
| Less than $300 | 7 (1.5%) | 16 (5.6%) |
| $300 to $499 | 35 (7.6%) | 24 (8.3%) |
| $500 to $799 | 98 (21.3%) | 22 (7.6%) |
| $800 to $999 | 40 (8.7%) | 111 (38.5%) |
| $1,000 to $1,499 | 167 (36.3%) | 97 (33.7%) |
| $1,500 to $1,999 | 30 (6.5%) | 0 (0.0%) |
| $2,000 to $2,499 | 64 (13.9%) | 0 (0.0%) |
| $2,500 to $2,999 | 15 (3.3%) | 0 (0.0%) |
| $3,000 or more | 4 (0.9%) | 0 (0.0%) |
| Total | 460 (100.0%) | 288 (100.0%) |
Physical Housing Characteristics in Mount Vernon
Housing Structures in Mount Vernon
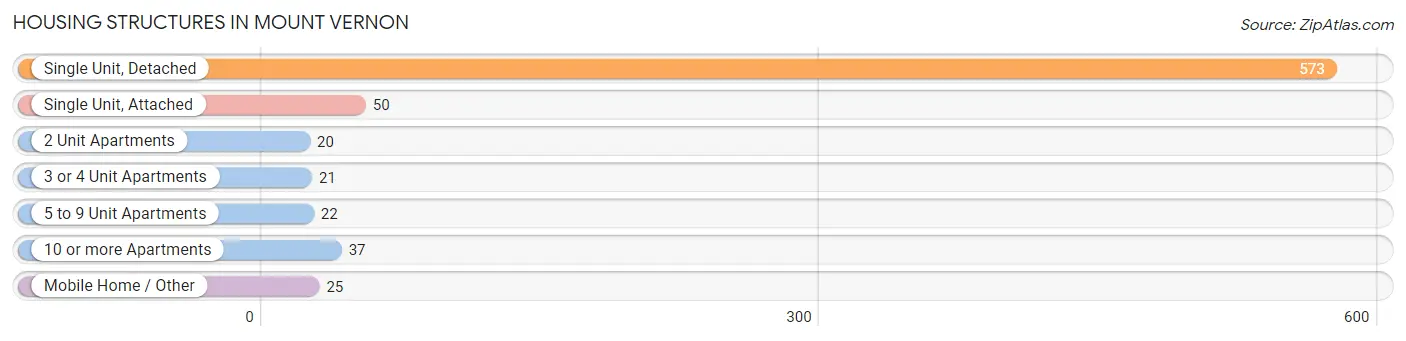
| Structure Type | # Housing Units | % Housing Units |
| Single Unit, Detached | 573 | 76.6% |
| Single Unit, Attached | 50 | 6.7% |
| 2 Unit Apartments | 20 | 2.7% |
| 3 or 4 Unit Apartments | 21 | 2.8% |
| 5 to 9 Unit Apartments | 22 | 2.9% |
| 10 or more Apartments | 37 | 5.0% |
| Mobile Home / Other | 25 | 3.3% |
| Total | 748 | 100.0% |
Housing Structures by Occupancy in Mount Vernon
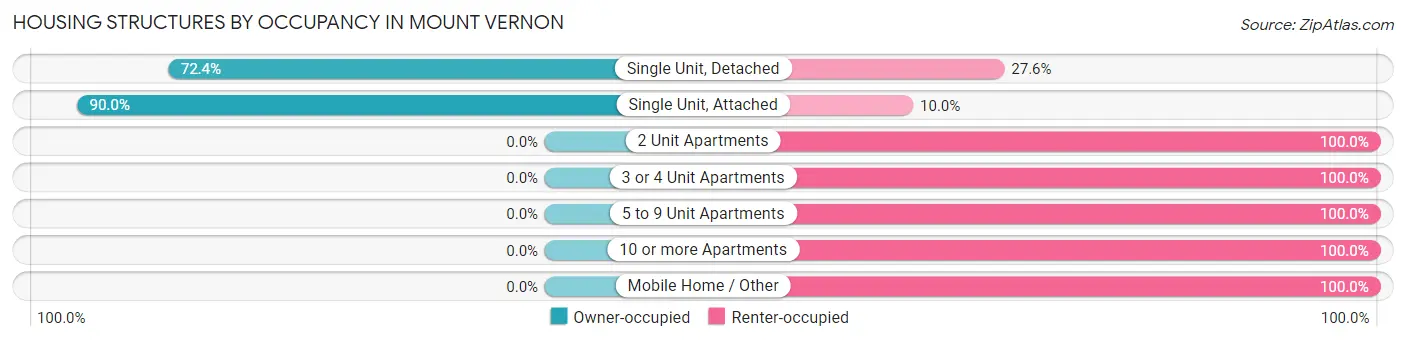
| Structure Type | Owner-occupied | Renter-occupied |
| Single Unit, Detached | 415 (72.4%) | 158 (27.6%) |
| Single Unit, Attached | 45 (90.0%) | 5 (10.0%) |
| 2 Unit Apartments | 0 (0.0%) | 20 (100.0%) |
| 3 or 4 Unit Apartments | 0 (0.0%) | 21 (100.0%) |
| 5 to 9 Unit Apartments | 0 (0.0%) | 22 (100.0%) |
| 10 or more Apartments | 0 (0.0%) | 37 (100.0%) |
| Mobile Home / Other | 0 (0.0%) | 25 (100.0%) |
| Total | 460 (61.5%) | 288 (38.5%) |
Housing Structures by Number of Rooms in Mount Vernon
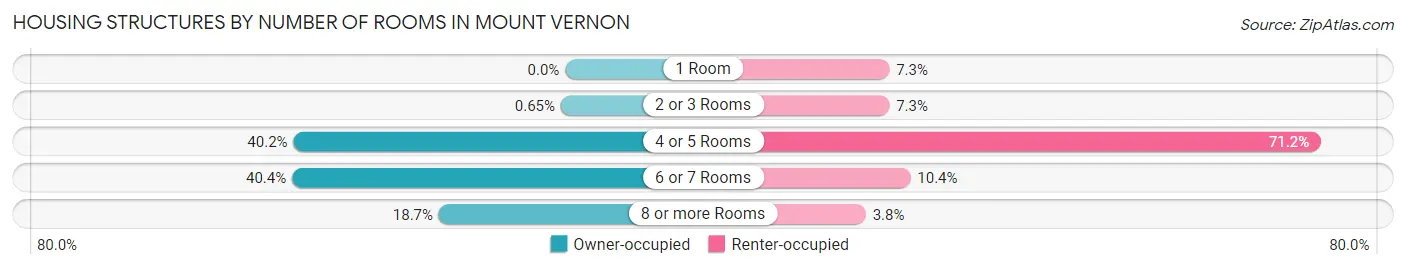
| Number of Rooms | Owner-occupied | Renter-occupied |
| 1 Room | 0 (0.0%) | 21 (7.3%) |
| 2 or 3 Rooms | 3 (0.6%) | 21 (7.3%) |
| 4 or 5 Rooms | 185 (40.2%) | 205 (71.2%) |
| 6 or 7 Rooms | 186 (40.4%) | 30 (10.4%) |
| 8 or more Rooms | 86 (18.7%) | 11 (3.8%) |
| Total | 460 (100.0%) | 288 (100.0%) |
Housing Structure by Heating Type in Mount Vernon
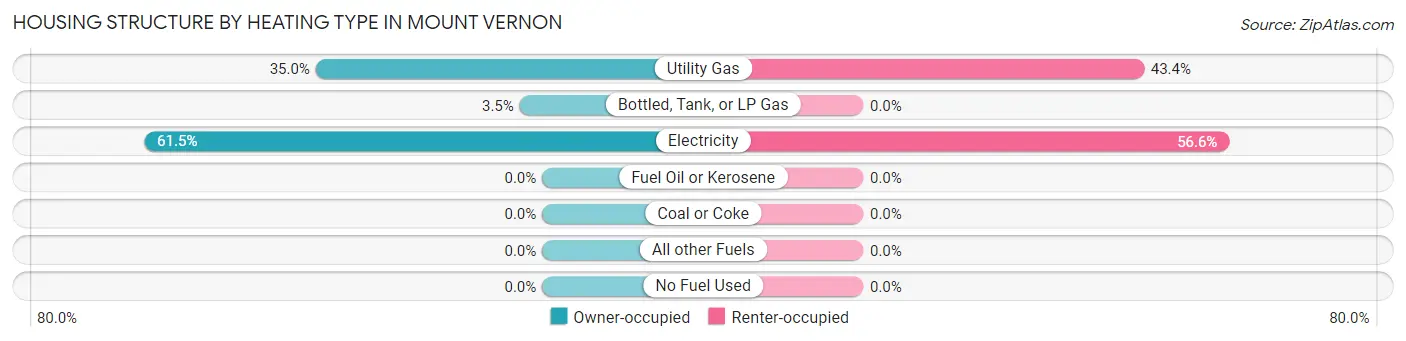
| Heating Type | Owner-occupied | Renter-occupied |
| Utility Gas | 161 (35.0%) | 125 (43.4%) |
| Bottled, Tank, or LP Gas | 16 (3.5%) | 0 (0.0%) |
| Electricity | 283 (61.5%) | 163 (56.6%) |
| Fuel Oil or Kerosene | 0 (0.0%) | 0 (0.0%) |
| Coal or Coke | 0 (0.0%) | 0 (0.0%) |
| All other Fuels | 0 (0.0%) | 0 (0.0%) |
| No Fuel Used | 0 (0.0%) | 0 (0.0%) |
| Total | 460 (100.0%) | 288 (100.0%) |
Household Vehicle Usage in Mount Vernon
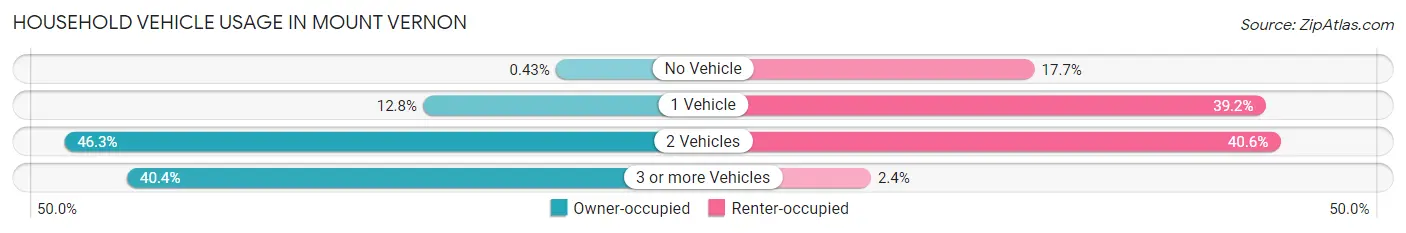
| Vehicles per Household | Owner-occupied | Renter-occupied |
| No Vehicle | 2 (0.4%) | 51 (17.7%) |
| 1 Vehicle | 59 (12.8%) | 113 (39.2%) |
| 2 Vehicles | 213 (46.3%) | 117 (40.6%) |
| 3 or more Vehicles | 186 (40.4%) | 7 (2.4%) |
| Total | 460 (100.0%) | 288 (100.0%) |
Real Estate & Mortgages in Mount Vernon
Real Estate and Mortgage Overview in Mount Vernon
| Characteristic | Without Mortgage | With Mortgage |
| Housing Units | 174 | 286 |
| Median Property Value | $190,000 | $149,100 |
| Median Household Income | $62,917 | $109 |
| Monthly Housing Costs | $618 | $4 |
| Real Estate Taxes | $1,491 | $0 |
Property Value by Mortgage Status in Mount Vernon
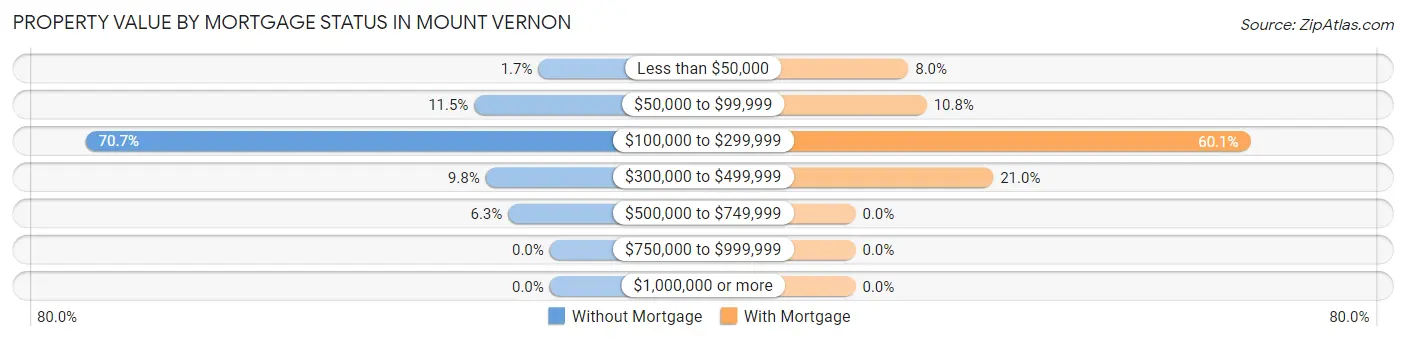
| Property Value | Without Mortgage | With Mortgage |
| Less than $50,000 | 3 (1.7%) | 23 (8.0%) |
| $50,000 to $99,999 | 20 (11.5%) | 31 (10.8%) |
| $100,000 to $299,999 | 123 (70.7%) | 172 (60.1%) |
| $300,000 to $499,999 | 17 (9.8%) | 60 (21.0%) |
| $500,000 to $749,999 | 11 (6.3%) | 0 (0.0%) |
| $750,000 to $999,999 | 0 (0.0%) | 0 (0.0%) |
| $1,000,000 or more | 0 (0.0%) | 0 (0.0%) |
| Total | 174 (100.0%) | 286 (100.0%) |
Household Income by Mortgage Status in Mount Vernon
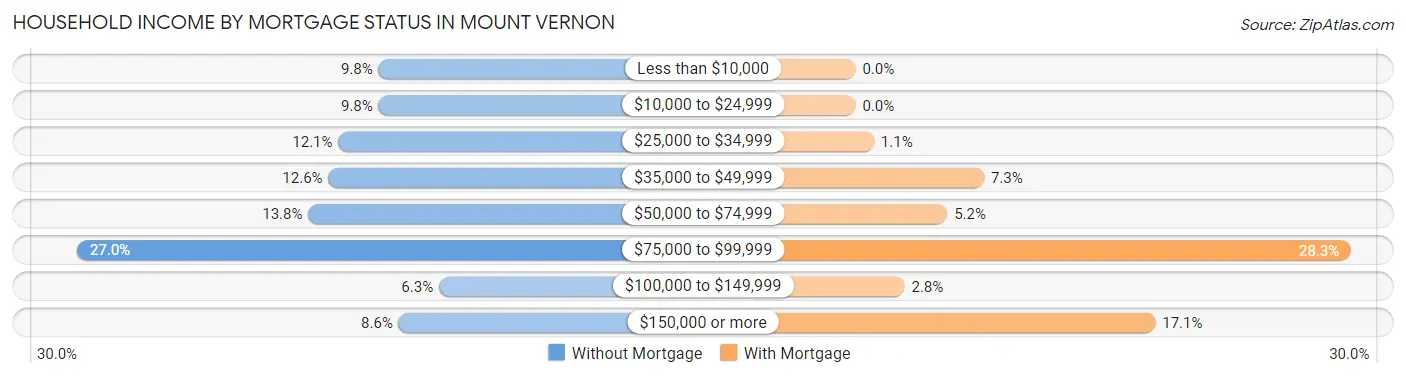
| Household Income | Without Mortgage | With Mortgage |
| Less than $10,000 | 17 (9.8%) | 0 (0.0%) |
| $10,000 to $24,999 | 17 (9.8%) | 0 (0.0%) |
| $25,000 to $34,999 | 21 (12.1%) | 3 (1.1%) |
| $35,000 to $49,999 | 22 (12.6%) | 21 (7.3%) |
| $50,000 to $74,999 | 24 (13.8%) | 15 (5.2%) |
| $75,000 to $99,999 | 47 (27.0%) | 81 (28.3%) |
| $100,000 to $149,999 | 11 (6.3%) | 8 (2.8%) |
| $150,000 or more | 15 (8.6%) | 49 (17.1%) |
| Total | 174 (100.0%) | 286 (100.0%) |
Property Value to Household Income Ratio in Mount Vernon
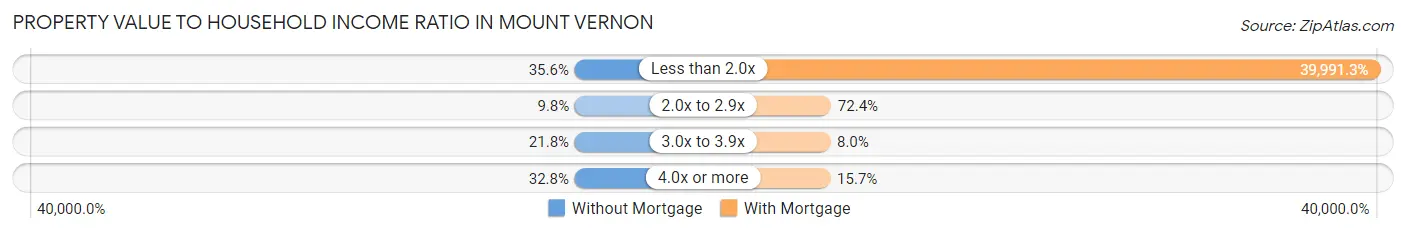
| Value-to-Income Ratio | Without Mortgage | With Mortgage |
| Less than 2.0x | 62 (35.6%) | 114,375 (39,991.3%) |
| 2.0x to 2.9x | 17 (9.8%) | 207 (72.4%) |
| 3.0x to 3.9x | 38 (21.8%) | 23 (8.0%) |
| 4.0x or more | 57 (32.8%) | 45 (15.7%) |
| Total | 174 (100.0%) | 286 (100.0%) |
Real Estate Taxes by Mortgage Status in Mount Vernon
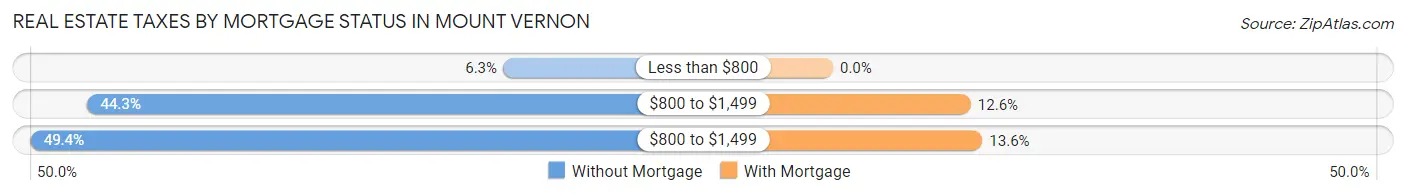
| Property Taxes | Without Mortgage | With Mortgage |
| Less than $800 | 11 (6.3%) | 0 (0.0%) |
| $800 to $1,499 | 77 (44.3%) | 36 (12.6%) |
| $800 to $1,499 | 86 (49.4%) | 39 (13.6%) |
| Total | 174 (100.0%) | 286 (100.0%) |
Health & Disability in Mount Vernon
Health Insurance Coverage by Age in Mount Vernon
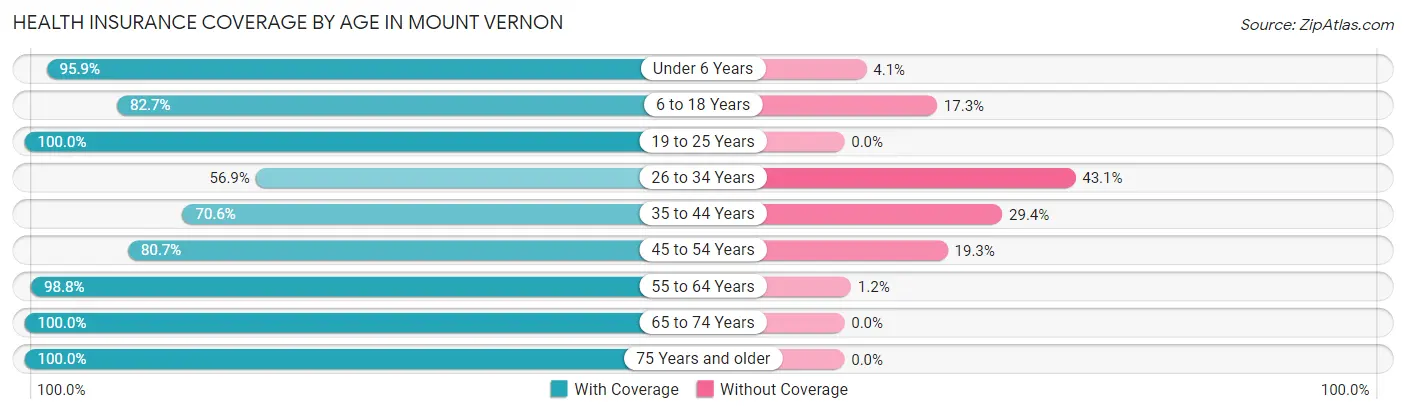
| Age Bracket | With Coverage | Without Coverage |
| Under 6 Years | 280 (95.9%) | 12 (4.1%) |
| 6 to 18 Years | 570 (82.7%) | 119 (17.3%) |
| 19 to 25 Years | 65 (100.0%) | 0 (0.0%) |
| 26 to 34 Years | 222 (56.9%) | 168 (43.1%) |
| 35 to 44 Years | 247 (70.6%) | 103 (29.4%) |
| 45 to 54 Years | 155 (80.7%) | 37 (19.3%) |
| 55 to 64 Years | 240 (98.8%) | 3 (1.2%) |
| 65 to 74 Years | 82 (100.0%) | 0 (0.0%) |
| 75 Years and older | 125 (100.0%) | 0 (0.0%) |
| Total | 1,986 (81.8%) | 442 (18.2%) |
Health Insurance Coverage by Citizenship Status in Mount Vernon
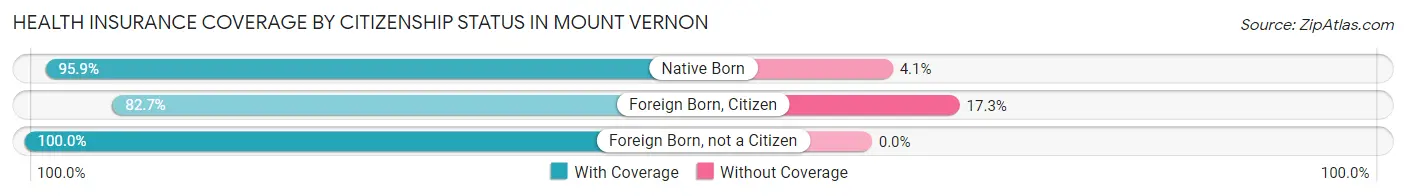
| Citizenship Status | With Coverage | Without Coverage |
| Native Born | 280 (95.9%) | 12 (4.1%) |
| Foreign Born, Citizen | 570 (82.7%) | 119 (17.3%) |
| Foreign Born, not a Citizen | 65 (100.0%) | 0 (0.0%) |
Health Insurance Coverage by Household Income in Mount Vernon
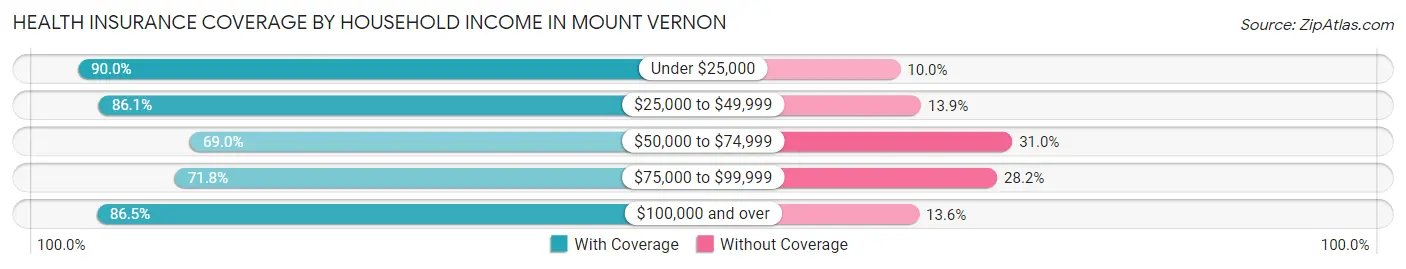
| Household Income | With Coverage | Without Coverage |
| Under $25,000 | 215 (90.0%) | 24 (10.0%) |
| $25,000 to $49,999 | 390 (86.1%) | 63 (13.9%) |
| $50,000 to $74,999 | 314 (69.0%) | 141 (31.0%) |
| $75,000 to $99,999 | 199 (71.8%) | 78 (28.2%) |
| $100,000 and over | 868 (86.5%) | 136 (13.6%) |
Public vs Private Health Insurance Coverage by Age in Mount Vernon
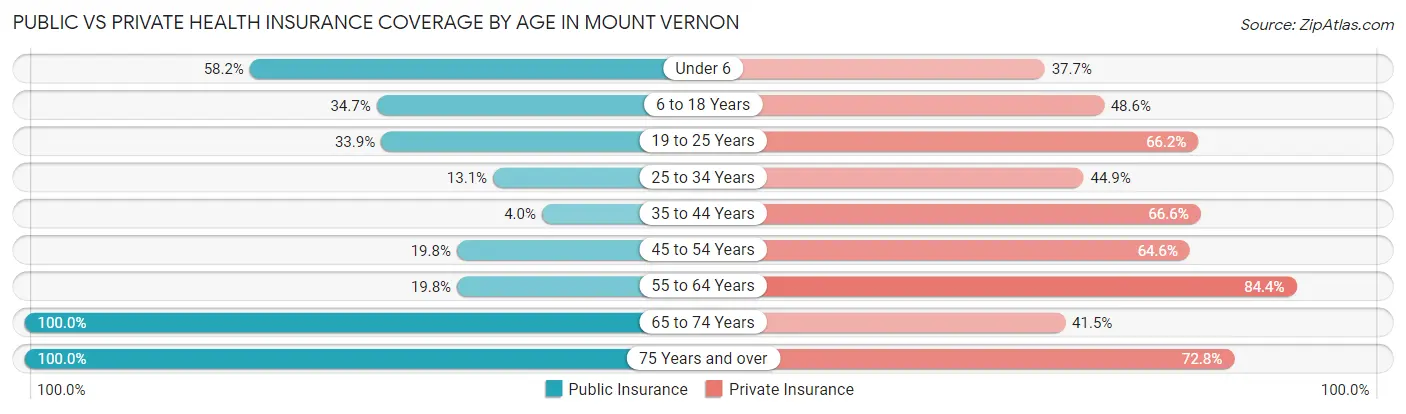
| Age Bracket | Public Insurance | Private Insurance |
| Under 6 | 170 (58.2%) | 110 (37.7%) |
| 6 to 18 Years | 239 (34.7%) | 335 (48.6%) |
| 19 to 25 Years | 22 (33.9%) | 43 (66.1%) |
| 25 to 34 Years | 51 (13.1%) | 175 (44.9%) |
| 35 to 44 Years | 14 (4.0%) | 233 (66.6%) |
| 45 to 54 Years | 38 (19.8%) | 124 (64.6%) |
| 55 to 64 Years | 48 (19.8%) | 205 (84.4%) |
| 65 to 74 Years | 82 (100.0%) | 34 (41.5%) |
| 75 Years and over | 125 (100.0%) | 91 (72.8%) |
| Total | 789 (32.5%) | 1,350 (55.6%) |
Disability Status by Sex by Age in Mount Vernon
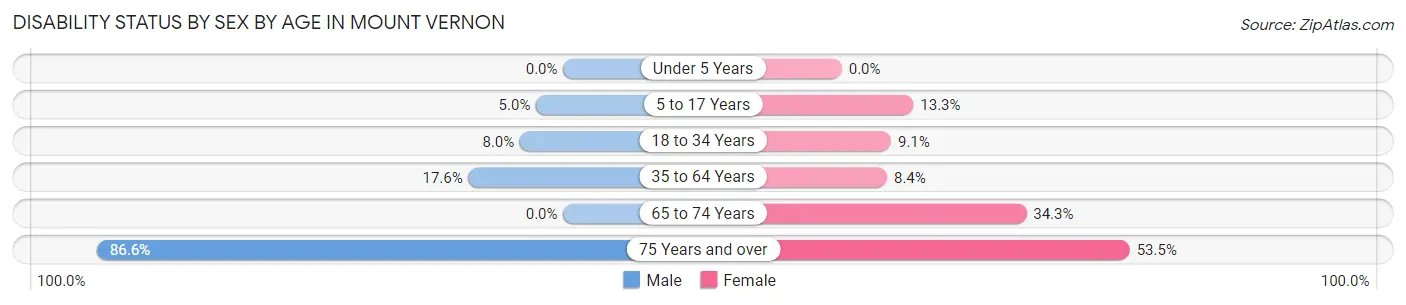
| Age Bracket | Male | Female |
| Under 5 Years | 0 (0.0%) | 0 (0.0%) |
| 5 to 17 Years | 25 (5.0%) | 32 (13.3%) |
| 18 to 34 Years | 21 (8.0%) | 20 (9.1%) |
| 35 to 64 Years | 69 (17.6%) | 33 (8.4%) |
| 65 to 74 Years | 0 (0.0%) | 25 (34.3%) |
| 75 Years and over | 58 (86.6%) | 31 (53.4%) |
Disability Class by Sex by Age in Mount Vernon
Disability Class: Hearing Difficulty
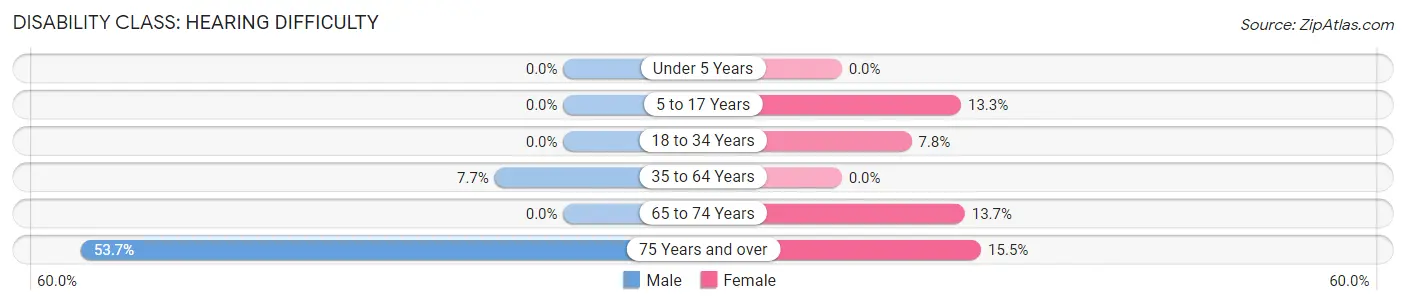
| Age Bracket | Male | Female |
| Under 5 Years | 0 (0.0%) | 0 (0.0%) |
| 5 to 17 Years | 0 (0.0%) | 32 (13.3%) |
| 18 to 34 Years | 0 (0.0%) | 17 (7.8%) |
| 35 to 64 Years | 30 (7.6%) | 0 (0.0%) |
| 65 to 74 Years | 0 (0.0%) | 10 (13.7%) |
| 75 Years and over | 36 (53.7%) | 9 (15.5%) |
Disability Class: Vision Difficulty
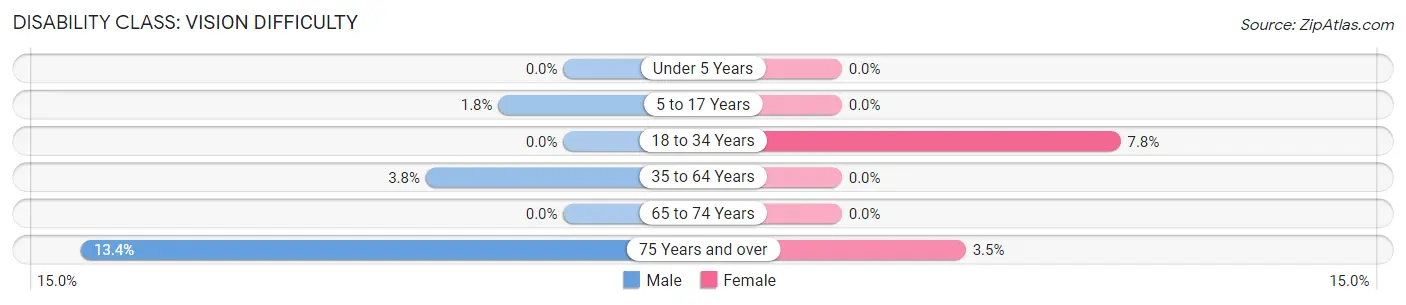
| Age Bracket | Male | Female |
| Under 5 Years | 0 (0.0%) | 0 (0.0%) |
| 5 to 17 Years | 9 (1.8%) | 0 (0.0%) |
| 18 to 34 Years | 0 (0.0%) | 17 (7.8%) |
| 35 to 64 Years | 15 (3.8%) | 0 (0.0%) |
| 65 to 74 Years | 0 (0.0%) | 0 (0.0%) |
| 75 Years and over | 9 (13.4%) | 2 (3.5%) |
Disability Class: Cognitive Difficulty
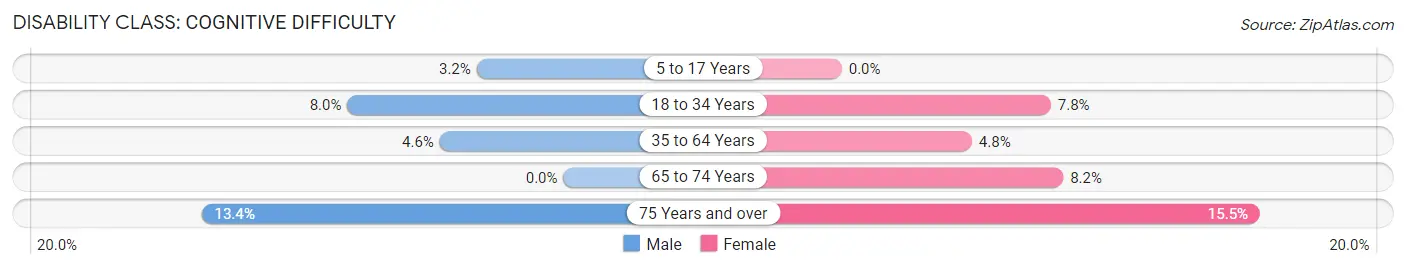
| Age Bracket | Male | Female |
| 5 to 17 Years | 16 (3.2%) | 0 (0.0%) |
| 18 to 34 Years | 21 (8.0%) | 17 (7.8%) |
| 35 to 64 Years | 18 (4.6%) | 19 (4.8%) |
| 65 to 74 Years | 0 (0.0%) | 6 (8.2%) |
| 75 Years and over | 9 (13.4%) | 9 (15.5%) |
Disability Class: Ambulatory Difficulty
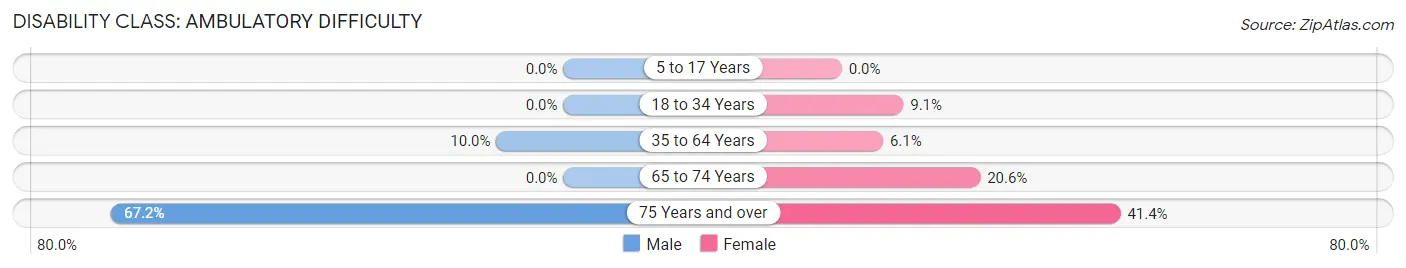
| Age Bracket | Male | Female |
| 5 to 17 Years | 0 (0.0%) | 0 (0.0%) |
| 18 to 34 Years | 0 (0.0%) | 20 (9.1%) |
| 35 to 64 Years | 39 (10.0%) | 24 (6.1%) |
| 65 to 74 Years | 0 (0.0%) | 15 (20.5%) |
| 75 Years and over | 45 (67.2%) | 24 (41.4%) |
Disability Class: Self-Care Difficulty
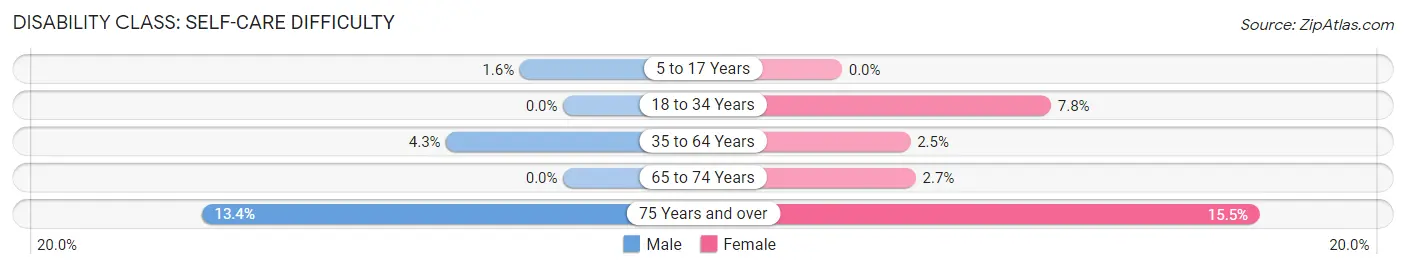
| Age Bracket | Male | Female |
| 5 to 17 Years | 8 (1.6%) | 0 (0.0%) |
| 18 to 34 Years | 0 (0.0%) | 17 (7.8%) |
| 35 to 64 Years | 17 (4.3%) | 10 (2.5%) |
| 65 to 74 Years | 0 (0.0%) | 2 (2.7%) |
| 75 Years and over | 9 (13.4%) | 9 (15.5%) |
Technology Access in Mount Vernon
Computing Device Access in Mount Vernon
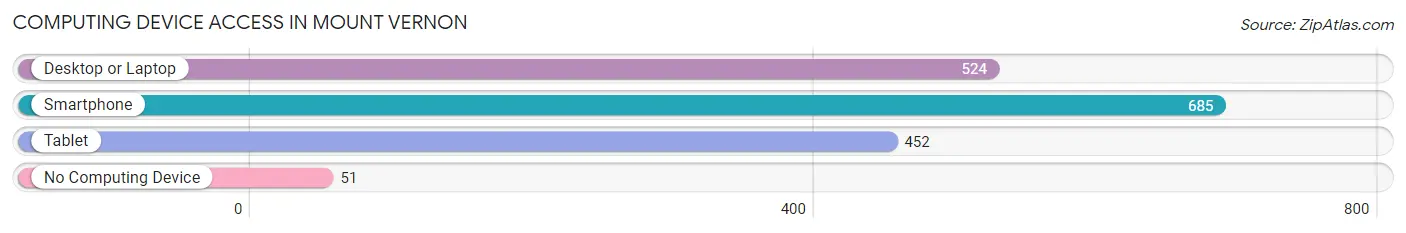
| Device Type | # Households | % Households |
| Desktop or Laptop | 524 | 70.1% |
| Smartphone | 685 | 91.6% |
| Tablet | 452 | 60.4% |
| No Computing Device | 51 | 6.8% |
| Total | 748 | 100.0% |
Internet Access in Mount Vernon
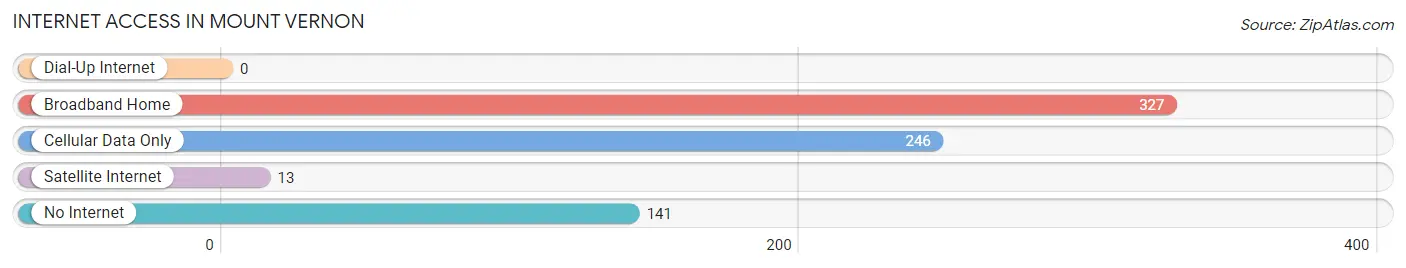
| Internet Type | # Households | % Households |
| Dial-Up Internet | 0 | 0.0% |
| Broadband Home | 327 | 43.7% |
| Cellular Data Only | 246 | 32.9% |
| Satellite Internet | 13 | 1.7% |
| No Internet | 141 | 18.9% |
| Total | 748 | 100.0% |
Mount Vernon Summary
Introduction
Mount Vernon, Texas is a small city located in Franklin County, Texas. It is the county seat of Franklin County and is located in the northeast corner of the state. The city has a population of 2,541 as of the 2010 census. The city is known for its historic downtown area, which is listed on the National Register of Historic Places. The city is also home to the Franklin County Historical Museum, which houses artifacts from the area's past.
History
Mount Vernon was founded in 1846 by settlers from the nearby town of Mount Pleasant. The town was named after George Washington's home, Mount Vernon. The town was originally a trading post and was the first county seat of Franklin County. The town was incorporated in 1876 and has remained the county seat ever since.
The town was an important stop on the Texas and Pacific Railway, which ran through the town in the late 19th century. The town was also an important stop on the Chisholm Trail, which was used by cowboys to drive cattle from Texas to Kansas.
The town was also the site of a major battle during the Civil War. In 1864, Confederate forces led by General Sterling Price attacked the town in an attempt to capture the Union garrison stationed there. The Union forces were able to repel the attack and the town was spared from destruction.
Geography
Mount Vernon is located in the northeast corner of Texas, in Franklin County. The city is situated at the intersection of U.S. Highway 67 and State Highway 37. The city is located about 90 miles northeast of Dallas and about 60 miles south of Texarkana.
The city is located in a hilly area and is surrounded by rolling hills and wooded areas. The city is located in the Red River Valley, which is a major agricultural area. The city is also located near the Sulphur River, which is a major tributary of the Red River.
Economy
The economy of Mount Vernon is largely based on agriculture. The city is located in the Red River Valley, which is a major agricultural area. The city is also home to several manufacturing companies, including a paper mill and a furniture factory.
The city is also home to several retail stores, including a Walmart Supercenter and several other stores. The city is also home to several restaurants, including a Sonic Drive-In and several other fast food restaurants.
Demographics
As of the 2010 census, the population of Mount Vernon was 2,541. The racial makeup of the city was 79.3% White, 16.2% African American, 0.7% Native American, 0.3% Asian, 0.1% Pacific Islander, 1.7% from other races, and 1.9% from two or more races. Hispanic or Latino of any race were 4.2% of the population.
The median income for a household in the city was $31,250, and the median income for a family was $37,500. The per capita income for the city was $17,845. About 17.2% of families and 20.2% of the population were below the poverty line, including 28.3% of those under age 18 and 14.3% of those age 65 or over.
Conclusion
Mount Vernon, Texas is a small city located in Franklin County, Texas. The city has a population of 2,541 as of the 2010 census. The city is known for its historic downtown area, which is listed on the National Register of Historic Places. The city is also home to the Franklin County Historical Museum, which houses artifacts from the area's past. The economy of Mount Vernon is largely based on agriculture, and the city is also home to several manufacturing companies and retail stores. The racial makeup of the city is 79.3% White, 16.2% African American, 0.7% Native American, 0.3% Asian, 0.1% Pacific Islander, 1.7% from other races, and 1.9% from two or more races. The median income for a household in the city was $31,250, and the median income for a family was $37,500.
Common Questions
What is Per Capita Income in Mount Vernon?
Per Capita income in Mount Vernon is $27,767.
What is the Median Family Income in Mount Vernon?
Median Family Income in Mount Vernon is $69,844.
What is the Median Household income in Mount Vernon?
Median Household Income in Mount Vernon is $63,750.
What is Income or Wage Gap in Mount Vernon?
Income or Wage Gap in Mount Vernon is 25.7%.
Women in Mount Vernon earn 74.3 cents for every dollar earned by a man.
What is Inequality or Gini Index in Mount Vernon?
Inequality or Gini Index in Mount Vernon is 0.43.
What is the Total Population of Mount Vernon?
Total Population of Mount Vernon is 2,527.
What is the Total Male Population of Mount Vernon?
Total Male Population of Mount Vernon is 1,371.
What is the Total Female Population of Mount Vernon?
Total Female Population of Mount Vernon is 1,156.
What is the Ratio of Males per 100 Females in Mount Vernon?
There are 118.60 Males per 100 Females in Mount Vernon.
What is the Ratio of Females per 100 Males in Mount Vernon?
There are 84.32 Females per 100 Males in Mount Vernon.
What is the Median Population Age in Mount Vernon?
Median Population Age in Mount Vernon is 31.1 Years.
What is the Average Family Size in Mount Vernon
Average Family Size in Mount Vernon is 4.0 People.
What is the Average Household Size in Mount Vernon
Average Household Size in Mount Vernon is 3.2 People.
How Large is the Labor Force in Mount Vernon?
There are 1,126 People in the Labor Forcein in Mount Vernon.
What is the Percentage of People in the Labor Force in Mount Vernon?
65.7% of People are in the Labor Force in Mount Vernon.
What is the Unemployment Rate in Mount Vernon?
Unemployment Rate in Mount Vernon is 6.0%.