Midlothian, TX Map & Demographics
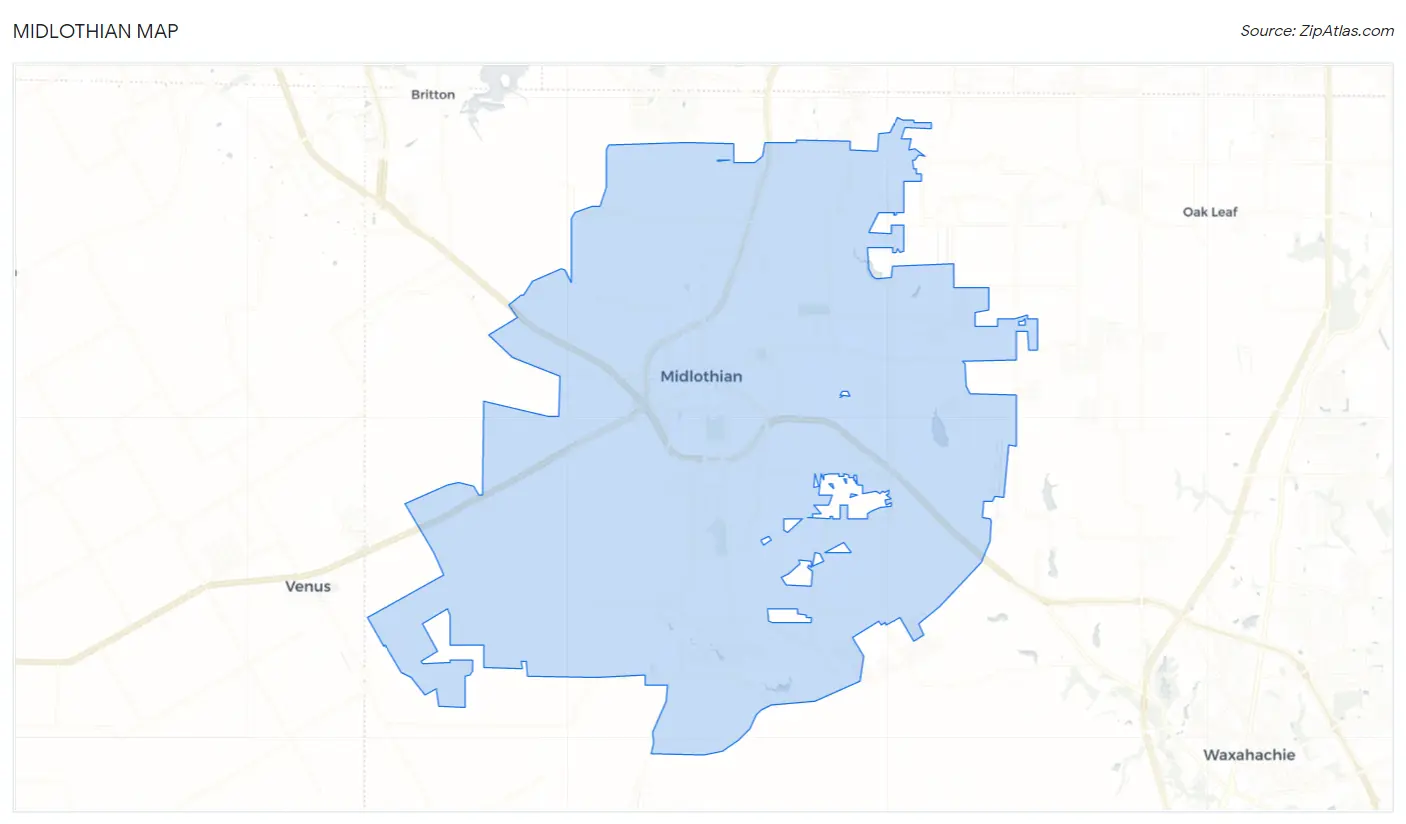
Midlothian Map
Midlothian Overview
$46,311
PER CAPITA INCOME
$126,756
AVG FAMILY INCOME
$119,323
AVG HOUSEHOLD INCOME
39.4%
WAGE / INCOME GAP [ % ]
60.6¢/ $1
WAGE / INCOME GAP [ $ ]
0.39
INEQUALITY / GINI INDEX
35,460
TOTAL POPULATION
17,257
MALE POPULATION
18,203
FEMALE POPULATION
94.80
MALES / 100 FEMALES
105.48
FEMALES / 100 MALES
35.5
MEDIAN AGE
3.2
AVG FAMILY SIZE
3.0
AVG HOUSEHOLD SIZE
19,179
LABOR FORCE [ PEOPLE ]
73.0%
PERCENT IN LABOR FORCE
2.9%
UNEMPLOYMENT RATE
Midlothian Zip Codes
Income in Midlothian
Income Overview in Midlothian
Per Capita Income in Midlothian is $46,311, while median incomes of families and households are $126,756 and $119,323 respectively.
| Characteristic | Number | Measure |
| Per Capita Income | 35,460 | $46,311 |
| Median Family Income | 10,007 | $126,756 |
| Mean Family Income | 10,007 | $147,291 |
| Median Household Income | 11,779 | $119,323 |
| Mean Household Income | 11,779 | $138,119 |
| Income Deficit | 10,007 | $0 |
| Wage / Income Gap (%) | 35,460 | 39.41% |
| Wage / Income Gap ($) | 35,460 | 60.59¢ per $1 |
| Gini / Inequality Index | 35,460 | 0.39 |
Earnings by Sex in Midlothian
Average Earnings in Midlothian are $60,157, $74,846 for men and $45,350 for women, a difference of 39.4%.
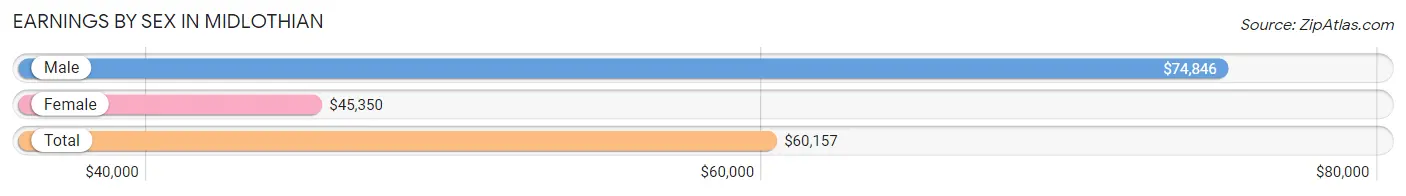
| Sex | Number | Average Earnings |
| Male | 10,159 (51.2%) | $74,846 |
| Female | 9,672 (48.8%) | $45,350 |
| Total | 19,831 (100.0%) | $60,157 |
Earnings by Sex by Income Bracket in Midlothian
The most common earnings brackets in Midlothian are $100,000+ for men (2,976 | 29.3%) and $75,000 to $99,999 for women (1,235 | 12.8%).
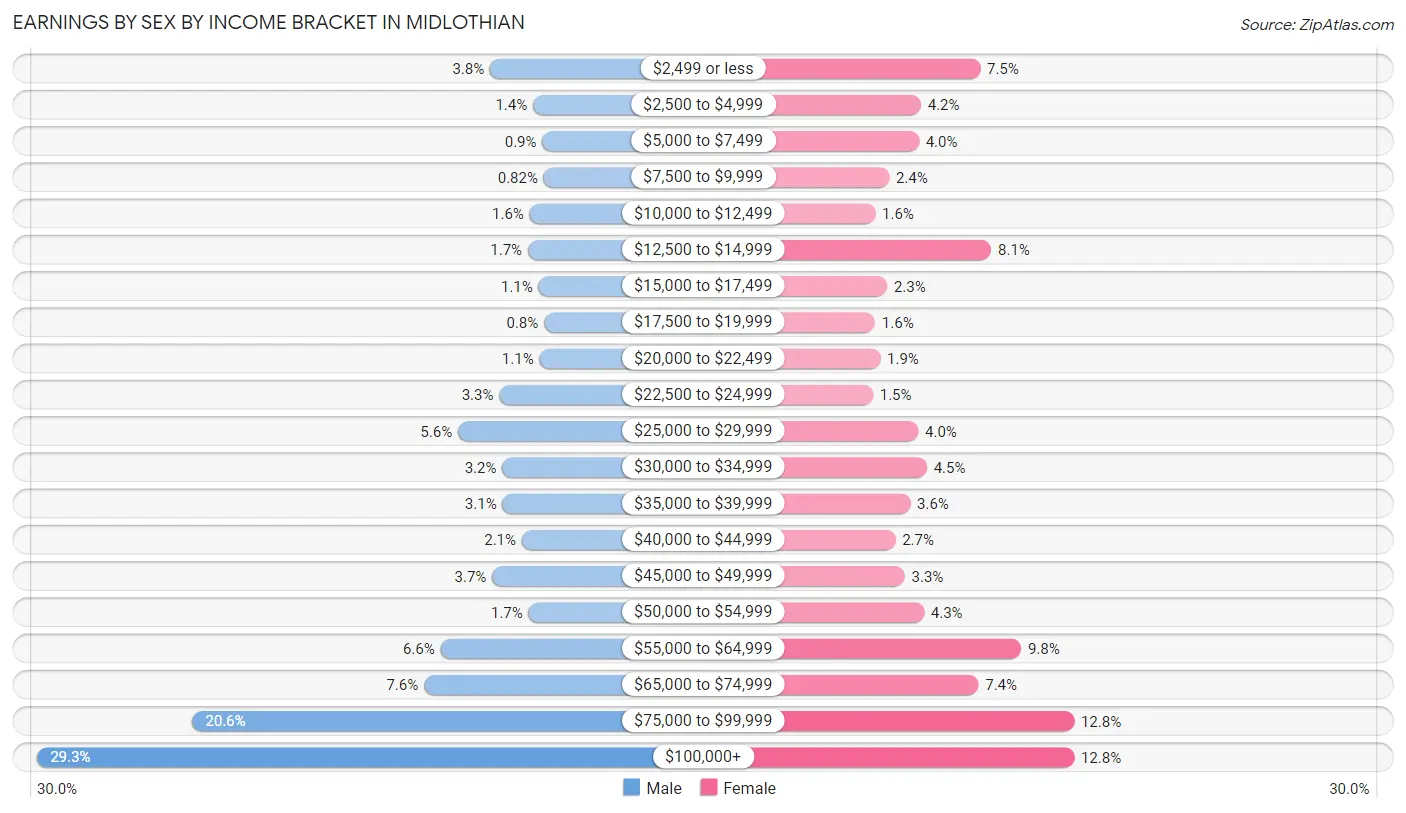
| Income | Male | Female |
| $2,499 or less | 390 (3.8%) | 724 (7.5%) |
| $2,500 to $4,999 | 144 (1.4%) | 402 (4.2%) |
| $5,000 to $7,499 | 91 (0.9%) | 391 (4.0%) |
| $7,500 to $9,999 | 83 (0.8%) | 229 (2.4%) |
| $10,000 to $12,499 | 164 (1.6%) | 154 (1.6%) |
| $12,500 to $14,999 | 174 (1.7%) | 784 (8.1%) |
| $15,000 to $17,499 | 113 (1.1%) | 219 (2.3%) |
| $17,500 to $19,999 | 81 (0.8%) | 153 (1.6%) |
| $20,000 to $22,499 | 108 (1.1%) | 181 (1.9%) |
| $22,500 to $24,999 | 337 (3.3%) | 141 (1.5%) |
| $25,000 to $29,999 | 573 (5.6%) | 388 (4.0%) |
| $30,000 to $34,999 | 320 (3.2%) | 434 (4.5%) |
| $35,000 to $39,999 | 319 (3.1%) | 344 (3.6%) |
| $40,000 to $44,999 | 208 (2.1%) | 263 (2.7%) |
| $45,000 to $49,999 | 378 (3.7%) | 314 (3.3%) |
| $50,000 to $54,999 | 170 (1.7%) | 419 (4.3%) |
| $55,000 to $64,999 | 673 (6.6%) | 947 (9.8%) |
| $65,000 to $74,999 | 767 (7.5%) | 715 (7.4%) |
| $75,000 to $99,999 | 2,090 (20.6%) | 1,235 (12.8%) |
| $100,000+ | 2,976 (29.3%) | 1,235 (12.8%) |
| Total | 10,159 (100.0%) | 9,672 (100.0%) |
Earnings by Sex by Educational Attainment in Midlothian
Average earnings in Midlothian are $80,220 for men and $55,440 for women, a difference of 30.9%. Men with an educational attainment of bachelor's degree enjoy the highest average annual earnings of $96,500, while those with less than high school education earn the least with $37,188. Women with an educational attainment of graduate degree earn the most with the average annual earnings of $76,722, while those with less than high school education have the smallest earnings of $16,958.
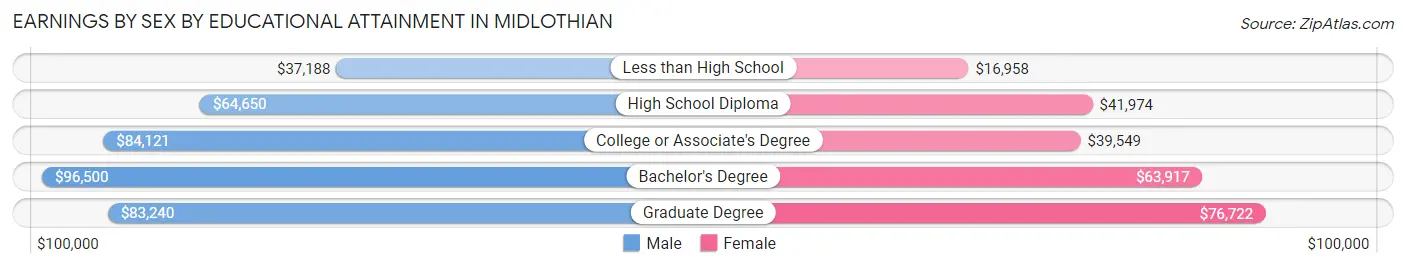
| Educational Attainment | Male Income | Female Income |
| Less than High School | $37,188 | $16,958 |
| High School Diploma | $64,650 | $41,974 |
| College or Associate's Degree | $84,121 | $39,549 |
| Bachelor's Degree | $96,500 | $63,917 |
| Graduate Degree | $83,240 | $76,722 |
| Total | $80,220 | $55,440 |
Family Income in Midlothian
Family Income Brackets in Midlothian
According to the Midlothian family income data, there are 2,642 families falling into the $100,000 to $149,999 income range, which is the most common income bracket and makes up 26.4% of all families. Conversely, the $10,000 to $14,999 income bracket is the least frequent group with only 60 families (0.6%) belonging to this category.
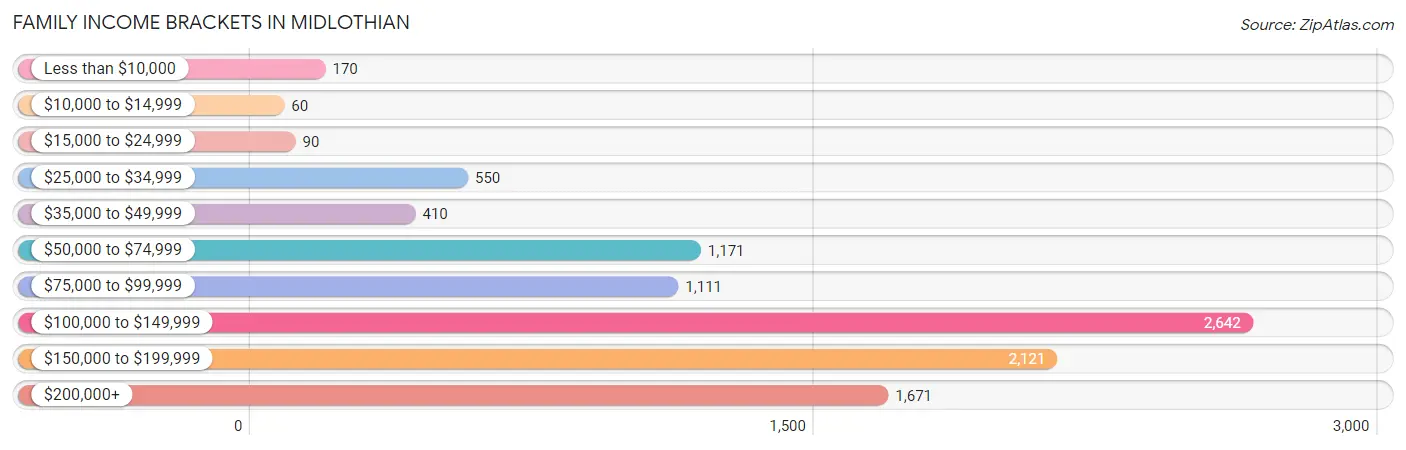
| Income Bracket | # Families | % Families |
| Less than $10,000 | 170 | 1.7% |
| $10,000 to $14,999 | 60 | 0.6% |
| $15,000 to $24,999 | 90 | 0.9% |
| $25,000 to $34,999 | 550 | 5.5% |
| $35,000 to $49,999 | 410 | 4.1% |
| $50,000 to $74,999 | 1,171 | 11.7% |
| $75,000 to $99,999 | 1,111 | 11.1% |
| $100,000 to $149,999 | 2,642 | 26.4% |
| $150,000 to $199,999 | 2,121 | 21.2% |
| $200,000+ | 1,671 | 16.7% |
Family Income by Famaliy Size in Midlothian
6-person families (352 | 3.5%) account for the highest median family income in Midlothian with $193,048 per family, while 2-person families (4,039 | 40.4%) have the highest median income of $52,428 per family member.
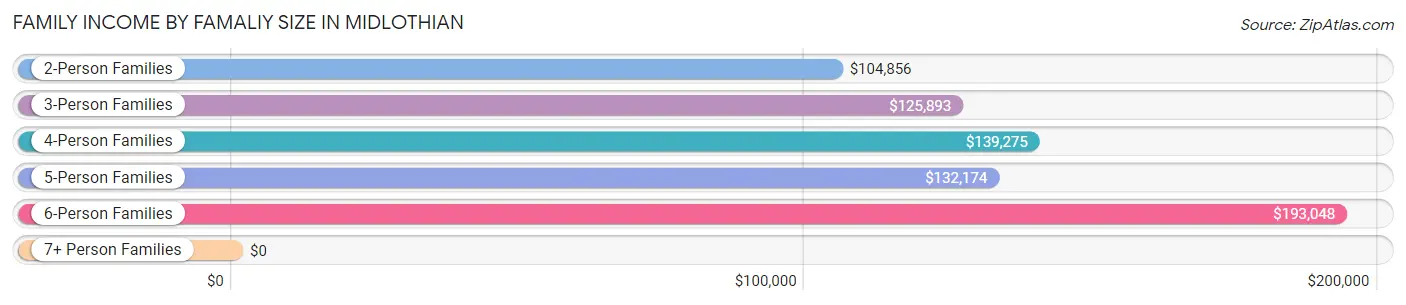
| Income Bracket | # Families | Median Income |
| 2-Person Families | 4,039 (40.4%) | $104,856 |
| 3-Person Families | 2,367 (23.6%) | $125,893 |
| 4-Person Families | 2,377 (23.7%) | $139,275 |
| 5-Person Families | 732 (7.3%) | $132,174 |
| 6-Person Families | 352 (3.5%) | $193,048 |
| 7+ Person Families | 140 (1.4%) | $0 |
| Total | 10,007 (100.0%) | $126,756 |
Family Income by Number of Earners in Midlothian
The median family income in Midlothian is $126,756, with families comprising 3+ earners (1,242) having the highest median family income of $189,792, while families with no earners (765) have the lowest median family income of $64,102, accounting for 12.4% and 7.6% of families, respectively.
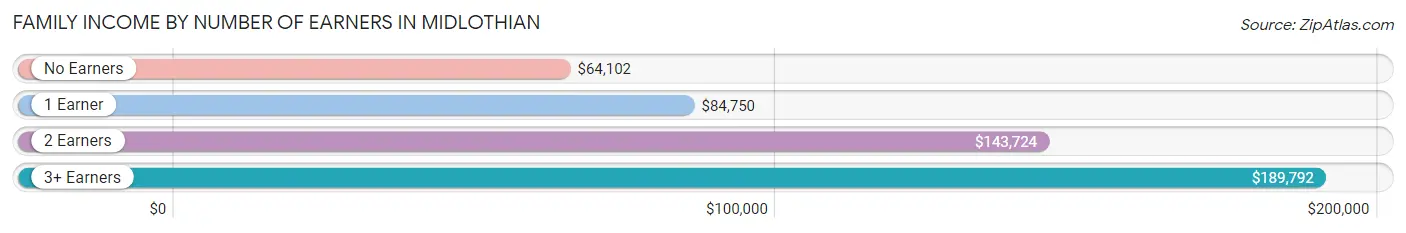
| Number of Earners | # Families | Median Income |
| No Earners | 765 (7.6%) | $64,102 |
| 1 Earner | 2,976 (29.7%) | $84,750 |
| 2 Earners | 5,024 (50.2%) | $143,724 |
| 3+ Earners | 1,242 (12.4%) | $189,792 |
| Total | 10,007 (100.0%) | $126,756 |
Household Income in Midlothian
Household Income Brackets in Midlothian
With 2,921 households falling in the category, the $100,000 to $149,999 income range is the most frequent in Midlothian, accounting for 24.8% of all households. In contrast, only 153 households (1.3%) fall into the less than $10,000 income bracket, making it the least populous group.
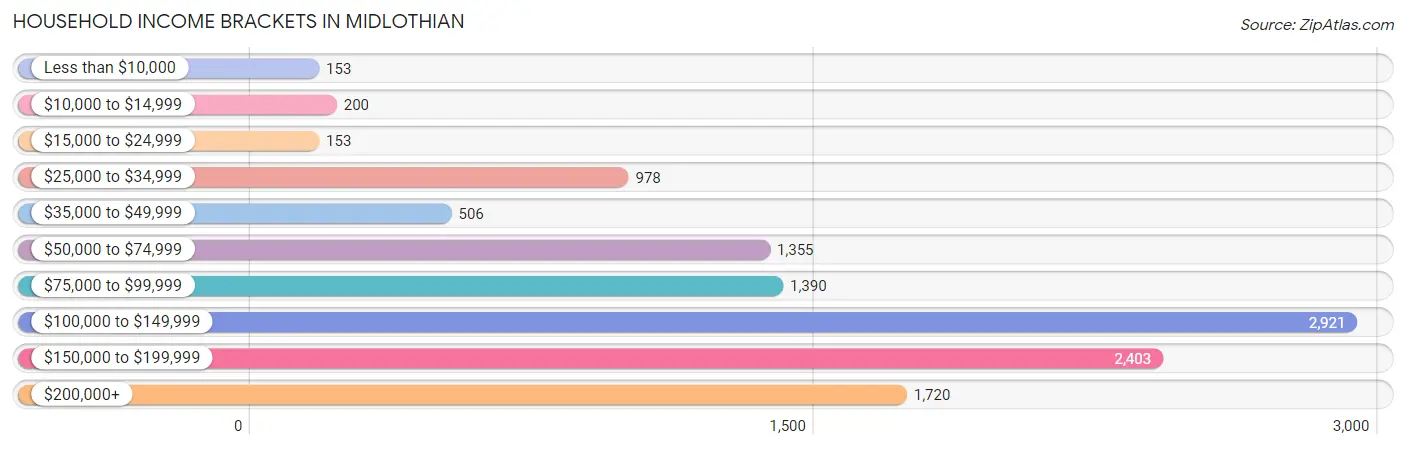
| Income Bracket | # Households | % Households |
| Less than $10,000 | 153 | 1.3% |
| $10,000 to $14,999 | 200 | 1.7% |
| $15,000 to $24,999 | 153 | 1.3% |
| $25,000 to $34,999 | 978 | 8.3% |
| $35,000 to $49,999 | 506 | 4.3% |
| $50,000 to $74,999 | 1,355 | 11.5% |
| $75,000 to $99,999 | 1,390 | 11.8% |
| $100,000 to $149,999 | 2,921 | 24.8% |
| $150,000 to $199,999 | 2,403 | 20.4% |
| $200,000+ | 1,720 | 14.6% |
Household Income by Householder Age in Midlothian
The median household income in Midlothian is $119,323, with the highest median household income of $147,721 found in the 45 to 64 years age bracket for the primary householder. A total of 4,871 households (41.3%) fall into this category. Meanwhile, the 15 to 24 years age bracket for the primary householder has the lowest median household income of $0, with 262 households (2.2%) in this group.
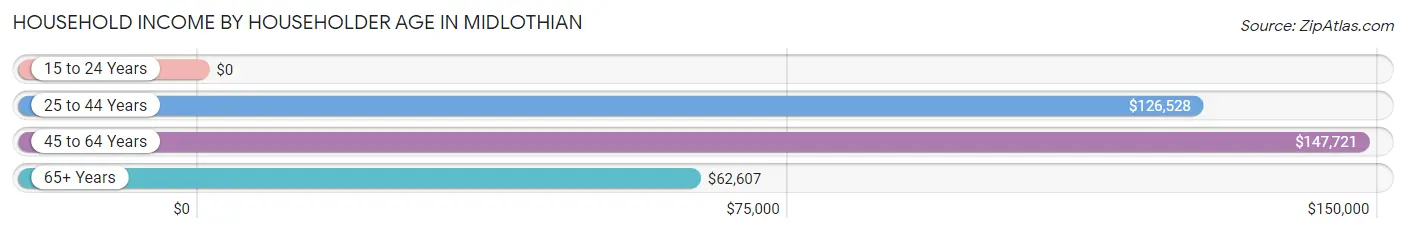
| Income Bracket | # Households | Median Income |
| 15 to 24 Years | 262 (2.2%) | $0 |
| 25 to 44 Years | 4,479 (38.0%) | $126,528 |
| 45 to 64 Years | 4,871 (41.3%) | $147,721 |
| 65+ Years | 2,167 (18.4%) | $62,607 |
| Total | 11,779 (100.0%) | $119,323 |
Poverty in Midlothian
Income Below Poverty by Sex and Age in Midlothian
With 4.4% poverty level for males and 7.5% for females among the residents of Midlothian, 6 to 11 year old males and under 5 year old females are the most vulnerable to poverty, with 407 males (20.9%) and 251 females (20.0%) in their respective age groups living below the poverty level.
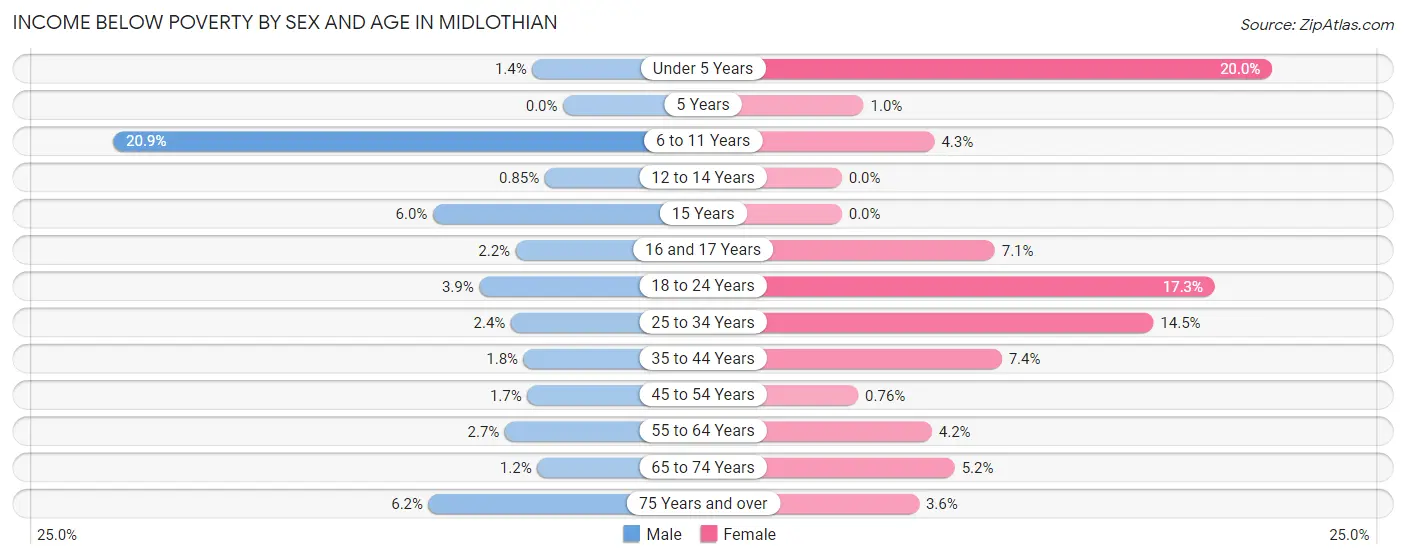
| Age Bracket | Male | Female |
| Under 5 Years | 17 (1.4%) | 251 (20.0%) |
| 5 Years | 0 (0.0%) | 3 (1.0%) |
| 6 to 11 Years | 407 (20.9%) | 80 (4.3%) |
| 12 to 14 Years | 9 (0.9%) | 0 (0.0%) |
| 15 Years | 16 (6.0%) | 0 (0.0%) |
| 16 and 17 Years | 12 (2.2%) | 45 (7.1%) |
| 18 to 24 Years | 57 (3.9%) | 265 (17.3%) |
| 25 to 34 Years | 48 (2.4%) | 309 (14.5%) |
| 35 to 44 Years | 44 (1.8%) | 205 (7.4%) |
| 45 to 54 Years | 45 (1.7%) | 19 (0.8%) |
| 55 to 64 Years | 52 (2.7%) | 74 (4.2%) |
| 65 to 74 Years | 12 (1.2%) | 72 (5.2%) |
| 75 Years and over | 32 (6.2%) | 36 (3.6%) |
| Total | 751 (4.4%) | 1,359 (7.5%) |
Income Above Poverty by Sex and Age in Midlothian
According to the poverty statistics in Midlothian, males aged 5 years and females aged 12 to 14 years are the age groups that are most secure financially, with 100.0% of males and 100.0% of females in these age groups living above the poverty line.
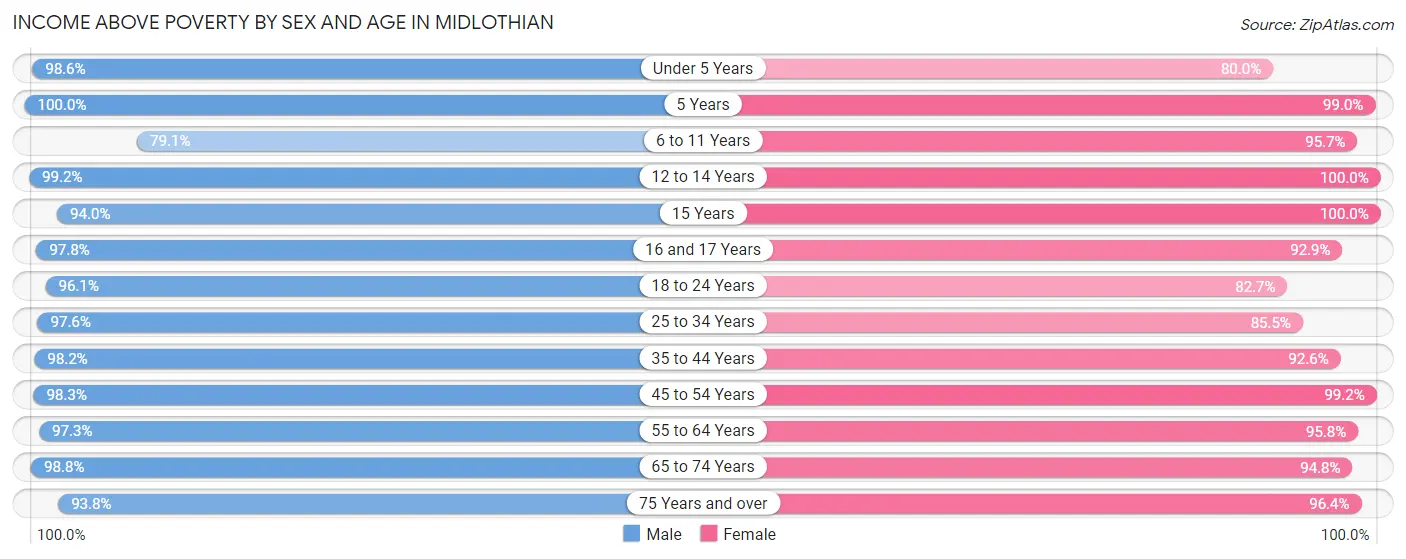
| Age Bracket | Male | Female |
| Under 5 Years | 1,171 (98.6%) | 1,006 (80.0%) |
| 5 Years | 130 (100.0%) | 294 (99.0%) |
| 6 to 11 Years | 1,541 (79.1%) | 1,781 (95.7%) |
| 12 to 14 Years | 1,054 (99.2%) | 849 (100.0%) |
| 15 Years | 249 (94.0%) | 219 (100.0%) |
| 16 and 17 Years | 533 (97.8%) | 589 (92.9%) |
| 18 to 24 Years | 1,407 (96.1%) | 1,266 (82.7%) |
| 25 to 34 Years | 1,933 (97.6%) | 1,828 (85.5%) |
| 35 to 44 Years | 2,355 (98.2%) | 2,557 (92.6%) |
| 45 to 54 Years | 2,672 (98.3%) | 2,469 (99.2%) |
| 55 to 64 Years | 1,874 (97.3%) | 1,695 (95.8%) |
| 65 to 74 Years | 988 (98.8%) | 1,303 (94.8%) |
| 75 Years and over | 481 (93.8%) | 970 (96.4%) |
| Total | 16,388 (95.6%) | 16,826 (92.5%) |
Income Below Poverty Among Married-Couple Families in Midlothian
The poverty statistics for married-couple families in Midlothian show that 1.6% or 122 of the total 7,668 families live below the poverty line. Families with no children have the highest poverty rate of 2.0%, comprising of 77 families. On the other hand, families with 3 or 4 children have the lowest poverty rate of 0.0%, which includes 0 families.
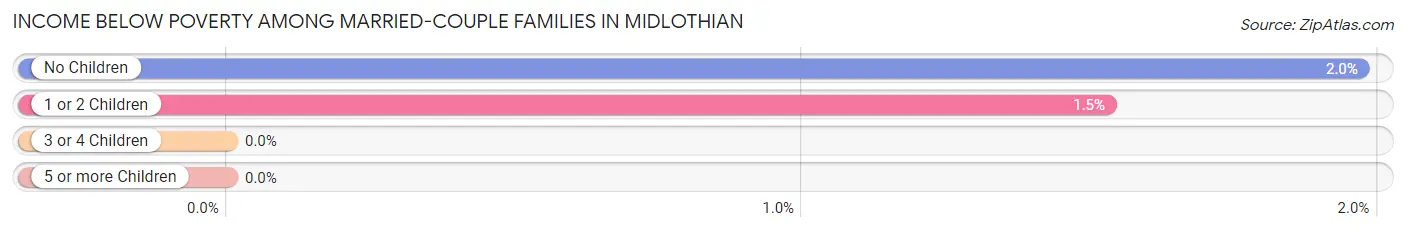
| Children | Above Poverty | Below Poverty |
| No Children | 3,826 (98.0%) | 77 (2.0%) |
| 1 or 2 Children | 2,894 (98.5%) | 45 (1.5%) |
| 3 or 4 Children | 784 (100.0%) | 0 (0.0%) |
| 5 or more Children | 42 (100.0%) | 0 (0.0%) |
| Total | 7,546 (98.4%) | 122 (1.6%) |
Income Below Poverty Among Single-Parent Households in Midlothian
According to the poverty data in Midlothian, 0.9% or 7 single-father households and 25.7% or 401 single-mother households are living below the poverty line. Among single-father households, those with no children have the highest poverty rate, with 7 households (2.1%) experiencing poverty. Likewise, among single-mother households, those with 3 or 4 children have the highest poverty rate, with 191 households (80.2%) falling below the poverty line.
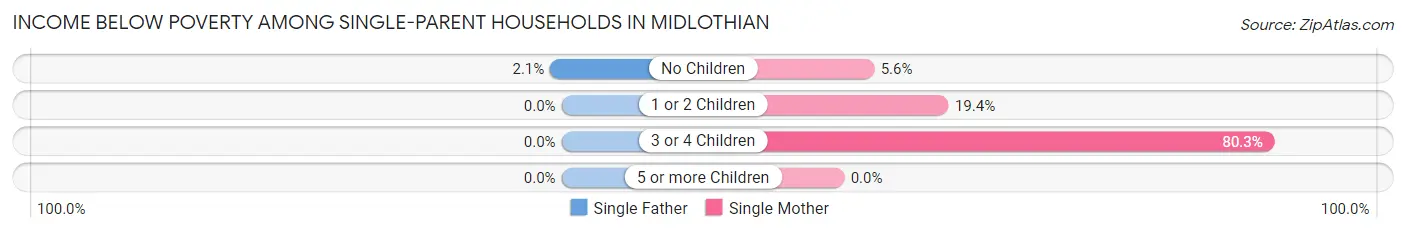
| Children | Single Father | Single Mother |
| No Children | 7 (2.1%) | 19 (5.6%) |
| 1 or 2 Children | 0 (0.0%) | 191 (19.4%) |
| 3 or 4 Children | 0 (0.0%) | 191 (80.2%) |
| 5 or more Children | 0 (0.0%) | 0 (0.0%) |
| Total | 7 (0.9%) | 401 (25.7%) |
Income Below Poverty Among Married-Couple vs Single-Parent Households in Midlothian
The poverty data for Midlothian shows that 122 of the married-couple family households (1.6%) and 408 of the single-parent households (17.4%) are living below the poverty level. Within the married-couple family households, those with no children have the highest poverty rate, with 77 households (2.0%) falling below the poverty line. Among the single-parent households, those with 3 or 4 children have the highest poverty rate, with 191 household (61.0%) living below poverty.
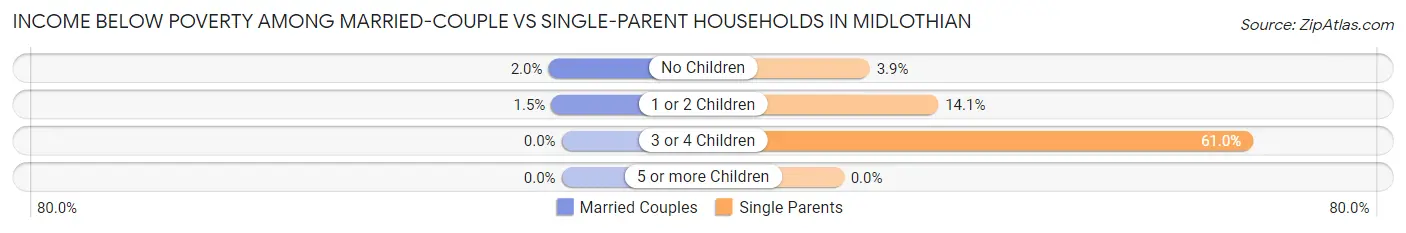
| Children | Married-Couple Families | Single-Parent Households |
| No Children | 77 (2.0%) | 26 (3.9%) |
| 1 or 2 Children | 45 (1.5%) | 191 (14.1%) |
| 3 or 4 Children | 0 (0.0%) | 191 (61.0%) |
| 5 or more Children | 0 (0.0%) | 0 (0.0%) |
| Total | 122 (1.6%) | 408 (17.4%) |
Race in Midlothian
The most populous races in Midlothian are White / Caucasian (27,536 | 77.6%), Hispanic or Latino (6,433 | 18.1%), and Black / African American (3,295 | 9.3%).
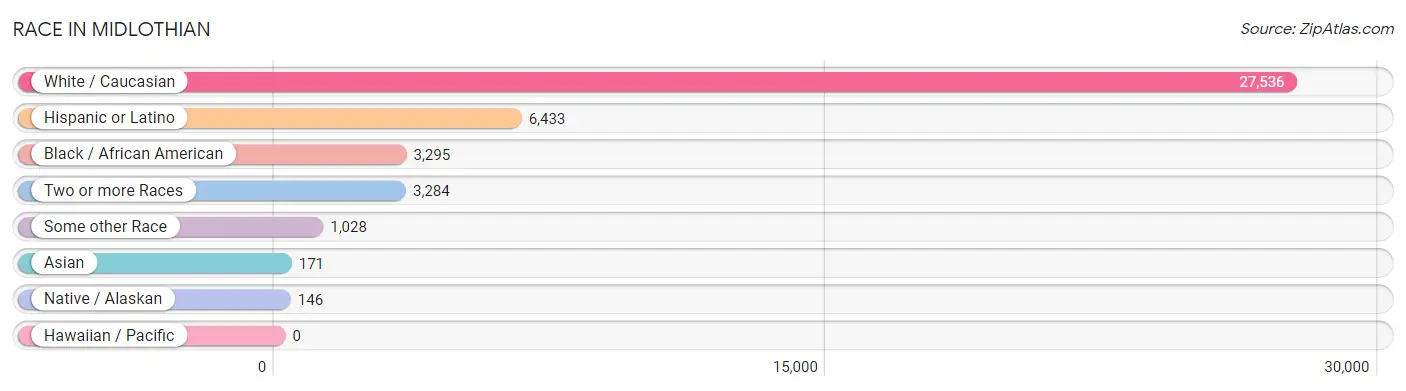
| Race | # Population | % Population |
| Asian | 171 | 0.5% |
| Black / African American | 3,295 | 9.3% |
| Hawaiian / Pacific | 0 | 0.0% |
| Hispanic or Latino | 6,433 | 18.1% |
| Native / Alaskan | 146 | 0.4% |
| White / Caucasian | 27,536 | 77.6% |
| Two or more Races | 3,284 | 9.3% |
| Some other Race | 1,028 | 2.9% |
| Total | 35,460 | 100.0% |
Ancestry in Midlothian
The most populous ancestries reported in Midlothian are Mexican (5,029 | 14.2%), American (4,418 | 12.5%), German (4,351 | 12.3%), English (3,904 | 11.0%), and Irish (3,011 | 8.5%), together accounting for 58.4% of all Midlothian residents.
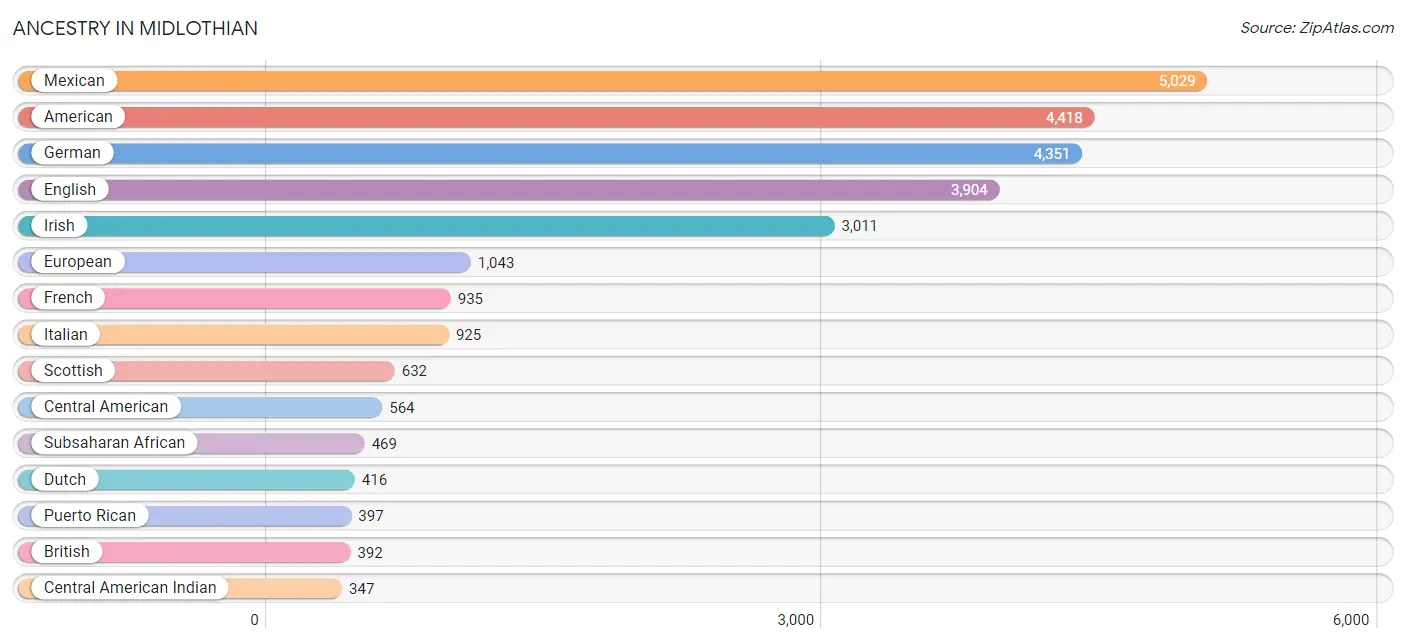
| Ancestry | # Population | % Population |
| African | 223 | 0.6% |
| American | 4,418 | 12.5% |
| Arab | 14 | 0.0% |
| Australian | 28 | 0.1% |
| Austrian | 87 | 0.3% |
| Bangladeshi | 63 | 0.2% |
| Bhutanese | 57 | 0.2% |
| Blackfeet | 86 | 0.2% |
| Brazilian | 74 | 0.2% |
| British | 392 | 1.1% |
| British West Indian | 18 | 0.1% |
| Burmese | 34 | 0.1% |
| Canadian | 19 | 0.1% |
| Central American | 564 | 1.6% |
| Central American Indian | 347 | 1.0% |
| Cherokee | 152 | 0.4% |
| Chippewa | 3 | 0.0% |
| Choctaw | 134 | 0.4% |
| Creek | 34 | 0.1% |
| Croatian | 39 | 0.1% |
| Cuban | 10 | 0.0% |
| Czech | 166 | 0.5% |
| Czechoslovakian | 19 | 0.1% |
| Danish | 43 | 0.1% |
| Dutch | 416 | 1.2% |
| Dutch West Indian | 16 | 0.1% |
| Eastern European | 15 | 0.0% |
| English | 3,904 | 11.0% |
| European | 1,043 | 2.9% |
| French | 935 | 2.6% |
| French Canadian | 172 | 0.5% |
| German | 4,351 | 12.3% |
| Greek | 54 | 0.2% |
| Guatemalan | 218 | 0.6% |
| Honduran | 24 | 0.1% |
| Hungarian | 56 | 0.2% |
| Indian (Asian) | 42 | 0.1% |
| Iranian | 20 | 0.1% |
| Irish | 3,011 | 8.5% |
| Italian | 925 | 2.6% |
| Korean | 48 | 0.1% |
| Lebanese | 4 | 0.0% |
| Lithuanian | 3 | 0.0% |
| Luxembourger | 9 | 0.0% |
| Maltese | 35 | 0.1% |
| Mexican | 5,029 | 14.2% |
| Mexican American Indian | 29 | 0.1% |
| Northern European | 60 | 0.2% |
| Norwegian | 255 | 0.7% |
| Polish | 330 | 0.9% |
| Portuguese | 16 | 0.1% |
| Puerto Rican | 397 | 1.1% |
| Russian | 65 | 0.2% |
| Salvadoran | 322 | 0.9% |
| Scandinavian | 13 | 0.0% |
| Scotch-Irish | 312 | 0.9% |
| Scottish | 632 | 1.8% |
| Slovak | 26 | 0.1% |
| Slovene | 9 | 0.0% |
| Spaniard | 62 | 0.2% |
| Spanish | 148 | 0.4% |
| Sri Lankan | 61 | 0.2% |
| Subsaharan African | 469 | 1.3% |
| Swedish | 292 | 0.8% |
| Swiss | 26 | 0.1% |
| Trinidadian and Tobagonian | 10 | 0.0% |
| Ukrainian | 77 | 0.2% |
| Vietnamese | 28 | 0.1% |
| Welsh | 187 | 0.5% | View All 69 Rows |
Immigrants in Midlothian
The most numerous immigrant groups reported in Midlothian came from Latin America (1,025 | 2.9%), Central America (956 | 2.7%), Mexico (810 | 2.3%), Africa (217 | 0.6%), and Cameroon (209 | 0.6%), together accounting for 9.1% of all Midlothian residents.
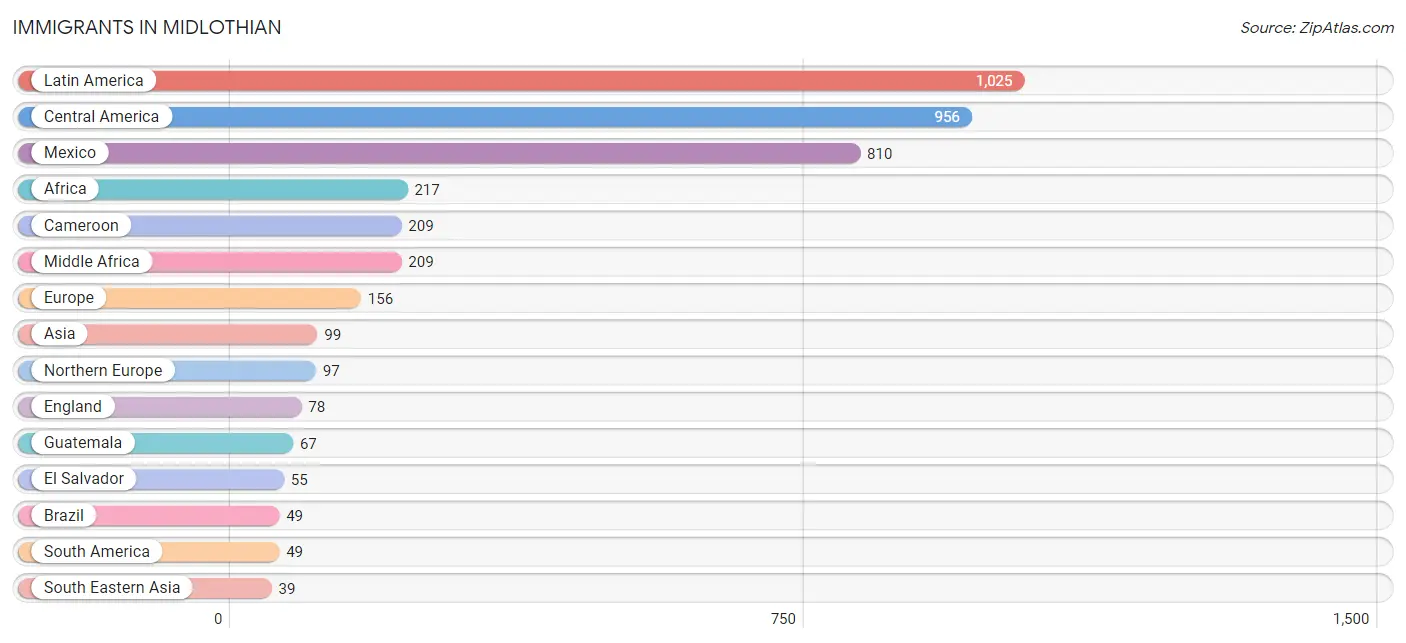
| Immigration Origin | # Population | % Population |
| Africa | 217 | 0.6% |
| Asia | 99 | 0.3% |
| Australia | 13 | 0.0% |
| Bangladesh | 17 | 0.1% |
| Brazil | 49 | 0.1% |
| Cameroon | 209 | 0.6% |
| Canada | 31 | 0.1% |
| Caribbean | 20 | 0.1% |
| Central America | 956 | 2.7% |
| Cuba | 10 | 0.0% |
| Eastern Africa | 8 | 0.0% |
| Eastern Asia | 13 | 0.0% |
| El Salvador | 55 | 0.2% |
| England | 78 | 0.2% |
| Europe | 156 | 0.4% |
| Germany | 19 | 0.1% |
| Guatemala | 67 | 0.2% |
| Honduras | 24 | 0.1% |
| Iran | 20 | 0.1% |
| Kenya | 8 | 0.0% |
| Korea | 13 | 0.0% |
| Kuwait | 10 | 0.0% |
| Laos | 19 | 0.1% |
| Latin America | 1,025 | 2.9% |
| Mexico | 810 | 2.3% |
| Middle Africa | 209 | 0.6% |
| Netherlands | 17 | 0.1% |
| Northern Europe | 97 | 0.3% |
| Oceania | 13 | 0.0% |
| Philippines | 15 | 0.0% |
| South America | 49 | 0.1% |
| South Central Asia | 37 | 0.1% |
| South Eastern Asia | 39 | 0.1% |
| Southern Europe | 23 | 0.1% |
| Trinidad and Tobago | 10 | 0.0% |
| Vietnam | 5 | 0.0% |
| Western Asia | 10 | 0.0% |
| Western Europe | 36 | 0.1% | View All 38 Rows |
Sex and Age in Midlothian
Sex and Age in Midlothian
The most populous age groups in Midlothian are 10 to 14 Years (1,778 | 10.3%) for men and 10 to 14 Years (1,626 | 8.9%) for women.
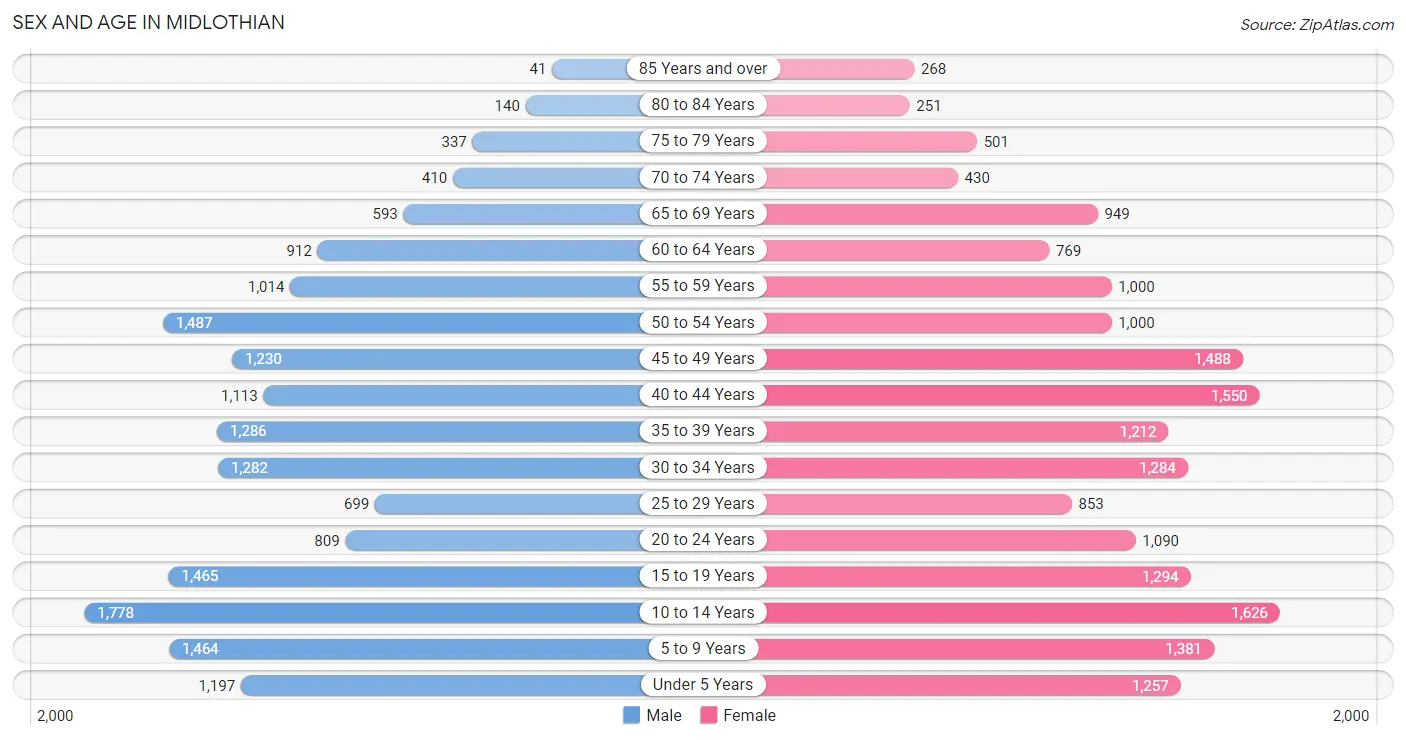
| Age Bracket | Male | Female |
| Under 5 Years | 1,197 (6.9%) | 1,257 (6.9%) |
| 5 to 9 Years | 1,464 (8.5%) | 1,381 (7.6%) |
| 10 to 14 Years | 1,778 (10.3%) | 1,626 (8.9%) |
| 15 to 19 Years | 1,465 (8.5%) | 1,294 (7.1%) |
| 20 to 24 Years | 809 (4.7%) | 1,090 (6.0%) |
| 25 to 29 Years | 699 (4.1%) | 853 (4.7%) |
| 30 to 34 Years | 1,282 (7.4%) | 1,284 (7.0%) |
| 35 to 39 Years | 1,286 (7.4%) | 1,212 (6.7%) |
| 40 to 44 Years | 1,113 (6.5%) | 1,550 (8.5%) |
| 45 to 49 Years | 1,230 (7.1%) | 1,488 (8.2%) |
| 50 to 54 Years | 1,487 (8.6%) | 1,000 (5.5%) |
| 55 to 59 Years | 1,014 (5.9%) | 1,000 (5.5%) |
| 60 to 64 Years | 912 (5.3%) | 769 (4.2%) |
| 65 to 69 Years | 593 (3.4%) | 949 (5.2%) |
| 70 to 74 Years | 410 (2.4%) | 430 (2.4%) |
| 75 to 79 Years | 337 (1.9%) | 501 (2.8%) |
| 80 to 84 Years | 140 (0.8%) | 251 (1.4%) |
| 85 Years and over | 41 (0.2%) | 268 (1.5%) |
| Total | 17,257 (100.0%) | 18,203 (100.0%) |
Families and Households in Midlothian
Median Family Size in Midlothian
The median family size in Midlothian is 3.22 persons per family, with married-couple families (7,668 | 76.6%) accounting for the largest median family size of 3.34 persons per family. On the other hand, single female/mother families (1,561 | 15.6%) represent the smallest median family size with 2.77 persons per family.
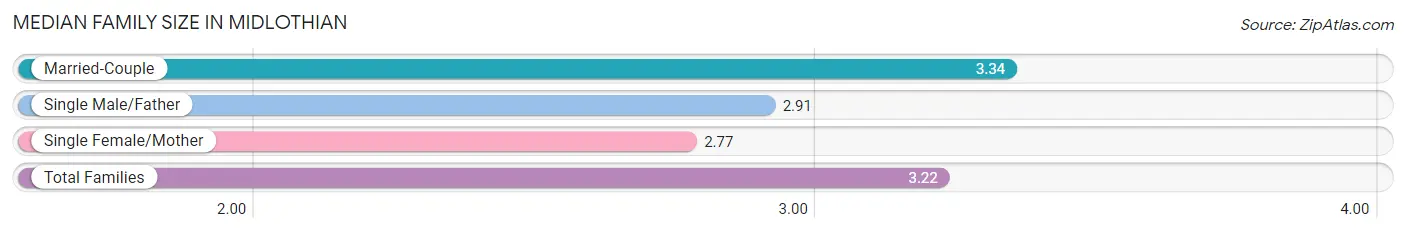
| Family Type | # Families | Family Size |
| Married-Couple | 7,668 (76.6%) | 3.34 |
| Single Male/Father | 778 (7.8%) | 2.91 |
| Single Female/Mother | 1,561 (15.6%) | 2.77 |
| Total Families | 10,007 (100.0%) | 3.22 |
Median Household Size in Midlothian
The median household size in Midlothian is 3.01 persons per household, with married-couple households (7,668 | 65.1%) accounting for the largest median household size of 3.39 persons per household. non-family households (1,772 | 15.0%) represent the smallest median household size with 1.21 persons per household.
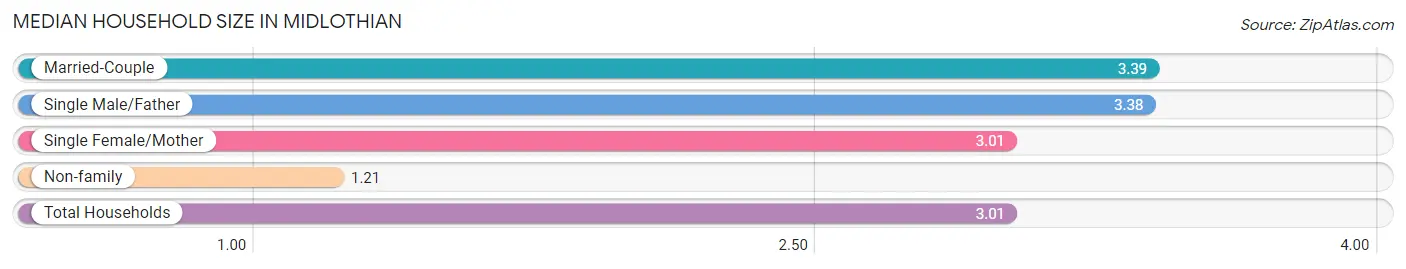
| Household Type | # Households | Household Size |
| Married-Couple | 7,668 (65.1%) | 3.39 |
| Single Male/Father | 778 (6.6%) | 3.38 |
| Single Female/Mother | 1,561 (13.3%) | 3.01 |
| Non-family | 1,772 (15.0%) | 1.21 |
| Total Households | 11,779 (100.0%) | 3.01 |
Household Size by Marriage Status in Midlothian
Out of a total of 11,779 households in Midlothian, 10,007 (85.0%) are family households, while 1,772 (15.0%) are nonfamily households. The most numerous type of family households are 2-person households, comprising 3,803, and the most common type of nonfamily households are 1-person households, comprising 1,410.
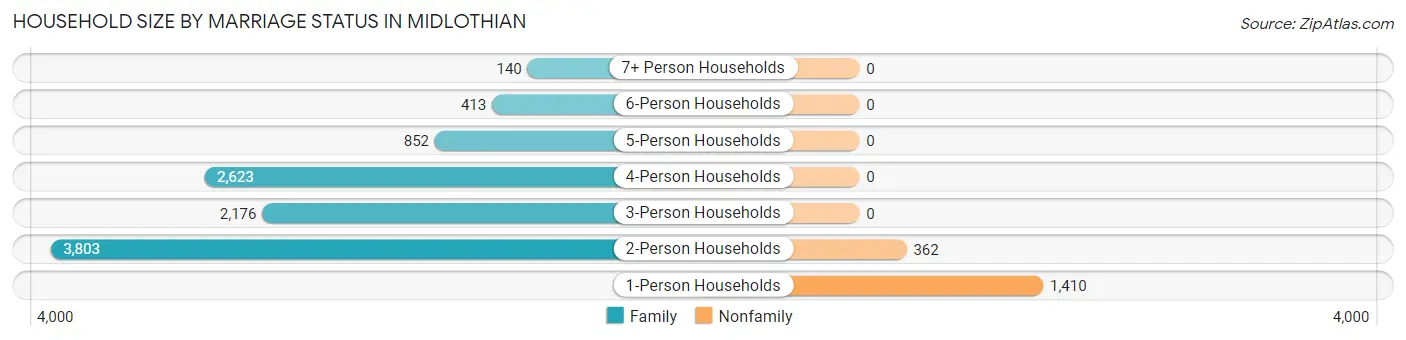
| Household Size | Family Households | Nonfamily Households |
| 1-Person Households | - | 1,410 (12.0%) |
| 2-Person Households | 3,803 (32.3%) | 362 (3.1%) |
| 3-Person Households | 2,176 (18.5%) | 0 (0.0%) |
| 4-Person Households | 2,623 (22.3%) | 0 (0.0%) |
| 5-Person Households | 852 (7.2%) | 0 (0.0%) |
| 6-Person Households | 413 (3.5%) | 0 (0.0%) |
| 7+ Person Households | 140 (1.2%) | 0 (0.0%) |
| Total | 10,007 (85.0%) | 1,772 (15.0%) |
Female Fertility in Midlothian
Fertility by Age in Midlothian
Average fertility rate in Midlothian is 43.0 births per 1,000 women. Women in the age bracket of 20 to 34 years have the highest fertility rate with 94.0 births per 1,000 women. Women in the age bracket of 20 to 34 years acount for 79.0% of all women with births.
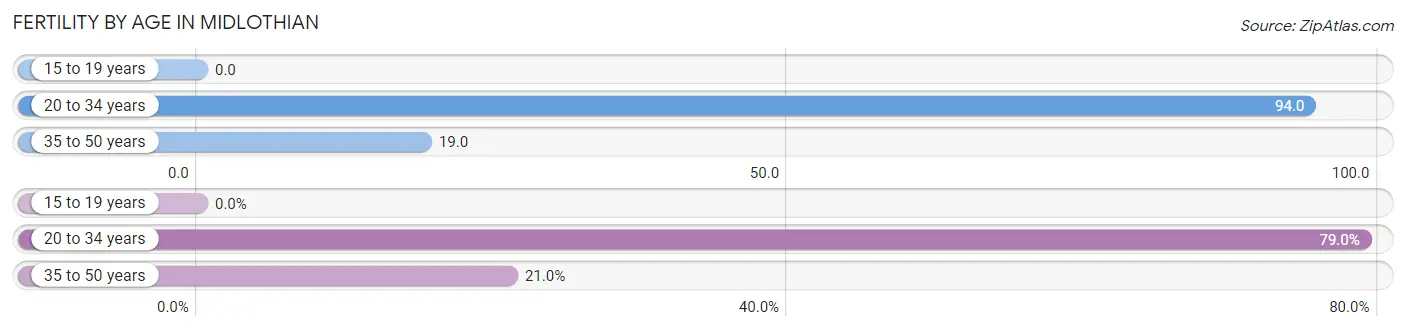
| Age Bracket | Women with Births | Births / 1,000 Women |
| 15 to 19 years | 0 (0.0%) | 0.0 |
| 20 to 34 years | 304 (79.0%) | 94.0 |
| 35 to 50 years | 81 (21.0%) | 19.0 |
| Total | 385 (100.0%) | 43.0 |
Fertility by Age by Marriage Status in Midlothian
84.7% of women with births (385) in Midlothian are married. The highest percentage of unmarried women with births falls into 20 to 34 years age bracket with 19.4% of them unmarried at the time of birth, while the lowest percentage of unmarried women with births belong to 35 to 50 years age bracket with 0.0% of them unmarried.
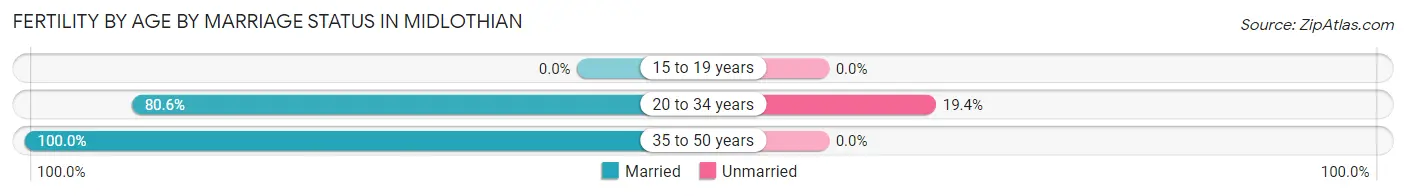
| Age Bracket | Married | Unmarried |
| 15 to 19 years | 0 (0.0%) | 0 (0.0%) |
| 20 to 34 years | 245 (80.6%) | 59 (19.4%) |
| 35 to 50 years | 81 (100.0%) | 0 (0.0%) |
| Total | 326 (84.7%) | 59 (15.3%) |
Fertility by Education in Midlothian
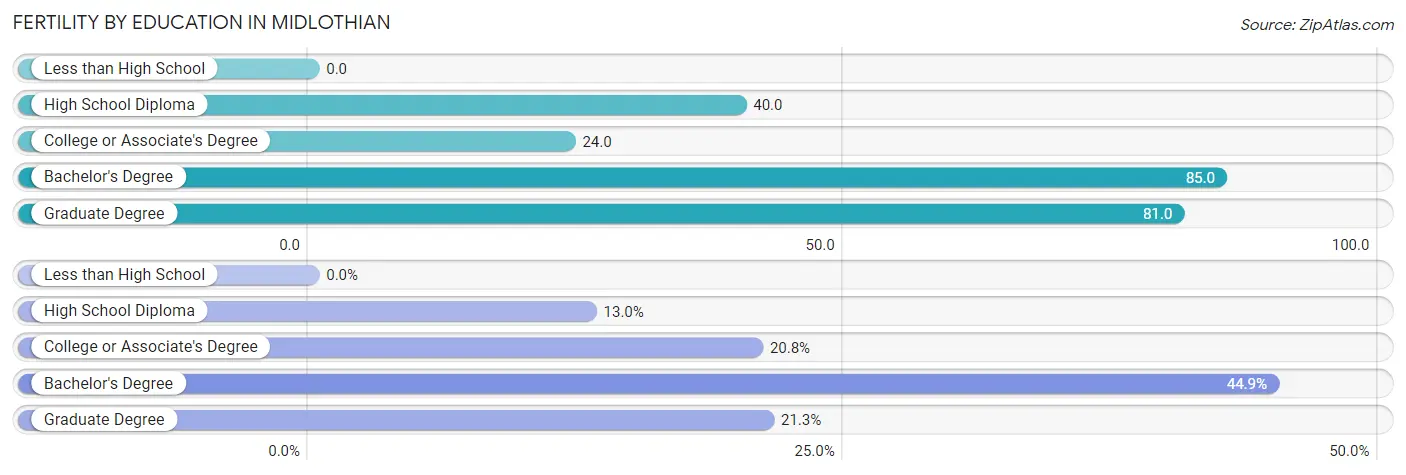
| Educational Attainment | Women with Births | Births / 1,000 Women |
| Less than High School | 0 (0.0%) | 0.0 |
| High School Diploma | 50 (13.0%) | 40.0 |
| College or Associate's Degree | 80 (20.8%) | 24.0 |
| Bachelor's Degree | 173 (44.9%) | 85.0 |
| Graduate Degree | 82 (21.3%) | 81.0 |
| Total | 385 (100.0%) | 43.0 |
Fertility by Education by Marriage Status in Midlothian
15.3% of women with births in Midlothian are unmarried. Women with the educational attainment of college or associate's degree are most likely to be married with 100.0% of them married at childbirth, while women with the educational attainment of high school diploma are least likely to be married with 100.0% of them unmarried at childbirth.
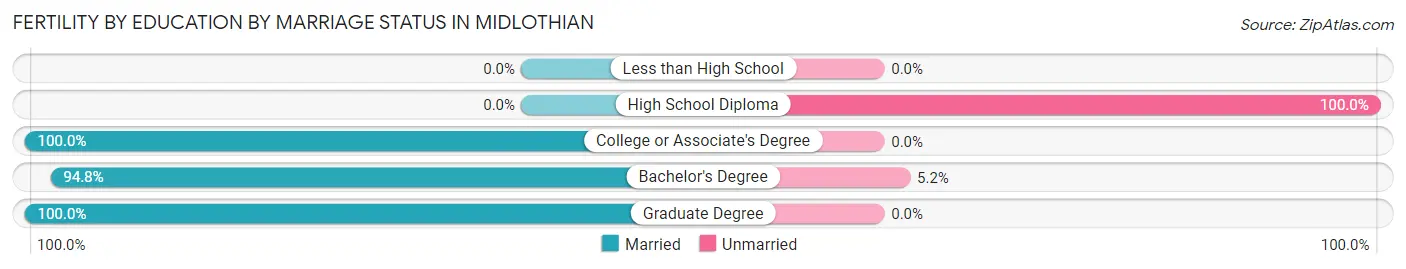
| Educational Attainment | Married | Unmarried |
| Less than High School | 0 (0.0%) | 0 (0.0%) |
| High School Diploma | 0 (0.0%) | 50 (100.0%) |
| College or Associate's Degree | 80 (100.0%) | 0 (0.0%) |
| Bachelor's Degree | 164 (94.8%) | 9 (5.2%) |
| Graduate Degree | 82 (100.0%) | 0 (0.0%) |
| Total | 326 (84.7%) | 59 (15.3%) |
Employment Characteristics in Midlothian
Employment by Class of Employer in Midlothian
Among the 18,268 employed individuals in Midlothian, private company employees (13,158 | 72.0%), local government employees (1,553 | 8.5%), and not-for-profit organizations (1,188 | 6.5%) make up the most common classes of employment.
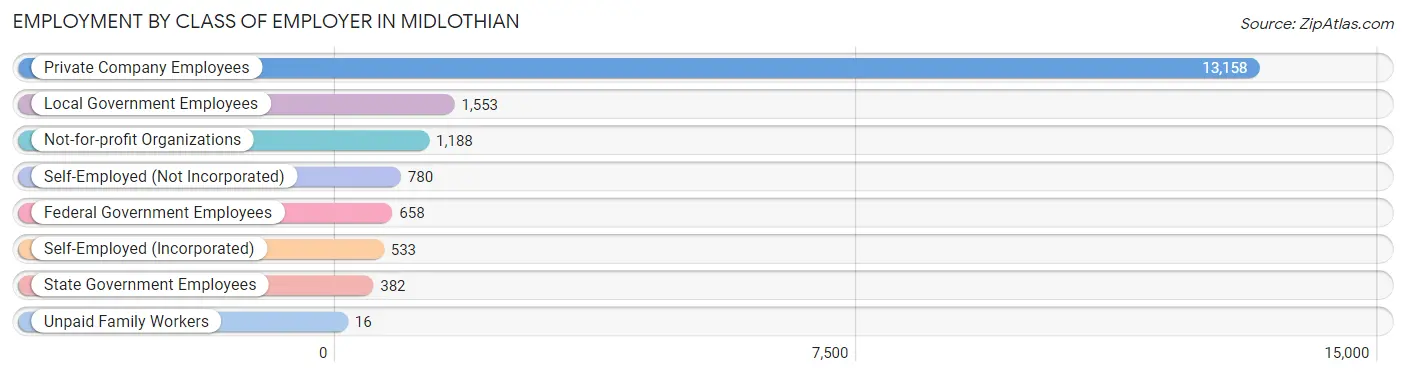
| Employer Class | # Employees | % Employees |
| Private Company Employees | 13,158 | 72.0% |
| Self-Employed (Incorporated) | 533 | 2.9% |
| Self-Employed (Not Incorporated) | 780 | 4.3% |
| Not-for-profit Organizations | 1,188 | 6.5% |
| Local Government Employees | 1,553 | 8.5% |
| State Government Employees | 382 | 2.1% |
| Federal Government Employees | 658 | 3.6% |
| Unpaid Family Workers | 16 | 0.1% |
| Total | 18,268 | 100.0% |
Employment Status by Age in Midlothian
According to the labor force statistics for Midlothian, out of the total population over 16 years of age (26,273), 73.0% or 19,179 individuals are in the labor force, with 2.9% or 556 of them unemployed. The age group with the highest labor force participation rate is 45 to 54 years, with 92.6% or 4,820 individuals in the labor force. Within the labor force, the 20 to 24 years age range has the highest percentage of unemployed individuals, with 6.9% or 110 of them being unemployed.
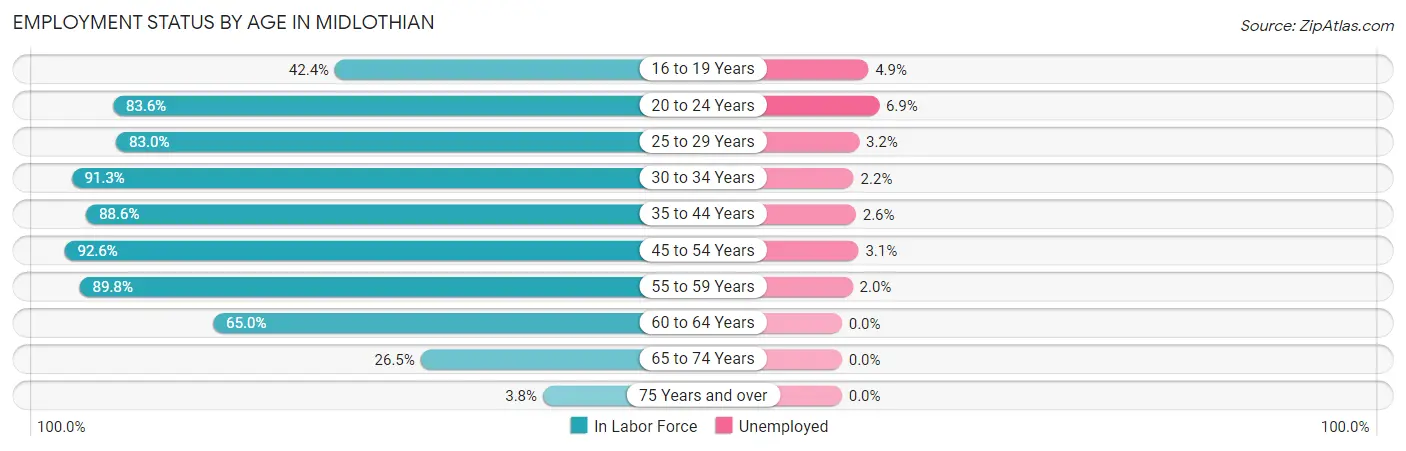
| Age Bracket | In Labor Force | Unemployed |
| 16 to 19 Years | 965 (42.4%) | 47 (4.9%) |
| 20 to 24 Years | 1,588 (83.6%) | 110 (6.9%) |
| 25 to 29 Years | 1,288 (83.0%) | 41 (3.2%) |
| 30 to 34 Years | 2,343 (91.3%) | 52 (2.2%) |
| 35 to 44 Years | 4,573 (88.6%) | 119 (2.6%) |
| 45 to 54 Years | 4,820 (92.6%) | 149 (3.1%) |
| 55 to 59 Years | 1,809 (89.8%) | 36 (2.0%) |
| 60 to 64 Years | 1,093 (65.0%) | 0 (0.0%) |
| 65 to 74 Years | 631 (26.5%) | 0 (0.0%) |
| 75 Years and over | 58 (3.8%) | 0 (0.0%) |
| Total | 19,179 (73.0%) | 556 (2.9%) |
Employment Status by Educational Attainment in Midlothian
According to labor force statistics for Midlothian, 87.6% of individuals (15,925) out of the total population between 25 and 64 years of age (18,179) are in the labor force, with 2.5% or 398 of them being unemployed. The group with the highest labor force participation rate are those with the educational attainment of college / associate degree, with 91.0% or 5,825 individuals in the labor force. Within the labor force, individuals with less than high school education have the highest percentage of unemployment, with 11.0% or 86 of them being unemployed.
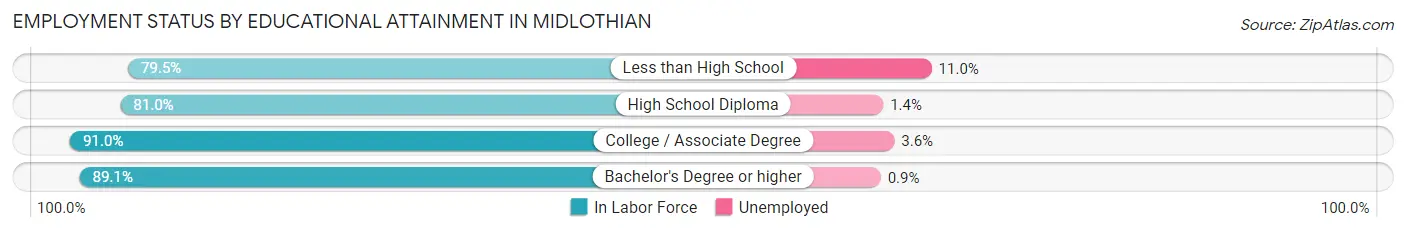
| Educational Attainment | In Labor Force | Unemployed |
| Less than High School | 785 (79.5%) | 109 (11.0%) |
| High School Diploma | 2,959 (81.0%) | 51 (1.4%) |
| College / Associate Degree | 5,825 (91.0%) | 230 (3.6%) |
| Bachelor's Degree or higher | 6,359 (89.1%) | 64 (0.9%) |
| Total | 15,925 (87.6%) | 454 (2.5%) |
Employment Occupations by Sex in Midlothian
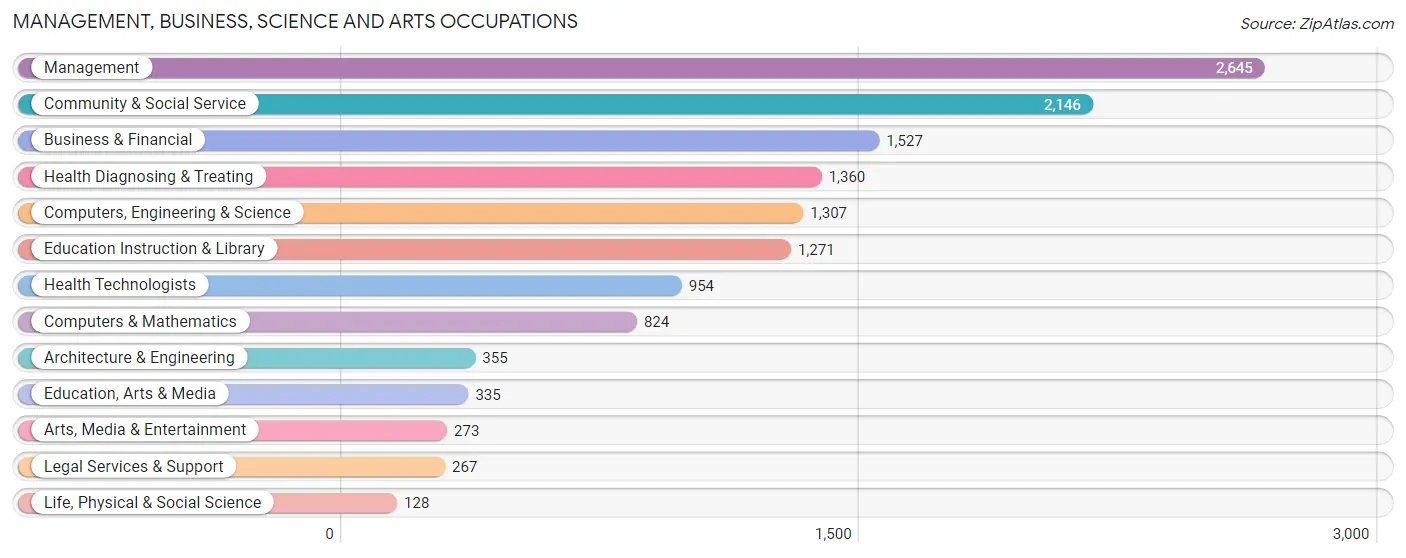
Management, Business, Science and Arts Occupations
The most common Management, Business, Science and Arts occupations in Midlothian are Management (2,645 | 14.2%), Community & Social Service (2,146 | 11.5%), Business & Financial (1,527 | 8.2%), Health Diagnosing & Treating (1,360 | 7.3%), and Computers, Engineering & Science (1,307 | 7.0%).
Management, Business, Science and Arts Occupations by Sex
Within the Management, Business, Science and Arts occupations in Midlothian, the most male-oriented occupations are Computers & Mathematics (74.6%), Arts, Media & Entertainment (74.4%), and Computers, Engineering & Science (66.9%), while the most female-oriented occupations are Health Technologists (84.5%), Health Diagnosing & Treating (82.1%), and Life, Physical & Social Science (75.0%).
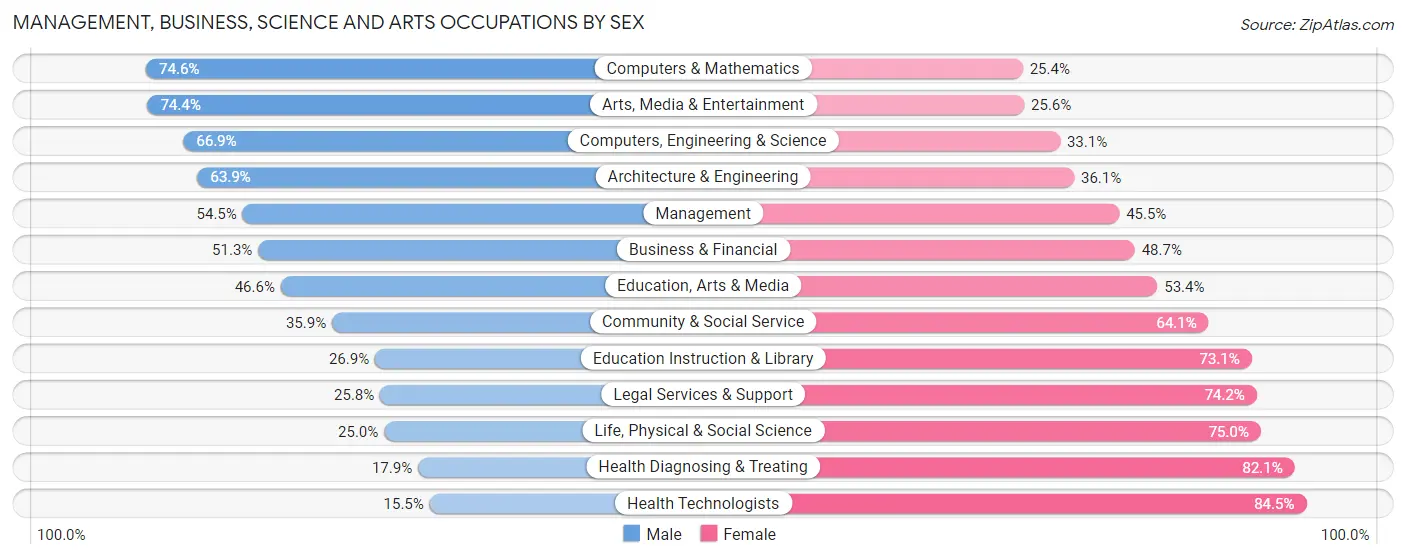
| Occupation | Male | Female |
| Management | 1,442 (54.5%) | 1,203 (45.5%) |
| Business & Financial | 783 (51.3%) | 744 (48.7%) |
| Computers, Engineering & Science | 874 (66.9%) | 433 (33.1%) |
| Computers & Mathematics | 615 (74.6%) | 209 (25.4%) |
| Architecture & Engineering | 227 (63.9%) | 128 (36.1%) |
| Life, Physical & Social Science | 32 (25.0%) | 96 (75.0%) |
| Community & Social Service | 770 (35.9%) | 1,376 (64.1%) |
| Education, Arts & Media | 156 (46.6%) | 179 (53.4%) |
| Legal Services & Support | 69 (25.8%) | 198 (74.2%) |
| Education Instruction & Library | 342 (26.9%) | 929 (73.1%) |
| Arts, Media & Entertainment | 203 (74.4%) | 70 (25.6%) |
| Health Diagnosing & Treating | 244 (17.9%) | 1,116 (82.1%) |
| Health Technologists | 148 (15.5%) | 806 (84.5%) |
| Total (Category) | 4,113 (45.8%) | 4,872 (54.2%) |
| Total (Overall) | 9,861 (53.0%) | 8,753 (47.0%) |
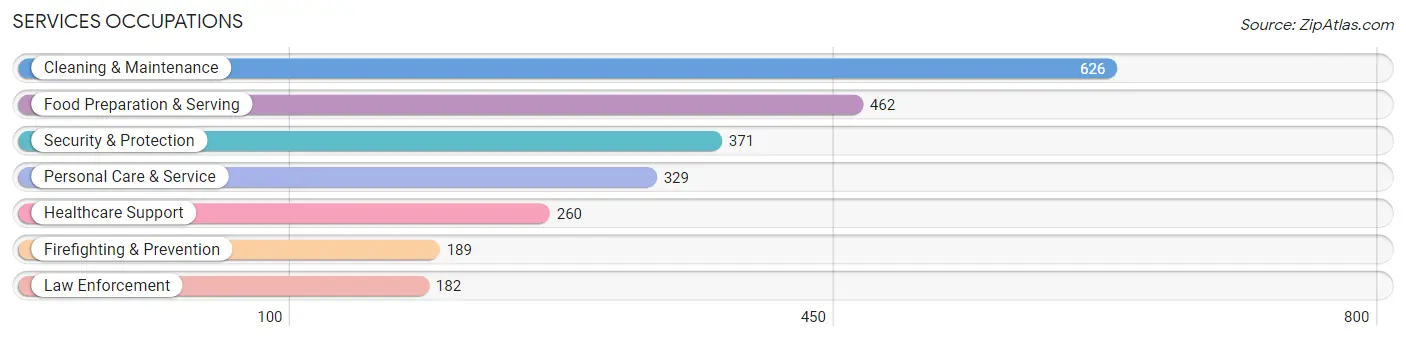
Services Occupations
The most common Services occupations in Midlothian are Cleaning & Maintenance (626 | 3.4%), Food Preparation & Serving (462 | 2.5%), Security & Protection (371 | 2.0%), Personal Care & Service (329 | 1.8%), and Healthcare Support (260 | 1.4%).
Services Occupations by Sex
Within the Services occupations in Midlothian, the most male-oriented occupations are Law Enforcement (85.7%), Security & Protection (79.8%), and Firefighting & Prevention (74.1%), while the most female-oriented occupations are Healthcare Support (97.7%), Personal Care & Service (79.6%), and Food Preparation & Serving (31.4%).
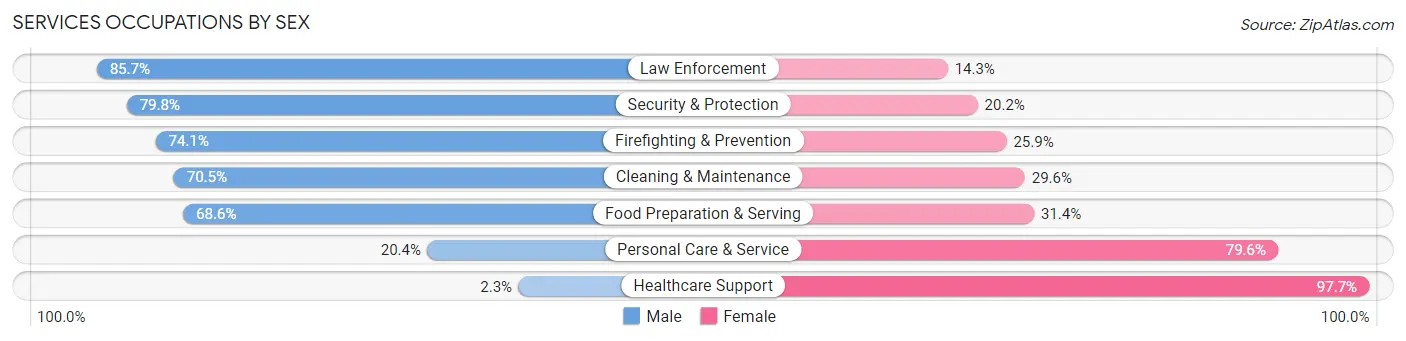
| Occupation | Male | Female |
| Healthcare Support | 6 (2.3%) | 254 (97.7%) |
| Security & Protection | 296 (79.8%) | 75 (20.2%) |
| Firefighting & Prevention | 140 (74.1%) | 49 (25.9%) |
| Law Enforcement | 156 (85.7%) | 26 (14.3%) |
| Food Preparation & Serving | 317 (68.6%) | 145 (31.4%) |
| Cleaning & Maintenance | 441 (70.5%) | 185 (29.5%) |
| Personal Care & Service | 67 (20.4%) | 262 (79.6%) |
| Total (Category) | 1,127 (55.0%) | 921 (45.0%) |
| Total (Overall) | 9,861 (53.0%) | 8,753 (47.0%) |
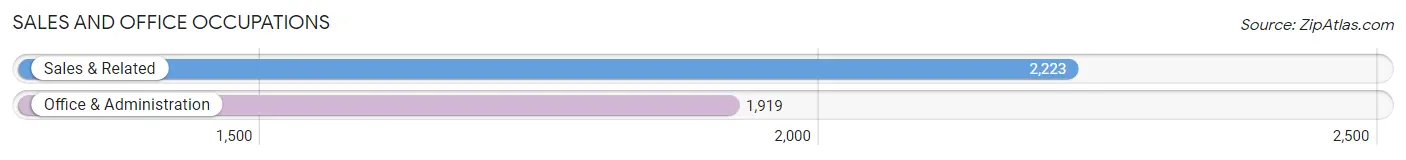
Sales and Office Occupations
The most common Sales and Office occupations in Midlothian are Sales & Related (2,223 | 11.9%), and Office & Administration (1,919 | 10.3%).
Sales and Office Occupations by Sex
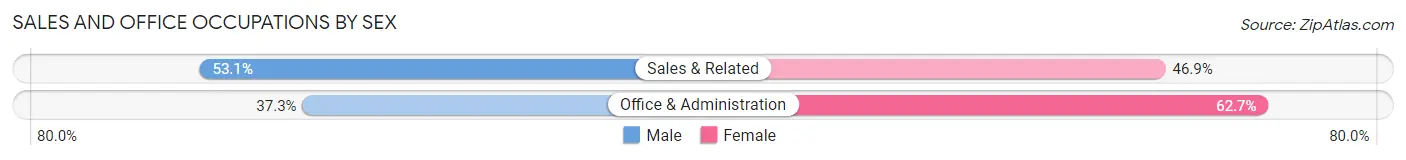
| Occupation | Male | Female |
| Sales & Related | 1,180 (53.1%) | 1,043 (46.9%) |
| Office & Administration | 715 (37.3%) | 1,204 (62.7%) |
| Total (Category) | 1,895 (45.8%) | 2,247 (54.2%) |
| Total (Overall) | 9,861 (53.0%) | 8,753 (47.0%) |
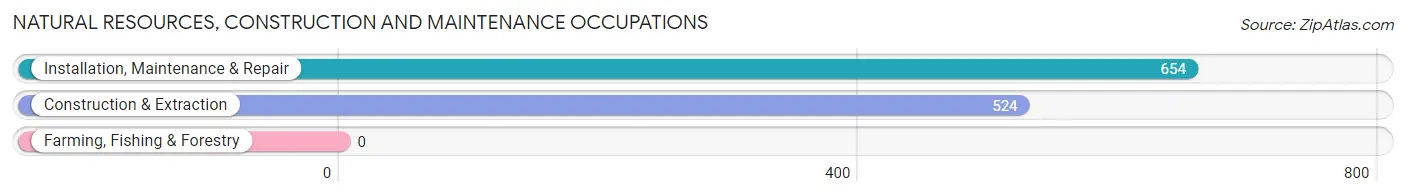
Natural Resources, Construction and Maintenance Occupations
The most common Natural Resources, Construction and Maintenance occupations in Midlothian are Installation, Maintenance & Repair (654 | 3.5%), and Construction & Extraction (524 | 2.8%).
Natural Resources, Construction and Maintenance Occupations by Sex
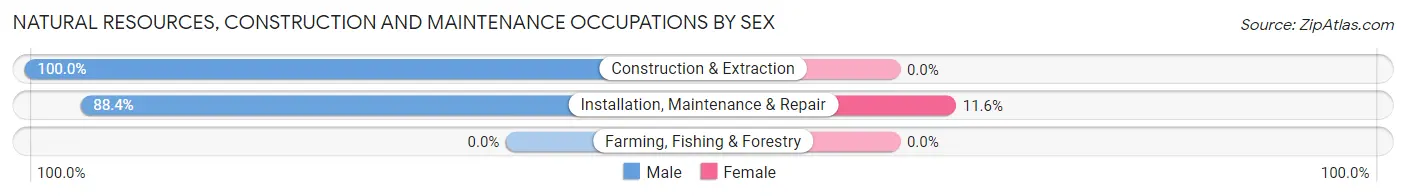
| Occupation | Male | Female |
| Farming, Fishing & Forestry | 0 (0.0%) | 0 (0.0%) |
| Construction & Extraction | 524 (100.0%) | 0 (0.0%) |
| Installation, Maintenance & Repair | 578 (88.4%) | 76 (11.6%) |
| Total (Category) | 1,102 (93.5%) | 76 (6.5%) |
| Total (Overall) | 9,861 (53.0%) | 8,753 (47.0%) |
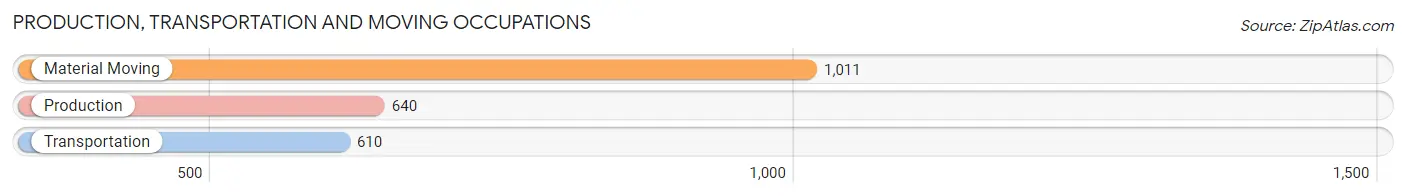
Production, Transportation and Moving Occupations
The most common Production, Transportation and Moving occupations in Midlothian are Material Moving (1,011 | 5.4%), Production (640 | 3.4%), and Transportation (610 | 3.3%).
Production, Transportation and Moving Occupations by Sex
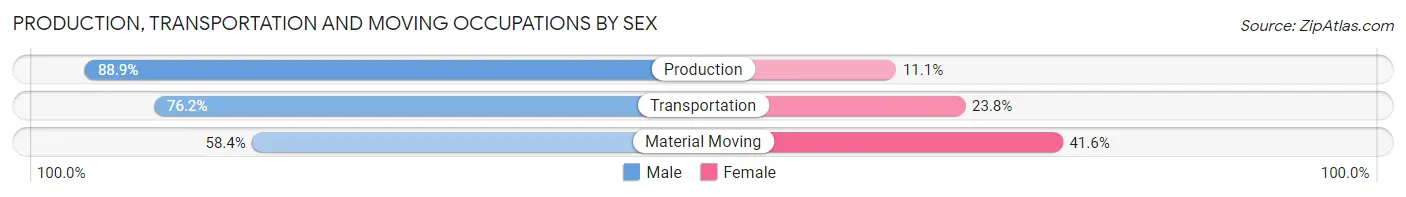
| Occupation | Male | Female |
| Production | 569 (88.9%) | 71 (11.1%) |
| Transportation | 465 (76.2%) | 145 (23.8%) |
| Material Moving | 590 (58.4%) | 421 (41.6%) |
| Total (Category) | 1,624 (71.8%) | 637 (28.2%) |
| Total (Overall) | 9,861 (53.0%) | 8,753 (47.0%) |
Employment Industries by Sex in Midlothian
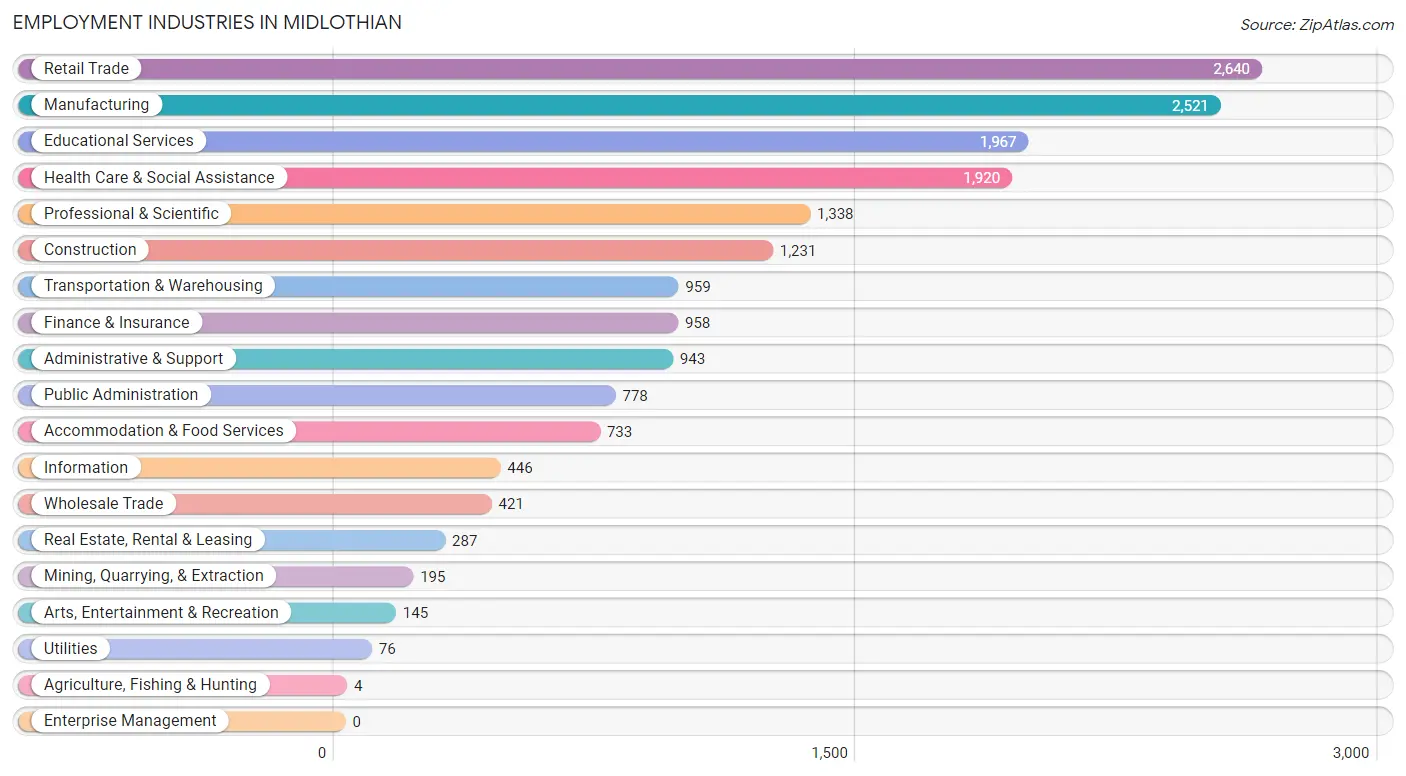
Employment Industries in Midlothian
The major employment industries in Midlothian include Retail Trade (2,640 | 14.2%), Manufacturing (2,521 | 13.5%), Educational Services (1,967 | 10.6%), Health Care & Social Assistance (1,920 | 10.3%), and Professional & Scientific (1,338 | 7.2%).
Employment Industries by Sex in Midlothian
The Midlothian industries that see more men than women are Agriculture, Fishing & Hunting (100.0%), Utilities (100.0%), and Construction (82.9%), whereas the industries that tend to have a higher number of women are Health Care & Social Assistance (82.1%), Educational Services (66.4%), and Finance & Insurance (61.5%).
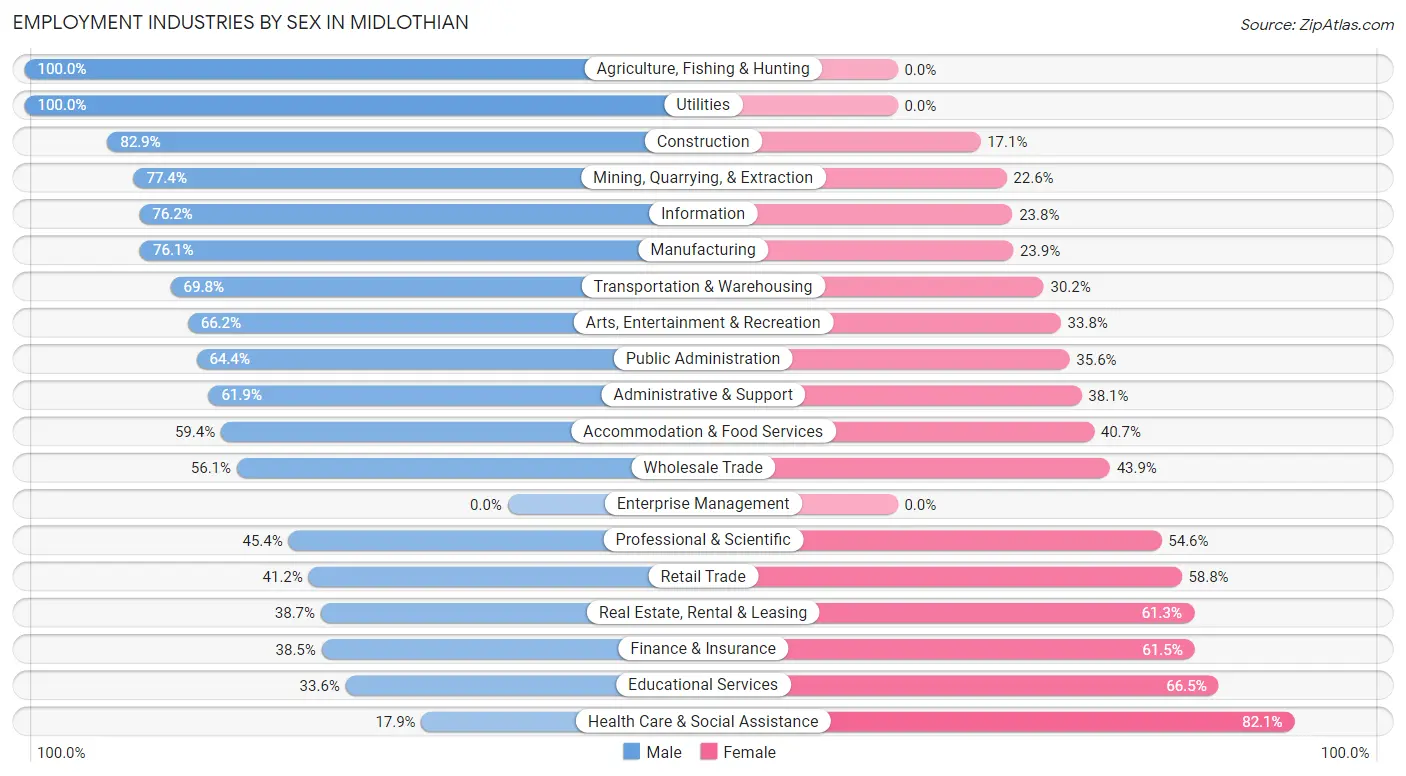
| Industry | Male | Female |
| Agriculture, Fishing & Hunting | 4 (100.0%) | 0 (0.0%) |
| Mining, Quarrying, & Extraction | 151 (77.4%) | 44 (22.6%) |
| Construction | 1,020 (82.9%) | 211 (17.1%) |
| Manufacturing | 1,918 (76.1%) | 603 (23.9%) |
| Wholesale Trade | 236 (56.1%) | 185 (43.9%) |
| Retail Trade | 1,088 (41.2%) | 1,552 (58.8%) |
| Transportation & Warehousing | 669 (69.8%) | 290 (30.2%) |
| Utilities | 76 (100.0%) | 0 (0.0%) |
| Information | 340 (76.2%) | 106 (23.8%) |
| Finance & Insurance | 369 (38.5%) | 589 (61.5%) |
| Real Estate, Rental & Leasing | 111 (38.7%) | 176 (61.3%) |
| Professional & Scientific | 607 (45.4%) | 731 (54.6%) |
| Enterprise Management | 0 (0.0%) | 0 (0.0%) |
| Administrative & Support | 584 (61.9%) | 359 (38.1%) |
| Educational Services | 660 (33.6%) | 1,307 (66.4%) |
| Health Care & Social Assistance | 343 (17.9%) | 1,577 (82.1%) |
| Arts, Entertainment & Recreation | 96 (66.2%) | 49 (33.8%) |
| Accommodation & Food Services | 435 (59.4%) | 298 (40.6%) |
| Public Administration | 501 (64.4%) | 277 (35.6%) |
| Total | 9,861 (53.0%) | 8,753 (47.0%) |
Education in Midlothian
School Enrollment in Midlothian
The most common levels of schooling among the 10,469 students in Midlothian are elementary school (2,629 | 25.1%), middle school (2,565 | 24.5%), and high school (2,326 | 22.2%).
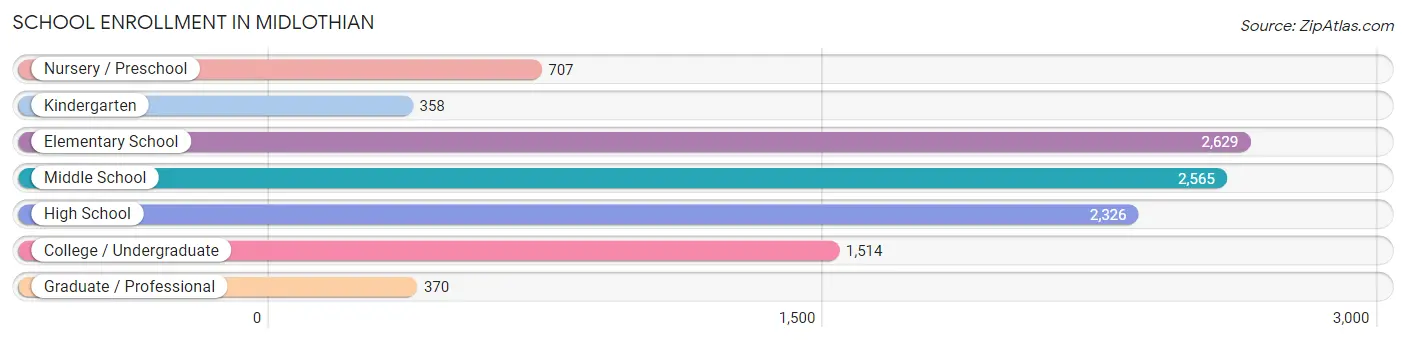
| School Level | # Students | % Students |
| Nursery / Preschool | 707 | 6.8% |
| Kindergarten | 358 | 3.4% |
| Elementary School | 2,629 | 25.1% |
| Middle School | 2,565 | 24.5% |
| High School | 2,326 | 22.2% |
| College / Undergraduate | 1,514 | 14.5% |
| Graduate / Professional | 370 | 3.5% |
| Total | 10,469 | 100.0% |
School Enrollment by Age by Funding Source in Midlothian
Out of a total of 10,469 students who are enrolled in schools in Midlothian, 1,057 (10.1%) attend a private institution, while the remaining 9,412 (89.9%) are enrolled in public schools. The age group of 3 to 4 year olds has the highest likelihood of being enrolled in private schools, with 290 (44.2% in the age bracket) enrolled. Conversely, the age group of 18 to 19 year olds has the lowest likelihood of being enrolled in a private school, with 880 (98.0% in the age bracket) attending a public institution.
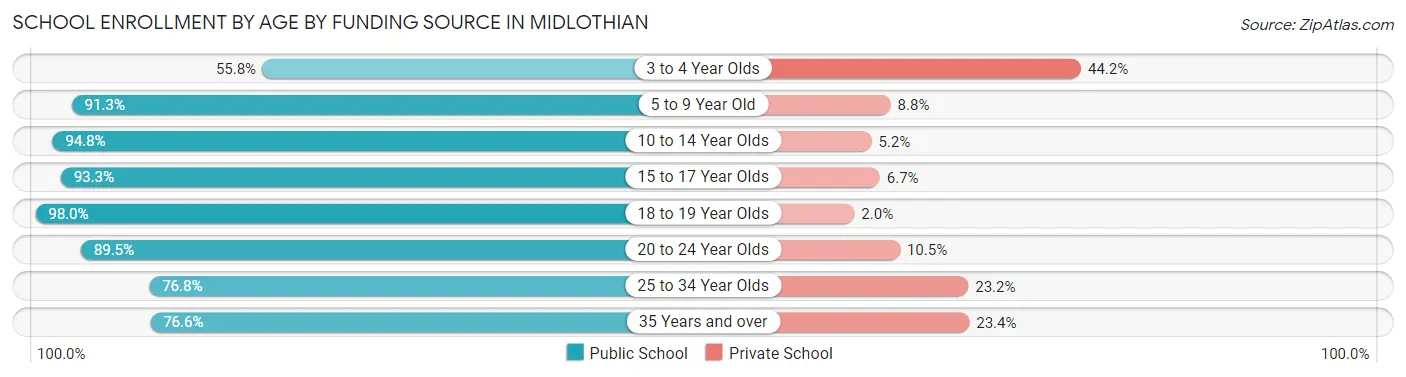
| Age Bracket | Public School | Private School |
| 3 to 4 Year Olds | 366 (55.8%) | 290 (44.2%) |
| 5 to 9 Year Old | 2,314 (91.2%) | 222 (8.7%) |
| 10 to 14 Year Olds | 3,189 (94.8%) | 174 (5.2%) |
| 15 to 17 Year Olds | 1,537 (93.3%) | 111 (6.7%) |
| 18 to 19 Year Olds | 880 (98.0%) | 18 (2.0%) |
| 20 to 24 Year Olds | 546 (89.5%) | 64 (10.5%) |
| 25 to 34 Year Olds | 162 (76.8%) | 49 (23.2%) |
| 35 Years and over | 419 (76.6%) | 128 (23.4%) |
| Total | 9,412 (89.9%) | 1,057 (10.1%) |
Educational Attainment by Field of Study in Midlothian
Business (2,218 | 25.5%), education (1,435 | 16.5%), science & technology (998 | 11.5%), arts & humanities (589 | 6.8%), and engineering (517 | 5.9%) are the most common fields of study among 8,707 individuals in Midlothian who have obtained a bachelor's degree or higher.
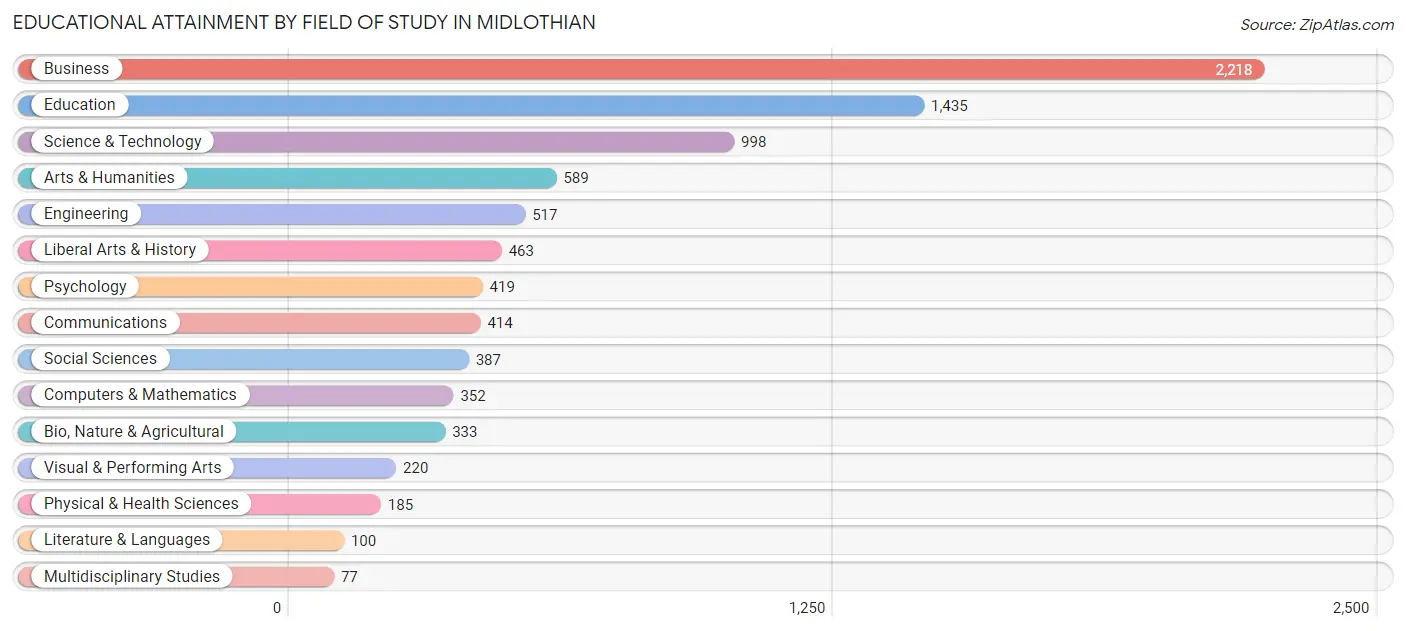
| Field of Study | # Graduates | % Graduates |
| Computers & Mathematics | 352 | 4.0% |
| Bio, Nature & Agricultural | 333 | 3.8% |
| Physical & Health Sciences | 185 | 2.1% |
| Psychology | 419 | 4.8% |
| Social Sciences | 387 | 4.4% |
| Engineering | 517 | 5.9% |
| Multidisciplinary Studies | 77 | 0.9% |
| Science & Technology | 998 | 11.5% |
| Business | 2,218 | 25.5% |
| Education | 1,435 | 16.5% |
| Literature & Languages | 100 | 1.1% |
| Liberal Arts & History | 463 | 5.3% |
| Visual & Performing Arts | 220 | 2.5% |
| Communications | 414 | 4.8% |
| Arts & Humanities | 589 | 6.8% |
| Total | 8,707 | 100.0% |
Transportation & Commute in Midlothian
Vehicle Availability by Sex in Midlothian
The most prevalent vehicle ownership categories in Midlothian are males with 2 vehicles (4,163, accounting for 43.1%) and females with 2 vehicles (4,043, making up 48.3%).
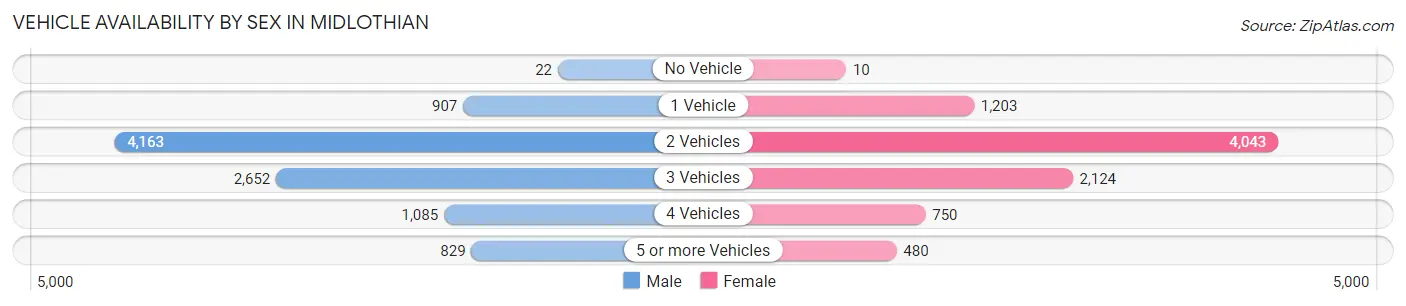
| Vehicles Available | Male | Female |
| No Vehicle | 22 (0.2%) | 10 (0.1%) |
| 1 Vehicle | 907 (9.4%) | 1,203 (14.0%) |
| 2 Vehicles | 4,163 (43.1%) | 4,043 (47.0%) |
| 3 Vehicles | 2,652 (27.5%) | 2,124 (24.7%) |
| 4 Vehicles | 1,085 (11.2%) | 750 (8.7%) |
| 5 or more Vehicles | 829 (8.6%) | 480 (5.6%) |
| Total | 9,658 (100.0%) | 8,610 (100.0%) |
Commute Time in Midlothian
The most frequently occuring commute durations in Midlothian are 30 to 34 minutes (2,720 commuters, 17.0%), 45 to 59 minutes (2,215 commuters, 13.9%), and 15 to 19 minutes (1,934 commuters, 12.1%).
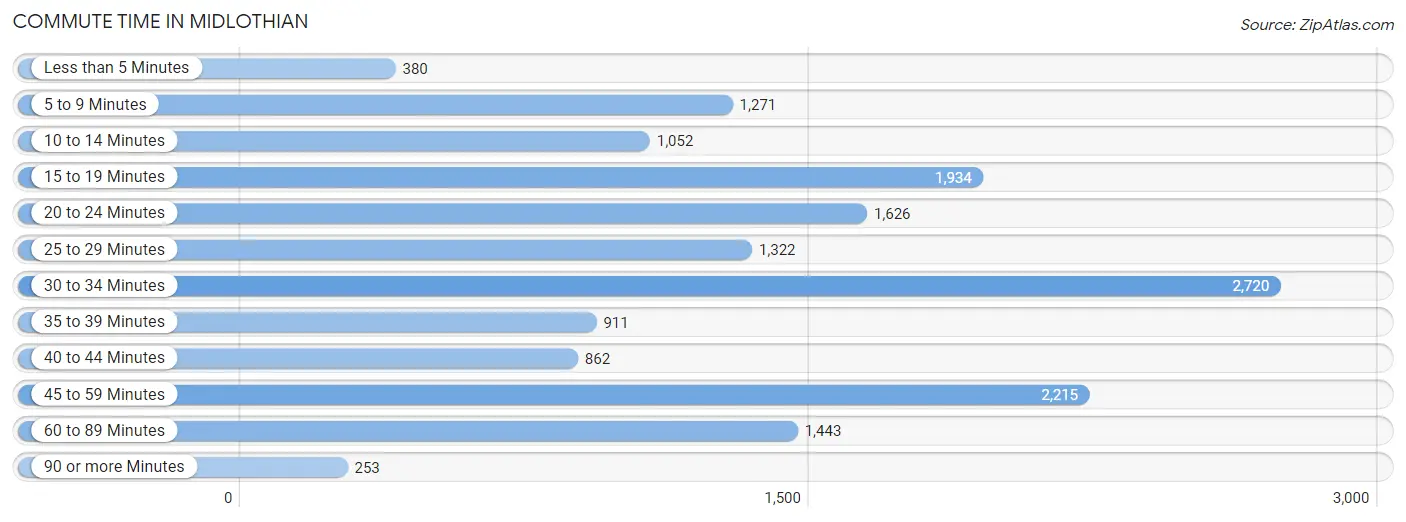
| Commute Time | # Commuters | % Commuters |
| Less than 5 Minutes | 380 | 2.4% |
| 5 to 9 Minutes | 1,271 | 8.0% |
| 10 to 14 Minutes | 1,052 | 6.6% |
| 15 to 19 Minutes | 1,934 | 12.1% |
| 20 to 24 Minutes | 1,626 | 10.2% |
| 25 to 29 Minutes | 1,322 | 8.3% |
| 30 to 34 Minutes | 2,720 | 17.0% |
| 35 to 39 Minutes | 911 | 5.7% |
| 40 to 44 Minutes | 862 | 5.4% |
| 45 to 59 Minutes | 2,215 | 13.9% |
| 60 to 89 Minutes | 1,443 | 9.0% |
| 90 or more Minutes | 253 | 1.6% |
Commute Time by Sex in Midlothian
The most common commute times in Midlothian are 30 to 34 minutes (1,626 commuters, 18.8%) for males and 15 to 19 minutes (1,139 commuters, 15.5%) for females.
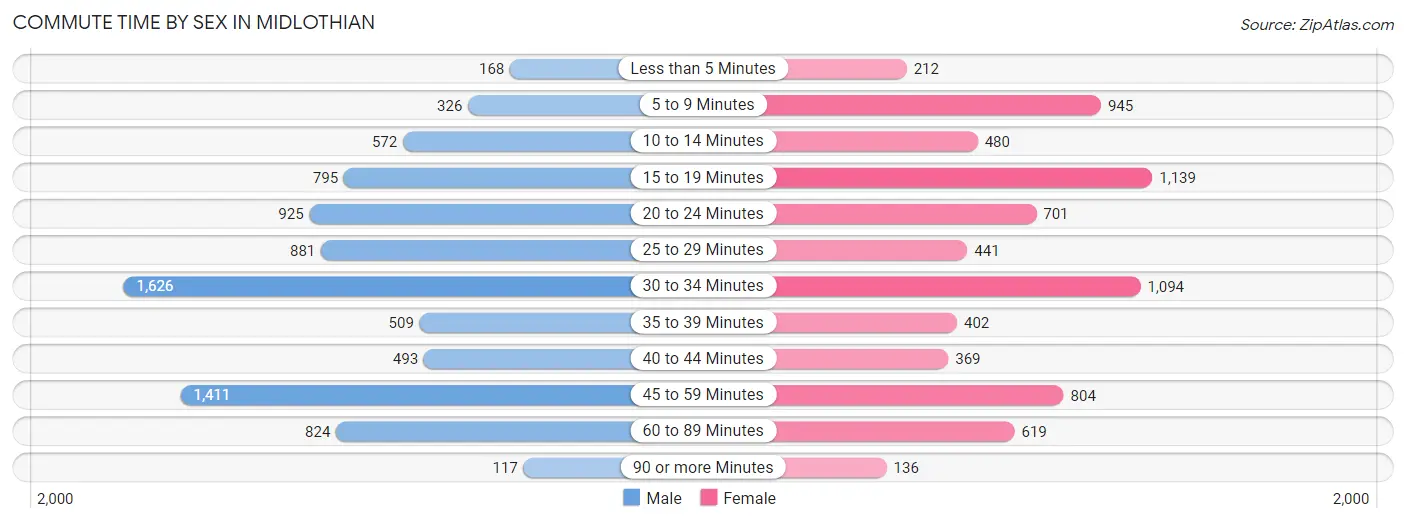
| Commute Time | Male | Female |
| Less than 5 Minutes | 168 (1.9%) | 212 (2.9%) |
| 5 to 9 Minutes | 326 (3.8%) | 945 (12.9%) |
| 10 to 14 Minutes | 572 (6.6%) | 480 (6.5%) |
| 15 to 19 Minutes | 795 (9.2%) | 1,139 (15.5%) |
| 20 to 24 Minutes | 925 (10.7%) | 701 (9.6%) |
| 25 to 29 Minutes | 881 (10.2%) | 441 (6.0%) |
| 30 to 34 Minutes | 1,626 (18.8%) | 1,094 (14.9%) |
| 35 to 39 Minutes | 509 (5.9%) | 402 (5.5%) |
| 40 to 44 Minutes | 493 (5.7%) | 369 (5.0%) |
| 45 to 59 Minutes | 1,411 (16.3%) | 804 (11.0%) |
| 60 to 89 Minutes | 824 (9.5%) | 619 (8.4%) |
| 90 or more Minutes | 117 (1.3%) | 136 (1.8%) |
Time of Departure to Work by Sex in Midlothian
The most frequent times of departure to work in Midlothian are 7:00 AM to 7:29 AM (1,527, 17.7%) for males and 7:30 AM to 7:59 AM (1,165, 15.9%) for females.
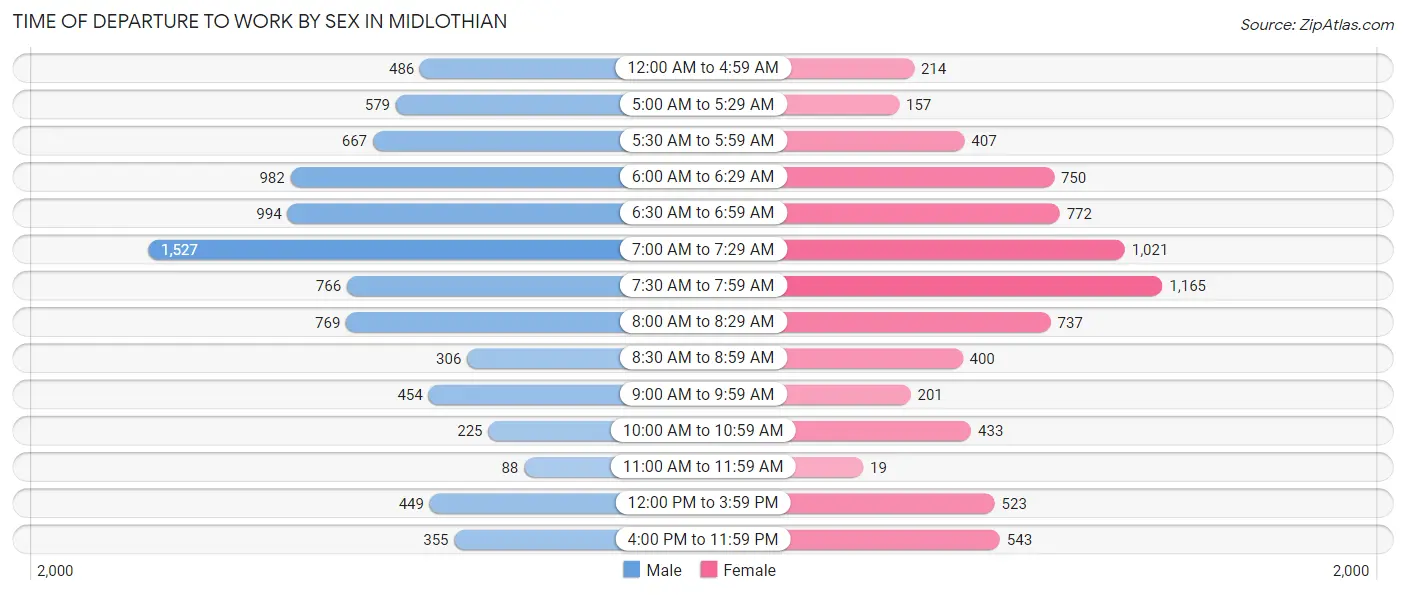
| Time of Departure | Male | Female |
| 12:00 AM to 4:59 AM | 486 (5.6%) | 214 (2.9%) |
| 5:00 AM to 5:29 AM | 579 (6.7%) | 157 (2.1%) |
| 5:30 AM to 5:59 AM | 667 (7.7%) | 407 (5.5%) |
| 6:00 AM to 6:29 AM | 982 (11.4%) | 750 (10.2%) |
| 6:30 AM to 6:59 AM | 994 (11.5%) | 772 (10.5%) |
| 7:00 AM to 7:29 AM | 1,527 (17.7%) | 1,021 (13.9%) |
| 7:30 AM to 7:59 AM | 766 (8.9%) | 1,165 (15.9%) |
| 8:00 AM to 8:29 AM | 769 (8.9%) | 737 (10.0%) |
| 8:30 AM to 8:59 AM | 306 (3.5%) | 400 (5.4%) |
| 9:00 AM to 9:59 AM | 454 (5.2%) | 201 (2.7%) |
| 10:00 AM to 10:59 AM | 225 (2.6%) | 433 (5.9%) |
| 11:00 AM to 11:59 AM | 88 (1.0%) | 19 (0.3%) |
| 12:00 PM to 3:59 PM | 449 (5.2%) | 523 (7.1%) |
| 4:00 PM to 11:59 PM | 355 (4.1%) | 543 (7.4%) |
| Total | 8,647 (100.0%) | 7,342 (100.0%) |
Housing Occupancy in Midlothian
Occupancy by Ownership in Midlothian
Of the total 11,779 dwellings in Midlothian, owner-occupied units account for 9,714 (82.5%), while renter-occupied units make up 2,065 (17.5%).
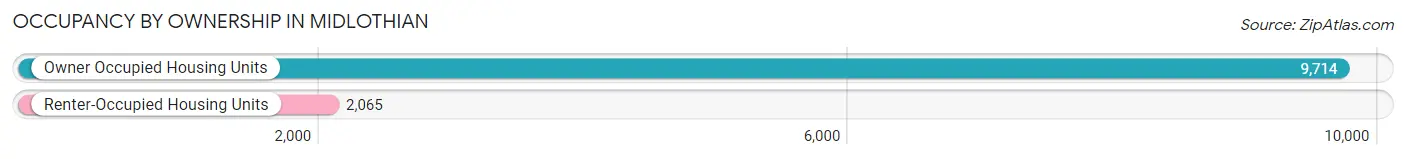
| Occupancy | # Housing Units | % Housing Units |
| Owner Occupied Housing Units | 9,714 | 82.5% |
| Renter-Occupied Housing Units | 2,065 | 17.5% |
| Total Occupied Housing Units | 11,779 | 100.0% |
Occupancy by Household Size in Midlothian
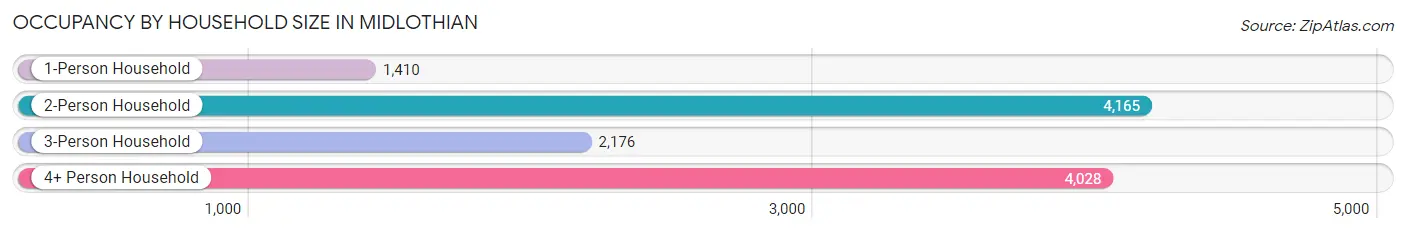
| Household Size | # Housing Units | % Housing Units |
| 1-Person Household | 1,410 | 12.0% |
| 2-Person Household | 4,165 | 35.4% |
| 3-Person Household | 2,176 | 18.5% |
| 4+ Person Household | 4,028 | 34.2% |
| Total Housing Units | 11,779 | 100.0% |
Occupancy by Ownership by Household Size in Midlothian
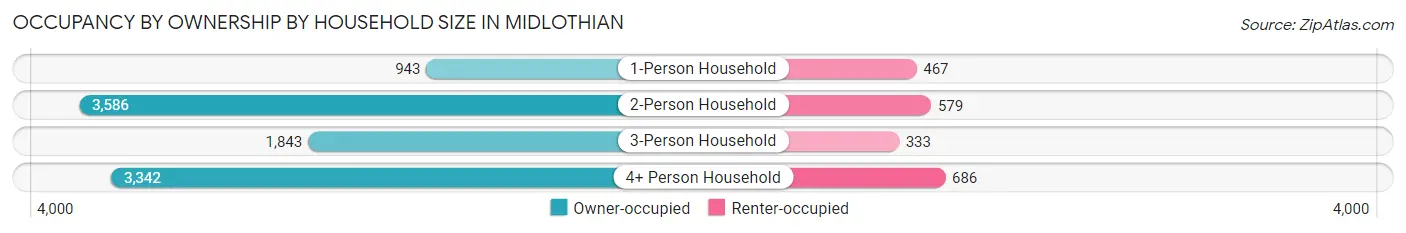
| Household Size | Owner-occupied | Renter-occupied |
| 1-Person Household | 943 (66.9%) | 467 (33.1%) |
| 2-Person Household | 3,586 (86.1%) | 579 (13.9%) |
| 3-Person Household | 1,843 (84.7%) | 333 (15.3%) |
| 4+ Person Household | 3,342 (83.0%) | 686 (17.0%) |
| Total Housing Units | 9,714 (82.5%) | 2,065 (17.5%) |
Occupancy by Educational Attainment in Midlothian
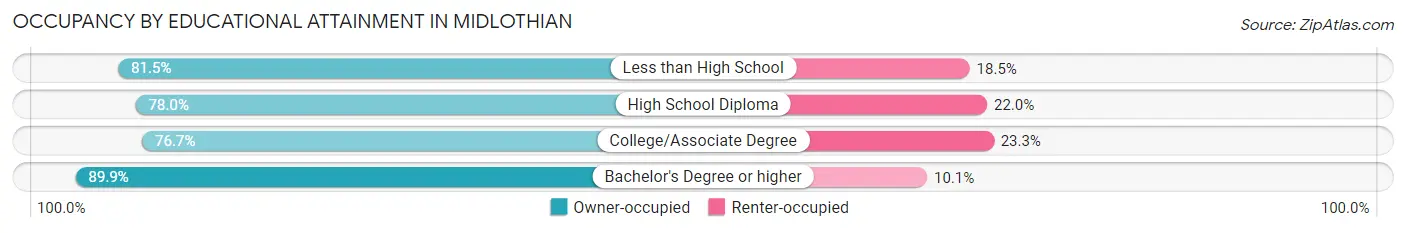
| Household Size | Owner-occupied | Renter-occupied |
| Less than High School | 378 (81.5%) | 86 (18.5%) |
| High School Diploma | 1,827 (78.0%) | 515 (22.0%) |
| College/Associate Degree | 3,246 (76.7%) | 986 (23.3%) |
| Bachelor's Degree or higher | 4,263 (89.9%) | 478 (10.1%) |
Occupancy by Age of Householder in Midlothian
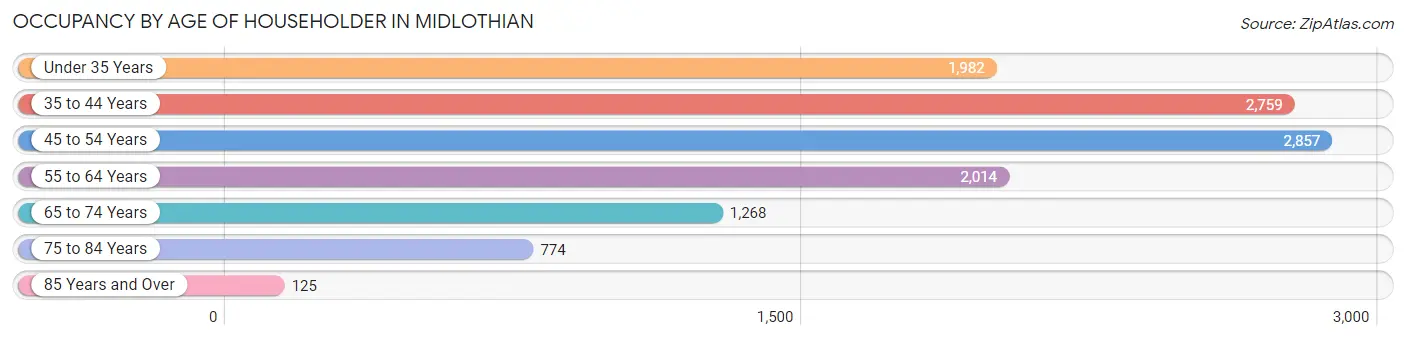
| Age Bracket | # Households | % Households |
| Under 35 Years | 1,982 | 16.8% |
| 35 to 44 Years | 2,759 | 23.4% |
| 45 to 54 Years | 2,857 | 24.3% |
| 55 to 64 Years | 2,014 | 17.1% |
| 65 to 74 Years | 1,268 | 10.8% |
| 75 to 84 Years | 774 | 6.6% |
| 85 Years and Over | 125 | 1.1% |
| Total | 11,779 | 100.0% |
Housing Finances in Midlothian
Median Income by Occupancy in Midlothian
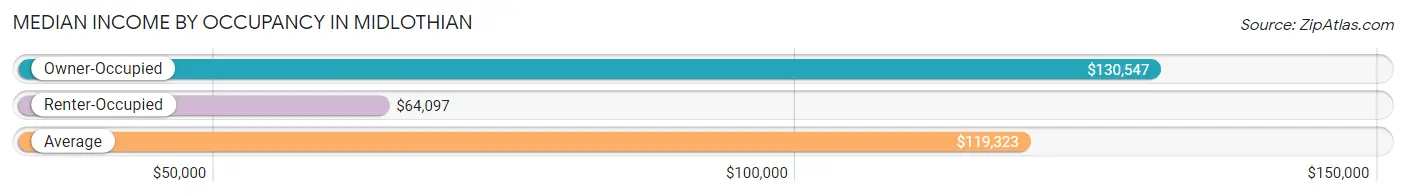
| Occupancy Type | # Households | Median Income |
| Owner-Occupied | 9,714 (82.5%) | $130,547 |
| Renter-Occupied | 2,065 (17.5%) | $64,097 |
| Average | 11,779 (100.0%) | $119,323 |
Occupancy by Householder Income Bracket in Midlothian
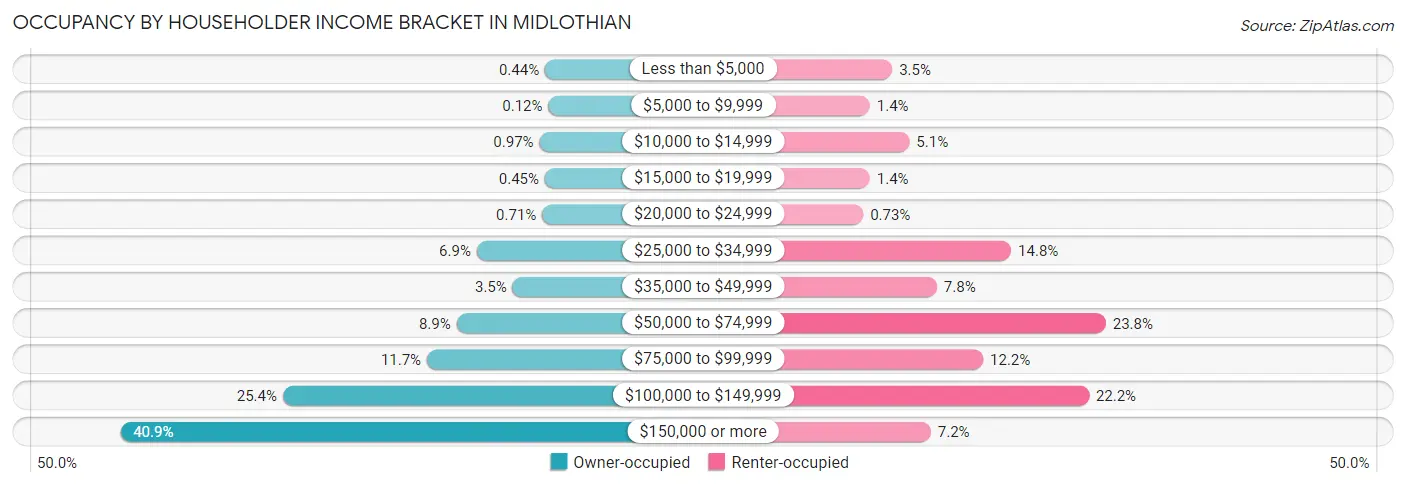
| Income Bracket | Owner-occupied | Renter-occupied |
| Less than $5,000 | 43 (0.4%) | 72 (3.5%) |
| $5,000 to $9,999 | 12 (0.1%) | 28 (1.4%) |
| $10,000 to $14,999 | 94 (1.0%) | 106 (5.1%) |
| $15,000 to $19,999 | 44 (0.4%) | 28 (1.4%) |
| $20,000 to $24,999 | 69 (0.7%) | 15 (0.7%) |
| $25,000 to $34,999 | 674 (6.9%) | 306 (14.8%) |
| $35,000 to $49,999 | 342 (3.5%) | 160 (7.7%) |
| $50,000 to $74,999 | 861 (8.9%) | 492 (23.8%) |
| $75,000 to $99,999 | 1,135 (11.7%) | 251 (12.1%) |
| $100,000 to $149,999 | 2,468 (25.4%) | 459 (22.2%) |
| $150,000 or more | 3,972 (40.9%) | 148 (7.2%) |
| Total | 9,714 (100.0%) | 2,065 (100.0%) |
Monthly Housing Cost Tiers in Midlothian
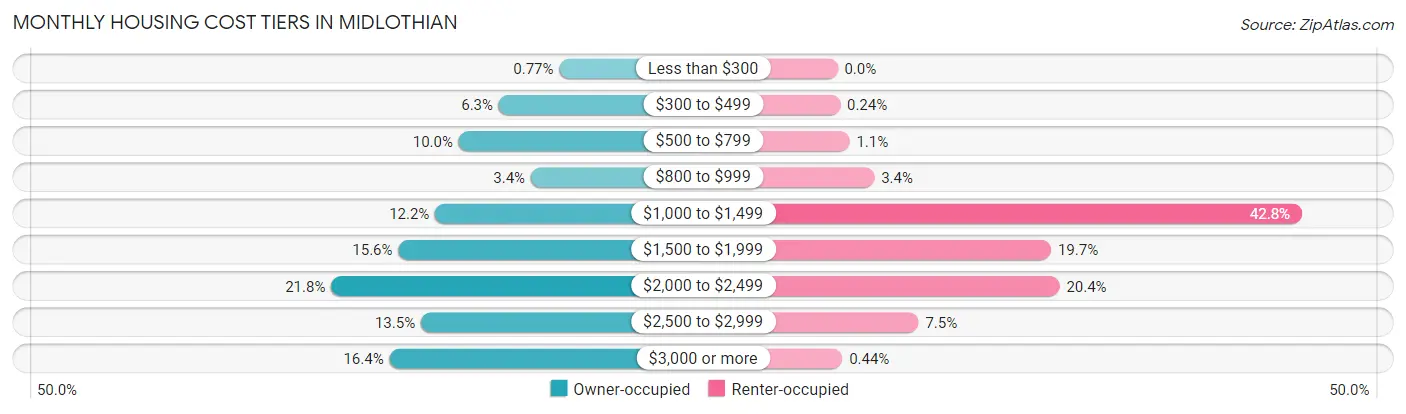
| Monthly Cost | Owner-occupied | Renter-occupied |
| Less than $300 | 75 (0.8%) | 0 (0.0%) |
| $300 to $499 | 616 (6.3%) | 5 (0.2%) |
| $500 to $799 | 974 (10.0%) | 23 (1.1%) |
| $800 to $999 | 329 (3.4%) | 70 (3.4%) |
| $1,000 to $1,499 | 1,185 (12.2%) | 883 (42.8%) |
| $1,500 to $1,999 | 1,514 (15.6%) | 406 (19.7%) |
| $2,000 to $2,499 | 2,115 (21.8%) | 422 (20.4%) |
| $2,500 to $2,999 | 1,312 (13.5%) | 154 (7.5%) |
| $3,000 or more | 1,594 (16.4%) | 9 (0.4%) |
| Total | 9,714 (100.0%) | 2,065 (100.0%) |
Physical Housing Characteristics in Midlothian
Housing Structures in Midlothian
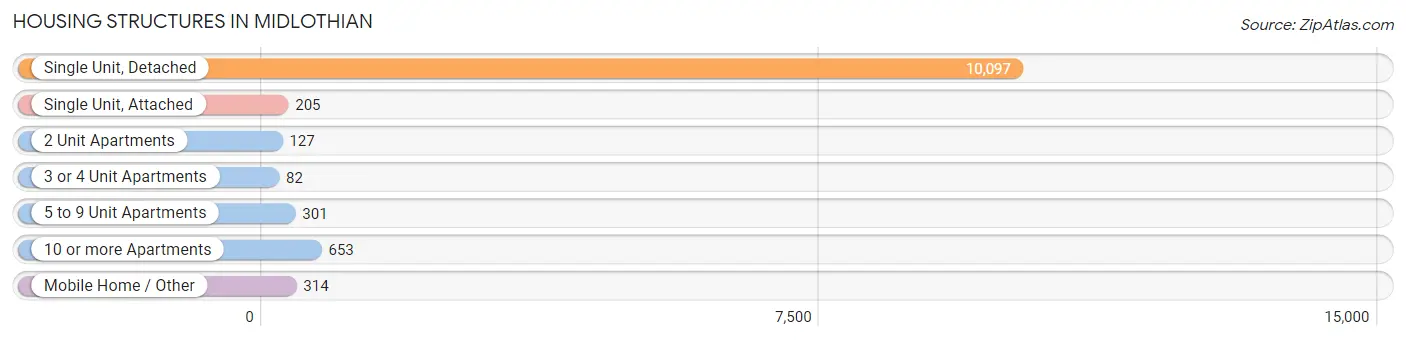
| Structure Type | # Housing Units | % Housing Units |
| Single Unit, Detached | 10,097 | 85.7% |
| Single Unit, Attached | 205 | 1.7% |
| 2 Unit Apartments | 127 | 1.1% |
| 3 or 4 Unit Apartments | 82 | 0.7% |
| 5 to 9 Unit Apartments | 301 | 2.6% |
| 10 or more Apartments | 653 | 5.5% |
| Mobile Home / Other | 314 | 2.7% |
| Total | 11,779 | 100.0% |
Housing Structures by Occupancy in Midlothian
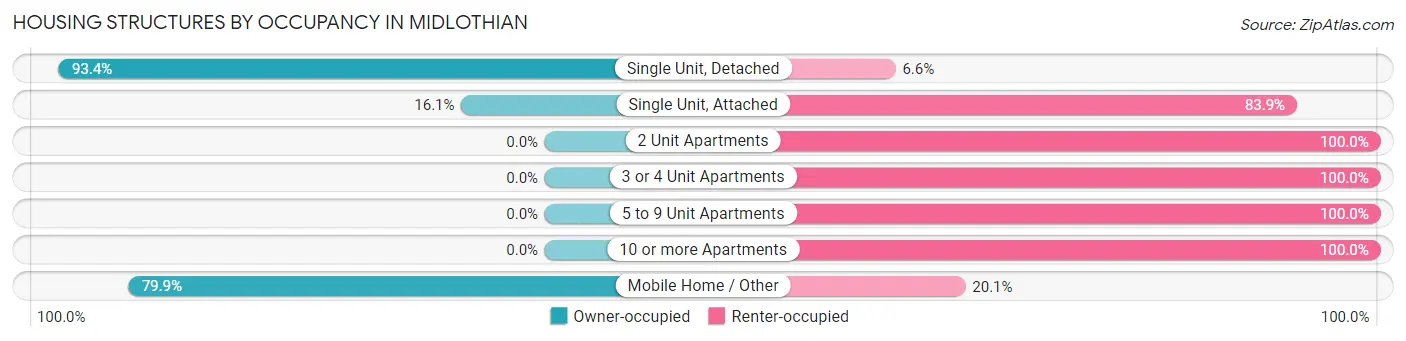
| Structure Type | Owner-occupied | Renter-occupied |
| Single Unit, Detached | 9,430 (93.4%) | 667 (6.6%) |
| Single Unit, Attached | 33 (16.1%) | 172 (83.9%) |
| 2 Unit Apartments | 0 (0.0%) | 127 (100.0%) |
| 3 or 4 Unit Apartments | 0 (0.0%) | 82 (100.0%) |
| 5 to 9 Unit Apartments | 0 (0.0%) | 301 (100.0%) |
| 10 or more Apartments | 0 (0.0%) | 653 (100.0%) |
| Mobile Home / Other | 251 (79.9%) | 63 (20.1%) |
| Total | 9,714 (82.5%) | 2,065 (17.5%) |
Housing Structures by Number of Rooms in Midlothian
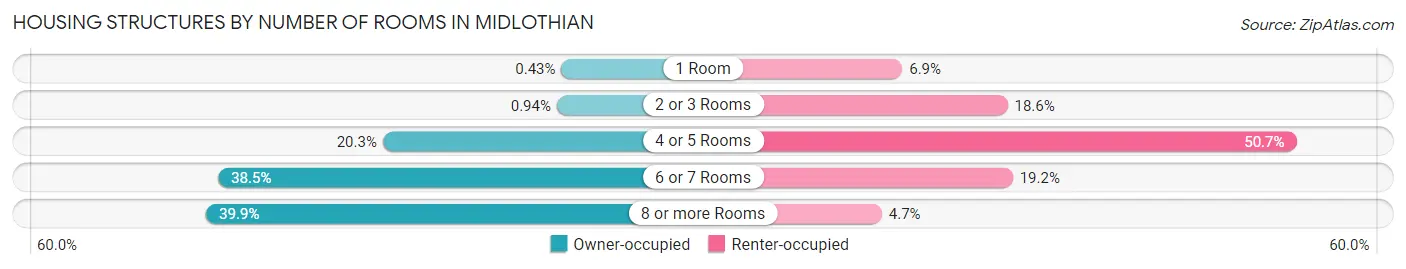
| Number of Rooms | Owner-occupied | Renter-occupied |
| 1 Room | 42 (0.4%) | 143 (6.9%) |
| 2 or 3 Rooms | 91 (0.9%) | 384 (18.6%) |
| 4 or 5 Rooms | 1,967 (20.3%) | 1,046 (50.6%) |
| 6 or 7 Rooms | 3,743 (38.5%) | 396 (19.2%) |
| 8 or more Rooms | 3,871 (39.9%) | 96 (4.6%) |
| Total | 9,714 (100.0%) | 2,065 (100.0%) |
Housing Structure by Heating Type in Midlothian
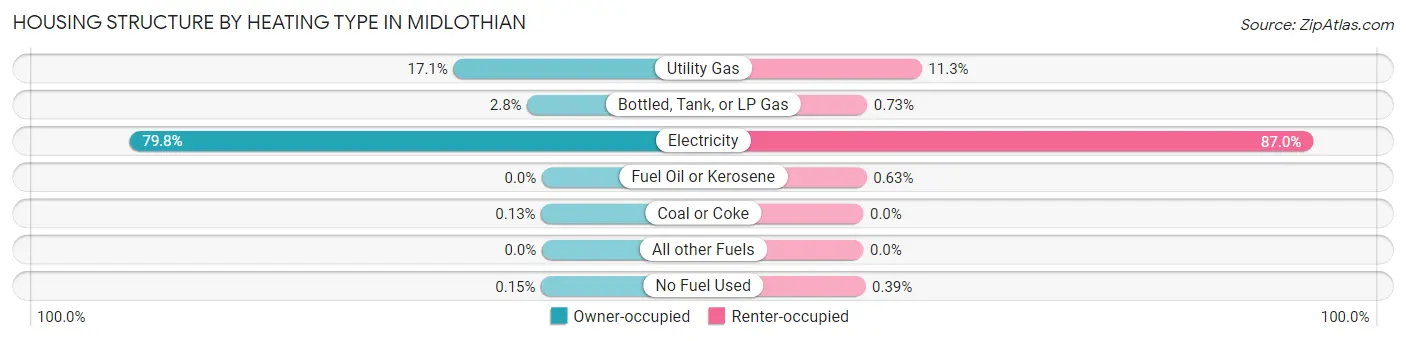
| Heating Type | Owner-occupied | Renter-occupied |
| Utility Gas | 1,661 (17.1%) | 233 (11.3%) |
| Bottled, Tank, or LP Gas | 276 (2.8%) | 15 (0.7%) |
| Electricity | 7,749 (79.8%) | 1,796 (87.0%) |
| Fuel Oil or Kerosene | 0 (0.0%) | 13 (0.6%) |
| Coal or Coke | 13 (0.1%) | 0 (0.0%) |
| All other Fuels | 0 (0.0%) | 0 (0.0%) |
| No Fuel Used | 15 (0.2%) | 8 (0.4%) |
| Total | 9,714 (100.0%) | 2,065 (100.0%) |
Household Vehicle Usage in Midlothian
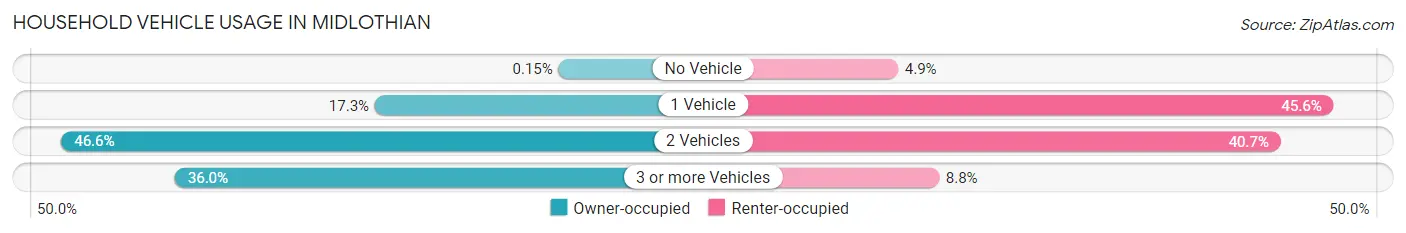
| Vehicles per Household | Owner-occupied | Renter-occupied |
| No Vehicle | 15 (0.2%) | 102 (4.9%) |
| 1 Vehicle | 1,681 (17.3%) | 942 (45.6%) |
| 2 Vehicles | 4,524 (46.6%) | 840 (40.7%) |
| 3 or more Vehicles | 3,494 (36.0%) | 181 (8.8%) |
| Total | 9,714 (100.0%) | 2,065 (100.0%) |
Real Estate & Mortgages in Midlothian
Real Estate and Mortgage Overview in Midlothian
| Characteristic | Without Mortgage | With Mortgage |
| Housing Units | 2,490 | 7,224 |
| Median Property Value | $246,500 | $353,100 |
| Median Household Income | $109,079 | $3,070 |
| Monthly Housing Costs | $715 | $1,594 |
| Real Estate Taxes | $3,540 | $40 |
Property Value by Mortgage Status in Midlothian
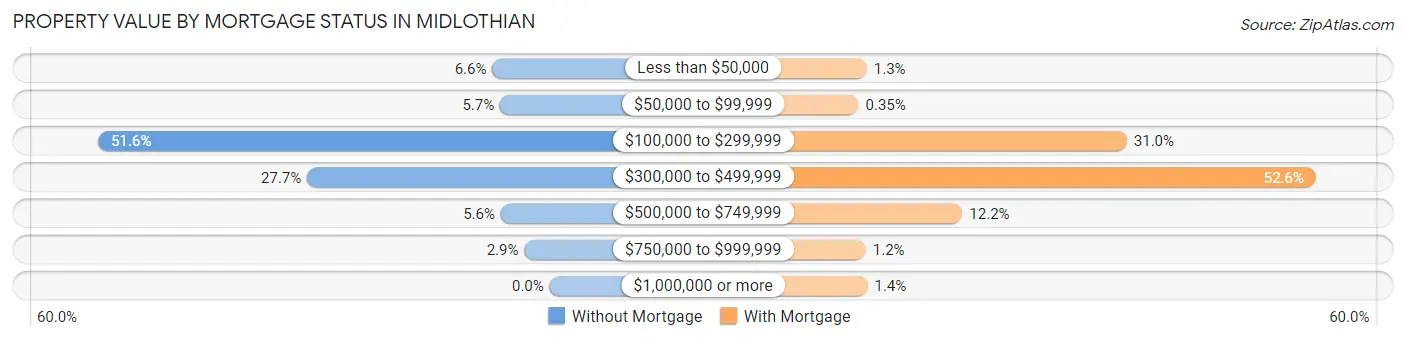
| Property Value | Without Mortgage | With Mortgage |
| Less than $50,000 | 163 (6.6%) | 93 (1.3%) |
| $50,000 to $99,999 | 141 (5.7%) | 25 (0.4%) |
| $100,000 to $299,999 | 1,285 (51.6%) | 2,240 (31.0%) |
| $300,000 to $499,999 | 690 (27.7%) | 3,800 (52.6%) |
| $500,000 to $749,999 | 139 (5.6%) | 882 (12.2%) |
| $750,000 to $999,999 | 72 (2.9%) | 85 (1.2%) |
| $1,000,000 or more | 0 (0.0%) | 99 (1.4%) |
| Total | 2,490 (100.0%) | 7,224 (100.0%) |
Household Income by Mortgage Status in Midlothian
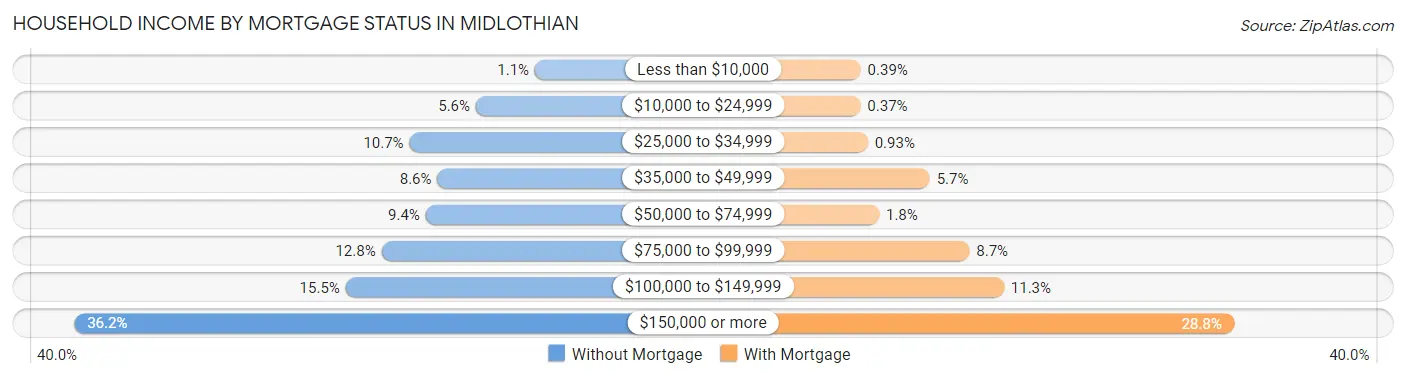
| Household Income | Without Mortgage | With Mortgage |
| Less than $10,000 | 28 (1.1%) | 28 (0.4%) |
| $10,000 to $24,999 | 140 (5.6%) | 27 (0.4%) |
| $25,000 to $34,999 | 266 (10.7%) | 67 (0.9%) |
| $35,000 to $49,999 | 213 (8.6%) | 408 (5.7%) |
| $50,000 to $74,999 | 235 (9.4%) | 129 (1.8%) |
| $75,000 to $99,999 | 319 (12.8%) | 626 (8.7%) |
| $100,000 to $149,999 | 387 (15.5%) | 816 (11.3%) |
| $150,000 or more | 902 (36.2%) | 2,081 (28.8%) |
| Total | 2,490 (100.0%) | 7,224 (100.0%) |
Property Value to Household Income Ratio in Midlothian
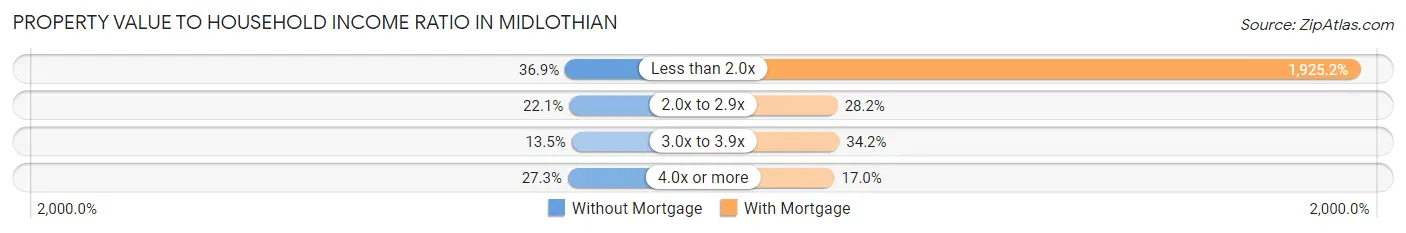
| Value-to-Income Ratio | Without Mortgage | With Mortgage |
| Less than 2.0x | 918 (36.9%) | 139,077 (1,925.2%) |
| 2.0x to 2.9x | 549 (22.1%) | 2,035 (28.2%) |
| 3.0x to 3.9x | 337 (13.5%) | 2,473 (34.2%) |
| 4.0x or more | 680 (27.3%) | 1,230 (17.0%) |
| Total | 2,490 (100.0%) | 7,224 (100.0%) |
Real Estate Taxes by Mortgage Status in Midlothian
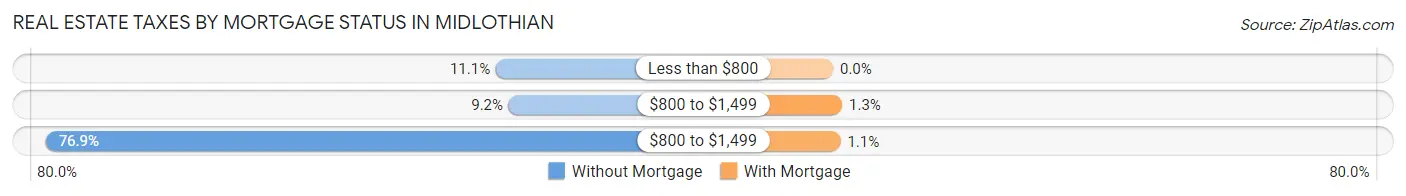
| Property Taxes | Without Mortgage | With Mortgage |
| Less than $800 | 277 (11.1%) | 0 (0.0%) |
| $800 to $1,499 | 230 (9.2%) | 95 (1.3%) |
| $800 to $1,499 | 1,915 (76.9%) | 79 (1.1%) |
| Total | 2,490 (100.0%) | 7,224 (100.0%) |
Health & Disability in Midlothian
Health Insurance Coverage by Age in Midlothian
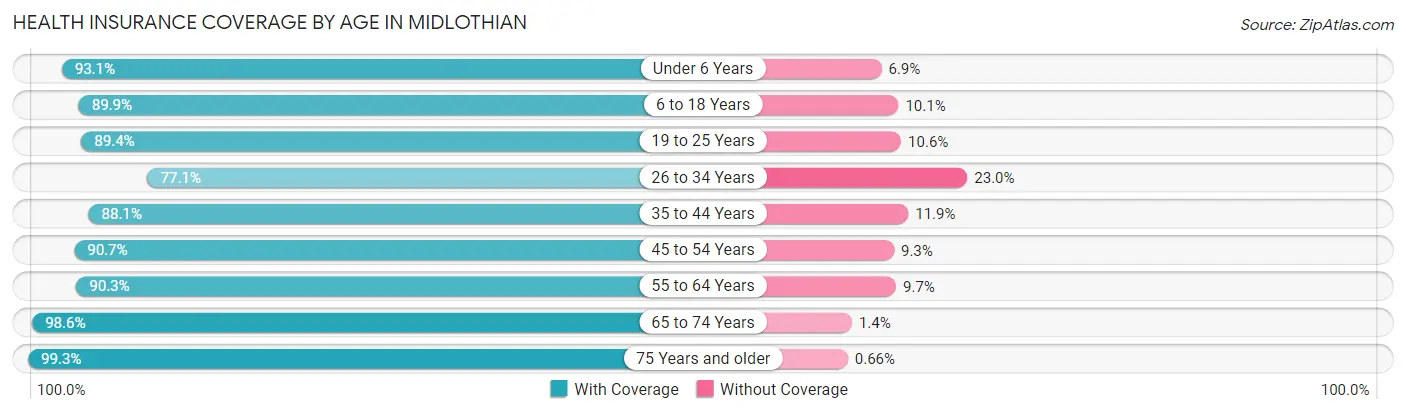
| Age Bracket | With Coverage | Without Coverage |
| Under 6 Years | 2,723 (93.1%) | 203 (6.9%) |
| 6 to 18 Years | 7,096 (89.9%) | 798 (10.1%) |
| 19 to 25 Years | 2,572 (89.4%) | 305 (10.6%) |
| 26 to 34 Years | 2,914 (77.0%) | 868 (23.0%) |
| 35 to 44 Years | 4,545 (88.1%) | 616 (11.9%) |
| 45 to 54 Years | 4,722 (90.7%) | 483 (9.3%) |
| 55 to 64 Years | 3,338 (90.3%) | 357 (9.7%) |
| 65 to 74 Years | 2,341 (98.6%) | 34 (1.4%) |
| 75 Years and older | 1,509 (99.3%) | 10 (0.7%) |
| Total | 31,760 (89.6%) | 3,674 (10.4%) |
Health Insurance Coverage by Citizenship Status in Midlothian
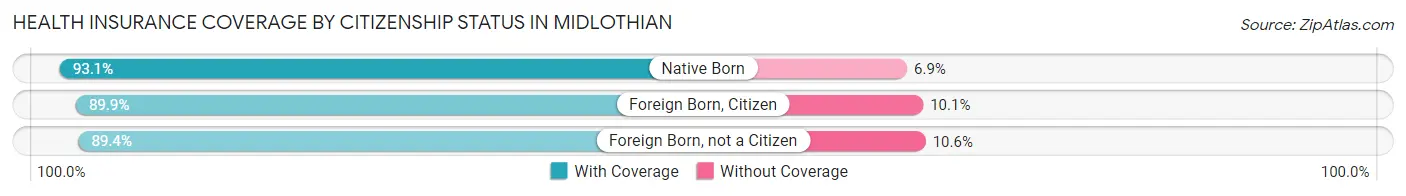
| Citizenship Status | With Coverage | Without Coverage |
| Native Born | 2,723 (93.1%) | 203 (6.9%) |
| Foreign Born, Citizen | 7,096 (89.9%) | 798 (10.1%) |
| Foreign Born, not a Citizen | 2,572 (89.4%) | 305 (10.6%) |
Health Insurance Coverage by Household Income in Midlothian
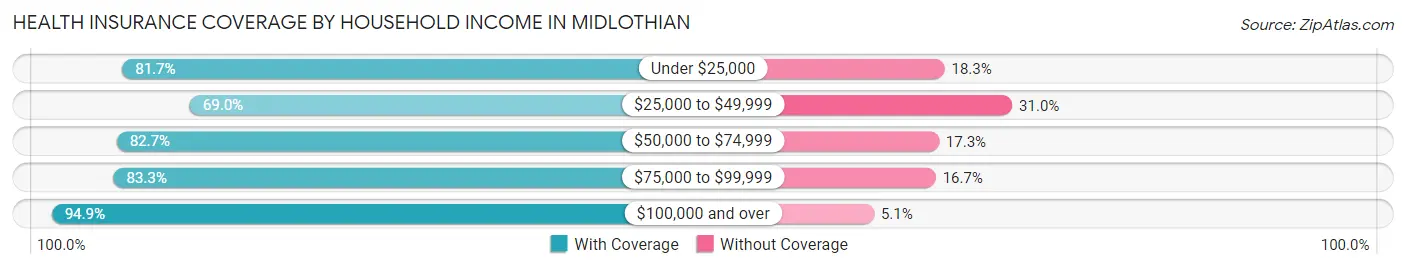
| Household Income | With Coverage | Without Coverage |
| Under $25,000 | 678 (81.7%) | 152 (18.3%) |
| $25,000 to $49,999 | 2,386 (69.0%) | 1,071 (31.0%) |
| $50,000 to $74,999 | 2,785 (82.7%) | 581 (17.3%) |
| $75,000 to $99,999 | 3,271 (83.3%) | 654 (16.7%) |
| $100,000 and over | 22,633 (94.9%) | 1,215 (5.1%) |
Public vs Private Health Insurance Coverage by Age in Midlothian
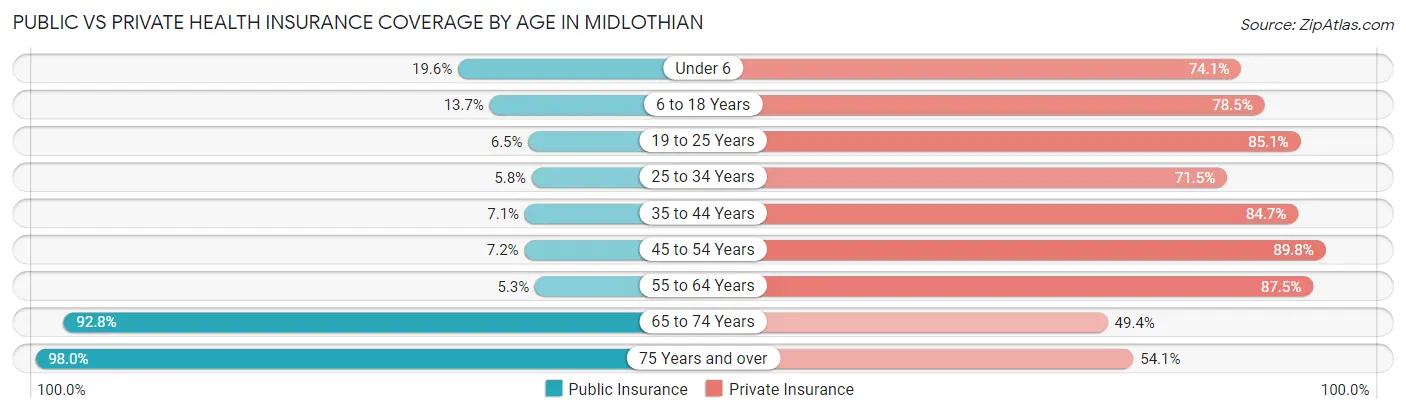
| Age Bracket | Public Insurance | Private Insurance |
| Under 6 | 572 (19.6%) | 2,168 (74.1%) |
| 6 to 18 Years | 1,079 (13.7%) | 6,193 (78.4%) |
| 19 to 25 Years | 187 (6.5%) | 2,449 (85.1%) |
| 25 to 34 Years | 221 (5.8%) | 2,704 (71.5%) |
| 35 to 44 Years | 368 (7.1%) | 4,371 (84.7%) |
| 45 to 54 Years | 376 (7.2%) | 4,673 (89.8%) |
| 55 to 64 Years | 194 (5.2%) | 3,232 (87.5%) |
| 65 to 74 Years | 2,204 (92.8%) | 1,172 (49.3%) |
| 75 Years and over | 1,489 (98.0%) | 822 (54.1%) |
| Total | 6,690 (18.9%) | 27,784 (78.4%) |
Disability Status by Sex by Age in Midlothian
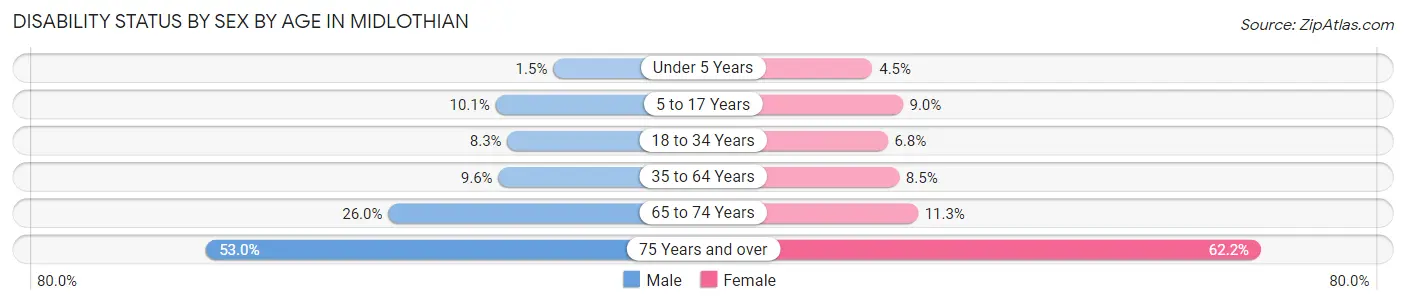
| Age Bracket | Male | Female |
| Under 5 Years | 18 (1.5%) | 57 (4.5%) |
| 5 to 17 Years | 408 (10.1%) | 348 (9.0%) |
| 18 to 34 Years | 286 (8.3%) | 249 (6.8%) |
| 35 to 64 Years | 679 (9.6%) | 595 (8.5%) |
| 65 to 74 Years | 260 (26.0%) | 155 (11.3%) |
| 75 Years and over | 272 (53.0%) | 626 (62.2%) |
Disability Class by Sex by Age in Midlothian
Disability Class: Hearing Difficulty
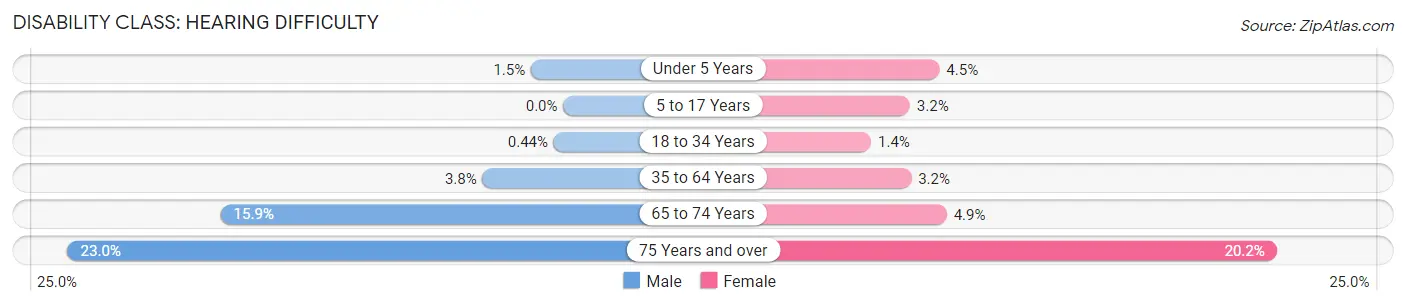
| Age Bracket | Male | Female |
| Under 5 Years | 18 (1.5%) | 57 (4.5%) |
| 5 to 17 Years | 0 (0.0%) | 122 (3.2%) |
| 18 to 34 Years | 15 (0.4%) | 50 (1.4%) |
| 35 to 64 Years | 264 (3.7%) | 226 (3.2%) |
| 65 to 74 Years | 159 (15.9%) | 67 (4.9%) |
| 75 Years and over | 118 (23.0%) | 203 (20.2%) |
Disability Class: Vision Difficulty
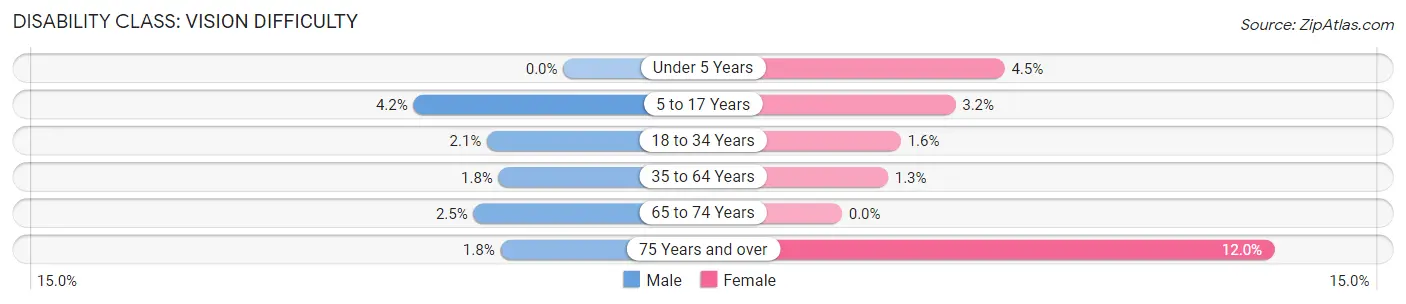
| Age Bracket | Male | Female |
| Under 5 Years | 0 (0.0%) | 57 (4.5%) |
| 5 to 17 Years | 169 (4.2%) | 122 (3.2%) |
| 18 to 34 Years | 73 (2.1%) | 60 (1.6%) |
| 35 to 64 Years | 127 (1.8%) | 90 (1.3%) |
| 65 to 74 Years | 25 (2.5%) | 0 (0.0%) |
| 75 Years and over | 9 (1.8%) | 121 (12.0%) |
Disability Class: Cognitive Difficulty
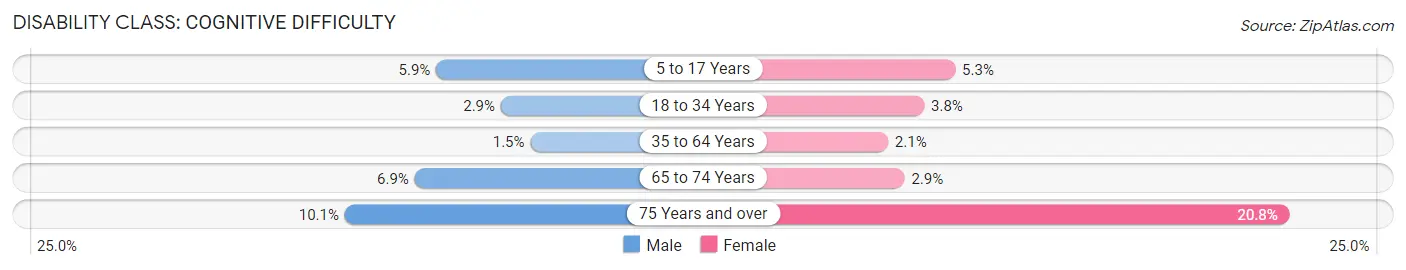
| Age Bracket | Male | Female |
| 5 to 17 Years | 239 (5.9%) | 203 (5.3%) |
| 18 to 34 Years | 100 (2.9%) | 140 (3.8%) |
| 35 to 64 Years | 108 (1.5%) | 150 (2.1%) |
| 65 to 74 Years | 69 (6.9%) | 40 (2.9%) |
| 75 Years and over | 52 (10.1%) | 209 (20.8%) |
Disability Class: Ambulatory Difficulty
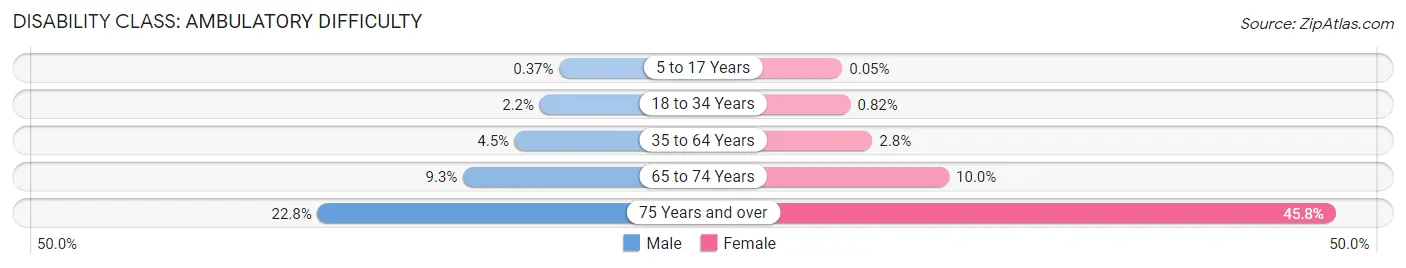
| Age Bracket | Male | Female |
| 5 to 17 Years | 15 (0.4%) | 2 (0.1%) |
| 18 to 34 Years | 75 (2.2%) | 30 (0.8%) |
| 35 to 64 Years | 316 (4.5%) | 199 (2.8%) |
| 65 to 74 Years | 93 (9.3%) | 137 (10.0%) |
| 75 Years and over | 117 (22.8%) | 461 (45.8%) |
Disability Class: Self-Care Difficulty
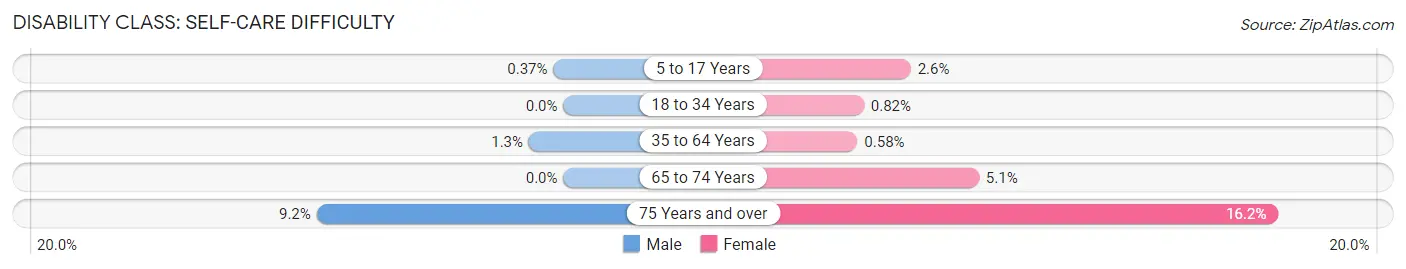
| Age Bracket | Male | Female |
| 5 to 17 Years | 15 (0.4%) | 99 (2.6%) |
| 18 to 34 Years | 0 (0.0%) | 30 (0.8%) |
| 35 to 64 Years | 90 (1.3%) | 41 (0.6%) |
| 65 to 74 Years | 0 (0.0%) | 70 (5.1%) |
| 75 Years and over | 47 (9.2%) | 163 (16.2%) |
Technology Access in Midlothian
Computing Device Access in Midlothian
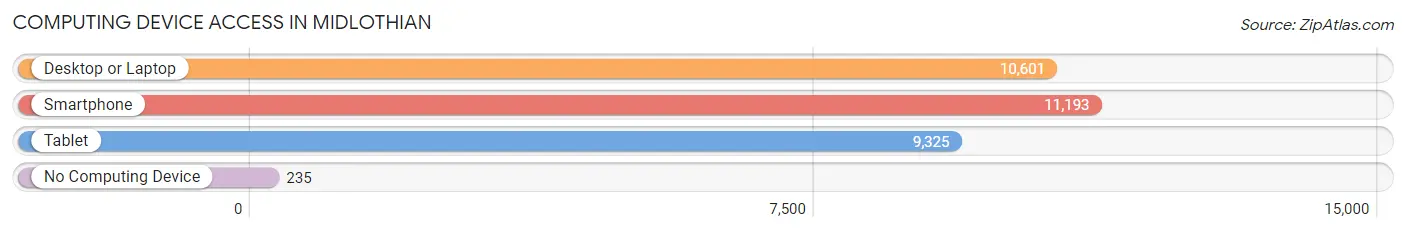
| Device Type | # Households | % Households |
| Desktop or Laptop | 10,601 | 90.0% |
| Smartphone | 11,193 | 95.0% |
| Tablet | 9,325 | 79.2% |
| No Computing Device | 235 | 2.0% |
| Total | 11,779 | 100.0% |
Internet Access in Midlothian
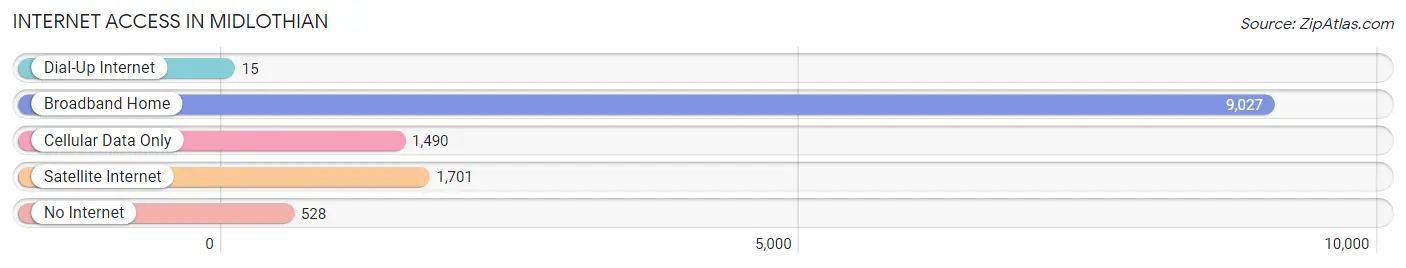
| Internet Type | # Households | % Households |
| Dial-Up Internet | 15 | 0.1% |
| Broadband Home | 9,027 | 76.6% |
| Cellular Data Only | 1,490 | 12.7% |
| Satellite Internet | 1,701 | 14.4% |
| No Internet | 528 | 4.5% |
| Total | 11,779 | 100.0% |
Midlothian Summary
Midlothian, Texas is a small city located in Ellis County, about 25 miles southwest of Dallas. It is part of the Dallas-Fort Worth-Arlington metropolitan area and has a population of about 25,000 people. The city is known for its rich history, diverse geography, strong economy, and diverse demographics.
History
Midlothian was founded in the late 1800s by a group of settlers from Scotland. The city was named after the town of Midlothian in Scotland, and the settlers brought with them many of the traditions and customs of their homeland. The city was officially incorporated in 1873, and the first post office was established in 1876.
The city grew slowly but steadily over the years, and by the early 1900s, it had become a thriving agricultural center. Cotton was the main crop, and the city was home to several cotton gins and other related businesses. The city also had a number of churches, schools, and other businesses.
In the 1950s, the city began to experience a period of rapid growth. This was due in part to the growth of the Dallas-Fort Worth area, as well as the development of the nearby Dallas-Fort Worth International Airport. The city continued to grow throughout the 1960s and 1970s, and by the 1980s, it had become a major suburb of Dallas.
Geography
Midlothian is located in the eastern part of Ellis County, about 25 miles southwest of Dallas. The city is situated on the edge of the Blackland Prairie, a region of rolling hills and grasslands. The city is bordered to the north by the city of Waxahachie, to the east by the city of Red Oak, to the south by the city of Ovilla, and to the west by the city of Cedar Hill.
The city has a total area of about 16 square miles, and the elevation is about 500 feet above sea level. The climate is generally mild, with hot summers and cool winters. The average annual temperature is about 65 degrees Fahrenheit.
Economy
Midlothian has a strong and diverse economy. The city is home to a number of major employers, including the Midlothian Independent School District, the Midlothian Community Hospital, and the Midlothian Country Club. The city is also home to several manufacturing companies, including the Midlothian Steel Company and the Midlothian Manufacturing Company.
The city is also home to a number of retail stores, restaurants, and other businesses. The city is served by the Dallas-Fort Worth International Airport, which is located about 25 miles away.
Demographics
As of the 2010 census, the population of Midlothian was 25,073. The racial makeup of the city was 79.3% White, 11.2% African American, 0.5% Native American, 1.7% Asian, 0.1% Pacific Islander, 5.2% from other races, and 2.1% from two or more races. Hispanic or Latino of any race were 13.2% of the population.
The median household income in Midlothian was $63,945, and the median family income was $71,945. The per capita income was $27,945. About 8.3% of the population was below the poverty line.
Midlothian is a diverse city with a rich history, diverse geography, strong economy, and diverse demographics. The city is home to a number of major employers, and it is served by the Dallas-Fort Worth International Airport. The city has a strong and diverse economy, and it is a great place to live and work.
Common Questions
What is Per Capita Income in Midlothian?
Per Capita income in Midlothian is $46,311.
What is the Median Family Income in Midlothian?
Median Family Income in Midlothian is $126,756.
What is the Median Household income in Midlothian?
Median Household Income in Midlothian is $119,323.
What is Income or Wage Gap in Midlothian?
Income or Wage Gap in Midlothian is 39.4%.
Women in Midlothian earn 60.6 cents for every dollar earned by a man.
What is Inequality or Gini Index in Midlothian?
Inequality or Gini Index in Midlothian is 0.39.
What is the Total Population of Midlothian?
Total Population of Midlothian is 35,460.
What is the Total Male Population of Midlothian?
Total Male Population of Midlothian is 17,257.
What is the Total Female Population of Midlothian?
Total Female Population of Midlothian is 18,203.
What is the Ratio of Males per 100 Females in Midlothian?
There are 94.80 Males per 100 Females in Midlothian.
What is the Ratio of Females per 100 Males in Midlothian?
There are 105.48 Females per 100 Males in Midlothian.
What is the Median Population Age in Midlothian?
Median Population Age in Midlothian is 35.5 Years.
What is the Average Family Size in Midlothian
Average Family Size in Midlothian is 3.2 People.
What is the Average Household Size in Midlothian
Average Household Size in Midlothian is 3.0 People.
How Large is the Labor Force in Midlothian?
There are 19,179 People in the Labor Forcein in Midlothian.
What is the Percentage of People in the Labor Force in Midlothian?
73.0% of People are in the Labor Force in Midlothian.
What is the Unemployment Rate in Midlothian?
Unemployment Rate in Midlothian is 2.9%.