Mesquite, TX Map & Demographics
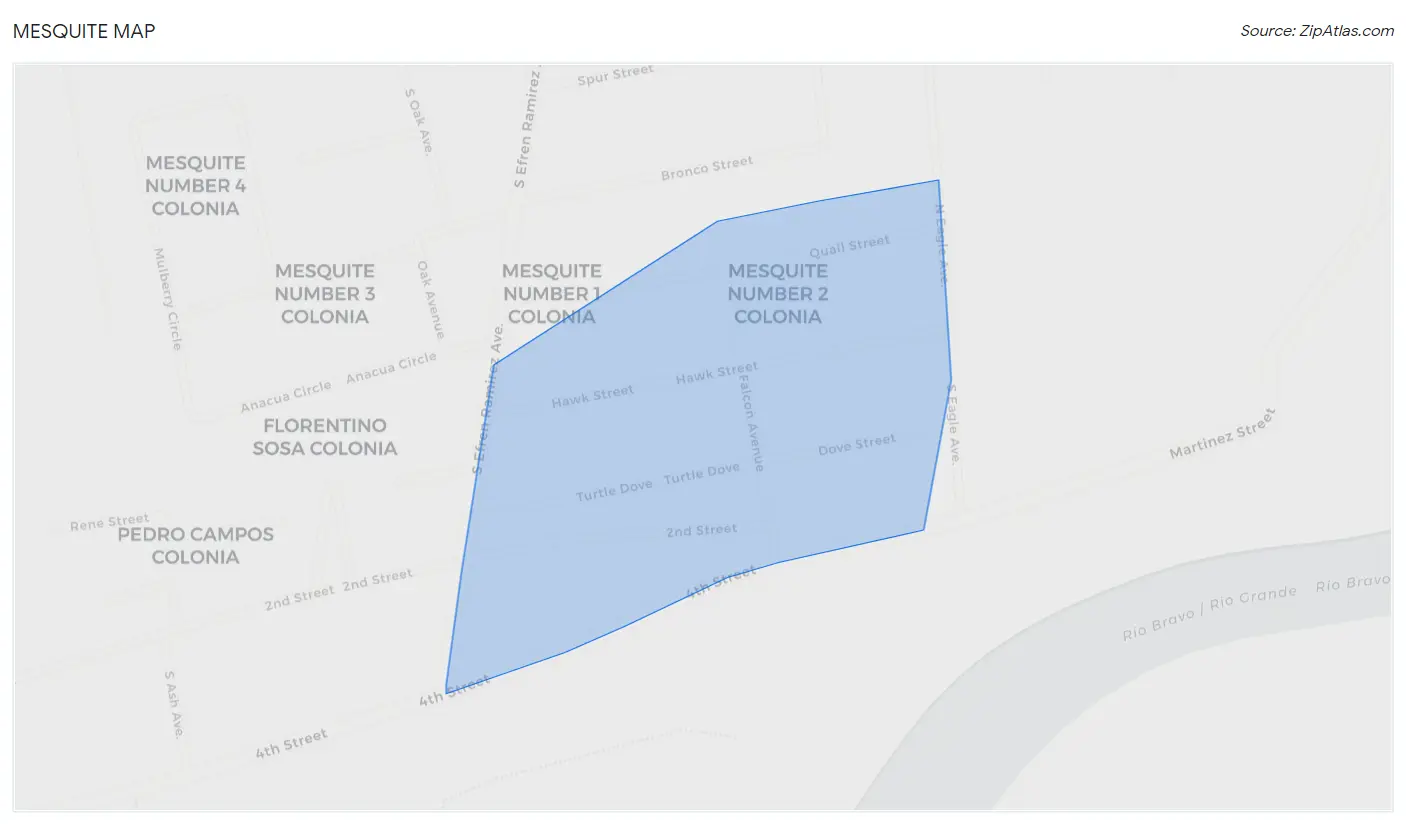
Mesquite Map
Mesquite Overview
$14,949
PER CAPITA INCOME
27.2%
WAGE / INCOME GAP [ % ]
72.8¢/ $1
WAGE / INCOME GAP [ $ ]
0.31
INEQUALITY / GINI INDEX
145
TOTAL POPULATION
77
MALE POPULATION
68
FEMALE POPULATION
113.24
MALES / 100 FEMALES
88.31
FEMALES / 100 MALES
25.5
MEDIAN AGE
3.5
AVG FAMILY SIZE
3.7
AVG HOUSEHOLD SIZE
79
LABOR FORCE [ PEOPLE ]
79.8%
PERCENT IN LABOR FORCE
22.8%
UNEMPLOYMENT RATE
Income in Mesquite
Income Overview in Mesquite
| Characteristic | Number | Measure |
| Per Capita Income | 145 | $14,949 |
| Median Family Income | 39 | $0 |
| Mean Family Income | 39 | $56,059 |
| Median Household Income | 39 | $0 |
| Mean Household Income | 39 | $57,438 |
| Income Deficit | 39 | $0 |
| Wage / Income Gap (%) | 145 | 27.16% |
| Wage / Income Gap ($) | 145 | 72.84¢ per $1 |
| Gini / Inequality Index | 145 | 0.31 |
Earnings by Sex in Mesquite
Average Earnings in Mesquite are $36,603, $41,880 for men and $30,505 for women, a difference of 27.2%.
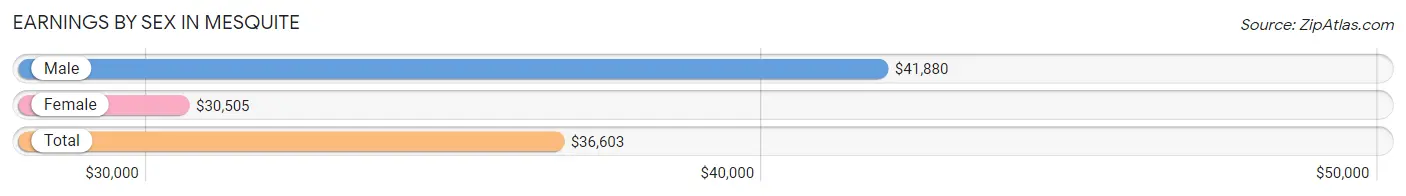
| Sex | Number | Average Earnings |
| Male | 46 (58.2%) | $41,880 |
| Female | 33 (41.8%) | $30,505 |
| Total | 79 (100.0%) | $36,603 |
Earnings by Sex by Income Bracket in Mesquite
The most common earnings brackets in Mesquite are $12,500 to $14,999 for men (18 | 39.1%) and $22,500 to $24,999 for women (18 | 54.5%).
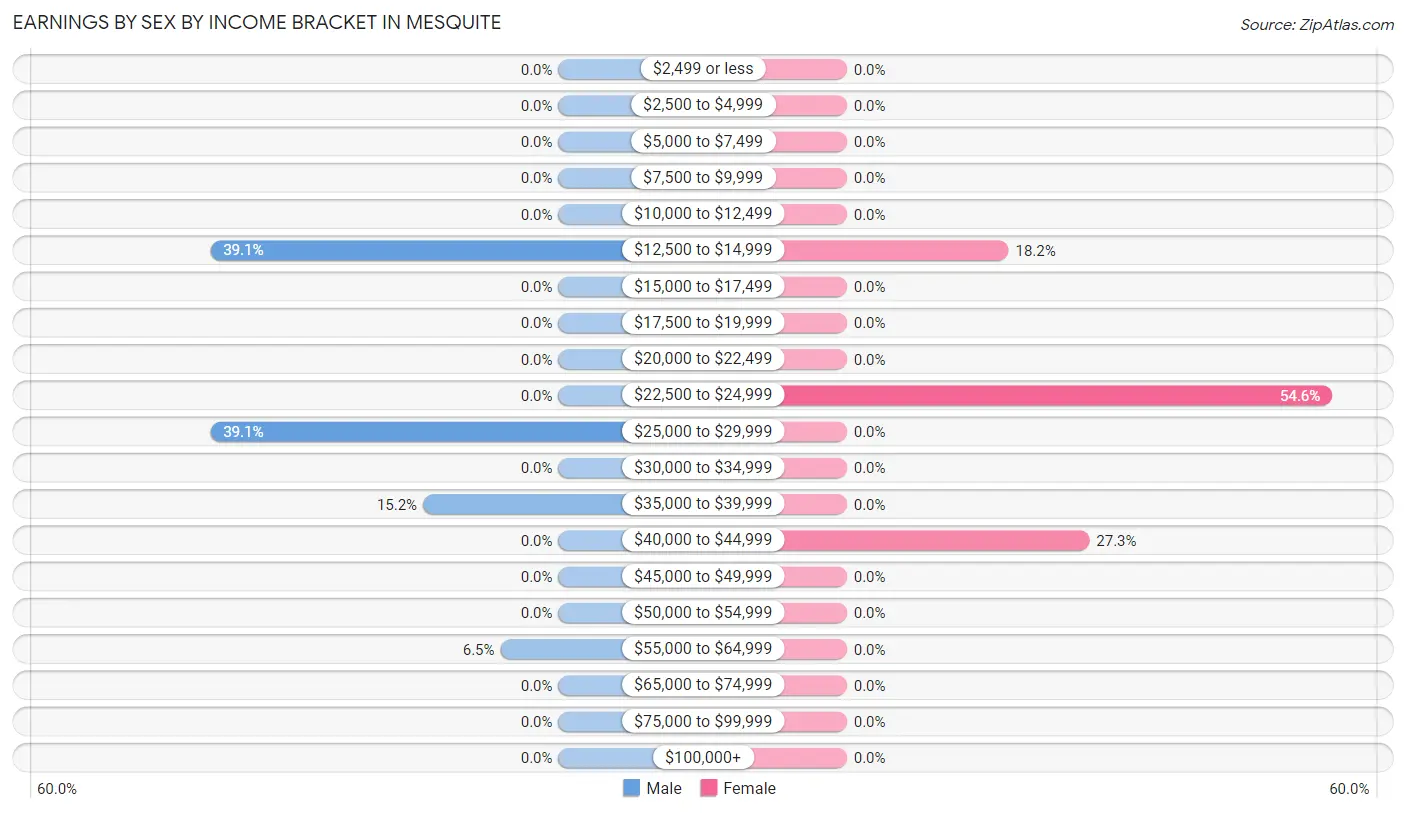
| Income | Male | Female |
| $2,499 or less | 0 (0.0%) | 0 (0.0%) |
| $2,500 to $4,999 | 0 (0.0%) | 0 (0.0%) |
| $5,000 to $7,499 | 0 (0.0%) | 0 (0.0%) |
| $7,500 to $9,999 | 0 (0.0%) | 0 (0.0%) |
| $10,000 to $12,499 | 0 (0.0%) | 0 (0.0%) |
| $12,500 to $14,999 | 18 (39.1%) | 6 (18.2%) |
| $15,000 to $17,499 | 0 (0.0%) | 0 (0.0%) |
| $17,500 to $19,999 | 0 (0.0%) | 0 (0.0%) |
| $20,000 to $22,499 | 0 (0.0%) | 0 (0.0%) |
| $22,500 to $24,999 | 0 (0.0%) | 18 (54.5%) |
| $25,000 to $29,999 | 18 (39.1%) | 0 (0.0%) |
| $30,000 to $34,999 | 0 (0.0%) | 0 (0.0%) |
| $35,000 to $39,999 | 7 (15.2%) | 0 (0.0%) |
| $40,000 to $44,999 | 0 (0.0%) | 9 (27.3%) |
| $45,000 to $49,999 | 0 (0.0%) | 0 (0.0%) |
| $50,000 to $54,999 | 0 (0.0%) | 0 (0.0%) |
| $55,000 to $64,999 | 3 (6.5%) | 0 (0.0%) |
| $65,000 to $74,999 | 0 (0.0%) | 0 (0.0%) |
| $75,000 to $99,999 | 0 (0.0%) | 0 (0.0%) |
| $100,000+ | 0 (0.0%) | 0 (0.0%) |
| Total | 46 (100.0%) | 33 (100.0%) |
Earnings by Sex by Educational Attainment in Mesquite
| Educational Attainment | Male Income | Female Income |
| Less than High School | - | - |
| High School Diploma | - | - |
| College or Associate's Degree | - | - |
| Bachelor's Degree | - | - |
| Graduate Degree | - | - |
| Total | - | - |
Family Income in Mesquite
Family Income Brackets in Mesquite
According to the Mesquite family income data, there are 25 families falling into the $35,000 to $49,999 income range, which is the most common income bracket and makes up 64.1% of all families.
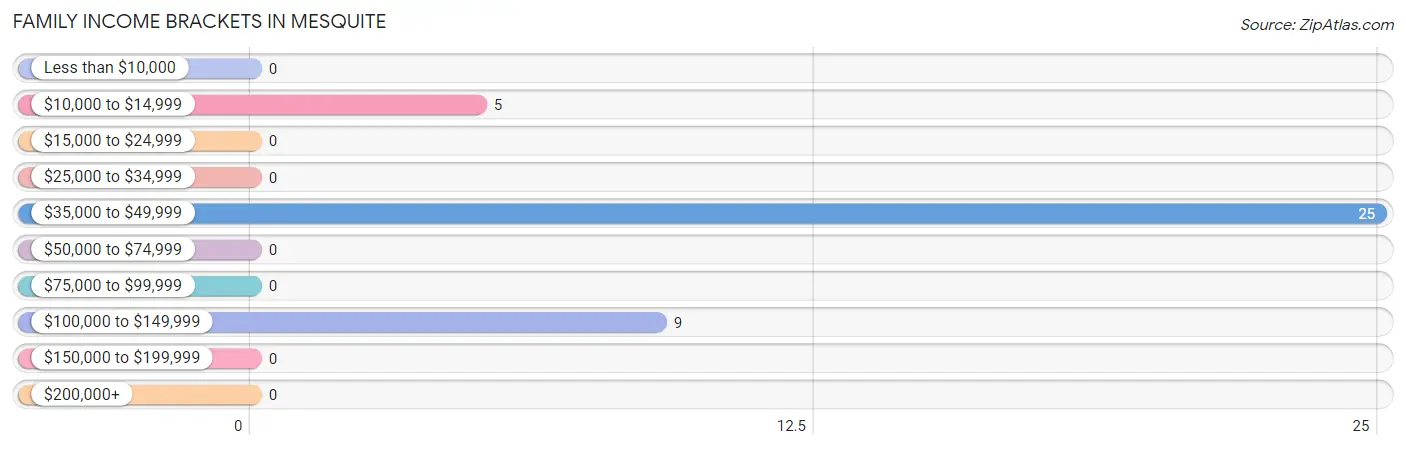
| Income Bracket | # Families | % Families |
| Less than $10,000 | 0 | 0.0% |
| $10,000 to $14,999 | 5 | 12.8% |
| $15,000 to $24,999 | 0 | 0.0% |
| $25,000 to $34,999 | 0 | 0.0% |
| $35,000 to $49,999 | 25 | 64.1% |
| $50,000 to $74,999 | 0 | 0.0% |
| $75,000 to $99,999 | 0 | 0.0% |
| $100,000 to $149,999 | 9 | 23.1% |
| $150,000 to $199,999 | 0 | 0.0% |
| $200,000+ | 0 | 0.0% |
Family Income by Famaliy Size in Mesquite
| Income Bracket | # Families | Median Income |
| 2-Person Families | 12 (30.8%) | $0 |
| 3-Person Families | 9 (23.1%) | $0 |
| 4-Person Families | 18 (46.2%) | $0 |
| 5-Person Families | 0 (0.0%) | $0 |
| 6-Person Families | 0 (0.0%) | $0 |
| 7+ Person Families | 0 (0.0%) | $0 |
| Total | 39 (100.0%) | $0 |
Family Income by Number of Earners in Mesquite
| Number of Earners | # Families | Median Income |
| No Earners | 0 (0.0%) | $0 |
| 1 Earner | 12 (30.8%) | $0 |
| 2 Earners | 18 (46.2%) | $0 |
| 3+ Earners | 9 (23.1%) | $0 |
| Total | 39 (100.0%) | $0 |
Household Income in Mesquite
Household Income Brackets in Mesquite
With 25 households falling in the category, the $35,000 to $49,999 income range is the most frequent in Mesquite, accounting for 64.1% of all households.
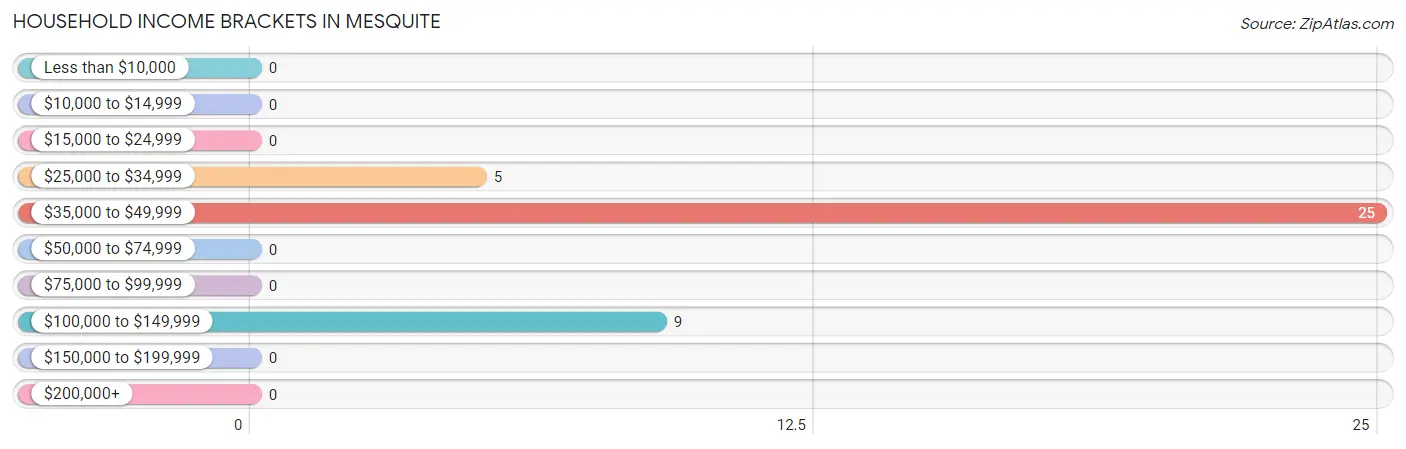
| Income Bracket | # Households | % Households |
| Less than $10,000 | 0 | 0.0% |
| $10,000 to $14,999 | 0 | 0.0% |
| $15,000 to $24,999 | 0 | 0.0% |
| $25,000 to $34,999 | 5 | 12.8% |
| $35,000 to $49,999 | 25 | 64.1% |
| $50,000 to $74,999 | 0 | 0.0% |
| $75,000 to $99,999 | 0 | 0.0% |
| $100,000 to $149,999 | 9 | 23.1% |
| $150,000 to $199,999 | 0 | 0.0% |
| $200,000+ | 0 | 0.0% |
Household Income by Householder Age in Mesquite
| Income Bracket | # Households | Median Income |
| 15 to 24 Years | 0 (0.0%) | $0 |
| 25 to 44 Years | 18 (46.2%) | $0 |
| 45 to 64 Years | 21 (53.8%) | $0 |
| 65+ Years | 0 (0.0%) | $0 |
| Total | 39 (100.0%) | $0 |
Poverty in Mesquite
Income Below Poverty by Sex and Age in Mesquite
With 9.1% poverty level for males and 16.2% for females among the residents of Mesquite, 55 to 64 year old males and 55 to 64 year old females are the most vulnerable to poverty, with 7 males (41.2%) and 5 females (38.5%) in their respective age groups living below the poverty level.
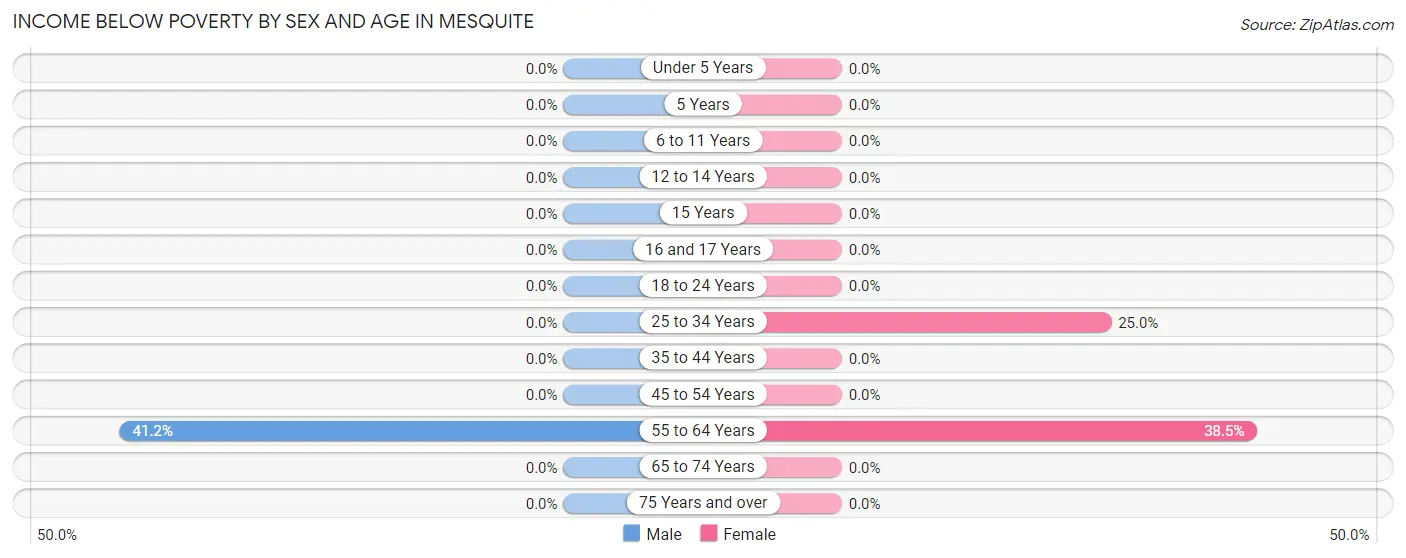
| Age Bracket | Male | Female |
| Under 5 Years | 0 (0.0%) | 0 (0.0%) |
| 5 Years | 0 (0.0%) | 0 (0.0%) |
| 6 to 11 Years | 0 (0.0%) | 0 (0.0%) |
| 12 to 14 Years | 0 (0.0%) | 0 (0.0%) |
| 15 Years | 0 (0.0%) | 0 (0.0%) |
| 16 and 17 Years | 0 (0.0%) | 0 (0.0%) |
| 18 to 24 Years | 0 (0.0%) | 0 (0.0%) |
| 25 to 34 Years | 0 (0.0%) | 6 (25.0%) |
| 35 to 44 Years | 0 (0.0%) | 0 (0.0%) |
| 45 to 54 Years | 0 (0.0%) | 0 (0.0%) |
| 55 to 64 Years | 7 (41.2%) | 5 (38.5%) |
| 65 to 74 Years | 0 (0.0%) | 0 (0.0%) |
| 75 Years and over | 0 (0.0%) | 0 (0.0%) |
| Total | 7 (9.1%) | 11 (16.2%) |
Income Above Poverty by Sex and Age in Mesquite
According to the poverty statistics in Mesquite, males aged 6 to 11 years and females aged 5 years are the age groups that are most secure financially, with 100.0% of males and 100.0% of females in these age groups living above the poverty line.
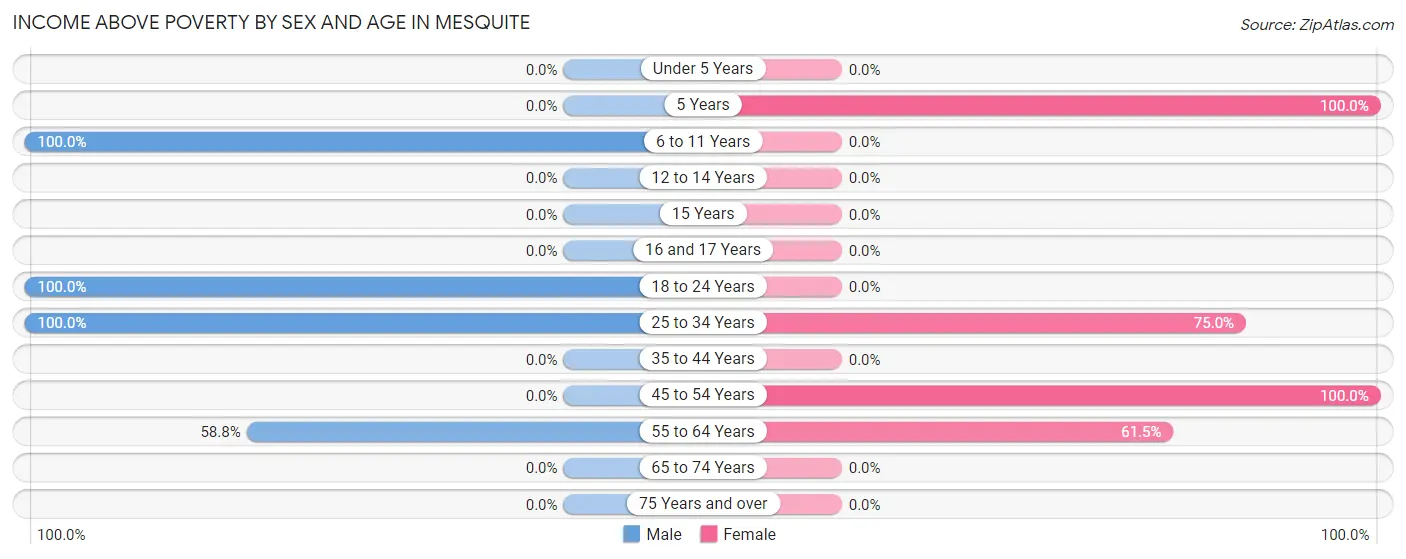
| Age Bracket | Male | Female |
| Under 5 Years | 0 (0.0%) | 0 (0.0%) |
| 5 Years | 0 (0.0%) | 22 (100.0%) |
| 6 to 11 Years | 24 (100.0%) | 0 (0.0%) |
| 12 to 14 Years | 0 (0.0%) | 0 (0.0%) |
| 15 Years | 0 (0.0%) | 0 (0.0%) |
| 16 and 17 Years | 0 (0.0%) | 0 (0.0%) |
| 18 to 24 Years | 18 (100.0%) | 0 (0.0%) |
| 25 to 34 Years | 18 (100.0%) | 18 (75.0%) |
| 35 to 44 Years | 0 (0.0%) | 0 (0.0%) |
| 45 to 54 Years | 0 (0.0%) | 9 (100.0%) |
| 55 to 64 Years | 10 (58.8%) | 8 (61.5%) |
| 65 to 74 Years | 0 (0.0%) | 0 (0.0%) |
| 75 Years and over | 0 (0.0%) | 0 (0.0%) |
| Total | 70 (90.9%) | 57 (83.8%) |
Income Below Poverty Among Married-Couple Families in Mesquite
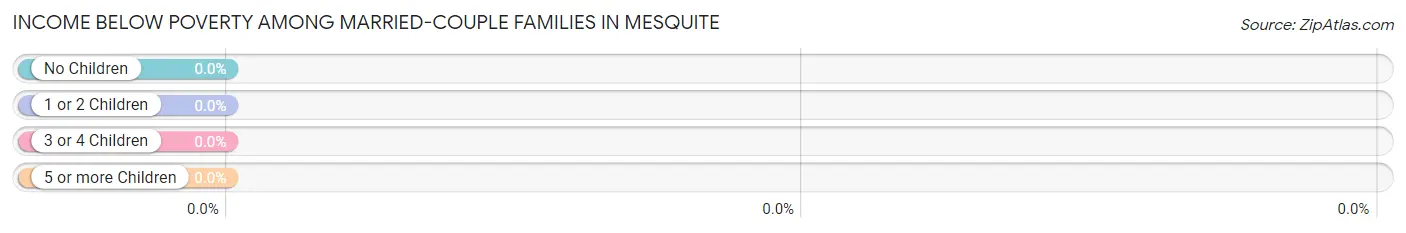
| Children | Above Poverty | Below Poverty |
| No Children | 16 (100.0%) | 0 (0.0%) |
| 1 or 2 Children | 18 (100.0%) | 0 (0.0%) |
| 3 or 4 Children | 0 (0.0%) | 0 (0.0%) |
| 5 or more Children | 0 (0.0%) | 0 (0.0%) |
| Total | 34 (100.0%) | 0 (0.0%) |
Income Below Poverty Among Single-Parent Households in Mesquite
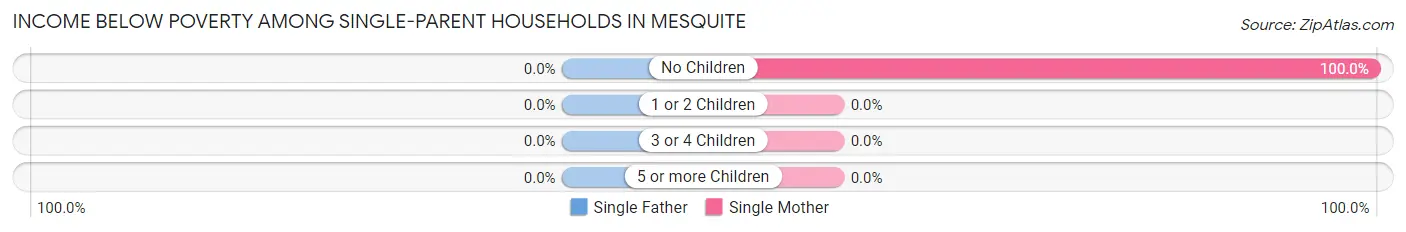
| Children | Single Father | Single Mother |
| No Children | 0 (0.0%) | 5 (100.0%) |
| 1 or 2 Children | 0 (0.0%) | 0 (0.0%) |
| 3 or 4 Children | 0 (0.0%) | 0 (0.0%) |
| 5 or more Children | 0 (0.0%) | 0 (0.0%) |
| Total | 0 (0.0%) | 5 (100.0%) |
Income Below Poverty Among Married-Couple vs Single-Parent Households in Mesquite
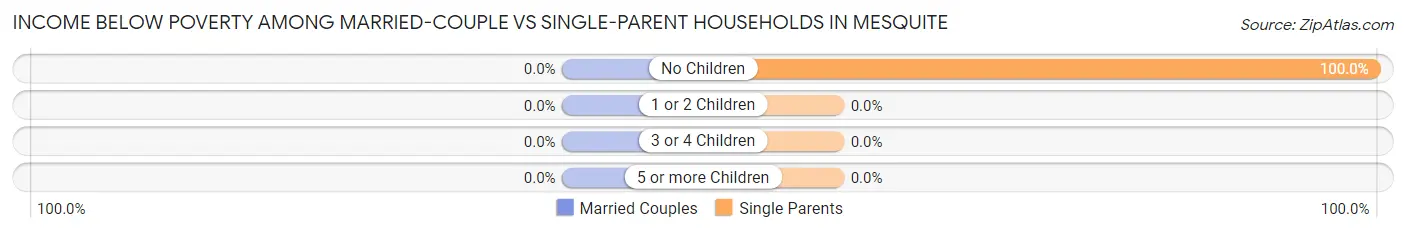
| Children | Married-Couple Families | Single-Parent Households |
| No Children | 0 (0.0%) | 5 (100.0%) |
| 1 or 2 Children | 0 (0.0%) | 0 (0.0%) |
| 3 or 4 Children | 0 (0.0%) | 0 (0.0%) |
| 5 or more Children | 0 (0.0%) | 0 (0.0%) |
| Total | 0 (0.0%) | 5 (100.0%) |
Race in Mesquite
The most populous races in Mesquite are Hispanic or Latino (145 | 100.0%), and White / Caucasian (145 | 100.0%).
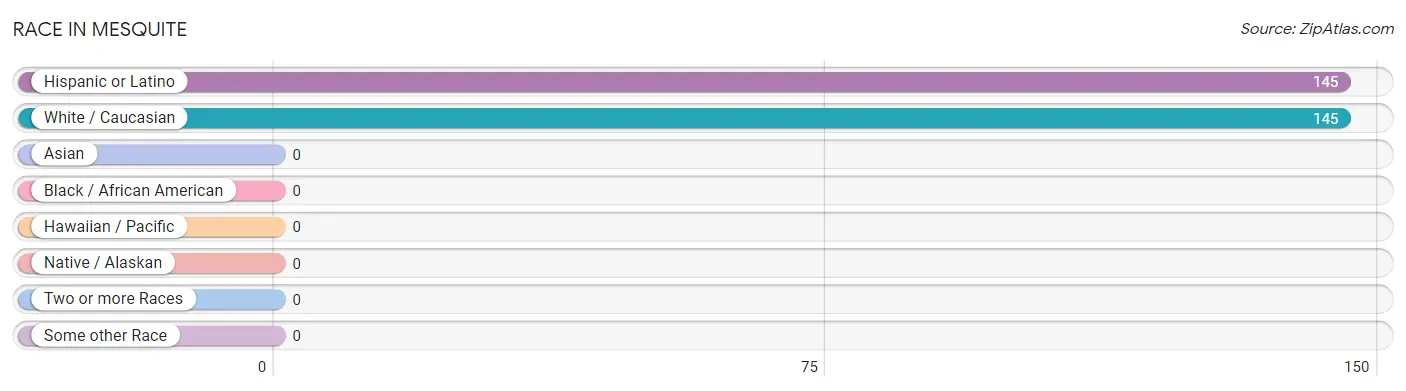
| Race | # Population | % Population |
| Asian | 0 | 0.0% |
| Black / African American | 0 | 0.0% |
| Hawaiian / Pacific | 0 | 0.0% |
| Hispanic or Latino | 145 | 100.0% |
| Native / Alaskan | 0 | 0.0% |
| White / Caucasian | 145 | 100.0% |
| Two or more Races | 0 | 0.0% |
| Some other Race | 0 | 0.0% |
| Total | 145 | 100.0% |
Ancestry in Mesquite
The most populous ancestries reported in Mesquite are , and Mexican (145 | 100.0%), together accounting for 100.0% of all Mesquite residents.

| Ancestry | # Population | % Population |
| Mexican | 145 | 100.0% | View All 1 Rows |
Immigrants in Mesquite
The most numerous immigrant groups reported in Mesquite came from Central America (39 | 26.9%), Latin America (39 | 26.9%), and Mexico (39 | 26.9%), together accounting for 80.7% of all Mesquite residents.
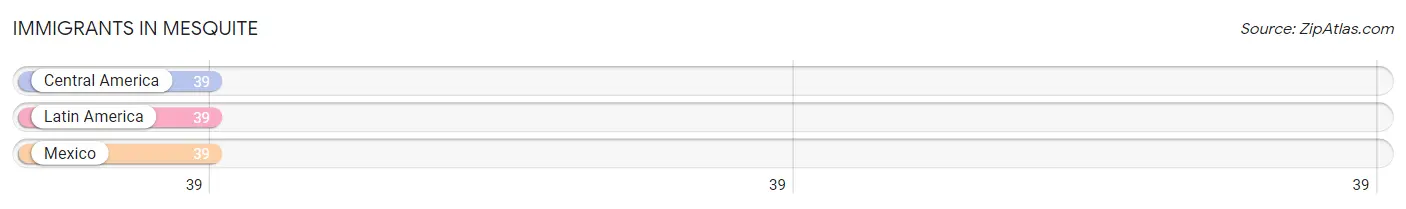
| Immigration Origin | # Population | % Population |
| Central America | 39 | 26.9% |
| Latin America | 39 | 26.9% |
| Mexico | 39 | 26.9% | View All 3 Rows |
Sex and Age in Mesquite
Sex and Age in Mesquite
The most populous age groups in Mesquite are 5 to 9 Years (24 | 31.2%) for men and 5 to 9 Years (22 | 32.4%) for women.
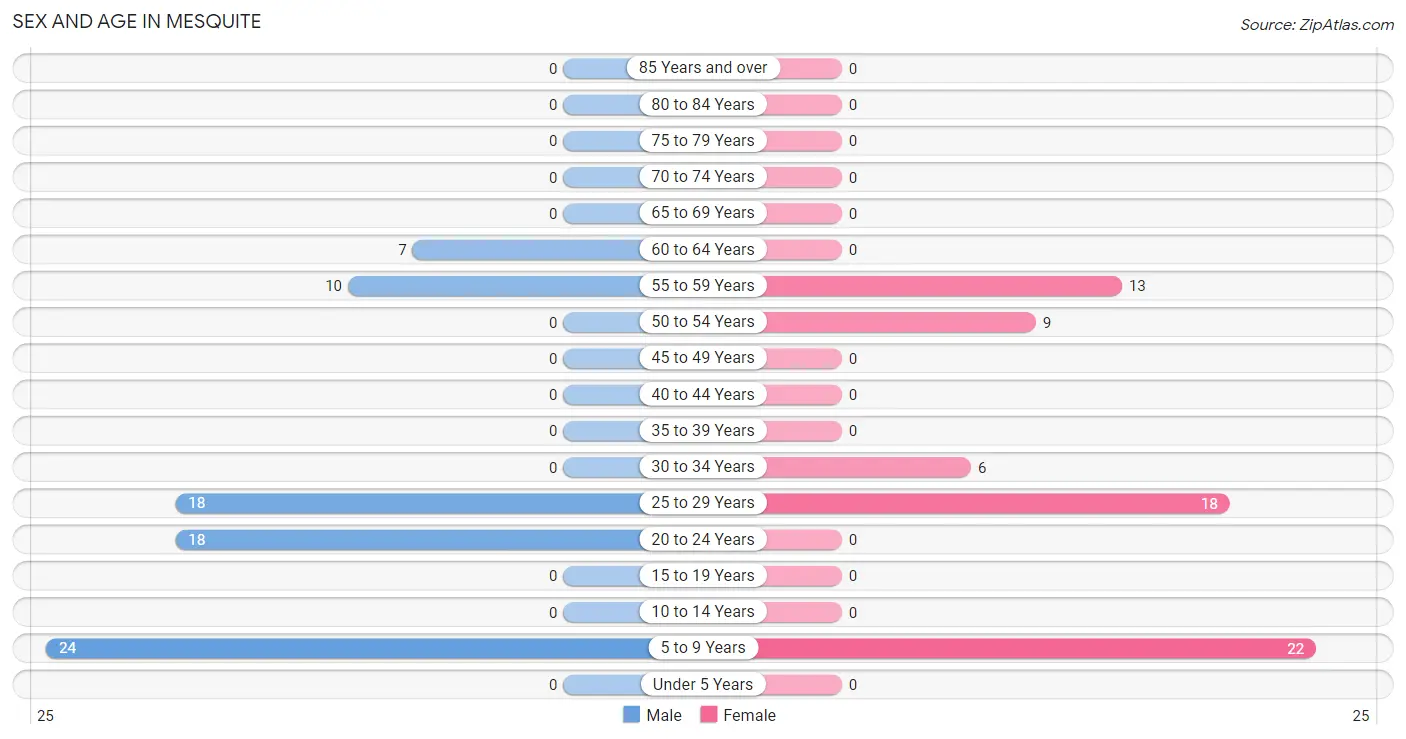
| Age Bracket | Male | Female |
| Under 5 Years | 0 (0.0%) | 0 (0.0%) |
| 5 to 9 Years | 24 (31.2%) | 22 (32.4%) |
| 10 to 14 Years | 0 (0.0%) | 0 (0.0%) |
| 15 to 19 Years | 0 (0.0%) | 0 (0.0%) |
| 20 to 24 Years | 18 (23.4%) | 0 (0.0%) |
| 25 to 29 Years | 18 (23.4%) | 18 (26.5%) |
| 30 to 34 Years | 0 (0.0%) | 6 (8.8%) |
| 35 to 39 Years | 0 (0.0%) | 0 (0.0%) |
| 40 to 44 Years | 0 (0.0%) | 0 (0.0%) |
| 45 to 49 Years | 0 (0.0%) | 0 (0.0%) |
| 50 to 54 Years | 0 (0.0%) | 9 (13.2%) |
| 55 to 59 Years | 10 (13.0%) | 13 (19.1%) |
| 60 to 64 Years | 7 (9.1%) | 0 (0.0%) |
| 65 to 69 Years | 0 (0.0%) | 0 (0.0%) |
| 70 to 74 Years | 0 (0.0%) | 0 (0.0%) |
| 75 to 79 Years | 0 (0.0%) | 0 (0.0%) |
| 80 to 84 Years | 0 (0.0%) | 0 (0.0%) |
| 85 Years and over | 0 (0.0%) | 0 (0.0%) |
| Total | 77 (100.0%) | 68 (100.0%) |
Families and Households in Mesquite
Median Family Size in Mesquite
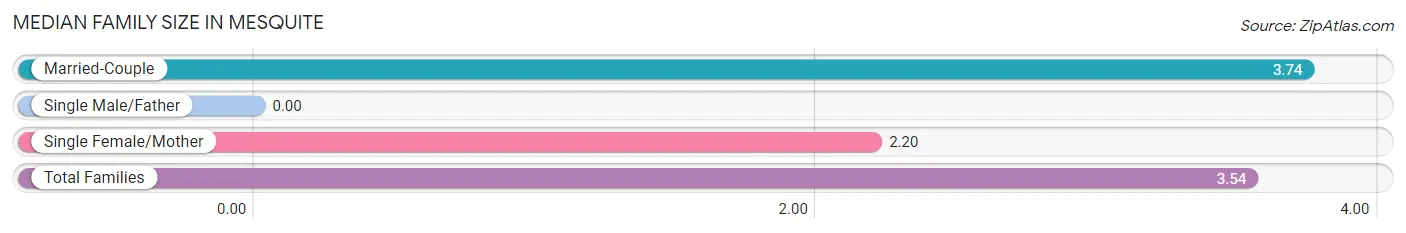
| Family Type | # Families | Family Size |
| Married-Couple | 34 (87.2%) | 3.74 |
| Single Male/Father | 0 (0.0%) | - |
| Single Female/Mother | 5 (12.8%) | 2.20 |
| Total Families | 39 (100.0%) | 3.54 |
Median Household Size in Mesquite
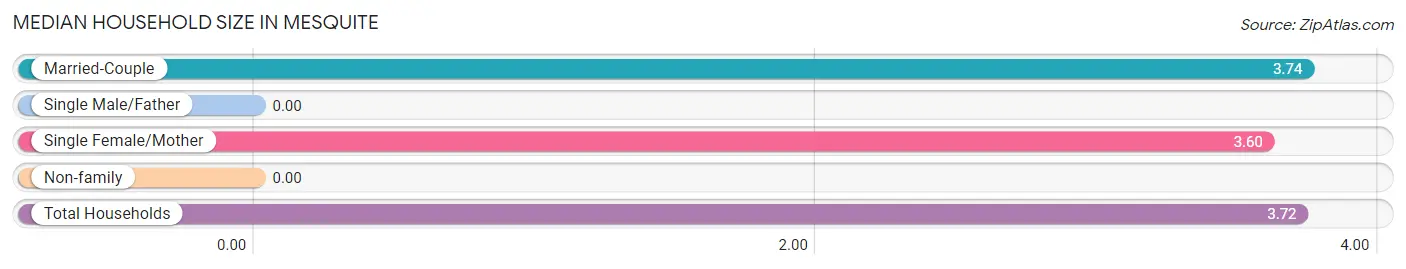
| Household Type | # Households | Household Size |
| Married-Couple | 34 (87.2%) | 3.74 |
| Single Male/Father | 0 (0.0%) | - |
| Single Female/Mother | 5 (12.8%) | 3.60 |
| Non-family | 0 (0.0%) | - |
| Total Households | 39 (100.0%) | 3.72 |
Household Size by Marriage Status in Mesquite
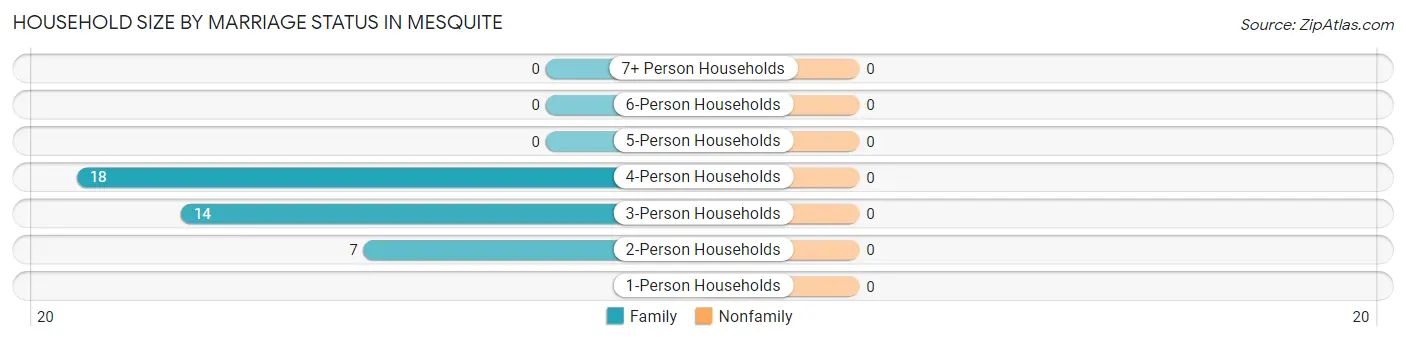
| Household Size | Family Households | Nonfamily Households |
| 1-Person Households | - | 0 (0.0%) |
| 2-Person Households | 7 (17.9%) | 0 (0.0%) |
| 3-Person Households | 14 (35.9%) | 0 (0.0%) |
| 4-Person Households | 18 (46.2%) | 0 (0.0%) |
| 5-Person Households | 0 (0.0%) | 0 (0.0%) |
| 6-Person Households | 0 (0.0%) | 0 (0.0%) |
| 7+ Person Households | 0 (0.0%) | 0 (0.0%) |
| Total | 39 (100.0%) | 0 (0.0%) |
Female Fertility in Mesquite
Fertility by Age in Mesquite

| Age Bracket | Women with Births | Births / 1,000 Women |
| 15 to 19 years | 0 (0.0%) | 0.0 |
| 20 to 34 years | 0 (0.0%) | 0.0 |
| 35 to 50 years | 0 (0.0%) | 0.0 |
| Total | 0 (0.0%) | 0.0 |
Fertility by Age by Marriage Status in Mesquite
| Age Bracket | Married | Unmarried |
| 15 to 19 years | 0 (0.0%) | 0 (0.0%) |
| 20 to 34 years | 0 (0.0%) | 0 (0.0%) |
| 35 to 50 years | 0 (0.0%) | 0 (0.0%) |
| Total | 0 (0.0%) | 0 (0.0%) |
Fertility by Education in Mesquite
| Educational Attainment | Women with Births | Births / 1,000 Women |
| Less than High School | 0 (0.0%) | 0.0 |
| High School Diploma | 0 (0.0%) | 0.0 |
| College or Associate's Degree | 0 (0.0%) | 0.0 |
| Bachelor's Degree | 0 (0.0%) | 0.0 |
| Graduate Degree | 0 (0.0%) | 0.0 |
| Total | 0 (0.0%) | 0.0 |
Fertility by Education by Marriage Status in Mesquite
| Educational Attainment | Married | Unmarried |
| Less than High School | 0 (0.0%) | 0 (0.0%) |
| High School Diploma | 0 (0.0%) | 0 (0.0%) |
| College or Associate's Degree | 0 (0.0%) | 0 (0.0%) |
| Bachelor's Degree | 0 (0.0%) | 0 (0.0%) |
| Graduate Degree | 0 (0.0%) | 0 (0.0%) |
| Total | 0 (0.0%) | 0 (0.0%) |
Employment Characteristics in Mesquite
Employment by Class of Employer in Mesquite
Among the 61 employed individuals in Mesquite, private company employees (19 | 31.1%), local government employees (18 | 29.5%), and state government employees (18 | 29.5%) make up the most common classes of employment.
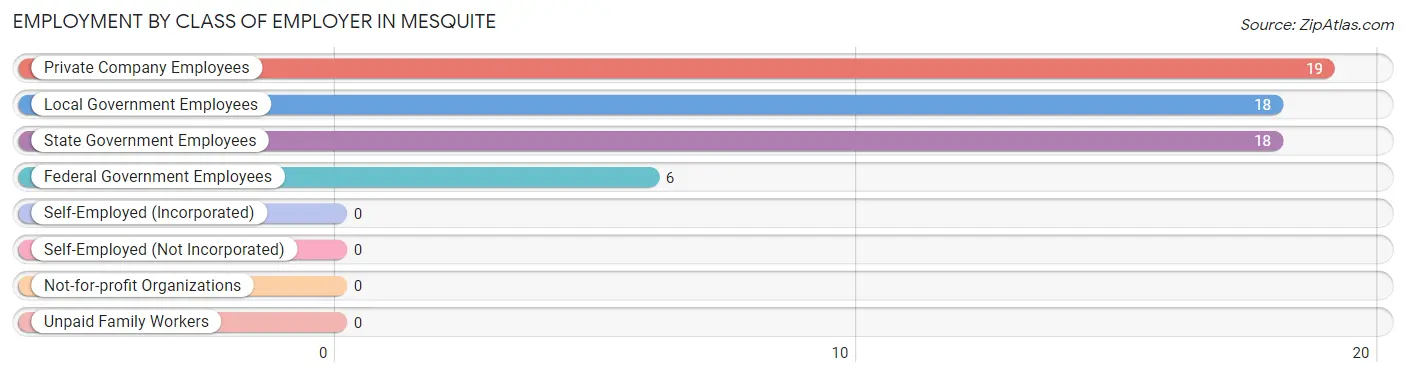
| Employer Class | # Employees | % Employees |
| Private Company Employees | 19 | 31.1% |
| Self-Employed (Incorporated) | 0 | 0.0% |
| Self-Employed (Not Incorporated) | 0 | 0.0% |
| Not-for-profit Organizations | 0 | 0.0% |
| Local Government Employees | 18 | 29.5% |
| State Government Employees | 18 | 29.5% |
| Federal Government Employees | 6 | 9.8% |
| Unpaid Family Workers | 0 | 0.0% |
| Total | 61 | 100.0% |
Employment Status by Age in Mesquite
According to the labor force statistics for Mesquite, out of the total population over 16 years of age (99), 79.8% or 79 individuals are in the labor force, with 22.8% or 18 of them unemployed. The age group with the highest labor force participation rate is 20 to 24 years, with 100.0% or 18 individuals in the labor force. Within the labor force, the 25 to 29 years age range has the highest percentage of unemployed individuals, with 50.0% or 18 of them being unemployed.
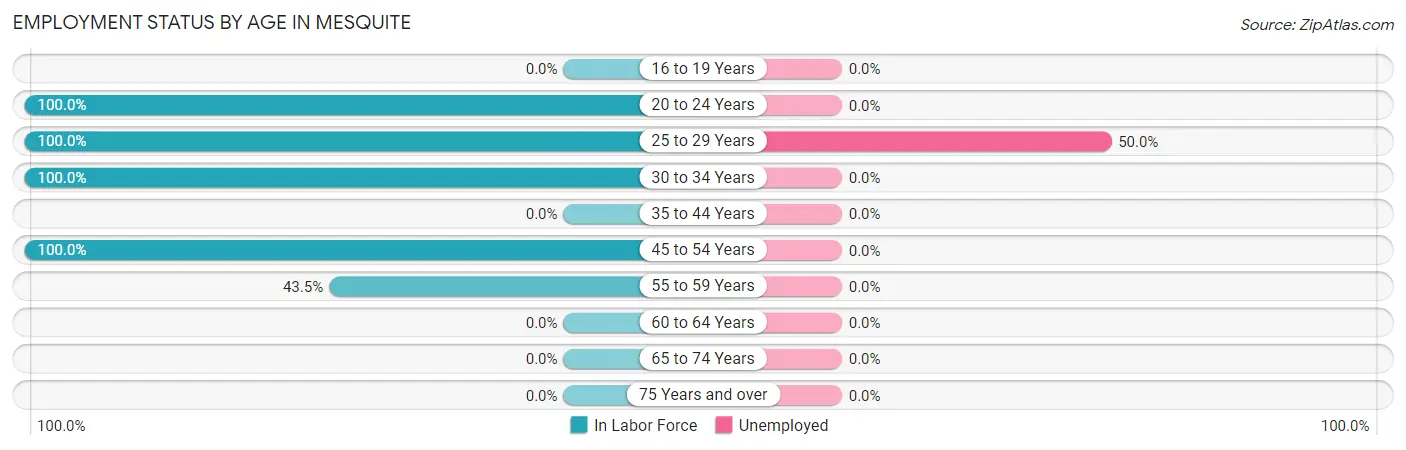
| Age Bracket | In Labor Force | Unemployed |
| 16 to 19 Years | 0 (0.0%) | 0 (0.0%) |
| 20 to 24 Years | 18 (100.0%) | 0 (0.0%) |
| 25 to 29 Years | 36 (100.0%) | 18 (50.0%) |
| 30 to 34 Years | 6 (100.0%) | 0 (0.0%) |
| 35 to 44 Years | 0 (0.0%) | 0 (0.0%) |
| 45 to 54 Years | 9 (100.0%) | 0 (0.0%) |
| 55 to 59 Years | 10 (43.5%) | 0 (0.0%) |
| 60 to 64 Years | 0 (0.0%) | 0 (0.0%) |
| 65 to 74 Years | 0 (0.0%) | 0 (0.0%) |
| 75 Years and over | 0 (0.0%) | 0 (0.0%) |
| Total | 79 (79.8%) | 18 (22.8%) |
Employment Status by Educational Attainment in Mesquite
According to labor force statistics for Mesquite, 75.3% of individuals (61) out of the total population between 25 and 64 years of age (81) are in the labor force, with 29.5% or 18 of them being unemployed. The group with the highest labor force participation rate are those with the educational attainment of high school diploma, with 100.0% or 36 individuals in the labor force. Within the labor force, individuals with high school diploma education have the highest percentage of unemployment, with 50.0% or 18 of them being unemployed.
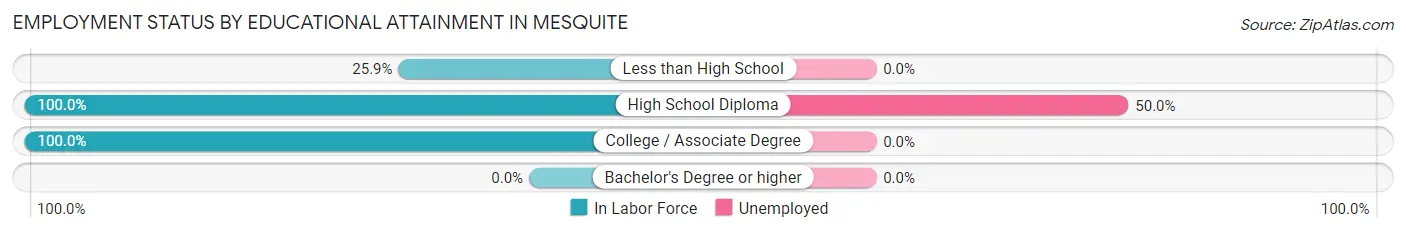
| Educational Attainment | In Labor Force | Unemployed |
| Less than High School | 7 (25.9%) | 0 (0.0%) |
| High School Diploma | 36 (100.0%) | 18 (50.0%) |
| College / Associate Degree | 18 (100.0%) | 0 (0.0%) |
| Bachelor's Degree or higher | 0 (0.0%) | 0 (0.0%) |
| Total | 61 (75.3%) | 24 (29.5%) |
Employment Occupations by Sex in Mesquite
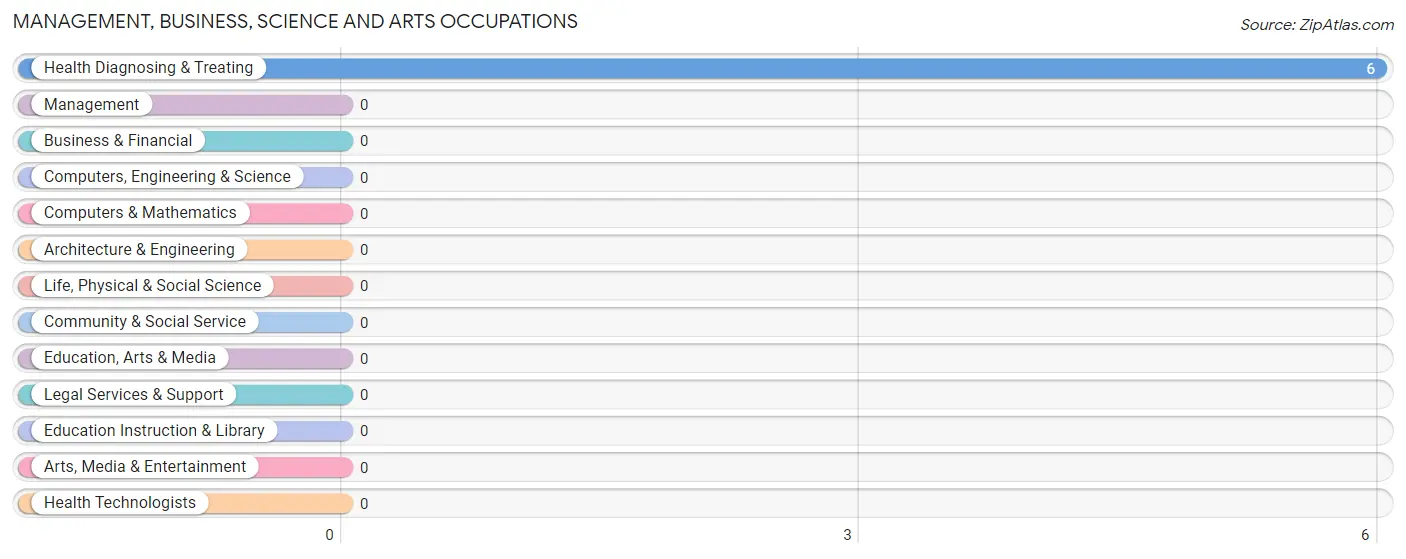
Management, Business, Science and Arts Occupations
The most common Management, Business, Science and Arts occupations in Mesquite are , and Health Diagnosing & Treating (6 | 9.8%).
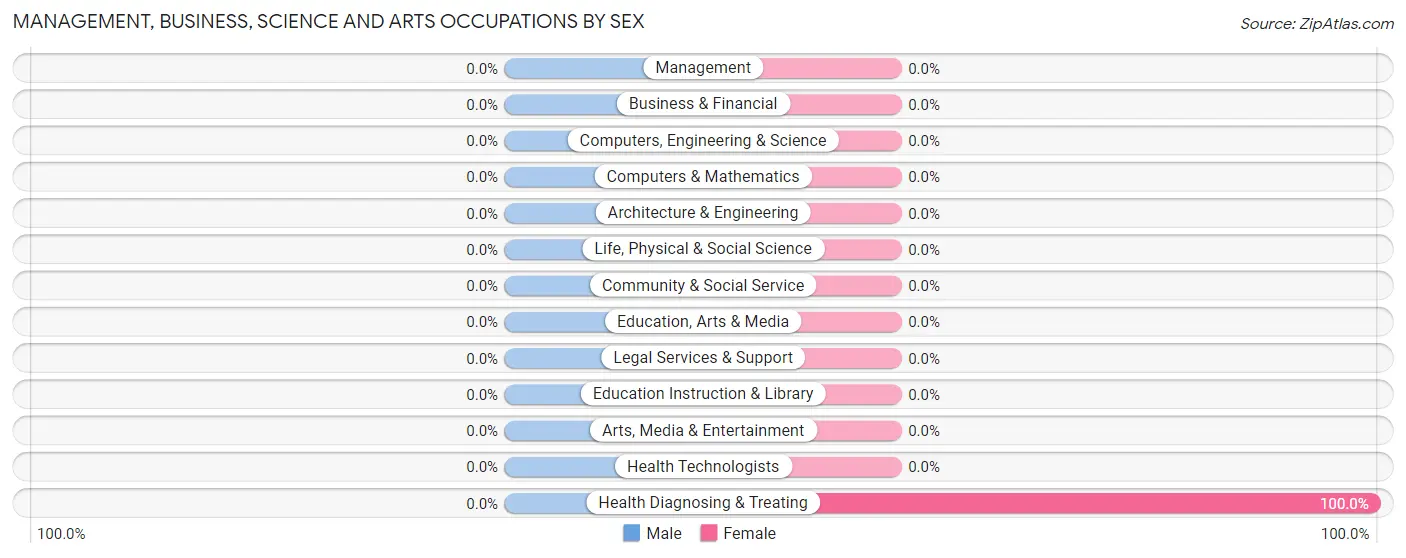
Management, Business, Science and Arts Occupations by Sex
| Occupation | Male | Female |
| Management | 0 (0.0%) | 0 (0.0%) |
| Business & Financial | 0 (0.0%) | 0 (0.0%) |
| Computers, Engineering & Science | 0 (0.0%) | 0 (0.0%) |
| Computers & Mathematics | 0 (0.0%) | 0 (0.0%) |
| Architecture & Engineering | 0 (0.0%) | 0 (0.0%) |
| Life, Physical & Social Science | 0 (0.0%) | 0 (0.0%) |
| Community & Social Service | 0 (0.0%) | 0 (0.0%) |
| Education, Arts & Media | 0 (0.0%) | 0 (0.0%) |
| Legal Services & Support | 0 (0.0%) | 0 (0.0%) |
| Education Instruction & Library | 0 (0.0%) | 0 (0.0%) |
| Arts, Media & Entertainment | 0 (0.0%) | 0 (0.0%) |
| Health Diagnosing & Treating | 0 (0.0%) | 6 (100.0%) |
| Health Technologists | 0 (0.0%) | 0 (0.0%) |
| Total (Category) | 0 (0.0%) | 6 (100.0%) |
| Total (Overall) | 28 (45.9%) | 33 (54.1%) |
Services Occupations
The most common Services occupations in Mesquite are , and Healthcare Support (9 | 14.7%).
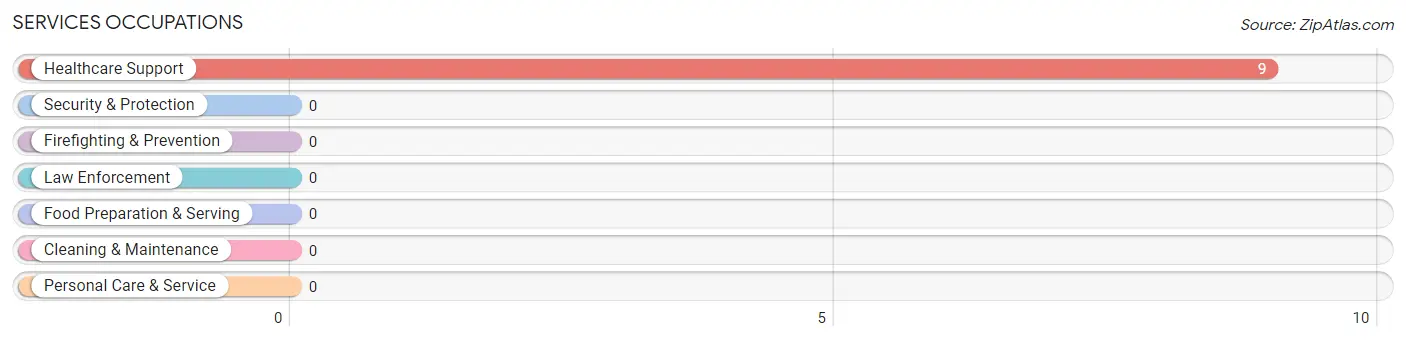
Services Occupations by Sex
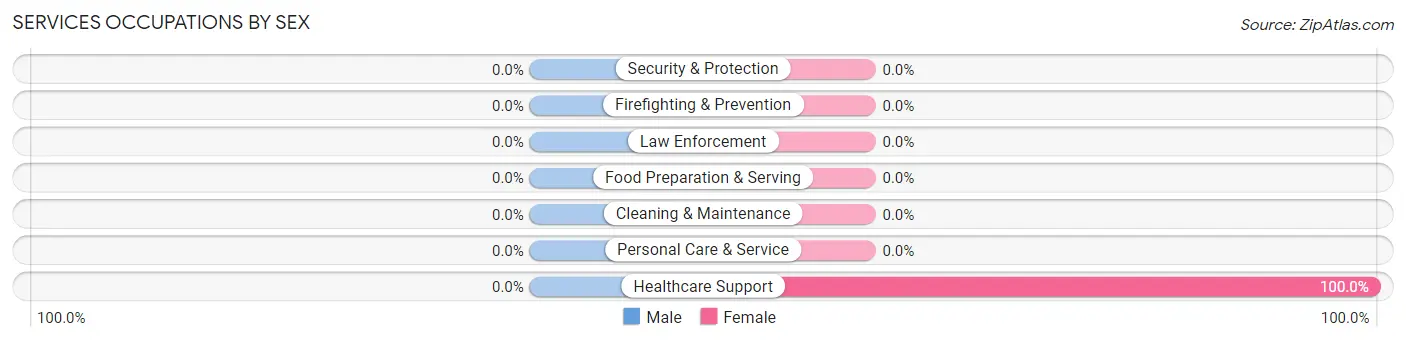
| Occupation | Male | Female |
| Healthcare Support | 0 (0.0%) | 9 (100.0%) |
| Security & Protection | 0 (0.0%) | 0 (0.0%) |
| Firefighting & Prevention | 0 (0.0%) | 0 (0.0%) |
| Law Enforcement | 0 (0.0%) | 0 (0.0%) |
| Food Preparation & Serving | 0 (0.0%) | 0 (0.0%) |
| Cleaning & Maintenance | 0 (0.0%) | 0 (0.0%) |
| Personal Care & Service | 0 (0.0%) | 0 (0.0%) |
| Total (Category) | 0 (0.0%) | 9 (100.0%) |
| Total (Overall) | 28 (45.9%) | 33 (54.1%) |
Sales and Office Occupations
The most common Sales and Office occupations in Mesquite are , and Office & Administration (36 | 59.0%).
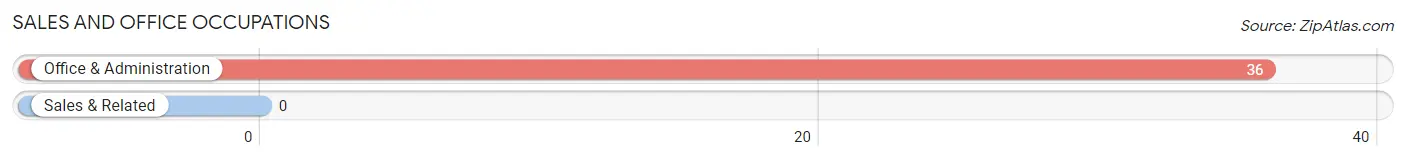
Sales and Office Occupations by Sex
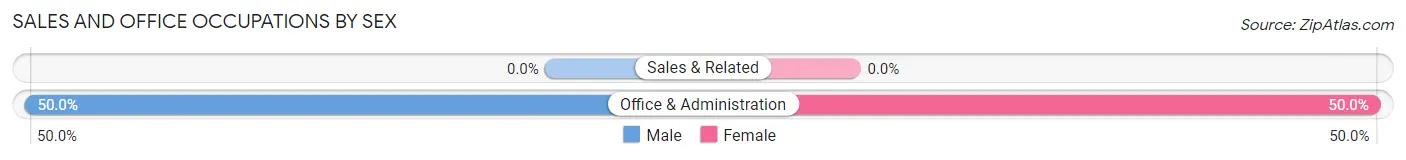
| Occupation | Male | Female |
| Sales & Related | 0 (0.0%) | 0 (0.0%) |
| Office & Administration | 18 (50.0%) | 18 (50.0%) |
| Total (Category) | 18 (50.0%) | 18 (50.0%) |
| Total (Overall) | 28 (45.9%) | 33 (54.1%) |
Natural Resources, Construction and Maintenance Occupations
The most common Natural Resources, Construction and Maintenance occupations in Mesquite are , and Construction & Extraction (3 | 4.9%).
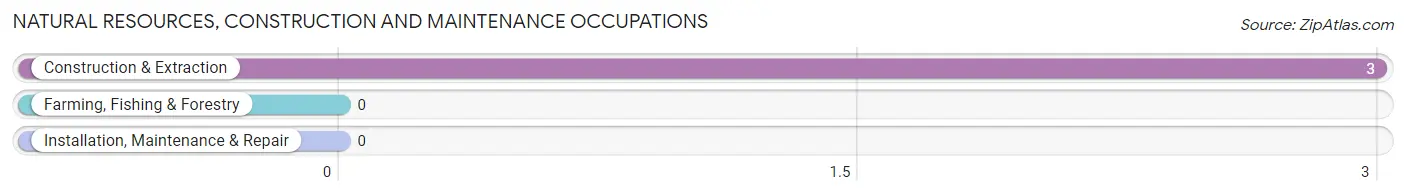
Natural Resources, Construction and Maintenance Occupations by Sex
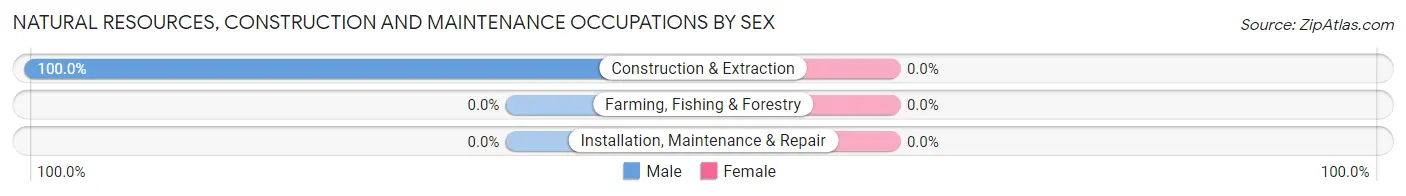
| Occupation | Male | Female |
| Farming, Fishing & Forestry | 0 (0.0%) | 0 (0.0%) |
| Construction & Extraction | 3 (100.0%) | 0 (0.0%) |
| Installation, Maintenance & Repair | 0 (0.0%) | 0 (0.0%) |
| Total (Category) | 3 (100.0%) | 0 (0.0%) |
| Total (Overall) | 28 (45.9%) | 33 (54.1%) |
Production, Transportation and Moving Occupations
The most common Production, Transportation and Moving occupations in Mesquite are , and Production (7 | 11.5%).
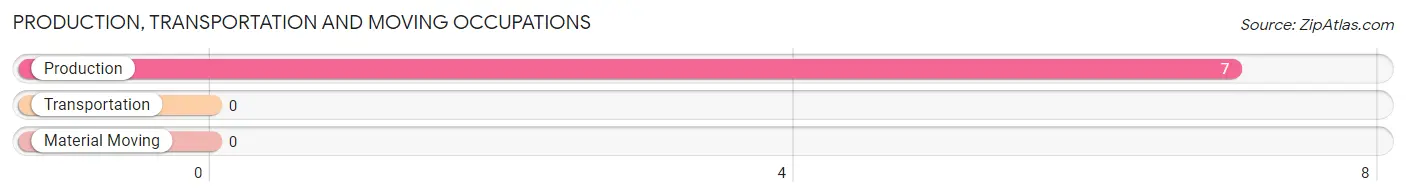
Production, Transportation and Moving Occupations by Sex
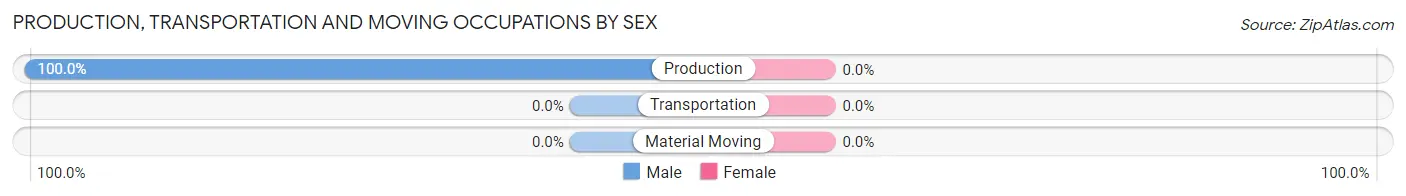
| Occupation | Male | Female |
| Production | 7 (100.0%) | 0 (0.0%) |
| Transportation | 0 (0.0%) | 0 (0.0%) |
| Material Moving | 0 (0.0%) | 0 (0.0%) |
| Total (Category) | 7 (100.0%) | 0 (0.0%) |
| Total (Overall) | 28 (45.9%) | 33 (54.1%) |
Employment Industries by Sex in Mesquite
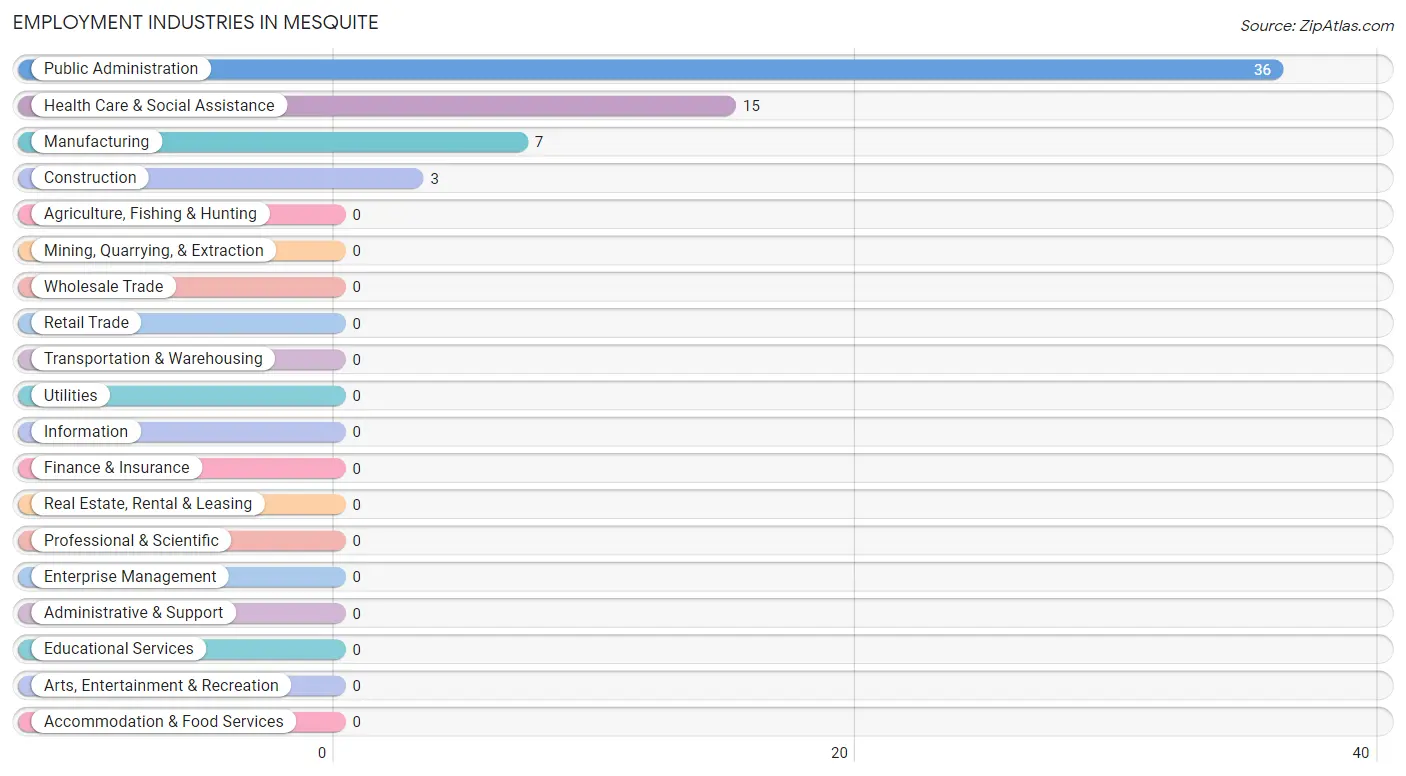
Employment Industries in Mesquite
The major employment industries in Mesquite include Public Administration (36 | 59.0%), Health Care & Social Assistance (15 | 24.6%), Manufacturing (7 | 11.5%), and Construction (3 | 4.9%).
Employment Industries by Sex in Mesquite
The Mesquite industries that see more men than women are Construction (100.0%), Manufacturing (100.0%), and Public Administration (50.0%), whereas the industries that tend to have a higher number of women are Health Care & Social Assistance (100.0%), and Public Administration (50.0%).
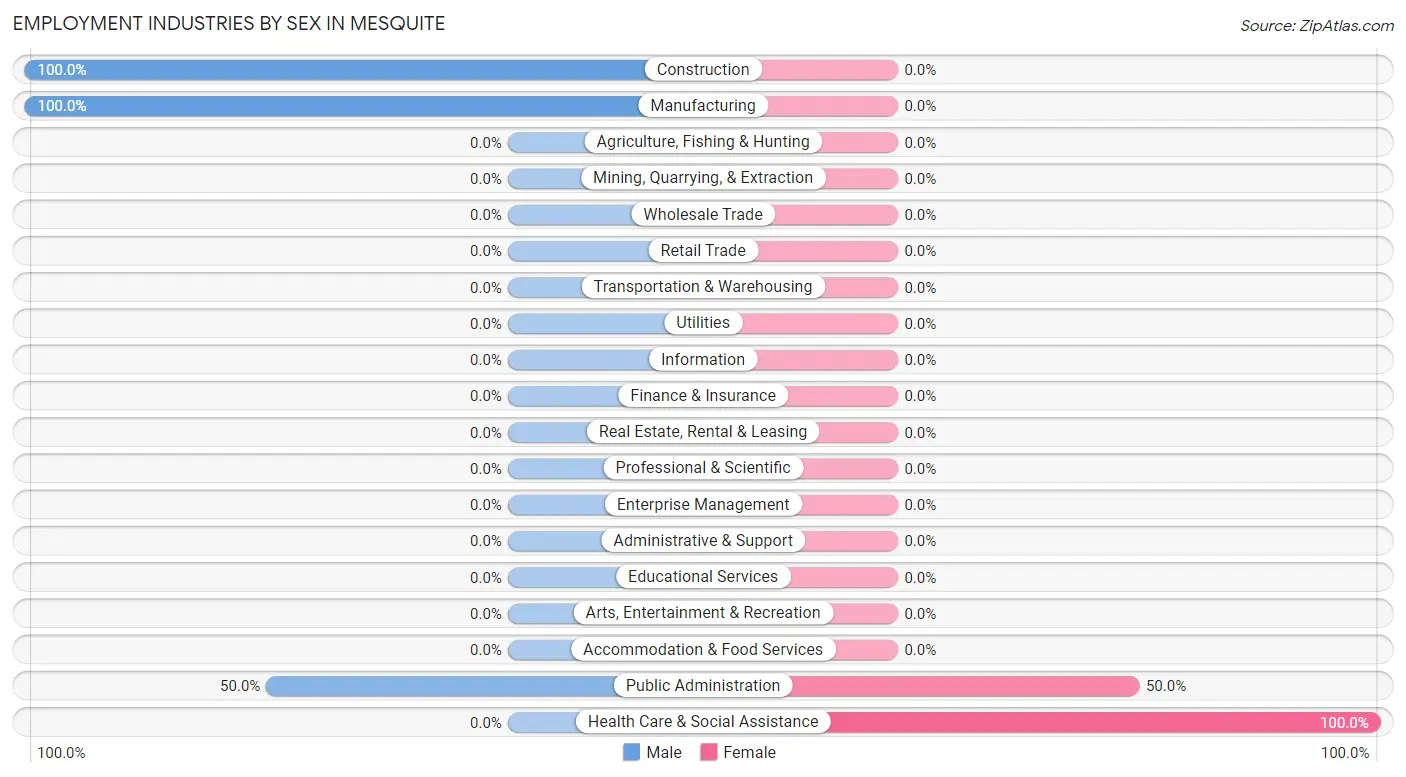
| Industry | Male | Female |
| Agriculture, Fishing & Hunting | 0 (0.0%) | 0 (0.0%) |
| Mining, Quarrying, & Extraction | 0 (0.0%) | 0 (0.0%) |
| Construction | 3 (100.0%) | 0 (0.0%) |
| Manufacturing | 7 (100.0%) | 0 (0.0%) |
| Wholesale Trade | 0 (0.0%) | 0 (0.0%) |
| Retail Trade | 0 (0.0%) | 0 (0.0%) |
| Transportation & Warehousing | 0 (0.0%) | 0 (0.0%) |
| Utilities | 0 (0.0%) | 0 (0.0%) |
| Information | 0 (0.0%) | 0 (0.0%) |
| Finance & Insurance | 0 (0.0%) | 0 (0.0%) |
| Real Estate, Rental & Leasing | 0 (0.0%) | 0 (0.0%) |
| Professional & Scientific | 0 (0.0%) | 0 (0.0%) |
| Enterprise Management | 0 (0.0%) | 0 (0.0%) |
| Administrative & Support | 0 (0.0%) | 0 (0.0%) |
| Educational Services | 0 (0.0%) | 0 (0.0%) |
| Health Care & Social Assistance | 0 (0.0%) | 15 (100.0%) |
| Arts, Entertainment & Recreation | 0 (0.0%) | 0 (0.0%) |
| Accommodation & Food Services | 0 (0.0%) | 0 (0.0%) |
| Public Administration | 18 (50.0%) | 18 (50.0%) |
| Total | 28 (45.9%) | 33 (54.1%) |
Education in Mesquite
School Enrollment in Mesquite
The most common levels of schooling among the 46 students in Mesquite are elementary school (24 | 52.2%), and nursery / preschool (22 | 47.8%).
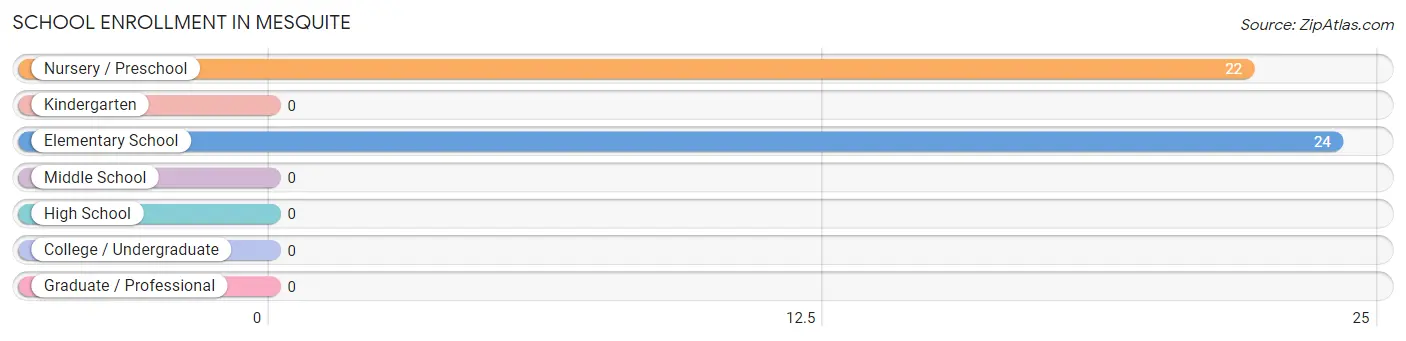
| School Level | # Students | % Students |
| Nursery / Preschool | 22 | 47.8% |
| Kindergarten | 0 | 0.0% |
| Elementary School | 24 | 52.2% |
| Middle School | 0 | 0.0% |
| High School | 0 | 0.0% |
| College / Undergraduate | 0 | 0.0% |
| Graduate / Professional | 0 | 0.0% |
| Total | 46 | 100.0% |
School Enrollment by Age by Funding Source in Mesquite
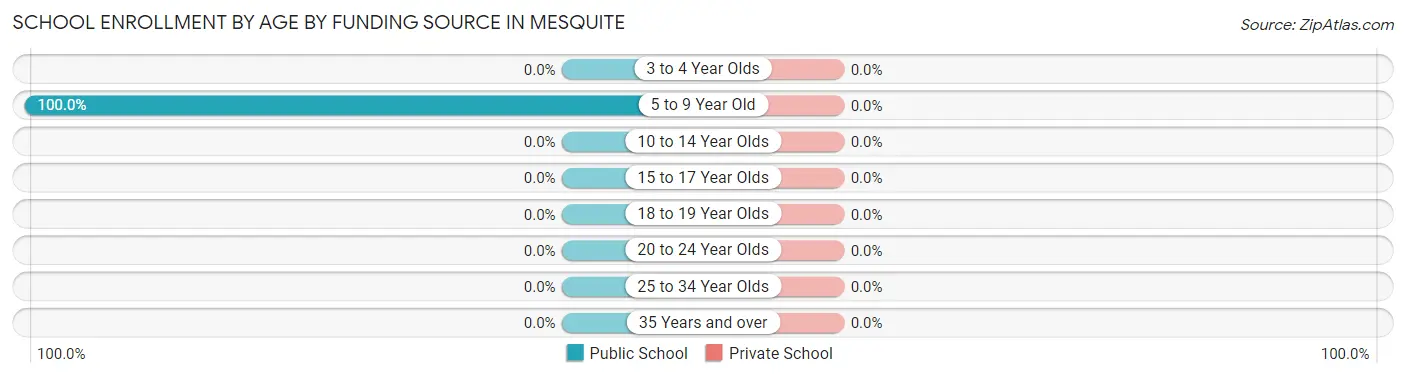
| Age Bracket | Public School | Private School |
| 3 to 4 Year Olds | 0 (0.0%) | 0 (0.0%) |
| 5 to 9 Year Old | 46 (100.0%) | 0 (0.0%) |
| 10 to 14 Year Olds | 0 (0.0%) | 0 (0.0%) |
| 15 to 17 Year Olds | 0 (0.0%) | 0 (0.0%) |
| 18 to 19 Year Olds | 0 (0.0%) | 0 (0.0%) |
| 20 to 24 Year Olds | 0 (0.0%) | 0 (0.0%) |
| 25 to 34 Year Olds | 0 (0.0%) | 0 (0.0%) |
| 35 Years and over | 0 (0.0%) | 0 (0.0%) |
| Total | 46 (100.0%) | 0 (0.0%) |
Educational Attainment by Field of Study in Mesquite
| Field of Study | # Graduates | % Graduates |
| Computers & Mathematics | 0 | 0.0% |
| Bio, Nature & Agricultural | 0 | 0.0% |
| Physical & Health Sciences | 0 | 0.0% |
| Psychology | 0 | 0.0% |
| Social Sciences | 0 | 0.0% |
| Engineering | 0 | 0.0% |
| Multidisciplinary Studies | 0 | 0.0% |
| Science & Technology | 0 | 0.0% |
| Business | 0 | 0.0% |
| Education | 0 | 0.0% |
| Literature & Languages | 0 | 0.0% |
| Liberal Arts & History | 0 | 0.0% |
| Visual & Performing Arts | 0 | 0.0% |
| Communications | 0 | 0.0% |
| Arts & Humanities | 0 | 0.0% |
| Total | 0 | 0.0% |
Transportation & Commute in Mesquite
Vehicle Availability by Sex in Mesquite
The most prevalent vehicle ownership categories in Mesquite are males with 2 vehicles (21, accounting for 75.0%) and females with 2 vehicles (27, making up 63.6%).
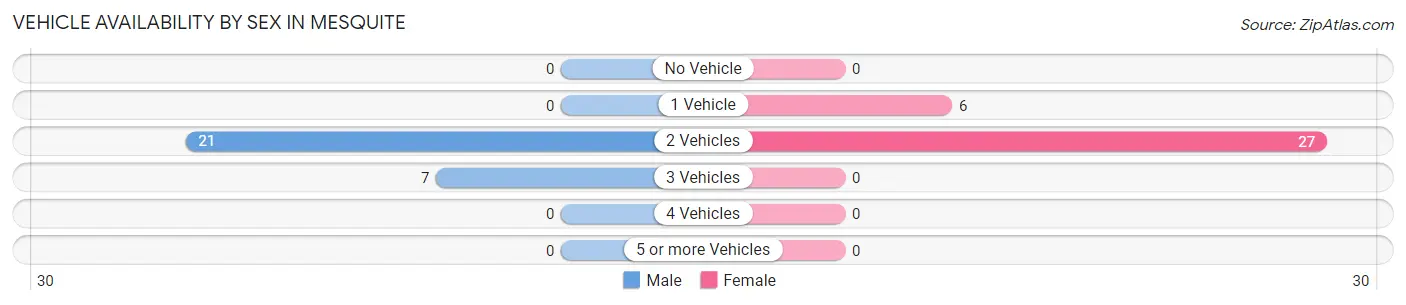
| Vehicles Available | Male | Female |
| No Vehicle | 0 (0.0%) | 0 (0.0%) |
| 1 Vehicle | 0 (0.0%) | 6 (18.2%) |
| 2 Vehicles | 21 (75.0%) | 27 (81.8%) |
| 3 Vehicles | 7 (25.0%) | 0 (0.0%) |
| 4 Vehicles | 0 (0.0%) | 0 (0.0%) |
| 5 or more Vehicles | 0 (0.0%) | 0 (0.0%) |
| Total | 28 (100.0%) | 33 (100.0%) |
Commute Time in Mesquite
The most frequently occuring commute durations in Mesquite are 20 to 24 minutes (27 commuters, 44.3%), 30 to 34 minutes (25 commuters, 41.0%), and 15 to 19 minutes (9 commuters, 14.7%).
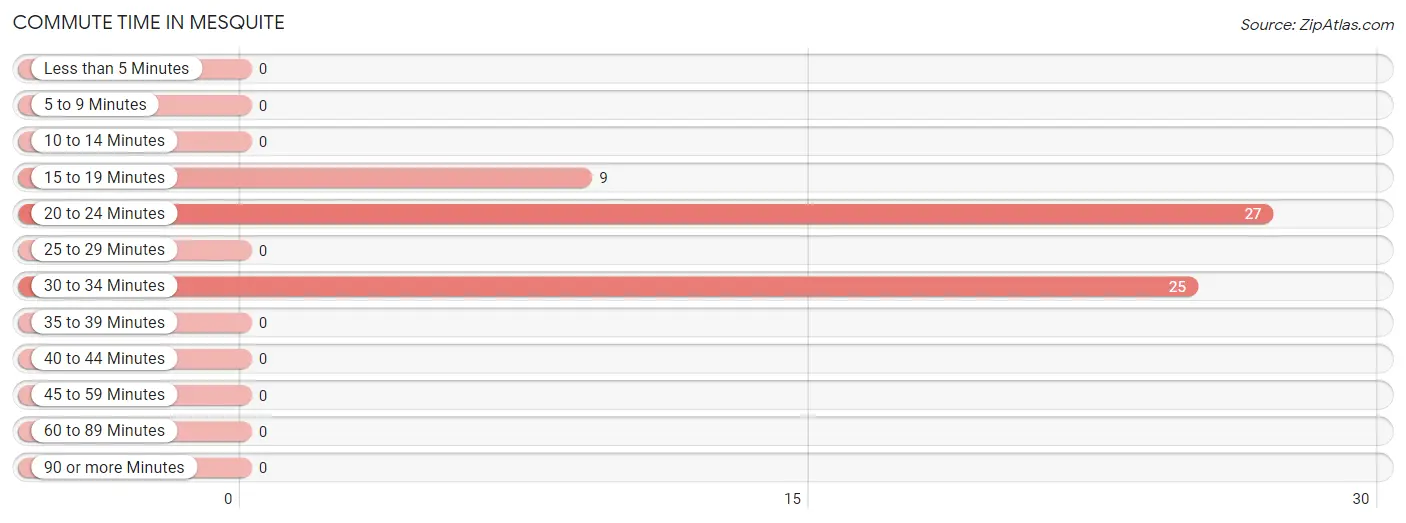
| Commute Time | # Commuters | % Commuters |
| Less than 5 Minutes | 0 | 0.0% |
| 5 to 9 Minutes | 0 | 0.0% |
| 10 to 14 Minutes | 0 | 0.0% |
| 15 to 19 Minutes | 9 | 14.7% |
| 20 to 24 Minutes | 27 | 44.3% |
| 25 to 29 Minutes | 0 | 0.0% |
| 30 to 34 Minutes | 25 | 41.0% |
| 35 to 39 Minutes | 0 | 0.0% |
| 40 to 44 Minutes | 0 | 0.0% |
| 45 to 59 Minutes | 0 | 0.0% |
| 60 to 89 Minutes | 0 | 0.0% |
| 90 or more Minutes | 0 | 0.0% |
Commute Time by Sex in Mesquite
The most common commute times in Mesquite are 20 to 24 minutes (18 commuters, 64.3%) for males and 30 to 34 minutes (18 commuters, 54.5%) for females.
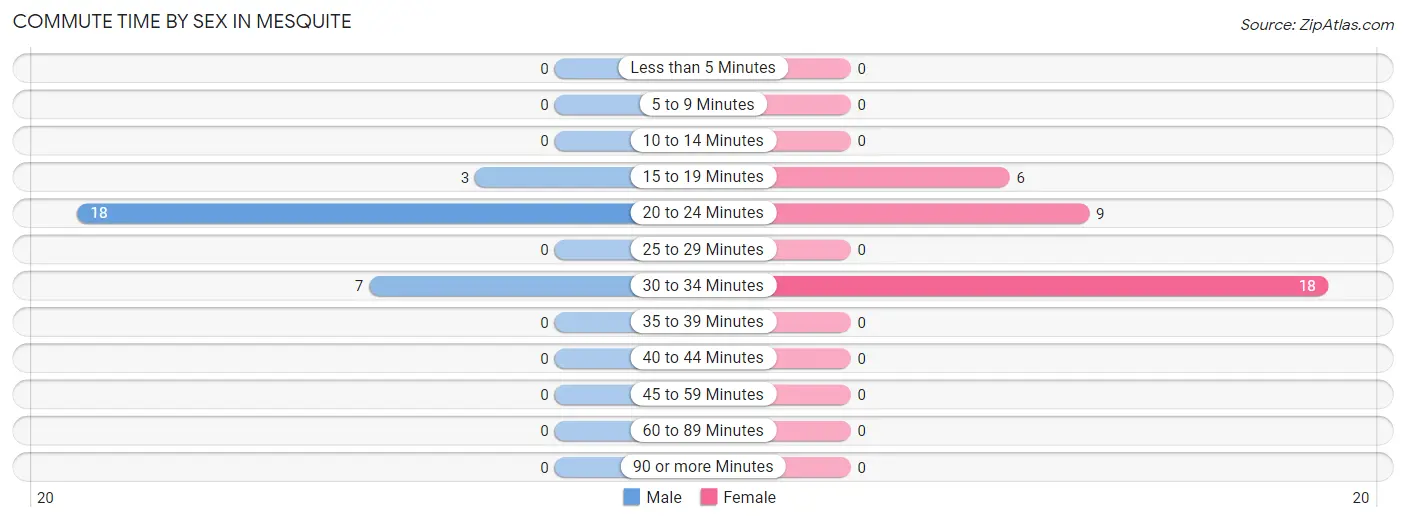
| Commute Time | Male | Female |
| Less than 5 Minutes | 0 (0.0%) | 0 (0.0%) |
| 5 to 9 Minutes | 0 (0.0%) | 0 (0.0%) |
| 10 to 14 Minutes | 0 (0.0%) | 0 (0.0%) |
| 15 to 19 Minutes | 3 (10.7%) | 6 (18.2%) |
| 20 to 24 Minutes | 18 (64.3%) | 9 (27.3%) |
| 25 to 29 Minutes | 0 (0.0%) | 0 (0.0%) |
| 30 to 34 Minutes | 7 (25.0%) | 18 (54.5%) |
| 35 to 39 Minutes | 0 (0.0%) | 0 (0.0%) |
| 40 to 44 Minutes | 0 (0.0%) | 0 (0.0%) |
| 45 to 59 Minutes | 0 (0.0%) | 0 (0.0%) |
| 60 to 89 Minutes | 0 (0.0%) | 0 (0.0%) |
| 90 or more Minutes | 0 (0.0%) | 0 (0.0%) |
Time of Departure to Work by Sex in Mesquite
The most frequent times of departure to work in Mesquite are 12:00 PM to 3:59 PM (18, 64.3%) for males and 7:30 AM to 7:59 AM (18, 54.5%) for females.
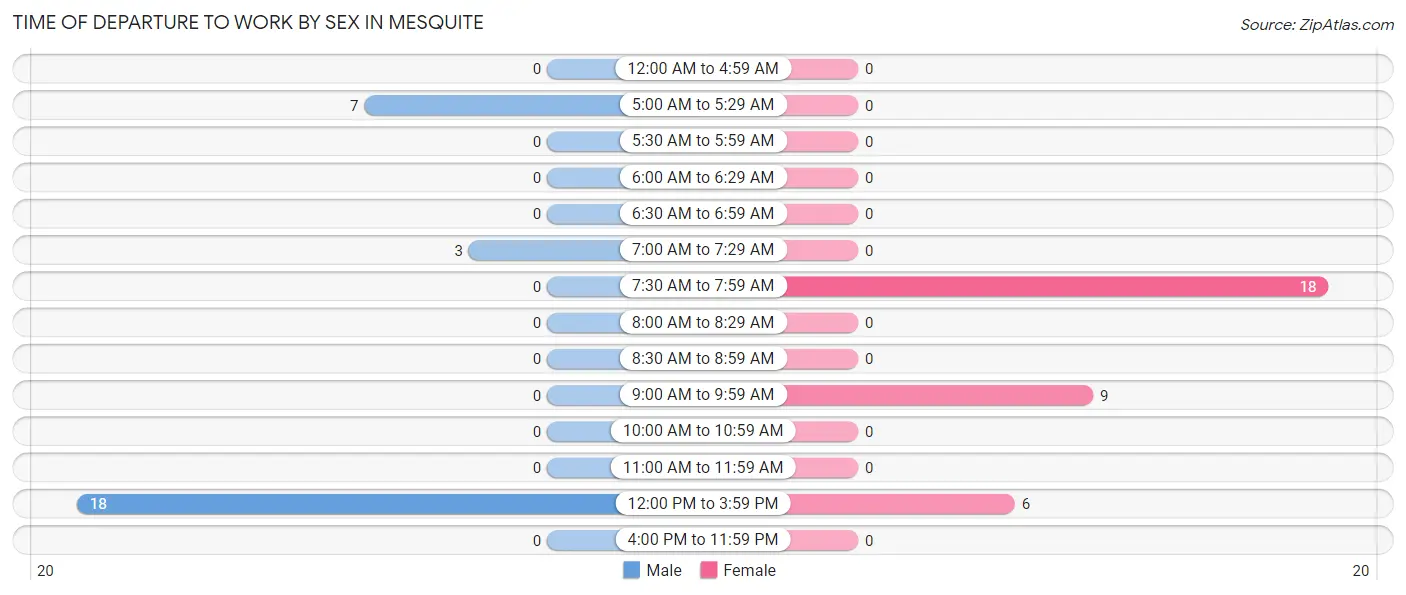
| Time of Departure | Male | Female |
| 12:00 AM to 4:59 AM | 0 (0.0%) | 0 (0.0%) |
| 5:00 AM to 5:29 AM | 7 (25.0%) | 0 (0.0%) |
| 5:30 AM to 5:59 AM | 0 (0.0%) | 0 (0.0%) |
| 6:00 AM to 6:29 AM | 0 (0.0%) | 0 (0.0%) |
| 6:30 AM to 6:59 AM | 0 (0.0%) | 0 (0.0%) |
| 7:00 AM to 7:29 AM | 3 (10.7%) | 0 (0.0%) |
| 7:30 AM to 7:59 AM | 0 (0.0%) | 18 (54.5%) |
| 8:00 AM to 8:29 AM | 0 (0.0%) | 0 (0.0%) |
| 8:30 AM to 8:59 AM | 0 (0.0%) | 0 (0.0%) |
| 9:00 AM to 9:59 AM | 0 (0.0%) | 9 (27.3%) |
| 10:00 AM to 10:59 AM | 0 (0.0%) | 0 (0.0%) |
| 11:00 AM to 11:59 AM | 0 (0.0%) | 0 (0.0%) |
| 12:00 PM to 3:59 PM | 18 (64.3%) | 6 (18.2%) |
| 4:00 PM to 11:59 PM | 0 (0.0%) | 0 (0.0%) |
| Total | 28 (100.0%) | 33 (100.0%) |
Housing Occupancy in Mesquite
Occupancy by Ownership in Mesquite
Of the total 50,352 dwellings in Mesquite, owner-occupied units account for 31,221 (62.0%), while renter-occupied units make up 19,131 (38.0%).
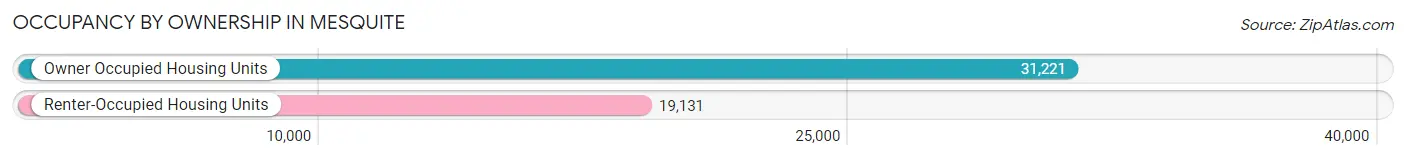
| Occupancy | # Housing Units | % Housing Units |
| Owner Occupied Housing Units | 31,221 | 62.0% |
| Renter-Occupied Housing Units | 19,131 | 38.0% |
| Total Occupied Housing Units | 50,352 | 100.0% |
Occupancy by Household Size in Mesquite
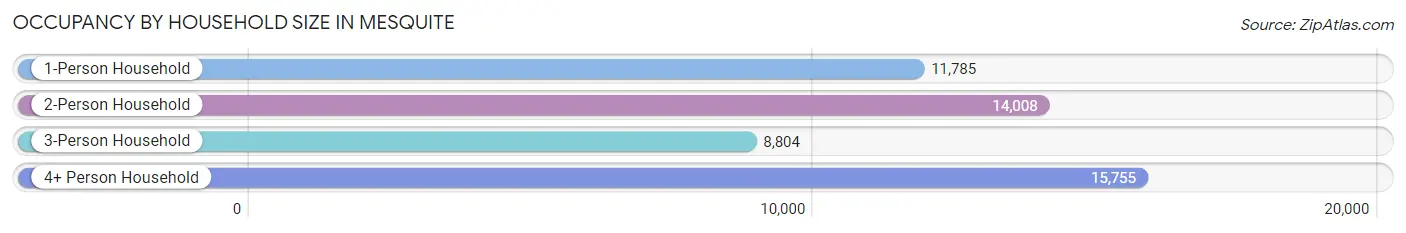
| Household Size | # Housing Units | % Housing Units |
| 1-Person Household | 11,785 | 23.4% |
| 2-Person Household | 14,008 | 27.8% |
| 3-Person Household | 8,804 | 17.5% |
| 4+ Person Household | 15,755 | 31.3% |
| Total Housing Units | 50,352 | 100.0% |
Occupancy by Ownership by Household Size in Mesquite
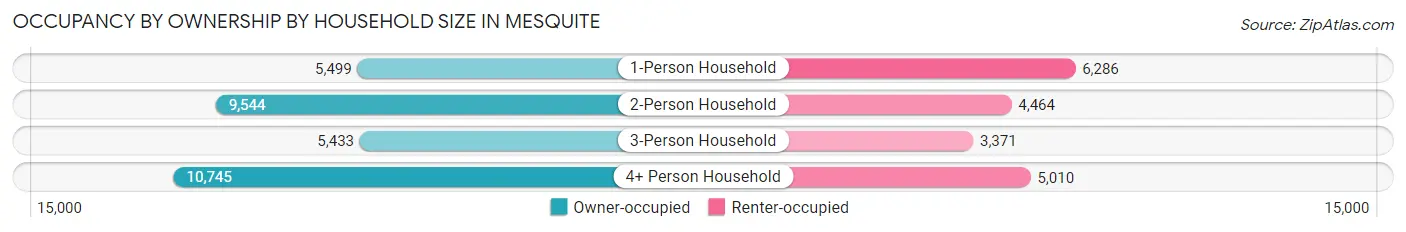
| Household Size | Owner-occupied | Renter-occupied |
| 1-Person Household | 5,499 (46.7%) | 6,286 (53.3%) |
| 2-Person Household | 9,544 (68.1%) | 4,464 (31.9%) |
| 3-Person Household | 5,433 (61.7%) | 3,371 (38.3%) |
| 4+ Person Household | 10,745 (68.2%) | 5,010 (31.8%) |
| Total Housing Units | 31,221 (62.0%) | 19,131 (38.0%) |
Occupancy by Educational Attainment in Mesquite
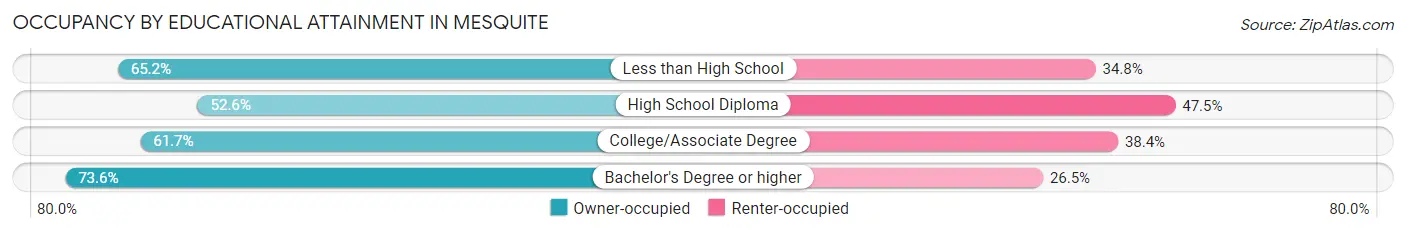
| Household Size | Owner-occupied | Renter-occupied |
| Less than High School | 5,450 (65.2%) | 2,907 (34.8%) |
| High School Diploma | 7,344 (52.5%) | 6,632 (47.4%) |
| College/Associate Degree | 11,296 (61.7%) | 7,027 (38.4%) |
| Bachelor's Degree or higher | 7,131 (73.6%) | 2,565 (26.5%) |
Occupancy by Age of Householder in Mesquite
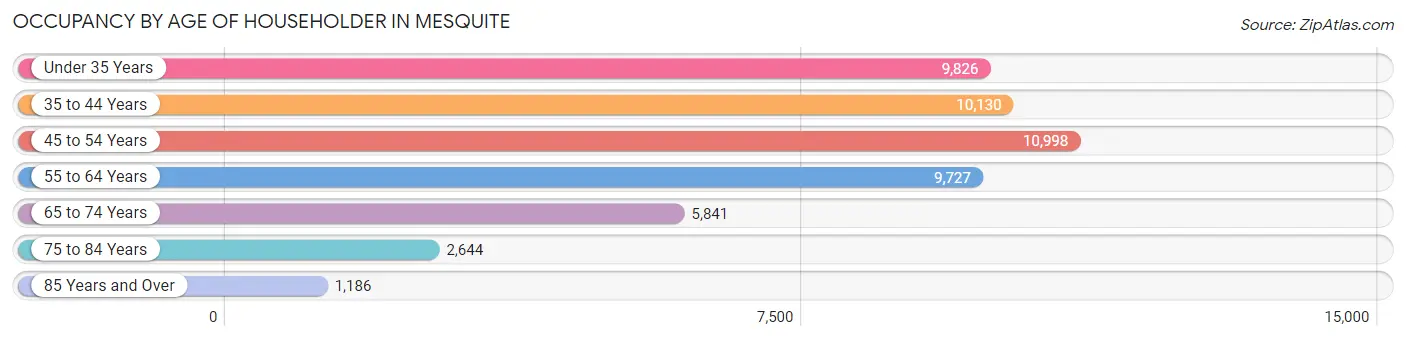
| Age Bracket | # Households | % Households |
| Under 35 Years | 9,826 | 19.5% |
| 35 to 44 Years | 10,130 | 20.1% |
| 45 to 54 Years | 10,998 | 21.8% |
| 55 to 64 Years | 9,727 | 19.3% |
| 65 to 74 Years | 5,841 | 11.6% |
| 75 to 84 Years | 2,644 | 5.2% |
| 85 Years and Over | 1,186 | 2.4% |
| Total | 50,352 | 100.0% |
Housing Finances in Mesquite
Median Income by Occupancy in Mesquite
| Occupancy Type | # Households | Median Income |
| Owner-Occupied | 21 (53.8%) | $0 |
| Renter-Occupied | 18 (46.2%) | $0 |
| Average | 39 (100.0%) | $0 |
Occupancy by Householder Income Bracket in Mesquite
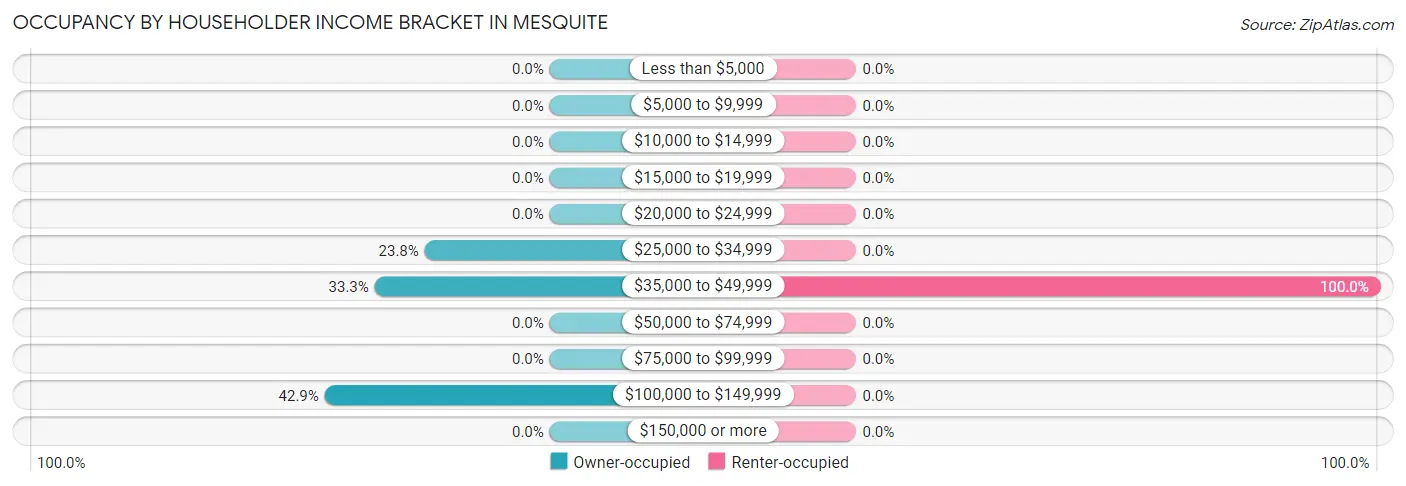
| Income Bracket | Owner-occupied | Renter-occupied |
| Less than $5,000 | 0 (0.0%) | 0 (0.0%) |
| $5,000 to $9,999 | 0 (0.0%) | 0 (0.0%) |
| $10,000 to $14,999 | 0 (0.0%) | 0 (0.0%) |
| $15,000 to $19,999 | 0 (0.0%) | 0 (0.0%) |
| $20,000 to $24,999 | 0 (0.0%) | 0 (0.0%) |
| $25,000 to $34,999 | 5 (23.8%) | 0 (0.0%) |
| $35,000 to $49,999 | 7 (33.3%) | 18 (100.0%) |
| $50,000 to $74,999 | 0 (0.0%) | 0 (0.0%) |
| $75,000 to $99,999 | 0 (0.0%) | 0 (0.0%) |
| $100,000 to $149,999 | 9 (42.9%) | 0 (0.0%) |
| $150,000 or more | 0 (0.0%) | 0 (0.0%) |
| Total | 21 (100.0%) | 18 (100.0%) |
Monthly Housing Cost Tiers in Mesquite
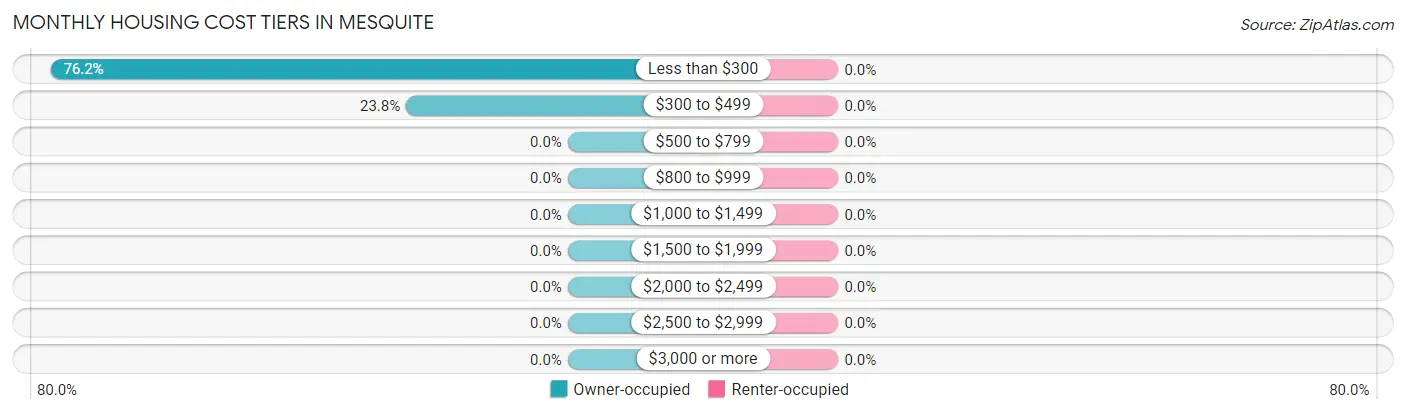
| Monthly Cost | Owner-occupied | Renter-occupied |
| Less than $300 | 16 (76.2%) | 0 (0.0%) |
| $300 to $499 | 5 (23.8%) | 0 (0.0%) |
| $500 to $799 | 0 (0.0%) | 0 (0.0%) |
| $800 to $999 | 0 (0.0%) | 0 (0.0%) |
| $1,000 to $1,499 | 0 (0.0%) | 0 (0.0%) |
| $1,500 to $1,999 | 0 (0.0%) | 0 (0.0%) |
| $2,000 to $2,499 | 0 (0.0%) | 0 (0.0%) |
| $2,500 to $2,999 | 0 (0.0%) | 0 (0.0%) |
| $3,000 or more | 0 (0.0%) | 0 (0.0%) |
| Total | 21 (100.0%) | 18 (100.0%) |
Physical Housing Characteristics in Mesquite
Housing Structures in Mesquite
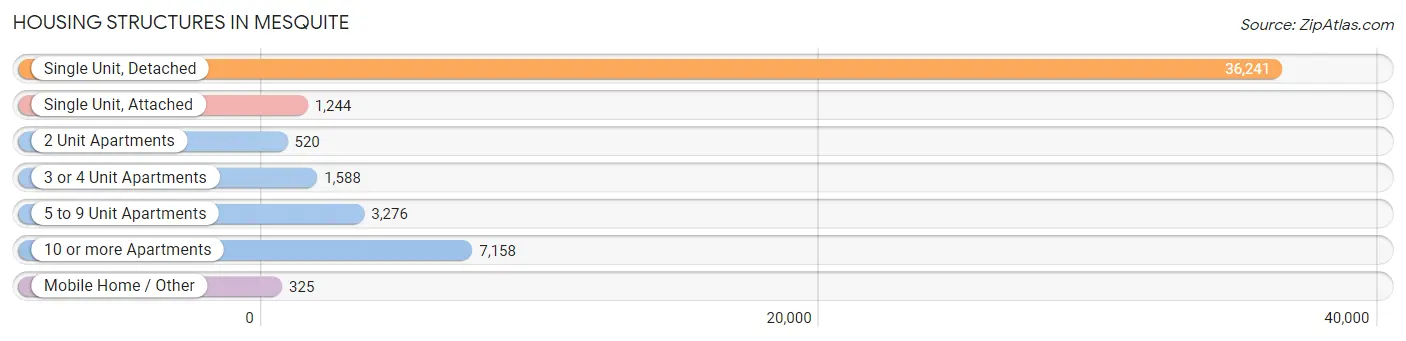
| Structure Type | # Housing Units | % Housing Units |
| Single Unit, Detached | 36,241 | 72.0% |
| Single Unit, Attached | 1,244 | 2.5% |
| 2 Unit Apartments | 520 | 1.0% |
| 3 or 4 Unit Apartments | 1,588 | 3.2% |
| 5 to 9 Unit Apartments | 3,276 | 6.5% |
| 10 or more Apartments | 7,158 | 14.2% |
| Mobile Home / Other | 325 | 0.6% |
| Total | 50,352 | 100.0% |
Housing Structures by Occupancy in Mesquite
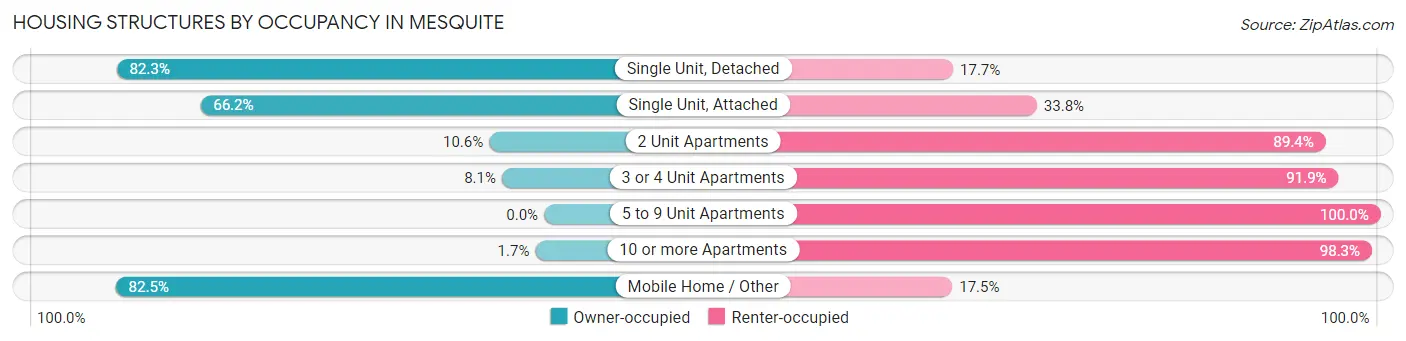
| Structure Type | Owner-occupied | Renter-occupied |
| Single Unit, Detached | 29,826 (82.3%) | 6,415 (17.7%) |
| Single Unit, Attached | 823 (66.2%) | 421 (33.8%) |
| 2 Unit Apartments | 55 (10.6%) | 465 (89.4%) |
| 3 or 4 Unit Apartments | 129 (8.1%) | 1,459 (91.9%) |
| 5 to 9 Unit Apartments | 0 (0.0%) | 3,276 (100.0%) |
| 10 or more Apartments | 120 (1.7%) | 7,038 (98.3%) |
| Mobile Home / Other | 268 (82.5%) | 57 (17.5%) |
| Total | 31,221 (62.0%) | 19,131 (38.0%) |
Housing Structures by Number of Rooms in Mesquite
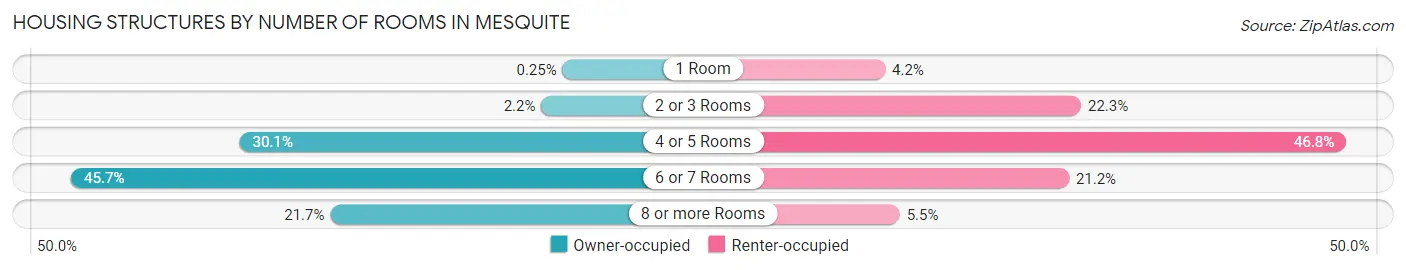
| Number of Rooms | Owner-occupied | Renter-occupied |
| 1 Room | 77 (0.3%) | 800 (4.2%) |
| 2 or 3 Rooms | 691 (2.2%) | 4,266 (22.3%) |
| 4 or 5 Rooms | 9,404 (30.1%) | 8,956 (46.8%) |
| 6 or 7 Rooms | 14,264 (45.7%) | 4,052 (21.2%) |
| 8 or more Rooms | 6,785 (21.7%) | 1,057 (5.5%) |
| Total | 31,221 (100.0%) | 19,131 (100.0%) |
Housing Structure by Heating Type in Mesquite
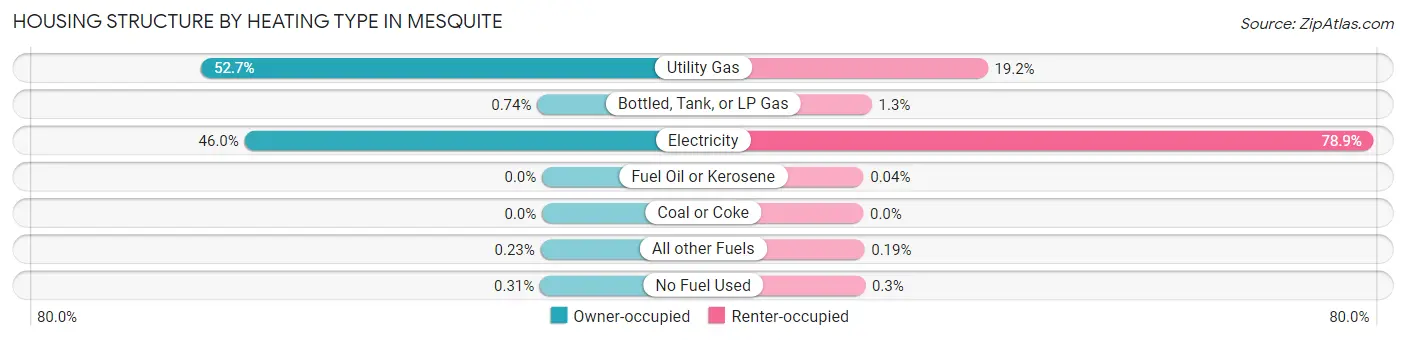
| Heating Type | Owner-occupied | Renter-occupied |
| Utility Gas | 16,461 (52.7%) | 3,678 (19.2%) |
| Bottled, Tank, or LP Gas | 232 (0.7%) | 252 (1.3%) |
| Electricity | 14,359 (46.0%) | 15,100 (78.9%) |
| Fuel Oil or Kerosene | 0 (0.0%) | 7 (0.0%) |
| Coal or Coke | 0 (0.0%) | 0 (0.0%) |
| All other Fuels | 72 (0.2%) | 37 (0.2%) |
| No Fuel Used | 97 (0.3%) | 57 (0.3%) |
| Total | 31,221 (100.0%) | 19,131 (100.0%) |
Household Vehicle Usage in Mesquite
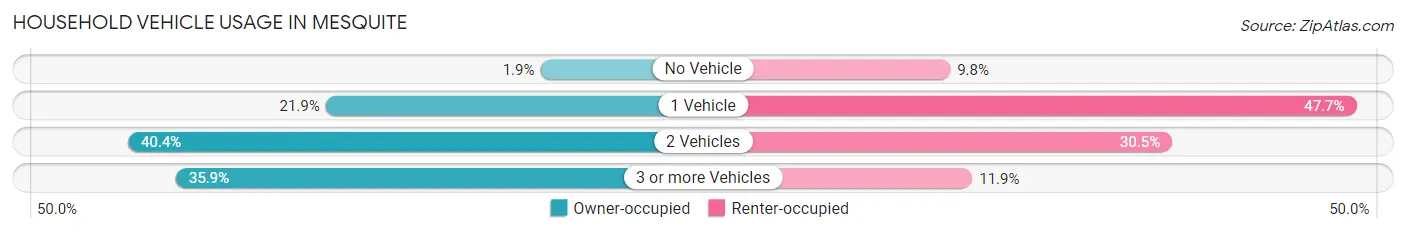
| Vehicles per Household | Owner-occupied | Renter-occupied |
| No Vehicle | 580 (1.9%) | 1,881 (9.8%) |
| 1 Vehicle | 6,840 (21.9%) | 9,133 (47.7%) |
| 2 Vehicles | 12,598 (40.4%) | 5,843 (30.5%) |
| 3 or more Vehicles | 11,203 (35.9%) | 2,274 (11.9%) |
| Total | 31,221 (100.0%) | 19,131 (100.0%) |
Real Estate & Mortgages in Mesquite
Real Estate and Mortgage Overview in Mesquite
| Characteristic | Without Mortgage | With Mortgage |
| Housing Units | 11,755 | 0 |
| Median Property Value | $190,500 | $0 |
| Median Household Income | $67,844 | $0 |
| Monthly Housing Costs | $629 | $0 |
| Real Estate Taxes | $2,729 | $0 |
Property Value by Mortgage Status in Mesquite
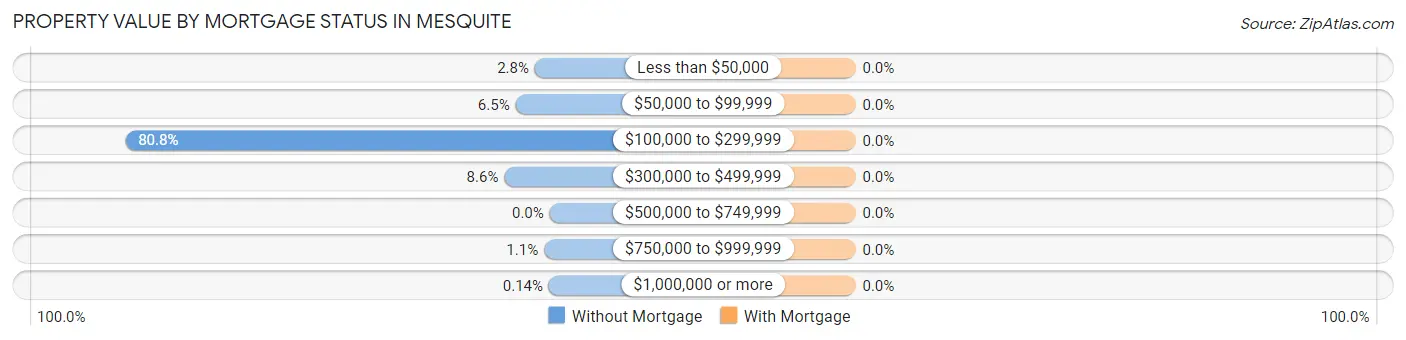
| Property Value | Without Mortgage | With Mortgage |
| Less than $50,000 | 332 (2.8%) | 0 (0.0%) |
| $50,000 to $99,999 | 764 (6.5%) | 0 (0.0%) |
| $100,000 to $299,999 | 9,501 (80.8%) | 0 (0.0%) |
| $300,000 to $499,999 | 1,016 (8.6%) | 0 (0.0%) |
| $500,000 to $749,999 | 0 (0.0%) | 0 (0.0%) |
| $750,000 to $999,999 | 126 (1.1%) | 0 (0.0%) |
| $1,000,000 or more | 16 (0.1%) | 0 (0.0%) |
| Total | 11,755 (100.0%) | 0 (0.0%) |
Household Income by Mortgage Status in Mesquite
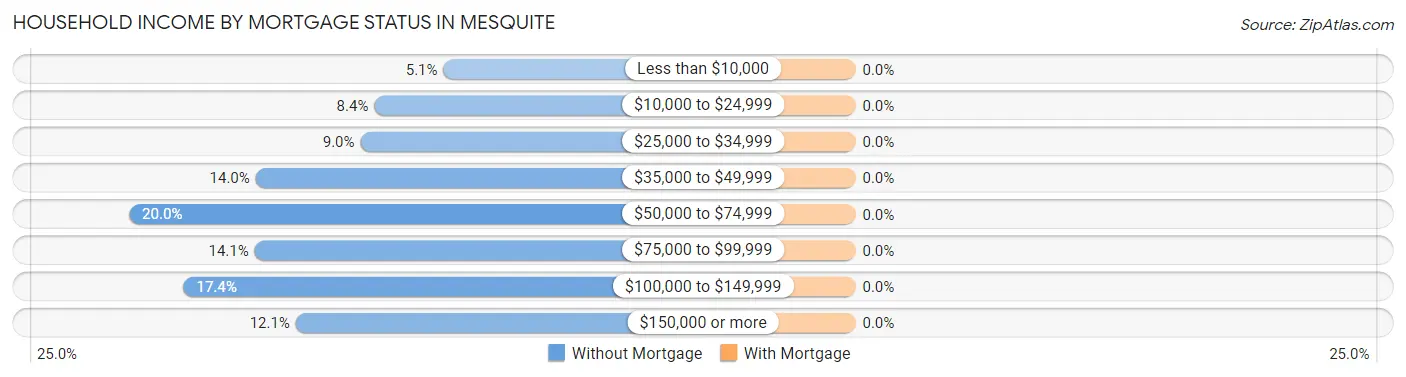
| Household Income | Without Mortgage | With Mortgage |
| Less than $10,000 | 595 (5.1%) | 0 (0.0%) |
| $10,000 to $24,999 | 981 (8.4%) | 0 (0.0%) |
| $25,000 to $34,999 | 1,059 (9.0%) | 0 (0.0%) |
| $35,000 to $49,999 | 1,646 (14.0%) | 0 (0.0%) |
| $50,000 to $74,999 | 2,353 (20.0%) | 0 (0.0%) |
| $75,000 to $99,999 | 1,651 (14.1%) | 0 (0.0%) |
| $100,000 to $149,999 | 2,049 (17.4%) | 0 (0.0%) |
| $150,000 or more | 1,421 (12.1%) | 0 (0.0%) |
| Total | 11,755 (100.0%) | 0 (0.0%) |
Property Value to Household Income Ratio in Mesquite
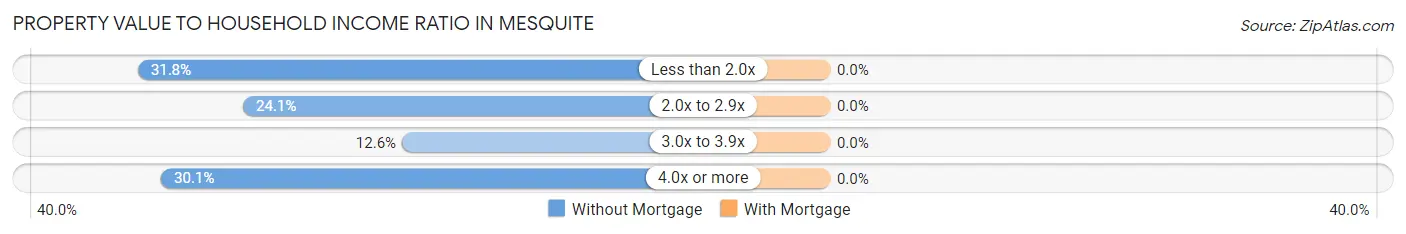
| Value-to-Income Ratio | Without Mortgage | With Mortgage |
| Less than 2.0x | 3,735 (31.8%) | 0 (0.0%) |
| 2.0x to 2.9x | 2,836 (24.1%) | 0 (0.0%) |
| 3.0x to 3.9x | 1,480 (12.6%) | 0 (0.0%) |
| 4.0x or more | 3,536 (30.1%) | 0 (0.0%) |
| Total | 11,755 (100.0%) | 0 (0.0%) |
Real Estate Taxes by Mortgage Status in Mesquite
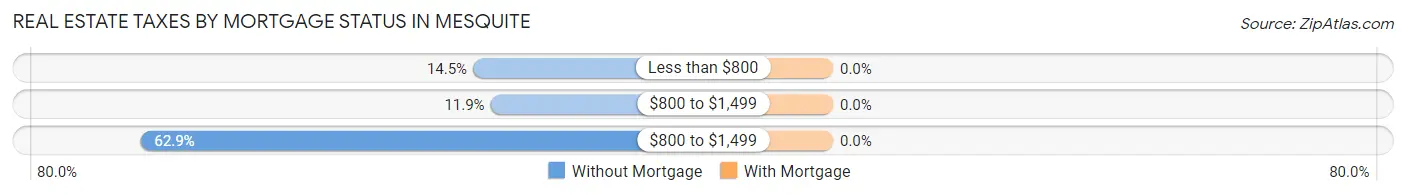
| Property Taxes | Without Mortgage | With Mortgage |
| Less than $800 | 1,703 (14.5%) | 0 (0.0%) |
| $800 to $1,499 | 1,402 (11.9%) | 0 (0.0%) |
| $800 to $1,499 | 7,397 (62.9%) | 0 (0.0%) |
| Total | 11,755 (100.0%) | 0 (0.0%) |
Health & Disability in Mesquite
Health Insurance Coverage by Age in Mesquite
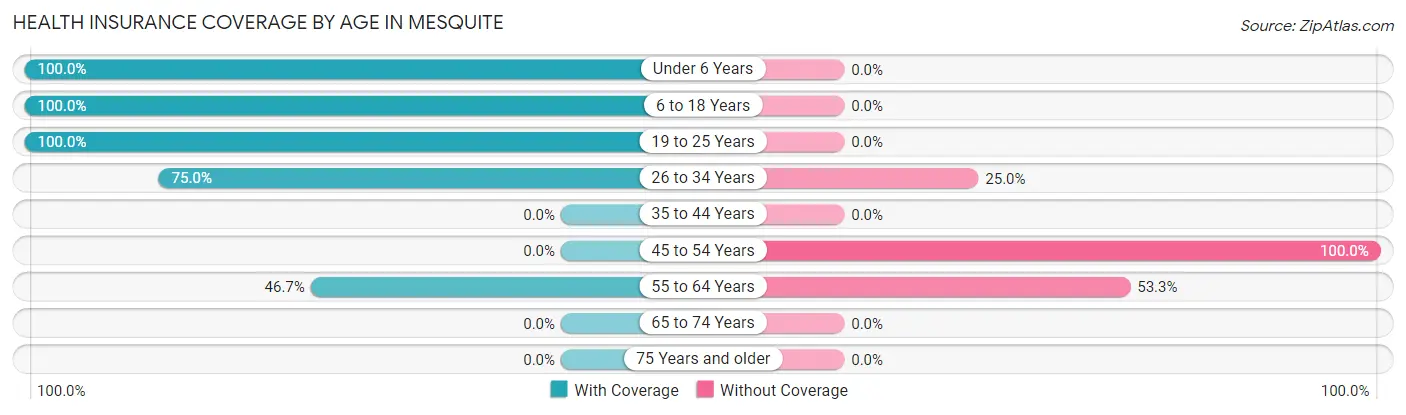
| Age Bracket | With Coverage | Without Coverage |
| Under 6 Years | 22 (100.0%) | 0 (0.0%) |
| 6 to 18 Years | 24 (100.0%) | 0 (0.0%) |
| 19 to 25 Years | 36 (100.0%) | 0 (0.0%) |
| 26 to 34 Years | 18 (75.0%) | 6 (25.0%) |
| 35 to 44 Years | 0 (0.0%) | 0 (0.0%) |
| 45 to 54 Years | 0 (0.0%) | 9 (100.0%) |
| 55 to 64 Years | 14 (46.7%) | 16 (53.3%) |
| 65 to 74 Years | 0 (0.0%) | 0 (0.0%) |
| 75 Years and older | 0 (0.0%) | 0 (0.0%) |
| Total | 114 (78.6%) | 31 (21.4%) |
Health Insurance Coverage by Citizenship Status in Mesquite
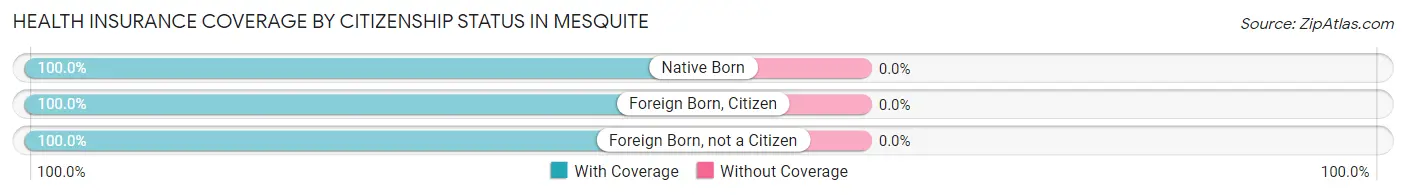
| Citizenship Status | With Coverage | Without Coverage |
| Native Born | 22 (100.0%) | 0 (0.0%) |
| Foreign Born, Citizen | 24 (100.0%) | 0 (0.0%) |
| Foreign Born, not a Citizen | 36 (100.0%) | 0 (0.0%) |
Health Insurance Coverage by Household Income in Mesquite
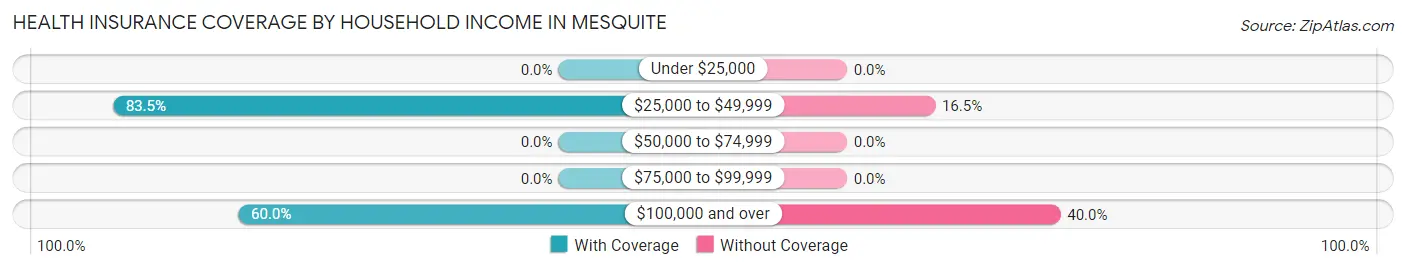
| Household Income | With Coverage | Without Coverage |
| Under $25,000 | 0 (0.0%) | 0 (0.0%) |
| $25,000 to $49,999 | 96 (83.5%) | 19 (16.5%) |
| $50,000 to $74,999 | 0 (0.0%) | 0 (0.0%) |
| $75,000 to $99,999 | 0 (0.0%) | 0 (0.0%) |
| $100,000 and over | 18 (60.0%) | 12 (40.0%) |
Public vs Private Health Insurance Coverage by Age in Mesquite
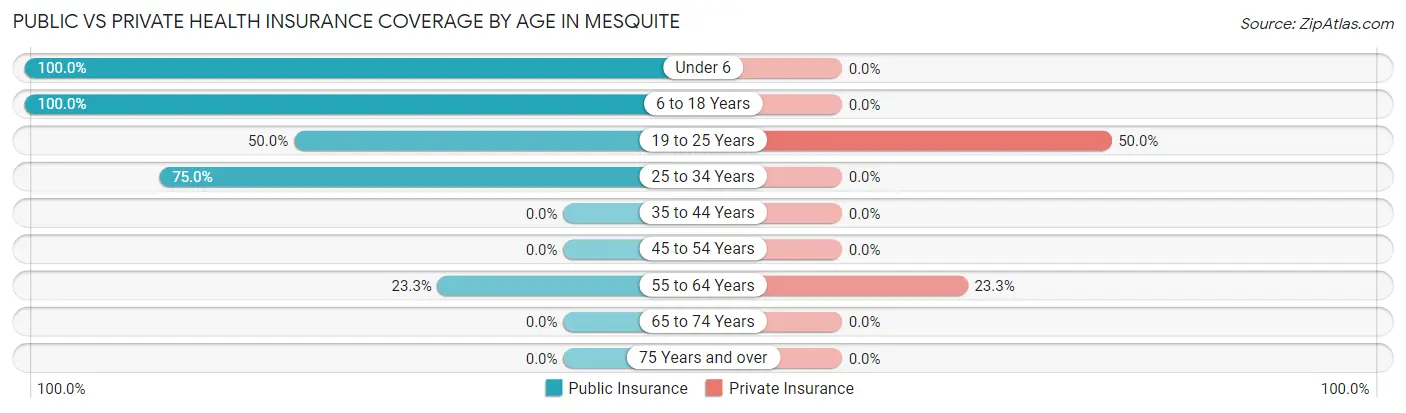
| Age Bracket | Public Insurance | Private Insurance |
| Under 6 | 22 (100.0%) | 0 (0.0%) |
| 6 to 18 Years | 24 (100.0%) | 0 (0.0%) |
| 19 to 25 Years | 18 (50.0%) | 18 (50.0%) |
| 25 to 34 Years | 18 (75.0%) | 0 (0.0%) |
| 35 to 44 Years | 0 (0.0%) | 0 (0.0%) |
| 45 to 54 Years | 0 (0.0%) | 0 (0.0%) |
| 55 to 64 Years | 7 (23.3%) | 7 (23.3%) |
| 65 to 74 Years | 0 (0.0%) | 0 (0.0%) |
| 75 Years and over | 0 (0.0%) | 0 (0.0%) |
| Total | 89 (61.4%) | 25 (17.2%) |
Disability Status by Sex by Age in Mesquite
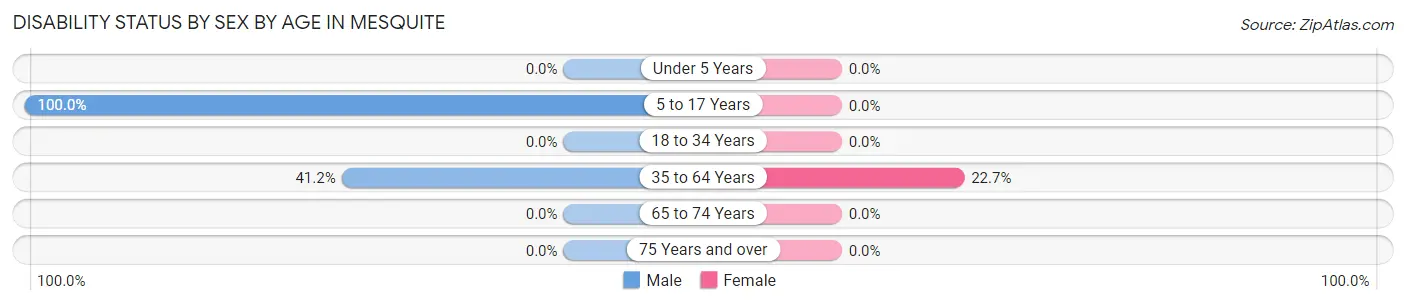
| Age Bracket | Male | Female |
| Under 5 Years | 0 (0.0%) | 0 (0.0%) |
| 5 to 17 Years | 24 (100.0%) | 0 (0.0%) |
| 18 to 34 Years | 0 (0.0%) | 0 (0.0%) |
| 35 to 64 Years | 7 (41.2%) | 5 (22.7%) |
| 65 to 74 Years | 0 (0.0%) | 0 (0.0%) |
| 75 Years and over | 0 (0.0%) | 0 (0.0%) |
Disability Class by Sex by Age in Mesquite
Disability Class: Hearing Difficulty
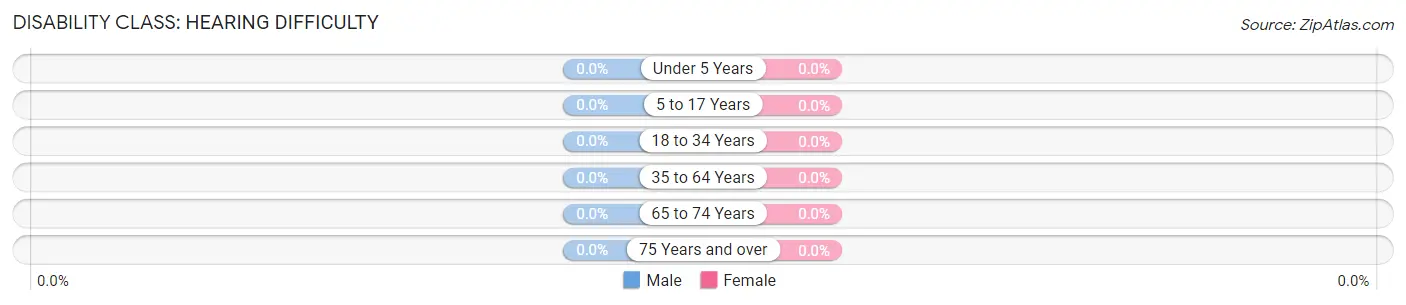
| Age Bracket | Male | Female |
| Under 5 Years | 0 (0.0%) | 0 (0.0%) |
| 5 to 17 Years | 0 (0.0%) | 0 (0.0%) |
| 18 to 34 Years | 0 (0.0%) | 0 (0.0%) |
| 35 to 64 Years | 0 (0.0%) | 0 (0.0%) |
| 65 to 74 Years | 0 (0.0%) | 0 (0.0%) |
| 75 Years and over | 0 (0.0%) | 0 (0.0%) |
Disability Class: Vision Difficulty
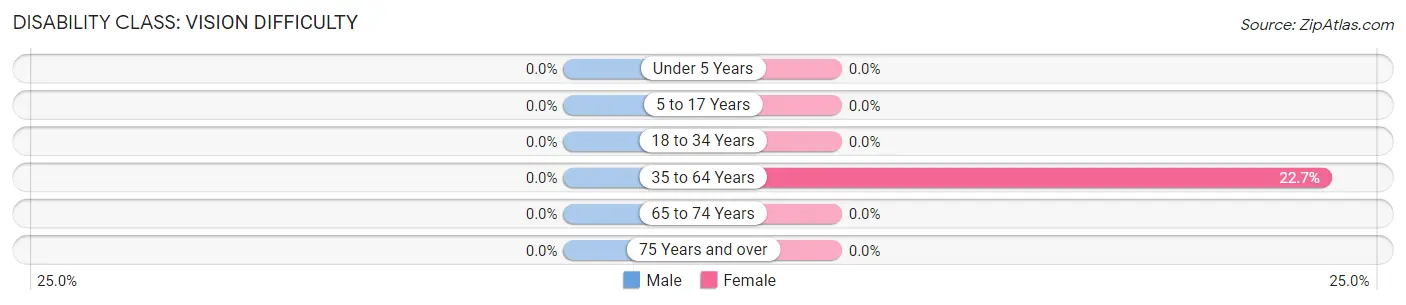
| Age Bracket | Male | Female |
| Under 5 Years | 0 (0.0%) | 0 (0.0%) |
| 5 to 17 Years | 0 (0.0%) | 0 (0.0%) |
| 18 to 34 Years | 0 (0.0%) | 0 (0.0%) |
| 35 to 64 Years | 0 (0.0%) | 5 (22.7%) |
| 65 to 74 Years | 0 (0.0%) | 0 (0.0%) |
| 75 Years and over | 0 (0.0%) | 0 (0.0%) |
Disability Class: Cognitive Difficulty
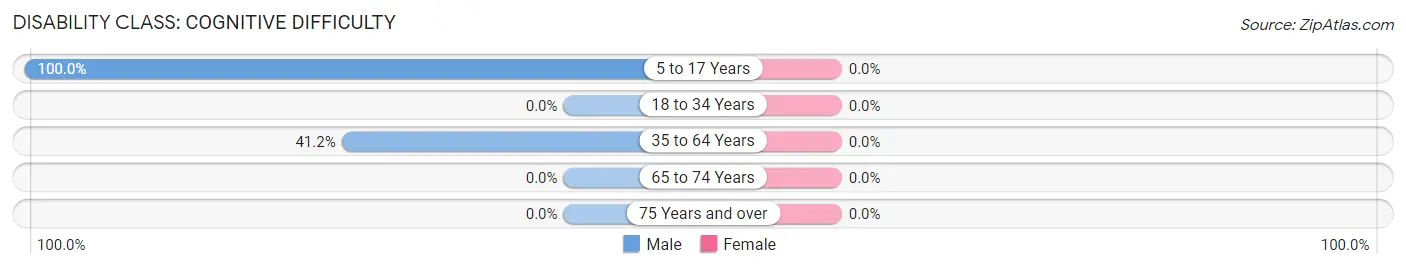
| Age Bracket | Male | Female |
| 5 to 17 Years | 24 (100.0%) | 0 (0.0%) |
| 18 to 34 Years | 0 (0.0%) | 0 (0.0%) |
| 35 to 64 Years | 7 (41.2%) | 0 (0.0%) |
| 65 to 74 Years | 0 (0.0%) | 0 (0.0%) |
| 75 Years and over | 0 (0.0%) | 0 (0.0%) |
Disability Class: Ambulatory Difficulty
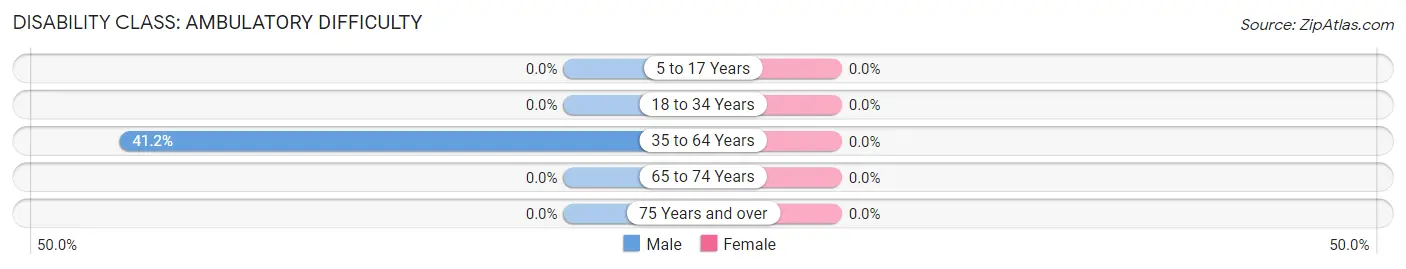
| Age Bracket | Male | Female |
| 5 to 17 Years | 0 (0.0%) | 0 (0.0%) |
| 18 to 34 Years | 0 (0.0%) | 0 (0.0%) |
| 35 to 64 Years | 7 (41.2%) | 0 (0.0%) |
| 65 to 74 Years | 0 (0.0%) | 0 (0.0%) |
| 75 Years and over | 0 (0.0%) | 0 (0.0%) |
Disability Class: Self-Care Difficulty
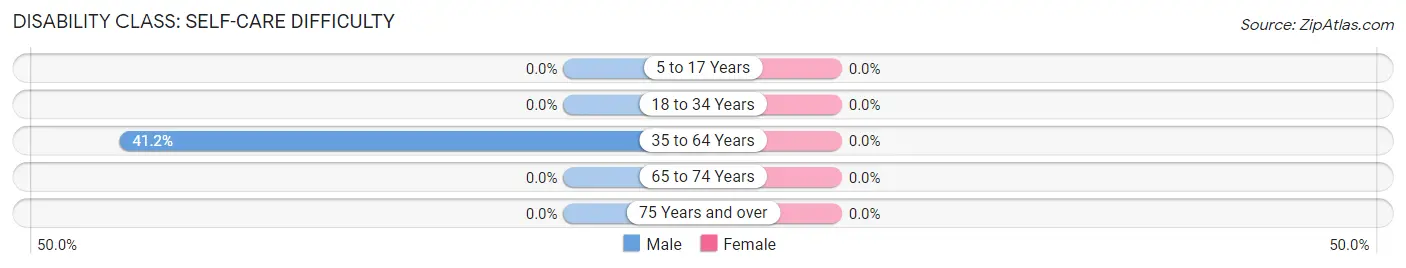
| Age Bracket | Male | Female |
| 5 to 17 Years | 0 (0.0%) | 0 (0.0%) |
| 18 to 34 Years | 0 (0.0%) | 0 (0.0%) |
| 35 to 64 Years | 7 (41.2%) | 0 (0.0%) |
| 65 to 74 Years | 0 (0.0%) | 0 (0.0%) |
| 75 Years and over | 0 (0.0%) | 0 (0.0%) |
Technology Access in Mesquite
Computing Device Access in Mesquite
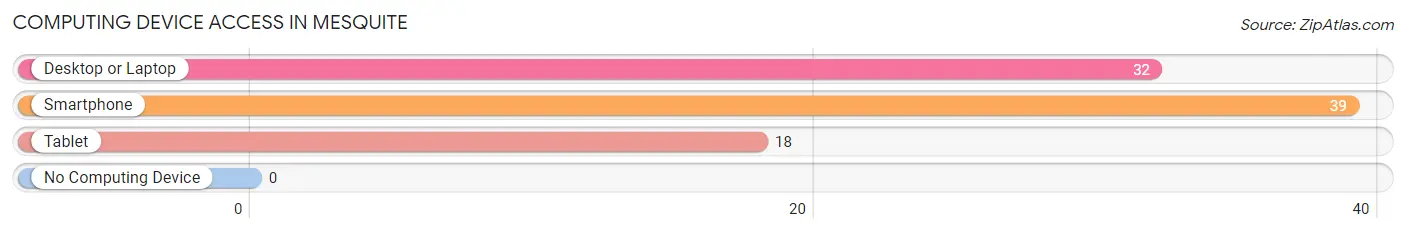
| Device Type | # Households | % Households |
| Desktop or Laptop | 32 | 82.1% |
| Smartphone | 39 | 100.0% |
| Tablet | 18 | 46.2% |
| No Computing Device | 0 | 0.0% |
| Total | 39 | 100.0% |
Internet Access in Mesquite
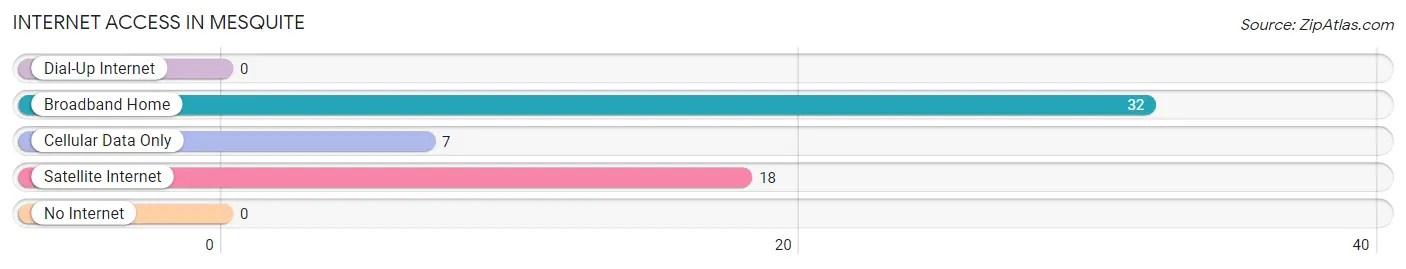
| Internet Type | # Households | % Households |
| Dial-Up Internet | 0 | 0.0% |
| Broadband Home | 32 | 82.1% |
| Cellular Data Only | 7 | 17.9% |
| Satellite Internet | 18 | 46.2% |
| No Internet | 0 | 0.0% |
| Total | 39 | 100.0% |
Mesquite Summary
Mesquite, Texas is a city located in Dallas County, Texas, United States. It is a suburb of Dallas and is part of the Dallas–Fort Worth metroplex. As of the 2010 census, the city had a population of 139,824, making it the eighteenth most populous city in the state of Texas.
History
Mesquite was founded in 1873 by John Henry Brown, a farmer from Tennessee. Brown named the city after Mesquite Creek, which ran through the area. The city was incorporated in 1887 and was the first city in Dallas County to incorporate.
In the early 1900s, Mesquite was a small farming community. The city experienced rapid growth in the 1950s and 1960s, as the population increased from 4,000 to over 100,000. This growth was due to the city's proximity to Dallas and the availability of affordable housing.
Geography
Mesquite is located in the eastern part of Dallas County, about 15 miles east of downtown Dallas. The city covers an area of 36.4 square miles and has an elevation of 545 feet. The city is bordered by Garland to the north, Sunnyvale to the east, Balch Springs to the south, and Dallas to the west.
The city is located in the Blackland Prairie region of Texas, which is characterized by flat terrain and fertile soil. The city is also located in the Trinity River watershed, which is the largest watershed in Texas.
Economy
Mesquite is a major economic center in the Dallas–Fort Worth metroplex. The city is home to several major employers, including Walmart, Home Depot, and AT&T. The city also has a large retail sector, with several shopping centers and malls.
The city is also home to several manufacturing companies, including a large Pepsi bottling plant. The city is also home to a large number of restaurants, bars, and other entertainment venues.
Demographics
As of the 2010 census, the population of Mesquite was 139,824. The racial makeup of the city was 57.2% White, 24.7% African American, 0.7% Native American, 2.3% Asian, 0.1% Pacific Islander, 11.7% from other races, and 3.1% from two or more races. Hispanic or Latino of any race were 28.2% of the population.
The median household income in Mesquite was $45,945, and the median family income was $51,914. The per capita income was $20,945. About 17.2% of the population was below the poverty line.
Mesquite is a diverse city, with a variety of cultures and backgrounds represented. The city is home to a large number of churches, representing a variety of denominations. The city also has a large number of parks and recreational facilities.
Common Questions
What is Per Capita Income in Mesquite?
Per Capita income in Mesquite is $14,949.
What is Income or Wage Gap in Mesquite?
Income or Wage Gap in Mesquite is 27.2%.
Women in Mesquite earn 72.8 cents for every dollar earned by a man.
What is Inequality or Gini Index in Mesquite?
Inequality or Gini Index in Mesquite is 0.31.
What is the Total Population of Mesquite?
Total Population of Mesquite is 145.
What is the Total Male Population of Mesquite?
Total Male Population of Mesquite is 77.
What is the Total Female Population of Mesquite?
Total Female Population of Mesquite is 68.
What is the Ratio of Males per 100 Females in Mesquite?
There are 113.24 Males per 100 Females in Mesquite.
What is the Ratio of Females per 100 Males in Mesquite?
There are 88.31 Females per 100 Males in Mesquite.
What is the Median Population Age in Mesquite?
Median Population Age in Mesquite is 25.5 Years.
What is the Average Family Size in Mesquite
Average Family Size in Mesquite is 3.5 People.
What is the Average Household Size in Mesquite
Average Household Size in Mesquite is 3.7 People.
How Large is the Labor Force in Mesquite?
There are 79 People in the Labor Forcein in Mesquite.
What is the Percentage of People in the Labor Force in Mesquite?
79.8% of People are in the Labor Force in Mesquite.
What is the Unemployment Rate in Mesquite?
Unemployment Rate in Mesquite is 22.8%.