Merkel, TX Map & Demographics
Merkel Map
Merkel Overview
$27,356
PER CAPITA INCOME
$78,784
AVG FAMILY INCOME
$67,159
AVG HOUSEHOLD INCOME
43.2%
WAGE / INCOME GAP [ % ]
56.8¢/ $1
WAGE / INCOME GAP [ $ ]
$8,366
FAMILY INCOME DEFICIT
0.41
INEQUALITY / GINI INDEX
2,646
TOTAL POPULATION
1,181
MALE POPULATION
1,465
FEMALE POPULATION
80.61
MALES / 100 FEMALES
124.05
FEMALES / 100 MALES
31.7
MEDIAN AGE
3.5
AVG FAMILY SIZE
2.9
AVG HOUSEHOLD SIZE
1,264
LABOR FORCE [ PEOPLE ]
67.1%
PERCENT IN LABOR FORCE
1.9%
UNEMPLOYMENT RATE
Merkel Zip Codes
Merkel Area Codes
Income in Merkel
Income Overview in Merkel
Per Capita Income in Merkel is $27,356, while median incomes of families and households are $78,784 and $67,159 respectively.
| Characteristic | Number | Measure |
| Per Capita Income | 2,646 | $27,356 |
| Median Family Income | 670 | $78,784 |
| Mean Family Income | 670 | $86,004 |
| Median Household Income | 893 | $67,159 |
| Mean Household Income | 893 | $76,642 |
| Income Deficit | 670 | $8,366 |
| Wage / Income Gap (%) | 2,646 | 43.25% |
| Wage / Income Gap ($) | 2,646 | 56.75¢ per $1 |
| Gini / Inequality Index | 2,646 | 0.41 |
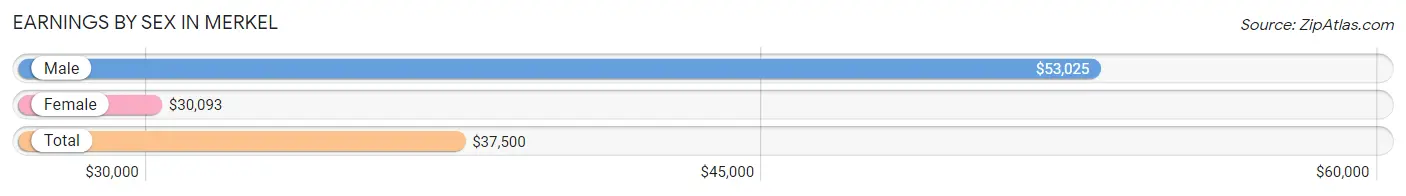
Earnings by Sex in Merkel
Average Earnings in Merkel are $37,500, $53,025 for men and $30,093 for women, a difference of 43.2%.
| Sex | Number | Average Earnings |
| Male | 666 (50.6%) | $53,025 |
| Female | 650 (49.4%) | $30,093 |
| Total | 1,316 (100.0%) | $37,500 |
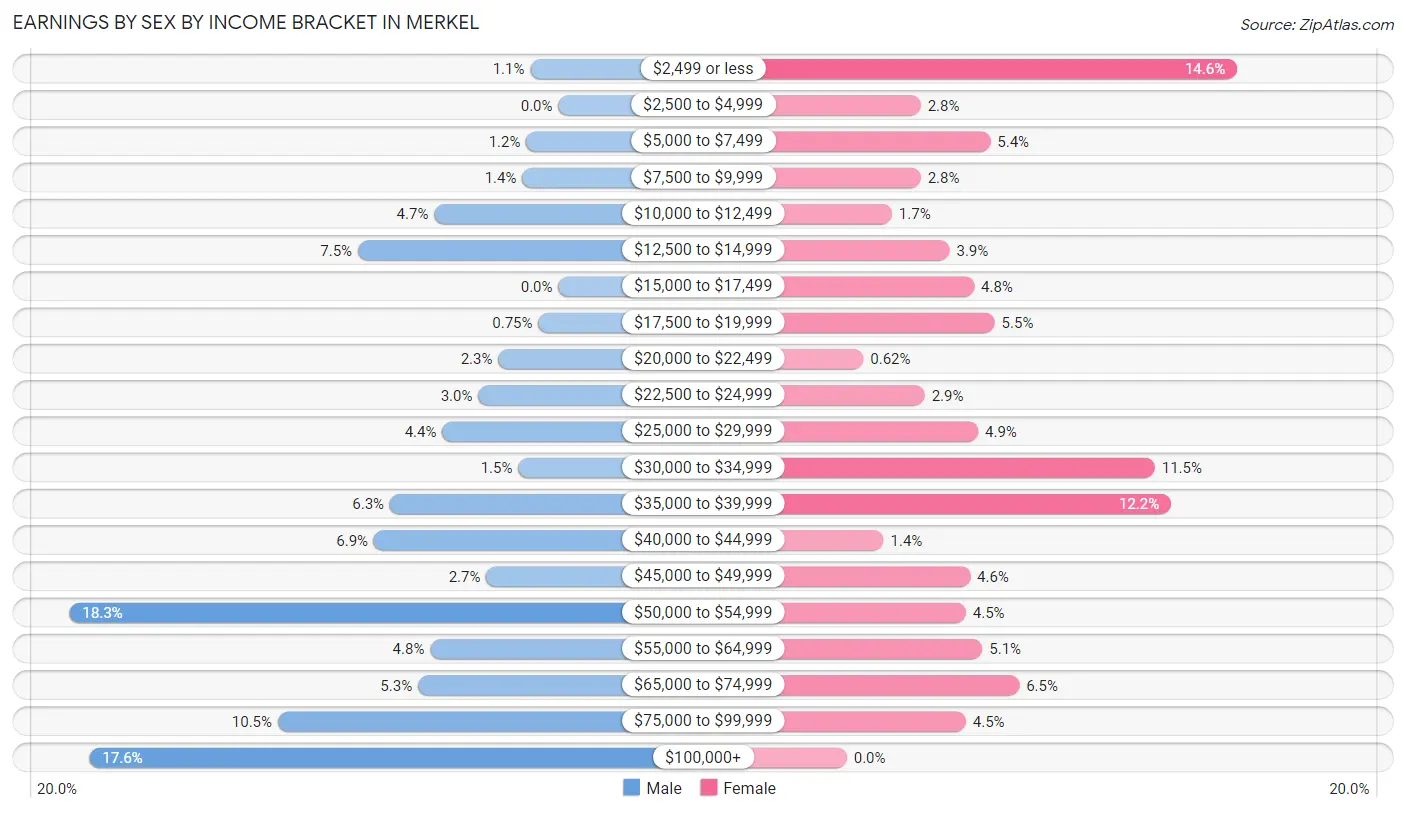
Earnings by Sex by Income Bracket in Merkel
The most common earnings brackets in Merkel are $50,000 to $54,999 for men (122 | 18.3%) and $2,499 or less for women (95 | 14.6%).
| Income | Male | Female |
| $2,499 or less | 7 (1.1%) | 95 (14.6%) |
| $2,500 to $4,999 | 0 (0.0%) | 18 (2.8%) |
| $5,000 to $7,499 | 8 (1.2%) | 35 (5.4%) |
| $7,500 to $9,999 | 9 (1.3%) | 18 (2.8%) |
| $10,000 to $12,499 | 31 (4.6%) | 11 (1.7%) |
| $12,500 to $14,999 | 50 (7.5%) | 25 (3.8%) |
| $15,000 to $17,499 | 0 (0.0%) | 31 (4.8%) |
| $17,500 to $19,999 | 5 (0.7%) | 36 (5.5%) |
| $20,000 to $22,499 | 15 (2.2%) | 4 (0.6%) |
| $22,500 to $24,999 | 20 (3.0%) | 19 (2.9%) |
| $25,000 to $29,999 | 29 (4.3%) | 32 (4.9%) |
| $30,000 to $34,999 | 10 (1.5%) | 75 (11.5%) |
| $35,000 to $39,999 | 42 (6.3%) | 79 (12.1%) |
| $40,000 to $44,999 | 46 (6.9%) | 9 (1.4%) |
| $45,000 to $49,999 | 18 (2.7%) | 30 (4.6%) |
| $50,000 to $54,999 | 122 (18.3%) | 29 (4.5%) |
| $55,000 to $64,999 | 32 (4.8%) | 33 (5.1%) |
| $65,000 to $74,999 | 35 (5.3%) | 42 (6.5%) |
| $75,000 to $99,999 | 70 (10.5%) | 29 (4.5%) |
| $100,000+ | 117 (17.6%) | 0 (0.0%) |
| Total | 666 (100.0%) | 650 (100.0%) |
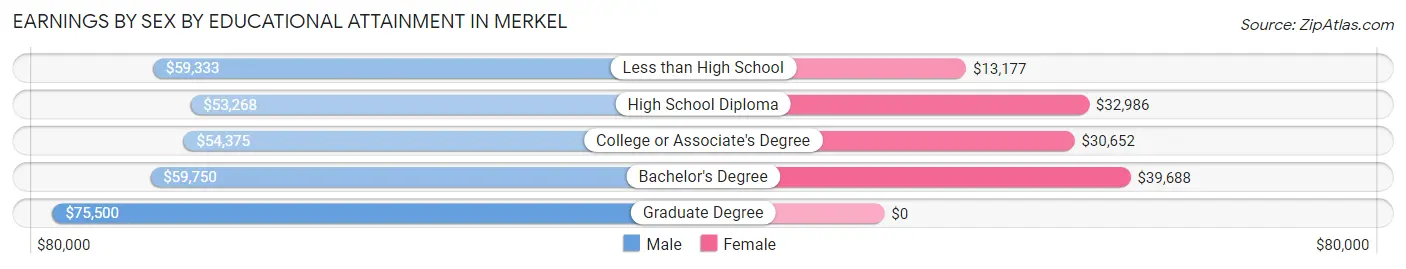
Earnings by Sex by Educational Attainment in Merkel
Average earnings in Merkel are $54,250 for men and $32,037 for women, a difference of 40.9%. Men with an educational attainment of graduate degree enjoy the highest average annual earnings of $75,500, while those with high school diploma education earn the least with $53,268. Women with an educational attainment of bachelor's degree earn the most with the average annual earnings of $39,688, while those with less than high school education have the smallest earnings of $13,177.
| Educational Attainment | Male Income | Female Income |
| Less than High School | $59,333 | $13,177 |
| High School Diploma | $53,268 | $32,986 |
| College or Associate's Degree | $54,375 | $30,652 |
| Bachelor's Degree | $59,750 | $39,688 |
| Graduate Degree | $75,500 | $0 |
| Total | $54,250 | $32,037 |
Family Income in Merkel
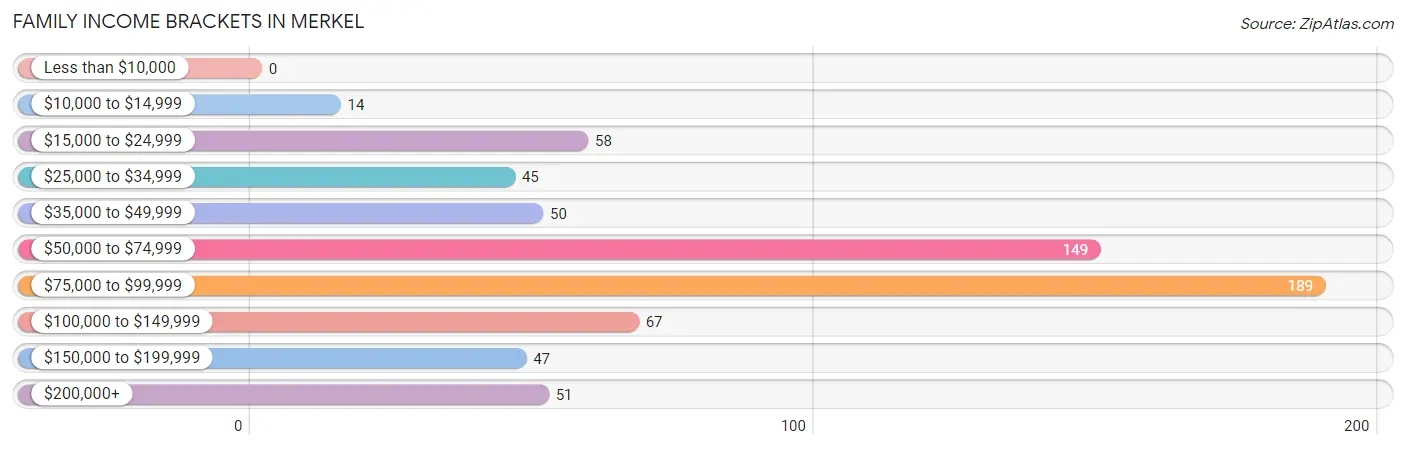
Family Income Brackets in Merkel
According to the Merkel family income data, there are 189 families falling into the $75,000 to $99,999 income range, which is the most common income bracket and makes up 28.2% of all families.
| Income Bracket | # Families | % Families |
| Less than $10,000 | 0 | 0.0% |
| $10,000 to $14,999 | 14 | 2.1% |
| $15,000 to $24,999 | 58 | 8.7% |
| $25,000 to $34,999 | 45 | 6.7% |
| $35,000 to $49,999 | 50 | 7.5% |
| $50,000 to $74,999 | 149 | 22.2% |
| $75,000 to $99,999 | 189 | 28.2% |
| $100,000 to $149,999 | 67 | 10.0% |
| $150,000 to $199,999 | 47 | 7.0% |
| $200,000+ | 51 | 7.6% |
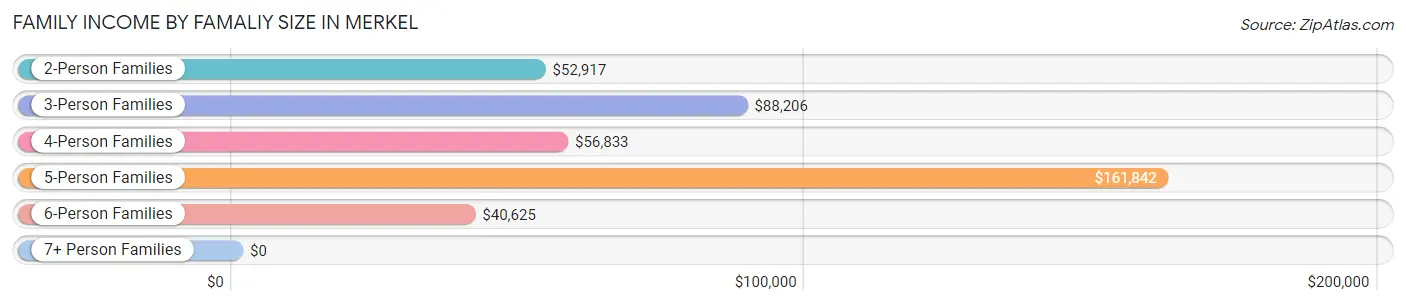
Family Income by Famaliy Size in Merkel
5-person families (94 | 14.0%) account for the highest median family income in Merkel with $161,842 per family, while 5-person families (94 | 14.0%) have the highest median income of $32,368 per family member.
| Income Bracket | # Families | Median Income |
| 2-Person Families | 197 (29.4%) | $52,917 |
| 3-Person Families | 205 (30.6%) | $88,206 |
| 4-Person Families | 148 (22.1%) | $56,833 |
| 5-Person Families | 94 (14.0%) | $161,842 |
| 6-Person Families | 26 (3.9%) | $40,625 |
| 7+ Person Families | 0 (0.0%) | $0 |
| Total | 670 (100.0%) | $78,784 |
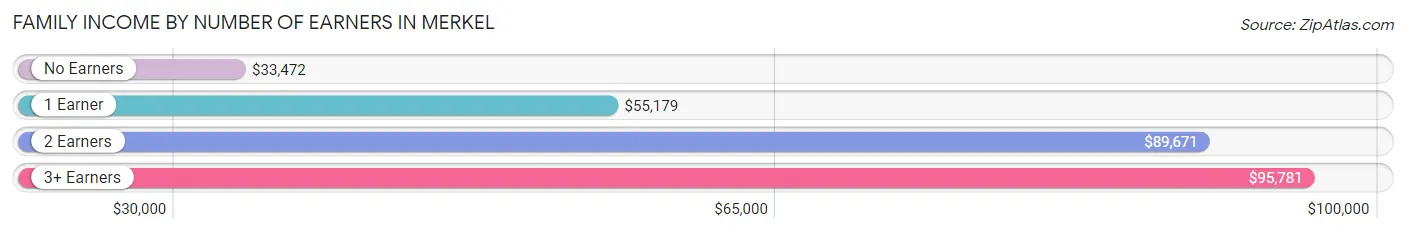
Family Income by Number of Earners in Merkel
The median family income in Merkel is $78,784, with families comprising 3+ earners (137) having the highest median family income of $95,781, while families with no earners (51) have the lowest median family income of $33,472, accounting for 20.4% and 7.6% of families, respectively.
| Number of Earners | # Families | Median Income |
| No Earners | 51 (7.6%) | $33,472 |
| 1 Earner | 243 (36.3%) | $55,179 |
| 2 Earners | 239 (35.7%) | $89,671 |
| 3+ Earners | 137 (20.4%) | $95,781 |
| Total | 670 (100.0%) | $78,784 |
Household Income in Merkel
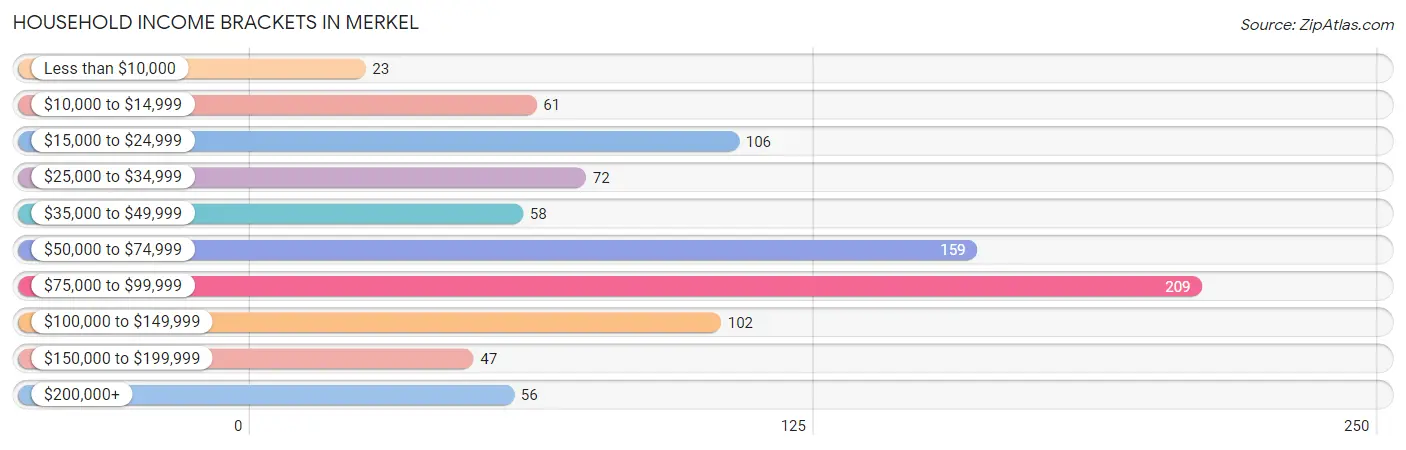
Household Income Brackets in Merkel
With 209 households falling in the category, the $75,000 to $99,999 income range is the most frequent in Merkel, accounting for 23.4% of all households. In contrast, only 23 households (2.6%) fall into the less than $10,000 income bracket, making it the least populous group.
| Income Bracket | # Households | % Households |
| Less than $10,000 | 23 | 2.6% |
| $10,000 to $14,999 | 61 | 6.8% |
| $15,000 to $24,999 | 106 | 11.9% |
| $25,000 to $34,999 | 72 | 8.1% |
| $35,000 to $49,999 | 58 | 6.5% |
| $50,000 to $74,999 | 159 | 17.8% |
| $75,000 to $99,999 | 209 | 23.4% |
| $100,000 to $149,999 | 102 | 11.4% |
| $150,000 to $199,999 | 47 | 5.3% |
| $200,000+ | 56 | 6.3% |
Household Income by Householder Age in Merkel
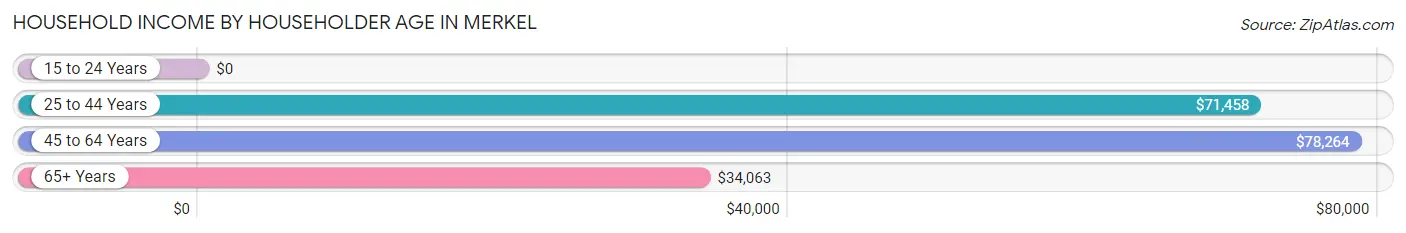
The median household income in Merkel is $67,159, with the highest median household income of $78,264 found in the 45 to 64 years age bracket for the primary householder. A total of 347 households (38.9%) fall into this category. Meanwhile, the 15 to 24 years age bracket for the primary householder has the lowest median household income of $0, with 28 households (3.1%) in this group.
| Income Bracket | # Households | Median Income |
| 15 to 24 Years | 28 (3.1%) | $0 |
| 25 to 44 Years | 321 (35.9%) | $71,458 |
| 45 to 64 Years | 347 (38.9%) | $78,264 |
| 65+ Years | 197 (22.1%) | $34,063 |
| Total | 893 (100.0%) | $67,159 |
Poverty in Merkel
Income Below Poverty by Sex and Age in Merkel
With 12.0% poverty level for males and 17.4% for females among the residents of Merkel, 12 to 14 year old males and 5 year old females are the most vulnerable to poverty, with 22 males (41.5%) and 14 females (66.7%) in their respective age groups living below the poverty level.
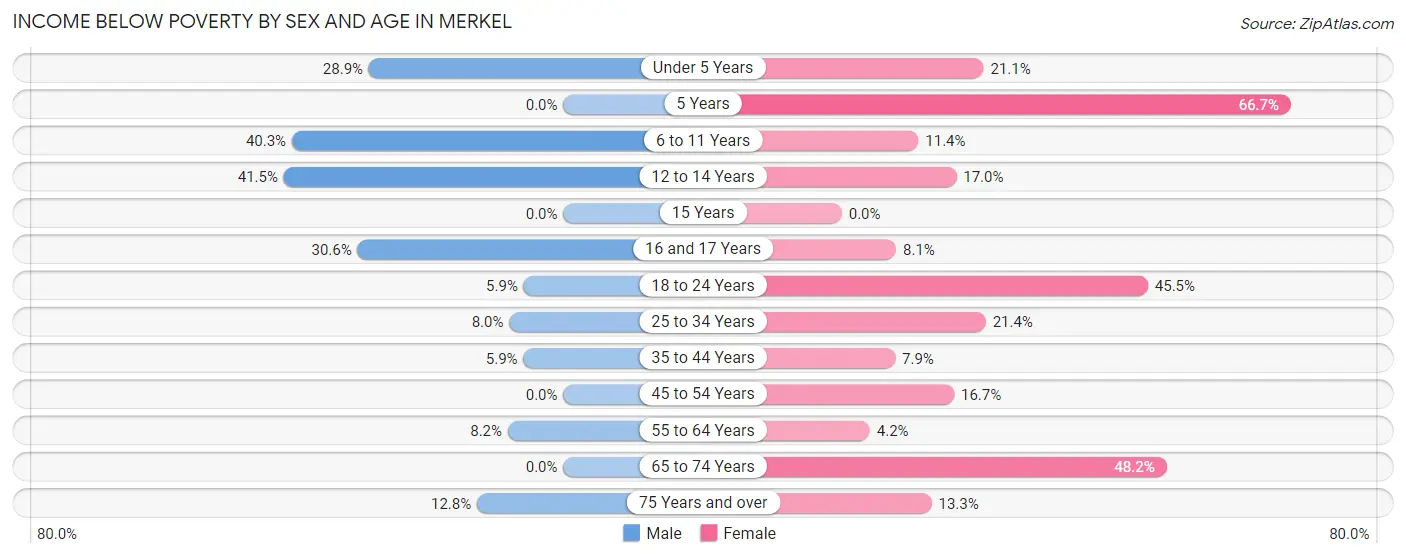
| Age Bracket | Male | Female |
| Under 5 Years | 28 (28.9%) | 28 (21.0%) |
| 5 Years | 0 (0.0%) | 14 (66.7%) |
| 6 to 11 Years | 27 (40.3%) | 24 (11.4%) |
| 12 to 14 Years | 22 (41.5%) | 17 (17.0%) |
| 15 Years | 0 (0.0%) | 0 (0.0%) |
| 16 and 17 Years | 22 (30.6%) | 5 (8.1%) |
| 18 to 24 Years | 6 (5.9%) | 5 (45.5%) |
| 25 to 34 Years | 15 (8.0%) | 50 (21.4%) |
| 35 to 44 Years | 8 (5.9%) | 17 (7.9%) |
| 45 to 54 Years | 0 (0.0%) | 23 (16.7%) |
| 55 to 64 Years | 7 (8.2%) | 5 (4.2%) |
| 65 to 74 Years | 0 (0.0%) | 54 (48.2%) |
| 75 Years and over | 5 (12.8%) | 6 (13.3%) |
| Total | 140 (12.0%) | 248 (17.4%) |
Income Above Poverty by Sex and Age in Merkel
According to the poverty statistics in Merkel, males aged 5 years and females aged 15 years are the age groups that are most secure financially, with 100.0% of males and 100.0% of females in these age groups living above the poverty line.
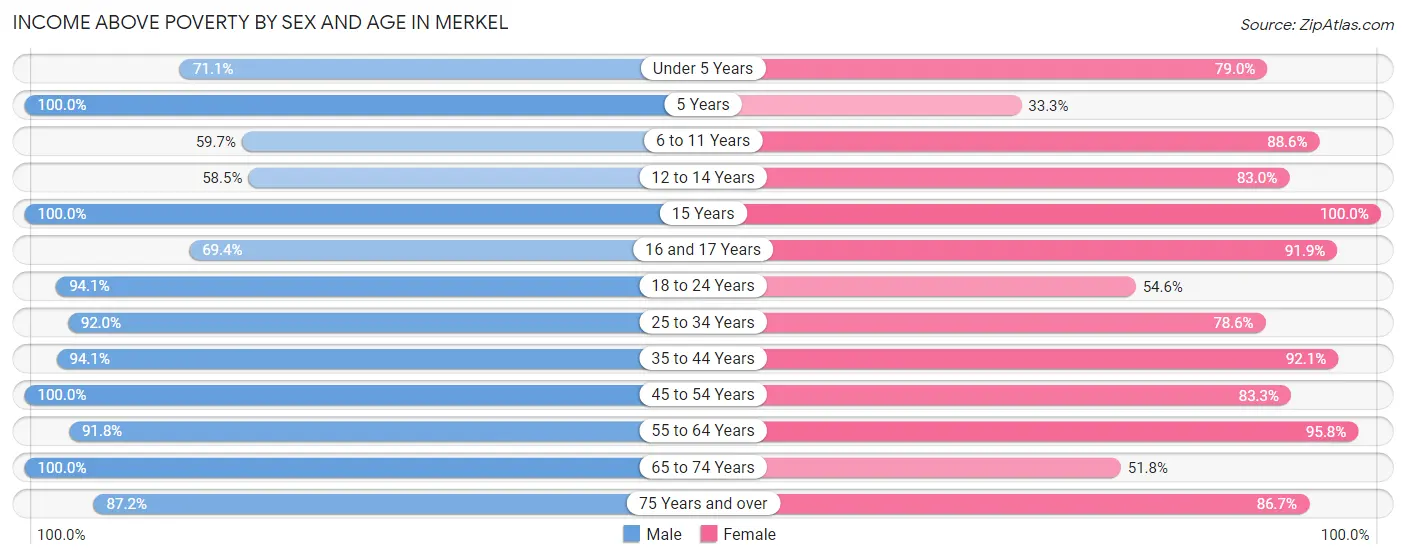
| Age Bracket | Male | Female |
| Under 5 Years | 69 (71.1%) | 105 (78.9%) |
| 5 Years | 49 (100.0%) | 7 (33.3%) |
| 6 to 11 Years | 40 (59.7%) | 187 (88.6%) |
| 12 to 14 Years | 31 (58.5%) | 83 (83.0%) |
| 15 Years | 10 (100.0%) | 21 (100.0%) |
| 16 and 17 Years | 50 (69.4%) | 57 (91.9%) |
| 18 to 24 Years | 96 (94.1%) | 6 (54.5%) |
| 25 to 34 Years | 172 (92.0%) | 184 (78.6%) |
| 35 to 44 Years | 127 (94.1%) | 198 (92.1%) |
| 45 to 54 Years | 187 (100.0%) | 115 (83.3%) |
| 55 to 64 Years | 78 (91.8%) | 115 (95.8%) |
| 65 to 74 Years | 81 (100.0%) | 58 (51.8%) |
| 75 Years and over | 34 (87.2%) | 39 (86.7%) |
| Total | 1,024 (88.0%) | 1,175 (82.6%) |
Income Below Poverty Among Married-Couple Families in Merkel
The poverty statistics for married-couple families in Merkel show that 7.8% or 38 of the total 490 families live below the poverty line. Families with 1 or 2 children have the highest poverty rate of 13.1%, comprising of 26 families. On the other hand, families with no children have the lowest poverty rate of 1.1%, which includes 2 families.
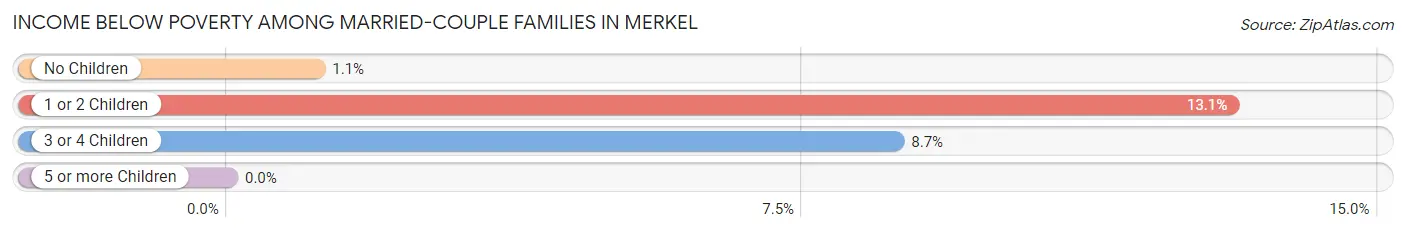
| Children | Above Poverty | Below Poverty |
| No Children | 174 (98.9%) | 2 (1.1%) |
| 1 or 2 Children | 173 (86.9%) | 26 (13.1%) |
| 3 or 4 Children | 105 (91.3%) | 10 (8.7%) |
| 5 or more Children | 0 (0.0%) | 0 (0.0%) |
| Total | 452 (92.2%) | 38 (7.8%) |
Income Below Poverty Among Single-Parent Households in Merkel
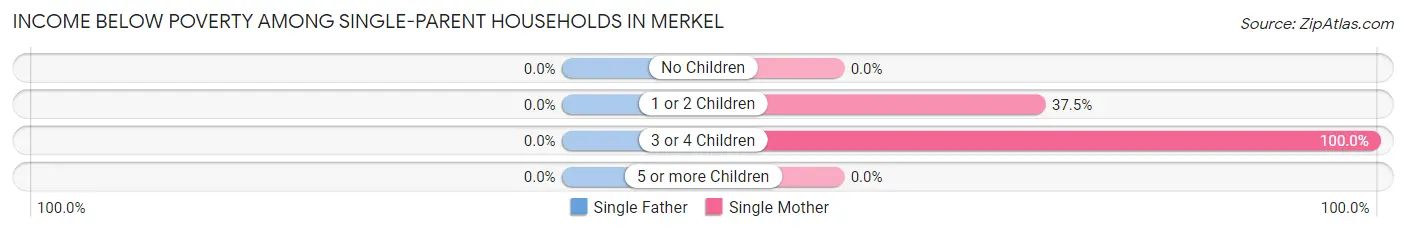
| Children | Single Father | Single Mother |
| No Children | 0 (0.0%) | 0 (0.0%) |
| 1 or 2 Children | 0 (0.0%) | 24 (37.5%) |
| 3 or 4 Children | 0 (0.0%) | 20 (100.0%) |
| 5 or more Children | 0 (0.0%) | 0 (0.0%) |
| Total | 0 (0.0%) | 44 (31.9%) |
Income Below Poverty Among Married-Couple vs Single-Parent Households in Merkel
The poverty data for Merkel shows that 38 of the married-couple family households (7.8%) and 44 of the single-parent households (24.4%) are living below the poverty level. Within the married-couple family households, those with 1 or 2 children have the highest poverty rate, with 26 households (13.1%) falling below the poverty line. Among the single-parent households, those with 3 or 4 children have the highest poverty rate, with 20 household (50.0%) living below poverty.
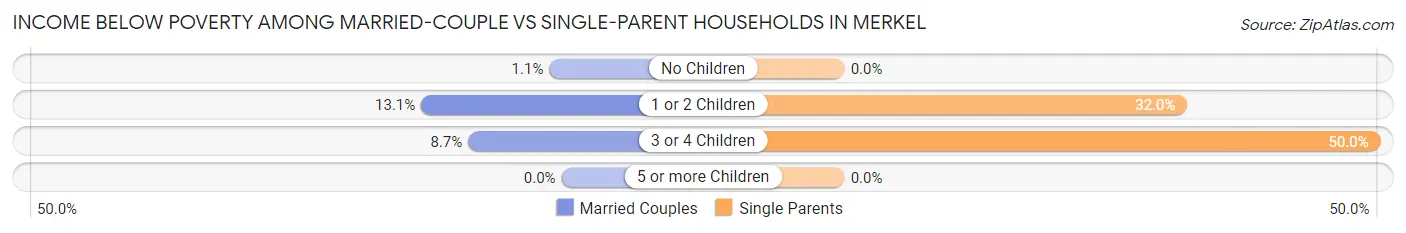
| Children | Married-Couple Families | Single-Parent Households |
| No Children | 2 (1.1%) | 0 (0.0%) |
| 1 or 2 Children | 26 (13.1%) | 24 (32.0%) |
| 3 or 4 Children | 10 (8.7%) | 20 (50.0%) |
| 5 or more Children | 0 (0.0%) | 0 (0.0%) |
| Total | 38 (7.8%) | 44 (24.4%) |
Race in Merkel
The most populous races in Merkel are White / Caucasian (2,191 | 82.8%), Hispanic or Latino (598 | 22.6%), and Two or more Races (236 | 8.9%).
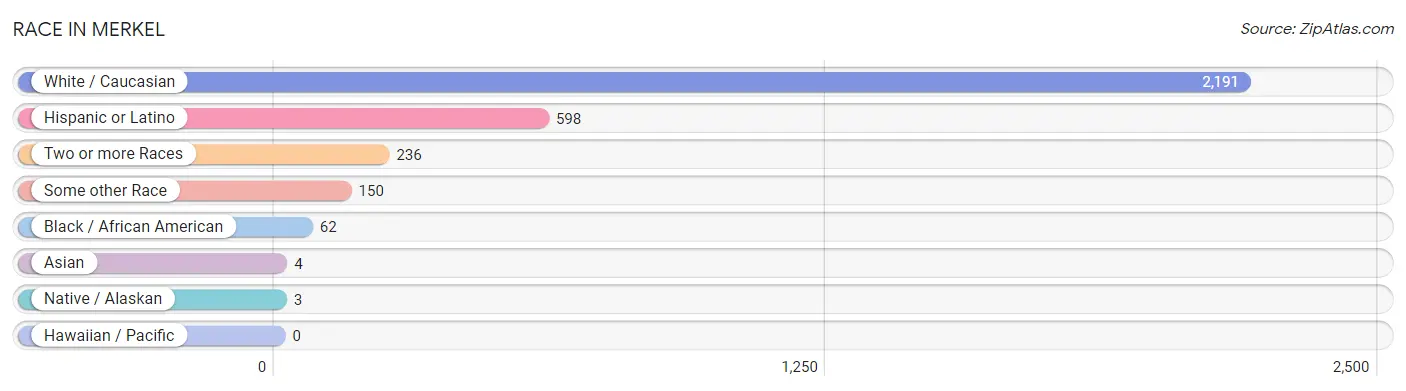
| Race | # Population | % Population |
| Asian | 4 | 0.2% |
| Black / African American | 62 | 2.3% |
| Hawaiian / Pacific | 0 | 0.0% |
| Hispanic or Latino | 598 | 22.6% |
| Native / Alaskan | 3 | 0.1% |
| White / Caucasian | 2,191 | 82.8% |
| Two or more Races | 236 | 8.9% |
| Some other Race | 150 | 5.7% |
| Total | 2,646 | 100.0% |
Ancestry in Merkel
The most populous ancestries reported in Merkel are Mexican (449 | 17.0%), Irish (307 | 11.6%), English (265 | 10.0%), German (242 | 9.1%), and American (180 | 6.8%), together accounting for 54.5% of all Merkel residents.
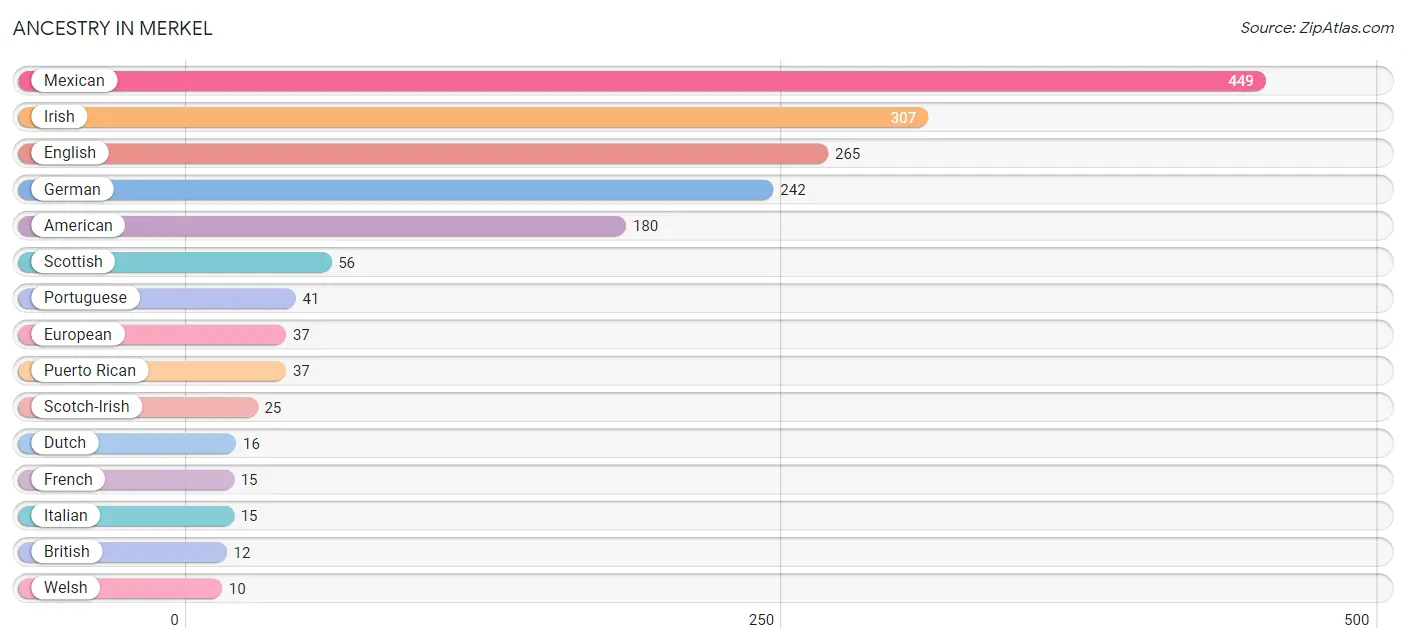
| Ancestry | # Population | % Population |
| American | 180 | 6.8% |
| Blackfeet | 3 | 0.1% |
| British | 12 | 0.4% |
| Cherokee | 2 | 0.1% |
| Comanche | 4 | 0.2% |
| Cuban | 5 | 0.2% |
| Czech | 7 | 0.3% |
| Czechoslovakian | 3 | 0.1% |
| Dutch | 16 | 0.6% |
| English | 265 | 10.0% |
| European | 37 | 1.4% |
| French | 15 | 0.6% |
| German | 242 | 9.1% |
| Irish | 307 | 11.6% |
| Israeli | 4 | 0.2% |
| Italian | 15 | 0.6% |
| Korean | 4 | 0.2% |
| Mexican | 449 | 17.0% |
| Portuguese | 41 | 1.5% |
| Puerto Rican | 37 | 1.4% |
| Scotch-Irish | 25 | 0.9% |
| Scottish | 56 | 2.1% |
| Swedish | 4 | 0.2% |
| Welsh | 10 | 0.4% | View All 24 Rows |
Immigrants in Merkel
The most numerous immigrant groups reported in Merkel came from Central America (106 | 4.0%), Latin America (106 | 4.0%), Mexico (106 | 4.0%), and Canada (4 | 0.2%), together accounting for 12.2% of all Merkel residents.
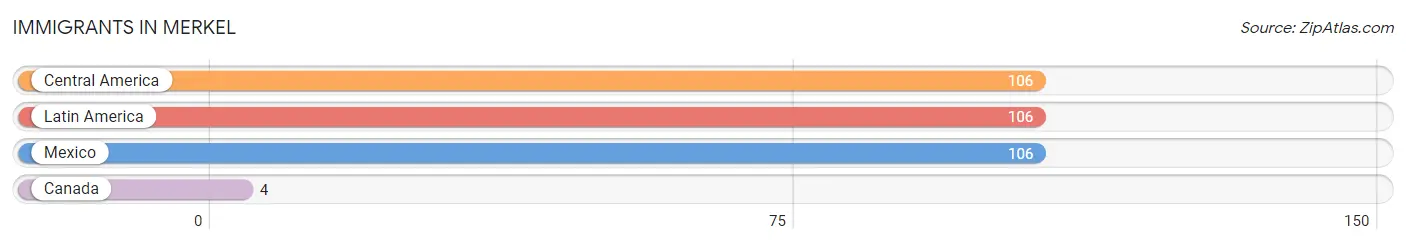
| Immigration Origin | # Population | % Population |
| Canada | 4 | 0.2% |
| Central America | 106 | 4.0% |
| Latin America | 106 | 4.0% |
| Mexico | 106 | 4.0% | View All 4 Rows |
Sex and Age in Merkel
Sex and Age in Merkel
The most populous age groups in Merkel are 30 to 34 Years (135 | 11.4%) for men and 10 to 14 Years (216 | 14.7%) for women.
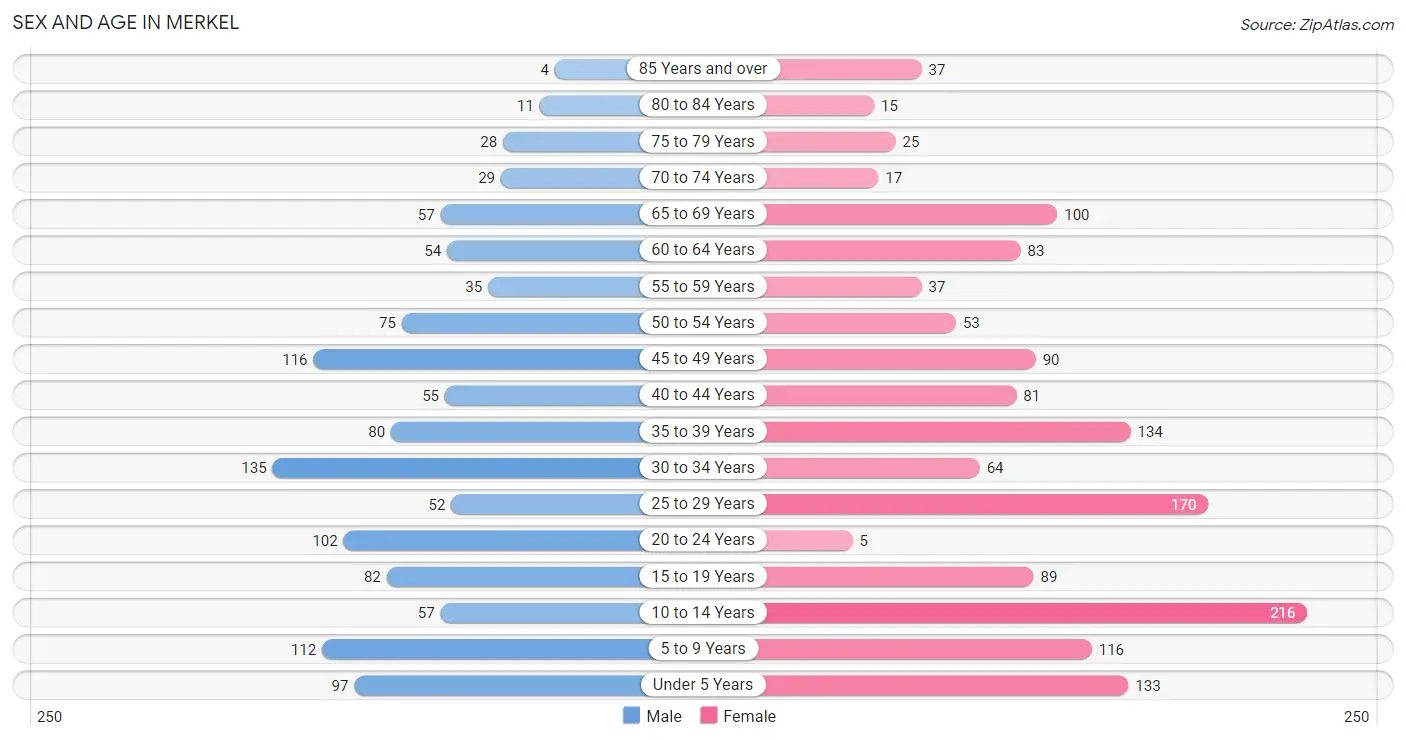
| Age Bracket | Male | Female |
| Under 5 Years | 97 (8.2%) | 133 (9.1%) |
| 5 to 9 Years | 112 (9.5%) | 116 (7.9%) |
| 10 to 14 Years | 57 (4.8%) | 216 (14.7%) |
| 15 to 19 Years | 82 (6.9%) | 89 (6.1%) |
| 20 to 24 Years | 102 (8.6%) | 5 (0.3%) |
| 25 to 29 Years | 52 (4.4%) | 170 (11.6%) |
| 30 to 34 Years | 135 (11.4%) | 64 (4.4%) |
| 35 to 39 Years | 80 (6.8%) | 134 (9.1%) |
| 40 to 44 Years | 55 (4.7%) | 81 (5.5%) |
| 45 to 49 Years | 116 (9.8%) | 90 (6.1%) |
| 50 to 54 Years | 75 (6.4%) | 53 (3.6%) |
| 55 to 59 Years | 35 (3.0%) | 37 (2.5%) |
| 60 to 64 Years | 54 (4.6%) | 83 (5.7%) |
| 65 to 69 Years | 57 (4.8%) | 100 (6.8%) |
| 70 to 74 Years | 29 (2.5%) | 17 (1.2%) |
| 75 to 79 Years | 28 (2.4%) | 25 (1.7%) |
| 80 to 84 Years | 11 (0.9%) | 15 (1.0%) |
| 85 Years and over | 4 (0.3%) | 37 (2.5%) |
| Total | 1,181 (100.0%) | 1,465 (100.0%) |
Families and Households in Merkel
Median Family Size in Merkel
The median family size in Merkel is 3.45 persons per family, with married-couple families (490 | 73.1%) accounting for the largest median family size of 3.65 persons per family. On the other hand, single female/mother families (138 | 20.6%) represent the smallest median family size with 2.88 persons per family.
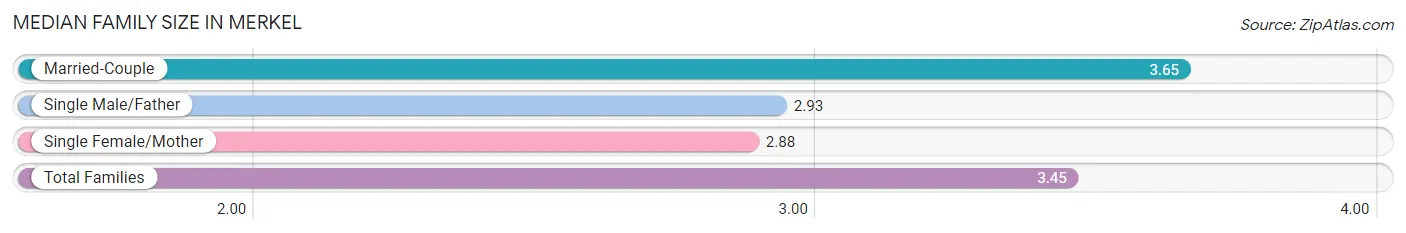
| Family Type | # Families | Family Size |
| Married-Couple | 490 (73.1%) | 3.65 |
| Single Male/Father | 42 (6.3%) | 2.93 |
| Single Female/Mother | 138 (20.6%) | 2.88 |
| Total Families | 670 (100.0%) | 3.45 |
Median Household Size in Merkel
The median household size in Merkel is 2.90 persons per household, with married-couple households (490 | 54.9%) accounting for the largest median household size of 3.66 persons per household. non-family households (223 | 25.0%) represent the smallest median household size with 1.18 persons per household.
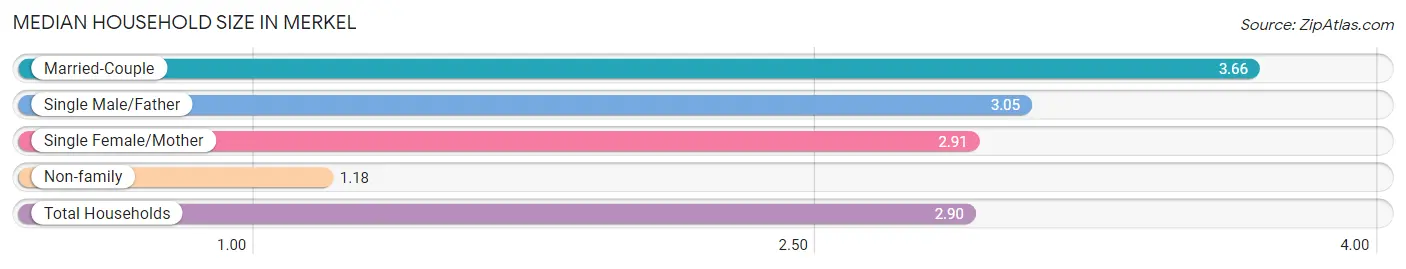
| Household Type | # Households | Household Size |
| Married-Couple | 490 (54.9%) | 3.66 |
| Single Male/Father | 42 (4.7%) | 3.05 |
| Single Female/Mother | 138 (15.4%) | 2.91 |
| Non-family | 223 (25.0%) | 1.18 |
| Total Households | 893 (100.0%) | 2.90 |
Household Size by Marriage Status in Merkel
Out of a total of 893 households in Merkel, 670 (75.0%) are family households, while 223 (25.0%) are nonfamily households. The most numerous type of family households are 3-person households, comprising 209, and the most common type of nonfamily households are 1-person households, comprising 190.
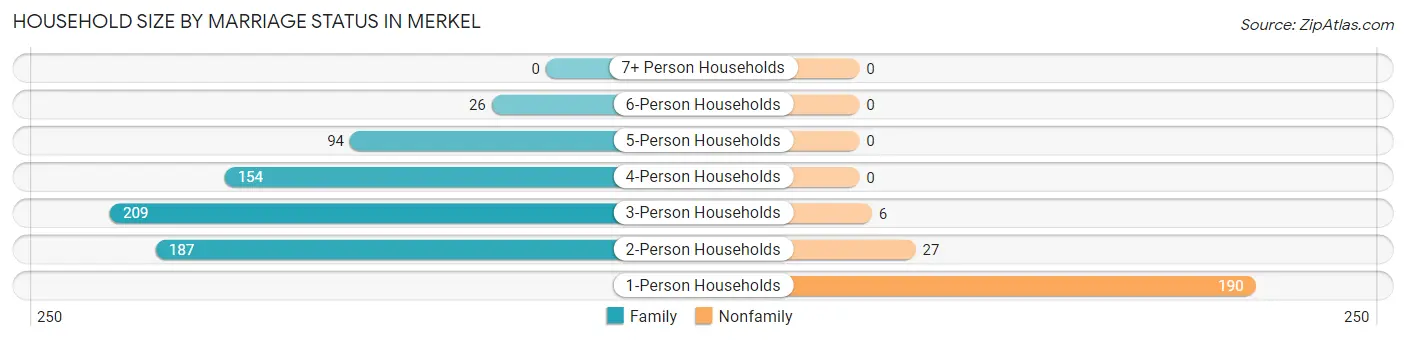
| Household Size | Family Households | Nonfamily Households |
| 1-Person Households | - | 190 (21.3%) |
| 2-Person Households | 187 (20.9%) | 27 (3.0%) |
| 3-Person Households | 209 (23.4%) | 6 (0.7%) |
| 4-Person Households | 154 (17.2%) | 0 (0.0%) |
| 5-Person Households | 94 (10.5%) | 0 (0.0%) |
| 6-Person Households | 26 (2.9%) | 0 (0.0%) |
| 7+ Person Households | 0 (0.0%) | 0 (0.0%) |
| Total | 670 (75.0%) | 223 (25.0%) |
Female Fertility in Merkel
Fertility by Age in Merkel
Average fertility rate in Merkel is 64.0 births per 1,000 women. Women in the age bracket of 20 to 34 years have the highest fertility rate with 176.0 births per 1,000 women. Women in the age bracket of 20 to 34 years acount for 100.0% of all women with births.
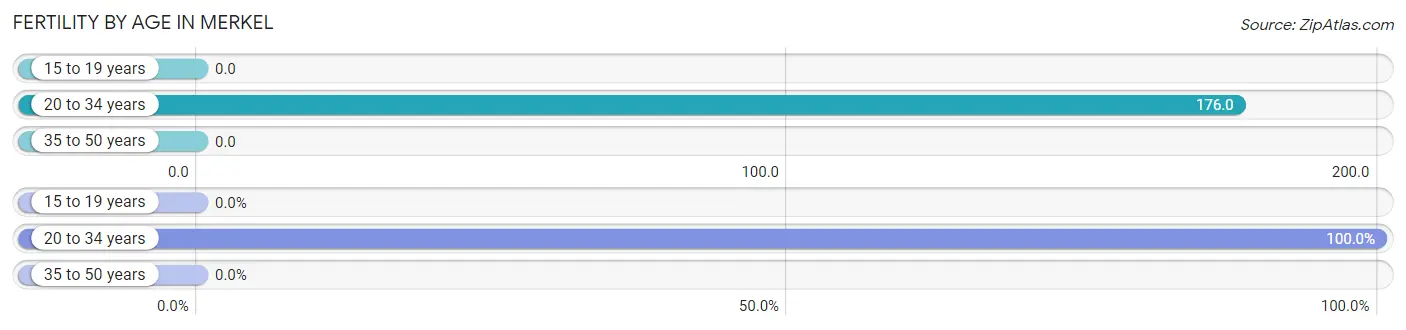
| Age Bracket | Women with Births | Births / 1,000 Women |
| 15 to 19 years | 0 (0.0%) | 0.0 |
| 20 to 34 years | 42 (100.0%) | 176.0 |
| 35 to 50 years | 0 (0.0%) | 0.0 |
| Total | 42 (100.0%) | 64.0 |
Fertility by Age by Marriage Status in Merkel
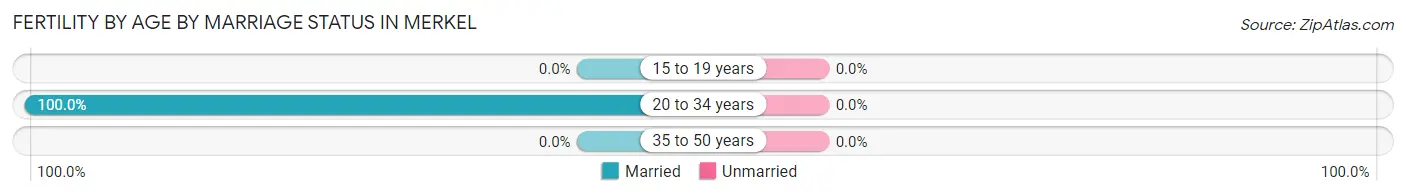
| Age Bracket | Married | Unmarried |
| 15 to 19 years | 0 (0.0%) | 0 (0.0%) |
| 20 to 34 years | 42 (100.0%) | 0 (0.0%) |
| 35 to 50 years | 0 (0.0%) | 0 (0.0%) |
| Total | 42 (100.0%) | 0 (0.0%) |
Fertility by Education in Merkel
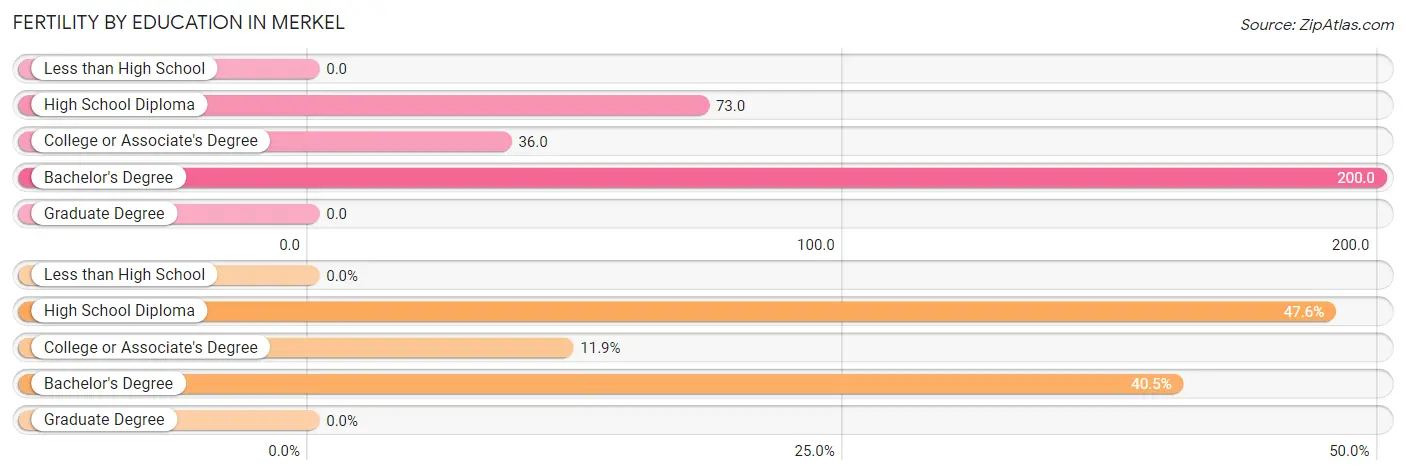
| Educational Attainment | Women with Births | Births / 1,000 Women |
| Less than High School | 0 (0.0%) | 0.0 |
| High School Diploma | 20 (47.6%) | 73.0 |
| College or Associate's Degree | 5 (11.9%) | 36.0 |
| Bachelor's Degree | 17 (40.5%) | 200.0 |
| Graduate Degree | 0 (0.0%) | 0.0 |
| Total | 42 (100.0%) | 64.0 |
Fertility by Education by Marriage Status in Merkel
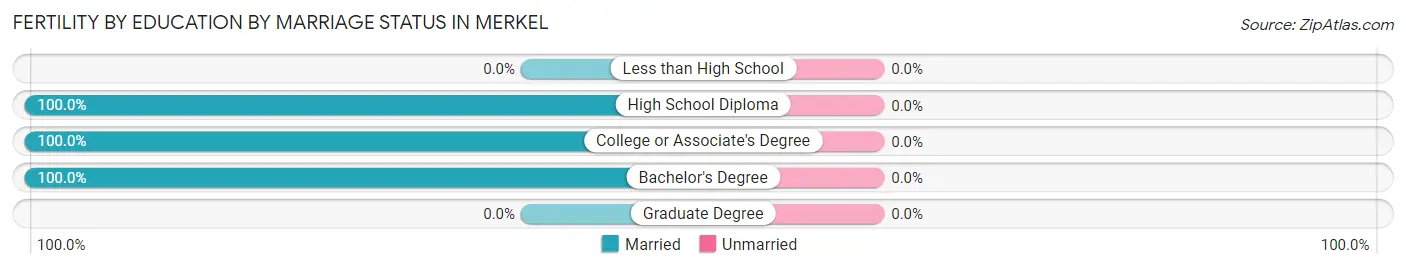
| Educational Attainment | Married | Unmarried |
| Less than High School | 0 (0.0%) | 0 (0.0%) |
| High School Diploma | 20 (100.0%) | 0 (0.0%) |
| College or Associate's Degree | 5 (100.0%) | 0 (0.0%) |
| Bachelor's Degree | 17 (100.0%) | 0 (0.0%) |
| Graduate Degree | 0 (0.0%) | 0 (0.0%) |
| Total | 42 (100.0%) | 0 (0.0%) |
Employment Characteristics in Merkel
Employment by Class of Employer in Merkel
Among the 1,227 employed individuals in Merkel, private company employees (849 | 69.2%), not-for-profit organizations (119 | 9.7%), and state government employees (103 | 8.4%) make up the most common classes of employment.
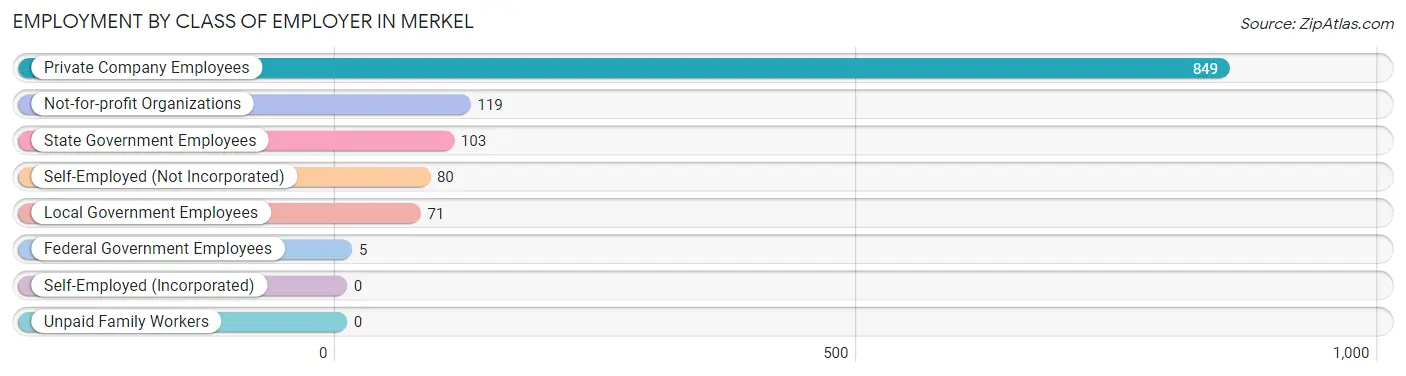
| Employer Class | # Employees | % Employees |
| Private Company Employees | 849 | 69.2% |
| Self-Employed (Incorporated) | 0 | 0.0% |
| Self-Employed (Not Incorporated) | 80 | 6.5% |
| Not-for-profit Organizations | 119 | 9.7% |
| Local Government Employees | 71 | 5.8% |
| State Government Employees | 103 | 8.4% |
| Federal Government Employees | 5 | 0.4% |
| Unpaid Family Workers | 0 | 0.0% |
| Total | 1,227 | 100.0% |
Employment Status by Age in Merkel
According to the labor force statistics for Merkel, out of the total population over 16 years of age (1,884), 67.1% or 1,264 individuals are in the labor force, with 1.9% or 24 of them unemployed. The age group with the highest labor force participation rate is 35 to 44 years, with 89.4% or 313 individuals in the labor force. Within the labor force, the 65 to 74 years age range has the highest percentage of unemployed individuals, with 5.3% or 3 of them being unemployed.
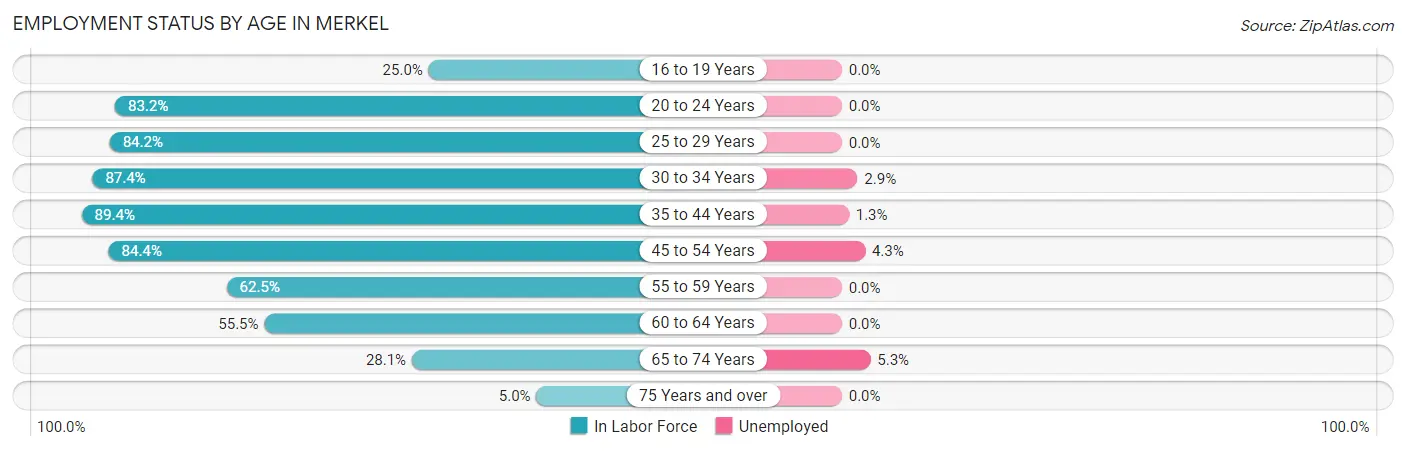
| Age Bracket | In Labor Force | Unemployed |
| 16 to 19 Years | 35 (25.0%) | 0 (0.0%) |
| 20 to 24 Years | 89 (83.2%) | 0 (0.0%) |
| 25 to 29 Years | 187 (84.2%) | 0 (0.0%) |
| 30 to 34 Years | 174 (87.4%) | 5 (2.9%) |
| 35 to 44 Years | 313 (89.4%) | 4 (1.3%) |
| 45 to 54 Years | 282 (84.4%) | 12 (4.3%) |
| 55 to 59 Years | 45 (62.5%) | 0 (0.0%) |
| 60 to 64 Years | 76 (55.5%) | 0 (0.0%) |
| 65 to 74 Years | 57 (28.1%) | 3 (5.3%) |
| 75 Years and over | 6 (5.0%) | 0 (0.0%) |
| Total | 1,264 (67.1%) | 24 (1.9%) |
Employment Status by Educational Attainment in Merkel
According to labor force statistics for Merkel, 82.0% of individuals (1,077) out of the total population between 25 and 64 years of age (1,314) are in the labor force, with 1.9% or 20 of them being unemployed. The group with the highest labor force participation rate are those with the educational attainment of bachelor's degree or higher, with 93.3% or 195 individuals in the labor force. Within the labor force, individuals with college / associate degree education have the highest percentage of unemployment, with 3.4% or 11 of them being unemployed.
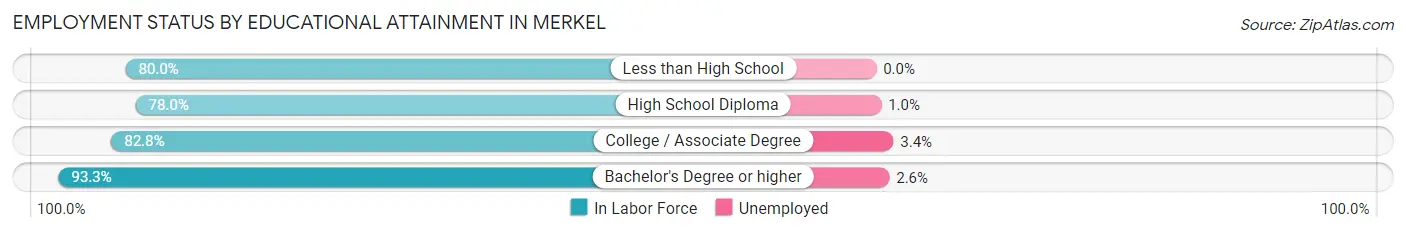
| Educational Attainment | In Labor Force | Unemployed |
| Less than High School | 72 (80.0%) | 0 (0.0%) |
| High School Diploma | 488 (78.0%) | 6 (1.0%) |
| College / Associate Degree | 322 (82.8%) | 13 (3.4%) |
| Bachelor's Degree or higher | 195 (93.3%) | 5 (2.6%) |
| Total | 1,077 (82.0%) | 25 (1.9%) |
Employment Occupations by Sex in Merkel
Management, Business, Science and Arts Occupations
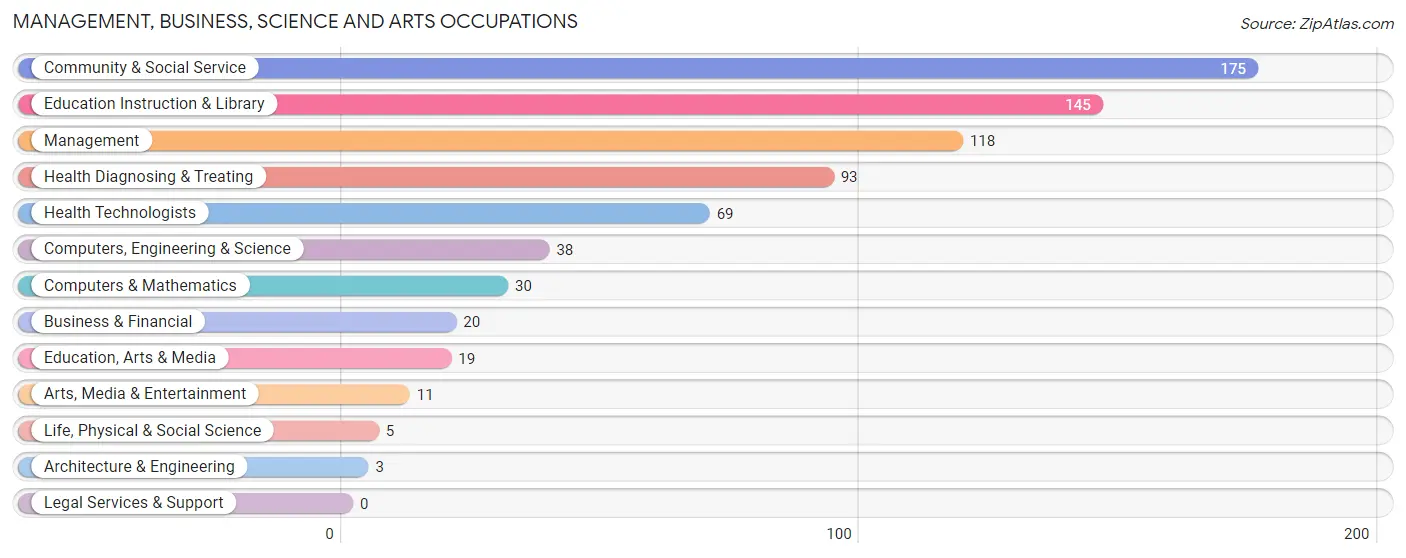
The most common Management, Business, Science and Arts occupations in Merkel are Community & Social Service (175 | 14.1%), Education Instruction & Library (145 | 11.7%), Management (118 | 9.5%), Health Diagnosing & Treating (93 | 7.5%), and Health Technologists (69 | 5.6%).
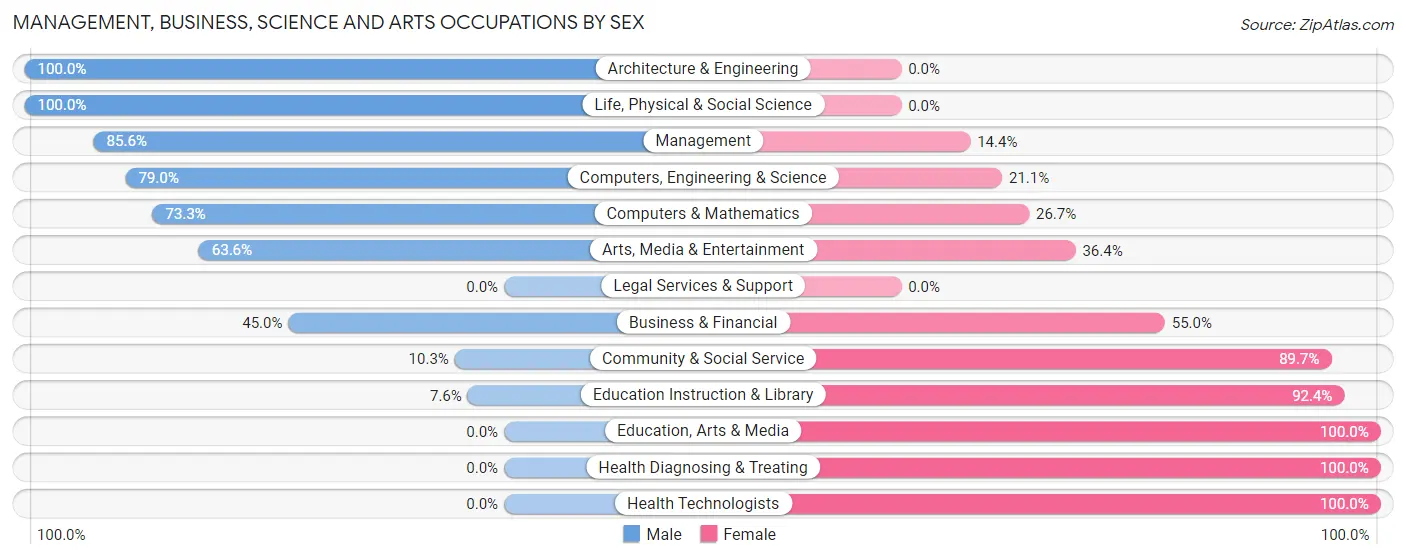
Management, Business, Science and Arts Occupations by Sex
Within the Management, Business, Science and Arts occupations in Merkel, the most male-oriented occupations are Architecture & Engineering (100.0%), Life, Physical & Social Science (100.0%), and Management (85.6%), while the most female-oriented occupations are Education, Arts & Media (100.0%), Health Diagnosing & Treating (100.0%), and Health Technologists (100.0%).
| Occupation | Male | Female |
| Management | 101 (85.6%) | 17 (14.4%) |
| Business & Financial | 9 (45.0%) | 11 (55.0%) |
| Computers, Engineering & Science | 30 (78.9%) | 8 (21.0%) |
| Computers & Mathematics | 22 (73.3%) | 8 (26.7%) |
| Architecture & Engineering | 3 (100.0%) | 0 (0.0%) |
| Life, Physical & Social Science | 5 (100.0%) | 0 (0.0%) |
| Community & Social Service | 18 (10.3%) | 157 (89.7%) |
| Education, Arts & Media | 0 (0.0%) | 19 (100.0%) |
| Legal Services & Support | 0 (0.0%) | 0 (0.0%) |
| Education Instruction & Library | 11 (7.6%) | 134 (92.4%) |
| Arts, Media & Entertainment | 7 (63.6%) | 4 (36.4%) |
| Health Diagnosing & Treating | 0 (0.0%) | 93 (100.0%) |
| Health Technologists | 0 (0.0%) | 69 (100.0%) |
| Total (Category) | 158 (35.6%) | 286 (64.4%) |
| Total (Overall) | 654 (52.7%) | 586 (47.3%) |
Services Occupations
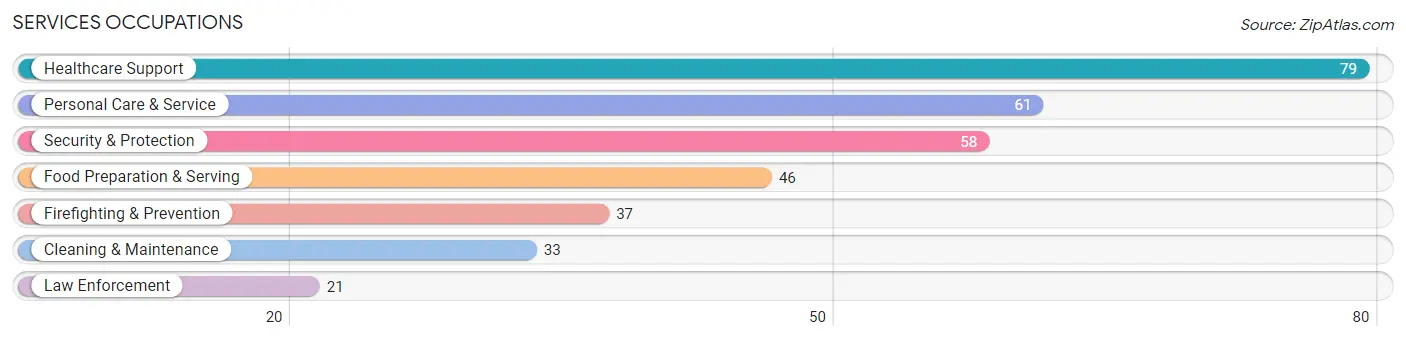
The most common Services occupations in Merkel are Healthcare Support (79 | 6.4%), Personal Care & Service (61 | 4.9%), Security & Protection (58 | 4.7%), Food Preparation & Serving (46 | 3.7%), and Firefighting & Prevention (37 | 3.0%).
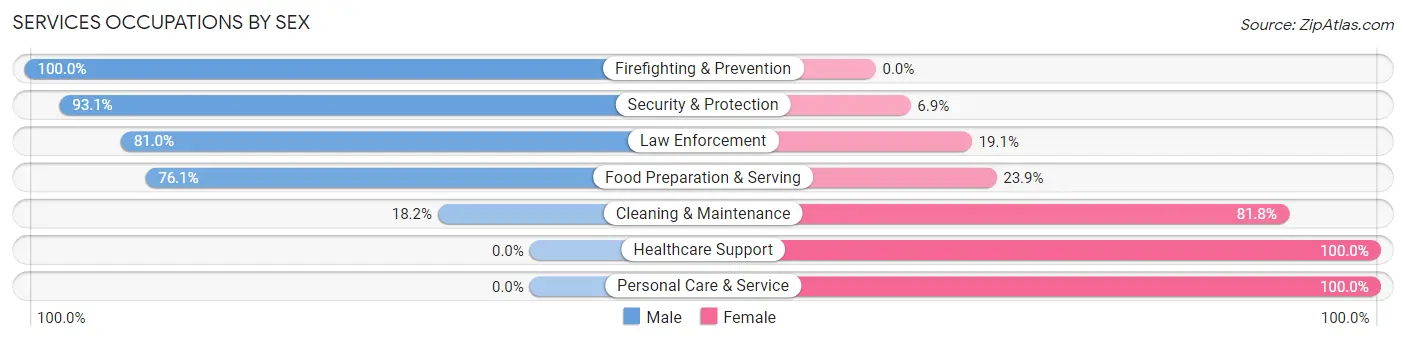
Services Occupations by Sex
Within the Services occupations in Merkel, the most male-oriented occupations are Firefighting & Prevention (100.0%), Security & Protection (93.1%), and Law Enforcement (80.9%), while the most female-oriented occupations are Healthcare Support (100.0%), Personal Care & Service (100.0%), and Cleaning & Maintenance (81.8%).
| Occupation | Male | Female |
| Healthcare Support | 0 (0.0%) | 79 (100.0%) |
| Security & Protection | 54 (93.1%) | 4 (6.9%) |
| Firefighting & Prevention | 37 (100.0%) | 0 (0.0%) |
| Law Enforcement | 17 (80.9%) | 4 (19.1%) |
| Food Preparation & Serving | 35 (76.1%) | 11 (23.9%) |
| Cleaning & Maintenance | 6 (18.2%) | 27 (81.8%) |
| Personal Care & Service | 0 (0.0%) | 61 (100.0%) |
| Total (Category) | 95 (34.3%) | 182 (65.7%) |
| Total (Overall) | 654 (52.7%) | 586 (47.3%) |
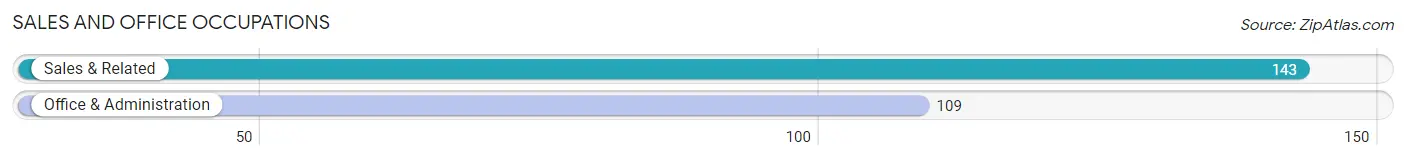
Sales and Office Occupations
The most common Sales and Office occupations in Merkel are Sales & Related (143 | 11.5%), and Office & Administration (109 | 8.8%).
Sales and Office Occupations by Sex
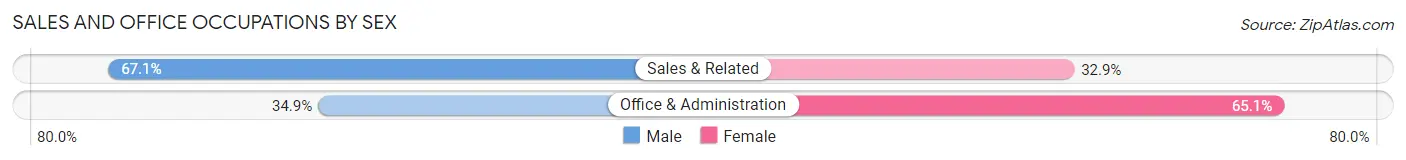
| Occupation | Male | Female |
| Sales & Related | 96 (67.1%) | 47 (32.9%) |
| Office & Administration | 38 (34.9%) | 71 (65.1%) |
| Total (Category) | 134 (53.2%) | 118 (46.8%) |
| Total (Overall) | 654 (52.7%) | 586 (47.3%) |
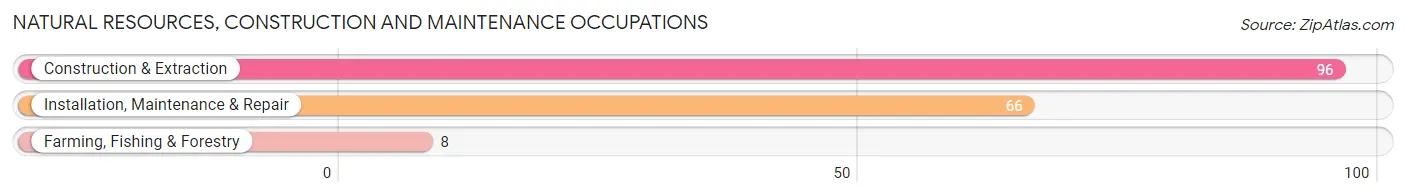
Natural Resources, Construction and Maintenance Occupations
The most common Natural Resources, Construction and Maintenance occupations in Merkel are Construction & Extraction (96 | 7.7%), Installation, Maintenance & Repair (66 | 5.3%), and Farming, Fishing & Forestry (8 | 0.6%).
Natural Resources, Construction and Maintenance Occupations by Sex
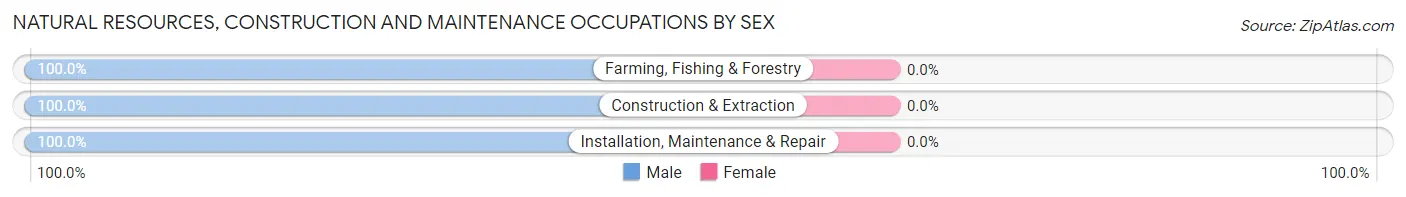
| Occupation | Male | Female |
| Farming, Fishing & Forestry | 8 (100.0%) | 0 (0.0%) |
| Construction & Extraction | 96 (100.0%) | 0 (0.0%) |
| Installation, Maintenance & Repair | 66 (100.0%) | 0 (0.0%) |
| Total (Category) | 170 (100.0%) | 0 (0.0%) |
| Total (Overall) | 654 (52.7%) | 586 (47.3%) |
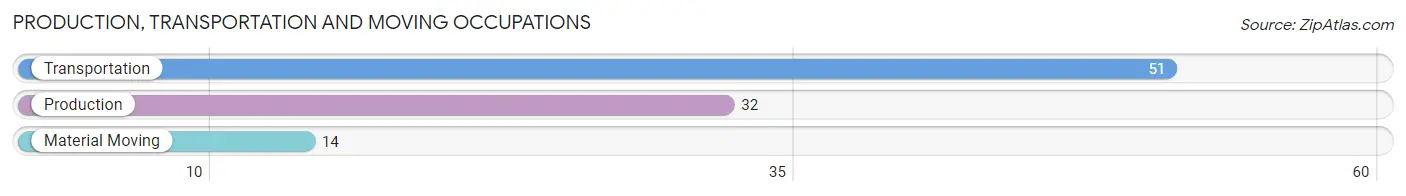
Production, Transportation and Moving Occupations
The most common Production, Transportation and Moving occupations in Merkel are Transportation (51 | 4.1%), Production (32 | 2.6%), and Material Moving (14 | 1.1%).
Production, Transportation and Moving Occupations by Sex
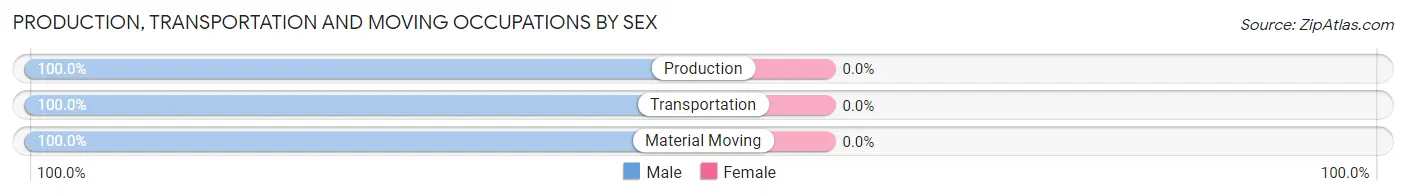
| Occupation | Male | Female |
| Production | 32 (100.0%) | 0 (0.0%) |
| Transportation | 51 (100.0%) | 0 (0.0%) |
| Material Moving | 14 (100.0%) | 0 (0.0%) |
| Total (Category) | 97 (100.0%) | 0 (0.0%) |
| Total (Overall) | 654 (52.7%) | 586 (47.3%) |
Employment Industries by Sex in Merkel
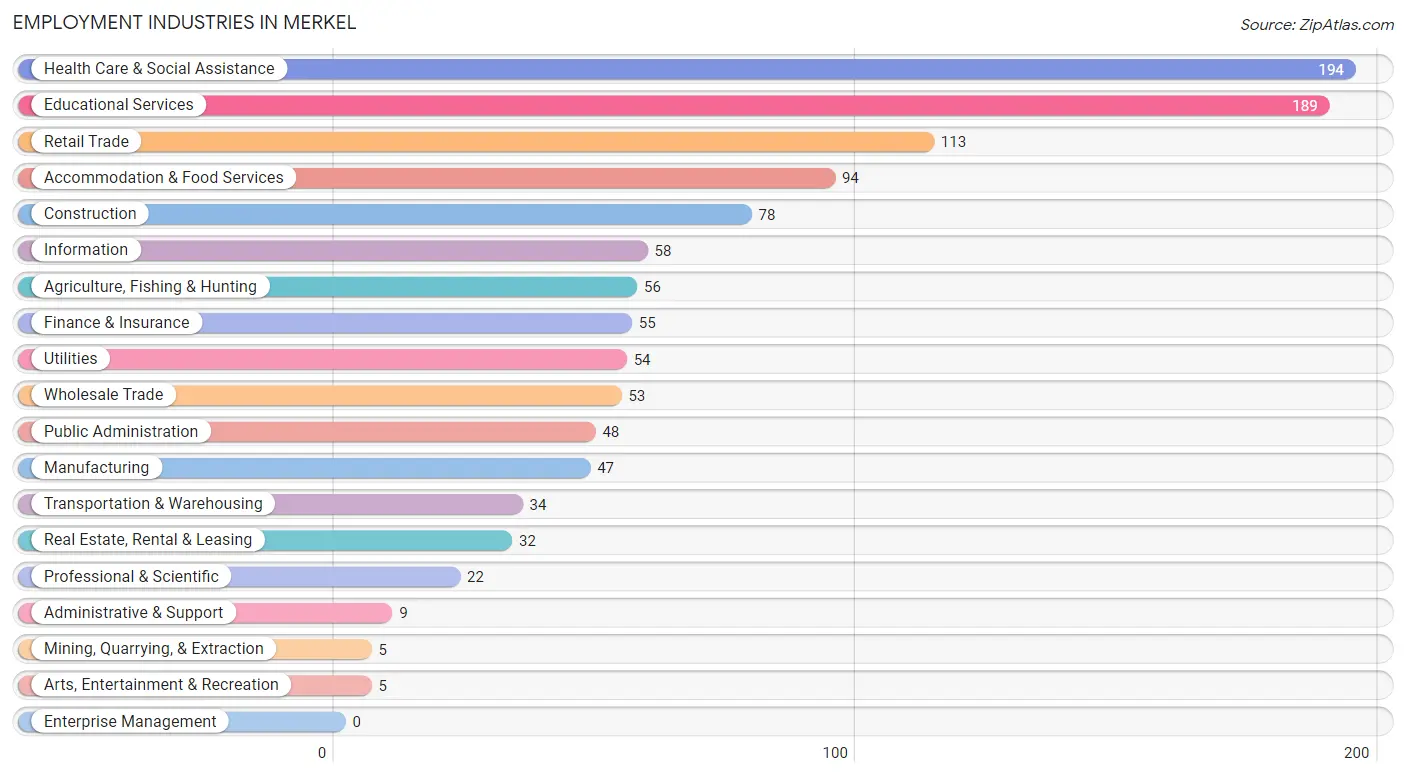
Employment Industries in Merkel
The major employment industries in Merkel include Health Care & Social Assistance (194 | 15.7%), Educational Services (189 | 15.2%), Retail Trade (113 | 9.1%), Accommodation & Food Services (94 | 7.6%), and Construction (78 | 6.3%).
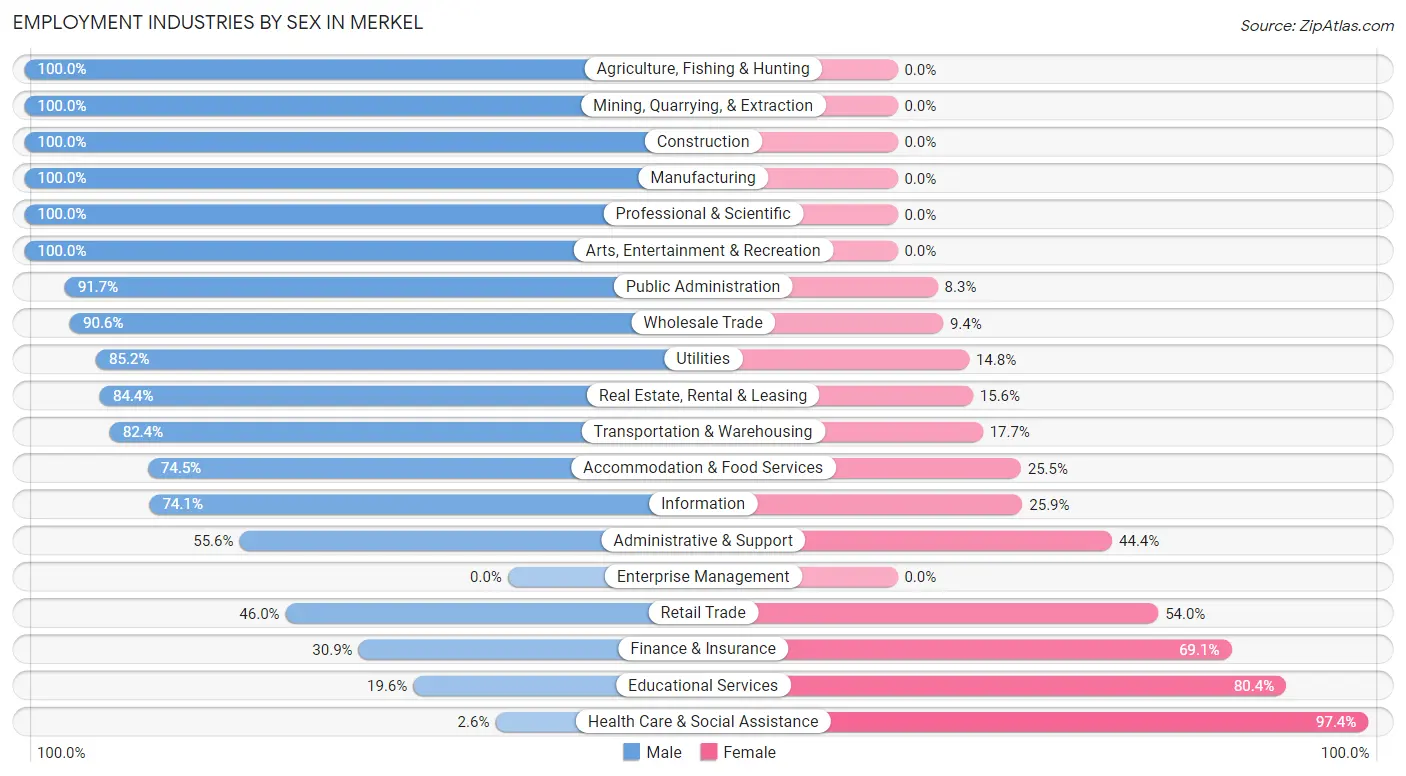
Employment Industries by Sex in Merkel
The Merkel industries that see more men than women are Agriculture, Fishing & Hunting (100.0%), Mining, Quarrying, & Extraction (100.0%), and Construction (100.0%), whereas the industries that tend to have a higher number of women are Health Care & Social Assistance (97.4%), Educational Services (80.4%), and Finance & Insurance (69.1%).
| Industry | Male | Female |
| Agriculture, Fishing & Hunting | 56 (100.0%) | 0 (0.0%) |
| Mining, Quarrying, & Extraction | 5 (100.0%) | 0 (0.0%) |
| Construction | 78 (100.0%) | 0 (0.0%) |
| Manufacturing | 47 (100.0%) | 0 (0.0%) |
| Wholesale Trade | 48 (90.6%) | 5 (9.4%) |
| Retail Trade | 52 (46.0%) | 61 (54.0%) |
| Transportation & Warehousing | 28 (82.4%) | 6 (17.6%) |
| Utilities | 46 (85.2%) | 8 (14.8%) |
| Information | 43 (74.1%) | 15 (25.9%) |
| Finance & Insurance | 17 (30.9%) | 38 (69.1%) |
| Real Estate, Rental & Leasing | 27 (84.4%) | 5 (15.6%) |
| Professional & Scientific | 22 (100.0%) | 0 (0.0%) |
| Enterprise Management | 0 (0.0%) | 0 (0.0%) |
| Administrative & Support | 5 (55.6%) | 4 (44.4%) |
| Educational Services | 37 (19.6%) | 152 (80.4%) |
| Health Care & Social Assistance | 5 (2.6%) | 189 (97.4%) |
| Arts, Entertainment & Recreation | 5 (100.0%) | 0 (0.0%) |
| Accommodation & Food Services | 70 (74.5%) | 24 (25.5%) |
| Public Administration | 44 (91.7%) | 4 (8.3%) |
| Total | 654 (52.7%) | 586 (47.3%) |
Education in Merkel
School Enrollment in Merkel
The most common levels of schooling among the 703 students in Merkel are middle school (203 | 28.9%), high school (187 | 26.6%), and elementary school (149 | 21.2%).
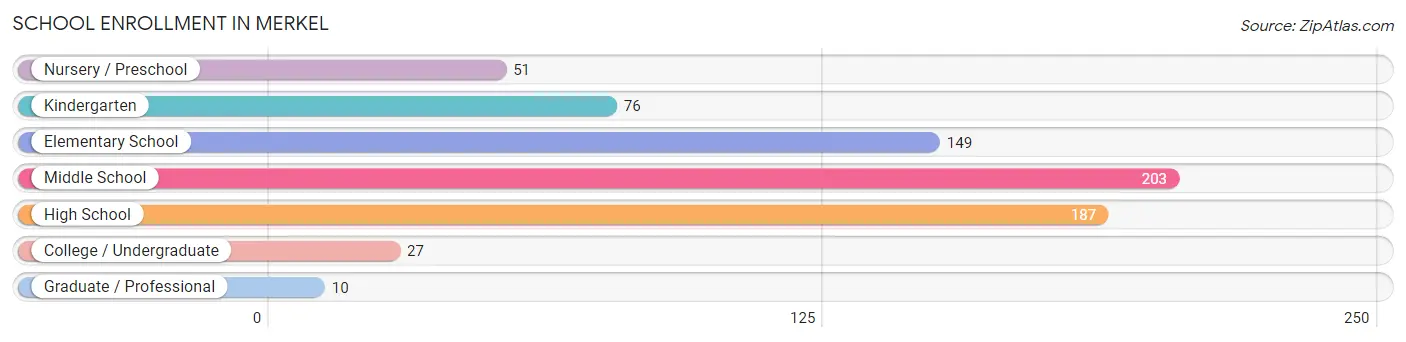
| School Level | # Students | % Students |
| Nursery / Preschool | 51 | 7.2% |
| Kindergarten | 76 | 10.8% |
| Elementary School | 149 | 21.2% |
| Middle School | 203 | 28.9% |
| High School | 187 | 26.6% |
| College / Undergraduate | 27 | 3.8% |
| Graduate / Professional | 10 | 1.4% |
| Total | 703 | 100.0% |
School Enrollment by Age by Funding Source in Merkel
Out of a total of 703 students who are enrolled in schools in Merkel, 50 (7.1%) attend a private institution, while the remaining 653 (92.9%) are enrolled in public schools. The age group of 18 to 19 year olds has the highest likelihood of being enrolled in private schools, with 4 (100.0% in the age bracket) enrolled. Conversely, the age group of 5 to 9 year old has the lowest likelihood of being enrolled in a private school, with 193 (100.0% in the age bracket) attending a public institution.

| Age Bracket | Public School | Private School |
| 3 to 4 Year Olds | 32 (64.0%) | 18 (36.0%) |
| 5 to 9 Year Old | 193 (100.0%) | 0 (0.0%) |
| 10 to 14 Year Olds | 261 (95.6%) | 12 (4.4%) |
| 15 to 17 Year Olds | 144 (96.0%) | 6 (4.0%) |
| 18 to 19 Year Olds | 0 (0.0%) | 4 (100.0%) |
| 20 to 24 Year Olds | 5 (45.5%) | 6 (54.5%) |
| 25 to 34 Year Olds | 18 (81.8%) | 4 (18.2%) |
| 35 Years and over | 0 (0.0%) | 0 (0.0%) |
| Total | 653 (92.9%) | 50 (7.1%) |
Educational Attainment by Field of Study in Merkel
Education (51 | 17.2%), science & technology (39 | 13.1%), literature & languages (38 | 12.8%), arts & humanities (32 | 10.8%), and computers & mathematics (28 | 9.4%) are the most common fields of study among 297 individuals in Merkel who have obtained a bachelor's degree or higher.
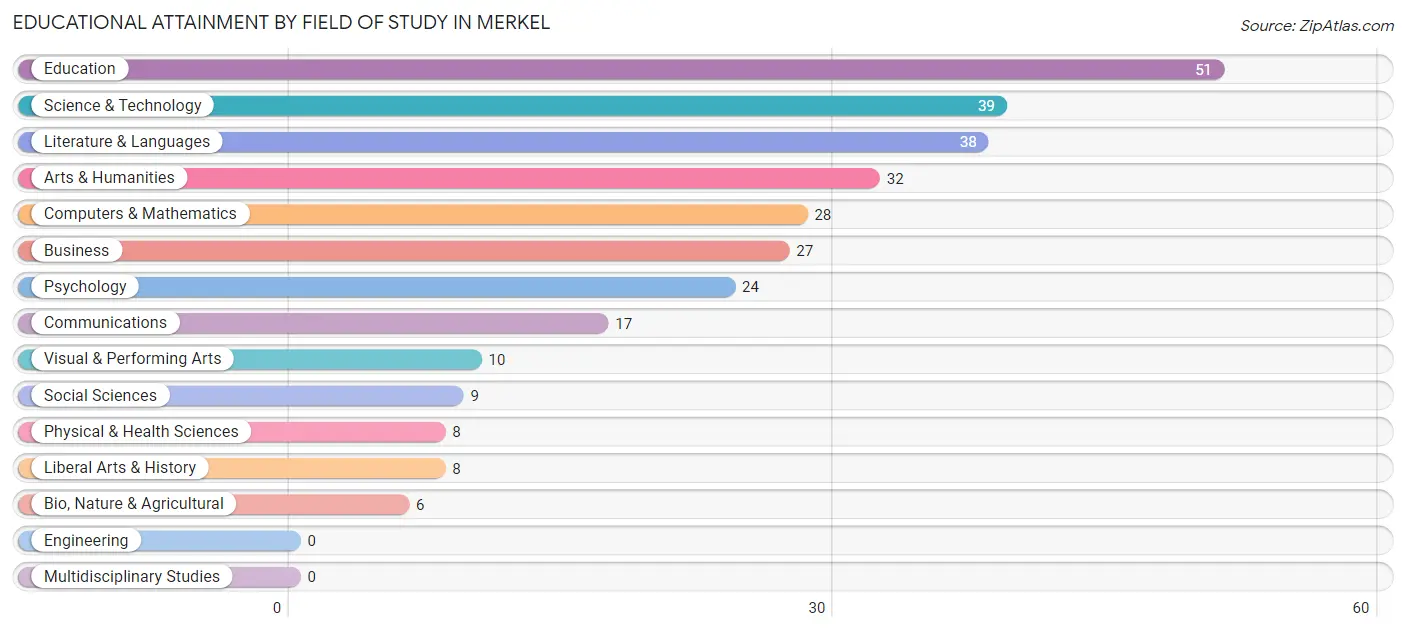
| Field of Study | # Graduates | % Graduates |
| Computers & Mathematics | 28 | 9.4% |
| Bio, Nature & Agricultural | 6 | 2.0% |
| Physical & Health Sciences | 8 | 2.7% |
| Psychology | 24 | 8.1% |
| Social Sciences | 9 | 3.0% |
| Engineering | 0 | 0.0% |
| Multidisciplinary Studies | 0 | 0.0% |
| Science & Technology | 39 | 13.1% |
| Business | 27 | 9.1% |
| Education | 51 | 17.2% |
| Literature & Languages | 38 | 12.8% |
| Liberal Arts & History | 8 | 2.7% |
| Visual & Performing Arts | 10 | 3.4% |
| Communications | 17 | 5.7% |
| Arts & Humanities | 32 | 10.8% |
| Total | 297 | 100.0% |
Transportation & Commute in Merkel
Vehicle Availability by Sex in Merkel
The most prevalent vehicle ownership categories in Merkel are males with 2 vehicles (221, accounting for 33.8%) and females with 2 vehicles (181, making up 38.6%).
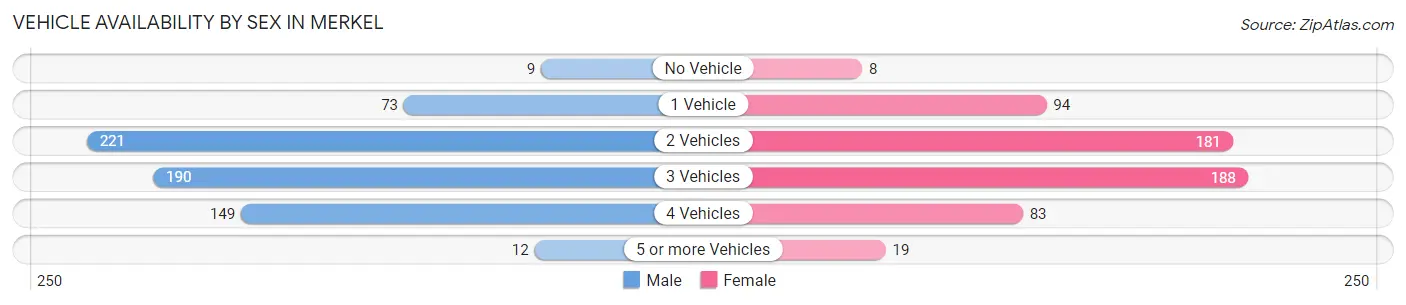
| Vehicles Available | Male | Female |
| No Vehicle | 9 (1.4%) | 8 (1.4%) |
| 1 Vehicle | 73 (11.2%) | 94 (16.4%) |
| 2 Vehicles | 221 (33.8%) | 181 (31.6%) |
| 3 Vehicles | 190 (29.0%) | 188 (32.8%) |
| 4 Vehicles | 149 (22.8%) | 83 (14.5%) |
| 5 or more Vehicles | 12 (1.8%) | 19 (3.3%) |
| Total | 654 (100.0%) | 573 (100.0%) |
Commute Time in Merkel
The most frequently occuring commute durations in Merkel are 5 to 9 minutes (207 commuters, 17.8%), 25 to 29 minutes (185 commuters, 15.9%), and 20 to 24 minutes (165 commuters, 14.2%).
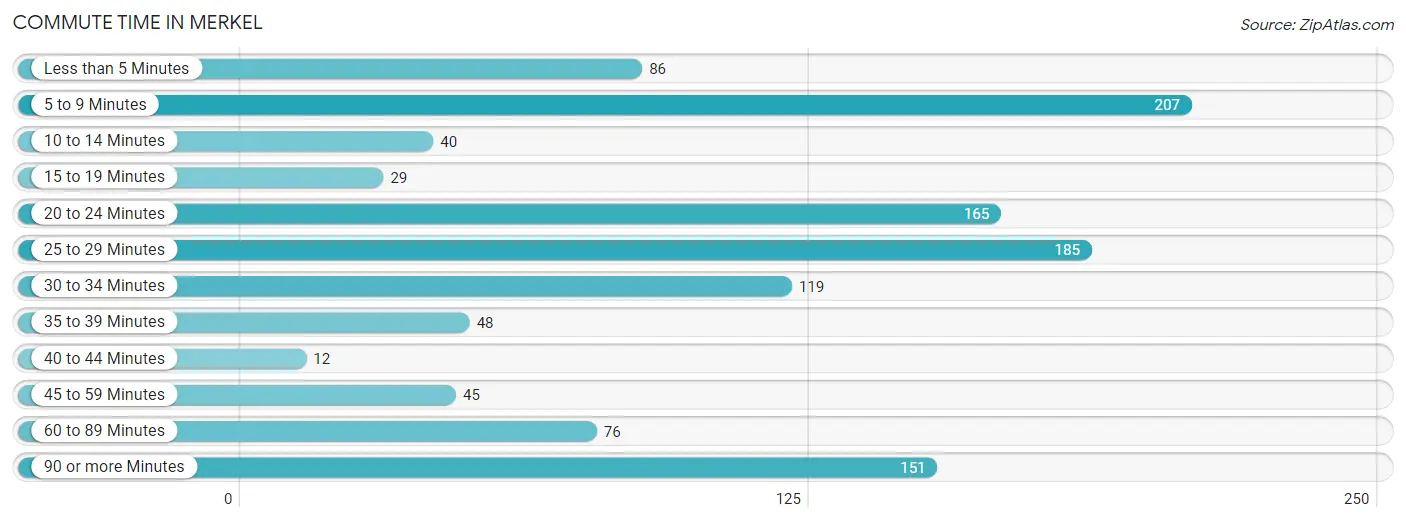
| Commute Time | # Commuters | % Commuters |
| Less than 5 Minutes | 86 | 7.4% |
| 5 to 9 Minutes | 207 | 17.8% |
| 10 to 14 Minutes | 40 | 3.4% |
| 15 to 19 Minutes | 29 | 2.5% |
| 20 to 24 Minutes | 165 | 14.2% |
| 25 to 29 Minutes | 185 | 15.9% |
| 30 to 34 Minutes | 119 | 10.2% |
| 35 to 39 Minutes | 48 | 4.1% |
| 40 to 44 Minutes | 12 | 1.0% |
| 45 to 59 Minutes | 45 | 3.9% |
| 60 to 89 Minutes | 76 | 6.5% |
| 90 or more Minutes | 151 | 13.0% |
Commute Time by Sex in Merkel
The most common commute times in Merkel are 90 or more minutes (139 commuters, 22.3%) for males and 5 to 9 minutes (149 commuters, 27.6%) for females.
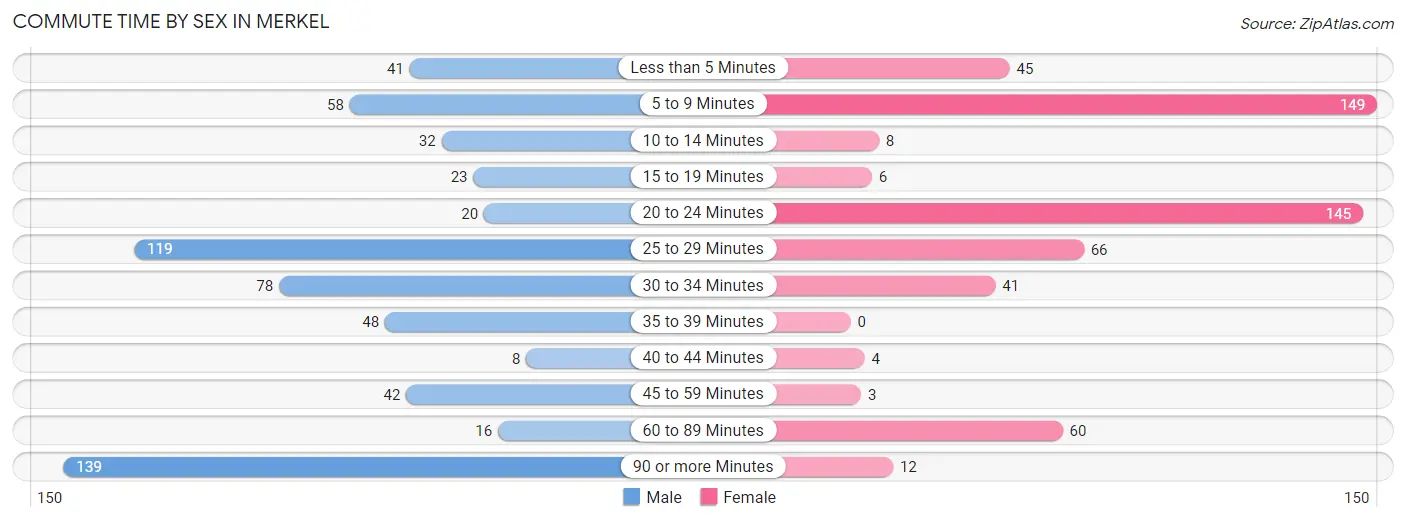
| Commute Time | Male | Female |
| Less than 5 Minutes | 41 (6.6%) | 45 (8.4%) |
| 5 to 9 Minutes | 58 (9.3%) | 149 (27.6%) |
| 10 to 14 Minutes | 32 (5.1%) | 8 (1.5%) |
| 15 to 19 Minutes | 23 (3.7%) | 6 (1.1%) |
| 20 to 24 Minutes | 20 (3.2%) | 145 (26.9%) |
| 25 to 29 Minutes | 119 (19.1%) | 66 (12.2%) |
| 30 to 34 Minutes | 78 (12.5%) | 41 (7.6%) |
| 35 to 39 Minutes | 48 (7.7%) | 0 (0.0%) |
| 40 to 44 Minutes | 8 (1.3%) | 4 (0.7%) |
| 45 to 59 Minutes | 42 (6.7%) | 3 (0.6%) |
| 60 to 89 Minutes | 16 (2.6%) | 60 (11.1%) |
| 90 or more Minutes | 139 (22.3%) | 12 (2.2%) |
Time of Departure to Work by Sex in Merkel
The most frequent times of departure to work in Merkel are 7:00 AM to 7:29 AM (111, 17.8%) for males and 7:00 AM to 7:29 AM (121, 22.5%) for females.
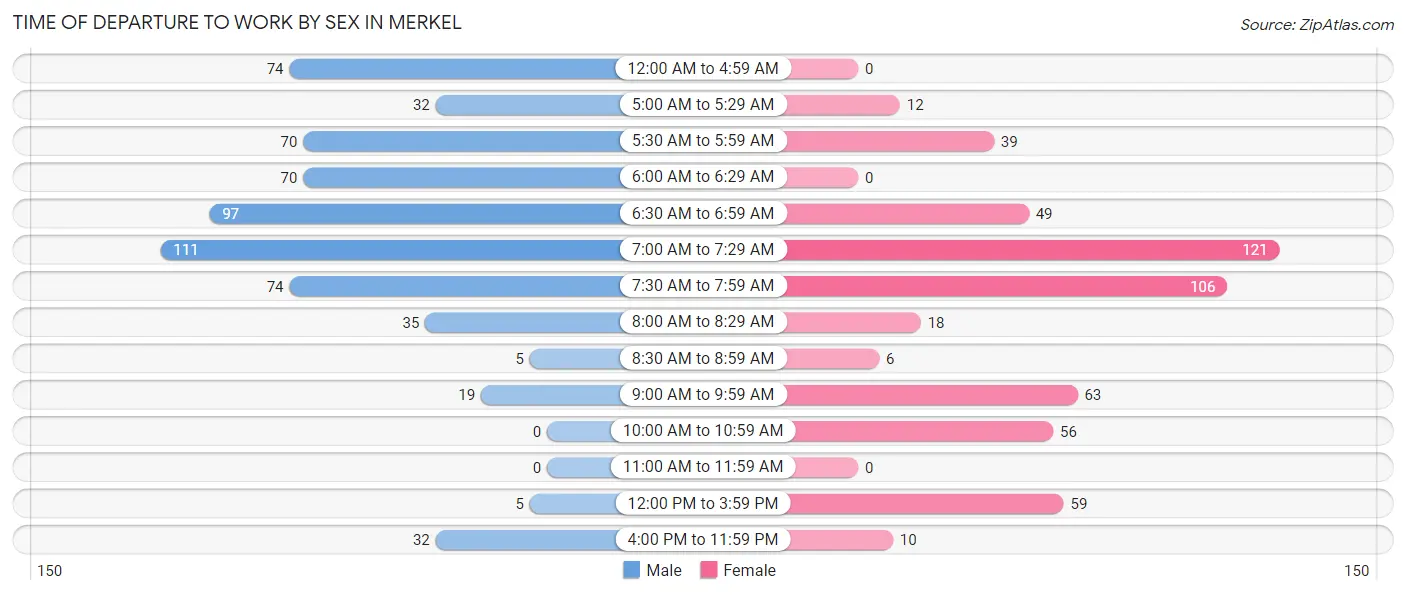
| Time of Departure | Male | Female |
| 12:00 AM to 4:59 AM | 74 (11.9%) | 0 (0.0%) |
| 5:00 AM to 5:29 AM | 32 (5.1%) | 12 (2.2%) |
| 5:30 AM to 5:59 AM | 70 (11.2%) | 39 (7.2%) |
| 6:00 AM to 6:29 AM | 70 (11.2%) | 0 (0.0%) |
| 6:30 AM to 6:59 AM | 97 (15.5%) | 49 (9.1%) |
| 7:00 AM to 7:29 AM | 111 (17.8%) | 121 (22.5%) |
| 7:30 AM to 7:59 AM | 74 (11.9%) | 106 (19.7%) |
| 8:00 AM to 8:29 AM | 35 (5.6%) | 18 (3.3%) |
| 8:30 AM to 8:59 AM | 5 (0.8%) | 6 (1.1%) |
| 9:00 AM to 9:59 AM | 19 (3.0%) | 63 (11.7%) |
| 10:00 AM to 10:59 AM | 0 (0.0%) | 56 (10.4%) |
| 11:00 AM to 11:59 AM | 0 (0.0%) | 0 (0.0%) |
| 12:00 PM to 3:59 PM | 5 (0.8%) | 59 (11.0%) |
| 4:00 PM to 11:59 PM | 32 (5.1%) | 10 (1.9%) |
| Total | 624 (100.0%) | 539 (100.0%) |
Housing Occupancy in Merkel
Occupancy by Ownership in Merkel
Of the total 893 dwellings in Merkel, owner-occupied units account for 660 (73.9%), while renter-occupied units make up 233 (26.1%).
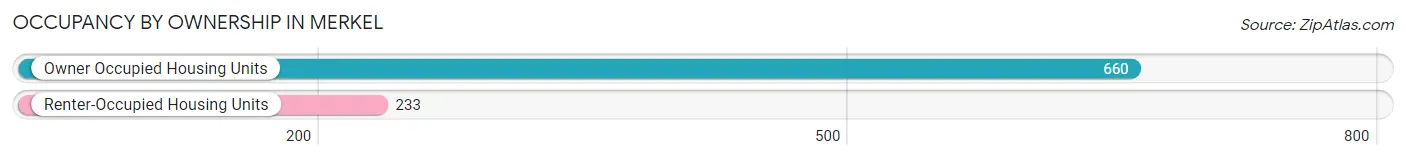
| Occupancy | # Housing Units | % Housing Units |
| Owner Occupied Housing Units | 660 | 73.9% |
| Renter-Occupied Housing Units | 233 | 26.1% |
| Total Occupied Housing Units | 893 | 100.0% |
Occupancy by Household Size in Merkel
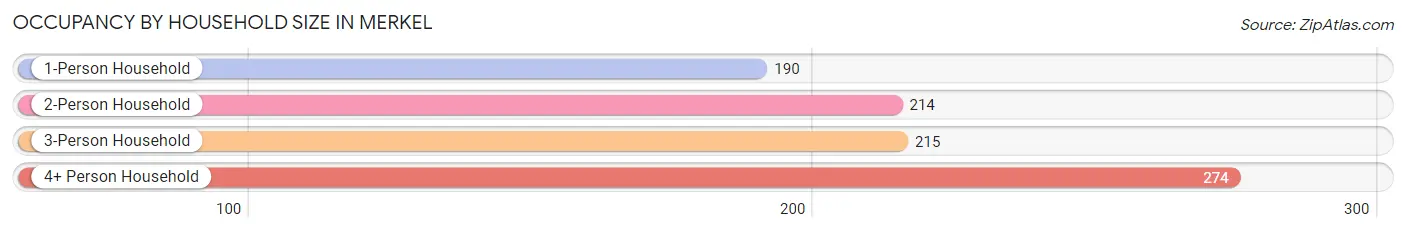
| Household Size | # Housing Units | % Housing Units |
| 1-Person Household | 190 | 21.3% |
| 2-Person Household | 214 | 24.0% |
| 3-Person Household | 215 | 24.1% |
| 4+ Person Household | 274 | 30.7% |
| Total Housing Units | 893 | 100.0% |
Occupancy by Ownership by Household Size in Merkel
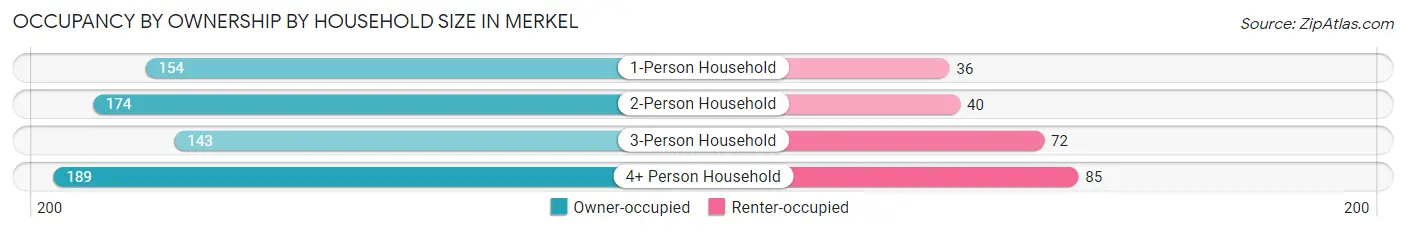
| Household Size | Owner-occupied | Renter-occupied |
| 1-Person Household | 154 (81.0%) | 36 (19.0%) |
| 2-Person Household | 174 (81.3%) | 40 (18.7%) |
| 3-Person Household | 143 (66.5%) | 72 (33.5%) |
| 4+ Person Household | 189 (69.0%) | 85 (31.0%) |
| Total Housing Units | 660 (73.9%) | 233 (26.1%) |
Occupancy by Educational Attainment in Merkel
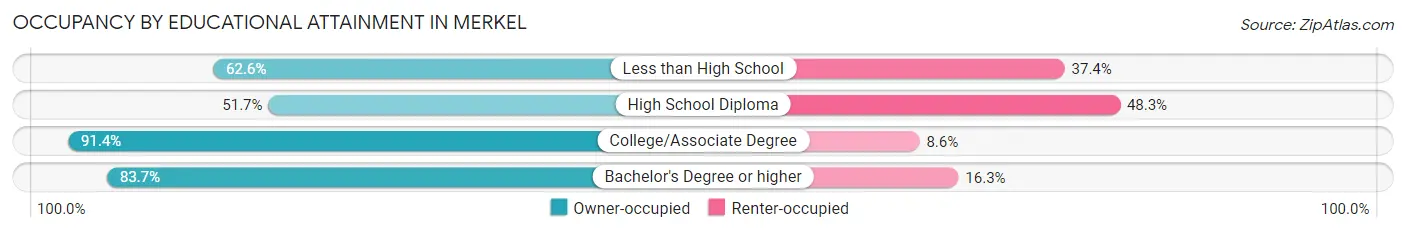
| Household Size | Owner-occupied | Renter-occupied |
| Less than High School | 57 (62.6%) | 34 (37.4%) |
| High School Diploma | 155 (51.7%) | 145 (48.3%) |
| College/Associate Degree | 330 (91.4%) | 31 (8.6%) |
| Bachelor's Degree or higher | 118 (83.7%) | 23 (16.3%) |
Occupancy by Age of Householder in Merkel
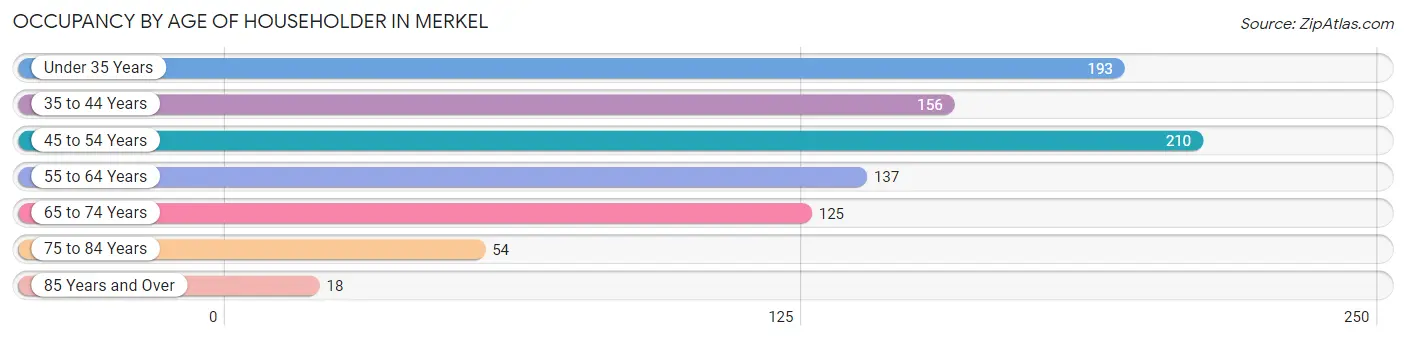
| Age Bracket | # Households | % Households |
| Under 35 Years | 193 | 21.6% |
| 35 to 44 Years | 156 | 17.5% |
| 45 to 54 Years | 210 | 23.5% |
| 55 to 64 Years | 137 | 15.3% |
| 65 to 74 Years | 125 | 14.0% |
| 75 to 84 Years | 54 | 6.0% |
| 85 Years and Over | 18 | 2.0% |
| Total | 893 | 100.0% |
Housing Finances in Merkel
Median Income by Occupancy in Merkel
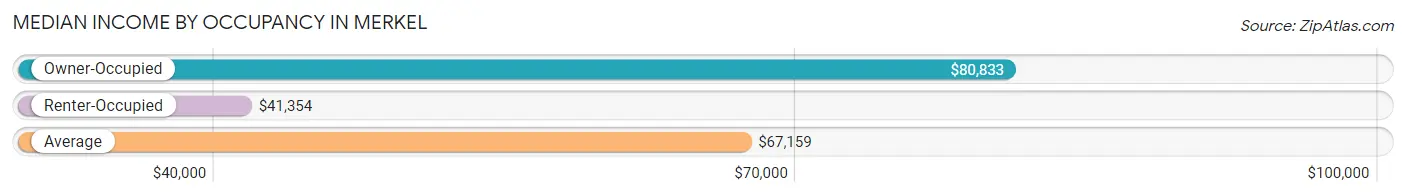
| Occupancy Type | # Households | Median Income |
| Owner-Occupied | 660 (73.9%) | $80,833 |
| Renter-Occupied | 233 (26.1%) | $41,354 |
| Average | 893 (100.0%) | $67,159 |
Occupancy by Householder Income Bracket in Merkel
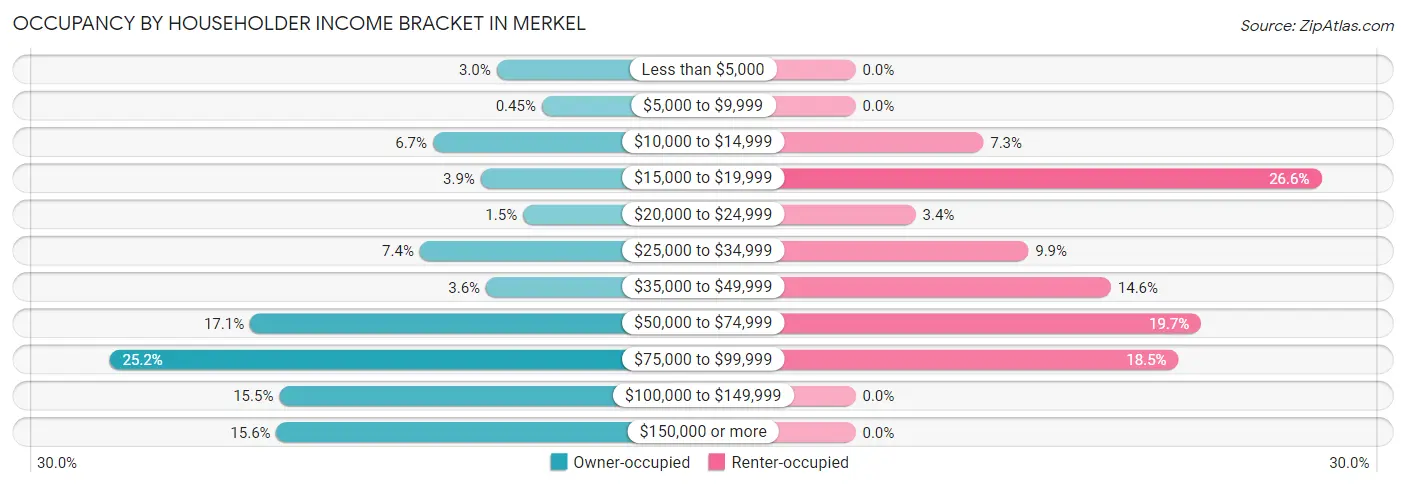
| Income Bracket | Owner-occupied | Renter-occupied |
| Less than $5,000 | 20 (3.0%) | 0 (0.0%) |
| $5,000 to $9,999 | 3 (0.4%) | 0 (0.0%) |
| $10,000 to $14,999 | 44 (6.7%) | 17 (7.3%) |
| $15,000 to $19,999 | 26 (3.9%) | 62 (26.6%) |
| $20,000 to $24,999 | 10 (1.5%) | 8 (3.4%) |
| $25,000 to $34,999 | 49 (7.4%) | 23 (9.9%) |
| $35,000 to $49,999 | 24 (3.6%) | 34 (14.6%) |
| $50,000 to $74,999 | 113 (17.1%) | 46 (19.7%) |
| $75,000 to $99,999 | 166 (25.2%) | 43 (18.4%) |
| $100,000 to $149,999 | 102 (15.4%) | 0 (0.0%) |
| $150,000 or more | 103 (15.6%) | 0 (0.0%) |
| Total | 660 (100.0%) | 233 (100.0%) |
Monthly Housing Cost Tiers in Merkel
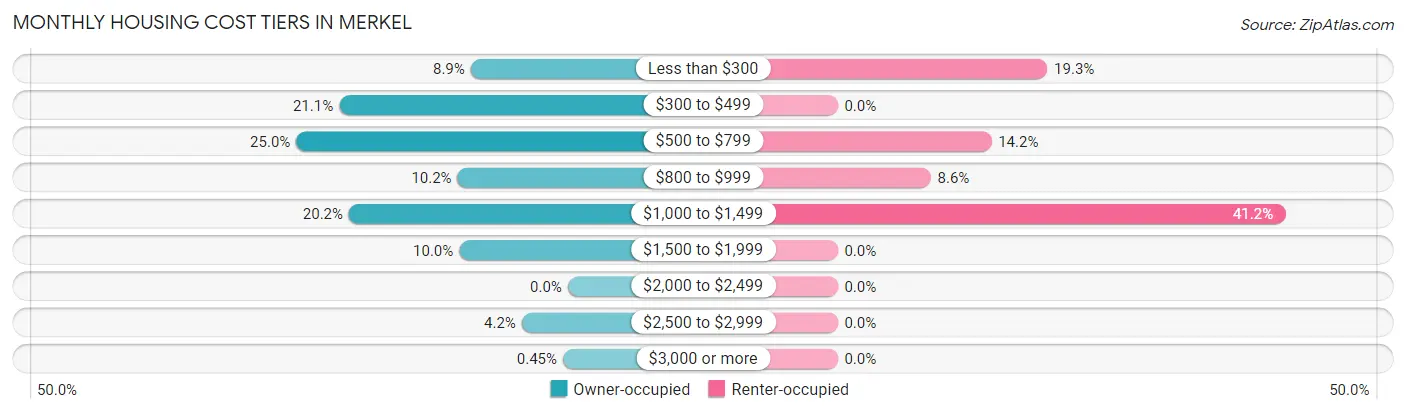
| Monthly Cost | Owner-occupied | Renter-occupied |
| Less than $300 | 59 (8.9%) | 45 (19.3%) |
| $300 to $499 | 139 (21.1%) | 0 (0.0%) |
| $500 to $799 | 165 (25.0%) | 33 (14.2%) |
| $800 to $999 | 67 (10.2%) | 20 (8.6%) |
| $1,000 to $1,499 | 133 (20.2%) | 96 (41.2%) |
| $1,500 to $1,999 | 66 (10.0%) | 0 (0.0%) |
| $2,000 to $2,499 | 0 (0.0%) | 0 (0.0%) |
| $2,500 to $2,999 | 28 (4.2%) | 0 (0.0%) |
| $3,000 or more | 3 (0.4%) | 0 (0.0%) |
| Total | 660 (100.0%) | 233 (100.0%) |
Physical Housing Characteristics in Merkel
Housing Structures in Merkel
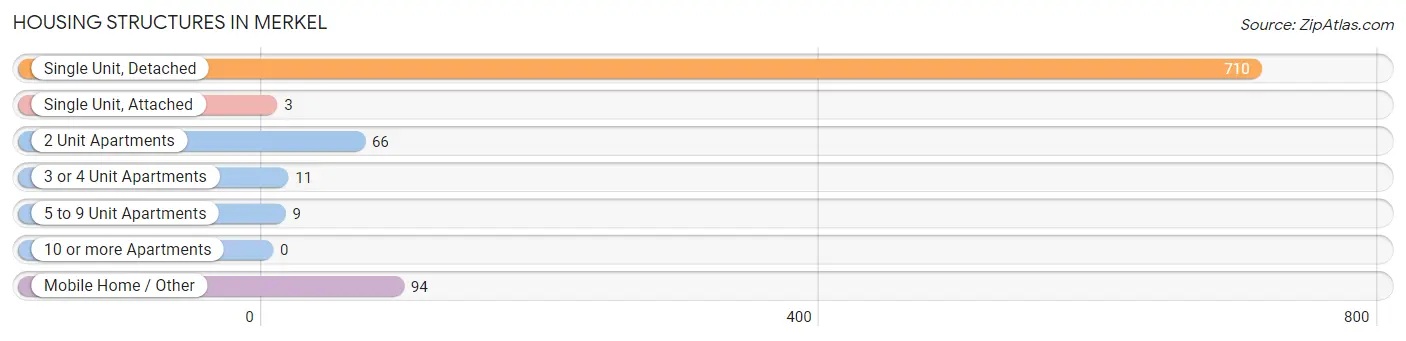
| Structure Type | # Housing Units | % Housing Units |
| Single Unit, Detached | 710 | 79.5% |
| Single Unit, Attached | 3 | 0.3% |
| 2 Unit Apartments | 66 | 7.4% |
| 3 or 4 Unit Apartments | 11 | 1.2% |
| 5 to 9 Unit Apartments | 9 | 1.0% |
| 10 or more Apartments | 0 | 0.0% |
| Mobile Home / Other | 94 | 10.5% |
| Total | 893 | 100.0% |
Housing Structures by Occupancy in Merkel
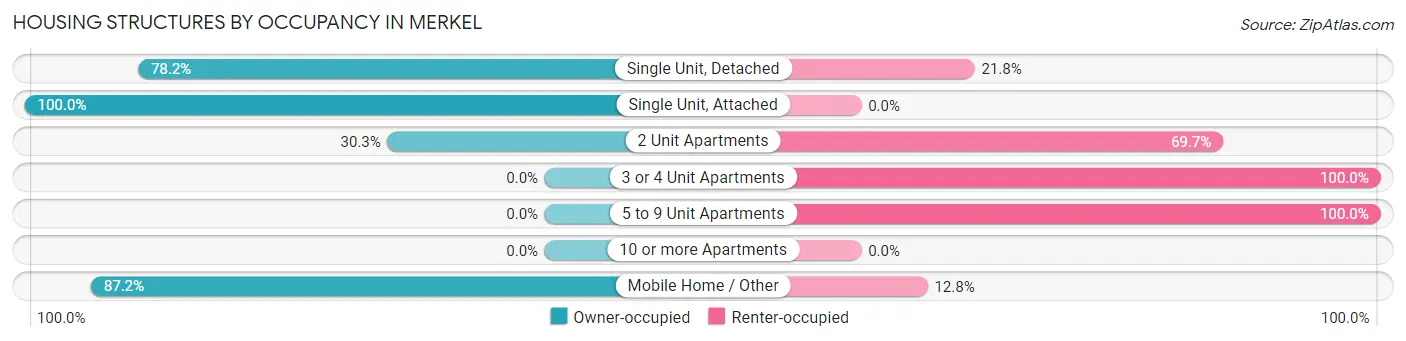
| Structure Type | Owner-occupied | Renter-occupied |
| Single Unit, Detached | 555 (78.2%) | 155 (21.8%) |
| Single Unit, Attached | 3 (100.0%) | 0 (0.0%) |
| 2 Unit Apartments | 20 (30.3%) | 46 (69.7%) |
| 3 or 4 Unit Apartments | 0 (0.0%) | 11 (100.0%) |
| 5 to 9 Unit Apartments | 0 (0.0%) | 9 (100.0%) |
| 10 or more Apartments | 0 (0.0%) | 0 (0.0%) |
| Mobile Home / Other | 82 (87.2%) | 12 (12.8%) |
| Total | 660 (73.9%) | 233 (26.1%) |
Housing Structures by Number of Rooms in Merkel
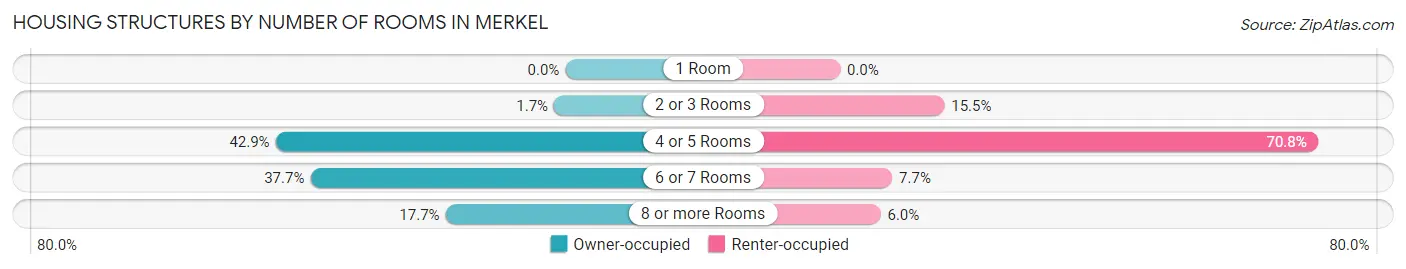
| Number of Rooms | Owner-occupied | Renter-occupied |
| 1 Room | 0 (0.0%) | 0 (0.0%) |
| 2 or 3 Rooms | 11 (1.7%) | 36 (15.4%) |
| 4 or 5 Rooms | 283 (42.9%) | 165 (70.8%) |
| 6 or 7 Rooms | 249 (37.7%) | 18 (7.7%) |
| 8 or more Rooms | 117 (17.7%) | 14 (6.0%) |
| Total | 660 (100.0%) | 233 (100.0%) |
Housing Structure by Heating Type in Merkel
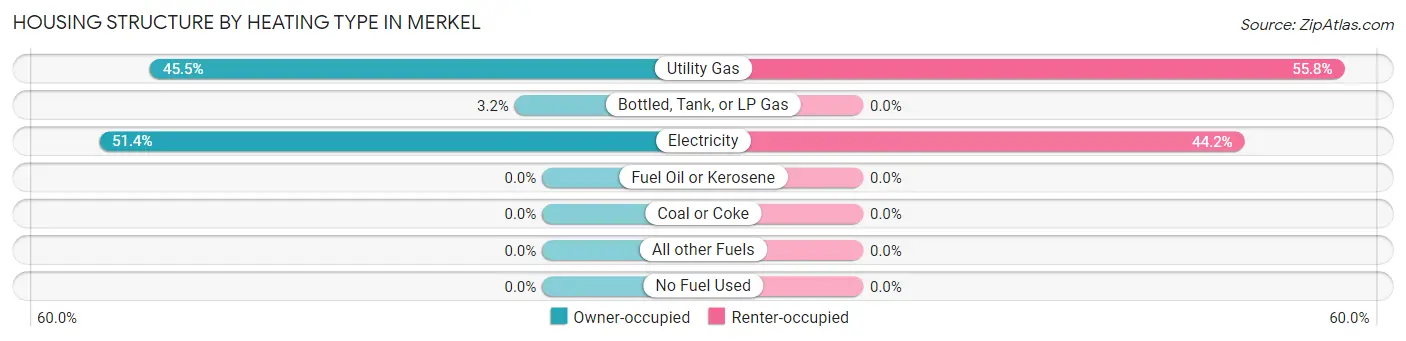
| Heating Type | Owner-occupied | Renter-occupied |
| Utility Gas | 300 (45.5%) | 130 (55.8%) |
| Bottled, Tank, or LP Gas | 21 (3.2%) | 0 (0.0%) |
| Electricity | 339 (51.4%) | 103 (44.2%) |
| Fuel Oil or Kerosene | 0 (0.0%) | 0 (0.0%) |
| Coal or Coke | 0 (0.0%) | 0 (0.0%) |
| All other Fuels | 0 (0.0%) | 0 (0.0%) |
| No Fuel Used | 0 (0.0%) | 0 (0.0%) |
| Total | 660 (100.0%) | 233 (100.0%) |
Household Vehicle Usage in Merkel
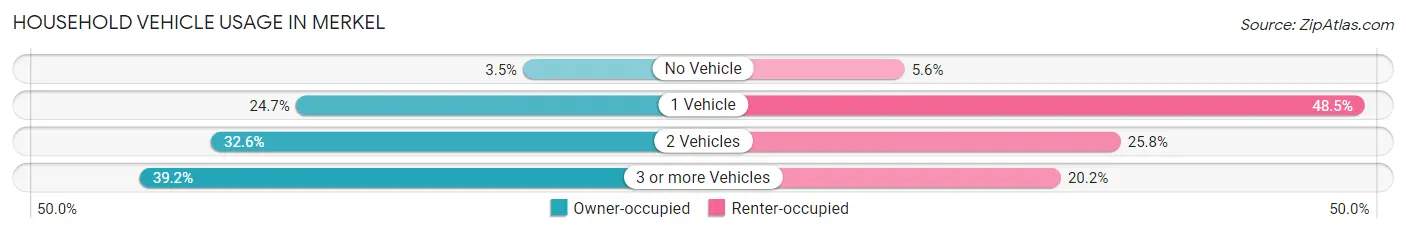
| Vehicles per Household | Owner-occupied | Renter-occupied |
| No Vehicle | 23 (3.5%) | 13 (5.6%) |
| 1 Vehicle | 163 (24.7%) | 113 (48.5%) |
| 2 Vehicles | 215 (32.6%) | 60 (25.8%) |
| 3 or more Vehicles | 259 (39.2%) | 47 (20.2%) |
| Total | 660 (100.0%) | 233 (100.0%) |
Real Estate & Mortgages in Merkel
Real Estate and Mortgage Overview in Merkel
| Characteristic | Without Mortgage | With Mortgage |
| Housing Units | 339 | 321 |
| Median Property Value | $68,800 | $150,200 |
| Median Household Income | $57,847 | $103 |
| Monthly Housing Costs | $472 | $3 |
| Real Estate Taxes | $613 | $20 |
Property Value by Mortgage Status in Merkel
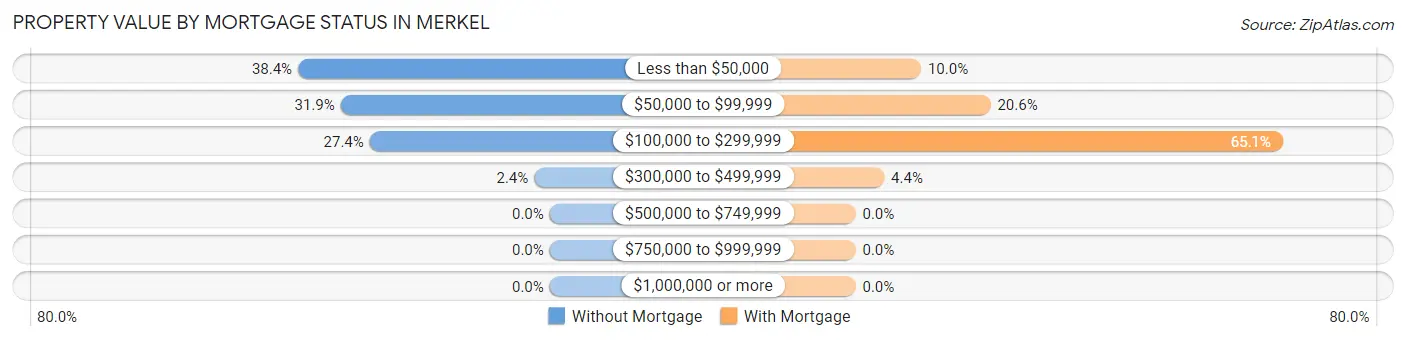
| Property Value | Without Mortgage | With Mortgage |
| Less than $50,000 | 130 (38.4%) | 32 (10.0%) |
| $50,000 to $99,999 | 108 (31.9%) | 66 (20.6%) |
| $100,000 to $299,999 | 93 (27.4%) | 209 (65.1%) |
| $300,000 to $499,999 | 8 (2.4%) | 14 (4.4%) |
| $500,000 to $749,999 | 0 (0.0%) | 0 (0.0%) |
| $750,000 to $999,999 | 0 (0.0%) | 0 (0.0%) |
| $1,000,000 or more | 0 (0.0%) | 0 (0.0%) |
| Total | 339 (100.0%) | 321 (100.0%) |
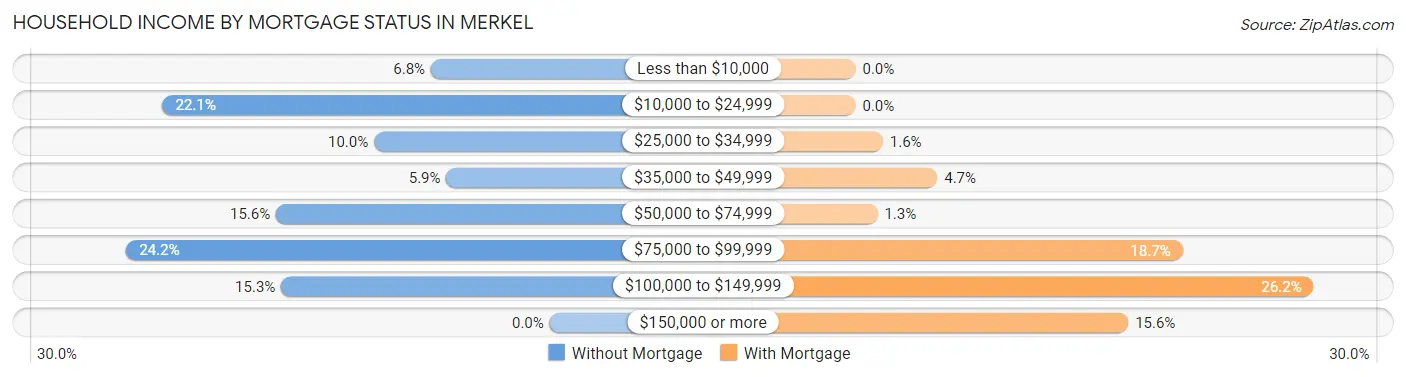
Household Income by Mortgage Status in Merkel
| Household Income | Without Mortgage | With Mortgage |
| Less than $10,000 | 23 (6.8%) | 0 (0.0%) |
| $10,000 to $24,999 | 75 (22.1%) | 0 (0.0%) |
| $25,000 to $34,999 | 34 (10.0%) | 5 (1.6%) |
| $35,000 to $49,999 | 20 (5.9%) | 15 (4.7%) |
| $50,000 to $74,999 | 53 (15.6%) | 4 (1.3%) |
| $75,000 to $99,999 | 82 (24.2%) | 60 (18.7%) |
| $100,000 to $149,999 | 52 (15.3%) | 84 (26.2%) |
| $150,000 or more | 0 (0.0%) | 50 (15.6%) |
| Total | 339 (100.0%) | 321 (100.0%) |
Property Value to Household Income Ratio in Merkel
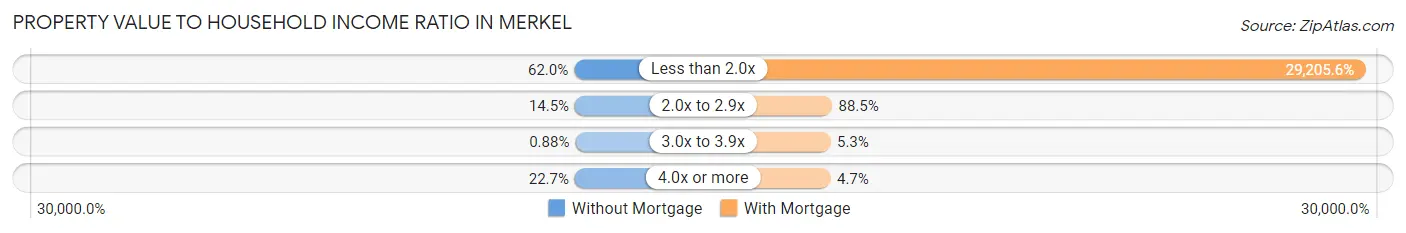
| Value-to-Income Ratio | Without Mortgage | With Mortgage |
| Less than 2.0x | 210 (62.0%) | 93,750 (29,205.6%) |
| 2.0x to 2.9x | 49 (14.4%) | 284 (88.5%) |
| 3.0x to 3.9x | 3 (0.9%) | 17 (5.3%) |
| 4.0x or more | 77 (22.7%) | 15 (4.7%) |
| Total | 339 (100.0%) | 321 (100.0%) |
Real Estate Taxes by Mortgage Status in Merkel
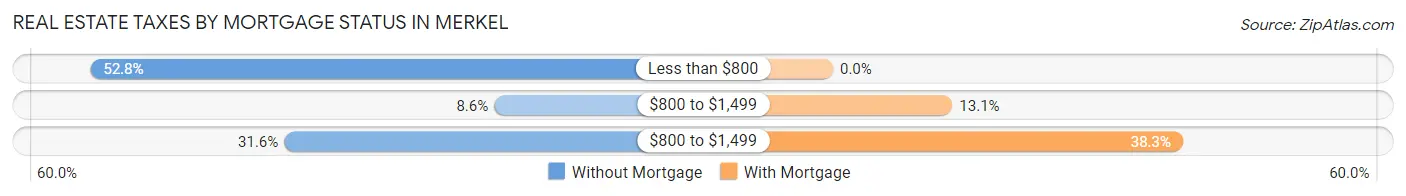
| Property Taxes | Without Mortgage | With Mortgage |
| Less than $800 | 179 (52.8%) | 0 (0.0%) |
| $800 to $1,499 | 29 (8.6%) | 42 (13.1%) |
| $800 to $1,499 | 107 (31.6%) | 123 (38.3%) |
| Total | 339 (100.0%) | 321 (100.0%) |
Health & Disability in Merkel
Health Insurance Coverage by Age in Merkel
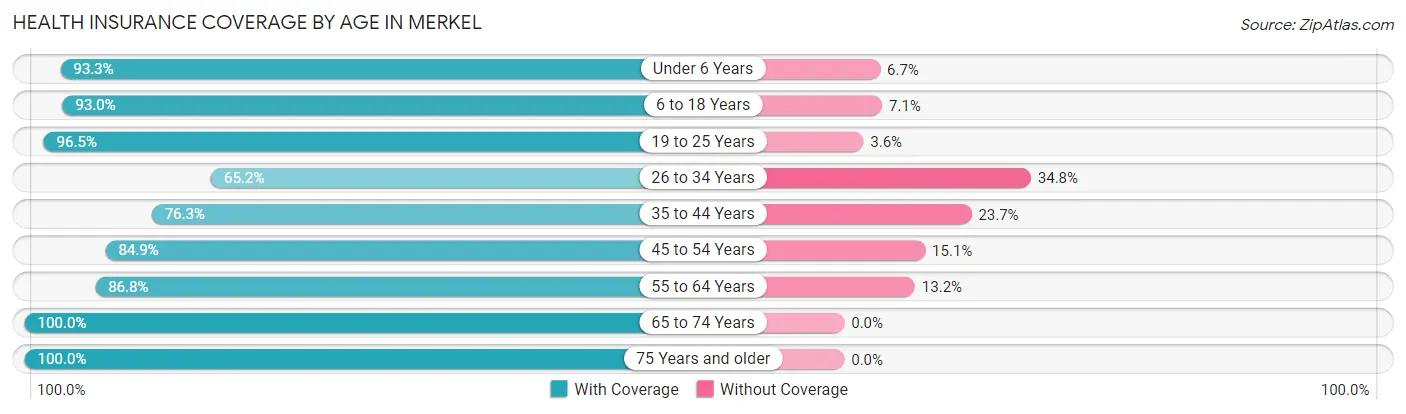
| Age Bracket | With Coverage | Without Coverage |
| Under 6 Years | 280 (93.3%) | 20 (6.7%) |
| 6 to 18 Years | 554 (92.9%) | 42 (7.0%) |
| 19 to 25 Years | 163 (96.5%) | 6 (3.5%) |
| 26 to 34 Years | 238 (65.2%) | 127 (34.8%) |
| 35 to 44 Years | 267 (76.3%) | 83 (23.7%) |
| 45 to 54 Years | 276 (84.9%) | 49 (15.1%) |
| 55 to 64 Years | 178 (86.8%) | 27 (13.2%) |
| 65 to 74 Years | 193 (100.0%) | 0 (0.0%) |
| 75 Years and older | 84 (100.0%) | 0 (0.0%) |
| Total | 2,233 (86.3%) | 354 (13.7%) |
Health Insurance Coverage by Citizenship Status in Merkel
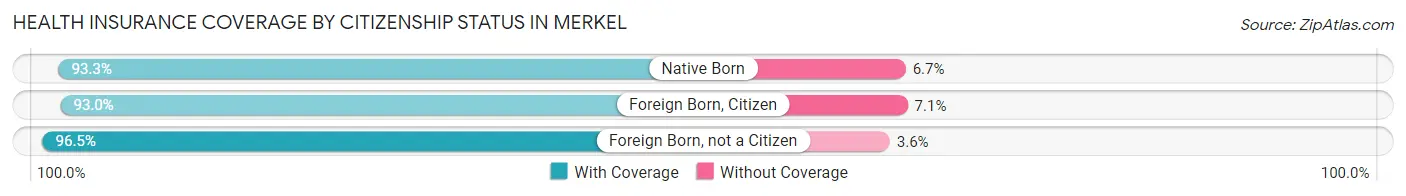
| Citizenship Status | With Coverage | Without Coverage |
| Native Born | 280 (93.3%) | 20 (6.7%) |
| Foreign Born, Citizen | 554 (92.9%) | 42 (7.0%) |
| Foreign Born, not a Citizen | 163 (96.5%) | 6 (3.5%) |
Health Insurance Coverage by Household Income in Merkel
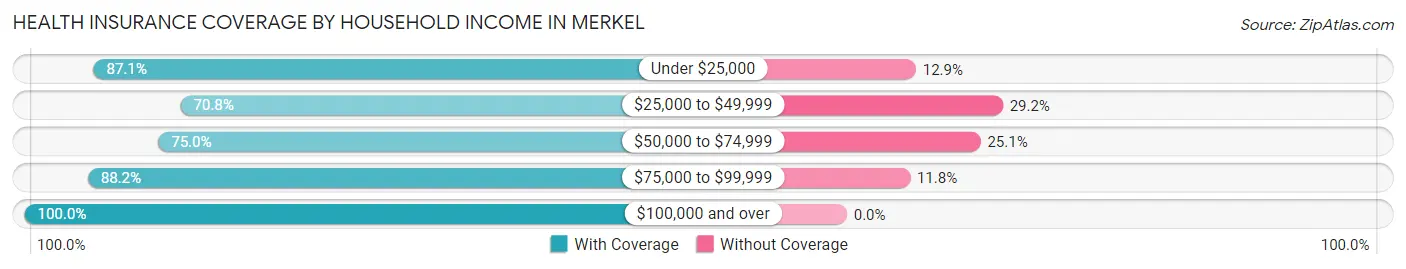
| Household Income | With Coverage | Without Coverage |
| Under $25,000 | 303 (87.1%) | 45 (12.9%) |
| $25,000 to $49,999 | 286 (70.8%) | 118 (29.2%) |
| $50,000 to $74,999 | 344 (75.0%) | 115 (25.1%) |
| $75,000 to $99,999 | 566 (88.2%) | 76 (11.8%) |
| $100,000 and over | 734 (100.0%) | 0 (0.0%) |
Public vs Private Health Insurance Coverage by Age in Merkel
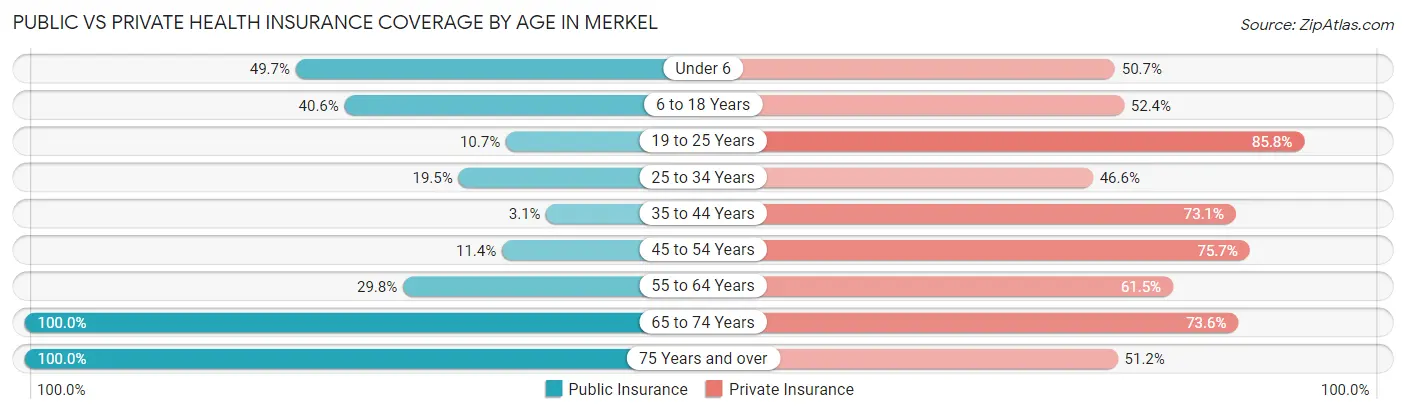
| Age Bracket | Public Insurance | Private Insurance |
| Under 6 | 149 (49.7%) | 152 (50.7%) |
| 6 to 18 Years | 242 (40.6%) | 312 (52.3%) |
| 19 to 25 Years | 18 (10.6%) | 145 (85.8%) |
| 25 to 34 Years | 71 (19.5%) | 170 (46.6%) |
| 35 to 44 Years | 11 (3.1%) | 256 (73.1%) |
| 45 to 54 Years | 37 (11.4%) | 246 (75.7%) |
| 55 to 64 Years | 61 (29.8%) | 126 (61.5%) |
| 65 to 74 Years | 193 (100.0%) | 142 (73.6%) |
| 75 Years and over | 84 (100.0%) | 43 (51.2%) |
| Total | 866 (33.5%) | 1,592 (61.5%) |
Disability Status by Sex by Age in Merkel
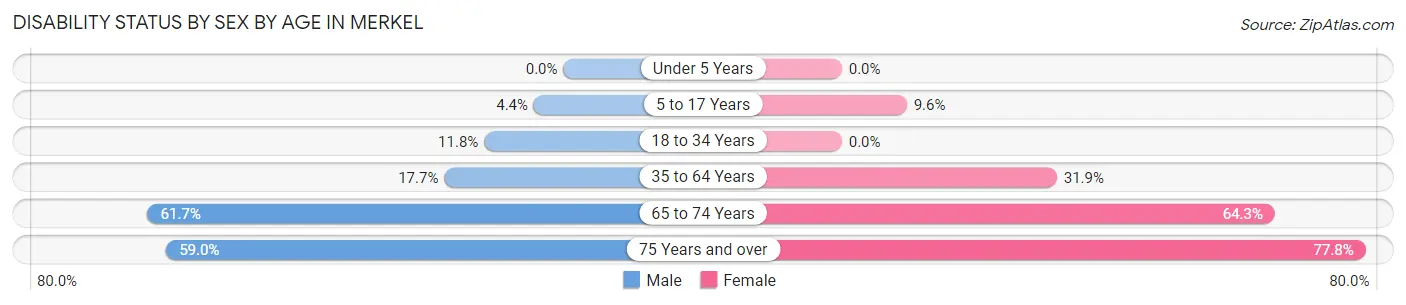
| Age Bracket | Male | Female |
| Under 5 Years | 0 (0.0%) | 0 (0.0%) |
| 5 to 17 Years | 11 (4.4%) | 40 (9.6%) |
| 18 to 34 Years | 34 (11.8%) | 0 (0.0%) |
| 35 to 64 Years | 72 (17.7%) | 151 (31.9%) |
| 65 to 74 Years | 50 (61.7%) | 72 (64.3%) |
| 75 Years and over | 23 (59.0%) | 35 (77.8%) |
Disability Class by Sex by Age in Merkel
Disability Class: Hearing Difficulty
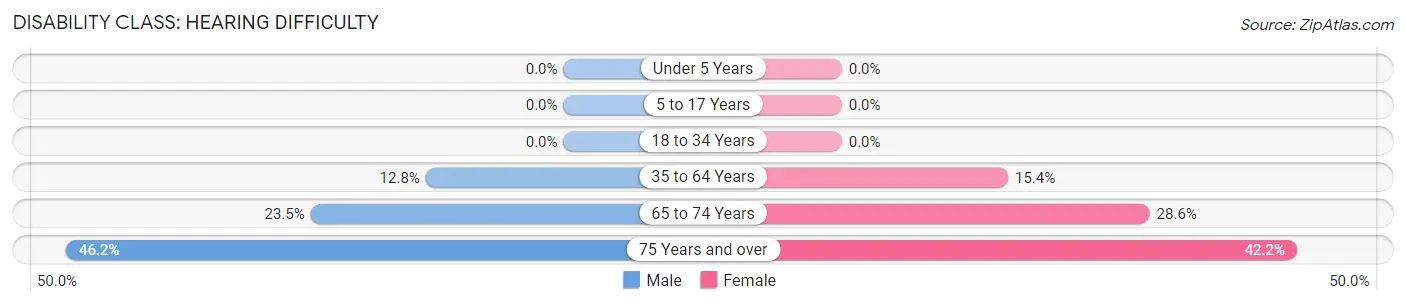
| Age Bracket | Male | Female |
| Under 5 Years | 0 (0.0%) | 0 (0.0%) |
| 5 to 17 Years | 0 (0.0%) | 0 (0.0%) |
| 18 to 34 Years | 0 (0.0%) | 0 (0.0%) |
| 35 to 64 Years | 52 (12.8%) | 73 (15.4%) |
| 65 to 74 Years | 19 (23.5%) | 32 (28.6%) |
| 75 Years and over | 18 (46.2%) | 19 (42.2%) |
Disability Class: Vision Difficulty
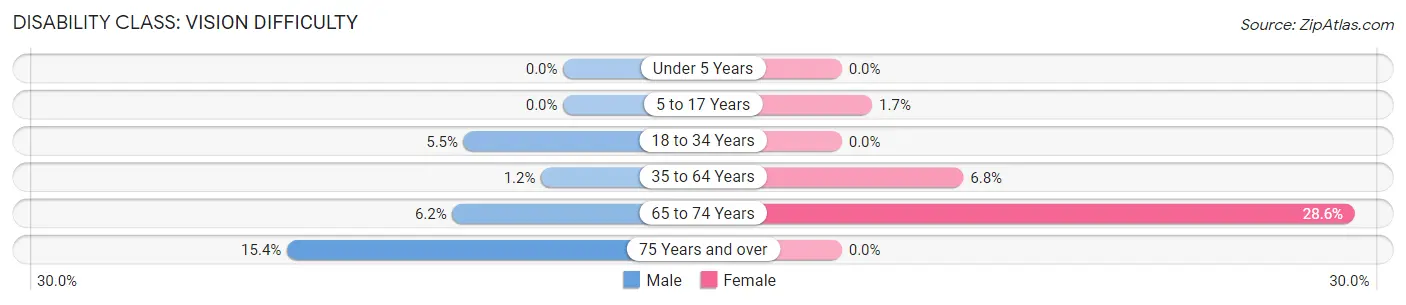
| Age Bracket | Male | Female |
| Under 5 Years | 0 (0.0%) | 0 (0.0%) |
| 5 to 17 Years | 0 (0.0%) | 7 (1.7%) |
| 18 to 34 Years | 16 (5.5%) | 0 (0.0%) |
| 35 to 64 Years | 5 (1.2%) | 32 (6.8%) |
| 65 to 74 Years | 5 (6.2%) | 32 (28.6%) |
| 75 Years and over | 6 (15.4%) | 0 (0.0%) |
Disability Class: Cognitive Difficulty
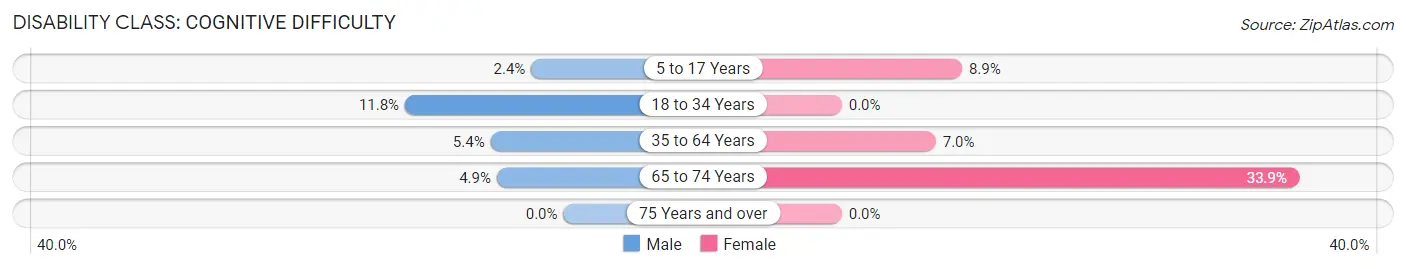
| Age Bracket | Male | Female |
| 5 to 17 Years | 6 (2.4%) | 37 (8.9%) |
| 18 to 34 Years | 34 (11.8%) | 0 (0.0%) |
| 35 to 64 Years | 22 (5.4%) | 33 (7.0%) |
| 65 to 74 Years | 4 (4.9%) | 38 (33.9%) |
| 75 Years and over | 0 (0.0%) | 0 (0.0%) |
Disability Class: Ambulatory Difficulty
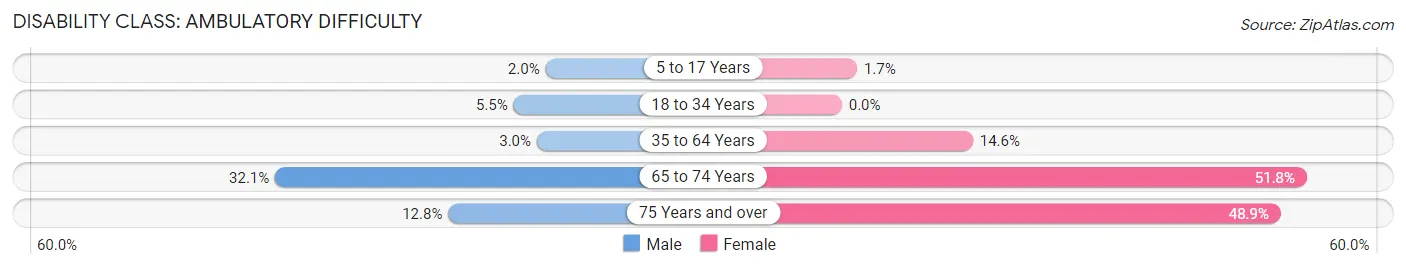
| Age Bracket | Male | Female |
| 5 to 17 Years | 5 (2.0%) | 7 (1.7%) |
| 18 to 34 Years | 16 (5.5%) | 0 (0.0%) |
| 35 to 64 Years | 12 (2.9%) | 69 (14.6%) |
| 65 to 74 Years | 26 (32.1%) | 58 (51.8%) |
| 75 Years and over | 5 (12.8%) | 22 (48.9%) |
Disability Class: Self-Care Difficulty
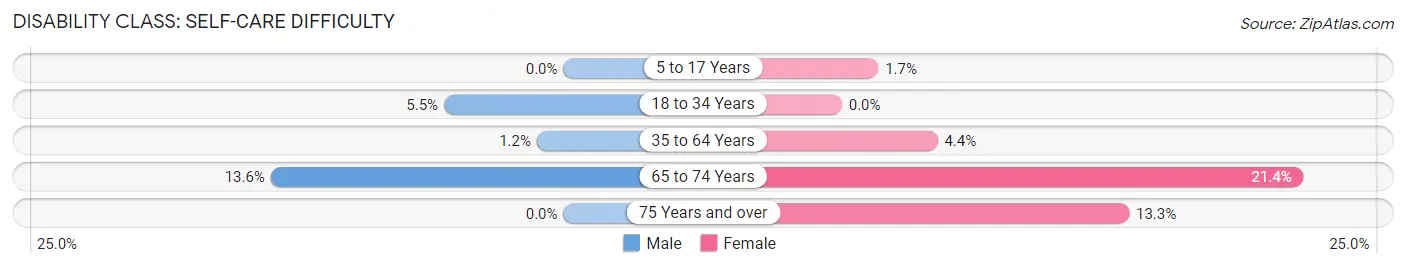
| Age Bracket | Male | Female |
| 5 to 17 Years | 0 (0.0%) | 7 (1.7%) |
| 18 to 34 Years | 16 (5.5%) | 0 (0.0%) |
| 35 to 64 Years | 5 (1.2%) | 21 (4.4%) |
| 65 to 74 Years | 11 (13.6%) | 24 (21.4%) |
| 75 Years and over | 0 (0.0%) | 6 (13.3%) |
Technology Access in Merkel
Computing Device Access in Merkel
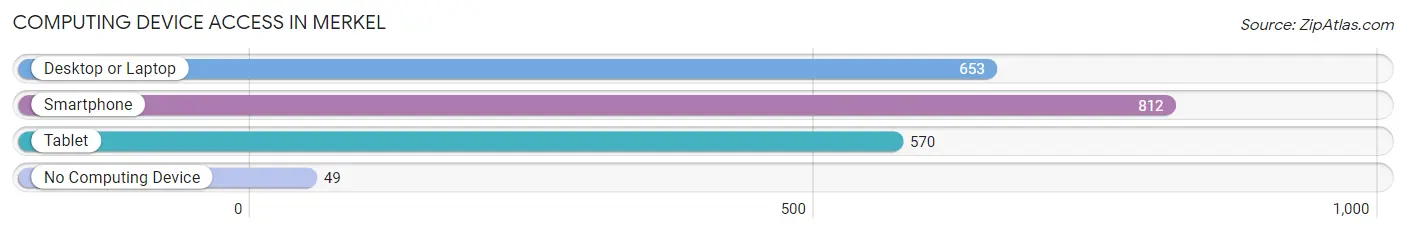
| Device Type | # Households | % Households |
| Desktop or Laptop | 653 | 73.1% |
| Smartphone | 812 | 90.9% |
| Tablet | 570 | 63.8% |
| No Computing Device | 49 | 5.5% |
| Total | 893 | 100.0% |
Internet Access in Merkel
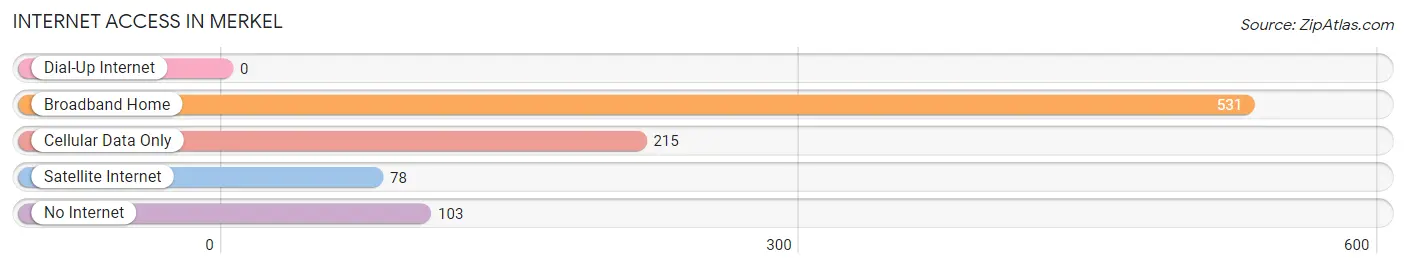
| Internet Type | # Households | % Households |
| Dial-Up Internet | 0 | 0.0% |
| Broadband Home | 531 | 59.5% |
| Cellular Data Only | 215 | 24.1% |
| Satellite Internet | 78 | 8.7% |
| No Internet | 103 | 11.5% |
| Total | 893 | 100.0% |
Merkel Summary
Merkel, Texas is a small city located in Taylor County, Texas. It is situated about 15 miles west of Abilene and is part of the Abilene Metropolitan Statistical Area. The city was founded in 1891 and was named after George Merkel, a German immigrant who settled in the area in the late 1800s. As of the 2010 census, the population of Merkel was 1,845.
History
Merkel was founded in 1891 by German immigrant George Merkel. He had moved to the area from Germany in 1885 and had purchased a large tract of land. He then began to subdivide the land and sell it to other settlers. The town was originally called Merkel's Store, but the name was changed to Merkel in 1895.
The town grew quickly and by 1900, it had a population of over 500. The town was incorporated in 1909 and by 1910, the population had grown to 1,000.
In the early 1900s, Merkel was a thriving agricultural community. Cotton was the main crop grown in the area and the town had several cotton gins and a cottonseed oil mill. The town also had several stores, a bank, a hotel, a school, and a post office.
In the 1920s, the town began to decline as the cotton industry declined. The population dropped to just over 500 by 1930. The town continued to decline until the 1950s when the oil industry began to boom in the area. This brought new jobs and new people to the area and the population began to grow again.
Geography
Merkel is located in Taylor County, Texas. It is situated about 15 miles west of Abilene and is part of the Abilene Metropolitan Statistical Area. The city is located at the intersection of U.S. Highway 83 and State Highway 351.
The city has a total area of 2.2 square miles, all of which is land. The terrain is mostly flat with some rolling hills. The climate is semi-arid with hot summers and mild winters.
Economy
The economy of Merkel is largely based on agriculture and oil and gas production. The town is home to several cotton gins and a cottonseed oil mill. The oil and gas industry is also a major employer in the area.
The town also has several retail stores, restaurants, and other businesses. The town is also home to a branch of the Abilene Independent School District.
Demographics
As of the 2010 census, the population of Merkel was 1,845. The racial makeup of the city was 79.3% White, 0.3% African American, 0.2% Native American, 0.2% Asian, 0.1% Pacific Islander, 17.7% from other races, and 2.4% from two or more races. Hispanic or Latino of any race were 33.2% of the population.
The median household income in Merkel was $37,917 and the median family income was $45,000. The per capita income was $17,917. About 17.2% of families and 20.3% of the population were below the poverty line, including 28.3% of those under age 18 and 11.2% of those age 65 or over.
Common Questions
What is Per Capita Income in Merkel?
Per Capita income in Merkel is $27,356.
What is the Median Family Income in Merkel?
Median Family Income in Merkel is $78,784.
What is the Median Household income in Merkel?
Median Household Income in Merkel is $67,159.
What is Income or Wage Gap in Merkel?
Income or Wage Gap in Merkel is 43.2%.
Women in Merkel earn 56.8 cents for every dollar earned by a man.
What is Family Income Deficit in Merkel?
Family Income Deficit in Merkel is $8,366.
Families that are below poverty line in Merkel earn $8,366 less on average than the poverty threshold level.
What is Inequality or Gini Index in Merkel?
Inequality or Gini Index in Merkel is 0.41.
What is the Total Population of Merkel?
Total Population of Merkel is 2,646.
What is the Total Male Population of Merkel?
Total Male Population of Merkel is 1,181.
What is the Total Female Population of Merkel?
Total Female Population of Merkel is 1,465.
What is the Ratio of Males per 100 Females in Merkel?
There are 80.61 Males per 100 Females in Merkel.
What is the Ratio of Females per 100 Males in Merkel?
There are 124.05 Females per 100 Males in Merkel.
What is the Median Population Age in Merkel?
Median Population Age in Merkel is 31.7 Years.
What is the Average Family Size in Merkel
Average Family Size in Merkel is 3.5 People.
What is the Average Household Size in Merkel
Average Household Size in Merkel is 2.9 People.
How Large is the Labor Force in Merkel?
There are 1,264 People in the Labor Forcein in Merkel.
What is the Percentage of People in the Labor Force in Merkel?
67.1% of People are in the Labor Force in Merkel.
What is the Unemployment Rate in Merkel?
Unemployment Rate in Merkel is 1.9%.