Menard, TX Map & Demographics
Menard Map
Menard Overview
$24,854
PER CAPITA INCOME
$61,477
AVG FAMILY INCOME
$37,601
AVG HOUSEHOLD INCOME
40.8%
WAGE / INCOME GAP [ % ]
59.2¢/ $1
WAGE / INCOME GAP [ $ ]
0.45
INEQUALITY / GINI INDEX
1,356
TOTAL POPULATION
667
MALE POPULATION
689
FEMALE POPULATION
96.81
MALES / 100 FEMALES
103.30
FEMALES / 100 MALES
59.0
MEDIAN AGE
3.0
AVG FAMILY SIZE
1.9
AVG HOUSEHOLD SIZE
587
LABOR FORCE [ PEOPLE ]
50.0%
PERCENT IN LABOR FORCE
8.0%
UNEMPLOYMENT RATE
Menard Zip Codes
Menard Area Codes
Income in Menard
Income Overview in Menard
Per Capita Income in Menard is $24,854, while median incomes of families and households are $61,477 and $37,601 respectively.
| Characteristic | Number | Measure |
| Per Capita Income | 1,356 | $24,854 |
| Median Family Income | 297 | $61,477 |
| Mean Family Income | 297 | $69,278 |
| Median Household Income | 705 | $37,601 |
| Mean Household Income | 705 | $45,797 |
| Income Deficit | 297 | $0 |
| Wage / Income Gap (%) | 1,356 | 40.77% |
| Wage / Income Gap ($) | 1,356 | 59.23¢ per $1 |
| Gini / Inequality Index | 1,356 | 0.45 |
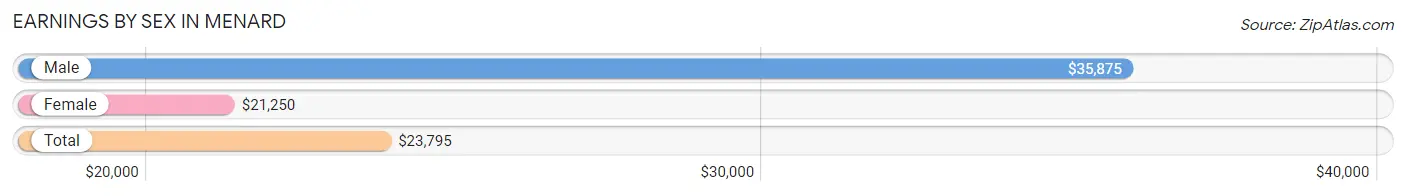
Earnings by Sex in Menard
Average Earnings in Menard are $23,795, $35,875 for men and $21,250 for women, a difference of 40.8%.
| Sex | Number | Average Earnings |
| Male | 365 (60.3%) | $35,875 |
| Female | 240 (39.7%) | $21,250 |
| Total | 605 (100.0%) | $23,795 |
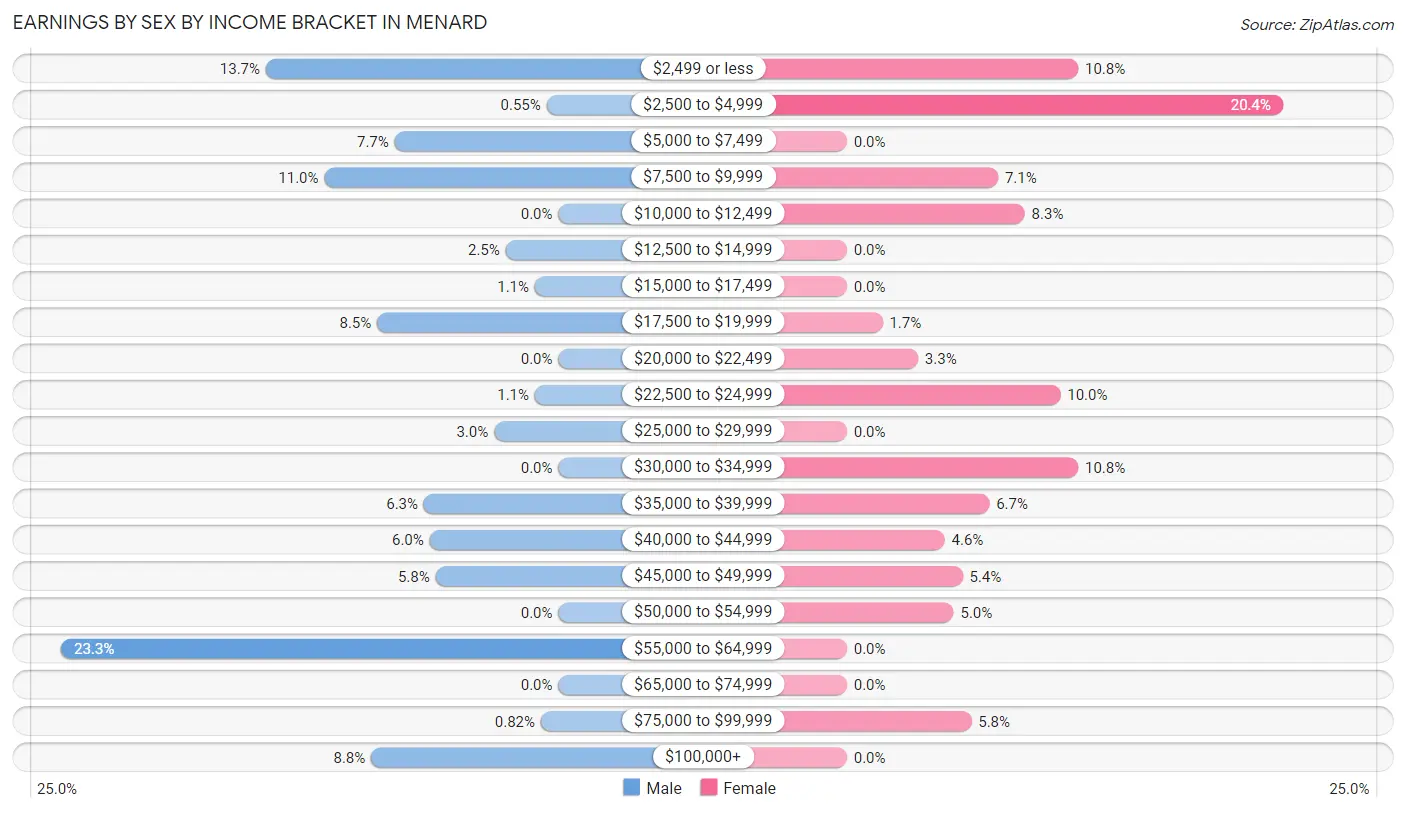
Earnings by Sex by Income Bracket in Menard
The most common earnings brackets in Menard are $55,000 to $64,999 for men (85 | 23.3%) and $2,500 to $4,999 for women (49 | 20.4%).
| Income | Male | Female |
| $2,499 or less | 50 (13.7%) | 26 (10.8%) |
| $2,500 to $4,999 | 2 (0.5%) | 49 (20.4%) |
| $5,000 to $7,499 | 28 (7.7%) | 0 (0.0%) |
| $7,500 to $9,999 | 40 (11.0%) | 17 (7.1%) |
| $10,000 to $12,499 | 0 (0.0%) | 20 (8.3%) |
| $12,500 to $14,999 | 9 (2.5%) | 0 (0.0%) |
| $15,000 to $17,499 | 4 (1.1%) | 0 (0.0%) |
| $17,500 to $19,999 | 31 (8.5%) | 4 (1.7%) |
| $20,000 to $22,499 | 0 (0.0%) | 8 (3.3%) |
| $22,500 to $24,999 | 4 (1.1%) | 24 (10.0%) |
| $25,000 to $29,999 | 11 (3.0%) | 0 (0.0%) |
| $30,000 to $34,999 | 0 (0.0%) | 26 (10.8%) |
| $35,000 to $39,999 | 23 (6.3%) | 16 (6.7%) |
| $40,000 to $44,999 | 22 (6.0%) | 11 (4.6%) |
| $45,000 to $49,999 | 21 (5.8%) | 13 (5.4%) |
| $50,000 to $54,999 | 0 (0.0%) | 12 (5.0%) |
| $55,000 to $64,999 | 85 (23.3%) | 0 (0.0%) |
| $65,000 to $74,999 | 0 (0.0%) | 0 (0.0%) |
| $75,000 to $99,999 | 3 (0.8%) | 14 (5.8%) |
| $100,000+ | 32 (8.8%) | 0 (0.0%) |
| Total | 365 (100.0%) | 240 (100.0%) |
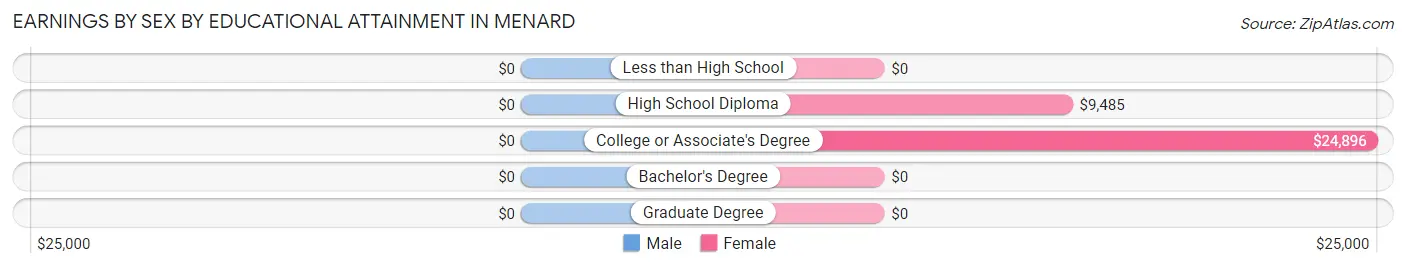
Earnings by Sex by Educational Attainment in Menard
| Educational Attainment | Male Income | Female Income |
| Less than High School | - | - |
| High School Diploma | - | - |
| College or Associate's Degree | - | - |
| Bachelor's Degree | - | - |
| Graduate Degree | - | - |
| Total | $37,500 | $24,948 |
Family Income in Menard
Family Income Brackets in Menard
According to the Menard family income data, there are 80 families falling into the $75,000 to $99,999 income range, which is the most common income bracket and makes up 26.9% of all families.
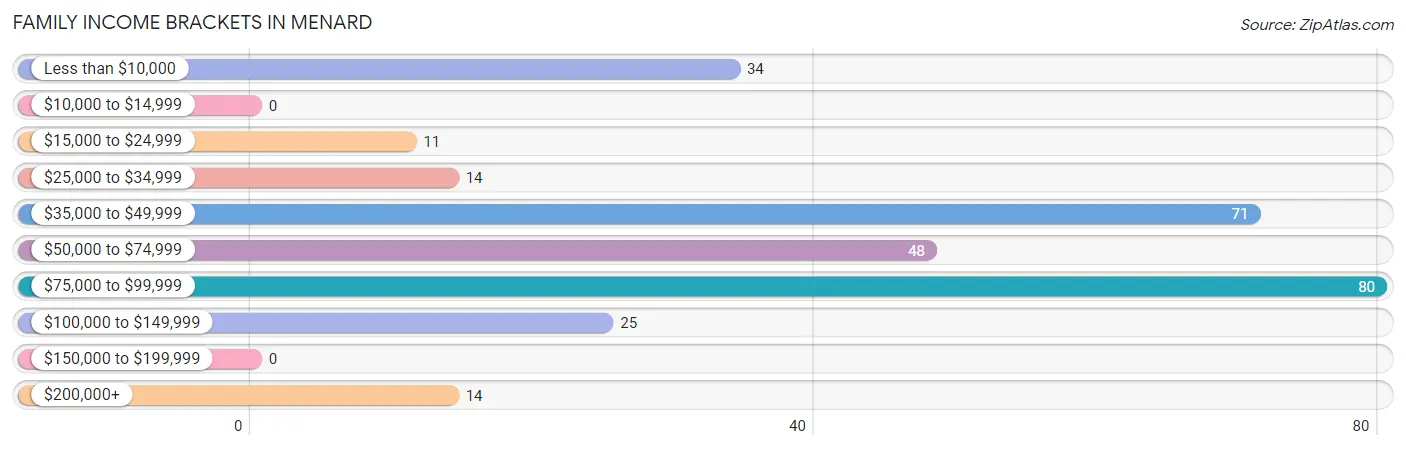
| Income Bracket | # Families | % Families |
| Less than $10,000 | 34 | 11.4% |
| $10,000 to $14,999 | 0 | 0.0% |
| $15,000 to $24,999 | 11 | 3.7% |
| $25,000 to $34,999 | 14 | 4.7% |
| $35,000 to $49,999 | 71 | 23.9% |
| $50,000 to $74,999 | 48 | 16.2% |
| $75,000 to $99,999 | 80 | 26.9% |
| $100,000 to $149,999 | 25 | 8.4% |
| $150,000 to $199,999 | 0 | 0.0% |
| $200,000+ | 14 | 4.7% |
Family Income by Famaliy Size in Menard
4-person families (22 | 7.4%) account for the highest median family income in Menard with $75,000 per family, while 2-person families (198 | 66.7%) have the highest median income of $22,916 per family member.
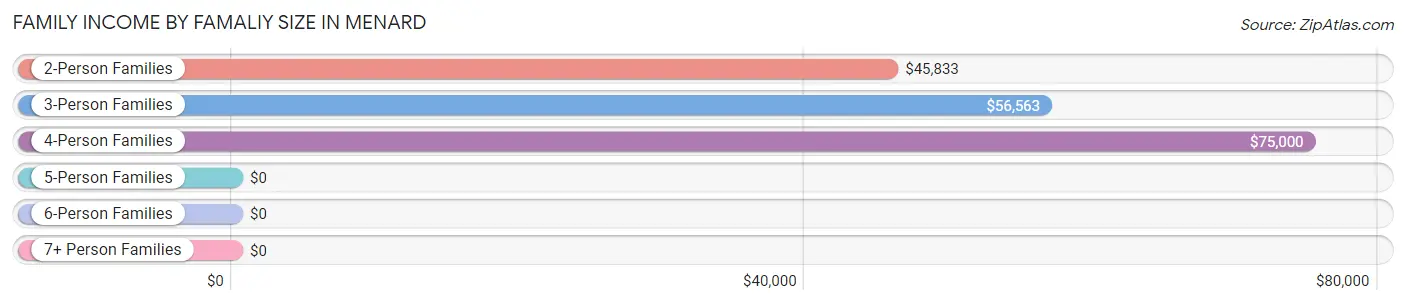
| Income Bracket | # Families | Median Income |
| 2-Person Families | 198 (66.7%) | $45,833 |
| 3-Person Families | 43 (14.5%) | $56,563 |
| 4-Person Families | 22 (7.4%) | $75,000 |
| 5-Person Families | 0 (0.0%) | $0 |
| 6-Person Families | 34 (11.5%) | $0 |
| 7+ Person Families | 0 (0.0%) | $0 |
| Total | 297 (100.0%) | $61,477 |
Family Income by Number of Earners in Menard
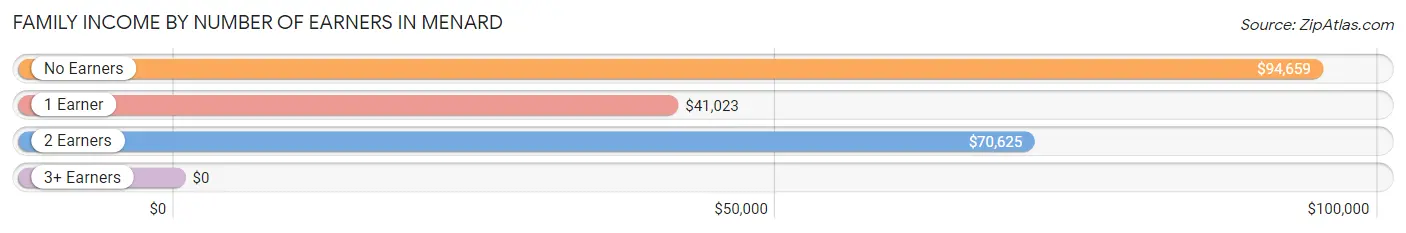
| Number of Earners | # Families | Median Income |
| No Earners | 49 (16.5%) | $94,659 |
| 1 Earner | 155 (52.2%) | $41,023 |
| 2 Earners | 77 (25.9%) | $70,625 |
| 3+ Earners | 16 (5.4%) | $0 |
| Total | 297 (100.0%) | $61,477 |
Household Income in Menard
Household Income Brackets in Menard
With 126 households falling in the category, the $15,000 to $24,999 income range is the most frequent in Menard, accounting for 17.9% of all households.
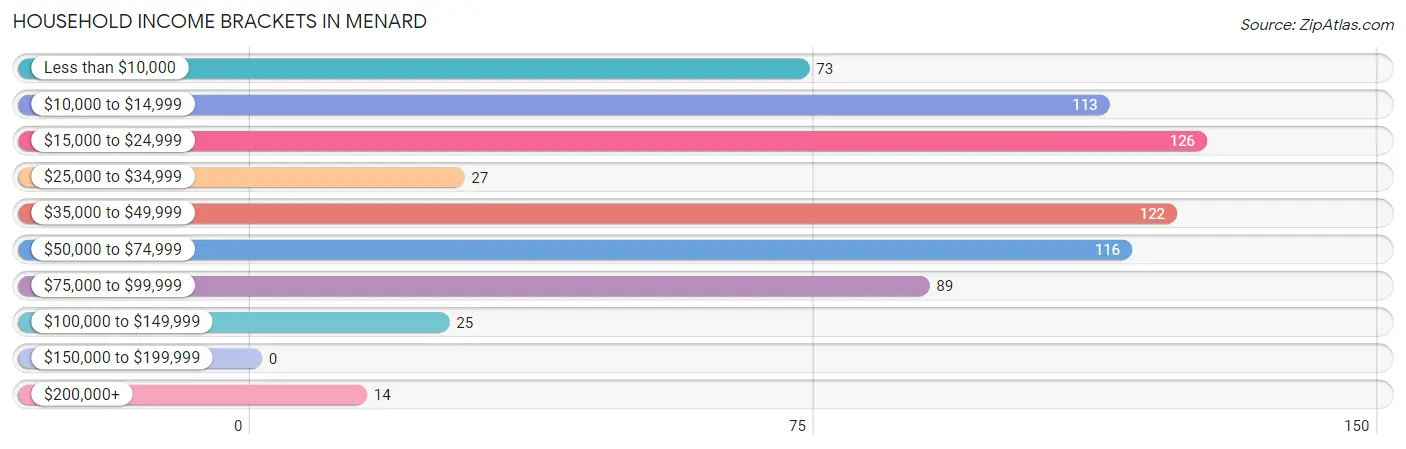
| Income Bracket | # Households | % Households |
| Less than $10,000 | 73 | 10.4% |
| $10,000 to $14,999 | 113 | 16.0% |
| $15,000 to $24,999 | 126 | 17.9% |
| $25,000 to $34,999 | 27 | 3.8% |
| $35,000 to $49,999 | 122 | 17.3% |
| $50,000 to $74,999 | 116 | 16.5% |
| $75,000 to $99,999 | 89 | 12.6% |
| $100,000 to $149,999 | 25 | 3.5% |
| $150,000 to $199,999 | 0 | 0.0% |
| $200,000+ | 14 | 2.0% |
Household Income by Householder Age in Menard
The median household income in Menard is $37,601, with the highest median household income of $58,005 found in the 25 to 44 years age bracket for the primary householder. A total of 119 households (16.9%) fall into this category. Meanwhile, the 15 to 24 years age bracket for the primary householder has the lowest median household income of $0, with 18 households (2.5%) in this group.
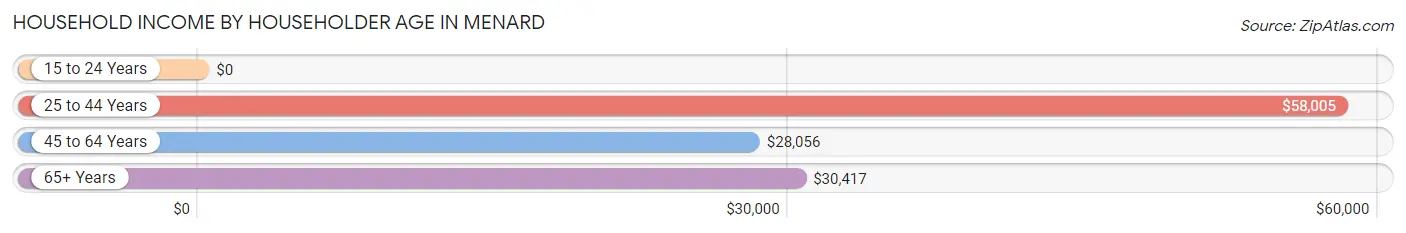
| Income Bracket | # Households | Median Income |
| 15 to 24 Years | 18 (2.5%) | $0 |
| 25 to 44 Years | 119 (16.9%) | $58,005 |
| 45 to 64 Years | 220 (31.2%) | $28,056 |
| 65+ Years | 348 (49.4%) | $30,417 |
| Total | 705 (100.0%) | $37,601 |
Poverty in Menard
Income Below Poverty by Sex and Age in Menard
With 17.4% poverty level for males and 30.1% for females among the residents of Menard, under 5 year old males and 12 to 14 year old females are the most vulnerable to poverty, with 12 males (100.0%) and 21 females (45.7%) in their respective age groups living below the poverty level.
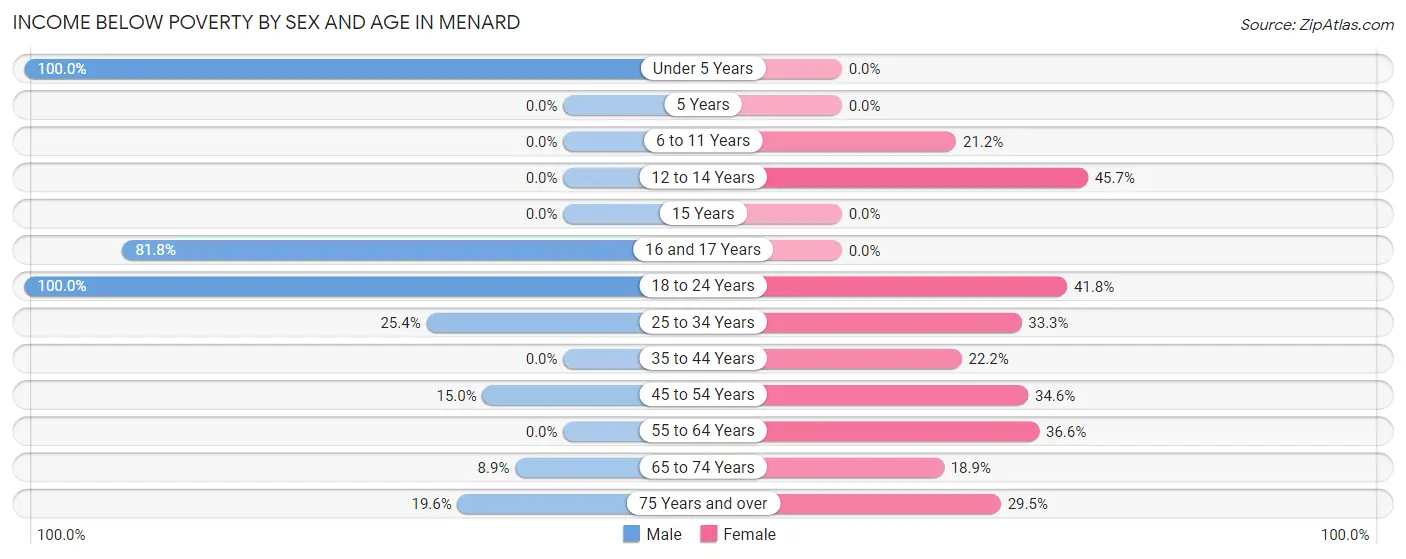
| Age Bracket | Male | Female |
| Under 5 Years | 12 (100.0%) | 0 (0.0%) |
| 5 Years | 0 (0.0%) | 0 (0.0%) |
| 6 to 11 Years | 0 (0.0%) | 7 (21.2%) |
| 12 to 14 Years | 0 (0.0%) | 21 (45.7%) |
| 15 Years | 0 (0.0%) | 0 (0.0%) |
| 16 and 17 Years | 18 (81.8%) | 0 (0.0%) |
| 18 to 24 Years | 9 (100.0%) | 23 (41.8%) |
| 25 to 34 Years | 32 (25.4%) | 11 (33.3%) |
| 35 to 44 Years | 0 (0.0%) | 8 (22.2%) |
| 45 to 54 Years | 9 (15.0%) | 28 (34.6%) |
| 55 to 64 Years | 0 (0.0%) | 41 (36.6%) |
| 65 to 74 Years | 10 (8.9%) | 21 (18.9%) |
| 75 Years and over | 22 (19.6%) | 41 (29.5%) |
| Total | 112 (17.4%) | 201 (30.1%) |
Income Above Poverty by Sex and Age in Menard
According to the poverty statistics in Menard, males aged 5 years and females aged under 5 years are the age groups that are most secure financially, with 100.0% of males and 100.0% of females in these age groups living above the poverty line.
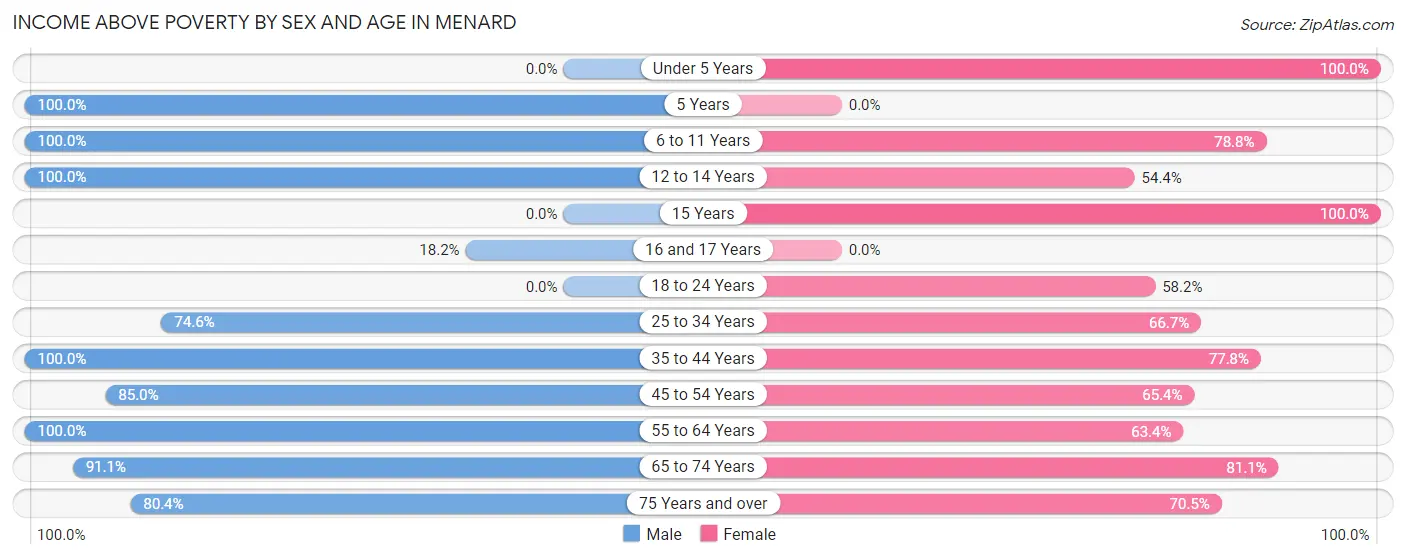
| Age Bracket | Male | Female |
| Under 5 Years | 0 (0.0%) | 8 (100.0%) |
| 5 Years | 13 (100.0%) | 0 (0.0%) |
| 6 to 11 Years | 39 (100.0%) | 26 (78.8%) |
| 12 to 14 Years | 18 (100.0%) | 25 (54.3%) |
| 15 Years | 0 (0.0%) | 13 (100.0%) |
| 16 and 17 Years | 4 (18.2%) | 0 (0.0%) |
| 18 to 24 Years | 0 (0.0%) | 32 (58.2%) |
| 25 to 34 Years | 94 (74.6%) | 22 (66.7%) |
| 35 to 44 Years | 38 (100.0%) | 28 (77.8%) |
| 45 to 54 Years | 51 (85.0%) | 53 (65.4%) |
| 55 to 64 Years | 81 (100.0%) | 71 (63.4%) |
| 65 to 74 Years | 102 (91.1%) | 90 (81.1%) |
| 75 Years and over | 90 (80.4%) | 98 (70.5%) |
| Total | 530 (82.6%) | 466 (69.9%) |
Income Below Poverty Among Married-Couple Families in Menard
The poverty statistics for married-couple families in Menard show that 3.3% or 7 of the total 212 families live below the poverty line. Families with no children have the highest poverty rate of 4.3%, comprising of 7 families. On the other hand, families with 1 or 2 children have the lowest poverty rate of 0.0%, which includes 0 families.
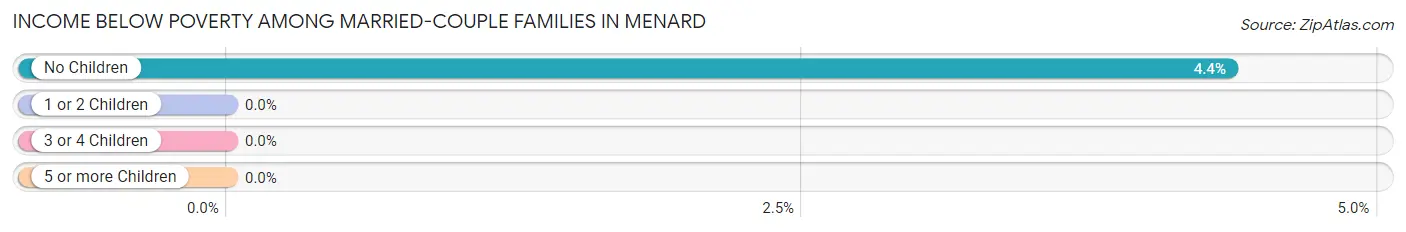
| Children | Above Poverty | Below Poverty |
| No Children | 154 (95.7%) | 7 (4.3%) |
| 1 or 2 Children | 51 (100.0%) | 0 (0.0%) |
| 3 or 4 Children | 0 (0.0%) | 0 (0.0%) |
| 5 or more Children | 0 (0.0%) | 0 (0.0%) |
| Total | 205 (96.7%) | 7 (3.3%) |
Income Below Poverty Among Single-Parent Households in Menard
According to the poverty data in Menard, 53.3% or 24 single-father households and 35.0% or 14 single-mother households are living below the poverty line. Among single-father households, those with 1 or 2 children have the highest poverty rate, with 15 households (100.0%) experiencing poverty. Likewise, among single-mother households, those with no children have the highest poverty rate, with 10 households (100.0%) falling below the poverty line.
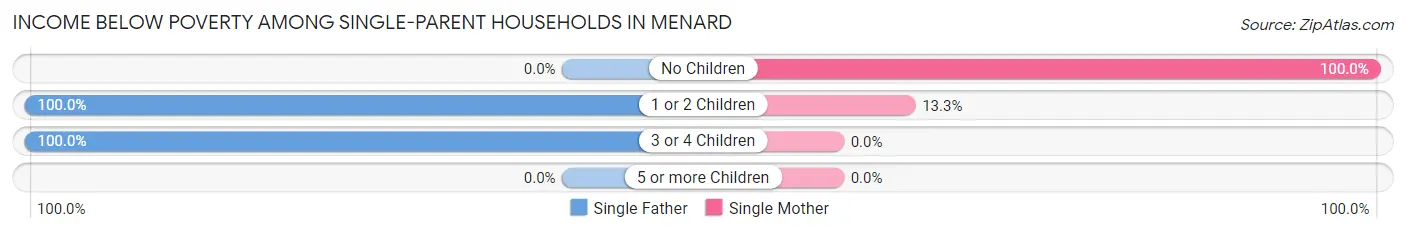
| Children | Single Father | Single Mother |
| No Children | 0 (0.0%) | 10 (100.0%) |
| 1 or 2 Children | 15 (100.0%) | 4 (13.3%) |
| 3 or 4 Children | 9 (100.0%) | 0 (0.0%) |
| 5 or more Children | 0 (0.0%) | 0 (0.0%) |
| Total | 24 (53.3%) | 14 (35.0%) |
Income Below Poverty Among Married-Couple vs Single-Parent Households in Menard
The poverty data for Menard shows that 7 of the married-couple family households (3.3%) and 38 of the single-parent households (44.7%) are living below the poverty level. Within the married-couple family households, those with no children have the highest poverty rate, with 7 households (4.3%) falling below the poverty line. Among the single-parent households, those with 3 or 4 children have the highest poverty rate, with 9 household (100.0%) living below poverty.
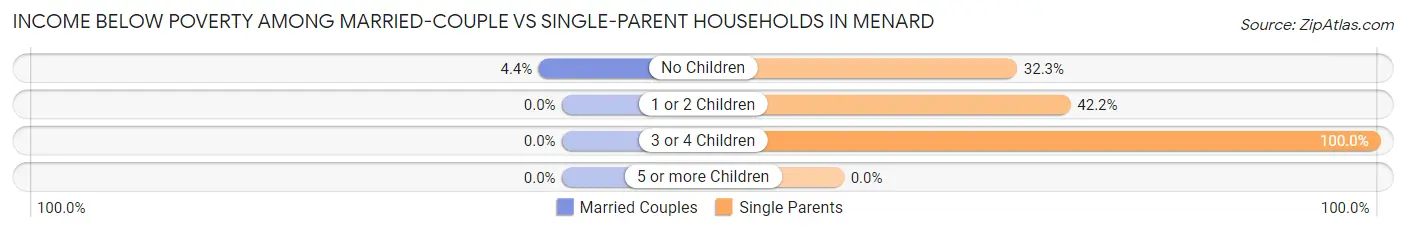
| Children | Married-Couple Families | Single-Parent Households |
| No Children | 7 (4.3%) | 10 (32.3%) |
| 1 or 2 Children | 0 (0.0%) | 19 (42.2%) |
| 3 or 4 Children | 0 (0.0%) | 9 (100.0%) |
| 5 or more Children | 0 (0.0%) | 0 (0.0%) |
| Total | 7 (3.3%) | 38 (44.7%) |
Race in Menard
The most populous races in Menard are White / Caucasian (1,009 | 74.4%), Hispanic or Latino (660 | 48.7%), and Two or more Races (243 | 17.9%).
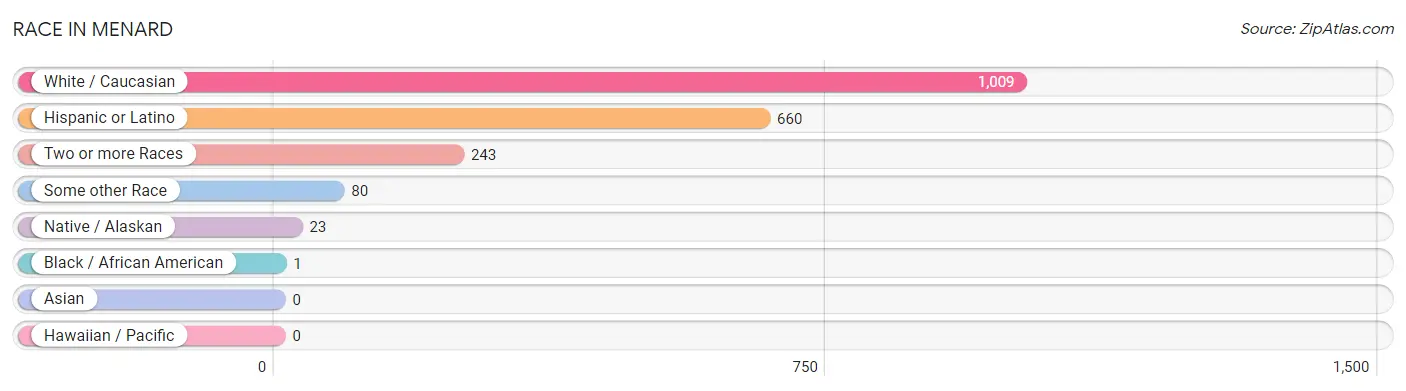
| Race | # Population | % Population |
| Asian | 0 | 0.0% |
| Black / African American | 1 | 0.1% |
| Hawaiian / Pacific | 0 | 0.0% |
| Hispanic or Latino | 660 | 48.7% |
| Native / Alaskan | 23 | 1.7% |
| White / Caucasian | 1,009 | 74.4% |
| Two or more Races | 243 | 17.9% |
| Some other Race | 80 | 5.9% |
| Total | 1,356 | 100.0% |
Ancestry in Menard
The most populous ancestries reported in Menard are Mexican (607 | 44.8%), German (247 | 18.2%), English (193 | 14.2%), Irish (179 | 13.2%), and European (39 | 2.9%), together accounting for 93.3% of all Menard residents.
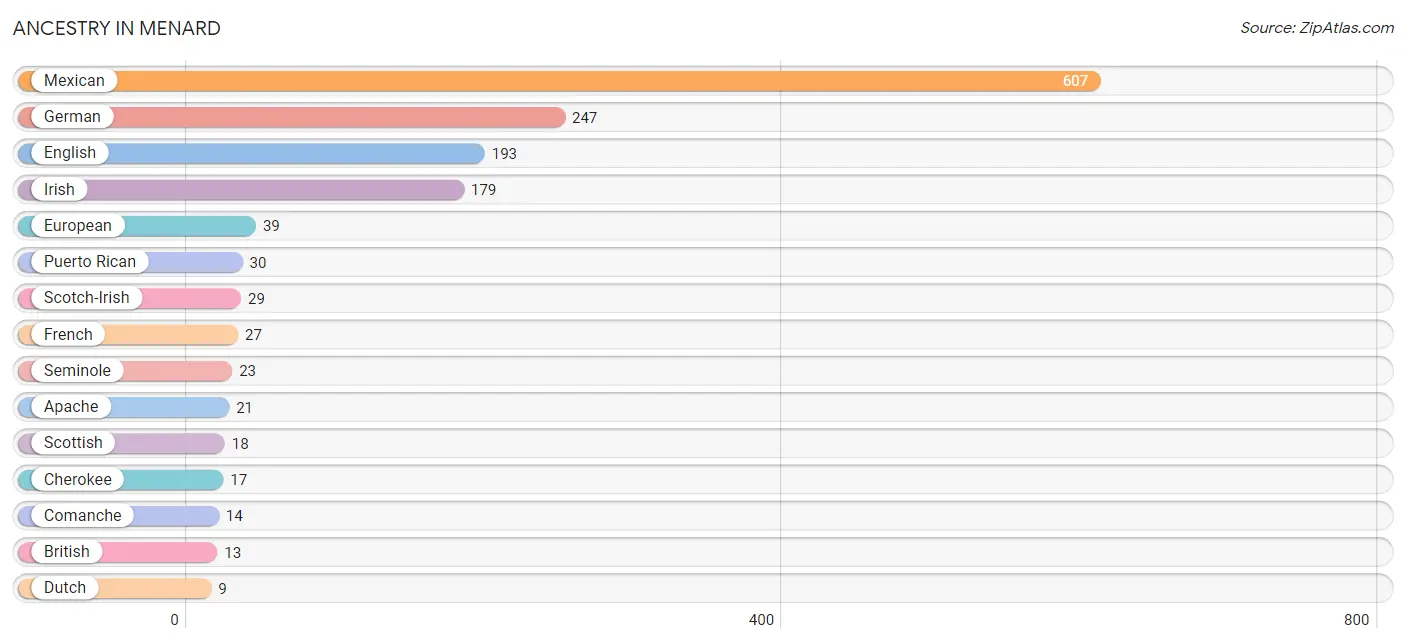
| Ancestry | # Population | % Population |
| American | 3 | 0.2% |
| Apache | 21 | 1.5% |
| British | 13 | 1.0% |
| Central American | 4 | 0.3% |
| Cherokee | 17 | 1.3% |
| Comanche | 14 | 1.0% |
| Dutch | 9 | 0.7% |
| English | 193 | 14.2% |
| European | 39 | 2.9% |
| French | 27 | 2.0% |
| German | 247 | 18.2% |
| Guatemalan | 4 | 0.3% |
| Irish | 179 | 13.2% |
| Mexican | 607 | 44.8% |
| Puerto Rican | 30 | 2.2% |
| Scotch-Irish | 29 | 2.1% |
| Scottish | 18 | 1.3% |
| Seminole | 23 | 1.7% | View All 18 Rows |
Immigrants in Menard
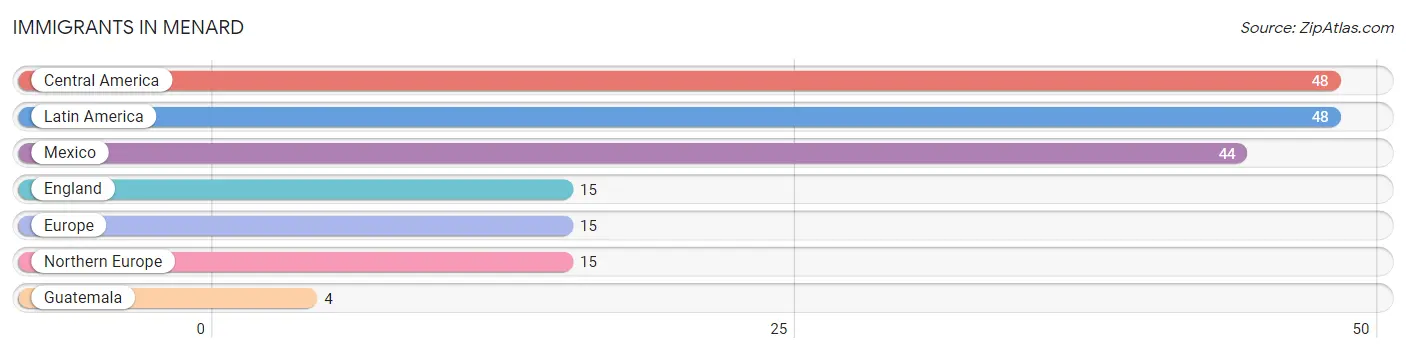
The most numerous immigrant groups reported in Menard came from Central America (48 | 3.5%), Latin America (48 | 3.5%), Mexico (44 | 3.2%), England (15 | 1.1%), and Europe (15 | 1.1%), together accounting for 12.5% of all Menard residents.
| Immigration Origin | # Population | % Population |
| Central America | 48 | 3.5% |
| England | 15 | 1.1% |
| Europe | 15 | 1.1% |
| Guatemala | 4 | 0.3% |
| Latin America | 48 | 3.5% |
| Mexico | 44 | 3.2% |
| Northern Europe | 15 | 1.1% | View All 7 Rows |
Sex and Age in Menard
Sex and Age in Menard
The most populous age groups in Menard are 70 to 74 Years (77 | 11.5%) for men and 80 to 84 Years (106 | 15.4%) for women.
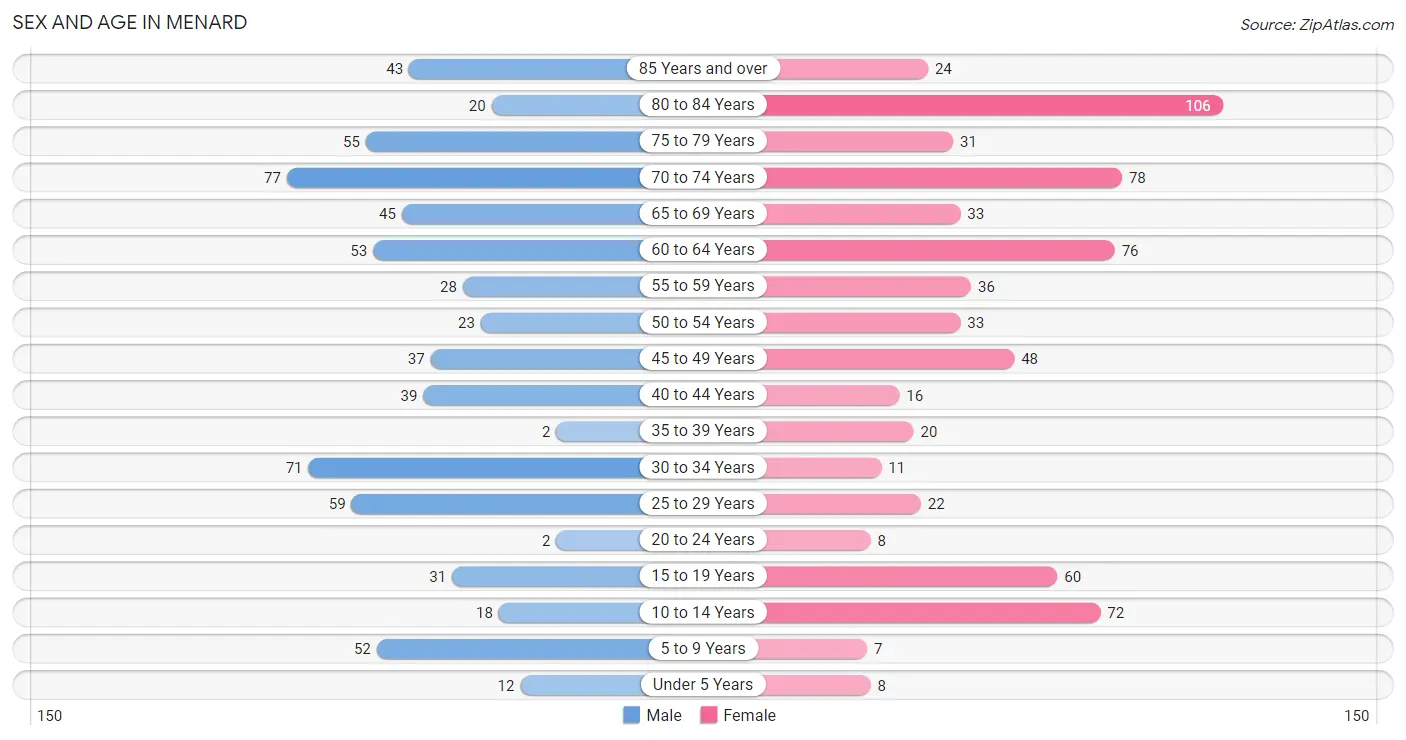
| Age Bracket | Male | Female |
| Under 5 Years | 12 (1.8%) | 8 (1.2%) |
| 5 to 9 Years | 52 (7.8%) | 7 (1.0%) |
| 10 to 14 Years | 18 (2.7%) | 72 (10.4%) |
| 15 to 19 Years | 31 (4.6%) | 60 (8.7%) |
| 20 to 24 Years | 2 (0.3%) | 8 (1.2%) |
| 25 to 29 Years | 59 (8.8%) | 22 (3.2%) |
| 30 to 34 Years | 71 (10.6%) | 11 (1.6%) |
| 35 to 39 Years | 2 (0.3%) | 20 (2.9%) |
| 40 to 44 Years | 39 (5.9%) | 16 (2.3%) |
| 45 to 49 Years | 37 (5.6%) | 48 (7.0%) |
| 50 to 54 Years | 23 (3.5%) | 33 (4.8%) |
| 55 to 59 Years | 28 (4.2%) | 36 (5.2%) |
| 60 to 64 Years | 53 (8.0%) | 76 (11.0%) |
| 65 to 69 Years | 45 (6.8%) | 33 (4.8%) |
| 70 to 74 Years | 77 (11.5%) | 78 (11.3%) |
| 75 to 79 Years | 55 (8.3%) | 31 (4.5%) |
| 80 to 84 Years | 20 (3.0%) | 106 (15.4%) |
| 85 Years and over | 43 (6.5%) | 24 (3.5%) |
| Total | 667 (100.0%) | 689 (100.0%) |
Families and Households in Menard
Median Family Size in Menard
The median family size in Menard is 2.97 persons per family, with single female/mother families (40 | 13.5%) accounting for the largest median family size of 3.65 persons per family. On the other hand, married-couple families (212 | 71.4%) represent the smallest median family size with 2.83 persons per family.
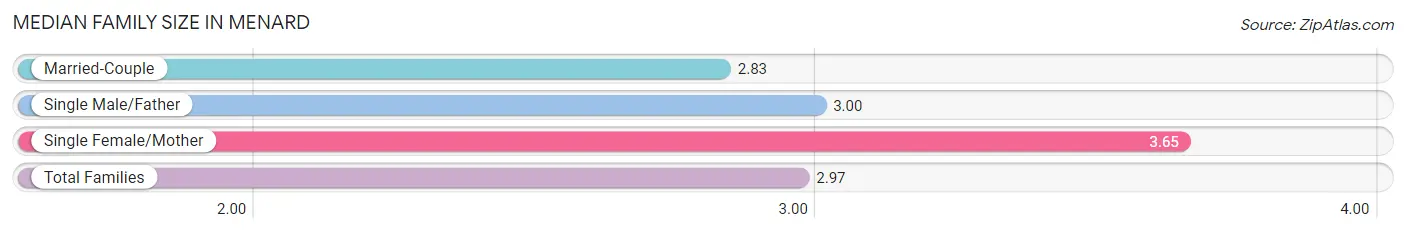
| Family Type | # Families | Family Size |
| Married-Couple | 212 (71.4%) | 2.83 |
| Single Male/Father | 45 (15.1%) | 3.00 |
| Single Female/Mother | 40 (13.5%) | 3.65 |
| Total Families | 297 (100.0%) | 2.97 |
Median Household Size in Menard
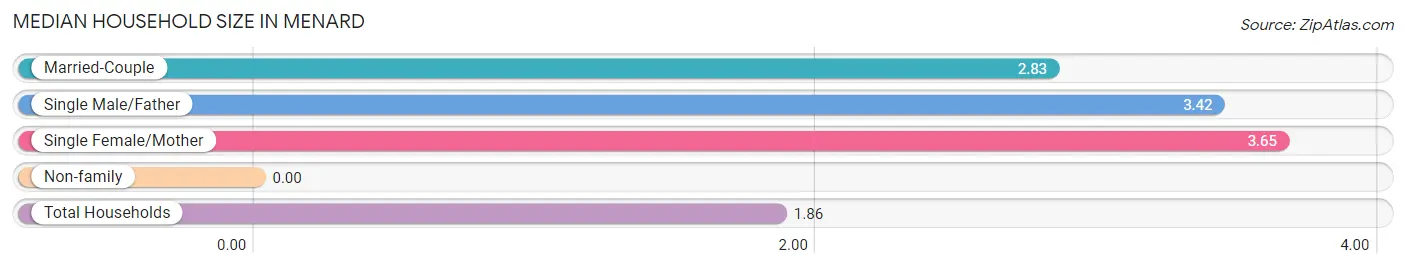
| Household Type | # Households | Household Size |
| Married-Couple | 212 (30.1%) | 2.83 |
| Single Male/Father | 45 (6.4%) | 3.42 |
| Single Female/Mother | 40 (5.7%) | 3.65 |
| Non-family | 408 (57.9%) | - |
| Total Households | 705 (100.0%) | 1.86 |
Household Size by Marriage Status in Menard
Out of a total of 705 households in Menard, 297 (42.1%) are family households, while 408 (57.9%) are nonfamily households. The most numerous type of family households are 2-person households, comprising 183, and the most common type of nonfamily households are 1-person households, comprising 408.
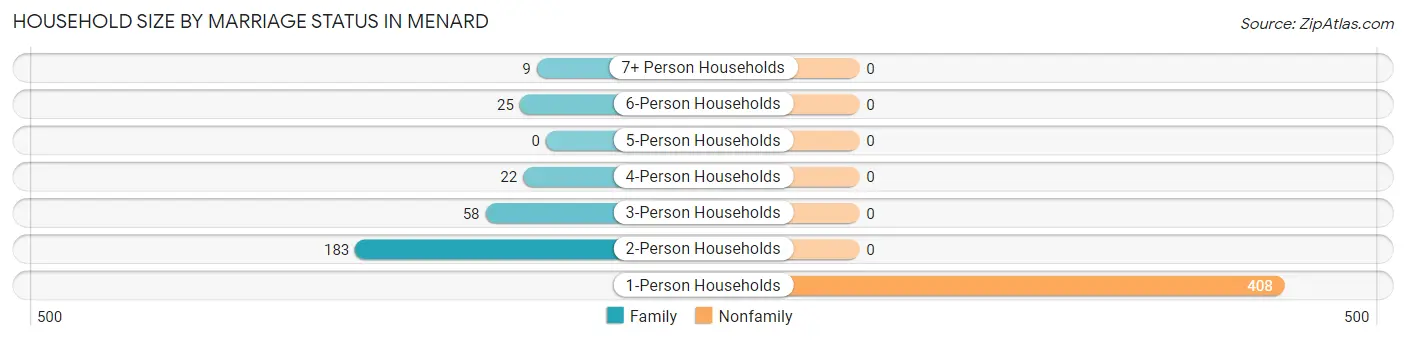
| Household Size | Family Households | Nonfamily Households |
| 1-Person Households | - | 408 (57.9%) |
| 2-Person Households | 183 (26.0%) | 0 (0.0%) |
| 3-Person Households | 58 (8.2%) | 0 (0.0%) |
| 4-Person Households | 22 (3.1%) | 0 (0.0%) |
| 5-Person Households | 0 (0.0%) | 0 (0.0%) |
| 6-Person Households | 25 (3.5%) | 0 (0.0%) |
| 7+ Person Households | 9 (1.3%) | 0 (0.0%) |
| Total | 297 (42.1%) | 408 (57.9%) |
Female Fertility in Menard
Fertility by Age in Menard
| Age Bracket | Women with Births | Births / 1,000 Women |
| 15 to 19 years | 0 (0.0%) | 0.0 |
| 20 to 34 years | 0 (0.0%) | 0.0 |
| 35 to 50 years | 0 (0.0%) | 0.0 |
| Total | 0 (0.0%) | 0.0 |
Fertility by Age by Marriage Status in Menard
| Age Bracket | Married | Unmarried |
| 15 to 19 years | 0 (0.0%) | 0 (0.0%) |
| 20 to 34 years | 0 (0.0%) | 0 (0.0%) |
| 35 to 50 years | 0 (0.0%) | 0 (0.0%) |
| Total | 0 (0.0%) | 0 (0.0%) |
Fertility by Education in Menard
| Educational Attainment | Women with Births | Births / 1,000 Women |
| Less than High School | 0 (0.0%) | 0.0 |
| High School Diploma | 0 (0.0%) | 0.0 |
| College or Associate's Degree | 0 (0.0%) | 0.0 |
| Bachelor's Degree | 0 (0.0%) | 0.0 |
| Graduate Degree | 0 (0.0%) | 0.0 |
| Total | 0 (0.0%) | 0.0 |
Fertility by Education by Marriage Status in Menard
| Educational Attainment | Married | Unmarried |
| Less than High School | 0 (0.0%) | 0 (0.0%) |
| High School Diploma | 0 (0.0%) | 0 (0.0%) |
| College or Associate's Degree | 0 (0.0%) | 0 (0.0%) |
| Bachelor's Degree | 0 (0.0%) | 0 (0.0%) |
| Graduate Degree | 0 (0.0%) | 0 (0.0%) |
| Total | 0 (0.0%) | 0 (0.0%) |
Employment Characteristics in Menard
Employment by Class of Employer in Menard
Among the 503 employed individuals in Menard, private company employees (318 | 63.2%), self-employed (not incorporated) (71 | 14.1%), and local government employees (63 | 12.5%) make up the most common classes of employment.
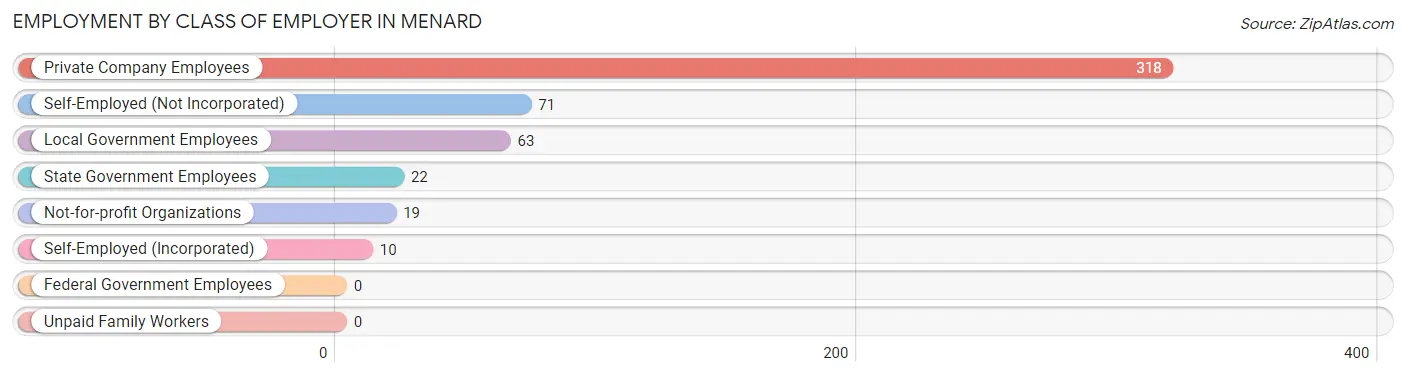
| Employer Class | # Employees | % Employees |
| Private Company Employees | 318 | 63.2% |
| Self-Employed (Incorporated) | 10 | 2.0% |
| Self-Employed (Not Incorporated) | 71 | 14.1% |
| Not-for-profit Organizations | 19 | 3.8% |
| Local Government Employees | 63 | 12.5% |
| State Government Employees | 22 | 4.4% |
| Federal Government Employees | 0 | 0.0% |
| Unpaid Family Workers | 0 | 0.0% |
| Total | 503 | 100.0% |
Employment Status by Age in Menard
According to the labor force statistics for Menard, out of the total population over 16 years of age (1,174), 50.0% or 587 individuals are in the labor force, with 8.0% or 47 of them unemployed. The age group with the highest labor force participation rate is 25 to 29 years, with 100.0% or 81 individuals in the labor force. Within the labor force, the 55 to 59 years age range has the highest percentage of unemployed individuals, with 36.5% or 19 of them being unemployed.
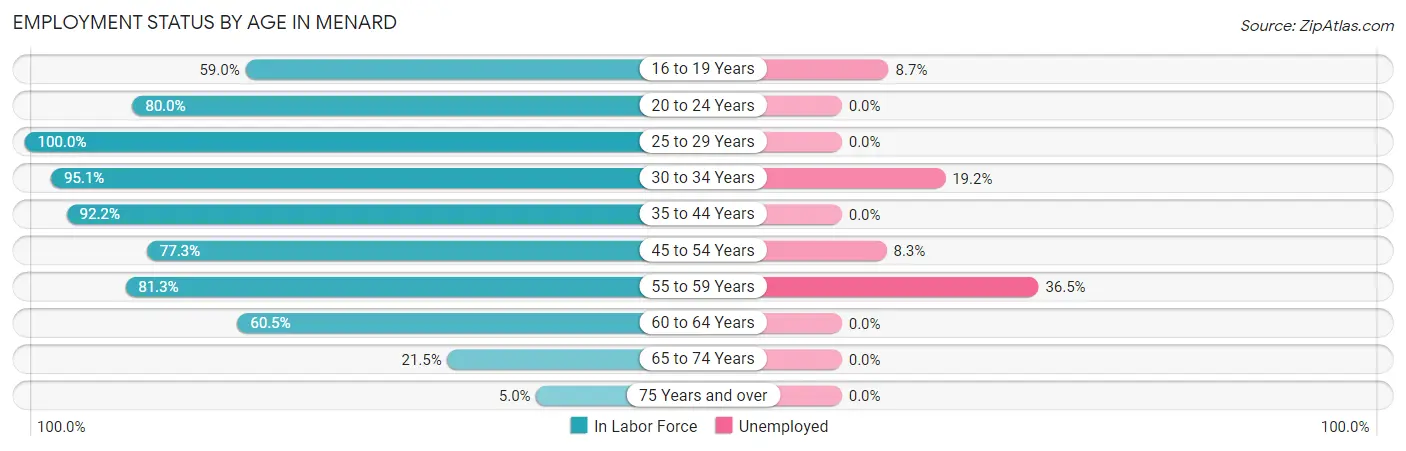
| Age Bracket | In Labor Force | Unemployed |
| 16 to 19 Years | 46 (59.0%) | 4 (8.7%) |
| 20 to 24 Years | 8 (80.0%) | 0 (0.0%) |
| 25 to 29 Years | 81 (100.0%) | 0 (0.0%) |
| 30 to 34 Years | 78 (95.1%) | 15 (19.2%) |
| 35 to 44 Years | 71 (92.2%) | 0 (0.0%) |
| 45 to 54 Years | 109 (77.3%) | 9 (8.3%) |
| 55 to 59 Years | 52 (81.3%) | 19 (36.5%) |
| 60 to 64 Years | 78 (60.5%) | 0 (0.0%) |
| 65 to 74 Years | 50 (21.5%) | 0 (0.0%) |
| 75 Years and over | 14 (5.0%) | 0 (0.0%) |
| Total | 587 (50.0%) | 47 (8.0%) |
Employment Status by Educational Attainment in Menard
According to labor force statistics for Menard, 81.7% of individuals (469) out of the total population between 25 and 64 years of age (574) are in the labor force, with 9.2% or 43 of them being unemployed. The group with the highest labor force participation rate are those with the educational attainment of bachelor's degree or higher, with 100.0% or 95 individuals in the labor force. Within the labor force, individuals with high school diploma education have the highest percentage of unemployment, with 21.7% or 43 of them being unemployed.
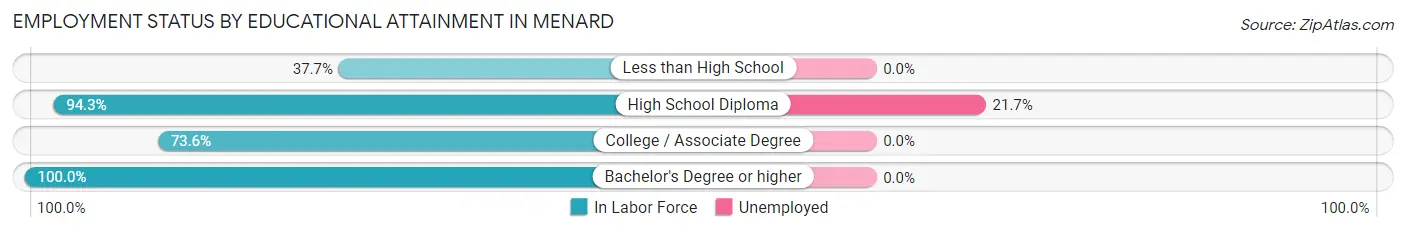
| Educational Attainment | In Labor Force | Unemployed |
| Less than High School | 23 (37.7%) | 0 (0.0%) |
| High School Diploma | 198 (94.3%) | 46 (21.7%) |
| College / Associate Degree | 153 (73.6%) | 0 (0.0%) |
| Bachelor's Degree or higher | 95 (100.0%) | 0 (0.0%) |
| Total | 469 (81.7%) | 53 (9.2%) |
Employment Occupations by Sex in Menard
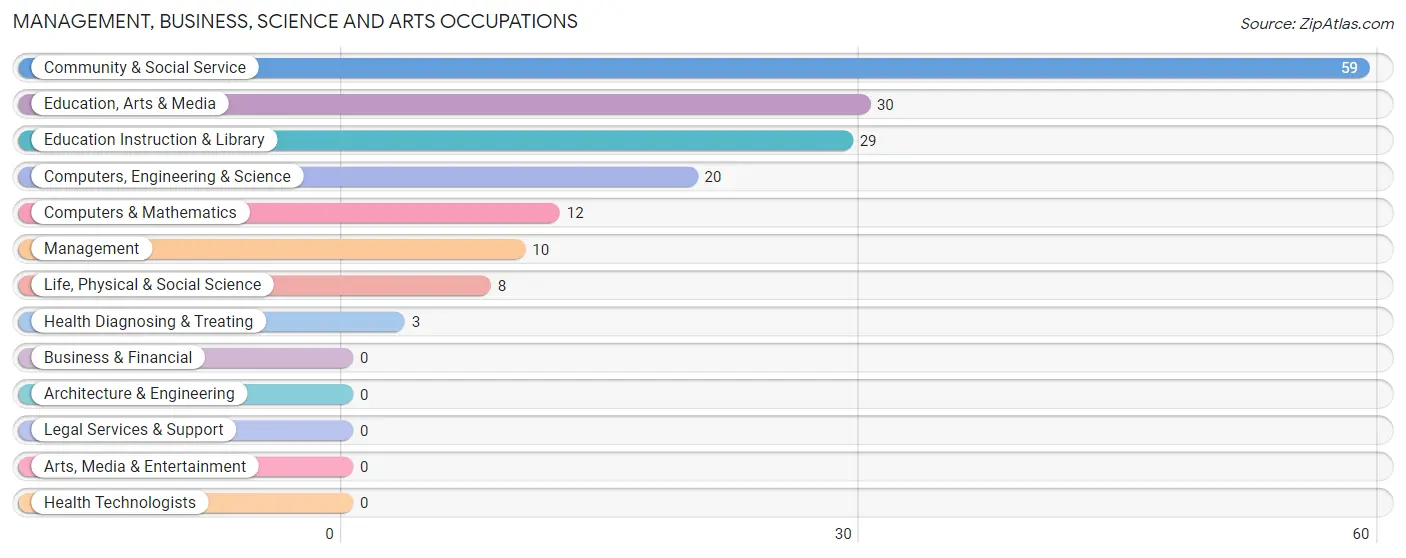
Management, Business, Science and Arts Occupations
The most common Management, Business, Science and Arts occupations in Menard are Community & Social Service (59 | 10.9%), Education, Arts & Media (30 | 5.6%), Education Instruction & Library (29 | 5.4%), Computers, Engineering & Science (20 | 3.7%), and Computers & Mathematics (12 | 2.2%).
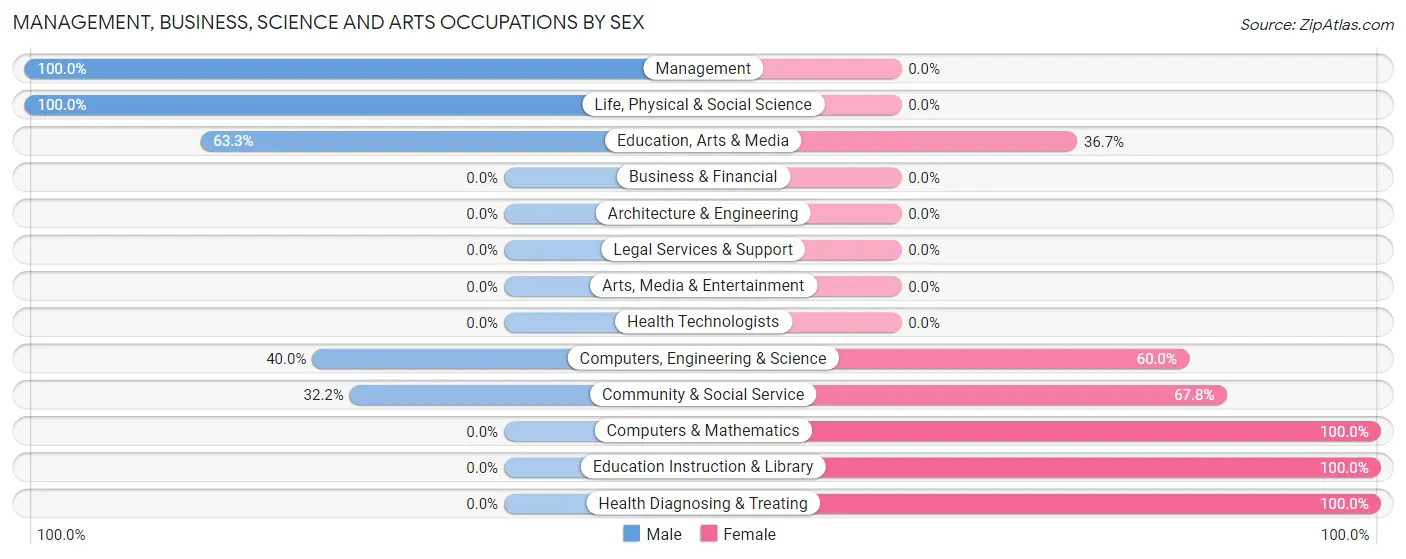
Management, Business, Science and Arts Occupations by Sex
Within the Management, Business, Science and Arts occupations in Menard, the most male-oriented occupations are Management (100.0%), Life, Physical & Social Science (100.0%), and Education, Arts & Media (63.3%), while the most female-oriented occupations are Computers & Mathematics (100.0%), Education Instruction & Library (100.0%), and Health Diagnosing & Treating (100.0%).
| Occupation | Male | Female |
| Management | 10 (100.0%) | 0 (0.0%) |
| Business & Financial | 0 (0.0%) | 0 (0.0%) |
| Computers, Engineering & Science | 8 (40.0%) | 12 (60.0%) |
| Computers & Mathematics | 0 (0.0%) | 12 (100.0%) |
| Architecture & Engineering | 0 (0.0%) | 0 (0.0%) |
| Life, Physical & Social Science | 8 (100.0%) | 0 (0.0%) |
| Community & Social Service | 19 (32.2%) | 40 (67.8%) |
| Education, Arts & Media | 19 (63.3%) | 11 (36.7%) |
| Legal Services & Support | 0 (0.0%) | 0 (0.0%) |
| Education Instruction & Library | 0 (0.0%) | 29 (100.0%) |
| Arts, Media & Entertainment | 0 (0.0%) | 0 (0.0%) |
| Health Diagnosing & Treating | 0 (0.0%) | 3 (100.0%) |
| Health Technologists | 0 (0.0%) | 0 (0.0%) |
| Total (Category) | 37 (40.2%) | 55 (59.8%) |
| Total (Overall) | 314 (58.2%) | 226 (41.8%) |
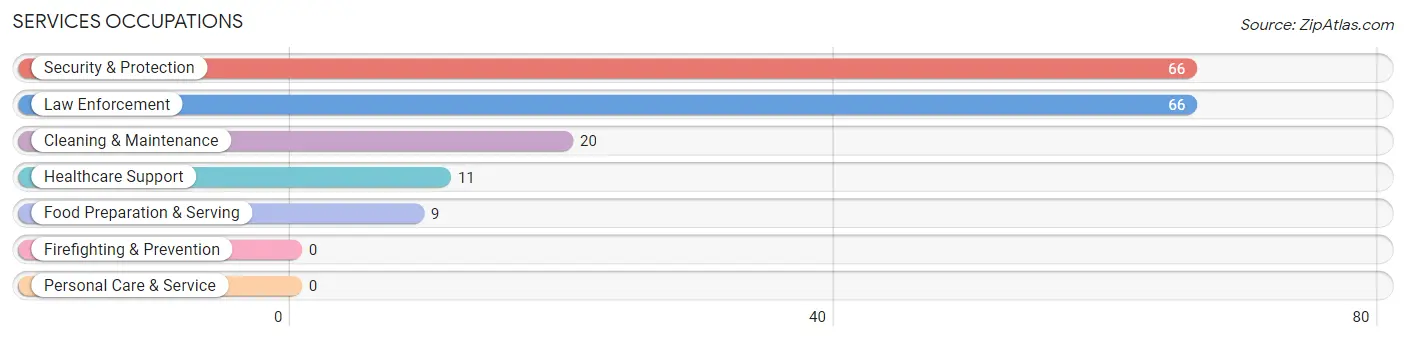
Services Occupations
The most common Services occupations in Menard are Security & Protection (66 | 12.2%), Law Enforcement (66 | 12.2%), Cleaning & Maintenance (20 | 3.7%), Healthcare Support (11 | 2.0%), and Food Preparation & Serving (9 | 1.7%).
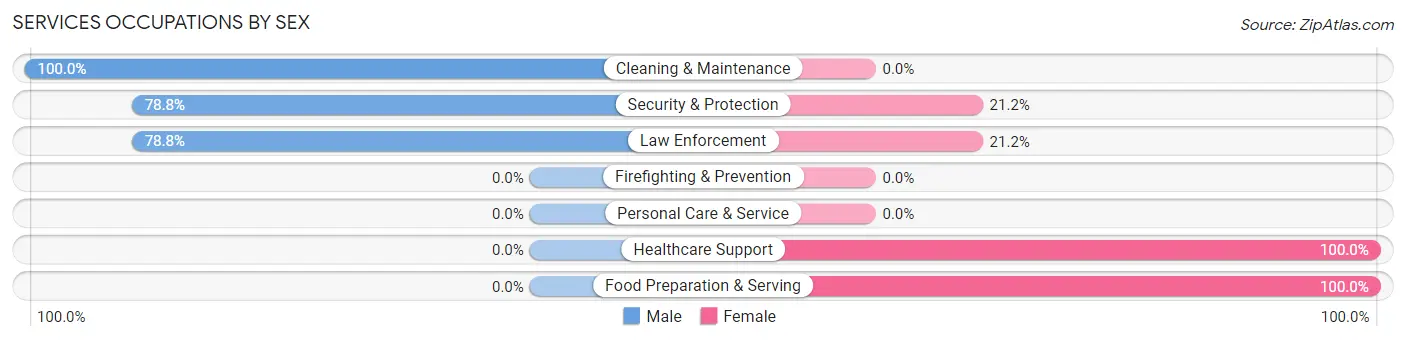
Services Occupations by Sex
Within the Services occupations in Menard, the most male-oriented occupations are Cleaning & Maintenance (100.0%), Security & Protection (78.8%), and Law Enforcement (78.8%), while the most female-oriented occupations are Healthcare Support (100.0%), Food Preparation & Serving (100.0%), and Security & Protection (21.2%).
| Occupation | Male | Female |
| Healthcare Support | 0 (0.0%) | 11 (100.0%) |
| Security & Protection | 52 (78.8%) | 14 (21.2%) |
| Firefighting & Prevention | 0 (0.0%) | 0 (0.0%) |
| Law Enforcement | 52 (78.8%) | 14 (21.2%) |
| Food Preparation & Serving | 0 (0.0%) | 9 (100.0%) |
| Cleaning & Maintenance | 20 (100.0%) | 0 (0.0%) |
| Personal Care & Service | 0 (0.0%) | 0 (0.0%) |
| Total (Category) | 72 (67.9%) | 34 (32.1%) |
| Total (Overall) | 314 (58.2%) | 226 (41.8%) |
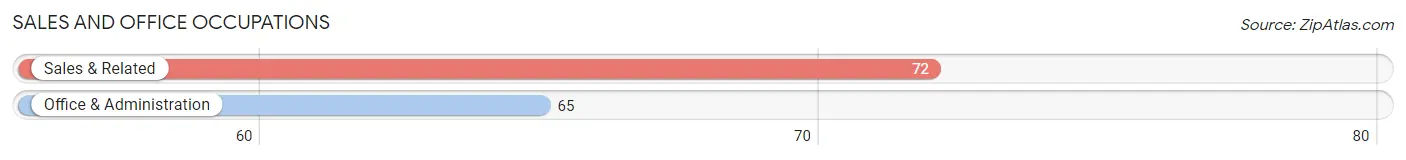
Sales and Office Occupations
The most common Sales and Office occupations in Menard are Sales & Related (72 | 13.3%), and Office & Administration (65 | 12.0%).
Sales and Office Occupations by Sex
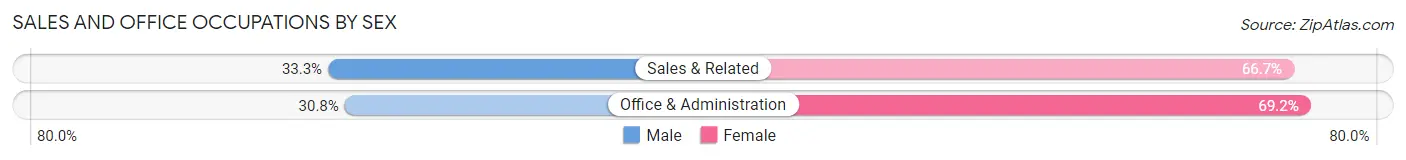
| Occupation | Male | Female |
| Sales & Related | 24 (33.3%) | 48 (66.7%) |
| Office & Administration | 20 (30.8%) | 45 (69.2%) |
| Total (Category) | 44 (32.1%) | 93 (67.9%) |
| Total (Overall) | 314 (58.2%) | 226 (41.8%) |
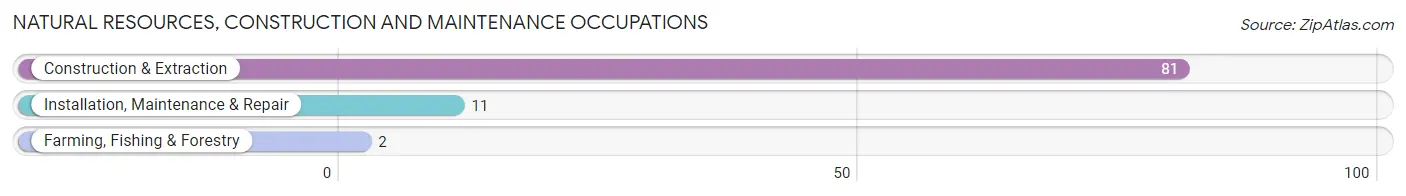
Natural Resources, Construction and Maintenance Occupations
The most common Natural Resources, Construction and Maintenance occupations in Menard are Construction & Extraction (81 | 15.0%), Installation, Maintenance & Repair (11 | 2.0%), and Farming, Fishing & Forestry (2 | 0.4%).
Natural Resources, Construction and Maintenance Occupations by Sex
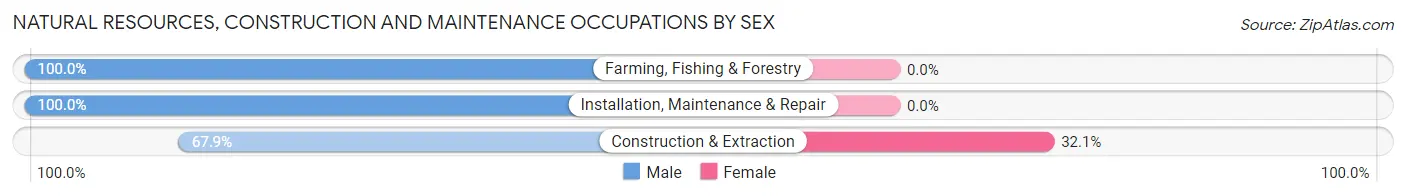
| Occupation | Male | Female |
| Farming, Fishing & Forestry | 2 (100.0%) | 0 (0.0%) |
| Construction & Extraction | 55 (67.9%) | 26 (32.1%) |
| Installation, Maintenance & Repair | 11 (100.0%) | 0 (0.0%) |
| Total (Category) | 68 (72.3%) | 26 (27.7%) |
| Total (Overall) | 314 (58.2%) | 226 (41.8%) |
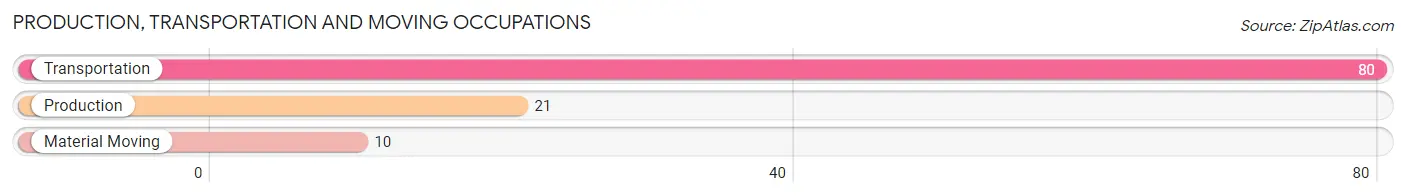
Production, Transportation and Moving Occupations
The most common Production, Transportation and Moving occupations in Menard are Transportation (80 | 14.8%), Production (21 | 3.9%), and Material Moving (10 | 1.8%).
Production, Transportation and Moving Occupations by Sex
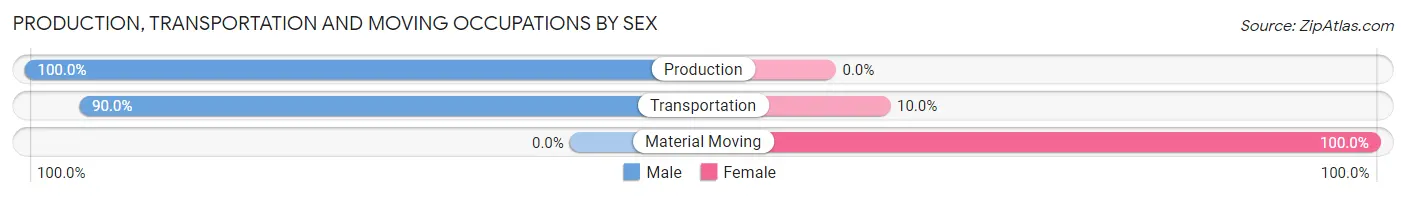
| Occupation | Male | Female |
| Production | 21 (100.0%) | 0 (0.0%) |
| Transportation | 72 (90.0%) | 8 (10.0%) |
| Material Moving | 0 (0.0%) | 10 (100.0%) |
| Total (Category) | 93 (83.8%) | 18 (16.2%) |
| Total (Overall) | 314 (58.2%) | 226 (41.8%) |
Employment Industries by Sex in Menard
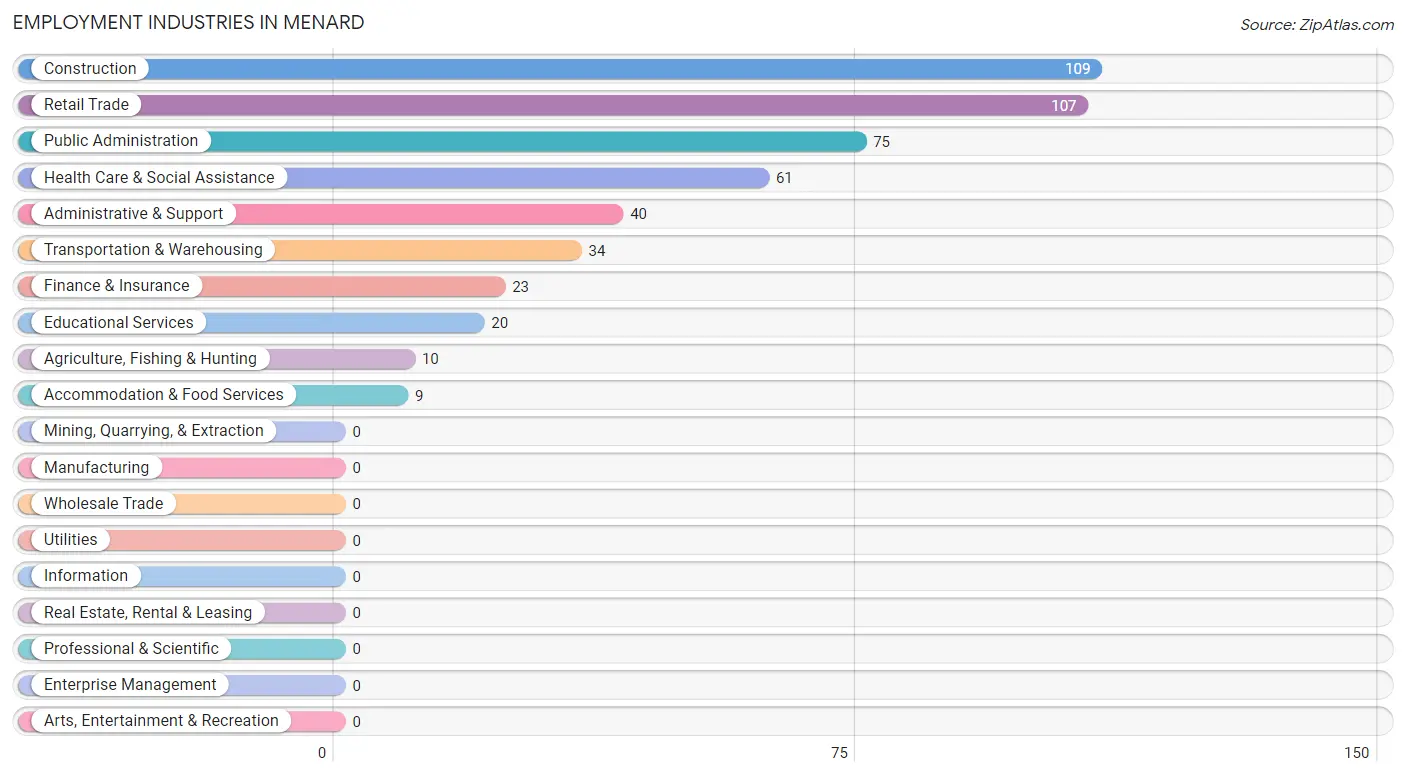
Employment Industries in Menard
The major employment industries in Menard include Construction (109 | 20.2%), Retail Trade (107 | 19.8%), Public Administration (75 | 13.9%), Health Care & Social Assistance (61 | 11.3%), and Administrative & Support (40 | 7.4%).
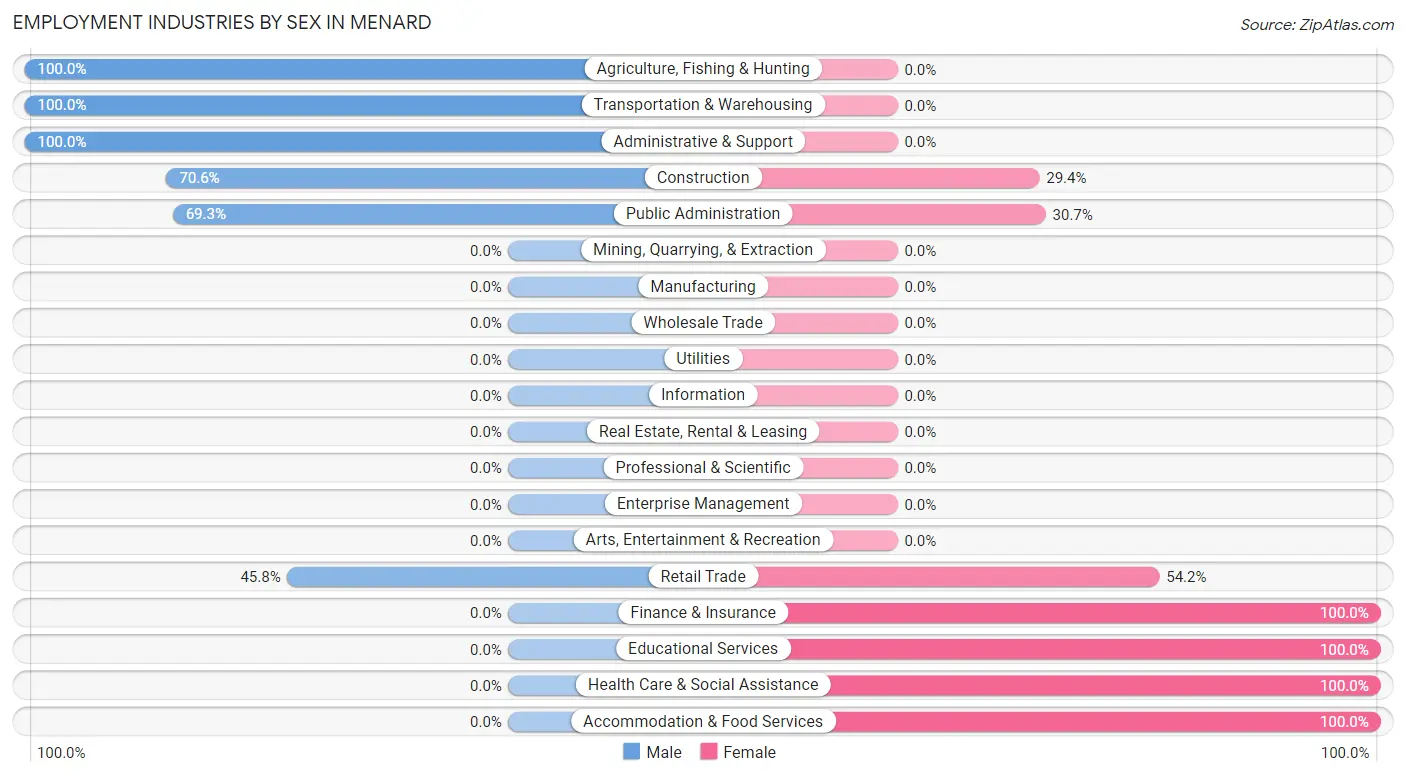
Employment Industries by Sex in Menard
The Menard industries that see more men than women are Agriculture, Fishing & Hunting (100.0%), Transportation & Warehousing (100.0%), and Administrative & Support (100.0%), whereas the industries that tend to have a higher number of women are Finance & Insurance (100.0%), Educational Services (100.0%), and Health Care & Social Assistance (100.0%).
| Industry | Male | Female |
| Agriculture, Fishing & Hunting | 10 (100.0%) | 0 (0.0%) |
| Mining, Quarrying, & Extraction | 0 (0.0%) | 0 (0.0%) |
| Construction | 77 (70.6%) | 32 (29.4%) |
| Manufacturing | 0 (0.0%) | 0 (0.0%) |
| Wholesale Trade | 0 (0.0%) | 0 (0.0%) |
| Retail Trade | 49 (45.8%) | 58 (54.2%) |
| Transportation & Warehousing | 34 (100.0%) | 0 (0.0%) |
| Utilities | 0 (0.0%) | 0 (0.0%) |
| Information | 0 (0.0%) | 0 (0.0%) |
| Finance & Insurance | 0 (0.0%) | 23 (100.0%) |
| Real Estate, Rental & Leasing | 0 (0.0%) | 0 (0.0%) |
| Professional & Scientific | 0 (0.0%) | 0 (0.0%) |
| Enterprise Management | 0 (0.0%) | 0 (0.0%) |
| Administrative & Support | 40 (100.0%) | 0 (0.0%) |
| Educational Services | 0 (0.0%) | 20 (100.0%) |
| Health Care & Social Assistance | 0 (0.0%) | 61 (100.0%) |
| Arts, Entertainment & Recreation | 0 (0.0%) | 0 (0.0%) |
| Accommodation & Food Services | 0 (0.0%) | 9 (100.0%) |
| Public Administration | 52 (69.3%) | 23 (30.7%) |
| Total | 314 (58.2%) | 226 (41.8%) |
Education in Menard
School Enrollment in Menard
The most common levels of schooling among the 245 students in Menard are middle school (77 | 31.4%), high school (73 | 29.8%), and elementary school (59 | 24.1%).
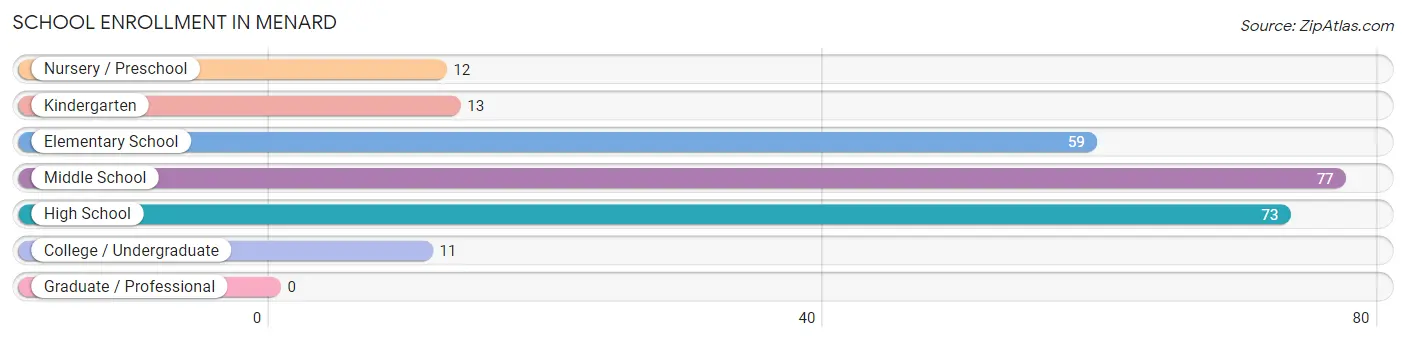
| School Level | # Students | % Students |
| Nursery / Preschool | 12 | 4.9% |
| Kindergarten | 13 | 5.3% |
| Elementary School | 59 | 24.1% |
| Middle School | 77 | 31.4% |
| High School | 73 | 29.8% |
| College / Undergraduate | 11 | 4.5% |
| Graduate / Professional | 0 | 0.0% |
| Total | 245 | 100.0% |
School Enrollment by Age by Funding Source in Menard
Out of a total of 245 students who are enrolled in schools in Menard, 15 (6.1%) attend a private institution, while the remaining 230 (93.9%) are enrolled in public schools. The age group of 5 to 9 year old has the highest likelihood of being enrolled in private schools, with 7 (11.9% in the age bracket) enrolled. Conversely, the age group of 3 to 4 year olds has the lowest likelihood of being enrolled in a private school, with 12 (100.0% in the age bracket) attending a public institution.
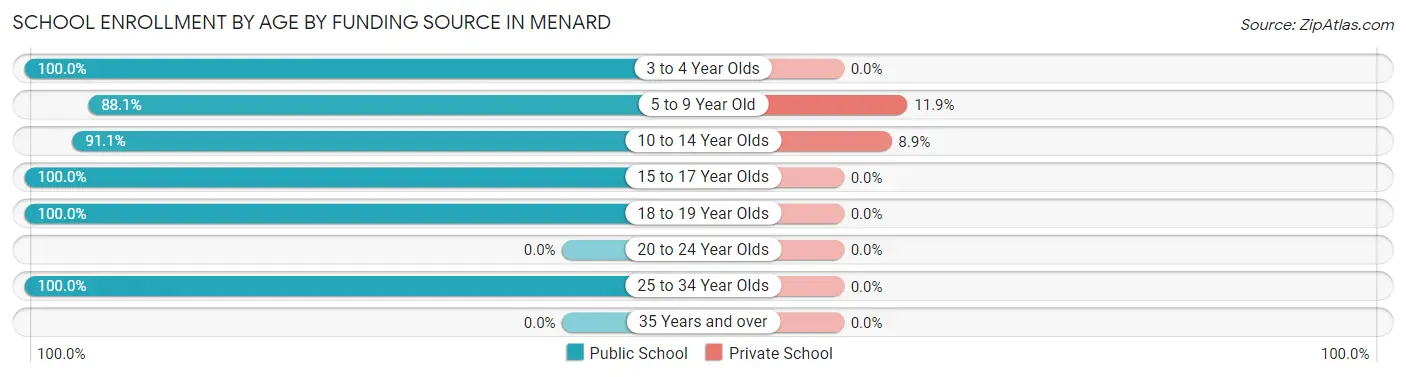
| Age Bracket | Public School | Private School |
| 3 to 4 Year Olds | 12 (100.0%) | 0 (0.0%) |
| 5 to 9 Year Old | 52 (88.1%) | 7 (11.9%) |
| 10 to 14 Year Olds | 82 (91.1%) | 8 (8.9%) |
| 15 to 17 Year Olds | 35 (100.0%) | 0 (0.0%) |
| 18 to 19 Year Olds | 38 (100.0%) | 0 (0.0%) |
| 20 to 24 Year Olds | 0 (0.0%) | 0 (0.0%) |
| 25 to 34 Year Olds | 11 (100.0%) | 0 (0.0%) |
| 35 Years and over | 0 (0.0%) | 0 (0.0%) |
| Total | 230 (93.9%) | 15 (6.1%) |
Educational Attainment by Field of Study in Menard
Arts & humanities (52 | 26.3%), computers & mathematics (33 | 16.7%), business (28 | 14.1%), education (28 | 14.1%), and liberal arts & history (19 | 9.6%) are the most common fields of study among 198 individuals in Menard who have obtained a bachelor's degree or higher.
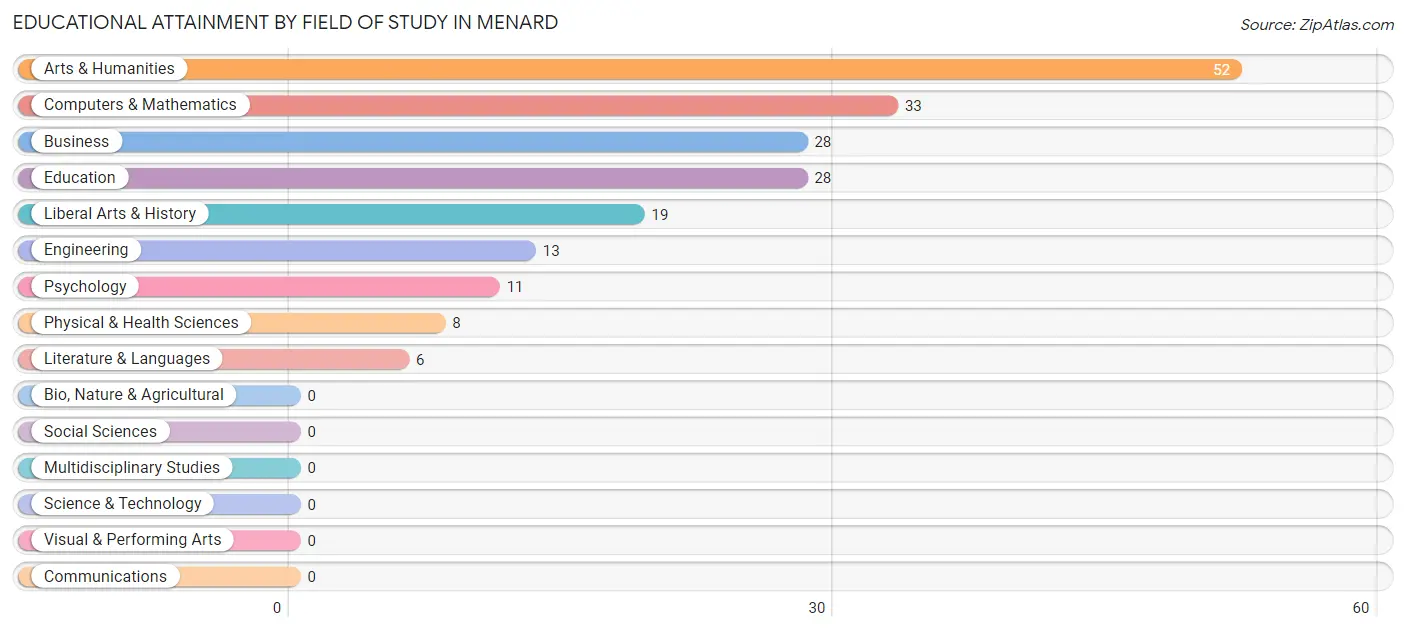
| Field of Study | # Graduates | % Graduates |
| Computers & Mathematics | 33 | 16.7% |
| Bio, Nature & Agricultural | 0 | 0.0% |
| Physical & Health Sciences | 8 | 4.0% |
| Psychology | 11 | 5.6% |
| Social Sciences | 0 | 0.0% |
| Engineering | 13 | 6.6% |
| Multidisciplinary Studies | 0 | 0.0% |
| Science & Technology | 0 | 0.0% |
| Business | 28 | 14.1% |
| Education | 28 | 14.1% |
| Literature & Languages | 6 | 3.0% |
| Liberal Arts & History | 19 | 9.6% |
| Visual & Performing Arts | 0 | 0.0% |
| Communications | 0 | 0.0% |
| Arts & Humanities | 52 | 26.3% |
| Total | 198 | 100.0% |
Transportation & Commute in Menard
Vehicle Availability by Sex in Menard
The most prevalent vehicle ownership categories in Menard are males with 2 vehicles (203, accounting for 65.3%) and females with 2 vehicles (118, making up 105.7%).
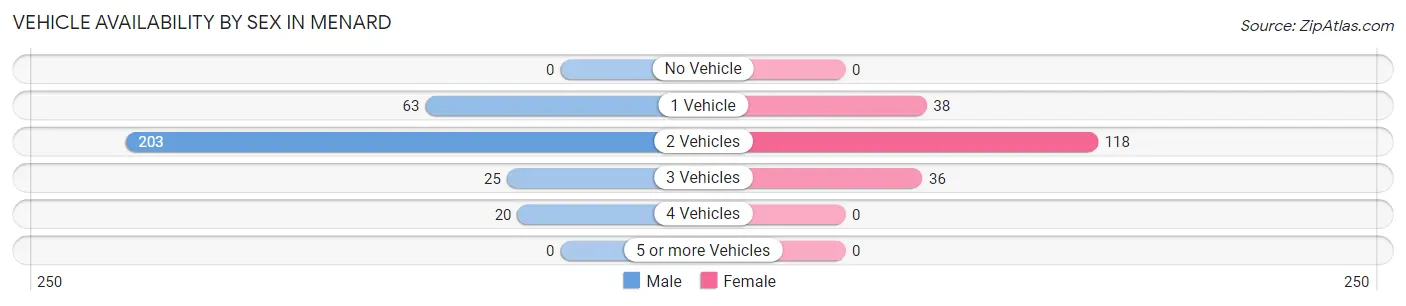
| Vehicles Available | Male | Female |
| No Vehicle | 0 (0.0%) | 0 (0.0%) |
| 1 Vehicle | 63 (20.3%) | 38 (19.8%) |
| 2 Vehicles | 203 (65.3%) | 118 (61.5%) |
| 3 Vehicles | 25 (8.0%) | 36 (18.8%) |
| 4 Vehicles | 20 (6.4%) | 0 (0.0%) |
| 5 or more Vehicles | 0 (0.0%) | 0 (0.0%) |
| Total | 311 (100.0%) | 192 (100.0%) |
Commute Time in Menard
The most frequently occuring commute durations in Menard are less than 5 minutes (137 commuters, 27.9%), 5 to 9 minutes (125 commuters, 25.5%), and 20 to 24 minutes (63 commuters, 12.8%).
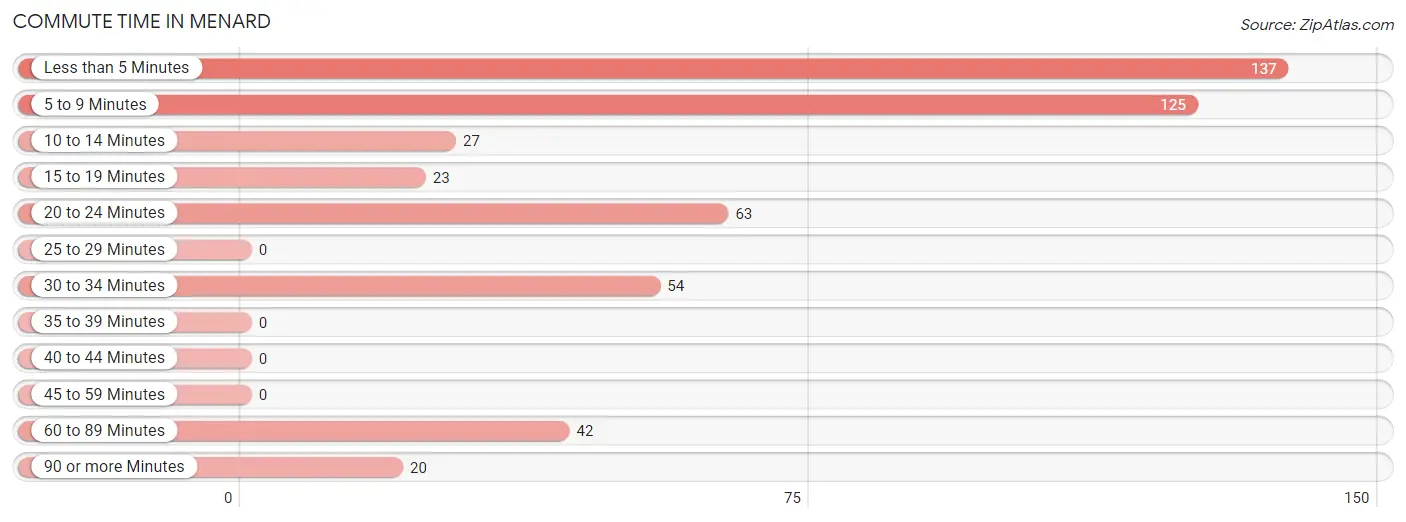
| Commute Time | # Commuters | % Commuters |
| Less than 5 Minutes | 137 | 27.9% |
| 5 to 9 Minutes | 125 | 25.5% |
| 10 to 14 Minutes | 27 | 5.5% |
| 15 to 19 Minutes | 23 | 4.7% |
| 20 to 24 Minutes | 63 | 12.8% |
| 25 to 29 Minutes | 0 | 0.0% |
| 30 to 34 Minutes | 54 | 11.0% |
| 35 to 39 Minutes | 0 | 0.0% |
| 40 to 44 Minutes | 0 | 0.0% |
| 45 to 59 Minutes | 0 | 0.0% |
| 60 to 89 Minutes | 42 | 8.6% |
| 90 or more Minutes | 20 | 4.1% |
Commute Time by Sex in Menard
The most common commute times in Menard are 5 to 9 minutes (90 commuters, 28.9%) for males and less than 5 minutes (74 commuters, 41.1%) for females.
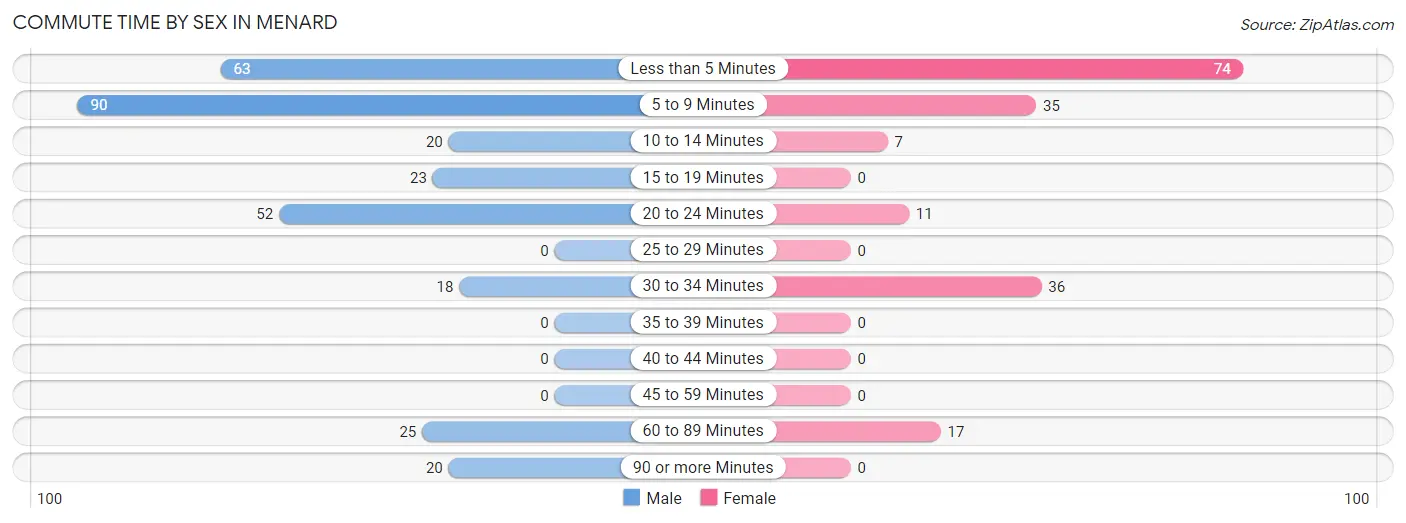
| Commute Time | Male | Female |
| Less than 5 Minutes | 63 (20.3%) | 74 (41.1%) |
| 5 to 9 Minutes | 90 (28.9%) | 35 (19.4%) |
| 10 to 14 Minutes | 20 (6.4%) | 7 (3.9%) |
| 15 to 19 Minutes | 23 (7.4%) | 0 (0.0%) |
| 20 to 24 Minutes | 52 (16.7%) | 11 (6.1%) |
| 25 to 29 Minutes | 0 (0.0%) | 0 (0.0%) |
| 30 to 34 Minutes | 18 (5.8%) | 36 (20.0%) |
| 35 to 39 Minutes | 0 (0.0%) | 0 (0.0%) |
| 40 to 44 Minutes | 0 (0.0%) | 0 (0.0%) |
| 45 to 59 Minutes | 0 (0.0%) | 0 (0.0%) |
| 60 to 89 Minutes | 25 (8.0%) | 17 (9.4%) |
| 90 or more Minutes | 20 (6.4%) | 0 (0.0%) |
Time of Departure to Work by Sex in Menard
The most frequent times of departure to work in Menard are 8:00 AM to 8:29 AM (109, 35.0%) for males and 6:30 AM to 6:59 AM (47, 26.1%) for females.
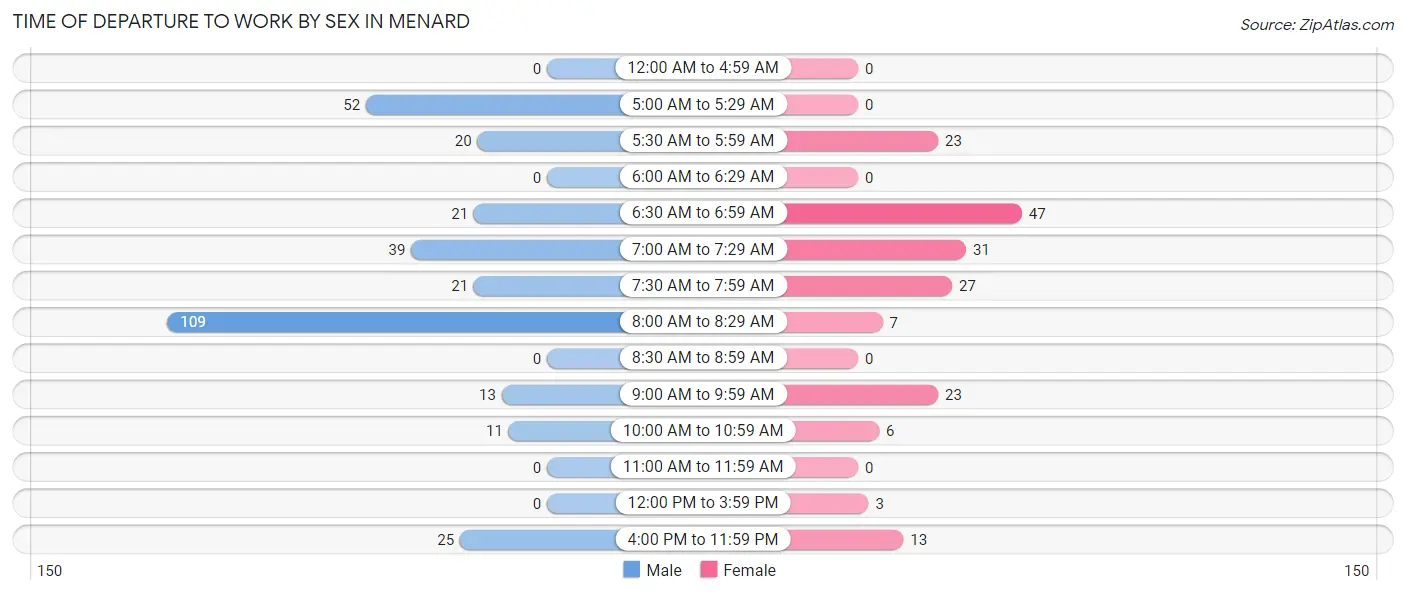
| Time of Departure | Male | Female |
| 12:00 AM to 4:59 AM | 0 (0.0%) | 0 (0.0%) |
| 5:00 AM to 5:29 AM | 52 (16.7%) | 0 (0.0%) |
| 5:30 AM to 5:59 AM | 20 (6.4%) | 23 (12.8%) |
| 6:00 AM to 6:29 AM | 0 (0.0%) | 0 (0.0%) |
| 6:30 AM to 6:59 AM | 21 (6.8%) | 47 (26.1%) |
| 7:00 AM to 7:29 AM | 39 (12.5%) | 31 (17.2%) |
| 7:30 AM to 7:59 AM | 21 (6.8%) | 27 (15.0%) |
| 8:00 AM to 8:29 AM | 109 (35.0%) | 7 (3.9%) |
| 8:30 AM to 8:59 AM | 0 (0.0%) | 0 (0.0%) |
| 9:00 AM to 9:59 AM | 13 (4.2%) | 23 (12.8%) |
| 10:00 AM to 10:59 AM | 11 (3.5%) | 6 (3.3%) |
| 11:00 AM to 11:59 AM | 0 (0.0%) | 0 (0.0%) |
| 12:00 PM to 3:59 PM | 0 (0.0%) | 3 (1.7%) |
| 4:00 PM to 11:59 PM | 25 (8.0%) | 13 (7.2%) |
| Total | 311 (100.0%) | 180 (100.0%) |
Housing Occupancy in Menard
Occupancy by Ownership in Menard
Of the total 705 dwellings in Menard, owner-occupied units account for 511 (72.5%), while renter-occupied units make up 194 (27.5%).
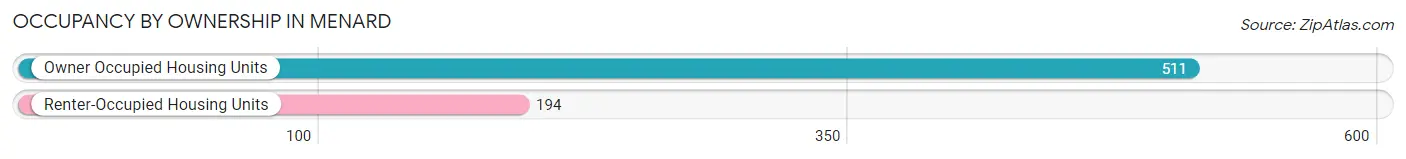
| Occupancy | # Housing Units | % Housing Units |
| Owner Occupied Housing Units | 511 | 72.5% |
| Renter-Occupied Housing Units | 194 | 27.5% |
| Total Occupied Housing Units | 705 | 100.0% |
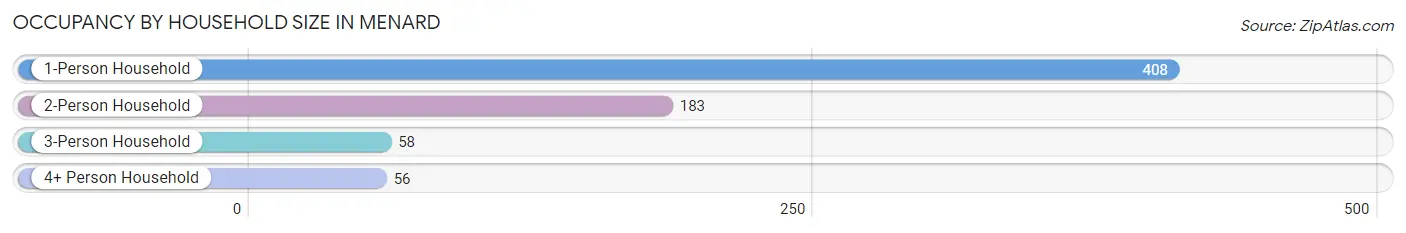
Occupancy by Household Size in Menard
| Household Size | # Housing Units | % Housing Units |
| 1-Person Household | 408 | 57.9% |
| 2-Person Household | 183 | 26.0% |
| 3-Person Household | 58 | 8.2% |
| 4+ Person Household | 56 | 7.9% |
| Total Housing Units | 705 | 100.0% |
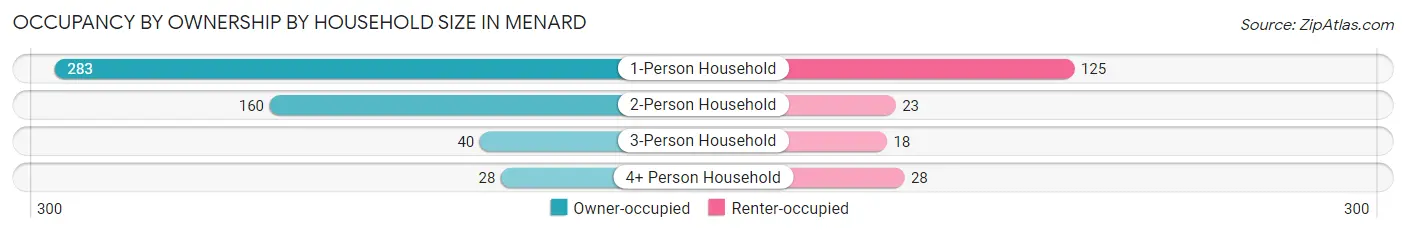
Occupancy by Ownership by Household Size in Menard
| Household Size | Owner-occupied | Renter-occupied |
| 1-Person Household | 283 (69.4%) | 125 (30.6%) |
| 2-Person Household | 160 (87.4%) | 23 (12.6%) |
| 3-Person Household | 40 (69.0%) | 18 (31.0%) |
| 4+ Person Household | 28 (50.0%) | 28 (50.0%) |
| Total Housing Units | 511 (72.5%) | 194 (27.5%) |
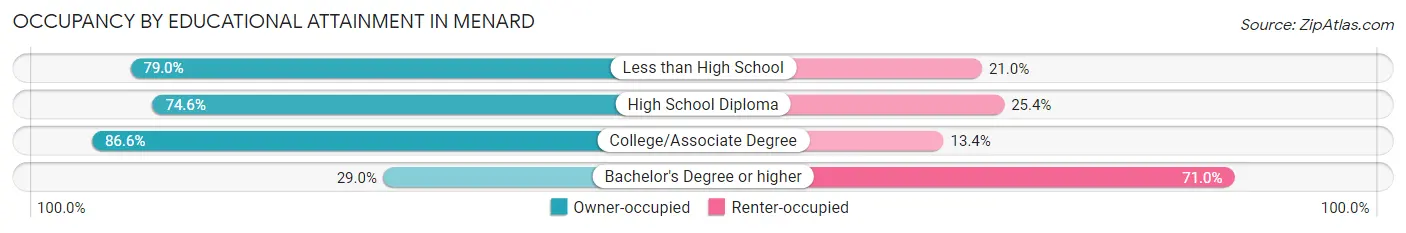
Occupancy by Educational Attainment in Menard
| Household Size | Owner-occupied | Renter-occupied |
| Less than High School | 113 (79.0%) | 30 (21.0%) |
| High School Diploma | 194 (74.6%) | 66 (25.4%) |
| College/Associate Degree | 175 (86.6%) | 27 (13.4%) |
| Bachelor's Degree or higher | 29 (29.0%) | 71 (71.0%) |
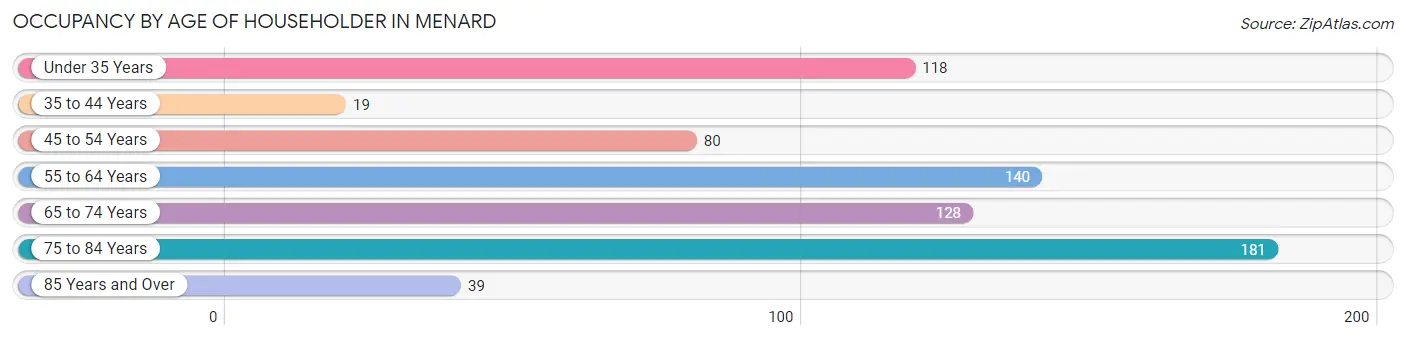
Occupancy by Age of Householder in Menard
| Age Bracket | # Households | % Households |
| Under 35 Years | 118 | 16.7% |
| 35 to 44 Years | 19 | 2.7% |
| 45 to 54 Years | 80 | 11.4% |
| 55 to 64 Years | 140 | 19.9% |
| 65 to 74 Years | 128 | 18.2% |
| 75 to 84 Years | 181 | 25.7% |
| 85 Years and Over | 39 | 5.5% |
| Total | 705 | 100.0% |
Housing Finances in Menard
Median Income by Occupancy in Menard
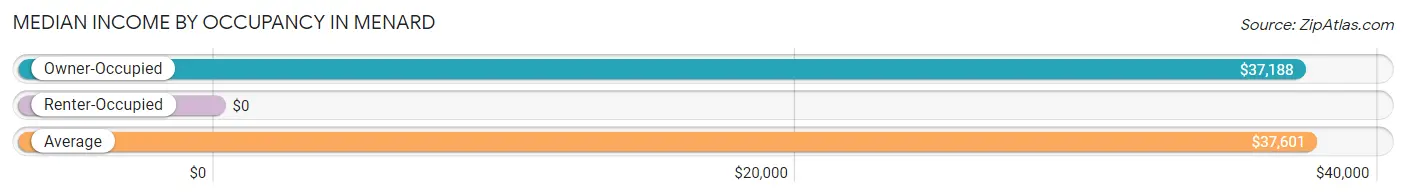
| Occupancy Type | # Households | Median Income |
| Owner-Occupied | 511 (72.5%) | $37,188 |
| Renter-Occupied | 194 (27.5%) | $0 |
| Average | 705 (100.0%) | $37,601 |
Occupancy by Householder Income Bracket in Menard
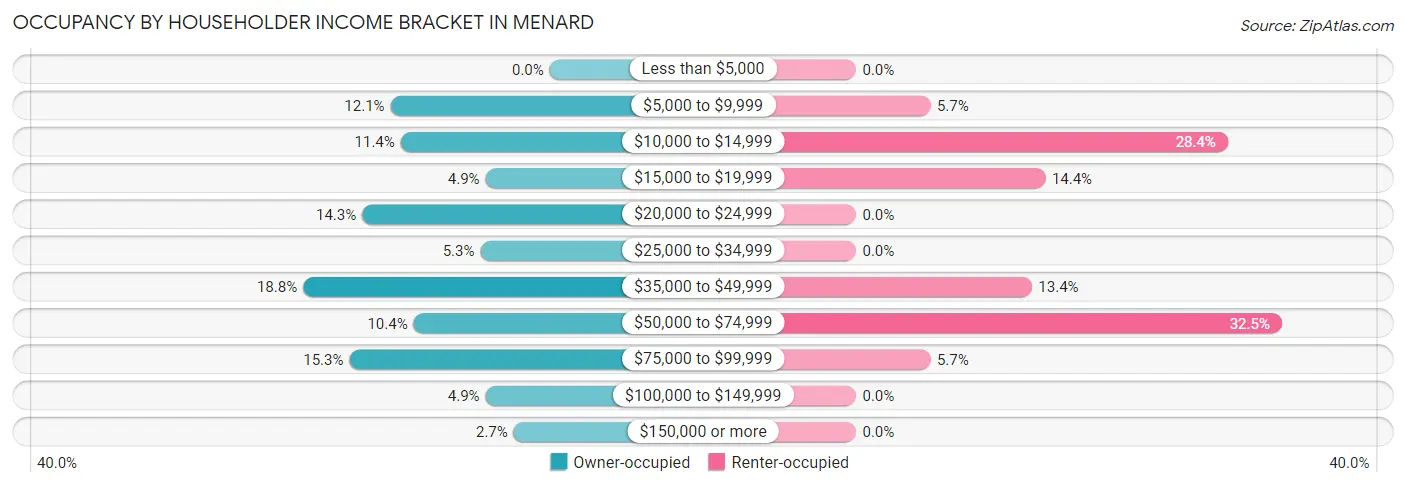
| Income Bracket | Owner-occupied | Renter-occupied |
| Less than $5,000 | 0 (0.0%) | 0 (0.0%) |
| $5,000 to $9,999 | 62 (12.1%) | 11 (5.7%) |
| $10,000 to $14,999 | 58 (11.4%) | 55 (28.3%) |
| $15,000 to $19,999 | 25 (4.9%) | 28 (14.4%) |
| $20,000 to $24,999 | 73 (14.3%) | 0 (0.0%) |
| $25,000 to $34,999 | 27 (5.3%) | 0 (0.0%) |
| $35,000 to $49,999 | 96 (18.8%) | 26 (13.4%) |
| $50,000 to $74,999 | 53 (10.4%) | 63 (32.5%) |
| $75,000 to $99,999 | 78 (15.3%) | 11 (5.7%) |
| $100,000 to $149,999 | 25 (4.9%) | 0 (0.0%) |
| $150,000 or more | 14 (2.7%) | 0 (0.0%) |
| Total | 511 (100.0%) | 194 (100.0%) |
Monthly Housing Cost Tiers in Menard
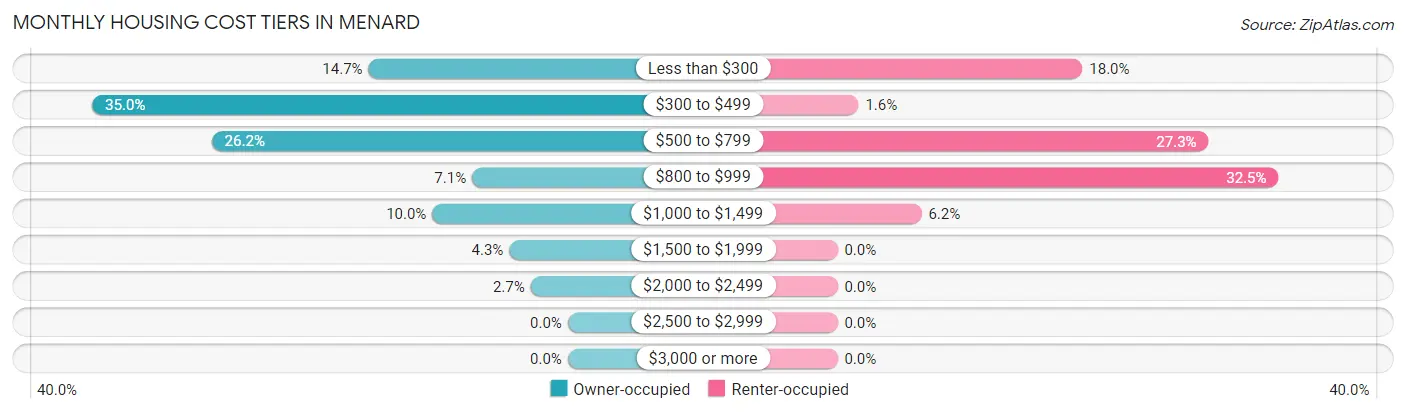
| Monthly Cost | Owner-occupied | Renter-occupied |
| Less than $300 | 75 (14.7%) | 35 (18.0%) |
| $300 to $499 | 179 (35.0%) | 3 (1.5%) |
| $500 to $799 | 134 (26.2%) | 53 (27.3%) |
| $800 to $999 | 36 (7.0%) | 63 (32.5%) |
| $1,000 to $1,499 | 51 (10.0%) | 12 (6.2%) |
| $1,500 to $1,999 | 22 (4.3%) | 0 (0.0%) |
| $2,000 to $2,499 | 14 (2.7%) | 0 (0.0%) |
| $2,500 to $2,999 | 0 (0.0%) | 0 (0.0%) |
| $3,000 or more | 0 (0.0%) | 0 (0.0%) |
| Total | 511 (100.0%) | 194 (100.0%) |
Physical Housing Characteristics in Menard
Housing Structures in Menard
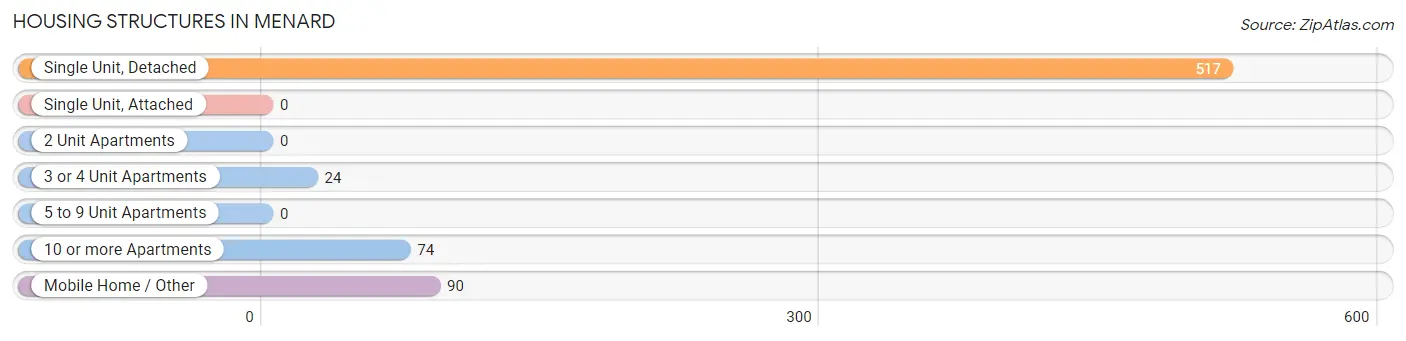
| Structure Type | # Housing Units | % Housing Units |
| Single Unit, Detached | 517 | 73.3% |
| Single Unit, Attached | 0 | 0.0% |
| 2 Unit Apartments | 0 | 0.0% |
| 3 or 4 Unit Apartments | 24 | 3.4% |
| 5 to 9 Unit Apartments | 0 | 0.0% |
| 10 or more Apartments | 74 | 10.5% |
| Mobile Home / Other | 90 | 12.8% |
| Total | 705 | 100.0% |
Housing Structures by Occupancy in Menard
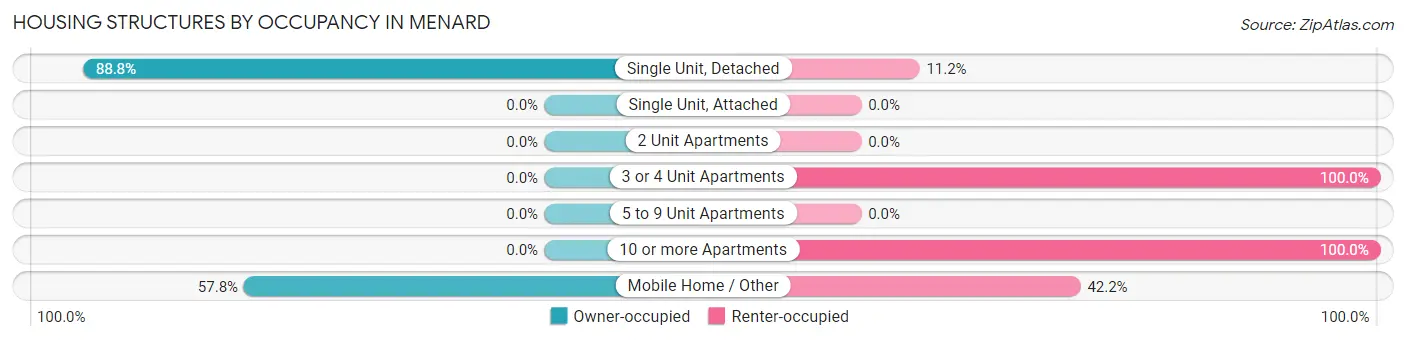
| Structure Type | Owner-occupied | Renter-occupied |
| Single Unit, Detached | 459 (88.8%) | 58 (11.2%) |
| Single Unit, Attached | 0 (0.0%) | 0 (0.0%) |
| 2 Unit Apartments | 0 (0.0%) | 0 (0.0%) |
| 3 or 4 Unit Apartments | 0 (0.0%) | 24 (100.0%) |
| 5 to 9 Unit Apartments | 0 (0.0%) | 0 (0.0%) |
| 10 or more Apartments | 0 (0.0%) | 74 (100.0%) |
| Mobile Home / Other | 52 (57.8%) | 38 (42.2%) |
| Total | 511 (72.5%) | 194 (27.5%) |
Housing Structures by Number of Rooms in Menard
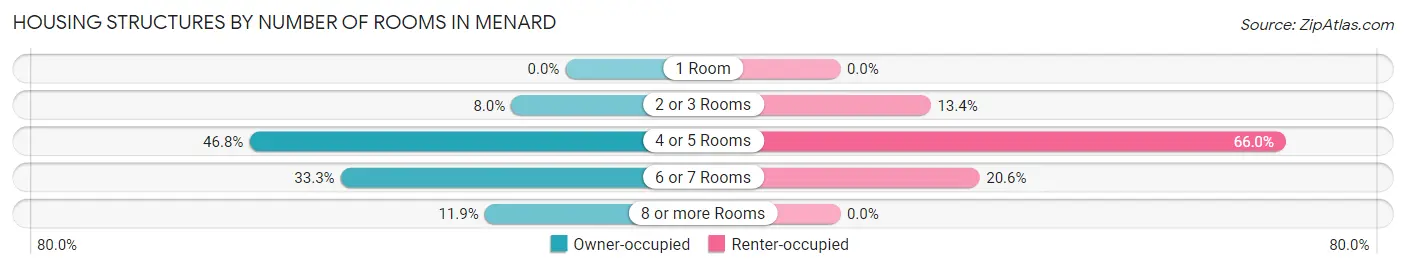
| Number of Rooms | Owner-occupied | Renter-occupied |
| 1 Room | 0 (0.0%) | 0 (0.0%) |
| 2 or 3 Rooms | 41 (8.0%) | 26 (13.4%) |
| 4 or 5 Rooms | 239 (46.8%) | 128 (66.0%) |
| 6 or 7 Rooms | 170 (33.3%) | 40 (20.6%) |
| 8 or more Rooms | 61 (11.9%) | 0 (0.0%) |
| Total | 511 (100.0%) | 194 (100.0%) |
Housing Structure by Heating Type in Menard
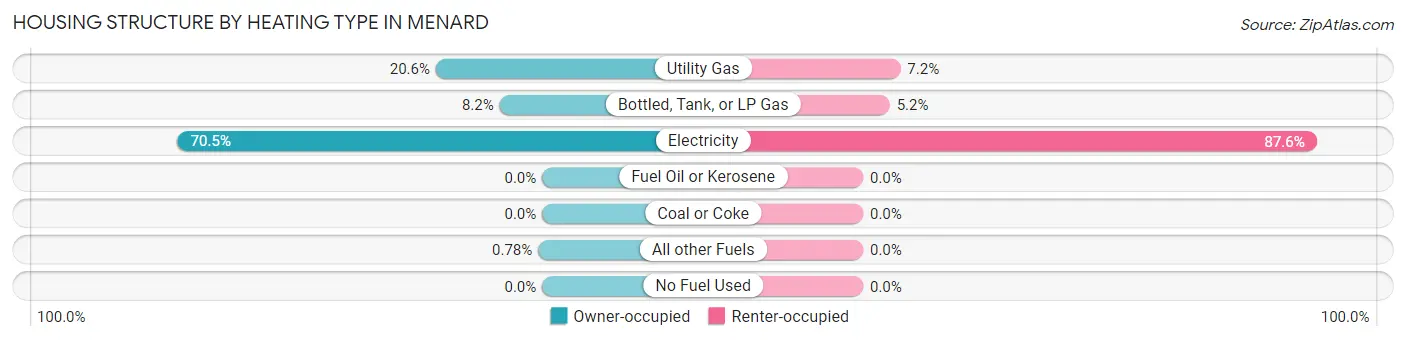
| Heating Type | Owner-occupied | Renter-occupied |
| Utility Gas | 105 (20.5%) | 14 (7.2%) |
| Bottled, Tank, or LP Gas | 42 (8.2%) | 10 (5.1%) |
| Electricity | 360 (70.5%) | 170 (87.6%) |
| Fuel Oil or Kerosene | 0 (0.0%) | 0 (0.0%) |
| Coal or Coke | 0 (0.0%) | 0 (0.0%) |
| All other Fuels | 4 (0.8%) | 0 (0.0%) |
| No Fuel Used | 0 (0.0%) | 0 (0.0%) |
| Total | 511 (100.0%) | 194 (100.0%) |
Household Vehicle Usage in Menard
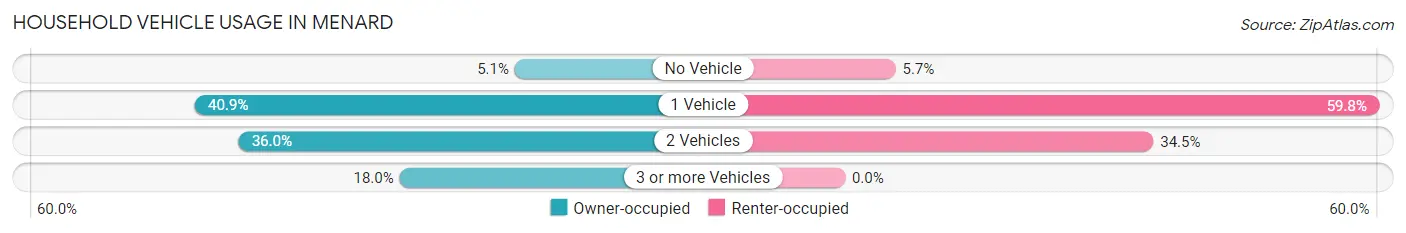
| Vehicles per Household | Owner-occupied | Renter-occupied |
| No Vehicle | 26 (5.1%) | 11 (5.7%) |
| 1 Vehicle | 209 (40.9%) | 116 (59.8%) |
| 2 Vehicles | 184 (36.0%) | 67 (34.5%) |
| 3 or more Vehicles | 92 (18.0%) | 0 (0.0%) |
| Total | 511 (100.0%) | 194 (100.0%) |
Real Estate & Mortgages in Menard
Real Estate and Mortgage Overview in Menard
| Characteristic | Without Mortgage | With Mortgage |
| Housing Units | 357 | 154 |
| Median Property Value | $56,000 | $99,100 |
| Median Household Income | $28,472 | $14 |
| Monthly Housing Costs | $388 | $0 |
| Real Estate Taxes | $1,066 | $0 |
Property Value by Mortgage Status in Menard
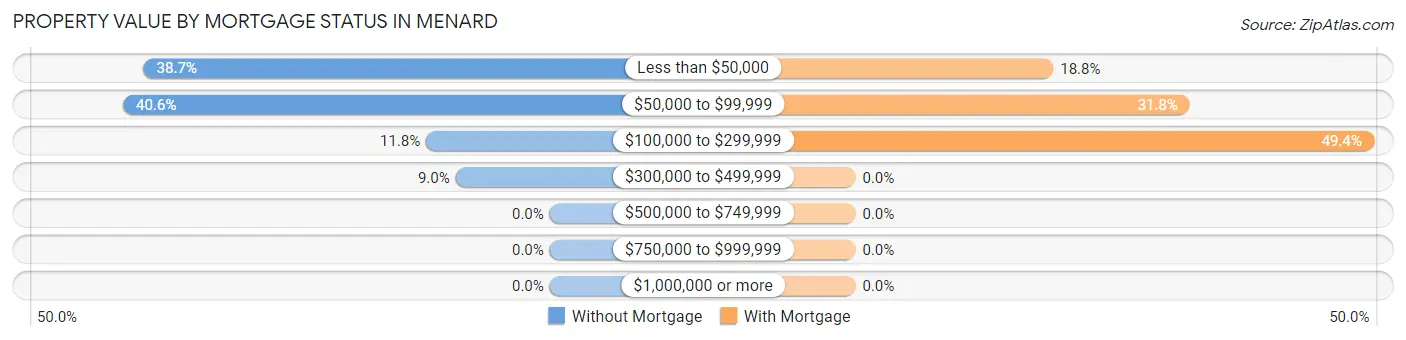
| Property Value | Without Mortgage | With Mortgage |
| Less than $50,000 | 138 (38.7%) | 29 (18.8%) |
| $50,000 to $99,999 | 145 (40.6%) | 49 (31.8%) |
| $100,000 to $299,999 | 42 (11.8%) | 76 (49.3%) |
| $300,000 to $499,999 | 32 (9.0%) | 0 (0.0%) |
| $500,000 to $749,999 | 0 (0.0%) | 0 (0.0%) |
| $750,000 to $999,999 | 0 (0.0%) | 0 (0.0%) |
| $1,000,000 or more | 0 (0.0%) | 0 (0.0%) |
| Total | 357 (100.0%) | 154 (100.0%) |
Household Income by Mortgage Status in Menard
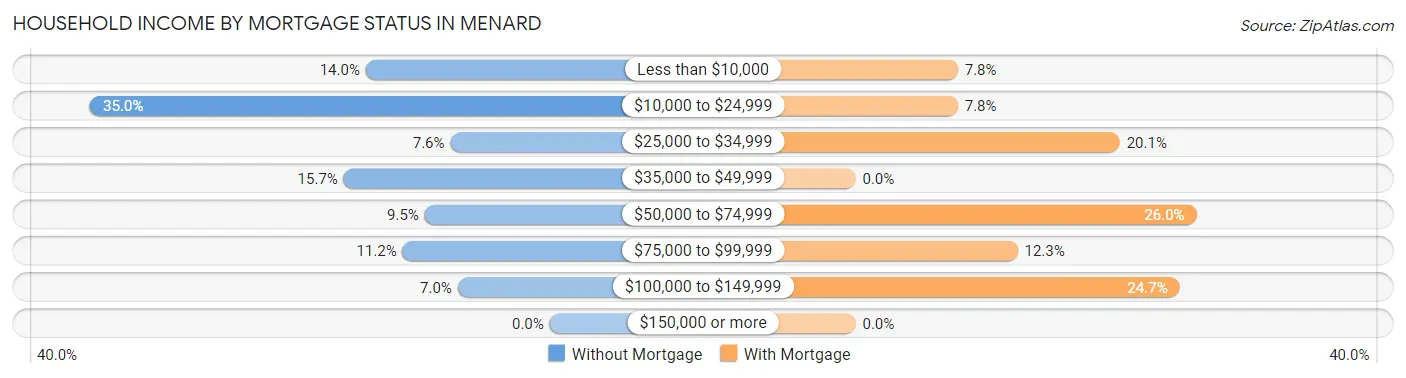
| Household Income | Without Mortgage | With Mortgage |
| Less than $10,000 | 50 (14.0%) | 12 (7.8%) |
| $10,000 to $24,999 | 125 (35.0%) | 12 (7.8%) |
| $25,000 to $34,999 | 27 (7.6%) | 31 (20.1%) |
| $35,000 to $49,999 | 56 (15.7%) | 0 (0.0%) |
| $50,000 to $74,999 | 34 (9.5%) | 40 (26.0%) |
| $75,000 to $99,999 | 40 (11.2%) | 19 (12.3%) |
| $100,000 to $149,999 | 25 (7.0%) | 38 (24.7%) |
| $150,000 or more | 0 (0.0%) | 0 (0.0%) |
| Total | 357 (100.0%) | 154 (100.0%) |
Property Value to Household Income Ratio in Menard
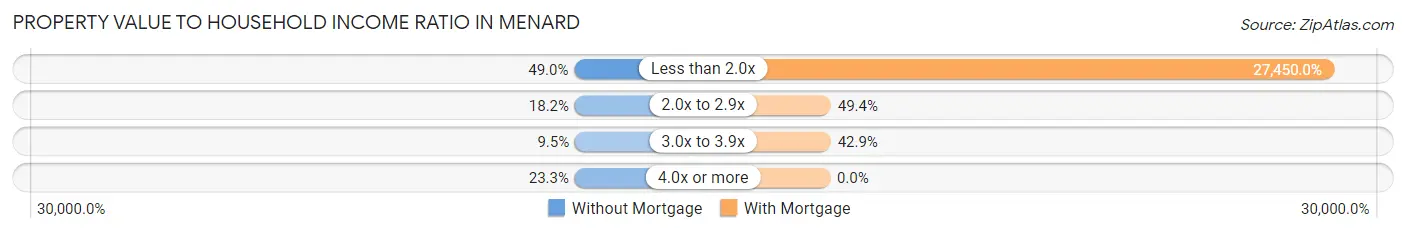
| Value-to-Income Ratio | Without Mortgage | With Mortgage |
| Less than 2.0x | 175 (49.0%) | 42,273 (27,450.0%) |
| 2.0x to 2.9x | 65 (18.2%) | 76 (49.3%) |
| 3.0x to 3.9x | 34 (9.5%) | 66 (42.9%) |
| 4.0x or more | 83 (23.3%) | 0 (0.0%) |
| Total | 357 (100.0%) | 154 (100.0%) |
Real Estate Taxes by Mortgage Status in Menard
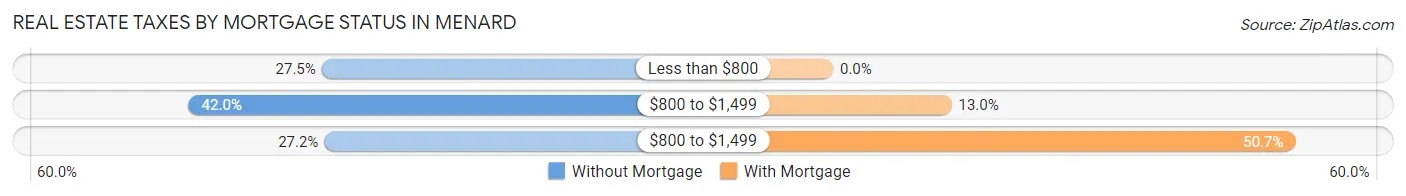
| Property Taxes | Without Mortgage | With Mortgage |
| Less than $800 | 98 (27.5%) | 0 (0.0%) |
| $800 to $1,499 | 150 (42.0%) | 20 (13.0%) |
| $800 to $1,499 | 97 (27.2%) | 78 (50.6%) |
| Total | 357 (100.0%) | 154 (100.0%) |
Health & Disability in Menard
Health Insurance Coverage by Age in Menard
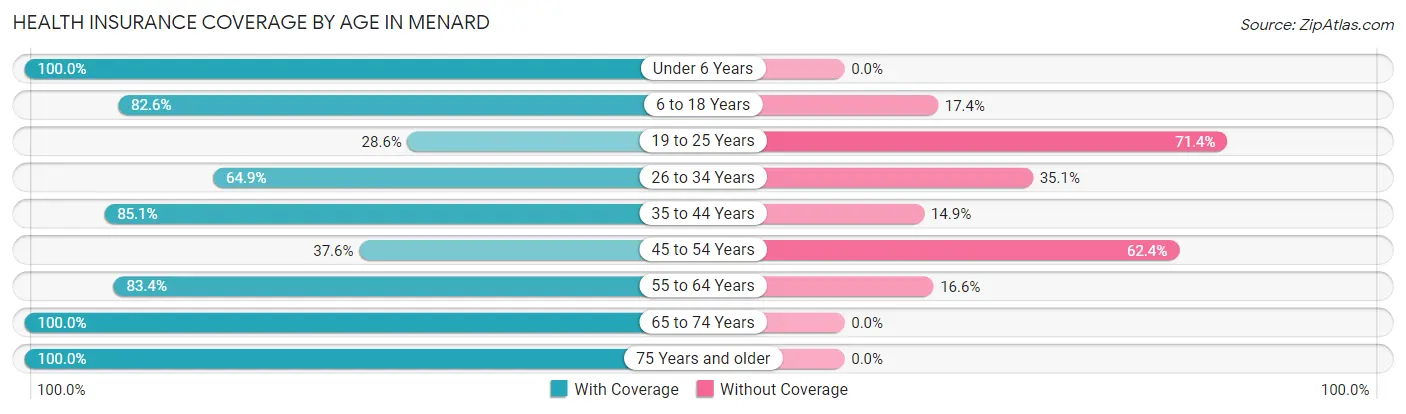
| Age Bracket | With Coverage | Without Coverage |
| Under 6 Years | 33 (100.0%) | 0 (0.0%) |
| 6 to 18 Years | 180 (82.6%) | 38 (17.4%) |
| 19 to 25 Years | 8 (28.6%) | 20 (71.4%) |
| 26 to 34 Years | 96 (64.9%) | 52 (35.1%) |
| 35 to 44 Years | 63 (85.1%) | 11 (14.9%) |
| 45 to 54 Years | 53 (37.6%) | 88 (62.4%) |
| 55 to 64 Years | 161 (83.4%) | 32 (16.6%) |
| 65 to 74 Years | 223 (100.0%) | 0 (0.0%) |
| 75 Years and older | 251 (100.0%) | 0 (0.0%) |
| Total | 1,068 (81.6%) | 241 (18.4%) |
Health Insurance Coverage by Citizenship Status in Menard
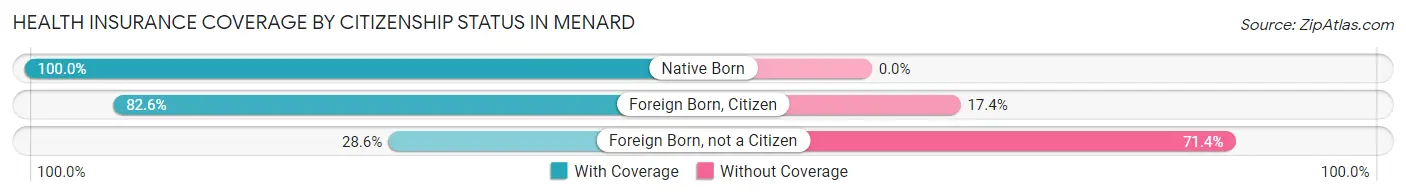
| Citizenship Status | With Coverage | Without Coverage |
| Native Born | 33 (100.0%) | 0 (0.0%) |
| Foreign Born, Citizen | 180 (82.6%) | 38 (17.4%) |
| Foreign Born, not a Citizen | 8 (28.6%) | 20 (71.4%) |
Health Insurance Coverage by Household Income in Menard
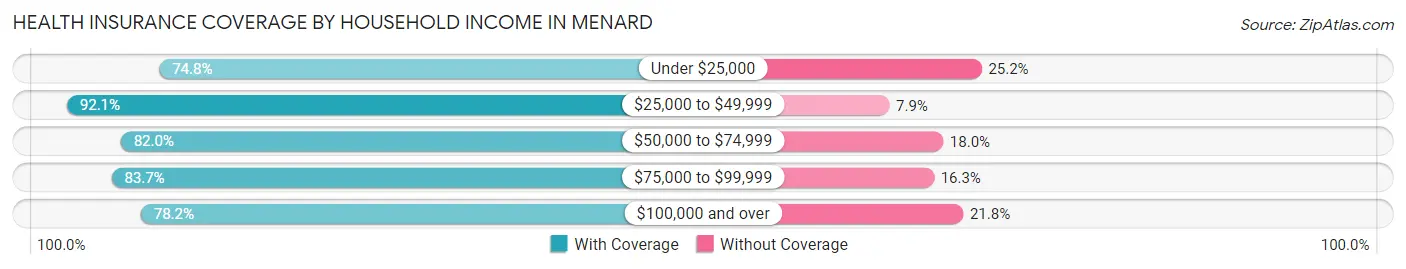
| Household Income | With Coverage | Without Coverage |
| Under $25,000 | 320 (74.8%) | 108 (25.2%) |
| $25,000 to $49,999 | 244 (92.1%) | 21 (7.9%) |
| $50,000 to $74,999 | 173 (82.0%) | 38 (18.0%) |
| $75,000 to $99,999 | 216 (83.7%) | 42 (16.3%) |
| $100,000 and over | 115 (78.2%) | 32 (21.8%) |
Public vs Private Health Insurance Coverage by Age in Menard
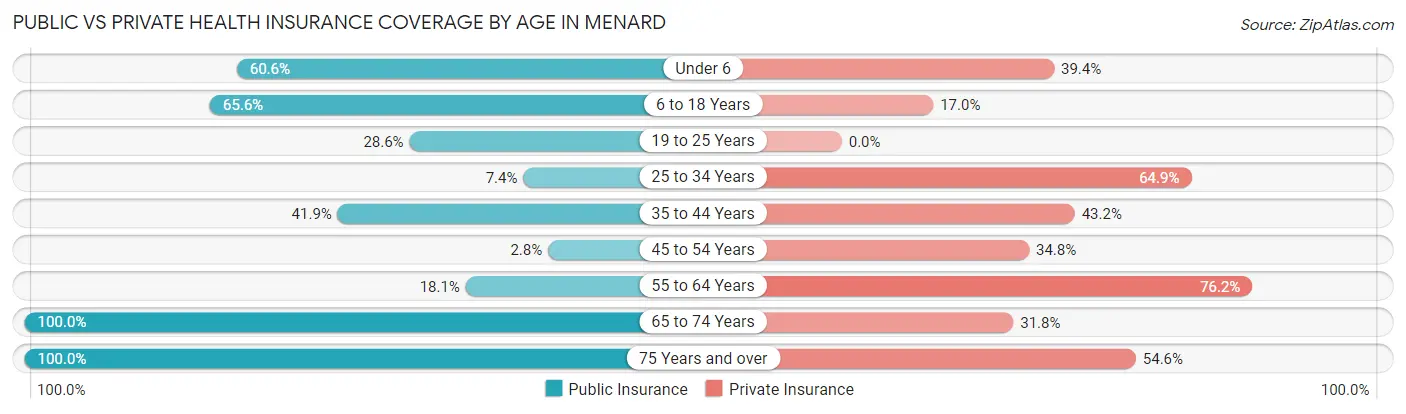
| Age Bracket | Public Insurance | Private Insurance |
| Under 6 | 20 (60.6%) | 13 (39.4%) |
| 6 to 18 Years | 143 (65.6%) | 37 (17.0%) |
| 19 to 25 Years | 8 (28.6%) | 0 (0.0%) |
| 25 to 34 Years | 11 (7.4%) | 96 (64.9%) |
| 35 to 44 Years | 31 (41.9%) | 32 (43.2%) |
| 45 to 54 Years | 4 (2.8%) | 49 (34.7%) |
| 55 to 64 Years | 35 (18.1%) | 147 (76.2%) |
| 65 to 74 Years | 223 (100.0%) | 71 (31.8%) |
| 75 Years and over | 251 (100.0%) | 137 (54.6%) |
| Total | 726 (55.5%) | 582 (44.5%) |
Disability Status by Sex by Age in Menard
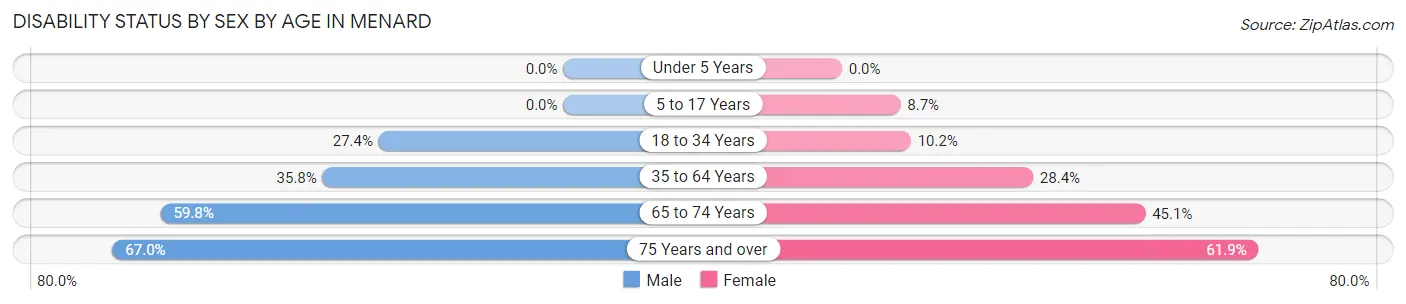
| Age Bracket | Male | Female |
| Under 5 Years | 0 (0.0%) | 0 (0.0%) |
| 5 to 17 Years | 0 (0.0%) | 8 (8.7%) |
| 18 to 34 Years | 37 (27.4%) | 9 (10.2%) |
| 35 to 64 Years | 64 (35.7%) | 65 (28.4%) |
| 65 to 74 Years | 67 (59.8%) | 50 (45.1%) |
| 75 Years and over | 75 (67.0%) | 86 (61.9%) |
Disability Class by Sex by Age in Menard
Disability Class: Hearing Difficulty
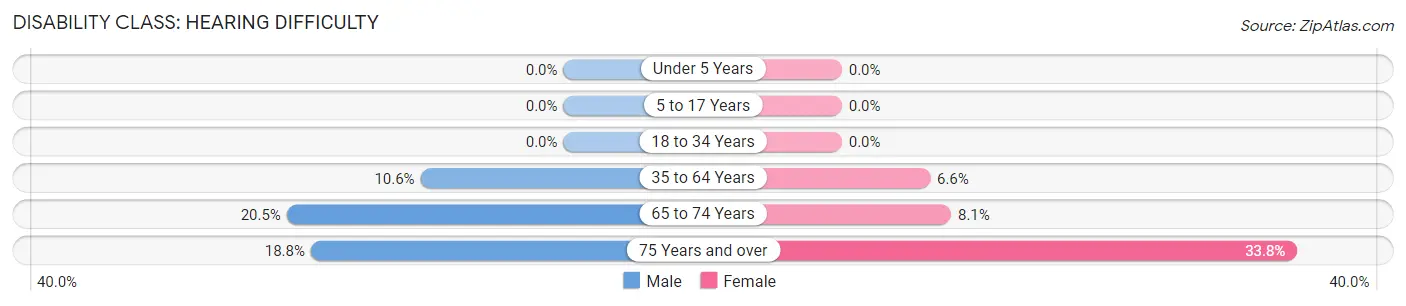
| Age Bracket | Male | Female |
| Under 5 Years | 0 (0.0%) | 0 (0.0%) |
| 5 to 17 Years | 0 (0.0%) | 0 (0.0%) |
| 18 to 34 Years | 0 (0.0%) | 0 (0.0%) |
| 35 to 64 Years | 19 (10.6%) | 15 (6.6%) |
| 65 to 74 Years | 23 (20.5%) | 9 (8.1%) |
| 75 Years and over | 21 (18.8%) | 47 (33.8%) |
Disability Class: Vision Difficulty
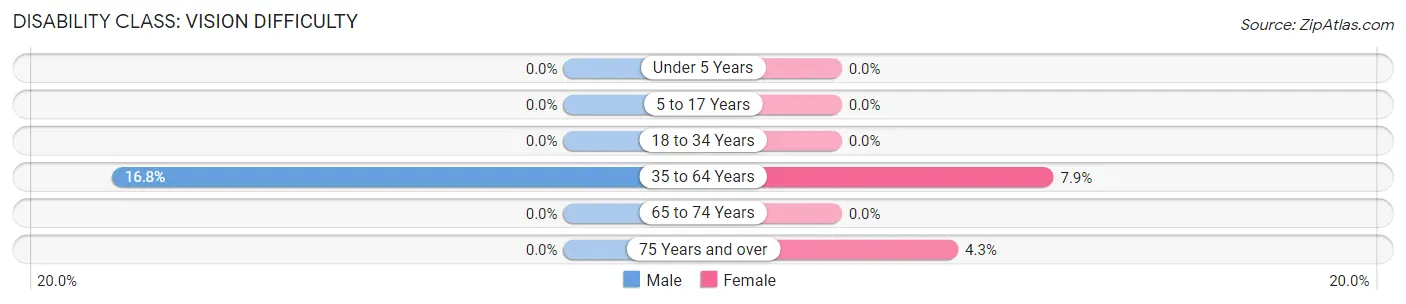
| Age Bracket | Male | Female |
| Under 5 Years | 0 (0.0%) | 0 (0.0%) |
| 5 to 17 Years | 0 (0.0%) | 0 (0.0%) |
| 18 to 34 Years | 0 (0.0%) | 0 (0.0%) |
| 35 to 64 Years | 30 (16.8%) | 18 (7.9%) |
| 65 to 74 Years | 0 (0.0%) | 0 (0.0%) |
| 75 Years and over | 0 (0.0%) | 6 (4.3%) |
Disability Class: Cognitive Difficulty
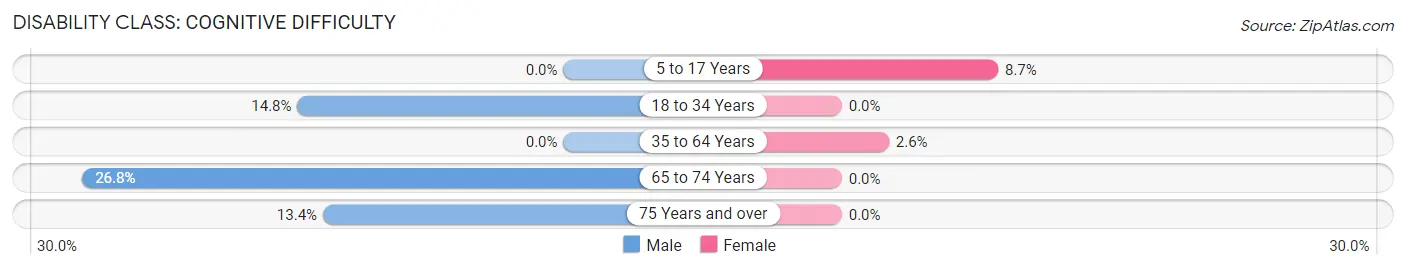
| Age Bracket | Male | Female |
| 5 to 17 Years | 0 (0.0%) | 8 (8.7%) |
| 18 to 34 Years | 20 (14.8%) | 0 (0.0%) |
| 35 to 64 Years | 0 (0.0%) | 6 (2.6%) |
| 65 to 74 Years | 30 (26.8%) | 0 (0.0%) |
| 75 Years and over | 15 (13.4%) | 0 (0.0%) |
Disability Class: Ambulatory Difficulty
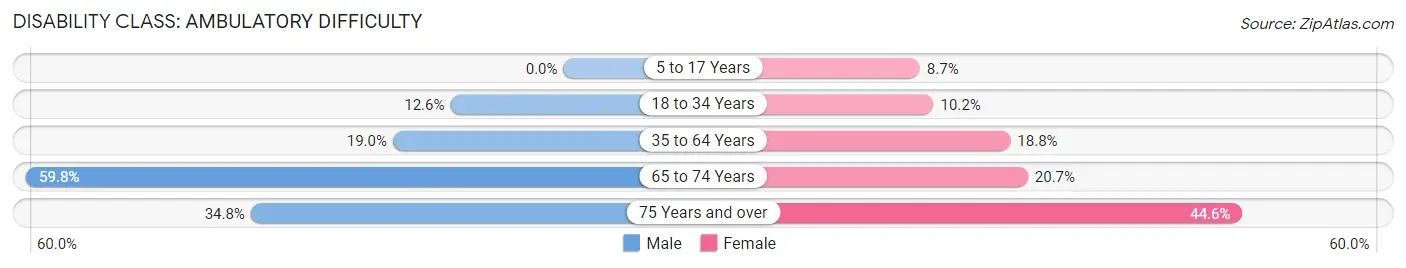
| Age Bracket | Male | Female |
| 5 to 17 Years | 0 (0.0%) | 8 (8.7%) |
| 18 to 34 Years | 17 (12.6%) | 9 (10.2%) |
| 35 to 64 Years | 34 (19.0%) | 43 (18.8%) |
| 65 to 74 Years | 67 (59.8%) | 23 (20.7%) |
| 75 Years and over | 39 (34.8%) | 62 (44.6%) |
Disability Class: Self-Care Difficulty
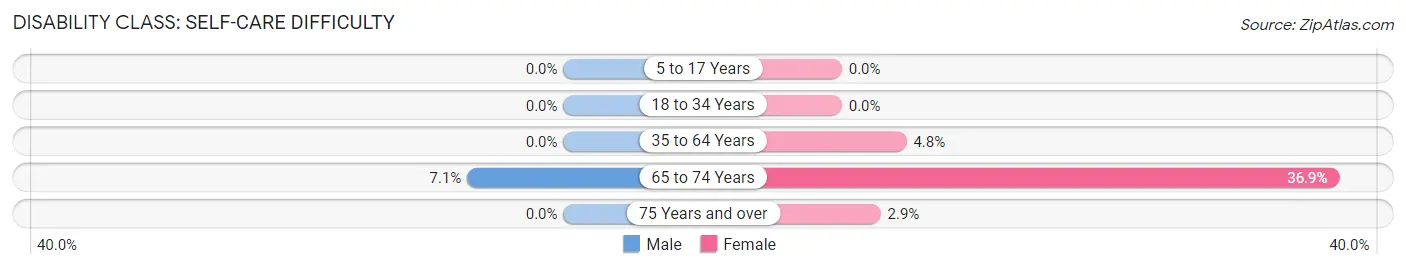
| Age Bracket | Male | Female |
| 5 to 17 Years | 0 (0.0%) | 0 (0.0%) |
| 18 to 34 Years | 0 (0.0%) | 0 (0.0%) |
| 35 to 64 Years | 0 (0.0%) | 11 (4.8%) |
| 65 to 74 Years | 8 (7.1%) | 41 (36.9%) |
| 75 Years and over | 0 (0.0%) | 4 (2.9%) |
Technology Access in Menard
Computing Device Access in Menard
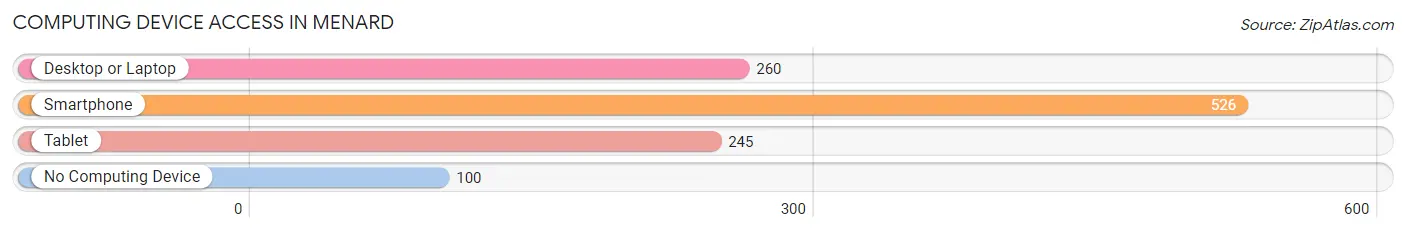
| Device Type | # Households | % Households |
| Desktop or Laptop | 260 | 36.9% |
| Smartphone | 526 | 74.6% |
| Tablet | 245 | 34.7% |
| No Computing Device | 100 | 14.2% |
| Total | 705 | 100.0% |
Internet Access in Menard
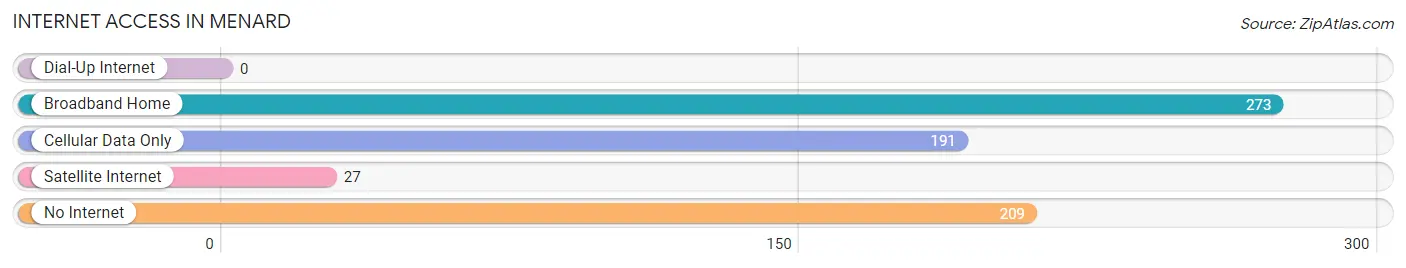
| Internet Type | # Households | % Households |
| Dial-Up Internet | 0 | 0.0% |
| Broadband Home | 273 | 38.7% |
| Cellular Data Only | 191 | 27.1% |
| Satellite Internet | 27 | 3.8% |
| No Internet | 209 | 29.6% |
| Total | 705 | 100.0% |
Menard Summary
Menard, Texas is a small town located in the heart of Texas Hill Country, about 90 miles northwest of San Antonio. It is the county seat of Menard County, which was established in 1858. The town was founded in 1858 and named after Michel Branamour Menard, the founder of Galveston, Texas. The population of Menard was 1,541 in the 2010 census.
History
Menard was founded in 1858 by Michel Branamour Menard, who was the founder of Galveston, Texas. The town was named after him and was the first county seat of Menard County. The town was originally located on the banks of the San Saba River, but was moved to its current location in 1876 due to flooding.
The town was an important stop on the San Antonio-El Paso Road, which was a major route for travelers and freight in the late 19th century. The town was also a stop on the San Antonio and Aransas Pass Railway, which was built in 1887.
The town was an important center for the cattle industry in the late 19th and early 20th centuries. The town was also home to several large ranches, including the 6666 Ranch, which was founded in 1867 and is still in operation today.
Geography
Menard is located in the heart of Texas Hill Country, about 90 miles northwest of San Antonio. The town is situated on the banks of the San Saba River, which is a tributary of the Colorado River. The town is surrounded by rolling hills and is located at an elevation of 1,400 feet.
The climate in Menard is semi-arid, with hot summers and mild winters. The average annual temperature is 68 degrees Fahrenheit, and the average annual precipitation is 22 inches.
Economy
The economy of Menard is largely based on agriculture and ranching. The town is home to several large ranches, including the 6666 Ranch, which is one of the largest ranches in the United States. The town is also home to several small businesses, including a grocery store, a hardware store, and a few restaurants.
The town is also home to a small manufacturing sector, which includes a few small factories that produce furniture, clothing, and other goods.
Demographics
The population of Menard was 1,541 in the 2010 census. The population is predominantly white, with a small Hispanic minority. The median household income in Menard is $35,000, and the median home value is $90,000.
The town is served by the Menard Independent School District, which includes two elementary schools, one middle school, and one high school. The town is also home to a branch of the Texas A&M University System.
Conclusion
Menard, Texas is a small town located in the heart of Texas Hill Country, about 90 miles northwest of San Antonio. It is the county seat of Menard County, which was established in 1858. The town was founded in 1858 and named after Michel Branamour Menard, the founder of Galveston, Texas. The population of Menard was 1,541 in the 2010 census. The economy of Menard is largely based on agriculture and ranching, and the town is home to several large ranches, including the 6666 Ranch. The town is also home to a small manufacturing sector, and is served by the Menard Independent School District.
Common Questions
What is Per Capita Income in Menard?
Per Capita income in Menard is $24,854.
What is the Median Family Income in Menard?
Median Family Income in Menard is $61,477.
What is the Median Household income in Menard?
Median Household Income in Menard is $37,601.
What is Income or Wage Gap in Menard?
Income or Wage Gap in Menard is 40.8%.
Women in Menard earn 59.2 cents for every dollar earned by a man.
What is Inequality or Gini Index in Menard?
Inequality or Gini Index in Menard is 0.45.
What is the Total Population of Menard?
Total Population of Menard is 1,356.
What is the Total Male Population of Menard?
Total Male Population of Menard is 667.
What is the Total Female Population of Menard?
Total Female Population of Menard is 689.
What is the Ratio of Males per 100 Females in Menard?
There are 96.81 Males per 100 Females in Menard.
What is the Ratio of Females per 100 Males in Menard?
There are 103.30 Females per 100 Males in Menard.
What is the Median Population Age in Menard?
Median Population Age in Menard is 59.0 Years.
What is the Average Family Size in Menard
Average Family Size in Menard is 3.0 People.
What is the Average Household Size in Menard
Average Household Size in Menard is 1.9 People.
How Large is the Labor Force in Menard?
There are 587 People in the Labor Forcein in Menard.
What is the Percentage of People in the Labor Force in Menard?
50.0% of People are in the Labor Force in Menard.
What is the Unemployment Rate in Menard?
Unemployment Rate in Menard is 8.0%.