Mason, TX Map & Demographics
Mason Map
Mason Overview
$31,397
PER CAPITA INCOME
$93,698
AVG FAMILY INCOME
$61,797
AVG HOUSEHOLD INCOME
10.5%
WAGE / INCOME GAP [ % ]
89.5¢/ $1
WAGE / INCOME GAP [ $ ]
0.47
INEQUALITY / GINI INDEX
2,158
TOTAL POPULATION
1,149
MALE POPULATION
1,009
FEMALE POPULATION
113.88
MALES / 100 FEMALES
87.82
FEMALES / 100 MALES
37.0
MEDIAN AGE
3.7
AVG FAMILY SIZE
2.9
AVG HOUSEHOLD SIZE
948
LABOR FORCE [ PEOPLE ]
57.6%
PERCENT IN LABOR FORCE
3.9%
UNEMPLOYMENT RATE
Mason Zip Codes
Mason Area Codes
Income in Mason
Income Overview in Mason
Per Capita Income in Mason is $31,397, while median incomes of families and households are $93,698 and $61,797 respectively.
| Characteristic | Number | Measure |
| Per Capita Income | 2,158 | $31,397 |
| Median Family Income | 517 | $93,698 |
| Mean Family Income | 517 | $111,053 |
| Median Household Income | 755 | $61,797 |
| Mean Household Income | 755 | $88,061 |
| Income Deficit | 517 | $0 |
| Wage / Income Gap (%) | 2,158 | 10.48% |
| Wage / Income Gap ($) | 2,158 | 89.52¢ per $1 |
| Gini / Inequality Index | 2,158 | 0.47 |
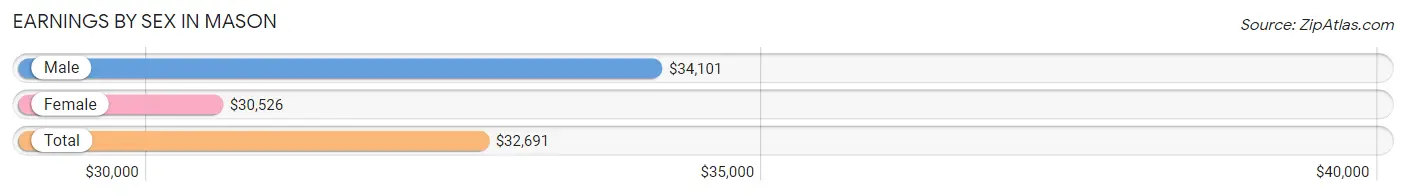
Earnings by Sex in Mason
Average Earnings in Mason are $32,691, $34,101 for men and $30,526 for women, a difference of 10.5%.
| Sex | Number | Average Earnings |
| Male | 493 (47.4%) | $34,101 |
| Female | 546 (52.5%) | $30,526 |
| Total | 1,039 (100.0%) | $32,691 |
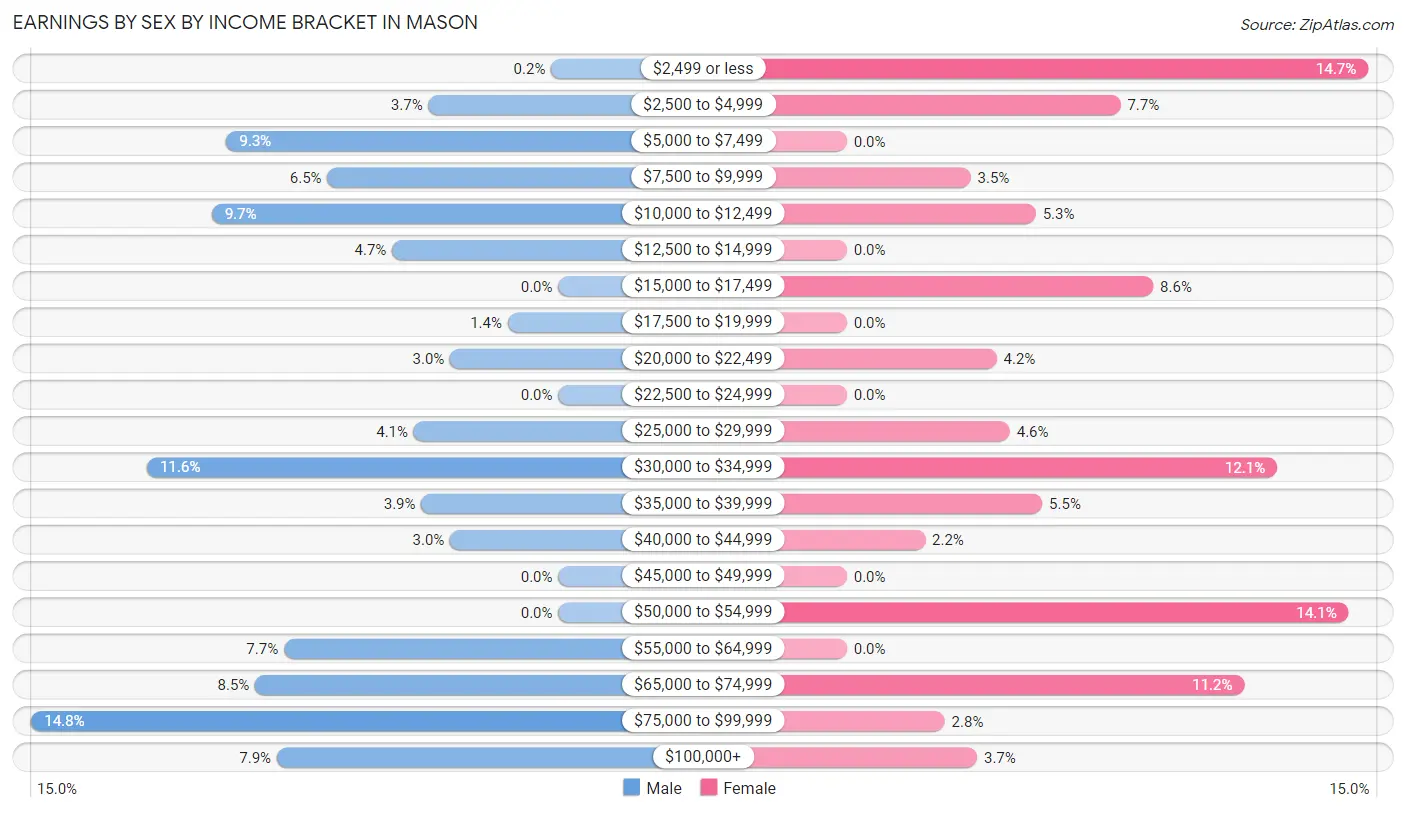
Earnings by Sex by Income Bracket in Mason
The most common earnings brackets in Mason are $75,000 to $99,999 for men (73 | 14.8%) and $2,499 or less for women (80 | 14.6%).
| Income | Male | Female |
| $2,499 or less | 1 (0.2%) | 80 (14.6%) |
| $2,500 to $4,999 | 18 (3.6%) | 42 (7.7%) |
| $5,000 to $7,499 | 46 (9.3%) | 0 (0.0%) |
| $7,500 to $9,999 | 32 (6.5%) | 19 (3.5%) |
| $10,000 to $12,499 | 48 (9.7%) | 29 (5.3%) |
| $12,500 to $14,999 | 23 (4.7%) | 0 (0.0%) |
| $15,000 to $17,499 | 0 (0.0%) | 47 (8.6%) |
| $17,500 to $19,999 | 7 (1.4%) | 0 (0.0%) |
| $20,000 to $22,499 | 15 (3.0%) | 23 (4.2%) |
| $22,500 to $24,999 | 0 (0.0%) | 0 (0.0%) |
| $25,000 to $29,999 | 20 (4.1%) | 25 (4.6%) |
| $30,000 to $34,999 | 57 (11.6%) | 66 (12.1%) |
| $35,000 to $39,999 | 19 (3.8%) | 30 (5.5%) |
| $40,000 to $44,999 | 15 (3.0%) | 12 (2.2%) |
| $45,000 to $49,999 | 0 (0.0%) | 0 (0.0%) |
| $50,000 to $54,999 | 0 (0.0%) | 77 (14.1%) |
| $55,000 to $64,999 | 38 (7.7%) | 0 (0.0%) |
| $65,000 to $74,999 | 42 (8.5%) | 61 (11.2%) |
| $75,000 to $99,999 | 73 (14.8%) | 15 (2.8%) |
| $100,000+ | 39 (7.9%) | 20 (3.7%) |
| Total | 493 (100.0%) | 546 (100.0%) |
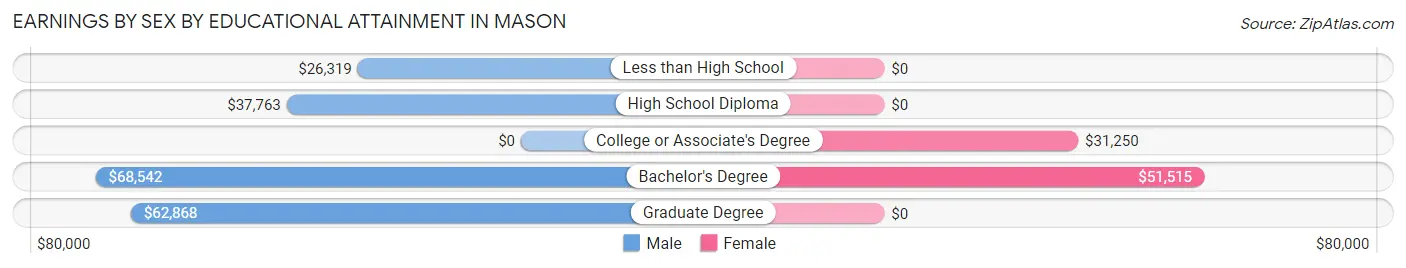
Earnings by Sex by Educational Attainment in Mason
Average earnings in Mason are $55,625 for men and $33,393 for women, a difference of 40.0%. Men with an educational attainment of bachelor's degree enjoy the highest average annual earnings of $68,542, while those with less than high school education earn the least with $26,319. Women with an educational attainment of bachelor's degree earn the most with the average annual earnings of $51,515, while those with college or associate's degree education have the smallest earnings of $31,250.
| Educational Attainment | Male Income | Female Income |
| Less than High School | $26,319 | $0 |
| High School Diploma | $37,763 | $0 |
| College or Associate's Degree | - | - |
| Bachelor's Degree | $68,542 | $51,515 |
| Graduate Degree | $62,868 | $0 |
| Total | $55,625 | $33,393 |
Family Income in Mason
Family Income Brackets in Mason
According to the Mason family income data, there are 120 families falling into the $100,000 to $149,999 income range, which is the most common income bracket and makes up 23.2% of all families.
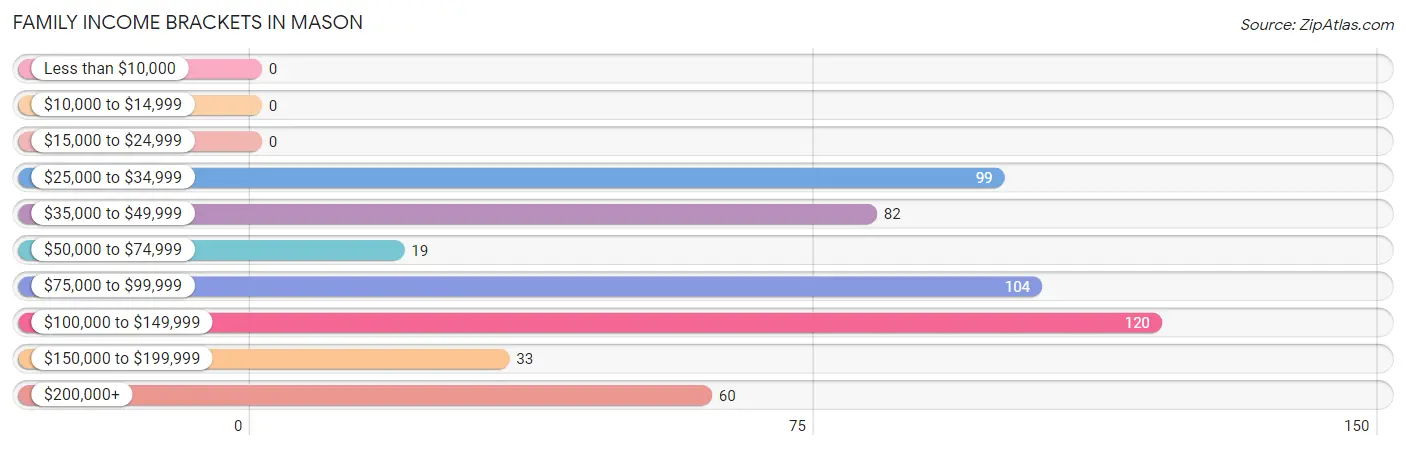
| Income Bracket | # Families | % Families |
| Less than $10,000 | 0 | 0.0% |
| $10,000 to $14,999 | 0 | 0.0% |
| $15,000 to $24,999 | 0 | 0.0% |
| $25,000 to $34,999 | 99 | 19.1% |
| $35,000 to $49,999 | 82 | 15.9% |
| $50,000 to $74,999 | 19 | 3.7% |
| $75,000 to $99,999 | 104 | 20.1% |
| $100,000 to $149,999 | 120 | 23.2% |
| $150,000 to $199,999 | 33 | 6.4% |
| $200,000+ | 60 | 11.6% |
Family Income by Famaliy Size in Mason
4-person families (164 | 31.7%) account for the highest median family income in Mason with $123,657 per family, while 4-person families (164 | 31.7%) have the highest median income of $30,914 per family member.
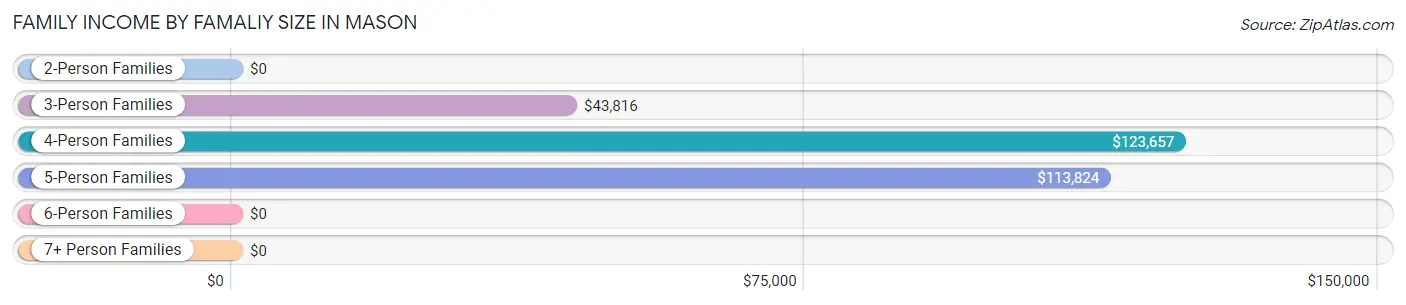
| Income Bracket | # Families | Median Income |
| 2-Person Families | 220 (42.5%) | $0 |
| 3-Person Families | 44 (8.5%) | $43,816 |
| 4-Person Families | 164 (31.7%) | $123,657 |
| 5-Person Families | 74 (14.3%) | $113,824 |
| 6-Person Families | 15 (2.9%) | $0 |
| 7+ Person Families | 0 (0.0%) | $0 |
| Total | 517 (100.0%) | $93,698 |
Family Income by Number of Earners in Mason
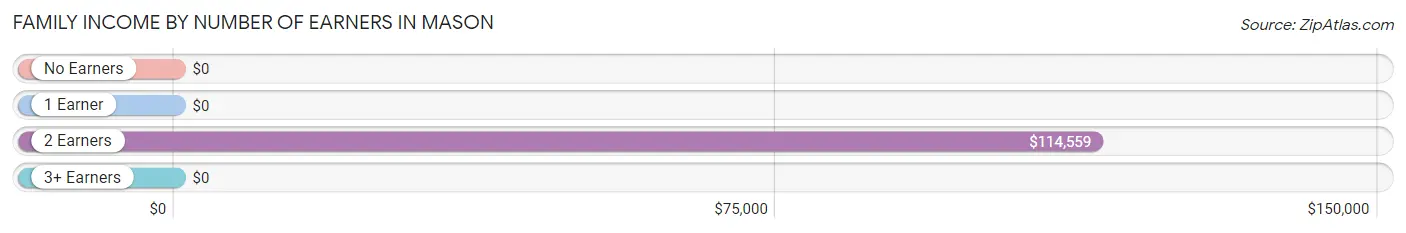
| Number of Earners | # Families | Median Income |
| No Earners | 43 (8.3%) | $0 |
| 1 Earner | 155 (30.0%) | $0 |
| 2 Earners | 292 (56.5%) | $114,559 |
| 3+ Earners | 27 (5.2%) | $0 |
| Total | 517 (100.0%) | $93,698 |
Household Income in Mason
Household Income Brackets in Mason
With 129 households falling in the category, the $100,000 to $149,999 income range is the most frequent in Mason, accounting for 17.1% of all households.
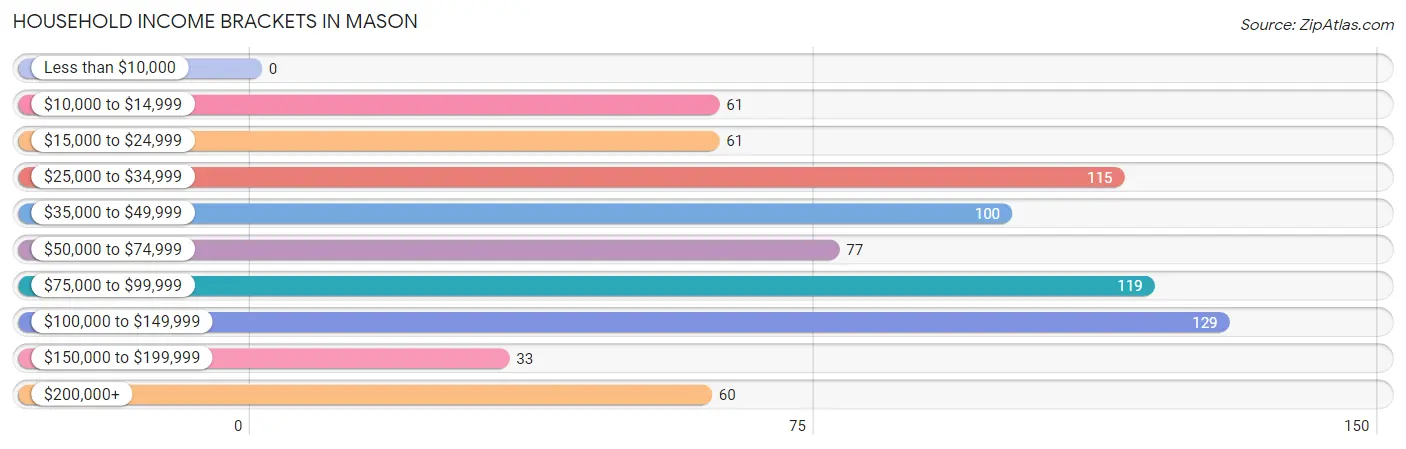
| Income Bracket | # Households | % Households |
| Less than $10,000 | 0 | 0.0% |
| $10,000 to $14,999 | 61 | 8.1% |
| $15,000 to $24,999 | 61 | 8.1% |
| $25,000 to $34,999 | 115 | 15.2% |
| $35,000 to $49,999 | 100 | 13.2% |
| $50,000 to $74,999 | 77 | 10.2% |
| $75,000 to $99,999 | 119 | 15.8% |
| $100,000 to $149,999 | 129 | 17.1% |
| $150,000 to $199,999 | 33 | 4.4% |
| $200,000+ | 60 | 7.9% |
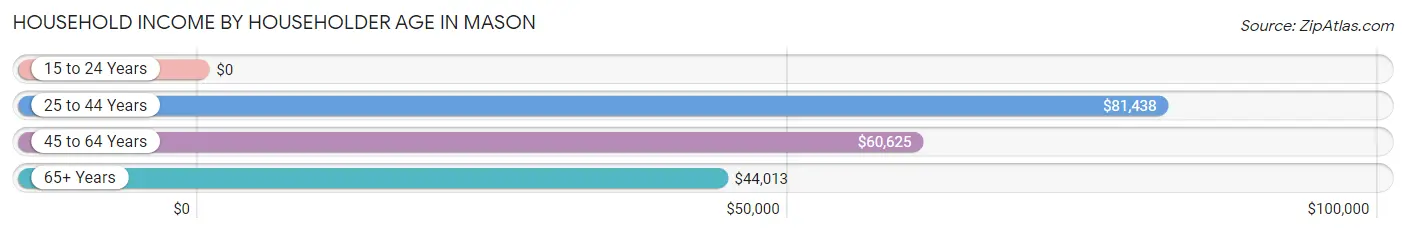
Household Income by Householder Age in Mason
The median household income in Mason is $61,797, with the highest median household income of $81,438 found in the 25 to 44 years age bracket for the primary householder. A total of 255 households (33.8%) fall into this category. Meanwhile, the 15 to 24 years age bracket for the primary householder has the lowest median household income of $0, with 7 households (0.9%) in this group.
| Income Bracket | # Households | Median Income |
| 15 to 24 Years | 7 (0.9%) | $0 |
| 25 to 44 Years | 255 (33.8%) | $81,438 |
| 45 to 64 Years | 206 (27.3%) | $60,625 |
| 65+ Years | 287 (38.0%) | $44,013 |
| Total | 755 (100.0%) | $61,797 |
Poverty in Mason
Income Below Poverty by Sex and Age in Mason
With 1.8% poverty level for males and 4.0% for females among the residents of Mason, 55 to 64 year old males and 45 to 54 year old females are the most vulnerable to poverty, with 18 males (14.9%) and 29 females (23.4%) in their respective age groups living below the poverty level.
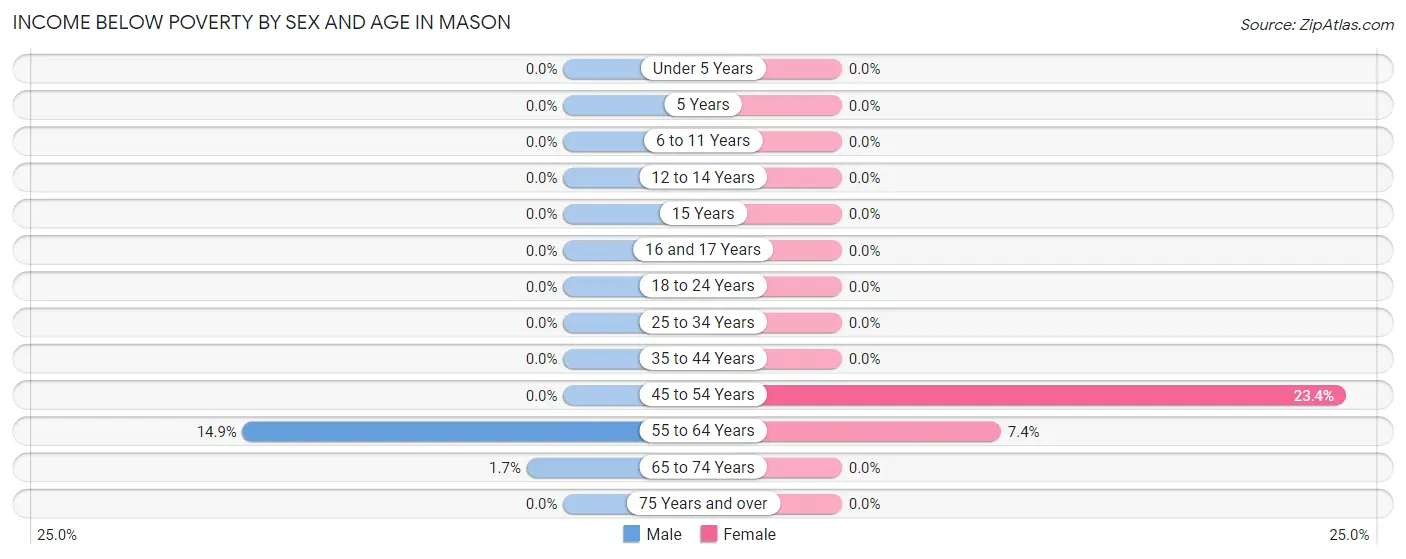
| Age Bracket | Male | Female |
| Under 5 Years | 0 (0.0%) | 0 (0.0%) |
| 5 Years | 0 (0.0%) | 0 (0.0%) |
| 6 to 11 Years | 0 (0.0%) | 0 (0.0%) |
| 12 to 14 Years | 0 (0.0%) | 0 (0.0%) |
| 15 Years | 0 (0.0%) | 0 (0.0%) |
| 16 and 17 Years | 0 (0.0%) | 0 (0.0%) |
| 18 to 24 Years | 0 (0.0%) | 0 (0.0%) |
| 25 to 34 Years | 0 (0.0%) | 0 (0.0%) |
| 35 to 44 Years | 0 (0.0%) | 0 (0.0%) |
| 45 to 54 Years | 0 (0.0%) | 29 (23.4%) |
| 55 to 64 Years | 18 (14.9%) | 11 (7.4%) |
| 65 to 74 Years | 3 (1.7%) | 0 (0.0%) |
| 75 Years and over | 0 (0.0%) | 0 (0.0%) |
| Total | 21 (1.8%) | 40 (4.0%) |
Income Above Poverty by Sex and Age in Mason
According to the poverty statistics in Mason, males aged under 5 years and females aged under 5 years are the age groups that are most secure financially, with 100.0% of males and 100.0% of females in these age groups living above the poverty line.
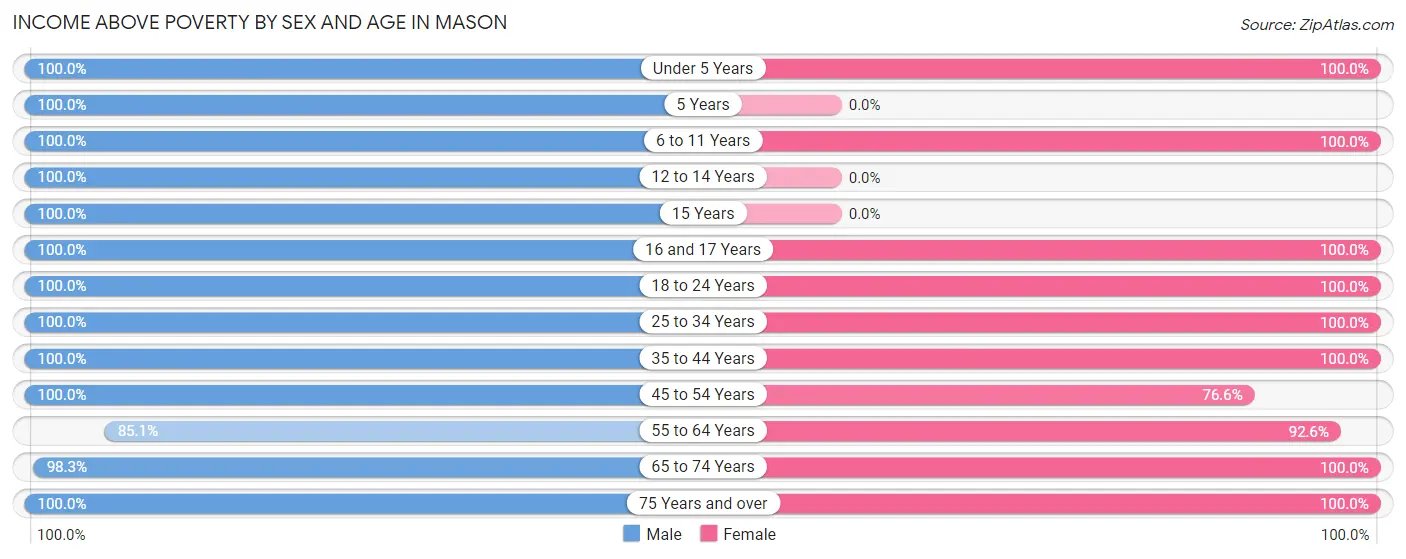
| Age Bracket | Male | Female |
| Under 5 Years | 225 (100.0%) | 44 (100.0%) |
| 5 Years | 26 (100.0%) | 0 (0.0%) |
| 6 to 11 Years | 46 (100.0%) | 116 (100.0%) |
| 12 to 14 Years | 39 (100.0%) | 0 (0.0%) |
| 15 Years | 17 (100.0%) | 0 (0.0%) |
| 16 and 17 Years | 14 (100.0%) | 66 (100.0%) |
| 18 to 24 Years | 115 (100.0%) | 71 (100.0%) |
| 25 to 34 Years | 146 (100.0%) | 113 (100.0%) |
| 35 to 44 Years | 88 (100.0%) | 87 (100.0%) |
| 45 to 54 Years | 44 (100.0%) | 95 (76.6%) |
| 55 to 64 Years | 103 (85.1%) | 138 (92.6%) |
| 65 to 74 Years | 173 (98.3%) | 201 (100.0%) |
| 75 Years and over | 83 (100.0%) | 38 (100.0%) |
| Total | 1,119 (98.2%) | 969 (96.0%) |
Income Below Poverty Among Married-Couple Families in Mason
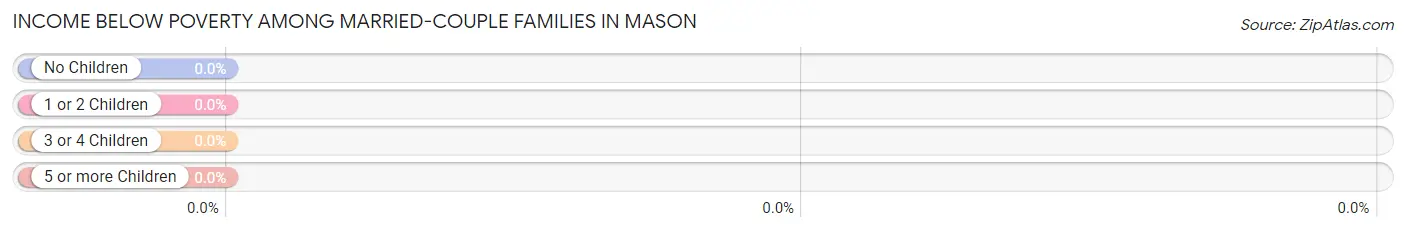
| Children | Above Poverty | Below Poverty |
| No Children | 248 (100.0%) | 0 (0.0%) |
| 1 or 2 Children | 127 (100.0%) | 0 (0.0%) |
| 3 or 4 Children | 81 (100.0%) | 0 (0.0%) |
| 5 or more Children | 0 (0.0%) | 0 (0.0%) |
| Total | 456 (100.0%) | 0 (0.0%) |
Income Below Poverty Among Single-Parent Households in Mason
| Children | Single Father | Single Mother |
| No Children | 0 (0.0%) | 0 (0.0%) |
| 1 or 2 Children | 0 (0.0%) | 0 (0.0%) |
| 3 or 4 Children | 0 (0.0%) | 0 (0.0%) |
| 5 or more Children | 0 (0.0%) | 0 (0.0%) |
| Total | 0 (0.0%) | 0 (0.0%) |
Income Below Poverty Among Married-Couple vs Single-Parent Households in Mason
| Children | Married-Couple Families | Single-Parent Households |
| No Children | 0 (0.0%) | 0 (0.0%) |
| 1 or 2 Children | 0 (0.0%) | 0 (0.0%) |
| 3 or 4 Children | 0 (0.0%) | 0 (0.0%) |
| 5 or more Children | 0 (0.0%) | 0 (0.0%) |
| Total | 0 (0.0%) | 0 (0.0%) |
Race in Mason
The most populous races in Mason are White / Caucasian (1,633 | 75.7%), Hispanic or Latino (718 | 33.3%), and Some other Race (337 | 15.6%).
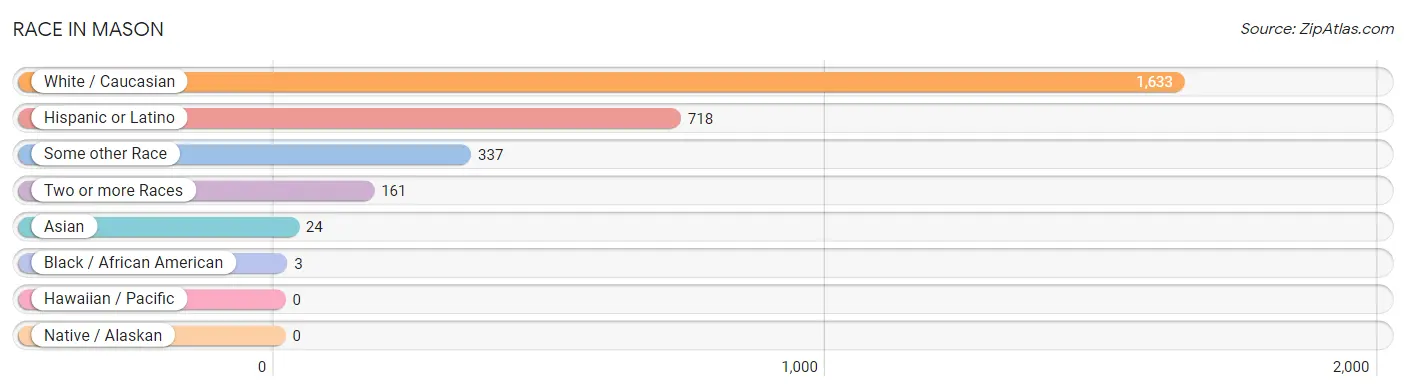
| Race | # Population | % Population |
| Asian | 24 | 1.1% |
| Black / African American | 3 | 0.1% |
| Hawaiian / Pacific | 0 | 0.0% |
| Hispanic or Latino | 718 | 33.3% |
| Native / Alaskan | 0 | 0.0% |
| White / Caucasian | 1,633 | 75.7% |
| Two or more Races | 161 | 7.5% |
| Some other Race | 337 | 15.6% |
| Total | 2,158 | 100.0% |
Ancestry in Mason
The most populous ancestries reported in Mason are Mexican (717 | 33.2%), German (712 | 33.0%), Irish (339 | 15.7%), English (204 | 9.5%), and American (176 | 8.2%), together accounting for 99.5% of all Mason residents.
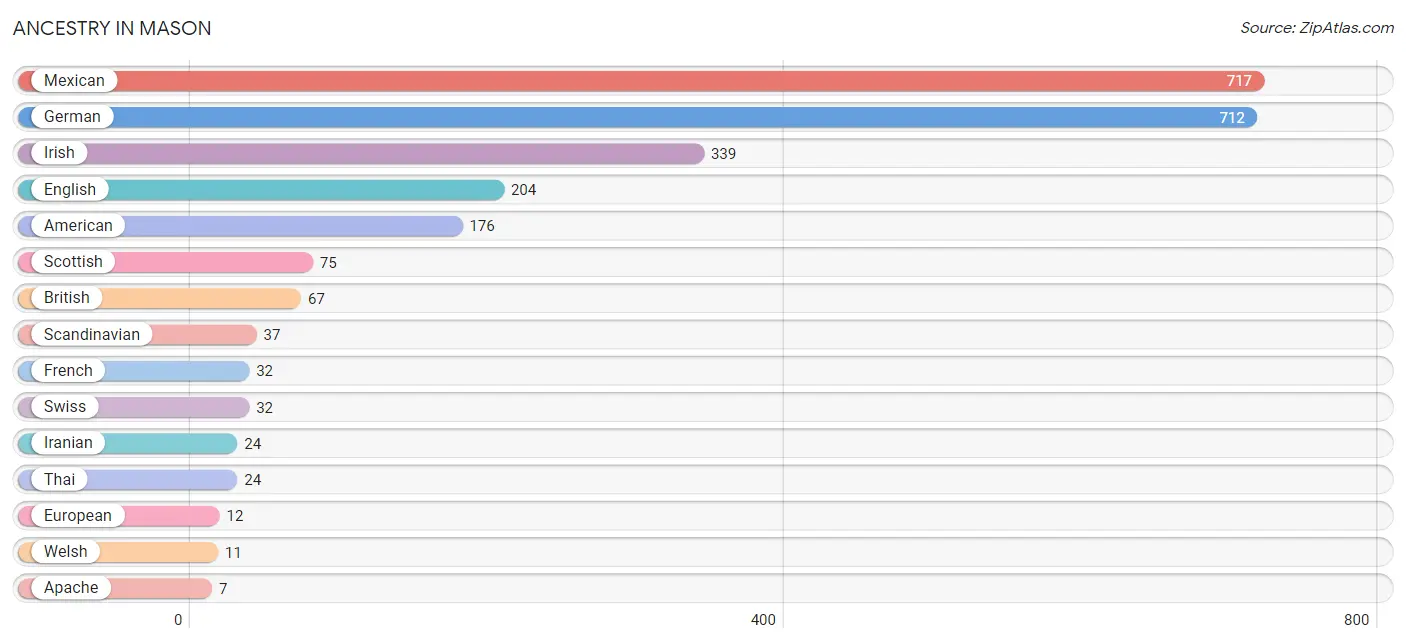
| Ancestry | # Population | % Population |
| American | 176 | 8.2% |
| Apache | 7 | 0.3% |
| British | 67 | 3.1% |
| Central American | 1 | 0.1% |
| English | 204 | 9.5% |
| European | 12 | 0.6% |
| French | 32 | 1.5% |
| German | 712 | 33.0% |
| Honduran | 1 | 0.1% |
| Iranian | 24 | 1.1% |
| Irish | 339 | 15.7% |
| Mexican | 717 | 33.2% |
| Scandinavian | 37 | 1.7% |
| Scottish | 75 | 3.5% |
| Swiss | 32 | 1.5% |
| Thai | 24 | 1.1% |
| Welsh | 11 | 0.5% | View All 17 Rows |
Immigrants in Mason
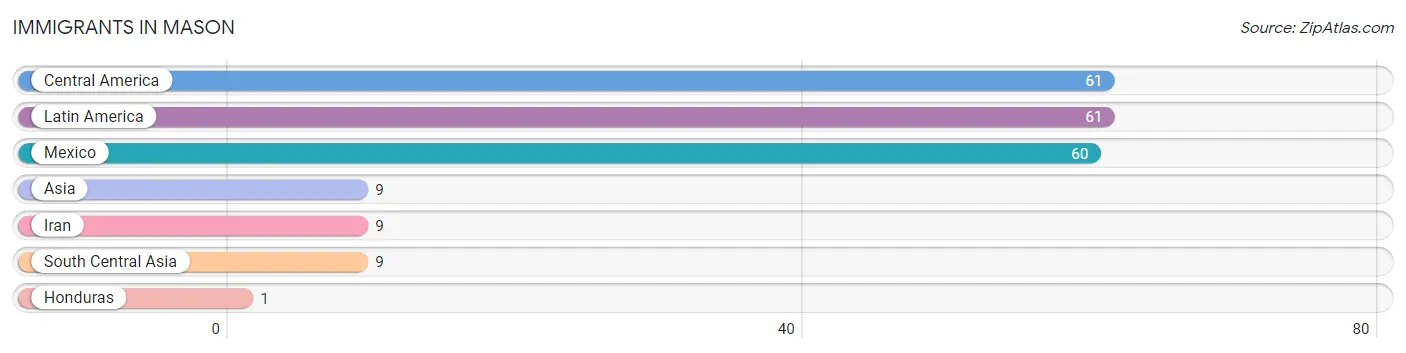
The most numerous immigrant groups reported in Mason came from Central America (61 | 2.8%), Latin America (61 | 2.8%), Mexico (60 | 2.8%), Asia (9 | 0.4%), and Iran (9 | 0.4%), together accounting for 9.3% of all Mason residents.
| Immigration Origin | # Population | % Population |
| Asia | 9 | 0.4% |
| Central America | 61 | 2.8% |
| Honduras | 1 | 0.1% |
| Iran | 9 | 0.4% |
| Latin America | 61 | 2.8% |
| Mexico | 60 | 2.8% |
| South Central Asia | 9 | 0.4% | View All 7 Rows |
Sex and Age in Mason
Sex and Age in Mason
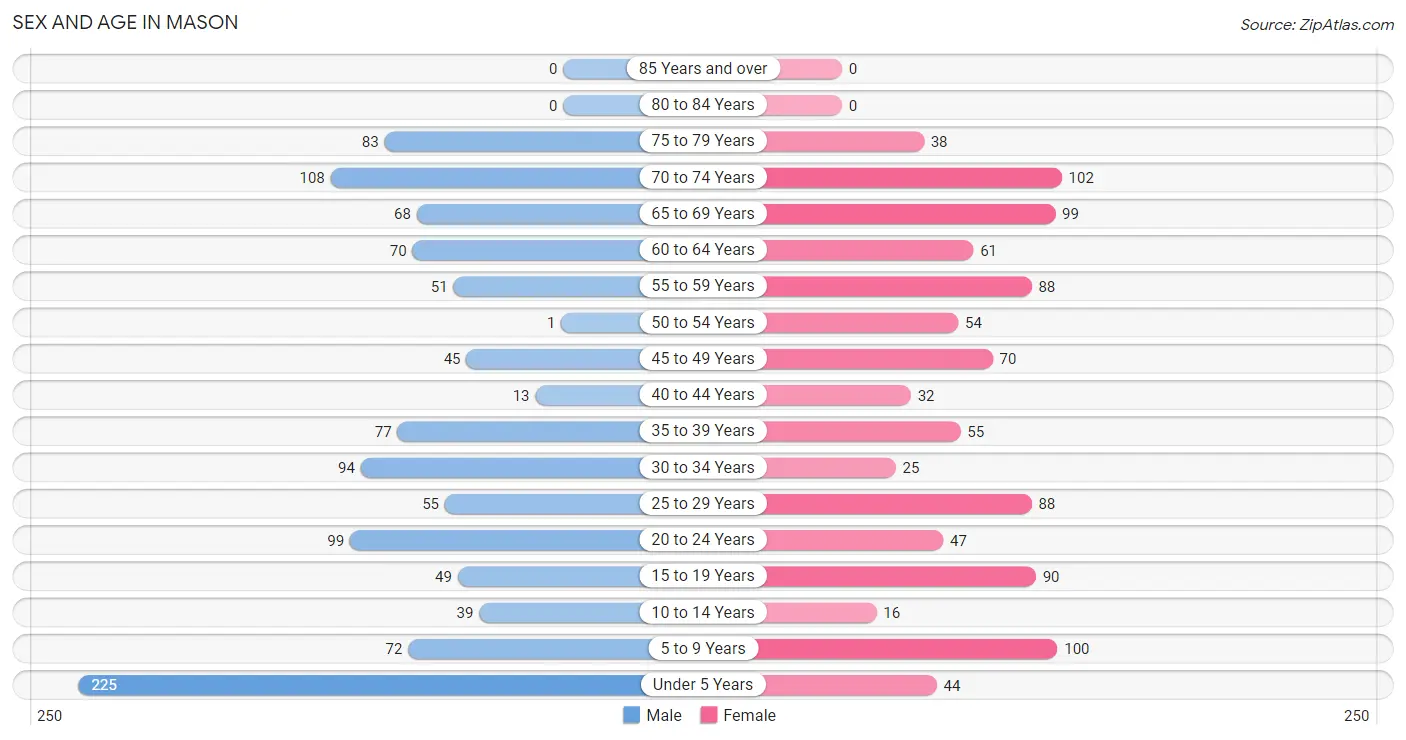
The most populous age groups in Mason are Under 5 Years (225 | 19.6%) for men and 70 to 74 Years (102 | 10.1%) for women.
| Age Bracket | Male | Female |
| Under 5 Years | 225 (19.6%) | 44 (4.4%) |
| 5 to 9 Years | 72 (6.3%) | 100 (9.9%) |
| 10 to 14 Years | 39 (3.4%) | 16 (1.6%) |
| 15 to 19 Years | 49 (4.3%) | 90 (8.9%) |
| 20 to 24 Years | 99 (8.6%) | 47 (4.7%) |
| 25 to 29 Years | 55 (4.8%) | 88 (8.7%) |
| 30 to 34 Years | 94 (8.2%) | 25 (2.5%) |
| 35 to 39 Years | 77 (6.7%) | 55 (5.4%) |
| 40 to 44 Years | 13 (1.1%) | 32 (3.2%) |
| 45 to 49 Years | 45 (3.9%) | 70 (6.9%) |
| 50 to 54 Years | 1 (0.1%) | 54 (5.3%) |
| 55 to 59 Years | 51 (4.4%) | 88 (8.7%) |
| 60 to 64 Years | 70 (6.1%) | 61 (6.0%) |
| 65 to 69 Years | 68 (5.9%) | 99 (9.8%) |
| 70 to 74 Years | 108 (9.4%) | 102 (10.1%) |
| 75 to 79 Years | 83 (7.2%) | 38 (3.8%) |
| 80 to 84 Years | 0 (0.0%) | 0 (0.0%) |
| 85 Years and over | 0 (0.0%) | 0 (0.0%) |
| Total | 1,149 (100.0%) | 1,009 (100.0%) |
Families and Households in Mason
Median Family Size in Mason
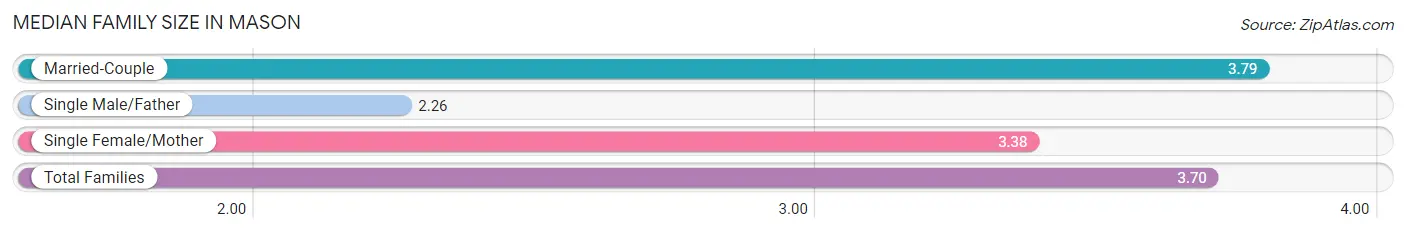
The median family size in Mason is 3.70 persons per family, with married-couple families (456 | 88.2%) accounting for the largest median family size of 3.79 persons per family. On the other hand, single male/father families (19 | 3.7%) represent the smallest median family size with 2.26 persons per family.
| Family Type | # Families | Family Size |
| Married-Couple | 456 (88.2%) | 3.79 |
| Single Male/Father | 19 (3.7%) | 2.26 |
| Single Female/Mother | 42 (8.1%) | 3.38 |
| Total Families | 517 (100.0%) | 3.70 |
Median Household Size in Mason

| Household Type | # Households | Household Size |
| Married-Couple | 456 (60.4%) | 3.79 |
| Single Male/Father | 19 (2.5%) | 2.26 |
| Single Female/Mother | 42 (5.6%) | 3.38 |
| Non-family | 238 (31.5%) | - |
| Total Households | 755 (100.0%) | 2.85 |
Household Size by Marriage Status in Mason
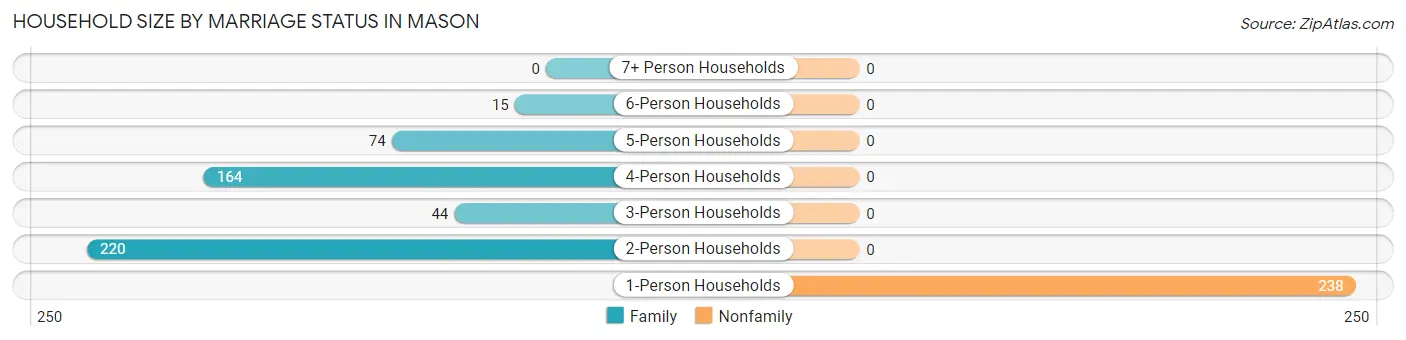
Out of a total of 755 households in Mason, 517 (68.5%) are family households, while 238 (31.5%) are nonfamily households. The most numerous type of family households are 2-person households, comprising 220, and the most common type of nonfamily households are 1-person households, comprising 238.
| Household Size | Family Households | Nonfamily Households |
| 1-Person Households | - | 238 (31.5%) |
| 2-Person Households | 220 (29.1%) | 0 (0.0%) |
| 3-Person Households | 44 (5.8%) | 0 (0.0%) |
| 4-Person Households | 164 (21.7%) | 0 (0.0%) |
| 5-Person Households | 74 (9.8%) | 0 (0.0%) |
| 6-Person Households | 15 (2.0%) | 0 (0.0%) |
| 7+ Person Households | 0 (0.0%) | 0 (0.0%) |
| Total | 517 (68.5%) | 238 (31.5%) |
Female Fertility in Mason
Fertility by Age in Mason
| Age Bracket | Women with Births | Births / 1,000 Women |
| 15 to 19 years | 0 (0.0%) | 0.0 |
| 20 to 34 years | 0 (0.0%) | 0.0 |
| 35 to 50 years | 0 (0.0%) | 0.0 |
| Total | 0 (0.0%) | 0.0 |
Fertility by Age by Marriage Status in Mason
| Age Bracket | Married | Unmarried |
| 15 to 19 years | 0 (0.0%) | 0 (0.0%) |
| 20 to 34 years | 0 (0.0%) | 0 (0.0%) |
| 35 to 50 years | 0 (0.0%) | 0 (0.0%) |
| Total | 0 (0.0%) | 0 (0.0%) |
Fertility by Education in Mason
| Educational Attainment | Women with Births | Births / 1,000 Women |
| Less than High School | 0 (0.0%) | 0.0 |
| High School Diploma | 0 (0.0%) | 0.0 |
| College or Associate's Degree | 0 (0.0%) | 0.0 |
| Bachelor's Degree | 0 (0.0%) | 0.0 |
| Graduate Degree | 0 (0.0%) | 0.0 |
| Total | 0 (0.0%) | 0.0 |
Fertility by Education by Marriage Status in Mason
| Educational Attainment | Married | Unmarried |
| Less than High School | 0 (0.0%) | 0 (0.0%) |
| High School Diploma | 0 (0.0%) | 0 (0.0%) |
| College or Associate's Degree | 0 (0.0%) | 0 (0.0%) |
| Bachelor's Degree | 0 (0.0%) | 0 (0.0%) |
| Graduate Degree | 0 (0.0%) | 0 (0.0%) |
| Total | 0 (0.0%) | 0 (0.0%) |
Employment Characteristics in Mason
Employment by Class of Employer in Mason
Among the 910 employed individuals in Mason, private company employees (468 | 51.4%), local government employees (167 | 18.3%), and self-employed (not incorporated) (86 | 9.5%) make up the most common classes of employment.
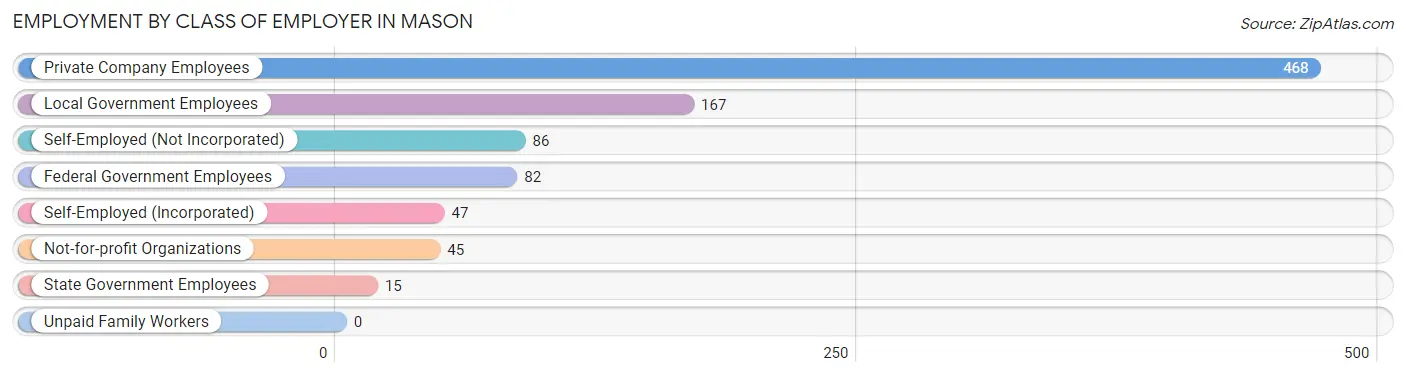
| Employer Class | # Employees | % Employees |
| Private Company Employees | 468 | 51.4% |
| Self-Employed (Incorporated) | 47 | 5.2% |
| Self-Employed (Not Incorporated) | 86 | 9.5% |
| Not-for-profit Organizations | 45 | 5.0% |
| Local Government Employees | 167 | 18.3% |
| State Government Employees | 15 | 1.7% |
| Federal Government Employees | 82 | 9.0% |
| Unpaid Family Workers | 0 | 0.0% |
| Total | 910 | 100.0% |
Employment Status by Age in Mason
According to the labor force statistics for Mason, out of the total population over 16 years of age (1,645), 57.6% or 948 individuals are in the labor force, with 3.9% or 37 of them unemployed. The age group with the highest labor force participation rate is 45 to 54 years, with 98.8% or 168 individuals in the labor force. Within the labor force, the 35 to 44 years age range has the highest percentage of unemployed individuals, with 12.3% or 21 of them being unemployed.
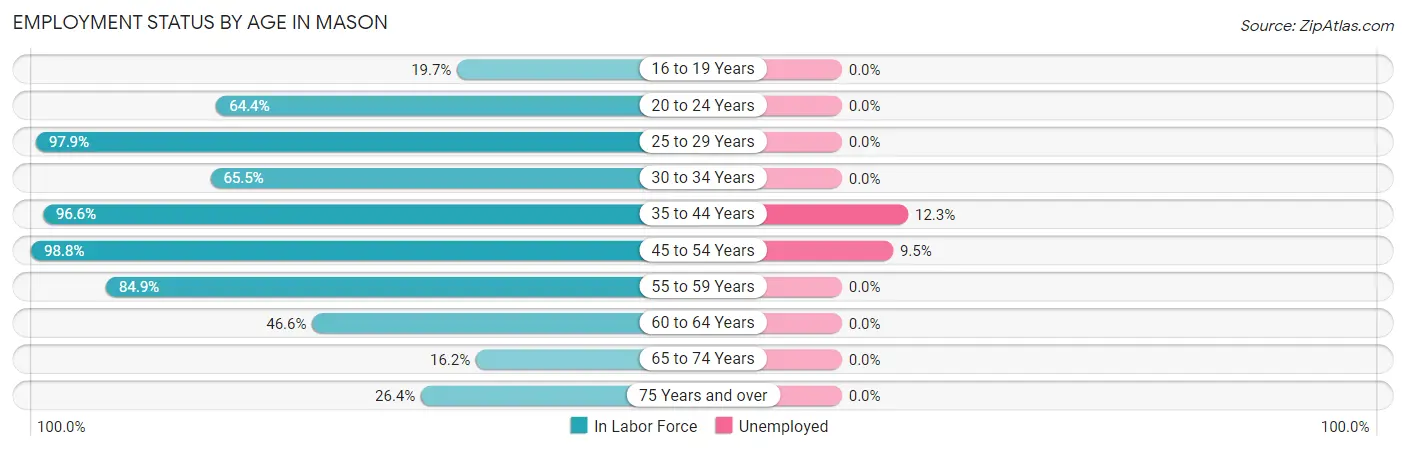
| Age Bracket | In Labor Force | Unemployed |
| 16 to 19 Years | 24 (19.7%) | 0 (0.0%) |
| 20 to 24 Years | 94 (64.4%) | 0 (0.0%) |
| 25 to 29 Years | 140 (97.9%) | 0 (0.0%) |
| 30 to 34 Years | 78 (65.5%) | 0 (0.0%) |
| 35 to 44 Years | 171 (96.6%) | 21 (12.3%) |
| 45 to 54 Years | 168 (98.8%) | 16 (9.5%) |
| 55 to 59 Years | 118 (84.9%) | 0 (0.0%) |
| 60 to 64 Years | 61 (46.6%) | 0 (0.0%) |
| 65 to 74 Years | 61 (16.2%) | 0 (0.0%) |
| 75 Years and over | 32 (26.4%) | 0 (0.0%) |
| Total | 948 (57.6%) | 37 (3.9%) |
Employment Status by Educational Attainment in Mason
According to labor force statistics for Mason, 83.7% of individuals (736) out of the total population between 25 and 64 years of age (879) are in the labor force, with 5.0% or 37 of them being unemployed. The group with the highest labor force participation rate are those with the educational attainment of bachelor's degree or higher, with 96.3% or 336 individuals in the labor force. Within the labor force, individuals with college / associate degree education have the highest percentage of unemployment, with 10.6% or 21 of them being unemployed.
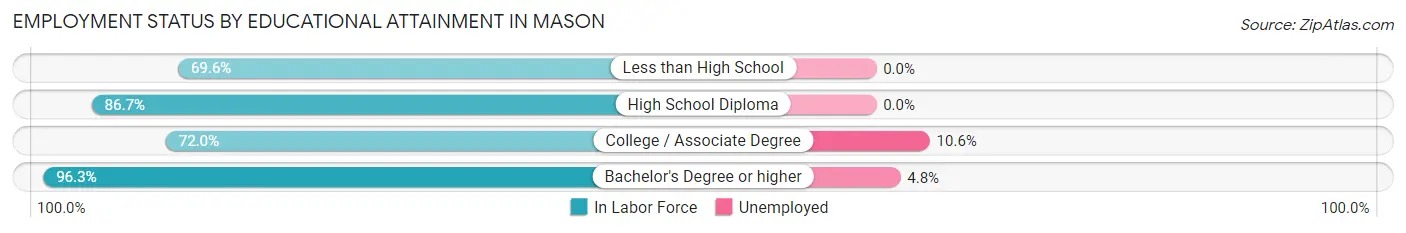
| Educational Attainment | In Labor Force | Unemployed |
| Less than High School | 78 (69.6%) | 0 (0.0%) |
| High School Diploma | 124 (86.7%) | 0 (0.0%) |
| College / Associate Degree | 198 (72.0%) | 29 (10.6%) |
| Bachelor's Degree or higher | 336 (96.3%) | 17 (4.8%) |
| Total | 736 (83.7%) | 44 (5.0%) |
Employment Occupations by Sex in Mason
Management, Business, Science and Arts Occupations
The most common Management, Business, Science and Arts occupations in Mason are Community & Social Service (156 | 17.1%), Management (147 | 16.2%), Education Instruction & Library (125 | 13.7%), Computers, Engineering & Science (40 | 4.4%), and Health Diagnosing & Treating (39 | 4.3%).
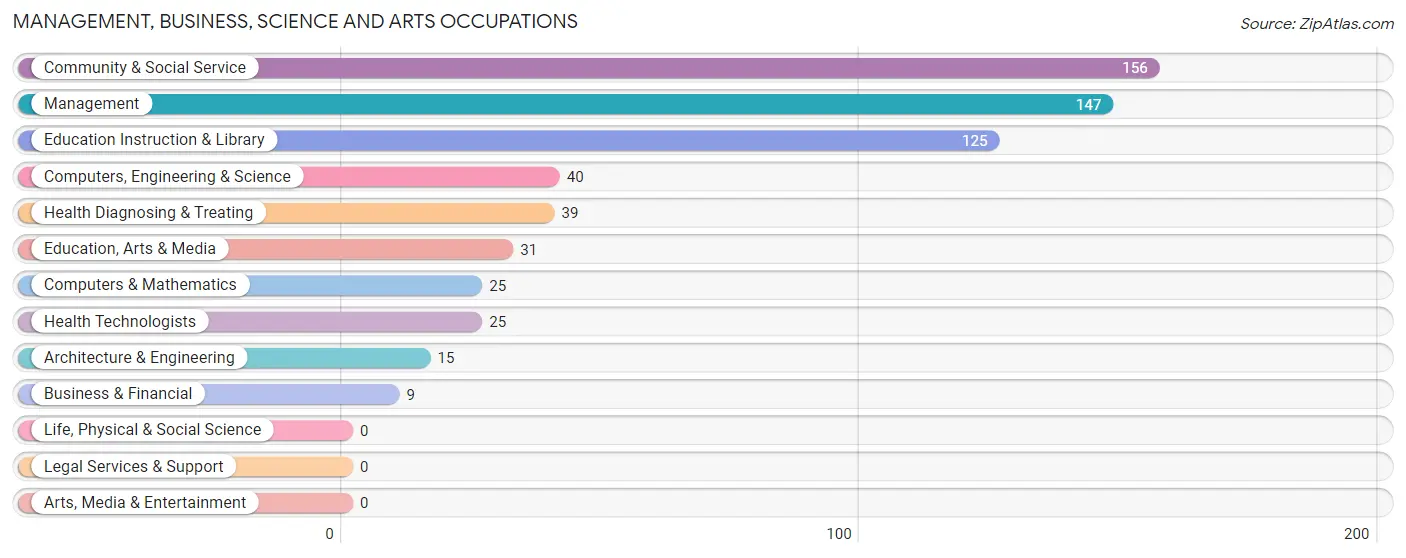
Management, Business, Science and Arts Occupations by Sex
Within the Management, Business, Science and Arts occupations in Mason, the most male-oriented occupations are Business & Financial (100.0%), Computers, Engineering & Science (100.0%), and Computers & Mathematics (100.0%), while the most female-oriented occupations are Health Diagnosing & Treating (100.0%), Health Technologists (100.0%), and Management (76.2%).
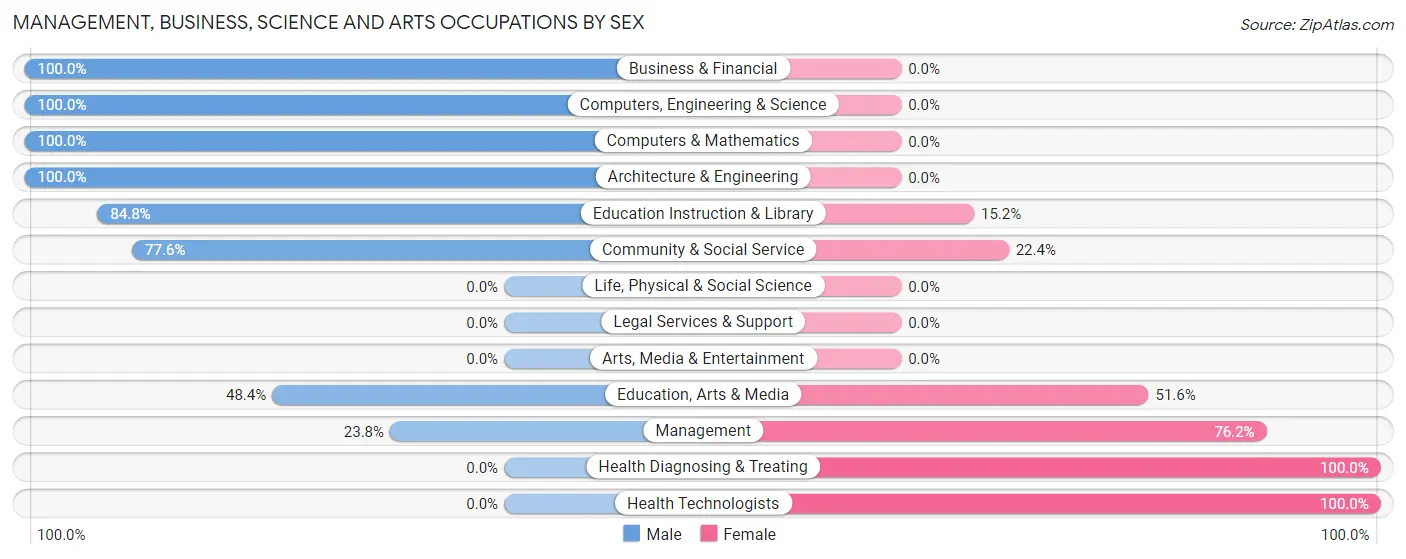
| Occupation | Male | Female |
| Management | 35 (23.8%) | 112 (76.2%) |
| Business & Financial | 9 (100.0%) | 0 (0.0%) |
| Computers, Engineering & Science | 40 (100.0%) | 0 (0.0%) |
| Computers & Mathematics | 25 (100.0%) | 0 (0.0%) |
| Architecture & Engineering | 15 (100.0%) | 0 (0.0%) |
| Life, Physical & Social Science | 0 (0.0%) | 0 (0.0%) |
| Community & Social Service | 121 (77.6%) | 35 (22.4%) |
| Education, Arts & Media | 15 (48.4%) | 16 (51.6%) |
| Legal Services & Support | 0 (0.0%) | 0 (0.0%) |
| Education Instruction & Library | 106 (84.8%) | 19 (15.2%) |
| Arts, Media & Entertainment | 0 (0.0%) | 0 (0.0%) |
| Health Diagnosing & Treating | 0 (0.0%) | 39 (100.0%) |
| Health Technologists | 0 (0.0%) | 25 (100.0%) |
| Total (Category) | 205 (52.4%) | 186 (47.6%) |
| Total (Overall) | 461 (50.7%) | 449 (49.3%) |
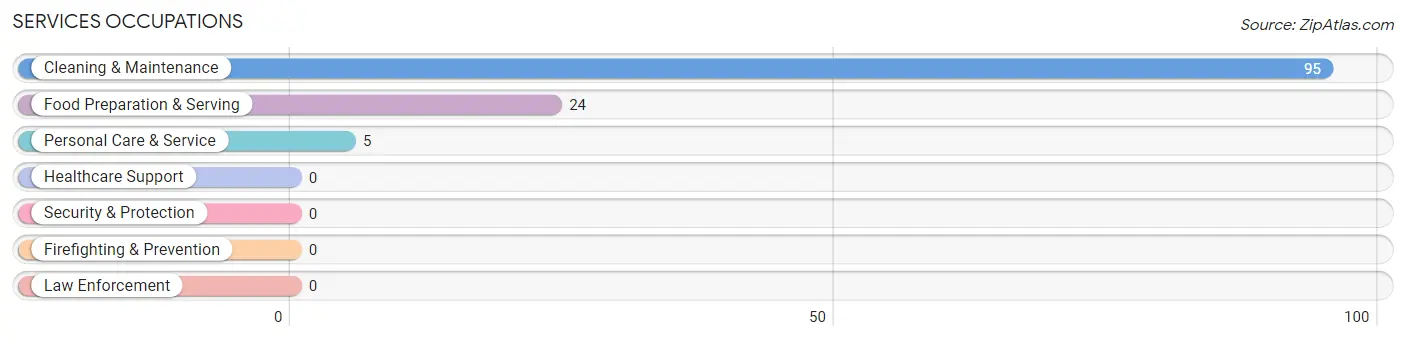
Services Occupations
The most common Services occupations in Mason are Cleaning & Maintenance (95 | 10.4%), Food Preparation & Serving (24 | 2.6%), and Personal Care & Service (5 | 0.5%).
Services Occupations by Sex
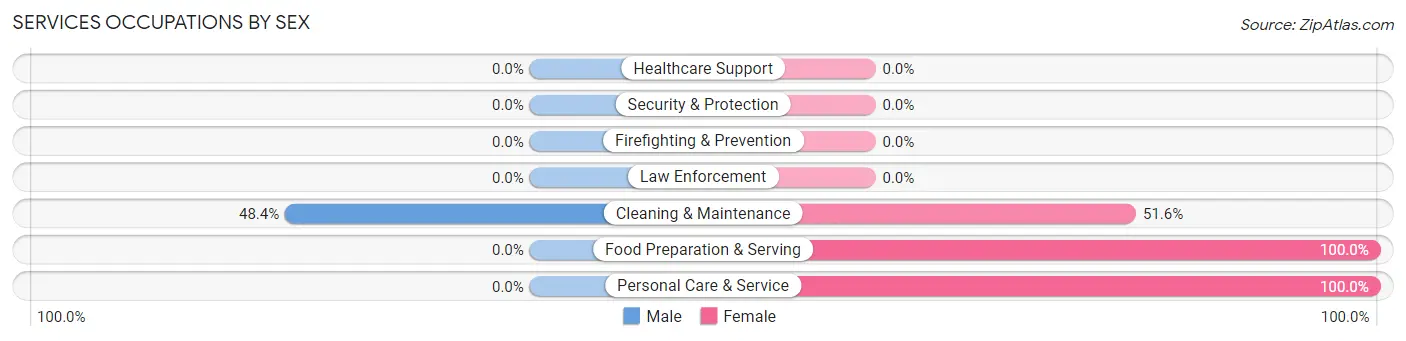
| Occupation | Male | Female |
| Healthcare Support | 0 (0.0%) | 0 (0.0%) |
| Security & Protection | 0 (0.0%) | 0 (0.0%) |
| Firefighting & Prevention | 0 (0.0%) | 0 (0.0%) |
| Law Enforcement | 0 (0.0%) | 0 (0.0%) |
| Food Preparation & Serving | 0 (0.0%) | 24 (100.0%) |
| Cleaning & Maintenance | 46 (48.4%) | 49 (51.6%) |
| Personal Care & Service | 0 (0.0%) | 5 (100.0%) |
| Total (Category) | 46 (37.1%) | 78 (62.9%) |
| Total (Overall) | 461 (50.7%) | 449 (49.3%) |
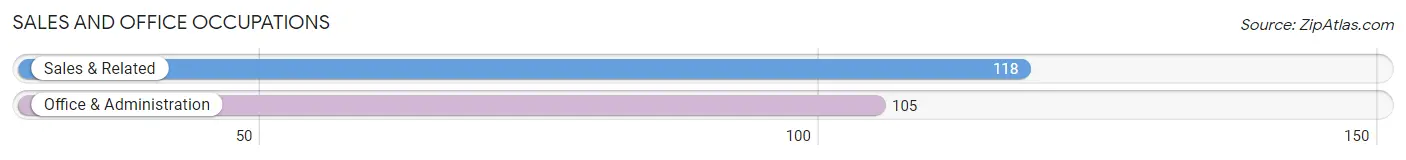
Sales and Office Occupations
The most common Sales and Office occupations in Mason are Sales & Related (118 | 13.0%), and Office & Administration (105 | 11.5%).
Sales and Office Occupations by Sex
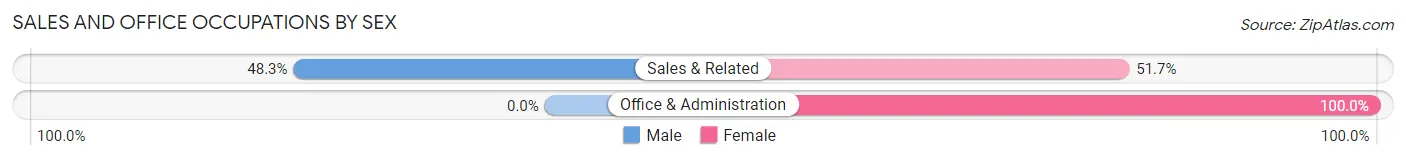
| Occupation | Male | Female |
| Sales & Related | 57 (48.3%) | 61 (51.7%) |
| Office & Administration | 0 (0.0%) | 105 (100.0%) |
| Total (Category) | 57 (25.6%) | 166 (74.4%) |
| Total (Overall) | 461 (50.7%) | 449 (49.3%) |
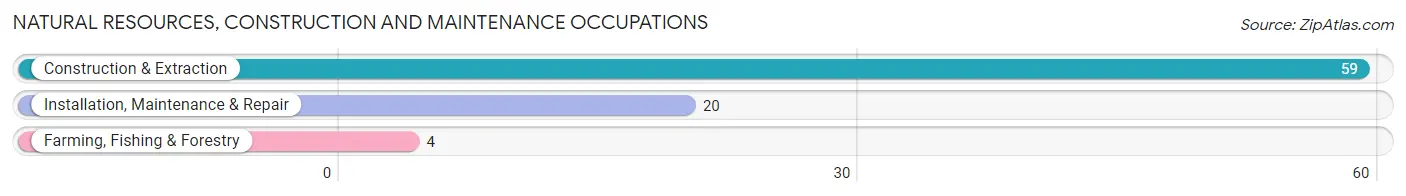
Natural Resources, Construction and Maintenance Occupations
The most common Natural Resources, Construction and Maintenance occupations in Mason are Construction & Extraction (59 | 6.5%), Installation, Maintenance & Repair (20 | 2.2%), and Farming, Fishing & Forestry (4 | 0.4%).
Natural Resources, Construction and Maintenance Occupations by Sex
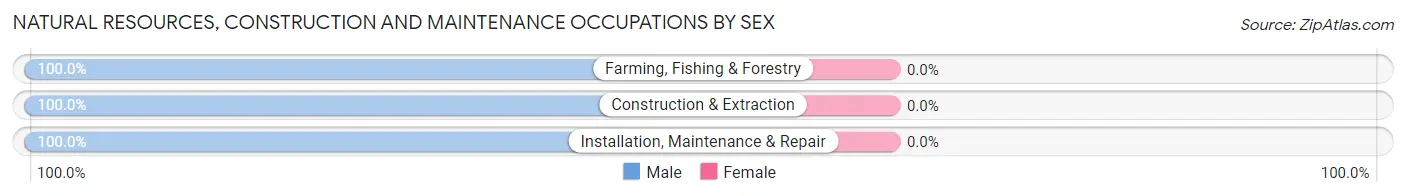
| Occupation | Male | Female |
| Farming, Fishing & Forestry | 4 (100.0%) | 0 (0.0%) |
| Construction & Extraction | 59 (100.0%) | 0 (0.0%) |
| Installation, Maintenance & Repair | 20 (100.0%) | 0 (0.0%) |
| Total (Category) | 83 (100.0%) | 0 (0.0%) |
| Total (Overall) | 461 (50.7%) | 449 (49.3%) |
Production, Transportation and Moving Occupations
The most common Production, Transportation and Moving occupations in Mason are Material Moving (49 | 5.4%), and Transportation (40 | 4.4%).
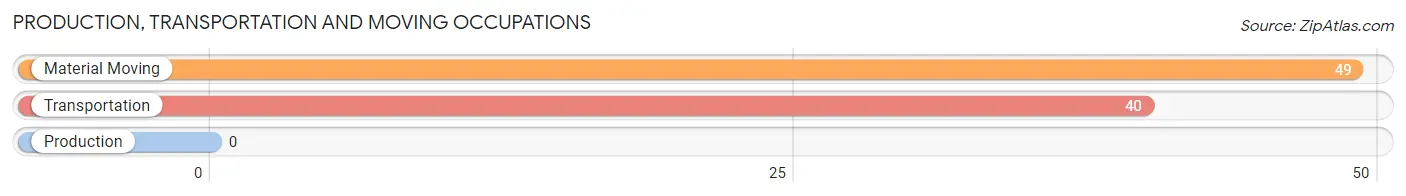
Production, Transportation and Moving Occupations by Sex
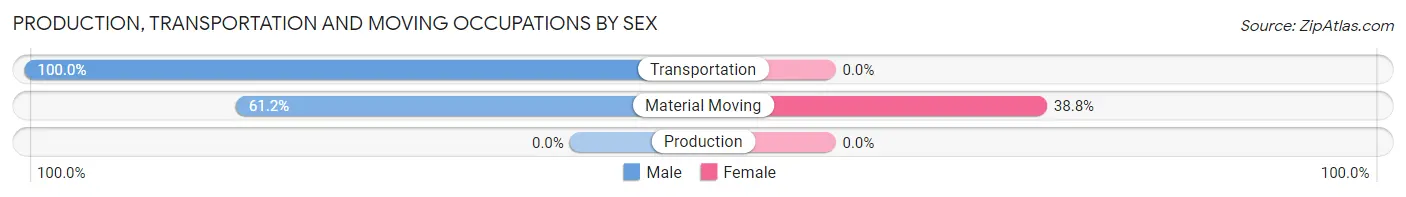
| Occupation | Male | Female |
| Production | 0 (0.0%) | 0 (0.0%) |
| Transportation | 40 (100.0%) | 0 (0.0%) |
| Material Moving | 30 (61.2%) | 19 (38.8%) |
| Total (Category) | 70 (78.6%) | 19 (21.3%) |
| Total (Overall) | 461 (50.7%) | 449 (49.3%) |
Employment Industries by Sex in Mason
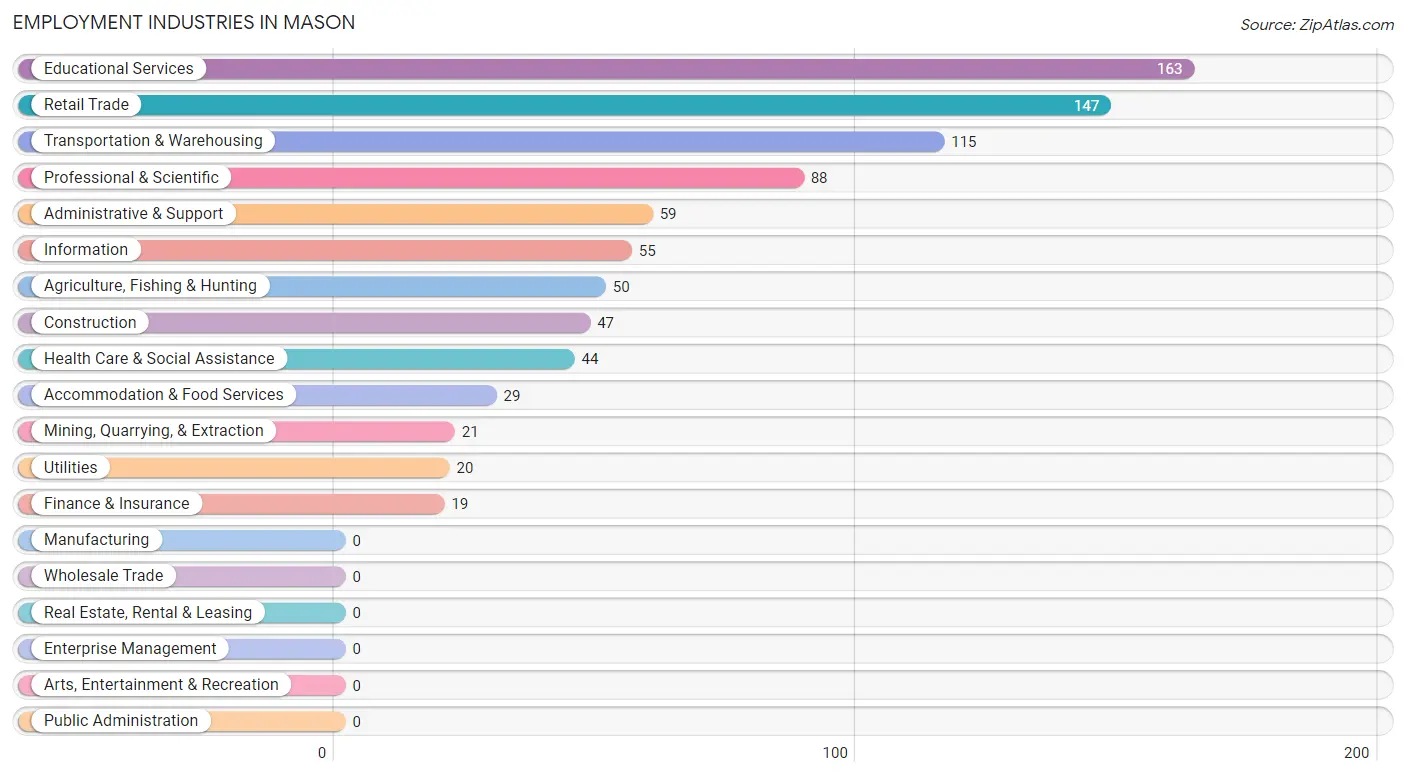
Employment Industries in Mason
The major employment industries in Mason include Educational Services (163 | 17.9%), Retail Trade (147 | 16.2%), Transportation & Warehousing (115 | 12.6%), Professional & Scientific (88 | 9.7%), and Administrative & Support (59 | 6.5%).
Employment Industries by Sex in Mason
The Mason industries that see more men than women are Agriculture, Fishing & Hunting (100.0%), Mining, Quarrying, & Extraction (100.0%), and Construction (100.0%), whereas the industries that tend to have a higher number of women are Transportation & Warehousing (100.0%), Finance & Insurance (100.0%), and Health Care & Social Assistance (100.0%).
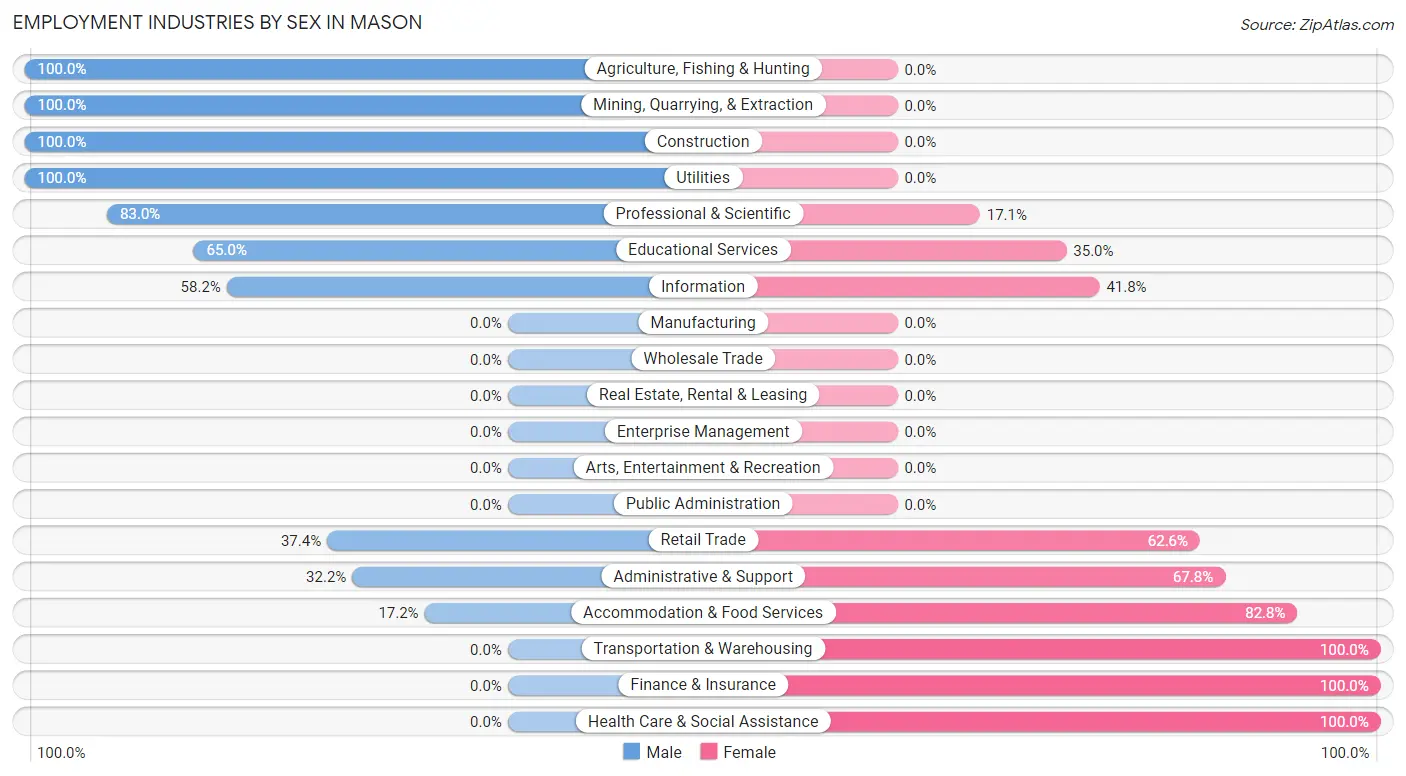
| Industry | Male | Female |
| Agriculture, Fishing & Hunting | 50 (100.0%) | 0 (0.0%) |
| Mining, Quarrying, & Extraction | 21 (100.0%) | 0 (0.0%) |
| Construction | 47 (100.0%) | 0 (0.0%) |
| Manufacturing | 0 (0.0%) | 0 (0.0%) |
| Wholesale Trade | 0 (0.0%) | 0 (0.0%) |
| Retail Trade | 55 (37.4%) | 92 (62.6%) |
| Transportation & Warehousing | 0 (0.0%) | 115 (100.0%) |
| Utilities | 20 (100.0%) | 0 (0.0%) |
| Information | 32 (58.2%) | 23 (41.8%) |
| Finance & Insurance | 0 (0.0%) | 19 (100.0%) |
| Real Estate, Rental & Leasing | 0 (0.0%) | 0 (0.0%) |
| Professional & Scientific | 73 (83.0%) | 15 (17.1%) |
| Enterprise Management | 0 (0.0%) | 0 (0.0%) |
| Administrative & Support | 19 (32.2%) | 40 (67.8%) |
| Educational Services | 106 (65.0%) | 57 (35.0%) |
| Health Care & Social Assistance | 0 (0.0%) | 44 (100.0%) |
| Arts, Entertainment & Recreation | 0 (0.0%) | 0 (0.0%) |
| Accommodation & Food Services | 5 (17.2%) | 24 (82.8%) |
| Public Administration | 0 (0.0%) | 0 (0.0%) |
| Total | 461 (50.7%) | 449 (49.3%) |
Education in Mason
School Enrollment in Mason
The most common levels of schooling among the 542 students in Mason are high school (138 | 25.5%), elementary school (122 | 22.5%), and nursery / preschool (96 | 17.7%).
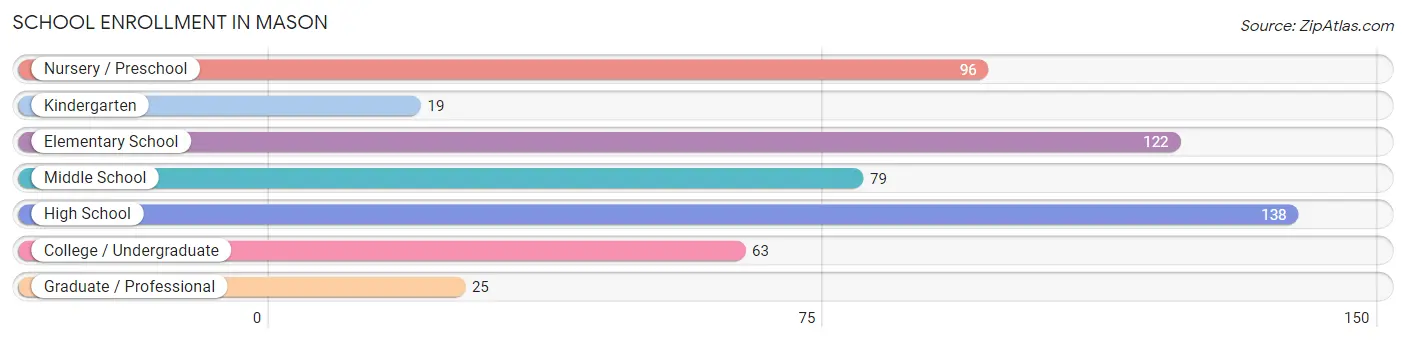
| School Level | # Students | % Students |
| Nursery / Preschool | 96 | 17.7% |
| Kindergarten | 19 | 3.5% |
| Elementary School | 122 | 22.5% |
| Middle School | 79 | 14.6% |
| High School | 138 | 25.5% |
| College / Undergraduate | 63 | 11.6% |
| Graduate / Professional | 25 | 4.6% |
| Total | 542 | 100.0% |
School Enrollment by Age by Funding Source in Mason
Out of a total of 542 students who are enrolled in schools in Mason, 14 (2.6%) attend a private institution, while the remaining 528 (97.4%) are enrolled in public schools. The age group of 10 to 14 year olds has the highest likelihood of being enrolled in private schools, with 14 (25.5% in the age bracket) enrolled. Conversely, the age group of 3 to 4 year olds has the lowest likelihood of being enrolled in a private school, with 89 (100.0% in the age bracket) attending a public institution.
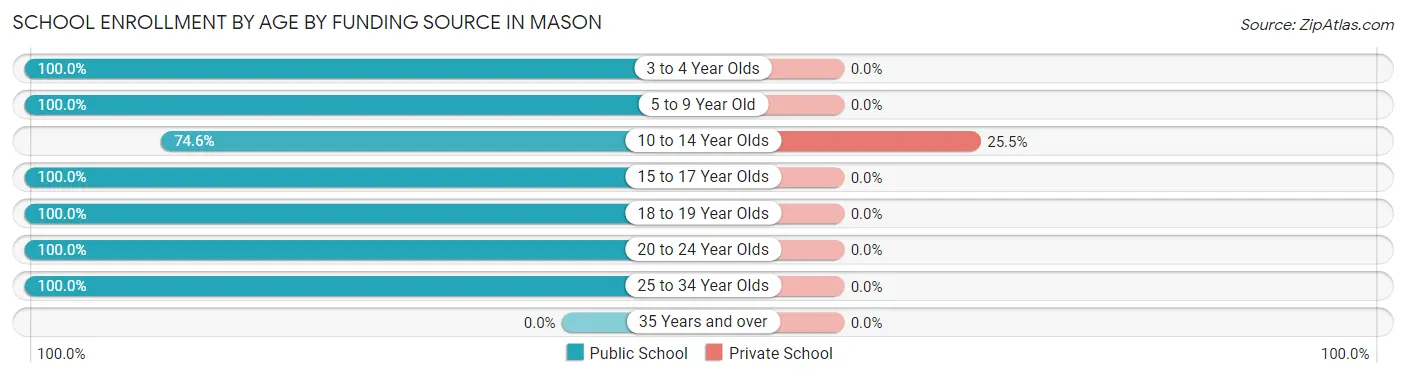
| Age Bracket | Public School | Private School |
| 3 to 4 Year Olds | 89 (100.0%) | 0 (0.0%) |
| 5 to 9 Year Old | 172 (100.0%) | 0 (0.0%) |
| 10 to 14 Year Olds | 41 (74.6%) | 14 (25.5%) |
| 15 to 17 Year Olds | 97 (100.0%) | 0 (0.0%) |
| 18 to 19 Year Olds | 41 (100.0%) | 0 (0.0%) |
| 20 to 24 Year Olds | 63 (100.0%) | 0 (0.0%) |
| 25 to 34 Year Olds | 25 (100.0%) | 0 (0.0%) |
| 35 Years and over | 0 (0.0%) | 0 (0.0%) |
| Total | 528 (97.4%) | 14 (2.6%) |
Educational Attainment by Field of Study in Mason
Business (96 | 20.7%), education (96 | 20.7%), arts & humanities (54 | 11.6%), liberal arts & history (35 | 7.5%), and literature & languages (32 | 6.9%) are the most common fields of study among 464 individuals in Mason who have obtained a bachelor's degree or higher.
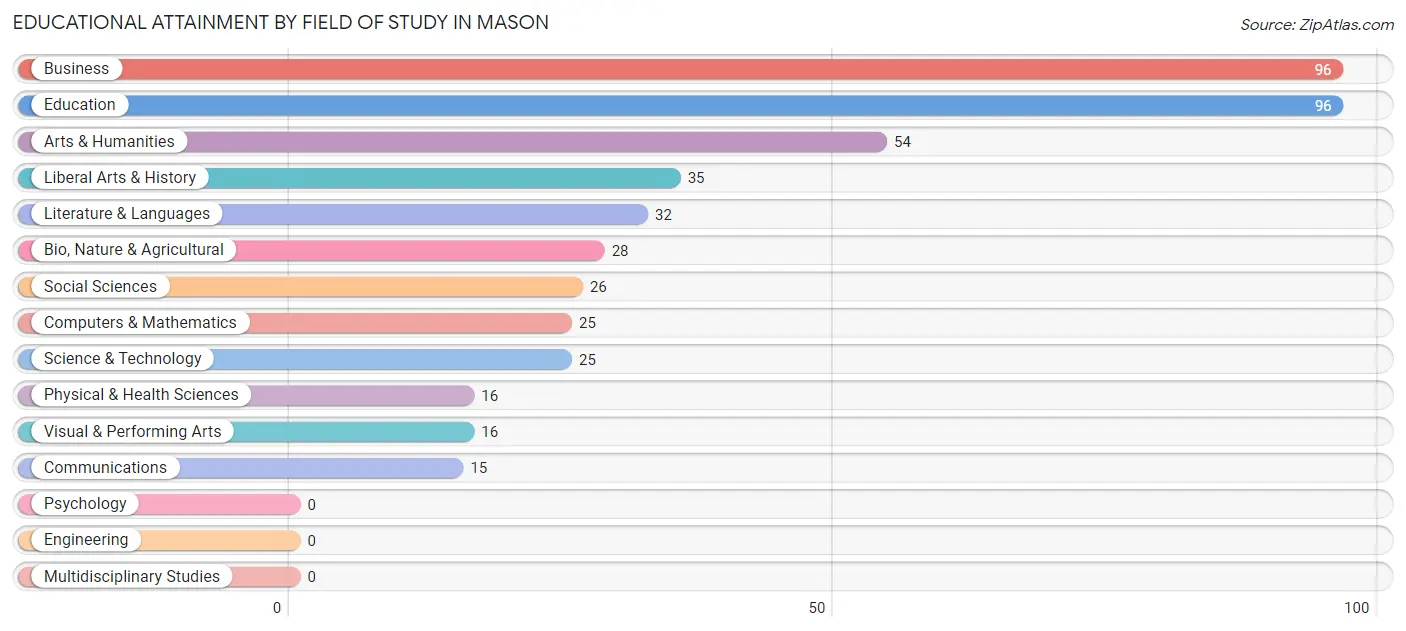
| Field of Study | # Graduates | % Graduates |
| Computers & Mathematics | 25 | 5.4% |
| Bio, Nature & Agricultural | 28 | 6.0% |
| Physical & Health Sciences | 16 | 3.5% |
| Psychology | 0 | 0.0% |
| Social Sciences | 26 | 5.6% |
| Engineering | 0 | 0.0% |
| Multidisciplinary Studies | 0 | 0.0% |
| Science & Technology | 25 | 5.4% |
| Business | 96 | 20.7% |
| Education | 96 | 20.7% |
| Literature & Languages | 32 | 6.9% |
| Liberal Arts & History | 35 | 7.5% |
| Visual & Performing Arts | 16 | 3.5% |
| Communications | 15 | 3.2% |
| Arts & Humanities | 54 | 11.6% |
| Total | 464 | 100.0% |
Transportation & Commute in Mason
Vehicle Availability by Sex in Mason
The most prevalent vehicle ownership categories in Mason are males with 2 vehicles (241, accounting for 52.3%) and females with 2 vehicles (201, making up 53.7%).
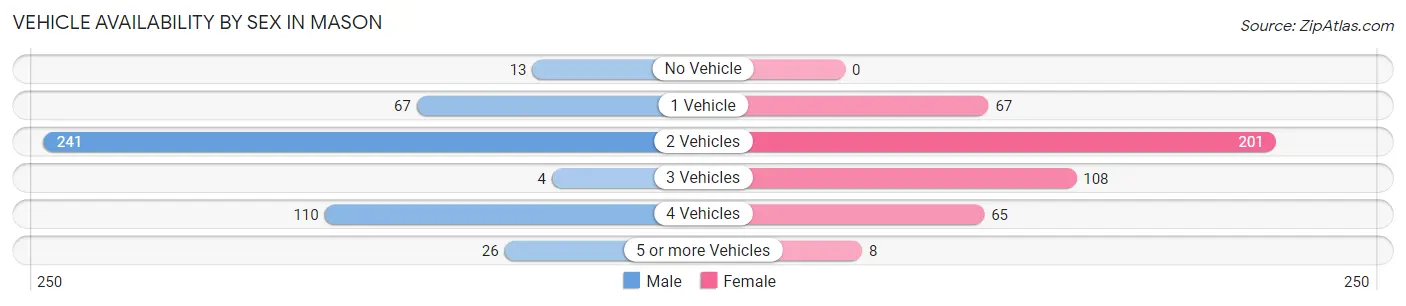
| Vehicles Available | Male | Female |
| No Vehicle | 13 (2.8%) | 0 (0.0%) |
| 1 Vehicle | 67 (14.5%) | 67 (14.9%) |
| 2 Vehicles | 241 (52.3%) | 201 (44.8%) |
| 3 Vehicles | 4 (0.9%) | 108 (24.0%) |
| 4 Vehicles | 110 (23.9%) | 65 (14.5%) |
| 5 or more Vehicles | 26 (5.6%) | 8 (1.8%) |
| Total | 461 (100.0%) | 449 (100.0%) |
Commute Time in Mason
The most frequently occuring commute durations in Mason are less than 5 minutes (196 commuters, 23.8%), 5 to 9 minutes (192 commuters, 23.3%), and 45 to 59 minutes (166 commuters, 20.2%).
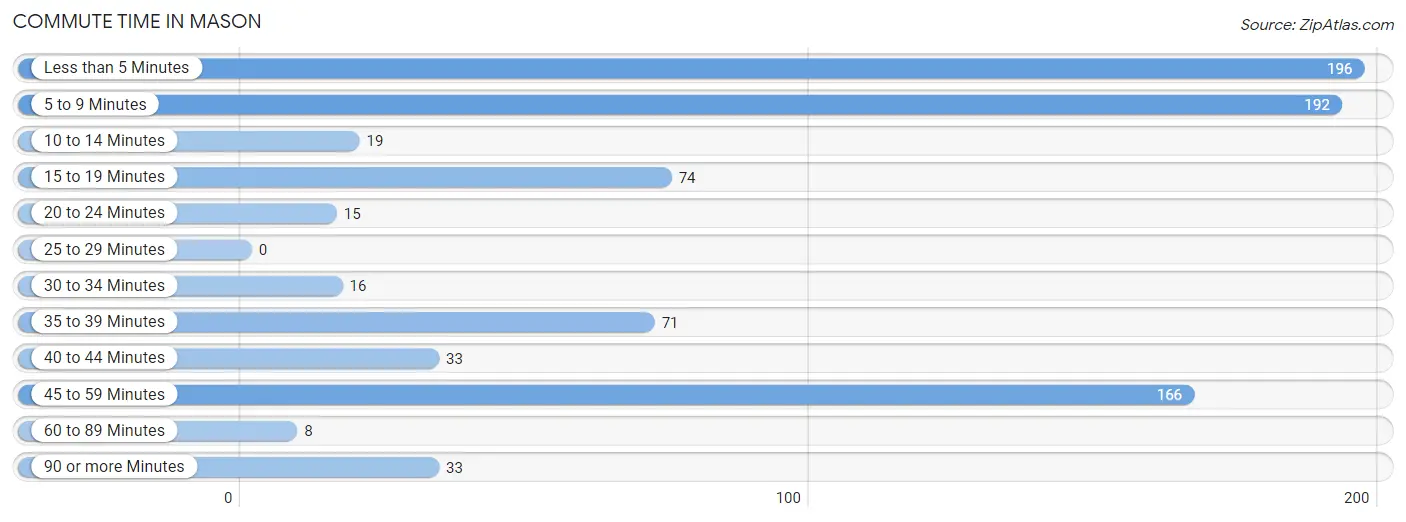
| Commute Time | # Commuters | % Commuters |
| Less than 5 Minutes | 196 | 23.8% |
| 5 to 9 Minutes | 192 | 23.3% |
| 10 to 14 Minutes | 19 | 2.3% |
| 15 to 19 Minutes | 74 | 9.0% |
| 20 to 24 Minutes | 15 | 1.8% |
| 25 to 29 Minutes | 0 | 0.0% |
| 30 to 34 Minutes | 16 | 1.9% |
| 35 to 39 Minutes | 71 | 8.6% |
| 40 to 44 Minutes | 33 | 4.0% |
| 45 to 59 Minutes | 166 | 20.2% |
| 60 to 89 Minutes | 8 | 1.0% |
| 90 or more Minutes | 33 | 4.0% |
Commute Time by Sex in Mason
The most common commute times in Mason are 5 to 9 minutes (113 commuters, 27.6%) for males and less than 5 minutes (109 commuters, 26.3%) for females.
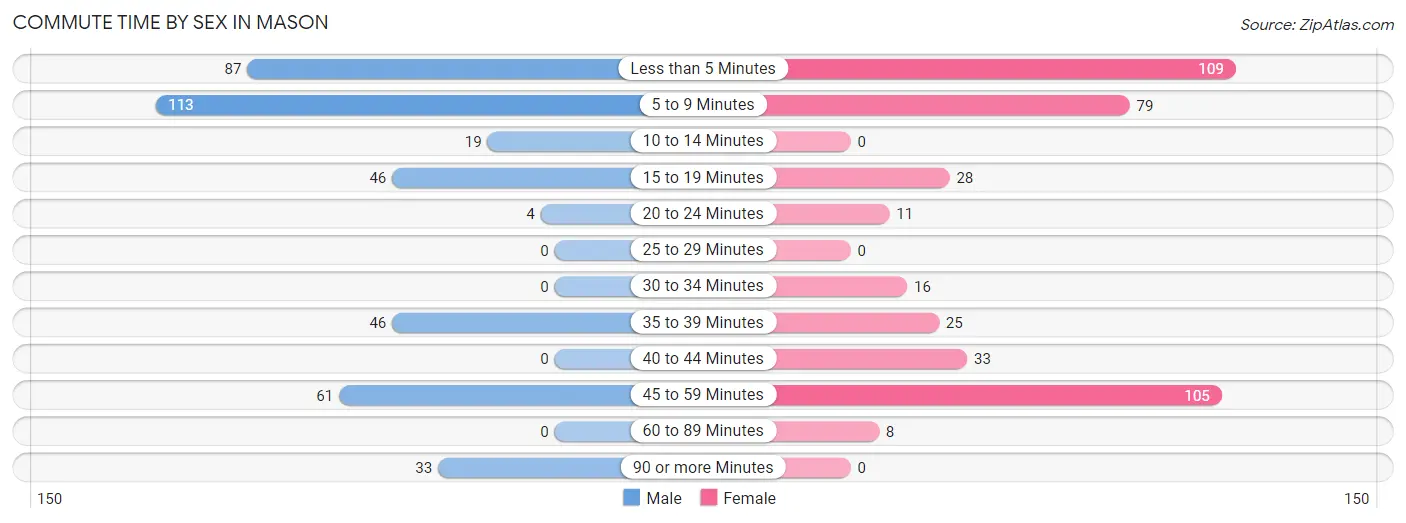
| Commute Time | Male | Female |
| Less than 5 Minutes | 87 (21.3%) | 109 (26.3%) |
| 5 to 9 Minutes | 113 (27.6%) | 79 (19.1%) |
| 10 to 14 Minutes | 19 (4.6%) | 0 (0.0%) |
| 15 to 19 Minutes | 46 (11.3%) | 28 (6.8%) |
| 20 to 24 Minutes | 4 (1.0%) | 11 (2.7%) |
| 25 to 29 Minutes | 0 (0.0%) | 0 (0.0%) |
| 30 to 34 Minutes | 0 (0.0%) | 16 (3.9%) |
| 35 to 39 Minutes | 46 (11.3%) | 25 (6.0%) |
| 40 to 44 Minutes | 0 (0.0%) | 33 (8.0%) |
| 45 to 59 Minutes | 61 (14.9%) | 105 (25.4%) |
| 60 to 89 Minutes | 0 (0.0%) | 8 (1.9%) |
| 90 or more Minutes | 33 (8.1%) | 0 (0.0%) |
Time of Departure to Work by Sex in Mason
The most frequent times of departure to work in Mason are 7:00 AM to 7:29 AM (118, 28.8%) for males and 5:00 AM to 5:29 AM (82, 19.8%) for females.
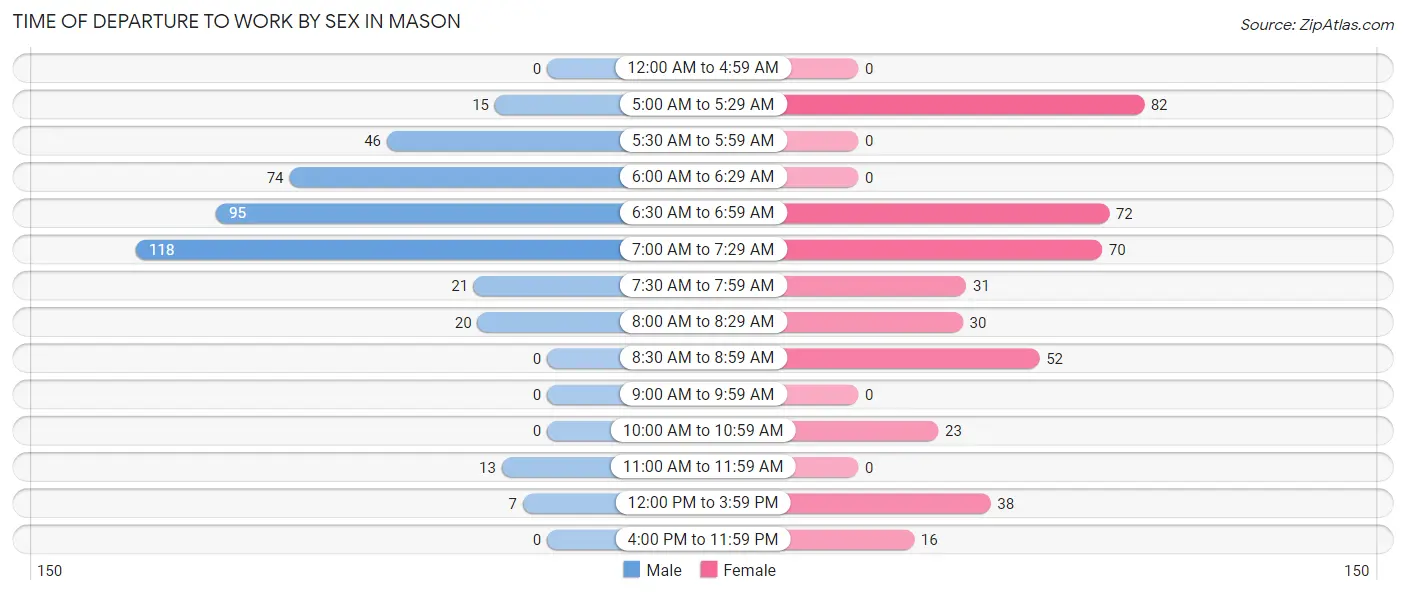
| Time of Departure | Male | Female |
| 12:00 AM to 4:59 AM | 0 (0.0%) | 0 (0.0%) |
| 5:00 AM to 5:29 AM | 15 (3.7%) | 82 (19.8%) |
| 5:30 AM to 5:59 AM | 46 (11.3%) | 0 (0.0%) |
| 6:00 AM to 6:29 AM | 74 (18.1%) | 0 (0.0%) |
| 6:30 AM to 6:59 AM | 95 (23.2%) | 72 (17.4%) |
| 7:00 AM to 7:29 AM | 118 (28.8%) | 70 (16.9%) |
| 7:30 AM to 7:59 AM | 21 (5.1%) | 31 (7.5%) |
| 8:00 AM to 8:29 AM | 20 (4.9%) | 30 (7.2%) |
| 8:30 AM to 8:59 AM | 0 (0.0%) | 52 (12.6%) |
| 9:00 AM to 9:59 AM | 0 (0.0%) | 0 (0.0%) |
| 10:00 AM to 10:59 AM | 0 (0.0%) | 23 (5.6%) |
| 11:00 AM to 11:59 AM | 13 (3.2%) | 0 (0.0%) |
| 12:00 PM to 3:59 PM | 7 (1.7%) | 38 (9.2%) |
| 4:00 PM to 11:59 PM | 0 (0.0%) | 16 (3.9%) |
| Total | 409 (100.0%) | 414 (100.0%) |
Housing Occupancy in Mason
Occupancy by Ownership in Mason
Of the total 755 dwellings in Mason, owner-occupied units account for 542 (71.8%), while renter-occupied units make up 213 (28.2%).
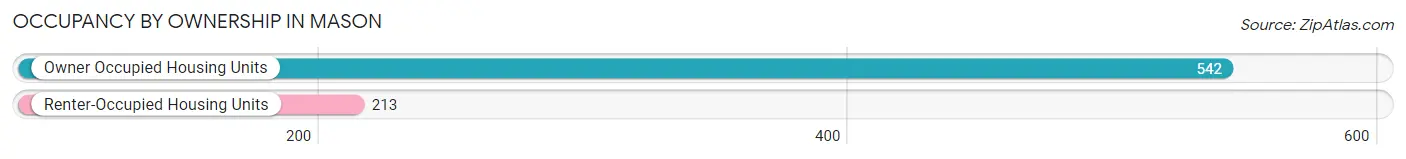
| Occupancy | # Housing Units | % Housing Units |
| Owner Occupied Housing Units | 542 | 71.8% |
| Renter-Occupied Housing Units | 213 | 28.2% |
| Total Occupied Housing Units | 755 | 100.0% |
Occupancy by Household Size in Mason
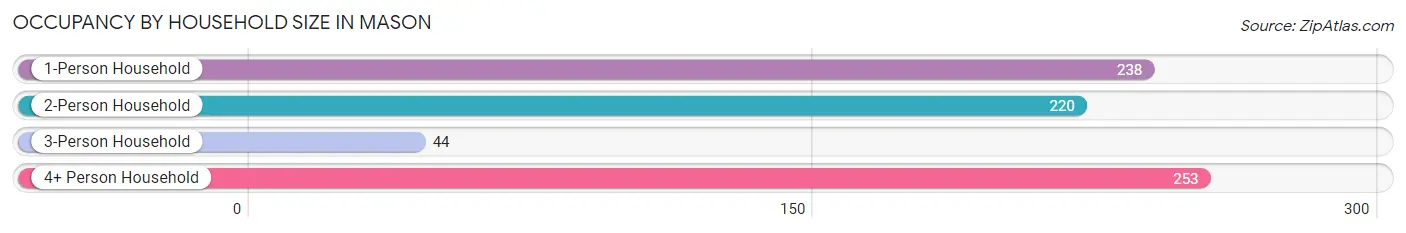
| Household Size | # Housing Units | % Housing Units |
| 1-Person Household | 238 | 31.5% |
| 2-Person Household | 220 | 29.1% |
| 3-Person Household | 44 | 5.8% |
| 4+ Person Household | 253 | 33.5% |
| Total Housing Units | 755 | 100.0% |
Occupancy by Ownership by Household Size in Mason
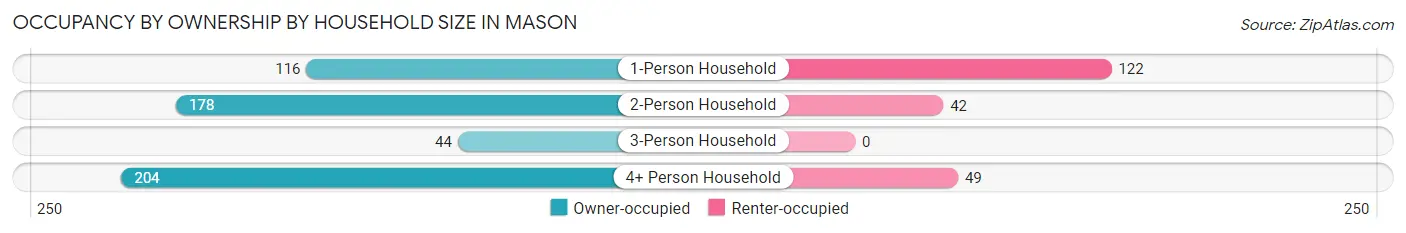
| Household Size | Owner-occupied | Renter-occupied |
| 1-Person Household | 116 (48.7%) | 122 (51.3%) |
| 2-Person Household | 178 (80.9%) | 42 (19.1%) |
| 3-Person Household | 44 (100.0%) | 0 (0.0%) |
| 4+ Person Household | 204 (80.6%) | 49 (19.4%) |
| Total Housing Units | 542 (71.8%) | 213 (28.2%) |
Occupancy by Educational Attainment in Mason
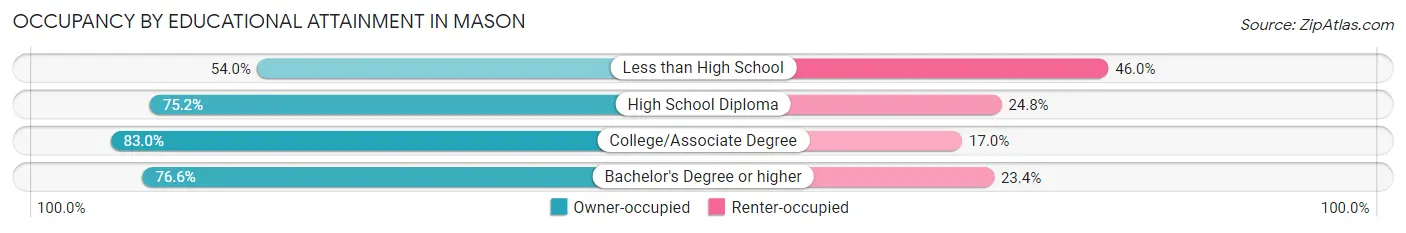
| Household Size | Owner-occupied | Renter-occupied |
| Less than High School | 102 (54.0%) | 87 (46.0%) |
| High School Diploma | 118 (75.2%) | 39 (24.8%) |
| College/Associate Degree | 112 (83.0%) | 23 (17.0%) |
| Bachelor's Degree or higher | 210 (76.6%) | 64 (23.4%) |
Occupancy by Age of Householder in Mason
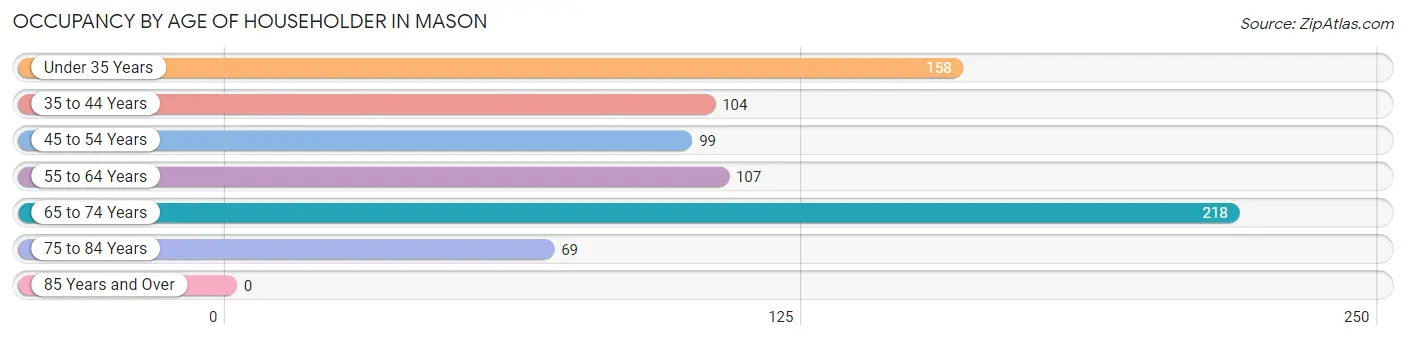
| Age Bracket | # Households | % Households |
| Under 35 Years | 158 | 20.9% |
| 35 to 44 Years | 104 | 13.8% |
| 45 to 54 Years | 99 | 13.1% |
| 55 to 64 Years | 107 | 14.2% |
| 65 to 74 Years | 218 | 28.9% |
| 75 to 84 Years | 69 | 9.1% |
| 85 Years and Over | 0 | 0.0% |
| Total | 755 | 100.0% |
Housing Finances in Mason
Median Income by Occupancy in Mason
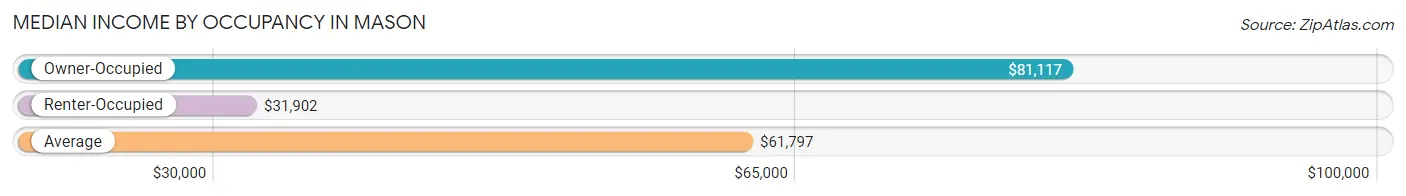
| Occupancy Type | # Households | Median Income |
| Owner-Occupied | 542 (71.8%) | $81,117 |
| Renter-Occupied | 213 (28.2%) | $31,902 |
| Average | 755 (100.0%) | $61,797 |
Occupancy by Householder Income Bracket in Mason
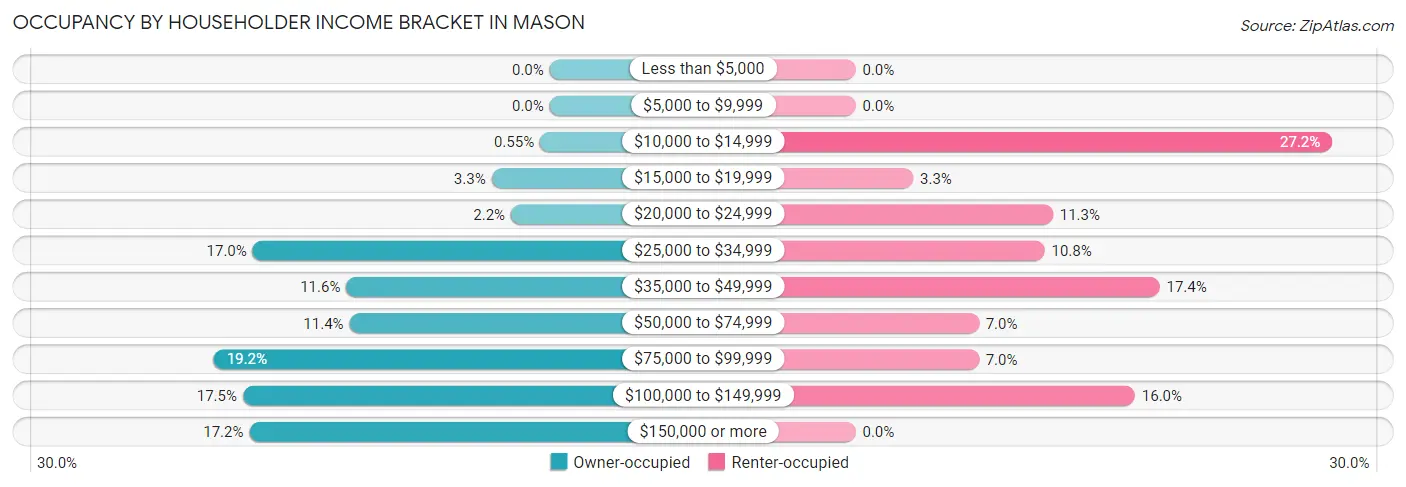
| Income Bracket | Owner-occupied | Renter-occupied |
| Less than $5,000 | 0 (0.0%) | 0 (0.0%) |
| $5,000 to $9,999 | 0 (0.0%) | 0 (0.0%) |
| $10,000 to $14,999 | 3 (0.5%) | 58 (27.2%) |
| $15,000 to $19,999 | 18 (3.3%) | 7 (3.3%) |
| $20,000 to $24,999 | 12 (2.2%) | 24 (11.3%) |
| $25,000 to $34,999 | 92 (17.0%) | 23 (10.8%) |
| $35,000 to $49,999 | 63 (11.6%) | 37 (17.4%) |
| $50,000 to $74,999 | 62 (11.4%) | 15 (7.0%) |
| $75,000 to $99,999 | 104 (19.2%) | 15 (7.0%) |
| $100,000 to $149,999 | 95 (17.5%) | 34 (16.0%) |
| $150,000 or more | 93 (17.2%) | 0 (0.0%) |
| Total | 542 (100.0%) | 213 (100.0%) |
Monthly Housing Cost Tiers in Mason
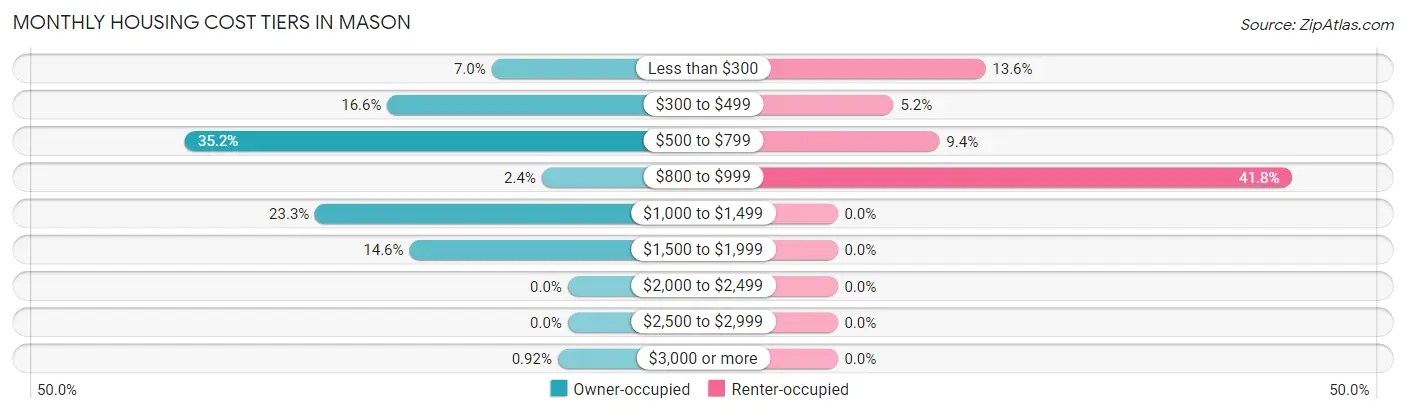
| Monthly Cost | Owner-occupied | Renter-occupied |
| Less than $300 | 38 (7.0%) | 29 (13.6%) |
| $300 to $499 | 90 (16.6%) | 11 (5.2%) |
| $500 to $799 | 191 (35.2%) | 20 (9.4%) |
| $800 to $999 | 13 (2.4%) | 89 (41.8%) |
| $1,000 to $1,499 | 126 (23.3%) | 0 (0.0%) |
| $1,500 to $1,999 | 79 (14.6%) | 0 (0.0%) |
| $2,000 to $2,499 | 0 (0.0%) | 0 (0.0%) |
| $2,500 to $2,999 | 0 (0.0%) | 0 (0.0%) |
| $3,000 or more | 5 (0.9%) | 0 (0.0%) |
| Total | 542 (100.0%) | 213 (100.0%) |
Physical Housing Characteristics in Mason
Housing Structures in Mason
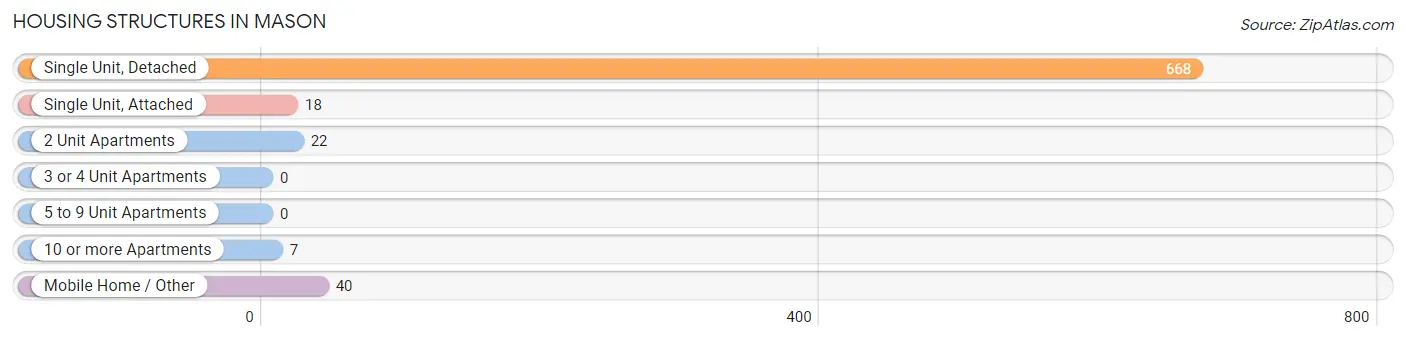
| Structure Type | # Housing Units | % Housing Units |
| Single Unit, Detached | 668 | 88.5% |
| Single Unit, Attached | 18 | 2.4% |
| 2 Unit Apartments | 22 | 2.9% |
| 3 or 4 Unit Apartments | 0 | 0.0% |
| 5 to 9 Unit Apartments | 0 | 0.0% |
| 10 or more Apartments | 7 | 0.9% |
| Mobile Home / Other | 40 | 5.3% |
| Total | 755 | 100.0% |
Housing Structures by Occupancy in Mason
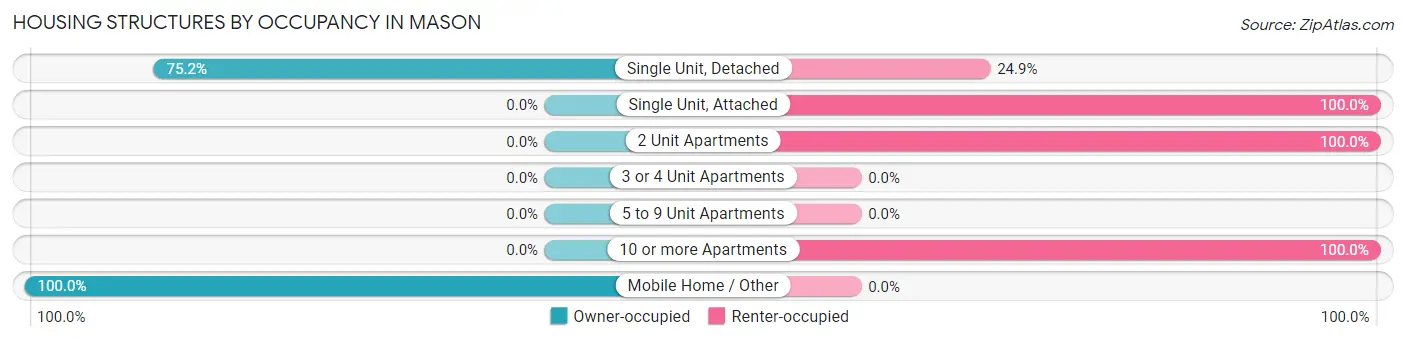
| Structure Type | Owner-occupied | Renter-occupied |
| Single Unit, Detached | 502 (75.1%) | 166 (24.8%) |
| Single Unit, Attached | 0 (0.0%) | 18 (100.0%) |
| 2 Unit Apartments | 0 (0.0%) | 22 (100.0%) |
| 3 or 4 Unit Apartments | 0 (0.0%) | 0 (0.0%) |
| 5 to 9 Unit Apartments | 0 (0.0%) | 0 (0.0%) |
| 10 or more Apartments | 0 (0.0%) | 7 (100.0%) |
| Mobile Home / Other | 40 (100.0%) | 0 (0.0%) |
| Total | 542 (71.8%) | 213 (28.2%) |
Housing Structures by Number of Rooms in Mason
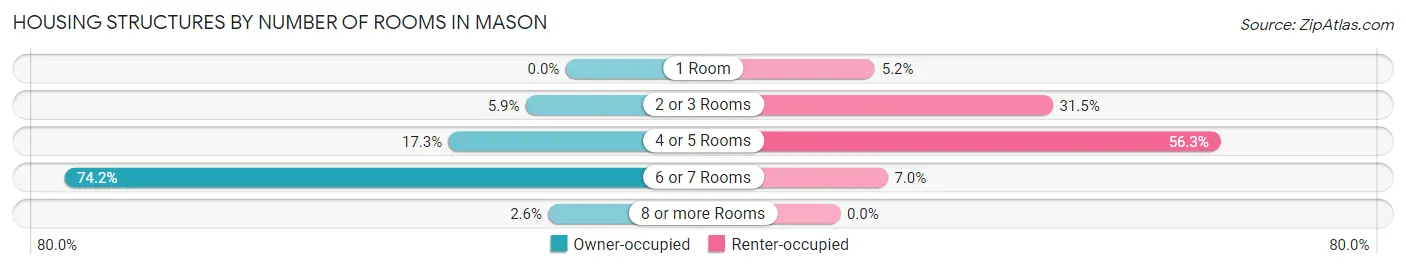
| Number of Rooms | Owner-occupied | Renter-occupied |
| 1 Room | 0 (0.0%) | 11 (5.2%) |
| 2 or 3 Rooms | 32 (5.9%) | 67 (31.5%) |
| 4 or 5 Rooms | 94 (17.3%) | 120 (56.3%) |
| 6 or 7 Rooms | 402 (74.2%) | 15 (7.0%) |
| 8 or more Rooms | 14 (2.6%) | 0 (0.0%) |
| Total | 542 (100.0%) | 213 (100.0%) |
Housing Structure by Heating Type in Mason
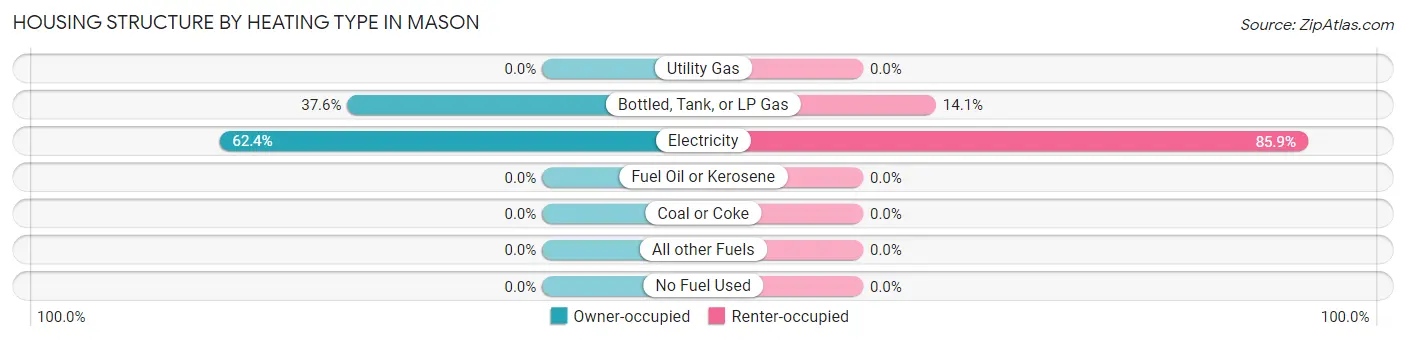
| Heating Type | Owner-occupied | Renter-occupied |
| Utility Gas | 0 (0.0%) | 0 (0.0%) |
| Bottled, Tank, or LP Gas | 204 (37.6%) | 30 (14.1%) |
| Electricity | 338 (62.4%) | 183 (85.9%) |
| Fuel Oil or Kerosene | 0 (0.0%) | 0 (0.0%) |
| Coal or Coke | 0 (0.0%) | 0 (0.0%) |
| All other Fuels | 0 (0.0%) | 0 (0.0%) |
| No Fuel Used | 0 (0.0%) | 0 (0.0%) |
| Total | 542 (100.0%) | 213 (100.0%) |
Household Vehicle Usage in Mason
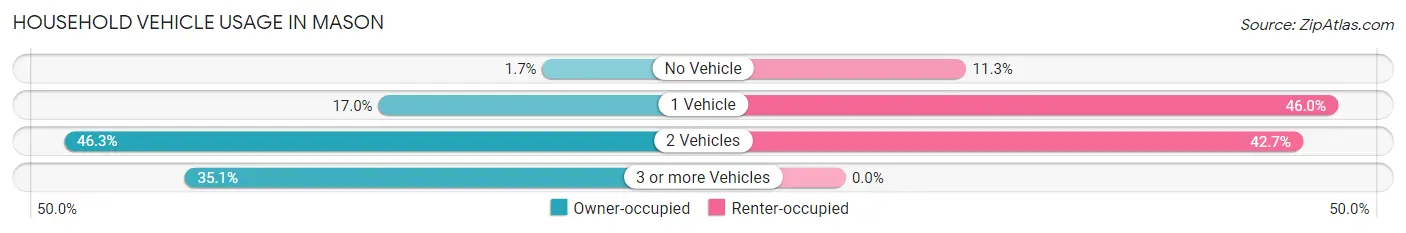
| Vehicles per Household | Owner-occupied | Renter-occupied |
| No Vehicle | 9 (1.7%) | 24 (11.3%) |
| 1 Vehicle | 92 (17.0%) | 98 (46.0%) |
| 2 Vehicles | 251 (46.3%) | 91 (42.7%) |
| 3 or more Vehicles | 190 (35.1%) | 0 (0.0%) |
| Total | 542 (100.0%) | 213 (100.0%) |
Real Estate & Mortgages in Mason
Real Estate and Mortgage Overview in Mason
| Characteristic | Without Mortgage | With Mortgage |
| Housing Units | 314 | 228 |
| Median Property Value | $137,200 | $231,600 |
| Median Household Income | $51,800 | $85 |
| Monthly Housing Costs | $548 | $5 |
| Real Estate Taxes | $1,130 | $0 |
Property Value by Mortgage Status in Mason
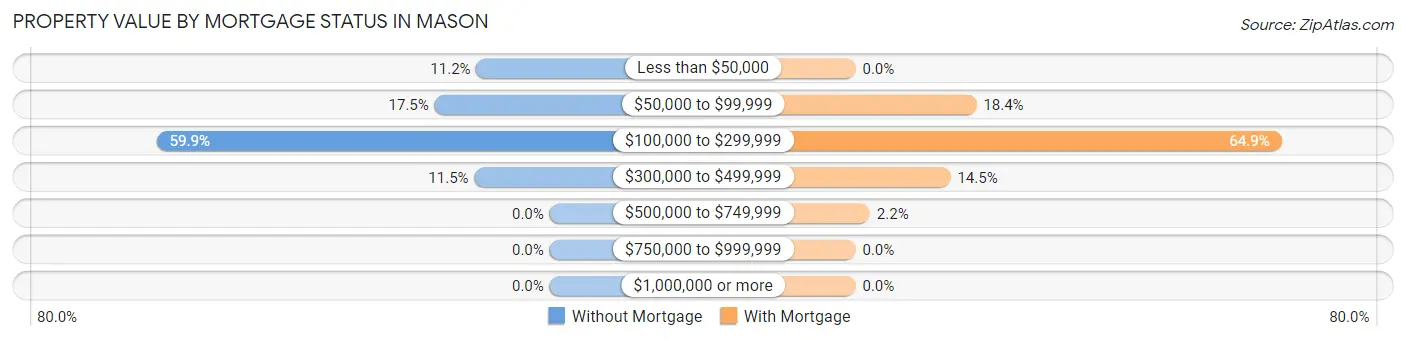
| Property Value | Without Mortgage | With Mortgage |
| Less than $50,000 | 35 (11.2%) | 0 (0.0%) |
| $50,000 to $99,999 | 55 (17.5%) | 42 (18.4%) |
| $100,000 to $299,999 | 188 (59.9%) | 148 (64.9%) |
| $300,000 to $499,999 | 36 (11.5%) | 33 (14.5%) |
| $500,000 to $749,999 | 0 (0.0%) | 5 (2.2%) |
| $750,000 to $999,999 | 0 (0.0%) | 0 (0.0%) |
| $1,000,000 or more | 0 (0.0%) | 0 (0.0%) |
| Total | 314 (100.0%) | 228 (100.0%) |
Household Income by Mortgage Status in Mason
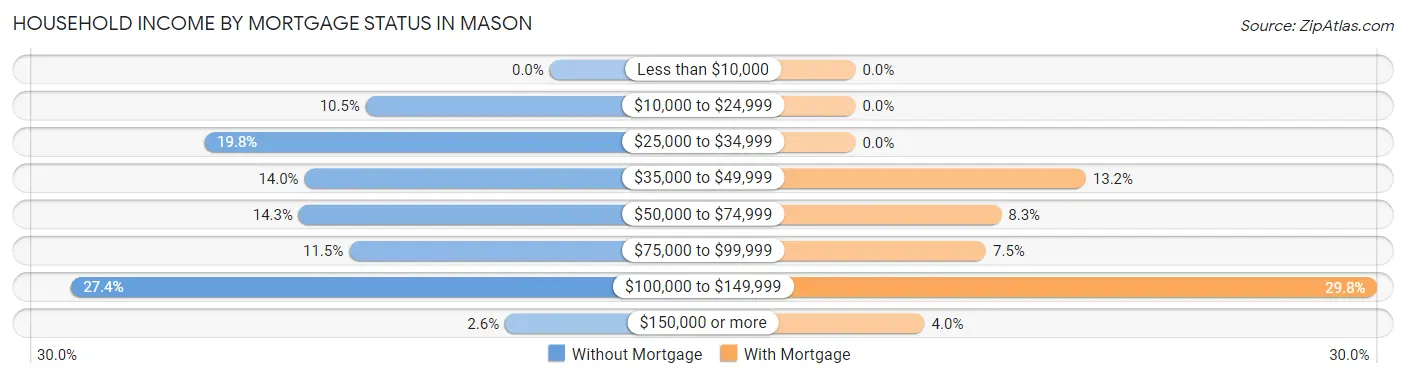
| Household Income | Without Mortgage | With Mortgage |
| Less than $10,000 | 0 (0.0%) | 0 (0.0%) |
| $10,000 to $24,999 | 33 (10.5%) | 0 (0.0%) |
| $25,000 to $34,999 | 62 (19.8%) | 0 (0.0%) |
| $35,000 to $49,999 | 44 (14.0%) | 30 (13.2%) |
| $50,000 to $74,999 | 45 (14.3%) | 19 (8.3%) |
| $75,000 to $99,999 | 36 (11.5%) | 17 (7.5%) |
| $100,000 to $149,999 | 86 (27.4%) | 68 (29.8%) |
| $150,000 or more | 8 (2.5%) | 9 (4.0%) |
| Total | 314 (100.0%) | 228 (100.0%) |
Property Value to Household Income Ratio in Mason
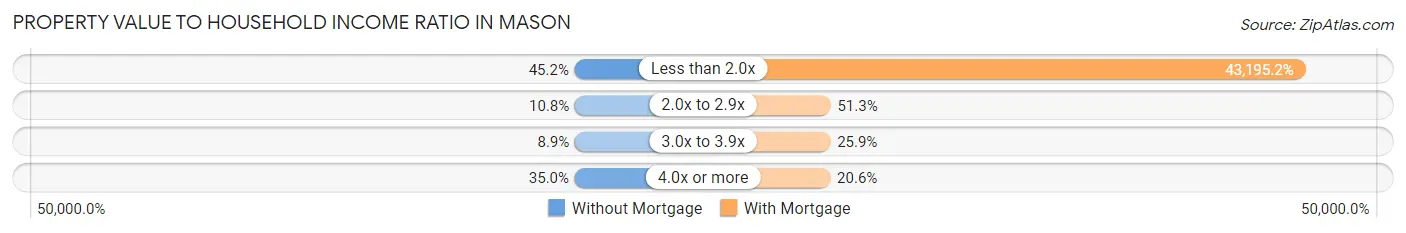
| Value-to-Income Ratio | Without Mortgage | With Mortgage |
| Less than 2.0x | 142 (45.2%) | 98,485 (43,195.2%) |
| 2.0x to 2.9x | 34 (10.8%) | 117 (51.3%) |
| 3.0x to 3.9x | 28 (8.9%) | 59 (25.9%) |
| 4.0x or more | 110 (35.0%) | 47 (20.6%) |
| Total | 314 (100.0%) | 228 (100.0%) |
Real Estate Taxes by Mortgage Status in Mason
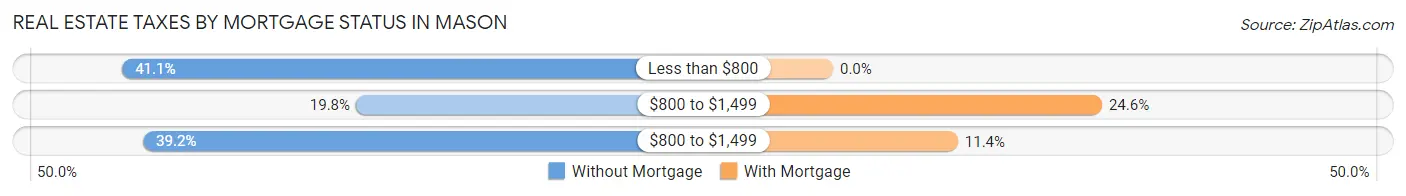
| Property Taxes | Without Mortgage | With Mortgage |
| Less than $800 | 129 (41.1%) | 0 (0.0%) |
| $800 to $1,499 | 62 (19.8%) | 56 (24.6%) |
| $800 to $1,499 | 123 (39.2%) | 26 (11.4%) |
| Total | 314 (100.0%) | 228 (100.0%) |
Health & Disability in Mason
Health Insurance Coverage by Age in Mason
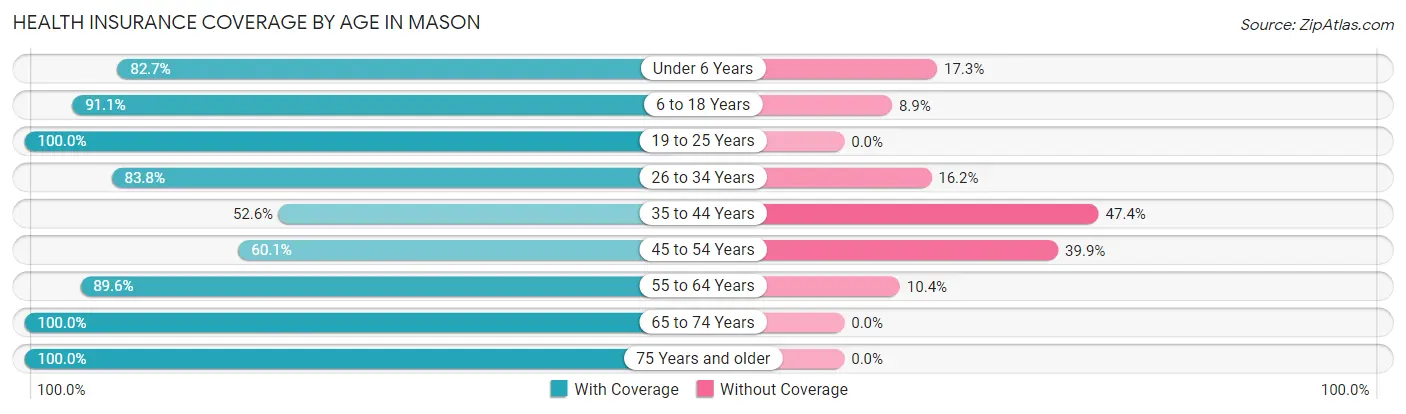
| Age Bracket | With Coverage | Without Coverage |
| Under 6 Years | 244 (82.7%) | 51 (17.3%) |
| 6 to 18 Years | 287 (91.1%) | 28 (8.9%) |
| 19 to 25 Years | 169 (100.0%) | 0 (0.0%) |
| 26 to 34 Years | 217 (83.8%) | 42 (16.2%) |
| 35 to 44 Years | 92 (52.6%) | 83 (47.4%) |
| 45 to 54 Years | 101 (60.1%) | 67 (39.9%) |
| 55 to 64 Years | 242 (89.6%) | 28 (10.4%) |
| 65 to 74 Years | 377 (100.0%) | 0 (0.0%) |
| 75 Years and older | 121 (100.0%) | 0 (0.0%) |
| Total | 1,850 (86.1%) | 299 (13.9%) |
Health Insurance Coverage by Citizenship Status in Mason
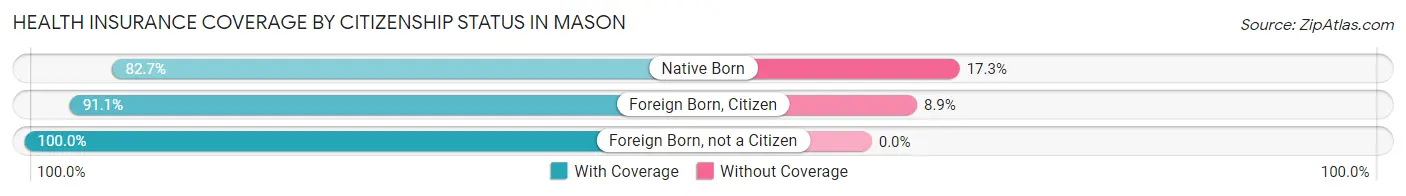
| Citizenship Status | With Coverage | Without Coverage |
| Native Born | 244 (82.7%) | 51 (17.3%) |
| Foreign Born, Citizen | 287 (91.1%) | 28 (8.9%) |
| Foreign Born, not a Citizen | 169 (100.0%) | 0 (0.0%) |
Health Insurance Coverage by Household Income in Mason
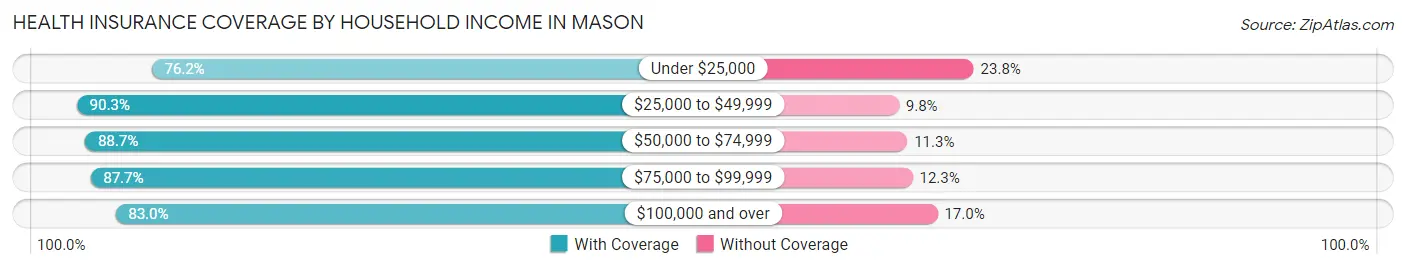
| Household Income | With Coverage | Without Coverage |
| Under $25,000 | 93 (76.2%) | 29 (23.8%) |
| $25,000 to $49,999 | 583 (90.2%) | 63 (9.8%) |
| $50,000 to $74,999 | 141 (88.7%) | 18 (11.3%) |
| $75,000 to $99,999 | 349 (87.7%) | 49 (12.3%) |
| $100,000 and over | 684 (83.0%) | 140 (17.0%) |
Public vs Private Health Insurance Coverage by Age in Mason
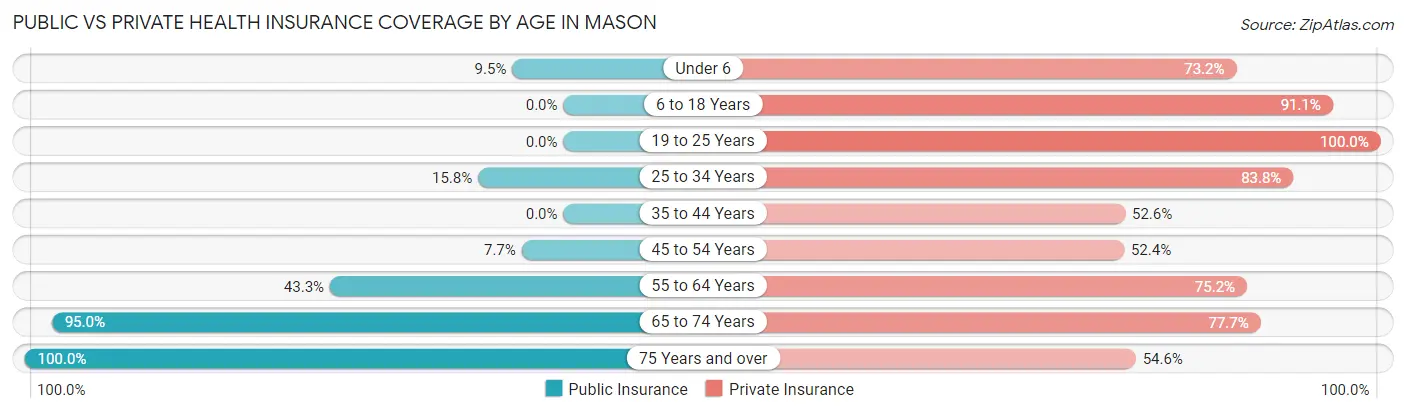
| Age Bracket | Public Insurance | Private Insurance |
| Under 6 | 28 (9.5%) | 216 (73.2%) |
| 6 to 18 Years | 0 (0.0%) | 287 (91.1%) |
| 19 to 25 Years | 0 (0.0%) | 169 (100.0%) |
| 25 to 34 Years | 41 (15.8%) | 217 (83.8%) |
| 35 to 44 Years | 0 (0.0%) | 92 (52.6%) |
| 45 to 54 Years | 13 (7.7%) | 88 (52.4%) |
| 55 to 64 Years | 117 (43.3%) | 203 (75.2%) |
| 65 to 74 Years | 358 (95.0%) | 293 (77.7%) |
| 75 Years and over | 121 (100.0%) | 66 (54.5%) |
| Total | 678 (31.6%) | 1,631 (75.9%) |
Disability Status by Sex by Age in Mason
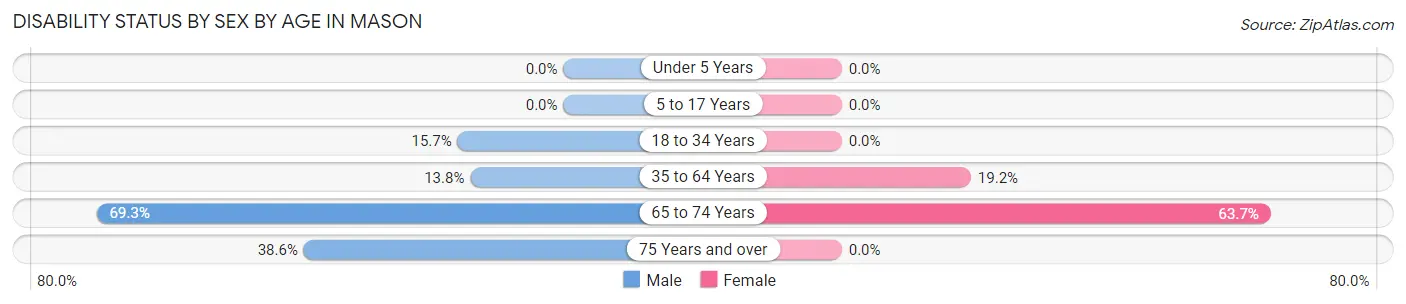
| Age Bracket | Male | Female |
| Under 5 Years | 0 (0.0%) | 0 (0.0%) |
| 5 to 17 Years | 0 (0.0%) | 0 (0.0%) |
| 18 to 34 Years | 41 (15.7%) | 0 (0.0%) |
| 35 to 64 Years | 35 (13.8%) | 69 (19.2%) |
| 65 to 74 Years | 122 (69.3%) | 128 (63.7%) |
| 75 Years and over | 32 (38.6%) | 0 (0.0%) |
Disability Class by Sex by Age in Mason
Disability Class: Hearing Difficulty
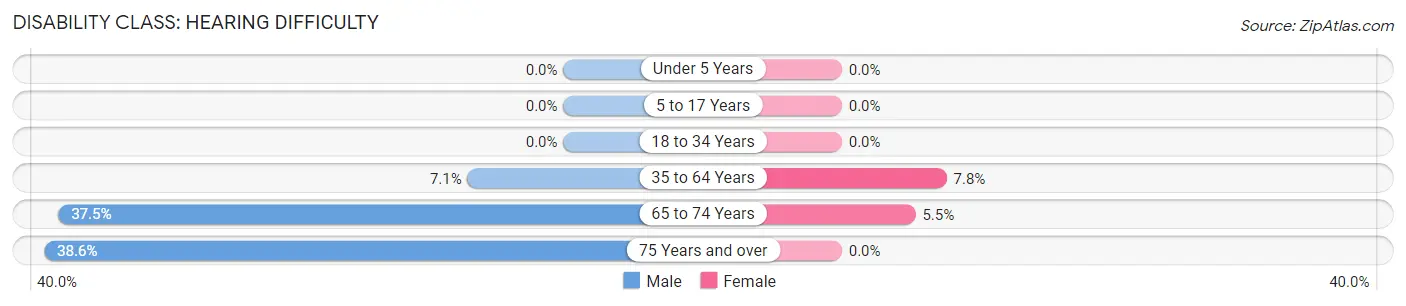
| Age Bracket | Male | Female |
| Under 5 Years | 0 (0.0%) | 0 (0.0%) |
| 5 to 17 Years | 0 (0.0%) | 0 (0.0%) |
| 18 to 34 Years | 0 (0.0%) | 0 (0.0%) |
| 35 to 64 Years | 18 (7.1%) | 28 (7.8%) |
| 65 to 74 Years | 66 (37.5%) | 11 (5.5%) |
| 75 Years and over | 32 (38.6%) | 0 (0.0%) |
Disability Class: Vision Difficulty
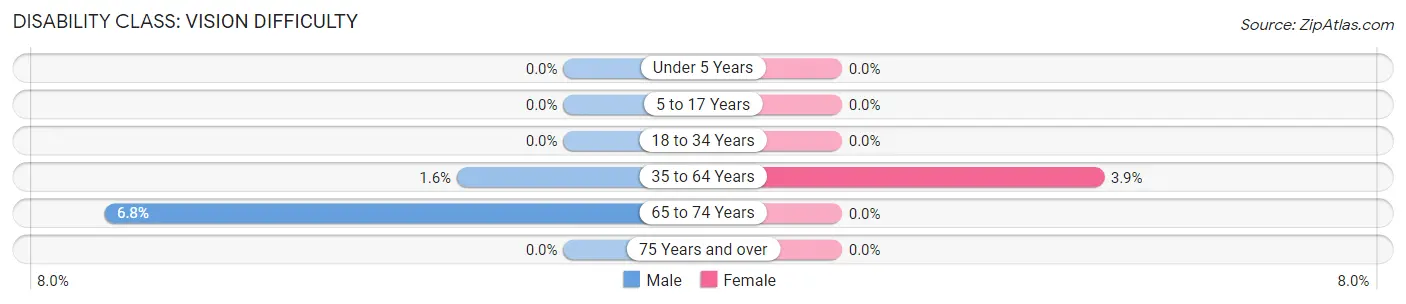
| Age Bracket | Male | Female |
| Under 5 Years | 0 (0.0%) | 0 (0.0%) |
| 5 to 17 Years | 0 (0.0%) | 0 (0.0%) |
| 18 to 34 Years | 0 (0.0%) | 0 (0.0%) |
| 35 to 64 Years | 4 (1.6%) | 14 (3.9%) |
| 65 to 74 Years | 12 (6.8%) | 0 (0.0%) |
| 75 Years and over | 0 (0.0%) | 0 (0.0%) |
Disability Class: Cognitive Difficulty
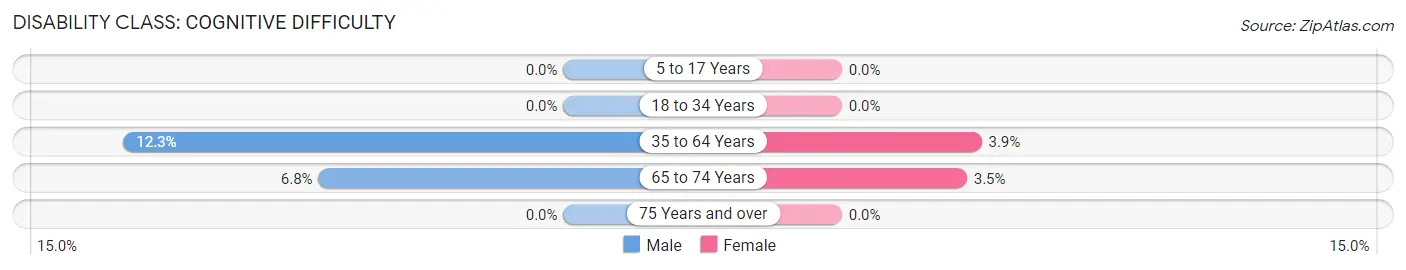
| Age Bracket | Male | Female |
| 5 to 17 Years | 0 (0.0%) | 0 (0.0%) |
| 18 to 34 Years | 0 (0.0%) | 0 (0.0%) |
| 35 to 64 Years | 31 (12.2%) | 14 (3.9%) |
| 65 to 74 Years | 12 (6.8%) | 7 (3.5%) |
| 75 Years and over | 0 (0.0%) | 0 (0.0%) |
Disability Class: Ambulatory Difficulty
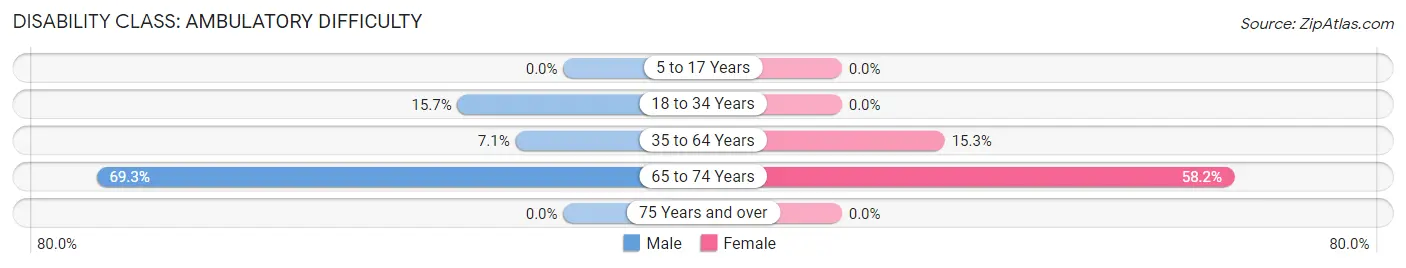
| Age Bracket | Male | Female |
| 5 to 17 Years | 0 (0.0%) | 0 (0.0%) |
| 18 to 34 Years | 41 (15.7%) | 0 (0.0%) |
| 35 to 64 Years | 18 (7.1%) | 55 (15.3%) |
| 65 to 74 Years | 122 (69.3%) | 117 (58.2%) |
| 75 Years and over | 0 (0.0%) | 0 (0.0%) |
Disability Class: Self-Care Difficulty
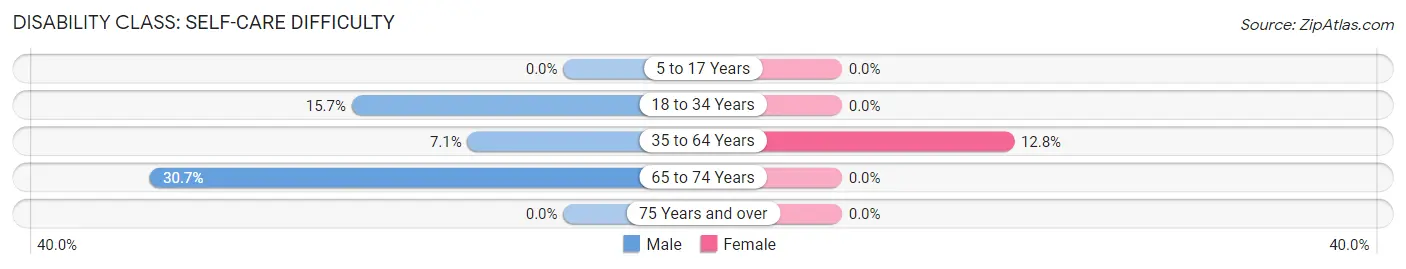
| Age Bracket | Male | Female |
| 5 to 17 Years | 0 (0.0%) | 0 (0.0%) |
| 18 to 34 Years | 41 (15.7%) | 0 (0.0%) |
| 35 to 64 Years | 18 (7.1%) | 46 (12.8%) |
| 65 to 74 Years | 54 (30.7%) | 0 (0.0%) |
| 75 Years and over | 0 (0.0%) | 0 (0.0%) |
Technology Access in Mason
Computing Device Access in Mason
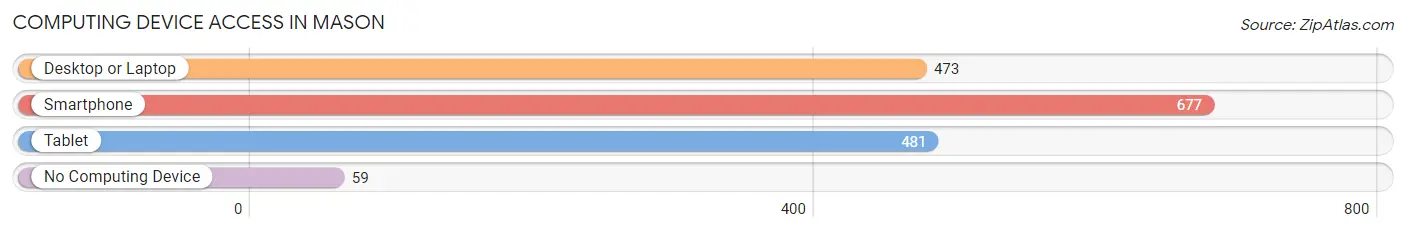
| Device Type | # Households | % Households |
| Desktop or Laptop | 473 | 62.6% |
| Smartphone | 677 | 89.7% |
| Tablet | 481 | 63.7% |
| No Computing Device | 59 | 7.8% |
| Total | 755 | 100.0% |
Internet Access in Mason
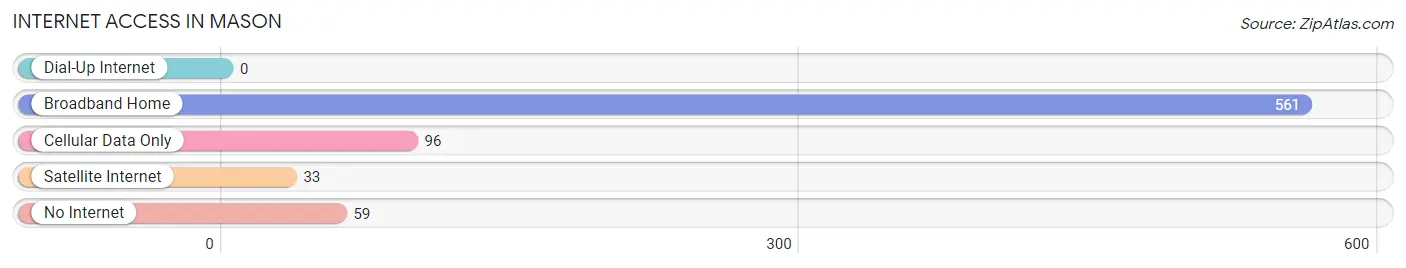
| Internet Type | # Households | % Households |
| Dial-Up Internet | 0 | 0.0% |
| Broadband Home | 561 | 74.3% |
| Cellular Data Only | 96 | 12.7% |
| Satellite Internet | 33 | 4.4% |
| No Internet | 59 | 7.8% |
| Total | 755 | 100.0% |
Mason Summary
Mason, Texas is a small town located in Mason County, Texas, United States. It is the county seat of Mason County and is located in the Hill Country region of Central Texas. The population of Mason was 1,531 at the 2010 census.
History
Mason was founded in 1858 by German immigrants who had settled in the area. The town was named after Fort Mason, which was established in 1851 to protect settlers from Indian raids. The fort was named after Major George T. Mason, who was killed in the Battle of San Jacinto.
The town was incorporated in 1876 and quickly became a center of commerce and trade for the surrounding area. The town was also home to a number of businesses, including a flour mill, a cotton gin, and a blacksmith shop.
In the late 19th century, Mason was a popular stop on the Chisholm Trail, which was used by cowboys to drive cattle from Texas to Kansas. The town was also home to a number of saloons and gambling halls, which attracted cowboys and other travelers.
In the early 20th century, Mason was a center of the oil and gas industry. The town was home to several oil and gas companies, including the Mason Oil Company, which was founded in 1911.
Geography
Mason is located in the Hill Country region of Central Texas, about 90 miles northwest of Austin. The town is situated at the intersection of U.S. Highway 87 and State Highway 29.
The town is located in a hilly area, with elevations ranging from 1,400 to 1,800 feet above sea level. The terrain is mostly flat, with some rolling hills. The town is located in the Edwards Plateau, which is characterized by limestone outcroppings and cedar trees.
The climate in Mason is semi-arid, with hot summers and mild winters. The average annual temperature is 68 degrees Fahrenheit, and the average annual precipitation is 22 inches.
Economy
Mason’s economy is largely based on agriculture and tourism. The town is home to a number of farms, ranches, and wineries. The town is also home to a number of tourist attractions, including the Mason County Historical Museum, the Mason County Courthouse, and the Mason County Jail.
The town is also home to a number of businesses, including restaurants, retail stores, and service providers. The town is also home to a number of manufacturing companies, including a furniture factory and a metal fabrication plant.
Demographics
As of the 2010 census, the population of Mason was 1,531. The racial makeup of the town was 94.3% White, 0.7% African American, 0.3% Native American, 0.2% Asian, 0.1% Pacific Islander, 2.7% from other races, and 1.9% from two or more races. Hispanic or Latino of any race were 5.3% of the population.
The median income for a household in Mason was $37,500, and the median income for a family was $45,000. The per capita income for the town was $19,845. About 11.3% of families and 14.2% of the population were below the poverty line, including 18.2% of those under age 18 and 8.3% of those age 65 or over.
Common Questions
What is Per Capita Income in Mason?
Per Capita income in Mason is $31,397.
What is the Median Family Income in Mason?
Median Family Income in Mason is $93,698.
What is the Median Household income in Mason?
Median Household Income in Mason is $61,797.
What is Income or Wage Gap in Mason?
Income or Wage Gap in Mason is 10.5%.
Women in Mason earn 89.5 cents for every dollar earned by a man.
What is Inequality or Gini Index in Mason?
Inequality or Gini Index in Mason is 0.47.
What is the Total Population of Mason?
Total Population of Mason is 2,158.
What is the Total Male Population of Mason?
Total Male Population of Mason is 1,149.
What is the Total Female Population of Mason?
Total Female Population of Mason is 1,009.
What is the Ratio of Males per 100 Females in Mason?
There are 113.88 Males per 100 Females in Mason.
What is the Ratio of Females per 100 Males in Mason?
There are 87.82 Females per 100 Males in Mason.
What is the Median Population Age in Mason?
Median Population Age in Mason is 37.0 Years.
What is the Average Family Size in Mason
Average Family Size in Mason is 3.7 People.
What is the Average Household Size in Mason
Average Household Size in Mason is 2.9 People.
How Large is the Labor Force in Mason?
There are 948 People in the Labor Forcein in Mason.
What is the Percentage of People in the Labor Force in Mason?
57.6% of People are in the Labor Force in Mason.
What is the Unemployment Rate in Mason?
Unemployment Rate in Mason is 3.9%.