Mart, TX Map & Demographics
Mart Map
Mart Overview
$21,344
PER CAPITA INCOME
$57,546
AVG FAMILY INCOME
$50,652
AVG HOUSEHOLD INCOME
10.8%
WAGE / INCOME GAP [ % ]
89.2¢/ $1
WAGE / INCOME GAP [ $ ]
$11,011
FAMILY INCOME DEFICIT
0.38
INEQUALITY / GINI INDEX
2,179
TOTAL POPULATION
1,050
MALE POPULATION
1,129
FEMALE POPULATION
93.00
MALES / 100 FEMALES
107.52
FEMALES / 100 MALES
34.4
MEDIAN AGE
3.5
AVG FAMILY SIZE
2.9
AVG HOUSEHOLD SIZE
822
LABOR FORCE [ PEOPLE ]
52.8%
PERCENT IN LABOR FORCE
11.1%
UNEMPLOYMENT RATE
Mart Zip Codes
Mart Area Codes
Income in Mart
Income Overview in Mart
Per Capita Income in Mart is $21,344, while median incomes of families and households are $57,546 and $50,652 respectively.
| Characteristic | Number | Measure |
| Per Capita Income | 2,179 | $21,344 |
| Median Family Income | 529 | $57,546 |
| Mean Family Income | 529 | $67,341 |
| Median Household Income | 738 | $50,652 |
| Mean Household Income | 738 | $60,402 |
| Income Deficit | 529 | $11,011 |
| Wage / Income Gap (%) | 2,179 | 10.79% |
| Wage / Income Gap ($) | 2,179 | 89.21¢ per $1 |
| Gini / Inequality Index | 2,179 | 0.38 |
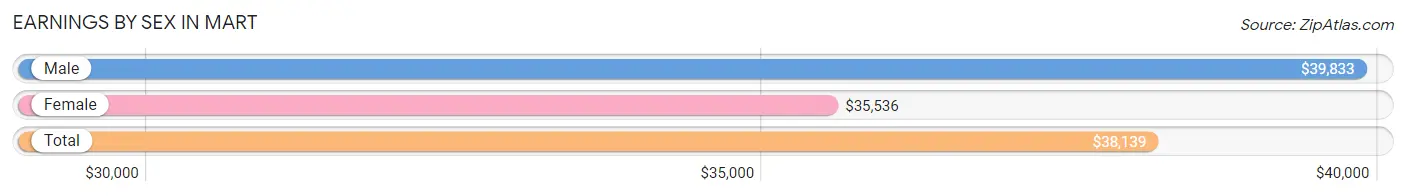
Earnings by Sex in Mart
Average Earnings in Mart are $38,139, $39,833 for men and $35,536 for women, a difference of 10.8%.
| Sex | Number | Average Earnings |
| Male | 446 (53.2%) | $39,833 |
| Female | 393 (46.8%) | $35,536 |
| Total | 839 (100.0%) | $38,139 |
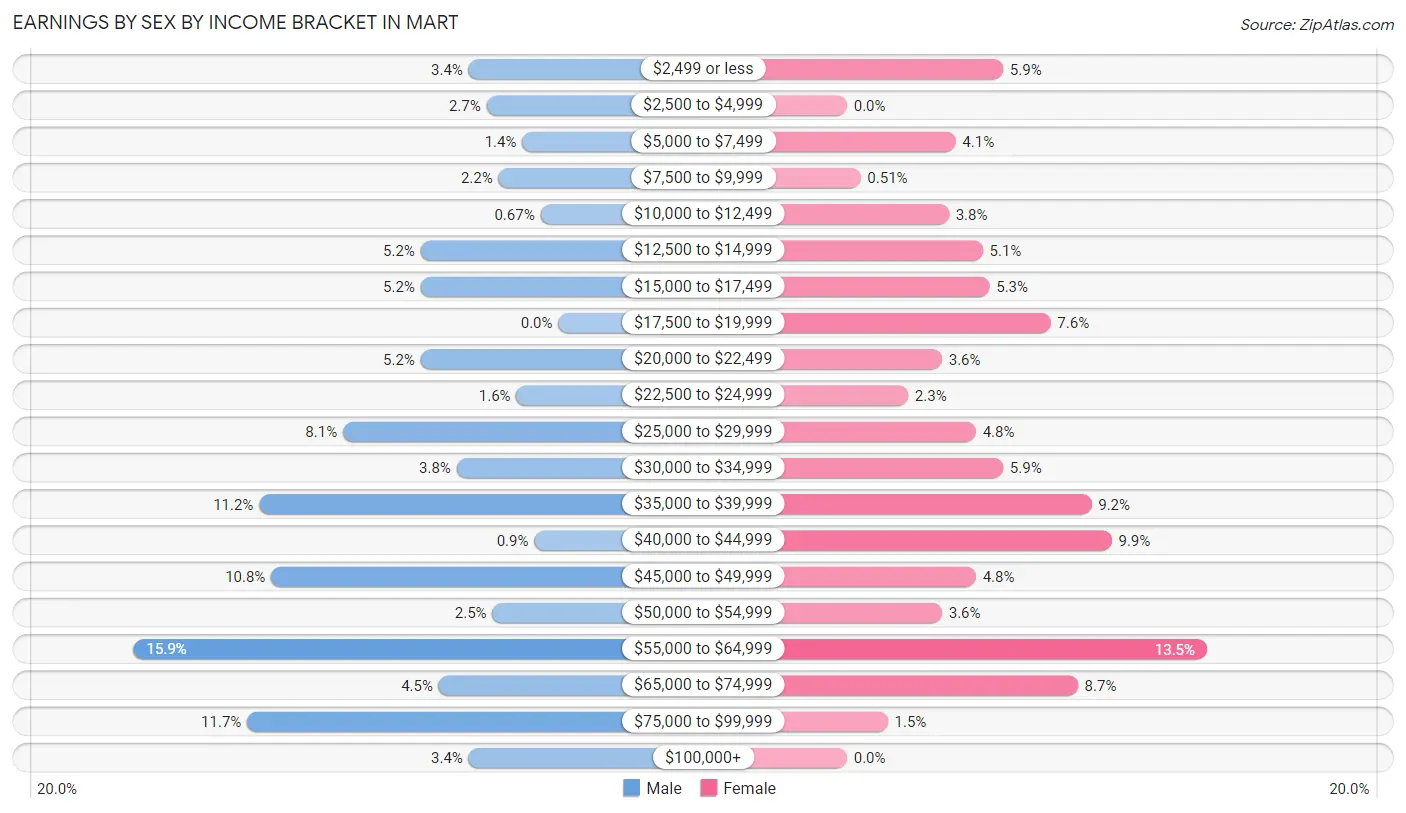
Earnings by Sex by Income Bracket in Mart
The most common earnings brackets in Mart are $55,000 to $64,999 for men (71 | 15.9%) and $55,000 to $64,999 for women (53 | 13.5%).
| Income | Male | Female |
| $2,499 or less | 15 (3.4%) | 23 (5.9%) |
| $2,500 to $4,999 | 12 (2.7%) | 0 (0.0%) |
| $5,000 to $7,499 | 6 (1.3%) | 16 (4.1%) |
| $7,500 to $9,999 | 10 (2.2%) | 2 (0.5%) |
| $10,000 to $12,499 | 3 (0.7%) | 15 (3.8%) |
| $12,500 to $14,999 | 23 (5.2%) | 20 (5.1%) |
| $15,000 to $17,499 | 23 (5.2%) | 21 (5.3%) |
| $17,500 to $19,999 | 0 (0.0%) | 30 (7.6%) |
| $20,000 to $22,499 | 23 (5.2%) | 14 (3.6%) |
| $22,500 to $24,999 | 7 (1.6%) | 9 (2.3%) |
| $25,000 to $29,999 | 36 (8.1%) | 19 (4.8%) |
| $30,000 to $34,999 | 17 (3.8%) | 23 (5.9%) |
| $35,000 to $39,999 | 50 (11.2%) | 36 (9.2%) |
| $40,000 to $44,999 | 4 (0.9%) | 39 (9.9%) |
| $45,000 to $49,999 | 48 (10.8%) | 19 (4.8%) |
| $50,000 to $54,999 | 11 (2.5%) | 14 (3.6%) |
| $55,000 to $64,999 | 71 (15.9%) | 53 (13.5%) |
| $65,000 to $74,999 | 20 (4.5%) | 34 (8.6%) |
| $75,000 to $99,999 | 52 (11.7%) | 6 (1.5%) |
| $100,000+ | 15 (3.4%) | 0 (0.0%) |
| Total | 446 (100.0%) | 393 (100.0%) |
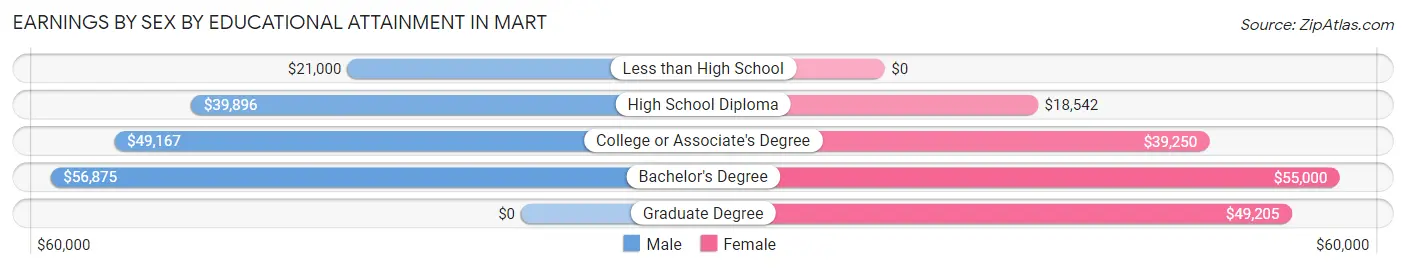
Earnings by Sex by Educational Attainment in Mart
Average earnings in Mart are $47,375 for men and $38,667 for women, a difference of 18.4%. Men with an educational attainment of bachelor's degree enjoy the highest average annual earnings of $56,875, while those with less than high school education earn the least with $21,000. Women with an educational attainment of bachelor's degree earn the most with the average annual earnings of $55,000, while those with high school diploma education have the smallest earnings of $18,542.
| Educational Attainment | Male Income | Female Income |
| Less than High School | $21,000 | $0 |
| High School Diploma | $39,896 | $18,542 |
| College or Associate's Degree | $49,167 | $39,250 |
| Bachelor's Degree | $56,875 | $55,000 |
| Graduate Degree | - | - |
| Total | $47,375 | $38,667 |
Family Income in Mart
Family Income Brackets in Mart
According to the Mart family income data, there are 115 families falling into the $50,000 to $74,999 income range, which is the most common income bracket and makes up 21.7% of all families.
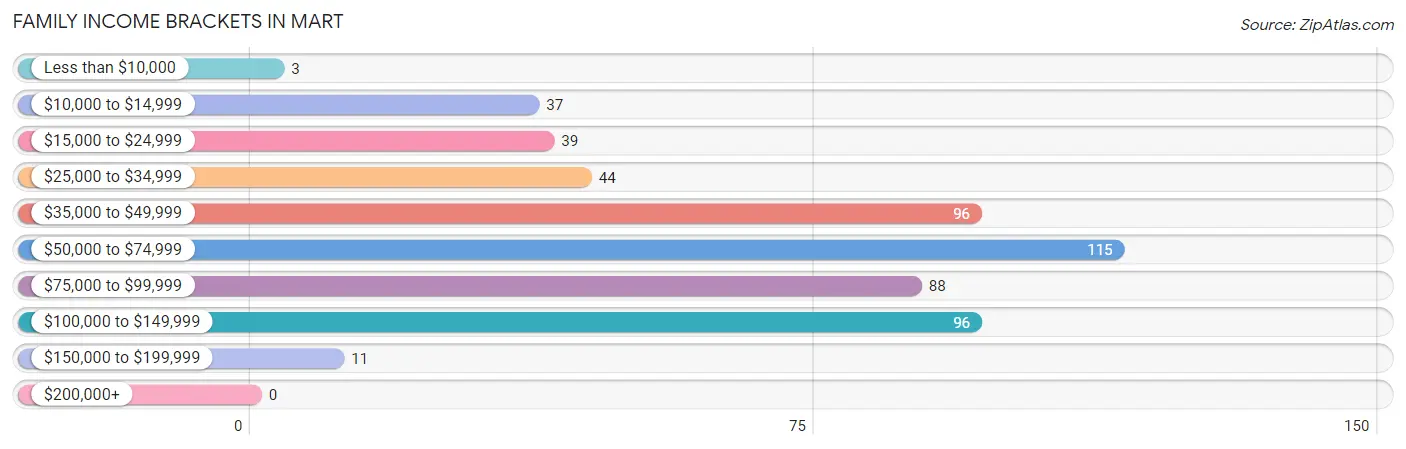
| Income Bracket | # Families | % Families |
| Less than $10,000 | 3 | 0.6% |
| $10,000 to $14,999 | 37 | 7.0% |
| $15,000 to $24,999 | 39 | 7.4% |
| $25,000 to $34,999 | 44 | 8.3% |
| $35,000 to $49,999 | 96 | 18.1% |
| $50,000 to $74,999 | 115 | 21.7% |
| $75,000 to $99,999 | 88 | 16.6% |
| $100,000 to $149,999 | 96 | 18.1% |
| $150,000 to $199,999 | 11 | 2.1% |
| $200,000+ | 0 | 0.0% |
Family Income by Famaliy Size in Mart
4-person families (57 | 10.8%) account for the highest median family income in Mart with $96,484 per family, while 2-person families (201 | 38.0%) have the highest median income of $24,956 per family member.
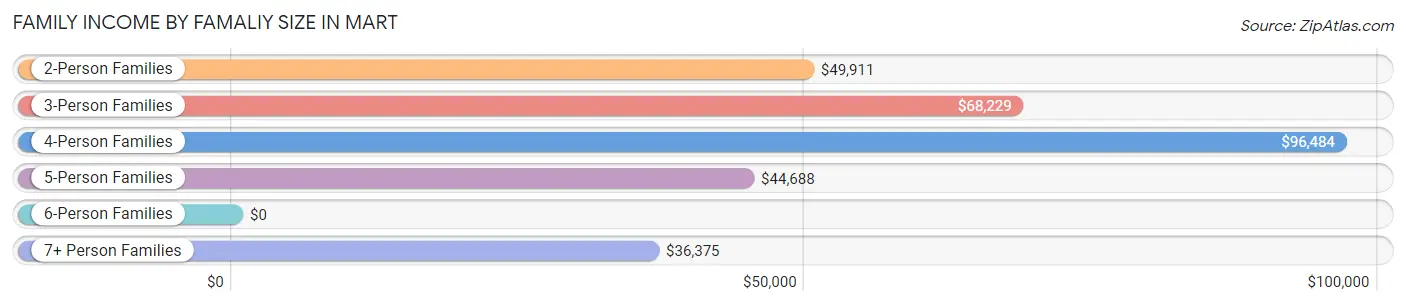
| Income Bracket | # Families | Median Income |
| 2-Person Families | 201 (38.0%) | $49,911 |
| 3-Person Families | 167 (31.6%) | $68,229 |
| 4-Person Families | 57 (10.8%) | $96,484 |
| 5-Person Families | 68 (12.9%) | $44,688 |
| 6-Person Families | 19 (3.6%) | $0 |
| 7+ Person Families | 17 (3.2%) | $36,375 |
| Total | 529 (100.0%) | $57,546 |
Family Income by Number of Earners in Mart
The median family income in Mart is $57,546, with families comprising 3+ earners (41) having the highest median family income of $120,417, while families with no earners (125) have the lowest median family income of $45,625, accounting for 7.7% and 23.6% of families, respectively.
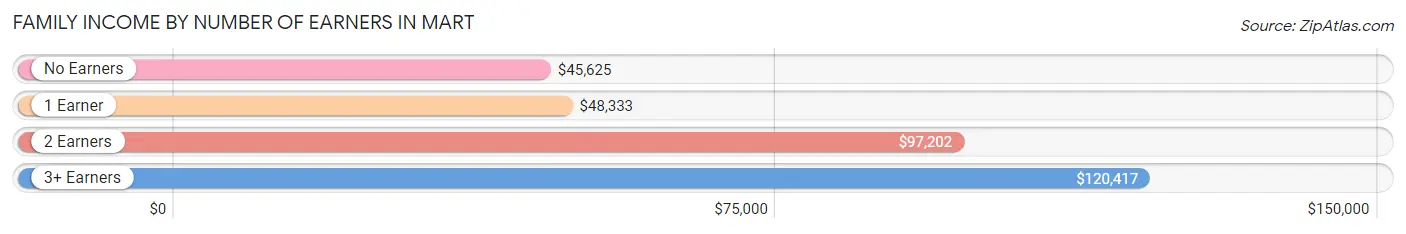
| Number of Earners | # Families | Median Income |
| No Earners | 125 (23.6%) | $45,625 |
| 1 Earner | 200 (37.8%) | $48,333 |
| 2 Earners | 163 (30.8%) | $97,202 |
| 3+ Earners | 41 (7.7%) | $120,417 |
| Total | 529 (100.0%) | $57,546 |
Household Income in Mart
Household Income Brackets in Mart
With 140 households falling in the category, the $50,000 to $74,999 income range is the most frequent in Mart, accounting for 19.0% of all households.
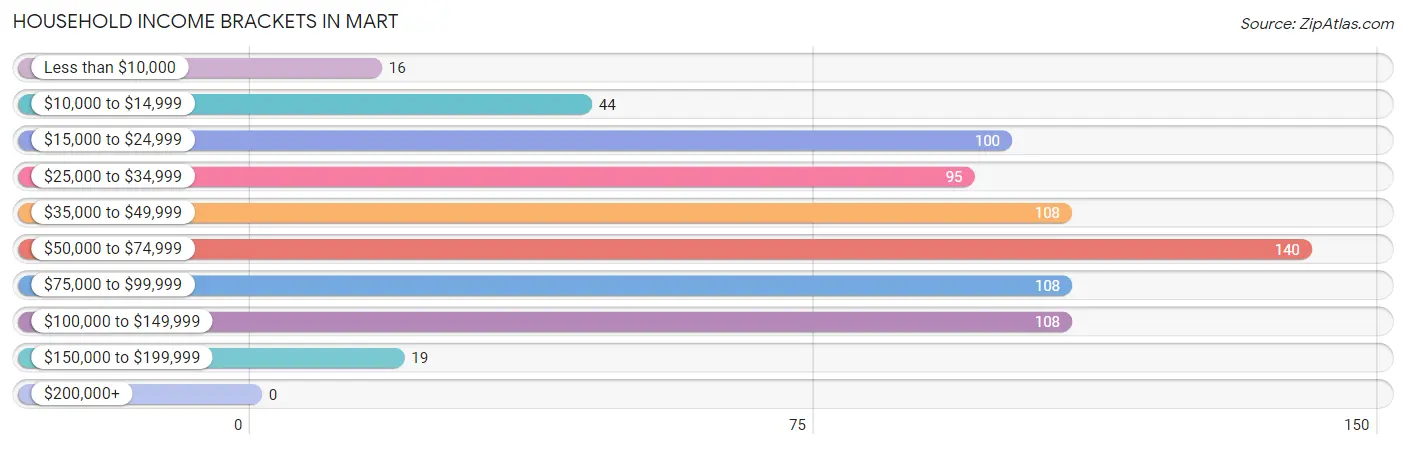
| Income Bracket | # Households | % Households |
| Less than $10,000 | 16 | 2.2% |
| $10,000 to $14,999 | 44 | 6.0% |
| $15,000 to $24,999 | 100 | 13.6% |
| $25,000 to $34,999 | 95 | 12.9% |
| $35,000 to $49,999 | 108 | 14.6% |
| $50,000 to $74,999 | 140 | 19.0% |
| $75,000 to $99,999 | 108 | 14.6% |
| $100,000 to $149,999 | 108 | 14.6% |
| $150,000 to $199,999 | 19 | 2.6% |
| $200,000+ | 0 | 0.0% |
Household Income by Householder Age in Mart
The median household income in Mart is $50,652, with the highest median household income of $59,107 found in the 25 to 44 years age bracket for the primary householder. A total of 275 households (37.3%) fall into this category. Meanwhile, the 45 to 64 years age bracket for the primary householder has the lowest median household income of $45,446, with 237 households (32.1%) in this group.
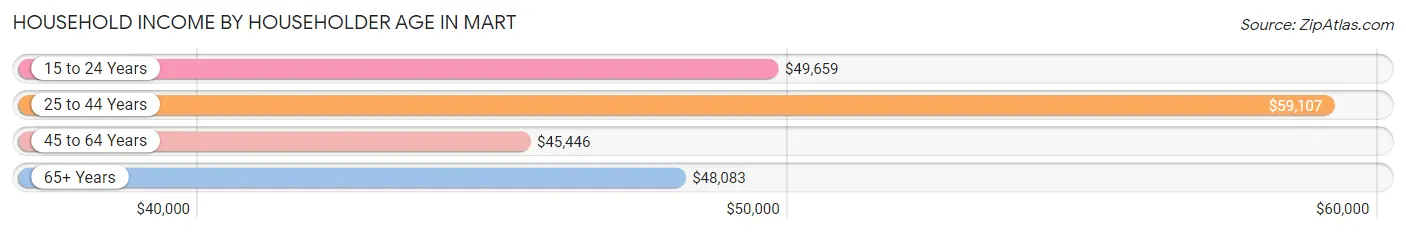
| Income Bracket | # Households | Median Income |
| 15 to 24 Years | 19 (2.6%) | $49,659 |
| 25 to 44 Years | 275 (37.3%) | $59,107 |
| 45 to 64 Years | 237 (32.1%) | $45,446 |
| 65+ Years | 207 (28.1%) | $48,083 |
| Total | 738 (100.0%) | $50,652 |
Poverty in Mart
Income Below Poverty by Sex and Age in Mart
With 21.2% poverty level for males and 24.3% for females among the residents of Mart, under 5 year old males and 15 year old females are the most vulnerable to poverty, with 19 males (55.9%) and 4 females (100.0%) in their respective age groups living below the poverty level.
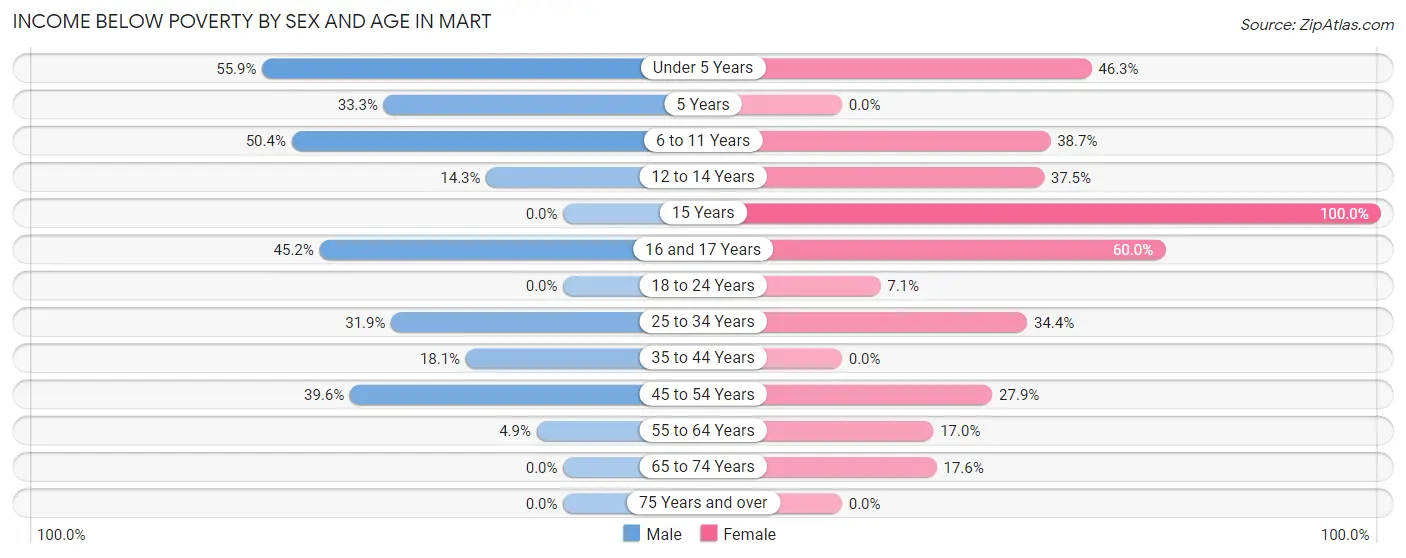
| Age Bracket | Male | Female |
| Under 5 Years | 19 (55.9%) | 44 (46.3%) |
| 5 Years | 9 (33.3%) | 0 (0.0%) |
| 6 to 11 Years | 60 (50.4%) | 53 (38.7%) |
| 12 to 14 Years | 14 (14.3%) | 30 (37.5%) |
| 15 Years | 0 (0.0%) | 4 (100.0%) |
| 16 and 17 Years | 19 (45.2%) | 24 (60.0%) |
| 18 to 24 Years | 0 (0.0%) | 5 (7.1%) |
| 25 to 34 Years | 38 (31.9%) | 44 (34.4%) |
| 35 to 44 Years | 32 (18.1%) | 0 (0.0%) |
| 45 to 54 Years | 19 (39.6%) | 24 (27.9%) |
| 55 to 64 Years | 6 (4.9%) | 28 (17.0%) |
| 65 to 74 Years | 0 (0.0%) | 16 (17.6%) |
| 75 Years and over | 0 (0.0%) | 0 (0.0%) |
| Total | 216 (21.2%) | 272 (24.3%) |
Income Above Poverty by Sex and Age in Mart
According to the poverty statistics in Mart, males aged 15 years and females aged 5 years are the age groups that are most secure financially, with 100.0% of males and 100.0% of females in these age groups living above the poverty line.
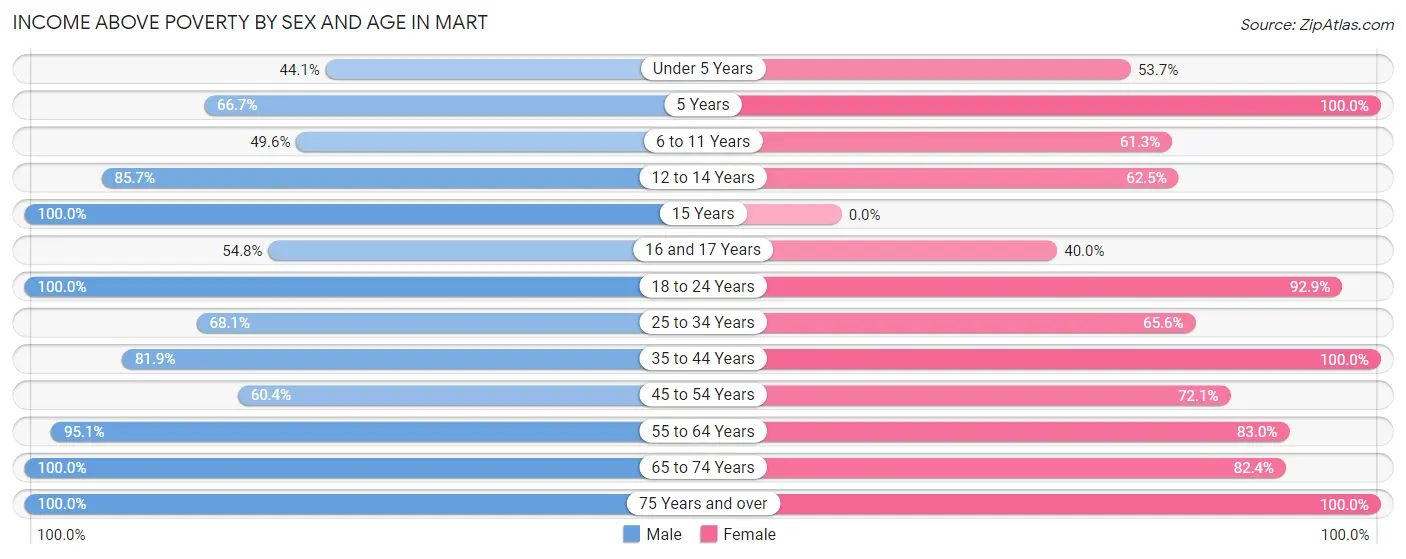
| Age Bracket | Male | Female |
| Under 5 Years | 15 (44.1%) | 51 (53.7%) |
| 5 Years | 18 (66.7%) | 24 (100.0%) |
| 6 to 11 Years | 59 (49.6%) | 84 (61.3%) |
| 12 to 14 Years | 84 (85.7%) | 50 (62.5%) |
| 15 Years | 4 (100.0%) | 0 (0.0%) |
| 16 and 17 Years | 23 (54.8%) | 16 (40.0%) |
| 18 to 24 Years | 81 (100.0%) | 65 (92.9%) |
| 25 to 34 Years | 81 (68.1%) | 84 (65.6%) |
| 35 to 44 Years | 145 (81.9%) | 120 (100.0%) |
| 45 to 54 Years | 29 (60.4%) | 62 (72.1%) |
| 55 to 64 Years | 116 (95.1%) | 137 (83.0%) |
| 65 to 74 Years | 68 (100.0%) | 75 (82.4%) |
| 75 Years and over | 82 (100.0%) | 77 (100.0%) |
| Total | 805 (78.8%) | 845 (75.6%) |
Income Below Poverty Among Married-Couple Families in Mart
The poverty statistics for married-couple families in Mart show that 8.1% or 27 of the total 332 families live below the poverty line. Families with 5 or more children have the highest poverty rate of 100.0%, comprising of 10 families. On the other hand, families with no children have the lowest poverty rate of 0.0%, which includes 0 families.
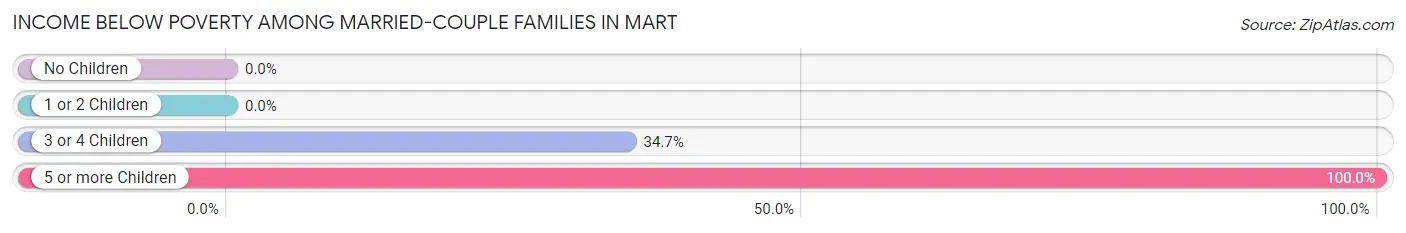
| Children | Above Poverty | Below Poverty |
| No Children | 161 (100.0%) | 0 (0.0%) |
| 1 or 2 Children | 112 (100.0%) | 0 (0.0%) |
| 3 or 4 Children | 32 (65.3%) | 17 (34.7%) |
| 5 or more Children | 0 (0.0%) | 10 (100.0%) |
| Total | 305 (91.9%) | 27 (8.1%) |
Income Below Poverty Among Single-Parent Households in Mart
According to the poverty data in Mart, 45.2% or 19 single-father households and 28.4% or 44 single-mother households are living below the poverty line. Among single-father households, those with 3 or 4 children have the highest poverty rate, with 6 households (100.0%) experiencing poverty. Likewise, among single-mother households, those with 3 or 4 children have the highest poverty rate, with 8 households (100.0%) falling below the poverty line.
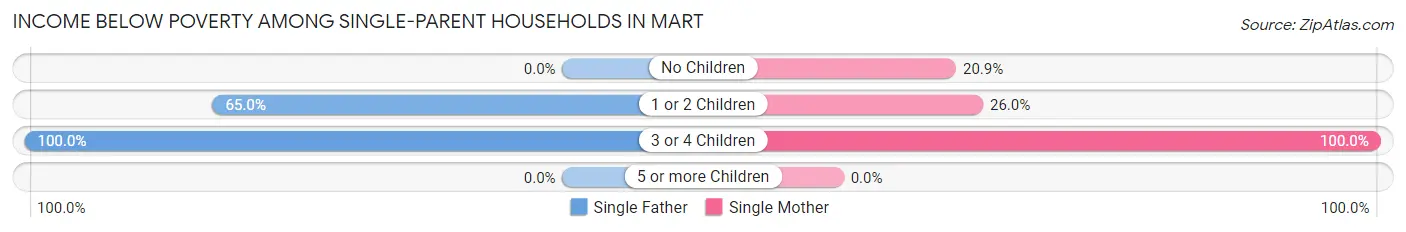
| Children | Single Father | Single Mother |
| No Children | 0 (0.0%) | 9 (20.9%) |
| 1 or 2 Children | 13 (65.0%) | 27 (26.0%) |
| 3 or 4 Children | 6 (100.0%) | 8 (100.0%) |
| 5 or more Children | 0 (0.0%) | 0 (0.0%) |
| Total | 19 (45.2%) | 44 (28.4%) |
Income Below Poverty Among Married-Couple vs Single-Parent Households in Mart
The poverty data for Mart shows that 27 of the married-couple family households (8.1%) and 63 of the single-parent households (32.0%) are living below the poverty level. Within the married-couple family households, those with 5 or more children have the highest poverty rate, with 10 households (100.0%) falling below the poverty line. Among the single-parent households, those with 3 or 4 children have the highest poverty rate, with 14 household (100.0%) living below poverty.
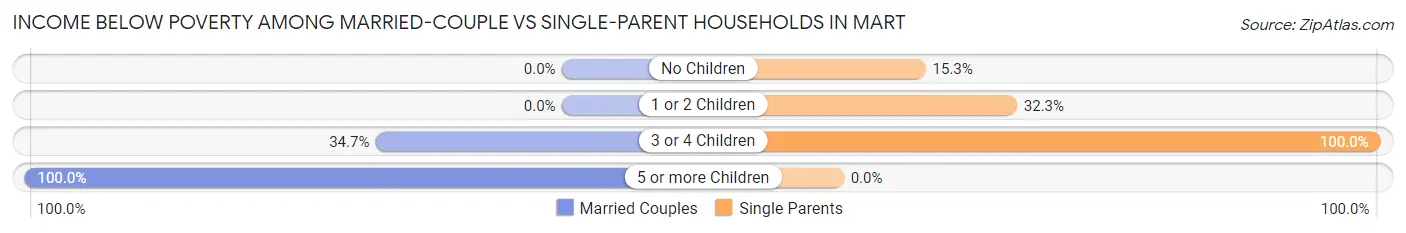
| Children | Married-Couple Families | Single-Parent Households |
| No Children | 0 (0.0%) | 9 (15.2%) |
| 1 or 2 Children | 0 (0.0%) | 40 (32.3%) |
| 3 or 4 Children | 17 (34.7%) | 14 (100.0%) |
| 5 or more Children | 10 (100.0%) | 0 (0.0%) |
| Total | 27 (8.1%) | 63 (32.0%) |
Race in Mart
The most populous races in Mart are White / Caucasian (1,296 | 59.5%), Black / African American (737 | 33.8%), and Hispanic or Latino (319 | 14.6%).
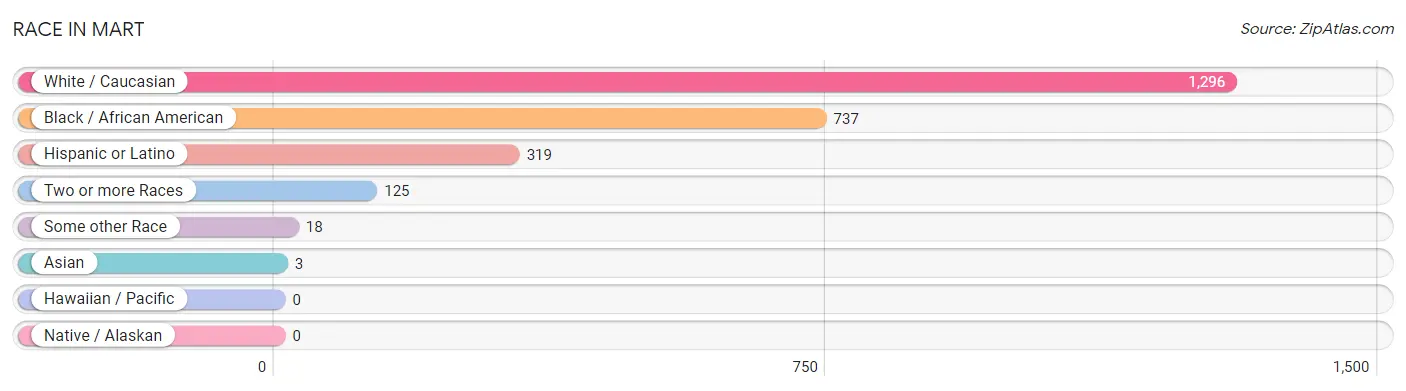
| Race | # Population | % Population |
| Asian | 3 | 0.1% |
| Black / African American | 737 | 33.8% |
| Hawaiian / Pacific | 0 | 0.0% |
| Hispanic or Latino | 319 | 14.6% |
| Native / Alaskan | 0 | 0.0% |
| White / Caucasian | 1,296 | 59.5% |
| Two or more Races | 125 | 5.7% |
| Some other Race | 18 | 0.8% |
| Total | 2,179 | 100.0% |
Ancestry in Mart
The most populous ancestries reported in Mart are German (315 | 14.5%), Mexican (287 | 13.2%), Irish (184 | 8.4%), English (133 | 6.1%), and African (86 | 4.0%), together accounting for 46.1% of all Mart residents.
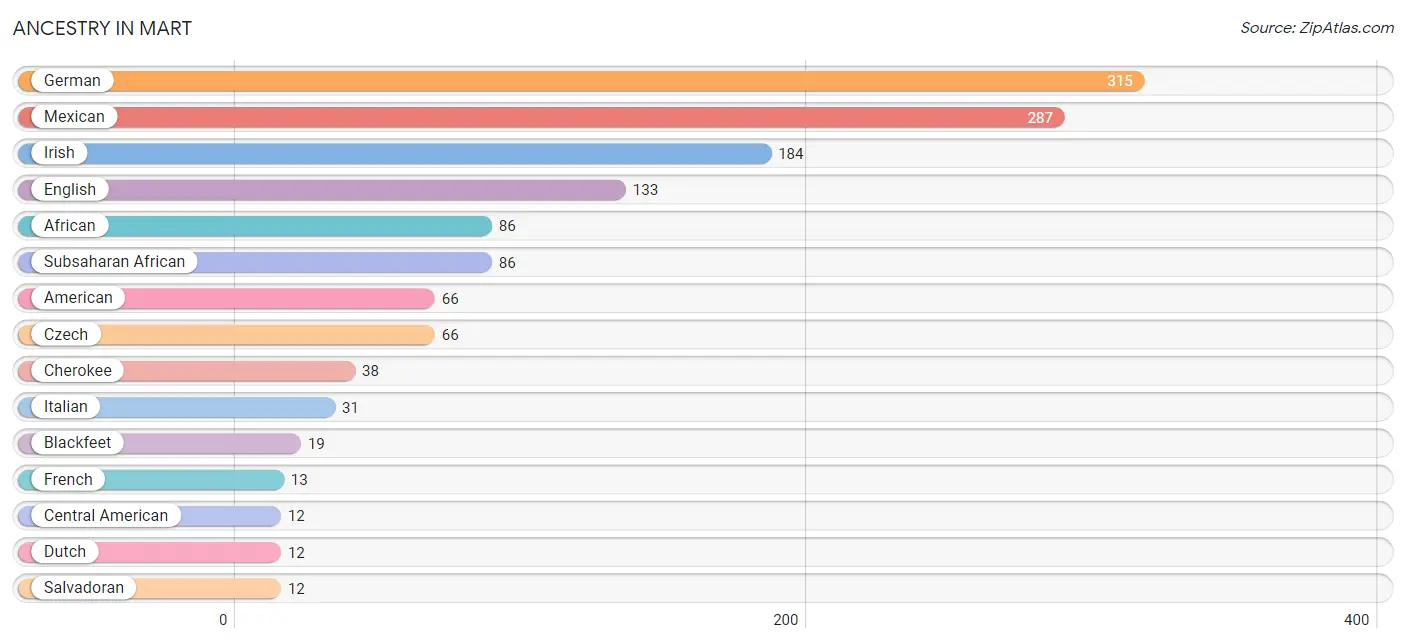
| Ancestry | # Population | % Population |
| African | 86 | 4.0% |
| American | 66 | 3.0% |
| Blackfeet | 19 | 0.9% |
| Central American | 12 | 0.5% |
| Cherokee | 38 | 1.7% |
| Choctaw | 2 | 0.1% |
| Czech | 66 | 3.0% |
| Dominican | 11 | 0.5% |
| Dutch | 12 | 0.5% |
| Eastern European | 2 | 0.1% |
| English | 133 | 6.1% |
| French | 13 | 0.6% |
| German | 315 | 14.5% |
| Hungarian | 3 | 0.1% |
| Irish | 184 | 8.4% |
| Italian | 31 | 1.4% |
| Korean | 3 | 0.1% |
| Mexican | 287 | 13.2% |
| Norwegian | 4 | 0.2% |
| Peruvian | 3 | 0.1% |
| Polish | 11 | 0.5% |
| Romanian | 4 | 0.2% |
| Russian | 11 | 0.5% |
| Salvadoran | 12 | 0.5% |
| Scotch-Irish | 12 | 0.5% |
| South American | 3 | 0.1% |
| Spaniard | 6 | 0.3% |
| Subsaharan African | 86 | 4.0% |
| Swedish | 5 | 0.2% |
| Welsh | 7 | 0.3% | View All 30 Rows |
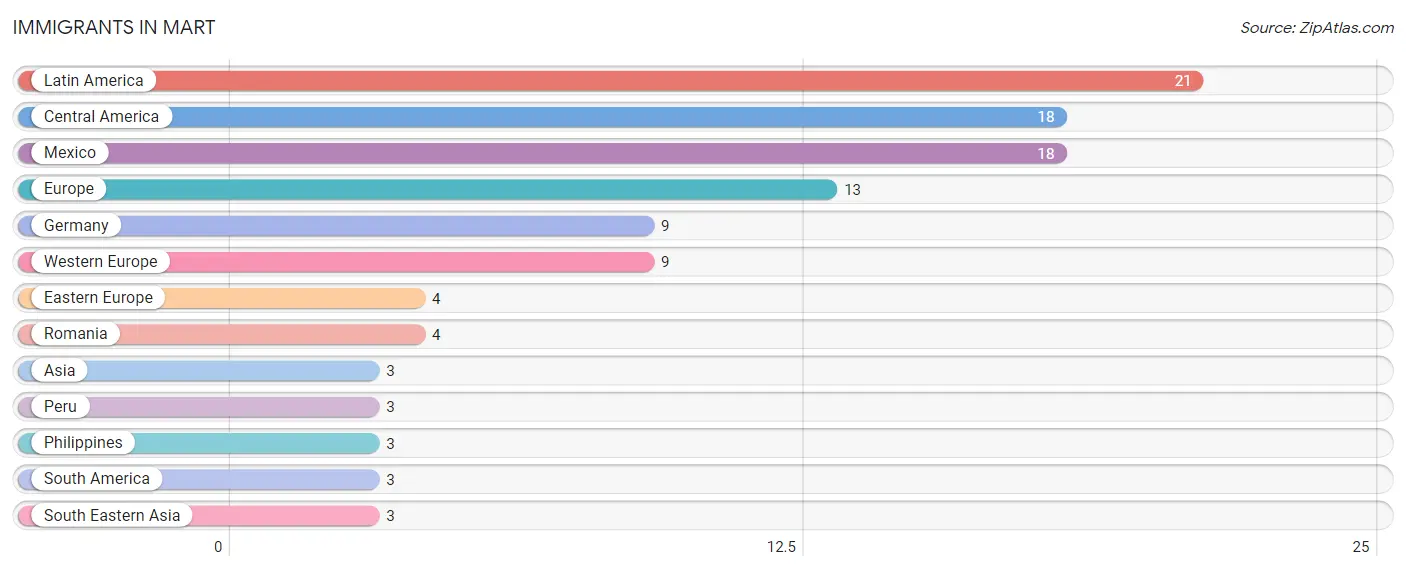
Immigrants in Mart
The most numerous immigrant groups reported in Mart came from Latin America (21 | 1.0%), Central America (18 | 0.8%), Mexico (18 | 0.8%), Europe (13 | 0.6%), and Germany (9 | 0.4%), together accounting for 3.6% of all Mart residents.
| Immigration Origin | # Population | % Population |
| Asia | 3 | 0.1% |
| Central America | 18 | 0.8% |
| Eastern Europe | 4 | 0.2% |
| Europe | 13 | 0.6% |
| Germany | 9 | 0.4% |
| Latin America | 21 | 1.0% |
| Mexico | 18 | 0.8% |
| Peru | 3 | 0.1% |
| Philippines | 3 | 0.1% |
| Romania | 4 | 0.2% |
| South America | 3 | 0.1% |
| South Eastern Asia | 3 | 0.1% |
| Western Europe | 9 | 0.4% | View All 13 Rows |
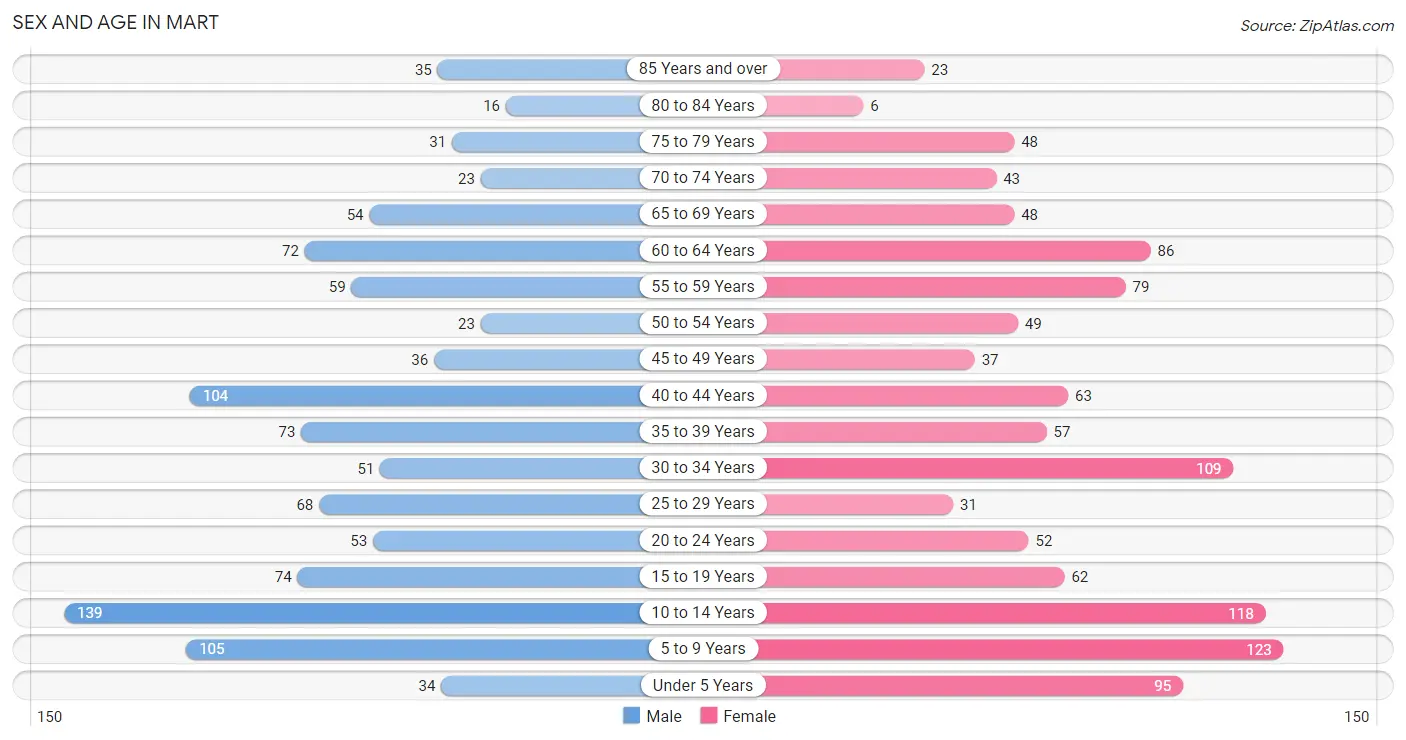
Sex and Age in Mart
Sex and Age in Mart
The most populous age groups in Mart are 10 to 14 Years (139 | 13.2%) for men and 5 to 9 Years (123 | 10.9%) for women.
| Age Bracket | Male | Female |
| Under 5 Years | 34 (3.2%) | 95 (8.4%) |
| 5 to 9 Years | 105 (10.0%) | 123 (10.9%) |
| 10 to 14 Years | 139 (13.2%) | 118 (10.4%) |
| 15 to 19 Years | 74 (7.0%) | 62 (5.5%) |
| 20 to 24 Years | 53 (5.1%) | 52 (4.6%) |
| 25 to 29 Years | 68 (6.5%) | 31 (2.8%) |
| 30 to 34 Years | 51 (4.9%) | 109 (9.7%) |
| 35 to 39 Years | 73 (7.0%) | 57 (5.1%) |
| 40 to 44 Years | 104 (9.9%) | 63 (5.6%) |
| 45 to 49 Years | 36 (3.4%) | 37 (3.3%) |
| 50 to 54 Years | 23 (2.2%) | 49 (4.3%) |
| 55 to 59 Years | 59 (5.6%) | 79 (7.0%) |
| 60 to 64 Years | 72 (6.9%) | 86 (7.6%) |
| 65 to 69 Years | 54 (5.1%) | 48 (4.3%) |
| 70 to 74 Years | 23 (2.2%) | 43 (3.8%) |
| 75 to 79 Years | 31 (2.9%) | 48 (4.3%) |
| 80 to 84 Years | 16 (1.5%) | 6 (0.5%) |
| 85 Years and over | 35 (3.3%) | 23 (2.0%) |
| Total | 1,050 (100.0%) | 1,129 (100.0%) |
Families and Households in Mart
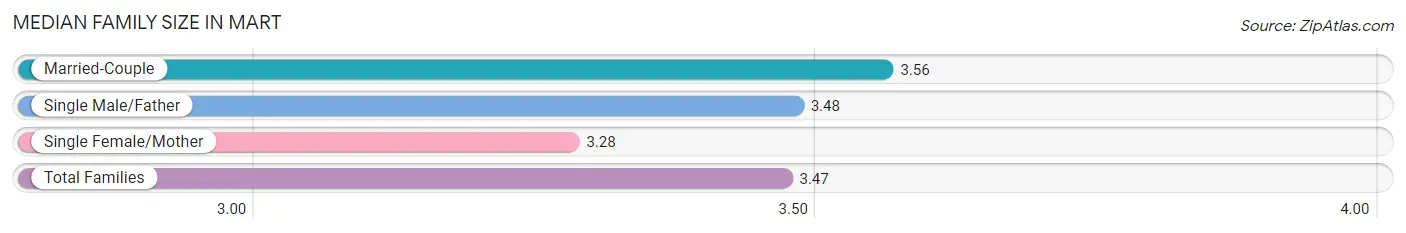
Median Family Size in Mart
The median family size in Mart is 3.47 persons per family, with married-couple families (332 | 62.8%) accounting for the largest median family size of 3.56 persons per family. On the other hand, single female/mother families (155 | 29.3%) represent the smallest median family size with 3.28 persons per family.
| Family Type | # Families | Family Size |
| Married-Couple | 332 (62.8%) | 3.56 |
| Single Male/Father | 42 (7.9%) | 3.48 |
| Single Female/Mother | 155 (29.3%) | 3.28 |
| Total Families | 529 (100.0%) | 3.47 |
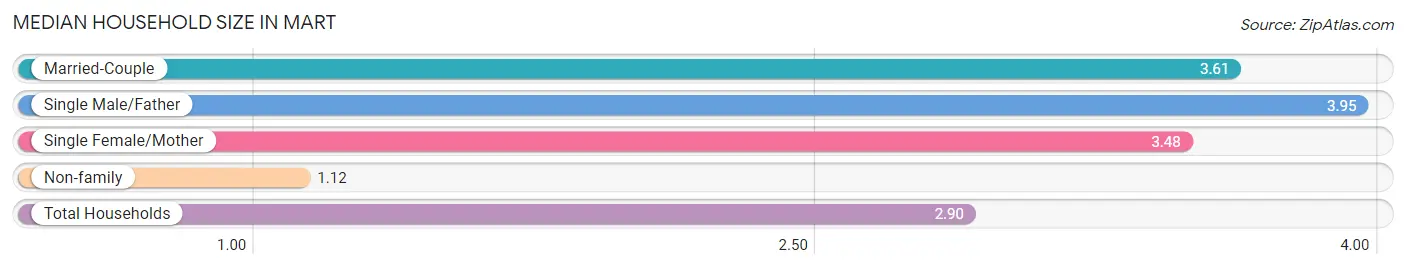
Median Household Size in Mart
The median household size in Mart is 2.90 persons per household, with single male/father households (42 | 5.7%) accounting for the largest median household size of 3.95 persons per household. non-family households (209 | 28.3%) represent the smallest median household size with 1.12 persons per household.
| Household Type | # Households | Household Size |
| Married-Couple | 332 (45.0%) | 3.61 |
| Single Male/Father | 42 (5.7%) | 3.95 |
| Single Female/Mother | 155 (21.0%) | 3.48 |
| Non-family | 209 (28.3%) | 1.12 |
| Total Households | 738 (100.0%) | 2.90 |
Household Size by Marriage Status in Mart
Out of a total of 738 households in Mart, 529 (71.7%) are family households, while 209 (28.3%) are nonfamily households. The most numerous type of family households are 3-person households, comprising 185, and the most common type of nonfamily households are 1-person households, comprising 189.
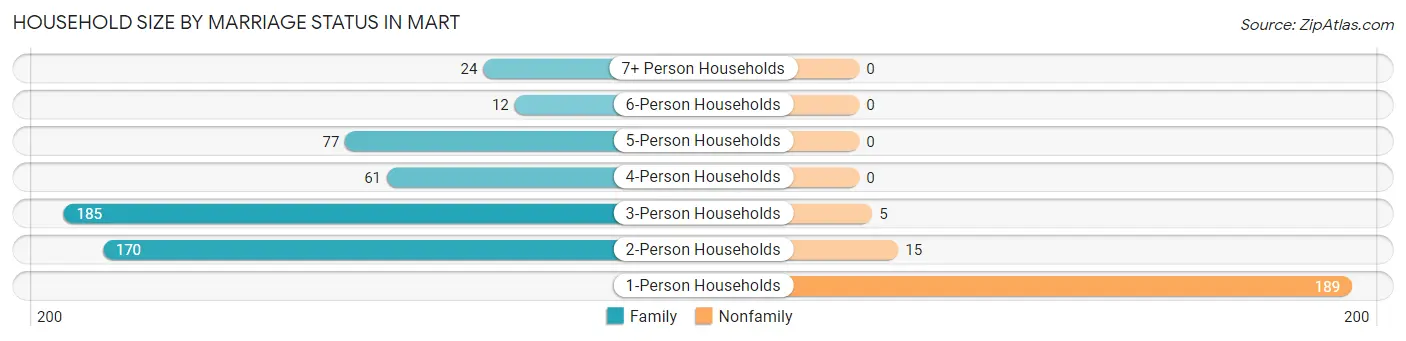
| Household Size | Family Households | Nonfamily Households |
| 1-Person Households | - | 189 (25.6%) |
| 2-Person Households | 170 (23.0%) | 15 (2.0%) |
| 3-Person Households | 185 (25.1%) | 5 (0.7%) |
| 4-Person Households | 61 (8.3%) | 0 (0.0%) |
| 5-Person Households | 77 (10.4%) | 0 (0.0%) |
| 6-Person Households | 12 (1.6%) | 0 (0.0%) |
| 7+ Person Households | 24 (3.3%) | 0 (0.0%) |
| Total | 529 (71.7%) | 209 (28.3%) |
Female Fertility in Mart
Fertility by Age in Mart
Average fertility rate in Mart is 31.0 births per 1,000 women. Women in the age bracket of 20 to 34 years have the highest fertility rate with 68.0 births per 1,000 women. Women in the age bracket of 20 to 34 years acount for 100.0% of all women with births.
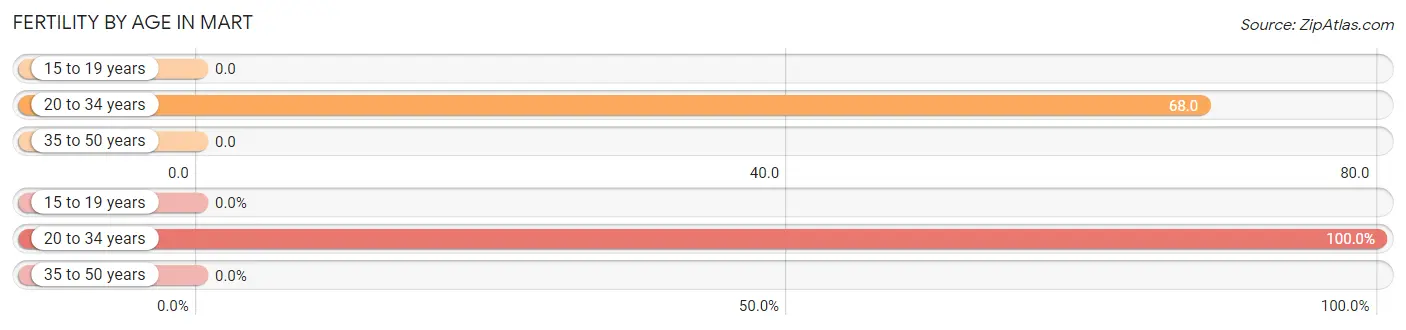
| Age Bracket | Women with Births | Births / 1,000 Women |
| 15 to 19 years | 0 (0.0%) | 0.0 |
| 20 to 34 years | 13 (100.0%) | 68.0 |
| 35 to 50 years | 0 (0.0%) | 0.0 |
| Total | 13 (100.0%) | 31.0 |
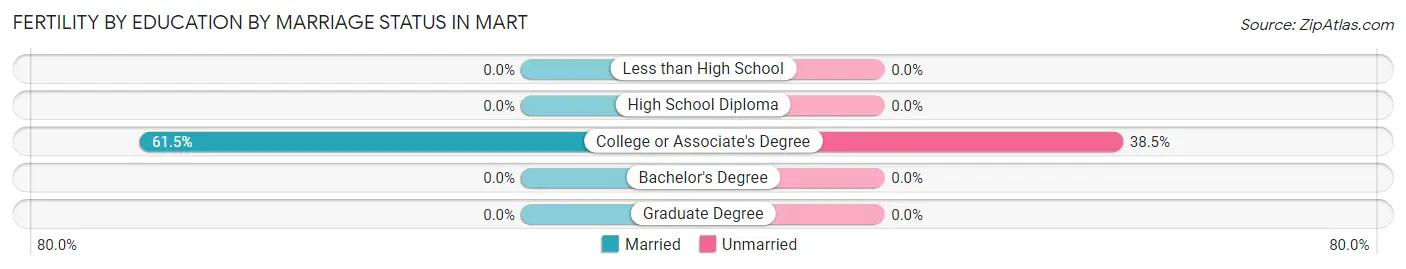
Fertility by Age by Marriage Status in Mart
61.5% of women with births (13) in Mart are married. The highest percentage of unmarried women with births falls into 20 to 34 years age bracket with 38.5% of them unmarried at the time of birth, while the lowest percentage of unmarried women with births belong to 20 to 34 years age bracket with 38.5% of them unmarried.
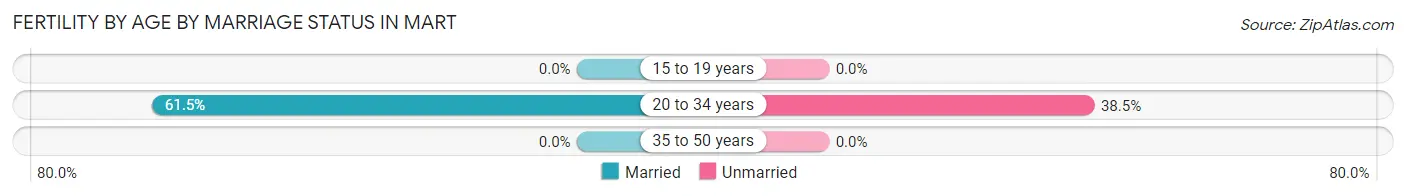
| Age Bracket | Married | Unmarried |
| 15 to 19 years | 0 (0.0%) | 0 (0.0%) |
| 20 to 34 years | 8 (61.5%) | 5 (38.5%) |
| 35 to 50 years | 0 (0.0%) | 0 (0.0%) |
| Total | 8 (61.5%) | 5 (38.5%) |
Fertility by Education in Mart
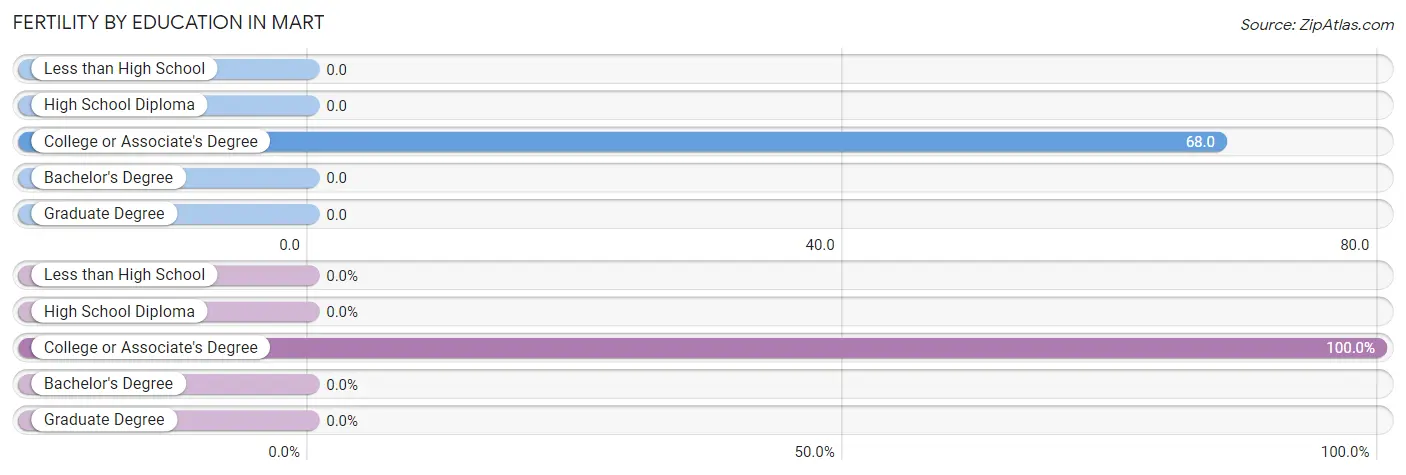
| Educational Attainment | Women with Births | Births / 1,000 Women |
| Less than High School | 0 (0.0%) | 0.0 |
| High School Diploma | 0 (0.0%) | 0.0 |
| College or Associate's Degree | 13 (100.0%) | 68.0 |
| Bachelor's Degree | 0 (0.0%) | 0.0 |
| Graduate Degree | 0 (0.0%) | 0.0 |
| Total | 13 (100.0%) | 31.0 |
Fertility by Education by Marriage Status in Mart
38.5% of women with births in Mart are unmarried. Women with the educational attainment of college or associate's degree are most likely to be married with 61.5% of them married at childbirth, while women with the educational attainment of college or associate's degree are least likely to be married with 38.5% of them unmarried at childbirth.
| Educational Attainment | Married | Unmarried |
| Less than High School | 0 (0.0%) | 0 (0.0%) |
| High School Diploma | 0 (0.0%) | 0 (0.0%) |
| College or Associate's Degree | 8 (61.5%) | 5 (38.5%) |
| Bachelor's Degree | 0 (0.0%) | 0 (0.0%) |
| Graduate Degree | 0 (0.0%) | 0 (0.0%) |
| Total | 8 (61.5%) | 5 (38.5%) |
Employment Characteristics in Mart
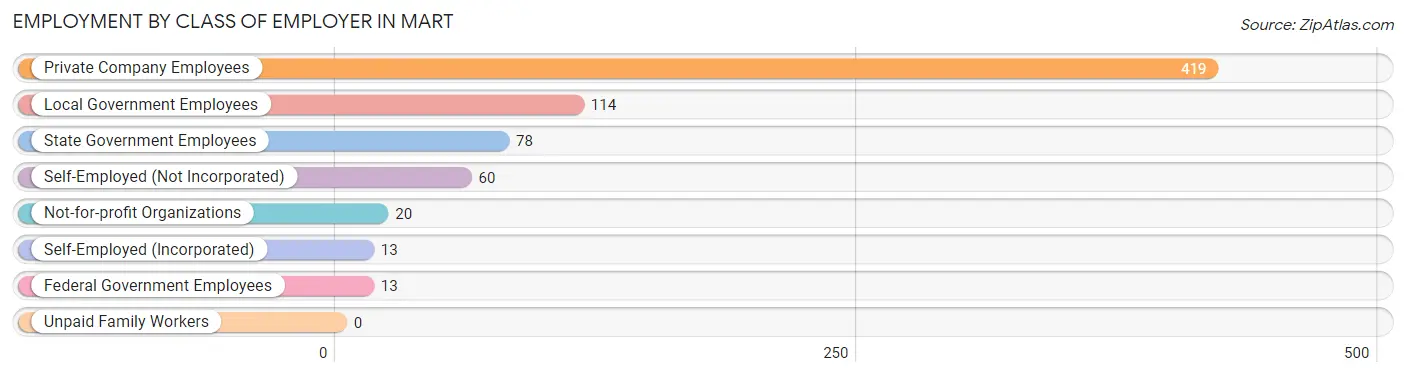
Employment by Class of Employer in Mart
Among the 717 employed individuals in Mart, private company employees (419 | 58.4%), local government employees (114 | 15.9%), and state government employees (78 | 10.9%) make up the most common classes of employment.
| Employer Class | # Employees | % Employees |
| Private Company Employees | 419 | 58.4% |
| Self-Employed (Incorporated) | 13 | 1.8% |
| Self-Employed (Not Incorporated) | 60 | 8.4% |
| Not-for-profit Organizations | 20 | 2.8% |
| Local Government Employees | 114 | 15.9% |
| State Government Employees | 78 | 10.9% |
| Federal Government Employees | 13 | 1.8% |
| Unpaid Family Workers | 0 | 0.0% |
| Total | 717 | 100.0% |
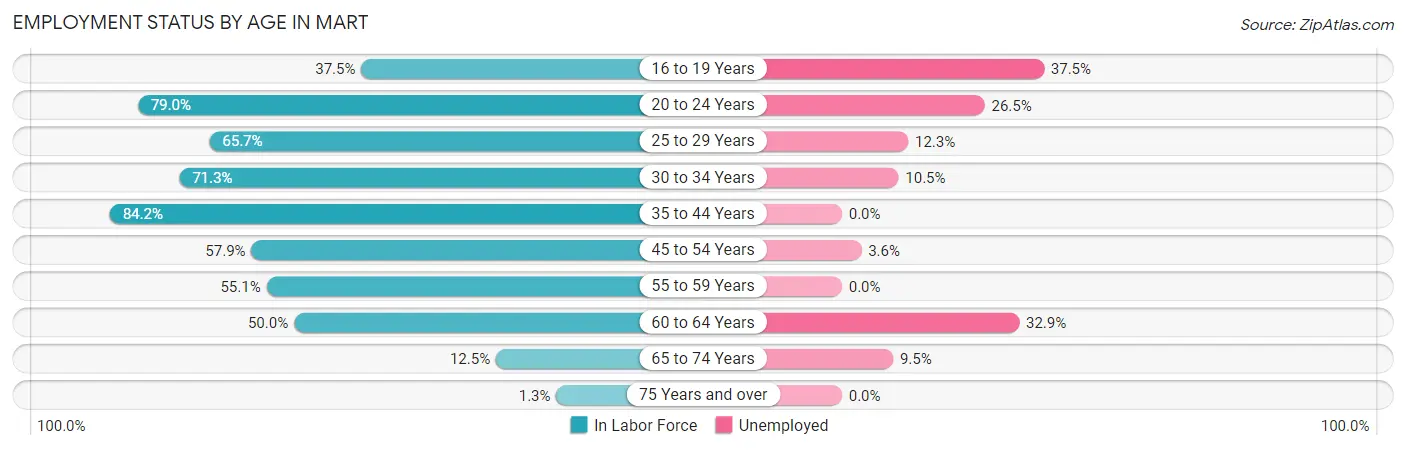
Employment Status by Age in Mart
According to the labor force statistics for Mart, out of the total population over 16 years of age (1,557), 52.8% or 822 individuals are in the labor force, with 11.1% or 91 of them unemployed. The age group with the highest labor force participation rate is 35 to 44 years, with 84.2% or 250 individuals in the labor force. Within the labor force, the 16 to 19 years age range has the highest percentage of unemployed individuals, with 37.5% or 18 of them being unemployed.
| Age Bracket | In Labor Force | Unemployed |
| 16 to 19 Years | 48 (37.5%) | 18 (37.5%) |
| 20 to 24 Years | 83 (79.0%) | 22 (26.5%) |
| 25 to 29 Years | 65 (65.7%) | 8 (12.3%) |
| 30 to 34 Years | 114 (71.3%) | 12 (10.5%) |
| 35 to 44 Years | 250 (84.2%) | 0 (0.0%) |
| 45 to 54 Years | 84 (57.9%) | 3 (3.6%) |
| 55 to 59 Years | 76 (55.1%) | 0 (0.0%) |
| 60 to 64 Years | 79 (50.0%) | 26 (32.9%) |
| 65 to 74 Years | 21 (12.5%) | 2 (9.5%) |
| 75 Years and over | 2 (1.3%) | 0 (0.0%) |
| Total | 822 (52.8%) | 91 (11.1%) |
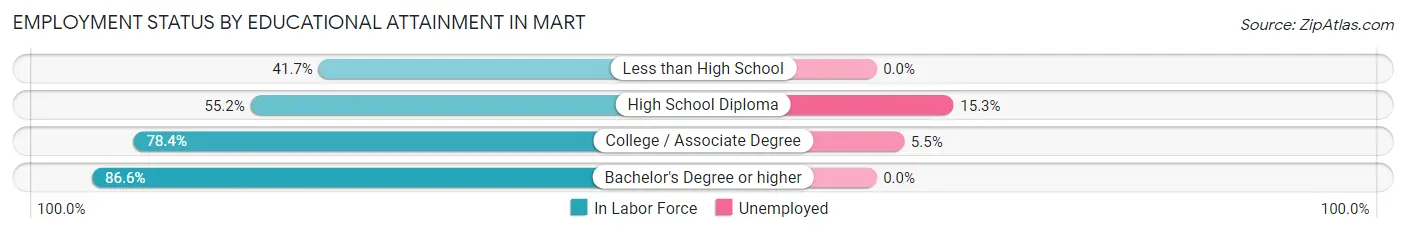
Employment Status by Educational Attainment in Mart
According to labor force statistics for Mart, 67.0% of individuals (668) out of the total population between 25 and 64 years of age (997) are in the labor force, with 7.3% or 49 of them being unemployed. The group with the highest labor force participation rate are those with the educational attainment of bachelor's degree or higher, with 86.6% or 97 individuals in the labor force. Within the labor force, individuals with high school diploma education have the highest percentage of unemployment, with 15.3% or 31 of them being unemployed.
| Educational Attainment | In Labor Force | Unemployed |
| Less than High School | 43 (41.7%) | 0 (0.0%) |
| High School Diploma | 202 (55.2%) | 56 (15.3%) |
| College / Associate Degree | 326 (78.4%) | 23 (5.5%) |
| Bachelor's Degree or higher | 97 (86.6%) | 0 (0.0%) |
| Total | 668 (67.0%) | 73 (7.3%) |
Employment Occupations by Sex in Mart
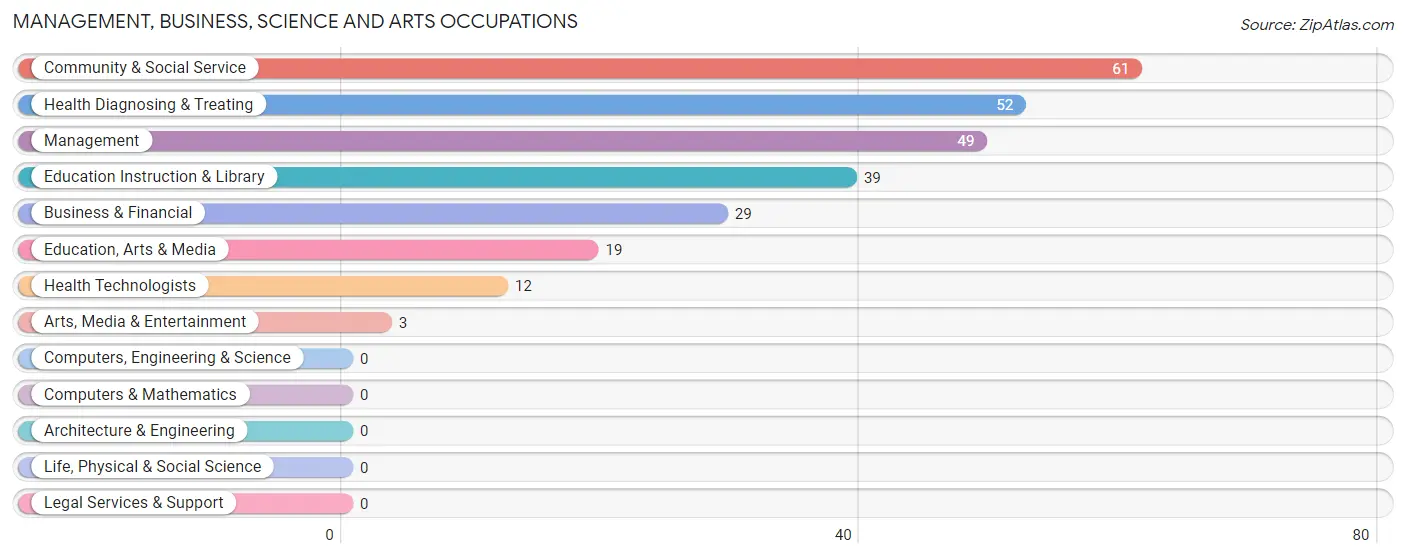
Management, Business, Science and Arts Occupations
The most common Management, Business, Science and Arts occupations in Mart are Community & Social Service (61 | 8.3%), Health Diagnosing & Treating (52 | 7.1%), Management (49 | 6.7%), Education Instruction & Library (39 | 5.3%), and Business & Financial (29 | 4.0%).
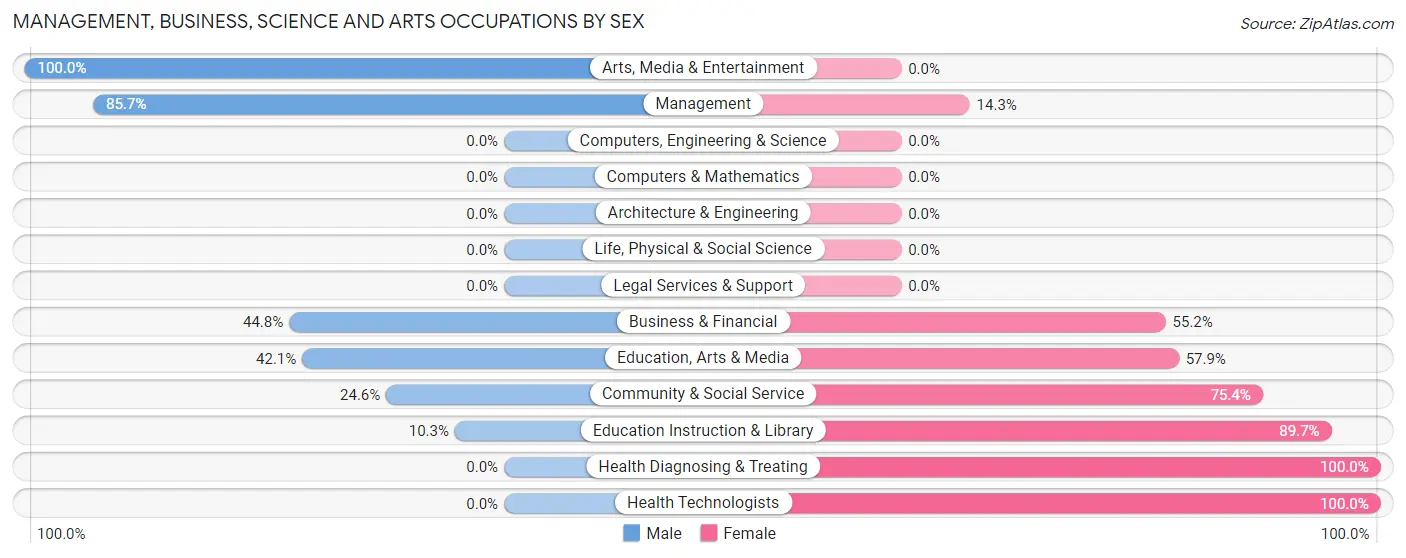
Management, Business, Science and Arts Occupations by Sex
Within the Management, Business, Science and Arts occupations in Mart, the most male-oriented occupations are Arts, Media & Entertainment (100.0%), Management (85.7%), and Business & Financial (44.8%), while the most female-oriented occupations are Health Diagnosing & Treating (100.0%), Health Technologists (100.0%), and Education Instruction & Library (89.7%).
| Occupation | Male | Female |
| Management | 42 (85.7%) | 7 (14.3%) |
| Business & Financial | 13 (44.8%) | 16 (55.2%) |
| Computers, Engineering & Science | 0 (0.0%) | 0 (0.0%) |
| Computers & Mathematics | 0 (0.0%) | 0 (0.0%) |
| Architecture & Engineering | 0 (0.0%) | 0 (0.0%) |
| Life, Physical & Social Science | 0 (0.0%) | 0 (0.0%) |
| Community & Social Service | 15 (24.6%) | 46 (75.4%) |
| Education, Arts & Media | 8 (42.1%) | 11 (57.9%) |
| Legal Services & Support | 0 (0.0%) | 0 (0.0%) |
| Education Instruction & Library | 4 (10.3%) | 35 (89.7%) |
| Arts, Media & Entertainment | 3 (100.0%) | 0 (0.0%) |
| Health Diagnosing & Treating | 0 (0.0%) | 52 (100.0%) |
| Health Technologists | 0 (0.0%) | 12 (100.0%) |
| Total (Category) | 70 (36.6%) | 121 (63.3%) |
| Total (Overall) | 412 (56.4%) | 319 (43.6%) |
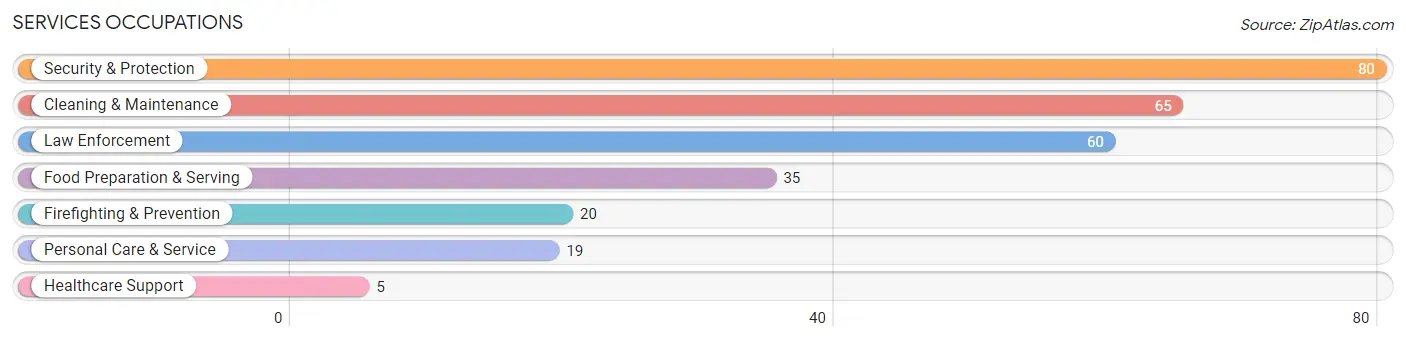
Services Occupations
The most common Services occupations in Mart are Security & Protection (80 | 10.9%), Cleaning & Maintenance (65 | 8.9%), Law Enforcement (60 | 8.2%), Food Preparation & Serving (35 | 4.8%), and Firefighting & Prevention (20 | 2.7%).
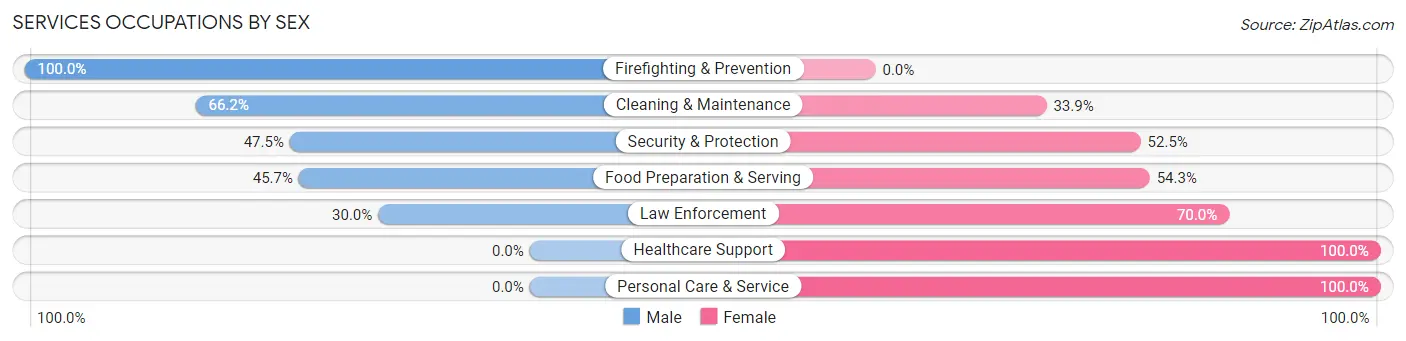
Services Occupations by Sex
Within the Services occupations in Mart, the most male-oriented occupations are Firefighting & Prevention (100.0%), Cleaning & Maintenance (66.1%), and Security & Protection (47.5%), while the most female-oriented occupations are Healthcare Support (100.0%), Personal Care & Service (100.0%), and Law Enforcement (70.0%).
| Occupation | Male | Female |
| Healthcare Support | 0 (0.0%) | 5 (100.0%) |
| Security & Protection | 38 (47.5%) | 42 (52.5%) |
| Firefighting & Prevention | 20 (100.0%) | 0 (0.0%) |
| Law Enforcement | 18 (30.0%) | 42 (70.0%) |
| Food Preparation & Serving | 16 (45.7%) | 19 (54.3%) |
| Cleaning & Maintenance | 43 (66.1%) | 22 (33.9%) |
| Personal Care & Service | 0 (0.0%) | 19 (100.0%) |
| Total (Category) | 97 (47.5%) | 107 (52.4%) |
| Total (Overall) | 412 (56.4%) | 319 (43.6%) |
Sales and Office Occupations
The most common Sales and Office occupations in Mart are Office & Administration (52 | 7.1%), and Sales & Related (24 | 3.3%).

Sales and Office Occupations by Sex

| Occupation | Male | Female |
| Sales & Related | 16 (66.7%) | 8 (33.3%) |
| Office & Administration | 13 (25.0%) | 39 (75.0%) |
| Total (Category) | 29 (38.2%) | 47 (61.8%) |
| Total (Overall) | 412 (56.4%) | 319 (43.6%) |
Natural Resources, Construction and Maintenance Occupations
The most common Natural Resources, Construction and Maintenance occupations in Mart are Construction & Extraction (57 | 7.8%), and Installation, Maintenance & Repair (30 | 4.1%).
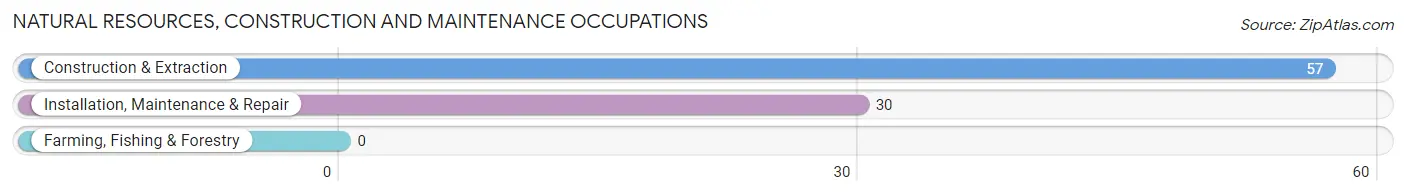
Natural Resources, Construction and Maintenance Occupations by Sex

| Occupation | Male | Female |
| Farming, Fishing & Forestry | 0 (0.0%) | 0 (0.0%) |
| Construction & Extraction | 40 (70.2%) | 17 (29.8%) |
| Installation, Maintenance & Repair | 30 (100.0%) | 0 (0.0%) |
| Total (Category) | 70 (80.5%) | 17 (19.5%) |
| Total (Overall) | 412 (56.4%) | 319 (43.6%) |
Production, Transportation and Moving Occupations
The most common Production, Transportation and Moving occupations in Mart are Material Moving (90 | 12.3%), Production (55 | 7.5%), and Transportation (28 | 3.8%).
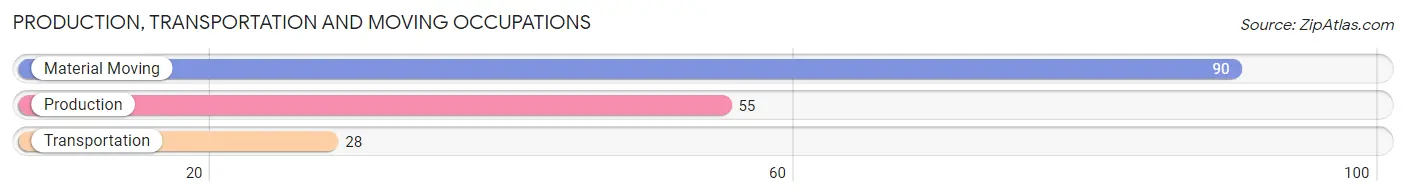
Production, Transportation and Moving Occupations by Sex
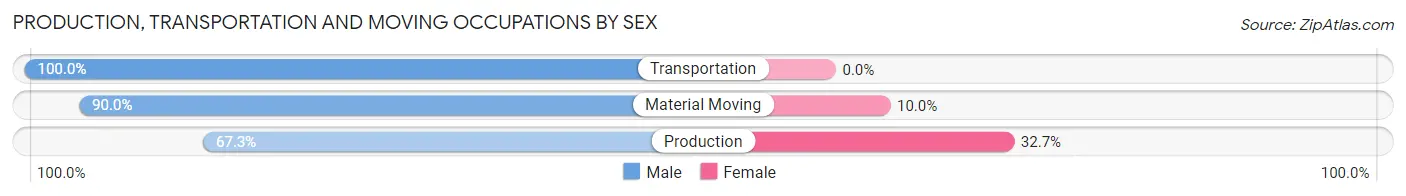
| Occupation | Male | Female |
| Production | 37 (67.3%) | 18 (32.7%) |
| Transportation | 28 (100.0%) | 0 (0.0%) |
| Material Moving | 81 (90.0%) | 9 (10.0%) |
| Total (Category) | 146 (84.4%) | 27 (15.6%) |
| Total (Overall) | 412 (56.4%) | 319 (43.6%) |
Employment Industries by Sex in Mart
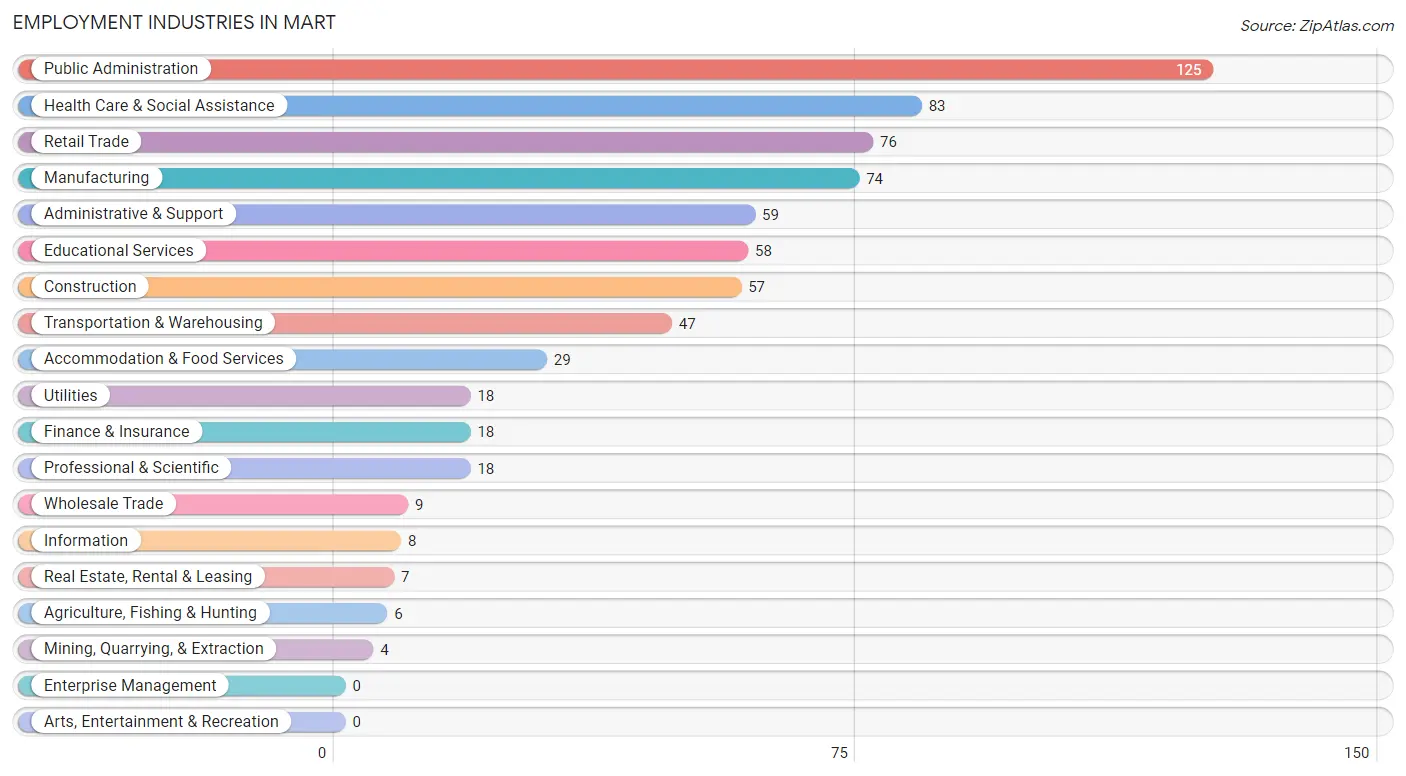
Employment Industries in Mart
The major employment industries in Mart include Public Administration (125 | 17.1%), Health Care & Social Assistance (83 | 11.4%), Retail Trade (76 | 10.4%), Manufacturing (74 | 10.1%), and Administrative & Support (59 | 8.1%).
Employment Industries by Sex in Mart
The Mart industries that see more men than women are Agriculture, Fishing & Hunting (100.0%), Mining, Quarrying, & Extraction (100.0%), and Wholesale Trade (100.0%), whereas the industries that tend to have a higher number of women are Finance & Insurance (100.0%), Real Estate, Rental & Leasing (100.0%), and Health Care & Social Assistance (97.6%).
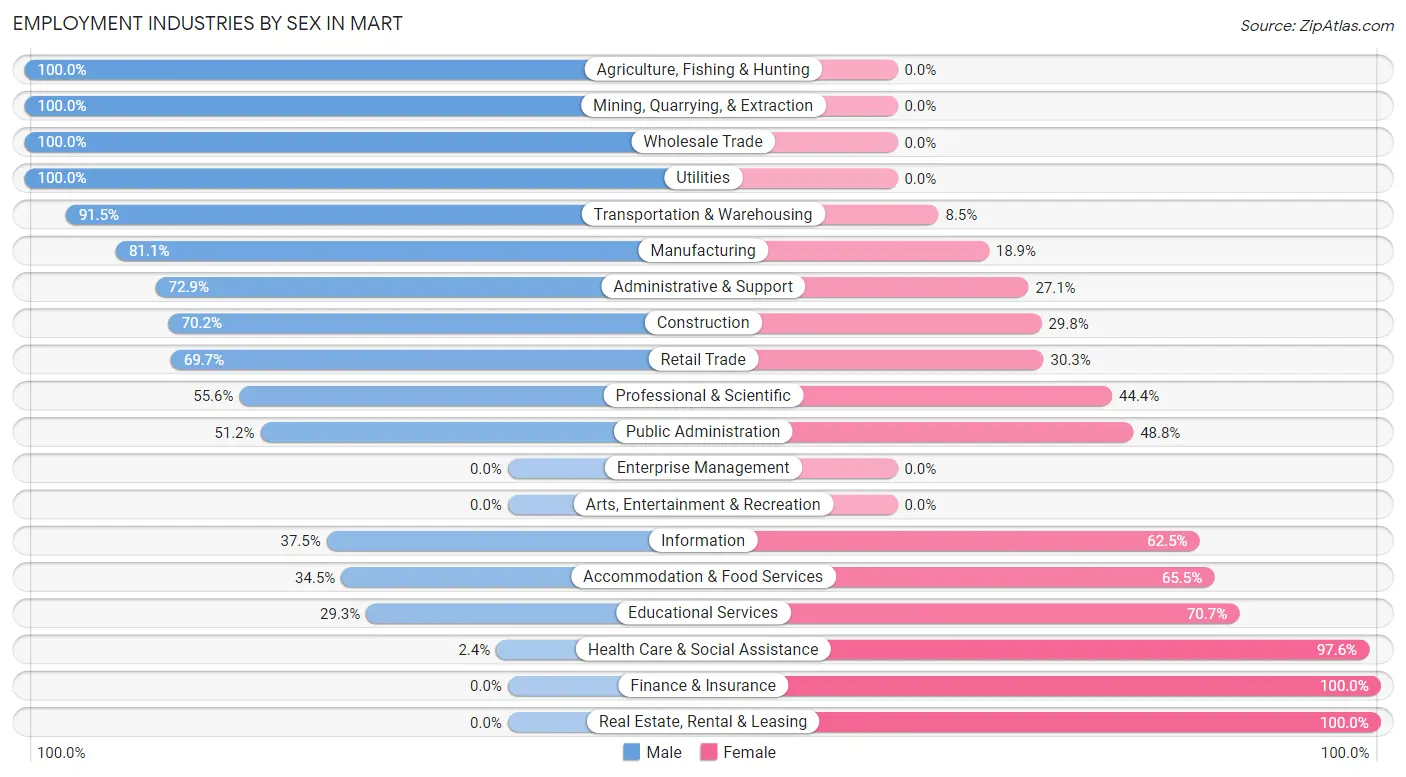
| Industry | Male | Female |
| Agriculture, Fishing & Hunting | 6 (100.0%) | 0 (0.0%) |
| Mining, Quarrying, & Extraction | 4 (100.0%) | 0 (0.0%) |
| Construction | 40 (70.2%) | 17 (29.8%) |
| Manufacturing | 60 (81.1%) | 14 (18.9%) |
| Wholesale Trade | 9 (100.0%) | 0 (0.0%) |
| Retail Trade | 53 (69.7%) | 23 (30.3%) |
| Transportation & Warehousing | 43 (91.5%) | 4 (8.5%) |
| Utilities | 18 (100.0%) | 0 (0.0%) |
| Information | 3 (37.5%) | 5 (62.5%) |
| Finance & Insurance | 0 (0.0%) | 18 (100.0%) |
| Real Estate, Rental & Leasing | 0 (0.0%) | 7 (100.0%) |
| Professional & Scientific | 10 (55.6%) | 8 (44.4%) |
| Enterprise Management | 0 (0.0%) | 0 (0.0%) |
| Administrative & Support | 43 (72.9%) | 16 (27.1%) |
| Educational Services | 17 (29.3%) | 41 (70.7%) |
| Health Care & Social Assistance | 2 (2.4%) | 81 (97.6%) |
| Arts, Entertainment & Recreation | 0 (0.0%) | 0 (0.0%) |
| Accommodation & Food Services | 10 (34.5%) | 19 (65.5%) |
| Public Administration | 64 (51.2%) | 61 (48.8%) |
| Total | 412 (56.4%) | 319 (43.6%) |
Education in Mart
School Enrollment in Mart
The most common levels of schooling among the 645 students in Mart are elementary school (187 | 29.0%), middle school (178 | 27.6%), and high school (116 | 18.0%).
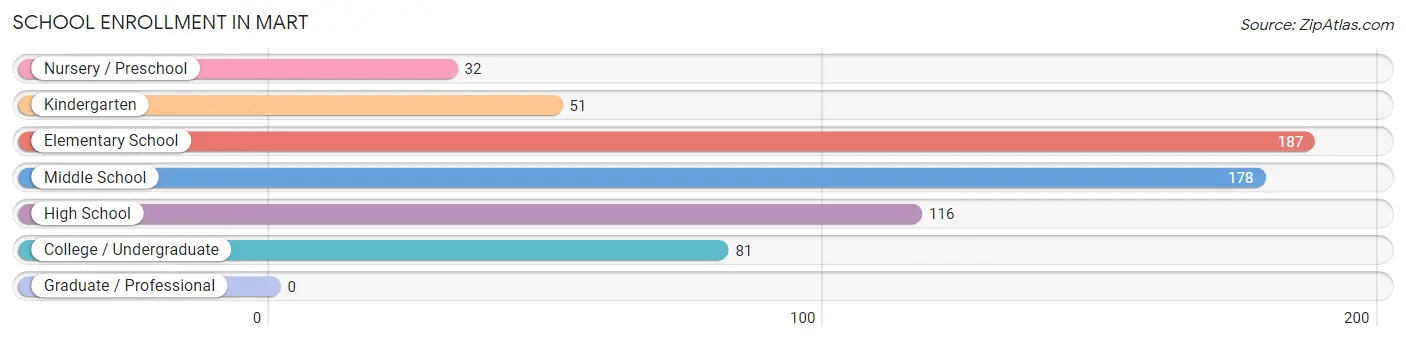
| School Level | # Students | % Students |
| Nursery / Preschool | 32 | 5.0% |
| Kindergarten | 51 | 7.9% |
| Elementary School | 187 | 29.0% |
| Middle School | 178 | 27.6% |
| High School | 116 | 18.0% |
| College / Undergraduate | 81 | 12.6% |
| Graduate / Professional | 0 | 0.0% |
| Total | 645 | 100.0% |
School Enrollment by Age by Funding Source in Mart
Out of a total of 645 students who are enrolled in schools in Mart, 17 (2.6%) attend a private institution, while the remaining 628 (97.4%) are enrolled in public schools. The age group of 20 to 24 year olds has the highest likelihood of being enrolled in private schools, with 4 (14.8% in the age bracket) enrolled. Conversely, the age group of 3 to 4 year olds has the lowest likelihood of being enrolled in a private school, with 11 (100.0% in the age bracket) attending a public institution.
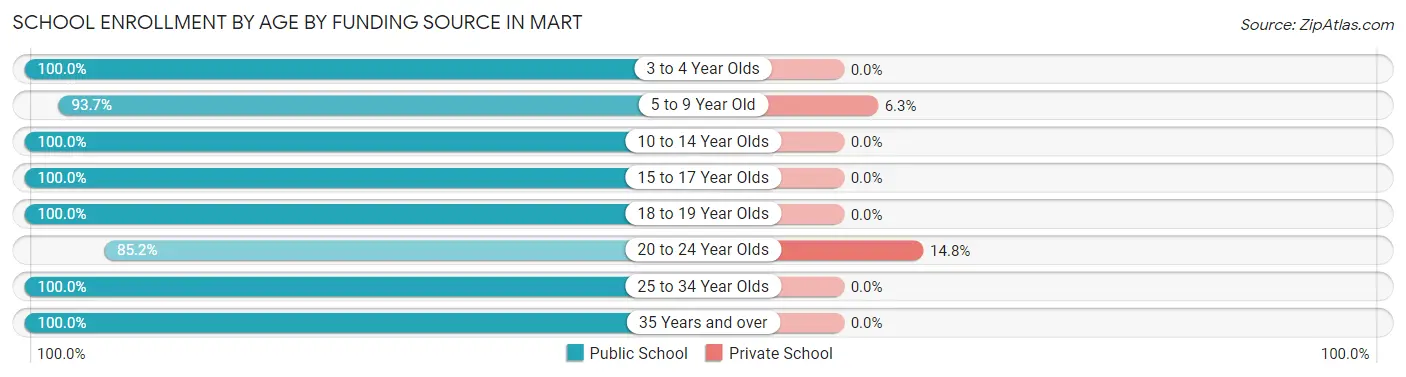
| Age Bracket | Public School | Private School |
| 3 to 4 Year Olds | 11 (100.0%) | 0 (0.0%) |
| 5 to 9 Year Old | 192 (93.7%) | 13 (6.3%) |
| 10 to 14 Year Olds | 256 (100.0%) | 0 (0.0%) |
| 15 to 17 Year Olds | 90 (100.0%) | 0 (0.0%) |
| 18 to 19 Year Olds | 15 (100.0%) | 0 (0.0%) |
| 20 to 24 Year Olds | 23 (85.2%) | 4 (14.8%) |
| 25 to 34 Year Olds | 20 (100.0%) | 0 (0.0%) |
| 35 Years and over | 21 (100.0%) | 0 (0.0%) |
| Total | 628 (97.4%) | 17 (2.6%) |
Educational Attainment by Field of Study in Mart
Education (37 | 24.8%), business (30 | 20.1%), arts & humanities (24 | 16.1%), bio, nature & agricultural (17 | 11.4%), and psychology (14 | 9.4%) are the most common fields of study among 149 individuals in Mart who have obtained a bachelor's degree or higher.
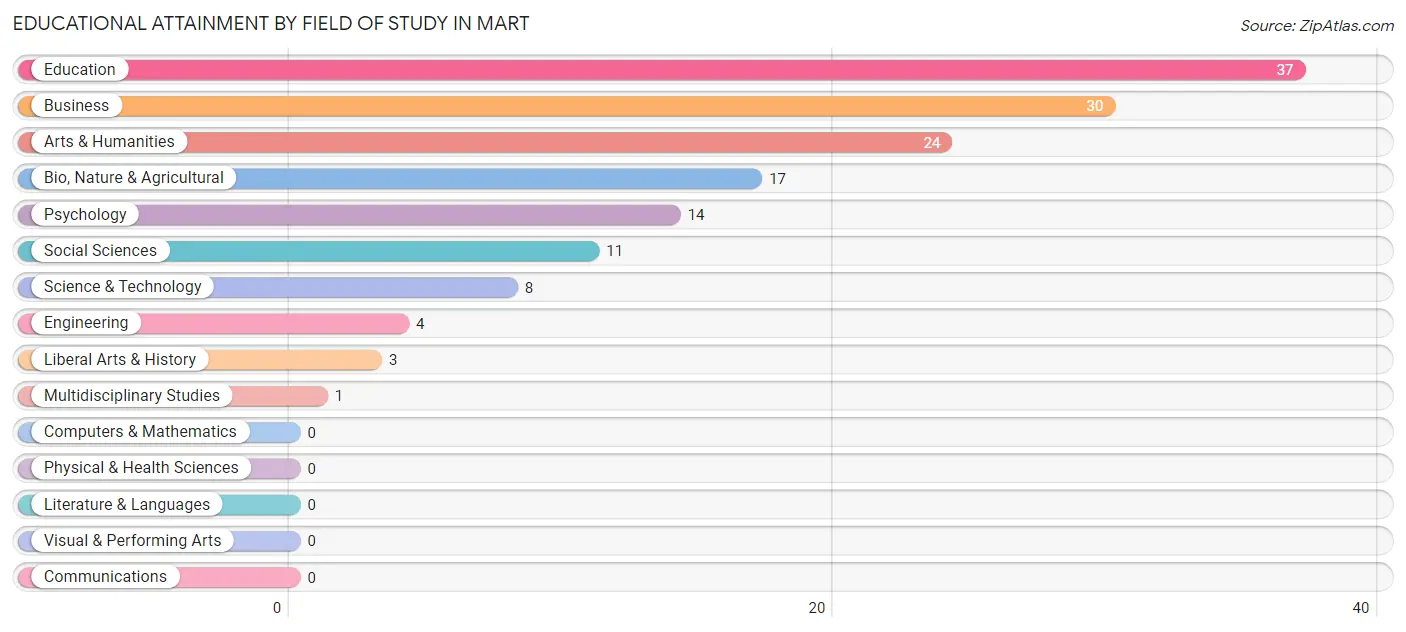
| Field of Study | # Graduates | % Graduates |
| Computers & Mathematics | 0 | 0.0% |
| Bio, Nature & Agricultural | 17 | 11.4% |
| Physical & Health Sciences | 0 | 0.0% |
| Psychology | 14 | 9.4% |
| Social Sciences | 11 | 7.4% |
| Engineering | 4 | 2.7% |
| Multidisciplinary Studies | 1 | 0.7% |
| Science & Technology | 8 | 5.4% |
| Business | 30 | 20.1% |
| Education | 37 | 24.8% |
| Literature & Languages | 0 | 0.0% |
| Liberal Arts & History | 3 | 2.0% |
| Visual & Performing Arts | 0 | 0.0% |
| Communications | 0 | 0.0% |
| Arts & Humanities | 24 | 16.1% |
| Total | 149 | 100.0% |
Transportation & Commute in Mart
Vehicle Availability by Sex in Mart
The most prevalent vehicle ownership categories in Mart are males with 2 vehicles (171, accounting for 41.9%) and females with 2 vehicles (123, making up 55.3%).
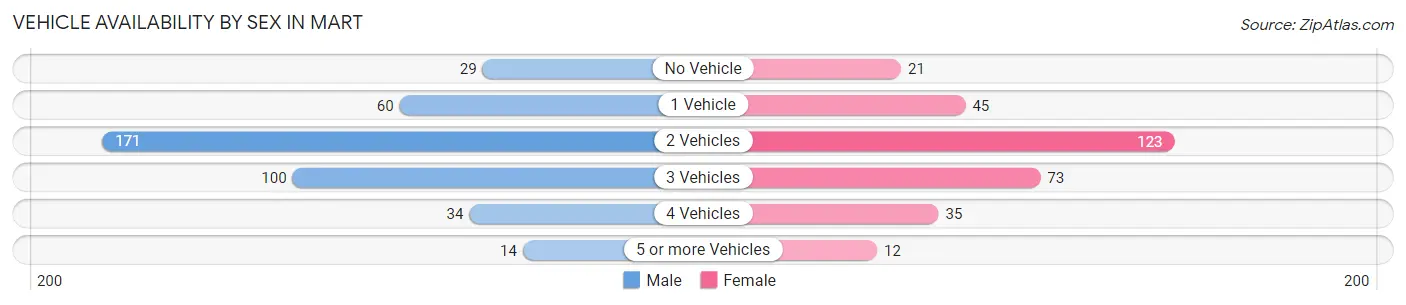
| Vehicles Available | Male | Female |
| No Vehicle | 29 (7.1%) | 21 (6.8%) |
| 1 Vehicle | 60 (14.7%) | 45 (14.6%) |
| 2 Vehicles | 171 (41.9%) | 123 (39.8%) |
| 3 Vehicles | 100 (24.5%) | 73 (23.6%) |
| 4 Vehicles | 34 (8.3%) | 35 (11.3%) |
| 5 or more Vehicles | 14 (3.4%) | 12 (3.9%) |
| Total | 408 (100.0%) | 309 (100.0%) |
Commute Time in Mart
The most frequently occuring commute durations in Mart are 30 to 34 minutes (213 commuters, 31.2%), 25 to 29 minutes (85 commuters, 12.4%), and 20 to 24 minutes (72 commuters, 10.5%).
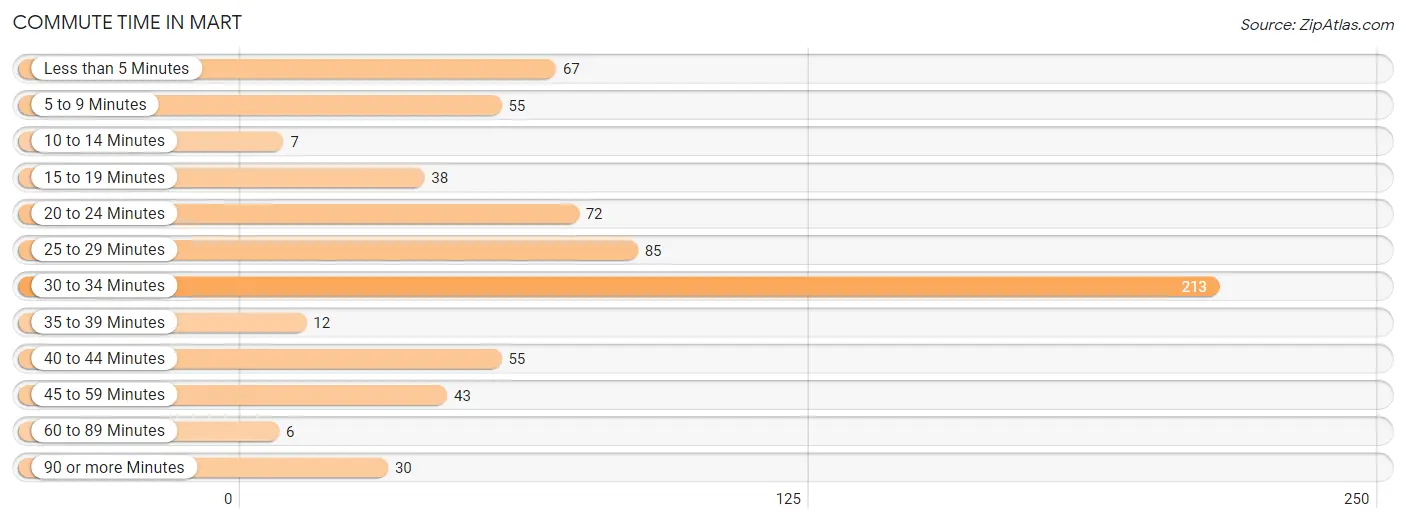
| Commute Time | # Commuters | % Commuters |
| Less than 5 Minutes | 67 | 9.8% |
| 5 to 9 Minutes | 55 | 8.1% |
| 10 to 14 Minutes | 7 | 1.0% |
| 15 to 19 Minutes | 38 | 5.6% |
| 20 to 24 Minutes | 72 | 10.5% |
| 25 to 29 Minutes | 85 | 12.4% |
| 30 to 34 Minutes | 213 | 31.2% |
| 35 to 39 Minutes | 12 | 1.8% |
| 40 to 44 Minutes | 55 | 8.1% |
| 45 to 59 Minutes | 43 | 6.3% |
| 60 to 89 Minutes | 6 | 0.9% |
| 90 or more Minutes | 30 | 4.4% |
Commute Time by Sex in Mart
The most common commute times in Mart are 30 to 34 minutes (96 commuters, 24.9%) for males and 30 to 34 minutes (117 commuters, 39.4%) for females.
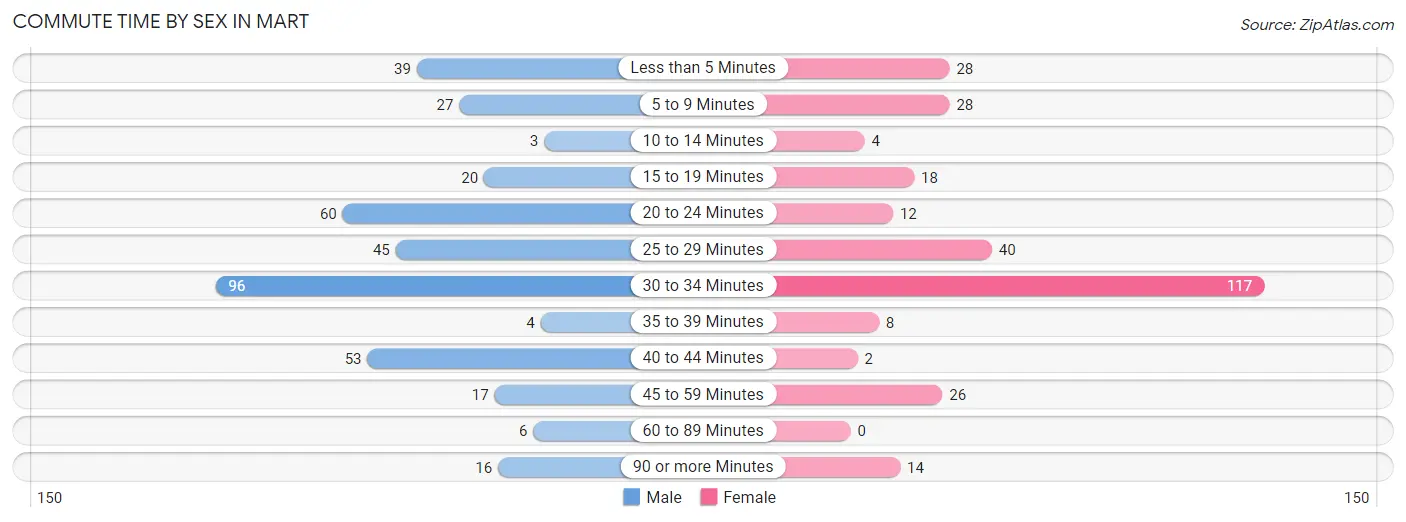
| Commute Time | Male | Female |
| Less than 5 Minutes | 39 (10.1%) | 28 (9.4%) |
| 5 to 9 Minutes | 27 (7.0%) | 28 (9.4%) |
| 10 to 14 Minutes | 3 (0.8%) | 4 (1.3%) |
| 15 to 19 Minutes | 20 (5.2%) | 18 (6.1%) |
| 20 to 24 Minutes | 60 (15.5%) | 12 (4.0%) |
| 25 to 29 Minutes | 45 (11.7%) | 40 (13.5%) |
| 30 to 34 Minutes | 96 (24.9%) | 117 (39.4%) |
| 35 to 39 Minutes | 4 (1.0%) | 8 (2.7%) |
| 40 to 44 Minutes | 53 (13.7%) | 2 (0.7%) |
| 45 to 59 Minutes | 17 (4.4%) | 26 (8.7%) |
| 60 to 89 Minutes | 6 (1.5%) | 0 (0.0%) |
| 90 or more Minutes | 16 (4.2%) | 14 (4.7%) |
Time of Departure to Work by Sex in Mart
The most frequent times of departure to work in Mart are 7:00 AM to 7:29 AM (102, 26.4%) for males and 7:00 AM to 7:29 AM (66, 22.2%) for females.
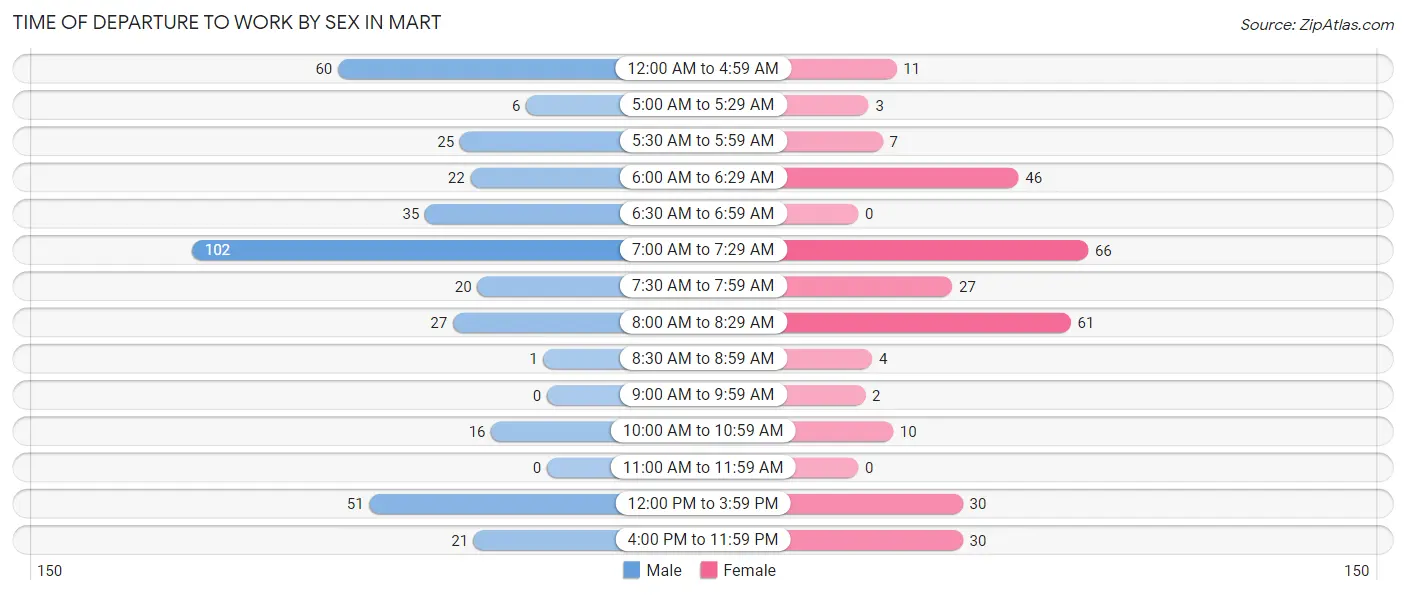
| Time of Departure | Male | Female |
| 12:00 AM to 4:59 AM | 60 (15.5%) | 11 (3.7%) |
| 5:00 AM to 5:29 AM | 6 (1.5%) | 3 (1.0%) |
| 5:30 AM to 5:59 AM | 25 (6.5%) | 7 (2.4%) |
| 6:00 AM to 6:29 AM | 22 (5.7%) | 46 (15.5%) |
| 6:30 AM to 6:59 AM | 35 (9.1%) | 0 (0.0%) |
| 7:00 AM to 7:29 AM | 102 (26.4%) | 66 (22.2%) |
| 7:30 AM to 7:59 AM | 20 (5.2%) | 27 (9.1%) |
| 8:00 AM to 8:29 AM | 27 (7.0%) | 61 (20.5%) |
| 8:30 AM to 8:59 AM | 1 (0.3%) | 4 (1.3%) |
| 9:00 AM to 9:59 AM | 0 (0.0%) | 2 (0.7%) |
| 10:00 AM to 10:59 AM | 16 (4.2%) | 10 (3.4%) |
| 11:00 AM to 11:59 AM | 0 (0.0%) | 0 (0.0%) |
| 12:00 PM to 3:59 PM | 51 (13.2%) | 30 (10.1%) |
| 4:00 PM to 11:59 PM | 21 (5.4%) | 30 (10.1%) |
| Total | 386 (100.0%) | 297 (100.0%) |
Housing Occupancy in Mart
Occupancy by Ownership in Mart
Of the total 738 dwellings in Mart, owner-occupied units account for 461 (62.5%), while renter-occupied units make up 277 (37.5%).
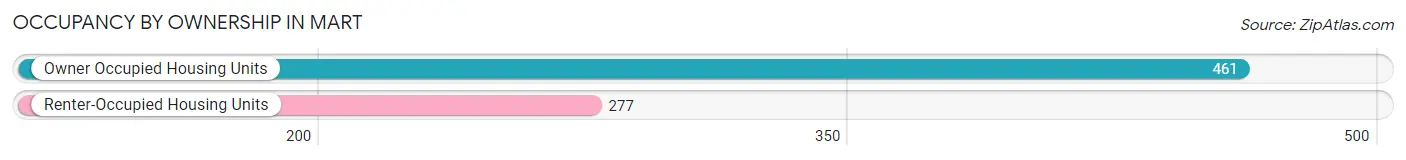
| Occupancy | # Housing Units | % Housing Units |
| Owner Occupied Housing Units | 461 | 62.5% |
| Renter-Occupied Housing Units | 277 | 37.5% |
| Total Occupied Housing Units | 738 | 100.0% |
Occupancy by Household Size in Mart
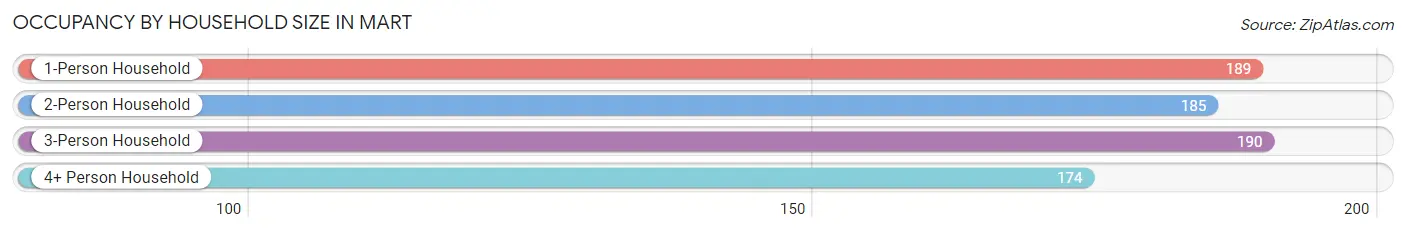
| Household Size | # Housing Units | % Housing Units |
| 1-Person Household | 189 | 25.6% |
| 2-Person Household | 185 | 25.1% |
| 3-Person Household | 190 | 25.8% |
| 4+ Person Household | 174 | 23.6% |
| Total Housing Units | 738 | 100.0% |
Occupancy by Ownership by Household Size in Mart
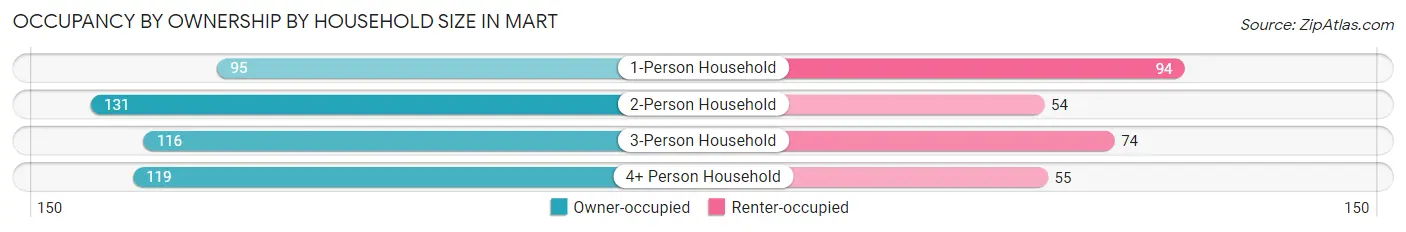
| Household Size | Owner-occupied | Renter-occupied |
| 1-Person Household | 95 (50.3%) | 94 (49.7%) |
| 2-Person Household | 131 (70.8%) | 54 (29.2%) |
| 3-Person Household | 116 (61.1%) | 74 (39.0%) |
| 4+ Person Household | 119 (68.4%) | 55 (31.6%) |
| Total Housing Units | 461 (62.5%) | 277 (37.5%) |
Occupancy by Educational Attainment in Mart
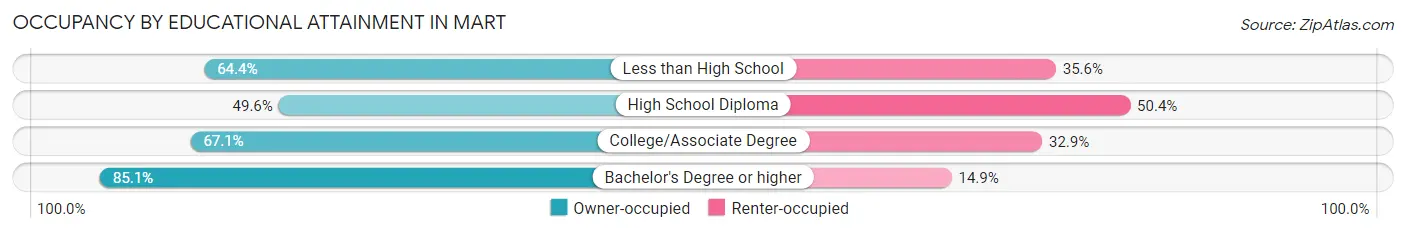
| Household Size | Owner-occupied | Renter-occupied |
| Less than High School | 47 (64.4%) | 26 (35.6%) |
| High School Diploma | 136 (49.6%) | 138 (50.4%) |
| College/Associate Degree | 204 (67.1%) | 100 (32.9%) |
| Bachelor's Degree or higher | 74 (85.1%) | 13 (14.9%) |
Occupancy by Age of Householder in Mart
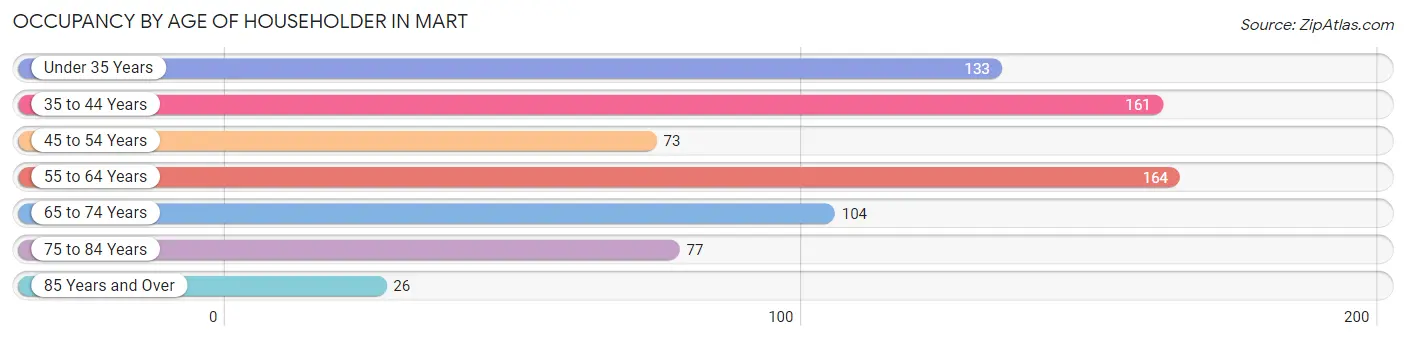
| Age Bracket | # Households | % Households |
| Under 35 Years | 133 | 18.0% |
| 35 to 44 Years | 161 | 21.8% |
| 45 to 54 Years | 73 | 9.9% |
| 55 to 64 Years | 164 | 22.2% |
| 65 to 74 Years | 104 | 14.1% |
| 75 to 84 Years | 77 | 10.4% |
| 85 Years and Over | 26 | 3.5% |
| Total | 738 | 100.0% |
Housing Finances in Mart
Median Income by Occupancy in Mart
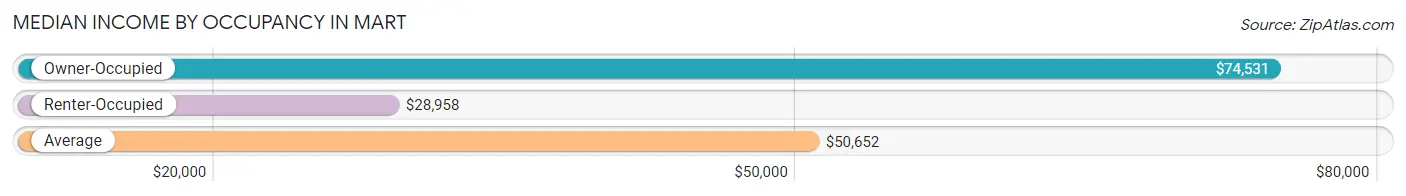
| Occupancy Type | # Households | Median Income |
| Owner-Occupied | 461 (62.5%) | $74,531 |
| Renter-Occupied | 277 (37.5%) | $28,958 |
| Average | 738 (100.0%) | $50,652 |
Occupancy by Householder Income Bracket in Mart
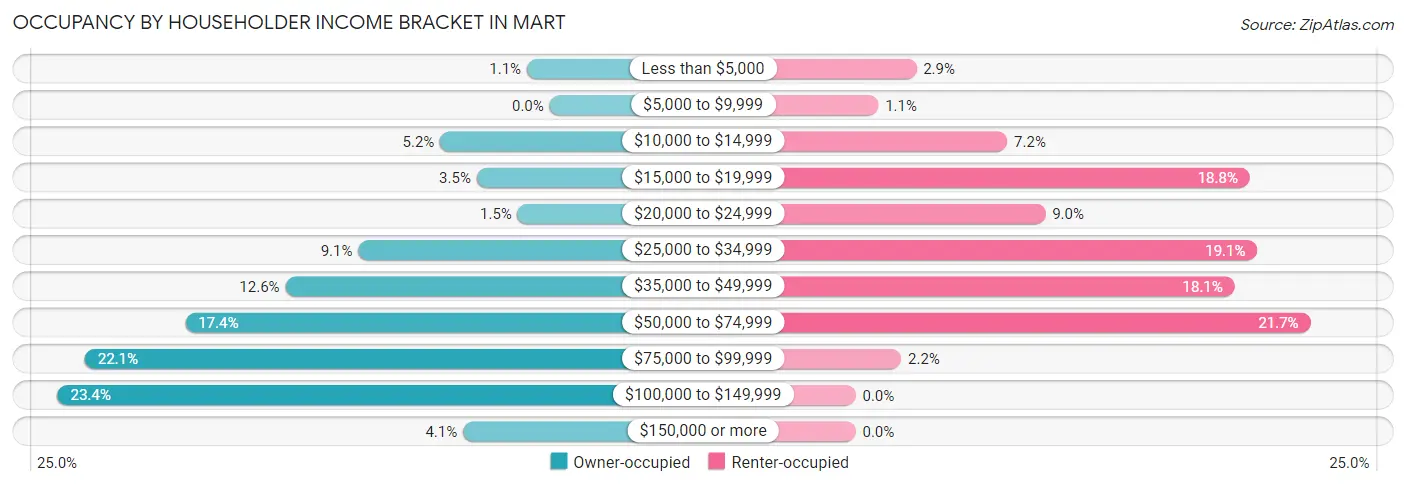
| Income Bracket | Owner-occupied | Renter-occupied |
| Less than $5,000 | 5 (1.1%) | 8 (2.9%) |
| $5,000 to $9,999 | 0 (0.0%) | 3 (1.1%) |
| $10,000 to $14,999 | 24 (5.2%) | 20 (7.2%) |
| $15,000 to $19,999 | 16 (3.5%) | 52 (18.8%) |
| $20,000 to $24,999 | 7 (1.5%) | 25 (9.0%) |
| $25,000 to $34,999 | 42 (9.1%) | 53 (19.1%) |
| $35,000 to $49,999 | 58 (12.6%) | 50 (18.0%) |
| $50,000 to $74,999 | 80 (17.3%) | 60 (21.7%) |
| $75,000 to $99,999 | 102 (22.1%) | 6 (2.2%) |
| $100,000 to $149,999 | 108 (23.4%) | 0 (0.0%) |
| $150,000 or more | 19 (4.1%) | 0 (0.0%) |
| Total | 461 (100.0%) | 277 (100.0%) |
Monthly Housing Cost Tiers in Mart
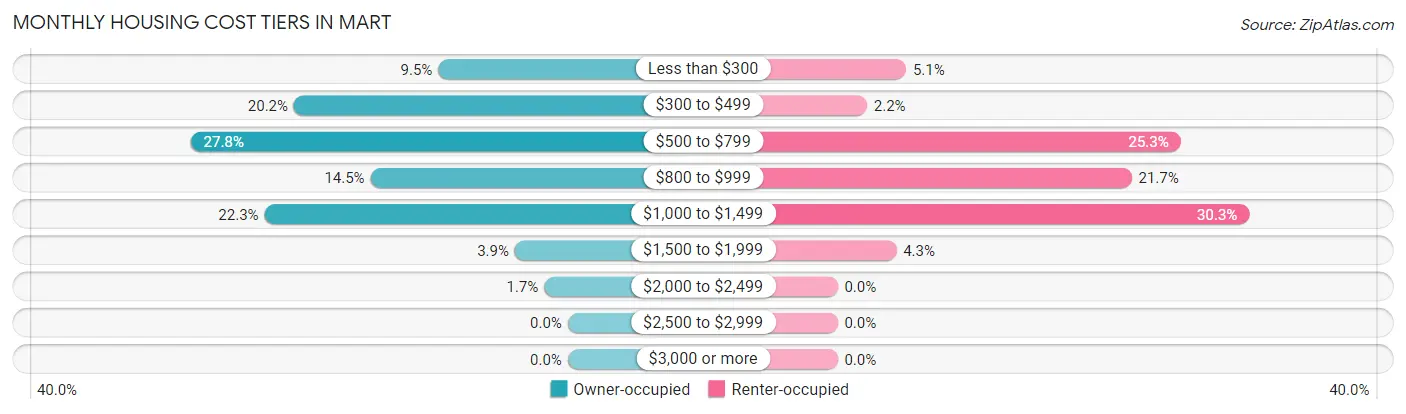
| Monthly Cost | Owner-occupied | Renter-occupied |
| Less than $300 | 44 (9.5%) | 14 (5.1%) |
| $300 to $499 | 93 (20.2%) | 6 (2.2%) |
| $500 to $799 | 128 (27.8%) | 70 (25.3%) |
| $800 to $999 | 67 (14.5%) | 60 (21.7%) |
| $1,000 to $1,499 | 103 (22.3%) | 84 (30.3%) |
| $1,500 to $1,999 | 18 (3.9%) | 12 (4.3%) |
| $2,000 to $2,499 | 8 (1.7%) | 0 (0.0%) |
| $2,500 to $2,999 | 0 (0.0%) | 0 (0.0%) |
| $3,000 or more | 0 (0.0%) | 0 (0.0%) |
| Total | 461 (100.0%) | 277 (100.0%) |
Physical Housing Characteristics in Mart
Housing Structures in Mart
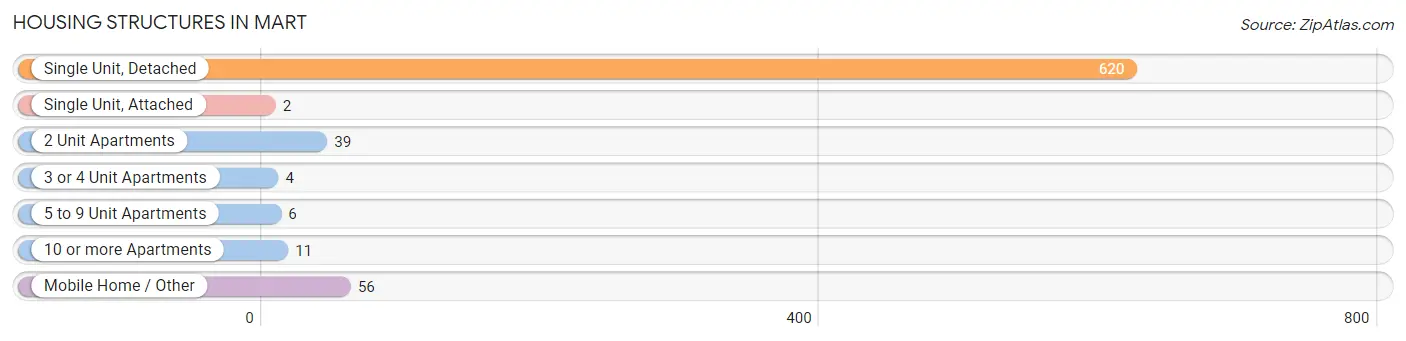
| Structure Type | # Housing Units | % Housing Units |
| Single Unit, Detached | 620 | 84.0% |
| Single Unit, Attached | 2 | 0.3% |
| 2 Unit Apartments | 39 | 5.3% |
| 3 or 4 Unit Apartments | 4 | 0.5% |
| 5 to 9 Unit Apartments | 6 | 0.8% |
| 10 or more Apartments | 11 | 1.5% |
| Mobile Home / Other | 56 | 7.6% |
| Total | 738 | 100.0% |
Housing Structures by Occupancy in Mart
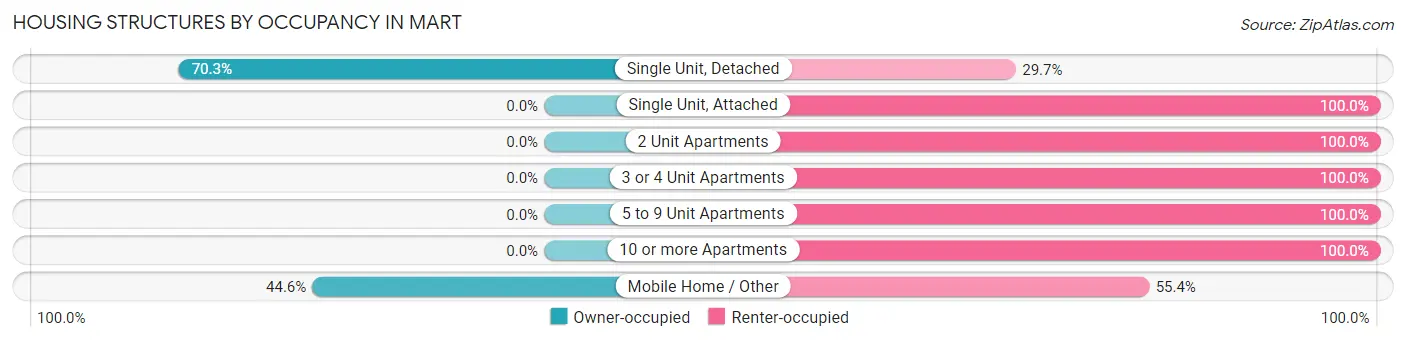
| Structure Type | Owner-occupied | Renter-occupied |
| Single Unit, Detached | 436 (70.3%) | 184 (29.7%) |
| Single Unit, Attached | 0 (0.0%) | 2 (100.0%) |
| 2 Unit Apartments | 0 (0.0%) | 39 (100.0%) |
| 3 or 4 Unit Apartments | 0 (0.0%) | 4 (100.0%) |
| 5 to 9 Unit Apartments | 0 (0.0%) | 6 (100.0%) |
| 10 or more Apartments | 0 (0.0%) | 11 (100.0%) |
| Mobile Home / Other | 25 (44.6%) | 31 (55.4%) |
| Total | 461 (62.5%) | 277 (37.5%) |
Housing Structures by Number of Rooms in Mart
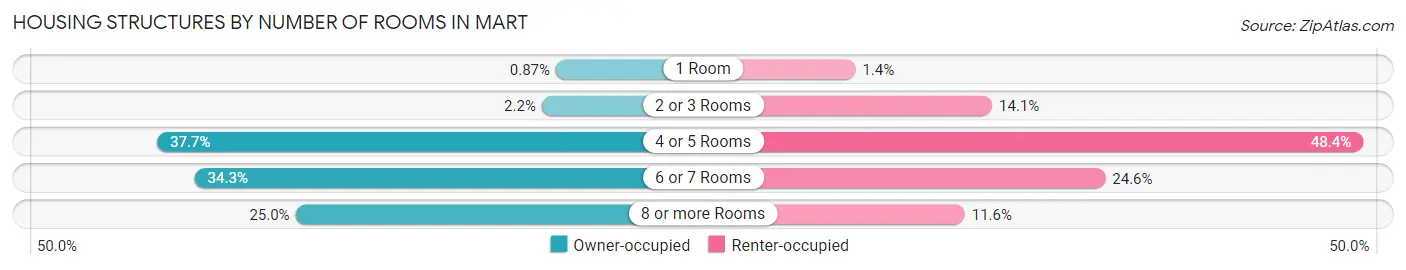
| Number of Rooms | Owner-occupied | Renter-occupied |
| 1 Room | 4 (0.9%) | 4 (1.4%) |
| 2 or 3 Rooms | 10 (2.2%) | 39 (14.1%) |
| 4 or 5 Rooms | 174 (37.7%) | 134 (48.4%) |
| 6 or 7 Rooms | 158 (34.3%) | 68 (24.5%) |
| 8 or more Rooms | 115 (24.9%) | 32 (11.6%) |
| Total | 461 (100.0%) | 277 (100.0%) |
Housing Structure by Heating Type in Mart
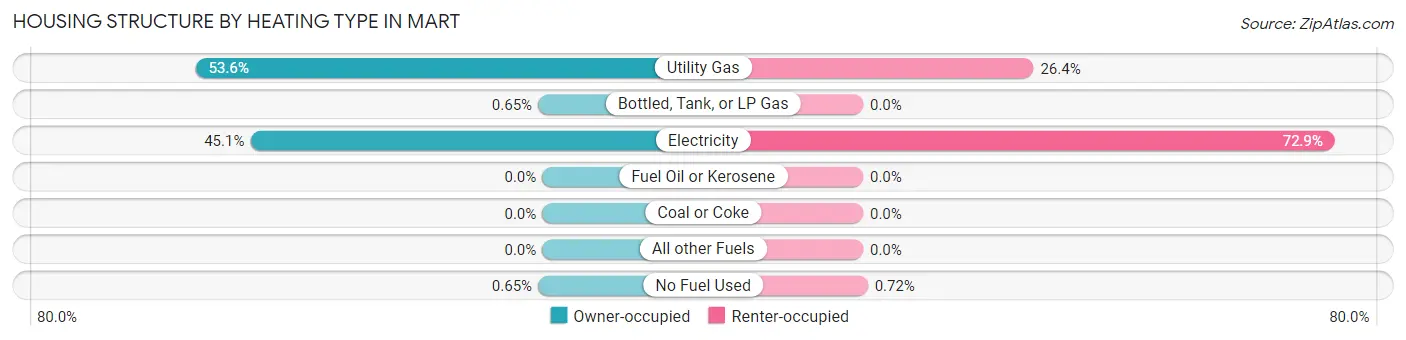
| Heating Type | Owner-occupied | Renter-occupied |
| Utility Gas | 247 (53.6%) | 73 (26.4%) |
| Bottled, Tank, or LP Gas | 3 (0.6%) | 0 (0.0%) |
| Electricity | 208 (45.1%) | 202 (72.9%) |
| Fuel Oil or Kerosene | 0 (0.0%) | 0 (0.0%) |
| Coal or Coke | 0 (0.0%) | 0 (0.0%) |
| All other Fuels | 0 (0.0%) | 0 (0.0%) |
| No Fuel Used | 3 (0.6%) | 2 (0.7%) |
| Total | 461 (100.0%) | 277 (100.0%) |
Household Vehicle Usage in Mart
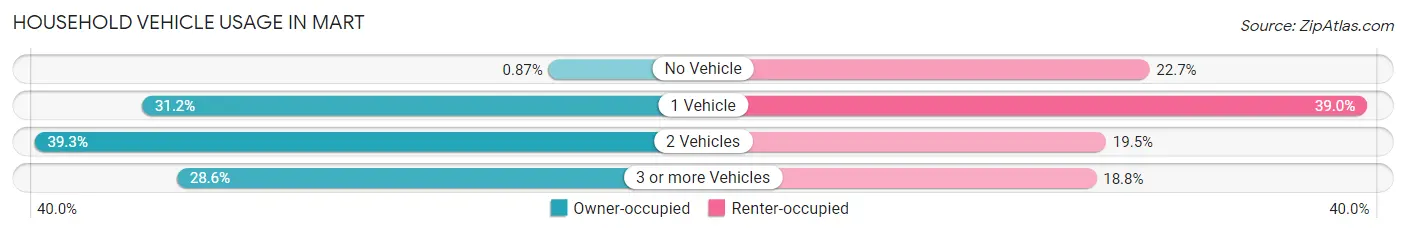
| Vehicles per Household | Owner-occupied | Renter-occupied |
| No Vehicle | 4 (0.9%) | 63 (22.7%) |
| 1 Vehicle | 144 (31.2%) | 108 (39.0%) |
| 2 Vehicles | 181 (39.3%) | 54 (19.5%) |
| 3 or more Vehicles | 132 (28.6%) | 52 (18.8%) |
| Total | 461 (100.0%) | 277 (100.0%) |
Real Estate & Mortgages in Mart
Real Estate and Mortgage Overview in Mart
| Characteristic | Without Mortgage | With Mortgage |
| Housing Units | 278 | 183 |
| Median Property Value | $97,300 | $97,800 |
| Median Household Income | $56,111 | $14 |
| Monthly Housing Costs | $505 | $0 |
| Real Estate Taxes | $1,600 | $12 |
Property Value by Mortgage Status in Mart
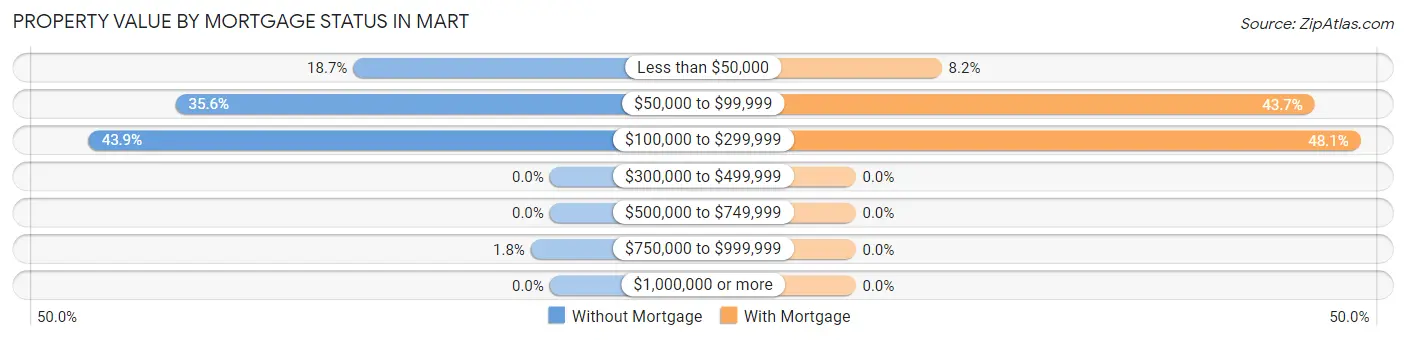
| Property Value | Without Mortgage | With Mortgage |
| Less than $50,000 | 52 (18.7%) | 15 (8.2%) |
| $50,000 to $99,999 | 99 (35.6%) | 80 (43.7%) |
| $100,000 to $299,999 | 122 (43.9%) | 88 (48.1%) |
| $300,000 to $499,999 | 0 (0.0%) | 0 (0.0%) |
| $500,000 to $749,999 | 0 (0.0%) | 0 (0.0%) |
| $750,000 to $999,999 | 5 (1.8%) | 0 (0.0%) |
| $1,000,000 or more | 0 (0.0%) | 0 (0.0%) |
| Total | 278 (100.0%) | 183 (100.0%) |
Household Income by Mortgage Status in Mart
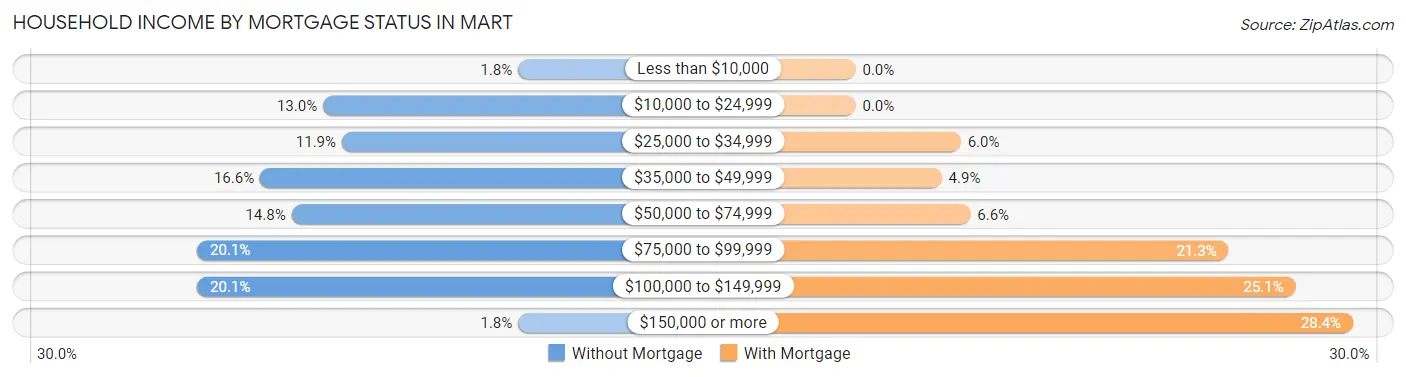
| Household Income | Without Mortgage | With Mortgage |
| Less than $10,000 | 5 (1.8%) | 0 (0.0%) |
| $10,000 to $24,999 | 36 (13.0%) | 0 (0.0%) |
| $25,000 to $34,999 | 33 (11.9%) | 11 (6.0%) |
| $35,000 to $49,999 | 46 (16.6%) | 9 (4.9%) |
| $50,000 to $74,999 | 41 (14.7%) | 12 (6.6%) |
| $75,000 to $99,999 | 56 (20.1%) | 39 (21.3%) |
| $100,000 to $149,999 | 56 (20.1%) | 46 (25.1%) |
| $150,000 or more | 5 (1.8%) | 52 (28.4%) |
| Total | 278 (100.0%) | 183 (100.0%) |
Property Value to Household Income Ratio in Mart
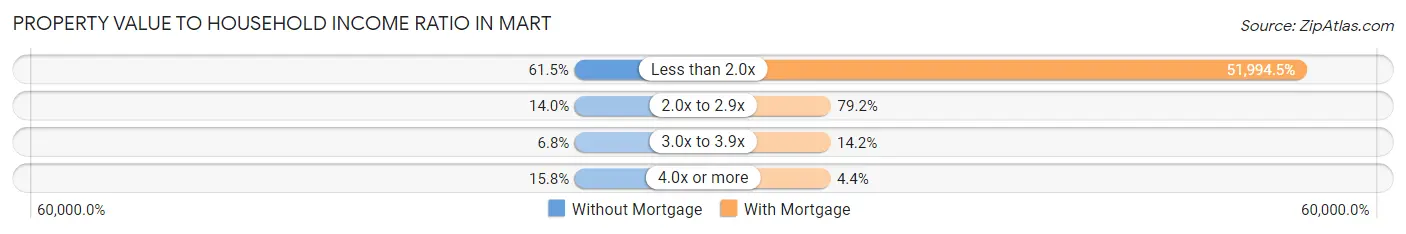
| Value-to-Income Ratio | Without Mortgage | With Mortgage |
| Less than 2.0x | 171 (61.5%) | 95,150 (51,994.5%) |
| 2.0x to 2.9x | 39 (14.0%) | 145 (79.2%) |
| 3.0x to 3.9x | 19 (6.8%) | 26 (14.2%) |
| 4.0x or more | 44 (15.8%) | 8 (4.4%) |
| Total | 278 (100.0%) | 183 (100.0%) |
Real Estate Taxes by Mortgage Status in Mart
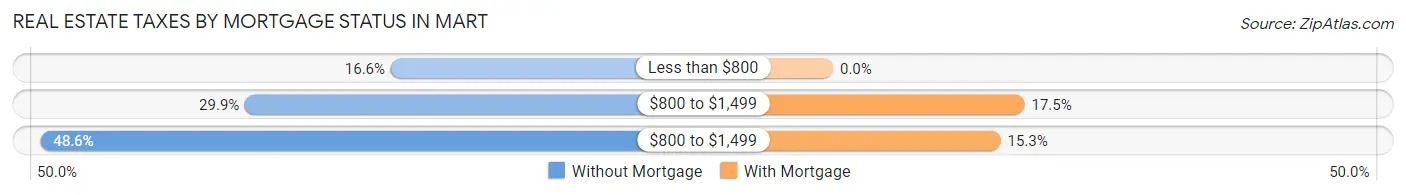
| Property Taxes | Without Mortgage | With Mortgage |
| Less than $800 | 46 (16.6%) | 0 (0.0%) |
| $800 to $1,499 | 83 (29.9%) | 32 (17.5%) |
| $800 to $1,499 | 135 (48.6%) | 28 (15.3%) |
| Total | 278 (100.0%) | 183 (100.0%) |
Health & Disability in Mart
Health Insurance Coverage by Age in Mart
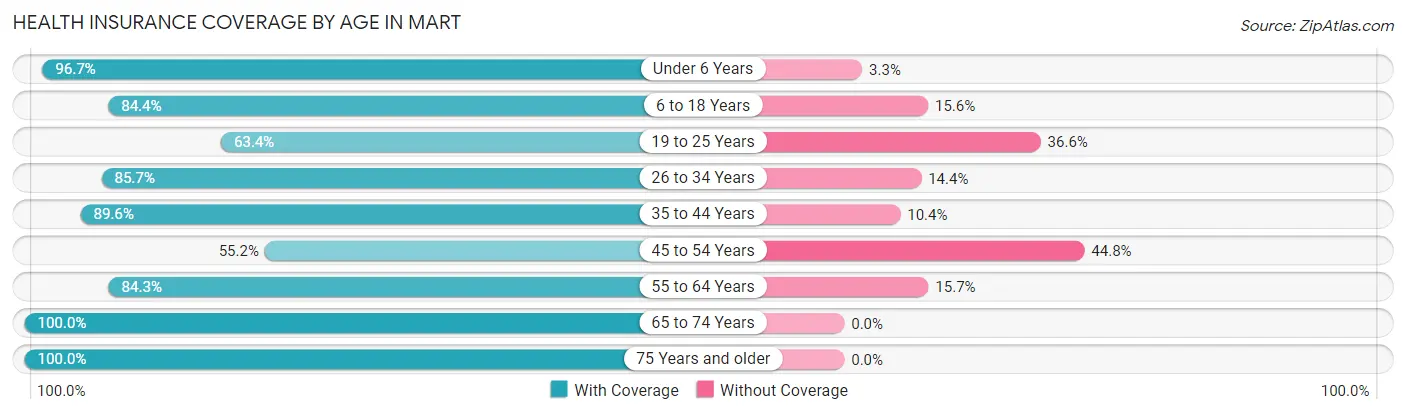
| Age Bracket | With Coverage | Without Coverage |
| Under 6 Years | 174 (96.7%) | 6 (3.3%) |
| 6 to 18 Years | 470 (84.4%) | 87 (15.6%) |
| 19 to 25 Years | 90 (63.4%) | 52 (36.6%) |
| 26 to 34 Years | 191 (85.7%) | 32 (14.3%) |
| 35 to 44 Years | 266 (89.6%) | 31 (10.4%) |
| 45 to 54 Years | 74 (55.2%) | 60 (44.8%) |
| 55 to 64 Years | 242 (84.3%) | 45 (15.7%) |
| 65 to 74 Years | 159 (100.0%) | 0 (0.0%) |
| 75 Years and older | 159 (100.0%) | 0 (0.0%) |
| Total | 1,825 (85.4%) | 313 (14.6%) |
Health Insurance Coverage by Citizenship Status in Mart
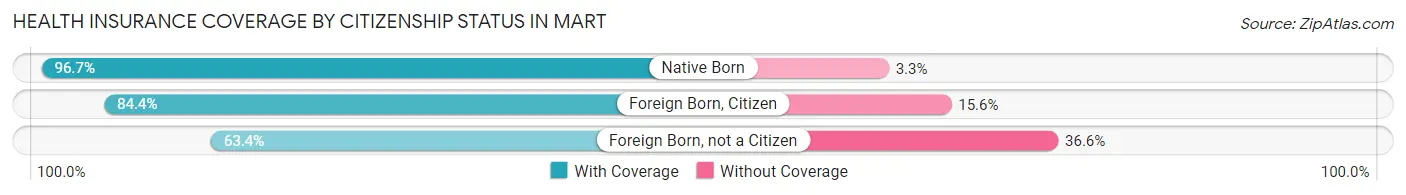
| Citizenship Status | With Coverage | Without Coverage |
| Native Born | 174 (96.7%) | 6 (3.3%) |
| Foreign Born, Citizen | 470 (84.4%) | 87 (15.6%) |
| Foreign Born, not a Citizen | 90 (63.4%) | 52 (36.6%) |
Health Insurance Coverage by Household Income in Mart
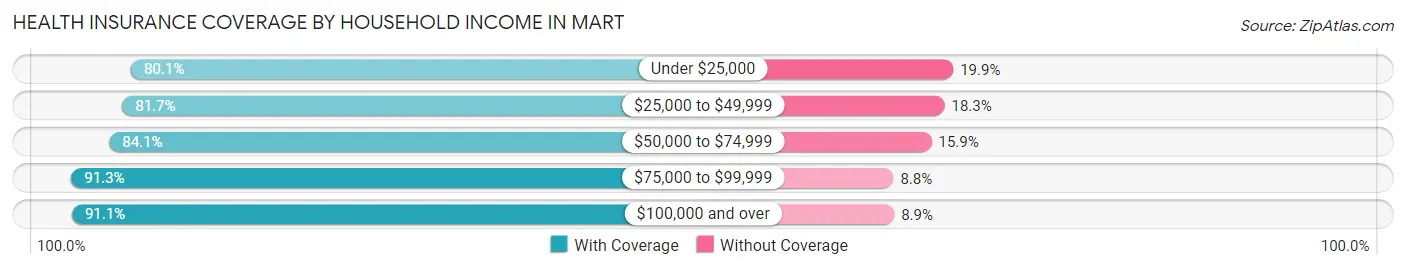
| Household Income | With Coverage | Without Coverage |
| Under $25,000 | 273 (80.1%) | 68 (19.9%) |
| $25,000 to $49,999 | 473 (81.7%) | 106 (18.3%) |
| $50,000 to $74,999 | 376 (84.1%) | 71 (15.9%) |
| $75,000 to $99,999 | 344 (91.2%) | 33 (8.7%) |
| $100,000 and over | 359 (91.1%) | 35 (8.9%) |
Public vs Private Health Insurance Coverage by Age in Mart
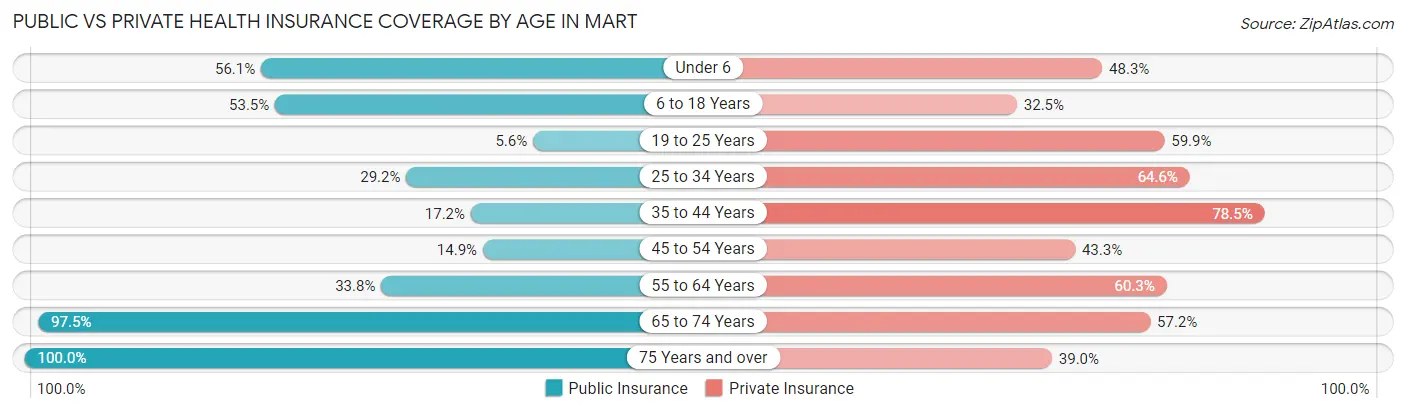
| Age Bracket | Public Insurance | Private Insurance |
| Under 6 | 101 (56.1%) | 87 (48.3%) |
| 6 to 18 Years | 298 (53.5%) | 181 (32.5%) |
| 19 to 25 Years | 8 (5.6%) | 85 (59.9%) |
| 25 to 34 Years | 65 (29.1%) | 144 (64.6%) |
| 35 to 44 Years | 51 (17.2%) | 233 (78.4%) |
| 45 to 54 Years | 20 (14.9%) | 58 (43.3%) |
| 55 to 64 Years | 97 (33.8%) | 173 (60.3%) |
| 65 to 74 Years | 155 (97.5%) | 91 (57.2%) |
| 75 Years and over | 159 (100.0%) | 62 (39.0%) |
| Total | 954 (44.6%) | 1,114 (52.1%) |
Disability Status by Sex by Age in Mart
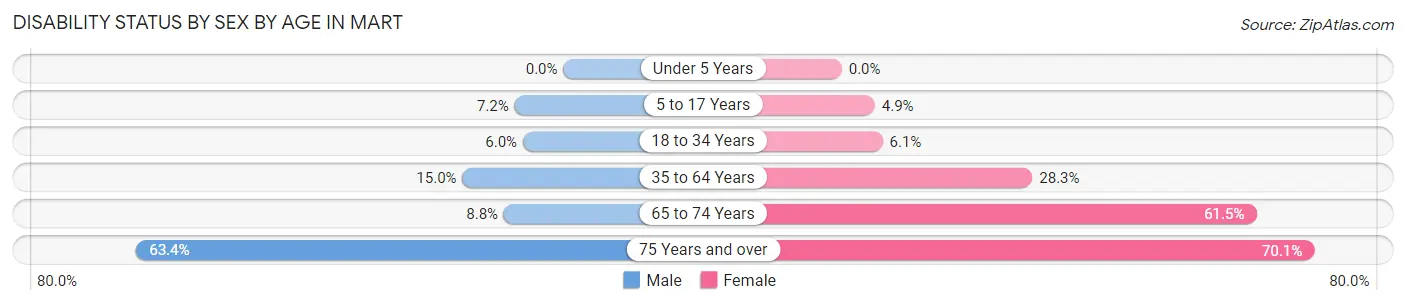
| Age Bracket | Male | Female |
| Under 5 Years | 0 (0.0%) | 0 (0.0%) |
| 5 to 17 Years | 21 (7.2%) | 14 (4.9%) |
| 18 to 34 Years | 12 (6.0%) | 12 (6.1%) |
| 35 to 64 Years | 52 (15.0%) | 105 (28.3%) |
| 65 to 74 Years | 6 (8.8%) | 56 (61.5%) |
| 75 Years and over | 52 (63.4%) | 54 (70.1%) |
Disability Class by Sex by Age in Mart
Disability Class: Hearing Difficulty
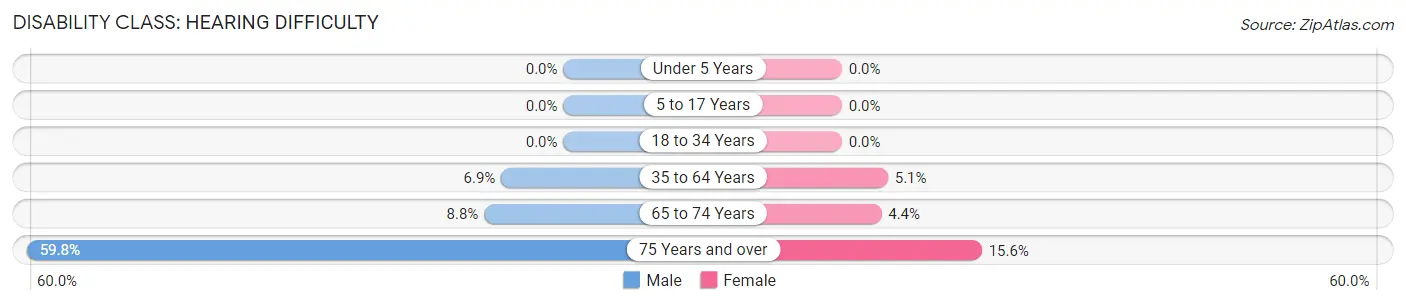
| Age Bracket | Male | Female |
| Under 5 Years | 0 (0.0%) | 0 (0.0%) |
| 5 to 17 Years | 0 (0.0%) | 0 (0.0%) |
| 18 to 34 Years | 0 (0.0%) | 0 (0.0%) |
| 35 to 64 Years | 24 (6.9%) | 19 (5.1%) |
| 65 to 74 Years | 6 (8.8%) | 4 (4.4%) |
| 75 Years and over | 49 (59.8%) | 12 (15.6%) |
Disability Class: Vision Difficulty
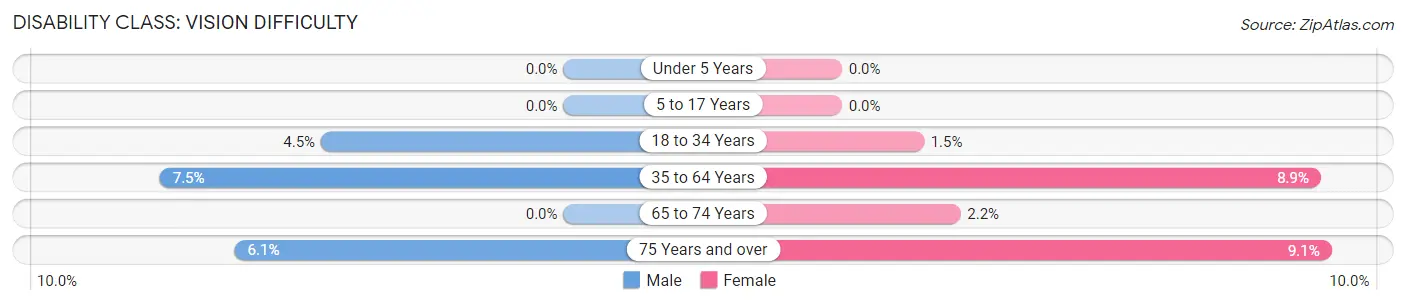
| Age Bracket | Male | Female |
| Under 5 Years | 0 (0.0%) | 0 (0.0%) |
| 5 to 17 Years | 0 (0.0%) | 0 (0.0%) |
| 18 to 34 Years | 9 (4.5%) | 3 (1.5%) |
| 35 to 64 Years | 26 (7.5%) | 33 (8.9%) |
| 65 to 74 Years | 0 (0.0%) | 2 (2.2%) |
| 75 Years and over | 5 (6.1%) | 7 (9.1%) |
Disability Class: Cognitive Difficulty
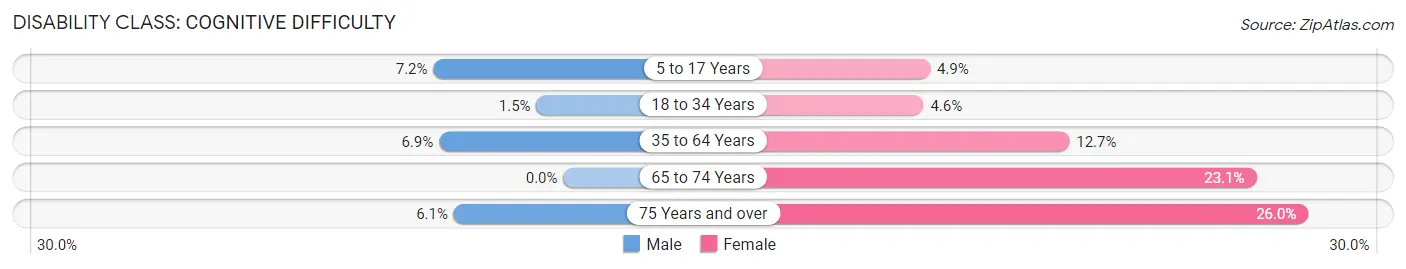
| Age Bracket | Male | Female |
| 5 to 17 Years | 21 (7.2%) | 14 (4.9%) |
| 18 to 34 Years | 3 (1.5%) | 9 (4.5%) |
| 35 to 64 Years | 24 (6.9%) | 47 (12.7%) |
| 65 to 74 Years | 0 (0.0%) | 21 (23.1%) |
| 75 Years and over | 5 (6.1%) | 20 (26.0%) |
Disability Class: Ambulatory Difficulty
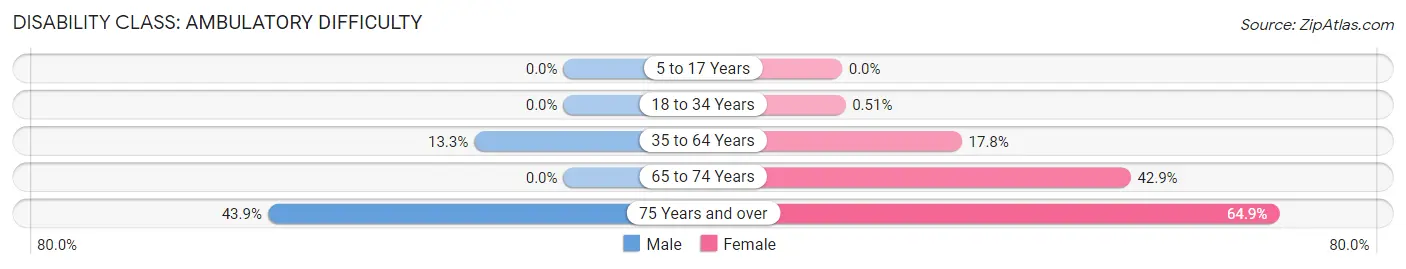
| Age Bracket | Male | Female |
| 5 to 17 Years | 0 (0.0%) | 0 (0.0%) |
| 18 to 34 Years | 0 (0.0%) | 1 (0.5%) |
| 35 to 64 Years | 46 (13.3%) | 66 (17.8%) |
| 65 to 74 Years | 0 (0.0%) | 39 (42.9%) |
| 75 Years and over | 36 (43.9%) | 50 (64.9%) |
Disability Class: Self-Care Difficulty
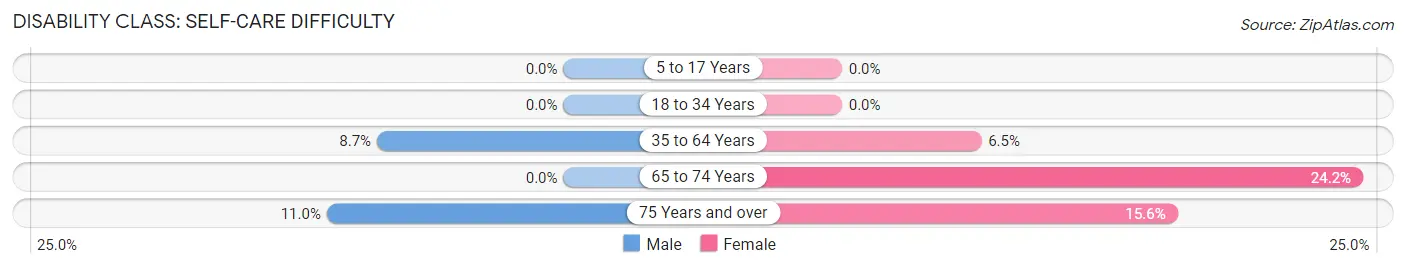
| Age Bracket | Male | Female |
| 5 to 17 Years | 0 (0.0%) | 0 (0.0%) |
| 18 to 34 Years | 0 (0.0%) | 0 (0.0%) |
| 35 to 64 Years | 30 (8.6%) | 24 (6.5%) |
| 65 to 74 Years | 0 (0.0%) | 22 (24.2%) |
| 75 Years and over | 9 (11.0%) | 12 (15.6%) |
Technology Access in Mart
Computing Device Access in Mart
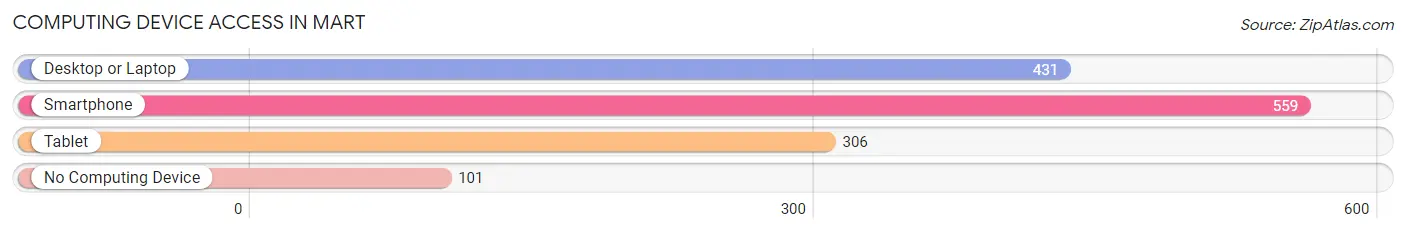
| Device Type | # Households | % Households |
| Desktop or Laptop | 431 | 58.4% |
| Smartphone | 559 | 75.7% |
| Tablet | 306 | 41.5% |
| No Computing Device | 101 | 13.7% |
| Total | 738 | 100.0% |
Internet Access in Mart
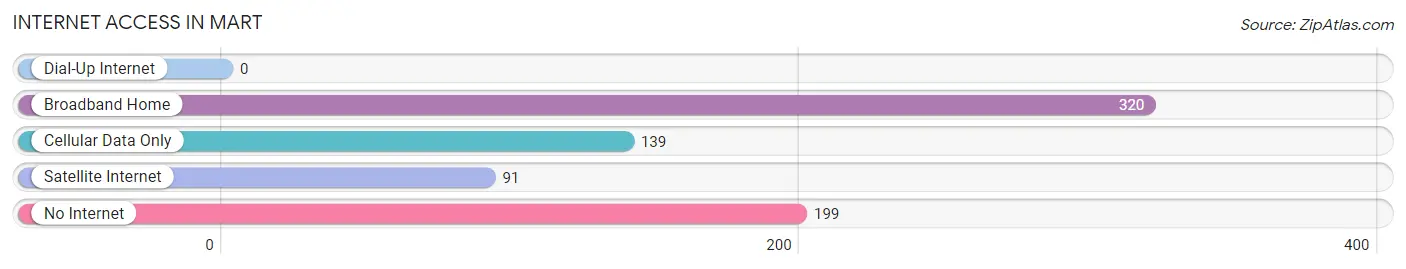
| Internet Type | # Households | % Households |
| Dial-Up Internet | 0 | 0.0% |
| Broadband Home | 320 | 43.4% |
| Cellular Data Only | 139 | 18.8% |
| Satellite Internet | 91 | 12.3% |
| No Internet | 199 | 27.0% |
| Total | 738 | 100.0% |
Mart Summary
Wal-Mart is an American multinational retail corporation that operates a chain of hypermarkets, discount department stores, and grocery stores. It is the world's largest company by revenue, according to the Fortune Global 500 list in 2020. It was founded by Sam Walton in 1962 and incorporated on October 31, 1969. The company is headquartered in Bentonville, Arkansas.
History
Wal-Mart was founded by Sam Walton in 1962 in Rogers, Arkansas. Walton opened the first store in Rogers, Arkansas, and the company grew rapidly, opening stores in other parts of the state. By 1967, the company had opened 24 stores in Arkansas, Oklahoma, and Missouri. In 1969, the company incorporated as Wal-Mart Stores, Inc. and began to expand into other states. By the early 1970s, the company had opened stores in Texas, Louisiana, Mississippi, and Tennessee.
In the 1980s, the company began to expand internationally, opening stores in Mexico, Canada, and the United Kingdom. In the 1990s, the company continued to expand, opening stores in China, India, and Brazil. By the early 2000s, the company had stores in 27 countries and had become the largest retailer in the world.
Geography
Wal-Mart has stores in all 50 states in the United States, as well as in Puerto Rico, the U.S. Virgin Islands, and Guam. The company also has stores in Mexico, Canada, the United Kingdom, China, India, Brazil, Argentina, Chile, Japan, South Korea, and Australia.
Economy
Wal-Mart is the largest employer in the United States, with over 2.2 million employees worldwide. The company is also the largest retailer in the world, with over 11,000 stores in 27 countries. In 2019, the company reported total revenue of $514.4 billion.
Wal-Mart is a major contributor to the U.S. economy. In 2019, the company reported total sales of $514.4 billion, which accounted for 2.8% of the U.S. gross domestic product. The company also reported total employment of 2.2 million people, which accounted for 1.4% of total U.S. employment.
Demographics
Wal-Mart is a major employer in the United States, with over 2.2 million employees worldwide. The company's workforce is diverse, with employees from a variety of backgrounds and cultures. In 2019, the company reported that its workforce was made up of 56% women, 44% men, and 24% people of color. The company also reported that its workforce was made up of 43% full-time employees and 57% part-time employees.
Common Questions
What is Per Capita Income in Mart?
Per Capita income in Mart is $21,344.
What is the Median Family Income in Mart?
Median Family Income in Mart is $57,546.
What is the Median Household income in Mart?
Median Household Income in Mart is $50,652.
What is Income or Wage Gap in Mart?
Income or Wage Gap in Mart is 10.8%.
Women in Mart earn 89.2 cents for every dollar earned by a man.
What is Family Income Deficit in Mart?
Family Income Deficit in Mart is $11,011.
Families that are below poverty line in Mart earn $11,011 less on average than the poverty threshold level.
What is Inequality or Gini Index in Mart?
Inequality or Gini Index in Mart is 0.38.
What is the Total Population of Mart?
Total Population of Mart is 2,179.
What is the Total Male Population of Mart?
Total Male Population of Mart is 1,050.
What is the Total Female Population of Mart?
Total Female Population of Mart is 1,129.
What is the Ratio of Males per 100 Females in Mart?
There are 93.00 Males per 100 Females in Mart.
What is the Ratio of Females per 100 Males in Mart?
There are 107.52 Females per 100 Males in Mart.
What is the Median Population Age in Mart?
Median Population Age in Mart is 34.4 Years.
What is the Average Family Size in Mart
Average Family Size in Mart is 3.5 People.
What is the Average Household Size in Mart
Average Household Size in Mart is 2.9 People.
How Large is the Labor Force in Mart?
There are 822 People in the Labor Forcein in Mart.
What is the Percentage of People in the Labor Force in Mart?
52.8% of People are in the Labor Force in Mart.
What is the Unemployment Rate in Mart?
Unemployment Rate in Mart is 11.1%.