Madisonville, TX Map & Demographics
Madisonville Map
Madisonville Overview
$27,615
PER CAPITA INCOME
$65,833
AVG FAMILY INCOME
$62,135
AVG HOUSEHOLD INCOME
21.7%
WAGE / INCOME GAP [ % ]
78.3¢/ $1
WAGE / INCOME GAP [ $ ]
0.42
INEQUALITY / GINI INDEX
4,480
TOTAL POPULATION
2,177
MALE POPULATION
2,303
FEMALE POPULATION
94.53
MALES / 100 FEMALES
105.79
FEMALES / 100 MALES
38.2
MEDIAN AGE
3.4
AVG FAMILY SIZE
2.7
AVG HOUSEHOLD SIZE
2,249
LABOR FORCE [ PEOPLE ]
63.0%
PERCENT IN LABOR FORCE
0.5%
UNEMPLOYMENT RATE
Madisonville Zip Codes
Madisonville Area Codes
Income in Madisonville
Income Overview in Madisonville
Per Capita Income in Madisonville is $27,615, while median incomes of families and households are $65,833 and $62,135 respectively.
| Characteristic | Number | Measure |
| Per Capita Income | 4,480 | $27,615 |
| Median Family Income | 1,064 | $65,833 |
| Mean Family Income | 1,064 | $84,720 |
| Median Household Income | 1,587 | $62,135 |
| Mean Household Income | 1,587 | $70,574 |
| Income Deficit | 1,064 | $0 |
| Wage / Income Gap (%) | 4,480 | 21.66% |
| Wage / Income Gap ($) | 4,480 | 78.34¢ per $1 |
| Gini / Inequality Index | 4,480 | 0.42 |
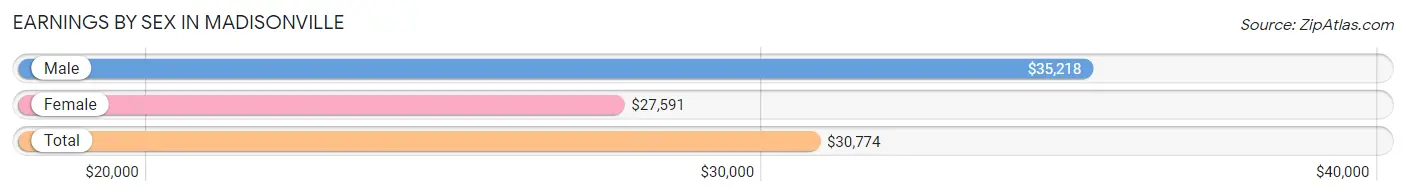
Earnings by Sex in Madisonville
Average Earnings in Madisonville are $30,774, $35,218 for men and $27,591 for women, a difference of 21.7%.
| Sex | Number | Average Earnings |
| Male | 1,147 (49.9%) | $35,218 |
| Female | 1,153 (50.1%) | $27,591 |
| Total | 2,300 (100.0%) | $30,774 |
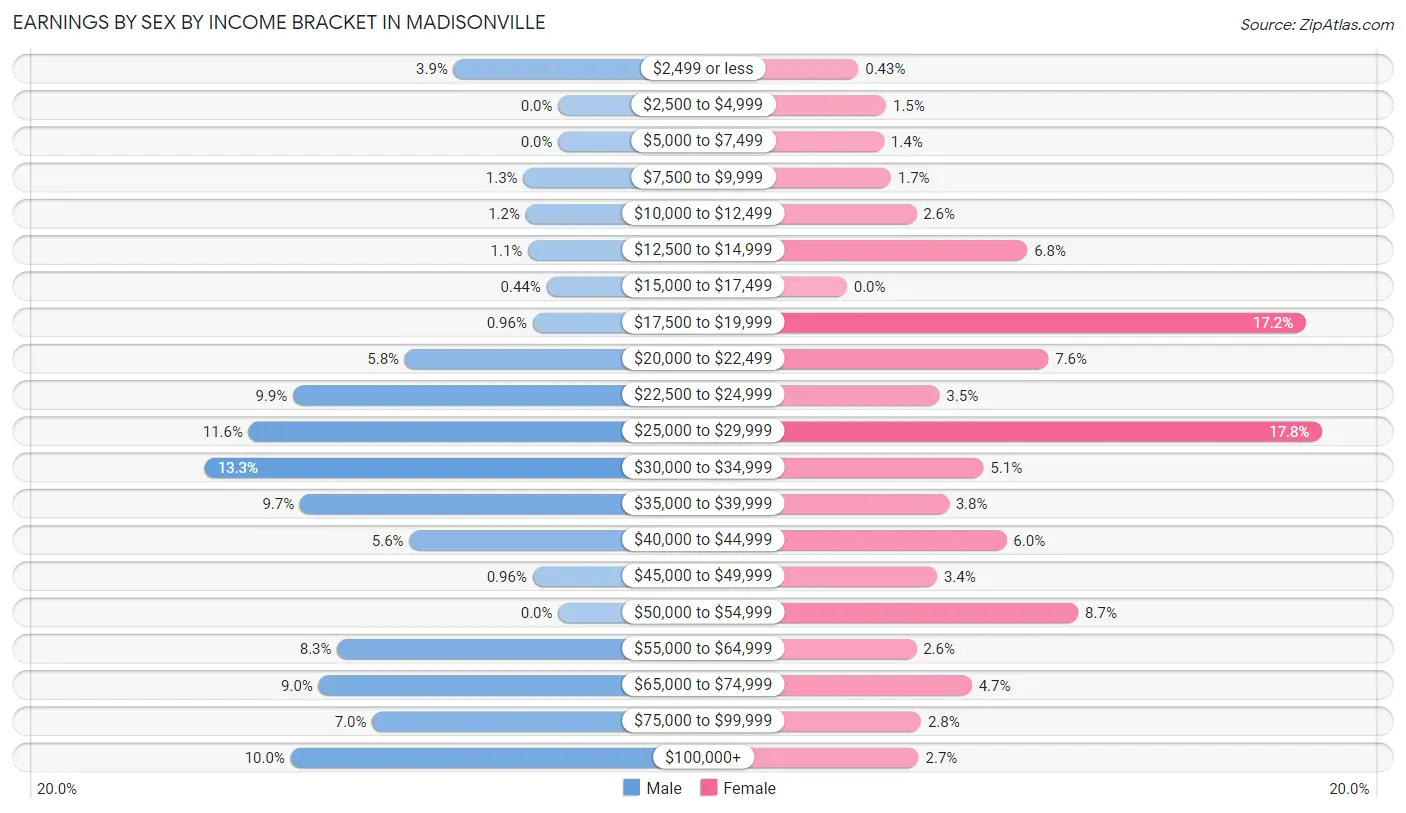
Earnings by Sex by Income Bracket in Madisonville
The most common earnings brackets in Madisonville are $30,000 to $34,999 for men (152 | 13.3%) and $25,000 to $29,999 for women (205 | 17.8%).
| Income | Male | Female |
| $2,499 or less | 45 (3.9%) | 5 (0.4%) |
| $2,500 to $4,999 | 0 (0.0%) | 17 (1.5%) |
| $5,000 to $7,499 | 0 (0.0%) | 16 (1.4%) |
| $7,500 to $9,999 | 15 (1.3%) | 19 (1.7%) |
| $10,000 to $12,499 | 14 (1.2%) | 30 (2.6%) |
| $12,500 to $14,999 | 13 (1.1%) | 78 (6.8%) |
| $15,000 to $17,499 | 5 (0.4%) | 0 (0.0%) |
| $17,500 to $19,999 | 11 (1.0%) | 198 (17.2%) |
| $20,000 to $22,499 | 66 (5.8%) | 87 (7.5%) |
| $22,500 to $24,999 | 114 (9.9%) | 40 (3.5%) |
| $25,000 to $29,999 | 133 (11.6%) | 205 (17.8%) |
| $30,000 to $34,999 | 152 (13.3%) | 59 (5.1%) |
| $35,000 to $39,999 | 111 (9.7%) | 44 (3.8%) |
| $40,000 to $44,999 | 64 (5.6%) | 69 (6.0%) |
| $45,000 to $49,999 | 11 (1.0%) | 39 (3.4%) |
| $50,000 to $54,999 | 0 (0.0%) | 100 (8.7%) |
| $55,000 to $64,999 | 95 (8.3%) | 30 (2.6%) |
| $65,000 to $74,999 | 103 (9.0%) | 54 (4.7%) |
| $75,000 to $99,999 | 80 (7.0%) | 32 (2.8%) |
| $100,000+ | 115 (10.0%) | 31 (2.7%) |
| Total | 1,147 (100.0%) | 1,153 (100.0%) |
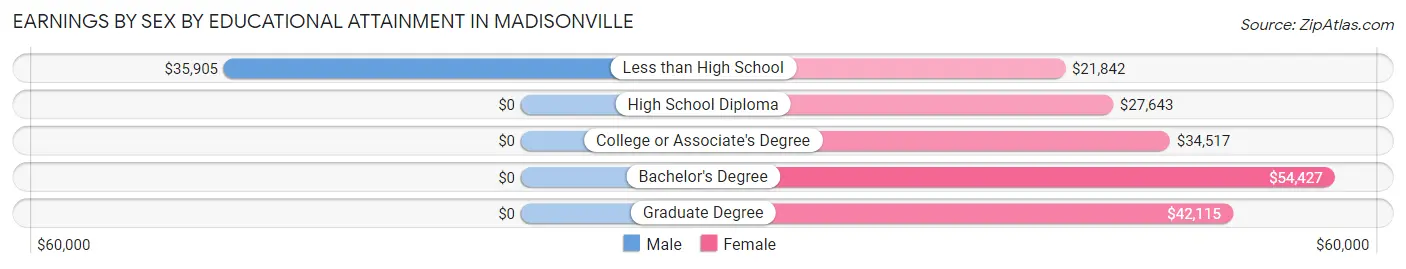
Earnings by Sex by Educational Attainment in Madisonville
Average earnings in Madisonville are $38,490 for men and $29,628 for women, a difference of 23.0%. Men with an educational attainment of less than high school enjoy the highest average annual earnings of $35,905, while those with less than high school education earn the least with $35,905. Women with an educational attainment of bachelor's degree earn the most with the average annual earnings of $54,427, while those with less than high school education have the smallest earnings of $21,842.
| Educational Attainment | Male Income | Female Income |
| Less than High School | $35,905 | $21,842 |
| High School Diploma | - | - |
| College or Associate's Degree | - | - |
| Bachelor's Degree | - | - |
| Graduate Degree | - | - |
| Total | $38,490 | $29,628 |
Family Income in Madisonville
Family Income Brackets in Madisonville
According to the Madisonville family income data, there are 267 families falling into the $50,000 to $74,999 income range, which is the most common income bracket and makes up 25.1% of all families. Conversely, the $10,000 to $14,999 income bracket is the least frequent group with only 9 families (0.9%) belonging to this category.
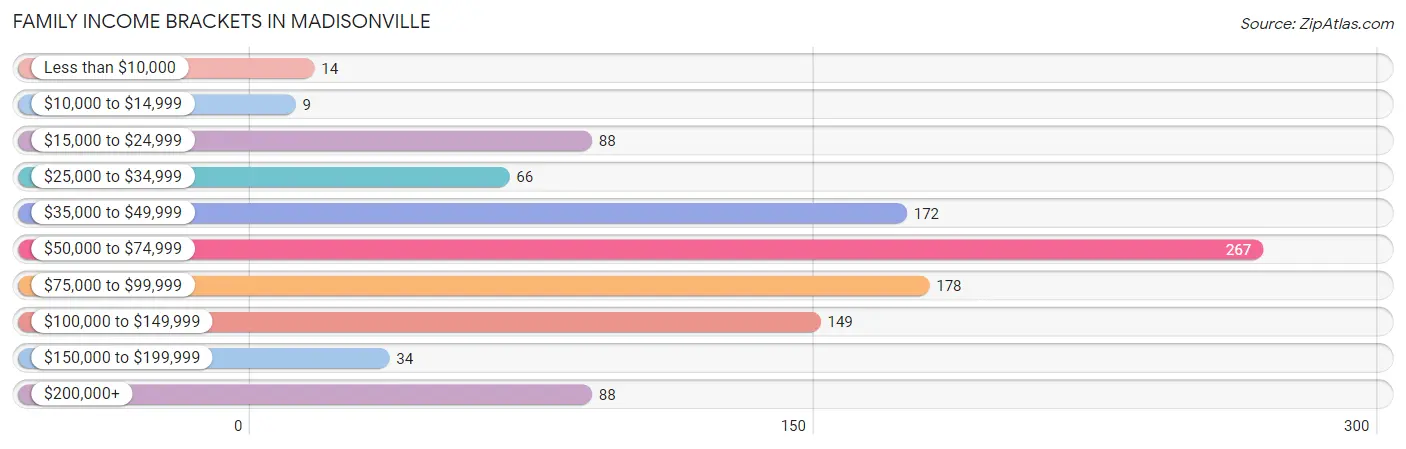
| Income Bracket | # Families | % Families |
| Less than $10,000 | 14 | 1.3% |
| $10,000 to $14,999 | 9 | 0.8% |
| $15,000 to $24,999 | 88 | 8.3% |
| $25,000 to $34,999 | 66 | 6.2% |
| $35,000 to $49,999 | 172 | 16.2% |
| $50,000 to $74,999 | 267 | 25.1% |
| $75,000 to $99,999 | 178 | 16.7% |
| $100,000 to $149,999 | 149 | 14.0% |
| $150,000 to $199,999 | 34 | 3.2% |
| $200,000+ | 88 | 8.3% |
Family Income by Famaliy Size in Madisonville
5-person families (103 | 9.7%) account for the highest median family income in Madisonville with $132,768 per family, while 2-person families (430 | 40.4%) have the highest median income of $28,720 per family member.
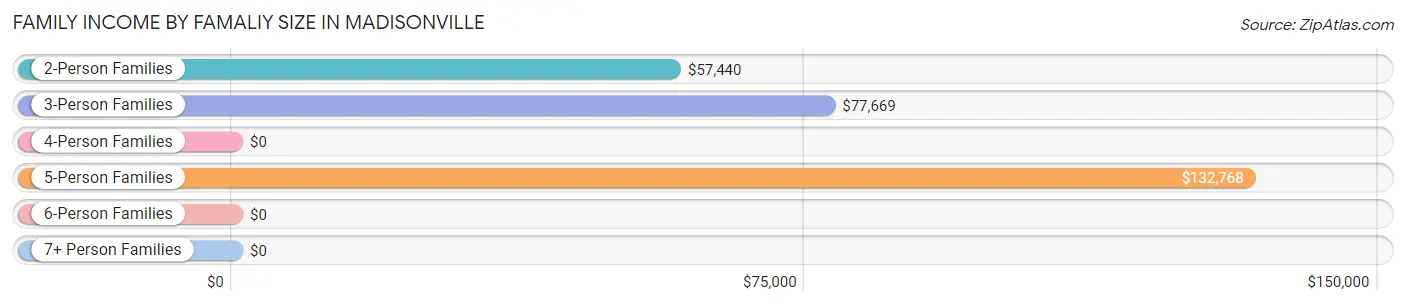
| Income Bracket | # Families | Median Income |
| 2-Person Families | 430 (40.4%) | $57,440 |
| 3-Person Families | 381 (35.8%) | $77,669 |
| 4-Person Families | 103 (9.7%) | $0 |
| 5-Person Families | 103 (9.7%) | $132,768 |
| 6-Person Families | 16 (1.5%) | $0 |
| 7+ Person Families | 31 (2.9%) | $0 |
| Total | 1,064 (100.0%) | $65,833 |
Family Income by Number of Earners in Madisonville
The median family income in Madisonville is $65,833, with families comprising 3+ earners (201) having the highest median family income of $138,603, while families with no earners (114) have the lowest median family income of $38,980, accounting for 18.9% and 10.7% of families, respectively.
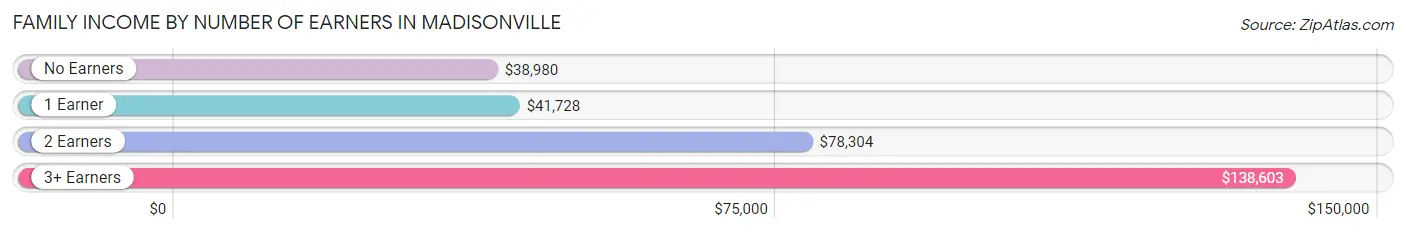
| Number of Earners | # Families | Median Income |
| No Earners | 114 (10.7%) | $38,980 |
| 1 Earner | 362 (34.0%) | $41,728 |
| 2 Earners | 387 (36.4%) | $78,304 |
| 3+ Earners | 201 (18.9%) | $138,603 |
| Total | 1,064 (100.0%) | $65,833 |
Household Income in Madisonville
Household Income Brackets in Madisonville
With 359 households falling in the category, the $50,000 to $74,999 income range is the most frequent in Madisonville, accounting for 22.6% of all households. In contrast, only 44 households (2.8%) fall into the $150,000 to $199,999 income bracket, making it the least populous group.
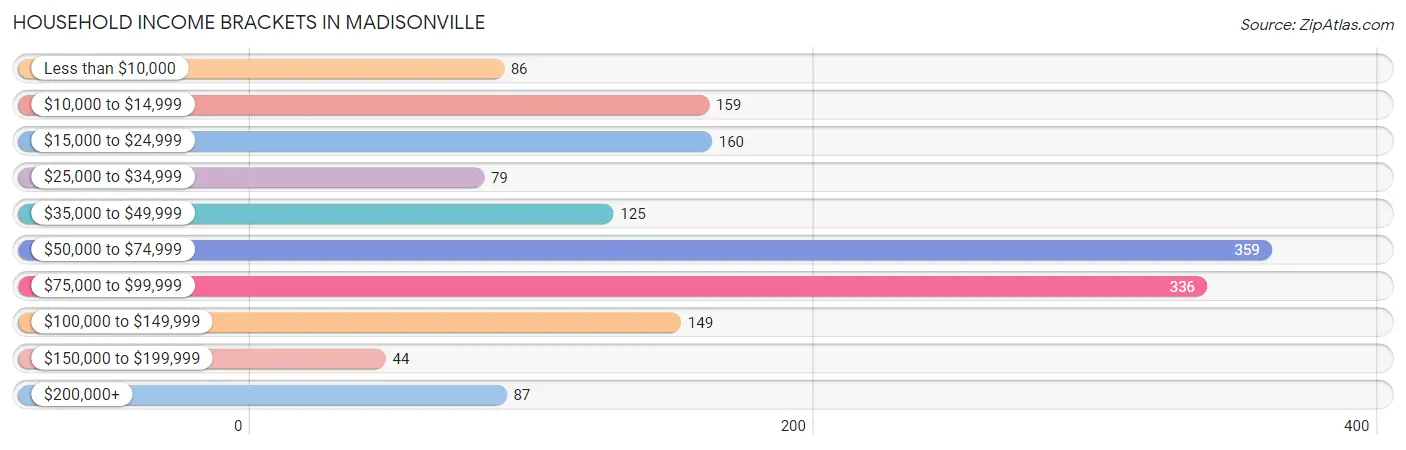
| Income Bracket | # Households | % Households |
| Less than $10,000 | 86 | 5.4% |
| $10,000 to $14,999 | 159 | 10.0% |
| $15,000 to $24,999 | 160 | 10.1% |
| $25,000 to $34,999 | 79 | 5.0% |
| $35,000 to $49,999 | 125 | 7.9% |
| $50,000 to $74,999 | 359 | 22.6% |
| $75,000 to $99,999 | 336 | 21.2% |
| $100,000 to $149,999 | 149 | 9.4% |
| $150,000 to $199,999 | 44 | 2.8% |
| $200,000+ | 87 | 5.5% |
Household Income by Householder Age in Madisonville
The median household income in Madisonville is $62,135, with the highest median household income of $70,508 found in the 25 to 44 years age bracket for the primary householder. A total of 533 households (33.6%) fall into this category. Meanwhile, the 15 to 24 years age bracket for the primary householder has the lowest median household income of $0, with 54 households (3.4%) in this group.
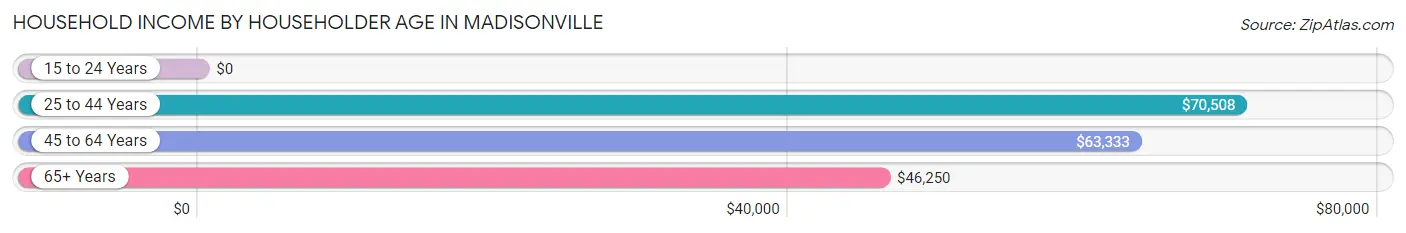
| Income Bracket | # Households | Median Income |
| 15 to 24 Years | 54 (3.4%) | $0 |
| 25 to 44 Years | 533 (33.6%) | $70,508 |
| 45 to 64 Years | 530 (33.4%) | $63,333 |
| 65+ Years | 470 (29.6%) | $46,250 |
| Total | 1,587 (100.0%) | $62,135 |
Poverty in Madisonville
Income Below Poverty by Sex and Age in Madisonville
With 9.6% poverty level for males and 16.2% for females among the residents of Madisonville, 16 and 17 year old males and 12 to 14 year old females are the most vulnerable to poverty, with 34 males (31.5%) and 60 females (39.2%) in their respective age groups living below the poverty level.
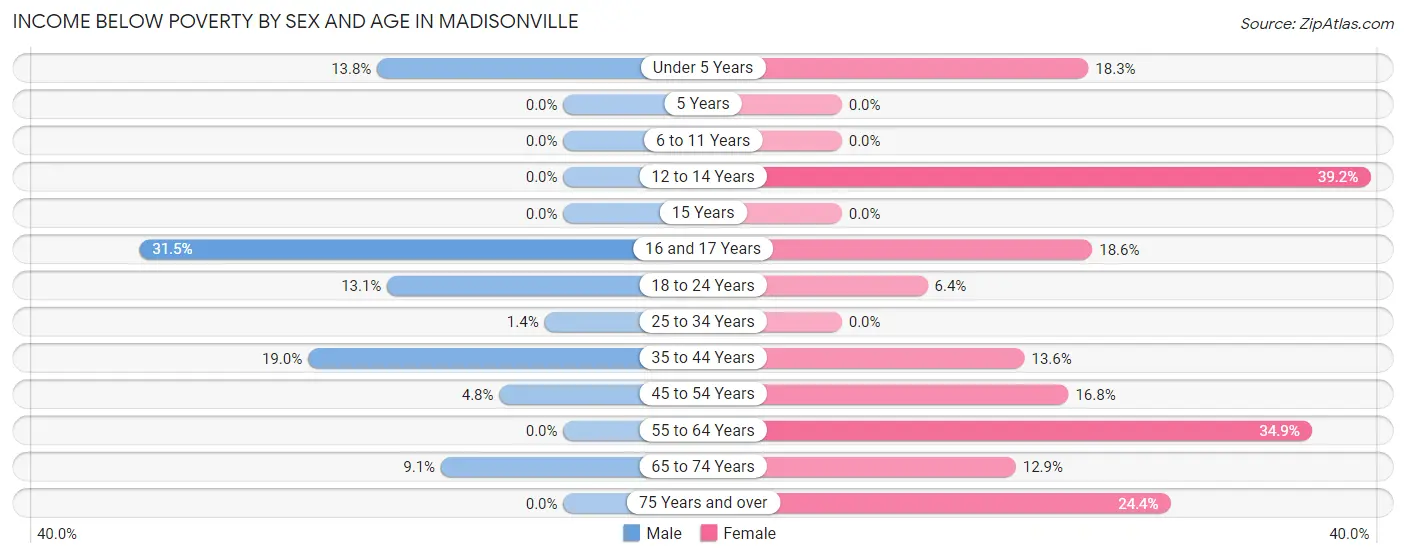
| Age Bracket | Male | Female |
| Under 5 Years | 21 (13.8%) | 26 (18.3%) |
| 5 Years | 0 (0.0%) | 0 (0.0%) |
| 6 to 11 Years | 0 (0.0%) | 0 (0.0%) |
| 12 to 14 Years | 0 (0.0%) | 60 (39.2%) |
| 15 Years | 0 (0.0%) | 0 (0.0%) |
| 16 and 17 Years | 34 (31.5%) | 8 (18.6%) |
| 18 to 24 Years | 34 (13.1%) | 13 (6.4%) |
| 25 to 34 Years | 3 (1.4%) | 0 (0.0%) |
| 35 to 44 Years | 84 (19.0%) | 38 (13.6%) |
| 45 to 54 Years | 14 (4.8%) | 51 (16.8%) |
| 55 to 64 Years | 0 (0.0%) | 90 (34.9%) |
| 65 to 74 Years | 15 (9.1%) | 31 (12.9%) |
| 75 Years and over | 0 (0.0%) | 40 (24.4%) |
| Total | 205 (9.6%) | 357 (16.2%) |
Income Above Poverty by Sex and Age in Madisonville
According to the poverty statistics in Madisonville, males aged 5 years and females aged 6 to 11 years are the age groups that are most secure financially, with 100.0% of males and 100.0% of females in these age groups living above the poverty line.
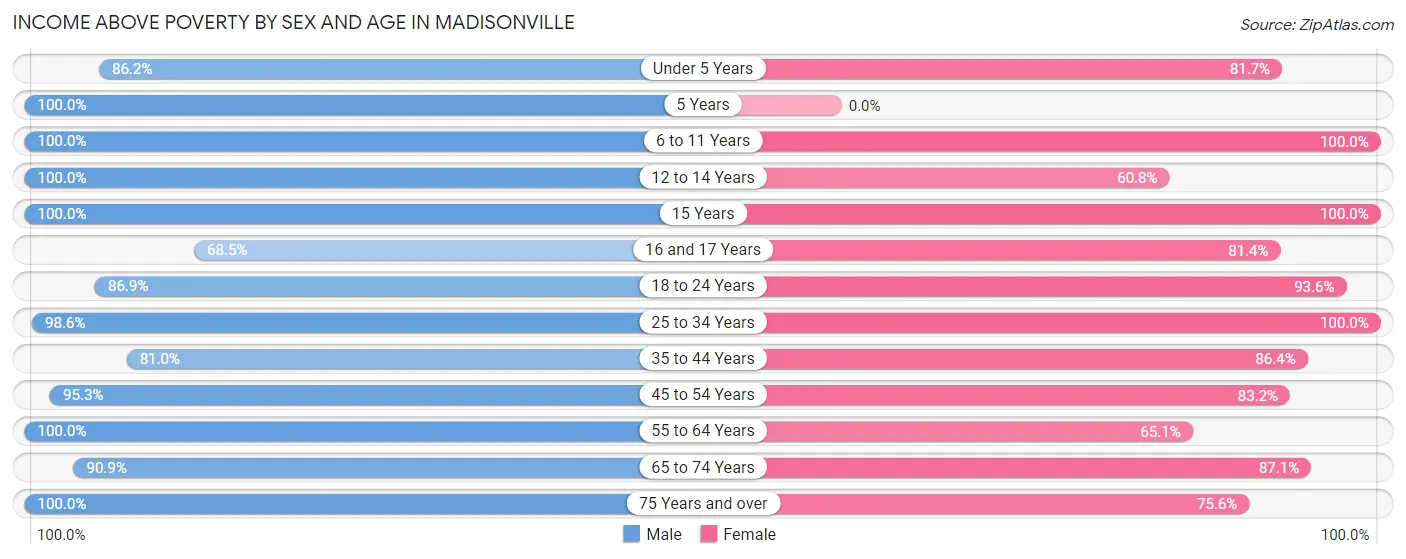
| Age Bracket | Male | Female |
| Under 5 Years | 131 (86.2%) | 116 (81.7%) |
| 5 Years | 35 (100.0%) | 0 (0.0%) |
| 6 to 11 Years | 138 (100.0%) | 111 (100.0%) |
| 12 to 14 Years | 98 (100.0%) | 93 (60.8%) |
| 15 Years | 29 (100.0%) | 44 (100.0%) |
| 16 and 17 Years | 74 (68.5%) | 35 (81.4%) |
| 18 to 24 Years | 226 (86.9%) | 191 (93.6%) |
| 25 to 34 Years | 211 (98.6%) | 266 (100.0%) |
| 35 to 44 Years | 359 (81.0%) | 242 (86.4%) |
| 45 to 54 Years | 281 (95.3%) | 252 (83.2%) |
| 55 to 64 Years | 141 (100.0%) | 168 (65.1%) |
| 65 to 74 Years | 150 (90.9%) | 209 (87.1%) |
| 75 Years and over | 48 (100.0%) | 124 (75.6%) |
| Total | 1,921 (90.4%) | 1,851 (83.8%) |
Income Below Poverty Among Married-Couple Families in Madisonville
The poverty statistics for married-couple families in Madisonville show that 6.4% or 45 of the total 706 families live below the poverty line. Families with 1 or 2 children have the highest poverty rate of 18.2%, comprising of 37 families. On the other hand, families with 3 or 4 children have the lowest poverty rate of 0.0%, which includes 0 families.
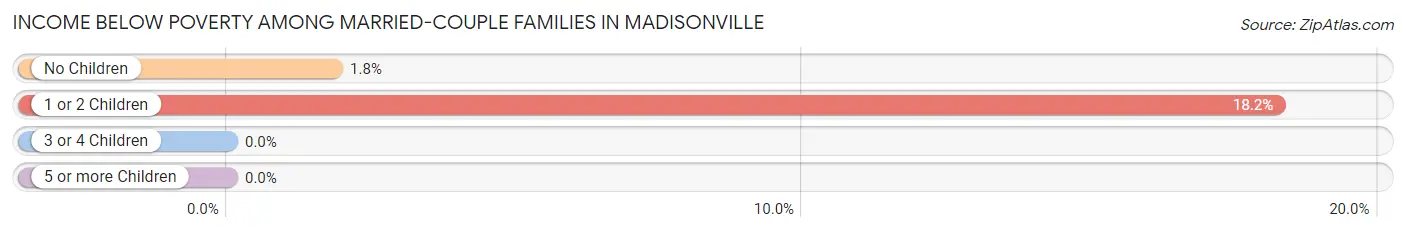
| Children | Above Poverty | Below Poverty |
| No Children | 429 (98.2%) | 8 (1.8%) |
| 1 or 2 Children | 166 (81.8%) | 37 (18.2%) |
| 3 or 4 Children | 58 (100.0%) | 0 (0.0%) |
| 5 or more Children | 8 (100.0%) | 0 (0.0%) |
| Total | 661 (93.6%) | 45 (6.4%) |
Income Below Poverty Among Single-Parent Households in Madisonville
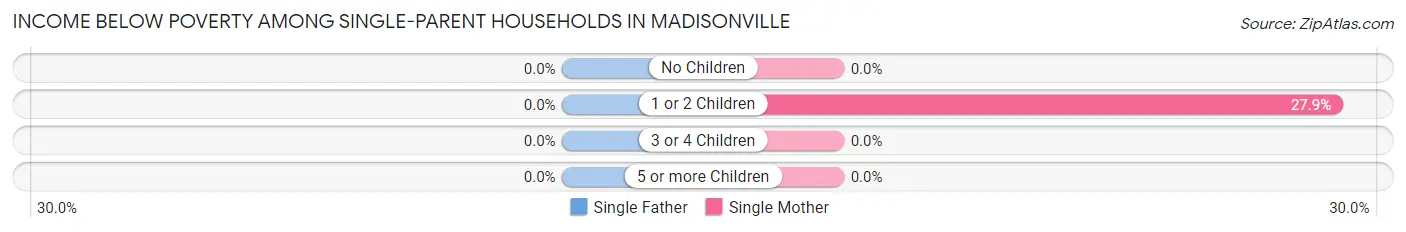
| Children | Single Father | Single Mother |
| No Children | 0 (0.0%) | 0 (0.0%) |
| 1 or 2 Children | 0 (0.0%) | 65 (27.9%) |
| 3 or 4 Children | 0 (0.0%) | 0 (0.0%) |
| 5 or more Children | 0 (0.0%) | 0 (0.0%) |
| Total | 0 (0.0%) | 65 (19.7%) |
Income Below Poverty Among Married-Couple vs Single-Parent Households in Madisonville
The poverty data for Madisonville shows that 45 of the married-couple family households (6.4%) and 65 of the single-parent households (18.2%) are living below the poverty level. Within the married-couple family households, those with 1 or 2 children have the highest poverty rate, with 37 households (18.2%) falling below the poverty line. Among the single-parent households, those with 1 or 2 children have the highest poverty rate, with 65 household (26.3%) living below poverty.
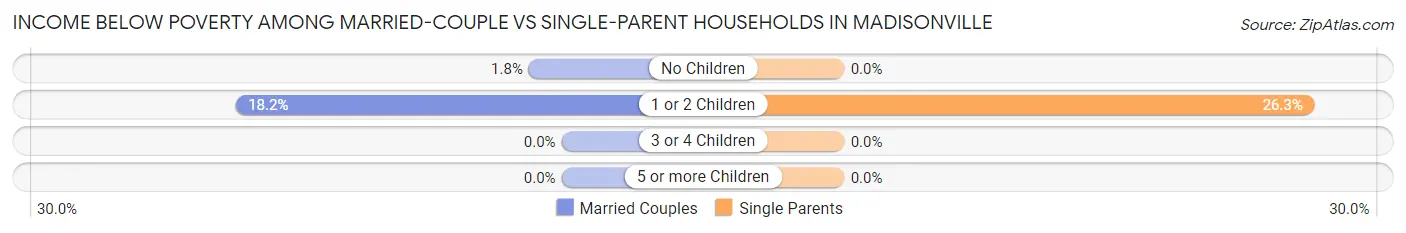
| Children | Married-Couple Families | Single-Parent Households |
| No Children | 8 (1.8%) | 0 (0.0%) |
| 1 or 2 Children | 37 (18.2%) | 65 (26.3%) |
| 3 or 4 Children | 0 (0.0%) | 0 (0.0%) |
| 5 or more Children | 0 (0.0%) | 0 (0.0%) |
| Total | 45 (6.4%) | 65 (18.2%) |
Race in Madisonville
The most populous races in Madisonville are White / Caucasian (2,578 | 57.5%), Hispanic or Latino (1,653 | 36.9%), and Black / African American (1,064 | 23.7%).
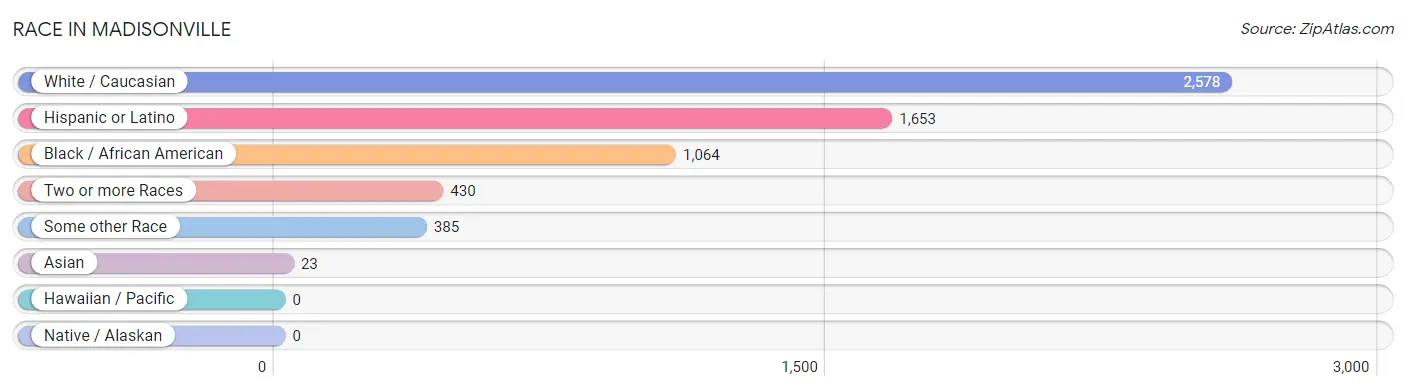
| Race | # Population | % Population |
| Asian | 23 | 0.5% |
| Black / African American | 1,064 | 23.7% |
| Hawaiian / Pacific | 0 | 0.0% |
| Hispanic or Latino | 1,653 | 36.9% |
| Native / Alaskan | 0 | 0.0% |
| White / Caucasian | 2,578 | 57.5% |
| Two or more Races | 430 | 9.6% |
| Some other Race | 385 | 8.6% |
| Total | 4,480 | 100.0% |
Ancestry in Madisonville
The most populous ancestries reported in Madisonville are Mexican (1,543 | 34.4%), English (319 | 7.1%), American (208 | 4.6%), Irish (167 | 3.7%), and German (149 | 3.3%), together accounting for 53.3% of all Madisonville residents.
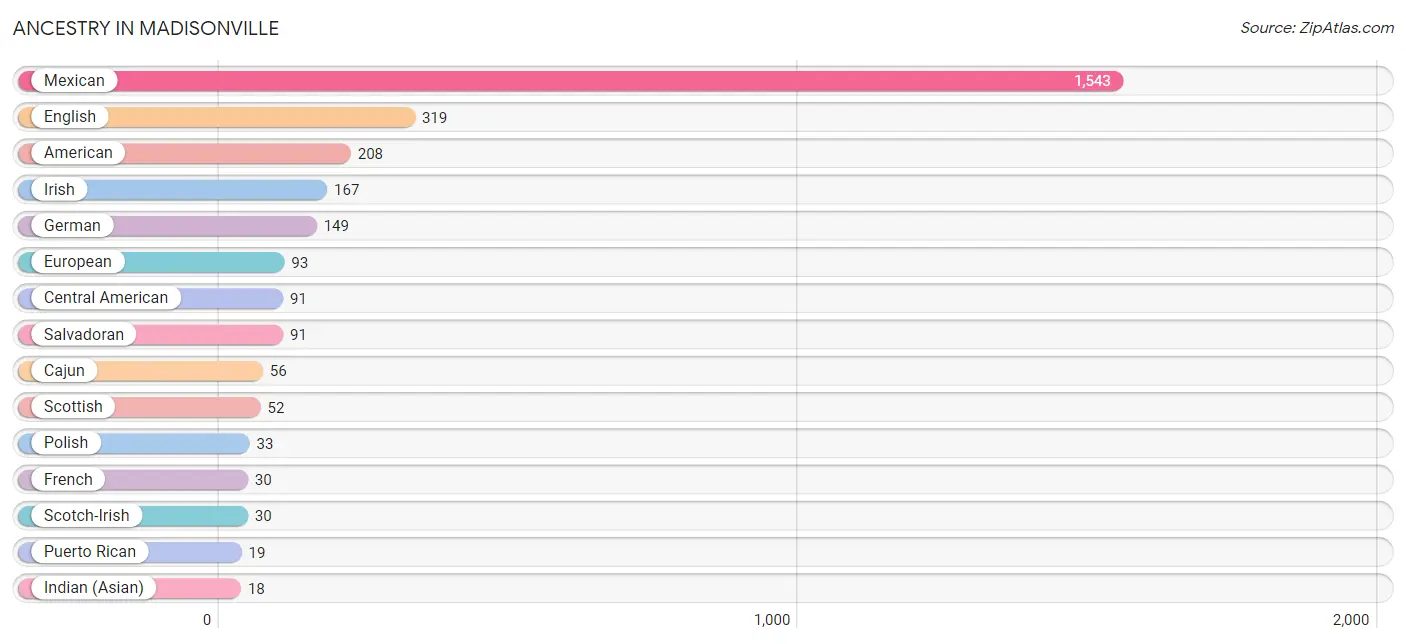
| Ancestry | # Population | % Population |
| American | 208 | 4.6% |
| Bhutanese | 11 | 0.3% |
| Cajun | 56 | 1.3% |
| Central American | 91 | 2.0% |
| Czech | 5 | 0.1% |
| Dutch | 5 | 0.1% |
| English | 319 | 7.1% |
| European | 93 | 2.1% |
| French | 30 | 0.7% |
| German | 149 | 3.3% |
| Greek | 11 | 0.3% |
| Indian (Asian) | 18 | 0.4% |
| Irish | 167 | 3.7% |
| Italian | 16 | 0.4% |
| Mexican | 1,543 | 34.4% |
| Polish | 33 | 0.7% |
| Puerto Rican | 19 | 0.4% |
| Salvadoran | 91 | 2.0% |
| Scotch-Irish | 30 | 0.7% |
| Scottish | 52 | 1.2% |
| Swedish | 11 | 0.3% | View All 21 Rows |
Immigrants in Madisonville
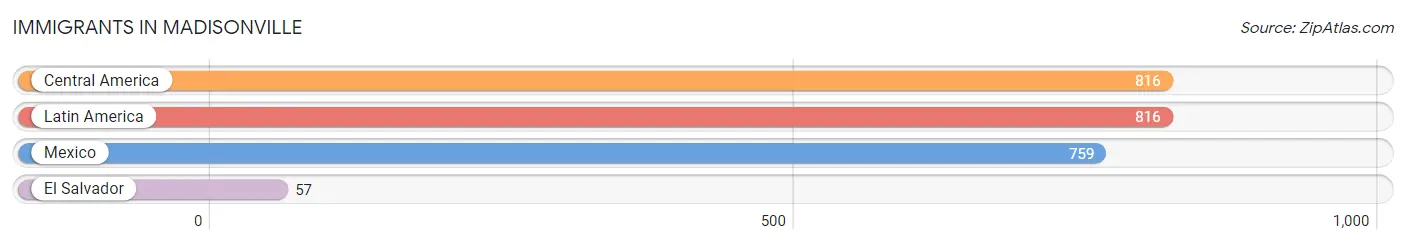
The most numerous immigrant groups reported in Madisonville came from Central America (816 | 18.2%), Latin America (816 | 18.2%), Mexico (759 | 16.9%), and El Salvador (57 | 1.3%), together accounting for 54.6% of all Madisonville residents.
| Immigration Origin | # Population | % Population |
| Central America | 816 | 18.2% |
| El Salvador | 57 | 1.3% |
| Latin America | 816 | 18.2% |
| Mexico | 759 | 16.9% | View All 4 Rows |
Sex and Age in Madisonville
Sex and Age in Madisonville
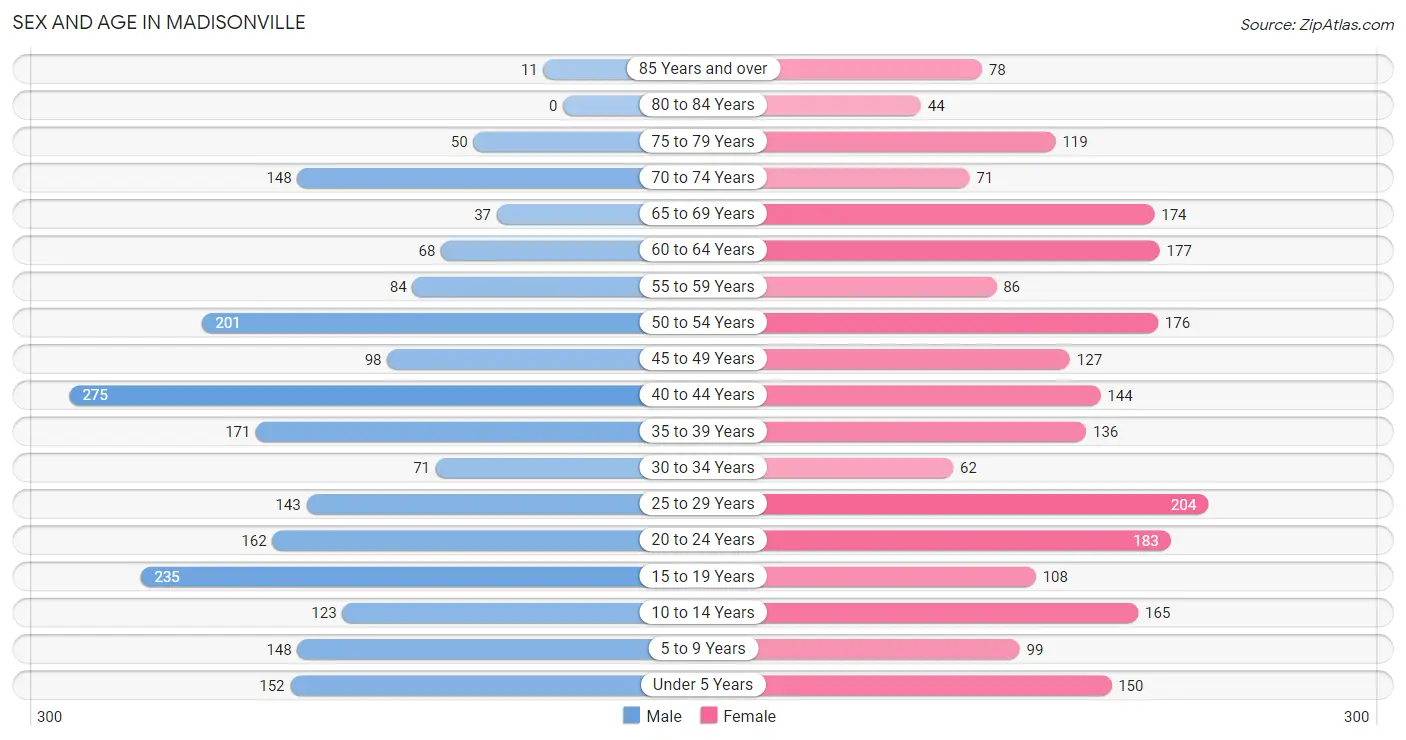
The most populous age groups in Madisonville are 40 to 44 Years (275 | 12.6%) for men and 25 to 29 Years (204 | 8.9%) for women.
| Age Bracket | Male | Female |
| Under 5 Years | 152 (7.0%) | 150 (6.5%) |
| 5 to 9 Years | 148 (6.8%) | 99 (4.3%) |
| 10 to 14 Years | 123 (5.7%) | 165 (7.2%) |
| 15 to 19 Years | 235 (10.8%) | 108 (4.7%) |
| 20 to 24 Years | 162 (7.4%) | 183 (8.0%) |
| 25 to 29 Years | 143 (6.6%) | 204 (8.9%) |
| 30 to 34 Years | 71 (3.3%) | 62 (2.7%) |
| 35 to 39 Years | 171 (7.9%) | 136 (5.9%) |
| 40 to 44 Years | 275 (12.6%) | 144 (6.2%) |
| 45 to 49 Years | 98 (4.5%) | 127 (5.5%) |
| 50 to 54 Years | 201 (9.2%) | 176 (7.6%) |
| 55 to 59 Years | 84 (3.9%) | 86 (3.7%) |
| 60 to 64 Years | 68 (3.1%) | 177 (7.7%) |
| 65 to 69 Years | 37 (1.7%) | 174 (7.6%) |
| 70 to 74 Years | 148 (6.8%) | 71 (3.1%) |
| 75 to 79 Years | 50 (2.3%) | 119 (5.2%) |
| 80 to 84 Years | 0 (0.0%) | 44 (1.9%) |
| 85 Years and over | 11 (0.5%) | 78 (3.4%) |
| Total | 2,177 (100.0%) | 2,303 (100.0%) |
Families and Households in Madisonville
Median Family Size in Madisonville
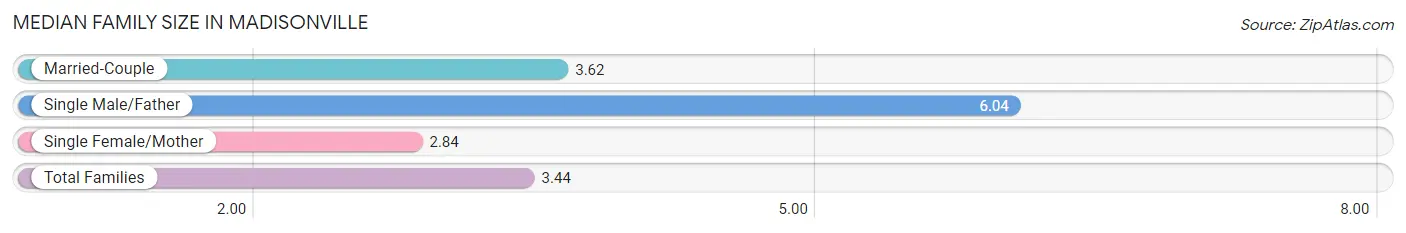
The median family size in Madisonville is 3.44 persons per family, with single male/father families (28 | 2.6%) accounting for the largest median family size of 6.04 persons per family. On the other hand, single female/mother families (330 | 31.0%) represent the smallest median family size with 2.84 persons per family.
| Family Type | # Families | Family Size |
| Married-Couple | 706 (66.3%) | 3.62 |
| Single Male/Father | 28 (2.6%) | 6.04 |
| Single Female/Mother | 330 (31.0%) | 2.84 |
| Total Families | 1,064 (100.0%) | 3.44 |
Median Household Size in Madisonville
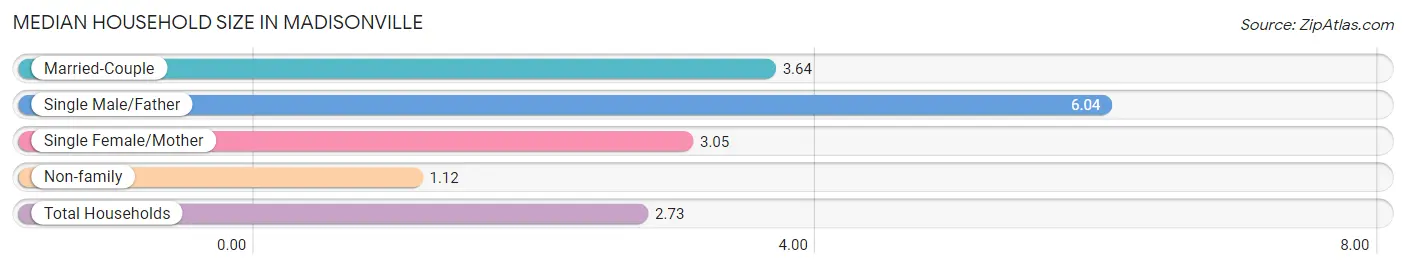
The median household size in Madisonville is 2.73 persons per household, with single male/father households (28 | 1.8%) accounting for the largest median household size of 6.04 persons per household. non-family households (523 | 33.0%) represent the smallest median household size with 1.12 persons per household.
| Household Type | # Households | Household Size |
| Married-Couple | 706 (44.5%) | 3.64 |
| Single Male/Father | 28 (1.8%) | 6.04 |
| Single Female/Mother | 330 (20.8%) | 3.05 |
| Non-family | 523 (33.0%) | 1.12 |
| Total Households | 1,587 (100.0%) | 2.73 |
Household Size by Marriage Status in Madisonville
Out of a total of 1,587 households in Madisonville, 1,064 (67.0%) are family households, while 523 (33.0%) are nonfamily households. The most numerous type of family households are 2-person households, comprising 401, and the most common type of nonfamily households are 1-person households, comprising 500.
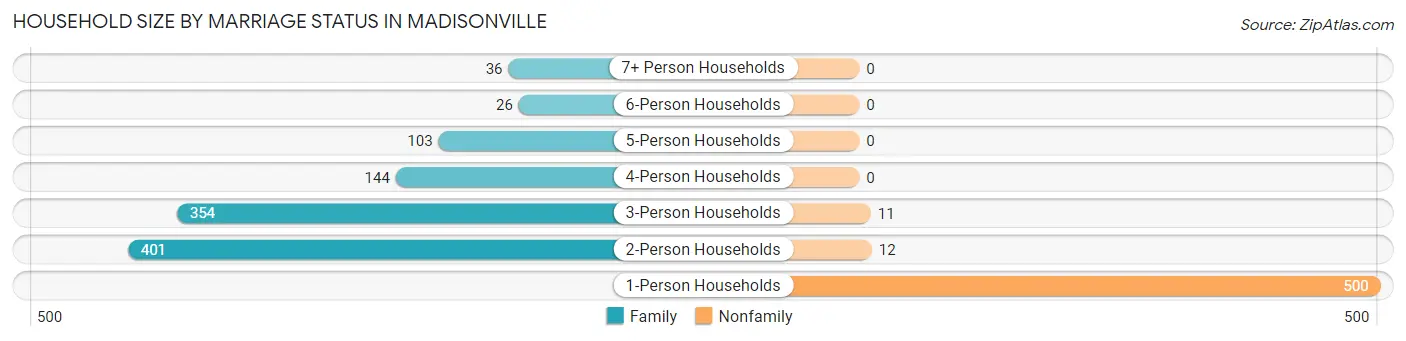
| Household Size | Family Households | Nonfamily Households |
| 1-Person Households | - | 500 (31.5%) |
| 2-Person Households | 401 (25.3%) | 12 (0.8%) |
| 3-Person Households | 354 (22.3%) | 11 (0.7%) |
| 4-Person Households | 144 (9.1%) | 0 (0.0%) |
| 5-Person Households | 103 (6.5%) | 0 (0.0%) |
| 6-Person Households | 26 (1.6%) | 0 (0.0%) |
| 7+ Person Households | 36 (2.3%) | 0 (0.0%) |
| Total | 1,064 (67.0%) | 523 (33.0%) |
Female Fertility in Madisonville
Fertility by Age in Madisonville
Average fertility rate in Madisonville is 15.0 births per 1,000 women. Women in the age bracket of 20 to 34 years have the highest fertility rate with 20.0 births per 1,000 women. Women in the age bracket of 20 to 34 years acount for 60.0% of all women with births.
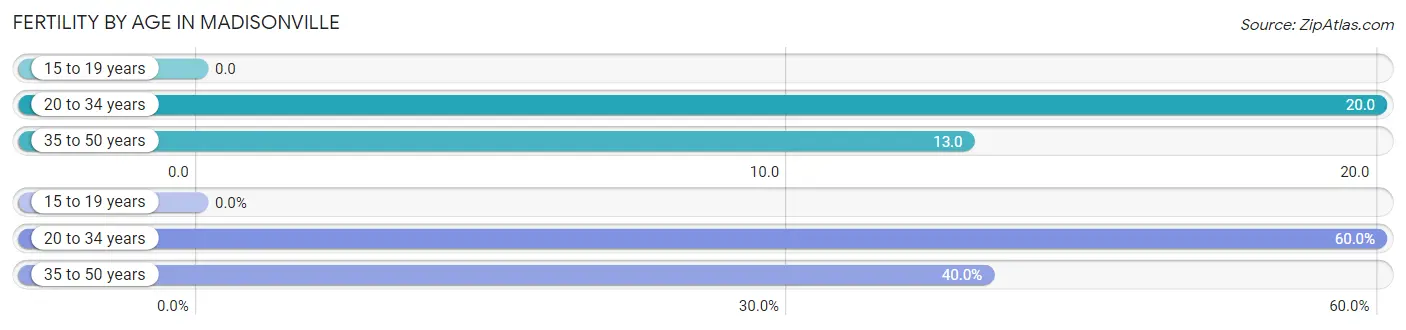
| Age Bracket | Women with Births | Births / 1,000 Women |
| 15 to 19 years | 0 (0.0%) | 0.0 |
| 20 to 34 years | 9 (60.0%) | 20.0 |
| 35 to 50 years | 6 (40.0%) | 13.0 |
| Total | 15 (100.0%) | 15.0 |
Fertility by Age by Marriage Status in Madisonville
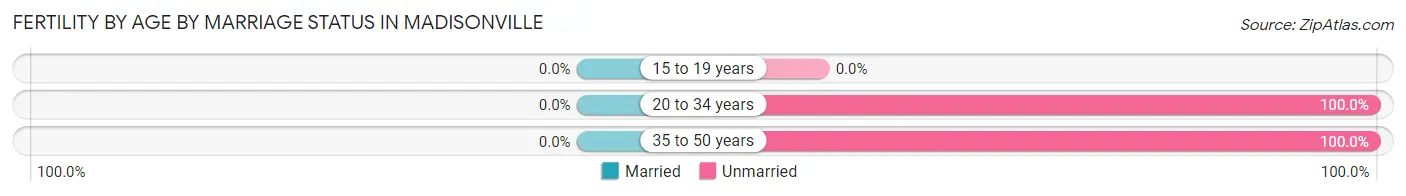
| Age Bracket | Married | Unmarried |
| 15 to 19 years | 0 (0.0%) | 0 (0.0%) |
| 20 to 34 years | 0 (0.0%) | 9 (100.0%) |
| 35 to 50 years | 0 (0.0%) | 6 (100.0%) |
| Total | 0 (0.0%) | 15 (100.0%) |
Fertility by Education in Madisonville
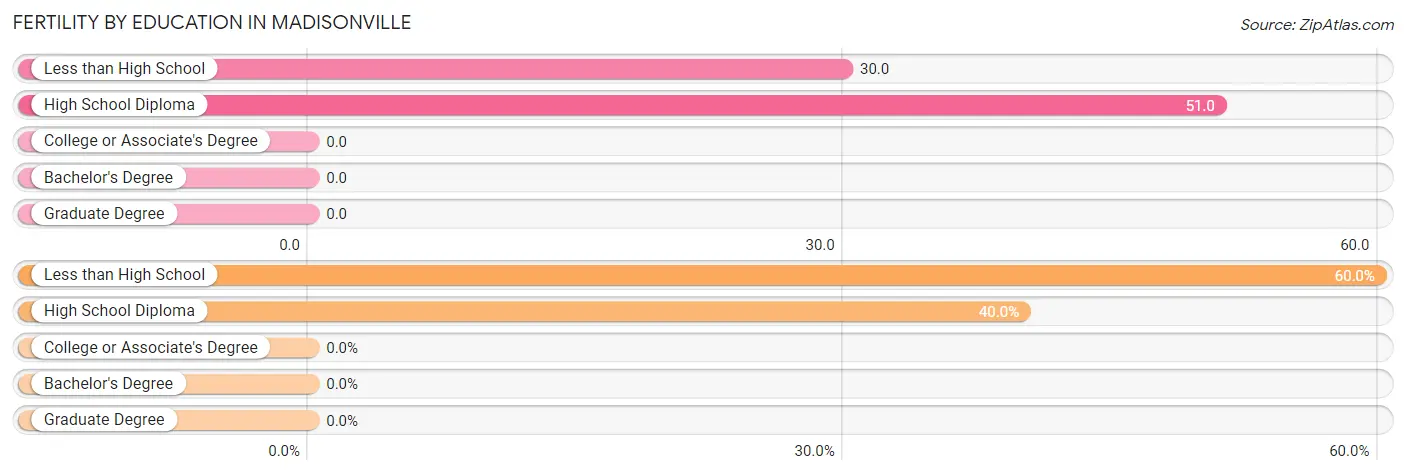
| Educational Attainment | Women with Births | Births / 1,000 Women |
| Less than High School | 9 (60.0%) | 30.0 |
| High School Diploma | 6 (40.0%) | 51.0 |
| College or Associate's Degree | 0 (0.0%) | 0.0 |
| Bachelor's Degree | 0 (0.0%) | 0.0 |
| Graduate Degree | 0 (0.0%) | 0.0 |
| Total | 15 (100.0%) | 15.0 |
Fertility by Education by Marriage Status in Madisonville
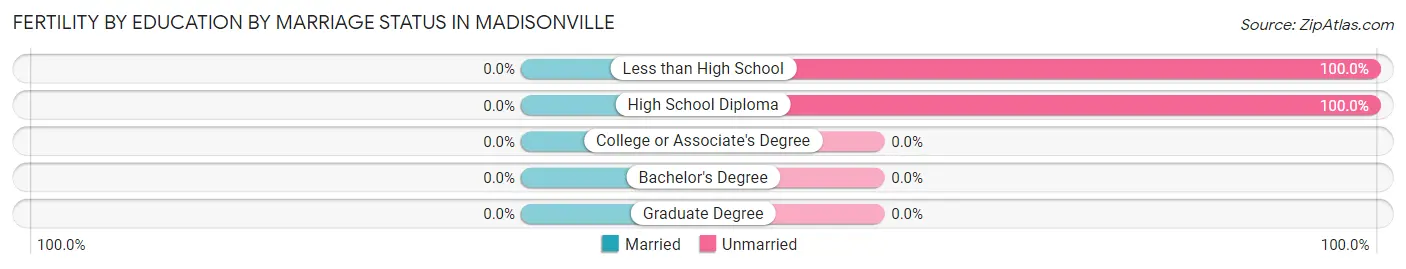
| Educational Attainment | Married | Unmarried |
| Less than High School | 0 (0.0%) | 9 (100.0%) |
| High School Diploma | 0 (0.0%) | 6 (100.0%) |
| College or Associate's Degree | 0 (0.0%) | 0 (0.0%) |
| Bachelor's Degree | 0 (0.0%) | 0 (0.0%) |
| Graduate Degree | 0 (0.0%) | 0 (0.0%) |
| Total | 0 (0.0%) | 15 (100.0%) |
Employment Characteristics in Madisonville
Employment by Class of Employer in Madisonville
Among the 2,239 employed individuals in Madisonville, private company employees (1,798 | 80.3%), state government employees (150 | 6.7%), and local government employees (108 | 4.8%) make up the most common classes of employment.
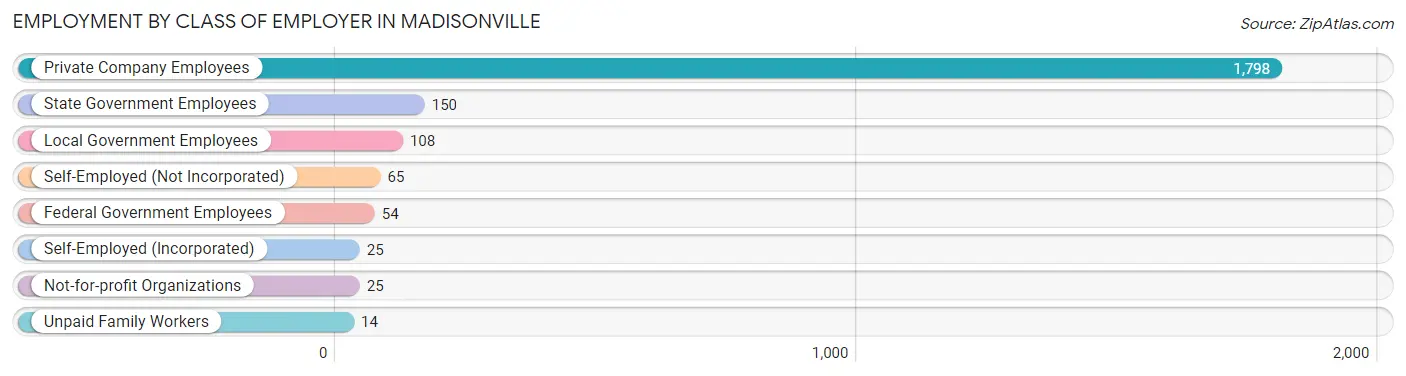
| Employer Class | # Employees | % Employees |
| Private Company Employees | 1,798 | 80.3% |
| Self-Employed (Incorporated) | 25 | 1.1% |
| Self-Employed (Not Incorporated) | 65 | 2.9% |
| Not-for-profit Organizations | 25 | 1.1% |
| Local Government Employees | 108 | 4.8% |
| State Government Employees | 150 | 6.7% |
| Federal Government Employees | 54 | 2.4% |
| Unpaid Family Workers | 14 | 0.6% |
| Total | 2,239 | 100.0% |
Employment Status by Age in Madisonville
According to the labor force statistics for Madisonville, out of the total population over 16 years of age (3,570), 63.0% or 2,249 individuals are in the labor force, with 0.5% or 11 of them unemployed. The age group with the highest labor force participation rate is 25 to 29 years, with 93.4% or 324 individuals in the labor force. Within the labor force, the 35 to 44 years age range has the highest percentage of unemployed individuals, with 1.8% or 11 of them being unemployed.
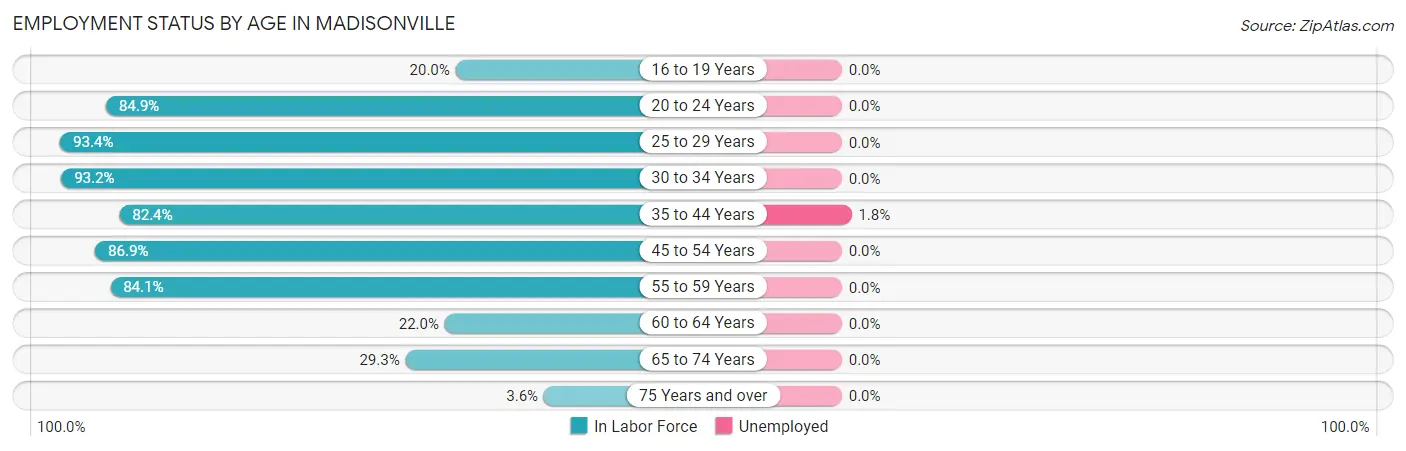
| Age Bracket | In Labor Force | Unemployed |
| 16 to 19 Years | 54 (20.0%) | 0 (0.0%) |
| 20 to 24 Years | 293 (84.9%) | 0 (0.0%) |
| 25 to 29 Years | 324 (93.4%) | 0 (0.0%) |
| 30 to 34 Years | 124 (93.2%) | 0 (0.0%) |
| 35 to 44 Years | 598 (82.4%) | 11 (1.8%) |
| 45 to 54 Years | 523 (86.9%) | 0 (0.0%) |
| 55 to 59 Years | 143 (84.1%) | 0 (0.0%) |
| 60 to 64 Years | 54 (22.0%) | 0 (0.0%) |
| 65 to 74 Years | 126 (29.3%) | 0 (0.0%) |
| 75 Years and over | 11 (3.6%) | 0 (0.0%) |
| Total | 2,249 (63.0%) | 11 (0.5%) |
Employment Status by Educational Attainment in Madisonville
According to labor force statistics for Madisonville, 79.4% of individuals (1,765) out of the total population between 25 and 64 years of age (2,223) are in the labor force, with 0.6% or 11 of them being unemployed. The group with the highest labor force participation rate are those with the educational attainment of college / associate degree, with 96.2% or 536 individuals in the labor force. Within the labor force, individuals with high school diploma education have the highest percentage of unemployment, with 2.3% or 11 of them being unemployed.
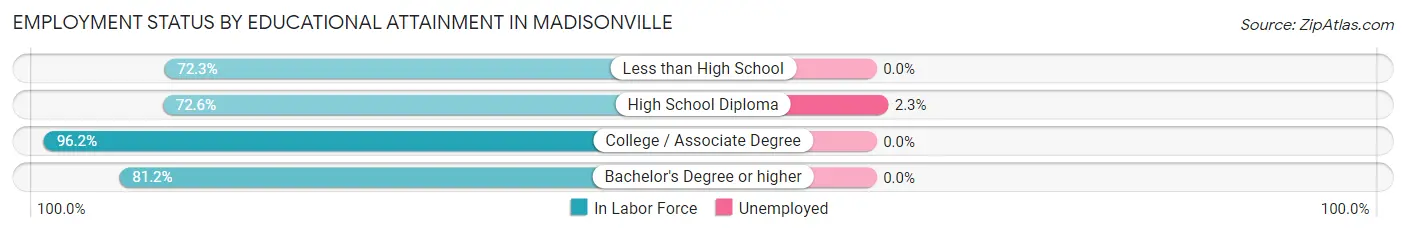
| Educational Attainment | In Labor Force | Unemployed |
| Less than High School | 536 (72.3%) | 0 (0.0%) |
| High School Diploma | 482 (72.6%) | 15 (2.3%) |
| College / Associate Degree | 536 (96.2%) | 0 (0.0%) |
| Bachelor's Degree or higher | 212 (81.2%) | 0 (0.0%) |
| Total | 1,765 (79.4%) | 13 (0.6%) |
Employment Occupations by Sex in Madisonville
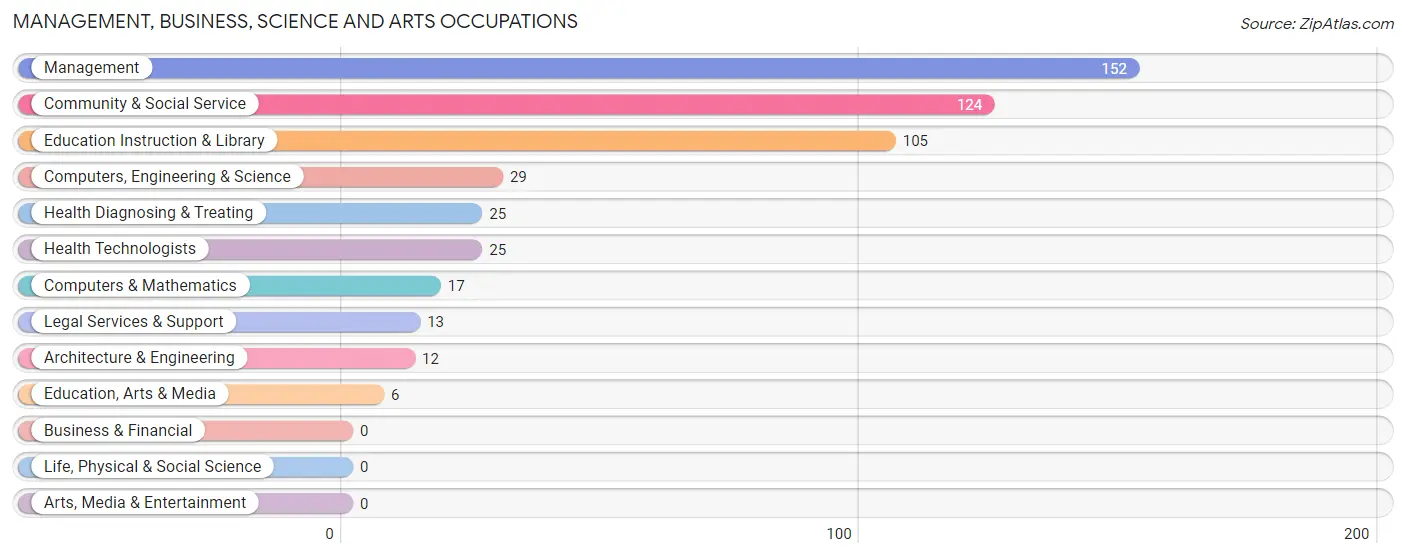
Management, Business, Science and Arts Occupations
The most common Management, Business, Science and Arts occupations in Madisonville are Management (152 | 6.8%), Community & Social Service (124 | 5.5%), Education Instruction & Library (105 | 4.7%), Computers, Engineering & Science (29 | 1.3%), and Health Diagnosing & Treating (25 | 1.1%).
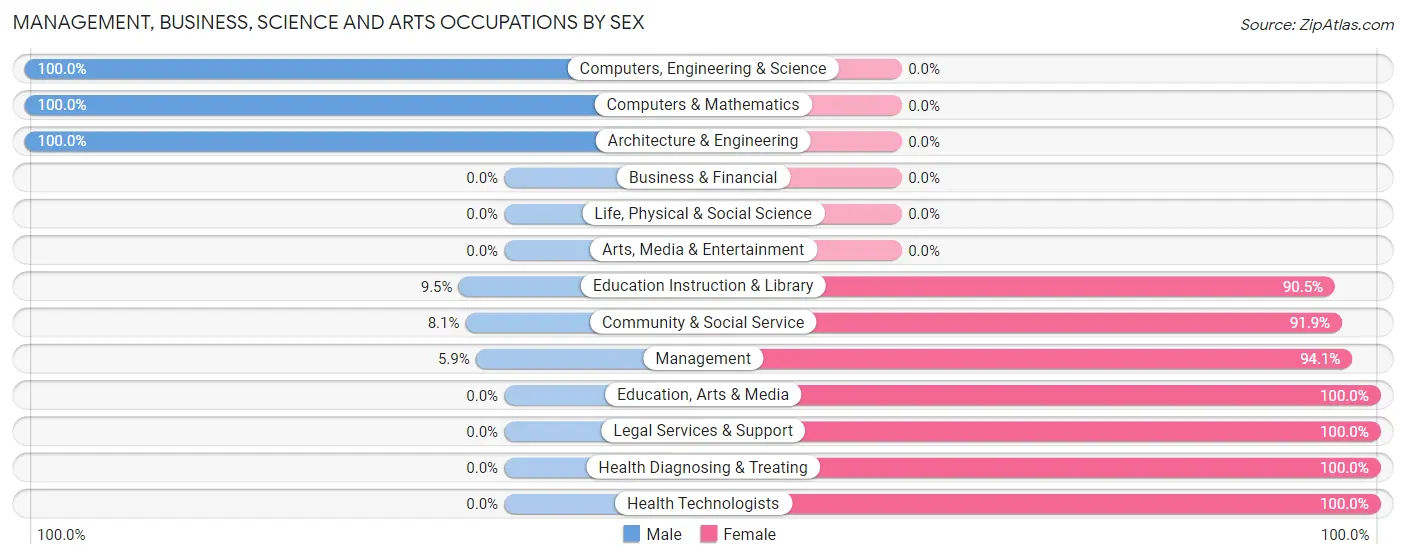
Management, Business, Science and Arts Occupations by Sex
Within the Management, Business, Science and Arts occupations in Madisonville, the most male-oriented occupations are Computers, Engineering & Science (100.0%), Computers & Mathematics (100.0%), and Architecture & Engineering (100.0%), while the most female-oriented occupations are Education, Arts & Media (100.0%), Legal Services & Support (100.0%), and Health Diagnosing & Treating (100.0%).
| Occupation | Male | Female |
| Management | 9 (5.9%) | 143 (94.1%) |
| Business & Financial | 0 (0.0%) | 0 (0.0%) |
| Computers, Engineering & Science | 29 (100.0%) | 0 (0.0%) |
| Computers & Mathematics | 17 (100.0%) | 0 (0.0%) |
| Architecture & Engineering | 12 (100.0%) | 0 (0.0%) |
| Life, Physical & Social Science | 0 (0.0%) | 0 (0.0%) |
| Community & Social Service | 10 (8.1%) | 114 (91.9%) |
| Education, Arts & Media | 0 (0.0%) | 6 (100.0%) |
| Legal Services & Support | 0 (0.0%) | 13 (100.0%) |
| Education Instruction & Library | 10 (9.5%) | 95 (90.5%) |
| Arts, Media & Entertainment | 0 (0.0%) | 0 (0.0%) |
| Health Diagnosing & Treating | 0 (0.0%) | 25 (100.0%) |
| Health Technologists | 0 (0.0%) | 25 (100.0%) |
| Total (Category) | 48 (14.5%) | 282 (85.5%) |
| Total (Overall) | 1,086 (48.5%) | 1,153 (51.5%) |
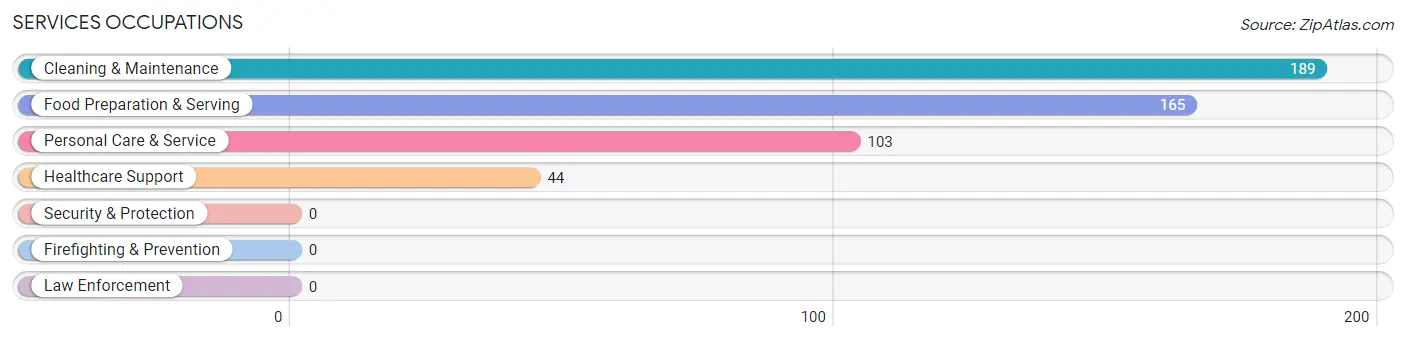
Services Occupations
The most common Services occupations in Madisonville are Cleaning & Maintenance (189 | 8.4%), Food Preparation & Serving (165 | 7.4%), Personal Care & Service (103 | 4.6%), and Healthcare Support (44 | 2.0%).
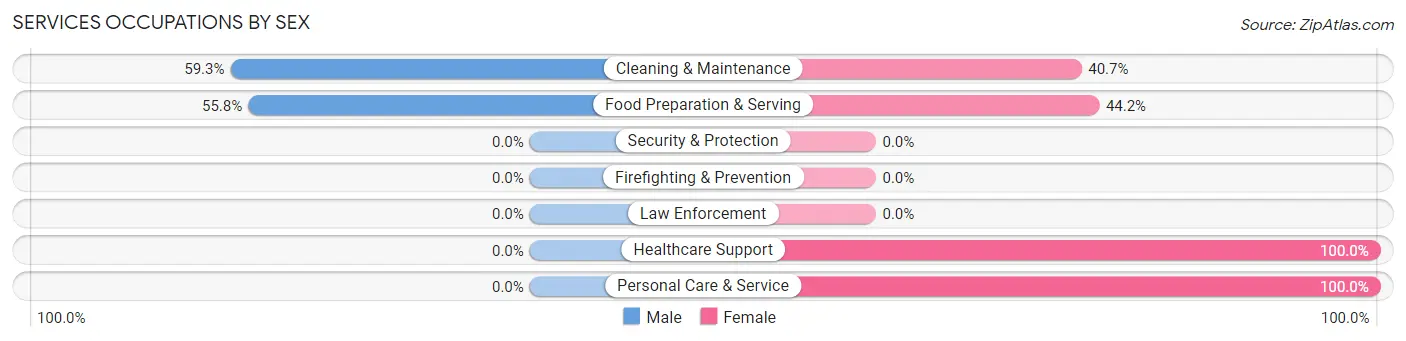
Services Occupations by Sex
Within the Services occupations in Madisonville, the most male-oriented occupations are Cleaning & Maintenance (59.3%), and Food Preparation & Serving (55.8%), while the most female-oriented occupations are Healthcare Support (100.0%), Personal Care & Service (100.0%), and Food Preparation & Serving (44.2%).
| Occupation | Male | Female |
| Healthcare Support | 0 (0.0%) | 44 (100.0%) |
| Security & Protection | 0 (0.0%) | 0 (0.0%) |
| Firefighting & Prevention | 0 (0.0%) | 0 (0.0%) |
| Law Enforcement | 0 (0.0%) | 0 (0.0%) |
| Food Preparation & Serving | 92 (55.8%) | 73 (44.2%) |
| Cleaning & Maintenance | 112 (59.3%) | 77 (40.7%) |
| Personal Care & Service | 0 (0.0%) | 103 (100.0%) |
| Total (Category) | 204 (40.7%) | 297 (59.3%) |
| Total (Overall) | 1,086 (48.5%) | 1,153 (51.5%) |
Sales and Office Occupations
The most common Sales and Office occupations in Madisonville are Office & Administration (301 | 13.4%), and Sales & Related (231 | 10.3%).

Sales and Office Occupations by Sex

| Occupation | Male | Female |
| Sales & Related | 102 (44.2%) | 129 (55.8%) |
| Office & Administration | 51 (16.9%) | 250 (83.1%) |
| Total (Category) | 153 (28.8%) | 379 (71.2%) |
| Total (Overall) | 1,086 (48.5%) | 1,153 (51.5%) |
Natural Resources, Construction and Maintenance Occupations
The most common Natural Resources, Construction and Maintenance occupations in Madisonville are Farming, Fishing & Forestry (363 | 16.2%), Construction & Extraction (100 | 4.5%), and Installation, Maintenance & Repair (54 | 2.4%).

Natural Resources, Construction and Maintenance Occupations by Sex

| Occupation | Male | Female |
| Farming, Fishing & Forestry | 187 (51.5%) | 176 (48.5%) |
| Construction & Extraction | 92 (92.0%) | 8 (8.0%) |
| Installation, Maintenance & Repair | 54 (100.0%) | 0 (0.0%) |
| Total (Category) | 333 (64.4%) | 184 (35.6%) |
| Total (Overall) | 1,086 (48.5%) | 1,153 (51.5%) |
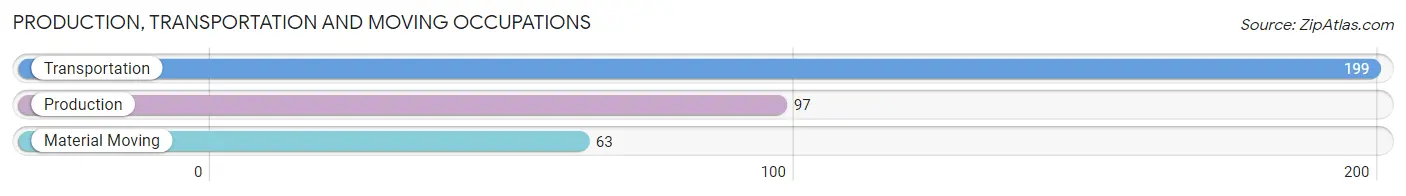
Production, Transportation and Moving Occupations
The most common Production, Transportation and Moving occupations in Madisonville are Transportation (199 | 8.9%), Production (97 | 4.3%), and Material Moving (63 | 2.8%).
Production, Transportation and Moving Occupations by Sex
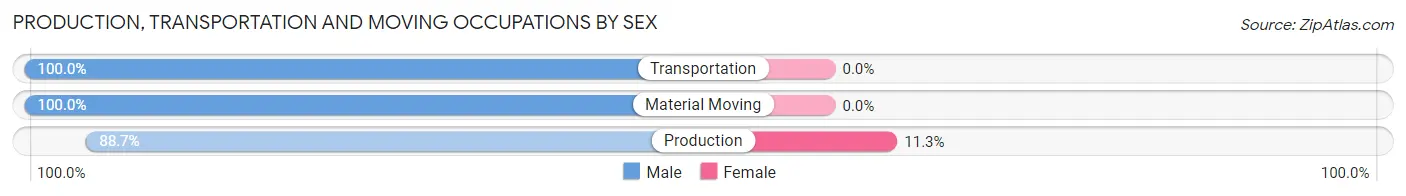
| Occupation | Male | Female |
| Production | 86 (88.7%) | 11 (11.3%) |
| Transportation | 199 (100.0%) | 0 (0.0%) |
| Material Moving | 63 (100.0%) | 0 (0.0%) |
| Total (Category) | 348 (96.9%) | 11 (3.1%) |
| Total (Overall) | 1,086 (48.5%) | 1,153 (51.5%) |
Employment Industries by Sex in Madisonville
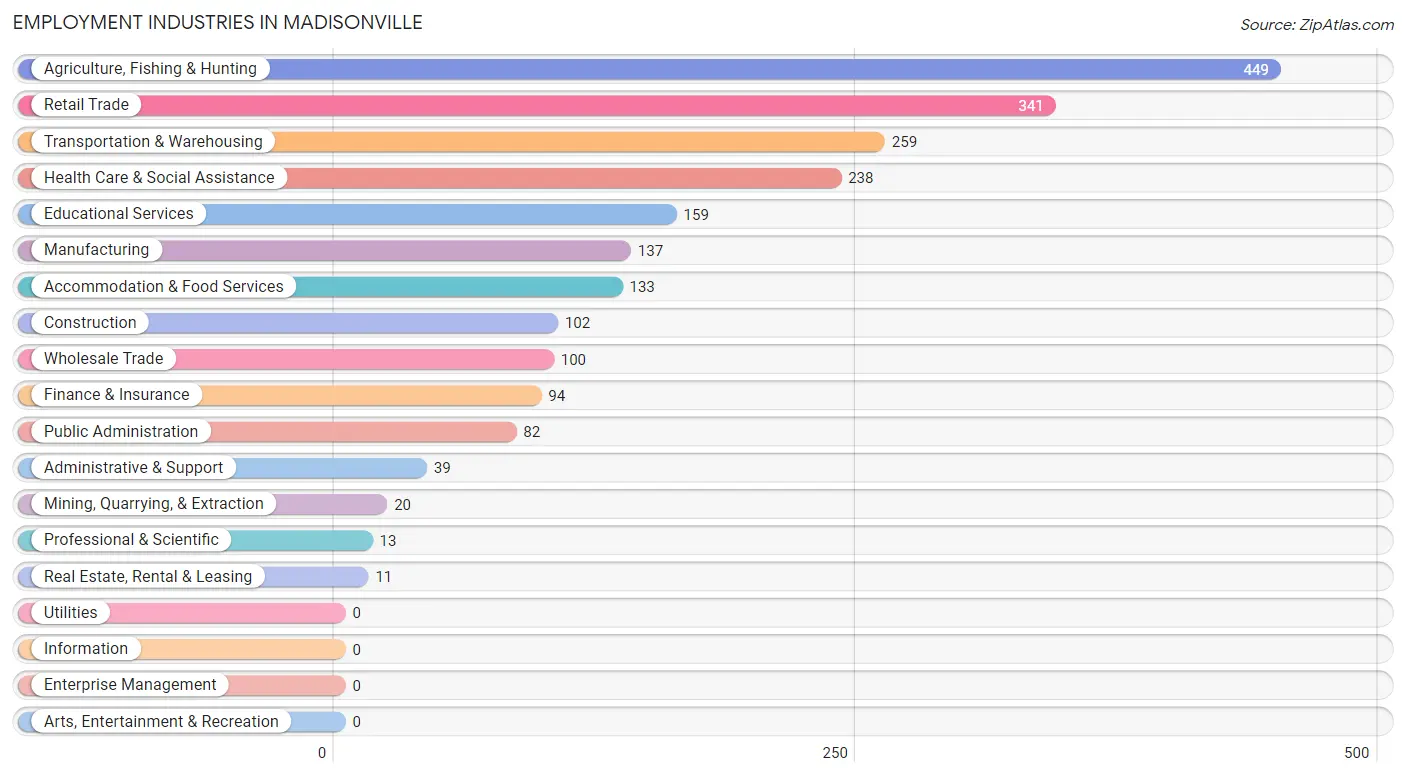
Employment Industries in Madisonville
The major employment industries in Madisonville include Agriculture, Fishing & Hunting (449 | 20.1%), Retail Trade (341 | 15.2%), Transportation & Warehousing (259 | 11.6%), Health Care & Social Assistance (238 | 10.6%), and Educational Services (159 | 7.1%).
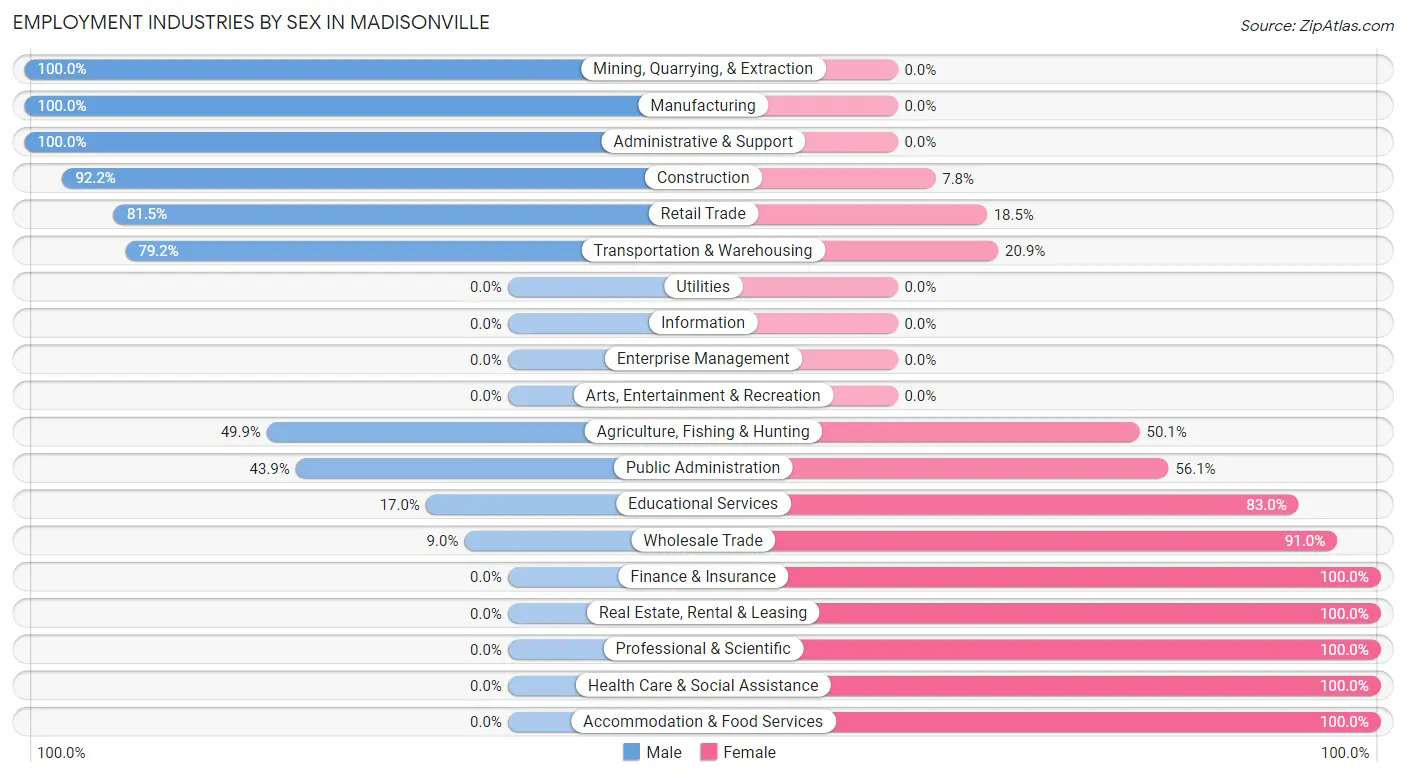
Employment Industries by Sex in Madisonville
The Madisonville industries that see more men than women are Mining, Quarrying, & Extraction (100.0%), Manufacturing (100.0%), and Administrative & Support (100.0%), whereas the industries that tend to have a higher number of women are Finance & Insurance (100.0%), Real Estate, Rental & Leasing (100.0%), and Professional & Scientific (100.0%).
| Industry | Male | Female |
| Agriculture, Fishing & Hunting | 224 (49.9%) | 225 (50.1%) |
| Mining, Quarrying, & Extraction | 20 (100.0%) | 0 (0.0%) |
| Construction | 94 (92.2%) | 8 (7.8%) |
| Manufacturing | 137 (100.0%) | 0 (0.0%) |
| Wholesale Trade | 9 (9.0%) | 91 (91.0%) |
| Retail Trade | 278 (81.5%) | 63 (18.5%) |
| Transportation & Warehousing | 205 (79.1%) | 54 (20.8%) |
| Utilities | 0 (0.0%) | 0 (0.0%) |
| Information | 0 (0.0%) | 0 (0.0%) |
| Finance & Insurance | 0 (0.0%) | 94 (100.0%) |
| Real Estate, Rental & Leasing | 0 (0.0%) | 11 (100.0%) |
| Professional & Scientific | 0 (0.0%) | 13 (100.0%) |
| Enterprise Management | 0 (0.0%) | 0 (0.0%) |
| Administrative & Support | 39 (100.0%) | 0 (0.0%) |
| Educational Services | 27 (17.0%) | 132 (83.0%) |
| Health Care & Social Assistance | 0 (0.0%) | 238 (100.0%) |
| Arts, Entertainment & Recreation | 0 (0.0%) | 0 (0.0%) |
| Accommodation & Food Services | 0 (0.0%) | 133 (100.0%) |
| Public Administration | 36 (43.9%) | 46 (56.1%) |
| Total | 1,086 (48.5%) | 1,153 (51.5%) |
Education in Madisonville
School Enrollment in Madisonville
The most common levels of schooling among the 1,264 students in Madisonville are high school (379 | 30.0%), middle school (261 | 20.6%), and college / undergraduate (252 | 19.9%).
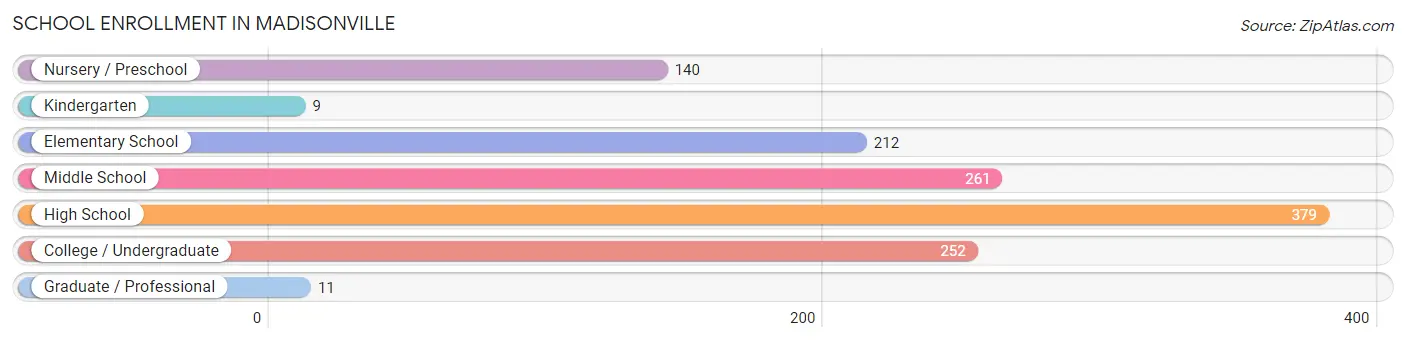
| School Level | # Students | % Students |
| Nursery / Preschool | 140 | 11.1% |
| Kindergarten | 9 | 0.7% |
| Elementary School | 212 | 16.8% |
| Middle School | 261 | 20.6% |
| High School | 379 | 30.0% |
| College / Undergraduate | 252 | 19.9% |
| Graduate / Professional | 11 | 0.9% |
| Total | 1,264 | 100.0% |
School Enrollment by Age by Funding Source in Madisonville
Out of a total of 1,264 students who are enrolled in schools in Madisonville, 62 (4.9%) attend a private institution, while the remaining 1,202 (95.1%) are enrolled in public schools. The age group of 18 to 19 year olds has the highest likelihood of being enrolled in private schools, with 21 (22.8% in the age bracket) enrolled. Conversely, the age group of 3 to 4 year olds has the lowest likelihood of being enrolled in a private school, with 114 (100.0% in the age bracket) attending a public institution.
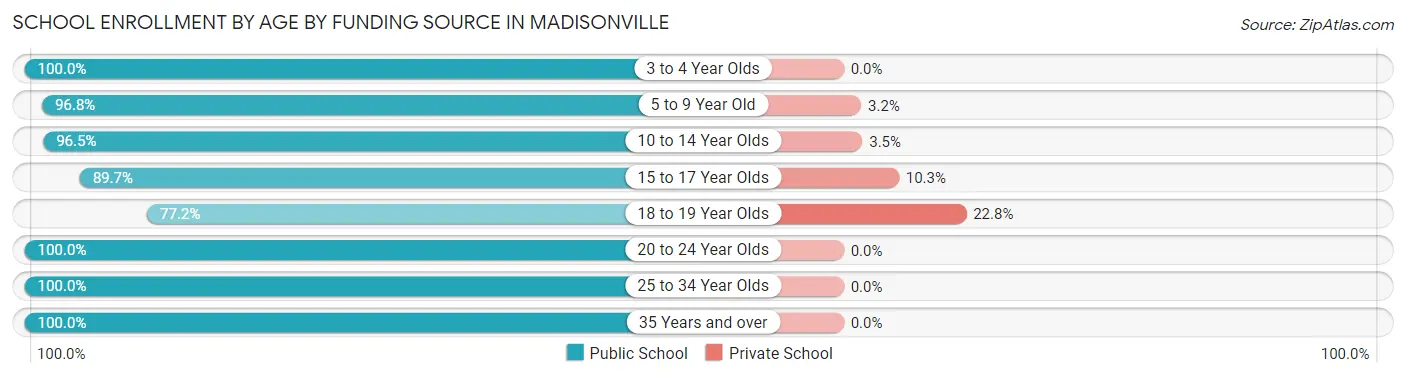
| Age Bracket | Public School | Private School |
| 3 to 4 Year Olds | 114 (100.0%) | 0 (0.0%) |
| 5 to 9 Year Old | 239 (96.8%) | 8 (3.2%) |
| 10 to 14 Year Olds | 278 (96.5%) | 10 (3.5%) |
| 15 to 17 Year Olds | 201 (89.7%) | 23 (10.3%) |
| 18 to 19 Year Olds | 71 (77.2%) | 21 (22.8%) |
| 20 to 24 Year Olds | 157 (100.0%) | 0 (0.0%) |
| 25 to 34 Year Olds | 78 (100.0%) | 0 (0.0%) |
| 35 Years and over | 64 (100.0%) | 0 (0.0%) |
| Total | 1,202 (95.1%) | 62 (4.9%) |
Educational Attainment by Field of Study in Madisonville
Education (102 | 24.5%), business (72 | 17.3%), arts & humanities (68 | 16.3%), social sciences (44 | 10.5%), and science & technology (34 | 8.2%) are the most common fields of study among 417 individuals in Madisonville who have obtained a bachelor's degree or higher.
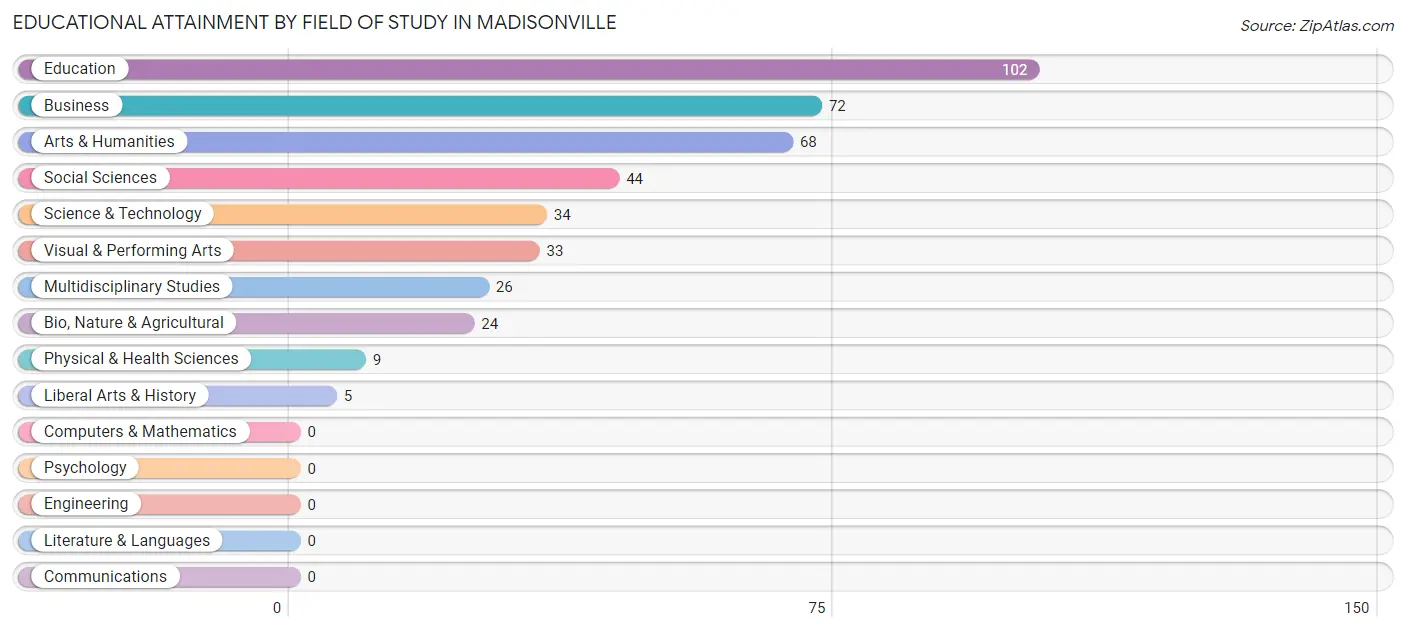
| Field of Study | # Graduates | % Graduates |
| Computers & Mathematics | 0 | 0.0% |
| Bio, Nature & Agricultural | 24 | 5.8% |
| Physical & Health Sciences | 9 | 2.2% |
| Psychology | 0 | 0.0% |
| Social Sciences | 44 | 10.5% |
| Engineering | 0 | 0.0% |
| Multidisciplinary Studies | 26 | 6.2% |
| Science & Technology | 34 | 8.2% |
| Business | 72 | 17.3% |
| Education | 102 | 24.5% |
| Literature & Languages | 0 | 0.0% |
| Liberal Arts & History | 5 | 1.2% |
| Visual & Performing Arts | 33 | 7.9% |
| Communications | 0 | 0.0% |
| Arts & Humanities | 68 | 16.3% |
| Total | 417 | 100.0% |
Transportation & Commute in Madisonville
Vehicle Availability by Sex in Madisonville
The most prevalent vehicle ownership categories in Madisonville are males with 2 vehicles (442, accounting for 40.7%) and females with 2 vehicles (306, making up 38.3%).
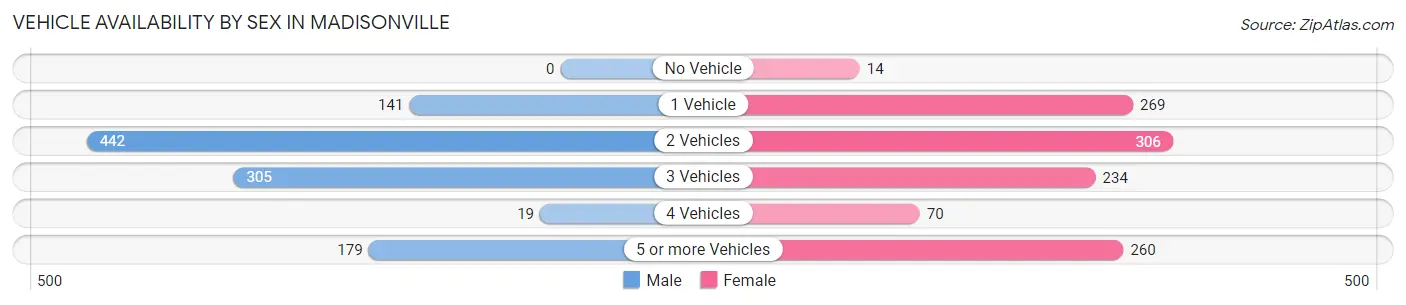
| Vehicles Available | Male | Female |
| No Vehicle | 0 (0.0%) | 14 (1.2%) |
| 1 Vehicle | 141 (13.0%) | 269 (23.3%) |
| 2 Vehicles | 442 (40.7%) | 306 (26.5%) |
| 3 Vehicles | 305 (28.1%) | 234 (20.3%) |
| 4 Vehicles | 19 (1.8%) | 70 (6.1%) |
| 5 or more Vehicles | 179 (16.5%) | 260 (22.6%) |
| Total | 1,086 (100.0%) | 1,153 (100.0%) |
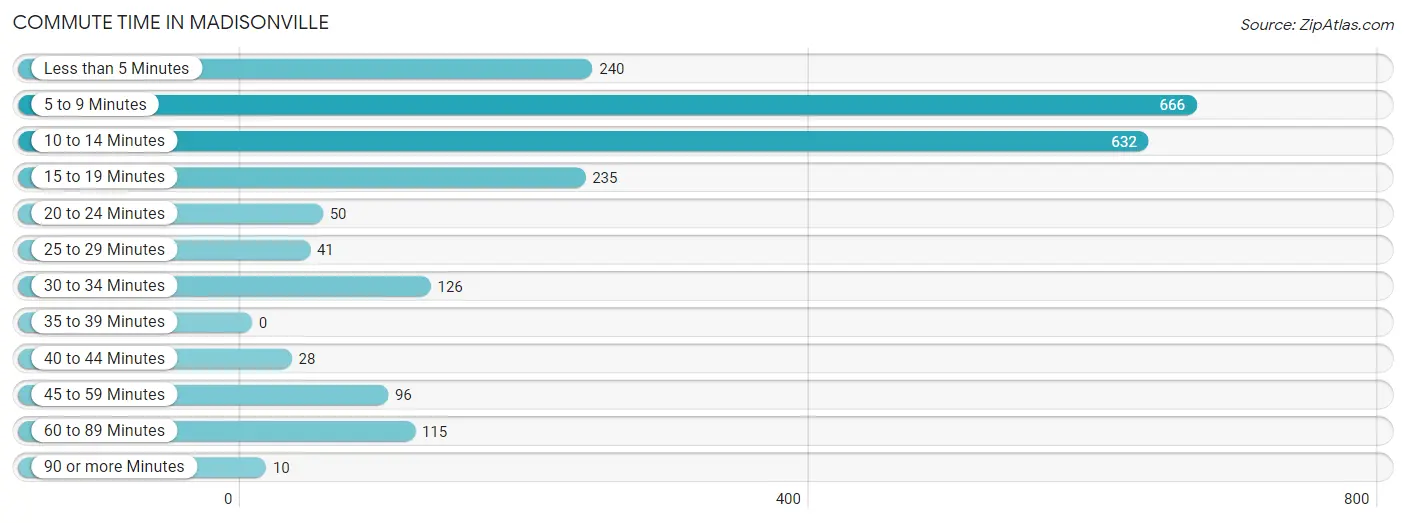
Commute Time in Madisonville
The most frequently occuring commute durations in Madisonville are 5 to 9 minutes (666 commuters, 29.7%), 10 to 14 minutes (632 commuters, 28.2%), and less than 5 minutes (240 commuters, 10.7%).
| Commute Time | # Commuters | % Commuters |
| Less than 5 Minutes | 240 | 10.7% |
| 5 to 9 Minutes | 666 | 29.7% |
| 10 to 14 Minutes | 632 | 28.2% |
| 15 to 19 Minutes | 235 | 10.5% |
| 20 to 24 Minutes | 50 | 2.2% |
| 25 to 29 Minutes | 41 | 1.8% |
| 30 to 34 Minutes | 126 | 5.6% |
| 35 to 39 Minutes | 0 | 0.0% |
| 40 to 44 Minutes | 28 | 1.3% |
| 45 to 59 Minutes | 96 | 4.3% |
| 60 to 89 Minutes | 115 | 5.1% |
| 90 or more Minutes | 10 | 0.4% |
Commute Time by Sex in Madisonville
The most common commute times in Madisonville are 10 to 14 minutes (370 commuters, 34.1%) for males and 5 to 9 minutes (389 commuters, 33.7%) for females.
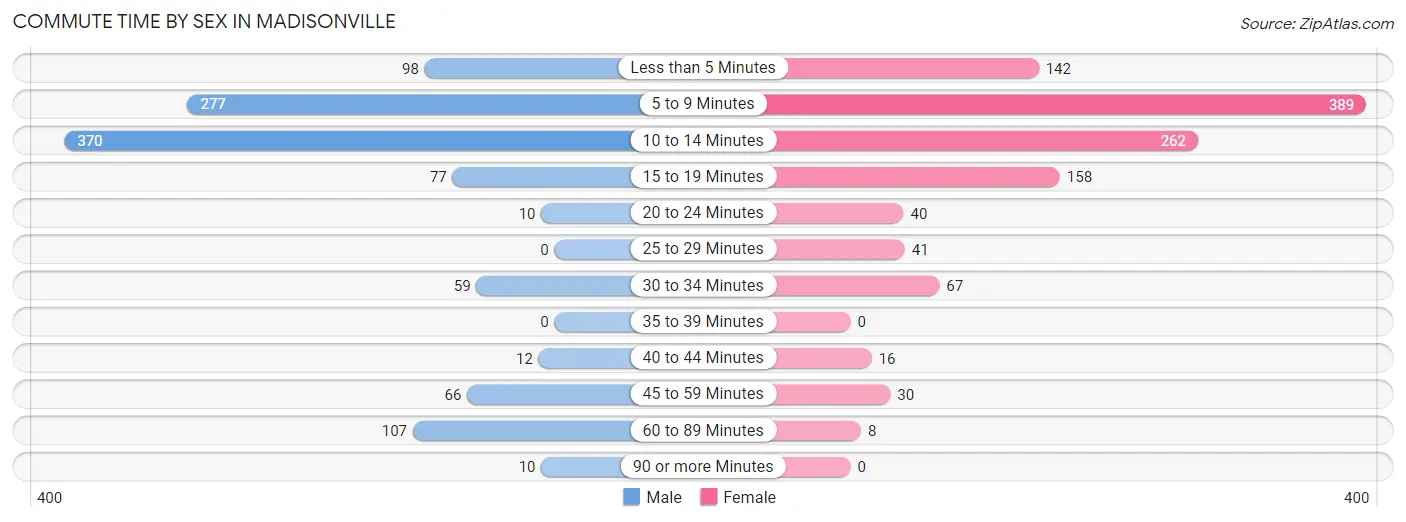
| Commute Time | Male | Female |
| Less than 5 Minutes | 98 (9.0%) | 142 (12.3%) |
| 5 to 9 Minutes | 277 (25.5%) | 389 (33.7%) |
| 10 to 14 Minutes | 370 (34.1%) | 262 (22.7%) |
| 15 to 19 Minutes | 77 (7.1%) | 158 (13.7%) |
| 20 to 24 Minutes | 10 (0.9%) | 40 (3.5%) |
| 25 to 29 Minutes | 0 (0.0%) | 41 (3.6%) |
| 30 to 34 Minutes | 59 (5.4%) | 67 (5.8%) |
| 35 to 39 Minutes | 0 (0.0%) | 0 (0.0%) |
| 40 to 44 Minutes | 12 (1.1%) | 16 (1.4%) |
| 45 to 59 Minutes | 66 (6.1%) | 30 (2.6%) |
| 60 to 89 Minutes | 107 (9.9%) | 8 (0.7%) |
| 90 or more Minutes | 10 (0.9%) | 0 (0.0%) |
Time of Departure to Work by Sex in Madisonville
The most frequent times of departure to work in Madisonville are 7:00 AM to 7:29 AM (253, 23.3%) for males and 7:00 AM to 7:29 AM (251, 21.8%) for females.
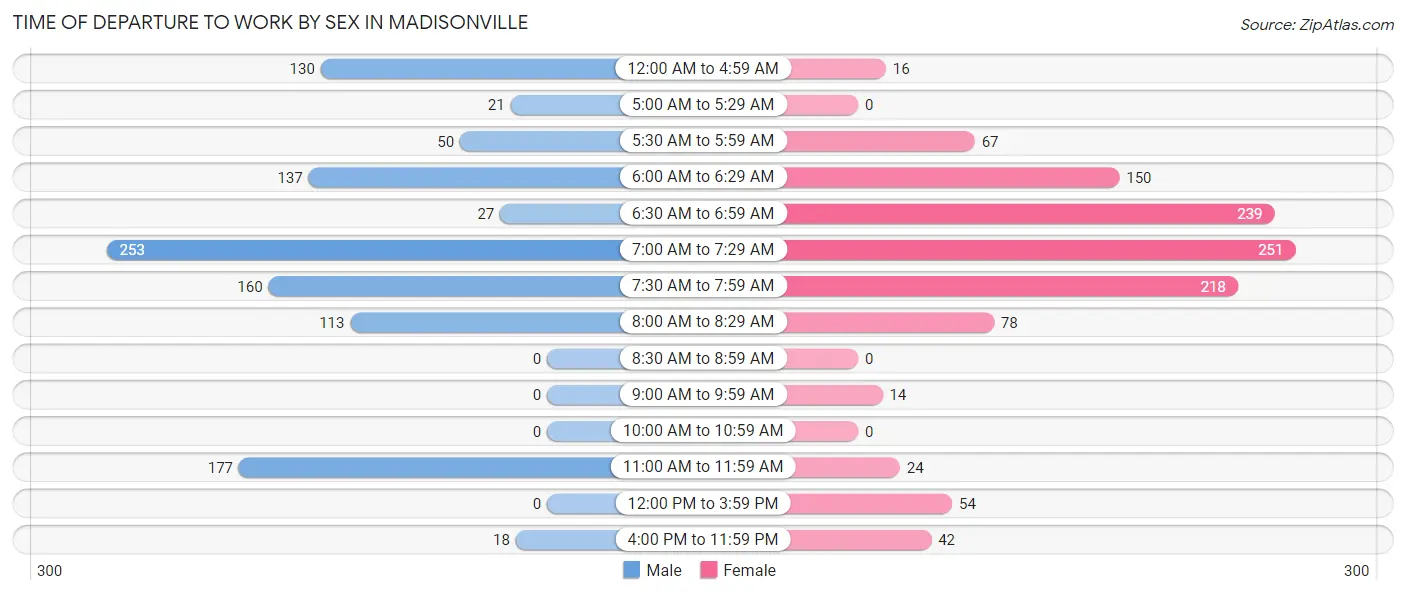
| Time of Departure | Male | Female |
| 12:00 AM to 4:59 AM | 130 (12.0%) | 16 (1.4%) |
| 5:00 AM to 5:29 AM | 21 (1.9%) | 0 (0.0%) |
| 5:30 AM to 5:59 AM | 50 (4.6%) | 67 (5.8%) |
| 6:00 AM to 6:29 AM | 137 (12.6%) | 150 (13.0%) |
| 6:30 AM to 6:59 AM | 27 (2.5%) | 239 (20.7%) |
| 7:00 AM to 7:29 AM | 253 (23.3%) | 251 (21.8%) |
| 7:30 AM to 7:59 AM | 160 (14.7%) | 218 (18.9%) |
| 8:00 AM to 8:29 AM | 113 (10.4%) | 78 (6.8%) |
| 8:30 AM to 8:59 AM | 0 (0.0%) | 0 (0.0%) |
| 9:00 AM to 9:59 AM | 0 (0.0%) | 14 (1.2%) |
| 10:00 AM to 10:59 AM | 0 (0.0%) | 0 (0.0%) |
| 11:00 AM to 11:59 AM | 177 (16.3%) | 24 (2.1%) |
| 12:00 PM to 3:59 PM | 0 (0.0%) | 54 (4.7%) |
| 4:00 PM to 11:59 PM | 18 (1.7%) | 42 (3.6%) |
| Total | 1,086 (100.0%) | 1,153 (100.0%) |
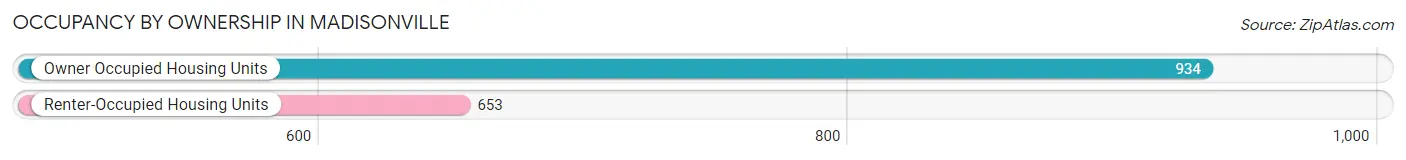
Housing Occupancy in Madisonville
Occupancy by Ownership in Madisonville
Of the total 1,587 dwellings in Madisonville, owner-occupied units account for 934 (58.9%), while renter-occupied units make up 653 (41.1%).
| Occupancy | # Housing Units | % Housing Units |
| Owner Occupied Housing Units | 934 | 58.9% |
| Renter-Occupied Housing Units | 653 | 41.1% |
| Total Occupied Housing Units | 1,587 | 100.0% |
Occupancy by Household Size in Madisonville
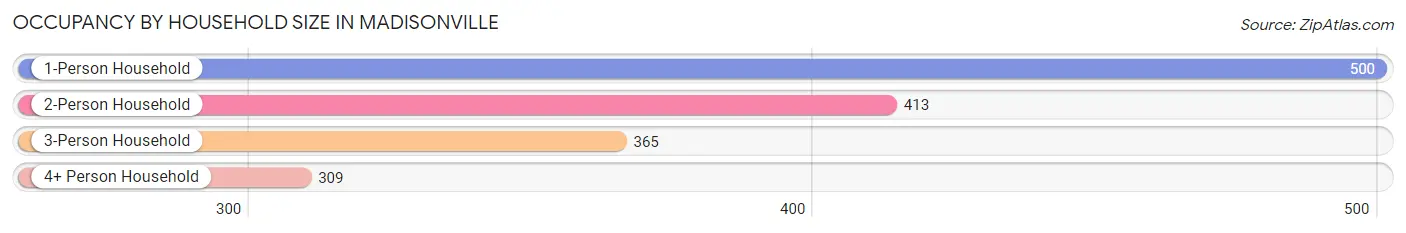
| Household Size | # Housing Units | % Housing Units |
| 1-Person Household | 500 | 31.5% |
| 2-Person Household | 413 | 26.0% |
| 3-Person Household | 365 | 23.0% |
| 4+ Person Household | 309 | 19.5% |
| Total Housing Units | 1,587 | 100.0% |
Occupancy by Ownership by Household Size in Madisonville
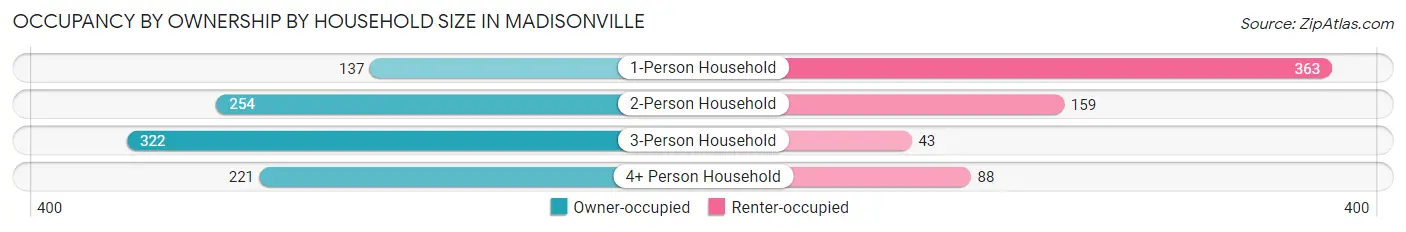
| Household Size | Owner-occupied | Renter-occupied |
| 1-Person Household | 137 (27.4%) | 363 (72.6%) |
| 2-Person Household | 254 (61.5%) | 159 (38.5%) |
| 3-Person Household | 322 (88.2%) | 43 (11.8%) |
| 4+ Person Household | 221 (71.5%) | 88 (28.5%) |
| Total Housing Units | 934 (58.9%) | 653 (41.1%) |
Occupancy by Educational Attainment in Madisonville
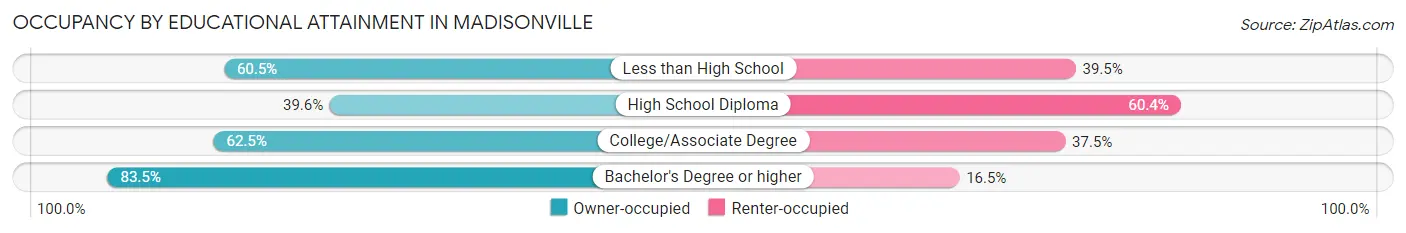
| Household Size | Owner-occupied | Renter-occupied |
| Less than High School | 260 (60.5%) | 170 (39.5%) |
| High School Diploma | 174 (39.6%) | 265 (60.4%) |
| College/Associate Degree | 297 (62.5%) | 178 (37.5%) |
| Bachelor's Degree or higher | 203 (83.5%) | 40 (16.5%) |
Occupancy by Age of Householder in Madisonville
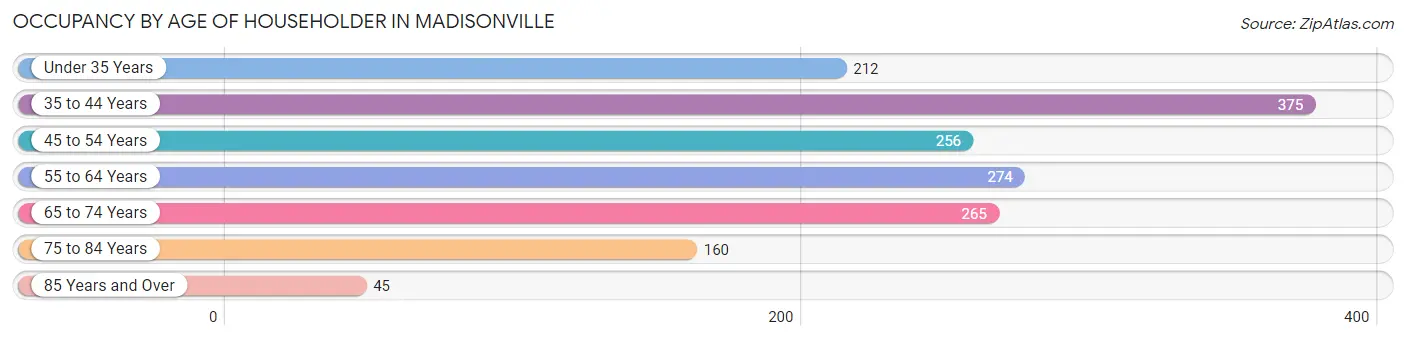
| Age Bracket | # Households | % Households |
| Under 35 Years | 212 | 13.4% |
| 35 to 44 Years | 375 | 23.6% |
| 45 to 54 Years | 256 | 16.1% |
| 55 to 64 Years | 274 | 17.3% |
| 65 to 74 Years | 265 | 16.7% |
| 75 to 84 Years | 160 | 10.1% |
| 85 Years and Over | 45 | 2.8% |
| Total | 1,587 | 100.0% |
Housing Finances in Madisonville
Median Income by Occupancy in Madisonville
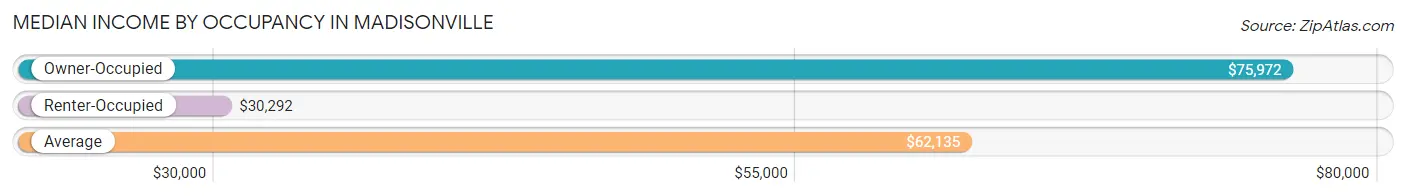
| Occupancy Type | # Households | Median Income |
| Owner-Occupied | 934 (58.9%) | $75,972 |
| Renter-Occupied | 653 (41.1%) | $30,292 |
| Average | 1,587 (100.0%) | $62,135 |
Occupancy by Householder Income Bracket in Madisonville
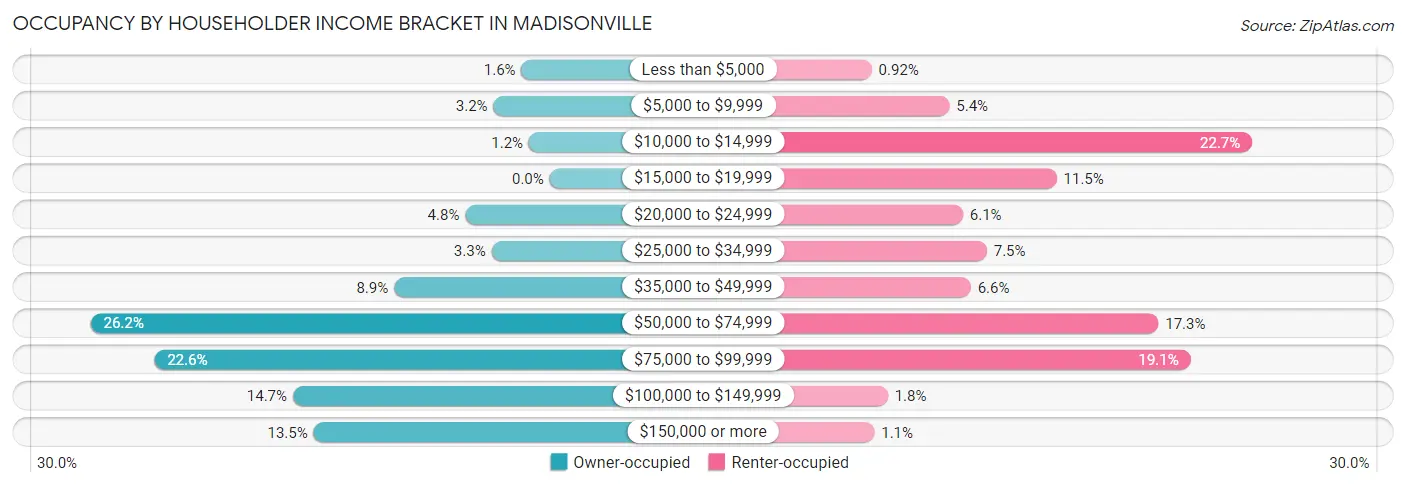
| Income Bracket | Owner-occupied | Renter-occupied |
| Less than $5,000 | 15 (1.6%) | 6 (0.9%) |
| $5,000 to $9,999 | 30 (3.2%) | 35 (5.4%) |
| $10,000 to $14,999 | 11 (1.2%) | 148 (22.7%) |
| $15,000 to $19,999 | 0 (0.0%) | 75 (11.5%) |
| $20,000 to $24,999 | 45 (4.8%) | 40 (6.1%) |
| $25,000 to $34,999 | 31 (3.3%) | 49 (7.5%) |
| $35,000 to $49,999 | 83 (8.9%) | 43 (6.6%) |
| $50,000 to $74,999 | 245 (26.2%) | 113 (17.3%) |
| $75,000 to $99,999 | 211 (22.6%) | 125 (19.1%) |
| $100,000 to $149,999 | 137 (14.7%) | 12 (1.8%) |
| $150,000 or more | 126 (13.5%) | 7 (1.1%) |
| Total | 934 (100.0%) | 653 (100.0%) |
Monthly Housing Cost Tiers in Madisonville
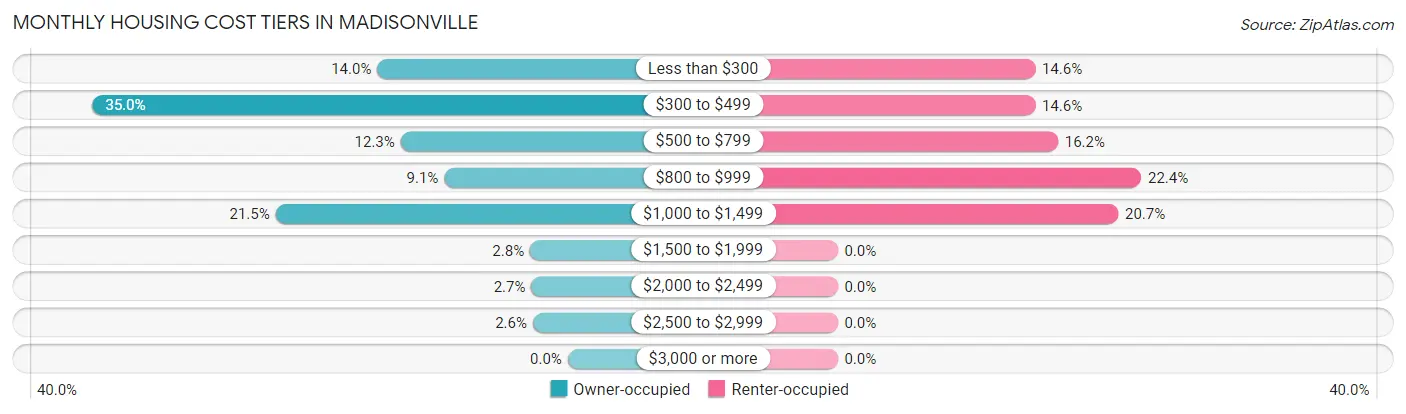
| Monthly Cost | Owner-occupied | Renter-occupied |
| Less than $300 | 131 (14.0%) | 95 (14.5%) |
| $300 to $499 | 327 (35.0%) | 95 (14.5%) |
| $500 to $799 | 115 (12.3%) | 106 (16.2%) |
| $800 to $999 | 85 (9.1%) | 146 (22.4%) |
| $1,000 to $1,499 | 201 (21.5%) | 135 (20.7%) |
| $1,500 to $1,999 | 26 (2.8%) | 0 (0.0%) |
| $2,000 to $2,499 | 25 (2.7%) | 0 (0.0%) |
| $2,500 to $2,999 | 24 (2.6%) | 0 (0.0%) |
| $3,000 or more | 0 (0.0%) | 0 (0.0%) |
| Total | 934 (100.0%) | 653 (100.0%) |
Physical Housing Characteristics in Madisonville
Housing Structures in Madisonville
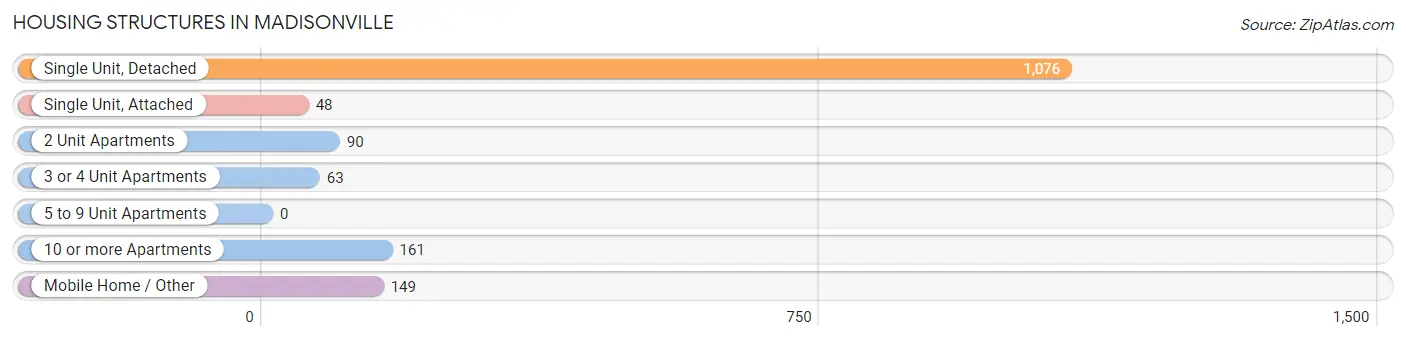
| Structure Type | # Housing Units | % Housing Units |
| Single Unit, Detached | 1,076 | 67.8% |
| Single Unit, Attached | 48 | 3.0% |
| 2 Unit Apartments | 90 | 5.7% |
| 3 or 4 Unit Apartments | 63 | 4.0% |
| 5 to 9 Unit Apartments | 0 | 0.0% |
| 10 or more Apartments | 161 | 10.1% |
| Mobile Home / Other | 149 | 9.4% |
| Total | 1,587 | 100.0% |
Housing Structures by Occupancy in Madisonville
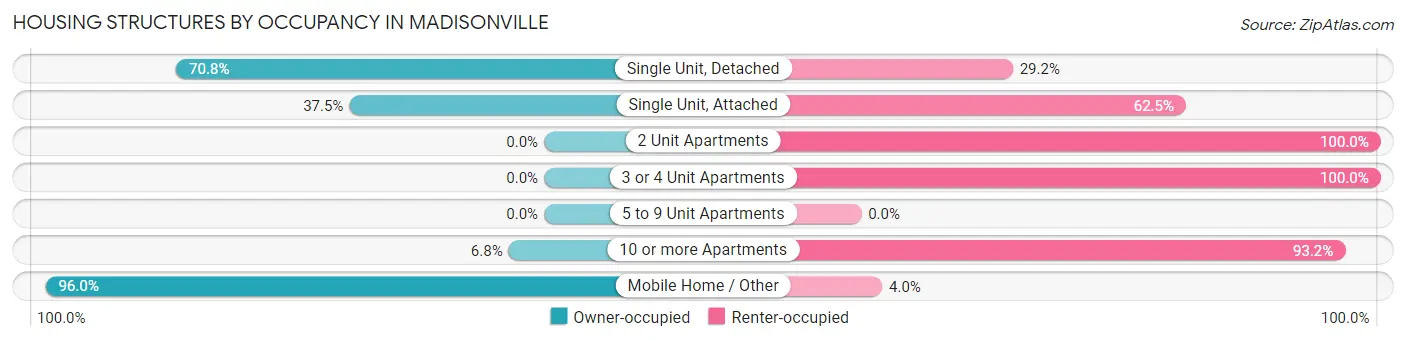
| Structure Type | Owner-occupied | Renter-occupied |
| Single Unit, Detached | 762 (70.8%) | 314 (29.2%) |
| Single Unit, Attached | 18 (37.5%) | 30 (62.5%) |
| 2 Unit Apartments | 0 (0.0%) | 90 (100.0%) |
| 3 or 4 Unit Apartments | 0 (0.0%) | 63 (100.0%) |
| 5 to 9 Unit Apartments | 0 (0.0%) | 0 (0.0%) |
| 10 or more Apartments | 11 (6.8%) | 150 (93.2%) |
| Mobile Home / Other | 143 (96.0%) | 6 (4.0%) |
| Total | 934 (58.9%) | 653 (41.1%) |
Housing Structures by Number of Rooms in Madisonville
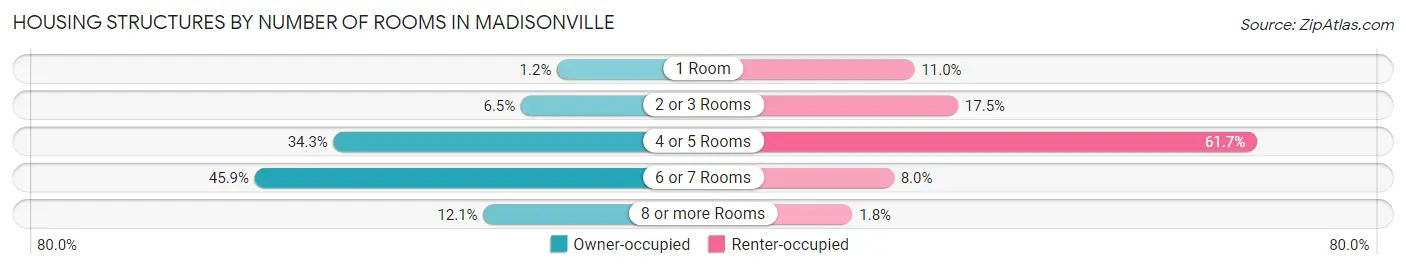
| Number of Rooms | Owner-occupied | Renter-occupied |
| 1 Room | 11 (1.2%) | 72 (11.0%) |
| 2 or 3 Rooms | 61 (6.5%) | 114 (17.5%) |
| 4 or 5 Rooms | 320 (34.3%) | 403 (61.7%) |
| 6 or 7 Rooms | 429 (45.9%) | 52 (8.0%) |
| 8 or more Rooms | 113 (12.1%) | 12 (1.8%) |
| Total | 934 (100.0%) | 653 (100.0%) |
Housing Structure by Heating Type in Madisonville
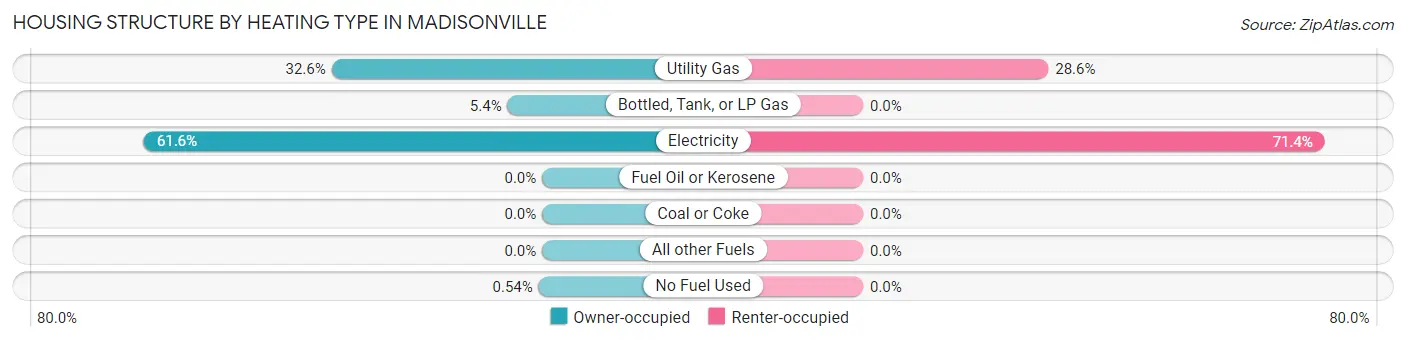
| Heating Type | Owner-occupied | Renter-occupied |
| Utility Gas | 304 (32.6%) | 187 (28.6%) |
| Bottled, Tank, or LP Gas | 50 (5.3%) | 0 (0.0%) |
| Electricity | 575 (61.6%) | 466 (71.4%) |
| Fuel Oil or Kerosene | 0 (0.0%) | 0 (0.0%) |
| Coal or Coke | 0 (0.0%) | 0 (0.0%) |
| All other Fuels | 0 (0.0%) | 0 (0.0%) |
| No Fuel Used | 5 (0.5%) | 0 (0.0%) |
| Total | 934 (100.0%) | 653 (100.0%) |
Household Vehicle Usage in Madisonville
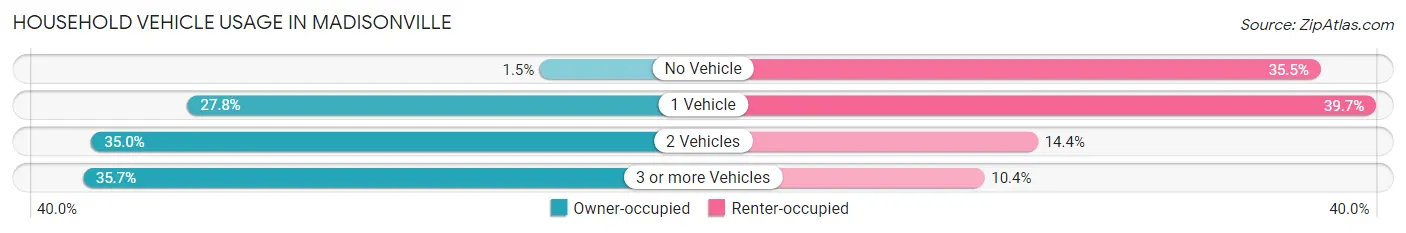
| Vehicles per Household | Owner-occupied | Renter-occupied |
| No Vehicle | 14 (1.5%) | 232 (35.5%) |
| 1 Vehicle | 260 (27.8%) | 259 (39.7%) |
| 2 Vehicles | 327 (35.0%) | 94 (14.4%) |
| 3 or more Vehicles | 333 (35.6%) | 68 (10.4%) |
| Total | 934 (100.0%) | 653 (100.0%) |
Real Estate & Mortgages in Madisonville
Real Estate and Mortgage Overview in Madisonville
| Characteristic | Without Mortgage | With Mortgage |
| Housing Units | 533 | 401 |
| Median Property Value | $82,700 | $139,600 |
| Median Household Income | $76,181 | $42 |
| Monthly Housing Costs | $450 | $0 |
| Real Estate Taxes | $1,398 | $28 |
Property Value by Mortgage Status in Madisonville
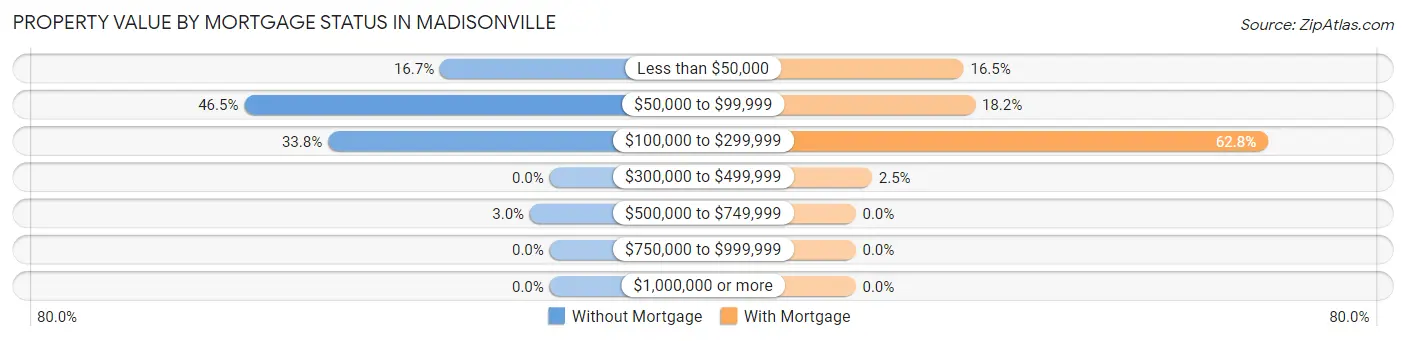
| Property Value | Without Mortgage | With Mortgage |
| Less than $50,000 | 89 (16.7%) | 66 (16.5%) |
| $50,000 to $99,999 | 248 (46.5%) | 73 (18.2%) |
| $100,000 to $299,999 | 180 (33.8%) | 252 (62.8%) |
| $300,000 to $499,999 | 0 (0.0%) | 10 (2.5%) |
| $500,000 to $749,999 | 16 (3.0%) | 0 (0.0%) |
| $750,000 to $999,999 | 0 (0.0%) | 0 (0.0%) |
| $1,000,000 or more | 0 (0.0%) | 0 (0.0%) |
| Total | 533 (100.0%) | 401 (100.0%) |
Household Income by Mortgage Status in Madisonville
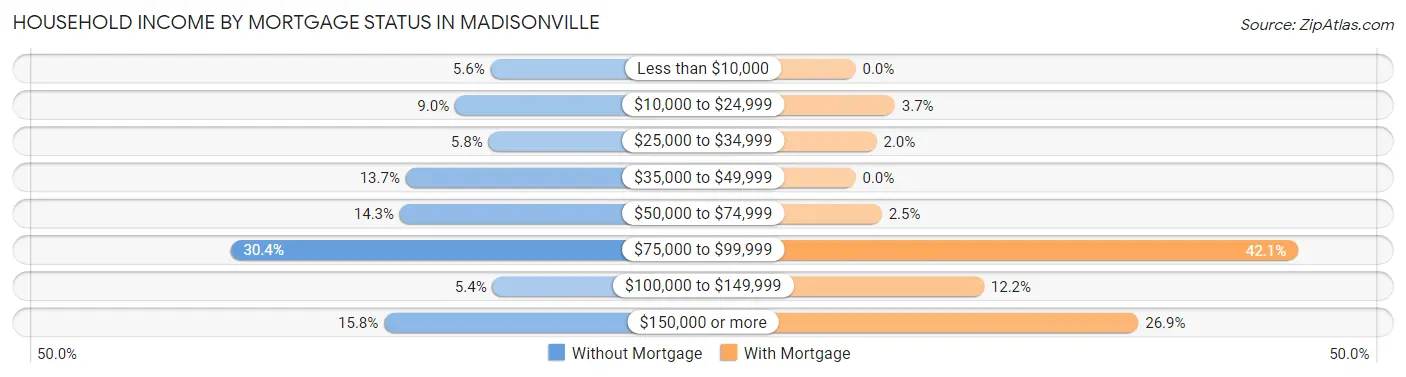
| Household Income | Without Mortgage | With Mortgage |
| Less than $10,000 | 30 (5.6%) | 0 (0.0%) |
| $10,000 to $24,999 | 48 (9.0%) | 15 (3.7%) |
| $25,000 to $34,999 | 31 (5.8%) | 8 (2.0%) |
| $35,000 to $49,999 | 73 (13.7%) | 0 (0.0%) |
| $50,000 to $74,999 | 76 (14.3%) | 10 (2.5%) |
| $75,000 to $99,999 | 162 (30.4%) | 169 (42.1%) |
| $100,000 to $149,999 | 29 (5.4%) | 49 (12.2%) |
| $150,000 or more | 84 (15.8%) | 108 (26.9%) |
| Total | 533 (100.0%) | 401 (100.0%) |
Property Value to Household Income Ratio in Madisonville
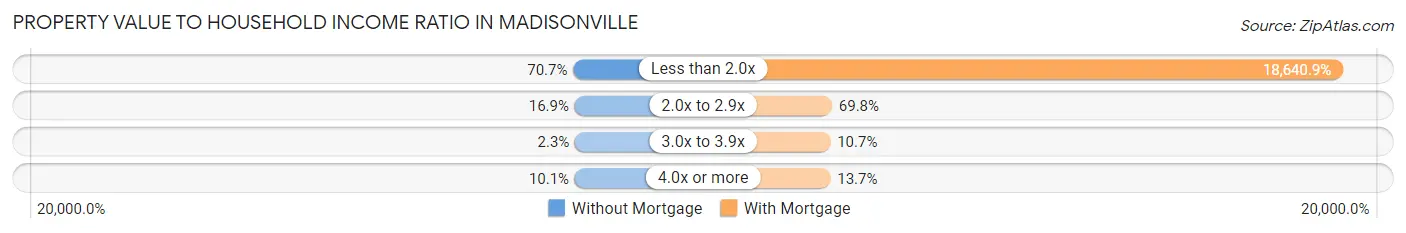
| Value-to-Income Ratio | Without Mortgage | With Mortgage |
| Less than 2.0x | 377 (70.7%) | 74,750 (18,640.9%) |
| 2.0x to 2.9x | 90 (16.9%) | 280 (69.8%) |
| 3.0x to 3.9x | 12 (2.2%) | 43 (10.7%) |
| 4.0x or more | 54 (10.1%) | 55 (13.7%) |
| Total | 533 (100.0%) | 401 (100.0%) |
Real Estate Taxes by Mortgage Status in Madisonville
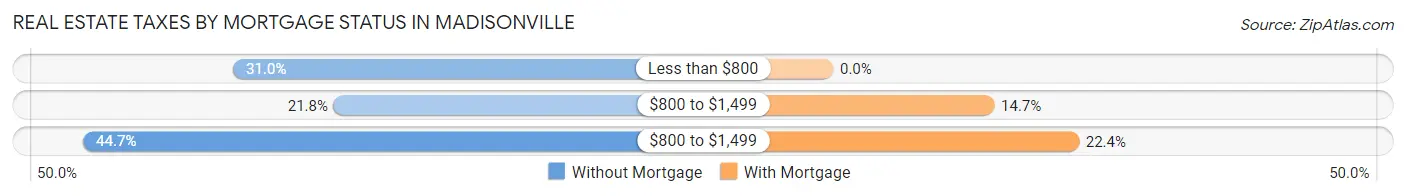
| Property Taxes | Without Mortgage | With Mortgage |
| Less than $800 | 165 (31.0%) | 0 (0.0%) |
| $800 to $1,499 | 116 (21.8%) | 59 (14.7%) |
| $800 to $1,499 | 238 (44.7%) | 90 (22.4%) |
| Total | 533 (100.0%) | 401 (100.0%) |
Health & Disability in Madisonville
Health Insurance Coverage by Age in Madisonville
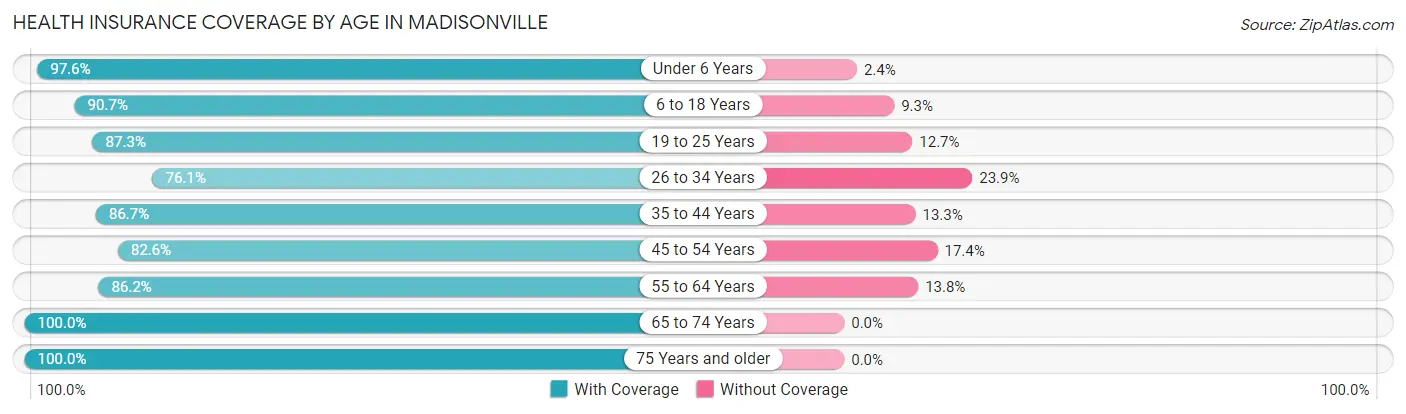
| Age Bracket | With Coverage | Without Coverage |
| Under 6 Years | 329 (97.6%) | 8 (2.4%) |
| 6 to 18 Years | 692 (90.7%) | 71 (9.3%) |
| 19 to 25 Years | 461 (87.3%) | 67 (12.7%) |
| 26 to 34 Years | 287 (76.1%) | 90 (23.9%) |
| 35 to 44 Years | 627 (86.7%) | 96 (13.3%) |
| 45 to 54 Years | 494 (82.6%) | 104 (17.4%) |
| 55 to 64 Years | 344 (86.2%) | 55 (13.8%) |
| 65 to 74 Years | 405 (100.0%) | 0 (0.0%) |
| 75 Years and older | 212 (100.0%) | 0 (0.0%) |
| Total | 3,851 (88.7%) | 491 (11.3%) |
Health Insurance Coverage by Citizenship Status in Madisonville
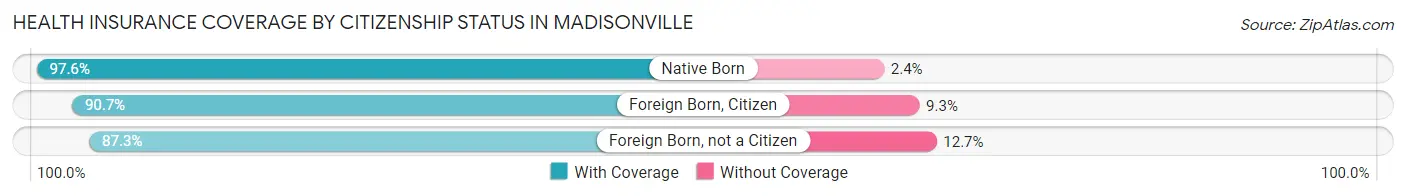
| Citizenship Status | With Coverage | Without Coverage |
| Native Born | 329 (97.6%) | 8 (2.4%) |
| Foreign Born, Citizen | 692 (90.7%) | 71 (9.3%) |
| Foreign Born, not a Citizen | 461 (87.3%) | 67 (12.7%) |
Health Insurance Coverage by Household Income in Madisonville
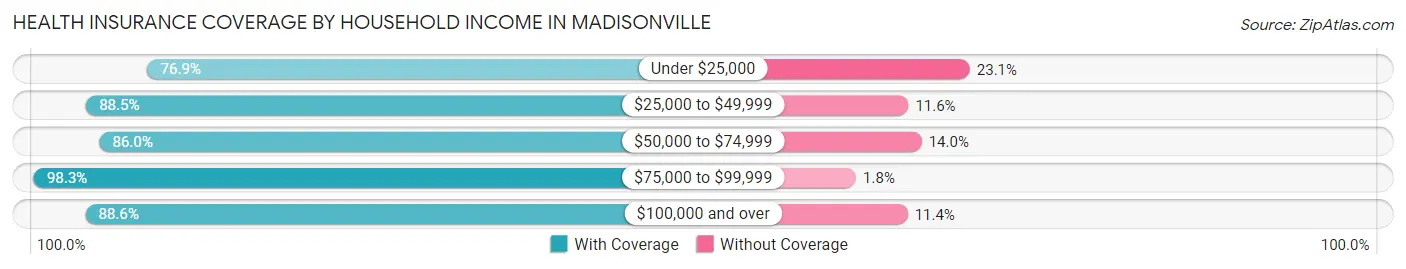
| Household Income | With Coverage | Without Coverage |
| Under $25,000 | 437 (76.9%) | 131 (23.1%) |
| $25,000 to $49,999 | 452 (88.4%) | 59 (11.6%) |
| $50,000 to $74,999 | 839 (86.0%) | 137 (14.0%) |
| $75,000 to $99,999 | 1,013 (98.3%) | 18 (1.8%) |
| $100,000 and over | 1,103 (88.6%) | 142 (11.4%) |
Public vs Private Health Insurance Coverage by Age in Madisonville
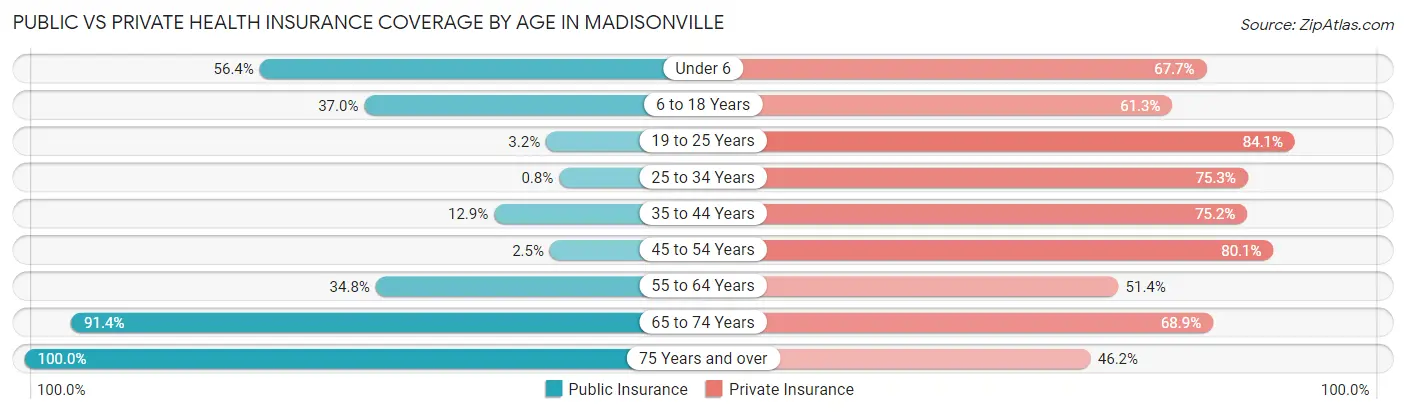
| Age Bracket | Public Insurance | Private Insurance |
| Under 6 | 190 (56.4%) | 228 (67.7%) |
| 6 to 18 Years | 282 (37.0%) | 468 (61.3%) |
| 19 to 25 Years | 17 (3.2%) | 444 (84.1%) |
| 25 to 34 Years | 3 (0.8%) | 284 (75.3%) |
| 35 to 44 Years | 93 (12.9%) | 544 (75.2%) |
| 45 to 54 Years | 15 (2.5%) | 479 (80.1%) |
| 55 to 64 Years | 139 (34.8%) | 205 (51.4%) |
| 65 to 74 Years | 370 (91.4%) | 279 (68.9%) |
| 75 Years and over | 212 (100.0%) | 98 (46.2%) |
| Total | 1,321 (30.4%) | 3,029 (69.8%) |
Disability Status by Sex by Age in Madisonville
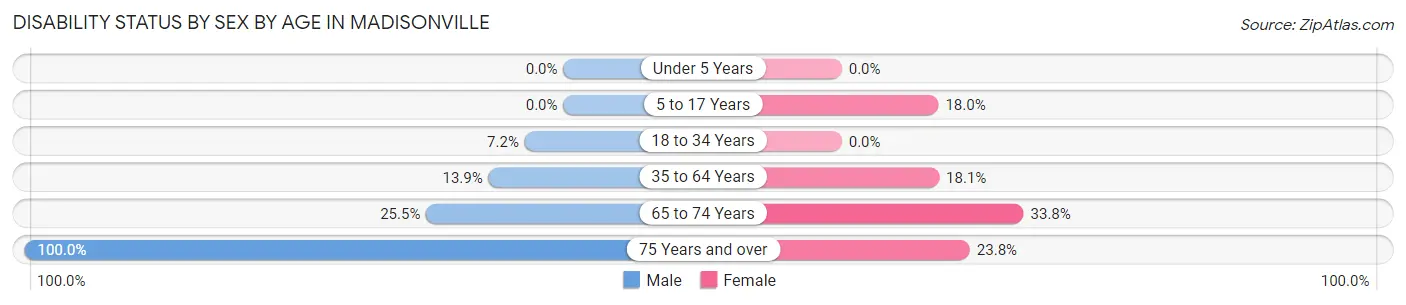
| Age Bracket | Male | Female |
| Under 5 Years | 0 (0.0%) | 0 (0.0%) |
| 5 to 17 Years | 0 (0.0%) | 63 (17.9%) |
| 18 to 34 Years | 34 (7.2%) | 0 (0.0%) |
| 35 to 64 Years | 122 (13.9%) | 152 (18.1%) |
| 65 to 74 Years | 42 (25.5%) | 81 (33.8%) |
| 75 Years and over | 48 (100.0%) | 39 (23.8%) |
Disability Class by Sex by Age in Madisonville
Disability Class: Hearing Difficulty
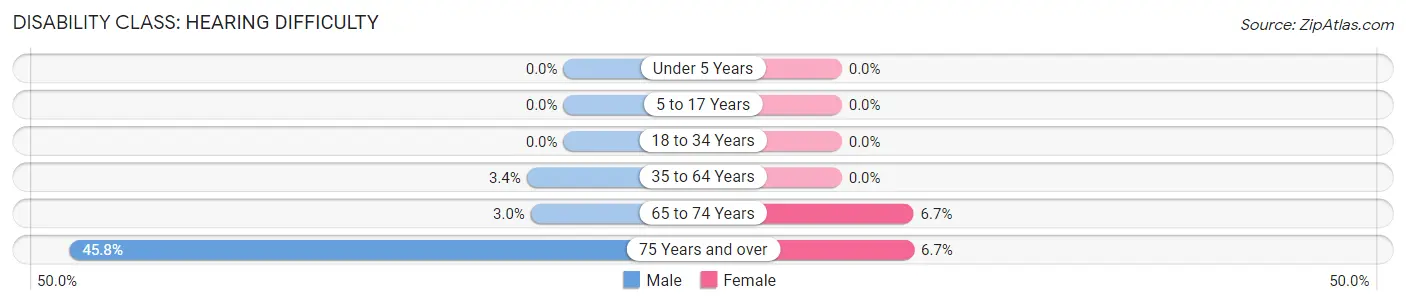
| Age Bracket | Male | Female |
| Under 5 Years | 0 (0.0%) | 0 (0.0%) |
| 5 to 17 Years | 0 (0.0%) | 0 (0.0%) |
| 18 to 34 Years | 0 (0.0%) | 0 (0.0%) |
| 35 to 64 Years | 30 (3.4%) | 0 (0.0%) |
| 65 to 74 Years | 5 (3.0%) | 16 (6.7%) |
| 75 Years and over | 22 (45.8%) | 11 (6.7%) |
Disability Class: Vision Difficulty
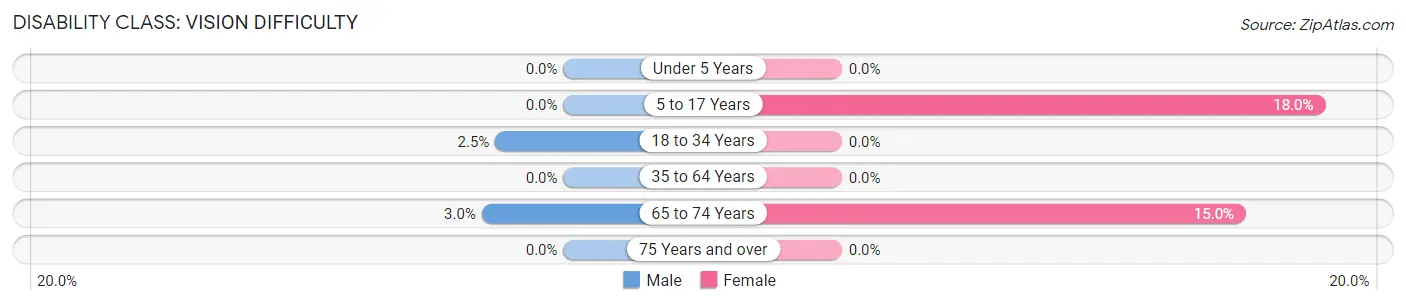
| Age Bracket | Male | Female |
| Under 5 Years | 0 (0.0%) | 0 (0.0%) |
| 5 to 17 Years | 0 (0.0%) | 63 (17.9%) |
| 18 to 34 Years | 12 (2.5%) | 0 (0.0%) |
| 35 to 64 Years | 0 (0.0%) | 0 (0.0%) |
| 65 to 74 Years | 5 (3.0%) | 36 (15.0%) |
| 75 Years and over | 0 (0.0%) | 0 (0.0%) |
Disability Class: Cognitive Difficulty
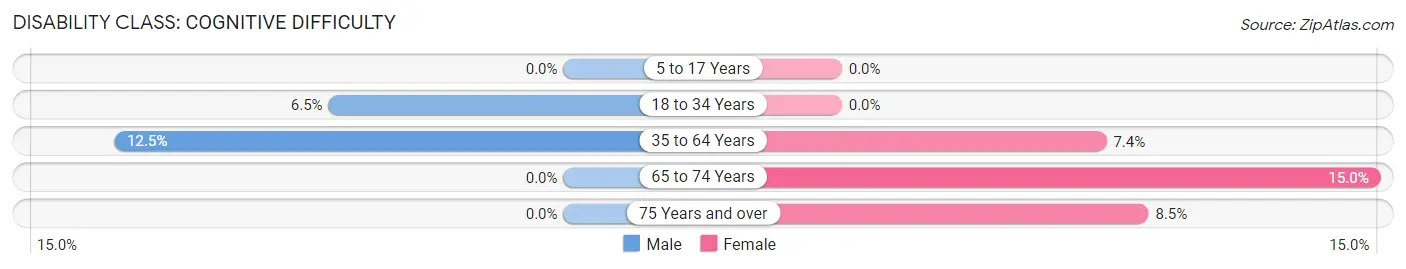
| Age Bracket | Male | Female |
| 5 to 17 Years | 0 (0.0%) | 0 (0.0%) |
| 18 to 34 Years | 31 (6.5%) | 0 (0.0%) |
| 35 to 64 Years | 110 (12.5%) | 62 (7.4%) |
| 65 to 74 Years | 0 (0.0%) | 36 (15.0%) |
| 75 Years and over | 0 (0.0%) | 14 (8.5%) |
Disability Class: Ambulatory Difficulty
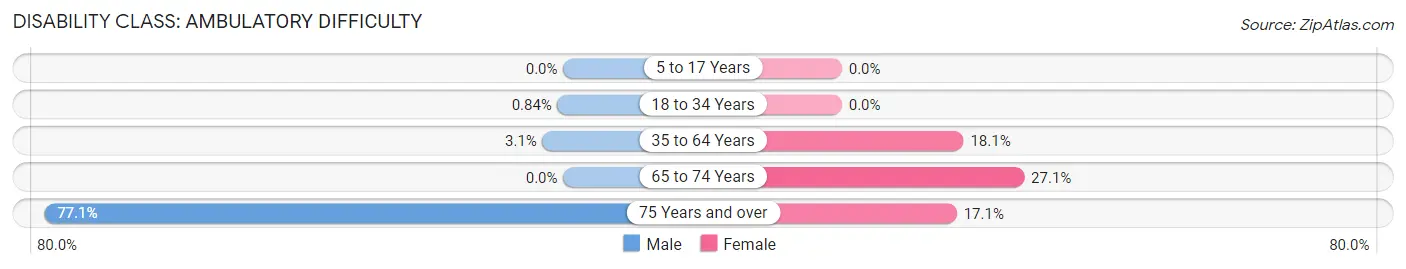
| Age Bracket | Male | Female |
| 5 to 17 Years | 0 (0.0%) | 0 (0.0%) |
| 18 to 34 Years | 4 (0.8%) | 0 (0.0%) |
| 35 to 64 Years | 27 (3.1%) | 152 (18.1%) |
| 65 to 74 Years | 0 (0.0%) | 65 (27.1%) |
| 75 Years and over | 37 (77.1%) | 28 (17.1%) |
Disability Class: Self-Care Difficulty
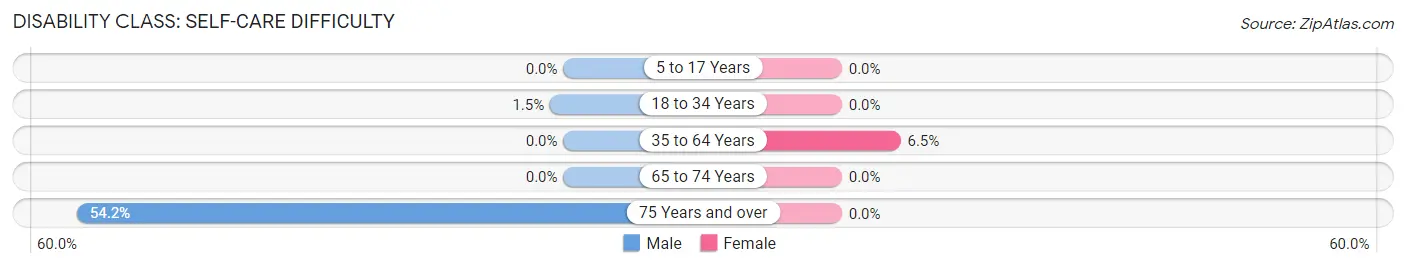
| Age Bracket | Male | Female |
| 5 to 17 Years | 0 (0.0%) | 0 (0.0%) |
| 18 to 34 Years | 7 (1.5%) | 0 (0.0%) |
| 35 to 64 Years | 0 (0.0%) | 55 (6.5%) |
| 65 to 74 Years | 0 (0.0%) | 0 (0.0%) |
| 75 Years and over | 26 (54.2%) | 0 (0.0%) |
Technology Access in Madisonville
Computing Device Access in Madisonville
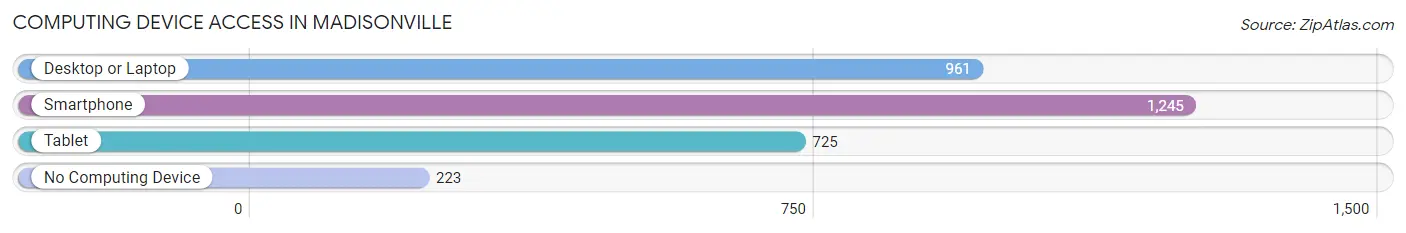
| Device Type | # Households | % Households |
| Desktop or Laptop | 961 | 60.6% |
| Smartphone | 1,245 | 78.4% |
| Tablet | 725 | 45.7% |
| No Computing Device | 223 | 14.1% |
| Total | 1,587 | 100.0% |
Internet Access in Madisonville
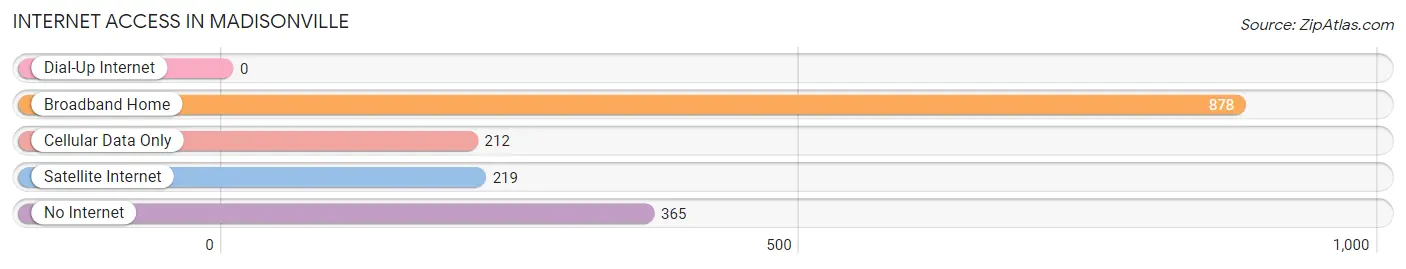
| Internet Type | # Households | % Households |
| Dial-Up Internet | 0 | 0.0% |
| Broadband Home | 878 | 55.3% |
| Cellular Data Only | 212 | 13.4% |
| Satellite Internet | 219 | 13.8% |
| No Internet | 365 | 23.0% |
| Total | 1,587 | 100.0% |
Madisonville Summary
Introduction
The small town of Madisonville, Texas is located in Madison County, Texas, and is the county seat. It is situated in the East Texas Piney Woods region, and is approximately halfway between Houston and Dallas. The town has a population of 4,541 as of the 2010 census, and is the largest town in Madison County.
History
The area that is now Madisonville was first settled in the early 1830s by a group of settlers from the United States. The town was originally known as Madisonville, after James Madison, the fourth President of the United States. The town was officially incorporated in 1846, and the first post office was established in 1848.
The town was an important stop on the stagecoach route between Houston and Dallas, and was also a major stop on the Houston and Texas Central Railway. The town was also an important center for cotton production, and was home to several cotton gins.
In the late 19th century, the town was home to several schools, including a college, and a number of churches. The town also had a number of businesses, including a bank, a newspaper, and a hotel.
Geography
Madisonville is located in the East Texas Piney Woods region, and is situated in the southeastern part of Madison County. The town is located at the intersection of State Highway 21 and State Highway 75, and is approximately halfway between Houston and Dallas.
The town is situated on the banks of the Trinity River, and is surrounded by rolling hills and pine forests. The town is located in a humid subtropical climate zone, and has hot summers and mild winters.
Economy
The economy of Madisonville is largely based on agriculture and timber production. The town is home to several large farms, and is also home to several timber companies. The town is also home to several manufacturing companies, including a furniture factory and a plastics factory.
The town is also home to several retail stores, including a Walmart Supercenter, and a number of restaurants. The town is also home to a number of small businesses, including a number of antique stores.
Demographics
As of the 2010 census, the population of Madisonville was 4,541. The racial makeup of the town was 79.3% White, 16.2% African American, 0.7% Native American, 0.4% Asian, 0.1% Pacific Islander, 1.7% from other races, and 1.8% from two or more races. Hispanic or Latino of any race were 4.3% of the population.
The median income for a household in the town was $31,250, and the median income for a family was $37,500. The per capita income for the town was $17,845. About 17.2% of families and 20.3% of the population were below the poverty line, including 28.3% of those under age 18 and 14.2% of those age 65 or over.
Conclusion
Madisonville, Texas is a small town located in Madison County, Texas. The town has a population of 4,541 as of the 2010 census, and is the largest town in Madison County. The town is situated in the East Texas Piney Woods region, and is approximately halfway between Houston and Dallas. The economy of Madisonville is largely based on agriculture and timber production, and the town is also home to several manufacturing companies and retail stores. The racial makeup of the town is 79.3% White, 16.2% African American, 0.7% Native American, 0.4% Asian, 0.1% Pacific Islander, 1.7% from other races, and 1.8% from two or more races. The median income for a household in the town was $31,250, and the median income for a family was $37,500.
Common Questions
What is Per Capita Income in Madisonville?
Per Capita income in Madisonville is $27,615.
What is the Median Family Income in Madisonville?
Median Family Income in Madisonville is $65,833.
What is the Median Household income in Madisonville?
Median Household Income in Madisonville is $62,135.
What is Income or Wage Gap in Madisonville?
Income or Wage Gap in Madisonville is 21.7%.
Women in Madisonville earn 78.3 cents for every dollar earned by a man.
What is Inequality or Gini Index in Madisonville?
Inequality or Gini Index in Madisonville is 0.42.
What is the Total Population of Madisonville?
Total Population of Madisonville is 4,480.
What is the Total Male Population of Madisonville?
Total Male Population of Madisonville is 2,177.
What is the Total Female Population of Madisonville?
Total Female Population of Madisonville is 2,303.
What is the Ratio of Males per 100 Females in Madisonville?
There are 94.53 Males per 100 Females in Madisonville.
What is the Ratio of Females per 100 Males in Madisonville?
There are 105.79 Females per 100 Males in Madisonville.
What is the Median Population Age in Madisonville?
Median Population Age in Madisonville is 38.2 Years.
What is the Average Family Size in Madisonville
Average Family Size in Madisonville is 3.4 People.
What is the Average Household Size in Madisonville
Average Household Size in Madisonville is 2.7 People.
How Large is the Labor Force in Madisonville?
There are 2,249 People in the Labor Forcein in Madisonville.
What is the Percentage of People in the Labor Force in Madisonville?
63.0% of People are in the Labor Force in Madisonville.
What is the Unemployment Rate in Madisonville?
Unemployment Rate in Madisonville is 0.5%.