Llano, TX Map & Demographics
Llano Map
Llano Overview
$30,235
PER CAPITA INCOME
$67,543
AVG FAMILY INCOME
$46,404
AVG HOUSEHOLD INCOME
1.3%
WAGE / INCOME GAP [ % ]
98.7¢/ $1
WAGE / INCOME GAP [ $ ]
0.46
INEQUALITY / GINI INDEX
3,374
TOTAL POPULATION
1,501
MALE POPULATION
1,873
FEMALE POPULATION
80.14
MALES / 100 FEMALES
124.78
FEMALES / 100 MALES
41.1
MEDIAN AGE
2.9
AVG FAMILY SIZE
2.2
AVG HOUSEHOLD SIZE
1,796
LABOR FORCE [ PEOPLE ]
64.6%
PERCENT IN LABOR FORCE
7.6%
UNEMPLOYMENT RATE
Llano Zip Codes
Llano Area Codes
Income in Llano
Income Overview in Llano
Per Capita Income in Llano is $30,235, while median incomes of families and households are $67,543 and $46,404 respectively.
| Characteristic | Number | Measure |
| Per Capita Income | 3,374 | $30,235 |
| Median Family Income | 884 | $67,543 |
| Mean Family Income | 884 | $89,132 |
| Median Household Income | 1,467 | $46,404 |
| Mean Household Income | 1,467 | $68,363 |
| Income Deficit | 884 | $0 |
| Wage / Income Gap (%) | 3,374 | 1.34% |
| Wage / Income Gap ($) | 3,374 | 98.66¢ per $1 |
| Gini / Inequality Index | 3,374 | 0.46 |
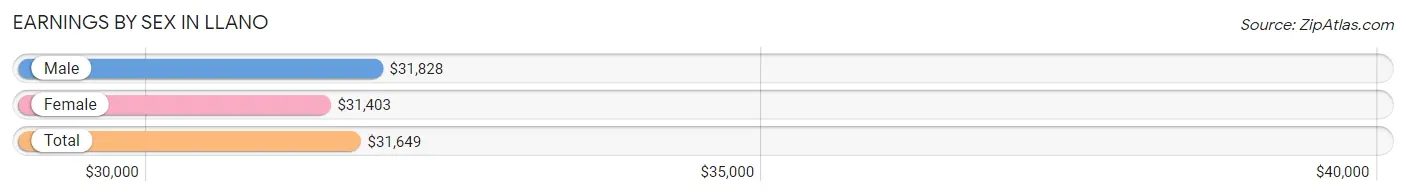
Earnings by Sex in Llano
Average Earnings in Llano are $31,649, $31,828 for men and $31,403 for women, a difference of 1.3%.
| Sex | Number | Average Earnings |
| Male | 934 (49.5%) | $31,828 |
| Female | 953 (50.5%) | $31,403 |
| Total | 1,887 (100.0%) | $31,649 |
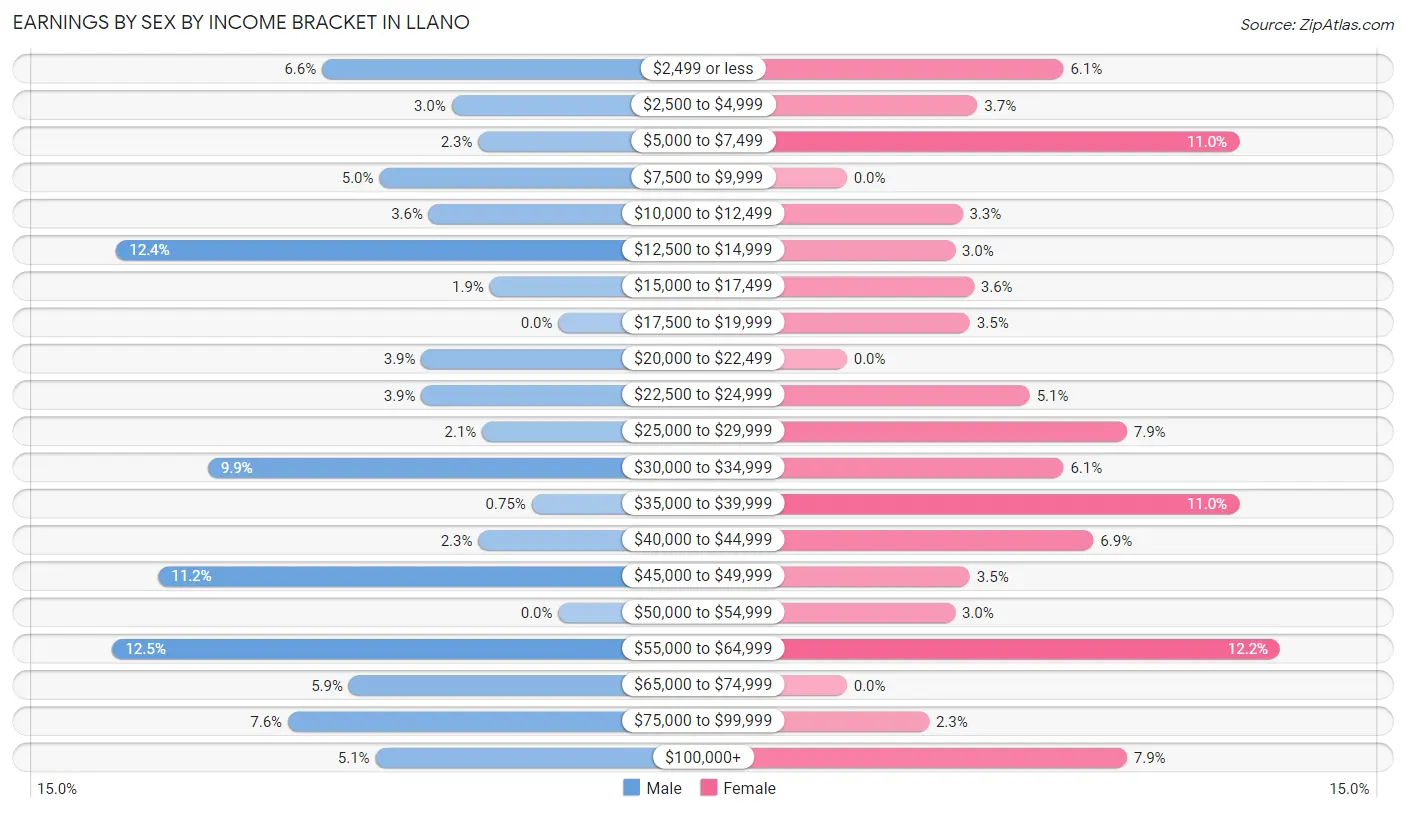
Earnings by Sex by Income Bracket in Llano
The most common earnings brackets in Llano are $55,000 to $64,999 for men (117 | 12.5%) and $55,000 to $64,999 for women (116 | 12.2%).
| Income | Male | Female |
| $2,499 or less | 62 (6.6%) | 58 (6.1%) |
| $2,500 to $4,999 | 28 (3.0%) | 35 (3.7%) |
| $5,000 to $7,499 | 21 (2.2%) | 105 (11.0%) |
| $7,500 to $9,999 | 47 (5.0%) | 0 (0.0%) |
| $10,000 to $12,499 | 34 (3.6%) | 31 (3.3%) |
| $12,500 to $14,999 | 116 (12.4%) | 29 (3.0%) |
| $15,000 to $17,499 | 18 (1.9%) | 34 (3.6%) |
| $17,500 to $19,999 | 0 (0.0%) | 33 (3.5%) |
| $20,000 to $22,499 | 36 (3.8%) | 0 (0.0%) |
| $22,500 to $24,999 | 36 (3.8%) | 49 (5.1%) |
| $25,000 to $29,999 | 20 (2.1%) | 75 (7.9%) |
| $30,000 to $34,999 | 92 (9.9%) | 58 (6.1%) |
| $35,000 to $39,999 | 7 (0.7%) | 105 (11.0%) |
| $40,000 to $44,999 | 21 (2.2%) | 66 (6.9%) |
| $45,000 to $49,999 | 105 (11.2%) | 33 (3.5%) |
| $50,000 to $54,999 | 0 (0.0%) | 29 (3.0%) |
| $55,000 to $64,999 | 117 (12.5%) | 116 (12.2%) |
| $65,000 to $74,999 | 55 (5.9%) | 0 (0.0%) |
| $75,000 to $99,999 | 71 (7.6%) | 22 (2.3%) |
| $100,000+ | 48 (5.1%) | 75 (7.9%) |
| Total | 934 (100.0%) | 953 (100.0%) |
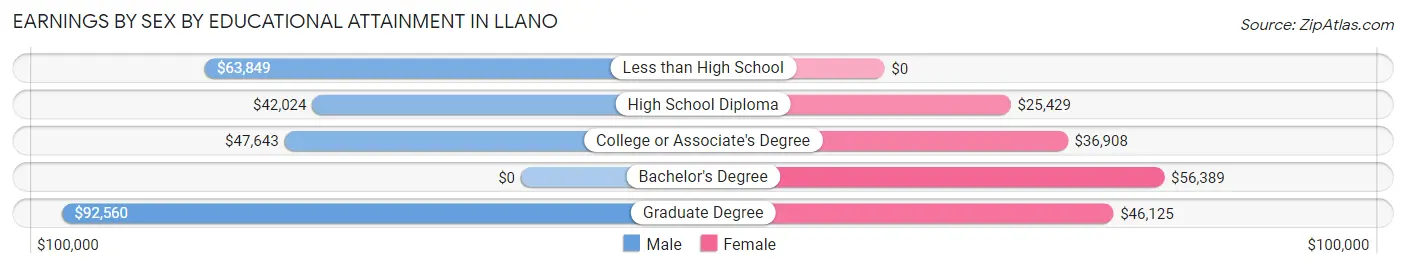
Earnings by Sex by Educational Attainment in Llano
Average earnings in Llano are $48,819 for men and $36,094 for women, a difference of 26.1%. Men with an educational attainment of graduate degree enjoy the highest average annual earnings of $92,560, while those with high school diploma education earn the least with $42,024. Women with an educational attainment of bachelor's degree earn the most with the average annual earnings of $56,389, while those with high school diploma education have the smallest earnings of $25,429.
| Educational Attainment | Male Income | Female Income |
| Less than High School | $63,849 | $0 |
| High School Diploma | $42,024 | $25,429 |
| College or Associate's Degree | $47,643 | $36,908 |
| Bachelor's Degree | - | - |
| Graduate Degree | $92,560 | $46,125 |
| Total | $48,819 | $36,094 |
Family Income in Llano
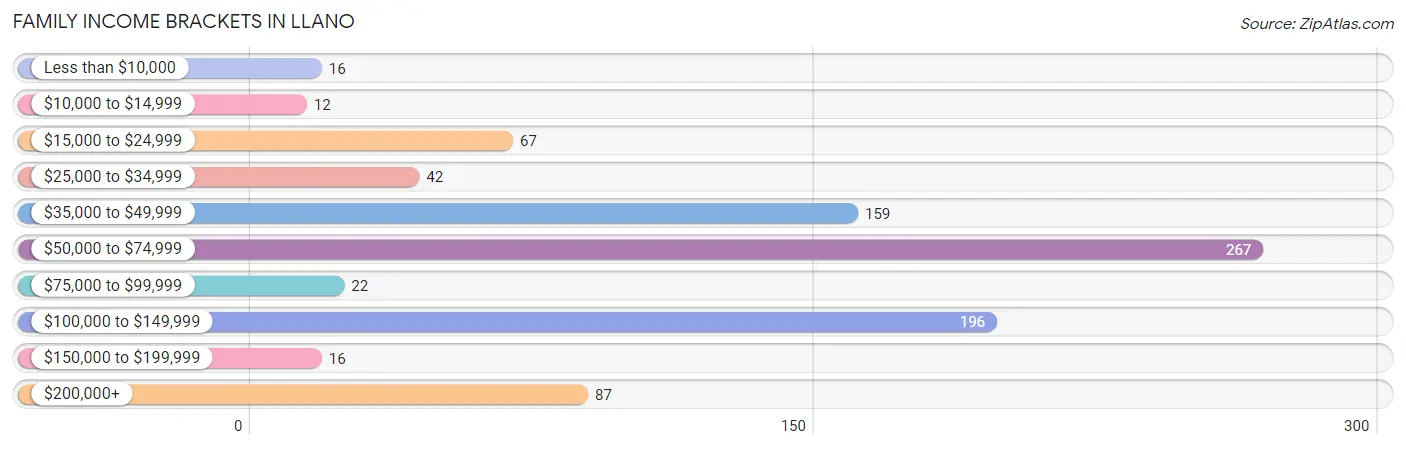
Family Income Brackets in Llano
According to the Llano family income data, there are 267 families falling into the $50,000 to $74,999 income range, which is the most common income bracket and makes up 30.2% of all families. Conversely, the $10,000 to $14,999 income bracket is the least frequent group with only 12 families (1.4%) belonging to this category.
| Income Bracket | # Families | % Families |
| Less than $10,000 | 16 | 1.8% |
| $10,000 to $14,999 | 12 | 1.4% |
| $15,000 to $24,999 | 67 | 7.6% |
| $25,000 to $34,999 | 42 | 4.8% |
| $35,000 to $49,999 | 159 | 18.0% |
| $50,000 to $74,999 | 267 | 30.2% |
| $75,000 to $99,999 | 22 | 2.5% |
| $100,000 to $149,999 | 196 | 22.2% |
| $150,000 to $199,999 | 16 | 1.8% |
| $200,000+ | 87 | 9.8% |
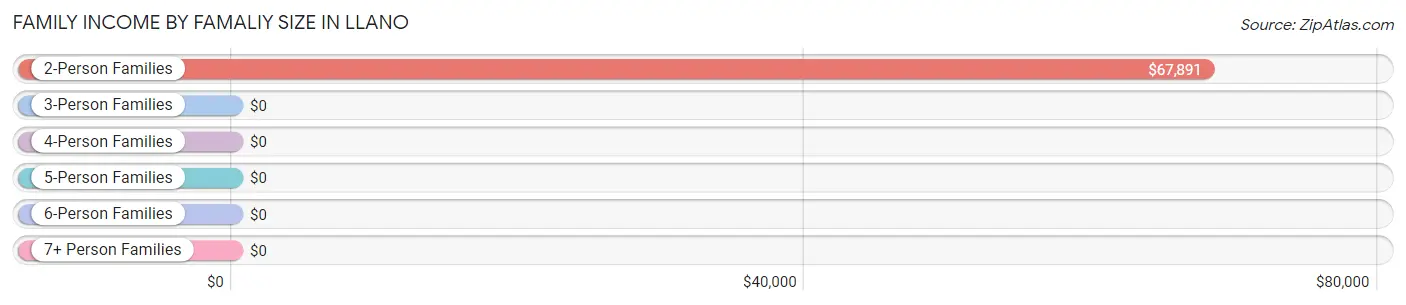
Family Income by Famaliy Size in Llano
2-person families (452 | 51.1%) account for the highest median family income in Llano with $67,891 per family, while 2-person families (452 | 51.1%) have the highest median income of $33,946 per family member.
| Income Bracket | # Families | Median Income |
| 2-Person Families | 452 (51.1%) | $67,891 |
| 3-Person Families | 251 (28.4%) | $0 |
| 4-Person Families | 95 (10.7%) | $0 |
| 5-Person Families | 71 (8.0%) | $0 |
| 6-Person Families | 15 (1.7%) | $0 |
| 7+ Person Families | 0 (0.0%) | $0 |
| Total | 884 (100.0%) | $67,543 |
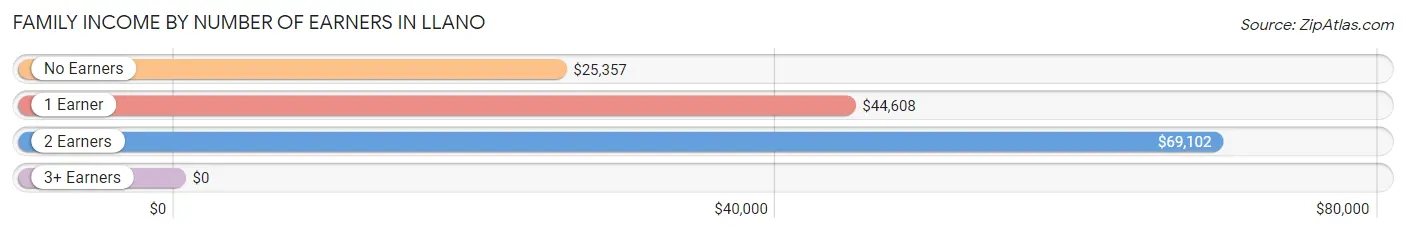
Family Income by Number of Earners in Llano
| Number of Earners | # Families | Median Income |
| No Earners | 96 (10.9%) | $25,357 |
| 1 Earner | 244 (27.6%) | $44,608 |
| 2 Earners | 429 (48.5%) | $69,102 |
| 3+ Earners | 115 (13.0%) | $0 |
| Total | 884 (100.0%) | $67,543 |
Household Income in Llano
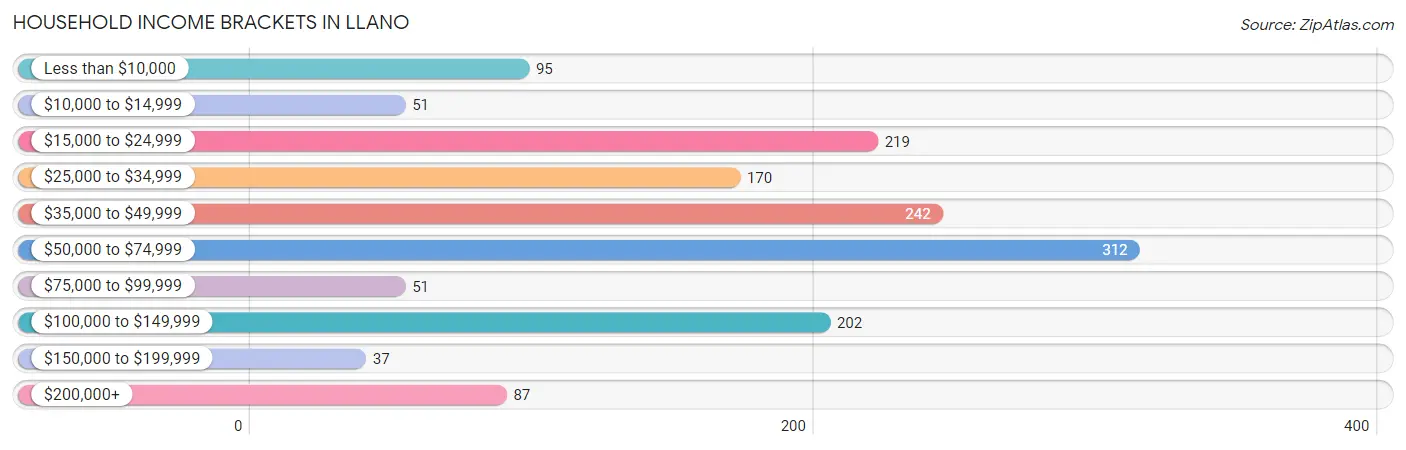
Household Income Brackets in Llano
With 312 households falling in the category, the $50,000 to $74,999 income range is the most frequent in Llano, accounting for 21.3% of all households. In contrast, only 37 households (2.5%) fall into the $150,000 to $199,999 income bracket, making it the least populous group.
| Income Bracket | # Households | % Households |
| Less than $10,000 | 95 | 6.5% |
| $10,000 to $14,999 | 51 | 3.5% |
| $15,000 to $24,999 | 219 | 14.9% |
| $25,000 to $34,999 | 170 | 11.6% |
| $35,000 to $49,999 | 242 | 16.5% |
| $50,000 to $74,999 | 312 | 21.3% |
| $75,000 to $99,999 | 51 | 3.5% |
| $100,000 to $149,999 | 202 | 13.8% |
| $150,000 to $199,999 | 37 | 2.5% |
| $200,000+ | 87 | 5.9% |
Household Income by Householder Age in Llano
The median household income in Llano is $46,404, with the highest median household income of $48,750 found in the 45 to 64 years age bracket for the primary householder. A total of 458 households (31.2%) fall into this category. Meanwhile, the 15 to 24 years age bracket for the primary householder has the lowest median household income of $0, with 116 households (7.9%) in this group.
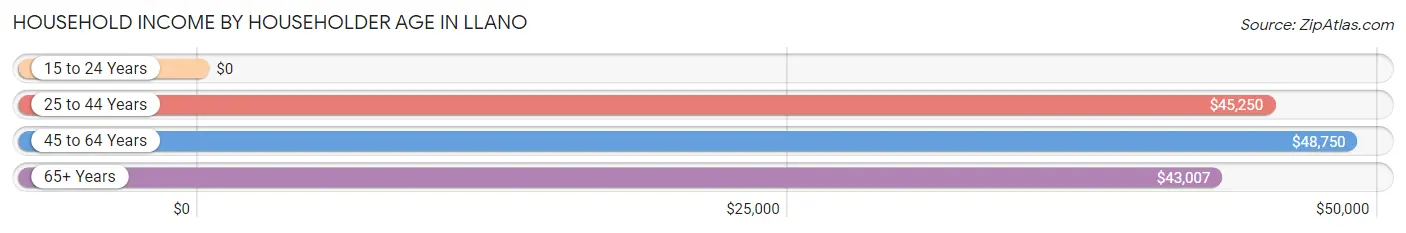
| Income Bracket | # Households | Median Income |
| 15 to 24 Years | 116 (7.9%) | $0 |
| 25 to 44 Years | 306 (20.9%) | $45,250 |
| 45 to 64 Years | 458 (31.2%) | $48,750 |
| 65+ Years | 587 (40.0%) | $43,007 |
| Total | 1,467 (100.0%) | $46,404 |
Poverty in Llano
Income Below Poverty by Sex and Age in Llano
With 13.2% poverty level for males and 16.1% for females among the residents of Llano, 15 year old males and 5 year old females are the most vulnerable to poverty, with 36 males (41.4%) and 18 females (58.1%) in their respective age groups living below the poverty level.
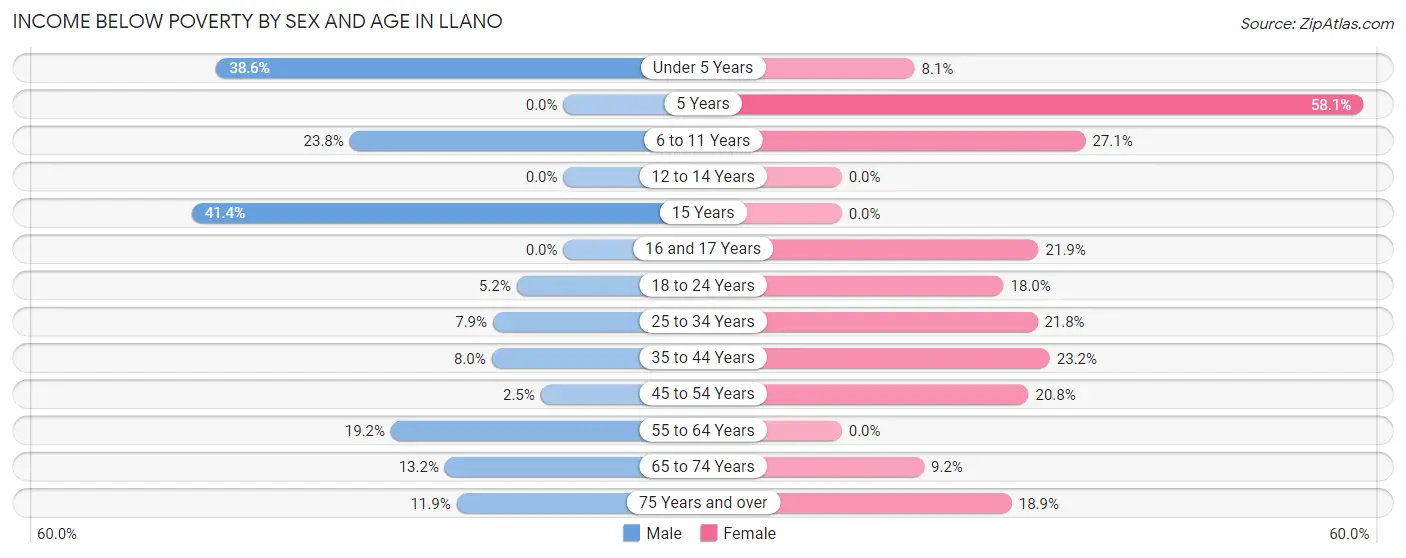
| Age Bracket | Male | Female |
| Under 5 Years | 17 (38.6%) | 9 (8.1%) |
| 5 Years | 0 (0.0%) | 18 (58.1%) |
| 6 to 11 Years | 30 (23.8%) | 19 (27.1%) |
| 12 to 14 Years | 0 (0.0%) | 0 (0.0%) |
| 15 Years | 36 (41.4%) | 0 (0.0%) |
| 16 and 17 Years | 0 (0.0%) | 16 (21.9%) |
| 18 to 24 Years | 13 (5.2%) | 20 (18.0%) |
| 25 to 34 Years | 15 (7.9%) | 61 (21.8%) |
| 35 to 44 Years | 8 (8.0%) | 38 (23.2%) |
| 45 to 54 Years | 4 (2.5%) | 47 (20.8%) |
| 55 to 64 Years | 29 (19.2%) | 0 (0.0%) |
| 65 to 74 Years | 35 (13.2%) | 21 (9.2%) |
| 75 Years and over | 10 (11.9%) | 32 (18.9%) |
| Total | 197 (13.2%) | 281 (16.1%) |
Income Above Poverty by Sex and Age in Llano
According to the poverty statistics in Llano, males aged 12 to 14 years and females aged 12 to 14 years are the age groups that are most secure financially, with 100.0% of males and 100.0% of females in these age groups living above the poverty line.
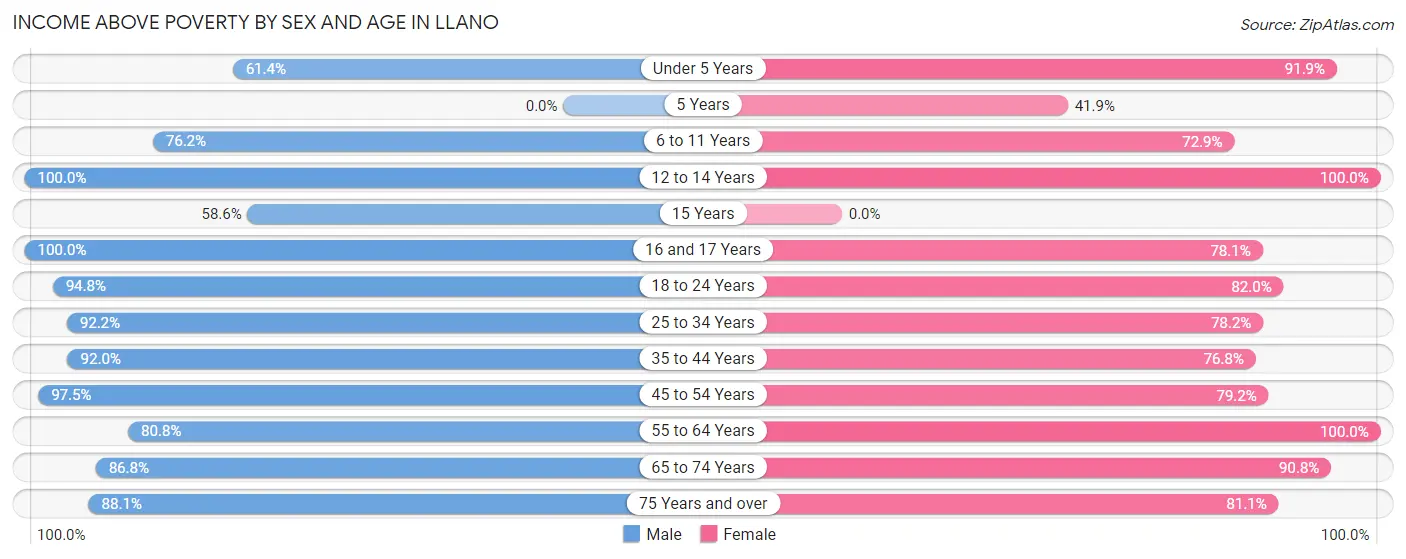
| Age Bracket | Male | Female |
| Under 5 Years | 27 (61.4%) | 102 (91.9%) |
| 5 Years | 0 (0.0%) | 13 (41.9%) |
| 6 to 11 Years | 96 (76.2%) | 51 (72.9%) |
| 12 to 14 Years | 17 (100.0%) | 71 (100.0%) |
| 15 Years | 51 (58.6%) | 0 (0.0%) |
| 16 and 17 Years | 17 (100.0%) | 57 (78.1%) |
| 18 to 24 Years | 236 (94.8%) | 91 (82.0%) |
| 25 to 34 Years | 176 (92.1%) | 219 (78.2%) |
| 35 to 44 Years | 92 (92.0%) | 126 (76.8%) |
| 45 to 54 Years | 154 (97.5%) | 179 (79.2%) |
| 55 to 64 Years | 122 (80.8%) | 208 (100.0%) |
| 65 to 74 Years | 230 (86.8%) | 208 (90.8%) |
| 75 Years and over | 74 (88.1%) | 137 (81.1%) |
| Total | 1,292 (86.8%) | 1,462 (83.9%) |
Income Below Poverty Among Married-Couple Families in Llano
The poverty statistics for married-couple families in Llano show that 1.6% or 9 of the total 575 families live below the poverty line. Families with no children have the highest poverty rate of 2.0%, comprising of 9 families. On the other hand, families with 1 or 2 children have the lowest poverty rate of 0.0%, which includes 0 families.
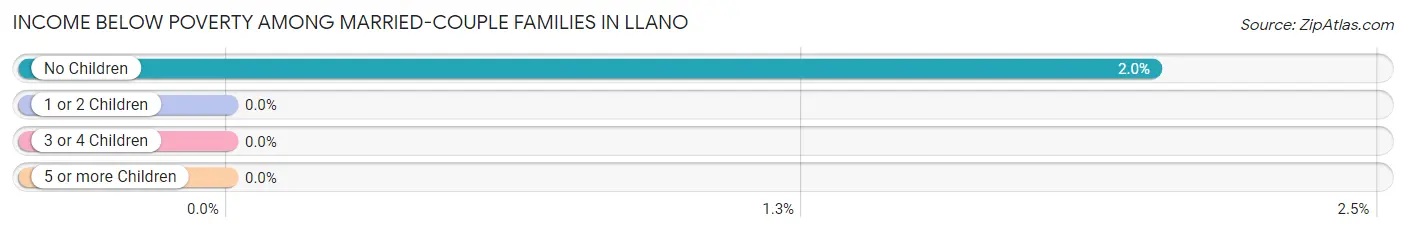
| Children | Above Poverty | Below Poverty |
| No Children | 439 (98.0%) | 9 (2.0%) |
| 1 or 2 Children | 122 (100.0%) | 0 (0.0%) |
| 3 or 4 Children | 5 (100.0%) | 0 (0.0%) |
| 5 or more Children | 0 (0.0%) | 0 (0.0%) |
| Total | 566 (98.4%) | 9 (1.6%) |
Income Below Poverty Among Single-Parent Households in Llano
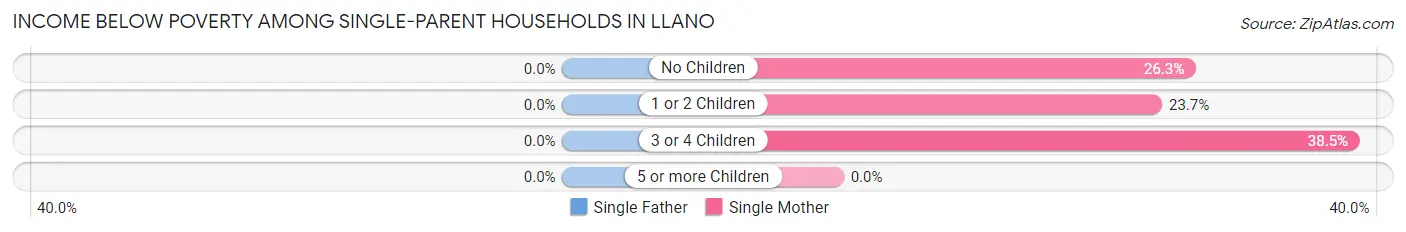
| Children | Single Father | Single Mother |
| No Children | 0 (0.0%) | 21 (26.3%) |
| 1 or 2 Children | 0 (0.0%) | 37 (23.7%) |
| 3 or 4 Children | 0 (0.0%) | 25 (38.5%) |
| 5 or more Children | 0 (0.0%) | 0 (0.0%) |
| Total | 0 (0.0%) | 83 (27.6%) |
Income Below Poverty Among Married-Couple vs Single-Parent Households in Llano
The poverty data for Llano shows that 9 of the married-couple family households (1.6%) and 83 of the single-parent households (26.9%) are living below the poverty level. Within the married-couple family households, those with no children have the highest poverty rate, with 9 households (2.0%) falling below the poverty line. Among the single-parent households, those with 3 or 4 children have the highest poverty rate, with 25 household (38.5%) living below poverty.
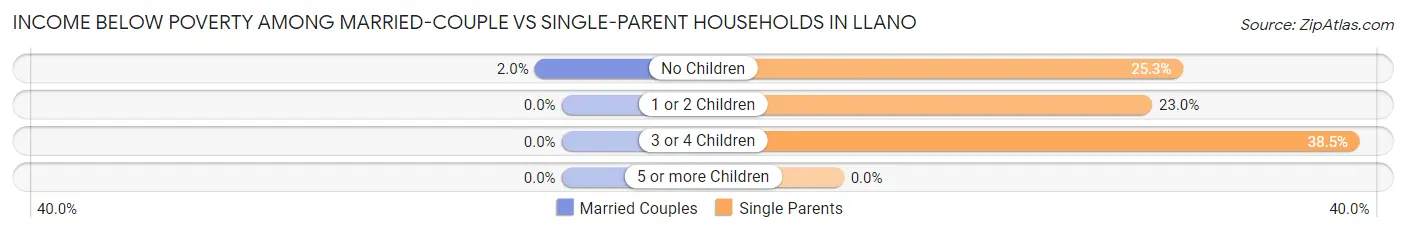
| Children | Married-Couple Families | Single-Parent Households |
| No Children | 9 (2.0%) | 21 (25.3%) |
| 1 or 2 Children | 0 (0.0%) | 37 (23.0%) |
| 3 or 4 Children | 0 (0.0%) | 25 (38.5%) |
| 5 or more Children | 0 (0.0%) | 0 (0.0%) |
| Total | 9 (1.6%) | 83 (26.9%) |
Race in Llano
The most populous races in Llano are White / Caucasian (3,135 | 92.9%), Hispanic or Latino (441 | 13.1%), and Two or more Races (118 | 3.5%).
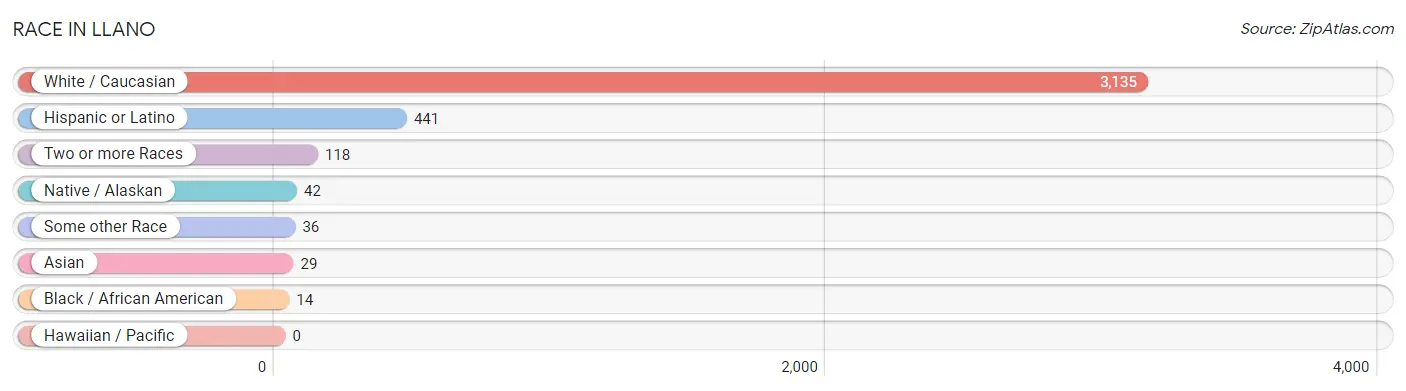
| Race | # Population | % Population |
| Asian | 29 | 0.9% |
| Black / African American | 14 | 0.4% |
| Hawaiian / Pacific | 0 | 0.0% |
| Hispanic or Latino | 441 | 13.1% |
| Native / Alaskan | 42 | 1.2% |
| White / Caucasian | 3,135 | 92.9% |
| Two or more Races | 118 | 3.5% |
| Some other Race | 36 | 1.1% |
| Total | 3,374 | 100.0% |
Ancestry in Llano
The most populous ancestries reported in Llano are English (594 | 17.6%), German (578 | 17.1%), Irish (488 | 14.5%), Mexican (352 | 10.4%), and American (174 | 5.2%), together accounting for 64.8% of all Llano residents.
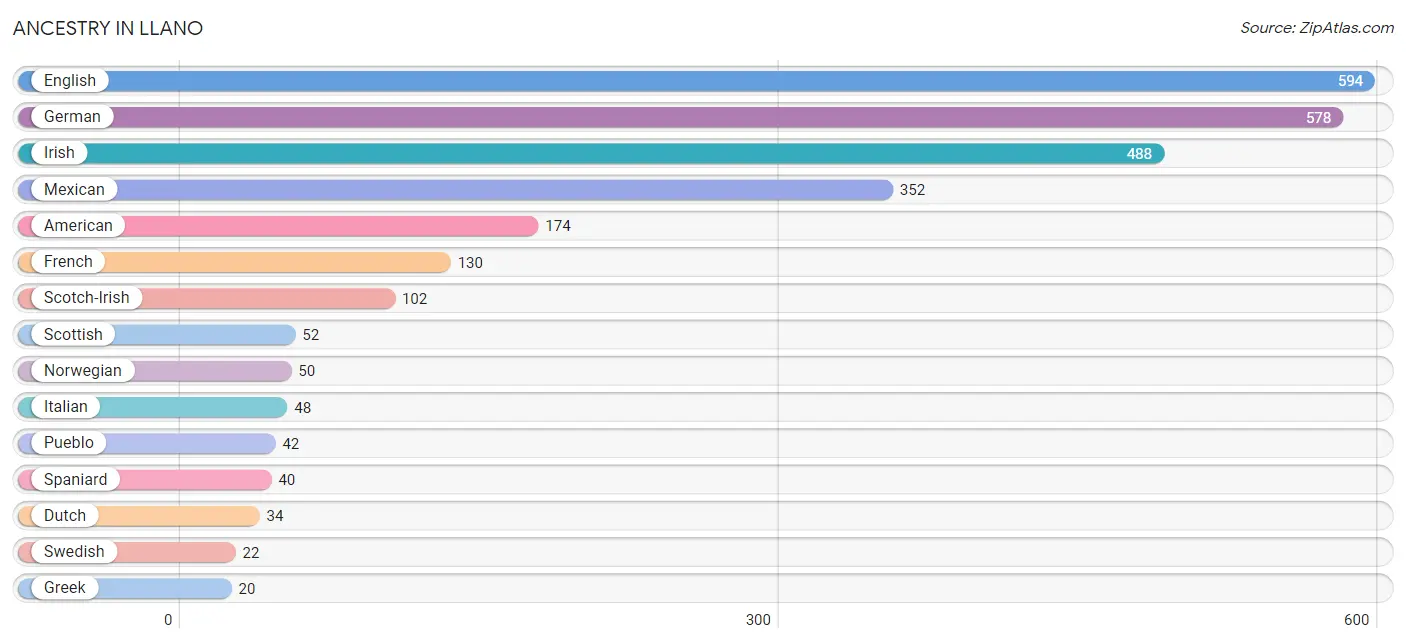
| Ancestry | # Population | % Population |
| American | 174 | 5.2% |
| British | 6 | 0.2% |
| Cherokee | 15 | 0.4% |
| Dutch | 34 | 1.0% |
| Eastern European | 14 | 0.4% |
| English | 594 | 17.6% |
| European | 5 | 0.2% |
| Finnish | 7 | 0.2% |
| French | 130 | 3.8% |
| French Canadian | 13 | 0.4% |
| German | 578 | 17.1% |
| Greek | 20 | 0.6% |
| Irish | 488 | 14.5% |
| Italian | 48 | 1.4% |
| Korean | 3 | 0.1% |
| Mexican | 352 | 10.4% |
| Norwegian | 50 | 1.5% |
| Peruvian | 16 | 0.5% |
| Polish | 8 | 0.2% |
| Pueblo | 42 | 1.2% |
| Puerto Rican | 20 | 0.6% |
| Russian | 6 | 0.2% |
| Scandinavian | 6 | 0.2% |
| Scotch-Irish | 102 | 3.0% |
| Scottish | 52 | 1.5% |
| South American | 16 | 0.5% |
| Spaniard | 40 | 1.2% |
| Swedish | 22 | 0.6% |
| Welsh | 7 | 0.2% | View All 29 Rows |
Immigrants in Llano
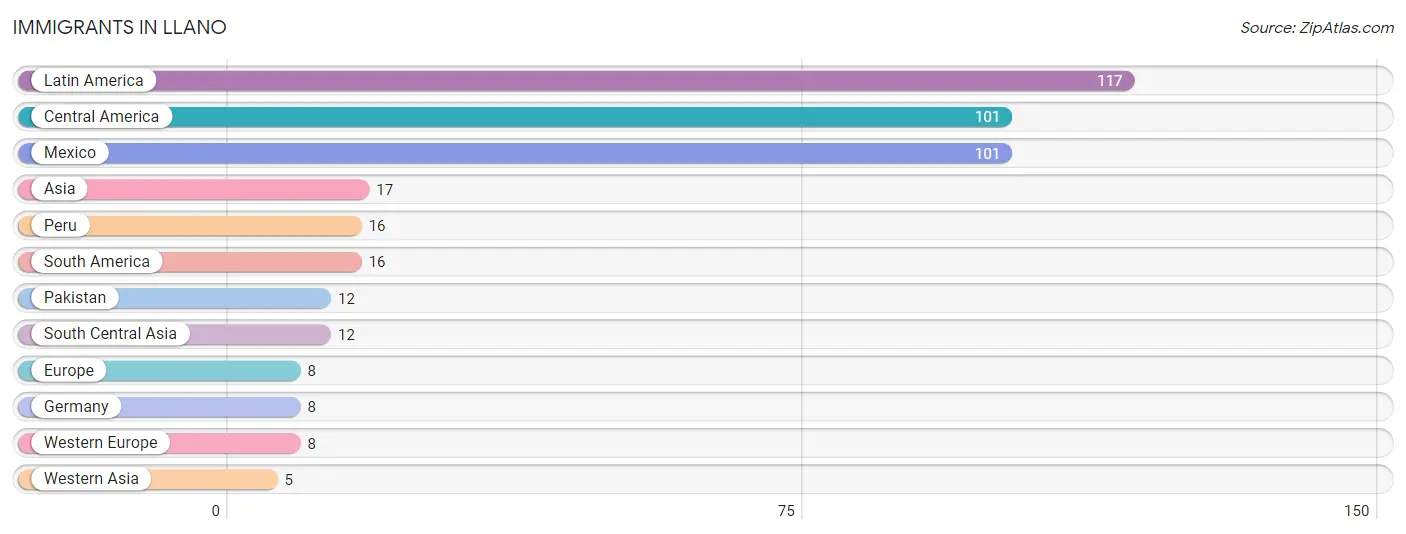
The most numerous immigrant groups reported in Llano came from Latin America (117 | 3.5%), Central America (101 | 3.0%), Mexico (101 | 3.0%), Asia (17 | 0.5%), and Peru (16 | 0.5%), together accounting for 10.4% of all Llano residents.
| Immigration Origin | # Population | % Population |
| Asia | 17 | 0.5% |
| Central America | 101 | 3.0% |
| Europe | 8 | 0.2% |
| Germany | 8 | 0.2% |
| Latin America | 117 | 3.5% |
| Mexico | 101 | 3.0% |
| Pakistan | 12 | 0.4% |
| Peru | 16 | 0.5% |
| South America | 16 | 0.5% |
| South Central Asia | 12 | 0.4% |
| Western Asia | 5 | 0.2% |
| Western Europe | 8 | 0.2% | View All 12 Rows |
Sex and Age in Llano
Sex and Age in Llano
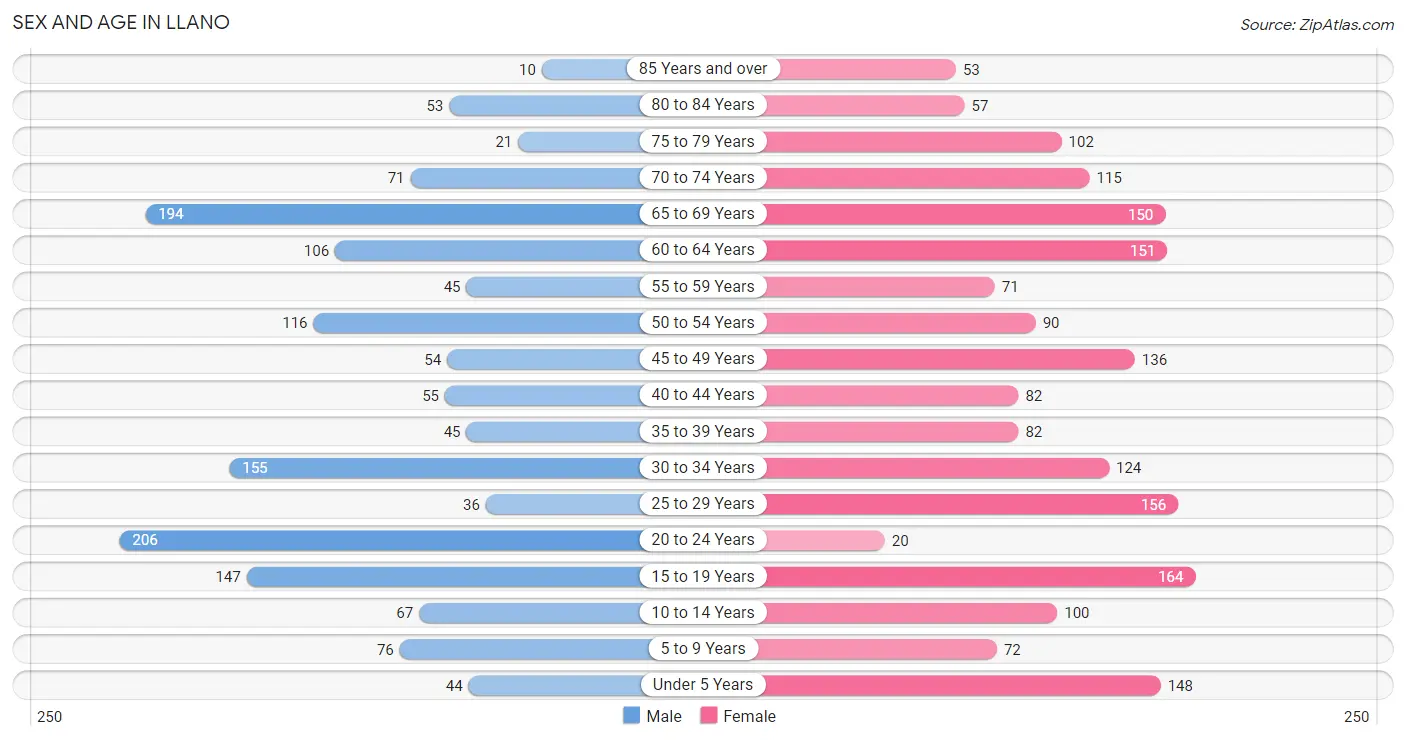
The most populous age groups in Llano are 20 to 24 Years (206 | 13.7%) for men and 15 to 19 Years (164 | 8.8%) for women.
| Age Bracket | Male | Female |
| Under 5 Years | 44 (2.9%) | 148 (7.9%) |
| 5 to 9 Years | 76 (5.1%) | 72 (3.8%) |
| 10 to 14 Years | 67 (4.5%) | 100 (5.3%) |
| 15 to 19 Years | 147 (9.8%) | 164 (8.8%) |
| 20 to 24 Years | 206 (13.7%) | 20 (1.1%) |
| 25 to 29 Years | 36 (2.4%) | 156 (8.3%) |
| 30 to 34 Years | 155 (10.3%) | 124 (6.6%) |
| 35 to 39 Years | 45 (3.0%) | 82 (4.4%) |
| 40 to 44 Years | 55 (3.7%) | 82 (4.4%) |
| 45 to 49 Years | 54 (3.6%) | 136 (7.3%) |
| 50 to 54 Years | 116 (7.7%) | 90 (4.8%) |
| 55 to 59 Years | 45 (3.0%) | 71 (3.8%) |
| 60 to 64 Years | 106 (7.1%) | 151 (8.1%) |
| 65 to 69 Years | 194 (12.9%) | 150 (8.0%) |
| 70 to 74 Years | 71 (4.7%) | 115 (6.1%) |
| 75 to 79 Years | 21 (1.4%) | 102 (5.4%) |
| 80 to 84 Years | 53 (3.5%) | 57 (3.0%) |
| 85 Years and over | 10 (0.7%) | 53 (2.8%) |
| Total | 1,501 (100.0%) | 1,873 (100.0%) |
Families and Households in Llano
Median Family Size in Llano
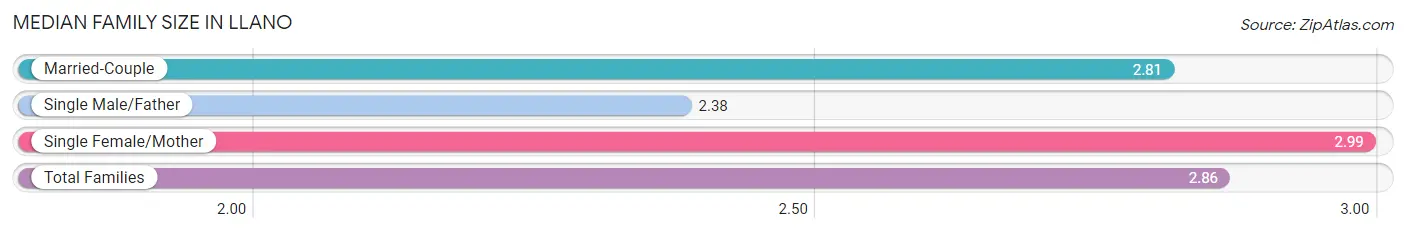
The median family size in Llano is 2.86 persons per family, with single female/mother families (301 | 34.1%) accounting for the largest median family size of 2.99 persons per family. On the other hand, single male/father families (8 | 0.9%) represent the smallest median family size with 2.38 persons per family.
| Family Type | # Families | Family Size |
| Married-Couple | 575 (65.0%) | 2.81 |
| Single Male/Father | 8 (0.9%) | 2.38 |
| Single Female/Mother | 301 (34.1%) | 2.99 |
| Total Families | 884 (100.0%) | 2.86 |
Median Household Size in Llano
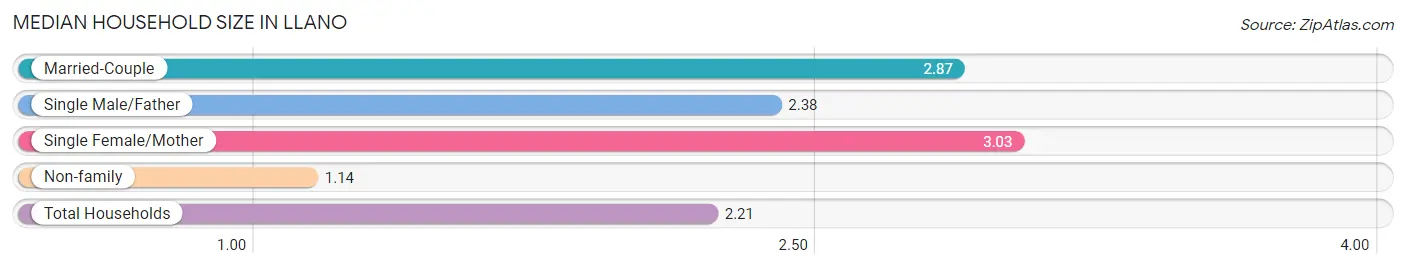
The median household size in Llano is 2.21 persons per household, with single female/mother households (301 | 20.5%) accounting for the largest median household size of 3.03 persons per household. non-family households (583 | 39.7%) represent the smallest median household size with 1.14 persons per household.
| Household Type | # Households | Household Size |
| Married-Couple | 575 (39.2%) | 2.87 |
| Single Male/Father | 8 (0.5%) | 2.38 |
| Single Female/Mother | 301 (20.5%) | 3.03 |
| Non-family | 583 (39.7%) | 1.14 |
| Total Households | 1,467 (100.0%) | 2.21 |
Household Size by Marriage Status in Llano
Out of a total of 1,467 households in Llano, 884 (60.3%) are family households, while 583 (39.7%) are nonfamily households. The most numerous type of family households are 2-person households, comprising 435, and the most common type of nonfamily households are 1-person households, comprising 521.
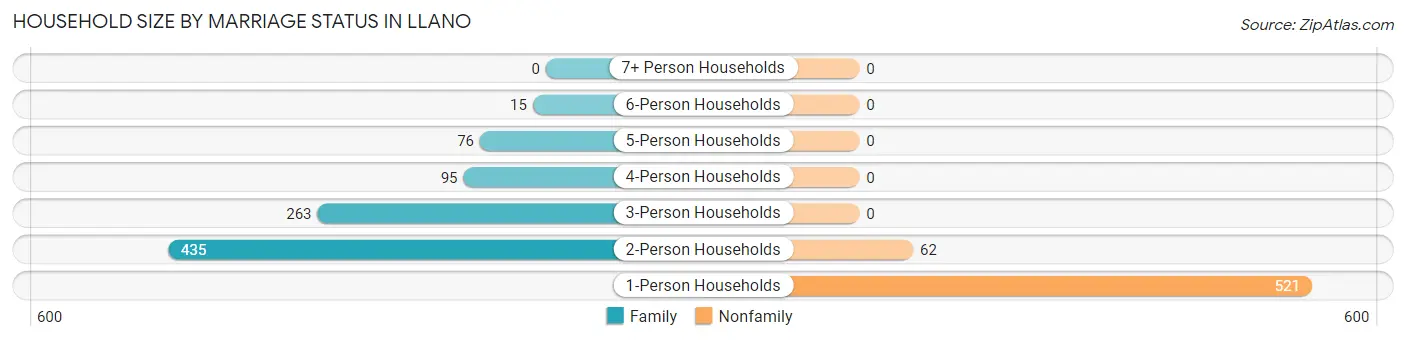
| Household Size | Family Households | Nonfamily Households |
| 1-Person Households | - | 521 (35.5%) |
| 2-Person Households | 435 (29.6%) | 62 (4.2%) |
| 3-Person Households | 263 (17.9%) | 0 (0.0%) |
| 4-Person Households | 95 (6.5%) | 0 (0.0%) |
| 5-Person Households | 76 (5.2%) | 0 (0.0%) |
| 6-Person Households | 15 (1.0%) | 0 (0.0%) |
| 7+ Person Households | 0 (0.0%) | 0 (0.0%) |
| Total | 884 (60.3%) | 583 (39.7%) |
Female Fertility in Llano
Fertility by Age in Llano
Average fertility rate in Llano is 38.0 births per 1,000 women. Women in the age bracket of 20 to 34 years have the highest fertility rate with 97.0 births per 1,000 women. Women in the age bracket of 20 to 34 years acount for 100.0% of all women with births.
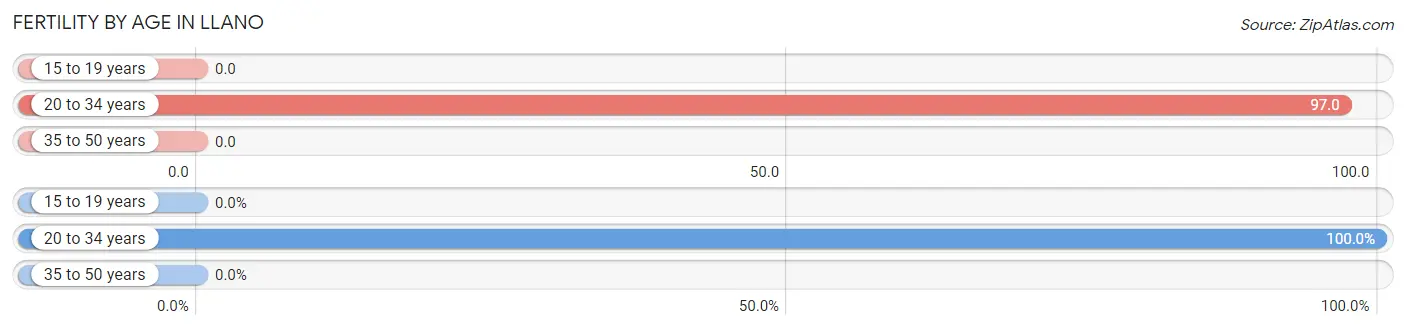
| Age Bracket | Women with Births | Births / 1,000 Women |
| 15 to 19 years | 0 (0.0%) | 0.0 |
| 20 to 34 years | 29 (100.0%) | 97.0 |
| 35 to 50 years | 0 (0.0%) | 0.0 |
| Total | 29 (100.0%) | 38.0 |
Fertility by Age by Marriage Status in Llano
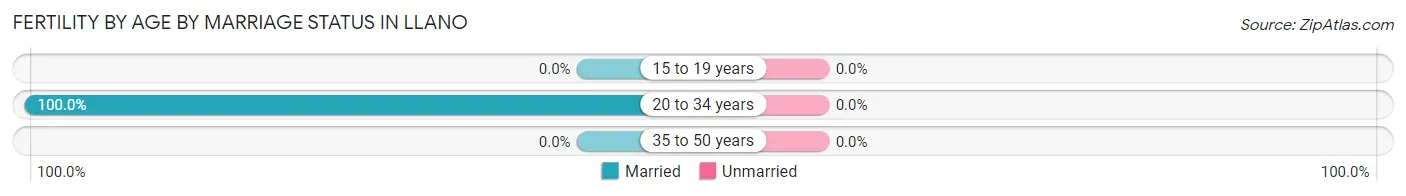
| Age Bracket | Married | Unmarried |
| 15 to 19 years | 0 (0.0%) | 0 (0.0%) |
| 20 to 34 years | 29 (100.0%) | 0 (0.0%) |
| 35 to 50 years | 0 (0.0%) | 0 (0.0%) |
| Total | 29 (100.0%) | 0 (0.0%) |
Fertility by Education in Llano
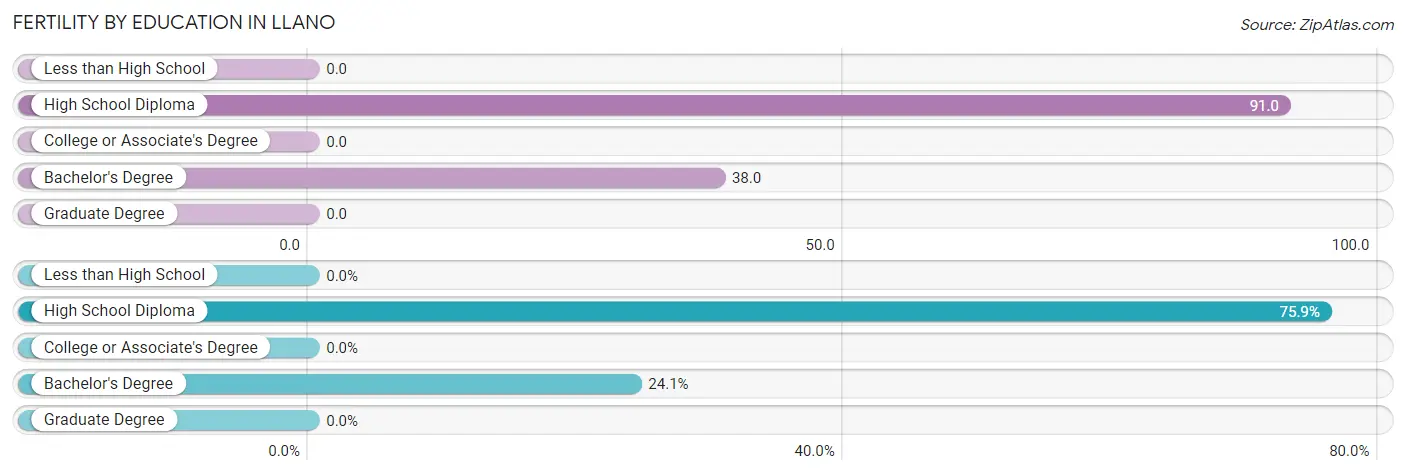
| Educational Attainment | Women with Births | Births / 1,000 Women |
| Less than High School | 0 (0.0%) | 0.0 |
| High School Diploma | 22 (75.9%) | 91.0 |
| College or Associate's Degree | 0 (0.0%) | 0.0 |
| Bachelor's Degree | 7 (24.1%) | 38.0 |
| Graduate Degree | 0 (0.0%) | 0.0 |
| Total | 29 (100.0%) | 38.0 |
Fertility by Education by Marriage Status in Llano
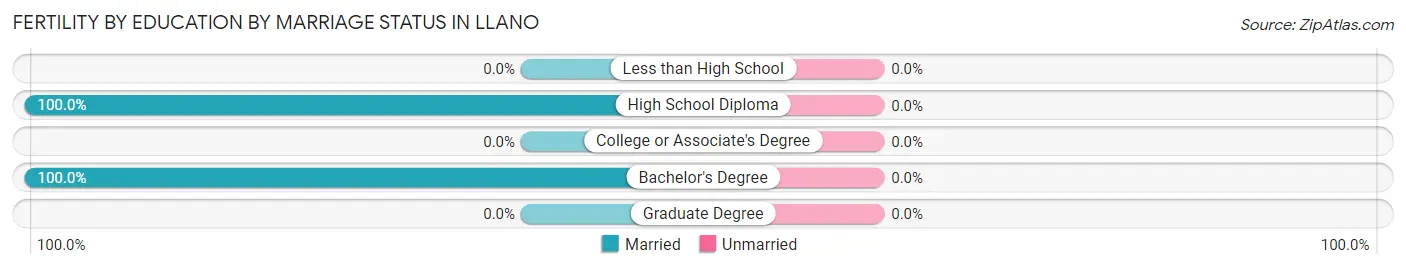
| Educational Attainment | Married | Unmarried |
| Less than High School | 0 (0.0%) | 0 (0.0%) |
| High School Diploma | 22 (100.0%) | 0 (0.0%) |
| College or Associate's Degree | 0 (0.0%) | 0 (0.0%) |
| Bachelor's Degree | 7 (100.0%) | 0 (0.0%) |
| Graduate Degree | 0 (0.0%) | 0 (0.0%) |
| Total | 29 (100.0%) | 0 (0.0%) |
Employment Characteristics in Llano
Employment by Class of Employer in Llano
Among the 1,660 employed individuals in Llano, private company employees (887 | 53.4%), local government employees (247 | 14.9%), and self-employed (incorporated) (159 | 9.6%) make up the most common classes of employment.
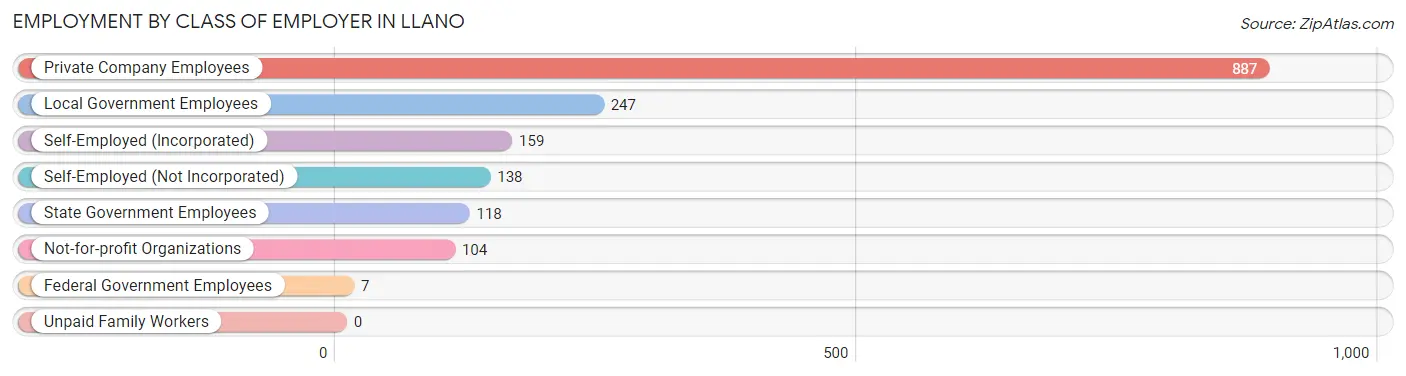
| Employer Class | # Employees | % Employees |
| Private Company Employees | 887 | 53.4% |
| Self-Employed (Incorporated) | 159 | 9.6% |
| Self-Employed (Not Incorporated) | 138 | 8.3% |
| Not-for-profit Organizations | 104 | 6.3% |
| Local Government Employees | 247 | 14.9% |
| State Government Employees | 118 | 7.1% |
| Federal Government Employees | 7 | 0.4% |
| Unpaid Family Workers | 0 | 0.0% |
| Total | 1,660 | 100.0% |
Employment Status by Age in Llano
According to the labor force statistics for Llano, out of the total population over 16 years of age (2,780), 64.6% or 1,796 individuals are in the labor force, with 7.6% or 136 of them unemployed. The age group with the highest labor force participation rate is 20 to 24 years, with 100.0% or 226 individuals in the labor force. Within the labor force, the 16 to 19 years age range has the highest percentage of unemployed individuals, with 56.2% or 100 of them being unemployed.
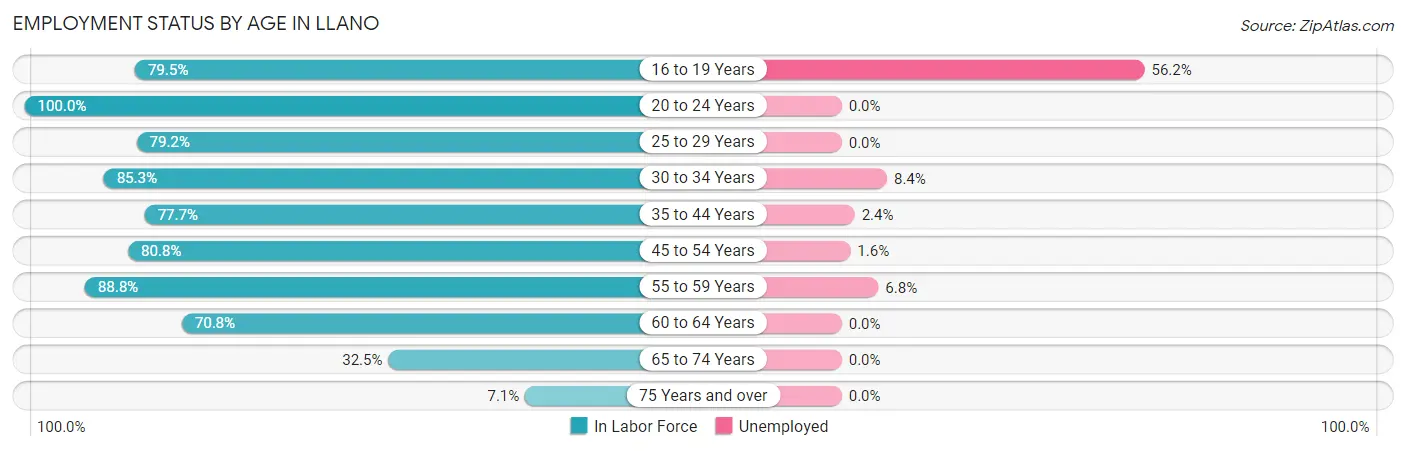
| Age Bracket | In Labor Force | Unemployed |
| 16 to 19 Years | 178 (79.5%) | 100 (56.2%) |
| 20 to 24 Years | 226 (100.0%) | 0 (0.0%) |
| 25 to 29 Years | 152 (79.2%) | 0 (0.0%) |
| 30 to 34 Years | 238 (85.3%) | 20 (8.4%) |
| 35 to 44 Years | 205 (77.7%) | 5 (2.4%) |
| 45 to 54 Years | 320 (80.8%) | 5 (1.6%) |
| 55 to 59 Years | 103 (88.8%) | 7 (6.8%) |
| 60 to 64 Years | 182 (70.8%) | 0 (0.0%) |
| 65 to 74 Years | 172 (32.5%) | 0 (0.0%) |
| 75 Years and over | 21 (7.1%) | 0 (0.0%) |
| Total | 1,796 (64.6%) | 136 (7.6%) |
Employment Status by Educational Attainment in Llano
According to labor force statistics for Llano, 79.8% of individuals (1,200) out of the total population between 25 and 64 years of age (1,504) are in the labor force, with 3.1% or 37 of them being unemployed. The group with the highest labor force participation rate are those with the educational attainment of bachelor's degree or higher, with 94.5% or 358 individuals in the labor force. Within the labor force, individuals with less than high school education have the highest percentage of unemployment, with 16.3% or 16 of them being unemployed.
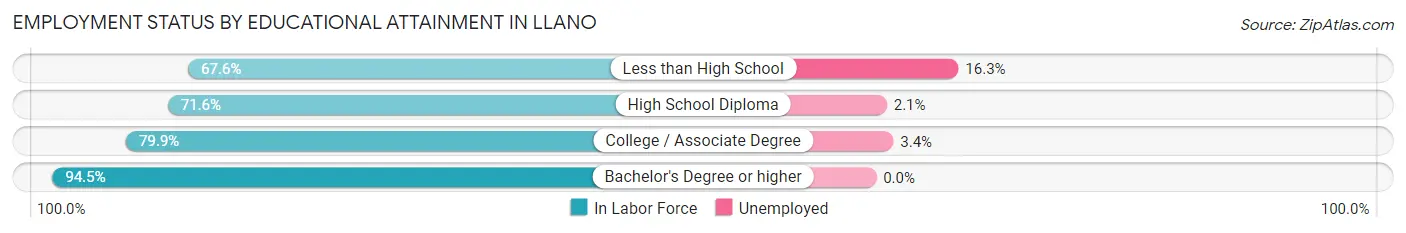
| Educational Attainment | In Labor Force | Unemployed |
| Less than High School | 98 (67.6%) | 24 (16.3%) |
| High School Diploma | 335 (71.6%) | 10 (2.1%) |
| College / Associate Degree | 409 (79.9%) | 17 (3.4%) |
| Bachelor's Degree or higher | 358 (94.5%) | 0 (0.0%) |
| Total | 1,200 (79.8%) | 47 (3.1%) |
Employment Occupations by Sex in Llano
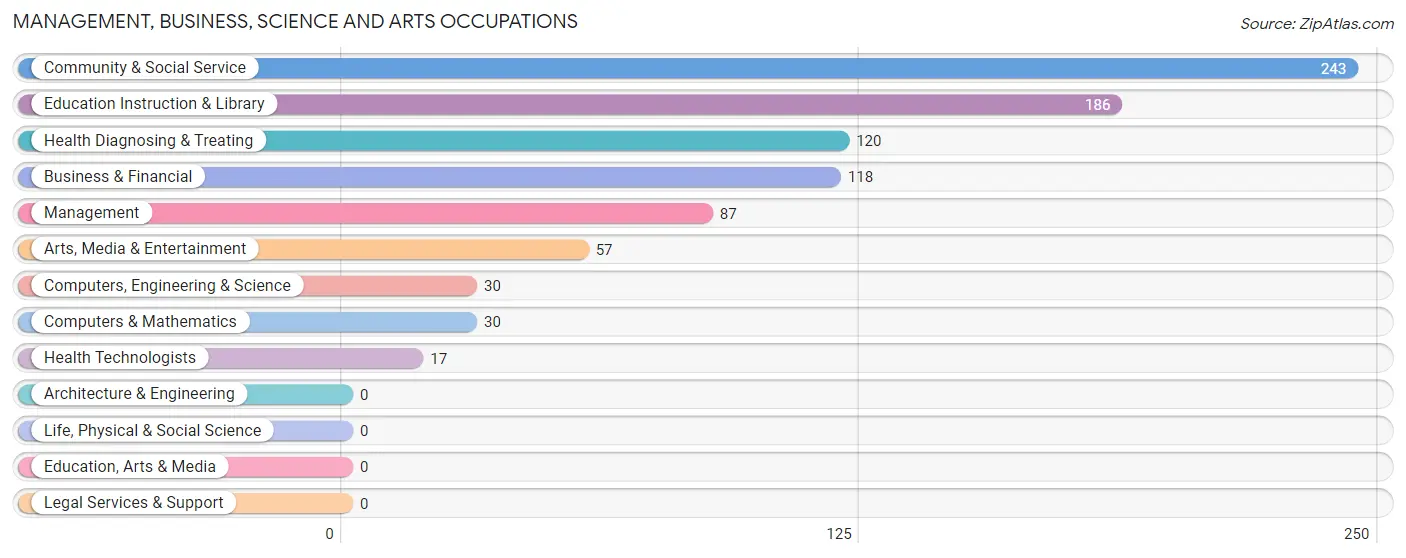
Management, Business, Science and Arts Occupations
The most common Management, Business, Science and Arts occupations in Llano are Community & Social Service (243 | 14.6%), Education Instruction & Library (186 | 11.2%), Health Diagnosing & Treating (120 | 7.2%), Business & Financial (118 | 7.1%), and Management (87 | 5.2%).
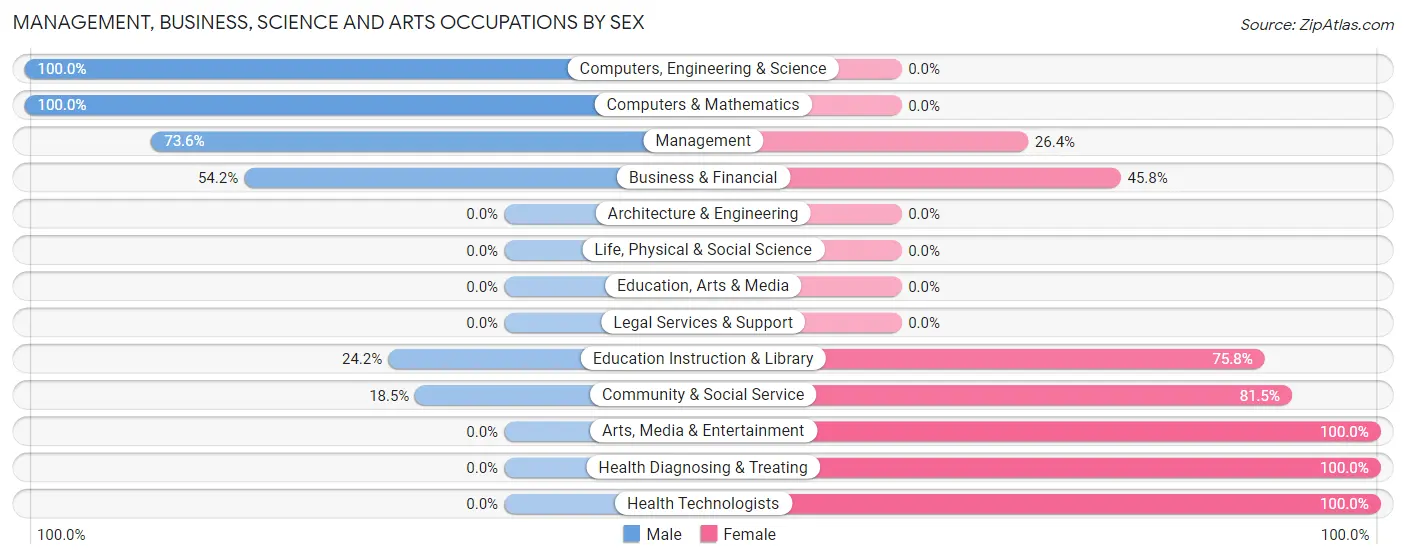
Management, Business, Science and Arts Occupations by Sex
Within the Management, Business, Science and Arts occupations in Llano, the most male-oriented occupations are Computers, Engineering & Science (100.0%), Computers & Mathematics (100.0%), and Management (73.6%), while the most female-oriented occupations are Arts, Media & Entertainment (100.0%), Health Diagnosing & Treating (100.0%), and Health Technologists (100.0%).
| Occupation | Male | Female |
| Management | 64 (73.6%) | 23 (26.4%) |
| Business & Financial | 64 (54.2%) | 54 (45.8%) |
| Computers, Engineering & Science | 30 (100.0%) | 0 (0.0%) |
| Computers & Mathematics | 30 (100.0%) | 0 (0.0%) |
| Architecture & Engineering | 0 (0.0%) | 0 (0.0%) |
| Life, Physical & Social Science | 0 (0.0%) | 0 (0.0%) |
| Community & Social Service | 45 (18.5%) | 198 (81.5%) |
| Education, Arts & Media | 0 (0.0%) | 0 (0.0%) |
| Legal Services & Support | 0 (0.0%) | 0 (0.0%) |
| Education Instruction & Library | 45 (24.2%) | 141 (75.8%) |
| Arts, Media & Entertainment | 0 (0.0%) | 57 (100.0%) |
| Health Diagnosing & Treating | 0 (0.0%) | 120 (100.0%) |
| Health Technologists | 0 (0.0%) | 17 (100.0%) |
| Total (Category) | 203 (34.0%) | 395 (66.0%) |
| Total (Overall) | 808 (48.7%) | 852 (51.3%) |
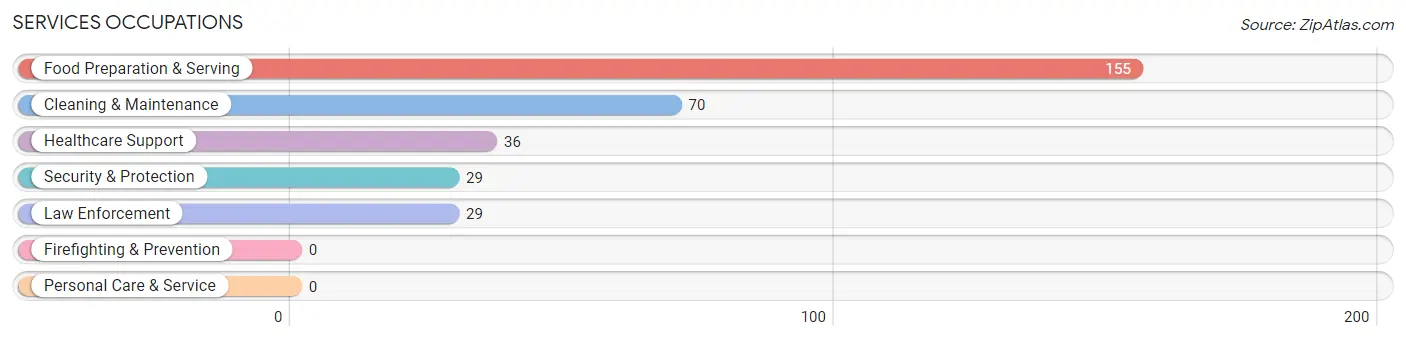
Services Occupations
The most common Services occupations in Llano are Food Preparation & Serving (155 | 9.3%), Cleaning & Maintenance (70 | 4.2%), Healthcare Support (36 | 2.2%), Security & Protection (29 | 1.8%), and Law Enforcement (29 | 1.8%).
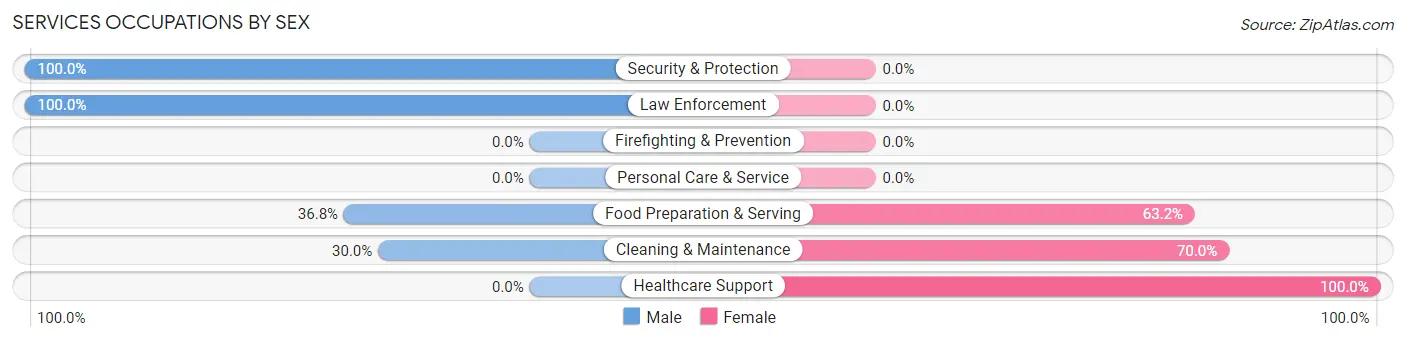
Services Occupations by Sex
Within the Services occupations in Llano, the most male-oriented occupations are Security & Protection (100.0%), Law Enforcement (100.0%), and Food Preparation & Serving (36.8%), while the most female-oriented occupations are Healthcare Support (100.0%), Cleaning & Maintenance (70.0%), and Food Preparation & Serving (63.2%).
| Occupation | Male | Female |
| Healthcare Support | 0 (0.0%) | 36 (100.0%) |
| Security & Protection | 29 (100.0%) | 0 (0.0%) |
| Firefighting & Prevention | 0 (0.0%) | 0 (0.0%) |
| Law Enforcement | 29 (100.0%) | 0 (0.0%) |
| Food Preparation & Serving | 57 (36.8%) | 98 (63.2%) |
| Cleaning & Maintenance | 21 (30.0%) | 49 (70.0%) |
| Personal Care & Service | 0 (0.0%) | 0 (0.0%) |
| Total (Category) | 107 (36.9%) | 183 (63.1%) |
| Total (Overall) | 808 (48.7%) | 852 (51.3%) |
Sales and Office Occupations
The most common Sales and Office occupations in Llano are Sales & Related (134 | 8.1%), and Office & Administration (130 | 7.8%).
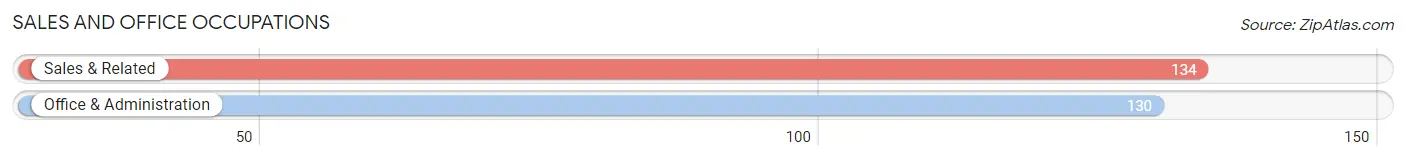
Sales and Office Occupations by Sex

| Occupation | Male | Female |
| Sales & Related | 60 (44.8%) | 74 (55.2%) |
| Office & Administration | 5 (3.8%) | 125 (96.2%) |
| Total (Category) | 65 (24.6%) | 199 (75.4%) |
| Total (Overall) | 808 (48.7%) | 852 (51.3%) |
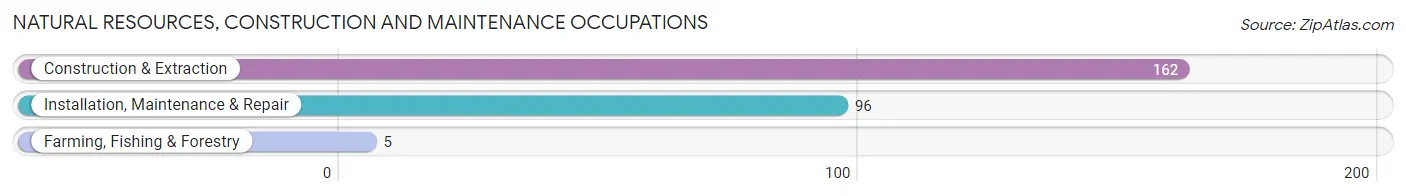
Natural Resources, Construction and Maintenance Occupations
The most common Natural Resources, Construction and Maintenance occupations in Llano are Construction & Extraction (162 | 9.8%), Installation, Maintenance & Repair (96 | 5.8%), and Farming, Fishing & Forestry (5 | 0.3%).
Natural Resources, Construction and Maintenance Occupations by Sex
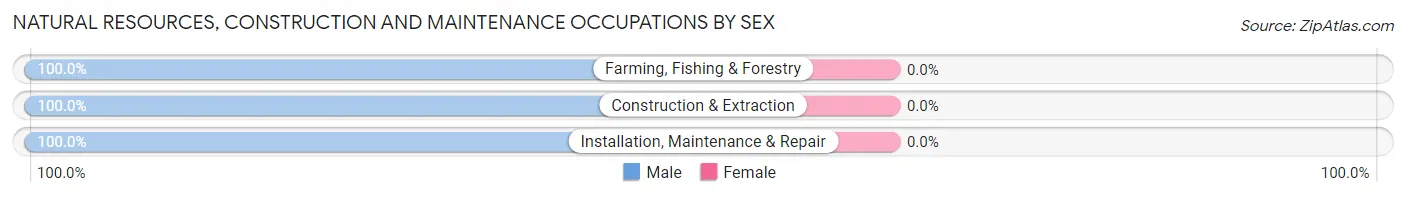
| Occupation | Male | Female |
| Farming, Fishing & Forestry | 5 (100.0%) | 0 (0.0%) |
| Construction & Extraction | 162 (100.0%) | 0 (0.0%) |
| Installation, Maintenance & Repair | 96 (100.0%) | 0 (0.0%) |
| Total (Category) | 263 (100.0%) | 0 (0.0%) |
| Total (Overall) | 808 (48.7%) | 852 (51.3%) |
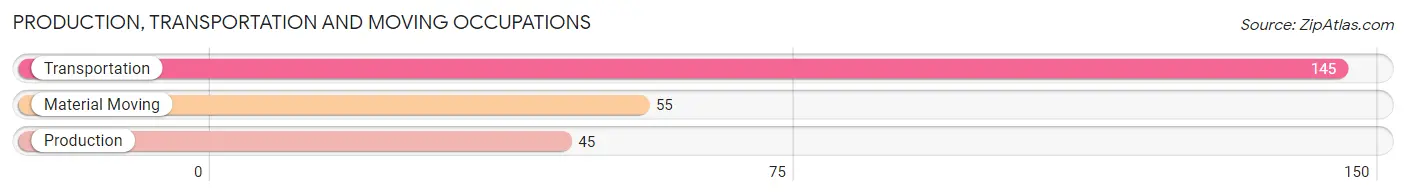
Production, Transportation and Moving Occupations
The most common Production, Transportation and Moving occupations in Llano are Transportation (145 | 8.7%), Material Moving (55 | 3.3%), and Production (45 | 2.7%).
Production, Transportation and Moving Occupations by Sex
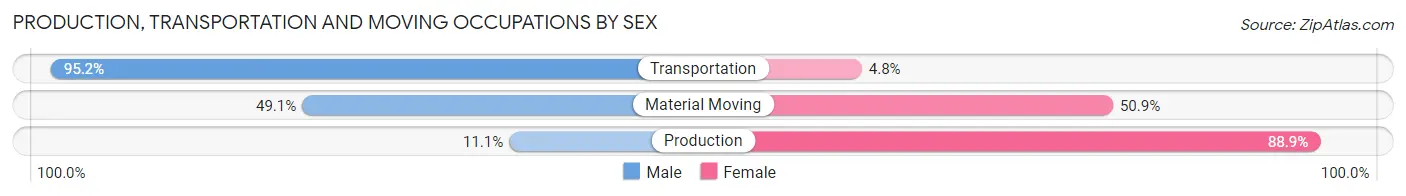
| Occupation | Male | Female |
| Production | 5 (11.1%) | 40 (88.9%) |
| Transportation | 138 (95.2%) | 7 (4.8%) |
| Material Moving | 27 (49.1%) | 28 (50.9%) |
| Total (Category) | 170 (69.4%) | 75 (30.6%) |
| Total (Overall) | 808 (48.7%) | 852 (51.3%) |
Employment Industries by Sex in Llano
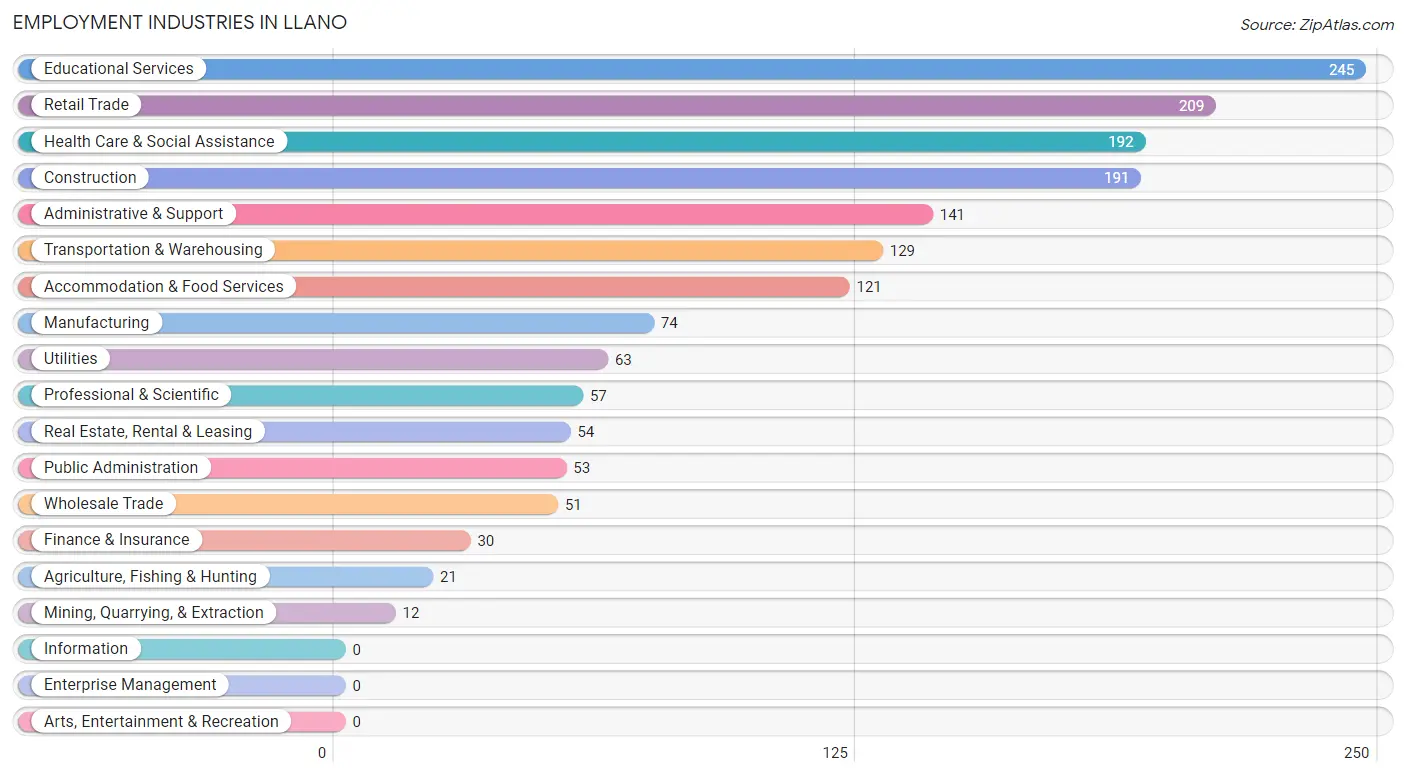
Employment Industries in Llano
The major employment industries in Llano include Educational Services (245 | 14.8%), Retail Trade (209 | 12.6%), Health Care & Social Assistance (192 | 11.6%), Construction (191 | 11.5%), and Administrative & Support (141 | 8.5%).
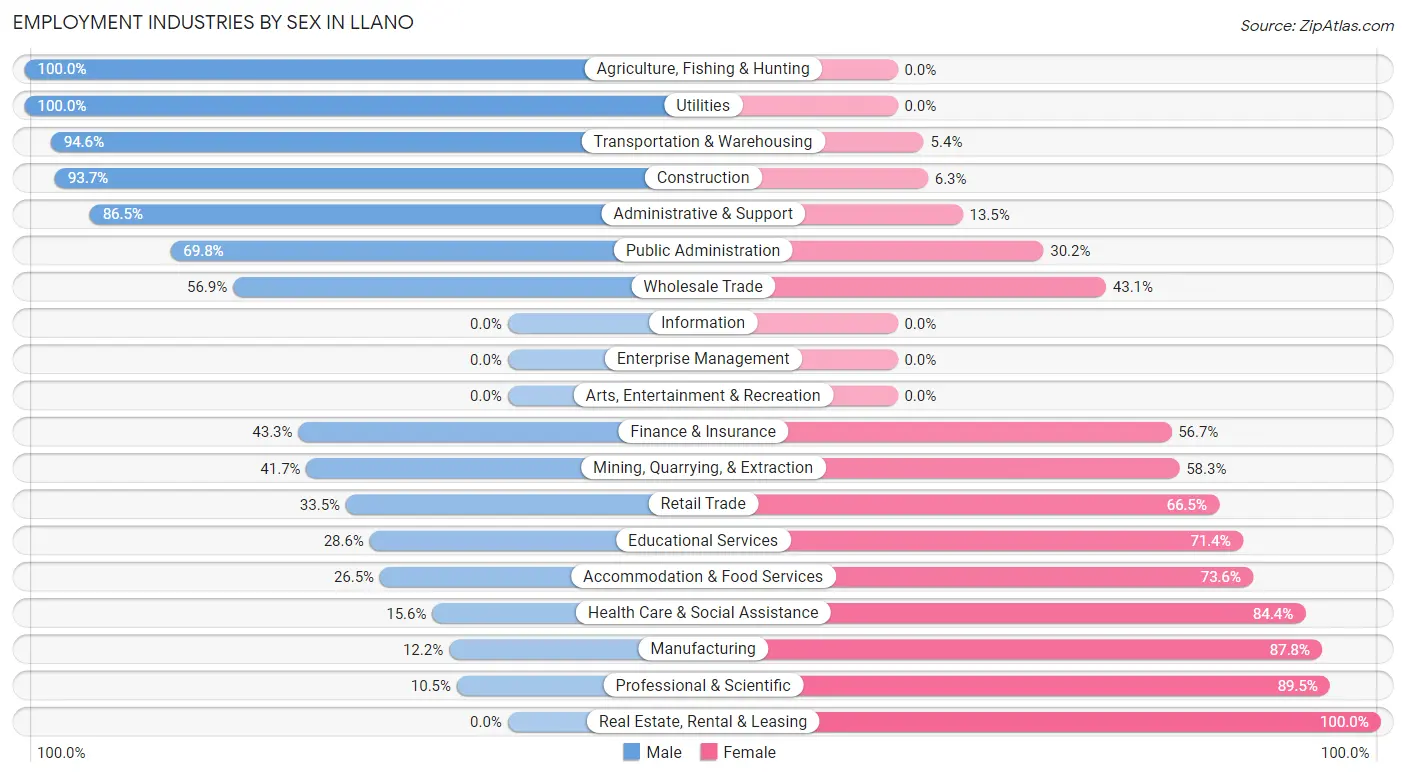
Employment Industries by Sex in Llano
The Llano industries that see more men than women are Agriculture, Fishing & Hunting (100.0%), Utilities (100.0%), and Transportation & Warehousing (94.6%), whereas the industries that tend to have a higher number of women are Real Estate, Rental & Leasing (100.0%), Professional & Scientific (89.5%), and Manufacturing (87.8%).
| Industry | Male | Female |
| Agriculture, Fishing & Hunting | 21 (100.0%) | 0 (0.0%) |
| Mining, Quarrying, & Extraction | 5 (41.7%) | 7 (58.3%) |
| Construction | 179 (93.7%) | 12 (6.3%) |
| Manufacturing | 9 (12.2%) | 65 (87.8%) |
| Wholesale Trade | 29 (56.9%) | 22 (43.1%) |
| Retail Trade | 70 (33.5%) | 139 (66.5%) |
| Transportation & Warehousing | 122 (94.6%) | 7 (5.4%) |
| Utilities | 63 (100.0%) | 0 (0.0%) |
| Information | 0 (0.0%) | 0 (0.0%) |
| Finance & Insurance | 13 (43.3%) | 17 (56.7%) |
| Real Estate, Rental & Leasing | 0 (0.0%) | 54 (100.0%) |
| Professional & Scientific | 6 (10.5%) | 51 (89.5%) |
| Enterprise Management | 0 (0.0%) | 0 (0.0%) |
| Administrative & Support | 122 (86.5%) | 19 (13.5%) |
| Educational Services | 70 (28.6%) | 175 (71.4%) |
| Health Care & Social Assistance | 30 (15.6%) | 162 (84.4%) |
| Arts, Entertainment & Recreation | 0 (0.0%) | 0 (0.0%) |
| Accommodation & Food Services | 32 (26.5%) | 89 (73.6%) |
| Public Administration | 37 (69.8%) | 16 (30.2%) |
| Total | 808 (48.7%) | 852 (51.3%) |
Education in Llano
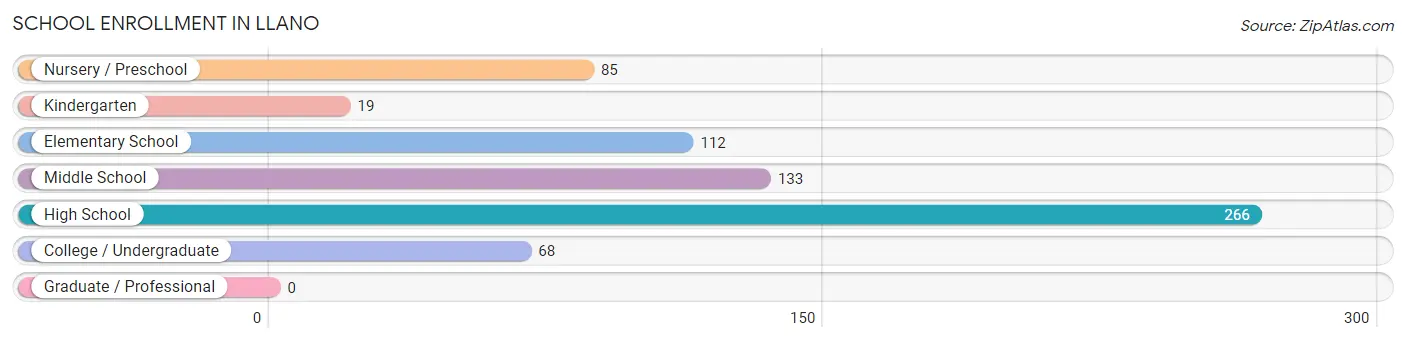
School Enrollment in Llano
The most common levels of schooling among the 683 students in Llano are high school (266 | 39.0%), middle school (133 | 19.5%), and elementary school (112 | 16.4%).
| School Level | # Students | % Students |
| Nursery / Preschool | 85 | 12.4% |
| Kindergarten | 19 | 2.8% |
| Elementary School | 112 | 16.4% |
| Middle School | 133 | 19.5% |
| High School | 266 | 39.0% |
| College / Undergraduate | 68 | 10.0% |
| Graduate / Professional | 0 | 0.0% |
| Total | 683 | 100.0% |
School Enrollment by Age by Funding Source in Llano
Out of a total of 683 students who are enrolled in schools in Llano, 125 (18.3%) attend a private institution, while the remaining 558 (81.7%) are enrolled in public schools. The age group of 3 to 4 year olds has the highest likelihood of being enrolled in private schools, with 61 (100.0% in the age bracket) enrolled. Conversely, the age group of 15 to 17 year olds has the lowest likelihood of being enrolled in a private school, with 177 (100.0% in the age bracket) attending a public institution.
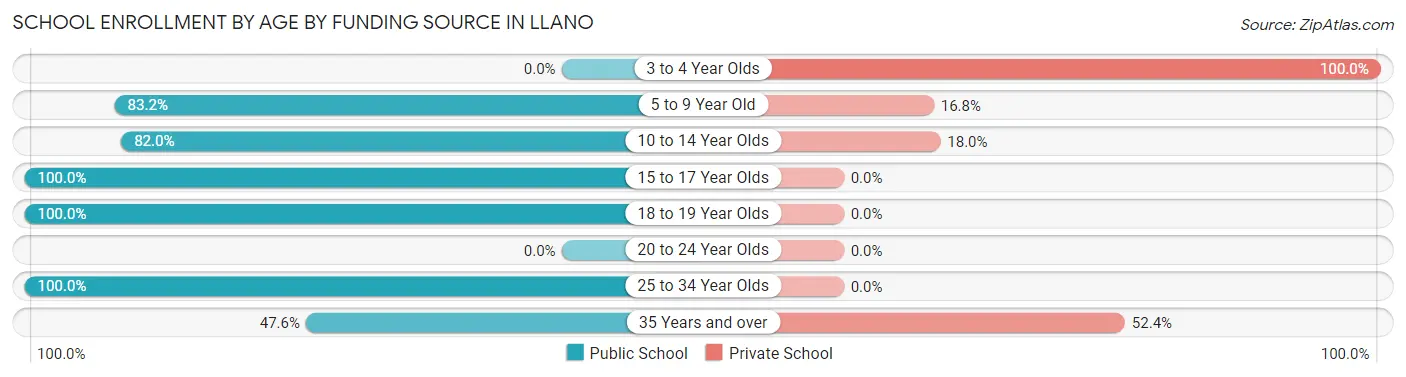
| Age Bracket | Public School | Private School |
| 3 to 4 Year Olds | 0 (0.0%) | 61 (100.0%) |
| 5 to 9 Year Old | 119 (83.2%) | 24 (16.8%) |
| 10 to 14 Year Olds | 132 (82.0%) | 29 (18.0%) |
| 15 to 17 Year Olds | 177 (100.0%) | 0 (0.0%) |
| 18 to 19 Year Olds | 62 (100.0%) | 0 (0.0%) |
| 20 to 24 Year Olds | 0 (0.0%) | 0 (0.0%) |
| 25 to 34 Year Olds | 58 (100.0%) | 0 (0.0%) |
| 35 Years and over | 10 (47.6%) | 11 (52.4%) |
| Total | 558 (81.7%) | 125 (18.3%) |
Educational Attainment by Field of Study in Llano
Bio, nature & agricultural (167 | 27.3%), education (101 | 16.5%), business (89 | 14.5%), visual & performing arts (65 | 10.6%), and science & technology (43 | 7.0%) are the most common fields of study among 612 individuals in Llano who have obtained a bachelor's degree or higher.
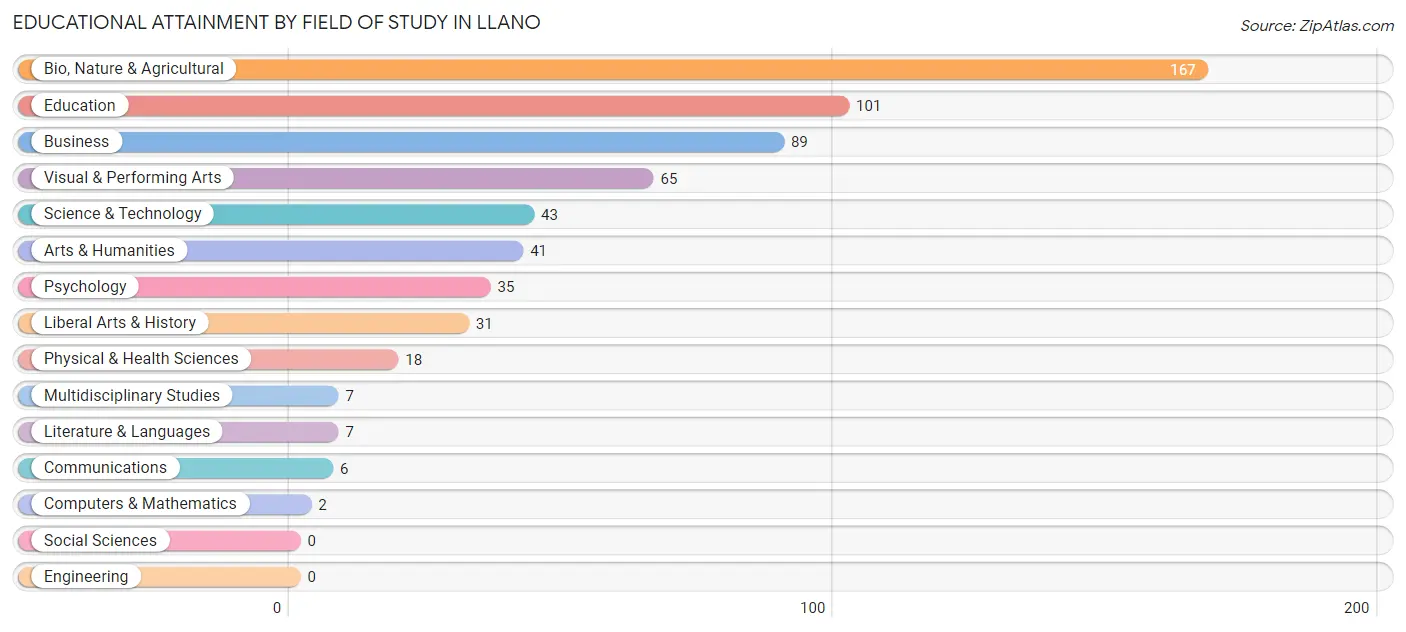
| Field of Study | # Graduates | % Graduates |
| Computers & Mathematics | 2 | 0.3% |
| Bio, Nature & Agricultural | 167 | 27.3% |
| Physical & Health Sciences | 18 | 2.9% |
| Psychology | 35 | 5.7% |
| Social Sciences | 0 | 0.0% |
| Engineering | 0 | 0.0% |
| Multidisciplinary Studies | 7 | 1.1% |
| Science & Technology | 43 | 7.0% |
| Business | 89 | 14.5% |
| Education | 101 | 16.5% |
| Literature & Languages | 7 | 1.1% |
| Liberal Arts & History | 31 | 5.1% |
| Visual & Performing Arts | 65 | 10.6% |
| Communications | 6 | 1.0% |
| Arts & Humanities | 41 | 6.7% |
| Total | 612 | 100.0% |
Transportation & Commute in Llano
Vehicle Availability by Sex in Llano
The most prevalent vehicle ownership categories in Llano are males with 3 vehicles (450, accounting for 55.7%) and females with 3 vehicles (374, making up 52.8%).
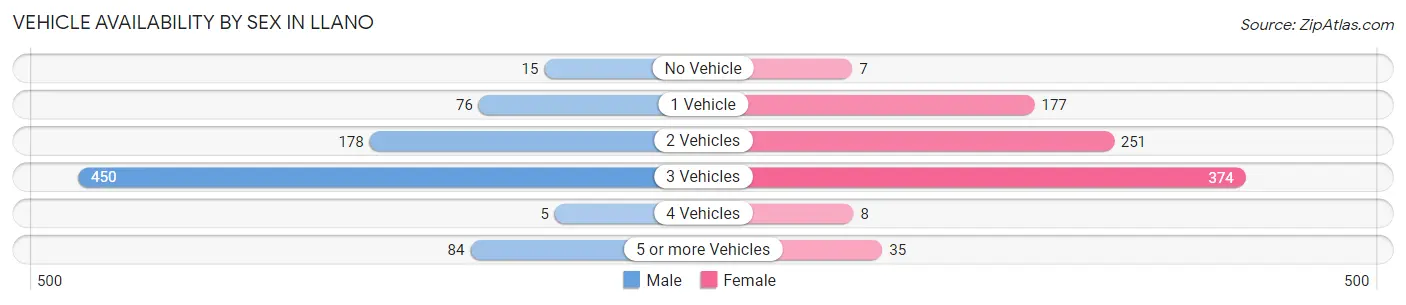
| Vehicles Available | Male | Female |
| No Vehicle | 15 (1.9%) | 7 (0.8%) |
| 1 Vehicle | 76 (9.4%) | 177 (20.8%) |
| 2 Vehicles | 178 (22.0%) | 251 (29.5%) |
| 3 Vehicles | 450 (55.7%) | 374 (43.9%) |
| 4 Vehicles | 5 (0.6%) | 8 (0.9%) |
| 5 or more Vehicles | 84 (10.4%) | 35 (4.1%) |
| Total | 808 (100.0%) | 852 (100.0%) |
Commute Time in Llano
The most frequently occuring commute durations in Llano are 5 to 9 minutes (537 commuters, 33.7%), 45 to 59 minutes (262 commuters, 16.4%), and 30 to 34 minutes (216 commuters, 13.5%).
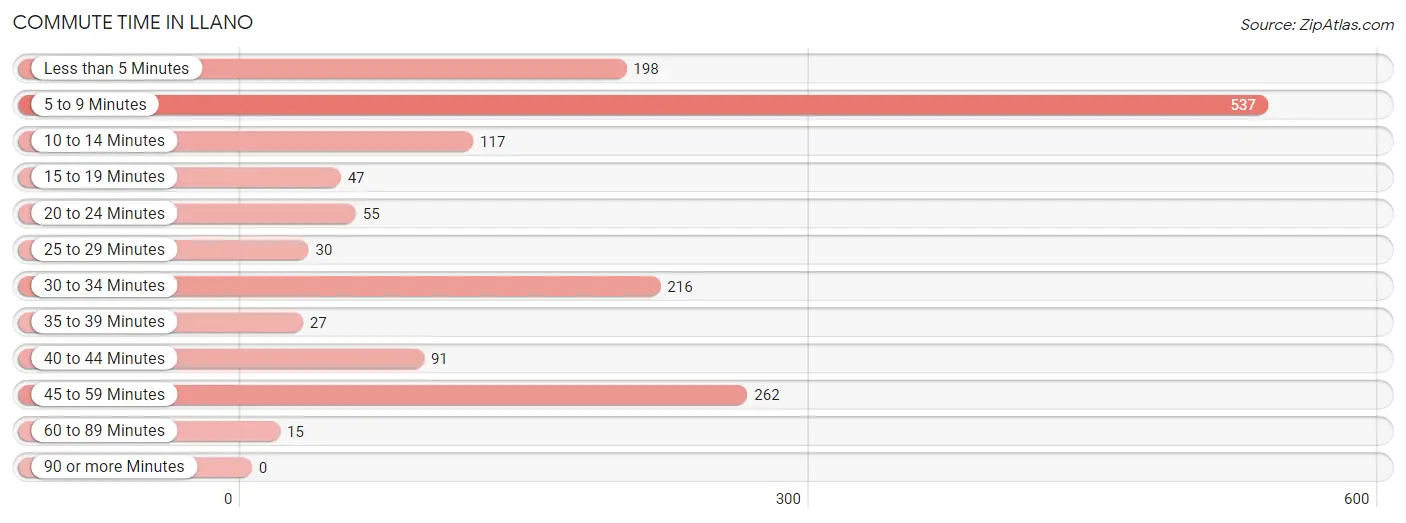
| Commute Time | # Commuters | % Commuters |
| Less than 5 Minutes | 198 | 12.4% |
| 5 to 9 Minutes | 537 | 33.7% |
| 10 to 14 Minutes | 117 | 7.3% |
| 15 to 19 Minutes | 47 | 2.9% |
| 20 to 24 Minutes | 55 | 3.5% |
| 25 to 29 Minutes | 30 | 1.9% |
| 30 to 34 Minutes | 216 | 13.5% |
| 35 to 39 Minutes | 27 | 1.7% |
| 40 to 44 Minutes | 91 | 5.7% |
| 45 to 59 Minutes | 262 | 16.4% |
| 60 to 89 Minutes | 15 | 0.9% |
| 90 or more Minutes | 0 | 0.0% |
Commute Time by Sex in Llano
The most common commute times in Llano are 45 to 59 minutes (205 commuters, 25.4%) for males and 5 to 9 minutes (384 commuters, 48.8%) for females.
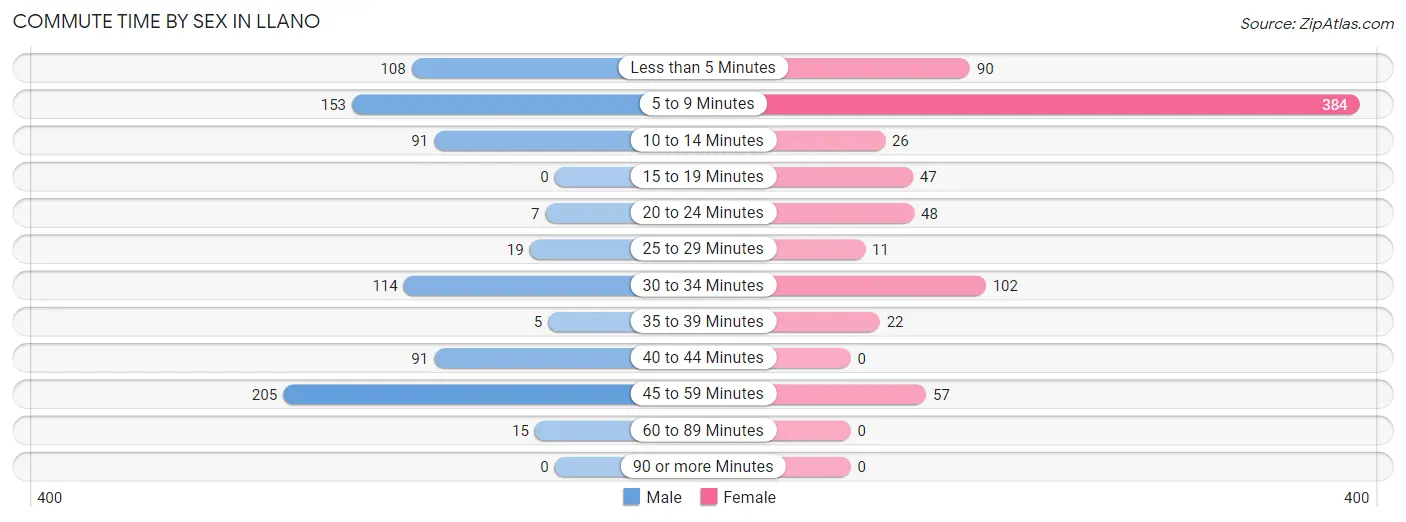
| Commute Time | Male | Female |
| Less than 5 Minutes | 108 (13.4%) | 90 (11.4%) |
| 5 to 9 Minutes | 153 (18.9%) | 384 (48.8%) |
| 10 to 14 Minutes | 91 (11.3%) | 26 (3.3%) |
| 15 to 19 Minutes | 0 (0.0%) | 47 (6.0%) |
| 20 to 24 Minutes | 7 (0.9%) | 48 (6.1%) |
| 25 to 29 Minutes | 19 (2.4%) | 11 (1.4%) |
| 30 to 34 Minutes | 114 (14.1%) | 102 (13.0%) |
| 35 to 39 Minutes | 5 (0.6%) | 22 (2.8%) |
| 40 to 44 Minutes | 91 (11.3%) | 0 (0.0%) |
| 45 to 59 Minutes | 205 (25.4%) | 57 (7.2%) |
| 60 to 89 Minutes | 15 (1.9%) | 0 (0.0%) |
| 90 or more Minutes | 0 (0.0%) | 0 (0.0%) |
Time of Departure to Work by Sex in Llano
The most frequent times of departure to work in Llano are 9:00 AM to 9:59 AM (171, 21.2%) for males and 7:00 AM to 7:29 AM (261, 33.2%) for females.
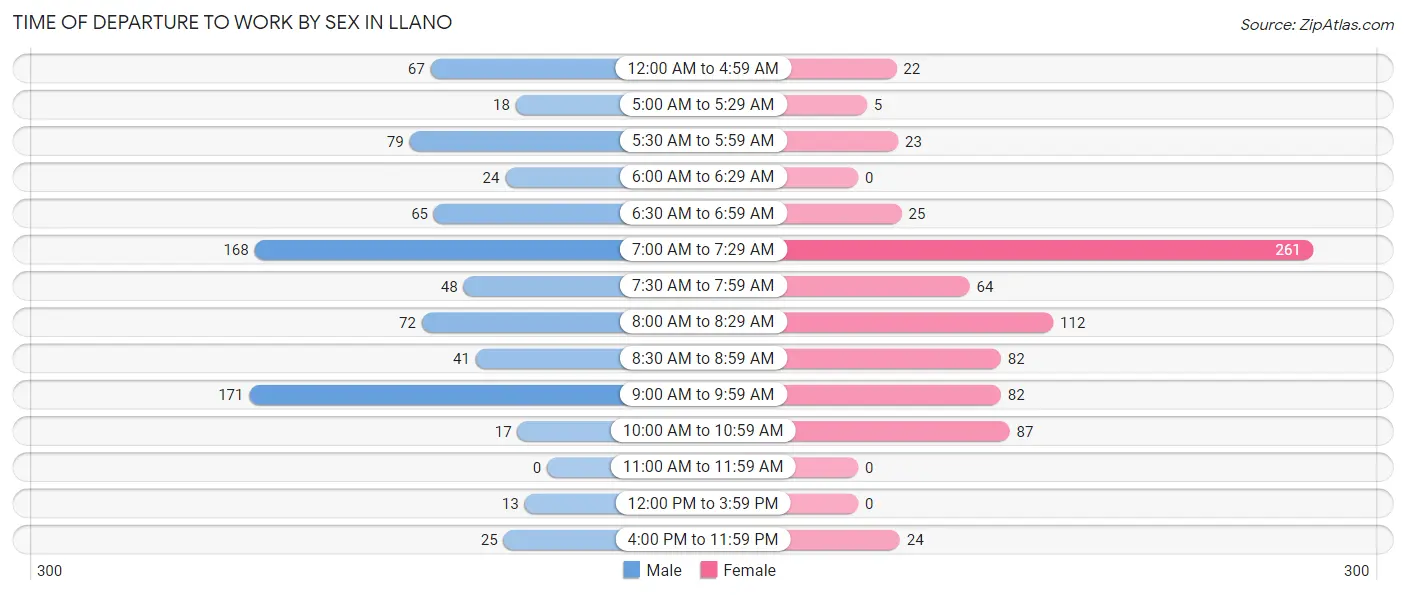
| Time of Departure | Male | Female |
| 12:00 AM to 4:59 AM | 67 (8.3%) | 22 (2.8%) |
| 5:00 AM to 5:29 AM | 18 (2.2%) | 5 (0.6%) |
| 5:30 AM to 5:59 AM | 79 (9.8%) | 23 (2.9%) |
| 6:00 AM to 6:29 AM | 24 (3.0%) | 0 (0.0%) |
| 6:30 AM to 6:59 AM | 65 (8.0%) | 25 (3.2%) |
| 7:00 AM to 7:29 AM | 168 (20.8%) | 261 (33.2%) |
| 7:30 AM to 7:59 AM | 48 (5.9%) | 64 (8.1%) |
| 8:00 AM to 8:29 AM | 72 (8.9%) | 112 (14.2%) |
| 8:30 AM to 8:59 AM | 41 (5.1%) | 82 (10.4%) |
| 9:00 AM to 9:59 AM | 171 (21.2%) | 82 (10.4%) |
| 10:00 AM to 10:59 AM | 17 (2.1%) | 87 (11.1%) |
| 11:00 AM to 11:59 AM | 0 (0.0%) | 0 (0.0%) |
| 12:00 PM to 3:59 PM | 13 (1.6%) | 0 (0.0%) |
| 4:00 PM to 11:59 PM | 25 (3.1%) | 24 (3.0%) |
| Total | 808 (100.0%) | 787 (100.0%) |
Housing Occupancy in Llano
Occupancy by Ownership in Llano
Of the total 1,467 dwellings in Llano, owner-occupied units account for 827 (56.4%), while renter-occupied units make up 640 (43.6%).
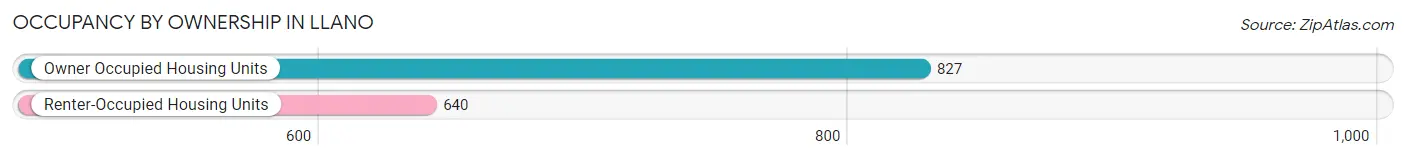
| Occupancy | # Housing Units | % Housing Units |
| Owner Occupied Housing Units | 827 | 56.4% |
| Renter-Occupied Housing Units | 640 | 43.6% |
| Total Occupied Housing Units | 1,467 | 100.0% |
Occupancy by Household Size in Llano
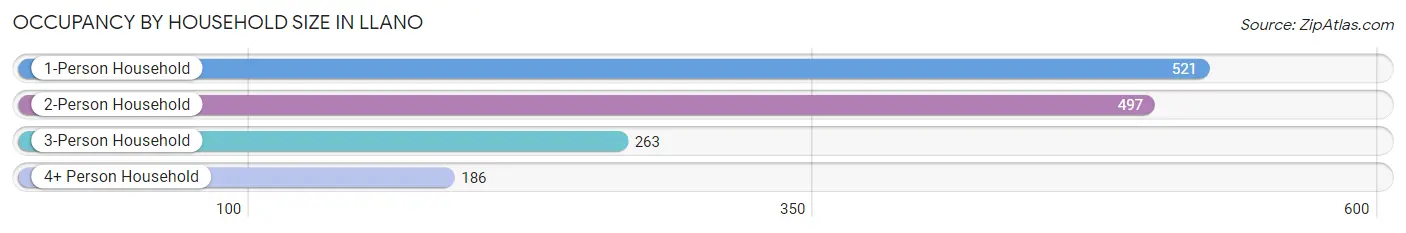
| Household Size | # Housing Units | % Housing Units |
| 1-Person Household | 521 | 35.5% |
| 2-Person Household | 497 | 33.9% |
| 3-Person Household | 263 | 17.9% |
| 4+ Person Household | 186 | 12.7% |
| Total Housing Units | 1,467 | 100.0% |
Occupancy by Ownership by Household Size in Llano
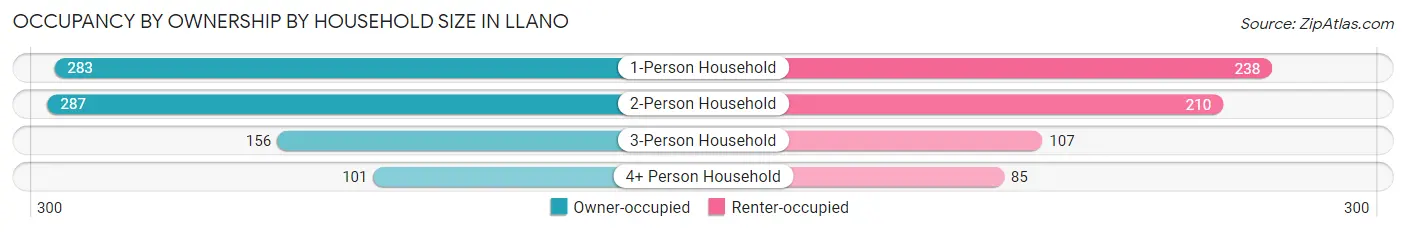
| Household Size | Owner-occupied | Renter-occupied |
| 1-Person Household | 283 (54.3%) | 238 (45.7%) |
| 2-Person Household | 287 (57.8%) | 210 (42.2%) |
| 3-Person Household | 156 (59.3%) | 107 (40.7%) |
| 4+ Person Household | 101 (54.3%) | 85 (45.7%) |
| Total Housing Units | 827 (56.4%) | 640 (43.6%) |
Occupancy by Educational Attainment in Llano
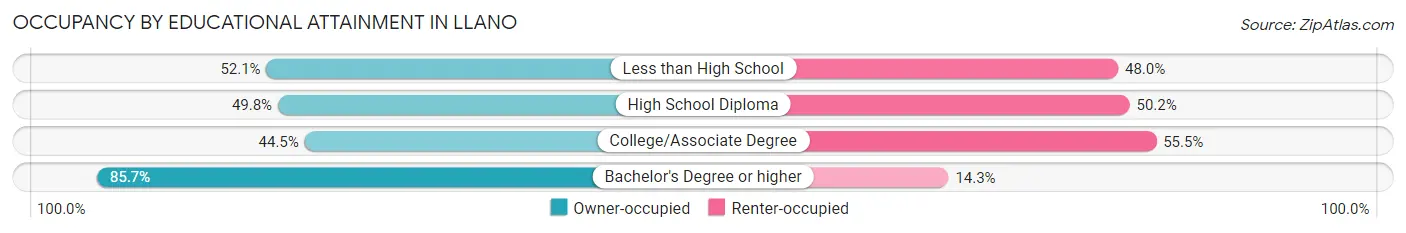
| Household Size | Owner-occupied | Renter-occupied |
| Less than High School | 76 (52.0%) | 70 (47.9%) |
| High School Diploma | 212 (49.8%) | 214 (50.2%) |
| College/Associate Degree | 246 (44.5%) | 307 (55.5%) |
| Bachelor's Degree or higher | 293 (85.7%) | 49 (14.3%) |
Occupancy by Age of Householder in Llano
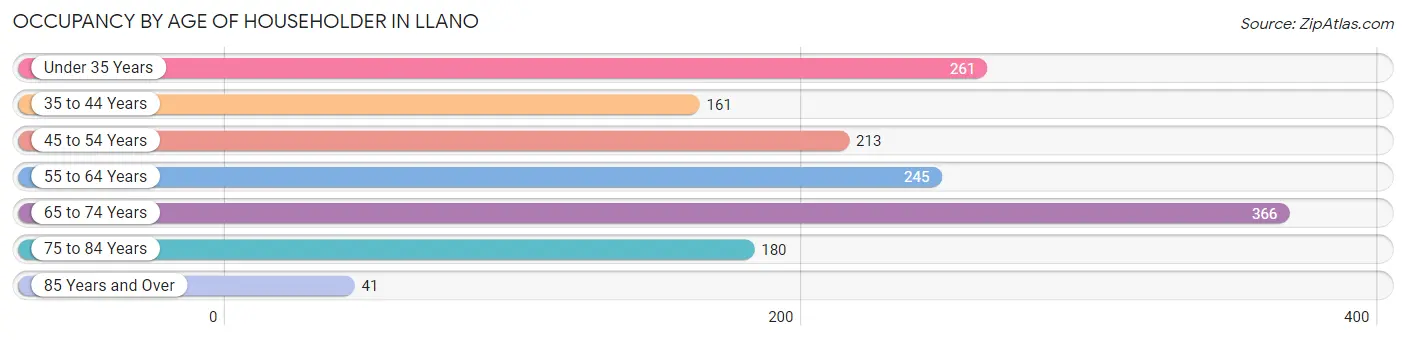
| Age Bracket | # Households | % Households |
| Under 35 Years | 261 | 17.8% |
| 35 to 44 Years | 161 | 11.0% |
| 45 to 54 Years | 213 | 14.5% |
| 55 to 64 Years | 245 | 16.7% |
| 65 to 74 Years | 366 | 24.9% |
| 75 to 84 Years | 180 | 12.3% |
| 85 Years and Over | 41 | 2.8% |
| Total | 1,467 | 100.0% |
Housing Finances in Llano
Median Income by Occupancy in Llano
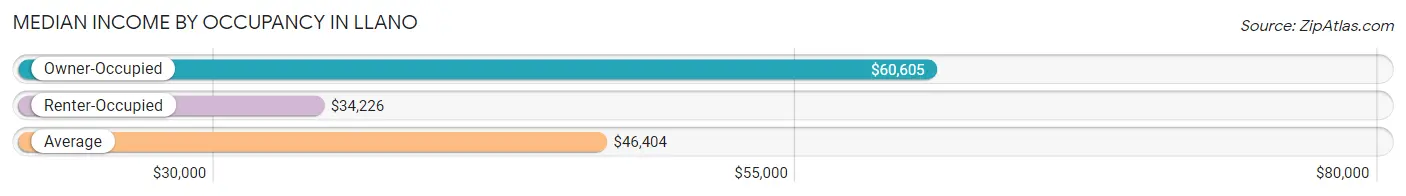
| Occupancy Type | # Households | Median Income |
| Owner-Occupied | 827 (56.4%) | $60,605 |
| Renter-Occupied | 640 (43.6%) | $34,226 |
| Average | 1,467 (100.0%) | $46,404 |
Occupancy by Householder Income Bracket in Llano
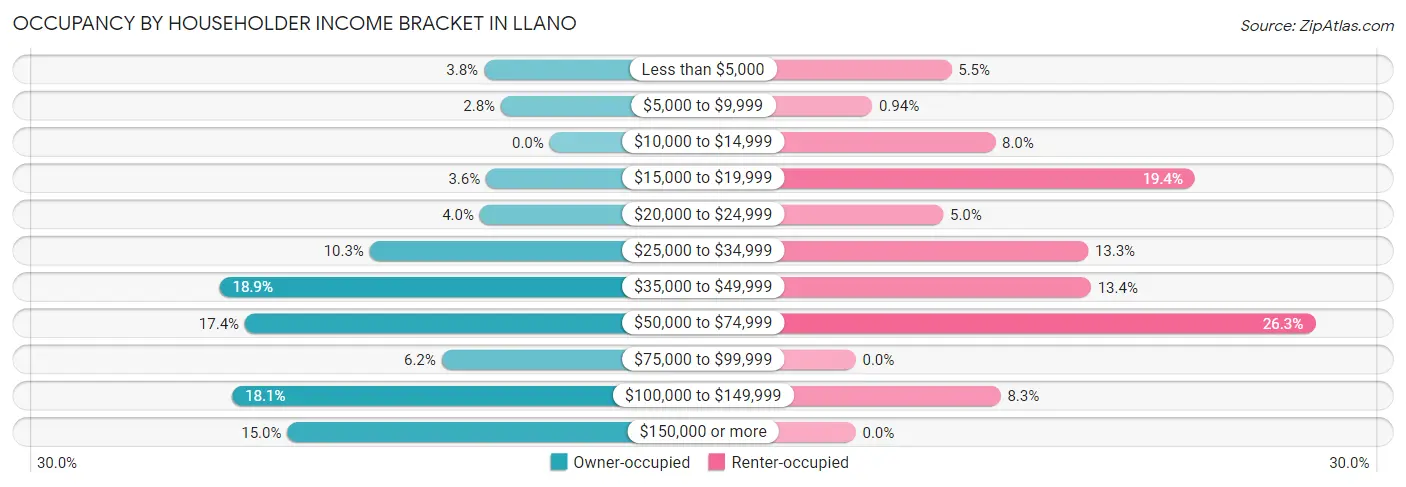
| Income Bracket | Owner-occupied | Renter-occupied |
| Less than $5,000 | 31 (3.7%) | 35 (5.5%) |
| $5,000 to $9,999 | 23 (2.8%) | 6 (0.9%) |
| $10,000 to $14,999 | 0 (0.0%) | 51 (8.0%) |
| $15,000 to $19,999 | 30 (3.6%) | 124 (19.4%) |
| $20,000 to $24,999 | 33 (4.0%) | 32 (5.0%) |
| $25,000 to $34,999 | 85 (10.3%) | 85 (13.3%) |
| $35,000 to $49,999 | 156 (18.9%) | 86 (13.4%) |
| $50,000 to $74,999 | 144 (17.4%) | 168 (26.3%) |
| $75,000 to $99,999 | 51 (6.2%) | 0 (0.0%) |
| $100,000 to $149,999 | 150 (18.1%) | 53 (8.3%) |
| $150,000 or more | 124 (15.0%) | 0 (0.0%) |
| Total | 827 (100.0%) | 640 (100.0%) |
Monthly Housing Cost Tiers in Llano
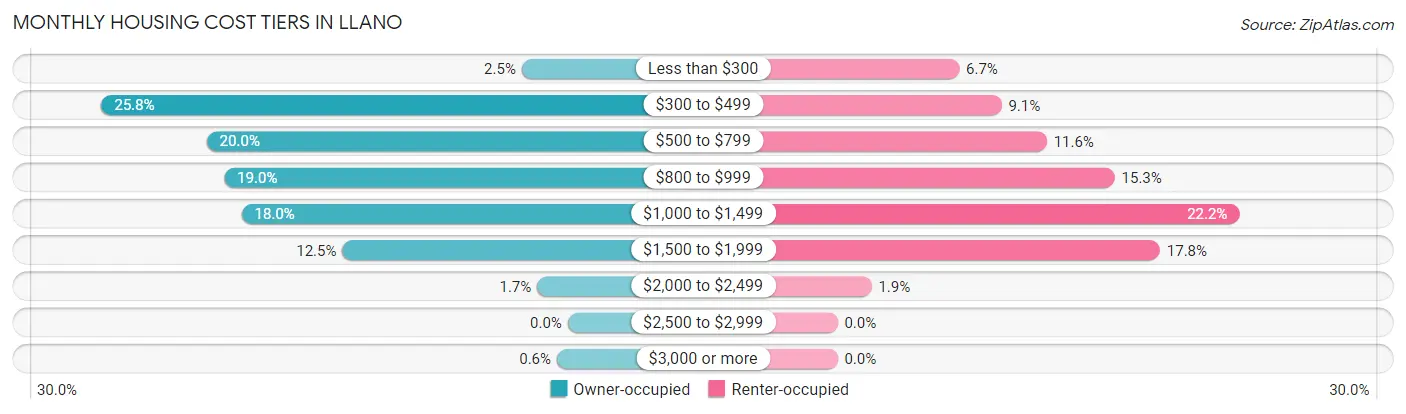
| Monthly Cost | Owner-occupied | Renter-occupied |
| Less than $300 | 21 (2.5%) | 43 (6.7%) |
| $300 to $499 | 213 (25.8%) | 58 (9.1%) |
| $500 to $799 | 165 (20.0%) | 74 (11.6%) |
| $800 to $999 | 157 (19.0%) | 98 (15.3%) |
| $1,000 to $1,499 | 149 (18.0%) | 142 (22.2%) |
| $1,500 to $1,999 | 103 (12.4%) | 114 (17.8%) |
| $2,000 to $2,499 | 14 (1.7%) | 12 (1.9%) |
| $2,500 to $2,999 | 0 (0.0%) | 0 (0.0%) |
| $3,000 or more | 5 (0.6%) | 0 (0.0%) |
| Total | 827 (100.0%) | 640 (100.0%) |
Physical Housing Characteristics in Llano
Housing Structures in Llano
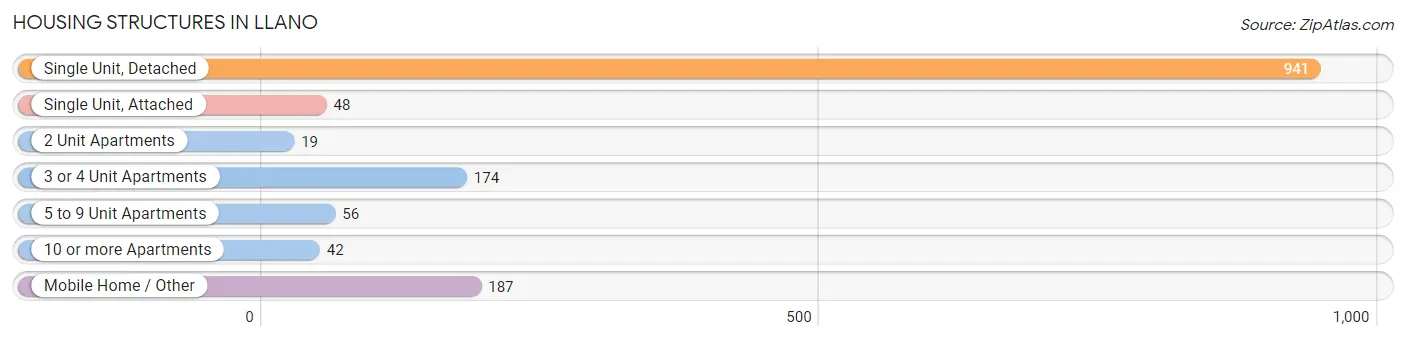
| Structure Type | # Housing Units | % Housing Units |
| Single Unit, Detached | 941 | 64.1% |
| Single Unit, Attached | 48 | 3.3% |
| 2 Unit Apartments | 19 | 1.3% |
| 3 or 4 Unit Apartments | 174 | 11.9% |
| 5 to 9 Unit Apartments | 56 | 3.8% |
| 10 or more Apartments | 42 | 2.9% |
| Mobile Home / Other | 187 | 12.8% |
| Total | 1,467 | 100.0% |
Housing Structures by Occupancy in Llano
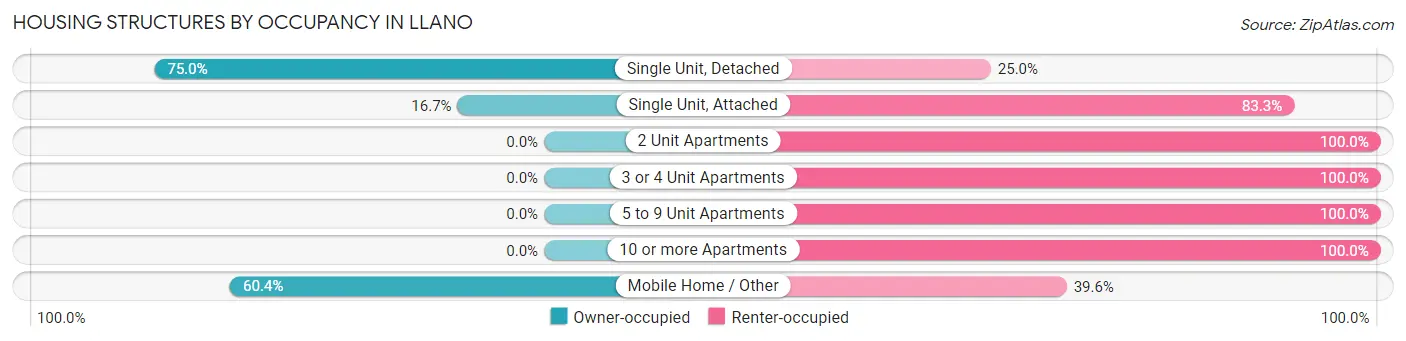
| Structure Type | Owner-occupied | Renter-occupied |
| Single Unit, Detached | 706 (75.0%) | 235 (25.0%) |
| Single Unit, Attached | 8 (16.7%) | 40 (83.3%) |
| 2 Unit Apartments | 0 (0.0%) | 19 (100.0%) |
| 3 or 4 Unit Apartments | 0 (0.0%) | 174 (100.0%) |
| 5 to 9 Unit Apartments | 0 (0.0%) | 56 (100.0%) |
| 10 or more Apartments | 0 (0.0%) | 42 (100.0%) |
| Mobile Home / Other | 113 (60.4%) | 74 (39.6%) |
| Total | 827 (56.4%) | 640 (43.6%) |
Housing Structures by Number of Rooms in Llano
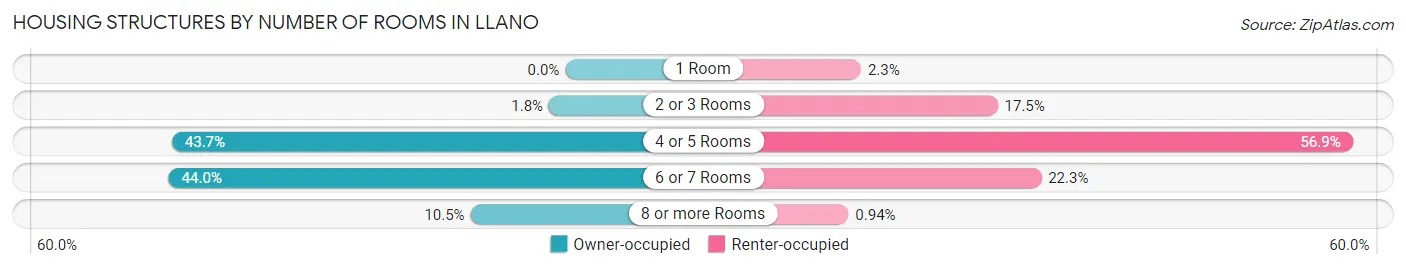
| Number of Rooms | Owner-occupied | Renter-occupied |
| 1 Room | 0 (0.0%) | 15 (2.3%) |
| 2 or 3 Rooms | 15 (1.8%) | 112 (17.5%) |
| 4 or 5 Rooms | 361 (43.6%) | 364 (56.9%) |
| 6 or 7 Rooms | 364 (44.0%) | 143 (22.3%) |
| 8 or more Rooms | 87 (10.5%) | 6 (0.9%) |
| Total | 827 (100.0%) | 640 (100.0%) |
Housing Structure by Heating Type in Llano
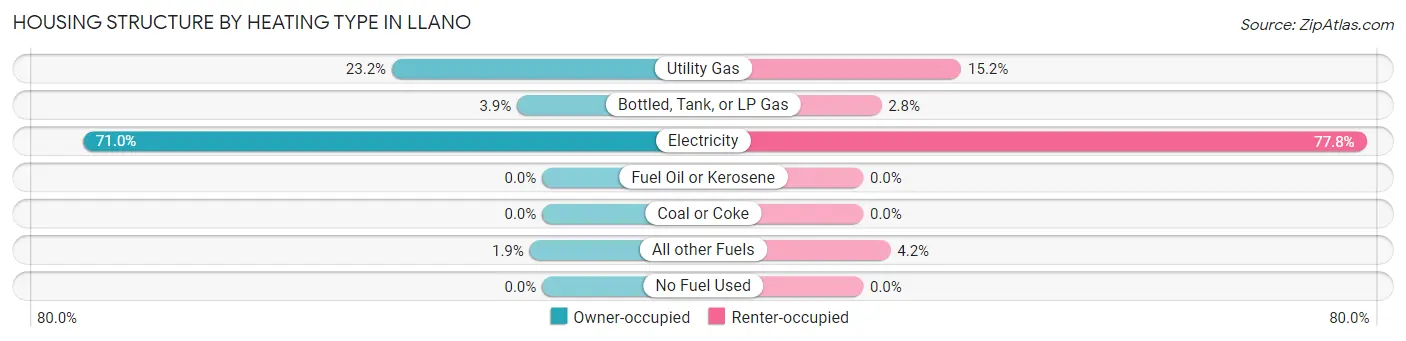
| Heating Type | Owner-occupied | Renter-occupied |
| Utility Gas | 192 (23.2%) | 97 (15.2%) |
| Bottled, Tank, or LP Gas | 32 (3.9%) | 18 (2.8%) |
| Electricity | 587 (71.0%) | 498 (77.8%) |
| Fuel Oil or Kerosene | 0 (0.0%) | 0 (0.0%) |
| Coal or Coke | 0 (0.0%) | 0 (0.0%) |
| All other Fuels | 16 (1.9%) | 27 (4.2%) |
| No Fuel Used | 0 (0.0%) | 0 (0.0%) |
| Total | 827 (100.0%) | 640 (100.0%) |
Household Vehicle Usage in Llano
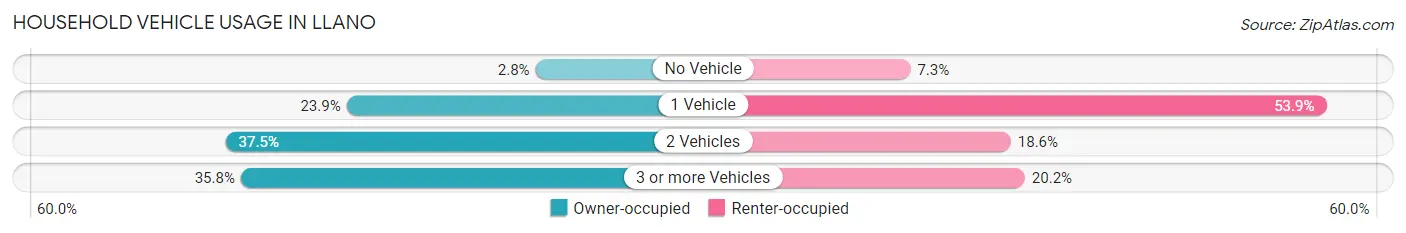
| Vehicles per Household | Owner-occupied | Renter-occupied |
| No Vehicle | 23 (2.8%) | 47 (7.3%) |
| 1 Vehicle | 198 (23.9%) | 345 (53.9%) |
| 2 Vehicles | 310 (37.5%) | 119 (18.6%) |
| 3 or more Vehicles | 296 (35.8%) | 129 (20.2%) |
| Total | 827 (100.0%) | 640 (100.0%) |
Real Estate & Mortgages in Llano
Real Estate and Mortgage Overview in Llano
| Characteristic | Without Mortgage | With Mortgage |
| Housing Units | 463 | 364 |
| Median Property Value | $155,900 | $174,200 |
| Median Household Income | $44,128 | $86 |
| Monthly Housing Costs | $495 | $5 |
| Real Estate Taxes | $968 | $0 |
Property Value by Mortgage Status in Llano
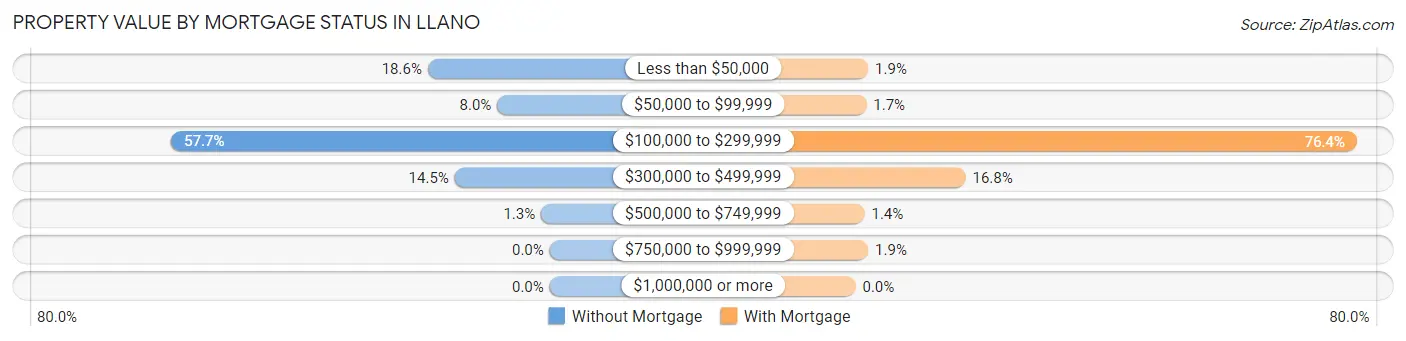
| Property Value | Without Mortgage | With Mortgage |
| Less than $50,000 | 86 (18.6%) | 7 (1.9%) |
| $50,000 to $99,999 | 37 (8.0%) | 6 (1.7%) |
| $100,000 to $299,999 | 267 (57.7%) | 278 (76.4%) |
| $300,000 to $499,999 | 67 (14.5%) | 61 (16.8%) |
| $500,000 to $749,999 | 6 (1.3%) | 5 (1.4%) |
| $750,000 to $999,999 | 0 (0.0%) | 7 (1.9%) |
| $1,000,000 or more | 0 (0.0%) | 0 (0.0%) |
| Total | 463 (100.0%) | 364 (100.0%) |
Household Income by Mortgage Status in Llano
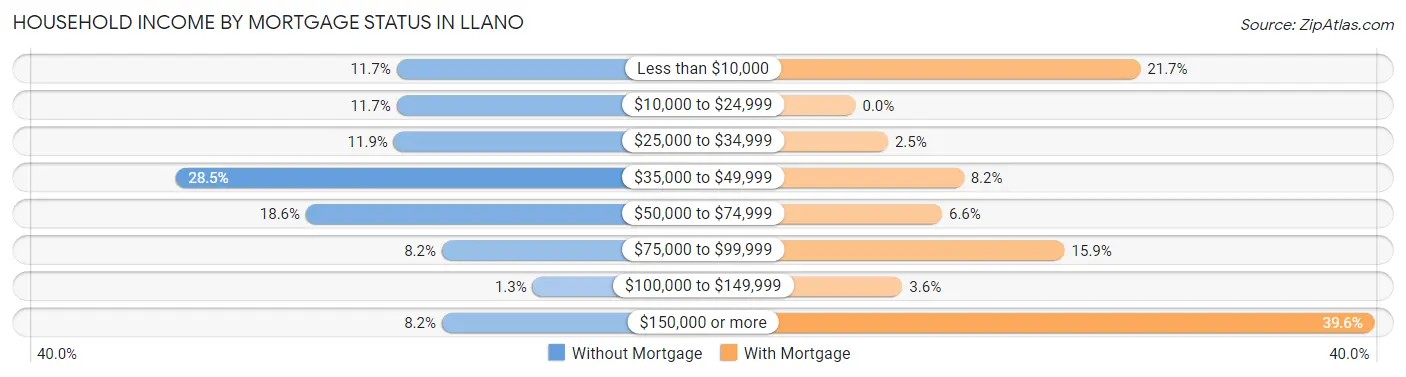
| Household Income | Without Mortgage | With Mortgage |
| Less than $10,000 | 54 (11.7%) | 79 (21.7%) |
| $10,000 to $24,999 | 54 (11.7%) | 0 (0.0%) |
| $25,000 to $34,999 | 55 (11.9%) | 9 (2.5%) |
| $35,000 to $49,999 | 132 (28.5%) | 30 (8.2%) |
| $50,000 to $74,999 | 86 (18.6%) | 24 (6.6%) |
| $75,000 to $99,999 | 38 (8.2%) | 58 (15.9%) |
| $100,000 to $149,999 | 6 (1.3%) | 13 (3.6%) |
| $150,000 or more | 38 (8.2%) | 144 (39.6%) |
| Total | 463 (100.0%) | 364 (100.0%) |
Property Value to Household Income Ratio in Llano
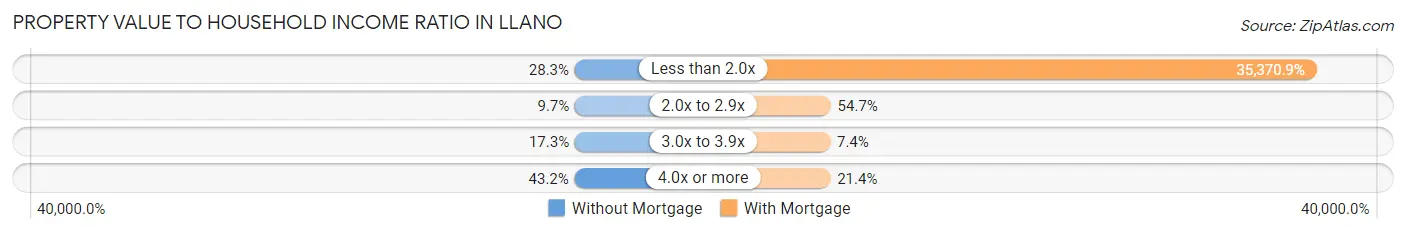
| Value-to-Income Ratio | Without Mortgage | With Mortgage |
| Less than 2.0x | 131 (28.3%) | 128,750 (35,370.9%) |
| 2.0x to 2.9x | 45 (9.7%) | 199 (54.7%) |
| 3.0x to 3.9x | 80 (17.3%) | 27 (7.4%) |
| 4.0x or more | 200 (43.2%) | 78 (21.4%) |
| Total | 463 (100.0%) | 364 (100.0%) |
Real Estate Taxes by Mortgage Status in Llano
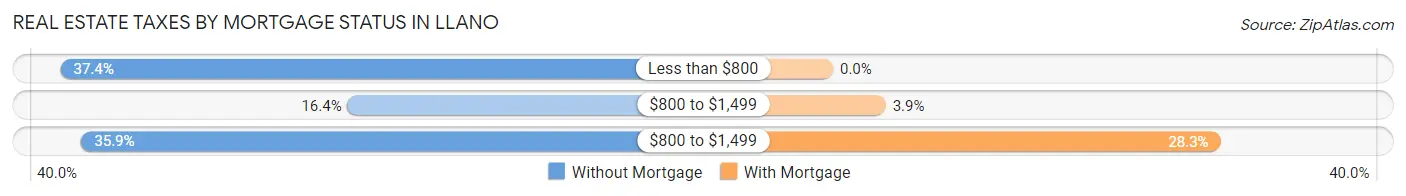
| Property Taxes | Without Mortgage | With Mortgage |
| Less than $800 | 173 (37.4%) | 0 (0.0%) |
| $800 to $1,499 | 76 (16.4%) | 14 (3.8%) |
| $800 to $1,499 | 166 (35.8%) | 103 (28.3%) |
| Total | 463 (100.0%) | 364 (100.0%) |
Health & Disability in Llano
Health Insurance Coverage by Age in Llano
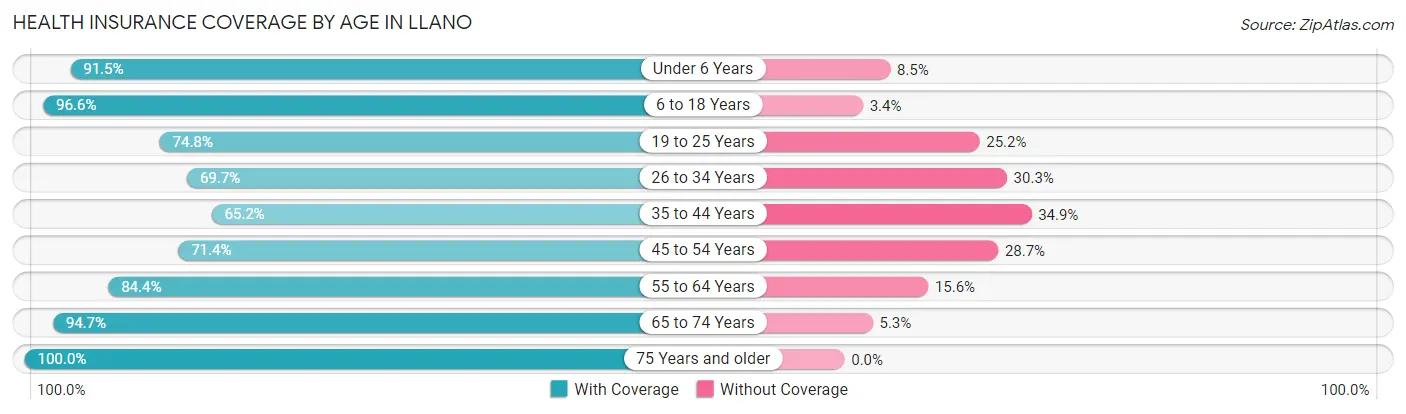
| Age Bracket | With Coverage | Without Coverage |
| Under 6 Years | 204 (91.5%) | 19 (8.5%) |
| 6 to 18 Years | 505 (96.6%) | 18 (3.4%) |
| 19 to 25 Years | 306 (74.8%) | 103 (25.2%) |
| 26 to 34 Years | 251 (69.7%) | 109 (30.3%) |
| 35 to 44 Years | 172 (65.1%) | 92 (34.8%) |
| 45 to 54 Years | 274 (71.4%) | 110 (28.6%) |
| 55 to 64 Years | 303 (84.4%) | 56 (15.6%) |
| 65 to 74 Years | 468 (94.7%) | 26 (5.3%) |
| 75 Years and older | 253 (100.0%) | 0 (0.0%) |
| Total | 2,736 (83.7%) | 533 (16.3%) |
Health Insurance Coverage by Citizenship Status in Llano
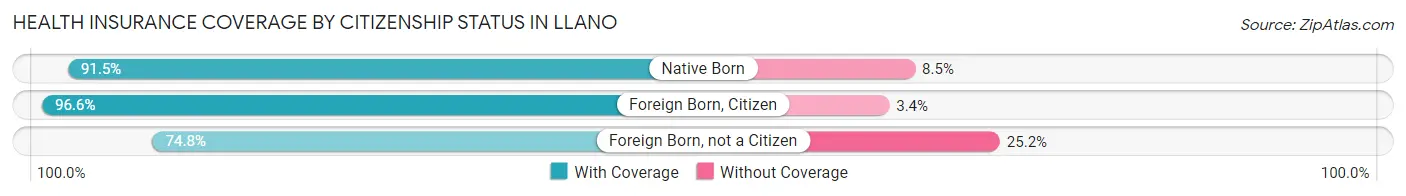
| Citizenship Status | With Coverage | Without Coverage |
| Native Born | 204 (91.5%) | 19 (8.5%) |
| Foreign Born, Citizen | 505 (96.6%) | 18 (3.4%) |
| Foreign Born, not a Citizen | 306 (74.8%) | 103 (25.2%) |
Health Insurance Coverage by Household Income in Llano
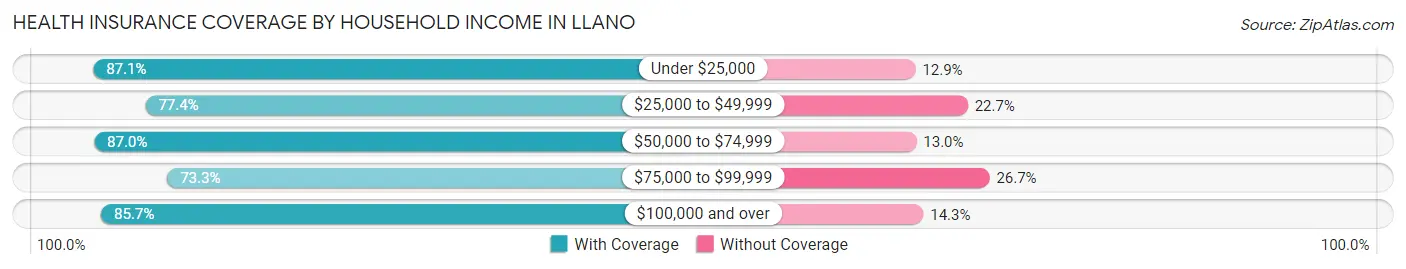
| Household Income | With Coverage | Without Coverage |
| Under $25,000 | 481 (87.1%) | 71 (12.9%) |
| $25,000 to $49,999 | 625 (77.3%) | 183 (22.7%) |
| $50,000 to $74,999 | 654 (87.0%) | 98 (13.0%) |
| $75,000 to $99,999 | 74 (73.3%) | 27 (26.7%) |
| $100,000 and over | 885 (85.7%) | 148 (14.3%) |
Public vs Private Health Insurance Coverage by Age in Llano
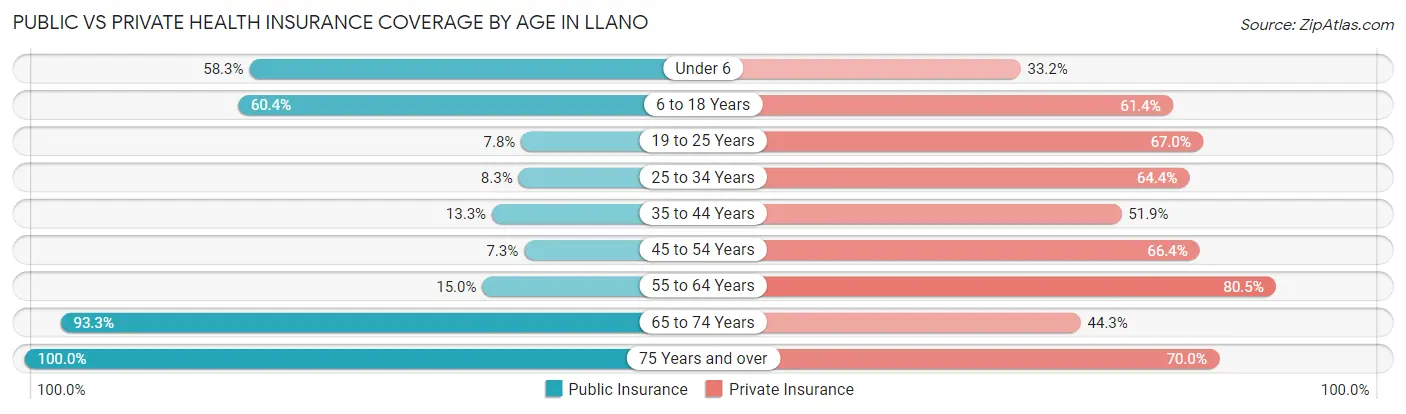
| Age Bracket | Public Insurance | Private Insurance |
| Under 6 | 130 (58.3%) | 74 (33.2%) |
| 6 to 18 Years | 316 (60.4%) | 321 (61.4%) |
| 19 to 25 Years | 32 (7.8%) | 274 (67.0%) |
| 25 to 34 Years | 30 (8.3%) | 232 (64.4%) |
| 35 to 44 Years | 35 (13.3%) | 137 (51.9%) |
| 45 to 54 Years | 28 (7.3%) | 255 (66.4%) |
| 55 to 64 Years | 54 (15.0%) | 289 (80.5%) |
| 65 to 74 Years | 461 (93.3%) | 219 (44.3%) |
| 75 Years and over | 253 (100.0%) | 177 (70.0%) |
| Total | 1,339 (41.0%) | 1,978 (60.5%) |
Disability Status by Sex by Age in Llano
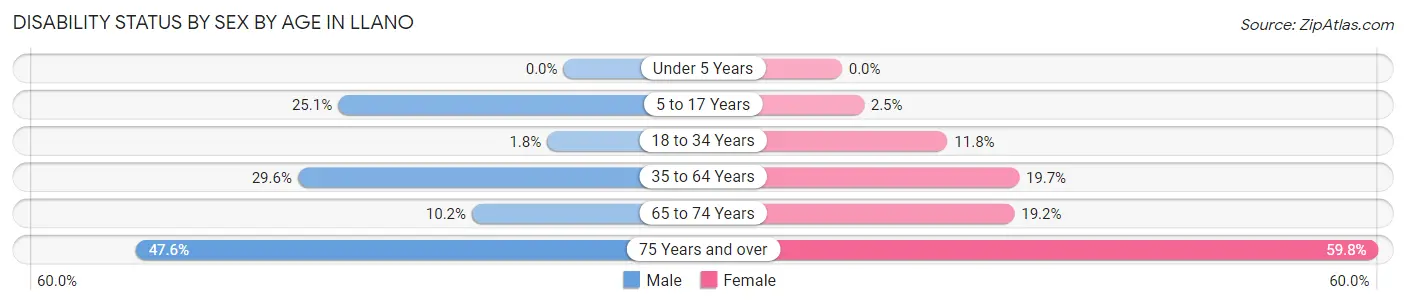
| Age Bracket | Male | Female |
| Under 5 Years | 0 (0.0%) | 0 (0.0%) |
| 5 to 17 Years | 62 (25.1%) | 6 (2.5%) |
| 18 to 34 Years | 8 (1.8%) | 46 (11.8%) |
| 35 to 64 Years | 121 (29.6%) | 118 (19.7%) |
| 65 to 74 Years | 27 (10.2%) | 44 (19.2%) |
| 75 Years and over | 40 (47.6%) | 101 (59.8%) |
Disability Class by Sex by Age in Llano
Disability Class: Hearing Difficulty
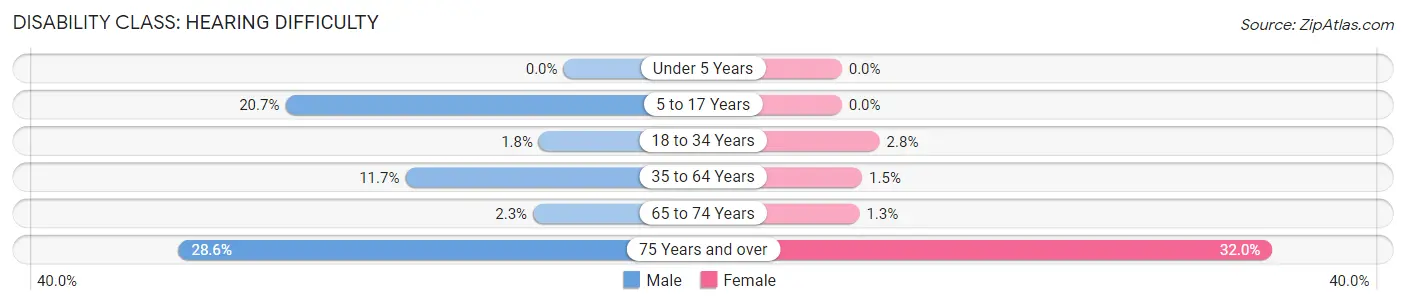
| Age Bracket | Male | Female |
| Under 5 Years | 0 (0.0%) | 0 (0.0%) |
| 5 to 17 Years | 51 (20.6%) | 0 (0.0%) |
| 18 to 34 Years | 8 (1.8%) | 11 (2.8%) |
| 35 to 64 Years | 48 (11.7%) | 9 (1.5%) |
| 65 to 74 Years | 6 (2.3%) | 3 (1.3%) |
| 75 Years and over | 24 (28.6%) | 54 (32.0%) |
Disability Class: Vision Difficulty
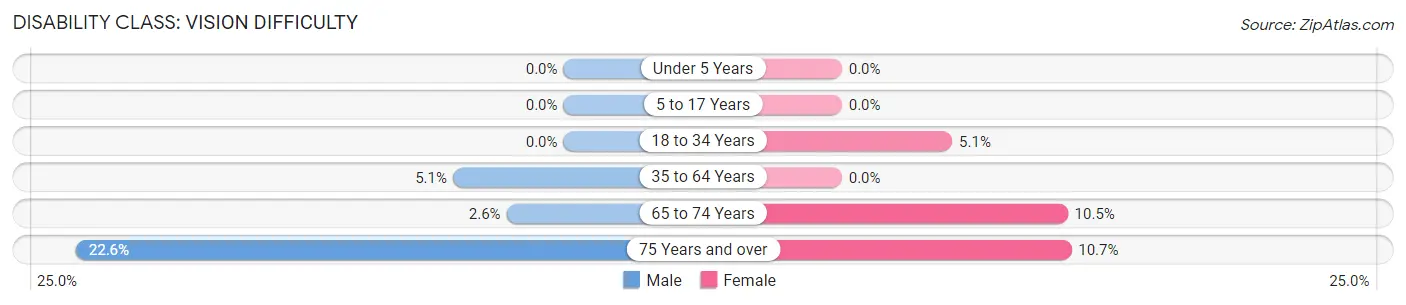
| Age Bracket | Male | Female |
| Under 5 Years | 0 (0.0%) | 0 (0.0%) |
| 5 to 17 Years | 0 (0.0%) | 0 (0.0%) |
| 18 to 34 Years | 0 (0.0%) | 20 (5.1%) |
| 35 to 64 Years | 21 (5.1%) | 0 (0.0%) |
| 65 to 74 Years | 7 (2.6%) | 24 (10.5%) |
| 75 Years and over | 19 (22.6%) | 18 (10.6%) |
Disability Class: Cognitive Difficulty
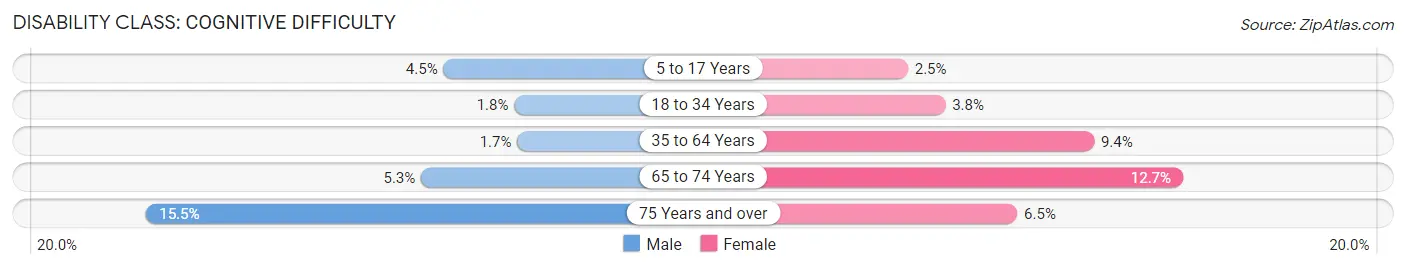
| Age Bracket | Male | Female |
| 5 to 17 Years | 11 (4.4%) | 6 (2.5%) |
| 18 to 34 Years | 8 (1.8%) | 15 (3.8%) |
| 35 to 64 Years | 7 (1.7%) | 56 (9.4%) |
| 65 to 74 Years | 14 (5.3%) | 29 (12.7%) |
| 75 Years and over | 13 (15.5%) | 11 (6.5%) |
Disability Class: Ambulatory Difficulty
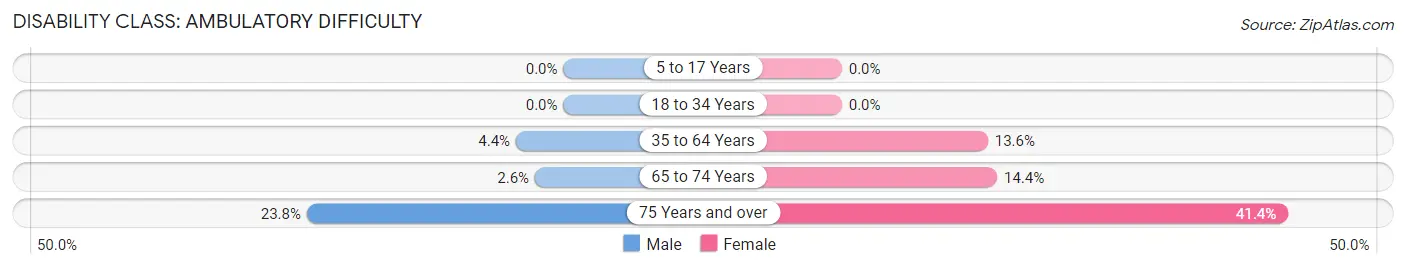
| Age Bracket | Male | Female |
| 5 to 17 Years | 0 (0.0%) | 0 (0.0%) |
| 18 to 34 Years | 0 (0.0%) | 0 (0.0%) |
| 35 to 64 Years | 18 (4.4%) | 81 (13.6%) |
| 65 to 74 Years | 7 (2.6%) | 33 (14.4%) |
| 75 Years and over | 20 (23.8%) | 70 (41.4%) |
Disability Class: Self-Care Difficulty
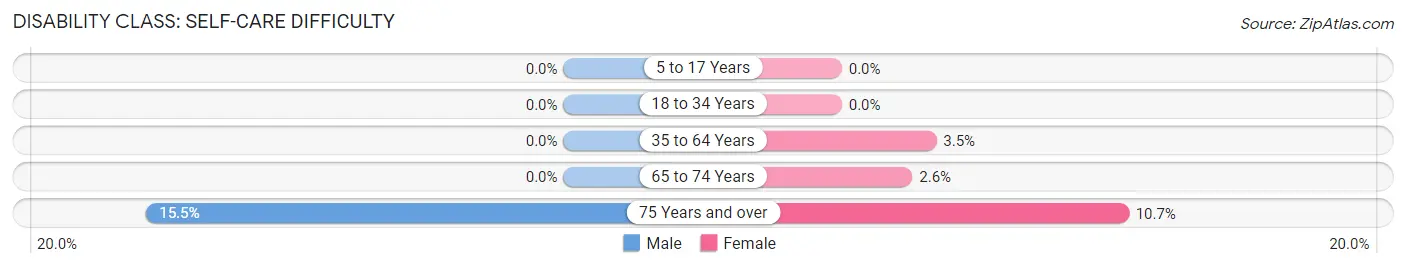
| Age Bracket | Male | Female |
| 5 to 17 Years | 0 (0.0%) | 0 (0.0%) |
| 18 to 34 Years | 0 (0.0%) | 0 (0.0%) |
| 35 to 64 Years | 0 (0.0%) | 21 (3.5%) |
| 65 to 74 Years | 0 (0.0%) | 6 (2.6%) |
| 75 Years and over | 13 (15.5%) | 18 (10.6%) |
Technology Access in Llano
Computing Device Access in Llano
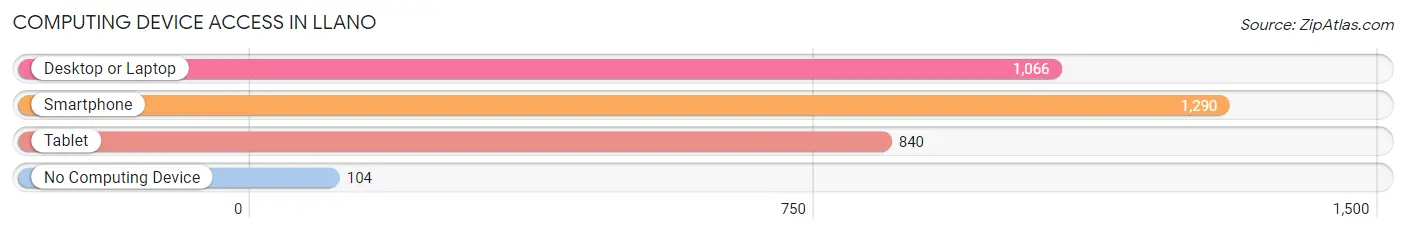
| Device Type | # Households | % Households |
| Desktop or Laptop | 1,066 | 72.7% |
| Smartphone | 1,290 | 87.9% |
| Tablet | 840 | 57.3% |
| No Computing Device | 104 | 7.1% |
| Total | 1,467 | 100.0% |
Internet Access in Llano
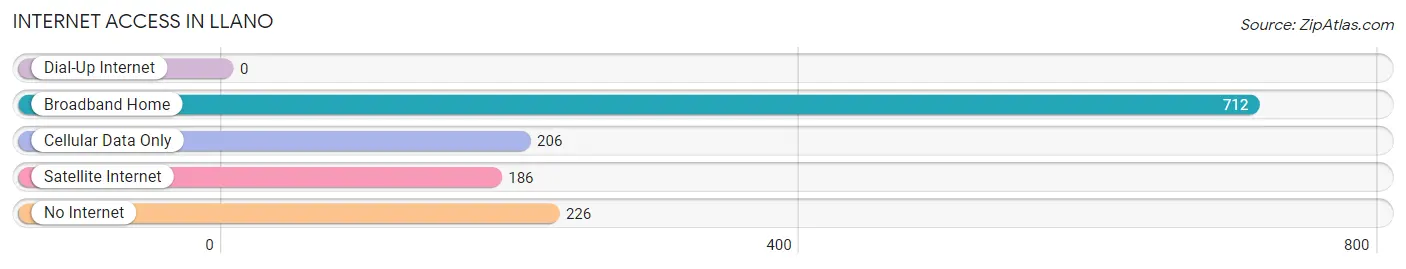
| Internet Type | # Households | % Households |
| Dial-Up Internet | 0 | 0.0% |
| Broadband Home | 712 | 48.5% |
| Cellular Data Only | 206 | 14.0% |
| Satellite Internet | 186 | 12.7% |
| No Internet | 226 | 15.4% |
| Total | 1,467 | 100.0% |
Llano Summary
Llano, Texas is a small city located in the heart of the Texas Hill Country. It is situated in Llano County, which is part of the larger Central Texas region. The city is located about 65 miles northwest of Austin and is home to a population of around 3,400 people.
History
The area that is now Llano was first inhabited by Native American tribes, including the Tonkawa, Comanche, and Apache. The first European settlers arrived in the area in the mid-1800s, and the city of Llano was officially founded in 1856. The city was named after the Llano River, which runs through the area.
In the late 1800s, Llano became a popular destination for ranchers and farmers, who were attracted to the area’s fertile soil and abundant water supply. The city also became a center for the local mining industry, as the area was rich in iron ore, limestone, and other minerals.
In the early 1900s, Llano became a popular tourist destination, as the city was known for its scenic beauty and outdoor activities. The city was also home to a number of resorts and spas, which attracted visitors from all over the country.
Geography
Llano is located in the heart of the Texas Hill Country, which is characterized by rolling hills, limestone outcroppings, and lush vegetation. The city is situated along the Llano River, which provides a source of water for the area. The city is also located near several lakes, including Lake Buchanan, Lake LBJ, and Lake Marble Falls.
The climate in Llano is generally mild, with hot summers and cool winters. The average temperature in the summer is around 90 degrees Fahrenheit, while the average temperature in the winter is around 50 degrees Fahrenheit.
Economy
The economy of Llano is largely based on tourism, agriculture, and mining. The city is home to several tourist attractions, including the Llano River, Enchanted Rock State Natural Area, and the Llano County Museum. The city is also home to several wineries, which attract visitors from all over the country.
Agriculture is also an important part of the local economy, as the area is home to several farms and ranches. The city is also home to several mining operations, which extract iron ore, limestone, and other minerals from the area.
Demographics
As of the 2010 census, the population of Llano was 3,325. The racial makeup of the city was 94.3% White, 0.7% African American, 0.3% Native American, 0.3% Asian, 0.1% Pacific Islander, 2.7% from other races, and 1.6% from two or more races. Hispanic or Latino of any race were 8.2% of the population.
The median household income in Llano was $37,917, and the median family income was $45,938. The per capita income for the city was $20,945. About 11.3% of families and 14.2% of the population were below the poverty line, including 19.2% of those under age 18 and 8.2% of those age 65 or over.
Llano is a small city with a rich history and a vibrant economy. The city is home to a diverse population and is a popular destination for tourists and outdoor enthusiasts. The city is also home to several mining operations, which provide jobs and economic stability to the area.
Common Questions
What is Per Capita Income in Llano?
Per Capita income in Llano is $30,235.
What is the Median Family Income in Llano?
Median Family Income in Llano is $67,543.
What is the Median Household income in Llano?
Median Household Income in Llano is $46,404.
What is Income or Wage Gap in Llano?
Income or Wage Gap in Llano is 1.3%.
Women in Llano earn 98.7 cents for every dollar earned by a man.
What is Inequality or Gini Index in Llano?
Inequality or Gini Index in Llano is 0.46.
What is the Total Population of Llano?
Total Population of Llano is 3,374.
What is the Total Male Population of Llano?
Total Male Population of Llano is 1,501.
What is the Total Female Population of Llano?
Total Female Population of Llano is 1,873.
What is the Ratio of Males per 100 Females in Llano?
There are 80.14 Males per 100 Females in Llano.
What is the Ratio of Females per 100 Males in Llano?
There are 124.78 Females per 100 Males in Llano.
What is the Median Population Age in Llano?
Median Population Age in Llano is 41.1 Years.
What is the Average Family Size in Llano
Average Family Size in Llano is 2.9 People.
What is the Average Household Size in Llano
Average Household Size in Llano is 2.2 People.
How Large is the Labor Force in Llano?
There are 1,796 People in the Labor Forcein in Llano.
What is the Percentage of People in the Labor Force in Llano?
64.6% of People are in the Labor Force in Llano.
What is the Unemployment Rate in Llano?
Unemployment Rate in Llano is 7.6%.