Liverpool, TX Map & Demographics
Liverpool Map
Liverpool Overview
$37,057
PER CAPITA INCOME
$68,500
AVG FAMILY INCOME
$49,750
AVG HOUSEHOLD INCOME
38.1%
WAGE / INCOME GAP [ % ]
61.9¢/ $1
WAGE / INCOME GAP [ $ ]
0.50
INEQUALITY / GINI INDEX
476
TOTAL POPULATION
236
MALE POPULATION
240
FEMALE POPULATION
98.33
MALES / 100 FEMALES
101.69
FEMALES / 100 MALES
45.7
MEDIAN AGE
3.2
AVG FAMILY SIZE
2.3
AVG HOUSEHOLD SIZE
242
LABOR FORCE [ PEOPLE ]
57.5%
PERCENT IN LABOR FORCE
8.7%
UNEMPLOYMENT RATE
Liverpool Zip Codes
Income in Liverpool
Income Overview in Liverpool
Per Capita Income in Liverpool is $37,057, while median incomes of families and households are $68,500 and $49,750 respectively.
| Characteristic | Number | Measure |
| Per Capita Income | 476 | $37,057 |
| Median Family Income | 120 | $68,500 |
| Mean Family Income | 120 | $85,393 |
| Median Household Income | 203 | $49,750 |
| Mean Household Income | 203 | $84,072 |
| Income Deficit | 120 | $0 |
| Wage / Income Gap (%) | 476 | 38.10% |
| Wage / Income Gap ($) | 476 | 61.90¢ per $1 |
| Gini / Inequality Index | 476 | 0.50 |
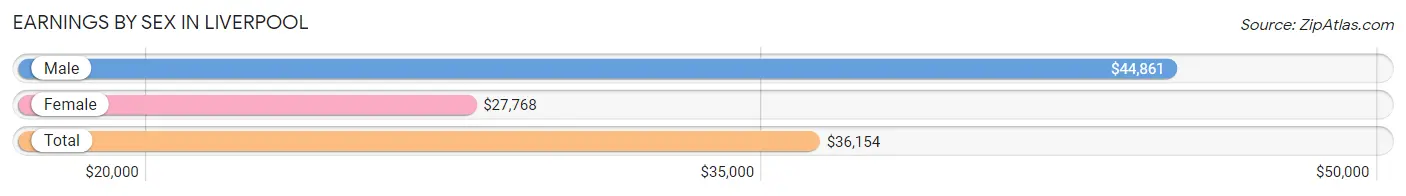
Earnings by Sex in Liverpool
Average Earnings in Liverpool are $36,154, $44,861 for men and $27,768 for women, a difference of 38.1%.
| Sex | Number | Average Earnings |
| Male | 125 (53.0%) | $44,861 |
| Female | 111 (47.0%) | $27,768 |
| Total | 236 (100.0%) | $36,154 |
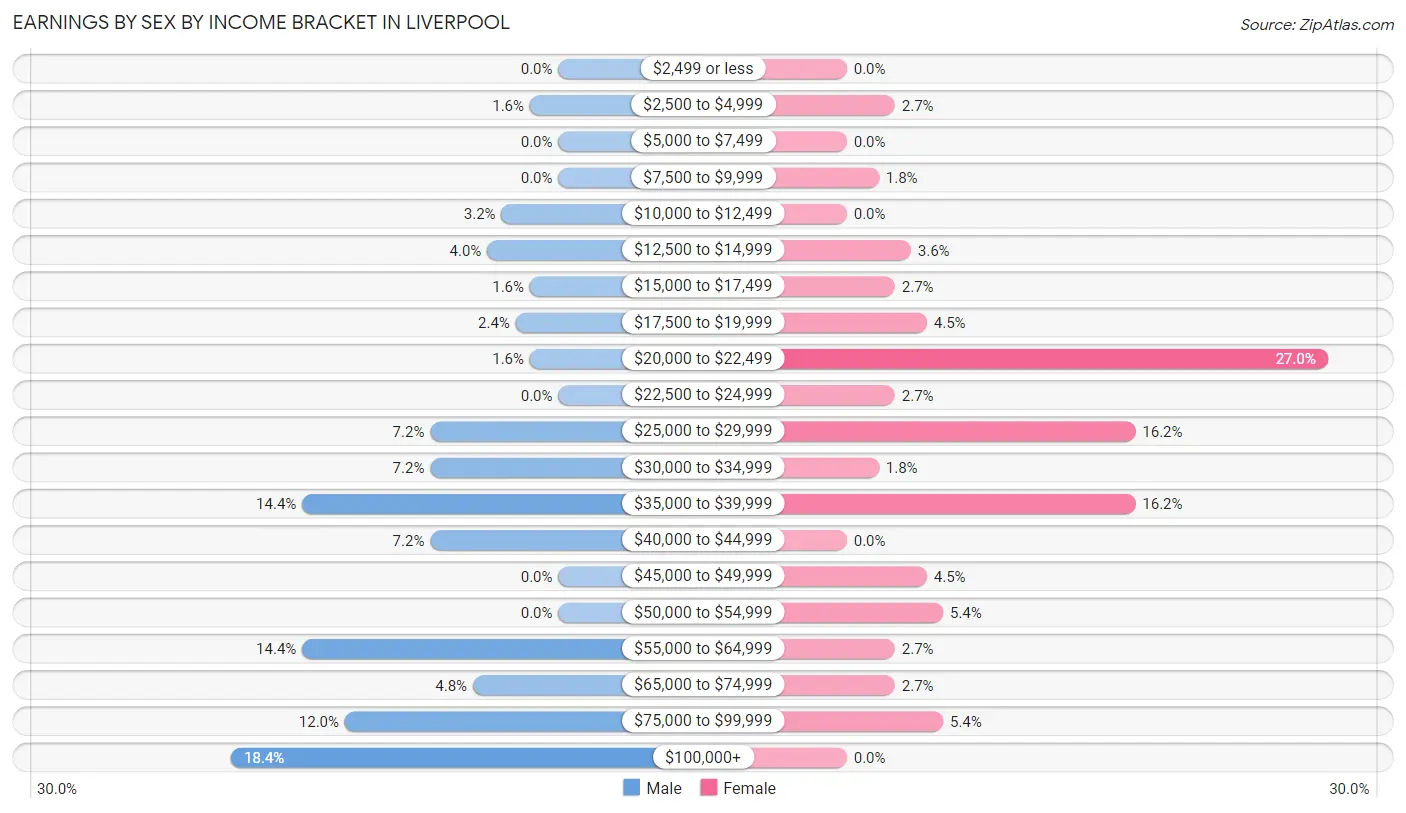
Earnings by Sex by Income Bracket in Liverpool
The most common earnings brackets in Liverpool are $100,000+ for men (23 | 18.4%) and $20,000 to $22,499 for women (30 | 27.0%).
| Income | Male | Female |
| $2,499 or less | 0 (0.0%) | 0 (0.0%) |
| $2,500 to $4,999 | 2 (1.6%) | 3 (2.7%) |
| $5,000 to $7,499 | 0 (0.0%) | 0 (0.0%) |
| $7,500 to $9,999 | 0 (0.0%) | 2 (1.8%) |
| $10,000 to $12,499 | 4 (3.2%) | 0 (0.0%) |
| $12,500 to $14,999 | 5 (4.0%) | 4 (3.6%) |
| $15,000 to $17,499 | 2 (1.6%) | 3 (2.7%) |
| $17,500 to $19,999 | 3 (2.4%) | 5 (4.5%) |
| $20,000 to $22,499 | 2 (1.6%) | 30 (27.0%) |
| $22,500 to $24,999 | 0 (0.0%) | 3 (2.7%) |
| $25,000 to $29,999 | 9 (7.2%) | 18 (16.2%) |
| $30,000 to $34,999 | 9 (7.2%) | 2 (1.8%) |
| $35,000 to $39,999 | 18 (14.4%) | 18 (16.2%) |
| $40,000 to $44,999 | 9 (7.2%) | 0 (0.0%) |
| $45,000 to $49,999 | 0 (0.0%) | 5 (4.5%) |
| $50,000 to $54,999 | 0 (0.0%) | 6 (5.4%) |
| $55,000 to $64,999 | 18 (14.4%) | 3 (2.7%) |
| $65,000 to $74,999 | 6 (4.8%) | 3 (2.7%) |
| $75,000 to $99,999 | 15 (12.0%) | 6 (5.4%) |
| $100,000+ | 23 (18.4%) | 0 (0.0%) |
| Total | 125 (100.0%) | 111 (100.0%) |
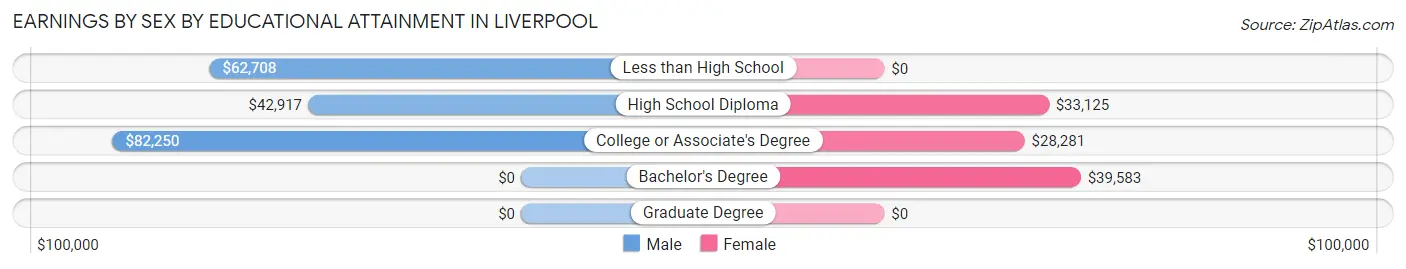
Earnings by Sex by Educational Attainment in Liverpool
Average earnings in Liverpool are $57,656 for men and $29,643 for women, a difference of 48.6%. Men with an educational attainment of college or associate's degree enjoy the highest average annual earnings of $82,250, while those with high school diploma education earn the least with $42,917. Women with an educational attainment of bachelor's degree earn the most with the average annual earnings of $39,583, while those with college or associate's degree education have the smallest earnings of $28,281.
| Educational Attainment | Male Income | Female Income |
| Less than High School | $62,708 | $0 |
| High School Diploma | $42,917 | $33,125 |
| College or Associate's Degree | $82,250 | $28,281 |
| Bachelor's Degree | - | - |
| Graduate Degree | - | - |
| Total | $57,656 | $29,643 |
Family Income in Liverpool
Family Income Brackets in Liverpool
According to the Liverpool family income data, there are 32 families falling into the $35,000 to $49,999 income range, which is the most common income bracket and makes up 26.7% of all families.
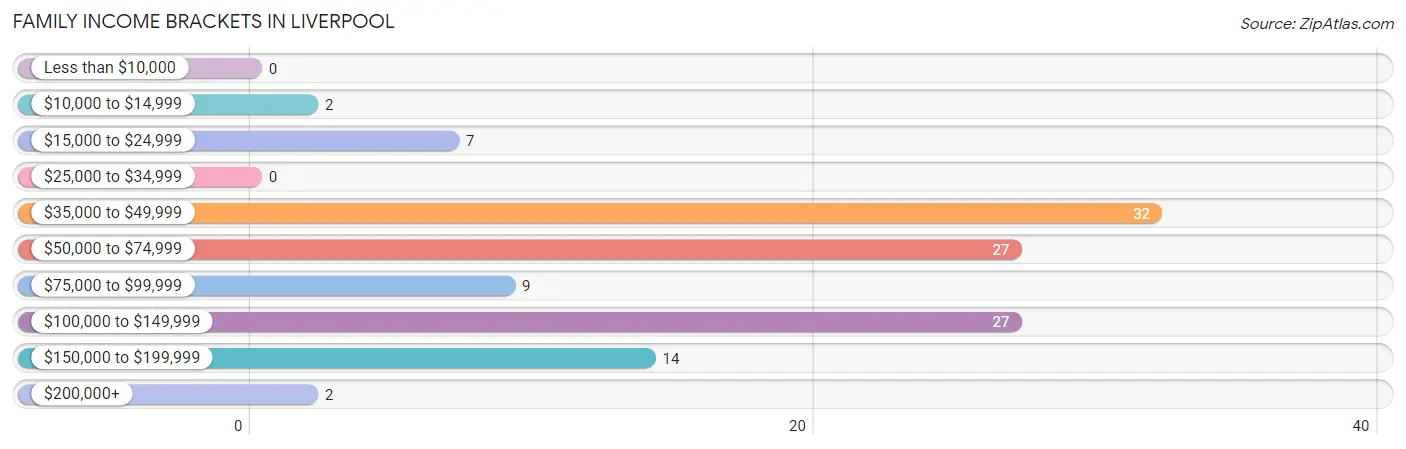
| Income Bracket | # Families | % Families |
| Less than $10,000 | 0 | 0.0% |
| $10,000 to $14,999 | 2 | 1.7% |
| $15,000 to $24,999 | 7 | 5.8% |
| $25,000 to $34,999 | 0 | 0.0% |
| $35,000 to $49,999 | 32 | 26.7% |
| $50,000 to $74,999 | 27 | 22.5% |
| $75,000 to $99,999 | 9 | 7.5% |
| $100,000 to $149,999 | 27 | 22.5% |
| $150,000 to $199,999 | 14 | 11.7% |
| $200,000+ | 2 | 1.7% |
Family Income by Famaliy Size in Liverpool
4-person families (14 | 11.7%) account for the highest median family income in Liverpool with $116,250 per family, while 4-person families (14 | 11.7%) have the highest median income of $29,062 per family member.
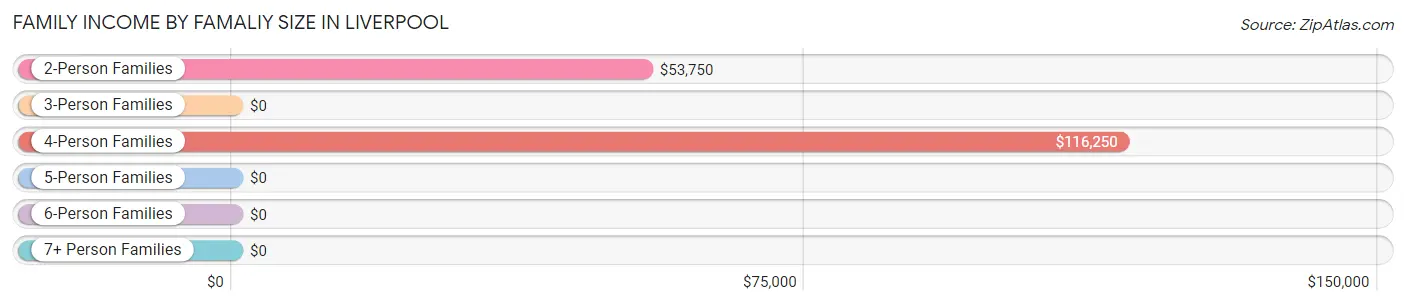
| Income Bracket | # Families | Median Income |
| 2-Person Families | 64 (53.3%) | $53,750 |
| 3-Person Families | 24 (20.0%) | $0 |
| 4-Person Families | 14 (11.7%) | $116,250 |
| 5-Person Families | 9 (7.5%) | $0 |
| 6-Person Families | 9 (7.5%) | $0 |
| 7+ Person Families | 0 (0.0%) | $0 |
| Total | 120 (100.0%) | $68,500 |
Family Income by Number of Earners in Liverpool
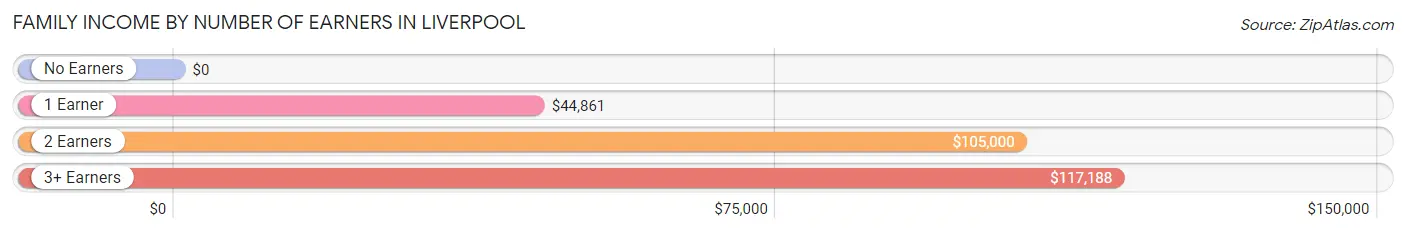
| Number of Earners | # Families | Median Income |
| No Earners | 13 (10.8%) | $0 |
| 1 Earner | 51 (42.5%) | $44,861 |
| 2 Earners | 42 (35.0%) | $105,000 |
| 3+ Earners | 14 (11.7%) | $117,188 |
| Total | 120 (100.0%) | $68,500 |
Household Income in Liverpool
Household Income Brackets in Liverpool
With 42 households falling in the category, the $35,000 to $49,999 income range is the most frequent in Liverpool, accounting for 20.7% of all households.
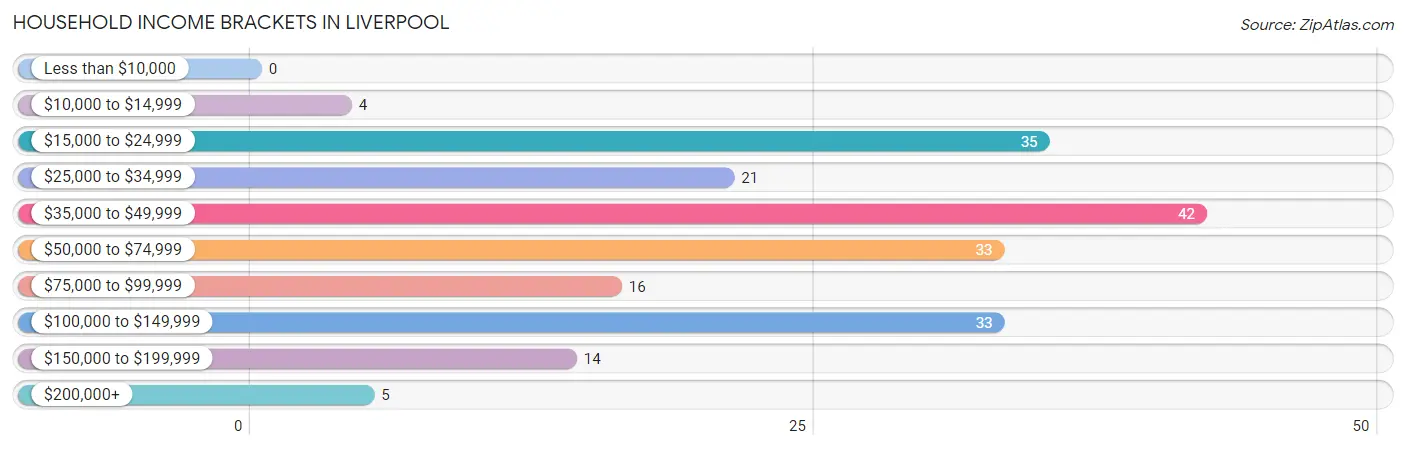
| Income Bracket | # Households | % Households |
| Less than $10,000 | 0 | 0.0% |
| $10,000 to $14,999 | 4 | 2.0% |
| $15,000 to $24,999 | 35 | 17.2% |
| $25,000 to $34,999 | 21 | 10.3% |
| $35,000 to $49,999 | 42 | 20.7% |
| $50,000 to $74,999 | 33 | 16.3% |
| $75,000 to $99,999 | 16 | 7.9% |
| $100,000 to $149,999 | 33 | 16.3% |
| $150,000 to $199,999 | 14 | 6.9% |
| $200,000+ | 5 | 2.5% |
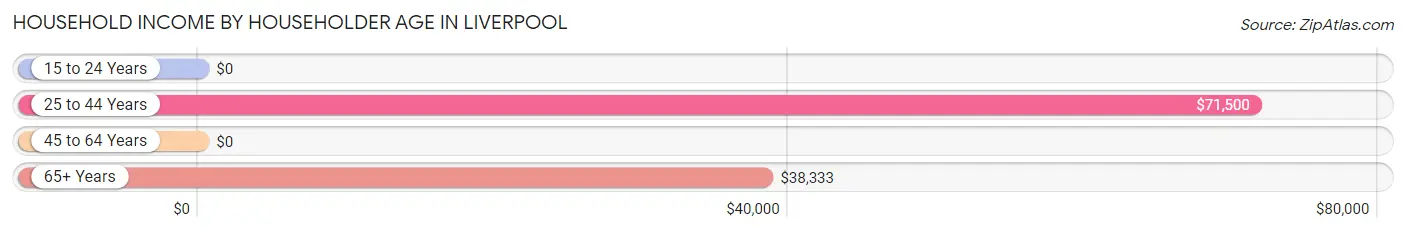
Household Income by Householder Age in Liverpool
The median household income in Liverpool is $49,750, with the highest median household income of $71,500 found in the 25 to 44 years age bracket for the primary householder. A total of 50 households (24.6%) fall into this category. Meanwhile, the 15 to 24 years age bracket for the primary householder has the lowest median household income of $0, with 2 households (1.0%) in this group.
| Income Bracket | # Households | Median Income |
| 15 to 24 Years | 2 (1.0%) | $0 |
| 25 to 44 Years | 50 (24.6%) | $71,500 |
| 45 to 64 Years | 87 (42.9%) | $0 |
| 65+ Years | 64 (31.5%) | $38,333 |
| Total | 203 (100.0%) | $49,750 |
Poverty in Liverpool
Income Below Poverty by Sex and Age in Liverpool
With 3.0% poverty level for males and 3.3% for females among the residents of Liverpool, 18 to 24 year old males and 55 to 64 year old females are the most vulnerable to poverty, with 2 males (13.3%) and 4 females (13.8%) in their respective age groups living below the poverty level.
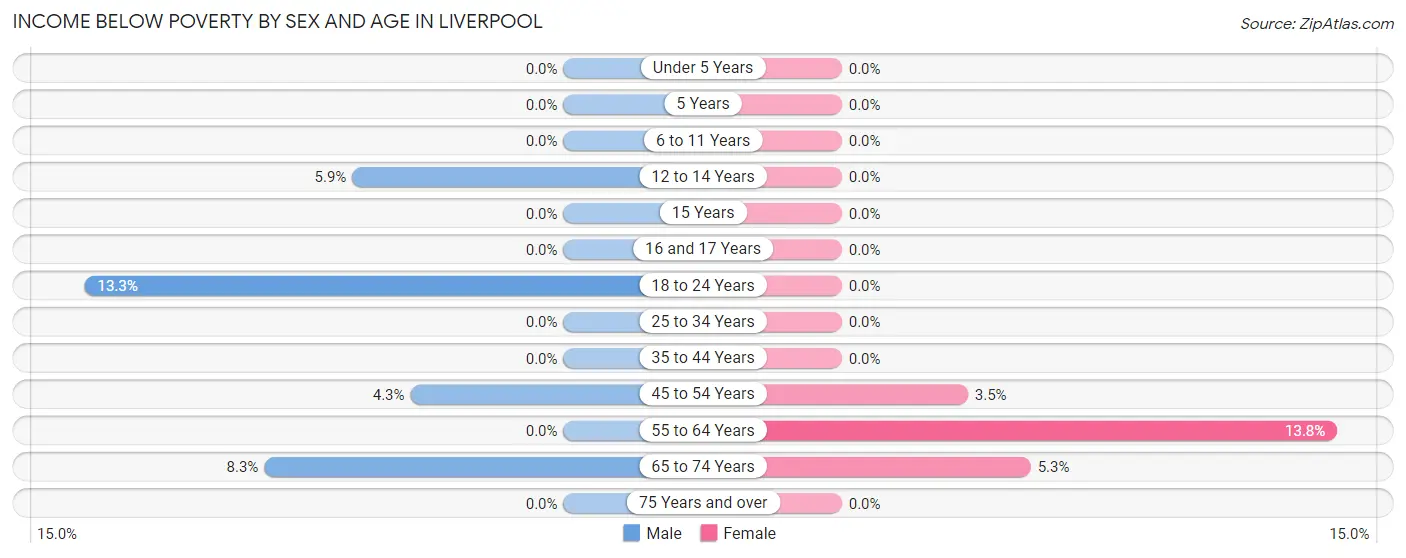
| Age Bracket | Male | Female |
| Under 5 Years | 0 (0.0%) | 0 (0.0%) |
| 5 Years | 0 (0.0%) | 0 (0.0%) |
| 6 to 11 Years | 0 (0.0%) | 0 (0.0%) |
| 12 to 14 Years | 1 (5.9%) | 0 (0.0%) |
| 15 Years | 0 (0.0%) | 0 (0.0%) |
| 16 and 17 Years | 0 (0.0%) | 0 (0.0%) |
| 18 to 24 Years | 2 (13.3%) | 0 (0.0%) |
| 25 to 34 Years | 0 (0.0%) | 0 (0.0%) |
| 35 to 44 Years | 0 (0.0%) | 0 (0.0%) |
| 45 to 54 Years | 2 (4.3%) | 2 (3.5%) |
| 55 to 64 Years | 0 (0.0%) | 4 (13.8%) |
| 65 to 74 Years | 2 (8.3%) | 2 (5.3%) |
| 75 Years and over | 0 (0.0%) | 0 (0.0%) |
| Total | 7 (3.0%) | 8 (3.3%) |
Income Above Poverty by Sex and Age in Liverpool
According to the poverty statistics in Liverpool, males aged under 5 years and females aged under 5 years are the age groups that are most secure financially, with 100.0% of males and 100.0% of females in these age groups living above the poverty line.
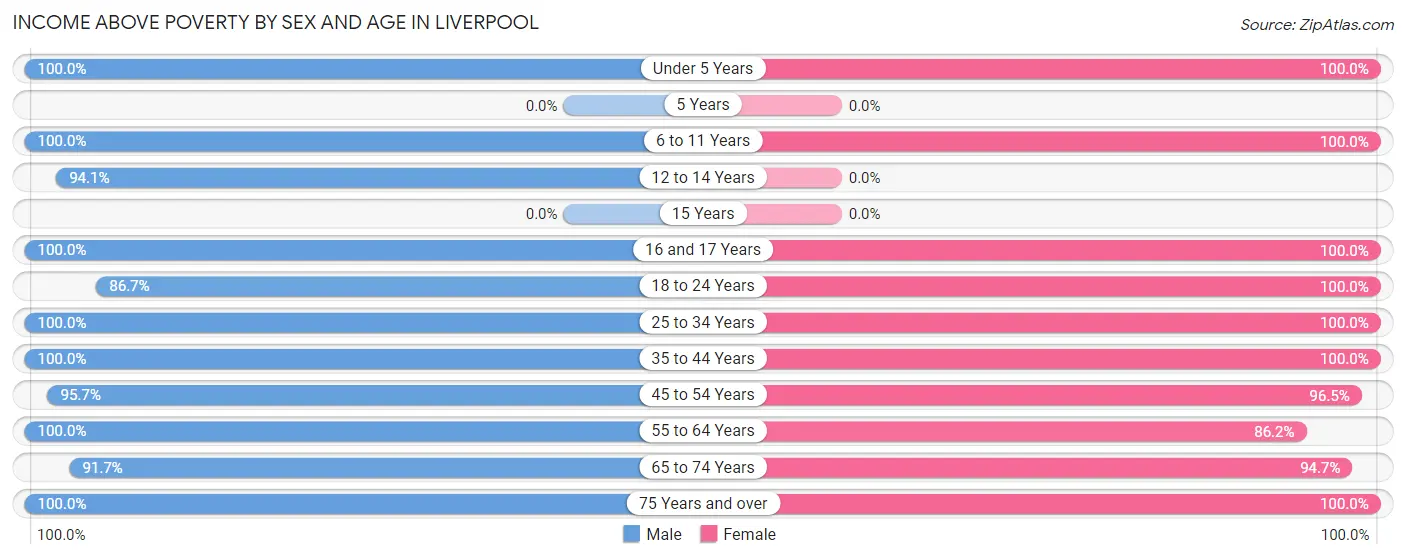
| Age Bracket | Male | Female |
| Under 5 Years | 10 (100.0%) | 10 (100.0%) |
| 5 Years | 0 (0.0%) | 0 (0.0%) |
| 6 to 11 Years | 13 (100.0%) | 5 (100.0%) |
| 12 to 14 Years | 16 (94.1%) | 0 (0.0%) |
| 15 Years | 0 (0.0%) | 0 (0.0%) |
| 16 and 17 Years | 29 (100.0%) | 2 (100.0%) |
| 18 to 24 Years | 13 (86.7%) | 29 (100.0%) |
| 25 to 34 Years | 29 (100.0%) | 31 (100.0%) |
| 35 to 44 Years | 12 (100.0%) | 23 (100.0%) |
| 45 to 54 Years | 45 (95.7%) | 55 (96.5%) |
| 55 to 64 Years | 37 (100.0%) | 25 (86.2%) |
| 65 to 74 Years | 22 (91.7%) | 36 (94.7%) |
| 75 Years and over | 3 (100.0%) | 16 (100.0%) |
| Total | 229 (97.0%) | 232 (96.7%) |
Income Below Poverty Among Married-Couple Families in Liverpool
The poverty statistics for married-couple families in Liverpool show that 2.2% or 2 of the total 92 families live below the poverty line. Families with no children have the highest poverty rate of 3.3%, comprising of 2 families. On the other hand, families with 1 or 2 children have the lowest poverty rate of 0.0%, which includes 0 families.
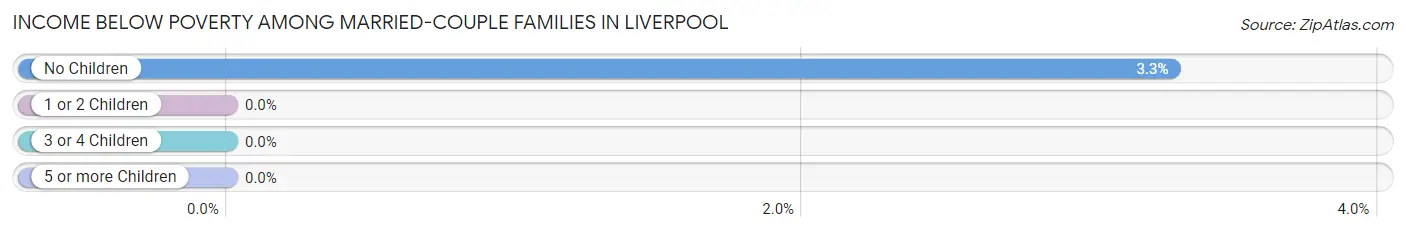
| Children | Above Poverty | Below Poverty |
| No Children | 59 (96.7%) | 2 (3.3%) |
| 1 or 2 Children | 28 (100.0%) | 0 (0.0%) |
| 3 or 4 Children | 3 (100.0%) | 0 (0.0%) |
| 5 or more Children | 0 (0.0%) | 0 (0.0%) |
| Total | 90 (97.8%) | 2 (2.2%) |
Income Below Poverty Among Single-Parent Households in Liverpool
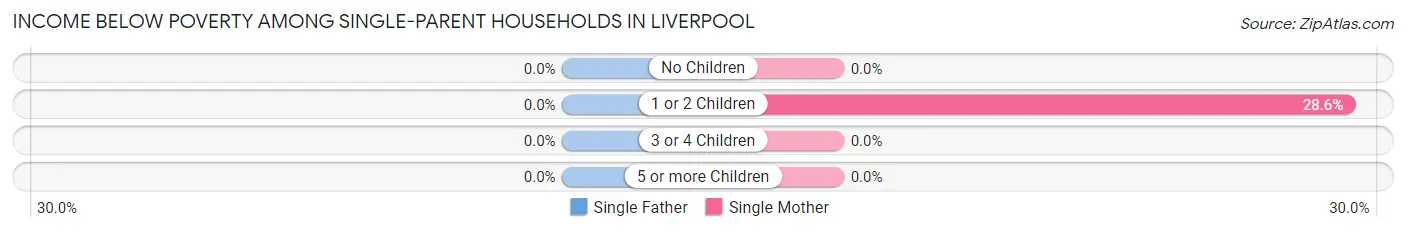
| Children | Single Father | Single Mother |
| No Children | 0 (0.0%) | 0 (0.0%) |
| 1 or 2 Children | 0 (0.0%) | 2 (28.6%) |
| 3 or 4 Children | 0 (0.0%) | 0 (0.0%) |
| 5 or more Children | 0 (0.0%) | 0 (0.0%) |
| Total | 0 (0.0%) | 2 (8.7%) |
Income Below Poverty Among Married-Couple vs Single-Parent Households in Liverpool
The poverty data for Liverpool shows that 2 of the married-couple family households (2.2%) and 2 of the single-parent households (7.1%) are living below the poverty level. Within the married-couple family households, those with no children have the highest poverty rate, with 2 households (3.3%) falling below the poverty line. Among the single-parent households, those with 1 or 2 children have the highest poverty rate, with 2 household (28.6%) living below poverty.
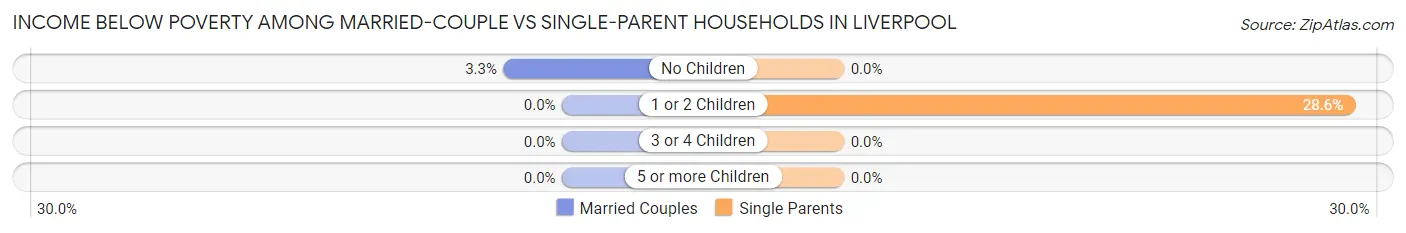
| Children | Married-Couple Families | Single-Parent Households |
| No Children | 2 (3.3%) | 0 (0.0%) |
| 1 or 2 Children | 0 (0.0%) | 2 (28.6%) |
| 3 or 4 Children | 0 (0.0%) | 0 (0.0%) |
| 5 or more Children | 0 (0.0%) | 0 (0.0%) |
| Total | 2 (2.2%) | 2 (7.1%) |
Race in Liverpool
The most populous races in Liverpool are White / Caucasian (321 | 67.4%), Hispanic or Latino (169 | 35.5%), and Some other Race (63 | 13.2%).
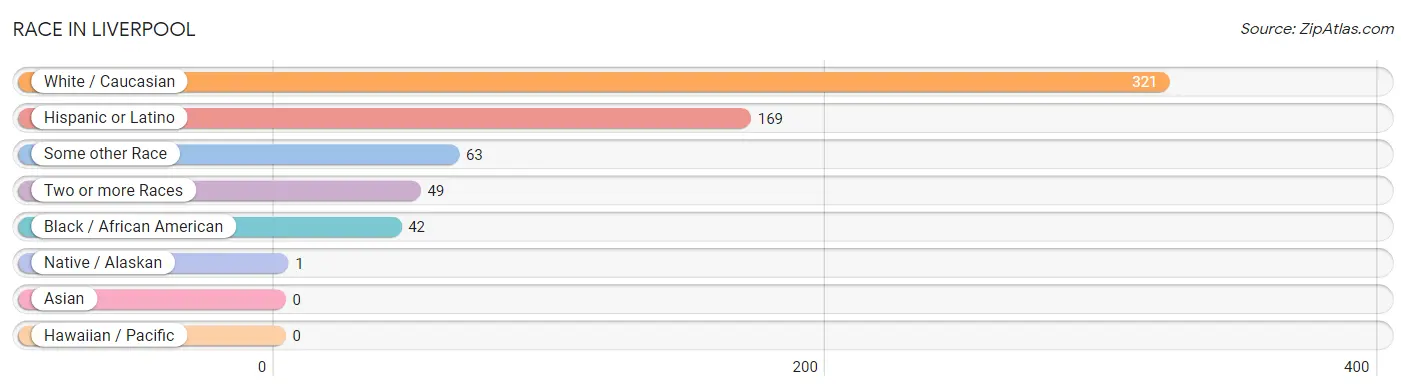
| Race | # Population | % Population |
| Asian | 0 | 0.0% |
| Black / African American | 42 | 8.8% |
| Hawaiian / Pacific | 0 | 0.0% |
| Hispanic or Latino | 169 | 35.5% |
| Native / Alaskan | 1 | 0.2% |
| White / Caucasian | 321 | 67.4% |
| Two or more Races | 49 | 10.3% |
| Some other Race | 63 | 13.2% |
| Total | 476 | 100.0% |
Ancestry in Liverpool
The most populous ancestries reported in Liverpool are Mexican (165 | 34.7%), German (80 | 16.8%), Irish (56 | 11.8%), English (40 | 8.4%), and American (26 | 5.5%), together accounting for 77.1% of all Liverpool residents.
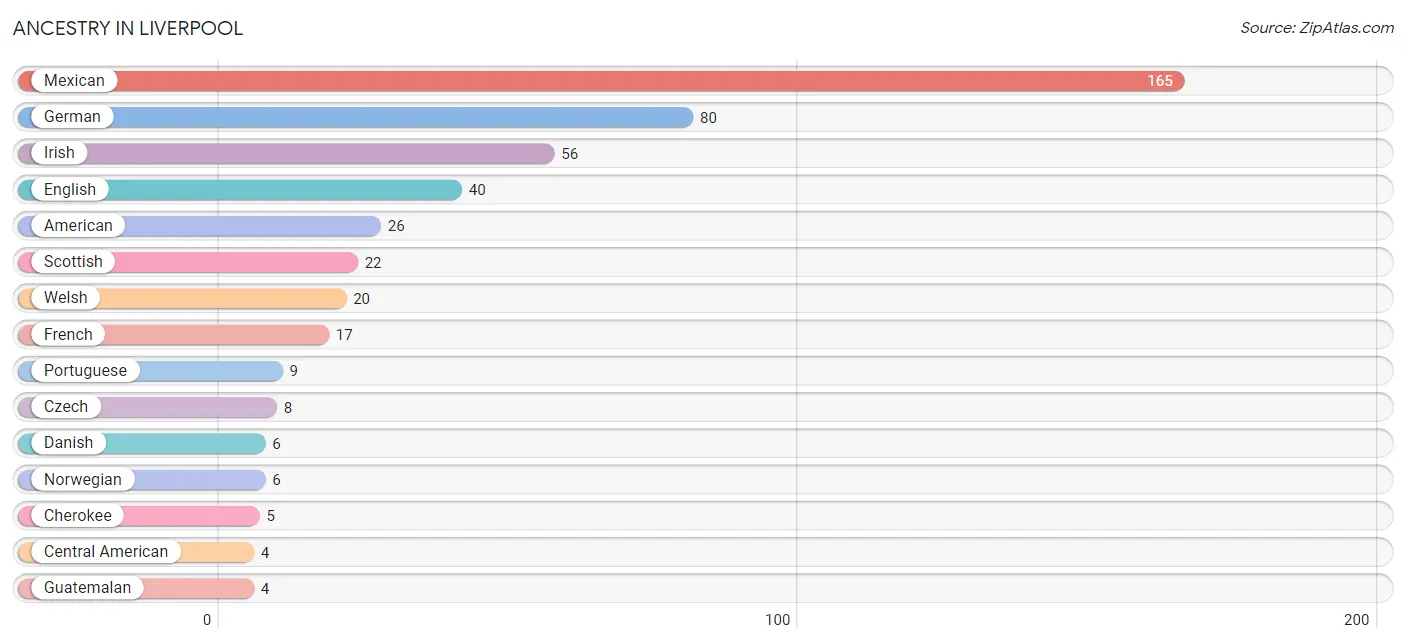
| Ancestry | # Population | % Population |
| American | 26 | 5.5% |
| British | 3 | 0.6% |
| Central American | 4 | 0.8% |
| Cherokee | 5 | 1.1% |
| Chickasaw | 1 | 0.2% |
| Czech | 8 | 1.7% |
| Danish | 6 | 1.3% |
| Dutch | 3 | 0.6% |
| English | 40 | 8.4% |
| French | 17 | 3.6% |
| German | 80 | 16.8% |
| Guatemalan | 4 | 0.8% |
| Irish | 56 | 11.8% |
| Italian | 4 | 0.8% |
| Mexican | 165 | 34.7% |
| Norwegian | 6 | 1.3% |
| Portuguese | 9 | 1.9% |
| Scandinavian | 4 | 0.8% |
| Scottish | 22 | 4.6% |
| Welsh | 20 | 4.2% | View All 20 Rows |
Immigrants in Liverpool
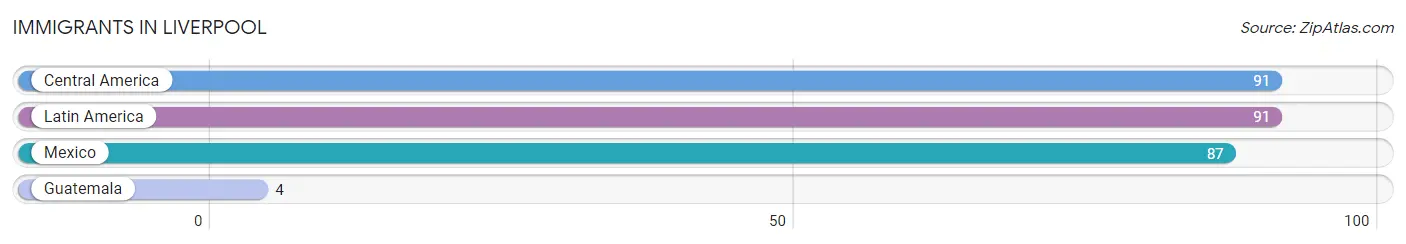
The most numerous immigrant groups reported in Liverpool came from Central America (91 | 19.1%), Latin America (91 | 19.1%), Mexico (87 | 18.3%), and Guatemala (4 | 0.8%), together accounting for 57.4% of all Liverpool residents.
| Immigration Origin | # Population | % Population |
| Central America | 91 | 19.1% |
| Guatemala | 4 | 0.8% |
| Latin America | 91 | 19.1% |
| Mexico | 87 | 18.3% | View All 4 Rows |
Sex and Age in Liverpool
Sex and Age in Liverpool
The most populous age groups in Liverpool are 50 to 54 Years (34 | 14.4%) for men and 45 to 49 Years (34 | 14.2%) for women.
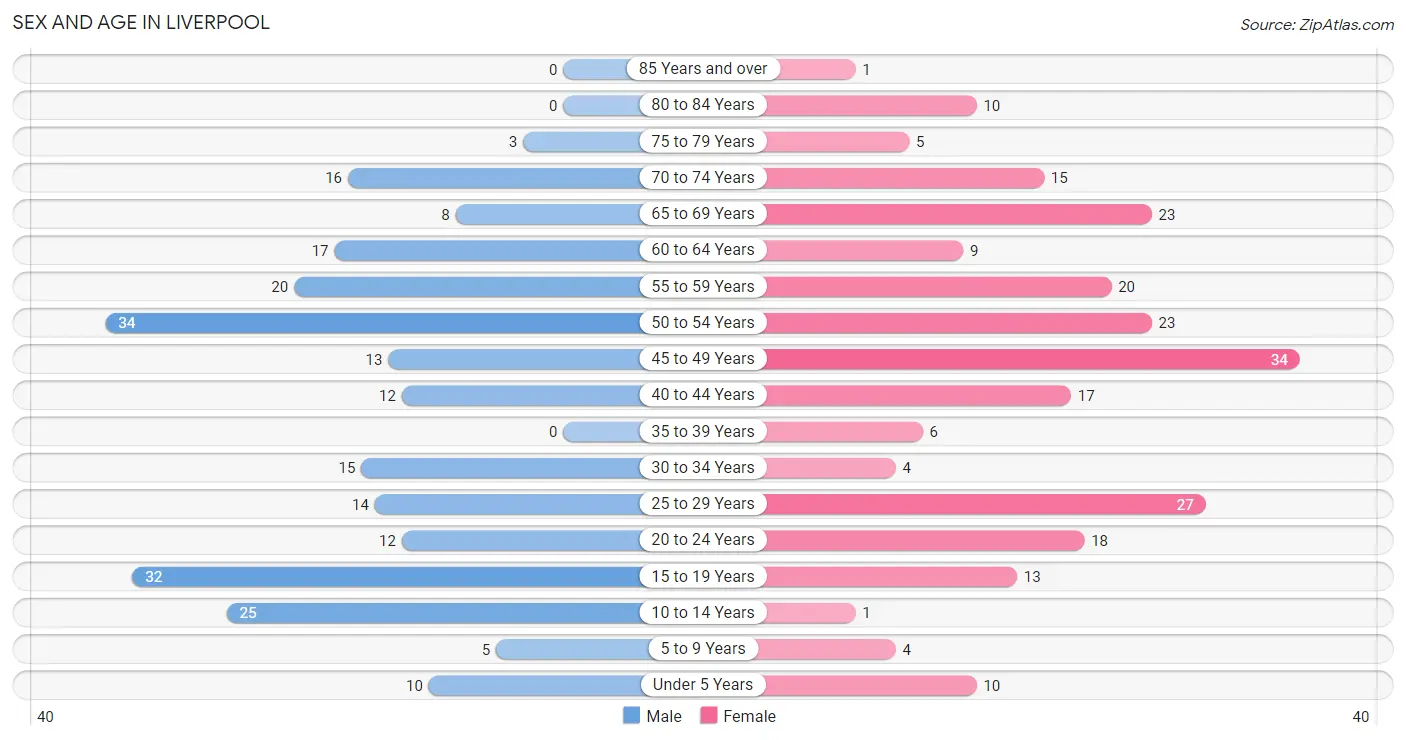
| Age Bracket | Male | Female |
| Under 5 Years | 10 (4.2%) | 10 (4.2%) |
| 5 to 9 Years | 5 (2.1%) | 4 (1.7%) |
| 10 to 14 Years | 25 (10.6%) | 1 (0.4%) |
| 15 to 19 Years | 32 (13.6%) | 13 (5.4%) |
| 20 to 24 Years | 12 (5.1%) | 18 (7.5%) |
| 25 to 29 Years | 14 (5.9%) | 27 (11.3%) |
| 30 to 34 Years | 15 (6.4%) | 4 (1.7%) |
| 35 to 39 Years | 0 (0.0%) | 6 (2.5%) |
| 40 to 44 Years | 12 (5.1%) | 17 (7.1%) |
| 45 to 49 Years | 13 (5.5%) | 34 (14.2%) |
| 50 to 54 Years | 34 (14.4%) | 23 (9.6%) |
| 55 to 59 Years | 20 (8.5%) | 20 (8.3%) |
| 60 to 64 Years | 17 (7.2%) | 9 (3.7%) |
| 65 to 69 Years | 8 (3.4%) | 23 (9.6%) |
| 70 to 74 Years | 16 (6.8%) | 15 (6.2%) |
| 75 to 79 Years | 3 (1.3%) | 5 (2.1%) |
| 80 to 84 Years | 0 (0.0%) | 10 (4.2%) |
| 85 Years and over | 0 (0.0%) | 1 (0.4%) |
| Total | 236 (100.0%) | 240 (100.0%) |
Families and Households in Liverpool
Median Family Size in Liverpool
The median family size in Liverpool is 3.20 persons per family, with single male/father families (5 | 4.2%) accounting for the largest median family size of 4 persons per family. On the other hand, single female/mother families (23 | 19.2%) represent the smallest median family size with 2.39 persons per family.
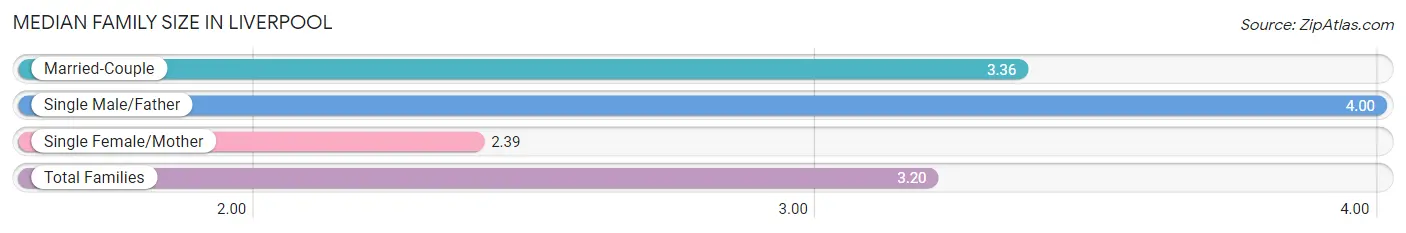
| Family Type | # Families | Family Size |
| Married-Couple | 92 (76.7%) | 3.36 |
| Single Male/Father | 5 (4.2%) | 4.00 |
| Single Female/Mother | 23 (19.2%) | 2.39 |
| Total Families | 120 (100.0%) | 3.20 |
Median Household Size in Liverpool
The median household size in Liverpool is 2.34 persons per household, with single male/father households (5 | 2.5%) accounting for the largest median household size of 4 persons per household. non-family households (83 | 40.9%) represent the smallest median household size with 1.05 persons per household.
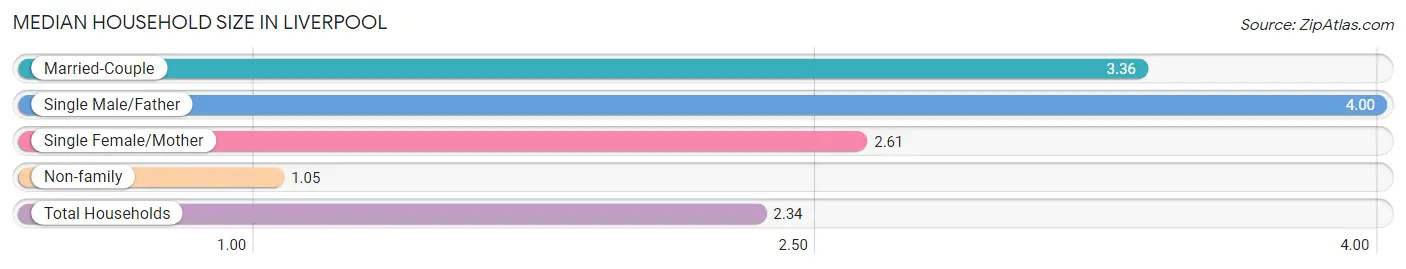
| Household Type | # Households | Household Size |
| Married-Couple | 92 (45.3%) | 3.36 |
| Single Male/Father | 5 (2.5%) | 4.00 |
| Single Female/Mother | 23 (11.3%) | 2.61 |
| Non-family | 83 (40.9%) | 1.05 |
| Total Households | 203 (100.0%) | 2.34 |
Household Size by Marriage Status in Liverpool
Out of a total of 203 households in Liverpool, 120 (59.1%) are family households, while 83 (40.9%) are nonfamily households. The most numerous type of family households are 2-person households, comprising 64, and the most common type of nonfamily households are 1-person households, comprising 79.
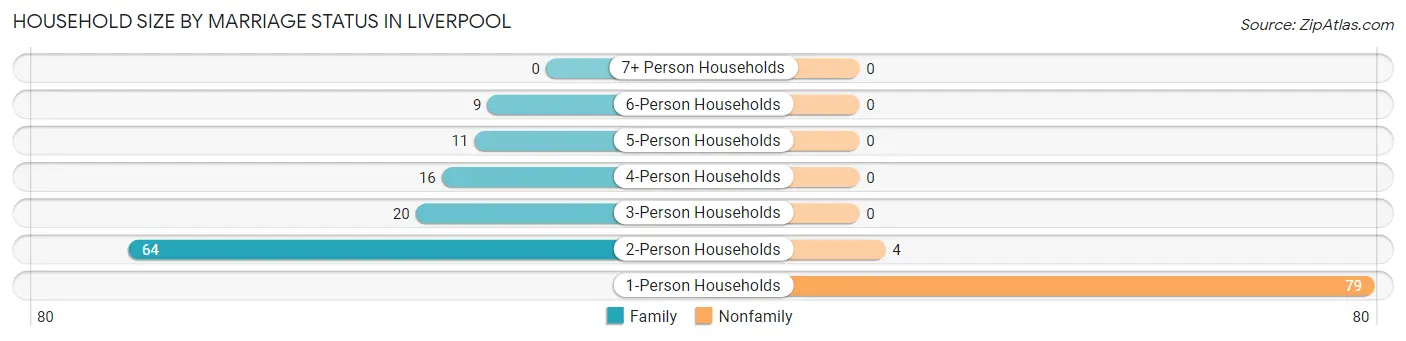
| Household Size | Family Households | Nonfamily Households |
| 1-Person Households | - | 79 (38.9%) |
| 2-Person Households | 64 (31.5%) | 4 (2.0%) |
| 3-Person Households | 20 (9.9%) | 0 (0.0%) |
| 4-Person Households | 16 (7.9%) | 0 (0.0%) |
| 5-Person Households | 11 (5.4%) | 0 (0.0%) |
| 6-Person Households | 9 (4.4%) | 0 (0.0%) |
| 7+ Person Households | 0 (0.0%) | 0 (0.0%) |
| Total | 120 (59.1%) | 83 (40.9%) |
Female Fertility in Liverpool
Fertility by Age in Liverpool
Average fertility rate in Liverpool is 23.0 births per 1,000 women. Women in the age bracket of 20 to 34 years have the highest fertility rate with 61.0 births per 1,000 women. Women in the age bracket of 20 to 34 years acount for 100.0% of all women with births.
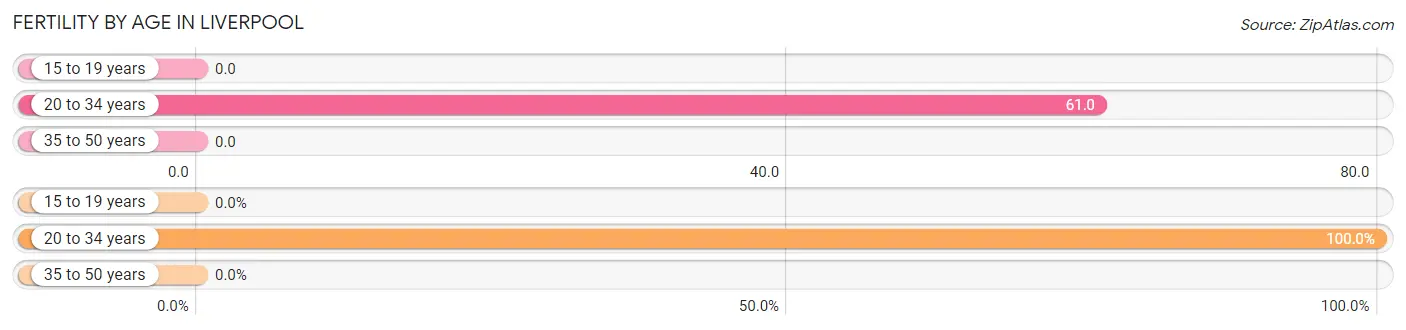
| Age Bracket | Women with Births | Births / 1,000 Women |
| 15 to 19 years | 0 (0.0%) | 0.0 |
| 20 to 34 years | 3 (100.0%) | 61.0 |
| 35 to 50 years | 0 (0.0%) | 0.0 |
| Total | 3 (100.0%) | 23.0 |
Fertility by Age by Marriage Status in Liverpool
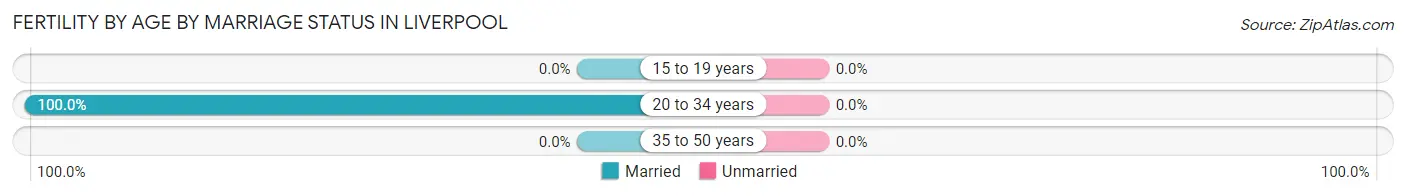
| Age Bracket | Married | Unmarried |
| 15 to 19 years | 0 (0.0%) | 0 (0.0%) |
| 20 to 34 years | 3 (100.0%) | 0 (0.0%) |
| 35 to 50 years | 0 (0.0%) | 0 (0.0%) |
| Total | 3 (100.0%) | 0 (0.0%) |
Fertility by Education in Liverpool
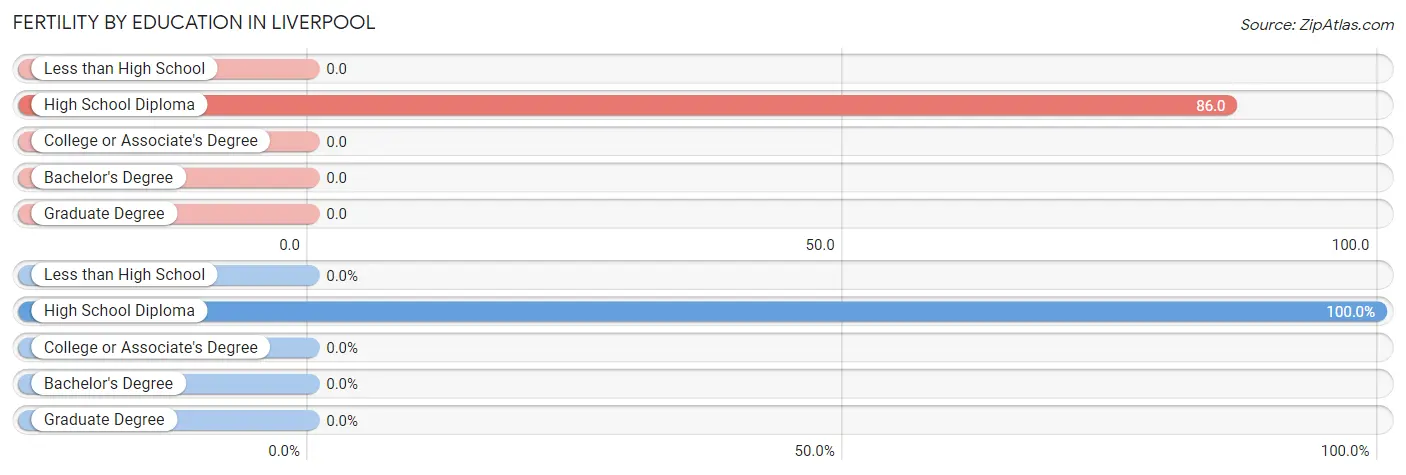
| Educational Attainment | Women with Births | Births / 1,000 Women |
| Less than High School | 0 (0.0%) | 0.0 |
| High School Diploma | 3 (100.0%) | 86.0 |
| College or Associate's Degree | 0 (0.0%) | 0.0 |
| Bachelor's Degree | 0 (0.0%) | 0.0 |
| Graduate Degree | 0 (0.0%) | 0.0 |
| Total | 3 (100.0%) | 23.0 |
Fertility by Education by Marriage Status in Liverpool
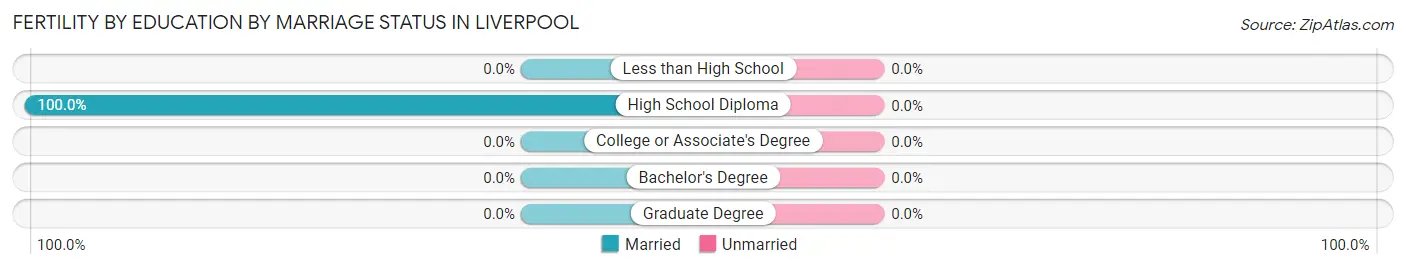
| Educational Attainment | Married | Unmarried |
| Less than High School | 0 (0.0%) | 0 (0.0%) |
| High School Diploma | 3 (100.0%) | 0 (0.0%) |
| College or Associate's Degree | 0 (0.0%) | 0 (0.0%) |
| Bachelor's Degree | 0 (0.0%) | 0 (0.0%) |
| Graduate Degree | 0 (0.0%) | 0 (0.0%) |
| Total | 3 (100.0%) | 0 (0.0%) |
Employment Characteristics in Liverpool
Employment by Class of Employer in Liverpool
Among the 221 employed individuals in Liverpool, private company employees (187 | 84.6%), self-employed (not incorporated) (14 | 6.3%), and not-for-profit organizations (8 | 3.6%) make up the most common classes of employment.
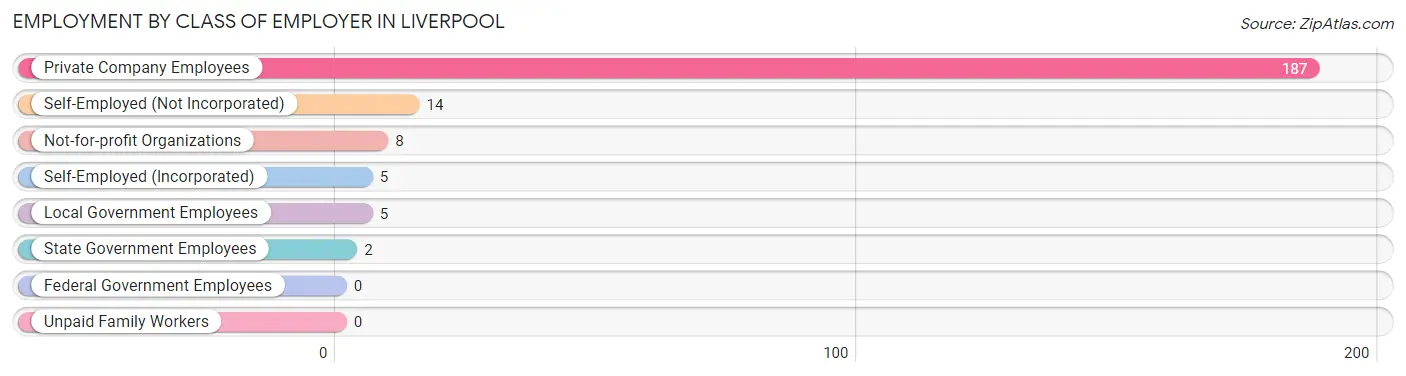
| Employer Class | # Employees | % Employees |
| Private Company Employees | 187 | 84.6% |
| Self-Employed (Incorporated) | 5 | 2.3% |
| Self-Employed (Not Incorporated) | 14 | 6.3% |
| Not-for-profit Organizations | 8 | 3.6% |
| Local Government Employees | 5 | 2.3% |
| State Government Employees | 2 | 0.9% |
| Federal Government Employees | 0 | 0.0% |
| Unpaid Family Workers | 0 | 0.0% |
| Total | 221 | 100.0% |
Employment Status by Age in Liverpool
According to the labor force statistics for Liverpool, out of the total population over 16 years of age (421), 57.5% or 242 individuals are in the labor force, with 8.7% or 21 of them unemployed. The age group with the highest labor force participation rate is 20 to 24 years, with 93.3% or 28 individuals in the labor force. Within the labor force, the 16 to 19 years age range has the highest percentage of unemployed individuals, with 83.3% or 15 of them being unemployed.
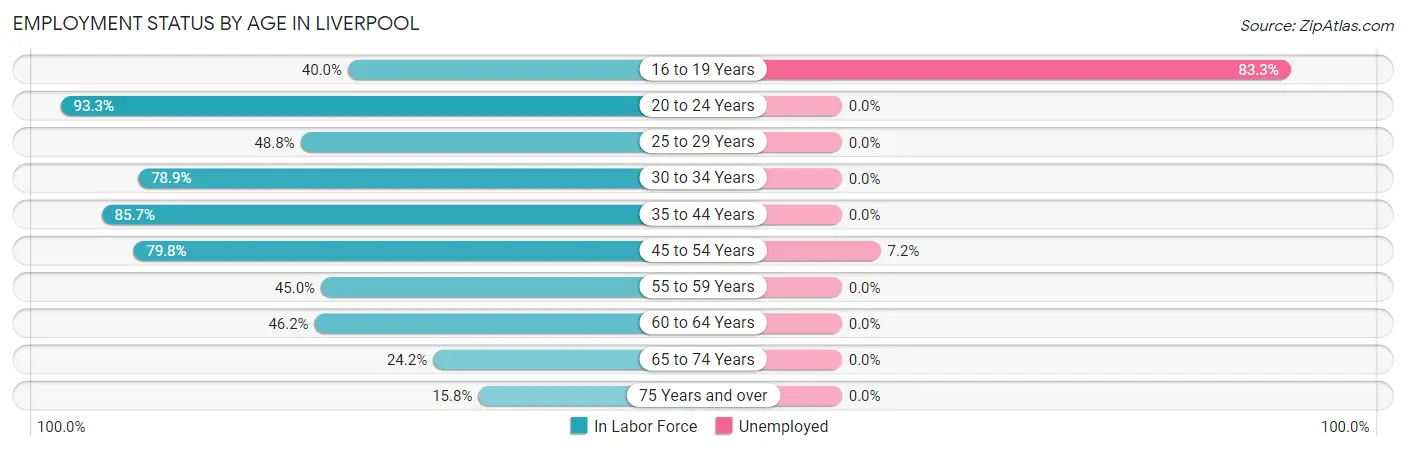
| Age Bracket | In Labor Force | Unemployed |
| 16 to 19 Years | 18 (40.0%) | 15 (83.3%) |
| 20 to 24 Years | 28 (93.3%) | 0 (0.0%) |
| 25 to 29 Years | 20 (48.8%) | 0 (0.0%) |
| 30 to 34 Years | 15 (78.9%) | 0 (0.0%) |
| 35 to 44 Years | 30 (85.7%) | 0 (0.0%) |
| 45 to 54 Years | 83 (79.8%) | 6 (7.2%) |
| 55 to 59 Years | 18 (45.0%) | 0 (0.0%) |
| 60 to 64 Years | 12 (46.2%) | 0 (0.0%) |
| 65 to 74 Years | 15 (24.2%) | 0 (0.0%) |
| 75 Years and over | 3 (15.8%) | 0 (0.0%) |
| Total | 242 (57.5%) | 21 (8.7%) |
Employment Status by Educational Attainment in Liverpool
According to labor force statistics for Liverpool, 67.2% of individuals (178) out of the total population between 25 and 64 years of age (265) are in the labor force, with 3.4% or 6 of them being unemployed. The group with the highest labor force participation rate are those with the educational attainment of bachelor's degree or higher, with 84.2% or 16 individuals in the labor force. Within the labor force, individuals with high school diploma education have the highest percentage of unemployment, with 5.1% or 4 of them being unemployed.
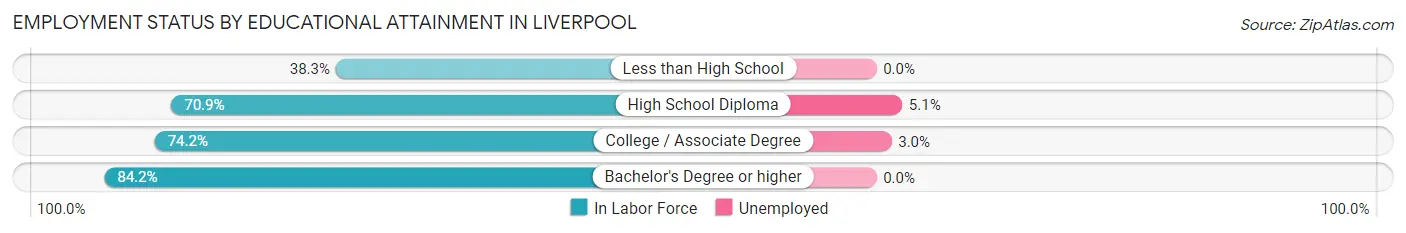
| Educational Attainment | In Labor Force | Unemployed |
| Less than High School | 18 (38.3%) | 0 (0.0%) |
| High School Diploma | 78 (70.9%) | 6 (5.1%) |
| College / Associate Degree | 66 (74.2%) | 3 (3.0%) |
| Bachelor's Degree or higher | 16 (84.2%) | 0 (0.0%) |
| Total | 178 (67.2%) | 9 (3.4%) |
Employment Occupations by Sex in Liverpool
Management, Business, Science and Arts Occupations
The most common Management, Business, Science and Arts occupations in Liverpool are Management (11 | 5.0%), Community & Social Service (8 | 3.6%), Legal Services & Support (4 | 1.8%), Education Instruction & Library (4 | 1.8%), and Business & Financial (3 | 1.4%).
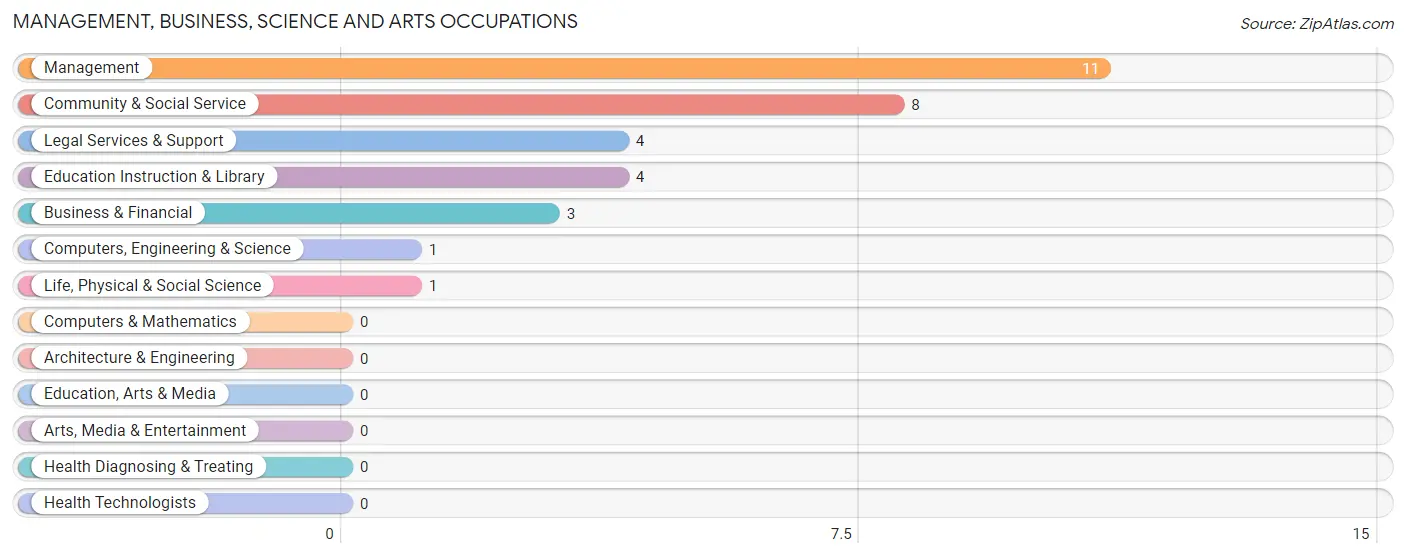
Management, Business, Science and Arts Occupations by Sex
Within the Management, Business, Science and Arts occupations in Liverpool, the most male-oriented occupations are Management (81.8%), Education Instruction & Library (50.0%), and Community & Social Service (25.0%), while the most female-oriented occupations are Business & Financial (100.0%), Computers, Engineering & Science (100.0%), and Life, Physical & Social Science (100.0%).

| Occupation | Male | Female |
| Management | 9 (81.8%) | 2 (18.2%) |
| Business & Financial | 0 (0.0%) | 3 (100.0%) |
| Computers, Engineering & Science | 0 (0.0%) | 1 (100.0%) |
| Computers & Mathematics | 0 (0.0%) | 0 (0.0%) |
| Architecture & Engineering | 0 (0.0%) | 0 (0.0%) |
| Life, Physical & Social Science | 0 (0.0%) | 1 (100.0%) |
| Community & Social Service | 2 (25.0%) | 6 (75.0%) |
| Education, Arts & Media | 0 (0.0%) | 0 (0.0%) |
| Legal Services & Support | 0 (0.0%) | 4 (100.0%) |
| Education Instruction & Library | 2 (50.0%) | 2 (50.0%) |
| Arts, Media & Entertainment | 0 (0.0%) | 0 (0.0%) |
| Health Diagnosing & Treating | 0 (0.0%) | 0 (0.0%) |
| Health Technologists | 0 (0.0%) | 0 (0.0%) |
| Total (Category) | 11 (47.8%) | 12 (52.2%) |
| Total (Overall) | 121 (54.7%) | 100 (45.3%) |
Services Occupations
The most common Services occupations in Liverpool are Food Preparation & Serving (19 | 8.6%), Healthcare Support (10 | 4.5%), Personal Care & Service (9 | 4.1%), and Cleaning & Maintenance (4 | 1.8%).
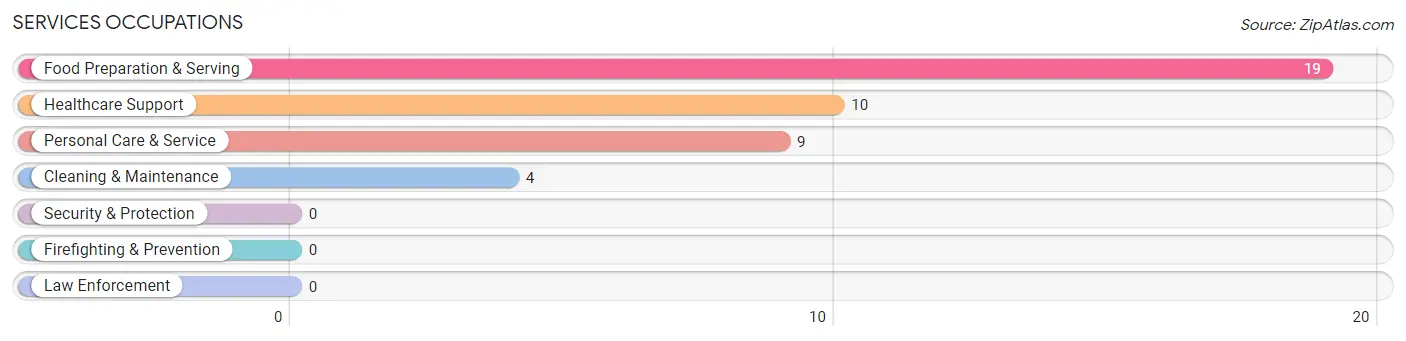
Services Occupations by Sex
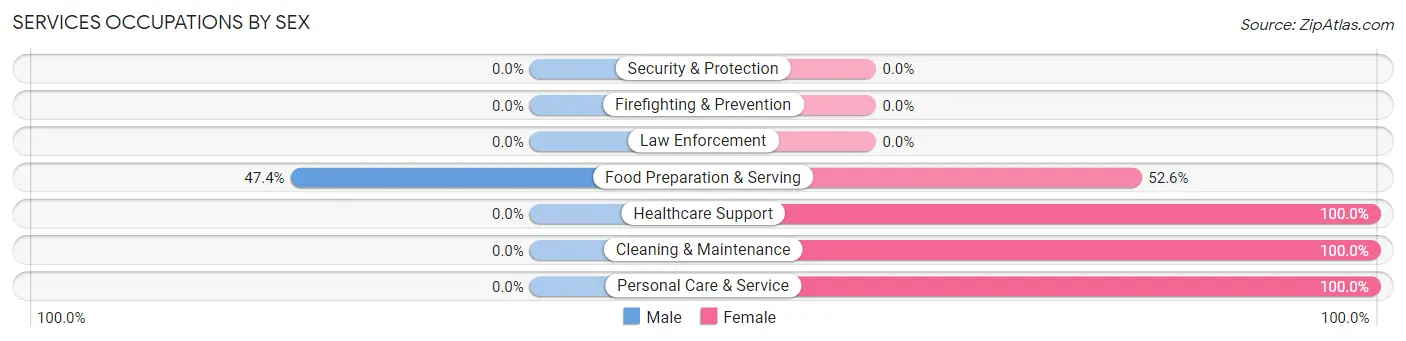
| Occupation | Male | Female |
| Healthcare Support | 0 (0.0%) | 10 (100.0%) |
| Security & Protection | 0 (0.0%) | 0 (0.0%) |
| Firefighting & Prevention | 0 (0.0%) | 0 (0.0%) |
| Law Enforcement | 0 (0.0%) | 0 (0.0%) |
| Food Preparation & Serving | 9 (47.4%) | 10 (52.6%) |
| Cleaning & Maintenance | 0 (0.0%) | 4 (100.0%) |
| Personal Care & Service | 0 (0.0%) | 9 (100.0%) |
| Total (Category) | 9 (21.4%) | 33 (78.6%) |
| Total (Overall) | 121 (54.7%) | 100 (45.3%) |
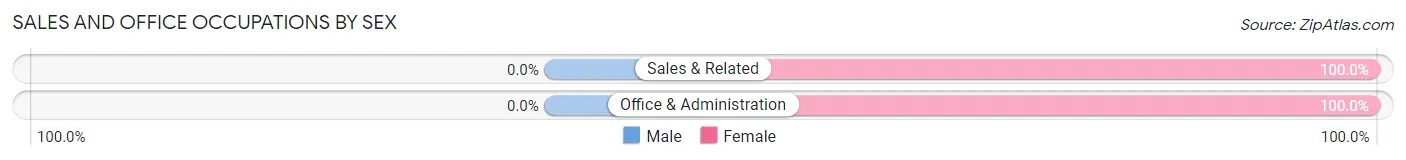
Sales and Office Occupations
The most common Sales and Office occupations in Liverpool are Sales & Related (27 | 12.2%), and Office & Administration (19 | 8.6%).
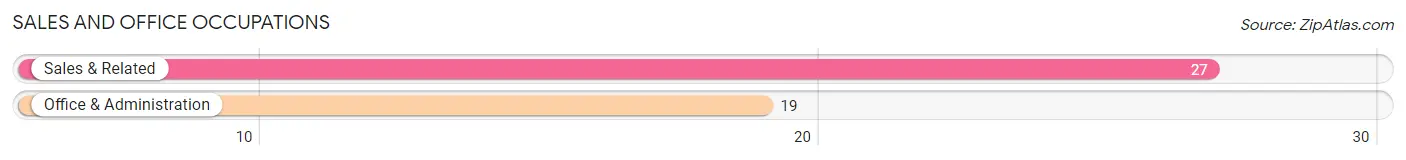
Sales and Office Occupations by Sex
| Occupation | Male | Female |
| Sales & Related | 0 (0.0%) | 27 (100.0%) |
| Office & Administration | 0 (0.0%) | 19 (100.0%) |
| Total (Category) | 0 (0.0%) | 46 (100.0%) |
| Total (Overall) | 121 (54.7%) | 100 (45.3%) |
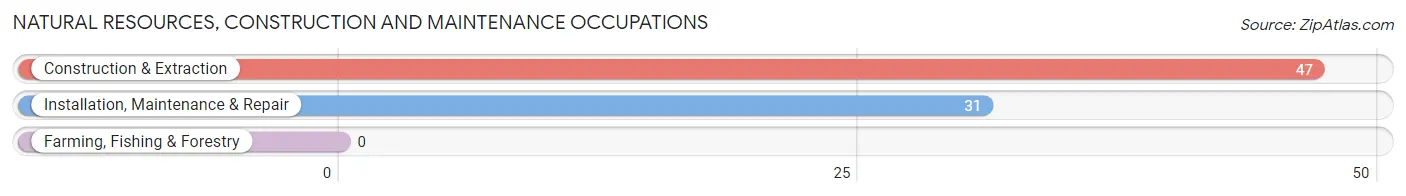
Natural Resources, Construction and Maintenance Occupations
The most common Natural Resources, Construction and Maintenance occupations in Liverpool are Construction & Extraction (47 | 21.3%), and Installation, Maintenance & Repair (31 | 14.0%).
Natural Resources, Construction and Maintenance Occupations by Sex
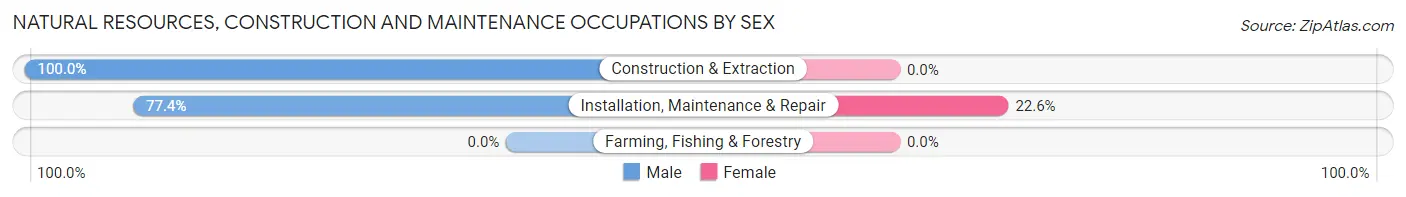
| Occupation | Male | Female |
| Farming, Fishing & Forestry | 0 (0.0%) | 0 (0.0%) |
| Construction & Extraction | 47 (100.0%) | 0 (0.0%) |
| Installation, Maintenance & Repair | 24 (77.4%) | 7 (22.6%) |
| Total (Category) | 71 (91.0%) | 7 (9.0%) |
| Total (Overall) | 121 (54.7%) | 100 (45.3%) |
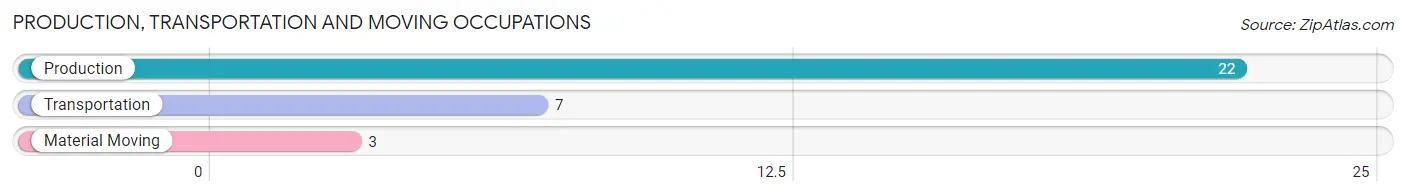
Production, Transportation and Moving Occupations
The most common Production, Transportation and Moving occupations in Liverpool are Production (22 | 10.0%), Transportation (7 | 3.2%), and Material Moving (3 | 1.4%).
Production, Transportation and Moving Occupations by Sex
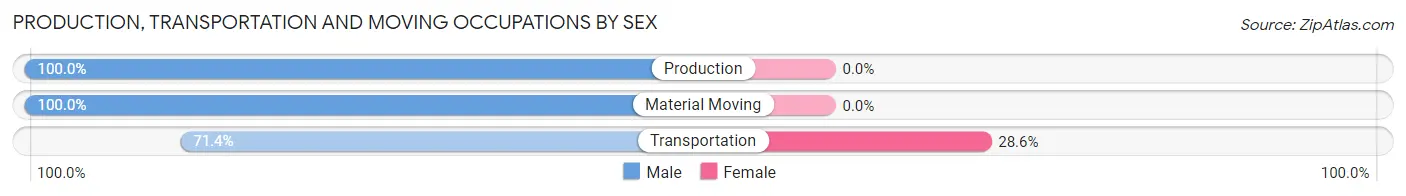
| Occupation | Male | Female |
| Production | 22 (100.0%) | 0 (0.0%) |
| Transportation | 5 (71.4%) | 2 (28.6%) |
| Material Moving | 3 (100.0%) | 0 (0.0%) |
| Total (Category) | 30 (93.8%) | 2 (6.2%) |
| Total (Overall) | 121 (54.7%) | 100 (45.3%) |
Employment Industries by Sex in Liverpool
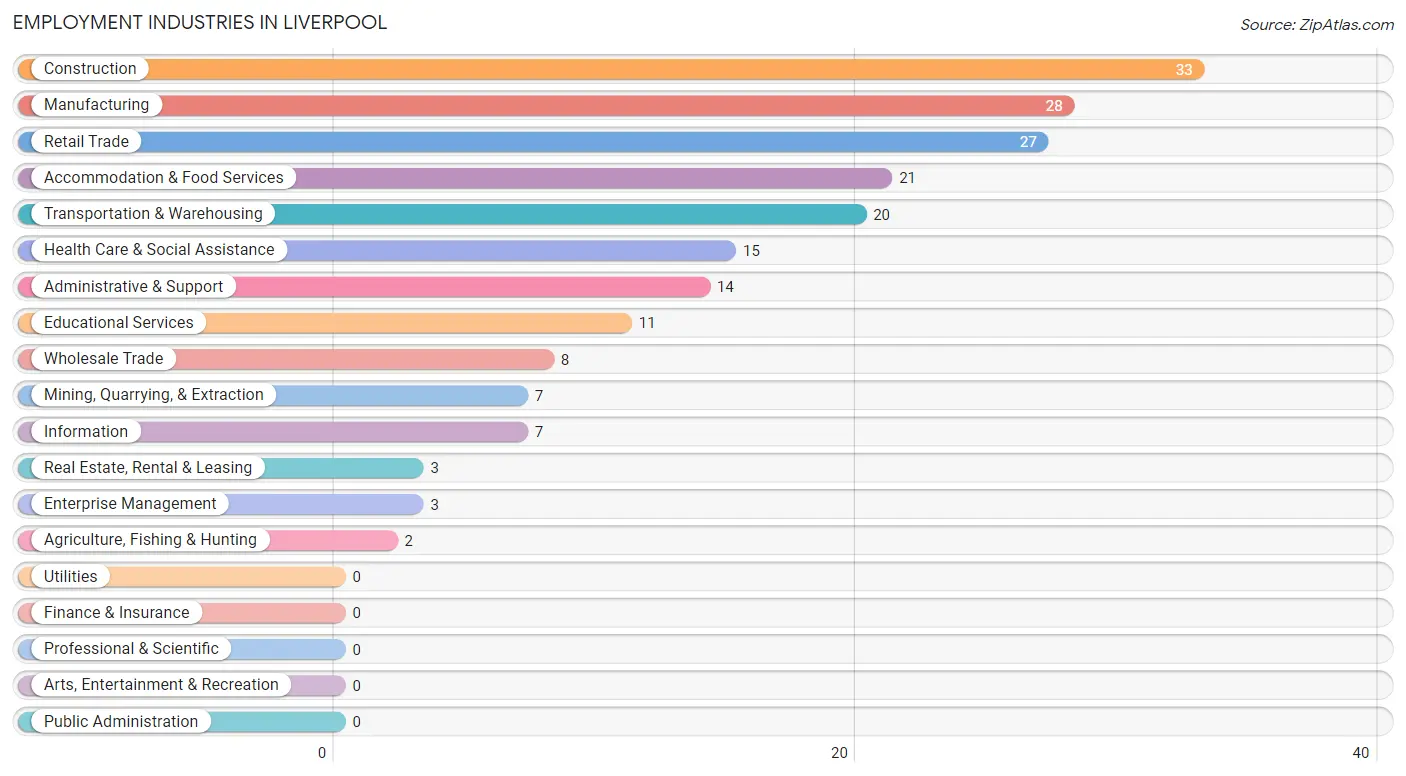
Employment Industries in Liverpool
The major employment industries in Liverpool include Construction (33 | 14.9%), Manufacturing (28 | 12.7%), Retail Trade (27 | 12.2%), Accommodation & Food Services (21 | 9.5%), and Transportation & Warehousing (20 | 9.0%).
Employment Industries by Sex in Liverpool
The Liverpool industries that see more men than women are Agriculture, Fishing & Hunting (100.0%), Mining, Quarrying, & Extraction (100.0%), and Construction (100.0%), whereas the industries that tend to have a higher number of women are Information (100.0%), Real Estate, Rental & Leasing (100.0%), and Enterprise Management (100.0%).
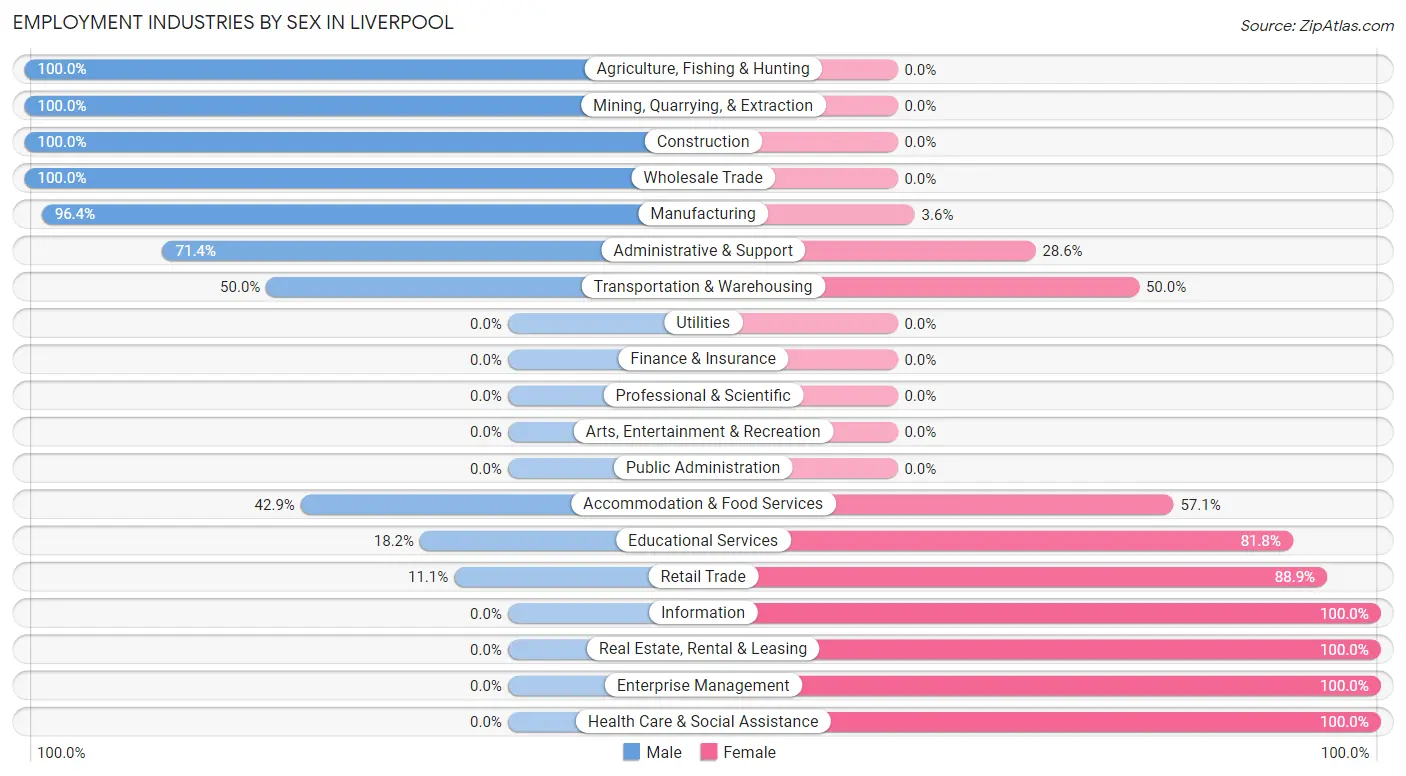
| Industry | Male | Female |
| Agriculture, Fishing & Hunting | 2 (100.0%) | 0 (0.0%) |
| Mining, Quarrying, & Extraction | 7 (100.0%) | 0 (0.0%) |
| Construction | 33 (100.0%) | 0 (0.0%) |
| Manufacturing | 27 (96.4%) | 1 (3.6%) |
| Wholesale Trade | 8 (100.0%) | 0 (0.0%) |
| Retail Trade | 3 (11.1%) | 24 (88.9%) |
| Transportation & Warehousing | 10 (50.0%) | 10 (50.0%) |
| Utilities | 0 (0.0%) | 0 (0.0%) |
| Information | 0 (0.0%) | 7 (100.0%) |
| Finance & Insurance | 0 (0.0%) | 0 (0.0%) |
| Real Estate, Rental & Leasing | 0 (0.0%) | 3 (100.0%) |
| Professional & Scientific | 0 (0.0%) | 0 (0.0%) |
| Enterprise Management | 0 (0.0%) | 3 (100.0%) |
| Administrative & Support | 10 (71.4%) | 4 (28.6%) |
| Educational Services | 2 (18.2%) | 9 (81.8%) |
| Health Care & Social Assistance | 0 (0.0%) | 15 (100.0%) |
| Arts, Entertainment & Recreation | 0 (0.0%) | 0 (0.0%) |
| Accommodation & Food Services | 9 (42.9%) | 12 (57.1%) |
| Public Administration | 0 (0.0%) | 0 (0.0%) |
| Total | 121 (54.7%) | 100 (45.3%) |
Education in Liverpool
School Enrollment in Liverpool
The most common levels of schooling among the 91 students in Liverpool are high school (45 | 49.4%), college / undergraduate (24 | 26.4%), and middle school (18 | 19.8%).
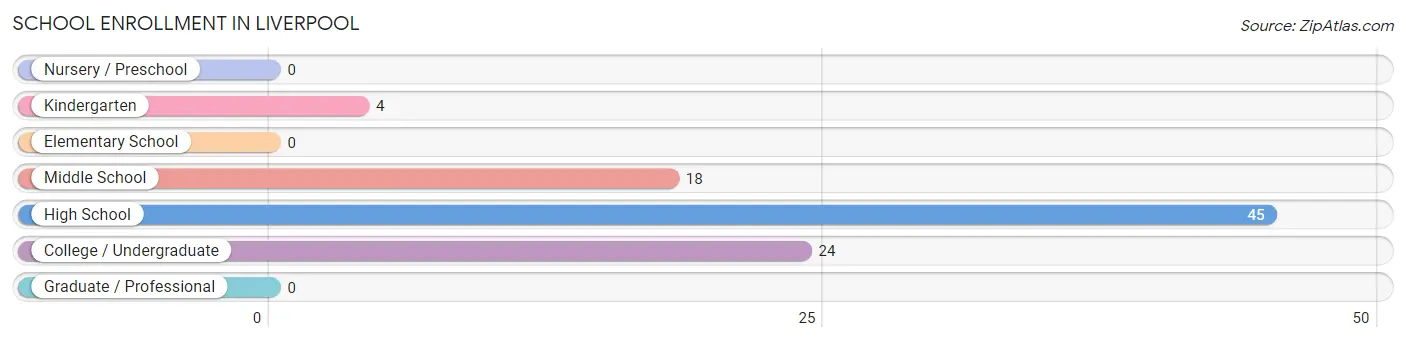
| School Level | # Students | % Students |
| Nursery / Preschool | 0 | 0.0% |
| Kindergarten | 4 | 4.4% |
| Elementary School | 0 | 0.0% |
| Middle School | 18 | 19.8% |
| High School | 45 | 49.4% |
| College / Undergraduate | 24 | 26.4% |
| Graduate / Professional | 0 | 0.0% |
| Total | 91 | 100.0% |
School Enrollment by Age by Funding Source in Liverpool
Out of a total of 91 students who are enrolled in schools in Liverpool, 6 (6.6%) attend a private institution, while the remaining 85 (93.4%) are enrolled in public schools. The age group of 5 to 9 year old has the highest likelihood of being enrolled in private schools, with 4 (100.0% in the age bracket) enrolled. Conversely, the age group of 10 to 14 year olds has the lowest likelihood of being enrolled in a private school, with 25 (100.0% in the age bracket) attending a public institution.
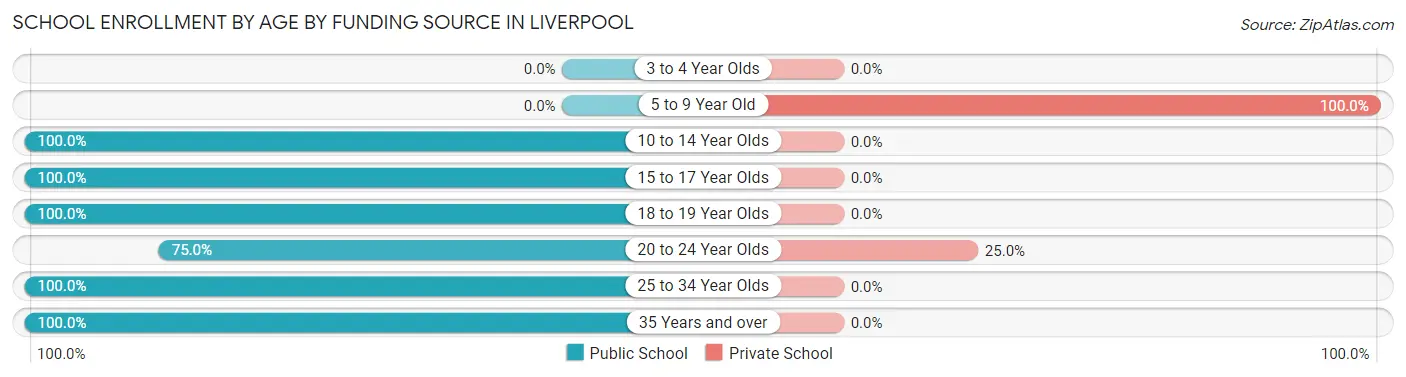
| Age Bracket | Public School | Private School |
| 3 to 4 Year Olds | 0 (0.0%) | 0 (0.0%) |
| 5 to 9 Year Old | 0 (0.0%) | 4 (100.0%) |
| 10 to 14 Year Olds | 25 (100.0%) | 0 (0.0%) |
| 15 to 17 Year Olds | 31 (100.0%) | 0 (0.0%) |
| 18 to 19 Year Olds | 14 (100.0%) | 0 (0.0%) |
| 20 to 24 Year Olds | 6 (75.0%) | 2 (25.0%) |
| 25 to 34 Year Olds | 5 (100.0%) | 0 (0.0%) |
| 35 Years and over | 4 (100.0%) | 0 (0.0%) |
| Total | 85 (93.4%) | 6 (6.6%) |
Educational Attainment by Field of Study in Liverpool
Psychology (8 | 25.8%), science & technology (7 | 22.6%), social sciences (5 | 16.1%), bio, nature & agricultural (3 | 9.7%), and visual & performing arts (3 | 9.7%) are the most common fields of study among 31 individuals in Liverpool who have obtained a bachelor's degree or higher.
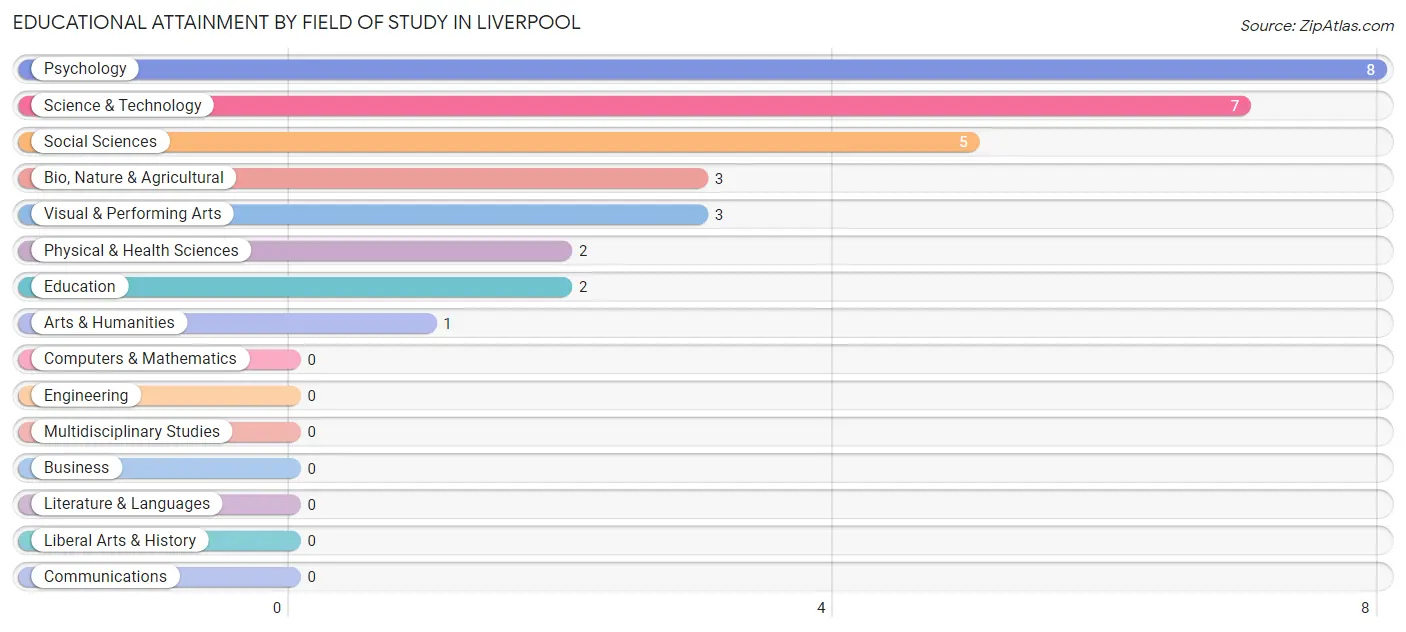
| Field of Study | # Graduates | % Graduates |
| Computers & Mathematics | 0 | 0.0% |
| Bio, Nature & Agricultural | 3 | 9.7% |
| Physical & Health Sciences | 2 | 6.5% |
| Psychology | 8 | 25.8% |
| Social Sciences | 5 | 16.1% |
| Engineering | 0 | 0.0% |
| Multidisciplinary Studies | 0 | 0.0% |
| Science & Technology | 7 | 22.6% |
| Business | 0 | 0.0% |
| Education | 2 | 6.5% |
| Literature & Languages | 0 | 0.0% |
| Liberal Arts & History | 0 | 0.0% |
| Visual & Performing Arts | 3 | 9.7% |
| Communications | 0 | 0.0% |
| Arts & Humanities | 1 | 3.2% |
| Total | 31 | 100.0% |
Transportation & Commute in Liverpool
Vehicle Availability by Sex in Liverpool
The most prevalent vehicle ownership categories in Liverpool are males with 3 vehicles (35, accounting for 28.9%) and females with 3 vehicles (18, making up 35.0%).
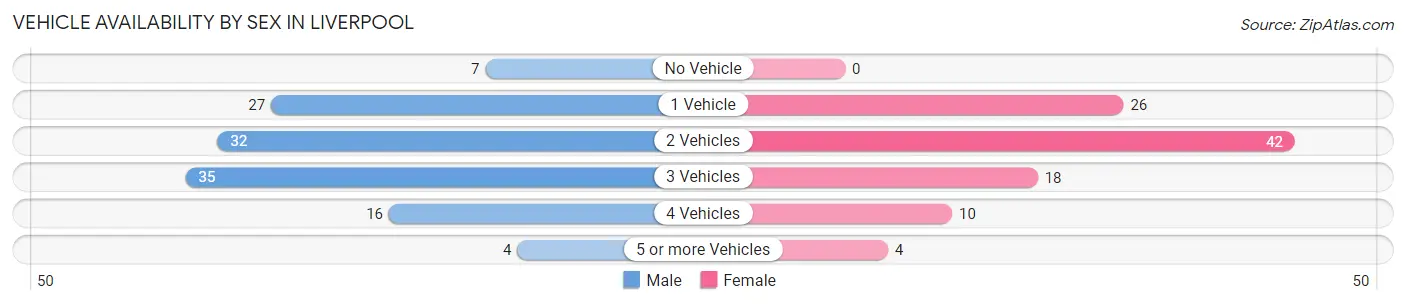
| Vehicles Available | Male | Female |
| No Vehicle | 7 (5.8%) | 0 (0.0%) |
| 1 Vehicle | 27 (22.3%) | 26 (26.0%) |
| 2 Vehicles | 32 (26.5%) | 42 (42.0%) |
| 3 Vehicles | 35 (28.9%) | 18 (18.0%) |
| 4 Vehicles | 16 (13.2%) | 10 (10.0%) |
| 5 or more Vehicles | 4 (3.3%) | 4 (4.0%) |
| Total | 121 (100.0%) | 100 (100.0%) |
Commute Time in Liverpool
The most frequently occuring commute durations in Liverpool are 15 to 19 minutes (68 commuters, 31.3%), 45 to 59 minutes (32 commuters, 14.7%), and 60 to 89 minutes (29 commuters, 13.4%).
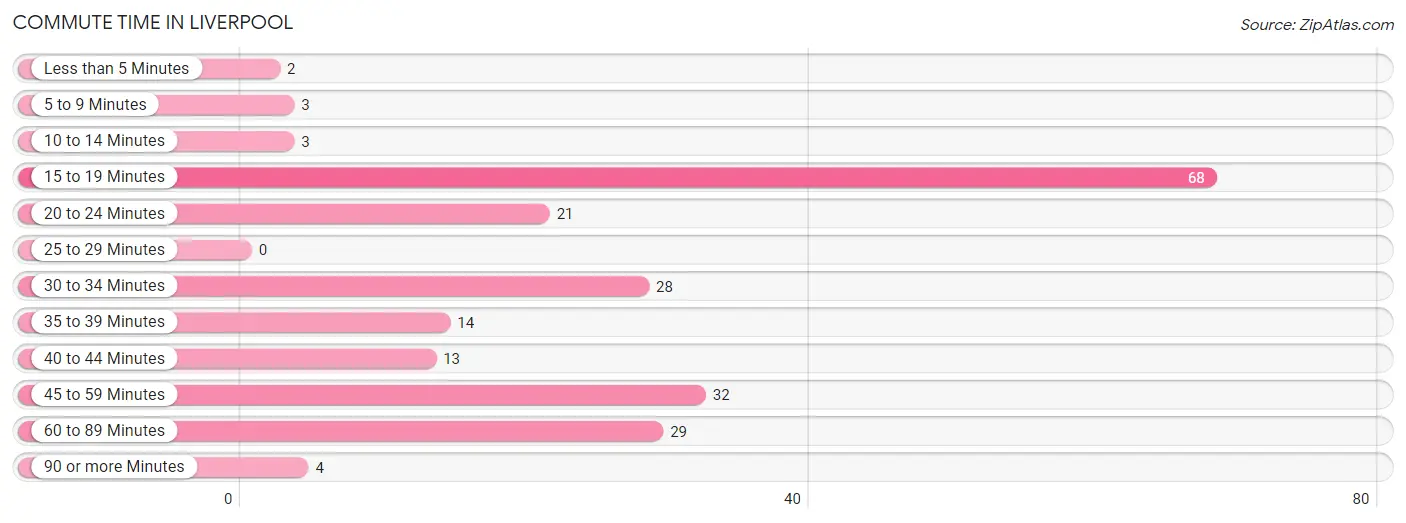
| Commute Time | # Commuters | % Commuters |
| Less than 5 Minutes | 2 | 0.9% |
| 5 to 9 Minutes | 3 | 1.4% |
| 10 to 14 Minutes | 3 | 1.4% |
| 15 to 19 Minutes | 68 | 31.3% |
| 20 to 24 Minutes | 21 | 9.7% |
| 25 to 29 Minutes | 0 | 0.0% |
| 30 to 34 Minutes | 28 | 12.9% |
| 35 to 39 Minutes | 14 | 6.5% |
| 40 to 44 Minutes | 13 | 6.0% |
| 45 to 59 Minutes | 32 | 14.7% |
| 60 to 89 Minutes | 29 | 13.4% |
| 90 or more Minutes | 4 | 1.8% |
Commute Time by Sex in Liverpool
The most common commute times in Liverpool are 15 to 19 minutes (38 commuters, 31.4%) for males and 15 to 19 minutes (30 commuters, 31.2%) for females.
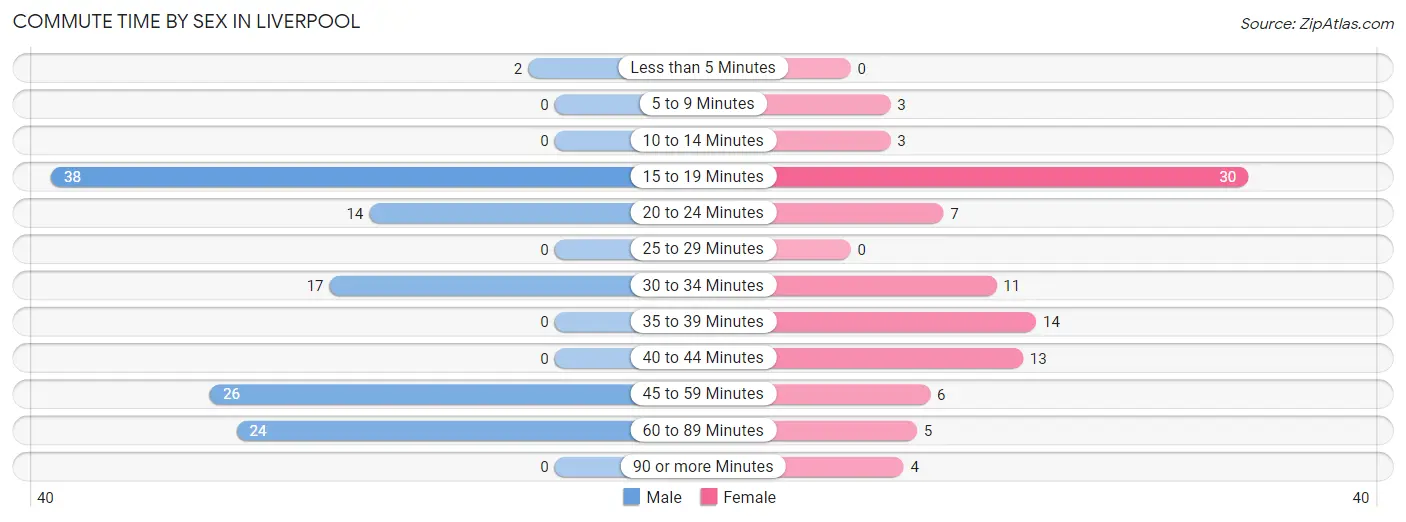
| Commute Time | Male | Female |
| Less than 5 Minutes | 2 (1.7%) | 0 (0.0%) |
| 5 to 9 Minutes | 0 (0.0%) | 3 (3.1%) |
| 10 to 14 Minutes | 0 (0.0%) | 3 (3.1%) |
| 15 to 19 Minutes | 38 (31.4%) | 30 (31.2%) |
| 20 to 24 Minutes | 14 (11.6%) | 7 (7.3%) |
| 25 to 29 Minutes | 0 (0.0%) | 0 (0.0%) |
| 30 to 34 Minutes | 17 (14.1%) | 11 (11.5%) |
| 35 to 39 Minutes | 0 (0.0%) | 14 (14.6%) |
| 40 to 44 Minutes | 0 (0.0%) | 13 (13.5%) |
| 45 to 59 Minutes | 26 (21.5%) | 6 (6.2%) |
| 60 to 89 Minutes | 24 (19.8%) | 5 (5.2%) |
| 90 or more Minutes | 0 (0.0%) | 4 (4.2%) |
Time of Departure to Work by Sex in Liverpool
The most frequent times of departure to work in Liverpool are 6:00 AM to 6:29 AM (41, 33.9%) for males and 6:00 AM to 6:29 AM (30, 31.2%) for females.
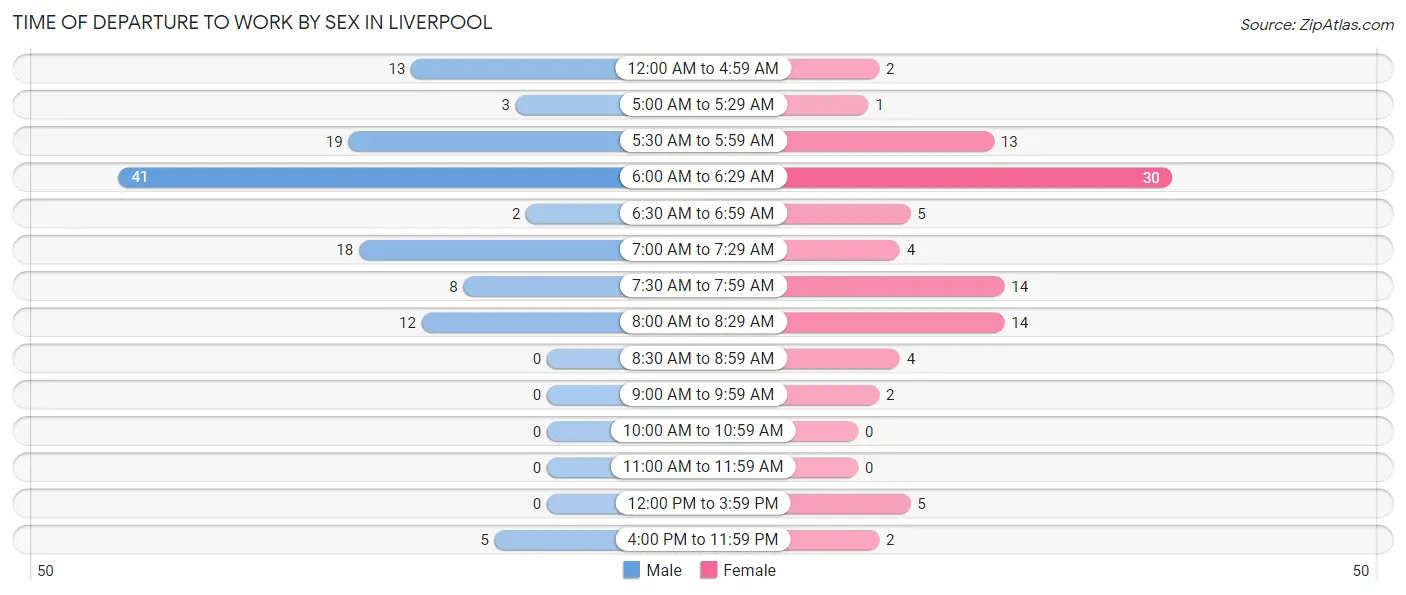
| Time of Departure | Male | Female |
| 12:00 AM to 4:59 AM | 13 (10.7%) | 2 (2.1%) |
| 5:00 AM to 5:29 AM | 3 (2.5%) | 1 (1.0%) |
| 5:30 AM to 5:59 AM | 19 (15.7%) | 13 (13.5%) |
| 6:00 AM to 6:29 AM | 41 (33.9%) | 30 (31.2%) |
| 6:30 AM to 6:59 AM | 2 (1.7%) | 5 (5.2%) |
| 7:00 AM to 7:29 AM | 18 (14.9%) | 4 (4.2%) |
| 7:30 AM to 7:59 AM | 8 (6.6%) | 14 (14.6%) |
| 8:00 AM to 8:29 AM | 12 (9.9%) | 14 (14.6%) |
| 8:30 AM to 8:59 AM | 0 (0.0%) | 4 (4.2%) |
| 9:00 AM to 9:59 AM | 0 (0.0%) | 2 (2.1%) |
| 10:00 AM to 10:59 AM | 0 (0.0%) | 0 (0.0%) |
| 11:00 AM to 11:59 AM | 0 (0.0%) | 0 (0.0%) |
| 12:00 PM to 3:59 PM | 0 (0.0%) | 5 (5.2%) |
| 4:00 PM to 11:59 PM | 5 (4.1%) | 2 (2.1%) |
| Total | 121 (100.0%) | 96 (100.0%) |
Housing Occupancy in Liverpool
Occupancy by Ownership in Liverpool
Of the total 203 dwellings in Liverpool, owner-occupied units account for 181 (89.2%), while renter-occupied units make up 22 (10.8%).
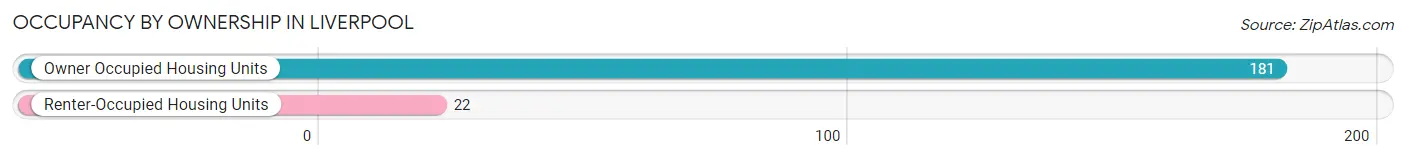
| Occupancy | # Housing Units | % Housing Units |
| Owner Occupied Housing Units | 181 | 89.2% |
| Renter-Occupied Housing Units | 22 | 10.8% |
| Total Occupied Housing Units | 203 | 100.0% |
Occupancy by Household Size in Liverpool
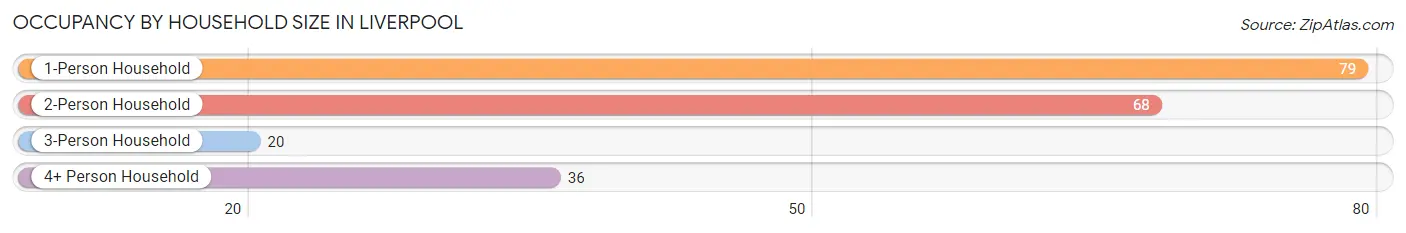
| Household Size | # Housing Units | % Housing Units |
| 1-Person Household | 79 | 38.9% |
| 2-Person Household | 68 | 33.5% |
| 3-Person Household | 20 | 9.9% |
| 4+ Person Household | 36 | 17.7% |
| Total Housing Units | 203 | 100.0% |
Occupancy by Ownership by Household Size in Liverpool
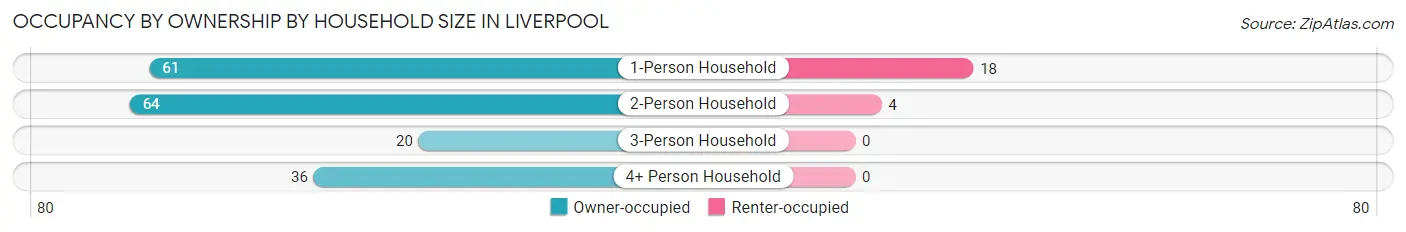
| Household Size | Owner-occupied | Renter-occupied |
| 1-Person Household | 61 (77.2%) | 18 (22.8%) |
| 2-Person Household | 64 (94.1%) | 4 (5.9%) |
| 3-Person Household | 20 (100.0%) | 0 (0.0%) |
| 4+ Person Household | 36 (100.0%) | 0 (0.0%) |
| Total Housing Units | 181 (89.2%) | 22 (10.8%) |
Occupancy by Educational Attainment in Liverpool
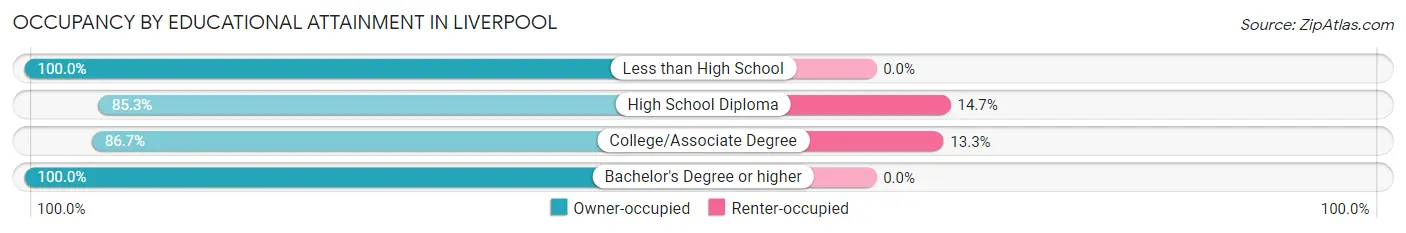
| Household Size | Owner-occupied | Renter-occupied |
| Less than High School | 27 (100.0%) | 0 (0.0%) |
| High School Diploma | 81 (85.3%) | 14 (14.7%) |
| College/Associate Degree | 52 (86.7%) | 8 (13.3%) |
| Bachelor's Degree or higher | 21 (100.0%) | 0 (0.0%) |
Occupancy by Age of Householder in Liverpool
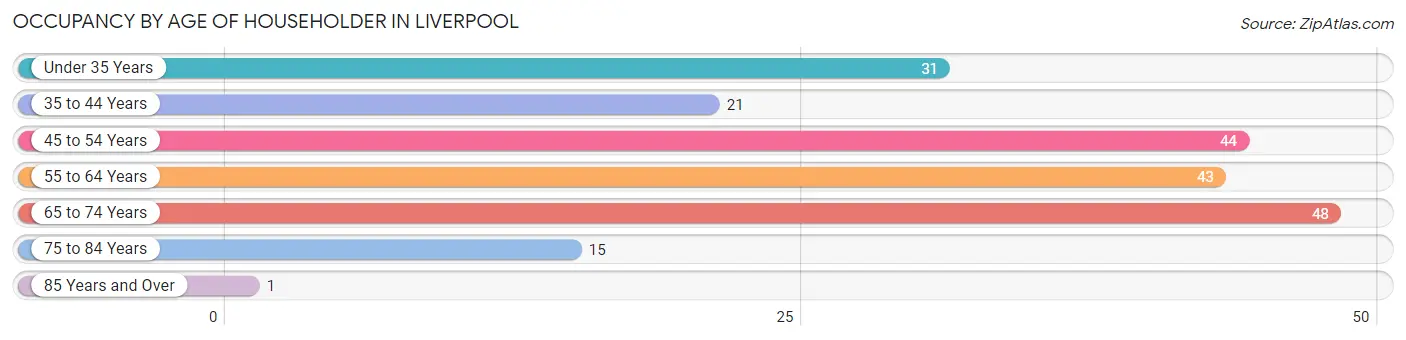
| Age Bracket | # Households | % Households |
| Under 35 Years | 31 | 15.3% |
| 35 to 44 Years | 21 | 10.3% |
| 45 to 54 Years | 44 | 21.7% |
| 55 to 64 Years | 43 | 21.2% |
| 65 to 74 Years | 48 | 23.6% |
| 75 to 84 Years | 15 | 7.4% |
| 85 Years and Over | 1 | 0.5% |
| Total | 203 | 100.0% |
Housing Finances in Liverpool
Median Income by Occupancy in Liverpool
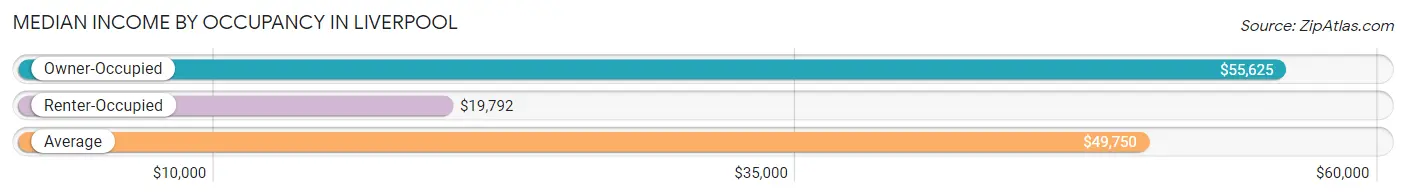
| Occupancy Type | # Households | Median Income |
| Owner-Occupied | 181 (89.2%) | $55,625 |
| Renter-Occupied | 22 (10.8%) | $19,792 |
| Average | 203 (100.0%) | $49,750 |
Occupancy by Householder Income Bracket in Liverpool
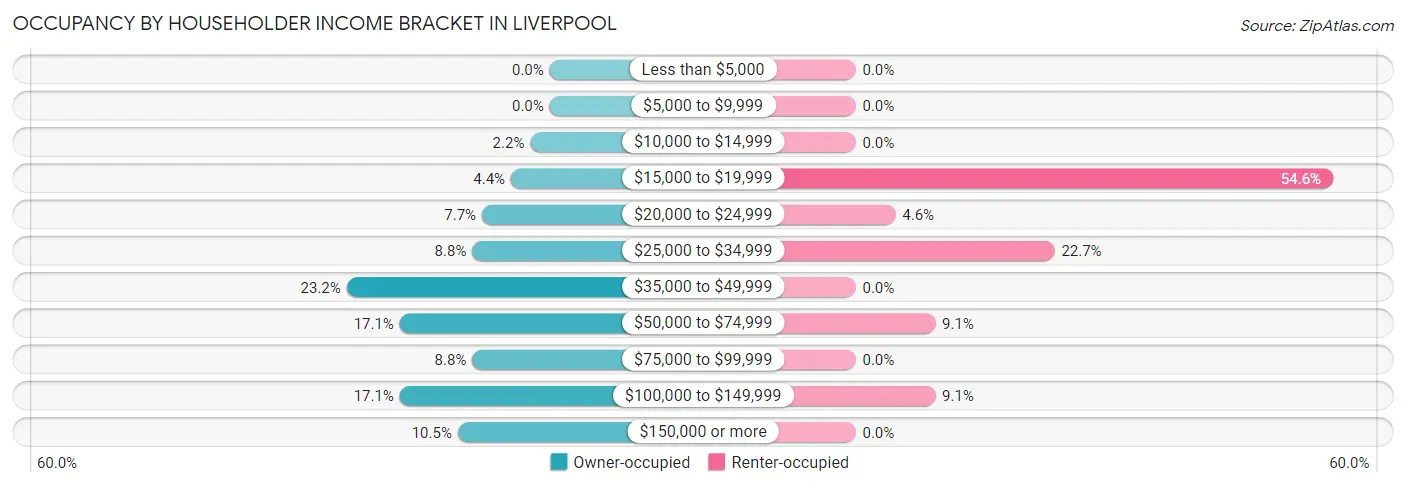
| Income Bracket | Owner-occupied | Renter-occupied |
| Less than $5,000 | 0 (0.0%) | 0 (0.0%) |
| $5,000 to $9,999 | 0 (0.0%) | 0 (0.0%) |
| $10,000 to $14,999 | 4 (2.2%) | 0 (0.0%) |
| $15,000 to $19,999 | 8 (4.4%) | 12 (54.5%) |
| $20,000 to $24,999 | 14 (7.7%) | 1 (4.5%) |
| $25,000 to $34,999 | 16 (8.8%) | 5 (22.7%) |
| $35,000 to $49,999 | 42 (23.2%) | 0 (0.0%) |
| $50,000 to $74,999 | 31 (17.1%) | 2 (9.1%) |
| $75,000 to $99,999 | 16 (8.8%) | 0 (0.0%) |
| $100,000 to $149,999 | 31 (17.1%) | 2 (9.1%) |
| $150,000 or more | 19 (10.5%) | 0 (0.0%) |
| Total | 181 (100.0%) | 22 (100.0%) |
Monthly Housing Cost Tiers in Liverpool
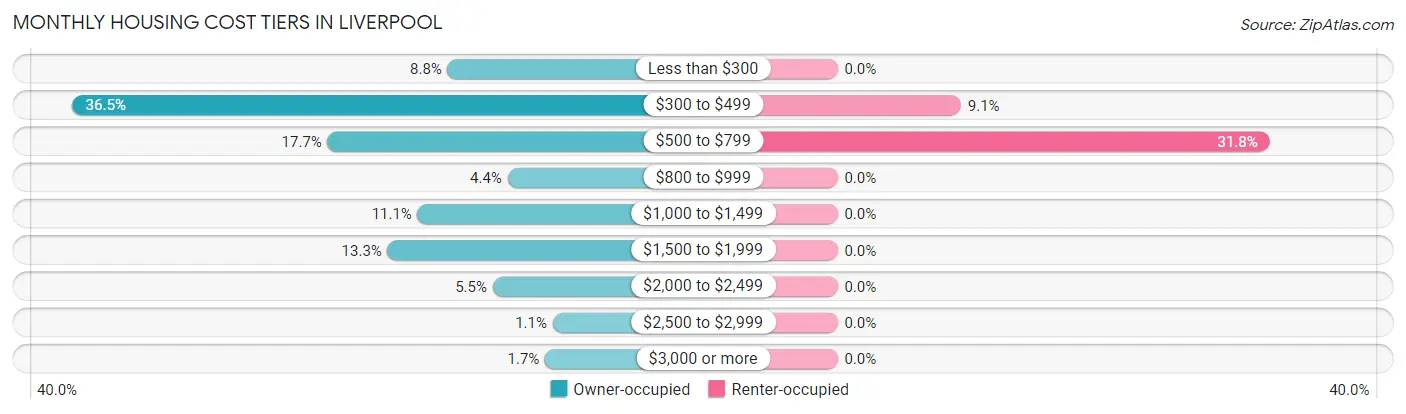
| Monthly Cost | Owner-occupied | Renter-occupied |
| Less than $300 | 16 (8.8%) | 0 (0.0%) |
| $300 to $499 | 66 (36.5%) | 2 (9.1%) |
| $500 to $799 | 32 (17.7%) | 7 (31.8%) |
| $800 to $999 | 8 (4.4%) | 0 (0.0%) |
| $1,000 to $1,499 | 20 (11.1%) | 0 (0.0%) |
| $1,500 to $1,999 | 24 (13.3%) | 0 (0.0%) |
| $2,000 to $2,499 | 10 (5.5%) | 0 (0.0%) |
| $2,500 to $2,999 | 2 (1.1%) | 0 (0.0%) |
| $3,000 or more | 3 (1.7%) | 0 (0.0%) |
| Total | 181 (100.0%) | 22 (100.0%) |
Physical Housing Characteristics in Liverpool
Housing Structures in Liverpool
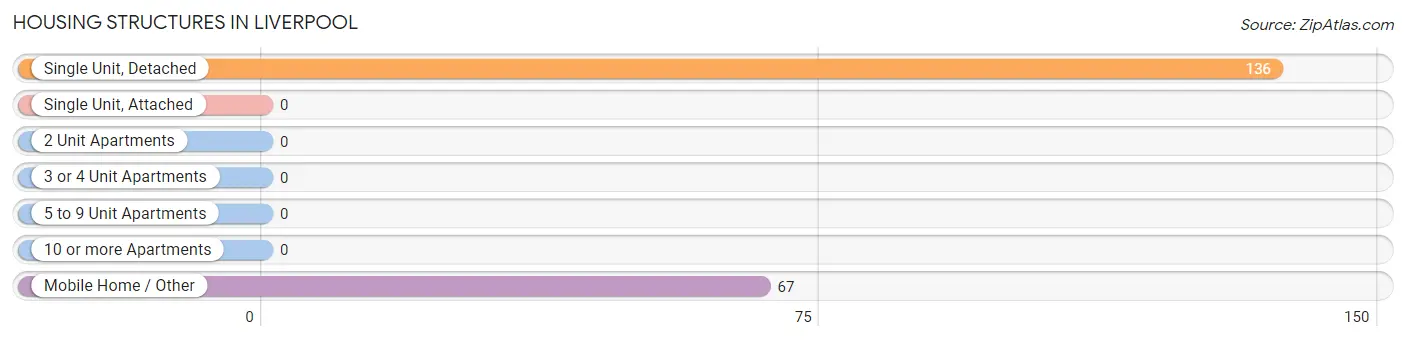
| Structure Type | # Housing Units | % Housing Units |
| Single Unit, Detached | 136 | 67.0% |
| Single Unit, Attached | 0 | 0.0% |
| 2 Unit Apartments | 0 | 0.0% |
| 3 or 4 Unit Apartments | 0 | 0.0% |
| 5 to 9 Unit Apartments | 0 | 0.0% |
| 10 or more Apartments | 0 | 0.0% |
| Mobile Home / Other | 67 | 33.0% |
| Total | 203 | 100.0% |
Housing Structures by Occupancy in Liverpool
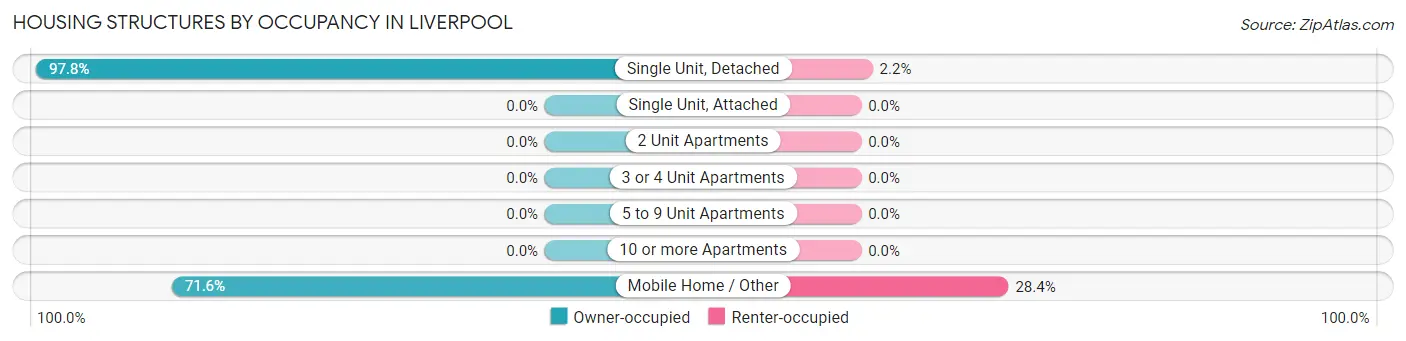
| Structure Type | Owner-occupied | Renter-occupied |
| Single Unit, Detached | 133 (97.8%) | 3 (2.2%) |
| Single Unit, Attached | 0 (0.0%) | 0 (0.0%) |
| 2 Unit Apartments | 0 (0.0%) | 0 (0.0%) |
| 3 or 4 Unit Apartments | 0 (0.0%) | 0 (0.0%) |
| 5 to 9 Unit Apartments | 0 (0.0%) | 0 (0.0%) |
| 10 or more Apartments | 0 (0.0%) | 0 (0.0%) |
| Mobile Home / Other | 48 (71.6%) | 19 (28.4%) |
| Total | 181 (89.2%) | 22 (10.8%) |
Housing Structures by Number of Rooms in Liverpool
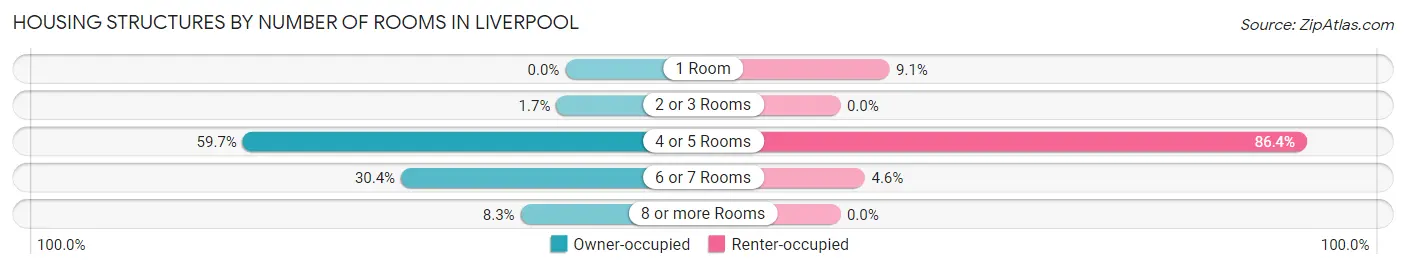
| Number of Rooms | Owner-occupied | Renter-occupied |
| 1 Room | 0 (0.0%) | 2 (9.1%) |
| 2 or 3 Rooms | 3 (1.7%) | 0 (0.0%) |
| 4 or 5 Rooms | 108 (59.7%) | 19 (86.4%) |
| 6 or 7 Rooms | 55 (30.4%) | 1 (4.5%) |
| 8 or more Rooms | 15 (8.3%) | 0 (0.0%) |
| Total | 181 (100.0%) | 22 (100.0%) |
Housing Structure by Heating Type in Liverpool
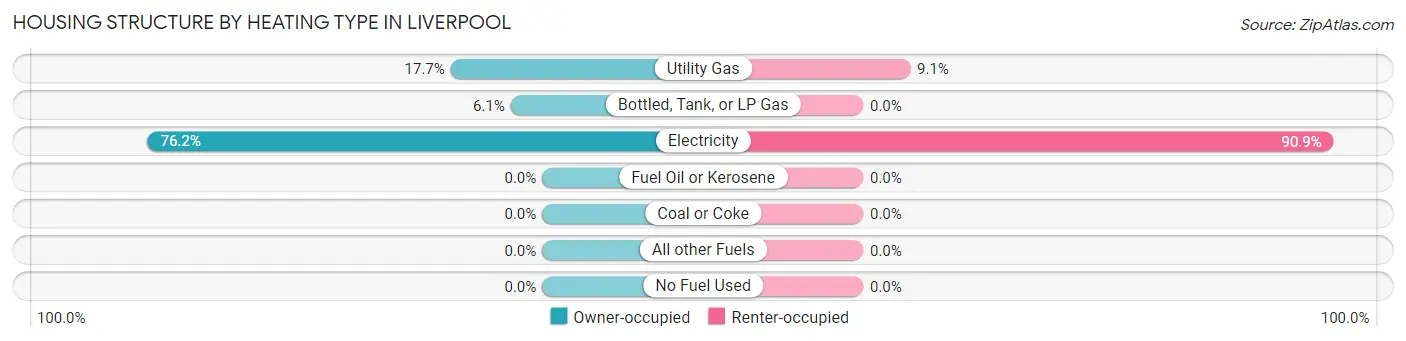
| Heating Type | Owner-occupied | Renter-occupied |
| Utility Gas | 32 (17.7%) | 2 (9.1%) |
| Bottled, Tank, or LP Gas | 11 (6.1%) | 0 (0.0%) |
| Electricity | 138 (76.2%) | 20 (90.9%) |
| Fuel Oil or Kerosene | 0 (0.0%) | 0 (0.0%) |
| Coal or Coke | 0 (0.0%) | 0 (0.0%) |
| All other Fuels | 0 (0.0%) | 0 (0.0%) |
| No Fuel Used | 0 (0.0%) | 0 (0.0%) |
| Total | 181 (100.0%) | 22 (100.0%) |
Household Vehicle Usage in Liverpool
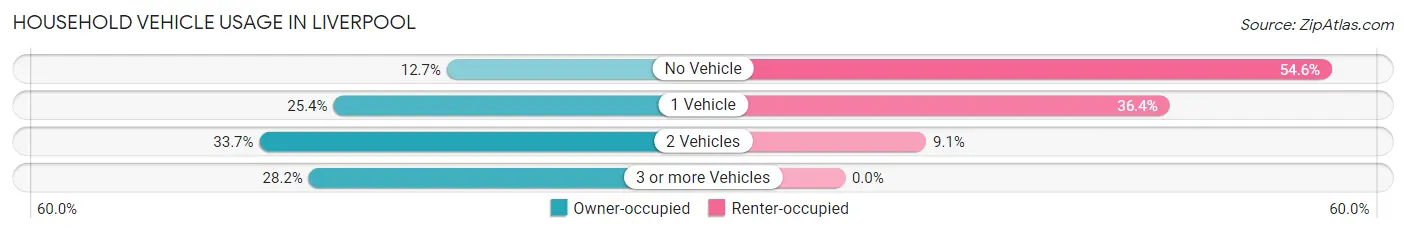
| Vehicles per Household | Owner-occupied | Renter-occupied |
| No Vehicle | 23 (12.7%) | 12 (54.5%) |
| 1 Vehicle | 46 (25.4%) | 8 (36.4%) |
| 2 Vehicles | 61 (33.7%) | 2 (9.1%) |
| 3 or more Vehicles | 51 (28.2%) | 0 (0.0%) |
| Total | 181 (100.0%) | 22 (100.0%) |
Real Estate & Mortgages in Liverpool
Real Estate and Mortgage Overview in Liverpool
| Characteristic | Without Mortgage | With Mortgage |
| Housing Units | 120 | 61 |
| Median Property Value | $112,500 | $227,500 |
| Median Household Income | $44,722 | $7 |
| Monthly Housing Costs | $400 | $3 |
| Real Estate Taxes | $1,383 | $0 |
Property Value by Mortgage Status in Liverpool
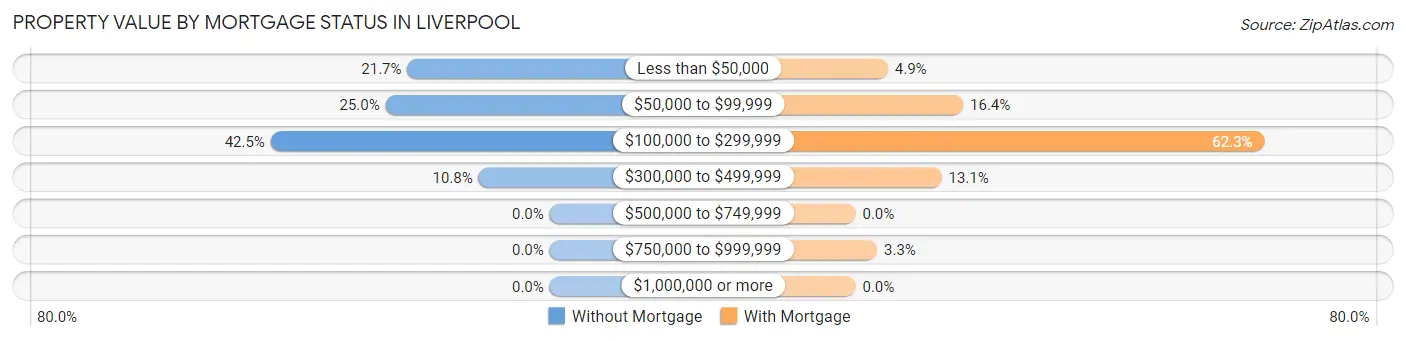
| Property Value | Without Mortgage | With Mortgage |
| Less than $50,000 | 26 (21.7%) | 3 (4.9%) |
| $50,000 to $99,999 | 30 (25.0%) | 10 (16.4%) |
| $100,000 to $299,999 | 51 (42.5%) | 38 (62.3%) |
| $300,000 to $499,999 | 13 (10.8%) | 8 (13.1%) |
| $500,000 to $749,999 | 0 (0.0%) | 0 (0.0%) |
| $750,000 to $999,999 | 0 (0.0%) | 2 (3.3%) |
| $1,000,000 or more | 0 (0.0%) | 0 (0.0%) |
| Total | 120 (100.0%) | 61 (100.0%) |
Household Income by Mortgage Status in Liverpool
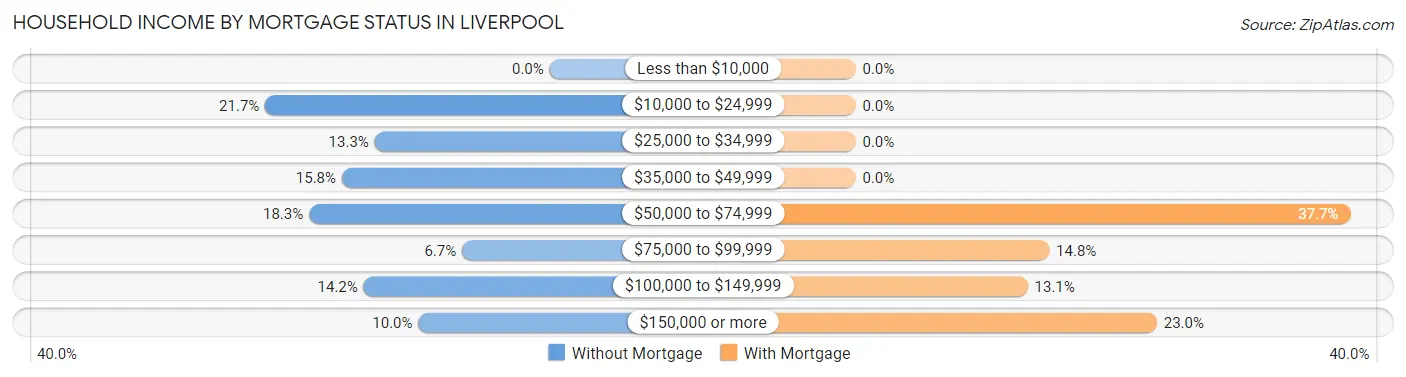
| Household Income | Without Mortgage | With Mortgage |
| Less than $10,000 | 0 (0.0%) | 0 (0.0%) |
| $10,000 to $24,999 | 26 (21.7%) | 0 (0.0%) |
| $25,000 to $34,999 | 16 (13.3%) | 0 (0.0%) |
| $35,000 to $49,999 | 19 (15.8%) | 0 (0.0%) |
| $50,000 to $74,999 | 22 (18.3%) | 23 (37.7%) |
| $75,000 to $99,999 | 8 (6.7%) | 9 (14.7%) |
| $100,000 to $149,999 | 17 (14.2%) | 8 (13.1%) |
| $150,000 or more | 12 (10.0%) | 14 (23.0%) |
| Total | 120 (100.0%) | 61 (100.0%) |
Property Value to Household Income Ratio in Liverpool
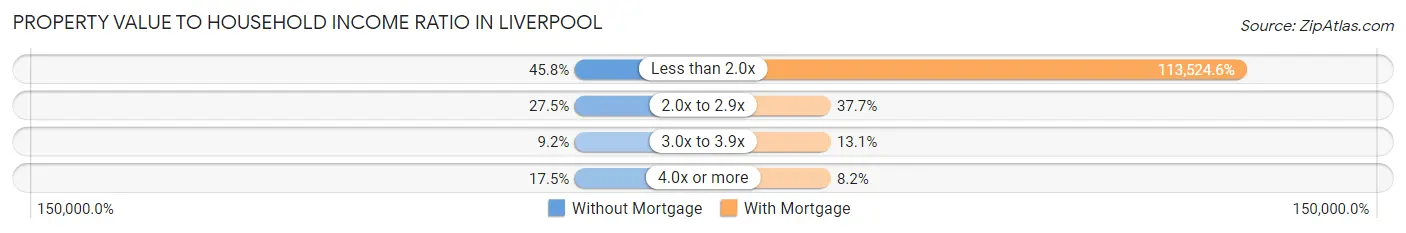
| Value-to-Income Ratio | Without Mortgage | With Mortgage |
| Less than 2.0x | 55 (45.8%) | 69,250 (113,524.6%) |
| 2.0x to 2.9x | 33 (27.5%) | 23 (37.7%) |
| 3.0x to 3.9x | 11 (9.2%) | 8 (13.1%) |
| 4.0x or more | 21 (17.5%) | 5 (8.2%) |
| Total | 120 (100.0%) | 61 (100.0%) |
Real Estate Taxes by Mortgage Status in Liverpool
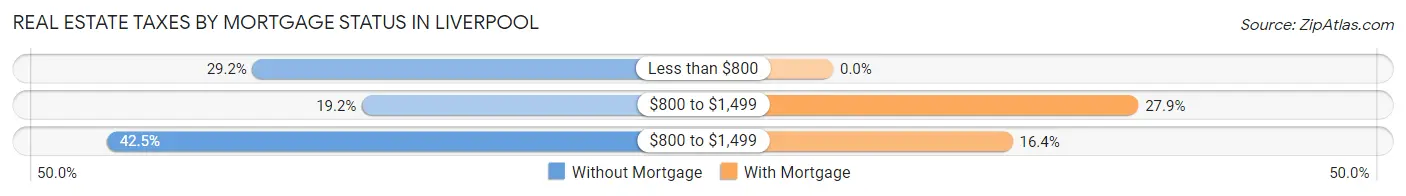
| Property Taxes | Without Mortgage | With Mortgage |
| Less than $800 | 35 (29.2%) | 0 (0.0%) |
| $800 to $1,499 | 23 (19.2%) | 17 (27.9%) |
| $800 to $1,499 | 51 (42.5%) | 10 (16.4%) |
| Total | 120 (100.0%) | 61 (100.0%) |
Health & Disability in Liverpool
Health Insurance Coverage by Age in Liverpool
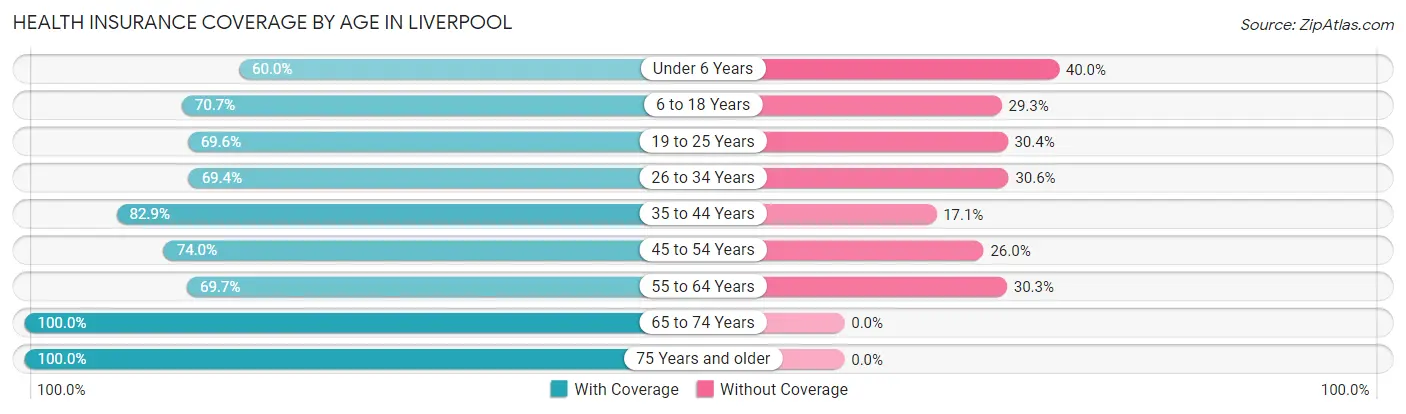
| Age Bracket | With Coverage | Without Coverage |
| Under 6 Years | 12 (60.0%) | 8 (40.0%) |
| 6 to 18 Years | 53 (70.7%) | 22 (29.3%) |
| 19 to 25 Years | 32 (69.6%) | 14 (30.4%) |
| 26 to 34 Years | 34 (69.4%) | 15 (30.6%) |
| 35 to 44 Years | 29 (82.9%) | 6 (17.1%) |
| 45 to 54 Years | 77 (74.0%) | 27 (26.0%) |
| 55 to 64 Years | 46 (69.7%) | 20 (30.3%) |
| 65 to 74 Years | 62 (100.0%) | 0 (0.0%) |
| 75 Years and older | 19 (100.0%) | 0 (0.0%) |
| Total | 364 (76.5%) | 112 (23.5%) |
Health Insurance Coverage by Citizenship Status in Liverpool
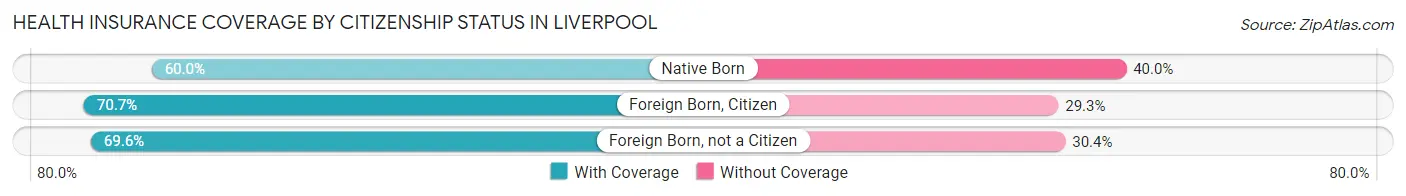
| Citizenship Status | With Coverage | Without Coverage |
| Native Born | 12 (60.0%) | 8 (40.0%) |
| Foreign Born, Citizen | 53 (70.7%) | 22 (29.3%) |
| Foreign Born, not a Citizen | 32 (69.6%) | 14 (30.4%) |
Health Insurance Coverage by Household Income in Liverpool
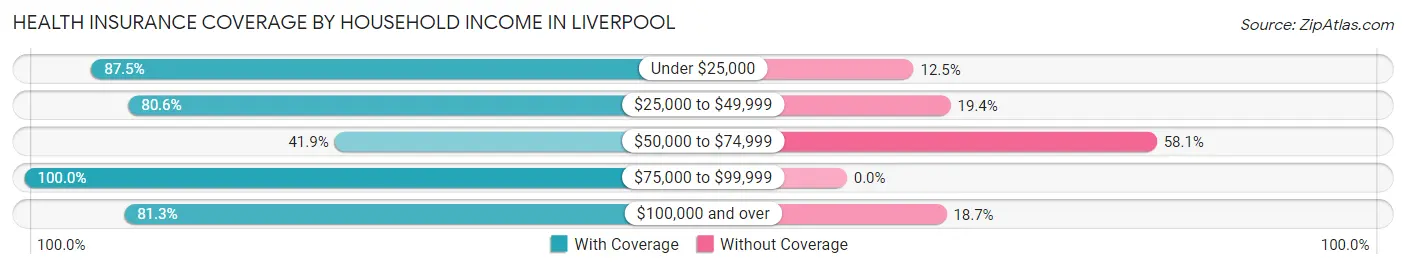
| Household Income | With Coverage | Without Coverage |
| Under $25,000 | 42 (87.5%) | 6 (12.5%) |
| $25,000 to $49,999 | 87 (80.6%) | 21 (19.4%) |
| $50,000 to $74,999 | 39 (41.9%) | 54 (58.1%) |
| $75,000 to $99,999 | 61 (100.0%) | 0 (0.0%) |
| $100,000 and over | 135 (81.3%) | 31 (18.7%) |
Public vs Private Health Insurance Coverage by Age in Liverpool
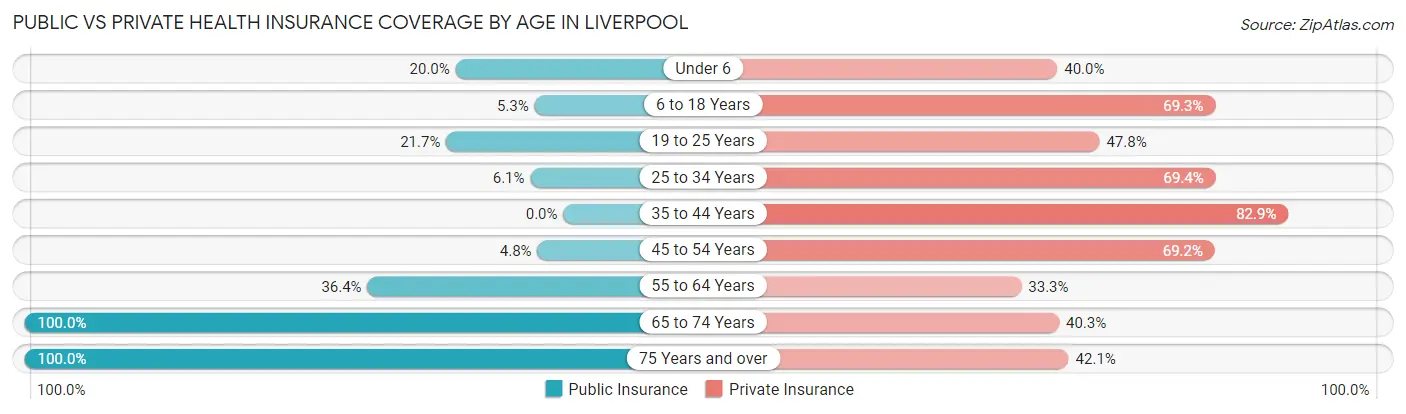
| Age Bracket | Public Insurance | Private Insurance |
| Under 6 | 4 (20.0%) | 8 (40.0%) |
| 6 to 18 Years | 4 (5.3%) | 52 (69.3%) |
| 19 to 25 Years | 10 (21.7%) | 22 (47.8%) |
| 25 to 34 Years | 3 (6.1%) | 34 (69.4%) |
| 35 to 44 Years | 0 (0.0%) | 29 (82.9%) |
| 45 to 54 Years | 5 (4.8%) | 72 (69.2%) |
| 55 to 64 Years | 24 (36.4%) | 22 (33.3%) |
| 65 to 74 Years | 62 (100.0%) | 25 (40.3%) |
| 75 Years and over | 19 (100.0%) | 8 (42.1%) |
| Total | 131 (27.5%) | 272 (57.1%) |
Disability Status by Sex by Age in Liverpool
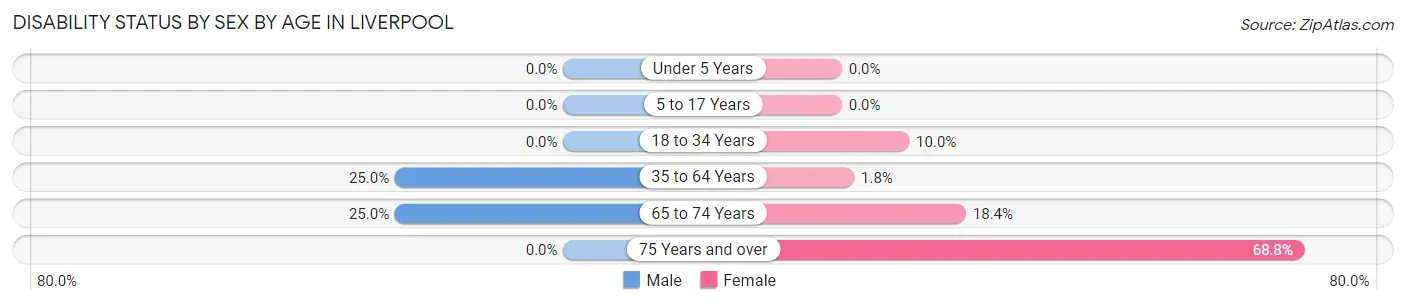
| Age Bracket | Male | Female |
| Under 5 Years | 0 (0.0%) | 0 (0.0%) |
| 5 to 17 Years | 0 (0.0%) | 0 (0.0%) |
| 18 to 34 Years | 0 (0.0%) | 6 (10.0%) |
| 35 to 64 Years | 24 (25.0%) | 2 (1.8%) |
| 65 to 74 Years | 6 (25.0%) | 7 (18.4%) |
| 75 Years and over | 0 (0.0%) | 11 (68.8%) |
Disability Class by Sex by Age in Liverpool
Disability Class: Hearing Difficulty
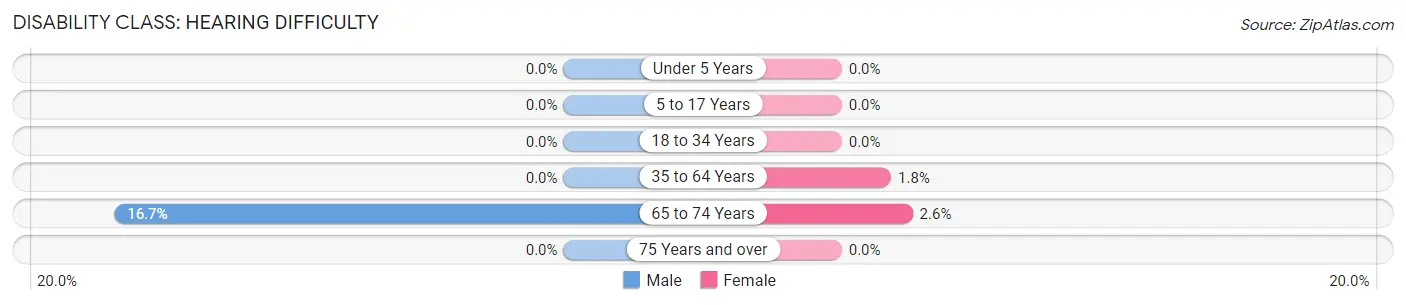
| Age Bracket | Male | Female |
| Under 5 Years | 0 (0.0%) | 0 (0.0%) |
| 5 to 17 Years | 0 (0.0%) | 0 (0.0%) |
| 18 to 34 Years | 0 (0.0%) | 0 (0.0%) |
| 35 to 64 Years | 0 (0.0%) | 2 (1.8%) |
| 65 to 74 Years | 4 (16.7%) | 1 (2.6%) |
| 75 Years and over | 0 (0.0%) | 0 (0.0%) |
Disability Class: Vision Difficulty
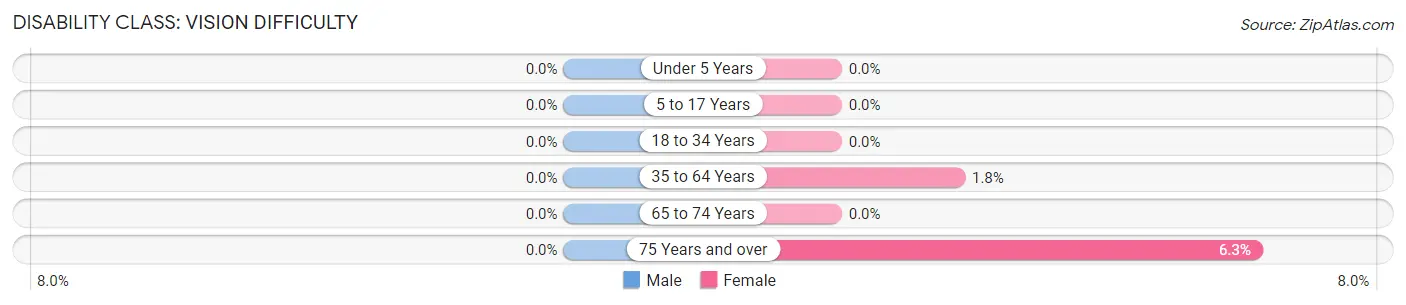
| Age Bracket | Male | Female |
| Under 5 Years | 0 (0.0%) | 0 (0.0%) |
| 5 to 17 Years | 0 (0.0%) | 0 (0.0%) |
| 18 to 34 Years | 0 (0.0%) | 0 (0.0%) |
| 35 to 64 Years | 0 (0.0%) | 2 (1.8%) |
| 65 to 74 Years | 0 (0.0%) | 0 (0.0%) |
| 75 Years and over | 0 (0.0%) | 1 (6.2%) |
Disability Class: Cognitive Difficulty
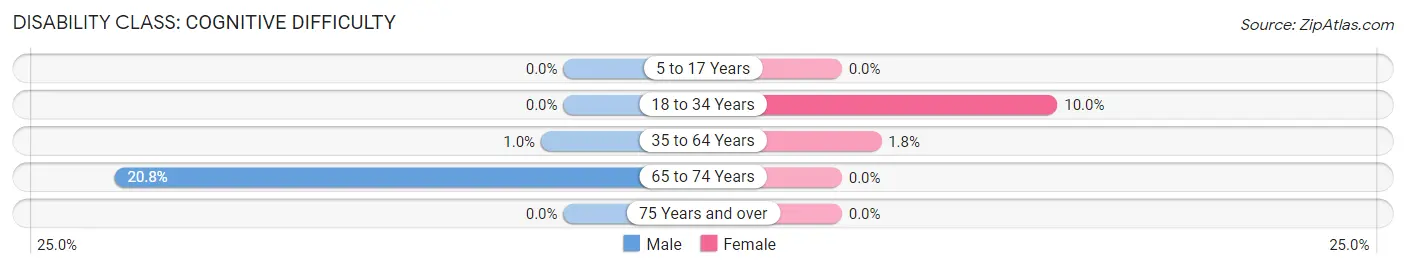
| Age Bracket | Male | Female |
| 5 to 17 Years | 0 (0.0%) | 0 (0.0%) |
| 18 to 34 Years | 0 (0.0%) | 6 (10.0%) |
| 35 to 64 Years | 1 (1.0%) | 2 (1.8%) |
| 65 to 74 Years | 5 (20.8%) | 0 (0.0%) |
| 75 Years and over | 0 (0.0%) | 0 (0.0%) |
Disability Class: Ambulatory Difficulty
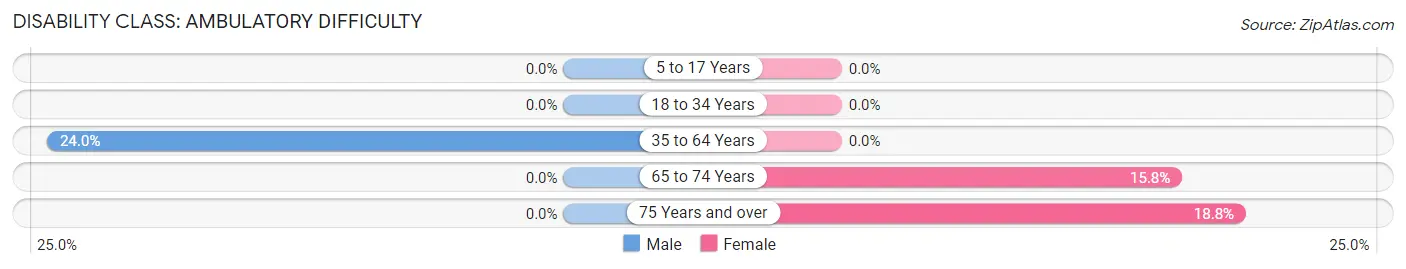
| Age Bracket | Male | Female |
| 5 to 17 Years | 0 (0.0%) | 0 (0.0%) |
| 18 to 34 Years | 0 (0.0%) | 0 (0.0%) |
| 35 to 64 Years | 23 (24.0%) | 0 (0.0%) |
| 65 to 74 Years | 0 (0.0%) | 6 (15.8%) |
| 75 Years and over | 0 (0.0%) | 3 (18.8%) |
Disability Class: Self-Care Difficulty
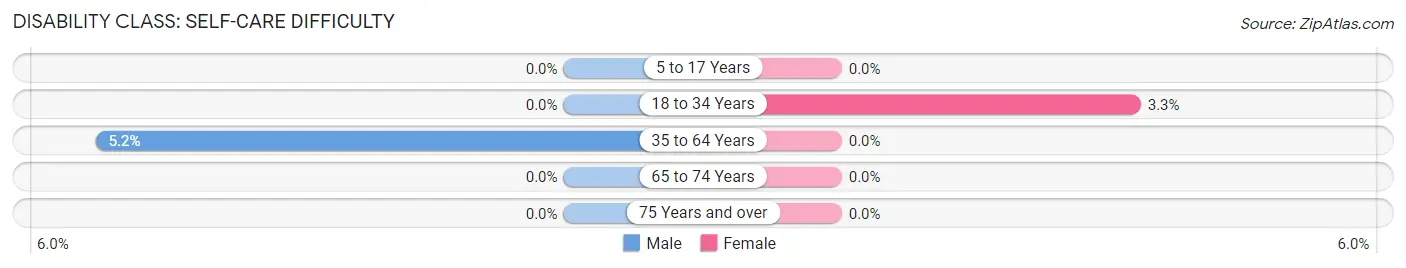
| Age Bracket | Male | Female |
| 5 to 17 Years | 0 (0.0%) | 0 (0.0%) |
| 18 to 34 Years | 0 (0.0%) | 2 (3.3%) |
| 35 to 64 Years | 5 (5.2%) | 0 (0.0%) |
| 65 to 74 Years | 0 (0.0%) | 0 (0.0%) |
| 75 Years and over | 0 (0.0%) | 0 (0.0%) |
Technology Access in Liverpool
Computing Device Access in Liverpool
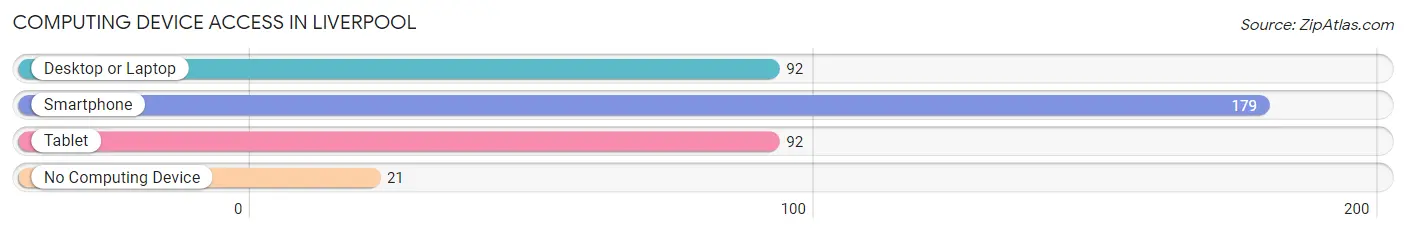
| Device Type | # Households | % Households |
| Desktop or Laptop | 92 | 45.3% |
| Smartphone | 179 | 88.2% |
| Tablet | 92 | 45.3% |
| No Computing Device | 21 | 10.3% |
| Total | 203 | 100.0% |
Internet Access in Liverpool
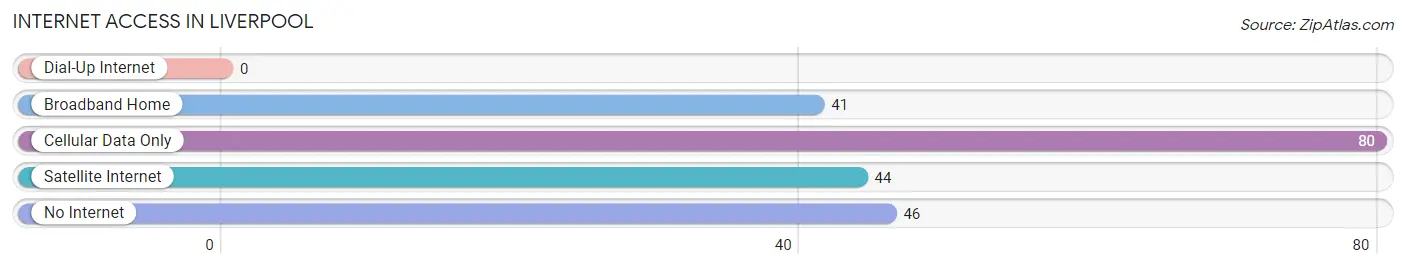
| Internet Type | # Households | % Households |
| Dial-Up Internet | 0 | 0.0% |
| Broadband Home | 41 | 20.2% |
| Cellular Data Only | 80 | 39.4% |
| Satellite Internet | 44 | 21.7% |
| No Internet | 46 | 22.7% |
| Total | 203 | 100.0% |
Liverpool Summary
Liverpool is a small city located in the southeastern part of Harris County, Texas. It is part of the Houston-The Woodlands-Sugar Land metropolitan area and is situated about 25 miles southeast of downtown Houston. The city was founded in 1876 and was named after the city of Liverpool in England. Liverpool is a diverse community with a population of approximately 4,000 people.
Geography
Liverpool is located in the southeastern part of Harris County, Texas. It is situated about 25 miles southeast of downtown Houston. The city is bordered by the cities of Pasadena, Deer Park, and La Porte. The city is located on the banks of the San Jacinto River and is surrounded by a number of small lakes and ponds. The city has a total area of 2.2 square miles, all of which is land.
Climate
Liverpool has a humid subtropical climate, with hot summers and mild winters. The average annual temperature is around 70 degrees Fahrenheit. The average annual precipitation is around 50 inches.
Demographics
As of the 2010 census, the population of Liverpool was 4,092. The racial makeup of the city was 68.3% White, 16.2% African American, 0.7% Native American, 0.7% Asian, 0.1% Pacific Islander, 11.2% from other races, and 2.9% from two or more races. Hispanic or Latino of any race were 24.3% of the population.
Economy
Liverpool’s economy is largely based on the oil and gas industry. The city is home to several oil and gas companies, including Chevron, Shell, and ExxonMobil. The city is also home to a number of manufacturing companies, including a steel mill and a paper mill. The city is also home to a number of retail stores, restaurants, and other businesses.
History
Liverpool was founded in 1876 by a group of settlers from England. The city was named after the city of Liverpool in England. The city was originally a farming community, but it soon became a center for the oil and gas industry. The city was incorporated in 1911.
In the 1950s, the city experienced a period of growth and development. The city was home to a number of oil and gas companies, as well as a steel mill and a paper mill. The city also experienced a population boom, with the population increasing from 1,000 in 1950 to 4,000 in 2000.
In recent years, the city has experienced a decline in population, with the population decreasing to 3,800 in 2010. Despite this, the city is still a vibrant and diverse community. The city is home to a number of businesses, including oil and gas companies, manufacturing companies, and retail stores. The city is also home to a number of parks and recreational facilities.
Common Questions
What is Per Capita Income in Liverpool?
Per Capita income in Liverpool is $37,057.
What is the Median Family Income in Liverpool?
Median Family Income in Liverpool is $68,500.
What is the Median Household income in Liverpool?
Median Household Income in Liverpool is $49,750.
What is Income or Wage Gap in Liverpool?
Income or Wage Gap in Liverpool is 38.1%.
Women in Liverpool earn 61.9 cents for every dollar earned by a man.
What is Inequality or Gini Index in Liverpool?
Inequality or Gini Index in Liverpool is 0.50.
What is the Total Population of Liverpool?
Total Population of Liverpool is 476.
What is the Total Male Population of Liverpool?
Total Male Population of Liverpool is 236.
What is the Total Female Population of Liverpool?
Total Female Population of Liverpool is 240.
What is the Ratio of Males per 100 Females in Liverpool?
There are 98.33 Males per 100 Females in Liverpool.
What is the Ratio of Females per 100 Males in Liverpool?
There are 101.69 Females per 100 Males in Liverpool.
What is the Median Population Age in Liverpool?
Median Population Age in Liverpool is 45.7 Years.
What is the Average Family Size in Liverpool
Average Family Size in Liverpool is 3.2 People.
What is the Average Household Size in Liverpool
Average Household Size in Liverpool is 2.3 People.
How Large is the Labor Force in Liverpool?
There are 242 People in the Labor Forcein in Liverpool.
What is the Percentage of People in the Labor Force in Liverpool?
57.5% of People are in the Labor Force in Liverpool.
What is the Unemployment Rate in Liverpool?
Unemployment Rate in Liverpool is 8.7%.