Liberty, TX Map & Demographics
Liberty Map
Liberty Overview
$29,250
PER CAPITA INCOME
$78,590
AVG FAMILY INCOME
$57,962
AVG HOUSEHOLD INCOME
50.4%
WAGE / INCOME GAP [ % ]
49.6¢/ $1
WAGE / INCOME GAP [ $ ]
0.51
INEQUALITY / GINI INDEX
8,348
TOTAL POPULATION
3,741
MALE POPULATION
4,607
FEMALE POPULATION
81.20
MALES / 100 FEMALES
123.15
FEMALES / 100 MALES
39.0
MEDIAN AGE
3.5
AVG FAMILY SIZE
2.7
AVG HOUSEHOLD SIZE
3,073
LABOR FORCE [ PEOPLE ]
48.1%
PERCENT IN LABOR FORCE
7.1%
UNEMPLOYMENT RATE
Liberty Zip Codes
Liberty Area Codes
Income in Liberty
Income Overview in Liberty
Per Capita Income in Liberty is $29,250, while median incomes of families and households are $78,590 and $57,962 respectively.
| Characteristic | Number | Measure |
| Per Capita Income | 8,348 | $29,250 |
| Median Family Income | 1,855 | $78,590 |
| Mean Family Income | 1,855 | $109,379 |
| Median Household Income | 2,884 | $57,962 |
| Mean Household Income | 2,884 | $82,157 |
| Income Deficit | 1,855 | $0 |
| Wage / Income Gap (%) | 8,348 | 50.39% |
| Wage / Income Gap ($) | 8,348 | 49.61¢ per $1 |
| Gini / Inequality Index | 8,348 | 0.51 |
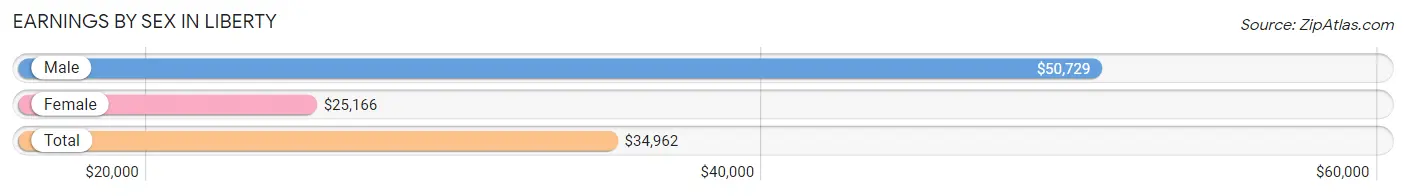
Earnings by Sex in Liberty
Average Earnings in Liberty are $34,962, $50,729 for men and $25,166 for women, a difference of 50.4%.
| Sex | Number | Average Earnings |
| Male | 1,786 (55.8%) | $50,729 |
| Female | 1,413 (44.2%) | $25,166 |
| Total | 3,199 (100.0%) | $34,962 |
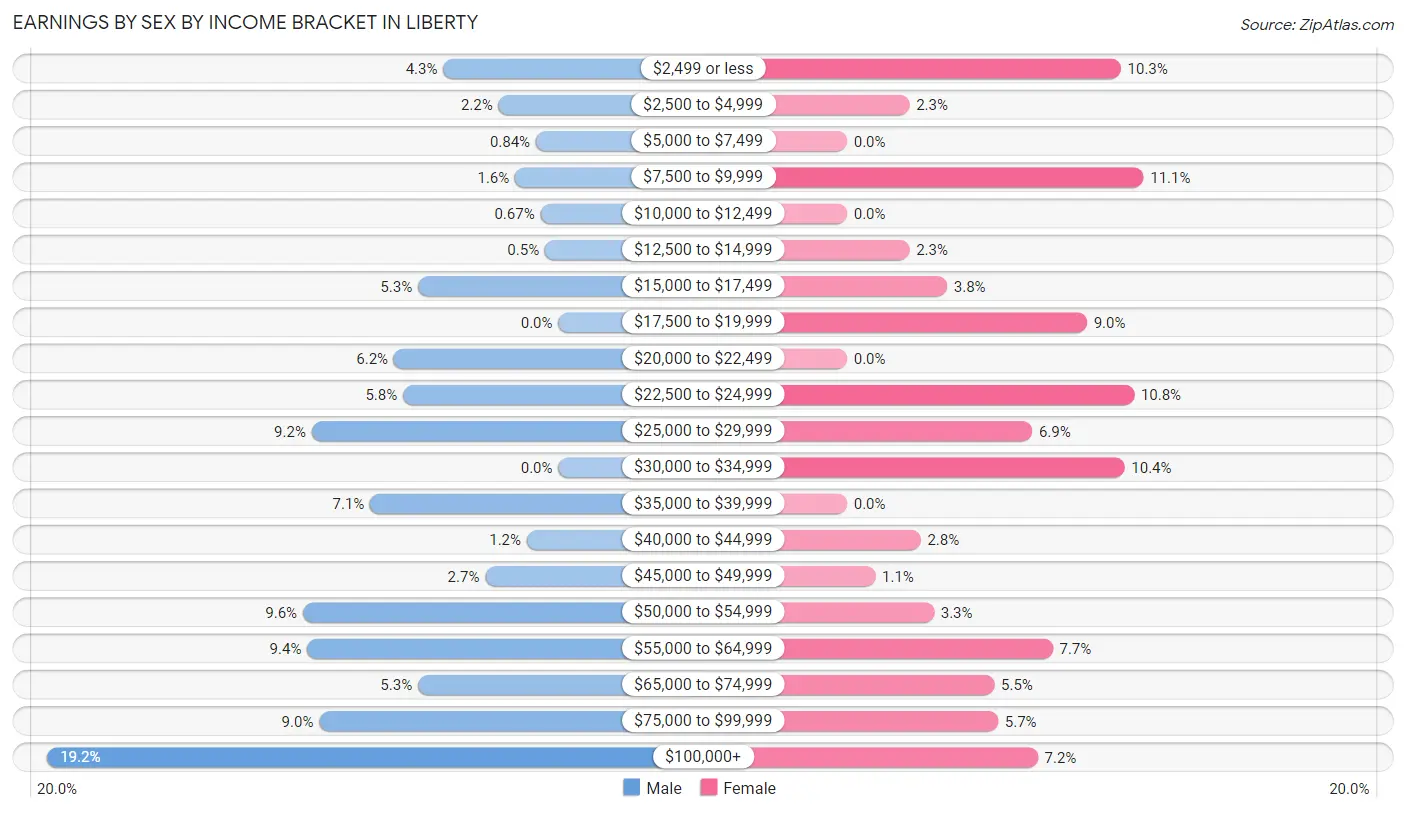
Earnings by Sex by Income Bracket in Liberty
The most common earnings brackets in Liberty are $100,000+ for men (342 | 19.2%) and $7,500 to $9,999 for women (157 | 11.1%).
| Income | Male | Female |
| $2,499 or less | 77 (4.3%) | 145 (10.3%) |
| $2,500 to $4,999 | 40 (2.2%) | 33 (2.3%) |
| $5,000 to $7,499 | 15 (0.8%) | 0 (0.0%) |
| $7,500 to $9,999 | 29 (1.6%) | 157 (11.1%) |
| $10,000 to $12,499 | 12 (0.7%) | 0 (0.0%) |
| $12,500 to $14,999 | 9 (0.5%) | 33 (2.3%) |
| $15,000 to $17,499 | 94 (5.3%) | 53 (3.7%) |
| $17,500 to $19,999 | 0 (0.0%) | 127 (9.0%) |
| $20,000 to $22,499 | 110 (6.2%) | 0 (0.0%) |
| $22,500 to $24,999 | 104 (5.8%) | 152 (10.8%) |
| $25,000 to $29,999 | 165 (9.2%) | 98 (6.9%) |
| $30,000 to $34,999 | 0 (0.0%) | 147 (10.4%) |
| $35,000 to $39,999 | 126 (7.0%) | 0 (0.0%) |
| $40,000 to $44,999 | 21 (1.2%) | 39 (2.8%) |
| $45,000 to $49,999 | 49 (2.7%) | 15 (1.1%) |
| $50,000 to $54,999 | 171 (9.6%) | 46 (3.3%) |
| $55,000 to $64,999 | 168 (9.4%) | 109 (7.7%) |
| $65,000 to $74,999 | 94 (5.3%) | 78 (5.5%) |
| $75,000 to $99,999 | 160 (9.0%) | 80 (5.7%) |
| $100,000+ | 342 (19.2%) | 101 (7.1%) |
| Total | 1,786 (100.0%) | 1,413 (100.0%) |
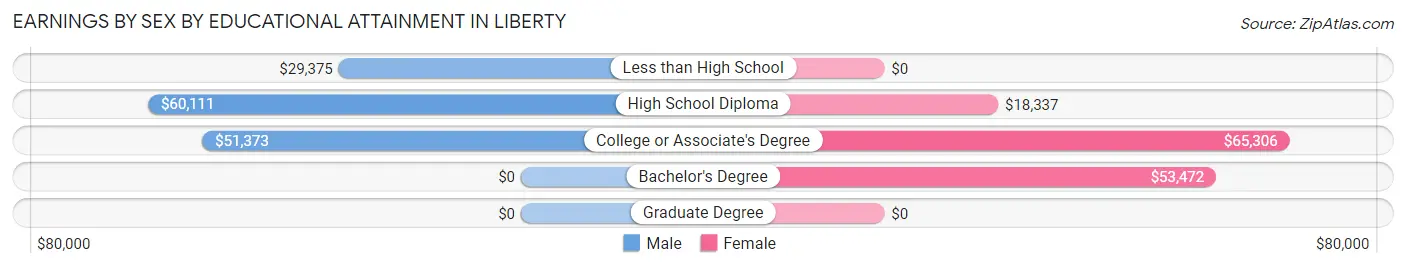
Earnings by Sex by Educational Attainment in Liberty
Average earnings in Liberty are $51,788 for men and $24,433 for women, a difference of 52.8%. Men with an educational attainment of high school diploma enjoy the highest average annual earnings of $60,111, while those with less than high school education earn the least with $29,375. Women with an educational attainment of college or associate's degree earn the most with the average annual earnings of $65,306, while those with high school diploma education have the smallest earnings of $18,337.
| Educational Attainment | Male Income | Female Income |
| Less than High School | $29,375 | $0 |
| High School Diploma | $60,111 | $18,337 |
| College or Associate's Degree | $51,373 | $65,306 |
| Bachelor's Degree | - | - |
| Graduate Degree | - | - |
| Total | $51,788 | $24,433 |
Family Income in Liberty
Family Income Brackets in Liberty
According to the Liberty family income data, there are 436 families falling into the $100,000 to $149,999 income range, which is the most common income bracket and makes up 23.5% of all families.
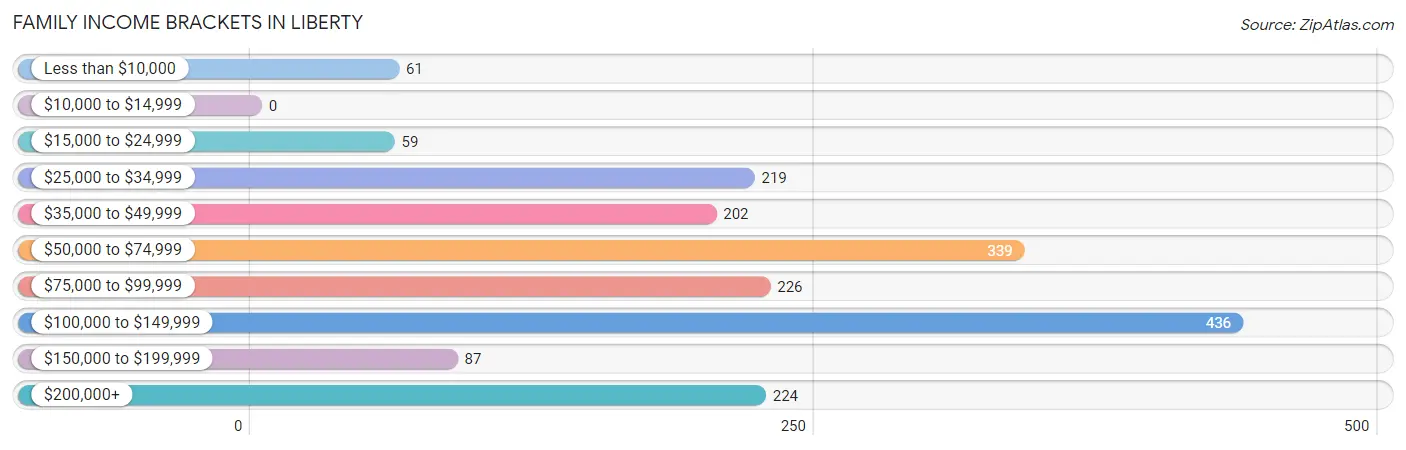
| Income Bracket | # Families | % Families |
| Less than $10,000 | 61 | 3.3% |
| $10,000 to $14,999 | 0 | 0.0% |
| $15,000 to $24,999 | 59 | 3.2% |
| $25,000 to $34,999 | 219 | 11.8% |
| $35,000 to $49,999 | 202 | 10.9% |
| $50,000 to $74,999 | 339 | 18.3% |
| $75,000 to $99,999 | 226 | 12.2% |
| $100,000 to $149,999 | 436 | 23.5% |
| $150,000 to $199,999 | 87 | 4.7% |
| $200,000+ | 224 | 12.1% |
Family Income by Famaliy Size in Liberty
3-person families (279 | 15.0%) account for the highest median family income in Liberty with $135,656 per family, while 3-person families (279 | 15.0%) have the highest median income of $45,219 per family member.
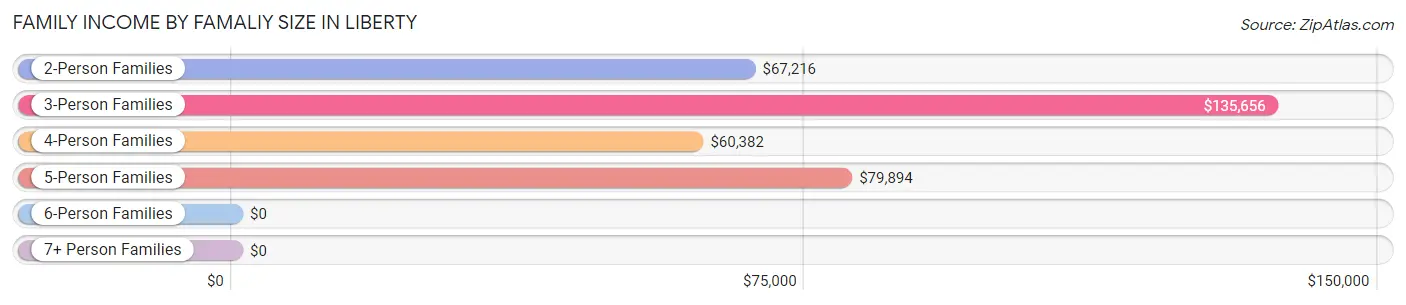
| Income Bracket | # Families | Median Income |
| 2-Person Families | 925 (49.9%) | $67,216 |
| 3-Person Families | 279 (15.0%) | $135,656 |
| 4-Person Families | 392 (21.1%) | $60,382 |
| 5-Person Families | 214 (11.5%) | $79,894 |
| 6-Person Families | 45 (2.4%) | $0 |
| 7+ Person Families | 0 (0.0%) | $0 |
| Total | 1,855 (100.0%) | $78,590 |
Family Income by Number of Earners in Liberty
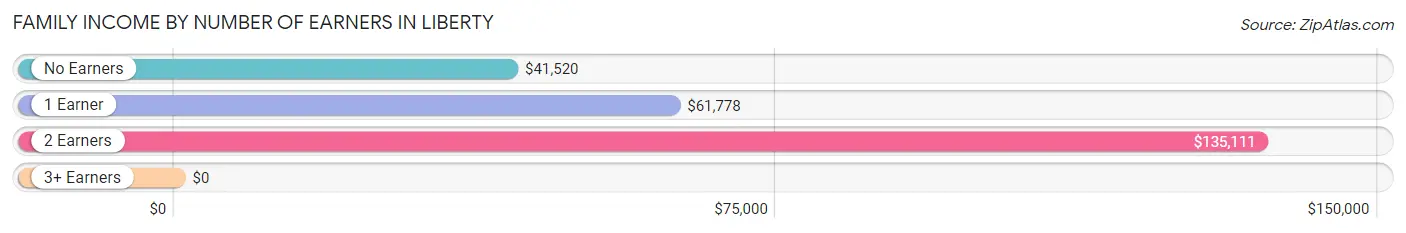
| Number of Earners | # Families | Median Income |
| No Earners | 506 (27.3%) | $41,520 |
| 1 Earner | 612 (33.0%) | $61,778 |
| 2 Earners | 635 (34.2%) | $135,111 |
| 3+ Earners | 102 (5.5%) | $0 |
| Total | 1,855 (100.0%) | $78,590 |
Household Income in Liberty
Household Income Brackets in Liberty
With 485 households falling in the category, the $50,000 to $74,999 income range is the most frequent in Liberty, accounting for 16.8% of all households. In contrast, only 89 households (3.1%) fall into the $150,000 to $199,999 income bracket, making it the least populous group.
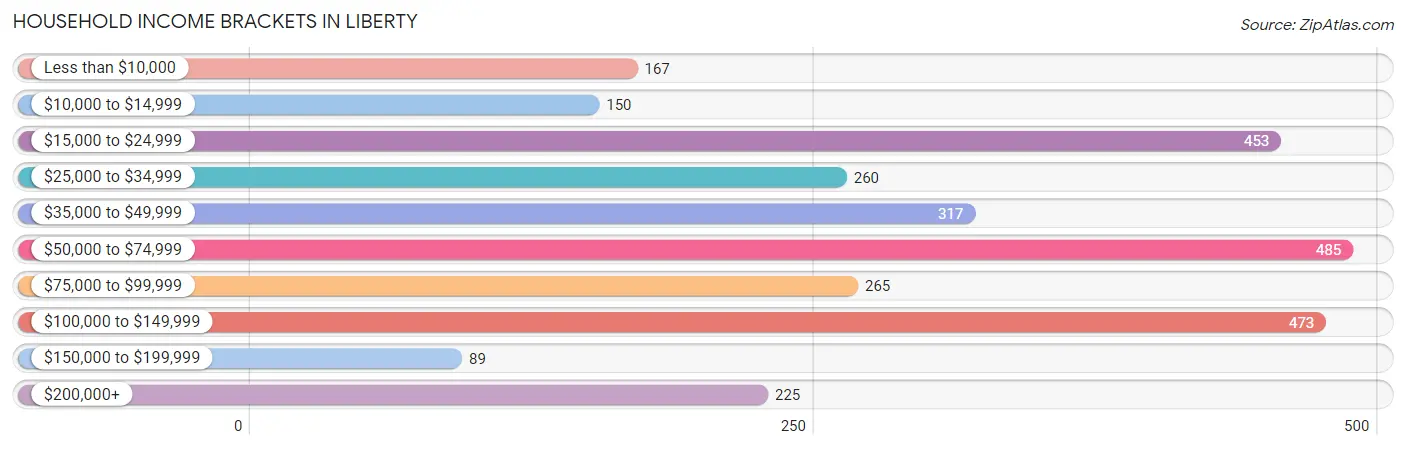
| Income Bracket | # Households | % Households |
| Less than $10,000 | 167 | 5.8% |
| $10,000 to $14,999 | 150 | 5.2% |
| $15,000 to $24,999 | 453 | 15.7% |
| $25,000 to $34,999 | 260 | 9.0% |
| $35,000 to $49,999 | 317 | 11.0% |
| $50,000 to $74,999 | 485 | 16.8% |
| $75,000 to $99,999 | 265 | 9.2% |
| $100,000 to $149,999 | 473 | 16.4% |
| $150,000 to $199,999 | 89 | 3.1% |
| $200,000+ | 225 | 7.8% |
Household Income by Householder Age in Liberty
The median household income in Liberty is $57,962, with the highest median household income of $78,324 found in the 25 to 44 years age bracket for the primary householder. A total of 953 households (33.0%) fall into this category. Meanwhile, the 65+ years age bracket for the primary householder has the lowest median household income of $42,257, with 906 households (31.4%) in this group.
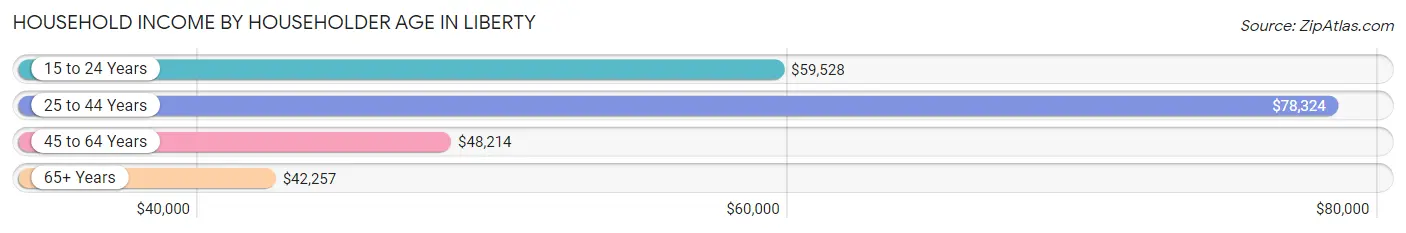
| Income Bracket | # Households | Median Income |
| 15 to 24 Years | 191 (6.6%) | $59,528 |
| 25 to 44 Years | 953 (33.0%) | $78,324 |
| 45 to 64 Years | 834 (28.9%) | $48,214 |
| 65+ Years | 906 (31.4%) | $42,257 |
| Total | 2,884 (100.0%) | $57,962 |
Poverty in Liberty
Income Below Poverty by Sex and Age in Liberty
With 11.8% poverty level for males and 21.3% for females among the residents of Liberty, 5 year old males and under 5 year old females are the most vulnerable to poverty, with 93 males (64.6%) and 311 females (69.6%) in their respective age groups living below the poverty level.
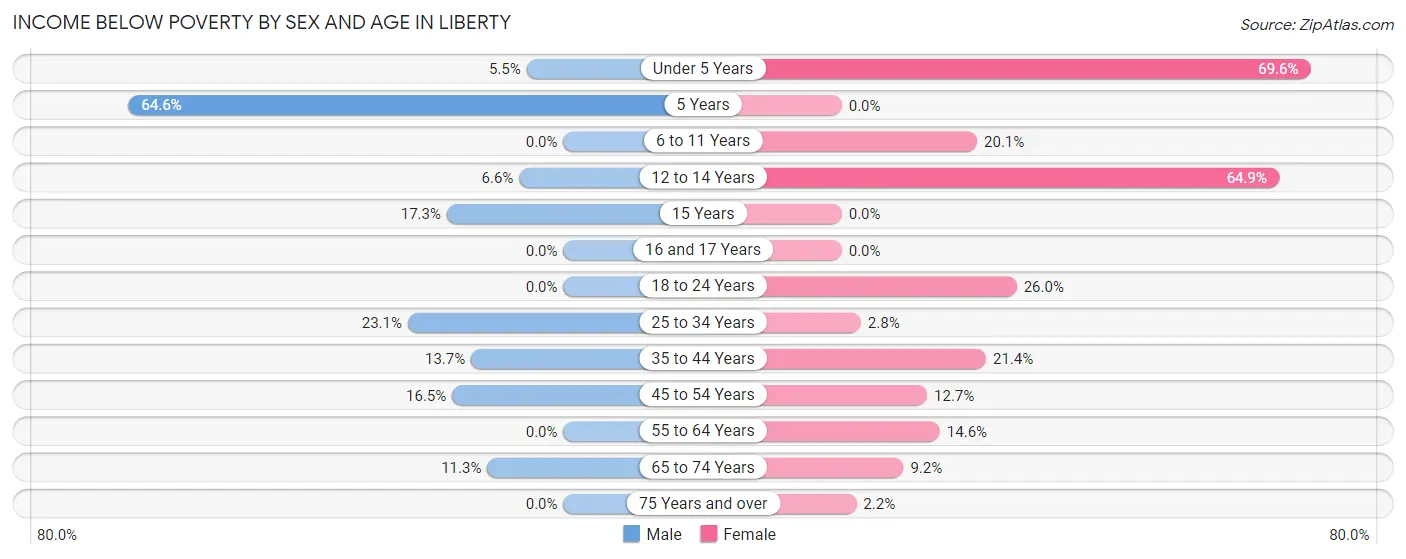
| Age Bracket | Male | Female |
| Under 5 Years | 16 (5.5%) | 311 (69.6%) |
| 5 Years | 93 (64.6%) | 0 (0.0%) |
| 6 to 11 Years | 0 (0.0%) | 90 (20.1%) |
| 12 to 14 Years | 12 (6.6%) | 109 (64.9%) |
| 15 Years | 18 (17.3%) | 0 (0.0%) |
| 16 and 17 Years | 0 (0.0%) | 0 (0.0%) |
| 18 to 24 Years | 0 (0.0%) | 126 (26.0%) |
| 25 to 34 Years | 76 (23.1%) | 12 (2.8%) |
| 35 to 44 Years | 99 (13.7%) | 142 (21.4%) |
| 45 to 54 Years | 55 (16.5%) | 66 (12.7%) |
| 55 to 64 Years | 0 (0.0%) | 29 (14.6%) |
| 65 to 74 Years | 33 (11.3%) | 37 (9.2%) |
| 75 Years and over | 0 (0.0%) | 9 (2.2%) |
| Total | 402 (11.8%) | 931 (21.3%) |
Income Above Poverty by Sex and Age in Liberty
According to the poverty statistics in Liberty, males aged 6 to 11 years and females aged 15 years are the age groups that are most secure financially, with 100.0% of males and 100.0% of females in these age groups living above the poverty line.
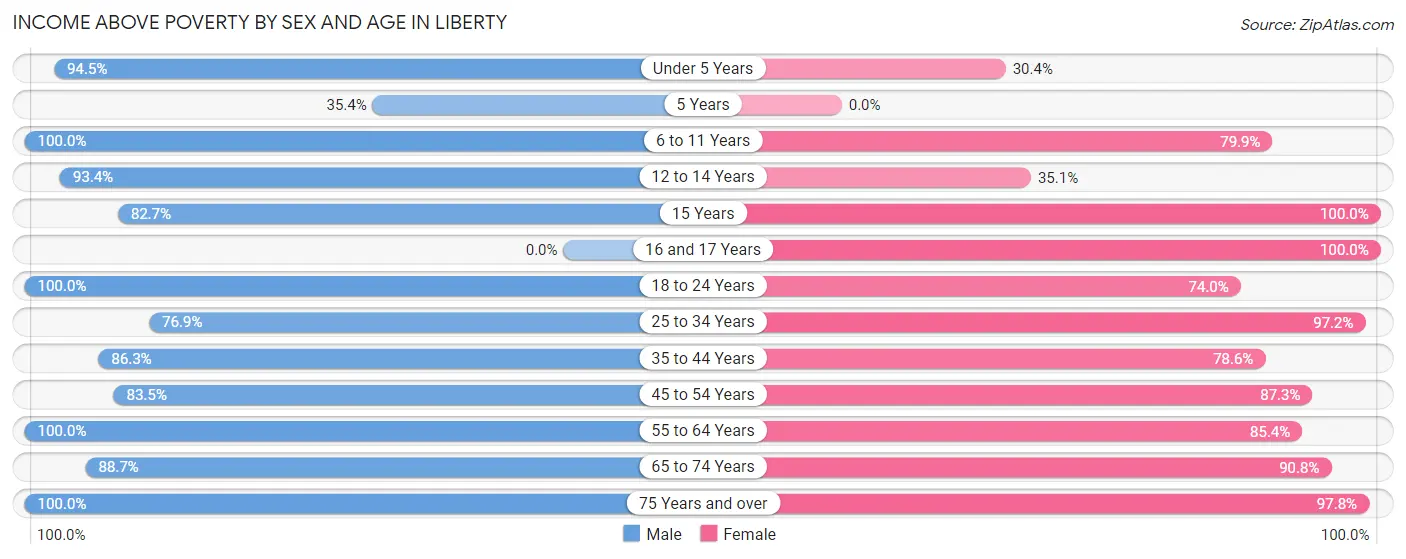
| Age Bracket | Male | Female |
| Under 5 Years | 277 (94.5%) | 136 (30.4%) |
| 5 Years | 51 (35.4%) | 0 (0.0%) |
| 6 to 11 Years | 69 (100.0%) | 358 (79.9%) |
| 12 to 14 Years | 171 (93.4%) | 59 (35.1%) |
| 15 Years | 86 (82.7%) | 101 (100.0%) |
| 16 and 17 Years | 0 (0.0%) | 97 (100.0%) |
| 18 to 24 Years | 297 (100.0%) | 359 (74.0%) |
| 25 to 34 Years | 253 (76.9%) | 410 (97.2%) |
| 35 to 44 Years | 623 (86.3%) | 521 (78.6%) |
| 45 to 54 Years | 278 (83.5%) | 455 (87.3%) |
| 55 to 64 Years | 258 (100.0%) | 170 (85.4%) |
| 65 to 74 Years | 259 (88.7%) | 367 (90.8%) |
| 75 Years and over | 377 (100.0%) | 406 (97.8%) |
| Total | 2,999 (88.2%) | 3,439 (78.7%) |
Income Below Poverty Among Married-Couple Families in Liberty
The poverty statistics for married-couple families in Liberty show that 7.5% or 119 of the total 1,586 families live below the poverty line. Families with 1 or 2 children have the highest poverty rate of 19.7%, comprising of 107 families. On the other hand, families with no children have the lowest poverty rate of 0.0%, which includes 0 families.
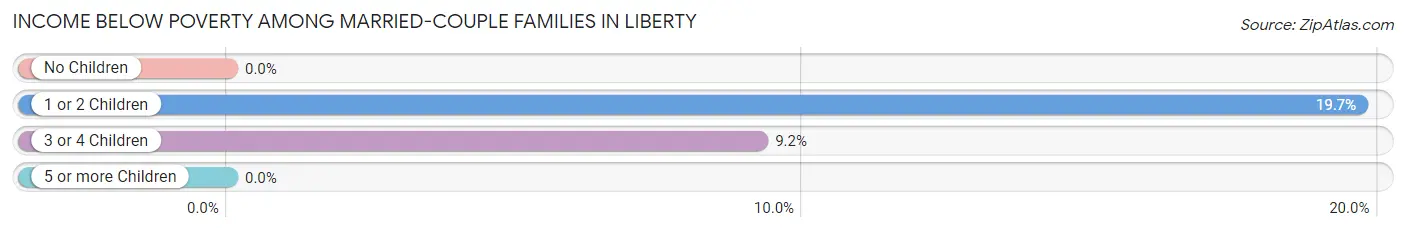
| Children | Above Poverty | Below Poverty |
| No Children | 912 (100.0%) | 0 (0.0%) |
| 1 or 2 Children | 437 (80.3%) | 107 (19.7%) |
| 3 or 4 Children | 118 (90.8%) | 12 (9.2%) |
| 5 or more Children | 0 (0.0%) | 0 (0.0%) |
| Total | 1,467 (92.5%) | 119 (7.5%) |
Income Below Poverty Among Single-Parent Households in Liberty
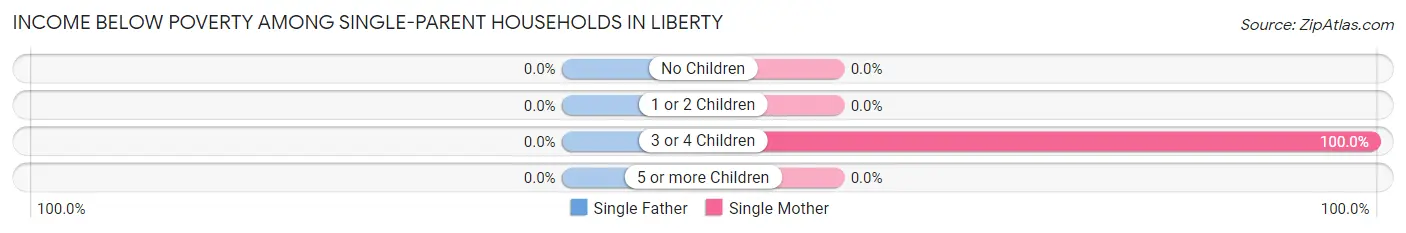
| Children | Single Father | Single Mother |
| No Children | 0 (0.0%) | 0 (0.0%) |
| 1 or 2 Children | 0 (0.0%) | 0 (0.0%) |
| 3 or 4 Children | 0 (0.0%) | 61 (100.0%) |
| 5 or more Children | 0 (0.0%) | 0 (0.0%) |
| Total | 0 (0.0%) | 61 (30.8%) |
Income Below Poverty Among Married-Couple vs Single-Parent Households in Liberty
The poverty data for Liberty shows that 119 of the married-couple family households (7.5%) and 61 of the single-parent households (22.7%) are living below the poverty level. Within the married-couple family households, those with 1 or 2 children have the highest poverty rate, with 107 households (19.7%) falling below the poverty line. Among the single-parent households, those with 3 or 4 children have the highest poverty rate, with 61 household (100.0%) living below poverty.
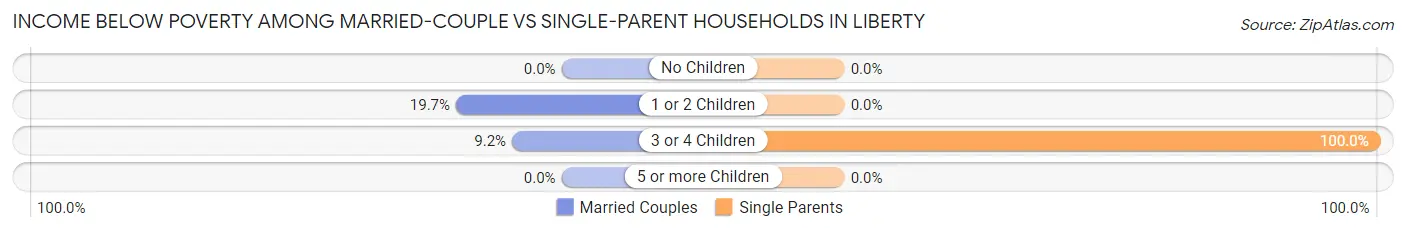
| Children | Married-Couple Families | Single-Parent Households |
| No Children | 0 (0.0%) | 0 (0.0%) |
| 1 or 2 Children | 107 (19.7%) | 0 (0.0%) |
| 3 or 4 Children | 12 (9.2%) | 61 (100.0%) |
| 5 or more Children | 0 (0.0%) | 0 (0.0%) |
| Total | 119 (7.5%) | 61 (22.7%) |
Race in Liberty
The most populous races in Liberty are White / Caucasian (5,070 | 60.7%), Hispanic or Latino (2,505 | 30.0%), and Some other Race (2,007 | 24.0%).
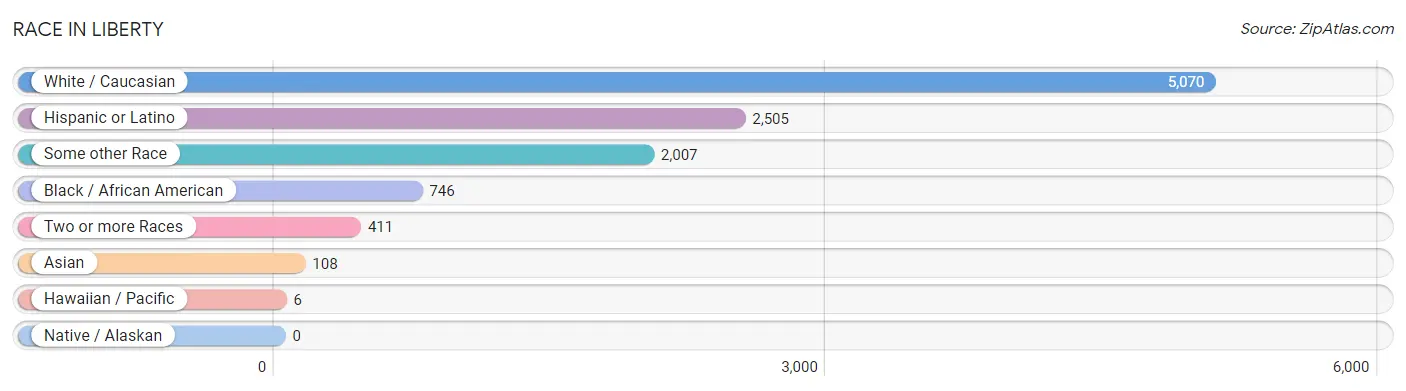
| Race | # Population | % Population |
| Asian | 108 | 1.3% |
| Black / African American | 746 | 8.9% |
| Hawaiian / Pacific | 6 | 0.1% |
| Hispanic or Latino | 2,505 | 30.0% |
| Native / Alaskan | 0 | 0.0% |
| White / Caucasian | 5,070 | 60.7% |
| Two or more Races | 411 | 4.9% |
| Some other Race | 2,007 | 24.0% |
| Total | 8,348 | 100.0% |
Ancestry in Liberty
The most populous ancestries reported in Liberty are Mexican (2,300 | 27.6%), English (1,113 | 13.3%), German (816 | 9.8%), Irish (674 | 8.1%), and American (611 | 7.3%), together accounting for 66.0% of all Liberty residents.
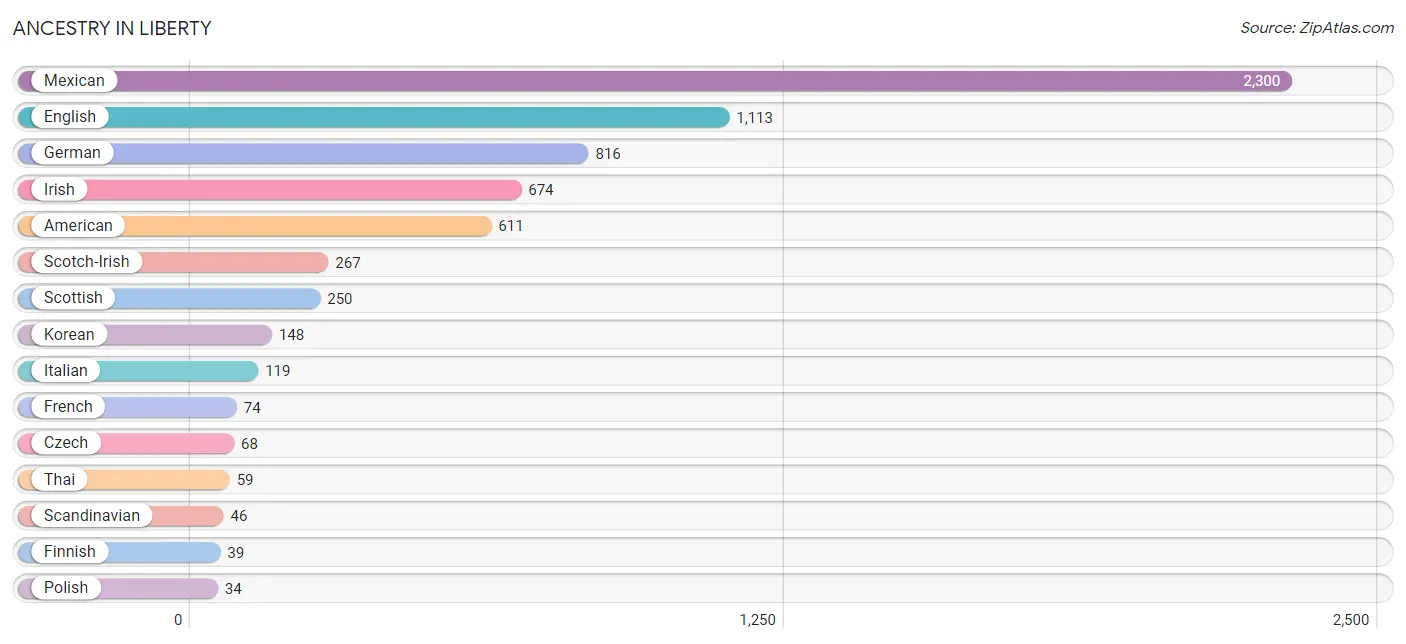
| Ancestry | # Population | % Population |
| American | 611 | 7.3% |
| British | 6 | 0.1% |
| Central American | 26 | 0.3% |
| Croatian | 4 | 0.1% |
| Czech | 68 | 0.8% |
| Danish | 18 | 0.2% |
| Dutch | 14 | 0.2% |
| English | 1,113 | 13.3% |
| European | 32 | 0.4% |
| Finnish | 39 | 0.5% |
| French | 74 | 0.9% |
| German | 816 | 9.8% |
| Guatemalan | 6 | 0.1% |
| Honduran | 20 | 0.2% |
| Hungarian | 7 | 0.1% |
| Indian (Asian) | 16 | 0.2% |
| Iranian | 1 | 0.0% |
| Irish | 674 | 8.1% |
| Italian | 119 | 1.4% |
| Korean | 148 | 1.8% |
| Mexican | 2,300 | 27.6% |
| Polish | 34 | 0.4% |
| Puerto Rican | 7 | 0.1% |
| Russian | 26 | 0.3% |
| Scandinavian | 46 | 0.5% |
| Scotch-Irish | 267 | 3.2% |
| Scottish | 250 | 3.0% |
| Thai | 59 | 0.7% | View All 28 Rows |
Immigrants in Liberty
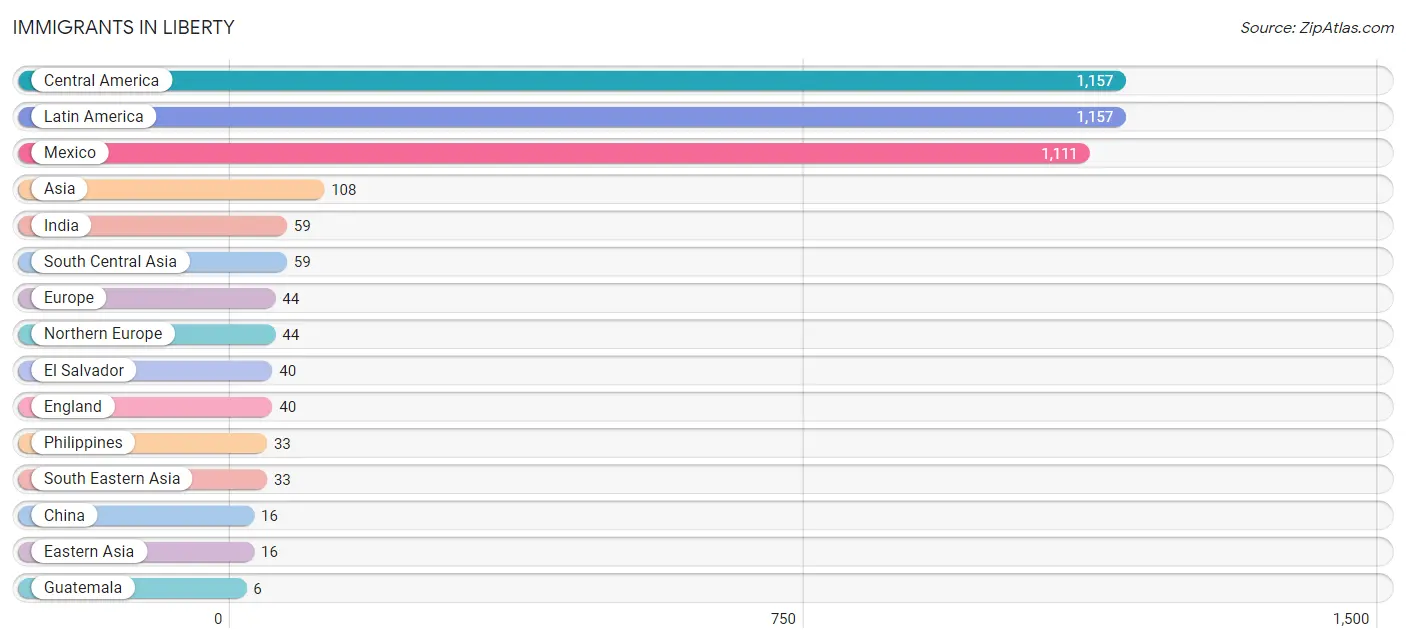
The most numerous immigrant groups reported in Liberty came from Central America (1,157 | 13.9%), Latin America (1,157 | 13.9%), Mexico (1,111 | 13.3%), Asia (108 | 1.3%), and India (59 | 0.7%), together accounting for 43.0% of all Liberty residents.
| Immigration Origin | # Population | % Population |
| Asia | 108 | 1.3% |
| Central America | 1,157 | 13.9% |
| China | 16 | 0.2% |
| Eastern Asia | 16 | 0.2% |
| El Salvador | 40 | 0.5% |
| England | 40 | 0.5% |
| Europe | 44 | 0.5% |
| Guatemala | 6 | 0.1% |
| India | 59 | 0.7% |
| Latin America | 1,157 | 13.9% |
| Mexico | 1,111 | 13.3% |
| Northern Europe | 44 | 0.5% |
| Philippines | 33 | 0.4% |
| South Central Asia | 59 | 0.7% |
| South Eastern Asia | 33 | 0.4% | View All 15 Rows |
Sex and Age in Liberty
Sex and Age in Liberty
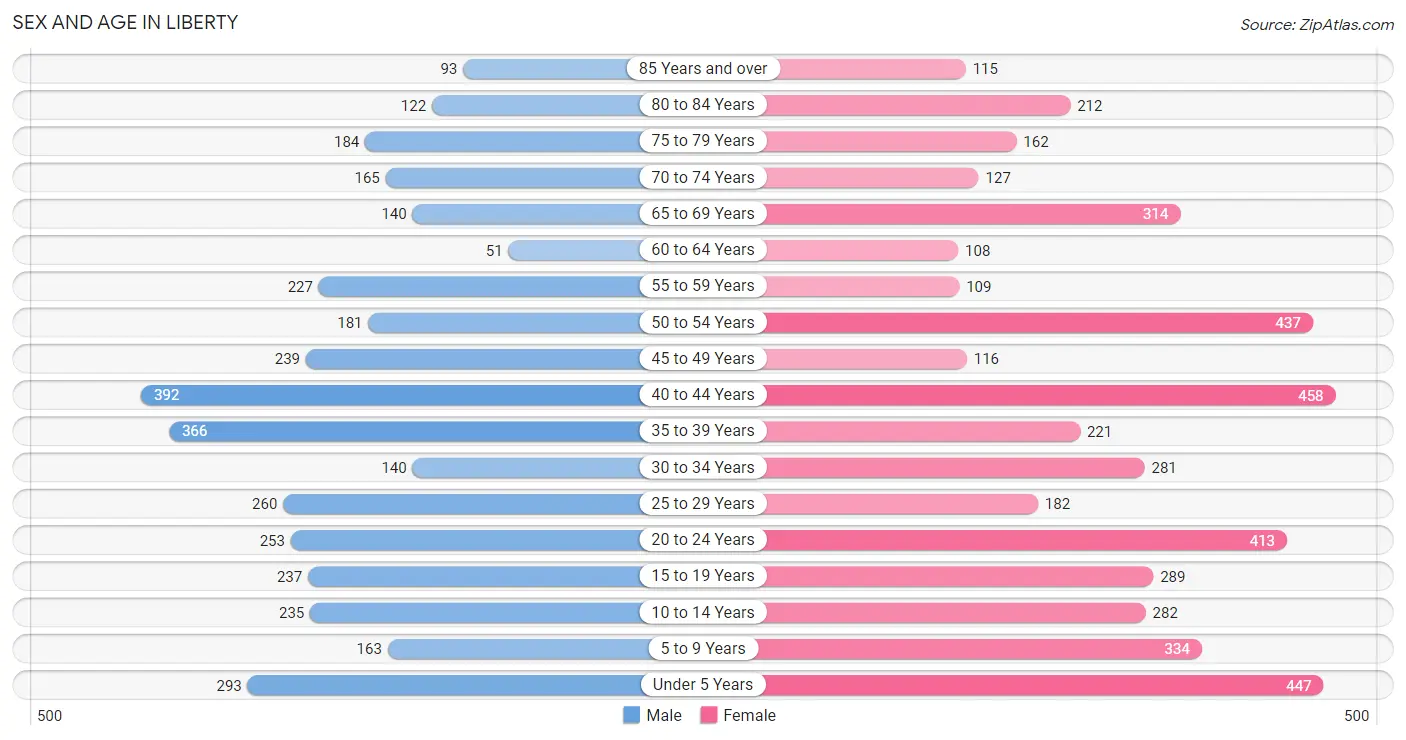
The most populous age groups in Liberty are 40 to 44 Years (392 | 10.5%) for men and 40 to 44 Years (458 | 9.9%) for women.
| Age Bracket | Male | Female |
| Under 5 Years | 293 (7.8%) | 447 (9.7%) |
| 5 to 9 Years | 163 (4.4%) | 334 (7.2%) |
| 10 to 14 Years | 235 (6.3%) | 282 (6.1%) |
| 15 to 19 Years | 237 (6.3%) | 289 (6.3%) |
| 20 to 24 Years | 253 (6.8%) | 413 (9.0%) |
| 25 to 29 Years | 260 (7.0%) | 182 (4.0%) |
| 30 to 34 Years | 140 (3.7%) | 281 (6.1%) |
| 35 to 39 Years | 366 (9.8%) | 221 (4.8%) |
| 40 to 44 Years | 392 (10.5%) | 458 (9.9%) |
| 45 to 49 Years | 239 (6.4%) | 116 (2.5%) |
| 50 to 54 Years | 181 (4.8%) | 437 (9.5%) |
| 55 to 59 Years | 227 (6.1%) | 109 (2.4%) |
| 60 to 64 Years | 51 (1.4%) | 108 (2.3%) |
| 65 to 69 Years | 140 (3.7%) | 314 (6.8%) |
| 70 to 74 Years | 165 (4.4%) | 127 (2.8%) |
| 75 to 79 Years | 184 (4.9%) | 162 (3.5%) |
| 80 to 84 Years | 122 (3.3%) | 212 (4.6%) |
| 85 Years and over | 93 (2.5%) | 115 (2.5%) |
| Total | 3,741 (100.0%) | 4,607 (100.0%) |
Families and Households in Liberty
Median Family Size in Liberty
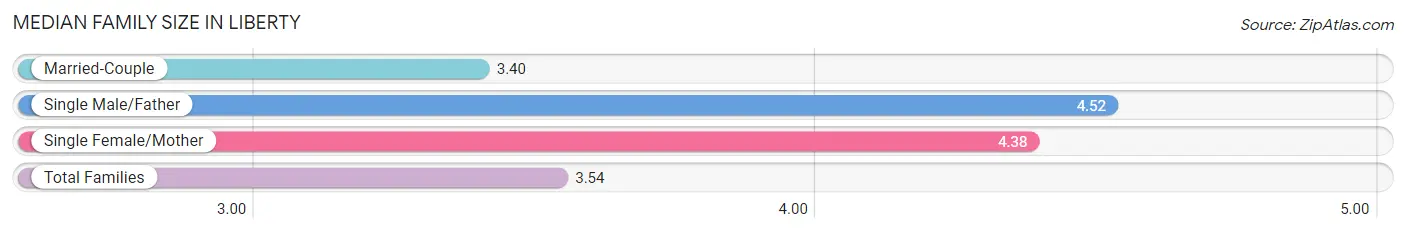
The median family size in Liberty is 3.54 persons per family, with single male/father families (71 | 3.8%) accounting for the largest median family size of 4.52 persons per family. On the other hand, married-couple families (1,586 | 85.5%) represent the smallest median family size with 3.40 persons per family.
| Family Type | # Families | Family Size |
| Married-Couple | 1,586 (85.5%) | 3.40 |
| Single Male/Father | 71 (3.8%) | 4.52 |
| Single Female/Mother | 198 (10.7%) | 4.38 |
| Total Families | 1,855 (100.0%) | 3.54 |
Median Household Size in Liberty
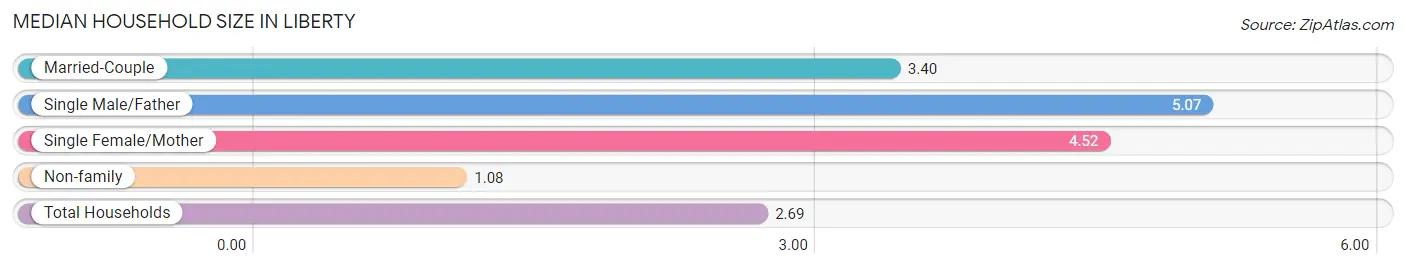
The median household size in Liberty is 2.69 persons per household, with single male/father households (71 | 2.5%) accounting for the largest median household size of 5.07 persons per household. non-family households (1,029 | 35.7%) represent the smallest median household size with 1.08 persons per household.
| Household Type | # Households | Household Size |
| Married-Couple | 1,586 (55.0%) | 3.40 |
| Single Male/Father | 71 (2.5%) | 5.07 |
| Single Female/Mother | 198 (6.9%) | 4.52 |
| Non-family | 1,029 (35.7%) | 1.08 |
| Total Households | 2,884 (100.0%) | 2.69 |
Household Size by Marriage Status in Liberty
Out of a total of 2,884 households in Liberty, 1,855 (64.3%) are family households, while 1,029 (35.7%) are nonfamily households. The most numerous type of family households are 2-person households, comprising 861, and the most common type of nonfamily households are 1-person households, comprising 939.
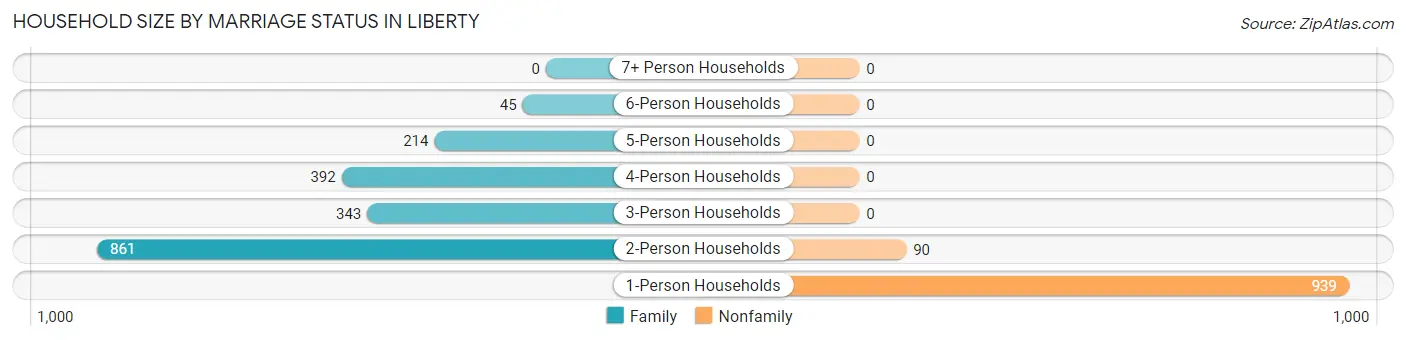
| Household Size | Family Households | Nonfamily Households |
| 1-Person Households | - | 939 (32.6%) |
| 2-Person Households | 861 (29.8%) | 90 (3.1%) |
| 3-Person Households | 343 (11.9%) | 0 (0.0%) |
| 4-Person Households | 392 (13.6%) | 0 (0.0%) |
| 5-Person Households | 214 (7.4%) | 0 (0.0%) |
| 6-Person Households | 45 (1.6%) | 0 (0.0%) |
| 7+ Person Households | 0 (0.0%) | 0 (0.0%) |
| Total | 1,855 (64.3%) | 1,029 (35.7%) |
Female Fertility in Liberty
Fertility by Age in Liberty
Average fertility rate in Liberty is 82.0 births per 1,000 women. Women in the age bracket of 35 to 50 years have the highest fertility rate with 108.0 births per 1,000 women. Women in the age bracket of 35 to 50 years acount for 55.8% of all women with births.
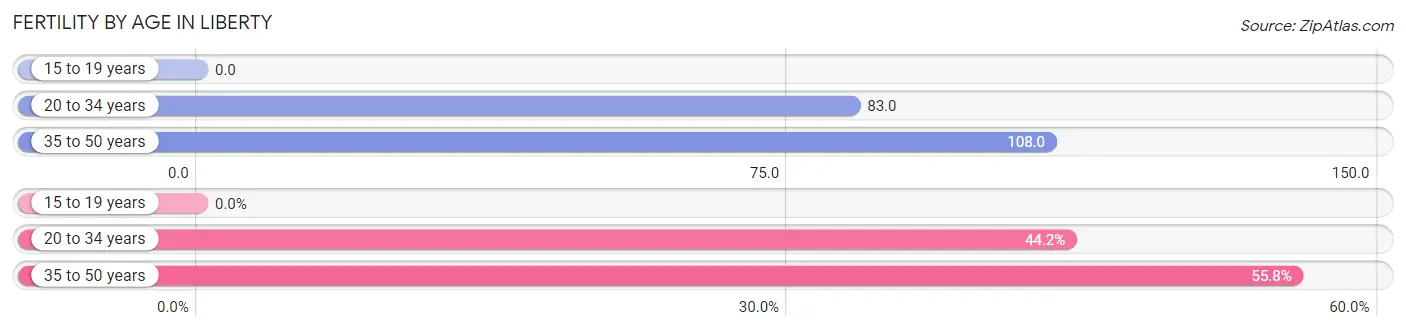
| Age Bracket | Women with Births | Births / 1,000 Women |
| 15 to 19 years | 0 (0.0%) | 0.0 |
| 20 to 34 years | 73 (44.2%) | 83.0 |
| 35 to 50 years | 92 (55.8%) | 108.0 |
| Total | 165 (100.0%) | 82.0 |
Fertility by Age by Marriage Status in Liberty
27.3% of women with births (165) in Liberty are married. The highest percentage of unmarried women with births falls into 20 to 34 years age bracket with 100.0% of them unmarried at the time of birth, while the lowest percentage of unmarried women with births belong to 35 to 50 years age bracket with 51.1% of them unmarried.
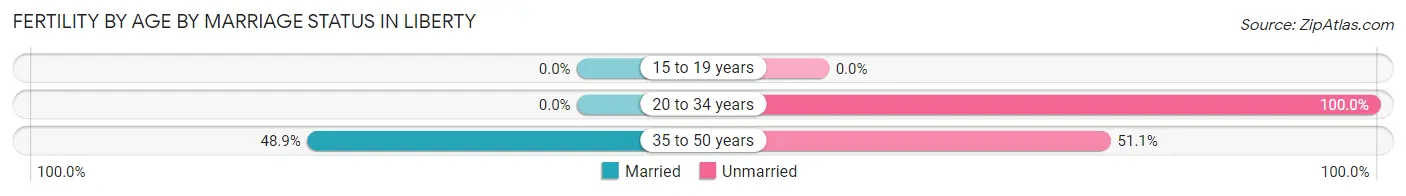
| Age Bracket | Married | Unmarried |
| 15 to 19 years | 0 (0.0%) | 0 (0.0%) |
| 20 to 34 years | 0 (0.0%) | 73 (100.0%) |
| 35 to 50 years | 45 (48.9%) | 47 (51.1%) |
| Total | 45 (27.3%) | 120 (72.7%) |
Fertility by Education in Liberty
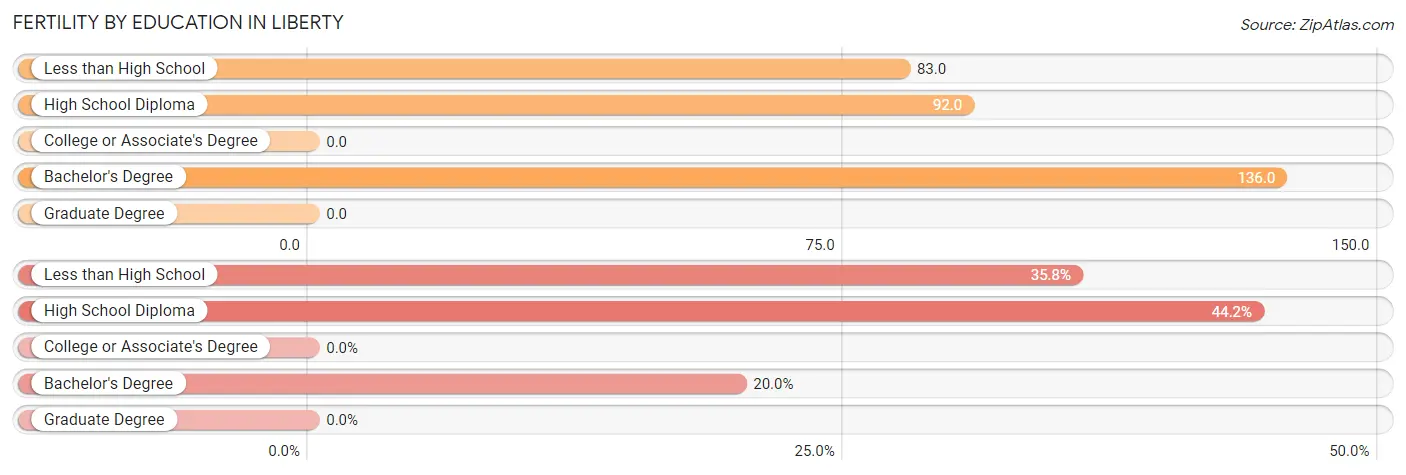
| Educational Attainment | Women with Births | Births / 1,000 Women |
| Less than High School | 59 (35.8%) | 83.0 |
| High School Diploma | 73 (44.2%) | 92.0 |
| College or Associate's Degree | 0 (0.0%) | 0.0 |
| Bachelor's Degree | 33 (20.0%) | 136.0 |
| Graduate Degree | 0 (0.0%) | 0.0 |
| Total | 165 (100.0%) | 82.0 |
Fertility by Education by Marriage Status in Liberty
72.7% of women with births in Liberty are unmarried. Women with the educational attainment of bachelor's degree are most likely to be married with 100.0% of them married at childbirth, while women with the educational attainment of high school diploma are least likely to be married with 100.0% of them unmarried at childbirth.
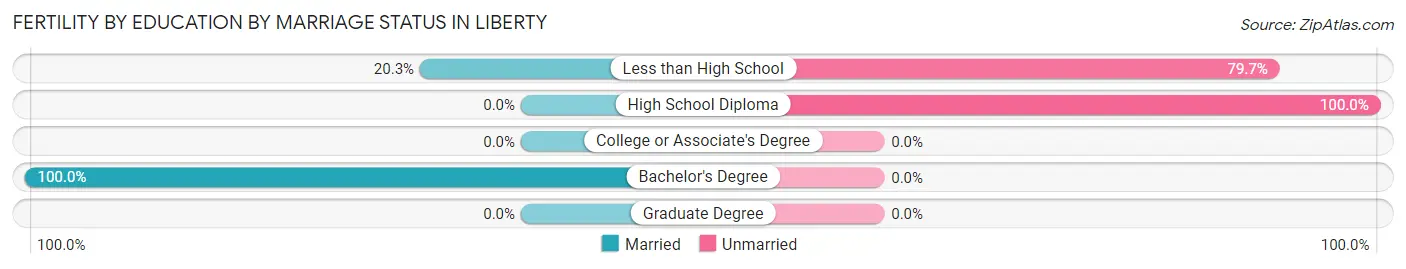
| Educational Attainment | Married | Unmarried |
| Less than High School | 12 (20.3%) | 47 (79.7%) |
| High School Diploma | 0 (0.0%) | 73 (100.0%) |
| College or Associate's Degree | 0 (0.0%) | 0 (0.0%) |
| Bachelor's Degree | 33 (100.0%) | 0 (0.0%) |
| Graduate Degree | 0 (0.0%) | 0 (0.0%) |
| Total | 45 (27.3%) | 120 (72.7%) |
Employment Characteristics in Liberty
Employment by Class of Employer in Liberty
Among the 2,855 employed individuals in Liberty, private company employees (2,100 | 73.6%), self-employed (incorporated) (221 | 7.7%), and local government employees (165 | 5.8%) make up the most common classes of employment.
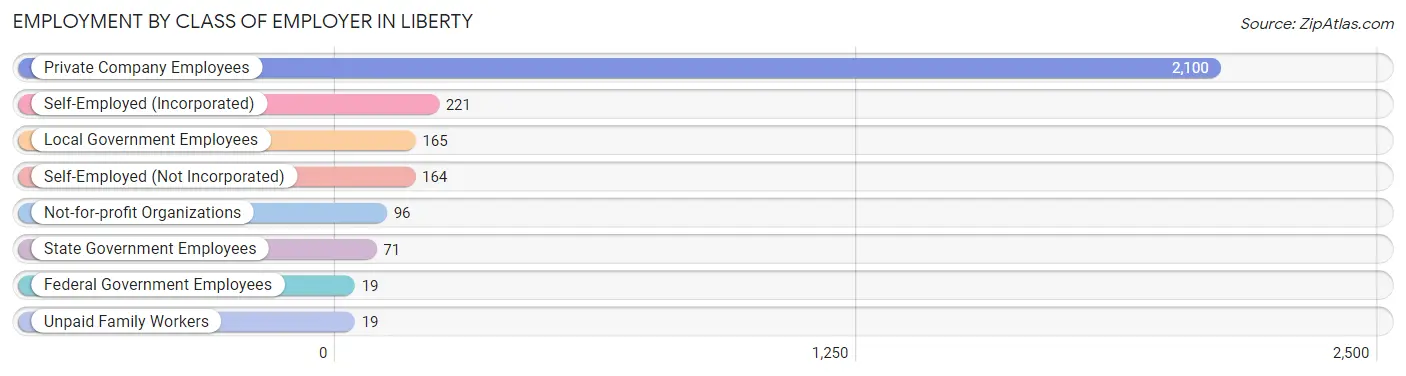
| Employer Class | # Employees | % Employees |
| Private Company Employees | 2,100 | 73.6% |
| Self-Employed (Incorporated) | 221 | 7.7% |
| Self-Employed (Not Incorporated) | 164 | 5.7% |
| Not-for-profit Organizations | 96 | 3.4% |
| Local Government Employees | 165 | 5.8% |
| State Government Employees | 71 | 2.5% |
| Federal Government Employees | 19 | 0.7% |
| Unpaid Family Workers | 19 | 0.7% |
| Total | 2,855 | 100.0% |
Employment Status by Age in Liberty
According to the labor force statistics for Liberty, out of the total population over 16 years of age (6,388), 48.1% or 3,073 individuals are in the labor force, with 7.1% or 218 of them unemployed. The age group with the highest labor force participation rate is 30 to 34 years, with 81.0% or 341 individuals in the labor force. Within the labor force, the 65 to 74 years age range has the highest percentage of unemployed individuals, with 27.3% or 15 of them being unemployed.
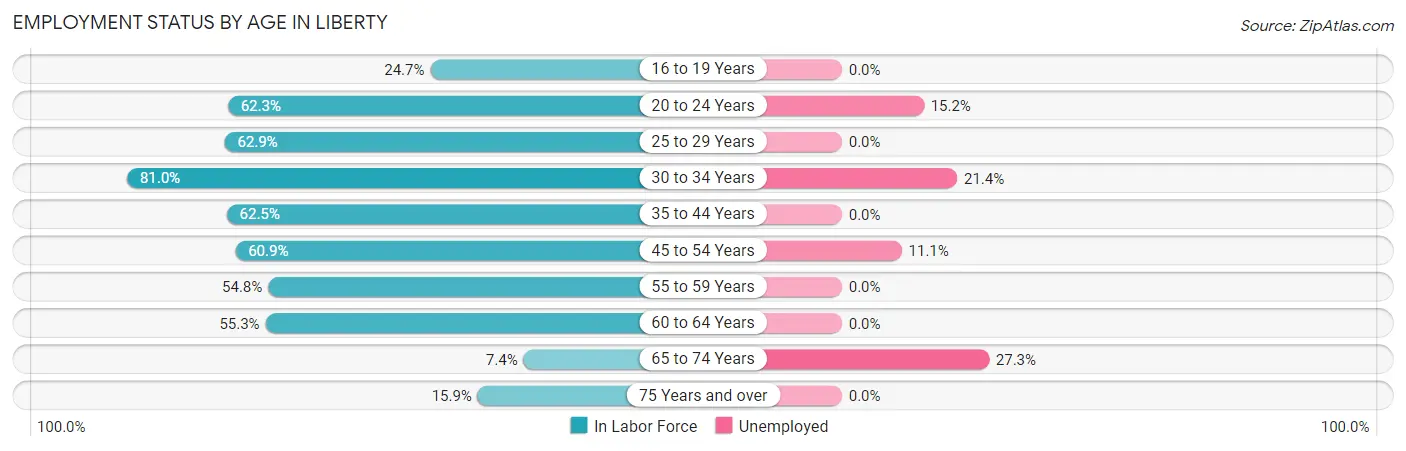
| Age Bracket | In Labor Force | Unemployed |
| 16 to 19 Years | 79 (24.7%) | 0 (0.0%) |
| 20 to 24 Years | 415 (62.3%) | 63 (15.2%) |
| 25 to 29 Years | 278 (62.9%) | 0 (0.0%) |
| 30 to 34 Years | 341 (81.0%) | 73 (21.4%) |
| 35 to 44 Years | 898 (62.5%) | 0 (0.0%) |
| 45 to 54 Years | 593 (60.9%) | 66 (11.1%) |
| 55 to 59 Years | 184 (54.8%) | 0 (0.0%) |
| 60 to 64 Years | 88 (55.3%) | 0 (0.0%) |
| 65 to 74 Years | 55 (7.4%) | 15 (27.3%) |
| 75 Years and over | 141 (15.9%) | 0 (0.0%) |
| Total | 3,073 (48.1%) | 218 (7.1%) |
Employment Status by Educational Attainment in Liberty
According to labor force statistics for Liberty, 63.2% of individuals (2,381) out of the total population between 25 and 64 years of age (3,768) are in the labor force, with 5.8% or 138 of them being unemployed. The group with the highest labor force participation rate are those with the educational attainment of college / associate degree, with 73.7% or 734 individuals in the labor force. Within the labor force, individuals with high school diploma education have the highest percentage of unemployment, with 9.0% or 73 of them being unemployed.
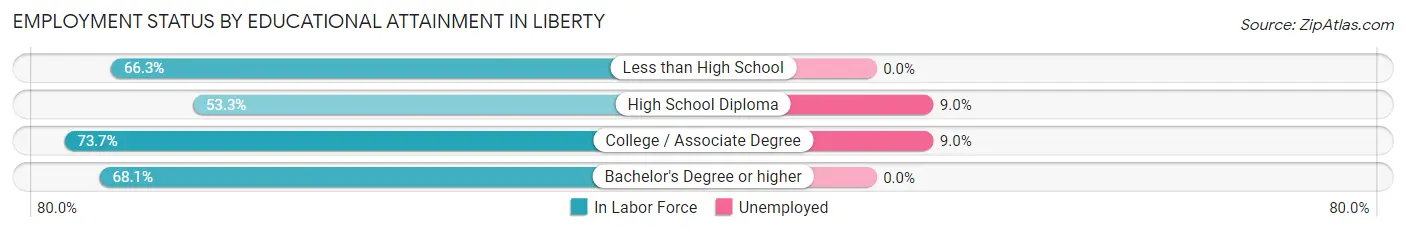
| Educational Attainment | In Labor Force | Unemployed |
| Less than High School | 544 (66.3%) | 0 (0.0%) |
| High School Diploma | 813 (53.3%) | 137 (9.0%) |
| College / Associate Degree | 734 (73.7%) | 90 (9.0%) |
| Bachelor's Degree or higher | 290 (68.1%) | 0 (0.0%) |
| Total | 2,381 (63.2%) | 219 (5.8%) |
Employment Occupations by Sex in Liberty
Management, Business, Science and Arts Occupations
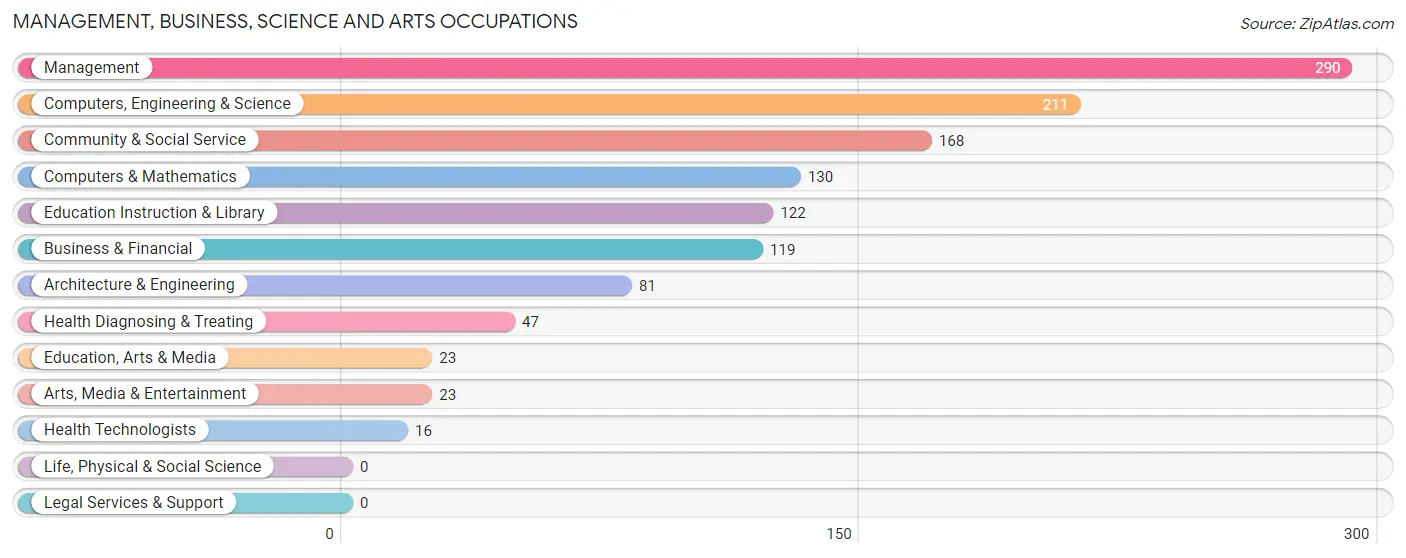
The most common Management, Business, Science and Arts occupations in Liberty are Management (290 | 10.2%), Computers, Engineering & Science (211 | 7.4%), Community & Social Service (168 | 5.9%), Computers & Mathematics (130 | 4.5%), and Education Instruction & Library (122 | 4.3%).
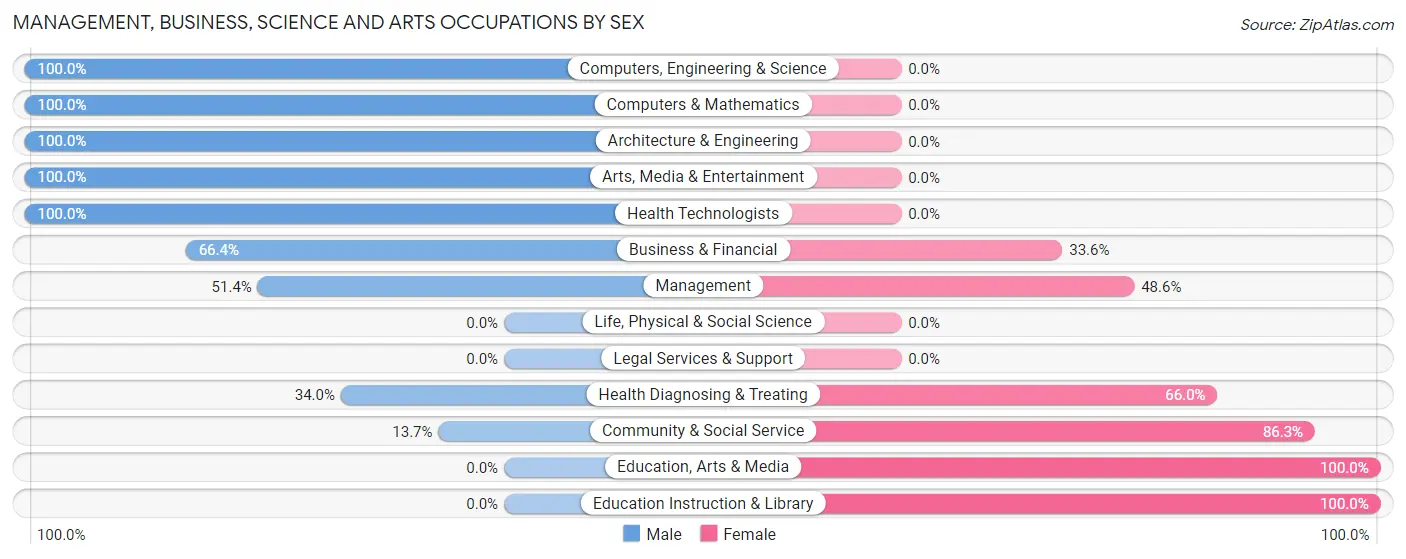
Management, Business, Science and Arts Occupations by Sex
Within the Management, Business, Science and Arts occupations in Liberty, the most male-oriented occupations are Computers, Engineering & Science (100.0%), Computers & Mathematics (100.0%), and Architecture & Engineering (100.0%), while the most female-oriented occupations are Education, Arts & Media (100.0%), Education Instruction & Library (100.0%), and Community & Social Service (86.3%).
| Occupation | Male | Female |
| Management | 149 (51.4%) | 141 (48.6%) |
| Business & Financial | 79 (66.4%) | 40 (33.6%) |
| Computers, Engineering & Science | 211 (100.0%) | 0 (0.0%) |
| Computers & Mathematics | 130 (100.0%) | 0 (0.0%) |
| Architecture & Engineering | 81 (100.0%) | 0 (0.0%) |
| Life, Physical & Social Science | 0 (0.0%) | 0 (0.0%) |
| Community & Social Service | 23 (13.7%) | 145 (86.3%) |
| Education, Arts & Media | 0 (0.0%) | 23 (100.0%) |
| Legal Services & Support | 0 (0.0%) | 0 (0.0%) |
| Education Instruction & Library | 0 (0.0%) | 122 (100.0%) |
| Arts, Media & Entertainment | 23 (100.0%) | 0 (0.0%) |
| Health Diagnosing & Treating | 16 (34.0%) | 31 (66.0%) |
| Health Technologists | 16 (100.0%) | 0 (0.0%) |
| Total (Category) | 478 (57.3%) | 357 (42.7%) |
| Total (Overall) | 1,624 (56.9%) | 1,231 (43.1%) |
Services Occupations
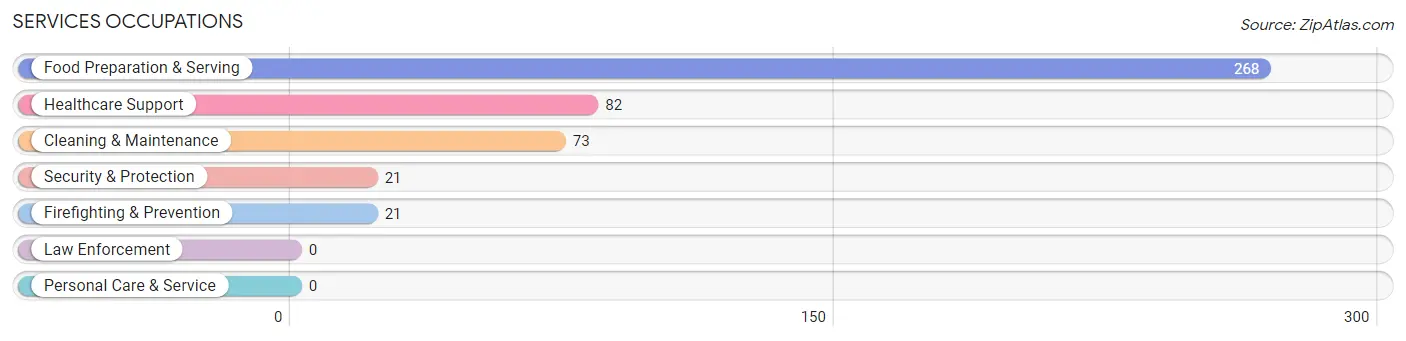
The most common Services occupations in Liberty are Food Preparation & Serving (268 | 9.4%), Healthcare Support (82 | 2.9%), Cleaning & Maintenance (73 | 2.6%), Security & Protection (21 | 0.7%), and Firefighting & Prevention (21 | 0.7%).
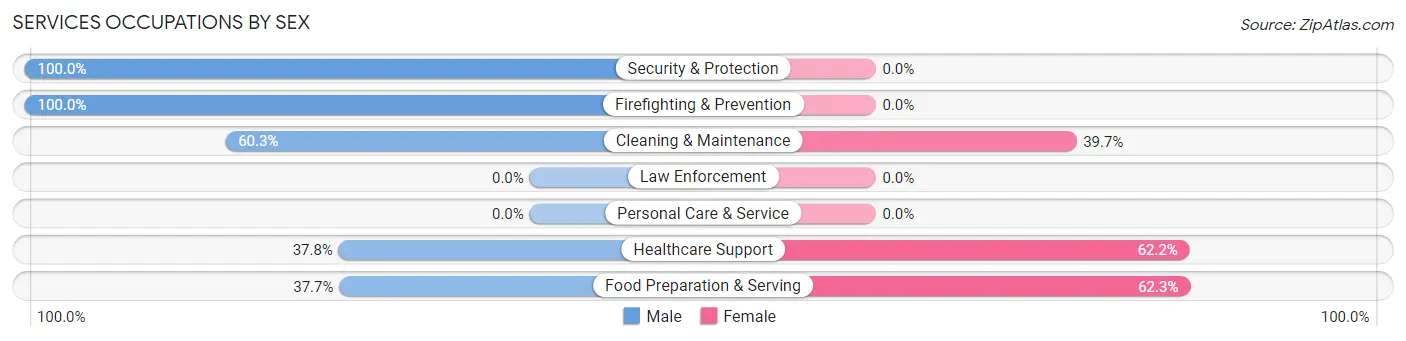
Services Occupations by Sex
Within the Services occupations in Liberty, the most male-oriented occupations are Security & Protection (100.0%), Firefighting & Prevention (100.0%), and Cleaning & Maintenance (60.3%), while the most female-oriented occupations are Food Preparation & Serving (62.3%), Healthcare Support (62.2%), and Cleaning & Maintenance (39.7%).
| Occupation | Male | Female |
| Healthcare Support | 31 (37.8%) | 51 (62.2%) |
| Security & Protection | 21 (100.0%) | 0 (0.0%) |
| Firefighting & Prevention | 21 (100.0%) | 0 (0.0%) |
| Law Enforcement | 0 (0.0%) | 0 (0.0%) |
| Food Preparation & Serving | 101 (37.7%) | 167 (62.3%) |
| Cleaning & Maintenance | 44 (60.3%) | 29 (39.7%) |
| Personal Care & Service | 0 (0.0%) | 0 (0.0%) |
| Total (Category) | 197 (44.4%) | 247 (55.6%) |
| Total (Overall) | 1,624 (56.9%) | 1,231 (43.1%) |
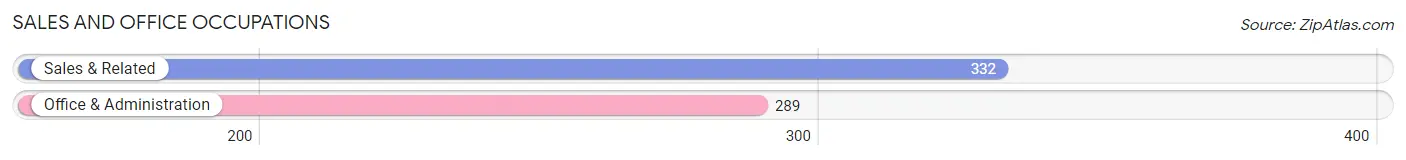
Sales and Office Occupations
The most common Sales and Office occupations in Liberty are Sales & Related (332 | 11.6%), and Office & Administration (289 | 10.1%).
Sales and Office Occupations by Sex
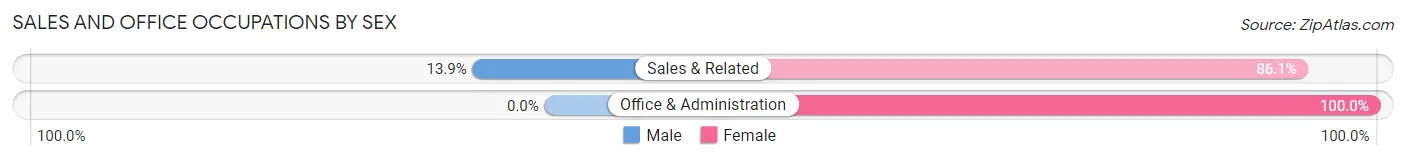
| Occupation | Male | Female |
| Sales & Related | 46 (13.9%) | 286 (86.1%) |
| Office & Administration | 0 (0.0%) | 289 (100.0%) |
| Total (Category) | 46 (7.4%) | 575 (92.6%) |
| Total (Overall) | 1,624 (56.9%) | 1,231 (43.1%) |
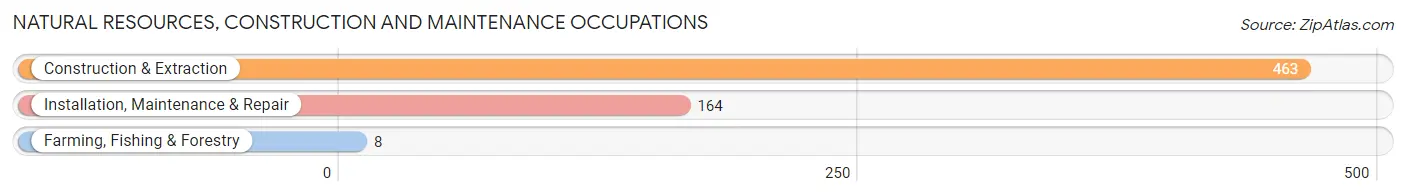
Natural Resources, Construction and Maintenance Occupations
The most common Natural Resources, Construction and Maintenance occupations in Liberty are Construction & Extraction (463 | 16.2%), Installation, Maintenance & Repair (164 | 5.7%), and Farming, Fishing & Forestry (8 | 0.3%).
Natural Resources, Construction and Maintenance Occupations by Sex
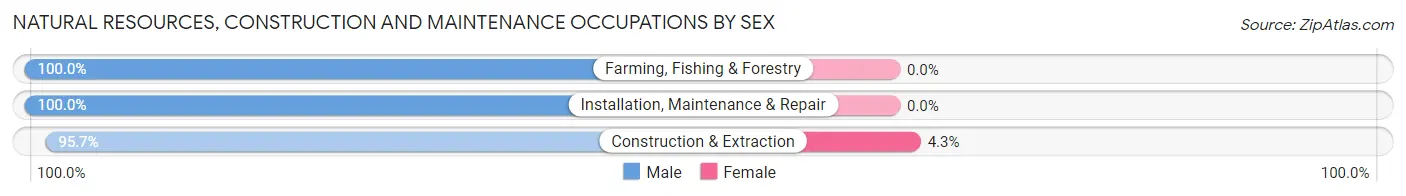
| Occupation | Male | Female |
| Farming, Fishing & Forestry | 8 (100.0%) | 0 (0.0%) |
| Construction & Extraction | 443 (95.7%) | 20 (4.3%) |
| Installation, Maintenance & Repair | 164 (100.0%) | 0 (0.0%) |
| Total (Category) | 615 (96.9%) | 20 (3.2%) |
| Total (Overall) | 1,624 (56.9%) | 1,231 (43.1%) |
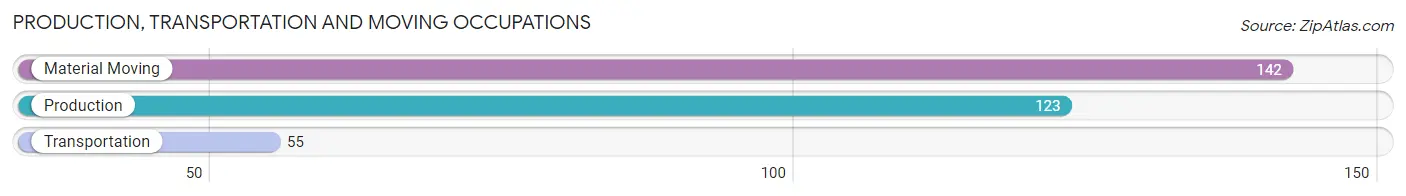
Production, Transportation and Moving Occupations
The most common Production, Transportation and Moving occupations in Liberty are Material Moving (142 | 5.0%), Production (123 | 4.3%), and Transportation (55 | 1.9%).
Production, Transportation and Moving Occupations by Sex
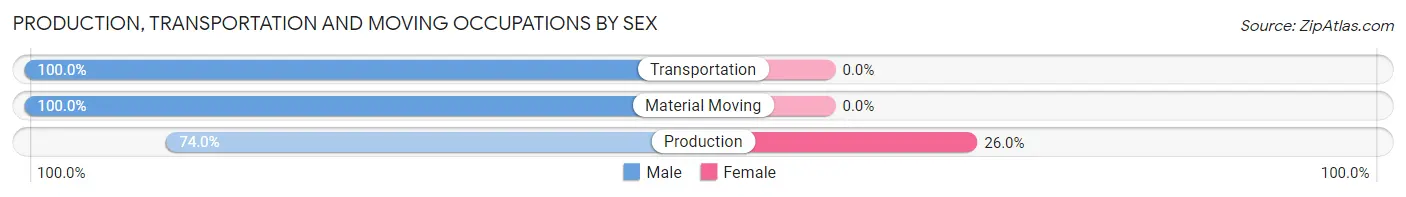
| Occupation | Male | Female |
| Production | 91 (74.0%) | 32 (26.0%) |
| Transportation | 55 (100.0%) | 0 (0.0%) |
| Material Moving | 142 (100.0%) | 0 (0.0%) |
| Total (Category) | 288 (90.0%) | 32 (10.0%) |
| Total (Overall) | 1,624 (56.9%) | 1,231 (43.1%) |
Employment Industries by Sex in Liberty
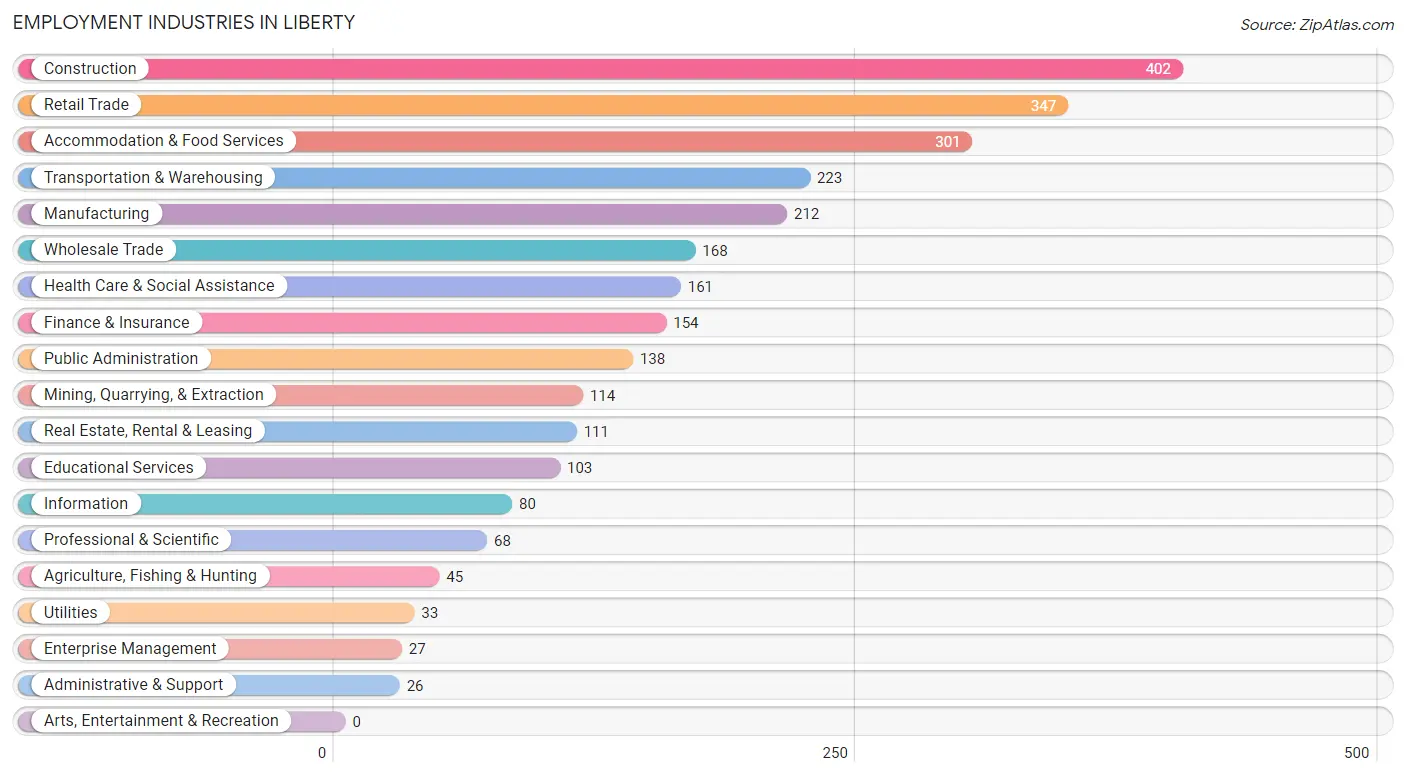
Employment Industries in Liberty
The major employment industries in Liberty include Construction (402 | 14.1%), Retail Trade (347 | 12.1%), Accommodation & Food Services (301 | 10.5%), Transportation & Warehousing (223 | 7.8%), and Manufacturing (212 | 7.4%).
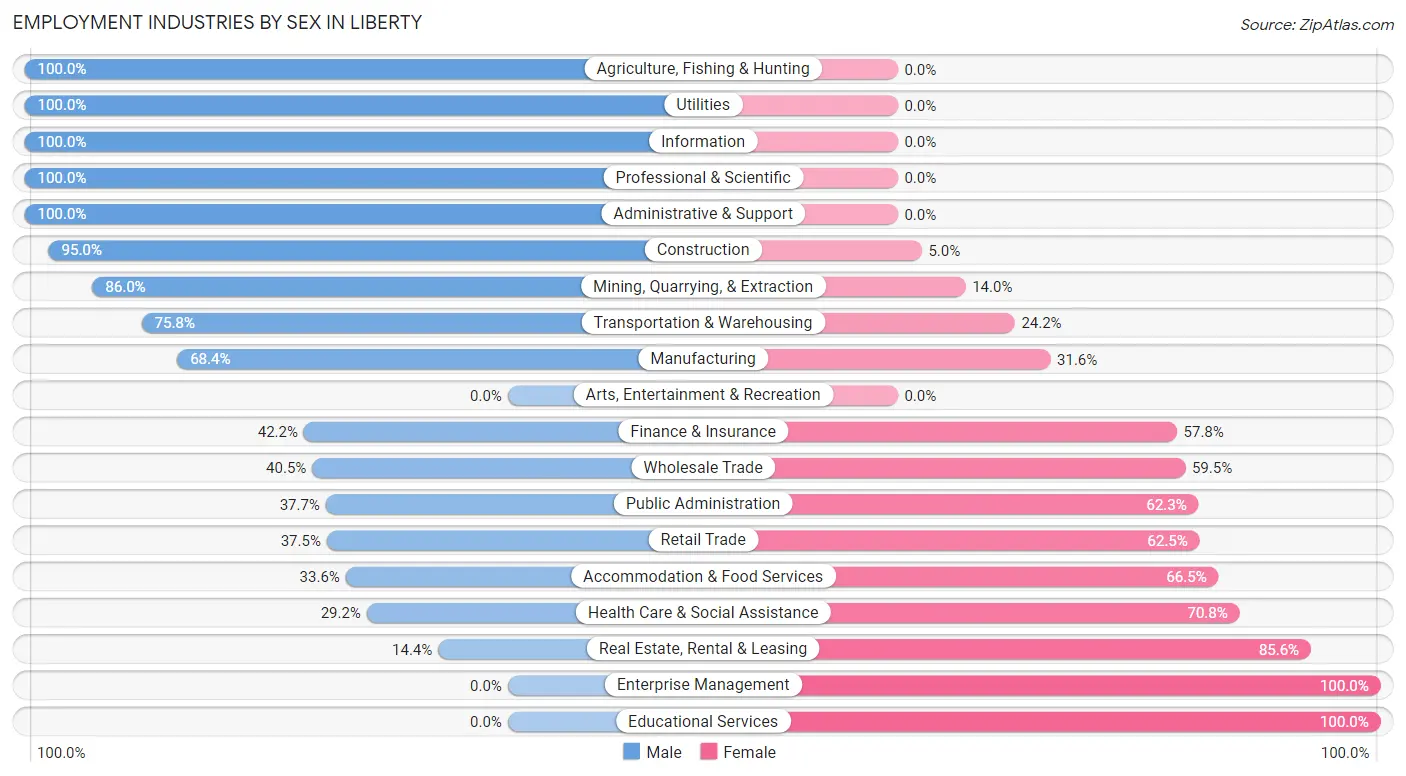
Employment Industries by Sex in Liberty
The Liberty industries that see more men than women are Agriculture, Fishing & Hunting (100.0%), Utilities (100.0%), and Information (100.0%), whereas the industries that tend to have a higher number of women are Enterprise Management (100.0%), Educational Services (100.0%), and Real Estate, Rental & Leasing (85.6%).
| Industry | Male | Female |
| Agriculture, Fishing & Hunting | 45 (100.0%) | 0 (0.0%) |
| Mining, Quarrying, & Extraction | 98 (86.0%) | 16 (14.0%) |
| Construction | 382 (95.0%) | 20 (5.0%) |
| Manufacturing | 145 (68.4%) | 67 (31.6%) |
| Wholesale Trade | 68 (40.5%) | 100 (59.5%) |
| Retail Trade | 130 (37.5%) | 217 (62.5%) |
| Transportation & Warehousing | 169 (75.8%) | 54 (24.2%) |
| Utilities | 33 (100.0%) | 0 (0.0%) |
| Information | 80 (100.0%) | 0 (0.0%) |
| Finance & Insurance | 65 (42.2%) | 89 (57.8%) |
| Real Estate, Rental & Leasing | 16 (14.4%) | 95 (85.6%) |
| Professional & Scientific | 68 (100.0%) | 0 (0.0%) |
| Enterprise Management | 0 (0.0%) | 27 (100.0%) |
| Administrative & Support | 26 (100.0%) | 0 (0.0%) |
| Educational Services | 0 (0.0%) | 103 (100.0%) |
| Health Care & Social Assistance | 47 (29.2%) | 114 (70.8%) |
| Arts, Entertainment & Recreation | 0 (0.0%) | 0 (0.0%) |
| Accommodation & Food Services | 101 (33.6%) | 200 (66.4%) |
| Public Administration | 52 (37.7%) | 86 (62.3%) |
| Total | 1,624 (56.9%) | 1,231 (43.1%) |
Education in Liberty
School Enrollment in Liberty
The most common levels of schooling among the 1,596 students in Liberty are middle school (449 | 28.1%), high school (447 | 28.0%), and elementary school (383 | 24.0%).
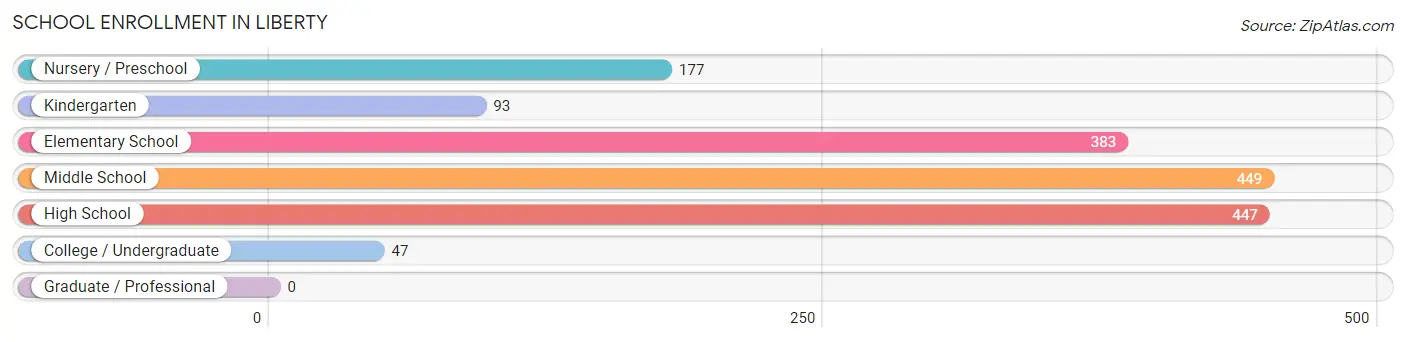
| School Level | # Students | % Students |
| Nursery / Preschool | 177 | 11.1% |
| Kindergarten | 93 | 5.8% |
| Elementary School | 383 | 24.0% |
| Middle School | 449 | 28.1% |
| High School | 447 | 28.0% |
| College / Undergraduate | 47 | 2.9% |
| Graduate / Professional | 0 | 0.0% |
| Total | 1,596 | 100.0% |
School Enrollment by Age by Funding Source in Liberty
Out of a total of 1,596 students who are enrolled in schools in Liberty, 96 (6.0%) attend a private institution, while the remaining 1,500 (94.0%) are enrolled in public schools. The age group of 18 to 19 year olds has the highest likelihood of being enrolled in private schools, with 47 (35.3% in the age bracket) enrolled. Conversely, the age group of 5 to 9 year old has the lowest likelihood of being enrolled in a private school, with 477 (100.0% in the age bracket) attending a public institution.
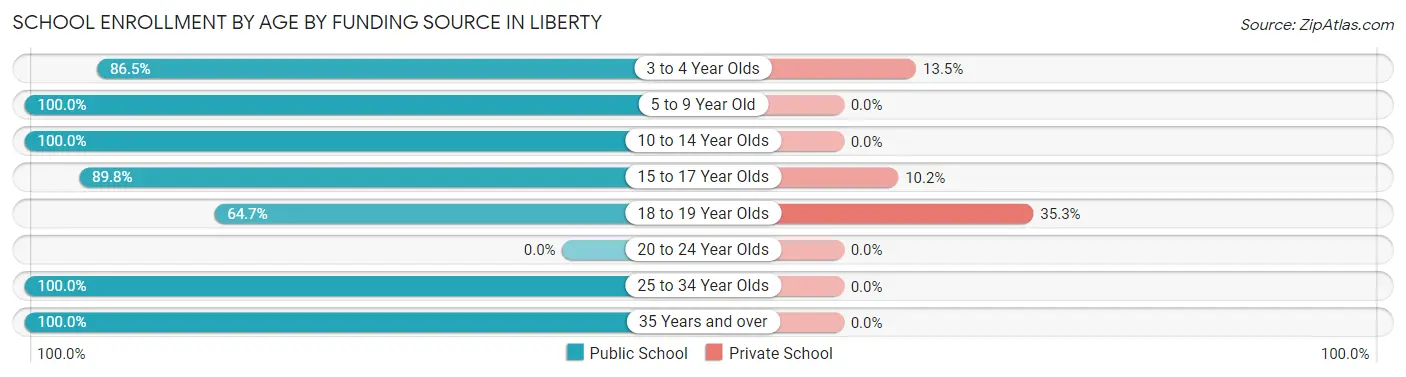
| Age Bracket | Public School | Private School |
| 3 to 4 Year Olds | 109 (86.5%) | 17 (13.5%) |
| 5 to 9 Year Old | 477 (100.0%) | 0 (0.0%) |
| 10 to 14 Year Olds | 498 (100.0%) | 0 (0.0%) |
| 15 to 17 Year Olds | 283 (89.8%) | 32 (10.2%) |
| 18 to 19 Year Olds | 86 (64.7%) | 47 (35.3%) |
| 20 to 24 Year Olds | 0 (0.0%) | 0 (0.0%) |
| 25 to 34 Year Olds | 20 (100.0%) | 0 (0.0%) |
| 35 Years and over | 27 (100.0%) | 0 (0.0%) |
| Total | 1,500 (94.0%) | 96 (6.0%) |
Educational Attainment by Field of Study in Liberty
Education (275 | 33.9%), engineering (126 | 15.5%), science & technology (110 | 13.6%), arts & humanities (100 | 12.3%), and bio, nature & agricultural (99 | 12.2%) are the most common fields of study among 811 individuals in Liberty who have obtained a bachelor's degree or higher.
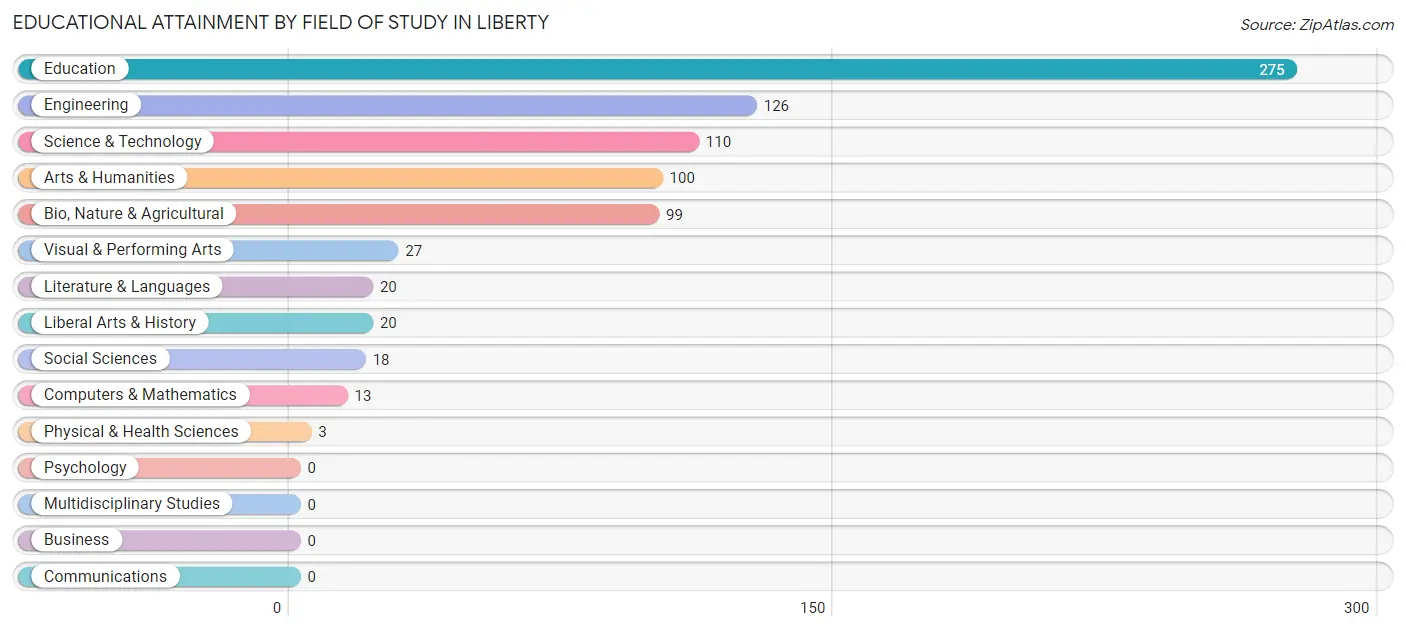
| Field of Study | # Graduates | % Graduates |
| Computers & Mathematics | 13 | 1.6% |
| Bio, Nature & Agricultural | 99 | 12.2% |
| Physical & Health Sciences | 3 | 0.4% |
| Psychology | 0 | 0.0% |
| Social Sciences | 18 | 2.2% |
| Engineering | 126 | 15.5% |
| Multidisciplinary Studies | 0 | 0.0% |
| Science & Technology | 110 | 13.6% |
| Business | 0 | 0.0% |
| Education | 275 | 33.9% |
| Literature & Languages | 20 | 2.5% |
| Liberal Arts & History | 20 | 2.5% |
| Visual & Performing Arts | 27 | 3.3% |
| Communications | 0 | 0.0% |
| Arts & Humanities | 100 | 12.3% |
| Total | 811 | 100.0% |
Transportation & Commute in Liberty
Vehicle Availability by Sex in Liberty
The most prevalent vehicle ownership categories in Liberty are males with 2 vehicles (749, accounting for 46.1%) and females with 2 vehicles (367, making up 60.8%).
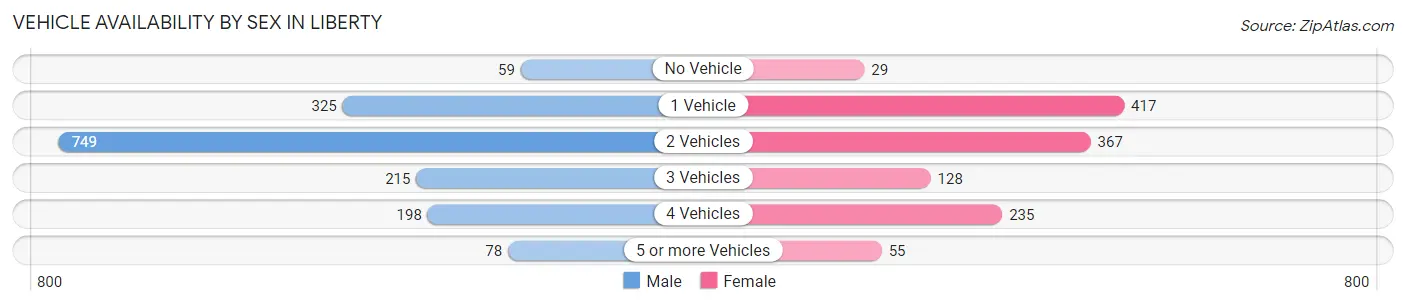
| Vehicles Available | Male | Female |
| No Vehicle | 59 (3.6%) | 29 (2.4%) |
| 1 Vehicle | 325 (20.0%) | 417 (33.9%) |
| 2 Vehicles | 749 (46.1%) | 367 (29.8%) |
| 3 Vehicles | 215 (13.2%) | 128 (10.4%) |
| 4 Vehicles | 198 (12.2%) | 235 (19.1%) |
| 5 or more Vehicles | 78 (4.8%) | 55 (4.5%) |
| Total | 1,624 (100.0%) | 1,231 (100.0%) |
Commute Time in Liberty
The most frequently occuring commute durations in Liberty are 5 to 9 minutes (487 commuters, 18.1%), 10 to 14 minutes (457 commuters, 17.0%), and 45 to 59 minutes (382 commuters, 14.2%).
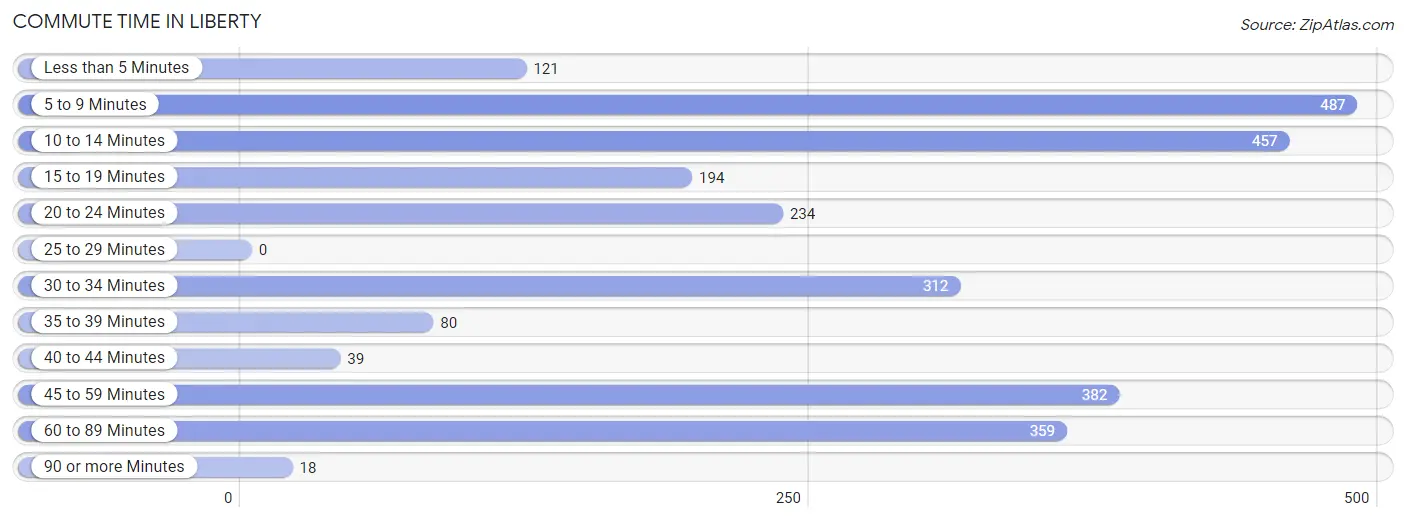
| Commute Time | # Commuters | % Commuters |
| Less than 5 Minutes | 121 | 4.5% |
| 5 to 9 Minutes | 487 | 18.1% |
| 10 to 14 Minutes | 457 | 17.0% |
| 15 to 19 Minutes | 194 | 7.2% |
| 20 to 24 Minutes | 234 | 8.7% |
| 25 to 29 Minutes | 0 | 0.0% |
| 30 to 34 Minutes | 312 | 11.6% |
| 35 to 39 Minutes | 80 | 3.0% |
| 40 to 44 Minutes | 39 | 1.5% |
| 45 to 59 Minutes | 382 | 14.2% |
| 60 to 89 Minutes | 359 | 13.4% |
| 90 or more Minutes | 18 | 0.7% |
Commute Time by Sex in Liberty
The most common commute times in Liberty are 60 to 89 minutes (288 commuters, 19.3%) for males and 10 to 14 minutes (408 commuters, 34.3%) for females.
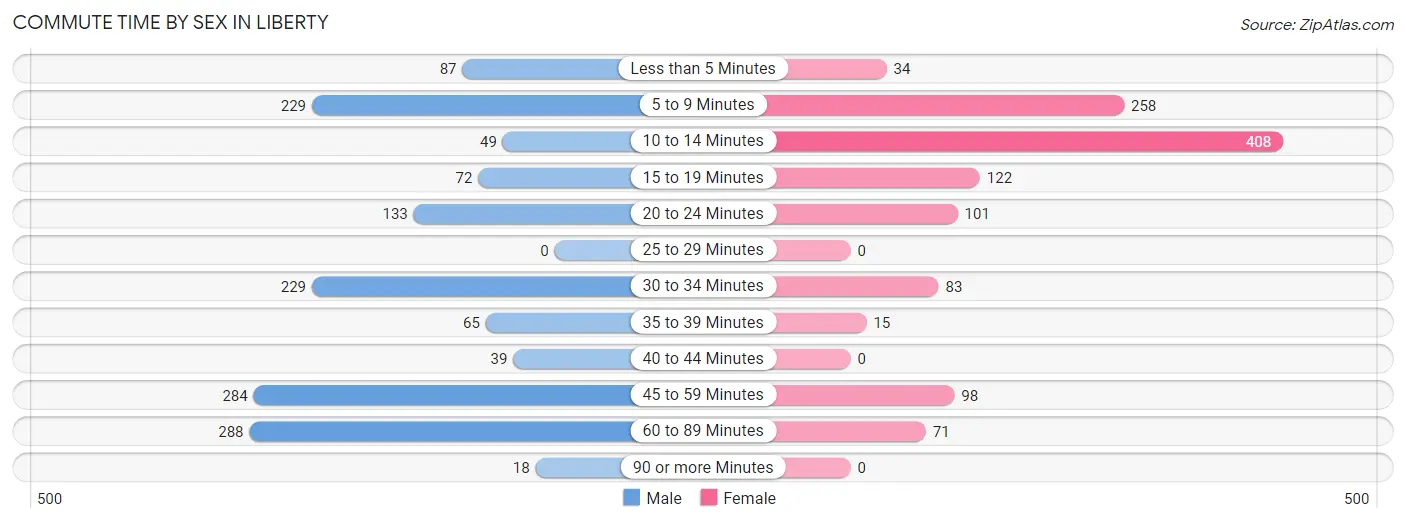
| Commute Time | Male | Female |
| Less than 5 Minutes | 87 (5.8%) | 34 (2.9%) |
| 5 to 9 Minutes | 229 (15.3%) | 258 (21.7%) |
| 10 to 14 Minutes | 49 (3.3%) | 408 (34.3%) |
| 15 to 19 Minutes | 72 (4.8%) | 122 (10.2%) |
| 20 to 24 Minutes | 133 (8.9%) | 101 (8.5%) |
| 25 to 29 Minutes | 0 (0.0%) | 0 (0.0%) |
| 30 to 34 Minutes | 229 (15.3%) | 83 (7.0%) |
| 35 to 39 Minutes | 65 (4.3%) | 15 (1.3%) |
| 40 to 44 Minutes | 39 (2.6%) | 0 (0.0%) |
| 45 to 59 Minutes | 284 (19.0%) | 98 (8.2%) |
| 60 to 89 Minutes | 288 (19.3%) | 71 (6.0%) |
| 90 or more Minutes | 18 (1.2%) | 0 (0.0%) |
Time of Departure to Work by Sex in Liberty
The most frequent times of departure to work in Liberty are 6:00 AM to 6:29 AM (333, 22.3%) for males and 6:30 AM to 6:59 AM (559, 47.0%) for females.
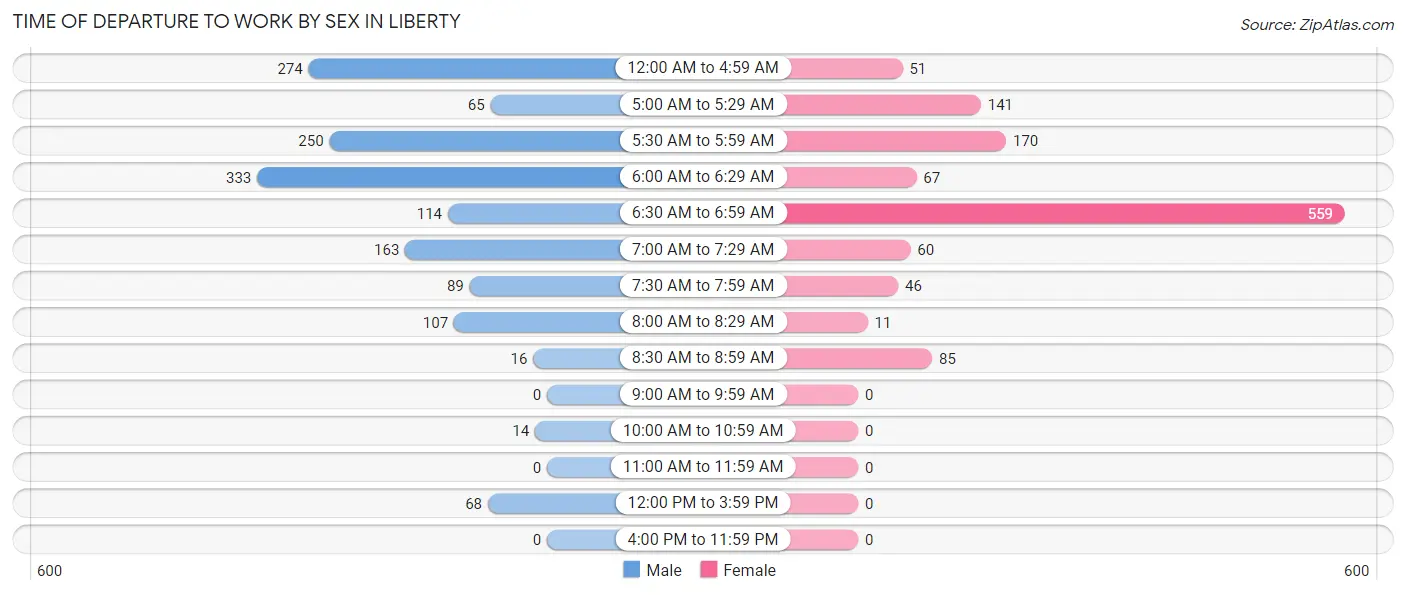
| Time of Departure | Male | Female |
| 12:00 AM to 4:59 AM | 274 (18.3%) | 51 (4.3%) |
| 5:00 AM to 5:29 AM | 65 (4.3%) | 141 (11.8%) |
| 5:30 AM to 5:59 AM | 250 (16.7%) | 170 (14.3%) |
| 6:00 AM to 6:29 AM | 333 (22.3%) | 67 (5.6%) |
| 6:30 AM to 6:59 AM | 114 (7.6%) | 559 (47.0%) |
| 7:00 AM to 7:29 AM | 163 (10.9%) | 60 (5.0%) |
| 7:30 AM to 7:59 AM | 89 (6.0%) | 46 (3.9%) |
| 8:00 AM to 8:29 AM | 107 (7.2%) | 11 (0.9%) |
| 8:30 AM to 8:59 AM | 16 (1.1%) | 85 (7.1%) |
| 9:00 AM to 9:59 AM | 0 (0.0%) | 0 (0.0%) |
| 10:00 AM to 10:59 AM | 14 (0.9%) | 0 (0.0%) |
| 11:00 AM to 11:59 AM | 0 (0.0%) | 0 (0.0%) |
| 12:00 PM to 3:59 PM | 68 (4.5%) | 0 (0.0%) |
| 4:00 PM to 11:59 PM | 0 (0.0%) | 0 (0.0%) |
| Total | 1,493 (100.0%) | 1,190 (100.0%) |
Housing Occupancy in Liberty
Occupancy by Ownership in Liberty
Of the total 2,884 dwellings in Liberty, owner-occupied units account for 2,045 (70.9%), while renter-occupied units make up 839 (29.1%).
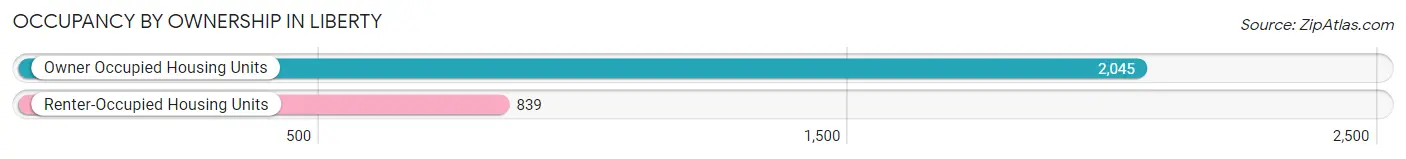
| Occupancy | # Housing Units | % Housing Units |
| Owner Occupied Housing Units | 2,045 | 70.9% |
| Renter-Occupied Housing Units | 839 | 29.1% |
| Total Occupied Housing Units | 2,884 | 100.0% |
Occupancy by Household Size in Liberty
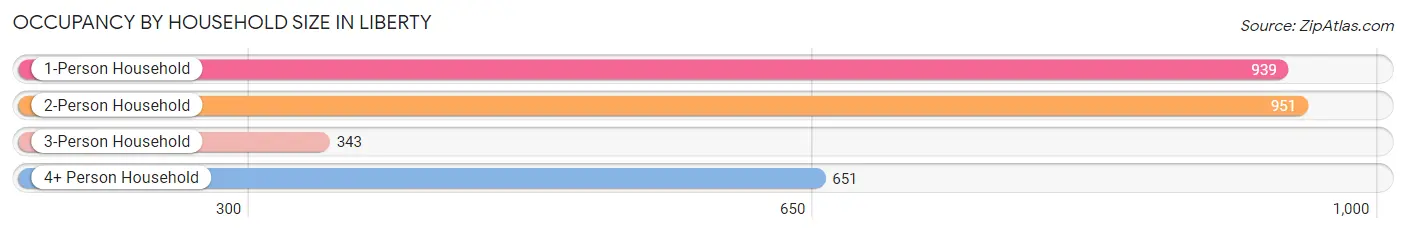
| Household Size | # Housing Units | % Housing Units |
| 1-Person Household | 939 | 32.6% |
| 2-Person Household | 951 | 33.0% |
| 3-Person Household | 343 | 11.9% |
| 4+ Person Household | 651 | 22.6% |
| Total Housing Units | 2,884 | 100.0% |
Occupancy by Ownership by Household Size in Liberty
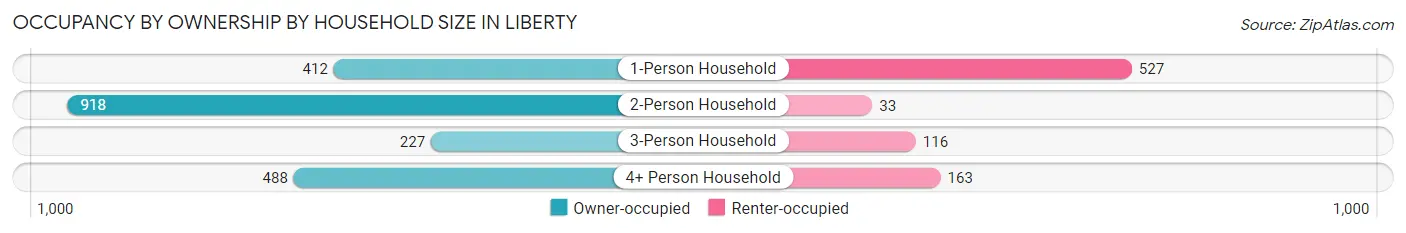
| Household Size | Owner-occupied | Renter-occupied |
| 1-Person Household | 412 (43.9%) | 527 (56.1%) |
| 2-Person Household | 918 (96.5%) | 33 (3.5%) |
| 3-Person Household | 227 (66.2%) | 116 (33.8%) |
| 4+ Person Household | 488 (75.0%) | 163 (25.0%) |
| Total Housing Units | 2,045 (70.9%) | 839 (29.1%) |
Occupancy by Educational Attainment in Liberty
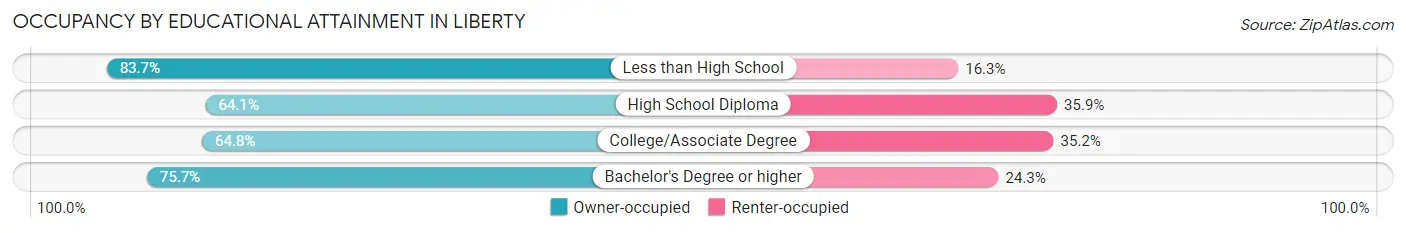
| Household Size | Owner-occupied | Renter-occupied |
| Less than High School | 483 (83.7%) | 94 (16.3%) |
| High School Diploma | 697 (64.1%) | 390 (35.9%) |
| College/Associate Degree | 350 (64.8%) | 190 (35.2%) |
| Bachelor's Degree or higher | 515 (75.7%) | 165 (24.3%) |
Occupancy by Age of Householder in Liberty
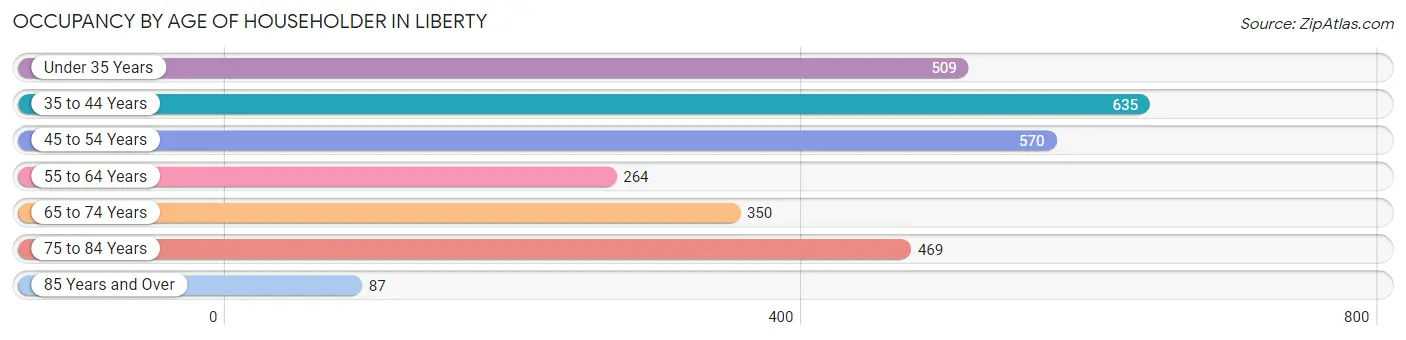
| Age Bracket | # Households | % Households |
| Under 35 Years | 509 | 17.6% |
| 35 to 44 Years | 635 | 22.0% |
| 45 to 54 Years | 570 | 19.8% |
| 55 to 64 Years | 264 | 9.1% |
| 65 to 74 Years | 350 | 12.1% |
| 75 to 84 Years | 469 | 16.3% |
| 85 Years and Over | 87 | 3.0% |
| Total | 2,884 | 100.0% |
Housing Finances in Liberty
Median Income by Occupancy in Liberty
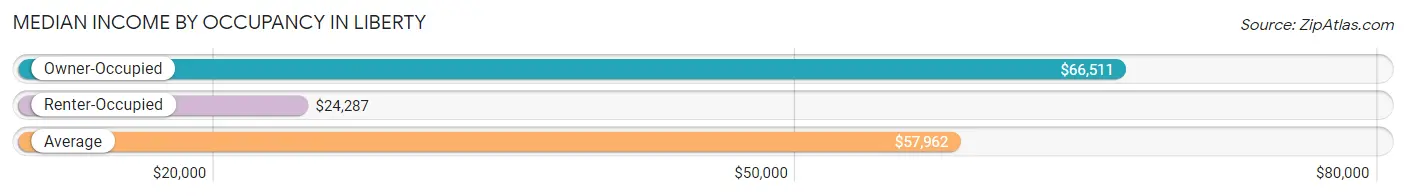
| Occupancy Type | # Households | Median Income |
| Owner-Occupied | 2,045 (70.9%) | $66,511 |
| Renter-Occupied | 839 (29.1%) | $24,287 |
| Average | 2,884 (100.0%) | $57,962 |
Occupancy by Householder Income Bracket in Liberty
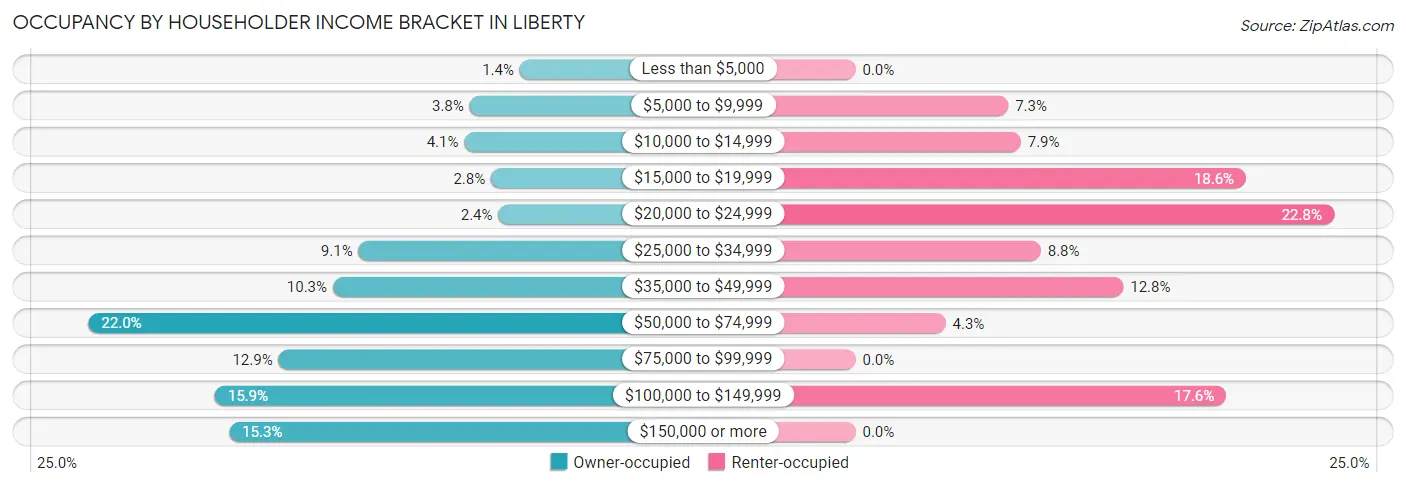
| Income Bracket | Owner-occupied | Renter-occupied |
| Less than $5,000 | 29 (1.4%) | 0 (0.0%) |
| $5,000 to $9,999 | 78 (3.8%) | 61 (7.3%) |
| $10,000 to $14,999 | 83 (4.1%) | 66 (7.9%) |
| $15,000 to $19,999 | 57 (2.8%) | 156 (18.6%) |
| $20,000 to $24,999 | 50 (2.4%) | 191 (22.8%) |
| $25,000 to $34,999 | 186 (9.1%) | 74 (8.8%) |
| $35,000 to $49,999 | 211 (10.3%) | 107 (12.8%) |
| $50,000 to $74,999 | 449 (22.0%) | 36 (4.3%) |
| $75,000 to $99,999 | 264 (12.9%) | 0 (0.0%) |
| $100,000 to $149,999 | 326 (15.9%) | 148 (17.6%) |
| $150,000 or more | 312 (15.3%) | 0 (0.0%) |
| Total | 2,045 (100.0%) | 839 (100.0%) |
Monthly Housing Cost Tiers in Liberty
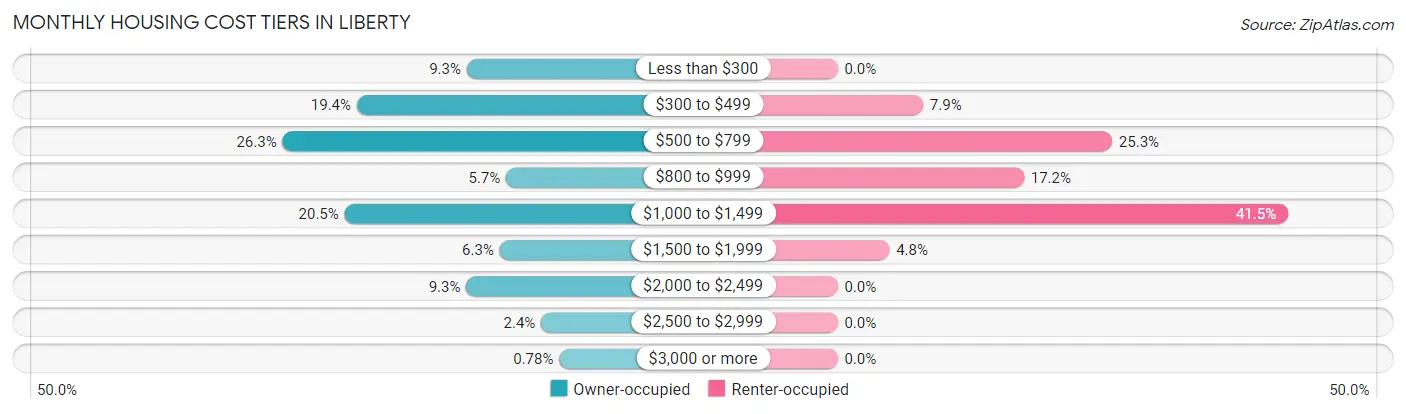
| Monthly Cost | Owner-occupied | Renter-occupied |
| Less than $300 | 190 (9.3%) | 0 (0.0%) |
| $300 to $499 | 397 (19.4%) | 66 (7.9%) |
| $500 to $799 | 537 (26.3%) | 212 (25.3%) |
| $800 to $999 | 116 (5.7%) | 144 (17.2%) |
| $1,000 to $1,499 | 420 (20.5%) | 348 (41.5%) |
| $1,500 to $1,999 | 128 (6.3%) | 40 (4.8%) |
| $2,000 to $2,499 | 191 (9.3%) | 0 (0.0%) |
| $2,500 to $2,999 | 50 (2.4%) | 0 (0.0%) |
| $3,000 or more | 16 (0.8%) | 0 (0.0%) |
| Total | 2,045 (100.0%) | 839 (100.0%) |
Physical Housing Characteristics in Liberty
Housing Structures in Liberty
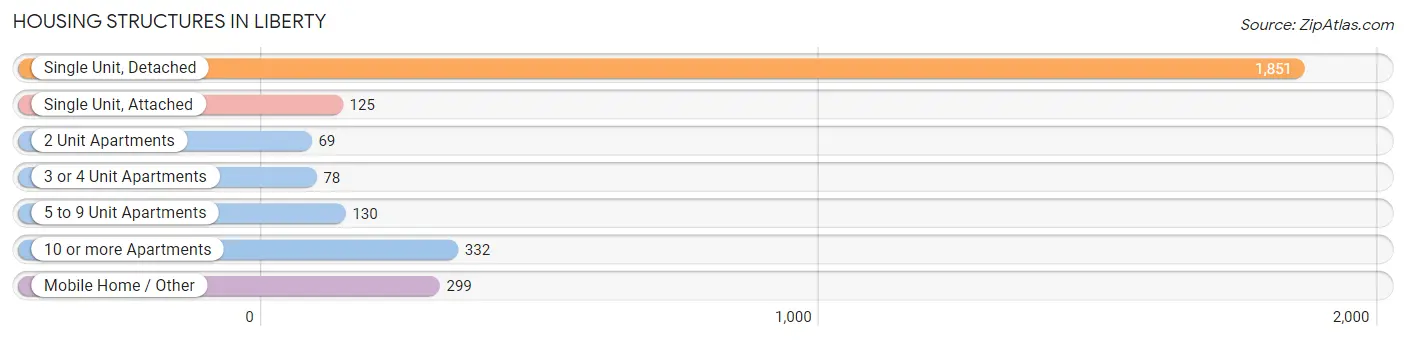
| Structure Type | # Housing Units | % Housing Units |
| Single Unit, Detached | 1,851 | 64.2% |
| Single Unit, Attached | 125 | 4.3% |
| 2 Unit Apartments | 69 | 2.4% |
| 3 or 4 Unit Apartments | 78 | 2.7% |
| 5 to 9 Unit Apartments | 130 | 4.5% |
| 10 or more Apartments | 332 | 11.5% |
| Mobile Home / Other | 299 | 10.4% |
| Total | 2,884 | 100.0% |
Housing Structures by Occupancy in Liberty
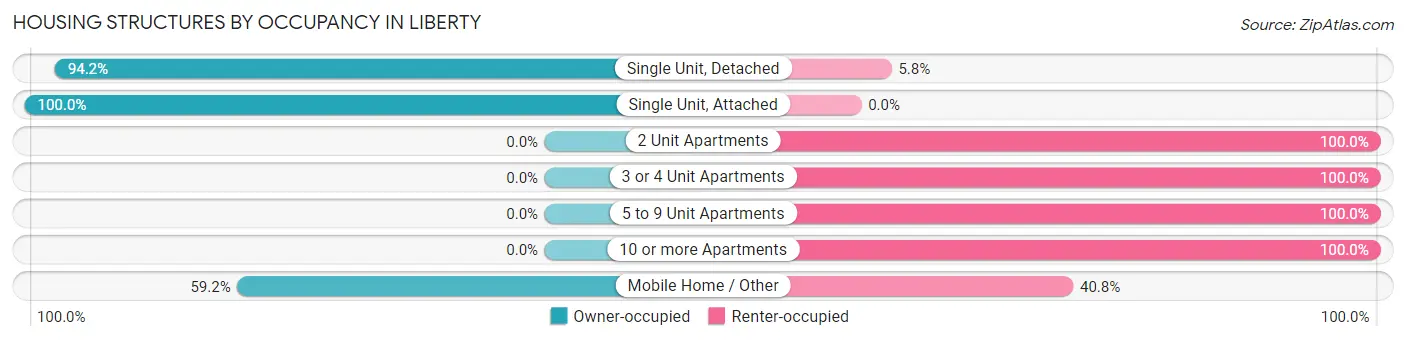
| Structure Type | Owner-occupied | Renter-occupied |
| Single Unit, Detached | 1,743 (94.2%) | 108 (5.8%) |
| Single Unit, Attached | 125 (100.0%) | 0 (0.0%) |
| 2 Unit Apartments | 0 (0.0%) | 69 (100.0%) |
| 3 or 4 Unit Apartments | 0 (0.0%) | 78 (100.0%) |
| 5 to 9 Unit Apartments | 0 (0.0%) | 130 (100.0%) |
| 10 or more Apartments | 0 (0.0%) | 332 (100.0%) |
| Mobile Home / Other | 177 (59.2%) | 122 (40.8%) |
| Total | 2,045 (70.9%) | 839 (29.1%) |
Housing Structures by Number of Rooms in Liberty
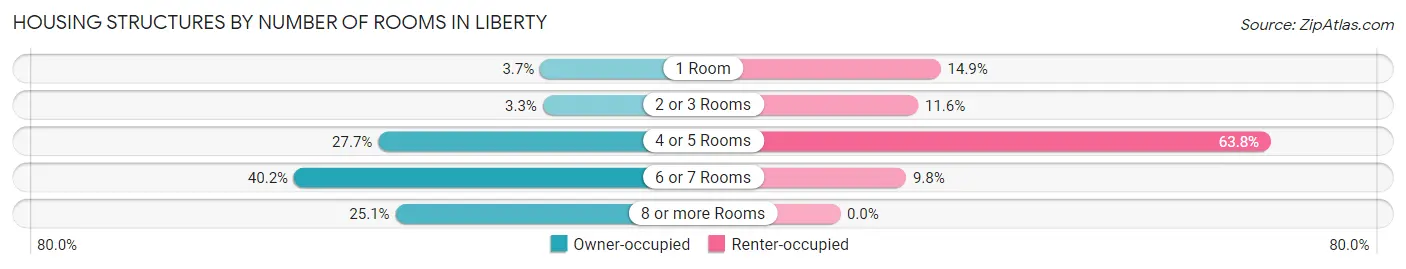
| Number of Rooms | Owner-occupied | Renter-occupied |
| 1 Room | 76 (3.7%) | 125 (14.9%) |
| 2 or 3 Rooms | 68 (3.3%) | 97 (11.6%) |
| 4 or 5 Rooms | 566 (27.7%) | 535 (63.8%) |
| 6 or 7 Rooms | 821 (40.2%) | 82 (9.8%) |
| 8 or more Rooms | 514 (25.1%) | 0 (0.0%) |
| Total | 2,045 (100.0%) | 839 (100.0%) |
Housing Structure by Heating Type in Liberty
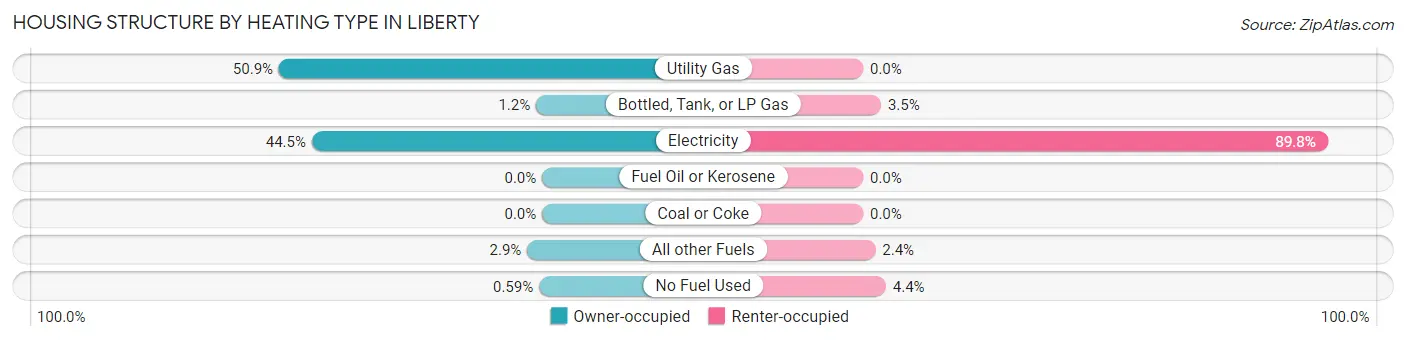
| Heating Type | Owner-occupied | Renter-occupied |
| Utility Gas | 1,040 (50.9%) | 0 (0.0%) |
| Bottled, Tank, or LP Gas | 24 (1.2%) | 29 (3.5%) |
| Electricity | 910 (44.5%) | 753 (89.7%) |
| Fuel Oil or Kerosene | 0 (0.0%) | 0 (0.0%) |
| Coal or Coke | 0 (0.0%) | 0 (0.0%) |
| All other Fuels | 59 (2.9%) | 20 (2.4%) |
| No Fuel Used | 12 (0.6%) | 37 (4.4%) |
| Total | 2,045 (100.0%) | 839 (100.0%) |
Household Vehicle Usage in Liberty
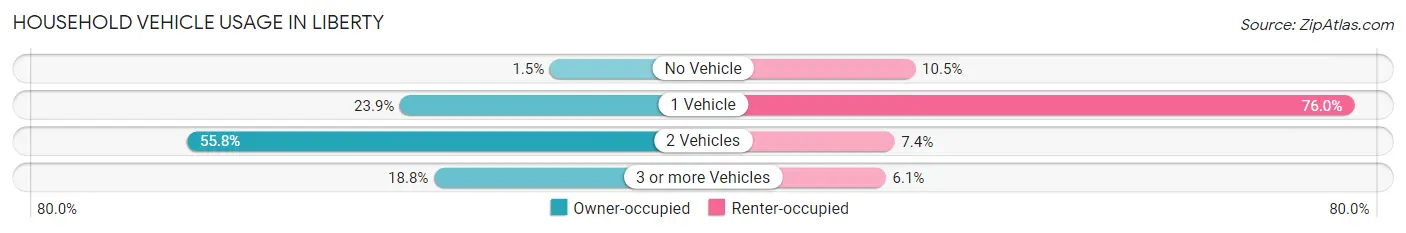
| Vehicles per Household | Owner-occupied | Renter-occupied |
| No Vehicle | 31 (1.5%) | 88 (10.5%) |
| 1 Vehicle | 489 (23.9%) | 638 (76.0%) |
| 2 Vehicles | 1,140 (55.7%) | 62 (7.4%) |
| 3 or more Vehicles | 385 (18.8%) | 51 (6.1%) |
| Total | 2,045 (100.0%) | 839 (100.0%) |
Real Estate & Mortgages in Liberty
Real Estate and Mortgage Overview in Liberty
| Characteristic | Without Mortgage | With Mortgage |
| Housing Units | 1,279 | 766 |
| Median Property Value | $129,900 | $157,900 |
| Median Household Income | $61,337 | $163 |
| Monthly Housing Costs | $602 | $16 |
| Real Estate Taxes | $2,314 | $20 |
Property Value by Mortgage Status in Liberty
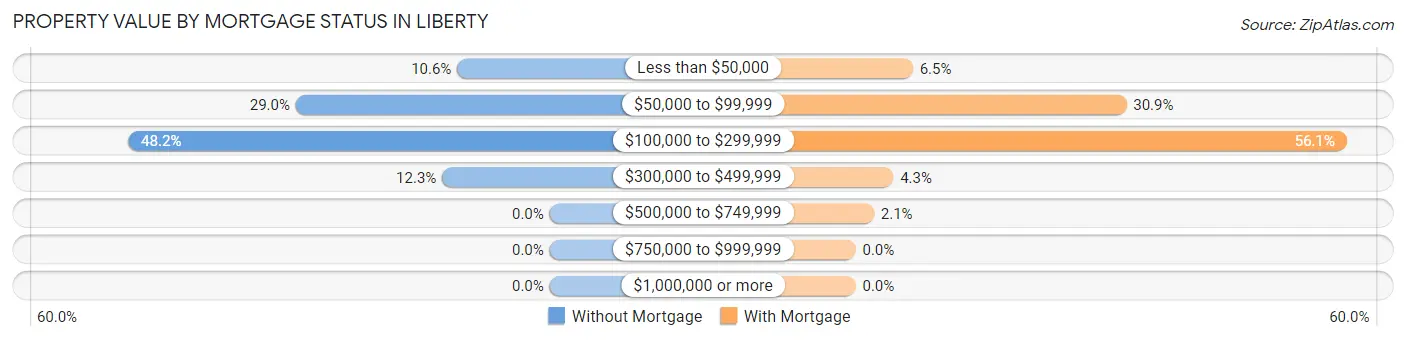
| Property Value | Without Mortgage | With Mortgage |
| Less than $50,000 | 135 (10.6%) | 50 (6.5%) |
| $50,000 to $99,999 | 371 (29.0%) | 237 (30.9%) |
| $100,000 to $299,999 | 616 (48.2%) | 430 (56.1%) |
| $300,000 to $499,999 | 157 (12.3%) | 33 (4.3%) |
| $500,000 to $749,999 | 0 (0.0%) | 16 (2.1%) |
| $750,000 to $999,999 | 0 (0.0%) | 0 (0.0%) |
| $1,000,000 or more | 0 (0.0%) | 0 (0.0%) |
| Total | 1,279 (100.0%) | 766 (100.0%) |
Household Income by Mortgage Status in Liberty
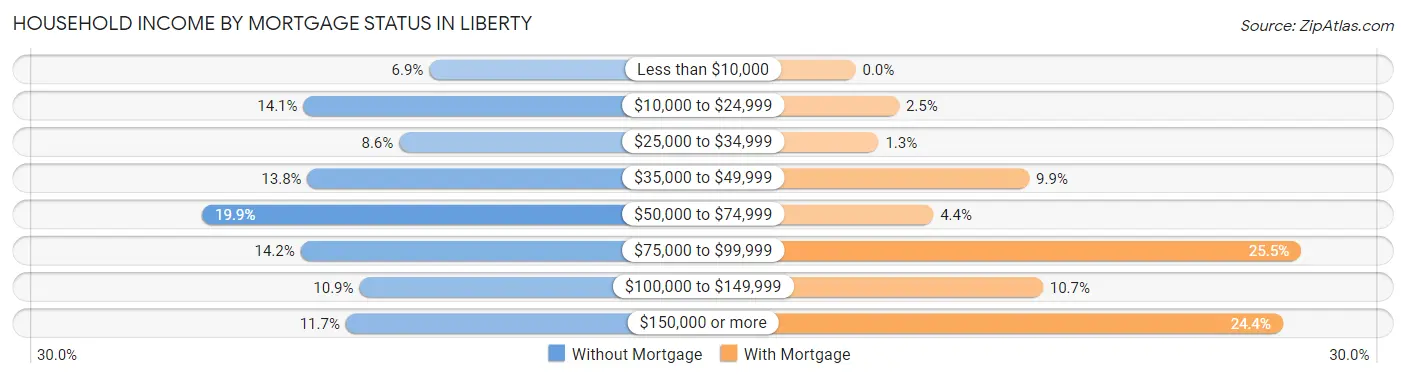
| Household Income | Without Mortgage | With Mortgage |
| Less than $10,000 | 88 (6.9%) | 0 (0.0%) |
| $10,000 to $24,999 | 180 (14.1%) | 19 (2.5%) |
| $25,000 to $34,999 | 110 (8.6%) | 10 (1.3%) |
| $35,000 to $49,999 | 177 (13.8%) | 76 (9.9%) |
| $50,000 to $74,999 | 254 (19.9%) | 34 (4.4%) |
| $75,000 to $99,999 | 182 (14.2%) | 195 (25.5%) |
| $100,000 to $149,999 | 139 (10.9%) | 82 (10.7%) |
| $150,000 or more | 149 (11.7%) | 187 (24.4%) |
| Total | 1,279 (100.0%) | 766 (100.0%) |
Property Value to Household Income Ratio in Liberty
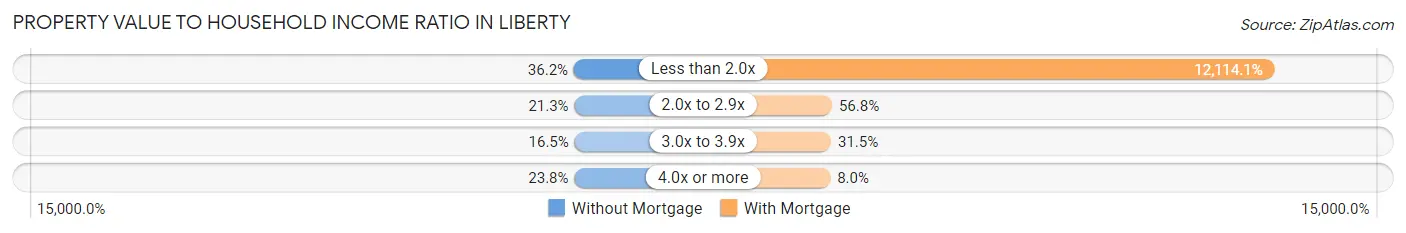
| Value-to-Income Ratio | Without Mortgage | With Mortgage |
| Less than 2.0x | 463 (36.2%) | 92,794 (12,114.1%) |
| 2.0x to 2.9x | 272 (21.3%) | 435 (56.8%) |
| 3.0x to 3.9x | 211 (16.5%) | 241 (31.5%) |
| 4.0x or more | 304 (23.8%) | 61 (8.0%) |
| Total | 1,279 (100.0%) | 766 (100.0%) |
Real Estate Taxes by Mortgage Status in Liberty
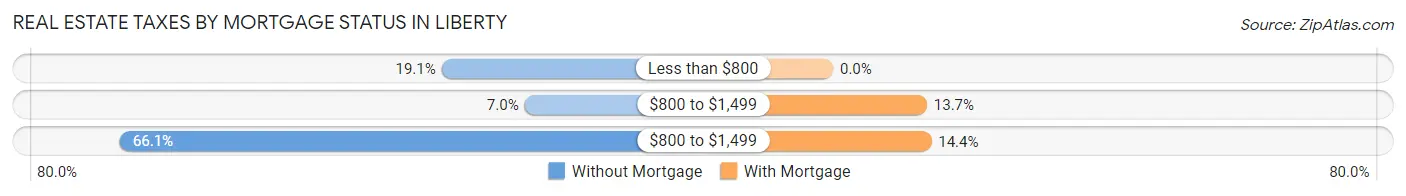
| Property Taxes | Without Mortgage | With Mortgage |
| Less than $800 | 244 (19.1%) | 0 (0.0%) |
| $800 to $1,499 | 89 (7.0%) | 105 (13.7%) |
| $800 to $1,499 | 845 (66.1%) | 110 (14.4%) |
| Total | 1,279 (100.0%) | 766 (100.0%) |
Health & Disability in Liberty
Health Insurance Coverage by Age in Liberty
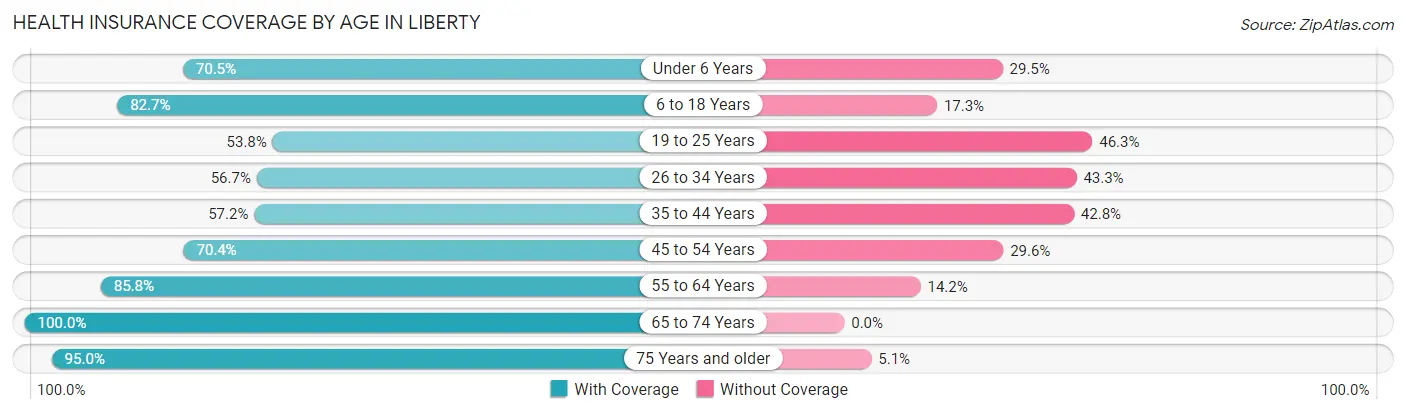
| Age Bracket | With Coverage | Without Coverage |
| Under 6 Years | 623 (70.5%) | 261 (29.5%) |
| 6 to 18 Years | 1,072 (82.7%) | 224 (17.3%) |
| 19 to 25 Years | 380 (53.7%) | 327 (46.3%) |
| 26 to 34 Years | 397 (56.7%) | 303 (43.3%) |
| 35 to 44 Years | 792 (57.2%) | 593 (42.8%) |
| 45 to 54 Years | 601 (70.4%) | 253 (29.6%) |
| 55 to 64 Years | 392 (85.8%) | 65 (14.2%) |
| 65 to 74 Years | 696 (100.0%) | 0 (0.0%) |
| 75 Years and older | 752 (95.0%) | 40 (5.1%) |
| Total | 5,705 (73.4%) | 2,066 (26.6%) |
Health Insurance Coverage by Citizenship Status in Liberty
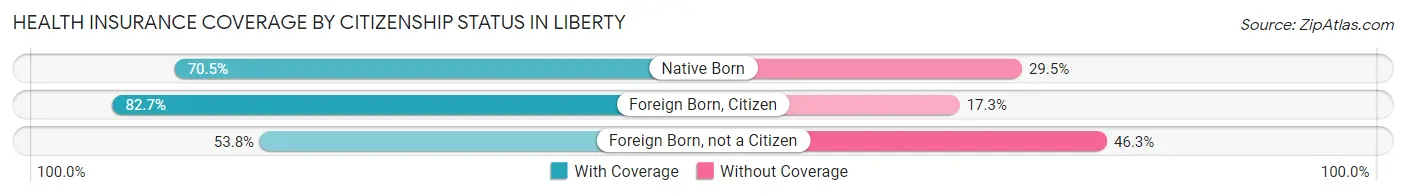
| Citizenship Status | With Coverage | Without Coverage |
| Native Born | 623 (70.5%) | 261 (29.5%) |
| Foreign Born, Citizen | 1,072 (82.7%) | 224 (17.3%) |
| Foreign Born, not a Citizen | 380 (53.7%) | 327 (46.3%) |
Health Insurance Coverage by Household Income in Liberty
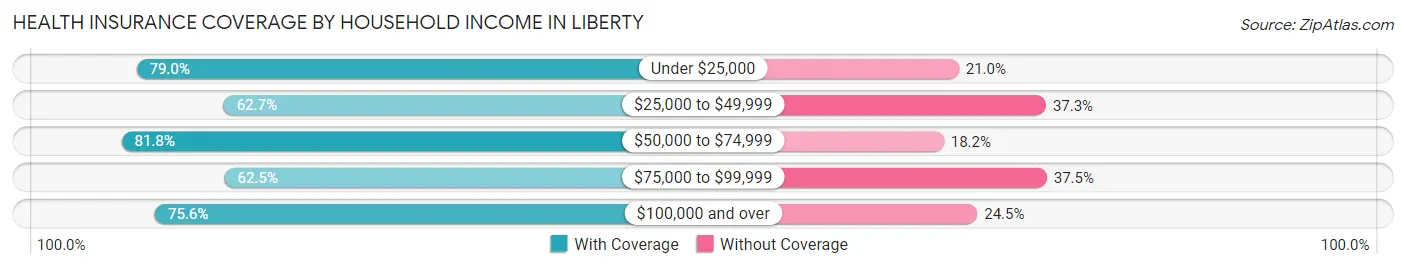
| Household Income | With Coverage | Without Coverage |
| Under $25,000 | 904 (79.0%) | 240 (21.0%) |
| $25,000 to $49,999 | 946 (62.7%) | 563 (37.3%) |
| $50,000 to $74,999 | 1,347 (81.8%) | 299 (18.2%) |
| $75,000 to $99,999 | 559 (62.5%) | 335 (37.5%) |
| $100,000 and over | 1,931 (75.5%) | 625 (24.4%) |
Public vs Private Health Insurance Coverage by Age in Liberty
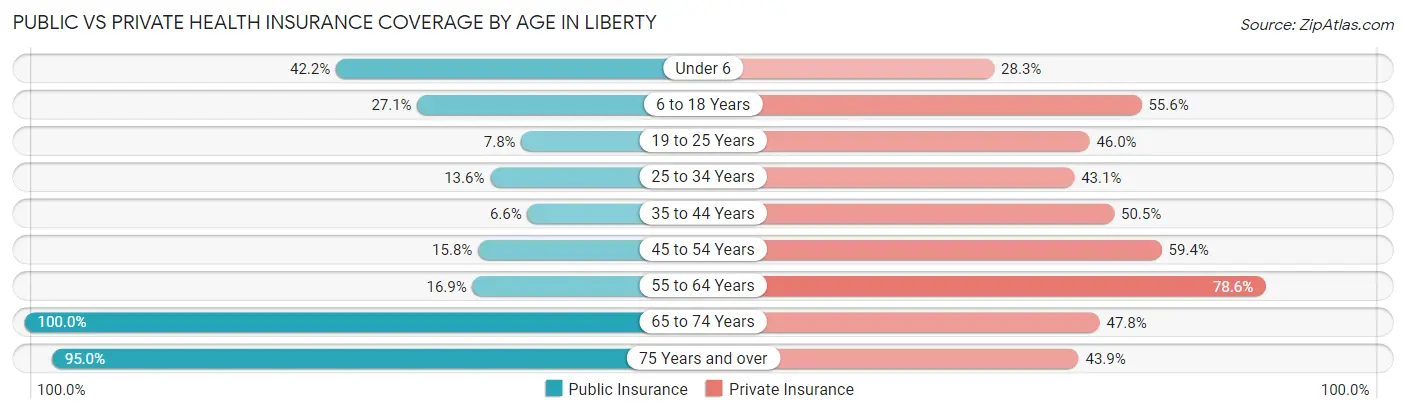
| Age Bracket | Public Insurance | Private Insurance |
| Under 6 | 373 (42.2%) | 250 (28.3%) |
| 6 to 18 Years | 351 (27.1%) | 721 (55.6%) |
| 19 to 25 Years | 55 (7.8%) | 325 (46.0%) |
| 25 to 34 Years | 95 (13.6%) | 302 (43.1%) |
| 35 to 44 Years | 92 (6.6%) | 700 (50.5%) |
| 45 to 54 Years | 135 (15.8%) | 507 (59.4%) |
| 55 to 64 Years | 77 (16.9%) | 359 (78.6%) |
| 65 to 74 Years | 696 (100.0%) | 333 (47.8%) |
| 75 Years and over | 752 (95.0%) | 348 (43.9%) |
| Total | 2,626 (33.8%) | 3,845 (49.5%) |
Disability Status by Sex by Age in Liberty
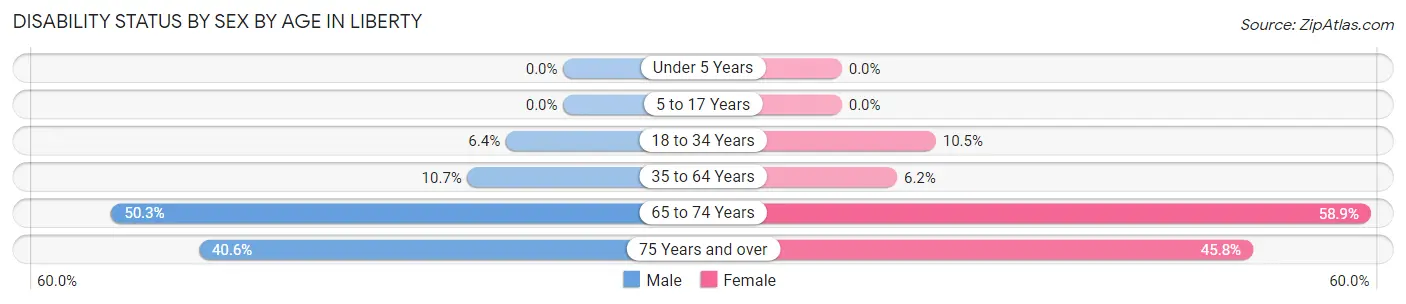
| Age Bracket | Male | Female |
| Under 5 Years | 0 (0.0%) | 0 (0.0%) |
| 5 to 17 Years | 0 (0.0%) | 0 (0.0%) |
| 18 to 34 Years | 40 (6.4%) | 95 (10.5%) |
| 35 to 64 Years | 140 (10.7%) | 85 (6.1%) |
| 65 to 74 Years | 147 (50.3%) | 238 (58.9%) |
| 75 Years and over | 153 (40.6%) | 190 (45.8%) |
Disability Class by Sex by Age in Liberty
Disability Class: Hearing Difficulty
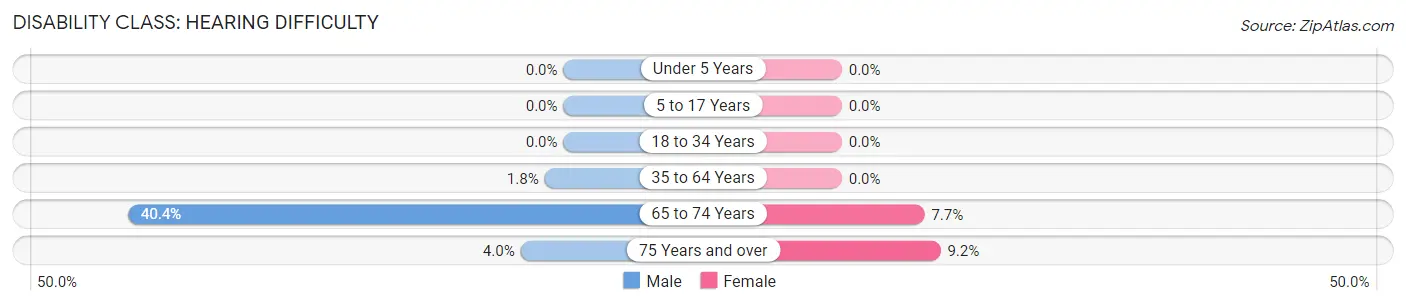
| Age Bracket | Male | Female |
| Under 5 Years | 0 (0.0%) | 0 (0.0%) |
| 5 to 17 Years | 0 (0.0%) | 0 (0.0%) |
| 18 to 34 Years | 0 (0.0%) | 0 (0.0%) |
| 35 to 64 Years | 23 (1.8%) | 0 (0.0%) |
| 65 to 74 Years | 118 (40.4%) | 31 (7.7%) |
| 75 Years and over | 15 (4.0%) | 38 (9.2%) |
Disability Class: Vision Difficulty
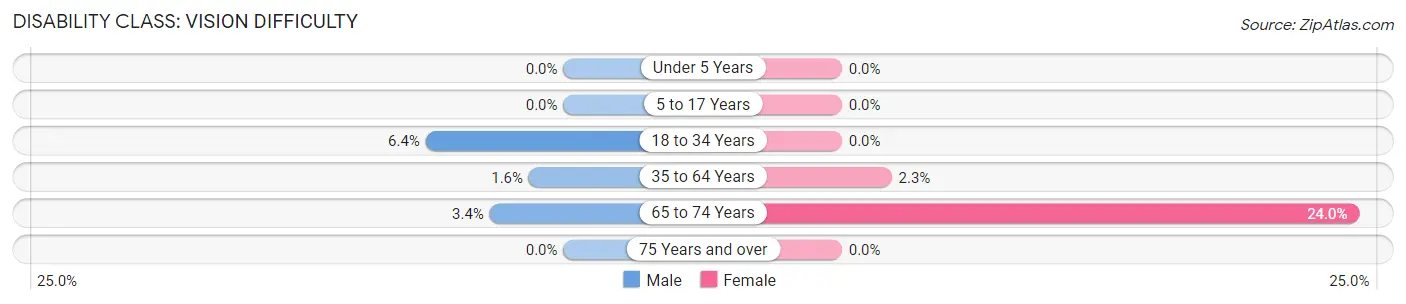
| Age Bracket | Male | Female |
| Under 5 Years | 0 (0.0%) | 0 (0.0%) |
| 5 to 17 Years | 0 (0.0%) | 0 (0.0%) |
| 18 to 34 Years | 40 (6.4%) | 0 (0.0%) |
| 35 to 64 Years | 21 (1.6%) | 32 (2.3%) |
| 65 to 74 Years | 10 (3.4%) | 97 (24.0%) |
| 75 Years and over | 0 (0.0%) | 0 (0.0%) |
Disability Class: Cognitive Difficulty
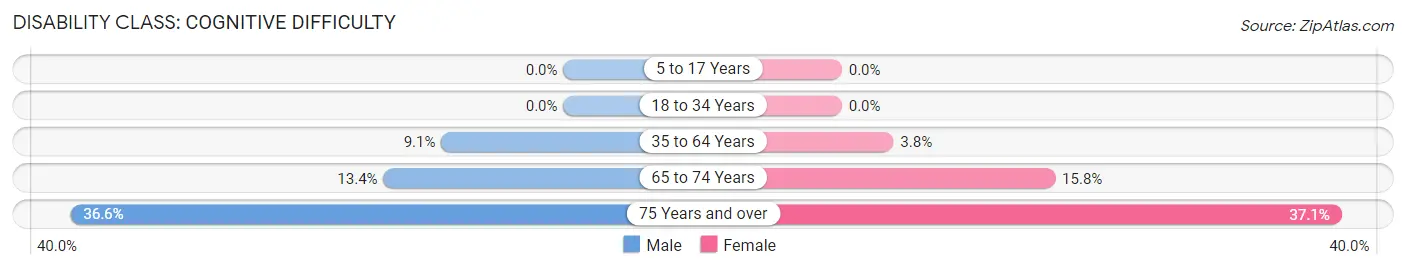
| Age Bracket | Male | Female |
| 5 to 17 Years | 0 (0.0%) | 0 (0.0%) |
| 18 to 34 Years | 0 (0.0%) | 0 (0.0%) |
| 35 to 64 Years | 119 (9.1%) | 53 (3.8%) |
| 65 to 74 Years | 39 (13.4%) | 64 (15.8%) |
| 75 Years and over | 138 (36.6%) | 154 (37.1%) |
Disability Class: Ambulatory Difficulty
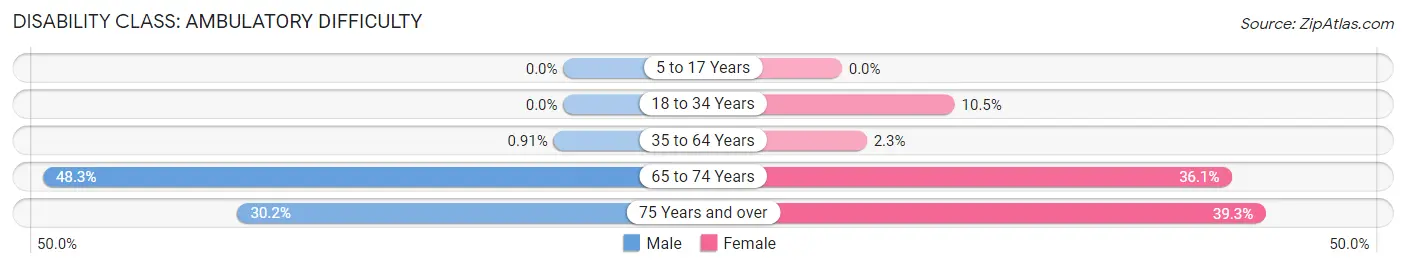
| Age Bracket | Male | Female |
| 5 to 17 Years | 0 (0.0%) | 0 (0.0%) |
| 18 to 34 Years | 0 (0.0%) | 95 (10.5%) |
| 35 to 64 Years | 12 (0.9%) | 32 (2.3%) |
| 65 to 74 Years | 141 (48.3%) | 146 (36.1%) |
| 75 Years and over | 114 (30.2%) | 163 (39.3%) |
Disability Class: Self-Care Difficulty
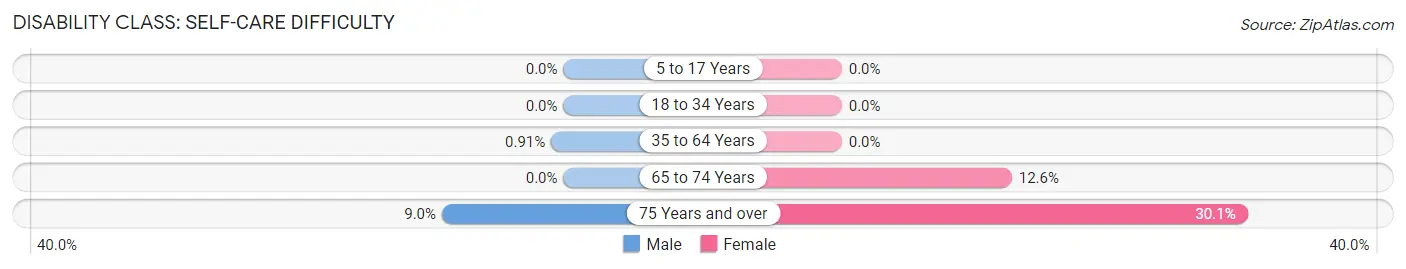
| Age Bracket | Male | Female |
| 5 to 17 Years | 0 (0.0%) | 0 (0.0%) |
| 18 to 34 Years | 0 (0.0%) | 0 (0.0%) |
| 35 to 64 Years | 12 (0.9%) | 0 (0.0%) |
| 65 to 74 Years | 0 (0.0%) | 51 (12.6%) |
| 75 Years and over | 34 (9.0%) | 125 (30.1%) |
Technology Access in Liberty
Computing Device Access in Liberty
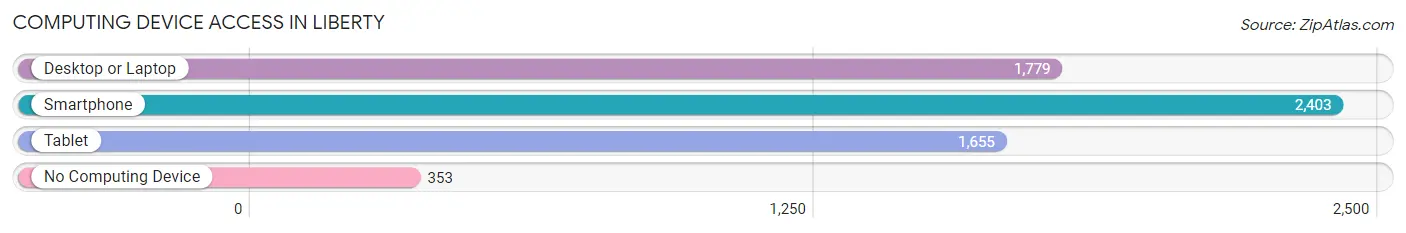
| Device Type | # Households | % Households |
| Desktop or Laptop | 1,779 | 61.7% |
| Smartphone | 2,403 | 83.3% |
| Tablet | 1,655 | 57.4% |
| No Computing Device | 353 | 12.2% |
| Total | 2,884 | 100.0% |
Internet Access in Liberty
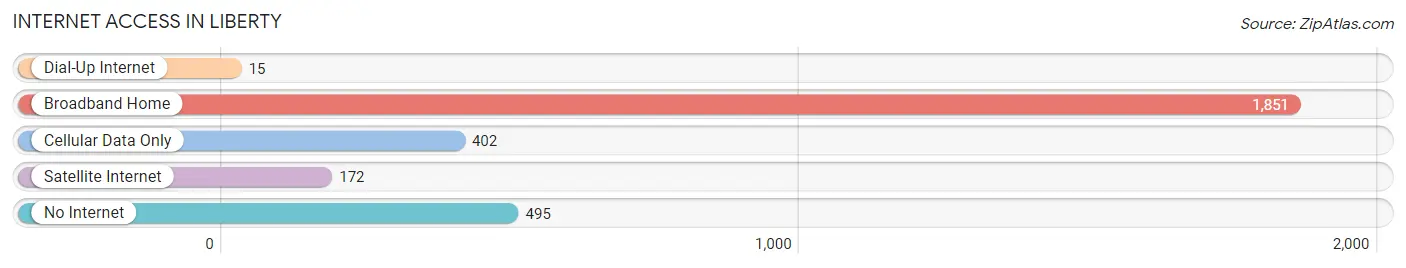
| Internet Type | # Households | % Households |
| Dial-Up Internet | 15 | 0.5% |
| Broadband Home | 1,851 | 64.2% |
| Cellular Data Only | 402 | 13.9% |
| Satellite Internet | 172 | 6.0% |
| No Internet | 495 | 17.2% |
| Total | 2,884 | 100.0% |
Liberty Summary
Liberty, Texas is a small city located in the southeastern part of the state, about 50 miles northeast of Houston. It is the county seat of Liberty County and has a population of 8,890 as of the 2010 census. The city is situated on the Trinity River and is known for its historic downtown area, which includes a courthouse square and several historic buildings.
History
The area that is now Liberty was first settled in the early 1800s by settlers from the United States and Mexico. The town was originally known as “Liberty Hill” and was established in 1831. The town was named after the Liberty Hill Plantation, which was owned by the Allen family. The town was officially incorporated in 1837 and was the first county seat of Liberty County.
In the late 1800s, Liberty was a thriving port town, with a population of over 1,000 people. The town was a major shipping point for cotton, lumber, and other goods. The town also had a number of businesses, including a bank, a hotel, and several stores.
In the early 1900s, Liberty experienced a period of decline due to the Great Depression and the decline of the cotton industry. The population of the town decreased to just over 500 people by the 1940s.
In the 1950s, the town began to experience a resurgence due to the growth of the oil and gas industry in the area. The population of the town increased to over 1,000 people by the 1960s.
Geography
Liberty is located in southeastern Texas, about 50 miles northeast of Houston. The city is situated on the Trinity River and is surrounded by rolling hills and wooded areas. The city has a total area of 4.2 square miles, all of which is land.
Economy
The economy of Liberty is largely based on the oil and gas industry. The city is home to several oil and gas companies, including Chevron, ExxonMobil, and Shell. The city also has a number of manufacturing companies, including a paper mill and a plastics plant.
The city also has a number of retail stores, restaurants, and other businesses. The city is also home to a number of government offices, including the Liberty County Courthouse.
Demographics
As of the 2010 census, the population of Liberty was 8,890. The racial makeup of the city was 79.3% White, 15.2% African American, 0.7% Native American, 0.5% Asian, 0.1% Pacific Islander, and 3.2% from other races. Hispanic or Latino of any race were 8.2% of the population.
The median income for a household in Liberty was $35,938, and the median income for a family was $41,944. The per capita income for the city was $17,845. About 17.2% of families and 20.3% of the population were below the poverty line, including 28.2% of those under age 18 and 11.2% of those age 65 or over.
Conclusion
Liberty, Texas is a small city located in the southeastern part of the state, about 50 miles northeast of Houston. It is the county seat of Liberty County and has a population of 8,890 as of the 2010 census. The city is situated on the Trinity River and is known for its historic downtown area, which includes a courthouse square and several historic buildings. The economy of Liberty is largely based on the oil and gas industry, and the city also has a number of manufacturing companies, retail stores, restaurants, and other businesses. The population of Liberty is largely White, with a significant African American population. The median income for a household in Liberty is $35,938, and the per capita income for the city is $17,845.
Common Questions
What is Per Capita Income in Liberty?
Per Capita income in Liberty is $29,250.
What is the Median Family Income in Liberty?
Median Family Income in Liberty is $78,590.
What is the Median Household income in Liberty?
Median Household Income in Liberty is $57,962.
What is Income or Wage Gap in Liberty?
Income or Wage Gap in Liberty is 50.4%.
Women in Liberty earn 49.6 cents for every dollar earned by a man.
What is Inequality or Gini Index in Liberty?
Inequality or Gini Index in Liberty is 0.51.
What is the Total Population of Liberty?
Total Population of Liberty is 8,348.
What is the Total Male Population of Liberty?
Total Male Population of Liberty is 3,741.
What is the Total Female Population of Liberty?
Total Female Population of Liberty is 4,607.
What is the Ratio of Males per 100 Females in Liberty?
There are 81.20 Males per 100 Females in Liberty.
What is the Ratio of Females per 100 Males in Liberty?
There are 123.15 Females per 100 Males in Liberty.
What is the Median Population Age in Liberty?
Median Population Age in Liberty is 39.0 Years.
What is the Average Family Size in Liberty
Average Family Size in Liberty is 3.5 People.
What is the Average Household Size in Liberty
Average Household Size in Liberty is 2.7 People.
How Large is the Labor Force in Liberty?
There are 3,073 People in the Labor Forcein in Liberty.
What is the Percentage of People in the Labor Force in Liberty?
48.1% of People are in the Labor Force in Liberty.
What is the Unemployment Rate in Liberty?
Unemployment Rate in Liberty is 7.1%.