La Homa, TX Map & Demographics
La Homa Map
La Homa Overview
$15,122
PER CAPITA INCOME
$42,139
AVG FAMILY INCOME
$38,365
AVG HOUSEHOLD INCOME
37.9%
WAGE / INCOME GAP [ % ]
62.1¢/ $1
WAGE / INCOME GAP [ $ ]
$10,035
FAMILY INCOME DEFICIT
0.46
INEQUALITY / GINI INDEX
10,661
TOTAL POPULATION
5,218
MALE POPULATION
5,443
FEMALE POPULATION
95.87
MALES / 100 FEMALES
104.31
FEMALES / 100 MALES
27.8
MEDIAN AGE
4.0
AVG FAMILY SIZE
3.6
AVG HOUSEHOLD SIZE
4,496
LABOR FORCE [ PEOPLE ]
63.4%
PERCENT IN LABOR FORCE
13.3%
UNEMPLOYMENT RATE
Income in La Homa
Income Overview in La Homa
Per Capita Income in La Homa is $15,122, while median incomes of families and households are $42,139 and $38,365 respectively.
| Characteristic | Number | Measure |
| Per Capita Income | 10,661 | $15,122 |
| Median Family Income | 2,483 | $42,139 |
| Mean Family Income | 2,483 | $56,896 |
| Median Household Income | 2,915 | $38,365 |
| Mean Household Income | 2,915 | $52,249 |
| Income Deficit | 2,483 | $10,035 |
| Wage / Income Gap (%) | 10,661 | 37.86% |
| Wage / Income Gap ($) | 10,661 | 62.14¢ per $1 |
| Gini / Inequality Index | 10,661 | 0.46 |
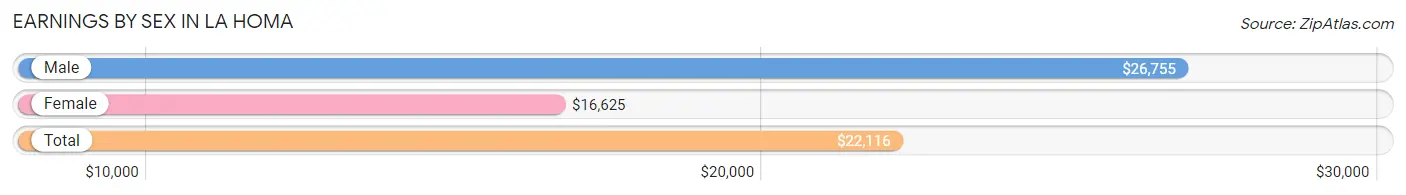
Earnings by Sex in La Homa
Average Earnings in La Homa are $22,116, $26,755 for men and $16,625 for women, a difference of 37.9%.
| Sex | Number | Average Earnings |
| Male | 2,649 (56.5%) | $26,755 |
| Female | 2,038 (43.5%) | $16,625 |
| Total | 4,687 (100.0%) | $22,116 |
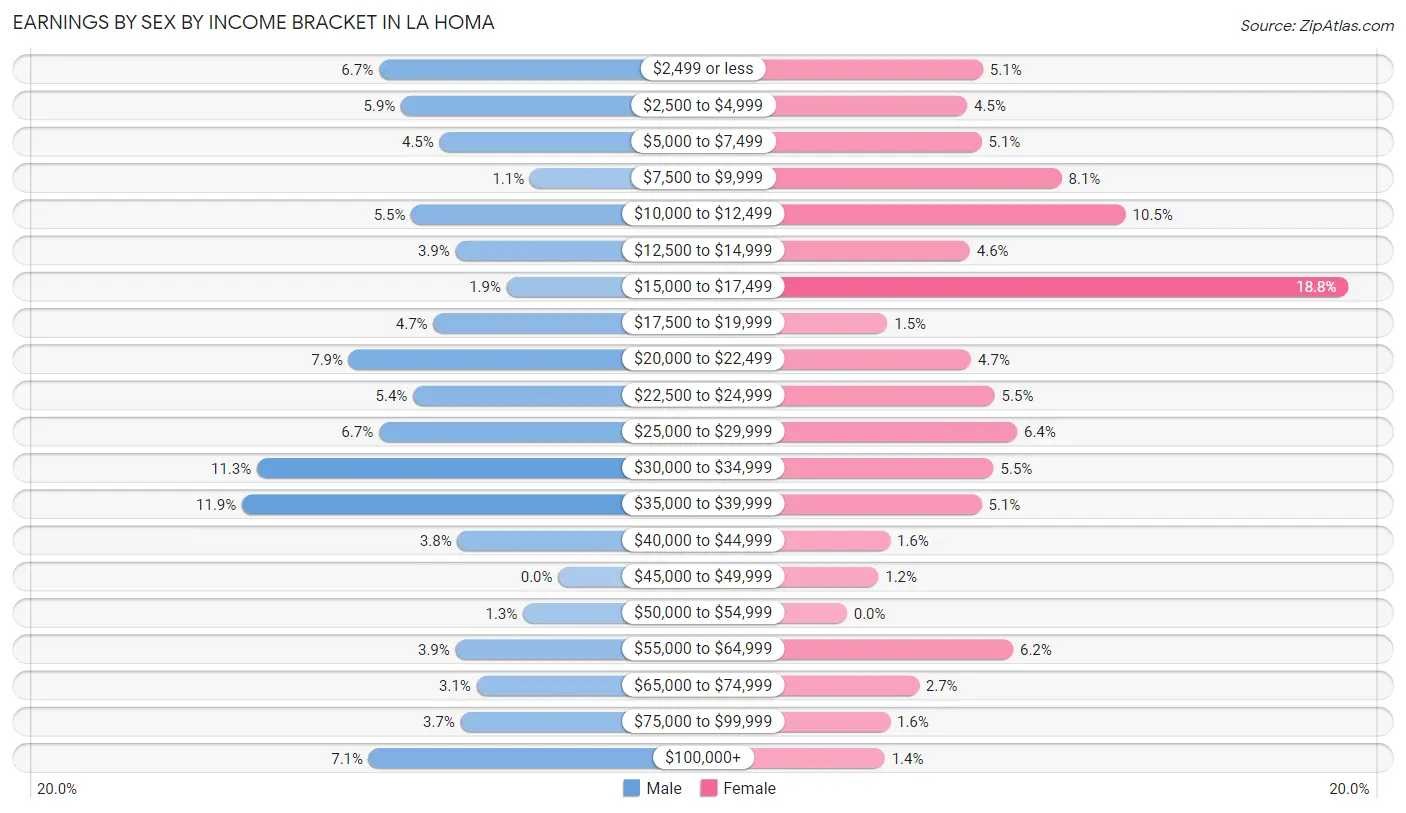
Earnings by Sex by Income Bracket in La Homa
The most common earnings brackets in La Homa are $35,000 to $39,999 for men (314 | 11.8%) and $15,000 to $17,499 for women (383 | 18.8%).
| Income | Male | Female |
| $2,499 or less | 178 (6.7%) | 104 (5.1%) |
| $2,500 to $4,999 | 156 (5.9%) | 92 (4.5%) |
| $5,000 to $7,499 | 118 (4.4%) | 103 (5.1%) |
| $7,500 to $9,999 | 28 (1.1%) | 164 (8.1%) |
| $10,000 to $12,499 | 146 (5.5%) | 213 (10.4%) |
| $12,500 to $14,999 | 102 (3.8%) | 94 (4.6%) |
| $15,000 to $17,499 | 51 (1.9%) | 383 (18.8%) |
| $17,500 to $19,999 | 124 (4.7%) | 31 (1.5%) |
| $20,000 to $22,499 | 208 (7.9%) | 95 (4.7%) |
| $22,500 to $24,999 | 144 (5.4%) | 113 (5.5%) |
| $25,000 to $29,999 | 178 (6.7%) | 130 (6.4%) |
| $30,000 to $34,999 | 299 (11.3%) | 112 (5.5%) |
| $35,000 to $39,999 | 314 (11.8%) | 103 (5.1%) |
| $40,000 to $44,999 | 100 (3.8%) | 33 (1.6%) |
| $45,000 to $49,999 | 0 (0.0%) | 24 (1.2%) |
| $50,000 to $54,999 | 35 (1.3%) | 0 (0.0%) |
| $55,000 to $64,999 | 102 (3.8%) | 127 (6.2%) |
| $65,000 to $74,999 | 81 (3.1%) | 55 (2.7%) |
| $75,000 to $99,999 | 97 (3.7%) | 33 (1.6%) |
| $100,000+ | 188 (7.1%) | 29 (1.4%) |
| Total | 2,649 (100.0%) | 2,038 (100.0%) |
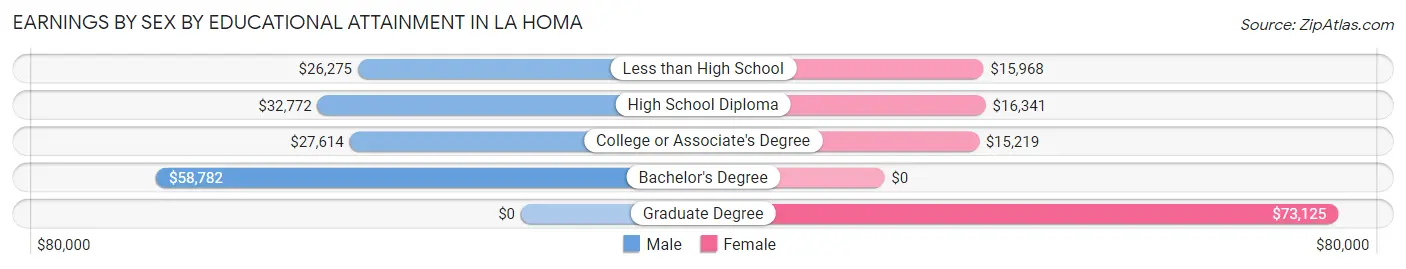
Earnings by Sex by Educational Attainment in La Homa
Average earnings in La Homa are $31,365 for men and $17,060 for women, a difference of 45.6%. Men with an educational attainment of bachelor's degree enjoy the highest average annual earnings of $58,782, while those with less than high school education earn the least with $26,275. Women with an educational attainment of graduate degree earn the most with the average annual earnings of $73,125, while those with college or associate's degree education have the smallest earnings of $15,219.
| Educational Attainment | Male Income | Female Income |
| Less than High School | $26,275 | $15,968 |
| High School Diploma | $32,772 | $16,341 |
| College or Associate's Degree | $27,614 | $15,219 |
| Bachelor's Degree | $58,782 | $0 |
| Graduate Degree | - | - |
| Total | $31,365 | $17,060 |
Family Income in La Homa
Family Income Brackets in La Homa
According to the La Homa family income data, there are 546 families falling into the $35,000 to $49,999 income range, which is the most common income bracket and makes up 22.0% of all families. Conversely, the $200,000+ income bracket is the least frequent group with only 62 families (2.5%) belonging to this category.
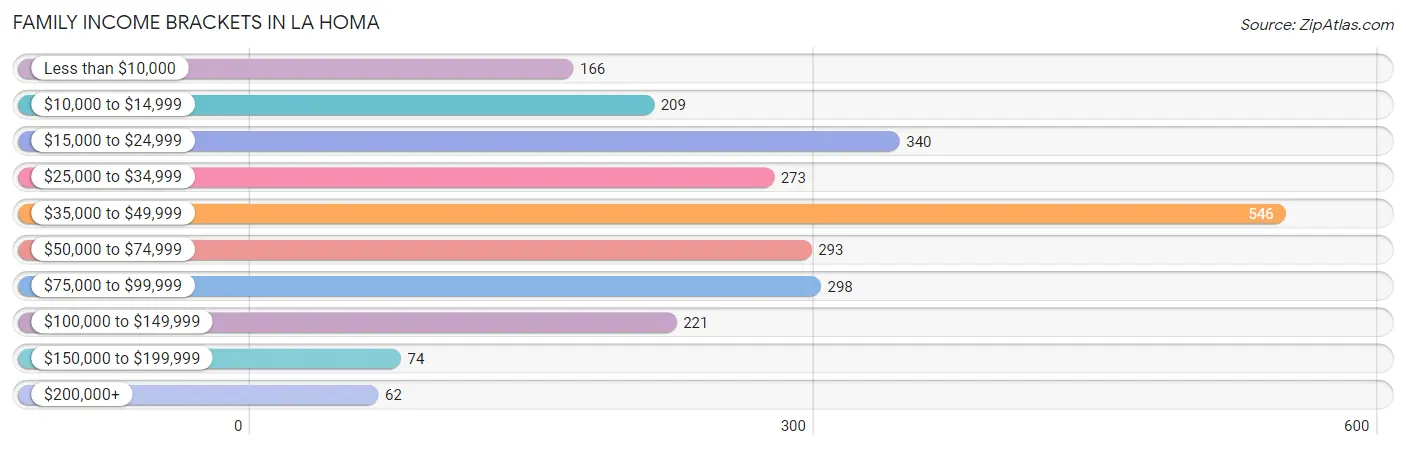
| Income Bracket | # Families | % Families |
| Less than $10,000 | 166 | 6.7% |
| $10,000 to $14,999 | 209 | 8.4% |
| $15,000 to $24,999 | 340 | 13.7% |
| $25,000 to $34,999 | 273 | 11.0% |
| $35,000 to $49,999 | 546 | 22.0% |
| $50,000 to $74,999 | 293 | 11.8% |
| $75,000 to $99,999 | 298 | 12.0% |
| $100,000 to $149,999 | 221 | 8.9% |
| $150,000 to $199,999 | 74 | 3.0% |
| $200,000+ | 62 | 2.5% |
Family Income by Famaliy Size in La Homa
7+ person families (140 | 5.6%) account for the highest median family income in La Homa with $130,323 per family, while 7+ person families (140 | 5.6%) have the highest median income of $18,618 per family member.
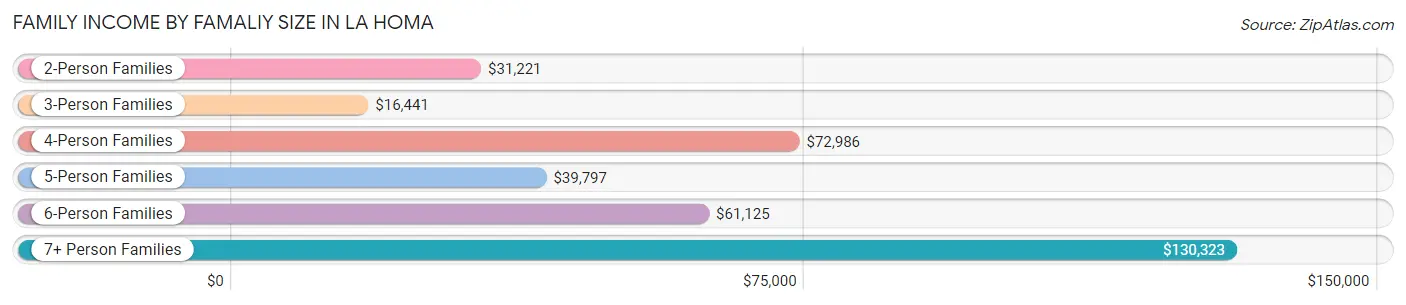
| Income Bracket | # Families | Median Income |
| 2-Person Families | 735 (29.6%) | $31,221 |
| 3-Person Families | 376 (15.1%) | $16,441 |
| 4-Person Families | 611 (24.6%) | $72,986 |
| 5-Person Families | 418 (16.8%) | $39,797 |
| 6-Person Families | 203 (8.2%) | $61,125 |
| 7+ Person Families | 140 (5.6%) | $130,323 |
| Total | 2,483 (100.0%) | $42,139 |
Family Income by Number of Earners in La Homa
The median family income in La Homa is $42,139, with families comprising 3+ earners (453) having the highest median family income of $72,813, while families with no earners (285) have the lowest median family income of $15,065, accounting for 18.2% and 11.5% of families, respectively.
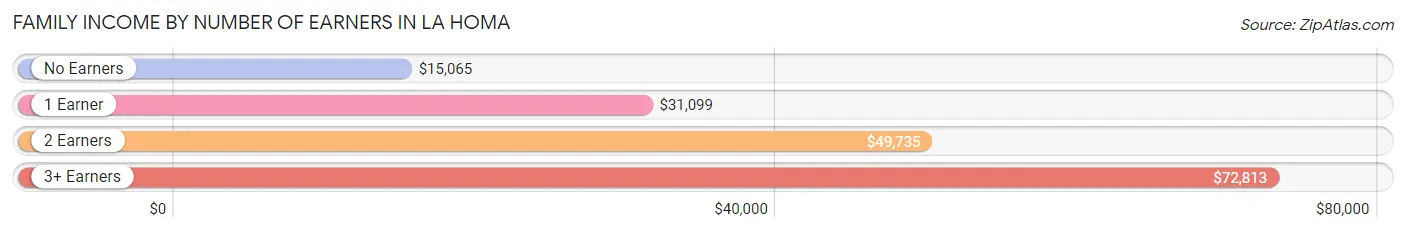
| Number of Earners | # Families | Median Income |
| No Earners | 285 (11.5%) | $15,065 |
| 1 Earner | 845 (34.0%) | $31,099 |
| 2 Earners | 900 (36.2%) | $49,735 |
| 3+ Earners | 453 (18.2%) | $72,813 |
| Total | 2,483 (100.0%) | $42,139 |
Household Income in La Homa
Household Income Brackets in La Homa
With 557 households falling in the category, the $35,000 to $49,999 income range is the most frequent in La Homa, accounting for 19.1% of all households. In contrast, only 64 households (2.2%) fall into the $200,000+ income bracket, making it the least populous group.
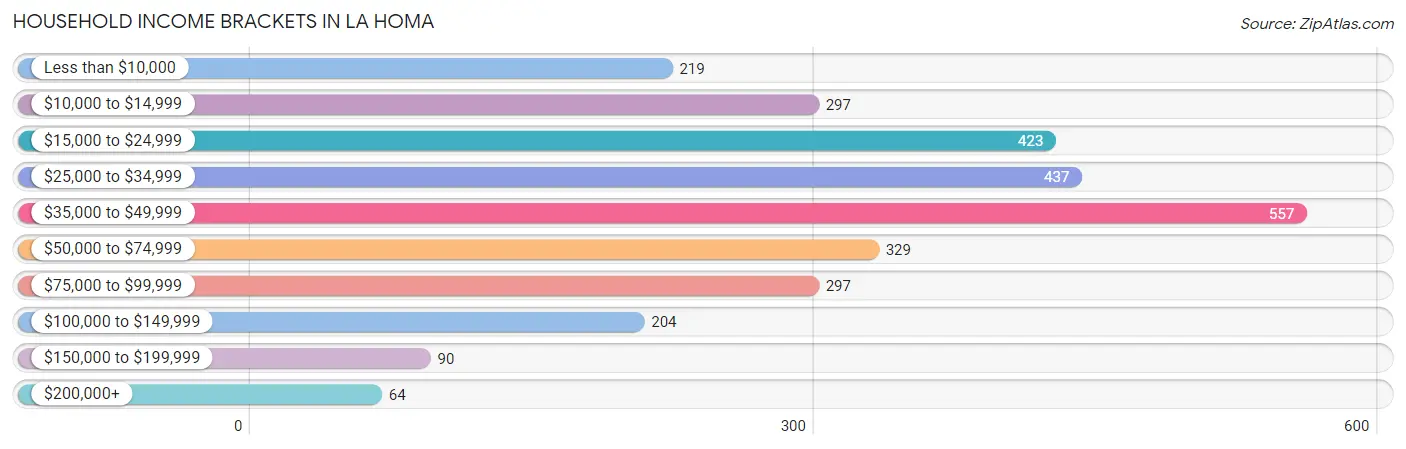
| Income Bracket | # Households | % Households |
| Less than $10,000 | 219 | 7.5% |
| $10,000 to $14,999 | 297 | 10.2% |
| $15,000 to $24,999 | 423 | 14.5% |
| $25,000 to $34,999 | 437 | 15.0% |
| $35,000 to $49,999 | 557 | 19.1% |
| $50,000 to $74,999 | 329 | 11.3% |
| $75,000 to $99,999 | 297 | 10.2% |
| $100,000 to $149,999 | 204 | 7.0% |
| $150,000 to $199,999 | 90 | 3.1% |
| $200,000+ | 64 | 2.2% |
Household Income by Householder Age in La Homa
The median household income in La Homa is $38,365, with the highest median household income of $41,701 found in the 25 to 44 years age bracket for the primary householder. A total of 1,293 households (44.4%) fall into this category. Meanwhile, the 15 to 24 years age bracket for the primary householder has the lowest median household income of $0, with 29 households (1.0%) in this group.
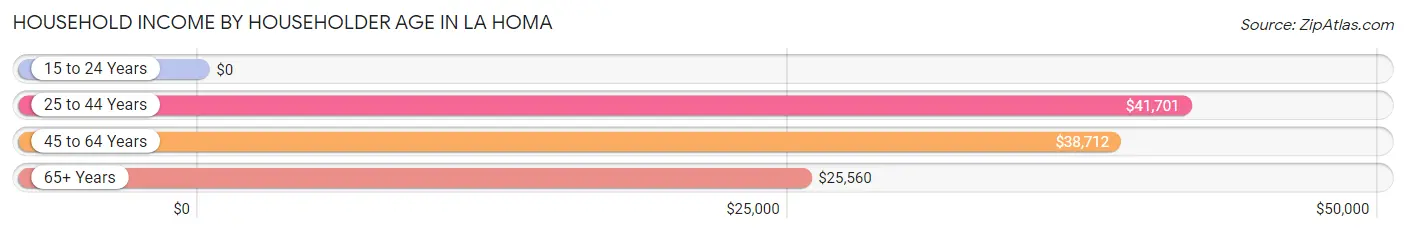
| Income Bracket | # Households | Median Income |
| 15 to 24 Years | 29 (1.0%) | $0 |
| 25 to 44 Years | 1,293 (44.4%) | $41,701 |
| 45 to 64 Years | 1,128 (38.7%) | $38,712 |
| 65+ Years | 465 (16.0%) | $25,560 |
| Total | 2,915 (100.0%) | $38,365 |
Poverty in La Homa
Income Below Poverty by Sex and Age in La Homa
With 27.2% poverty level for males and 29.5% for females among the residents of La Homa, 75 year old and over males and 5 year old females are the most vulnerable to poverty, with 115 males (58.7%) and 149 females (68.7%) in their respective age groups living below the poverty level.
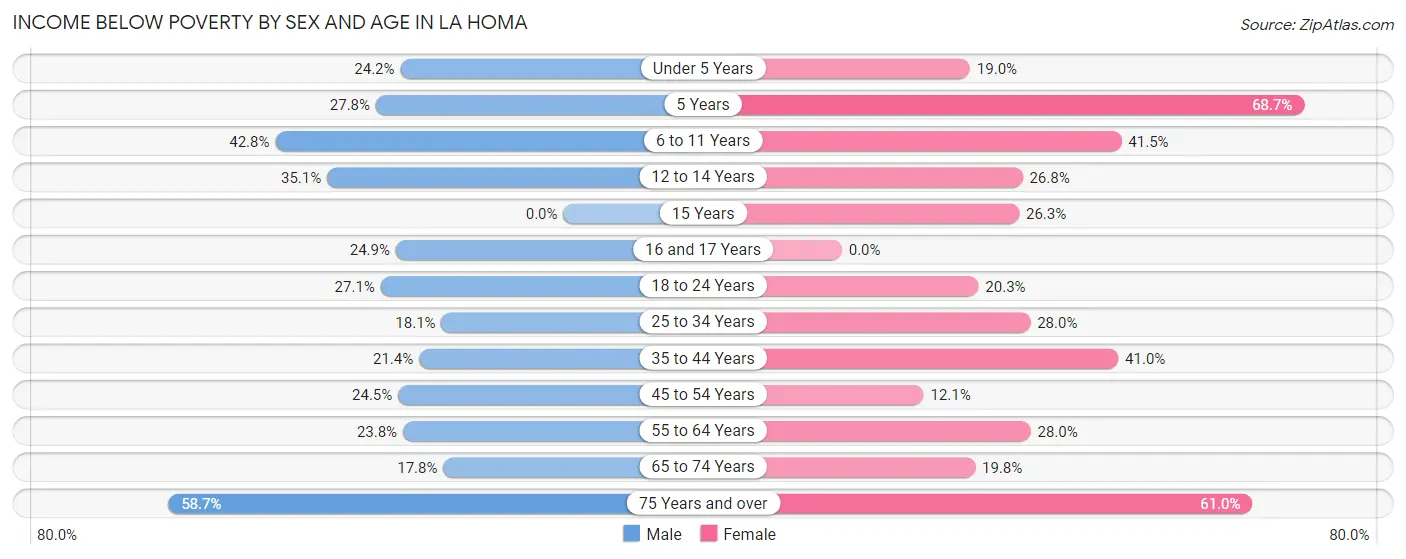
| Age Bracket | Male | Female |
| Under 5 Years | 167 (24.2%) | 70 (19.0%) |
| 5 Years | 27 (27.8%) | 149 (68.7%) |
| 6 to 11 Years | 287 (42.8%) | 267 (41.5%) |
| 12 to 14 Years | 100 (35.1%) | 88 (26.8%) |
| 15 Years | 0 (0.0%) | 60 (26.3%) |
| 16 and 17 Years | 50 (24.9%) | 0 (0.0%) |
| 18 to 24 Years | 140 (27.1%) | 113 (20.3%) |
| 25 to 34 Years | 161 (18.1%) | 230 (28.0%) |
| 35 to 44 Years | 141 (21.4%) | 245 (41.0%) |
| 45 to 54 Years | 107 (24.5%) | 71 (12.1%) |
| 55 to 64 Years | 101 (23.8%) | 164 (28.0%) |
| 65 to 74 Years | 23 (17.8%) | 53 (19.8%) |
| 75 Years and over | 115 (58.7%) | 89 (61.0%) |
| Total | 1,419 (27.2%) | 1,599 (29.5%) |
Income Above Poverty by Sex and Age in La Homa
According to the poverty statistics in La Homa, males aged 15 years and females aged 16 and 17 years are the age groups that are most secure financially, with 100.0% of males and 100.0% of females in these age groups living above the poverty line.
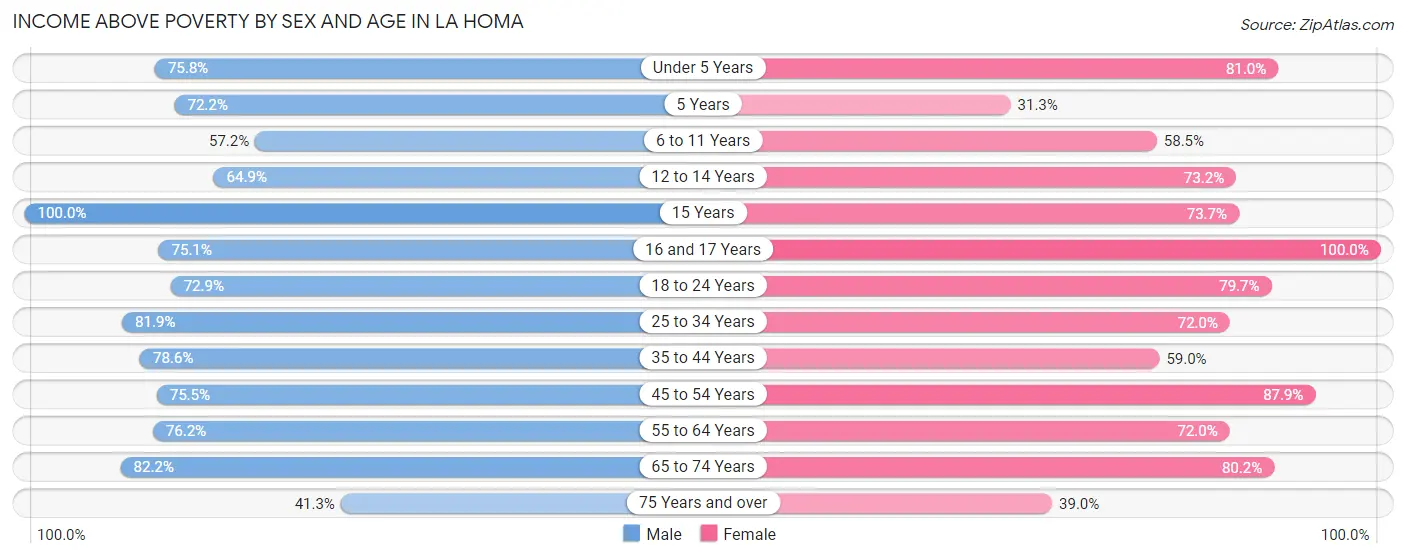
| Age Bracket | Male | Female |
| Under 5 Years | 523 (75.8%) | 298 (81.0%) |
| 5 Years | 70 (72.2%) | 68 (31.3%) |
| 6 to 11 Years | 384 (57.2%) | 376 (58.5%) |
| 12 to 14 Years | 185 (64.9%) | 240 (73.2%) |
| 15 Years | 20 (100.0%) | 168 (73.7%) |
| 16 and 17 Years | 151 (75.1%) | 81 (100.0%) |
| 18 to 24 Years | 376 (72.9%) | 444 (79.7%) |
| 25 to 34 Years | 728 (81.9%) | 592 (72.0%) |
| 35 to 44 Years | 517 (78.6%) | 352 (59.0%) |
| 45 to 54 Years | 329 (75.5%) | 514 (87.9%) |
| 55 to 64 Years | 323 (76.2%) | 421 (72.0%) |
| 65 to 74 Years | 106 (82.2%) | 215 (80.2%) |
| 75 Years and over | 81 (41.3%) | 57 (39.0%) |
| Total | 3,793 (72.8%) | 3,826 (70.5%) |
Income Below Poverty Among Married-Couple Families in La Homa
The poverty statistics for married-couple families in La Homa show that 23.6% or 400 of the total 1,694 families live below the poverty line. Families with no children have the highest poverty rate of 29.9%, comprising of 165 families. On the other hand, families with 1 or 2 children have the lowest poverty rate of 16.9%, which includes 118 families.
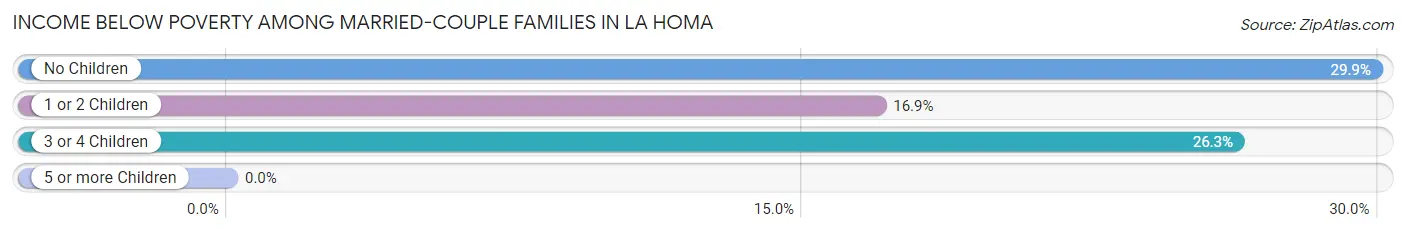
| Children | Above Poverty | Below Poverty |
| No Children | 387 (70.1%) | 165 (29.9%) |
| 1 or 2 Children | 579 (83.1%) | 118 (16.9%) |
| 3 or 4 Children | 328 (73.7%) | 117 (26.3%) |
| 5 or more Children | 0 (0.0%) | 0 (0.0%) |
| Total | 1,294 (76.4%) | 400 (23.6%) |
Income Below Poverty Among Single-Parent Households in La Homa
According to the poverty data in La Homa, 64.3% or 63 single-father households and 43.1% or 298 single-mother households are living below the poverty line. Among single-father households, those with no children have the highest poverty rate, with 37 households (78.7%) experiencing poverty. Likewise, among single-mother households, those with 5 or more children have the highest poverty rate, with 8 households (100.0%) falling below the poverty line.
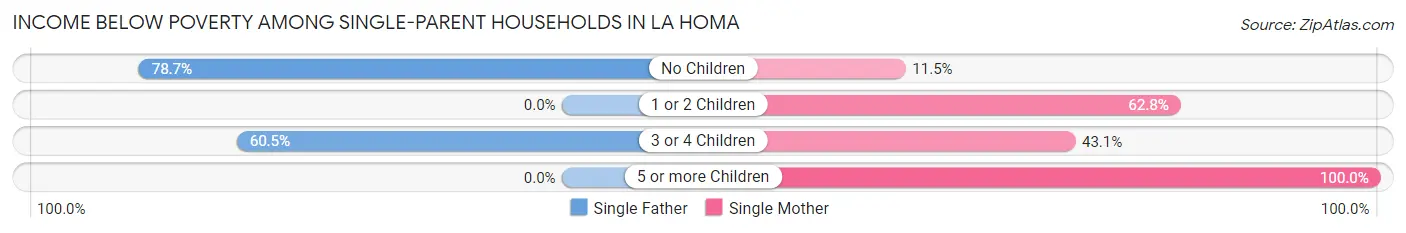
| Children | Single Father | Single Mother |
| No Children | 37 (78.7%) | 26 (11.5%) |
| 1 or 2 Children | 0 (0.0%) | 214 (62.8%) |
| 3 or 4 Children | 26 (60.5%) | 50 (43.1%) |
| 5 or more Children | 0 (0.0%) | 8 (100.0%) |
| Total | 63 (64.3%) | 298 (43.1%) |
Income Below Poverty Among Married-Couple vs Single-Parent Households in La Homa
The poverty data for La Homa shows that 400 of the married-couple family households (23.6%) and 361 of the single-parent households (45.8%) are living below the poverty level. Within the married-couple family households, those with no children have the highest poverty rate, with 165 households (29.9%) falling below the poverty line. Among the single-parent households, those with 1 or 2 children have the highest poverty rate, with 214 household (62.8%) living below poverty.
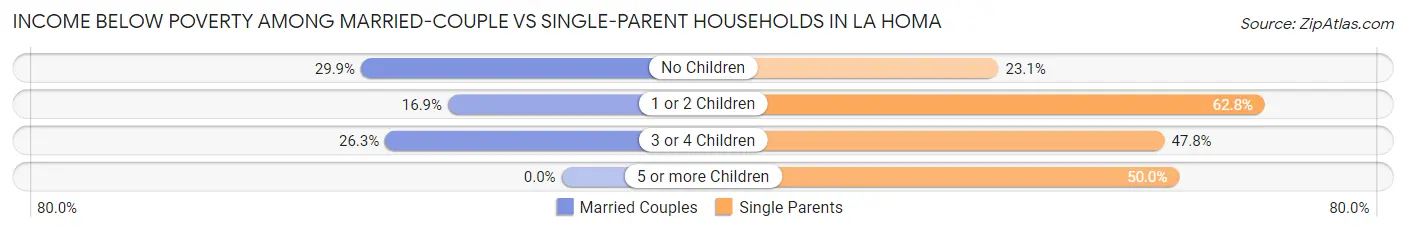
| Children | Married-Couple Families | Single-Parent Households |
| No Children | 165 (29.9%) | 63 (23.1%) |
| 1 or 2 Children | 118 (16.9%) | 214 (62.8%) |
| 3 or 4 Children | 117 (26.3%) | 76 (47.8%) |
| 5 or more Children | 0 (0.0%) | 8 (50.0%) |
| Total | 400 (23.6%) | 361 (45.8%) |
Race in La Homa
The most populous races in La Homa are Hispanic or Latino (10,456 | 98.1%), Two or more Races (5,710 | 53.6%), and White / Caucasian (4,220 | 39.6%).
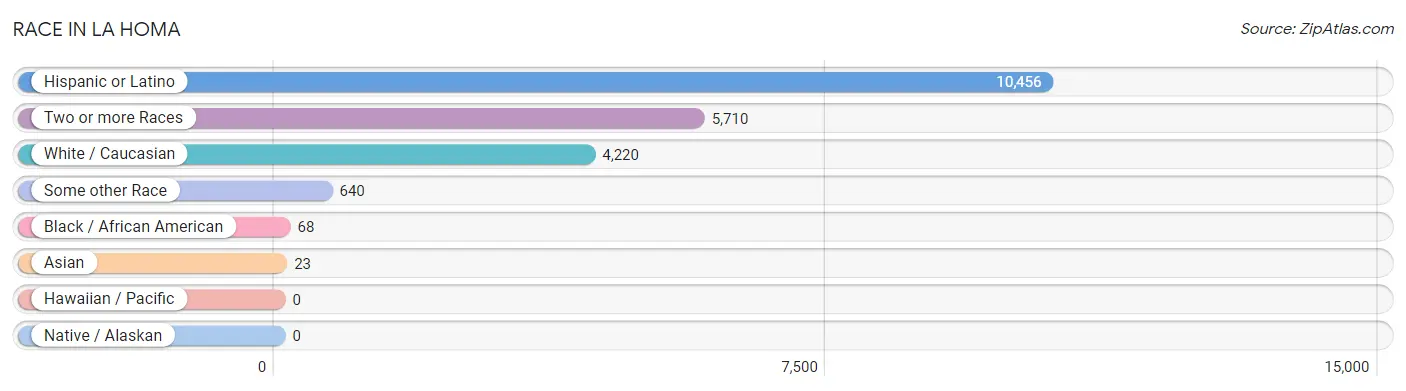
| Race | # Population | % Population |
| Asian | 23 | 0.2% |
| Black / African American | 68 | 0.6% |
| Hawaiian / Pacific | 0 | 0.0% |
| Hispanic or Latino | 10,456 | 98.1% |
| Native / Alaskan | 0 | 0.0% |
| White / Caucasian | 4,220 | 39.6% |
| Two or more Races | 5,710 | 53.6% |
| Some other Race | 640 | 6.0% |
| Total | 10,661 | 100.0% |
Ancestry in La Homa
The most populous ancestries reported in La Homa are Mexican (10,318 | 96.8%), Central American (138 | 1.3%), American (92 | 0.9%), Salvadoran (77 | 0.7%), and Honduran (61 | 0.6%), together accounting for 100.2% of all La Homa residents.
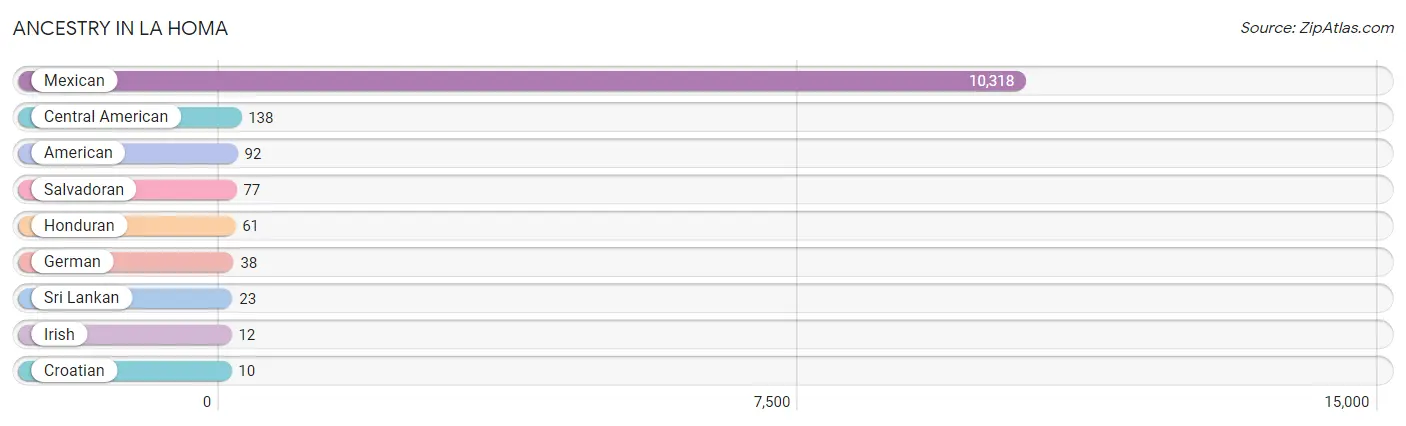
| Ancestry | # Population | % Population |
| American | 92 | 0.9% |
| Central American | 138 | 1.3% |
| Croatian | 10 | 0.1% |
| German | 38 | 0.4% |
| Honduran | 61 | 0.6% |
| Irish | 12 | 0.1% |
| Mexican | 10,318 | 96.8% |
| Salvadoran | 77 | 0.7% |
| Sri Lankan | 23 | 0.2% | View All 9 Rows |
Immigrants in La Homa
The most numerous immigrant groups reported in La Homa came from Central America (3,294 | 30.9%), Latin America (3,294 | 30.9%), Mexico (3,173 | 29.8%), El Salvador (95 | 0.9%), and Honduras (26 | 0.2%), together accounting for 92.7% of all La Homa residents.
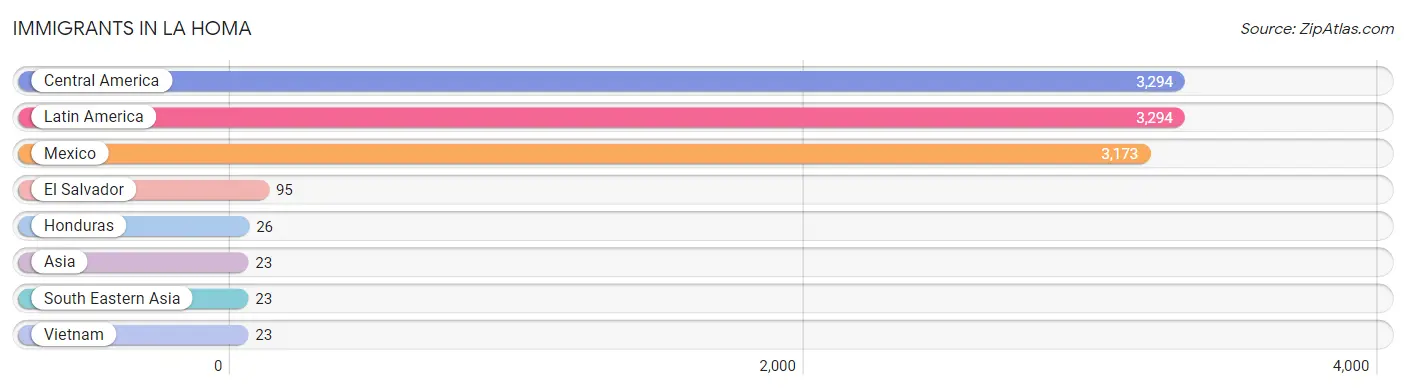
| Immigration Origin | # Population | % Population |
| Asia | 23 | 0.2% |
| Central America | 3,294 | 30.9% |
| El Salvador | 95 | 0.9% |
| Honduras | 26 | 0.2% |
| Latin America | 3,294 | 30.9% |
| Mexico | 3,173 | 29.8% |
| South Eastern Asia | 23 | 0.2% |
| Vietnam | 23 | 0.2% | View All 8 Rows |
Sex and Age in La Homa
Sex and Age in La Homa
The most populous age groups in La Homa are Under 5 Years (692 | 13.3%) for men and 10 to 14 Years (623 | 11.5%) for women.
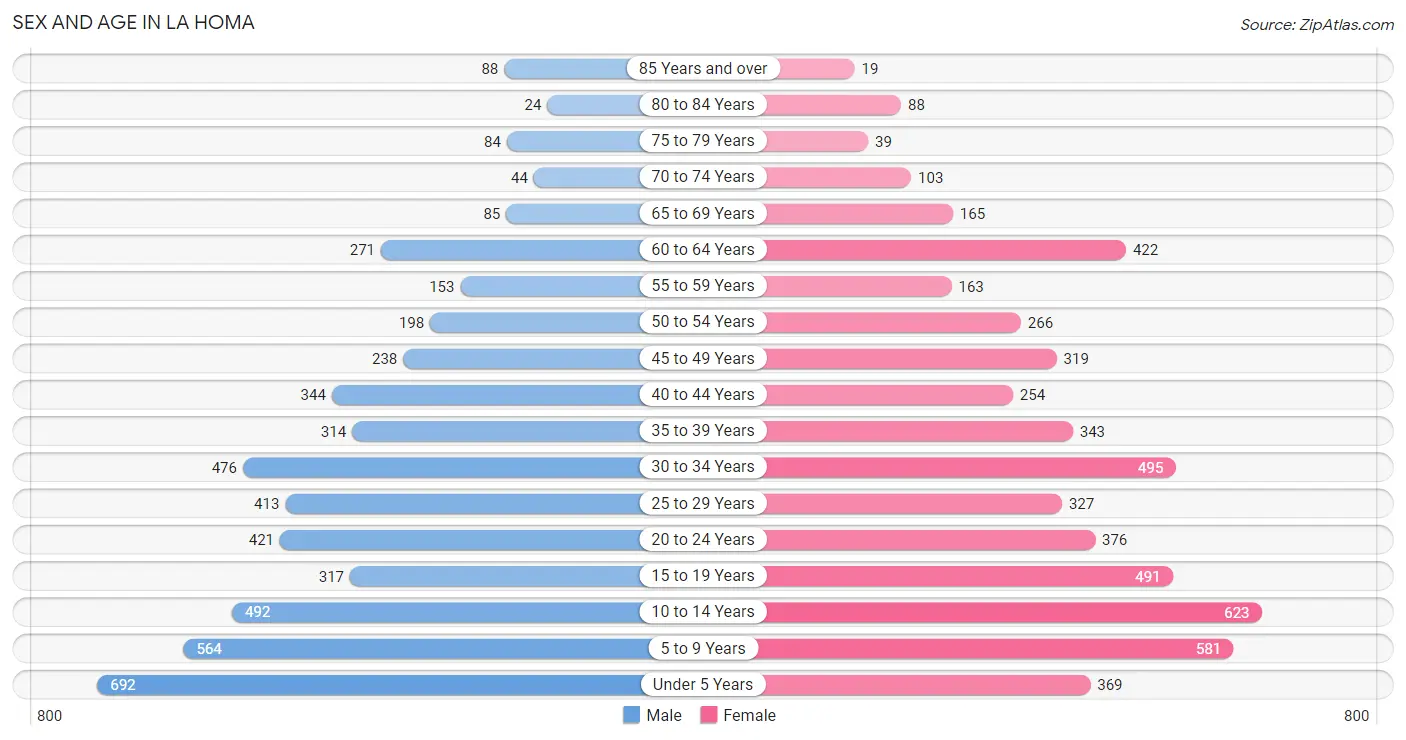
| Age Bracket | Male | Female |
| Under 5 Years | 692 (13.3%) | 369 (6.8%) |
| 5 to 9 Years | 564 (10.8%) | 581 (10.7%) |
| 10 to 14 Years | 492 (9.4%) | 623 (11.5%) |
| 15 to 19 Years | 317 (6.1%) | 491 (9.0%) |
| 20 to 24 Years | 421 (8.1%) | 376 (6.9%) |
| 25 to 29 Years | 413 (7.9%) | 327 (6.0%) |
| 30 to 34 Years | 476 (9.1%) | 495 (9.1%) |
| 35 to 39 Years | 314 (6.0%) | 343 (6.3%) |
| 40 to 44 Years | 344 (6.6%) | 254 (4.7%) |
| 45 to 49 Years | 238 (4.6%) | 319 (5.9%) |
| 50 to 54 Years | 198 (3.8%) | 266 (4.9%) |
| 55 to 59 Years | 153 (2.9%) | 163 (3.0%) |
| 60 to 64 Years | 271 (5.2%) | 422 (7.7%) |
| 65 to 69 Years | 85 (1.6%) | 165 (3.0%) |
| 70 to 74 Years | 44 (0.8%) | 103 (1.9%) |
| 75 to 79 Years | 84 (1.6%) | 39 (0.7%) |
| 80 to 84 Years | 24 (0.5%) | 88 (1.6%) |
| 85 Years and over | 88 (1.7%) | 19 (0.4%) |
| Total | 5,218 (100.0%) | 5,443 (100.0%) |
Families and Households in La Homa
Median Family Size in La Homa
The median family size in La Homa is 4.04 persons per family, with single male/father families (98 | 4.0%) accounting for the largest median family size of 5.34 persons per family. On the other hand, single female/mother families (691 | 27.8%) represent the smallest median family size with 3.75 persons per family.
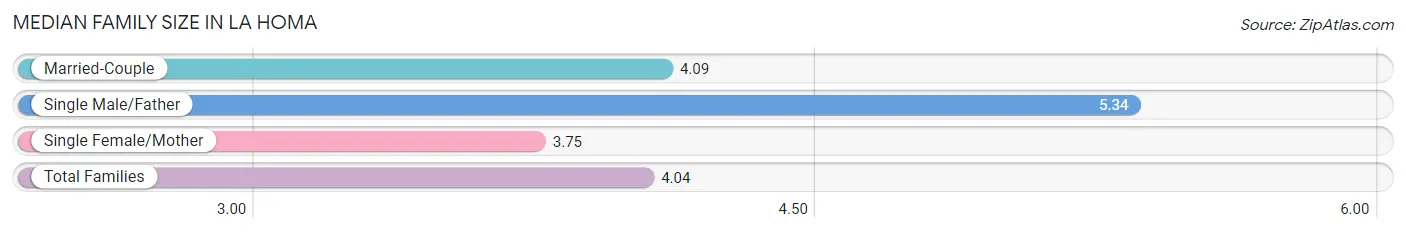
| Family Type | # Families | Family Size |
| Married-Couple | 1,694 (68.2%) | 4.09 |
| Single Male/Father | 98 (4.0%) | 5.34 |
| Single Female/Mother | 691 (27.8%) | 3.75 |
| Total Families | 2,483 (100.0%) | 4.04 |
Median Household Size in La Homa
The median household size in La Homa is 3.65 persons per household, with single male/father households (98 | 3.4%) accounting for the largest median household size of 5.34 persons per household. non-family households (432 | 14.8%) represent the smallest median household size with 1.03 persons per household.
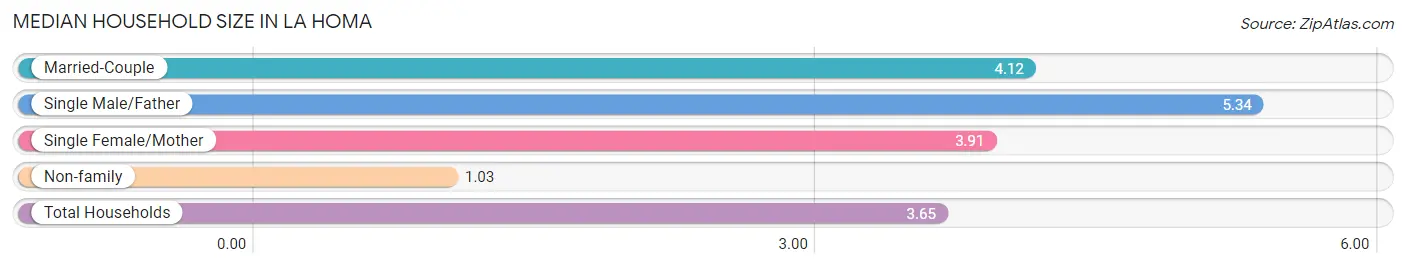
| Household Type | # Households | Household Size |
| Married-Couple | 1,694 (58.1%) | 4.12 |
| Single Male/Father | 98 (3.4%) | 5.34 |
| Single Female/Mother | 691 (23.7%) | 3.91 |
| Non-family | 432 (14.8%) | 1.03 |
| Total Households | 2,915 (100.0%) | 3.65 |
Household Size by Marriage Status in La Homa
Out of a total of 2,915 households in La Homa, 2,483 (85.2%) are family households, while 432 (14.8%) are nonfamily households. The most numerous type of family households are 2-person households, comprising 715, and the most common type of nonfamily households are 1-person households, comprising 421.
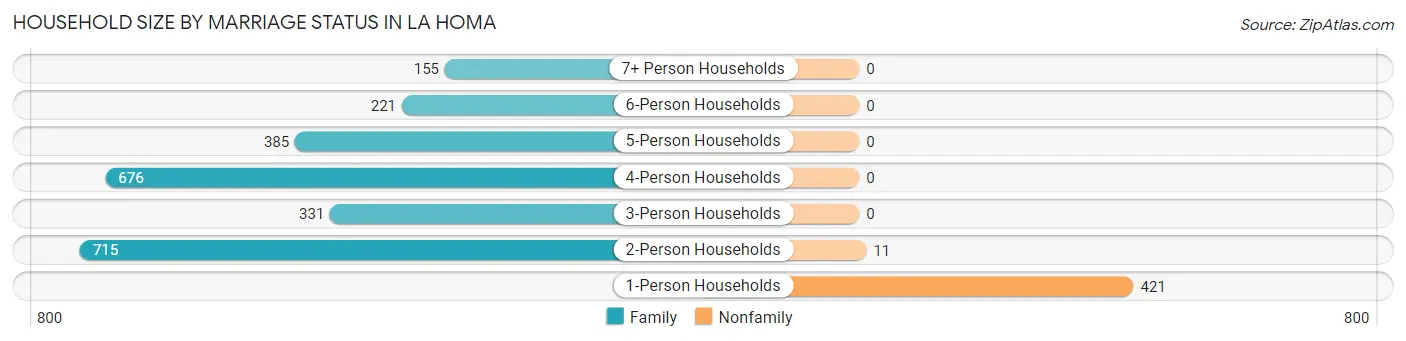
| Household Size | Family Households | Nonfamily Households |
| 1-Person Households | - | 421 (14.4%) |
| 2-Person Households | 715 (24.5%) | 11 (0.4%) |
| 3-Person Households | 331 (11.4%) | 0 (0.0%) |
| 4-Person Households | 676 (23.2%) | 0 (0.0%) |
| 5-Person Households | 385 (13.2%) | 0 (0.0%) |
| 6-Person Households | 221 (7.6%) | 0 (0.0%) |
| 7+ Person Households | 155 (5.3%) | 0 (0.0%) |
| Total | 2,483 (85.2%) | 432 (14.8%) |
Female Fertility in La Homa
Fertility by Age in La Homa
Average fertility rate in La Homa is 67.0 births per 1,000 women. Women in the age bracket of 20 to 34 years have the highest fertility rate with 114.0 births per 1,000 women. Women in the age bracket of 20 to 34 years acount for 76.4% of all women with births.
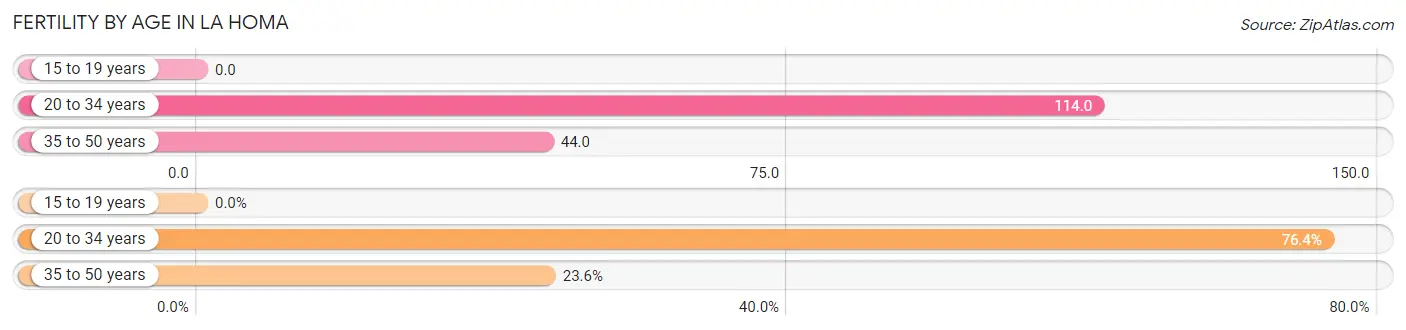
| Age Bracket | Women with Births | Births / 1,000 Women |
| 15 to 19 years | 0 (0.0%) | 0.0 |
| 20 to 34 years | 136 (76.4%) | 114.0 |
| 35 to 50 years | 42 (23.6%) | 44.0 |
| Total | 178 (100.0%) | 67.0 |
Fertility by Age by Marriage Status in La Homa
47.8% of women with births (178) in La Homa are married. The highest percentage of unmarried women with births falls into 35 to 50 years age bracket with 100.0% of them unmarried at the time of birth, while the lowest percentage of unmarried women with births belong to 20 to 34 years age bracket with 37.5% of them unmarried.
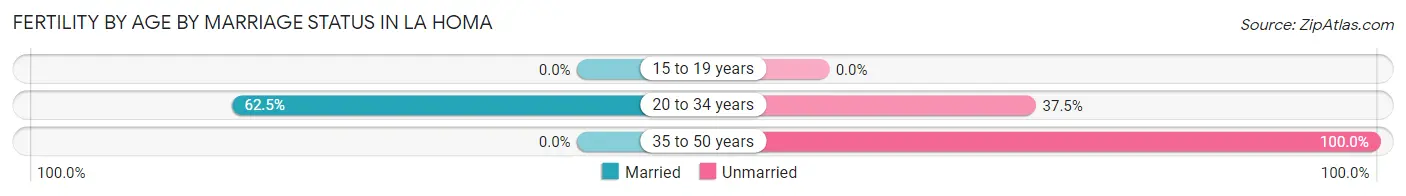
| Age Bracket | Married | Unmarried |
| 15 to 19 years | 0 (0.0%) | 0 (0.0%) |
| 20 to 34 years | 85 (62.5%) | 51 (37.5%) |
| 35 to 50 years | 0 (0.0%) | 42 (100.0%) |
| Total | 85 (47.7%) | 93 (52.2%) |
Fertility by Education in La Homa
Average fertility rate in La Homa is 67.0 births per 1,000 women. Women with the education attainment of bachelor's degree have the highest fertility rate of 250.0 births per 1,000 women, while women with the education attainment of less than high school have the lowest fertility at 13.0 births per 1,000 women. Women with the education attainment of high school diploma represent 32.6% of all women with births.
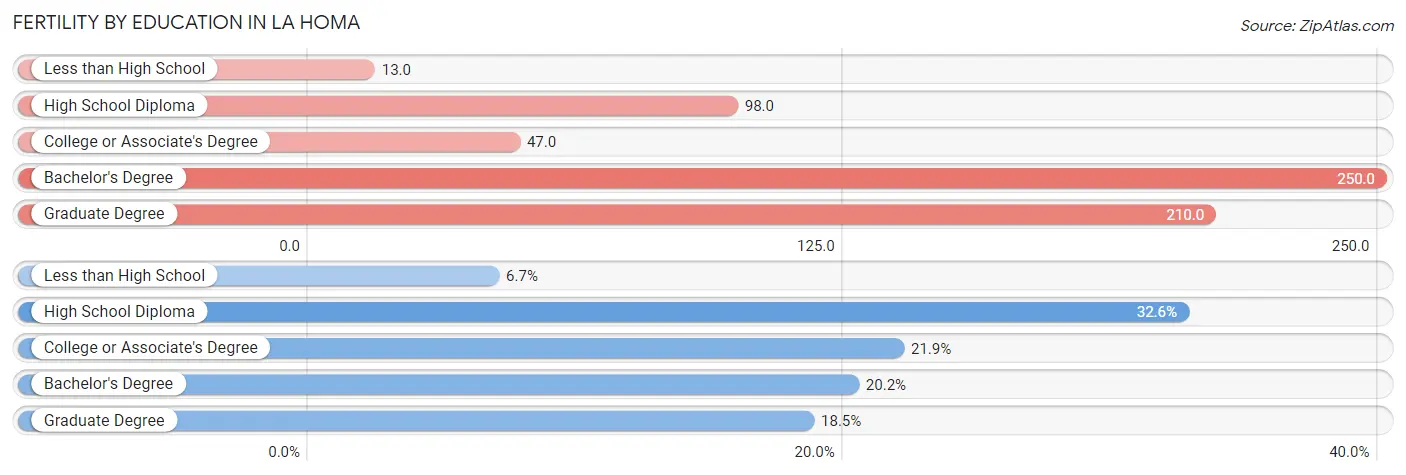
| Educational Attainment | Women with Births | Births / 1,000 Women |
| Less than High School | 12 (6.7%) | 13.0 |
| High School Diploma | 58 (32.6%) | 98.0 |
| College or Associate's Degree | 39 (21.9%) | 47.0 |
| Bachelor's Degree | 36 (20.2%) | 250.0 |
| Graduate Degree | 33 (18.5%) | 210.0 |
| Total | 178 (100.0%) | 67.0 |
Fertility by Education by Marriage Status in La Homa
52.2% of women with births in La Homa are unmarried. Women with the educational attainment of bachelor's degree are most likely to be married with 100.0% of them married at childbirth, while women with the educational attainment of less than high school are least likely to be married with 100.0% of them unmarried at childbirth.
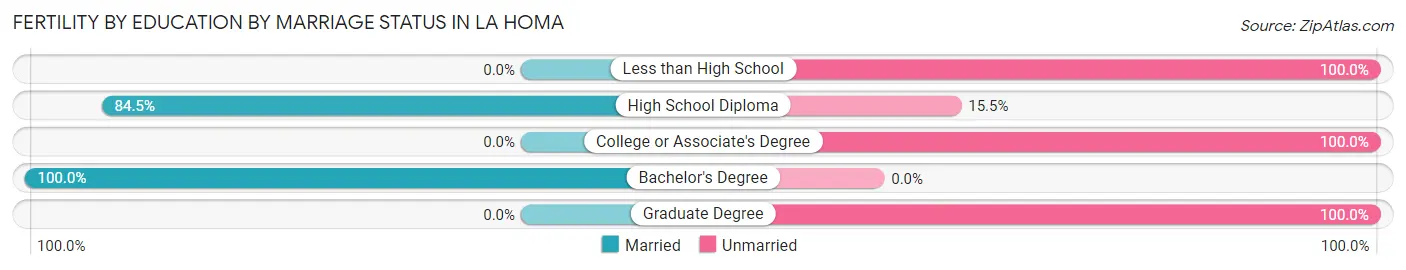
| Educational Attainment | Married | Unmarried |
| Less than High School | 0 (0.0%) | 12 (100.0%) |
| High School Diploma | 49 (84.5%) | 9 (15.5%) |
| College or Associate's Degree | 0 (0.0%) | 39 (100.0%) |
| Bachelor's Degree | 36 (100.0%) | 0 (0.0%) |
| Graduate Degree | 0 (0.0%) | 33 (100.0%) |
| Total | 85 (47.7%) | 93 (52.2%) |
Employment Characteristics in La Homa
Employment by Class of Employer in La Homa
Among the 3,601 employed individuals in La Homa, private company employees (2,788 | 77.4%), self-employed (not incorporated) (449 | 12.5%), and state government employees (149 | 4.1%) make up the most common classes of employment.
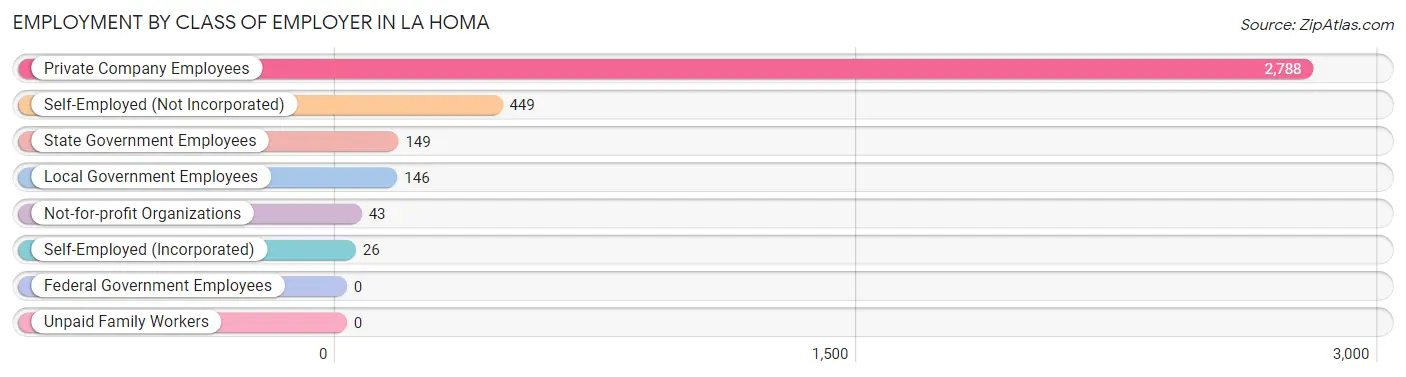
| Employer Class | # Employees | % Employees |
| Private Company Employees | 2,788 | 77.4% |
| Self-Employed (Incorporated) | 26 | 0.7% |
| Self-Employed (Not Incorporated) | 449 | 12.5% |
| Not-for-profit Organizations | 43 | 1.2% |
| Local Government Employees | 146 | 4.1% |
| State Government Employees | 149 | 4.1% |
| Federal Government Employees | 0 | 0.0% |
| Unpaid Family Workers | 0 | 0.0% |
| Total | 3,601 | 100.0% |
Employment Status by Age in La Homa
According to the labor force statistics for La Homa, out of the total population over 16 years of age (7,092), 63.4% or 4,496 individuals are in the labor force, with 13.3% or 598 of them unemployed. The age group with the highest labor force participation rate is 35 to 44 years, with 89.5% or 1,123 individuals in the labor force. Within the labor force, the 65 to 74 years age range has the highest percentage of unemployed individuals, with 36.8% or 25 of them being unemployed.
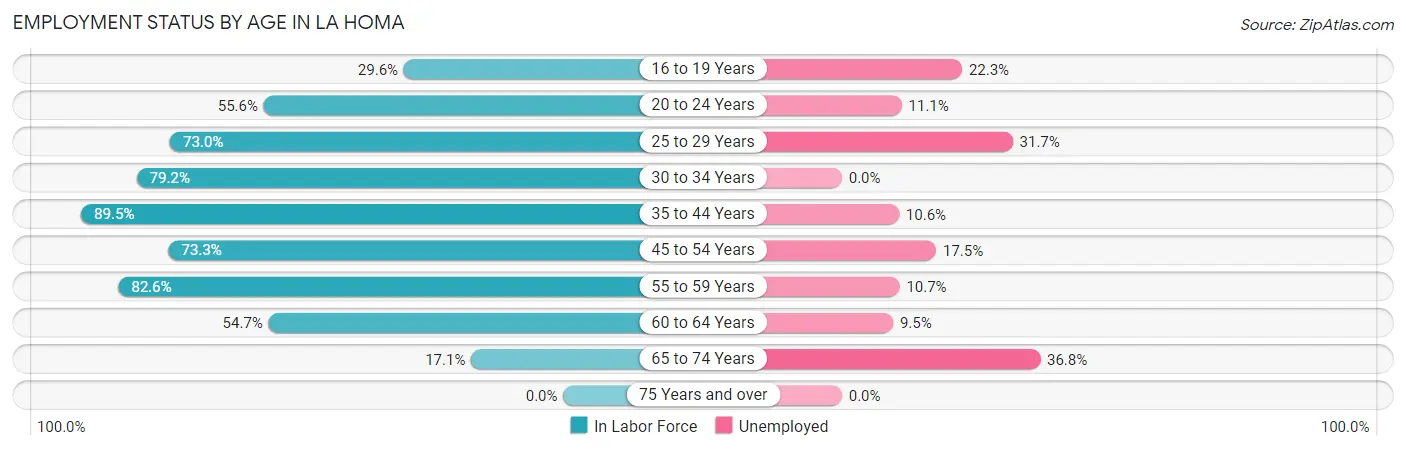
| Age Bracket | In Labor Force | Unemployed |
| 16 to 19 Years | 166 (29.6%) | 37 (22.3%) |
| 20 to 24 Years | 443 (55.6%) | 49 (11.1%) |
| 25 to 29 Years | 540 (73.0%) | 171 (31.7%) |
| 30 to 34 Years | 769 (79.2%) | 0 (0.0%) |
| 35 to 44 Years | 1,123 (89.5%) | 119 (10.6%) |
| 45 to 54 Years | 748 (73.3%) | 131 (17.5%) |
| 55 to 59 Years | 261 (82.6%) | 28 (10.7%) |
| 60 to 64 Years | 379 (54.7%) | 36 (9.5%) |
| 65 to 74 Years | 68 (17.1%) | 25 (36.8%) |
| 75 Years and over | 0 (0.0%) | 0 (0.0%) |
| Total | 4,496 (63.4%) | 598 (13.3%) |
Employment Status by Educational Attainment in La Homa
According to labor force statistics for La Homa, 76.5% of individuals (3,822) out of the total population between 25 and 64 years of age (4,996) are in the labor force, with 12.7% or 485 of them being unemployed. The group with the highest labor force participation rate are those with the educational attainment of bachelor's degree or higher, with 98.0% or 437 individuals in the labor force. Within the labor force, individuals with less than high school education have the highest percentage of unemployment, with 16.2% or 248 of them being unemployed.
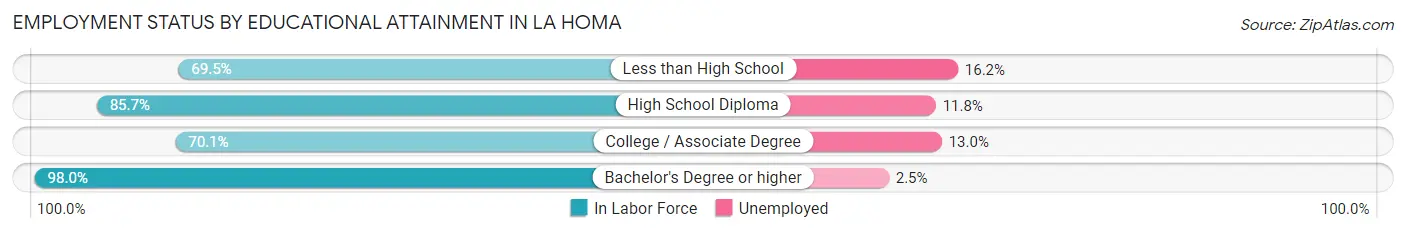
| Educational Attainment | In Labor Force | Unemployed |
| Less than High School | 1,528 (69.5%) | 356 (16.2%) |
| High School Diploma | 1,130 (85.7%) | 156 (11.8%) |
| College / Associate Degree | 724 (70.1%) | 134 (13.0%) |
| Bachelor's Degree or higher | 437 (98.0%) | 11 (2.5%) |
| Total | 3,822 (76.5%) | 634 (12.7%) |
Employment Occupations by Sex in La Homa
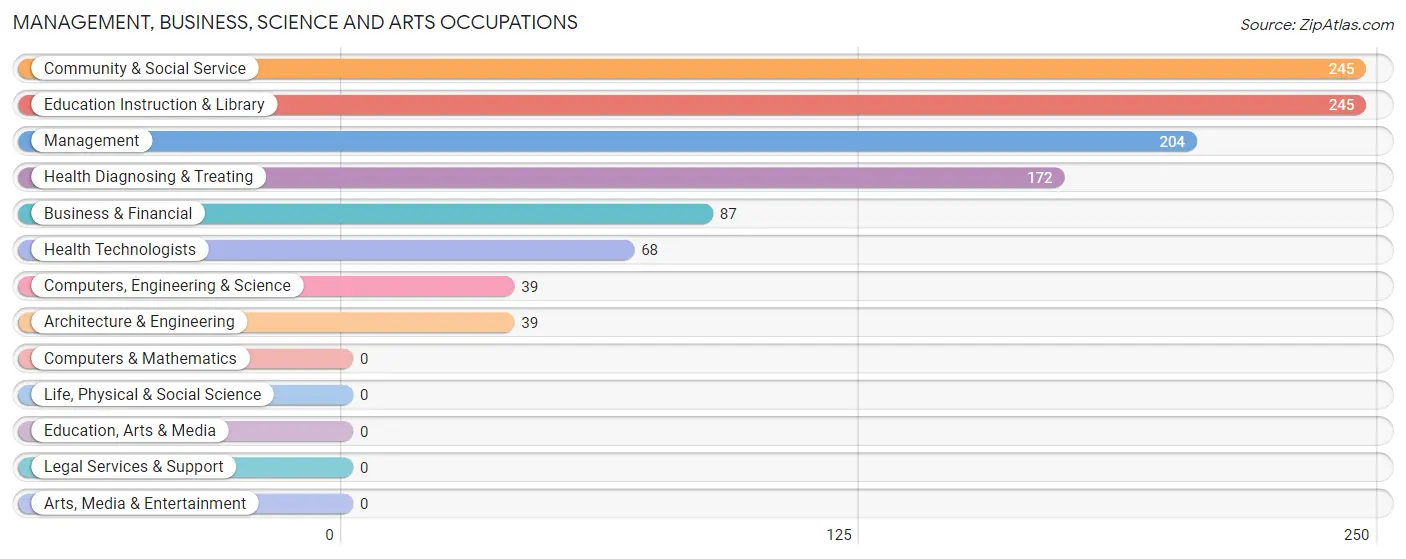
Management, Business, Science and Arts Occupations
The most common Management, Business, Science and Arts occupations in La Homa are Community & Social Service (245 | 6.3%), Education Instruction & Library (245 | 6.3%), Management (204 | 5.2%), Health Diagnosing & Treating (172 | 4.4%), and Business & Financial (87 | 2.2%).
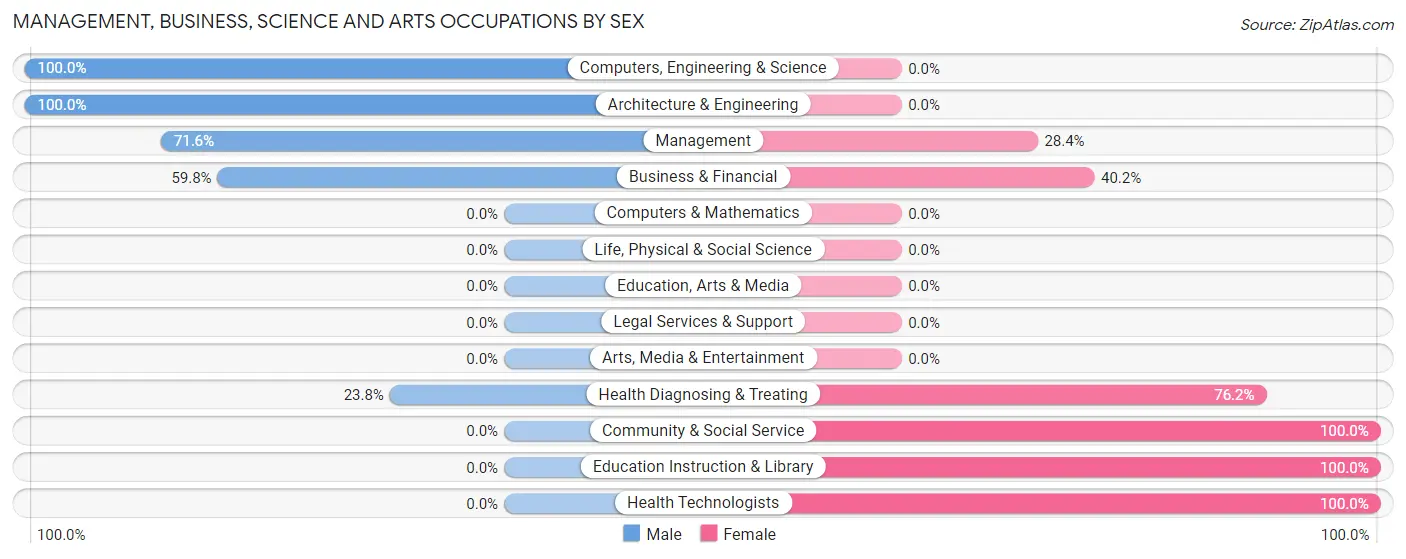
Management, Business, Science and Arts Occupations by Sex
Within the Management, Business, Science and Arts occupations in La Homa, the most male-oriented occupations are Computers, Engineering & Science (100.0%), Architecture & Engineering (100.0%), and Management (71.6%), while the most female-oriented occupations are Community & Social Service (100.0%), Education Instruction & Library (100.0%), and Health Technologists (100.0%).
| Occupation | Male | Female |
| Management | 146 (71.6%) | 58 (28.4%) |
| Business & Financial | 52 (59.8%) | 35 (40.2%) |
| Computers, Engineering & Science | 39 (100.0%) | 0 (0.0%) |
| Computers & Mathematics | 0 (0.0%) | 0 (0.0%) |
| Architecture & Engineering | 39 (100.0%) | 0 (0.0%) |
| Life, Physical & Social Science | 0 (0.0%) | 0 (0.0%) |
| Community & Social Service | 0 (0.0%) | 245 (100.0%) |
| Education, Arts & Media | 0 (0.0%) | 0 (0.0%) |
| Legal Services & Support | 0 (0.0%) | 0 (0.0%) |
| Education Instruction & Library | 0 (0.0%) | 245 (100.0%) |
| Arts, Media & Entertainment | 0 (0.0%) | 0 (0.0%) |
| Health Diagnosing & Treating | 41 (23.8%) | 131 (76.2%) |
| Health Technologists | 0 (0.0%) | 68 (100.0%) |
| Total (Category) | 278 (37.2%) | 469 (62.8%) |
| Total (Overall) | 2,293 (58.8%) | 1,608 (41.2%) |
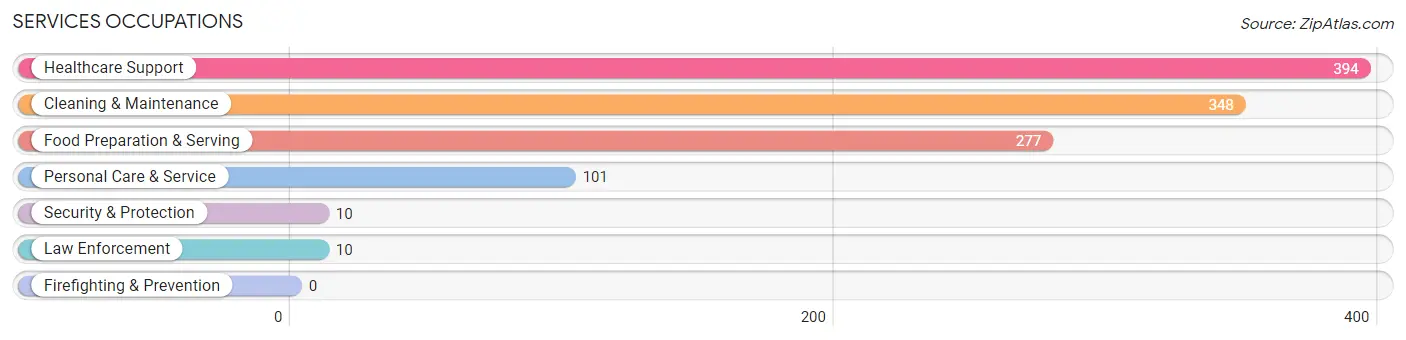
Services Occupations
The most common Services occupations in La Homa are Healthcare Support (394 | 10.1%), Cleaning & Maintenance (348 | 8.9%), Food Preparation & Serving (277 | 7.1%), Personal Care & Service (101 | 2.6%), and Security & Protection (10 | 0.3%).
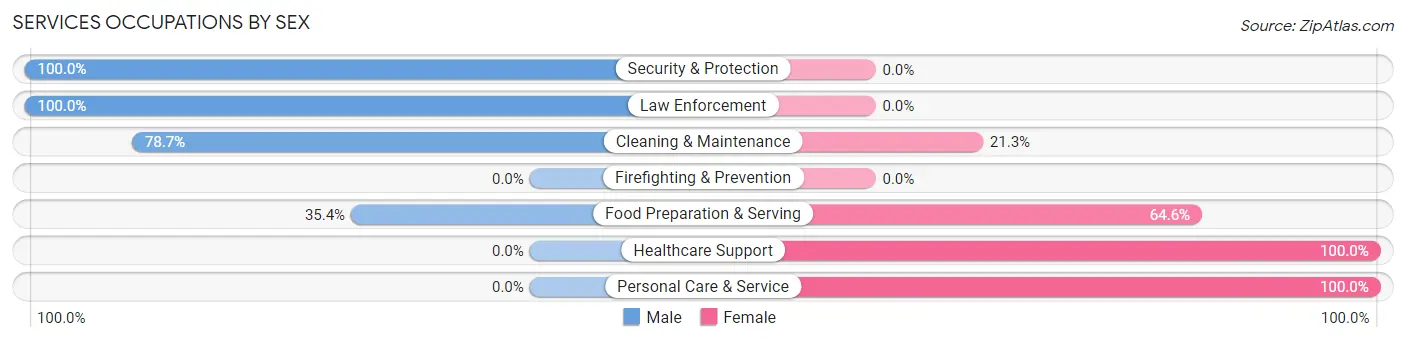
Services Occupations by Sex
Within the Services occupations in La Homa, the most male-oriented occupations are Security & Protection (100.0%), Law Enforcement (100.0%), and Cleaning & Maintenance (78.7%), while the most female-oriented occupations are Healthcare Support (100.0%), Personal Care & Service (100.0%), and Food Preparation & Serving (64.6%).
| Occupation | Male | Female |
| Healthcare Support | 0 (0.0%) | 394 (100.0%) |
| Security & Protection | 10 (100.0%) | 0 (0.0%) |
| Firefighting & Prevention | 0 (0.0%) | 0 (0.0%) |
| Law Enforcement | 10 (100.0%) | 0 (0.0%) |
| Food Preparation & Serving | 98 (35.4%) | 179 (64.6%) |
| Cleaning & Maintenance | 274 (78.7%) | 74 (21.3%) |
| Personal Care & Service | 0 (0.0%) | 101 (100.0%) |
| Total (Category) | 382 (33.8%) | 748 (66.2%) |
| Total (Overall) | 2,293 (58.8%) | 1,608 (41.2%) |
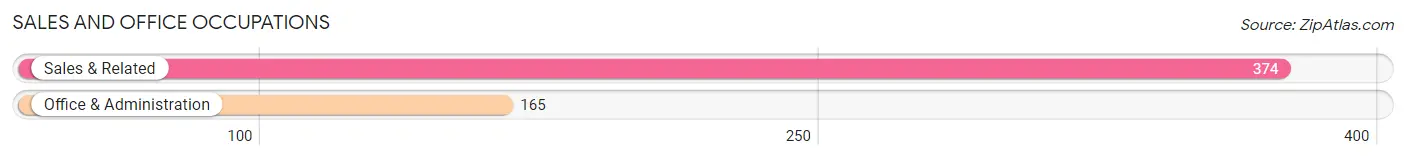
Sales and Office Occupations
The most common Sales and Office occupations in La Homa are Sales & Related (374 | 9.6%), and Office & Administration (165 | 4.2%).
Sales and Office Occupations by Sex
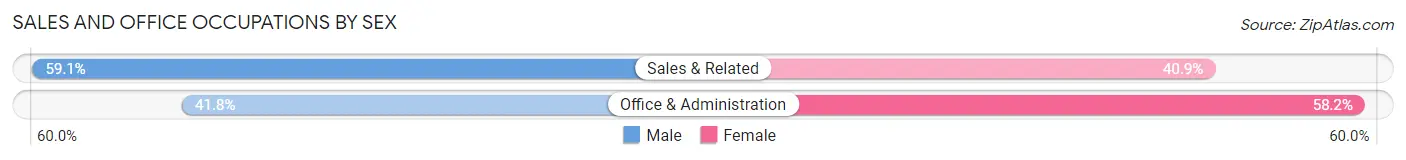
| Occupation | Male | Female |
| Sales & Related | 221 (59.1%) | 153 (40.9%) |
| Office & Administration | 69 (41.8%) | 96 (58.2%) |
| Total (Category) | 290 (53.8%) | 249 (46.2%) |
| Total (Overall) | 2,293 (58.8%) | 1,608 (41.2%) |
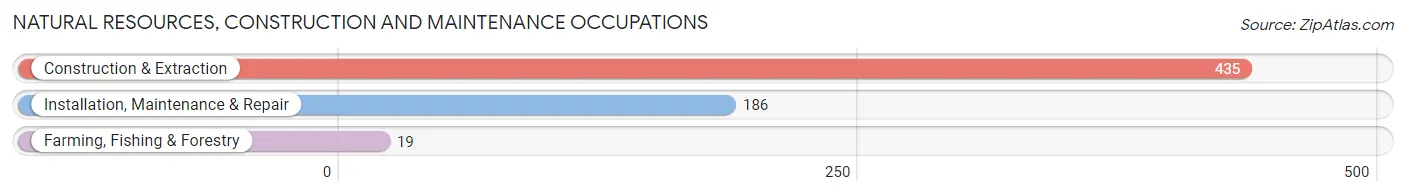
Natural Resources, Construction and Maintenance Occupations
The most common Natural Resources, Construction and Maintenance occupations in La Homa are Construction & Extraction (435 | 11.2%), Installation, Maintenance & Repair (186 | 4.8%), and Farming, Fishing & Forestry (19 | 0.5%).
Natural Resources, Construction and Maintenance Occupations by Sex
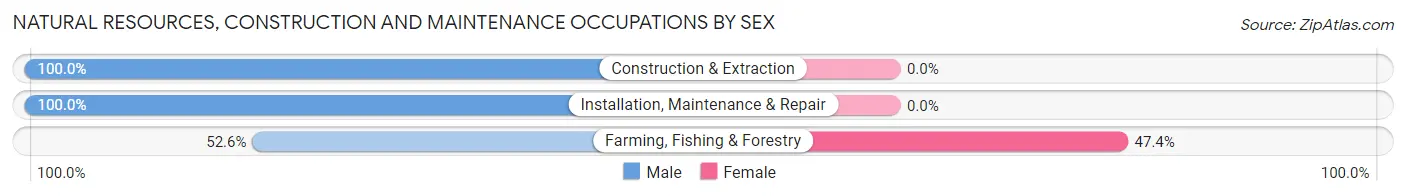
| Occupation | Male | Female |
| Farming, Fishing & Forestry | 10 (52.6%) | 9 (47.4%) |
| Construction & Extraction | 435 (100.0%) | 0 (0.0%) |
| Installation, Maintenance & Repair | 186 (100.0%) | 0 (0.0%) |
| Total (Category) | 631 (98.6%) | 9 (1.4%) |
| Total (Overall) | 2,293 (58.8%) | 1,608 (41.2%) |
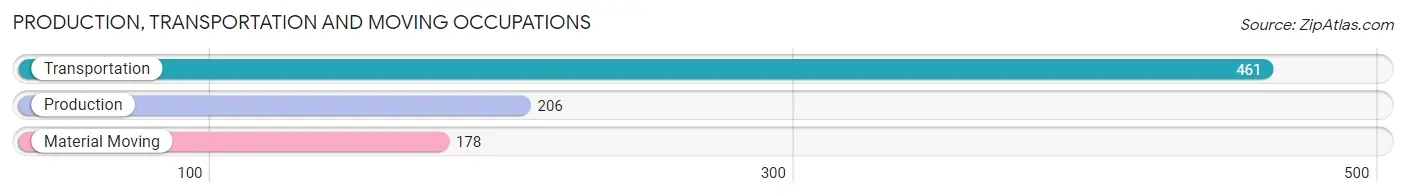
Production, Transportation and Moving Occupations
The most common Production, Transportation and Moving occupations in La Homa are Transportation (461 | 11.8%), Production (206 | 5.3%), and Material Moving (178 | 4.6%).
Production, Transportation and Moving Occupations by Sex
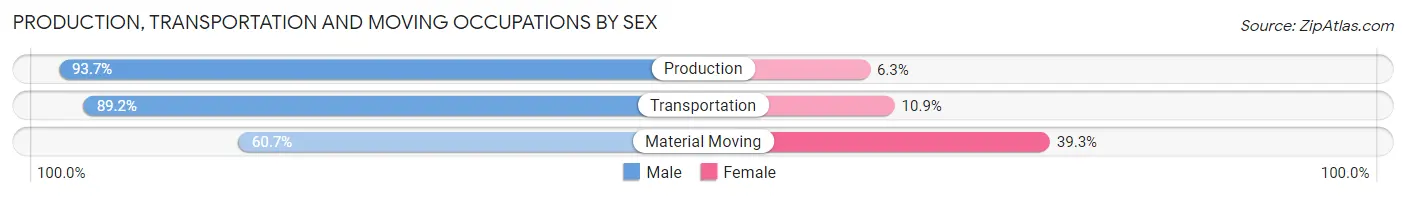
| Occupation | Male | Female |
| Production | 193 (93.7%) | 13 (6.3%) |
| Transportation | 411 (89.1%) | 50 (10.8%) |
| Material Moving | 108 (60.7%) | 70 (39.3%) |
| Total (Category) | 712 (84.3%) | 133 (15.7%) |
| Total (Overall) | 2,293 (58.8%) | 1,608 (41.2%) |
Employment Industries by Sex in La Homa
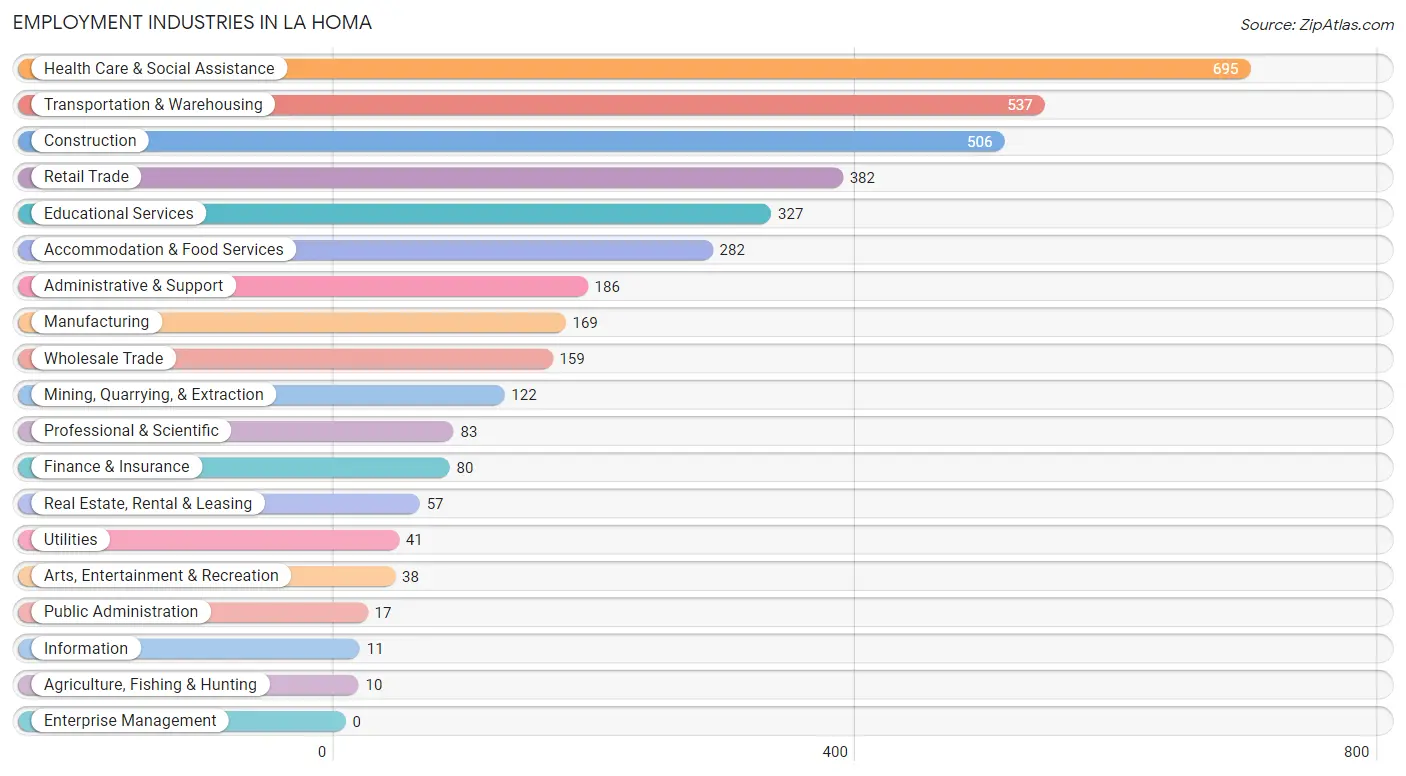
Employment Industries in La Homa
The major employment industries in La Homa include Health Care & Social Assistance (695 | 17.8%), Transportation & Warehousing (537 | 13.8%), Construction (506 | 13.0%), Retail Trade (382 | 9.8%), and Educational Services (327 | 8.4%).
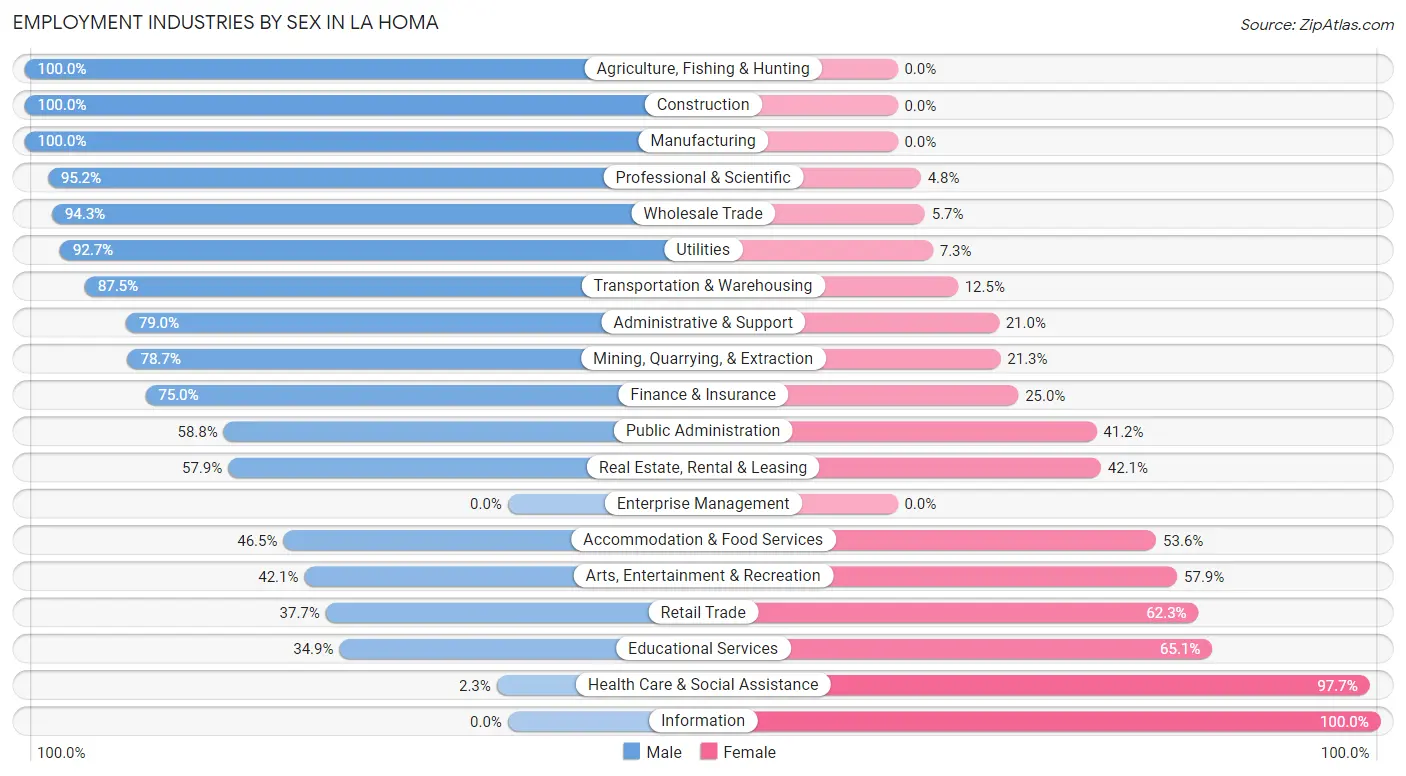
Employment Industries by Sex in La Homa
The La Homa industries that see more men than women are Agriculture, Fishing & Hunting (100.0%), Construction (100.0%), and Manufacturing (100.0%), whereas the industries that tend to have a higher number of women are Information (100.0%), Health Care & Social Assistance (97.7%), and Educational Services (65.1%).
| Industry | Male | Female |
| Agriculture, Fishing & Hunting | 10 (100.0%) | 0 (0.0%) |
| Mining, Quarrying, & Extraction | 96 (78.7%) | 26 (21.3%) |
| Construction | 506 (100.0%) | 0 (0.0%) |
| Manufacturing | 169 (100.0%) | 0 (0.0%) |
| Wholesale Trade | 150 (94.3%) | 9 (5.7%) |
| Retail Trade | 144 (37.7%) | 238 (62.3%) |
| Transportation & Warehousing | 470 (87.5%) | 67 (12.5%) |
| Utilities | 38 (92.7%) | 3 (7.3%) |
| Information | 0 (0.0%) | 11 (100.0%) |
| Finance & Insurance | 60 (75.0%) | 20 (25.0%) |
| Real Estate, Rental & Leasing | 33 (57.9%) | 24 (42.1%) |
| Professional & Scientific | 79 (95.2%) | 4 (4.8%) |
| Enterprise Management | 0 (0.0%) | 0 (0.0%) |
| Administrative & Support | 147 (79.0%) | 39 (21.0%) |
| Educational Services | 114 (34.9%) | 213 (65.1%) |
| Health Care & Social Assistance | 16 (2.3%) | 679 (97.7%) |
| Arts, Entertainment & Recreation | 16 (42.1%) | 22 (57.9%) |
| Accommodation & Food Services | 131 (46.5%) | 151 (53.5%) |
| Public Administration | 10 (58.8%) | 7 (41.2%) |
| Total | 2,293 (58.8%) | 1,608 (41.2%) |
Education in La Homa
School Enrollment in La Homa
The most common levels of schooling among the 3,561 students in La Homa are elementary school (916 | 25.7%), high school (801 | 22.5%), and middle school (793 | 22.3%).
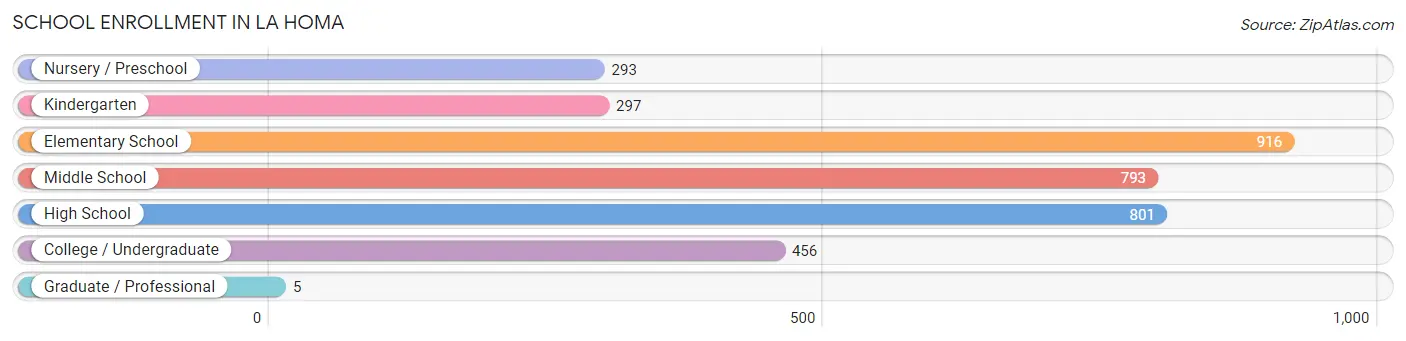
| School Level | # Students | % Students |
| Nursery / Preschool | 293 | 8.2% |
| Kindergarten | 297 | 8.3% |
| Elementary School | 916 | 25.7% |
| Middle School | 793 | 22.3% |
| High School | 801 | 22.5% |
| College / Undergraduate | 456 | 12.8% |
| Graduate / Professional | 5 | 0.1% |
| Total | 3,561 | 100.0% |
School Enrollment by Age by Funding Source in La Homa
Out of a total of 3,561 students who are enrolled in schools in La Homa, 46 (1.3%) attend a private institution, while the remaining 3,515 (98.7%) are enrolled in public schools. The age group of 25 to 34 year olds has the highest likelihood of being enrolled in private schools, with 11 (31.4% in the age bracket) enrolled. Conversely, the age group of 3 to 4 year olds has the lowest likelihood of being enrolled in a private school, with 246 (100.0% in the age bracket) attending a public institution.
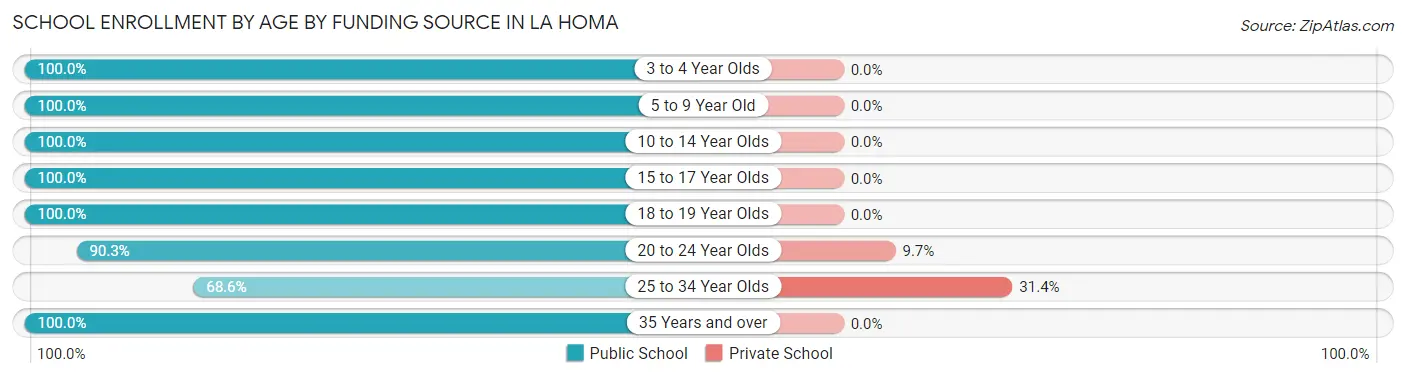
| Age Bracket | Public School | Private School |
| 3 to 4 Year Olds | 246 (100.0%) | 0 (0.0%) |
| 5 to 9 Year Old | 1,044 (100.0%) | 0 (0.0%) |
| 10 to 14 Year Olds | 1,102 (100.0%) | 0 (0.0%) |
| 15 to 17 Year Olds | 531 (100.0%) | 0 (0.0%) |
| 18 to 19 Year Olds | 174 (100.0%) | 0 (0.0%) |
| 20 to 24 Year Olds | 318 (90.3%) | 34 (9.7%) |
| 25 to 34 Year Olds | 24 (68.6%) | 11 (31.4%) |
| 35 Years and over | 77 (100.0%) | 0 (0.0%) |
| Total | 3,515 (98.7%) | 46 (1.3%) |
Educational Attainment by Field of Study in La Homa
Education (164 | 34.7%), business (63 | 13.3%), science & technology (54 | 11.4%), arts & humanities (46 | 9.7%), and engineering (39 | 8.3%) are the most common fields of study among 473 individuals in La Homa who have obtained a bachelor's degree or higher.
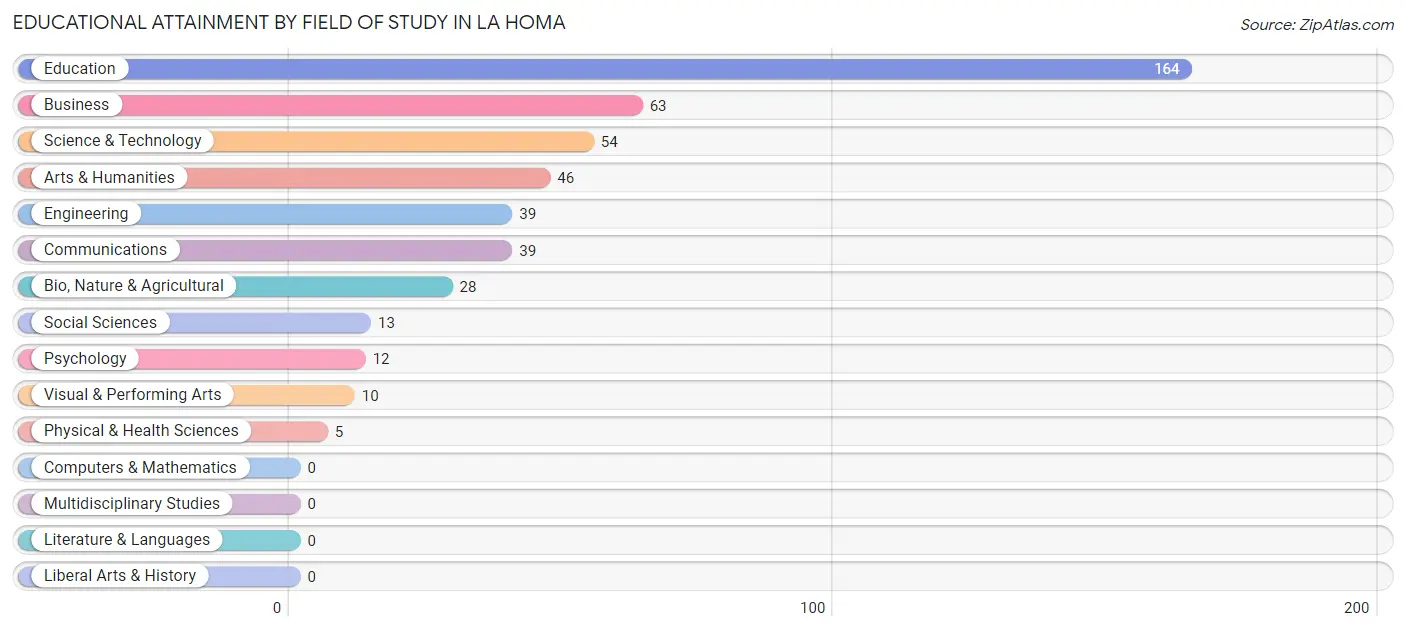
| Field of Study | # Graduates | % Graduates |
| Computers & Mathematics | 0 | 0.0% |
| Bio, Nature & Agricultural | 28 | 5.9% |
| Physical & Health Sciences | 5 | 1.1% |
| Psychology | 12 | 2.5% |
| Social Sciences | 13 | 2.8% |
| Engineering | 39 | 8.3% |
| Multidisciplinary Studies | 0 | 0.0% |
| Science & Technology | 54 | 11.4% |
| Business | 63 | 13.3% |
| Education | 164 | 34.7% |
| Literature & Languages | 0 | 0.0% |
| Liberal Arts & History | 0 | 0.0% |
| Visual & Performing Arts | 10 | 2.1% |
| Communications | 39 | 8.3% |
| Arts & Humanities | 46 | 9.7% |
| Total | 473 | 100.0% |
Transportation & Commute in La Homa
Vehicle Availability by Sex in La Homa
The most prevalent vehicle ownership categories in La Homa are males with 3 vehicles (706, accounting for 33.5%) and females with 3 vehicles (435, making up 47.3%).
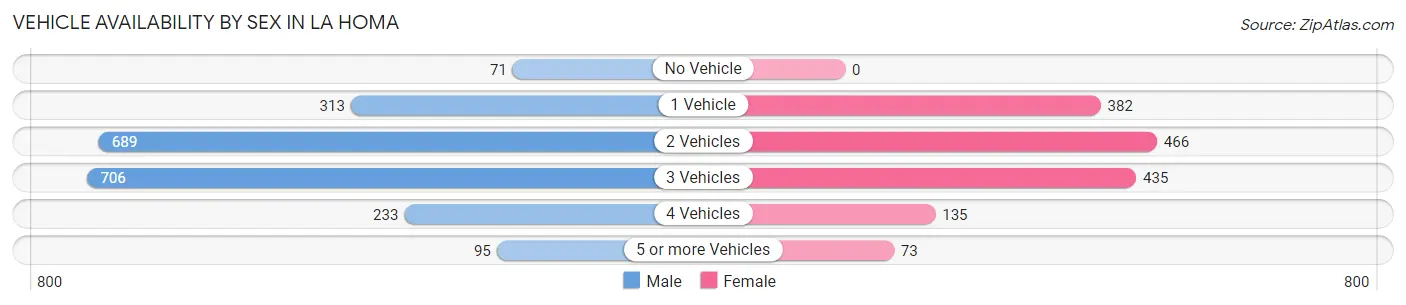
| Vehicles Available | Male | Female |
| No Vehicle | 71 (3.4%) | 0 (0.0%) |
| 1 Vehicle | 313 (14.9%) | 382 (25.6%) |
| 2 Vehicles | 689 (32.7%) | 466 (31.2%) |
| 3 Vehicles | 706 (33.5%) | 435 (29.2%) |
| 4 Vehicles | 233 (11.1%) | 135 (9.0%) |
| 5 or more Vehicles | 95 (4.5%) | 73 (4.9%) |
| Total | 2,107 (100.0%) | 1,491 (100.0%) |
Commute Time in La Homa
The most frequently occuring commute durations in La Homa are 20 to 24 minutes (643 commuters, 18.1%), 30 to 34 minutes (633 commuters, 17.8%), and 5 to 9 minutes (483 commuters, 13.6%).
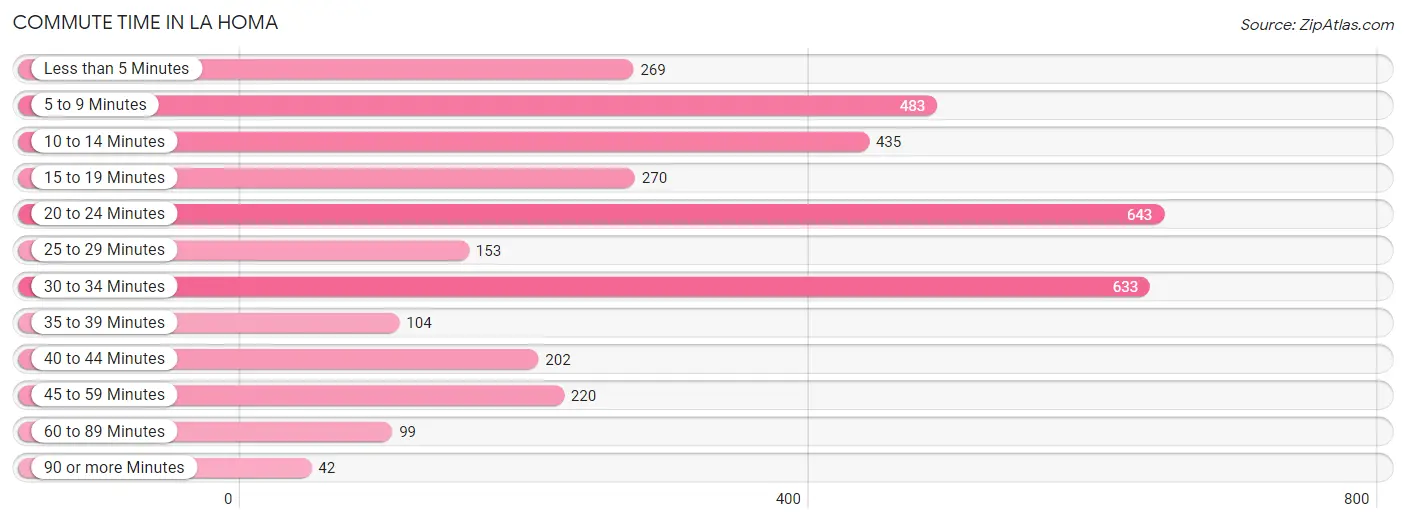
| Commute Time | # Commuters | % Commuters |
| Less than 5 Minutes | 269 | 7.6% |
| 5 to 9 Minutes | 483 | 13.6% |
| 10 to 14 Minutes | 435 | 12.2% |
| 15 to 19 Minutes | 270 | 7.6% |
| 20 to 24 Minutes | 643 | 18.1% |
| 25 to 29 Minutes | 153 | 4.3% |
| 30 to 34 Minutes | 633 | 17.8% |
| 35 to 39 Minutes | 104 | 2.9% |
| 40 to 44 Minutes | 202 | 5.7% |
| 45 to 59 Minutes | 220 | 6.2% |
| 60 to 89 Minutes | 99 | 2.8% |
| 90 or more Minutes | 42 | 1.2% |
Commute Time by Sex in La Homa
The most common commute times in La Homa are 30 to 34 minutes (515 commuters, 24.4%) for males and 20 to 24 minutes (265 commuters, 18.3%) for females.
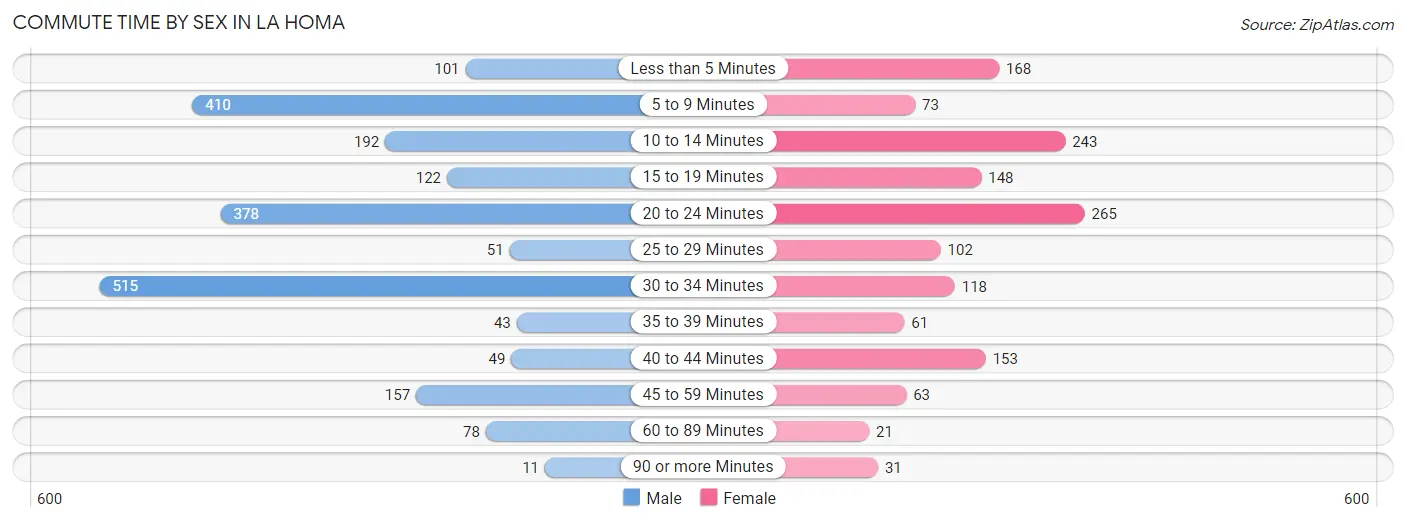
| Commute Time | Male | Female |
| Less than 5 Minutes | 101 (4.8%) | 168 (11.6%) |
| 5 to 9 Minutes | 410 (19.5%) | 73 (5.1%) |
| 10 to 14 Minutes | 192 (9.1%) | 243 (16.8%) |
| 15 to 19 Minutes | 122 (5.8%) | 148 (10.2%) |
| 20 to 24 Minutes | 378 (17.9%) | 265 (18.3%) |
| 25 to 29 Minutes | 51 (2.4%) | 102 (7.0%) |
| 30 to 34 Minutes | 515 (24.4%) | 118 (8.2%) |
| 35 to 39 Minutes | 43 (2.0%) | 61 (4.2%) |
| 40 to 44 Minutes | 49 (2.3%) | 153 (10.6%) |
| 45 to 59 Minutes | 157 (7.4%) | 63 (4.4%) |
| 60 to 89 Minutes | 78 (3.7%) | 21 (1.5%) |
| 90 or more Minutes | 11 (0.5%) | 31 (2.1%) |
Time of Departure to Work by Sex in La Homa
The most frequent times of departure to work in La Homa are 6:00 AM to 6:29 AM (340, 16.1%) for males and 8:00 AM to 8:29 AM (267, 18.5%) for females.
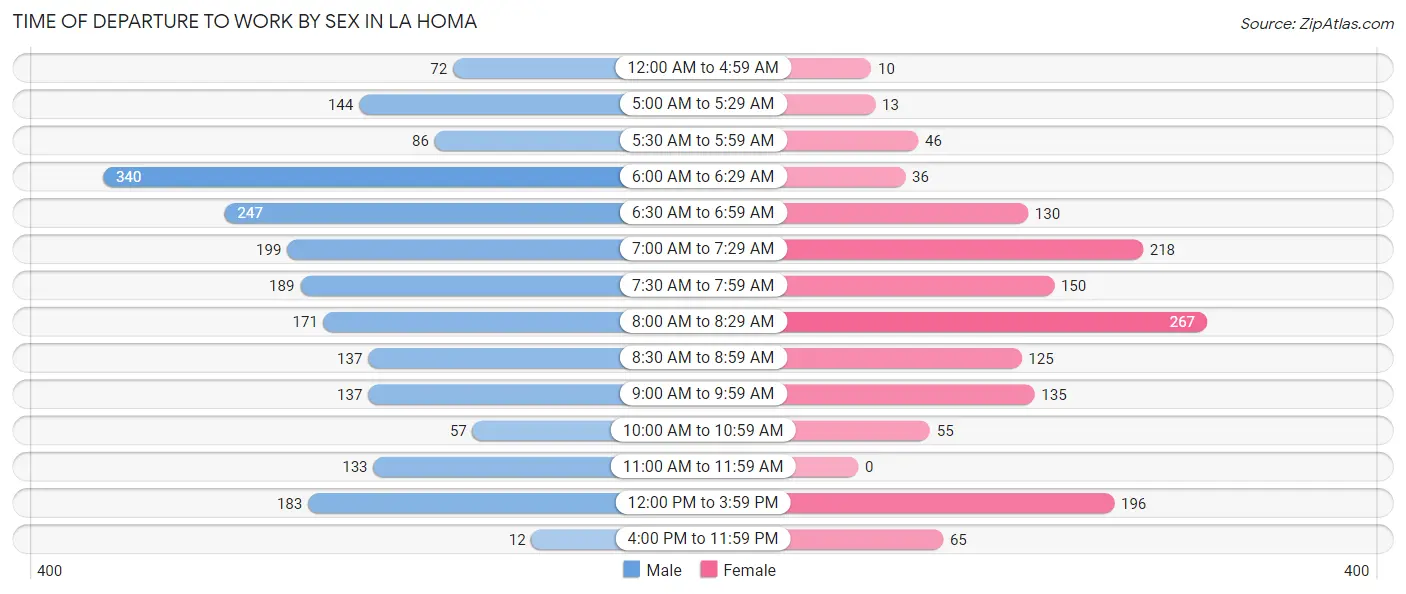
| Time of Departure | Male | Female |
| 12:00 AM to 4:59 AM | 72 (3.4%) | 10 (0.7%) |
| 5:00 AM to 5:29 AM | 144 (6.8%) | 13 (0.9%) |
| 5:30 AM to 5:59 AM | 86 (4.1%) | 46 (3.2%) |
| 6:00 AM to 6:29 AM | 340 (16.1%) | 36 (2.5%) |
| 6:30 AM to 6:59 AM | 247 (11.7%) | 130 (9.0%) |
| 7:00 AM to 7:29 AM | 199 (9.4%) | 218 (15.1%) |
| 7:30 AM to 7:59 AM | 189 (9.0%) | 150 (10.4%) |
| 8:00 AM to 8:29 AM | 171 (8.1%) | 267 (18.5%) |
| 8:30 AM to 8:59 AM | 137 (6.5%) | 125 (8.6%) |
| 9:00 AM to 9:59 AM | 137 (6.5%) | 135 (9.3%) |
| 10:00 AM to 10:59 AM | 57 (2.7%) | 55 (3.8%) |
| 11:00 AM to 11:59 AM | 133 (6.3%) | 0 (0.0%) |
| 12:00 PM to 3:59 PM | 183 (8.7%) | 196 (13.6%) |
| 4:00 PM to 11:59 PM | 12 (0.6%) | 65 (4.5%) |
| Total | 2,107 (100.0%) | 1,446 (100.0%) |
Housing Occupancy in La Homa
Occupancy by Ownership in La Homa
Of the total 2,915 dwellings in La Homa, owner-occupied units account for 2,434 (83.5%), while renter-occupied units make up 481 (16.5%).
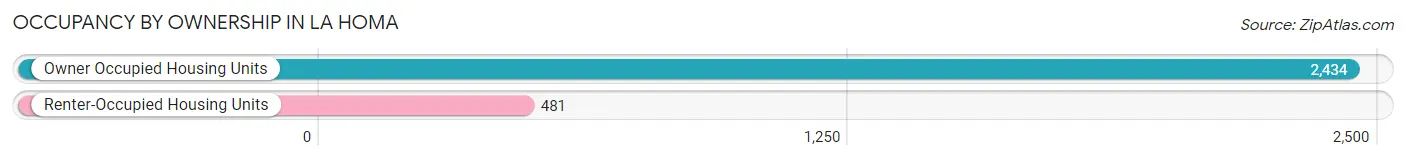
| Occupancy | # Housing Units | % Housing Units |
| Owner Occupied Housing Units | 2,434 | 83.5% |
| Renter-Occupied Housing Units | 481 | 16.5% |
| Total Occupied Housing Units | 2,915 | 100.0% |
Occupancy by Household Size in La Homa
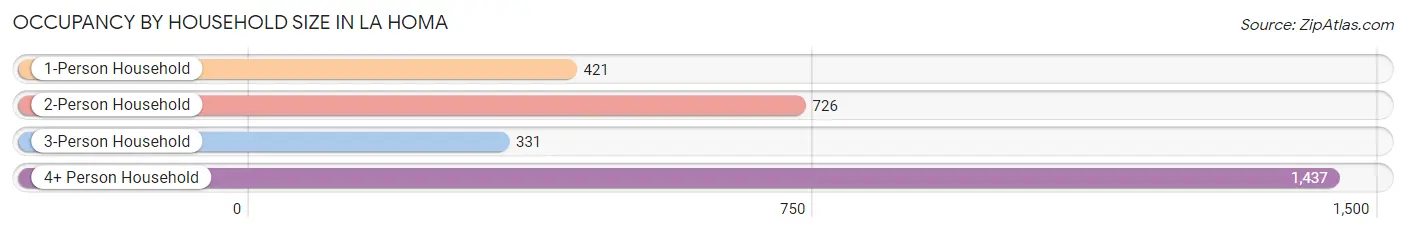
| Household Size | # Housing Units | % Housing Units |
| 1-Person Household | 421 | 14.4% |
| 2-Person Household | 726 | 24.9% |
| 3-Person Household | 331 | 11.4% |
| 4+ Person Household | 1,437 | 49.3% |
| Total Housing Units | 2,915 | 100.0% |
Occupancy by Ownership by Household Size in La Homa
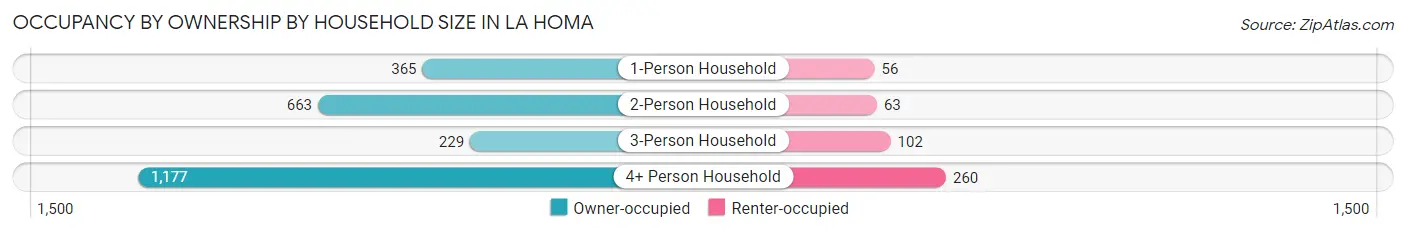
| Household Size | Owner-occupied | Renter-occupied |
| 1-Person Household | 365 (86.7%) | 56 (13.3%) |
| 2-Person Household | 663 (91.3%) | 63 (8.7%) |
| 3-Person Household | 229 (69.2%) | 102 (30.8%) |
| 4+ Person Household | 1,177 (81.9%) | 260 (18.1%) |
| Total Housing Units | 2,434 (83.5%) | 481 (16.5%) |
Occupancy by Educational Attainment in La Homa
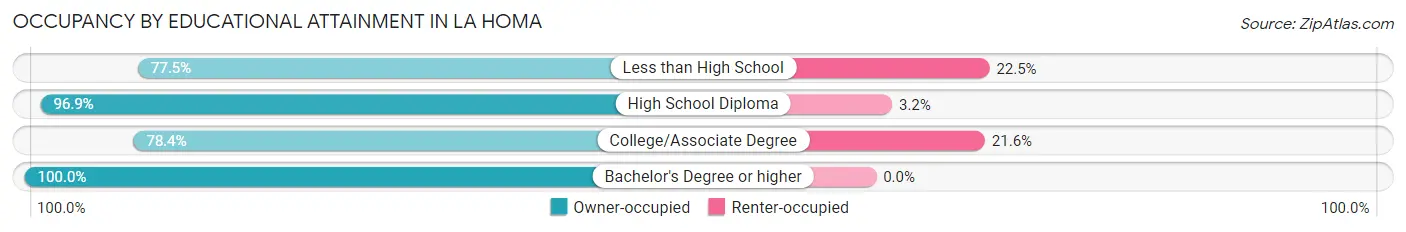
| Household Size | Owner-occupied | Renter-occupied |
| Less than High School | 1,143 (77.5%) | 331 (22.5%) |
| High School Diploma | 615 (96.9%) | 20 (3.2%) |
| College/Associate Degree | 473 (78.4%) | 130 (21.6%) |
| Bachelor's Degree or higher | 203 (100.0%) | 0 (0.0%) |
Occupancy by Age of Householder in La Homa
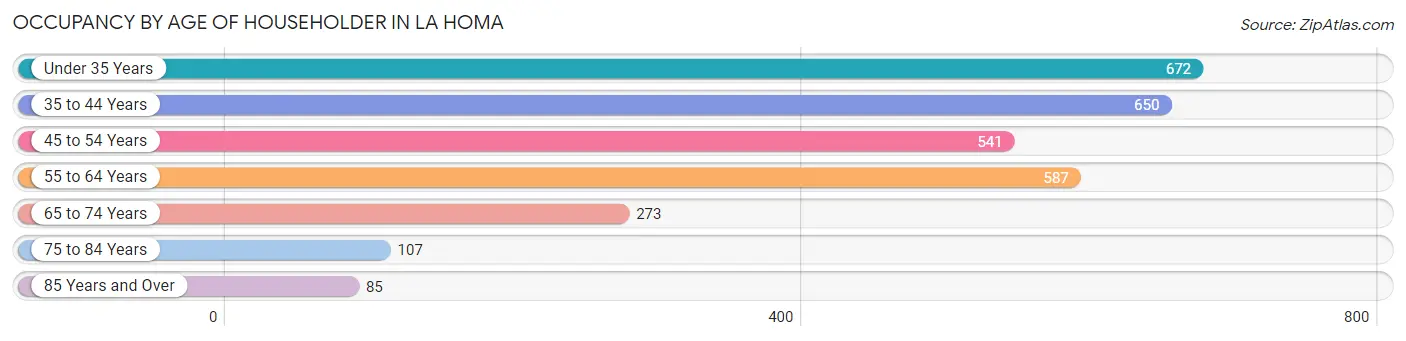
| Age Bracket | # Households | % Households |
| Under 35 Years | 672 | 23.1% |
| 35 to 44 Years | 650 | 22.3% |
| 45 to 54 Years | 541 | 18.6% |
| 55 to 64 Years | 587 | 20.1% |
| 65 to 74 Years | 273 | 9.4% |
| 75 to 84 Years | 107 | 3.7% |
| 85 Years and Over | 85 | 2.9% |
| Total | 2,915 | 100.0% |
Housing Finances in La Homa
Median Income by Occupancy in La Homa
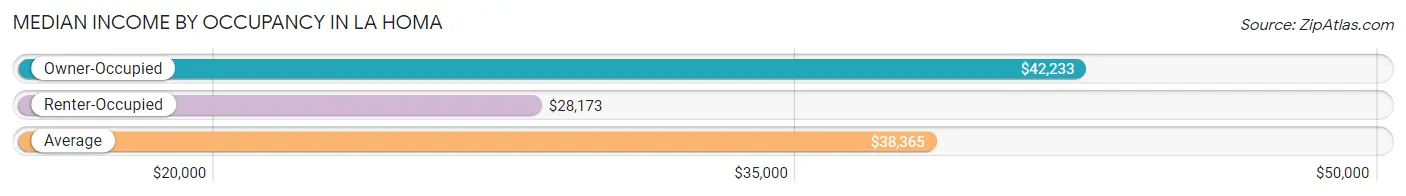
| Occupancy Type | # Households | Median Income |
| Owner-Occupied | 2,434 (83.5%) | $42,233 |
| Renter-Occupied | 481 (16.5%) | $28,173 |
| Average | 2,915 (100.0%) | $38,365 |
Occupancy by Householder Income Bracket in La Homa
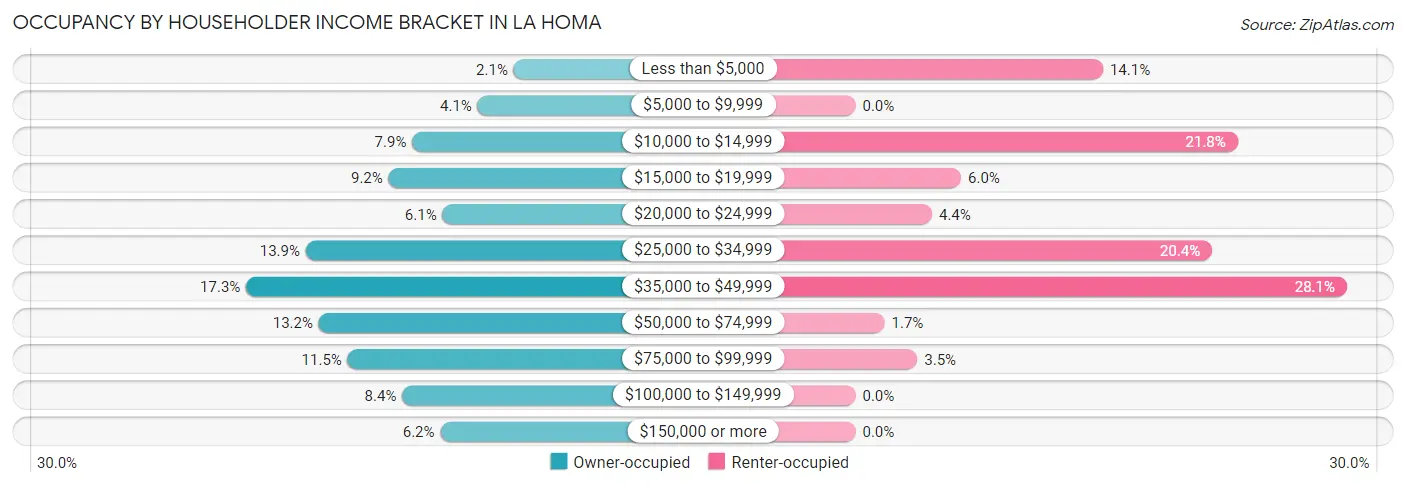
| Income Bracket | Owner-occupied | Renter-occupied |
| Less than $5,000 | 50 (2.1%) | 68 (14.1%) |
| $5,000 to $9,999 | 100 (4.1%) | 0 (0.0%) |
| $10,000 to $14,999 | 191 (7.9%) | 105 (21.8%) |
| $15,000 to $19,999 | 224 (9.2%) | 29 (6.0%) |
| $20,000 to $24,999 | 149 (6.1%) | 21 (4.4%) |
| $25,000 to $34,999 | 339 (13.9%) | 98 (20.4%) |
| $35,000 to $49,999 | 422 (17.3%) | 135 (28.1%) |
| $50,000 to $74,999 | 321 (13.2%) | 8 (1.7%) |
| $75,000 to $99,999 | 281 (11.5%) | 17 (3.5%) |
| $100,000 to $149,999 | 205 (8.4%) | 0 (0.0%) |
| $150,000 or more | 152 (6.2%) | 0 (0.0%) |
| Total | 2,434 (100.0%) | 481 (100.0%) |
Monthly Housing Cost Tiers in La Homa
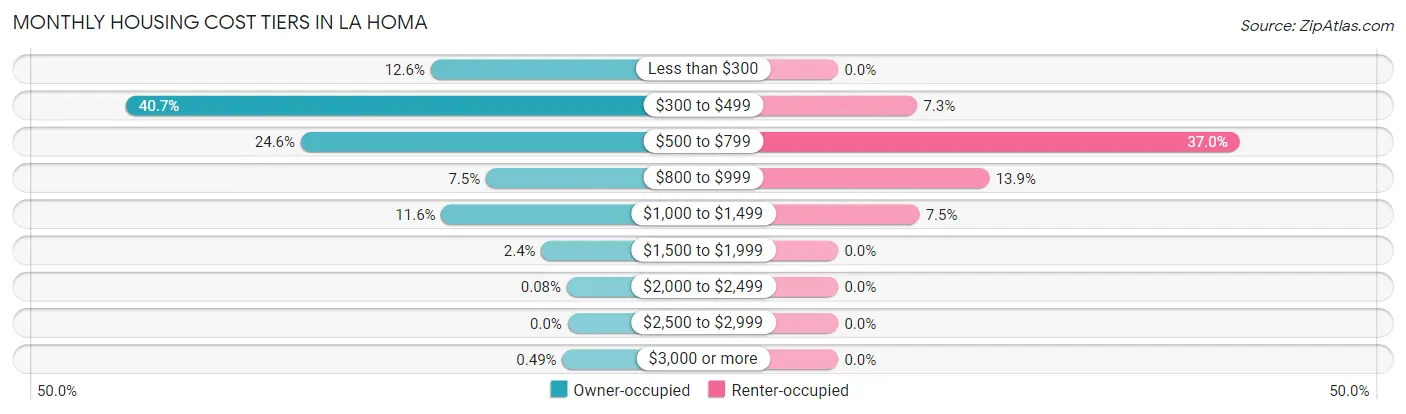
| Monthly Cost | Owner-occupied | Renter-occupied |
| Less than $300 | 307 (12.6%) | 0 (0.0%) |
| $300 to $499 | 990 (40.7%) | 35 (7.3%) |
| $500 to $799 | 598 (24.6%) | 178 (37.0%) |
| $800 to $999 | 183 (7.5%) | 67 (13.9%) |
| $1,000 to $1,499 | 283 (11.6%) | 36 (7.5%) |
| $1,500 to $1,999 | 59 (2.4%) | 0 (0.0%) |
| $2,000 to $2,499 | 2 (0.1%) | 0 (0.0%) |
| $2,500 to $2,999 | 0 (0.0%) | 0 (0.0%) |
| $3,000 or more | 12 (0.5%) | 0 (0.0%) |
| Total | 2,434 (100.0%) | 481 (100.0%) |
Physical Housing Characteristics in La Homa
Housing Structures in La Homa
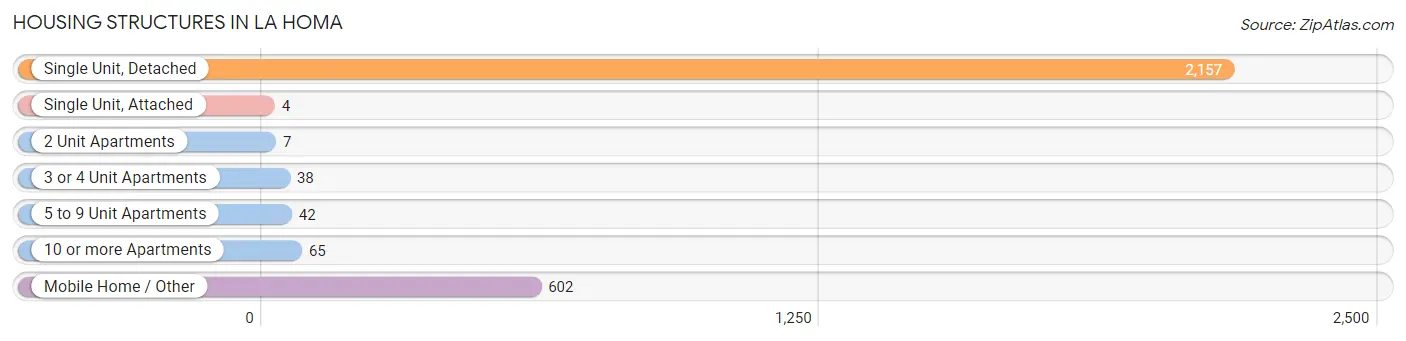
| Structure Type | # Housing Units | % Housing Units |
| Single Unit, Detached | 2,157 | 74.0% |
| Single Unit, Attached | 4 | 0.1% |
| 2 Unit Apartments | 7 | 0.2% |
| 3 or 4 Unit Apartments | 38 | 1.3% |
| 5 to 9 Unit Apartments | 42 | 1.4% |
| 10 or more Apartments | 65 | 2.2% |
| Mobile Home / Other | 602 | 20.6% |
| Total | 2,915 | 100.0% |
Housing Structures by Occupancy in La Homa
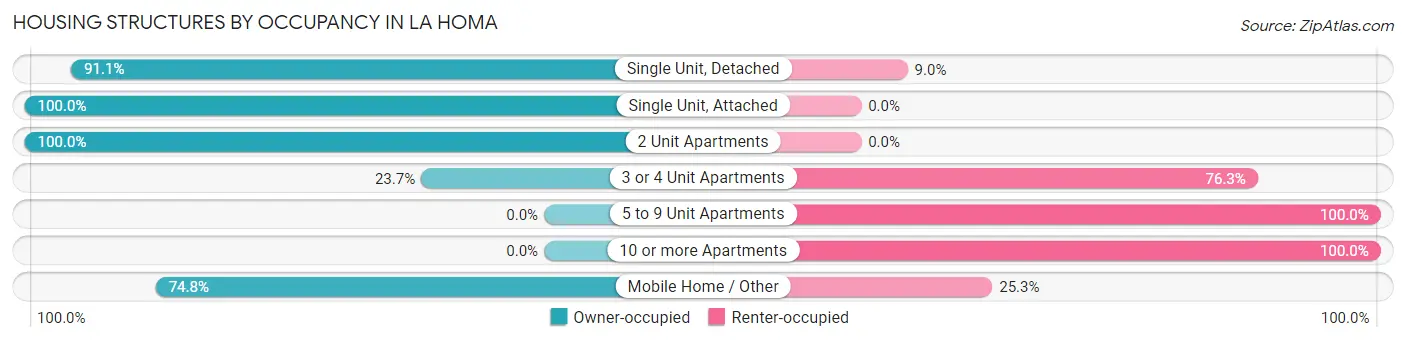
| Structure Type | Owner-occupied | Renter-occupied |
| Single Unit, Detached | 1,964 (91.0%) | 193 (8.9%) |
| Single Unit, Attached | 4 (100.0%) | 0 (0.0%) |
| 2 Unit Apartments | 7 (100.0%) | 0 (0.0%) |
| 3 or 4 Unit Apartments | 9 (23.7%) | 29 (76.3%) |
| 5 to 9 Unit Apartments | 0 (0.0%) | 42 (100.0%) |
| 10 or more Apartments | 0 (0.0%) | 65 (100.0%) |
| Mobile Home / Other | 450 (74.8%) | 152 (25.3%) |
| Total | 2,434 (83.5%) | 481 (16.5%) |
Housing Structures by Number of Rooms in La Homa
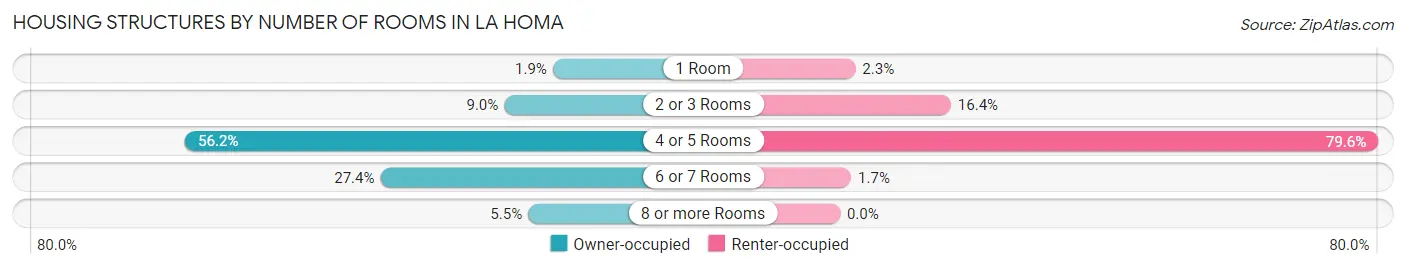
| Number of Rooms | Owner-occupied | Renter-occupied |
| 1 Room | 45 (1.8%) | 11 (2.3%) |
| 2 or 3 Rooms | 220 (9.0%) | 79 (16.4%) |
| 4 or 5 Rooms | 1,369 (56.2%) | 383 (79.6%) |
| 6 or 7 Rooms | 666 (27.4%) | 8 (1.7%) |
| 8 or more Rooms | 134 (5.5%) | 0 (0.0%) |
| Total | 2,434 (100.0%) | 481 (100.0%) |
Housing Structure by Heating Type in La Homa
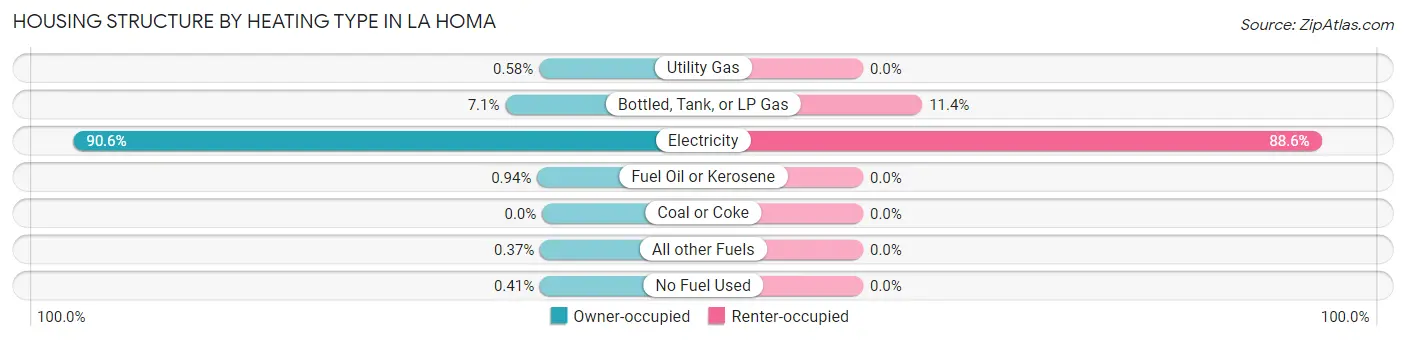
| Heating Type | Owner-occupied | Renter-occupied |
| Utility Gas | 14 (0.6%) | 0 (0.0%) |
| Bottled, Tank, or LP Gas | 173 (7.1%) | 55 (11.4%) |
| Electricity | 2,205 (90.6%) | 426 (88.6%) |
| Fuel Oil or Kerosene | 23 (0.9%) | 0 (0.0%) |
| Coal or Coke | 0 (0.0%) | 0 (0.0%) |
| All other Fuels | 9 (0.4%) | 0 (0.0%) |
| No Fuel Used | 10 (0.4%) | 0 (0.0%) |
| Total | 2,434 (100.0%) | 481 (100.0%) |
Household Vehicle Usage in La Homa
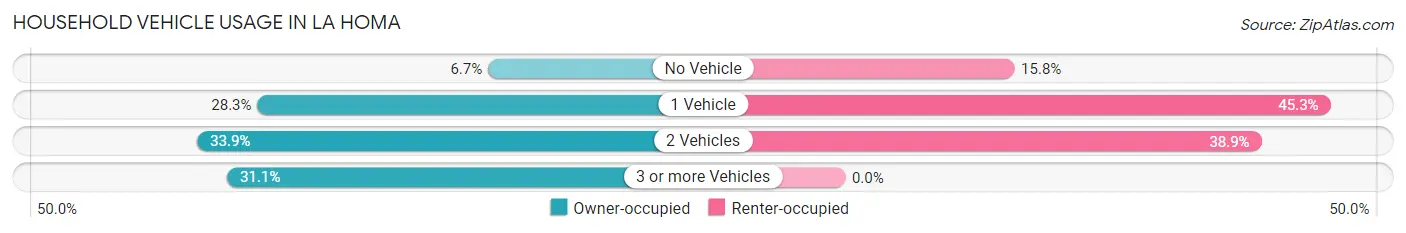
| Vehicles per Household | Owner-occupied | Renter-occupied |
| No Vehicle | 164 (6.7%) | 76 (15.8%) |
| 1 Vehicle | 688 (28.3%) | 218 (45.3%) |
| 2 Vehicles | 825 (33.9%) | 187 (38.9%) |
| 3 or more Vehicles | 757 (31.1%) | 0 (0.0%) |
| Total | 2,434 (100.0%) | 481 (100.0%) |
Real Estate & Mortgages in La Homa
Real Estate and Mortgage Overview in La Homa
| Characteristic | Without Mortgage | With Mortgage |
| Housing Units | 1,825 | 609 |
| Median Property Value | $78,800 | $120,100 |
| Median Household Income | $32,358 | $85 |
| Monthly Housing Costs | $426 | $0 |
| Real Estate Taxes | $1,534 | $0 |
Property Value by Mortgage Status in La Homa
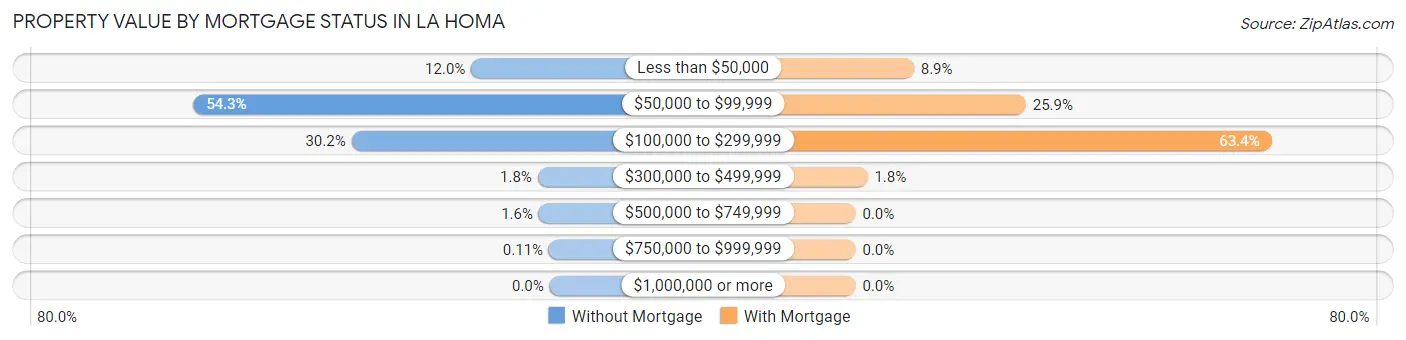
| Property Value | Without Mortgage | With Mortgage |
| Less than $50,000 | 218 (11.9%) | 54 (8.9%) |
| $50,000 to $99,999 | 991 (54.3%) | 158 (25.9%) |
| $100,000 to $299,999 | 551 (30.2%) | 386 (63.4%) |
| $300,000 to $499,999 | 33 (1.8%) | 11 (1.8%) |
| $500,000 to $749,999 | 30 (1.6%) | 0 (0.0%) |
| $750,000 to $999,999 | 2 (0.1%) | 0 (0.0%) |
| $1,000,000 or more | 0 (0.0%) | 0 (0.0%) |
| Total | 1,825 (100.0%) | 609 (100.0%) |
Household Income by Mortgage Status in La Homa
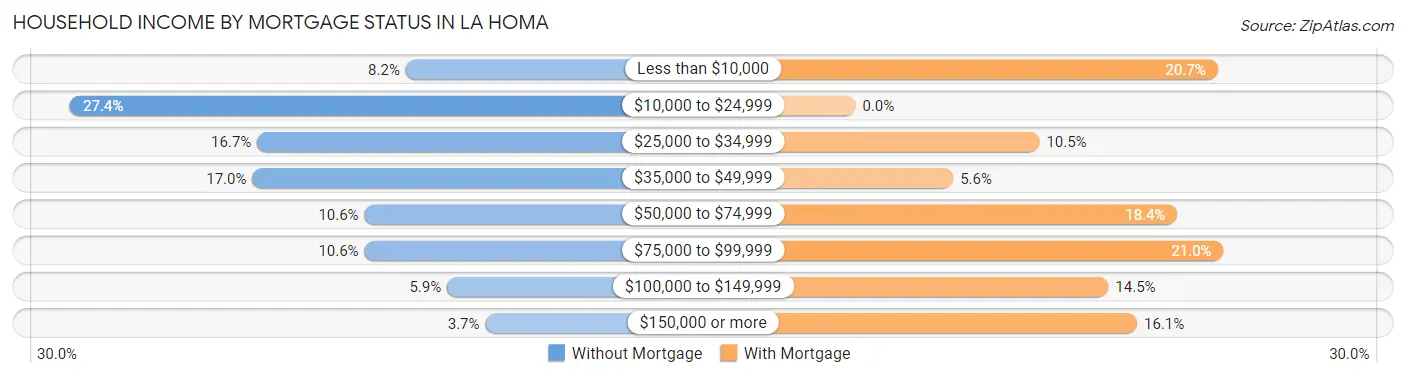
| Household Income | Without Mortgage | With Mortgage |
| Less than $10,000 | 150 (8.2%) | 126 (20.7%) |
| $10,000 to $24,999 | 500 (27.4%) | 0 (0.0%) |
| $25,000 to $34,999 | 305 (16.7%) | 64 (10.5%) |
| $35,000 to $49,999 | 310 (17.0%) | 34 (5.6%) |
| $50,000 to $74,999 | 193 (10.6%) | 112 (18.4%) |
| $75,000 to $99,999 | 193 (10.6%) | 128 (21.0%) |
| $100,000 to $149,999 | 107 (5.9%) | 88 (14.4%) |
| $150,000 or more | 67 (3.7%) | 98 (16.1%) |
| Total | 1,825 (100.0%) | 609 (100.0%) |
Property Value to Household Income Ratio in La Homa
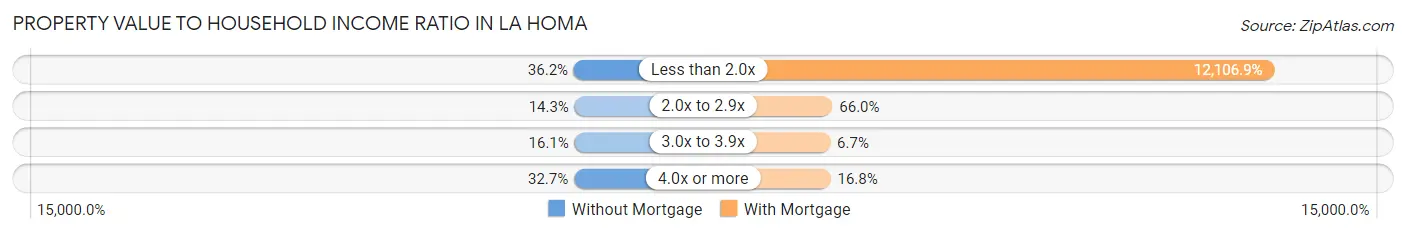
| Value-to-Income Ratio | Without Mortgage | With Mortgage |
| Less than 2.0x | 660 (36.2%) | 73,731 (12,106.9%) |
| 2.0x to 2.9x | 260 (14.2%) | 402 (66.0%) |
| 3.0x to 3.9x | 293 (16.1%) | 41 (6.7%) |
| 4.0x or more | 596 (32.7%) | 102 (16.8%) |
| Total | 1,825 (100.0%) | 609 (100.0%) |
Real Estate Taxes by Mortgage Status in La Homa
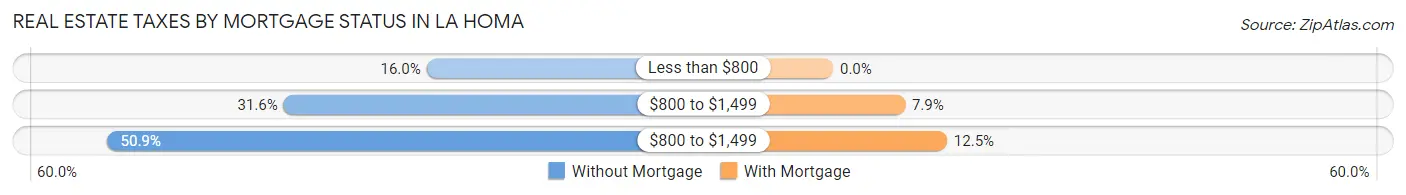
| Property Taxes | Without Mortgage | With Mortgage |
| Less than $800 | 291 (16.0%) | 0 (0.0%) |
| $800 to $1,499 | 577 (31.6%) | 48 (7.9%) |
| $800 to $1,499 | 929 (50.9%) | 76 (12.5%) |
| Total | 1,825 (100.0%) | 609 (100.0%) |
Health & Disability in La Homa
Health Insurance Coverage by Age in La Homa
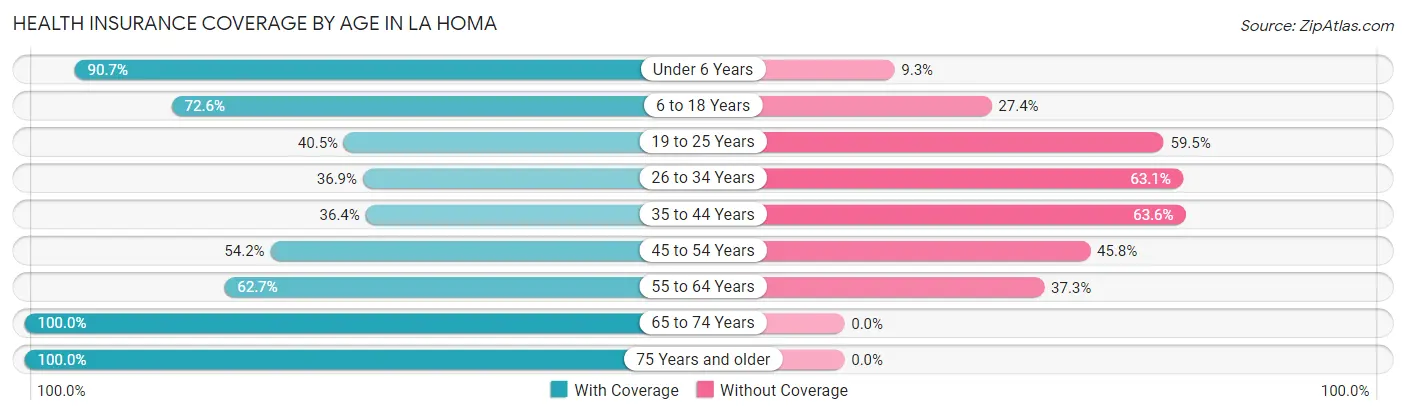
| Age Bracket | With Coverage | Without Coverage |
| Under 6 Years | 1,244 (90.7%) | 128 (9.3%) |
| 6 to 18 Years | 1,960 (72.6%) | 741 (27.4%) |
| 19 to 25 Years | 401 (40.5%) | 590 (59.5%) |
| 26 to 34 Years | 577 (36.9%) | 986 (63.1%) |
| 35 to 44 Years | 457 (36.4%) | 798 (63.6%) |
| 45 to 54 Years | 553 (54.2%) | 468 (45.8%) |
| 55 to 64 Years | 633 (62.7%) | 376 (37.3%) |
| 65 to 74 Years | 397 (100.0%) | 0 (0.0%) |
| 75 Years and older | 342 (100.0%) | 0 (0.0%) |
| Total | 6,564 (61.6%) | 4,087 (38.4%) |
Health Insurance Coverage by Citizenship Status in La Homa
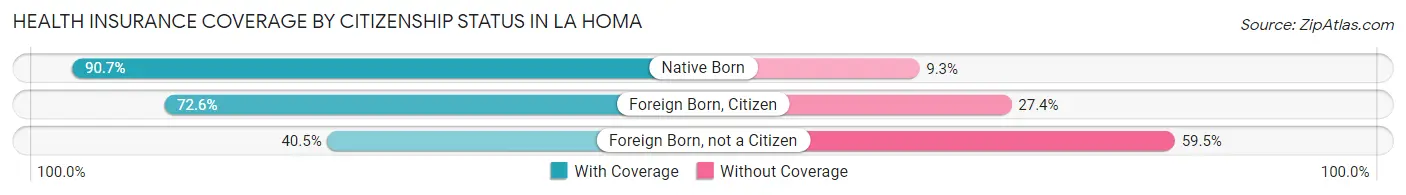
| Citizenship Status | With Coverage | Without Coverage |
| Native Born | 1,244 (90.7%) | 128 (9.3%) |
| Foreign Born, Citizen | 1,960 (72.6%) | 741 (27.4%) |
| Foreign Born, not a Citizen | 401 (40.5%) | 590 (59.5%) |
Health Insurance Coverage by Household Income in La Homa
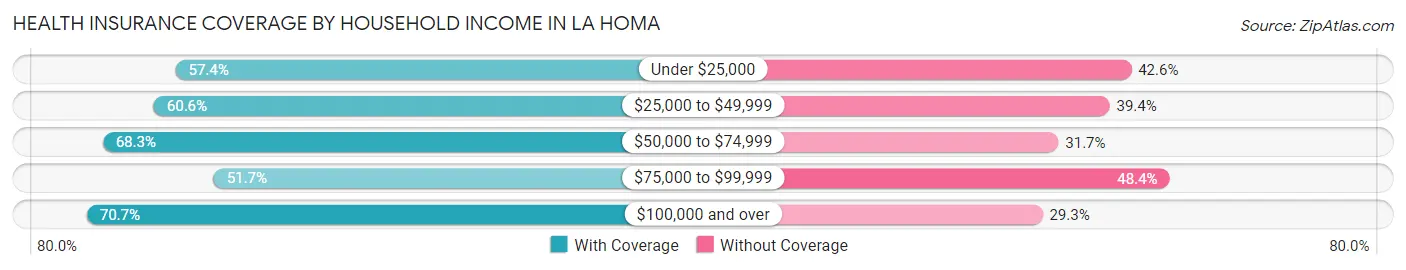
| Household Income | With Coverage | Without Coverage |
| Under $25,000 | 1,323 (57.4%) | 983 (42.6%) |
| $25,000 to $49,999 | 1,990 (60.6%) | 1,293 (39.4%) |
| $50,000 to $74,999 | 1,096 (68.3%) | 509 (31.7%) |
| $75,000 to $99,999 | 784 (51.6%) | 734 (48.3%) |
| $100,000 and over | 1,364 (70.7%) | 566 (29.3%) |
Public vs Private Health Insurance Coverage by Age in La Homa
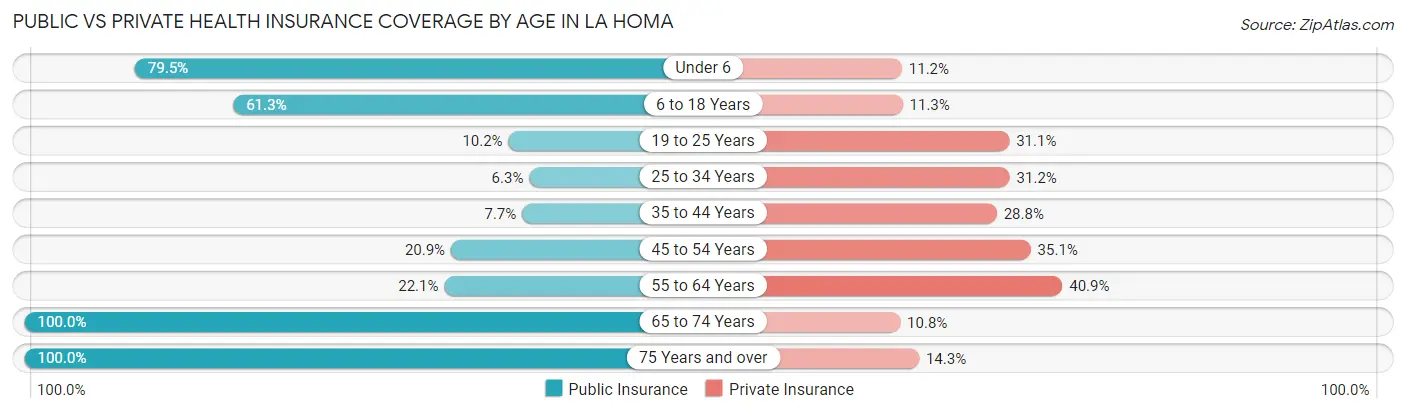
| Age Bracket | Public Insurance | Private Insurance |
| Under 6 | 1,091 (79.5%) | 153 (11.2%) |
| 6 to 18 Years | 1,655 (61.3%) | 305 (11.3%) |
| 19 to 25 Years | 101 (10.2%) | 308 (31.1%) |
| 25 to 34 Years | 99 (6.3%) | 487 (31.2%) |
| 35 to 44 Years | 96 (7.6%) | 361 (28.8%) |
| 45 to 54 Years | 213 (20.9%) | 358 (35.1%) |
| 55 to 64 Years | 223 (22.1%) | 413 (40.9%) |
| 65 to 74 Years | 397 (100.0%) | 43 (10.8%) |
| 75 Years and over | 342 (100.0%) | 49 (14.3%) |
| Total | 4,217 (39.6%) | 2,477 (23.3%) |
Disability Status by Sex by Age in La Homa
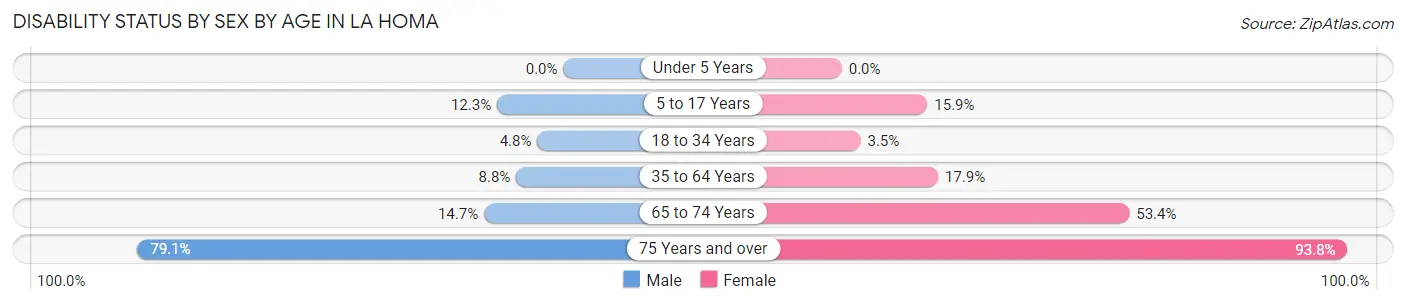
| Age Bracket | Male | Female |
| Under 5 Years | 0 (0.0%) | 0 (0.0%) |
| 5 to 17 Years | 157 (12.3%) | 240 (15.9%) |
| 18 to 34 Years | 68 (4.8%) | 48 (3.5%) |
| 35 to 64 Years | 133 (8.8%) | 316 (17.9%) |
| 65 to 74 Years | 19 (14.7%) | 143 (53.4%) |
| 75 Years and over | 155 (79.1%) | 137 (93.8%) |
Disability Class by Sex by Age in La Homa
Disability Class: Hearing Difficulty
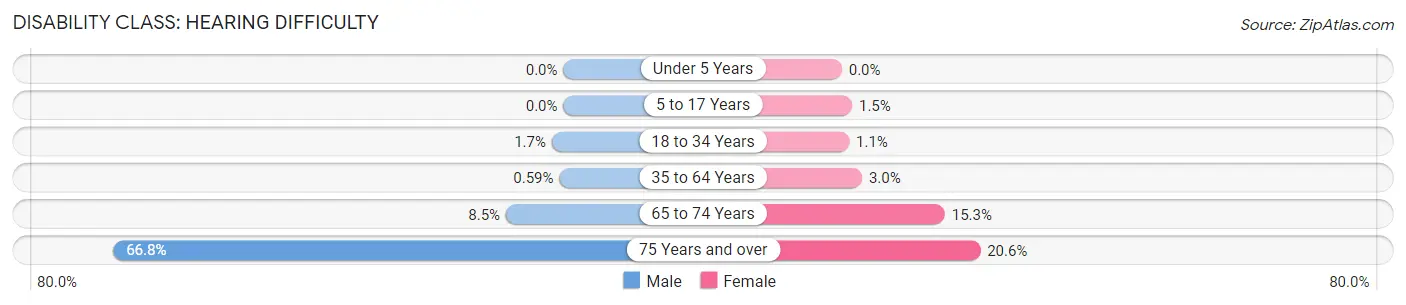
| Age Bracket | Male | Female |
| Under 5 Years | 0 (0.0%) | 0 (0.0%) |
| 5 to 17 Years | 0 (0.0%) | 23 (1.5%) |
| 18 to 34 Years | 24 (1.7%) | 15 (1.1%) |
| 35 to 64 Years | 9 (0.6%) | 53 (3.0%) |
| 65 to 74 Years | 11 (8.5%) | 41 (15.3%) |
| 75 Years and over | 131 (66.8%) | 30 (20.5%) |
Disability Class: Vision Difficulty
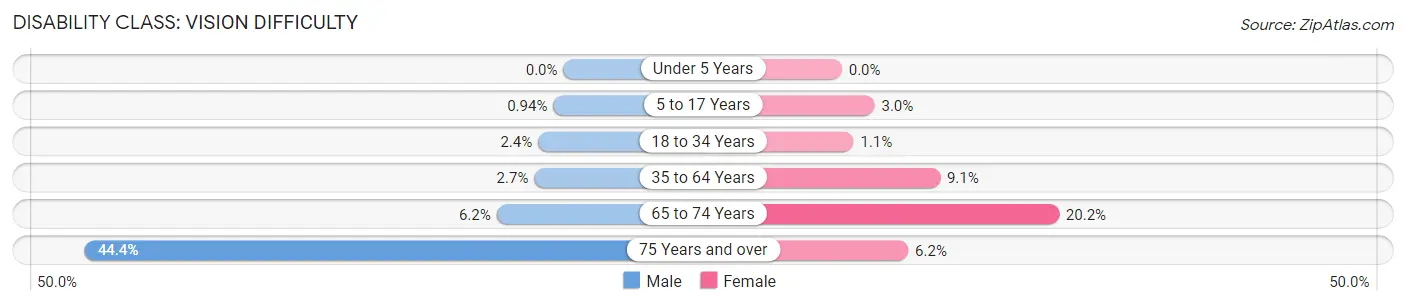
| Age Bracket | Male | Female |
| Under 5 Years | 0 (0.0%) | 0 (0.0%) |
| 5 to 17 Years | 12 (0.9%) | 46 (3.0%) |
| 18 to 34 Years | 33 (2.4%) | 15 (1.1%) |
| 35 to 64 Years | 41 (2.7%) | 161 (9.1%) |
| 65 to 74 Years | 8 (6.2%) | 54 (20.2%) |
| 75 Years and over | 87 (44.4%) | 9 (6.2%) |
Disability Class: Cognitive Difficulty
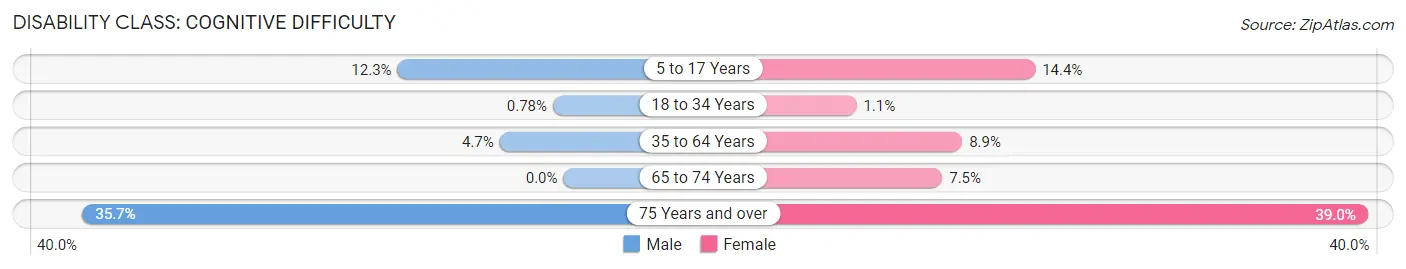
| Age Bracket | Male | Female |
| 5 to 17 Years | 157 (12.3%) | 217 (14.4%) |
| 18 to 34 Years | 11 (0.8%) | 15 (1.1%) |
| 35 to 64 Years | 72 (4.7%) | 158 (8.9%) |
| 65 to 74 Years | 0 (0.0%) | 20 (7.5%) |
| 75 Years and over | 70 (35.7%) | 57 (39.0%) |
Disability Class: Ambulatory Difficulty
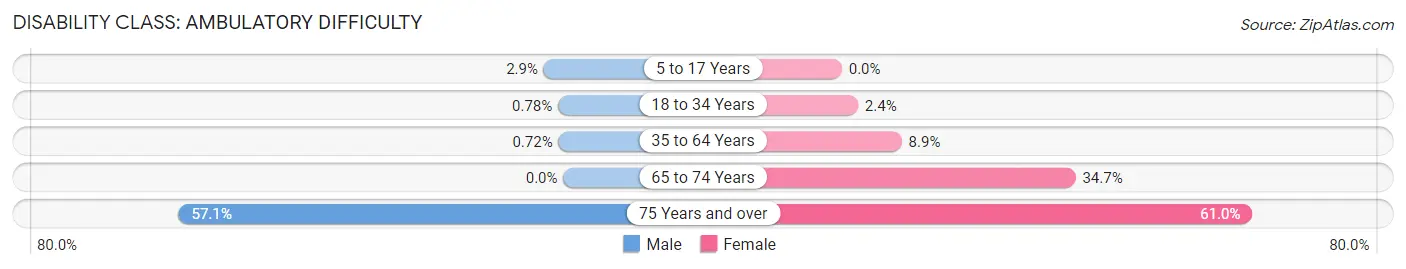
| Age Bracket | Male | Female |
| 5 to 17 Years | 37 (2.9%) | 0 (0.0%) |
| 18 to 34 Years | 11 (0.8%) | 33 (2.4%) |
| 35 to 64 Years | 11 (0.7%) | 157 (8.9%) |
| 65 to 74 Years | 0 (0.0%) | 93 (34.7%) |
| 75 Years and over | 112 (57.1%) | 89 (61.0%) |
Disability Class: Self-Care Difficulty
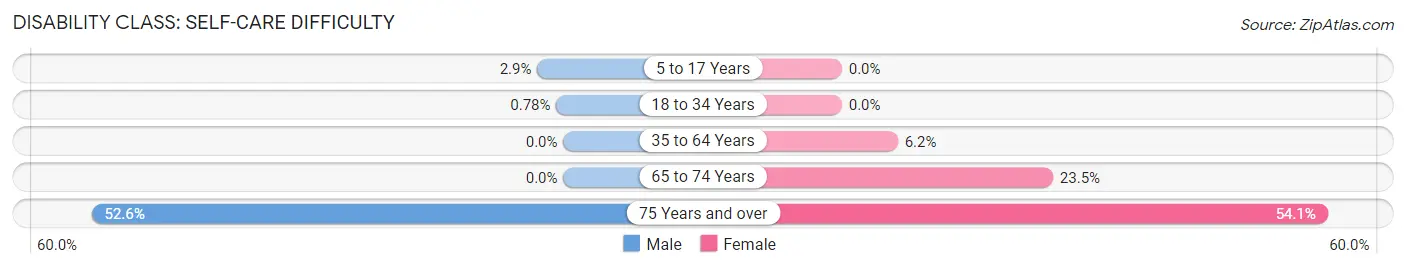
| Age Bracket | Male | Female |
| 5 to 17 Years | 37 (2.9%) | 0 (0.0%) |
| 18 to 34 Years | 11 (0.8%) | 0 (0.0%) |
| 35 to 64 Years | 0 (0.0%) | 110 (6.2%) |
| 65 to 74 Years | 0 (0.0%) | 63 (23.5%) |
| 75 Years and over | 103 (52.5%) | 79 (54.1%) |
Technology Access in La Homa
Computing Device Access in La Homa
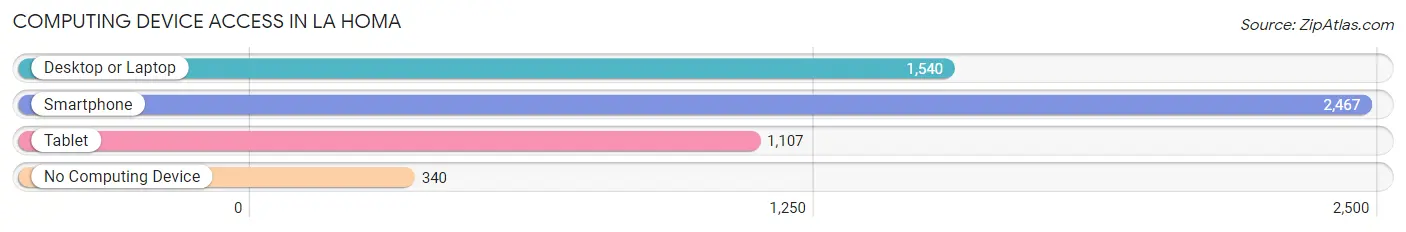
| Device Type | # Households | % Households |
| Desktop or Laptop | 1,540 | 52.8% |
| Smartphone | 2,467 | 84.6% |
| Tablet | 1,107 | 38.0% |
| No Computing Device | 340 | 11.7% |
| Total | 2,915 | 100.0% |
Internet Access in La Homa
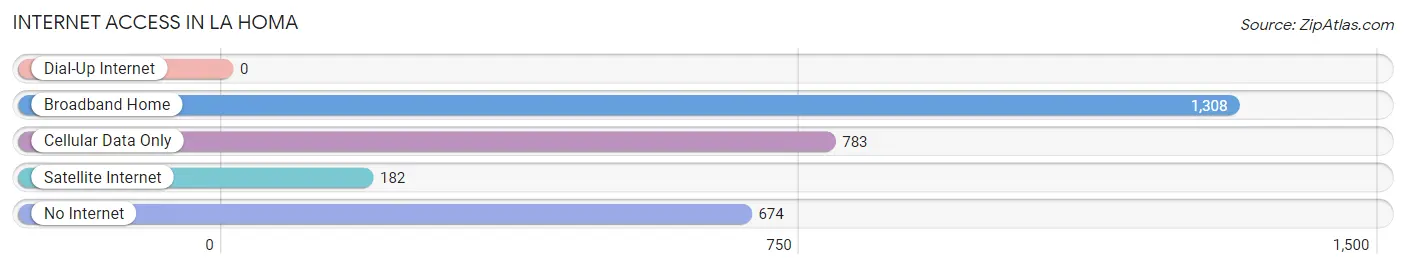
| Internet Type | # Households | % Households |
| Dial-Up Internet | 0 | 0.0% |
| Broadband Home | 1,308 | 44.9% |
| Cellular Data Only | 783 | 26.9% |
| Satellite Internet | 182 | 6.2% |
| No Internet | 674 | 23.1% |
| Total | 2,915 | 100.0% |
La Homa Summary
La Homa is a census-designated place (CDP) located in Hidalgo County, Texas, United States. The population was 2,845 at the 2010 census. It is part of the McAllen–Edinburg–Mission Metropolitan Statistical Area.
History
La Homa was founded in the early 1900s by a group of Mexican immigrants who were looking for a place to settle and start a new life. The name La Homa is derived from the Spanish word for “the home”. The original settlers were mostly farmers and ranchers who grew cotton, corn, and other crops. The area was also known for its cattle ranching.
In the early 1900s, the area was sparsely populated and the land was mostly used for grazing. In the 1920s, the area began to develop as more people moved in and began to farm the land. The first school was built in the area in 1925 and the first post office was established in 1927.
In the 1940s, the area began to grow rapidly as more people moved in and began to develop the land. The population increased from 1,000 in 1940 to over 5,000 in 1950. The area was also home to a number of businesses, including a cotton gin, a grocery store, and a movie theater.
In the 1950s, the area continued to grow and the population increased to over 10,000. The area was also home to a number of businesses, including a bank, a hospital, and a number of restaurants.
In the 1960s, the area continued to grow and the population increased to over 15,000. The area was also home to a number of businesses, including a movie theater, a bowling alley, and a number of restaurants.
In the 1970s, the area continued to grow and the population increased to over 20,000. The area was also home to a number of businesses, including a shopping center, a library, and a number of restaurants.
In the 1980s, the area continued to grow and the population increased to over 25,000. The area was also home to a number of businesses, including a hospital, a movie theater, and a number of restaurants.
In the 1990s, the area continued to grow and the population increased to over 30,000. The area was also home to a number of businesses, including a shopping center, a library, and a number of restaurants.
Geography
La Homa is located at 26°14'17" North, 98°14'17" West (26.238, -98.238). It is situated in the Rio Grande Valley of South Texas, approximately 10 miles north of the Mexico–United States border.
The area is mostly flat and is covered in grasslands and shrublands. The climate is subtropical and semi-arid, with hot summers and mild winters. The average annual temperature is 73°F (23°C).
Economy
The economy of La Homa is largely based on agriculture. The area is home to a number of farms and ranches that produce cotton, corn, sorghum, and other crops. The area is also home to a number of businesses, including a shopping center, a library, and a number of restaurants.
Demographics
As of the 2010 census, there were 2,845 people, 890 households, and 717 families residing in the CDP. The population density was 1,845.3 people per square mile (715.3/km2). There were 990 housing units at an average density of 631.3 per square mile (243.7/km2). The racial makeup of the CDP was 79.2% White, 0.3% African American, 0.2% Native American, 0.1% Asian, 0.1% Pacific Islander, 18.7% from other races, and 1.5% from two or more races. Hispanic or Latino of any race were 97.3% of the population.
There were 890 households, out of which 44.2% had children under the age of 18 living with them, 57.3% were married couples living together, 15.7% had a female householder with no husband present, and 20.7% were non-families. 17.2% of all households were made up of individuals, and 7.2% had someone living alone who was 65 years of age or older. The average household size was 3.19 and the average family size was 3.60.
In the CDP, the population was spread out, with 33.2% under the age of 18, 10.2% from 18 to 24, 27.2% from 25 to 44, 19.7% from 45 to 64, and 9.7% who were 65 years of age or older. The median age was 30 years. For every 100 females, there were 95.2 males. For every 100 females age 18 and over, there were 91.2 males.
The median income for a household in the CDP was $20,938, and the median income for a family was $22,917. Males had a median income of $17,917 versus $14,375 for females. The per capita income for the CDP was $8,845. About 33.2% of families and 37.2% of the population were below the poverty line, including 45.2% of those under age 18 and 33.3% of those age 65 or over.
Common Questions
What is Per Capita Income in La Homa?
Per Capita income in La Homa is $15,122.
What is the Median Family Income in La Homa?
Median Family Income in La Homa is $42,139.
What is the Median Household income in La Homa?
Median Household Income in La Homa is $38,365.
What is Income or Wage Gap in La Homa?
Income or Wage Gap in La Homa is 37.9%.
Women in La Homa earn 62.1 cents for every dollar earned by a man.
What is Family Income Deficit in La Homa?
Family Income Deficit in La Homa is $10,035.
Families that are below poverty line in La Homa earn $10,035 less on average than the poverty threshold level.
What is Inequality or Gini Index in La Homa?
Inequality or Gini Index in La Homa is 0.46.
What is the Total Population of La Homa?
Total Population of La Homa is 10,661.
What is the Total Male Population of La Homa?
Total Male Population of La Homa is 5,218.
What is the Total Female Population of La Homa?
Total Female Population of La Homa is 5,443.
What is the Ratio of Males per 100 Females in La Homa?
There are 95.87 Males per 100 Females in La Homa.
What is the Ratio of Females per 100 Males in La Homa?
There are 104.31 Females per 100 Males in La Homa.
What is the Median Population Age in La Homa?
Median Population Age in La Homa is 27.8 Years.
What is the Average Family Size in La Homa
Average Family Size in La Homa is 4.0 People.
What is the Average Household Size in La Homa
Average Household Size in La Homa is 3.6 People.
How Large is the Labor Force in La Homa?
There are 4,496 People in the Labor Forcein in La Homa.
What is the Percentage of People in the Labor Force in La Homa?
63.4% of People are in the Labor Force in La Homa.
What is the Unemployment Rate in La Homa?
Unemployment Rate in La Homa is 13.3%.