Kilgore, TX Map & Demographics
Kilgore Map
Kilgore Overview
$27,323
PER CAPITA INCOME
$69,748
AVG FAMILY INCOME
$58,439
AVG HOUSEHOLD INCOME
34.7%
WAGE / INCOME GAP [ % ]
65.3¢/ $1
WAGE / INCOME GAP [ $ ]
0.43
INEQUALITY / GINI INDEX
13,400
TOTAL POPULATION
6,647
MALE POPULATION
6,753
FEMALE POPULATION
98.43
MALES / 100 FEMALES
101.59
FEMALES / 100 MALES
38.2
MEDIAN AGE
3.4
AVG FAMILY SIZE
2.8
AVG HOUSEHOLD SIZE
6,243
LABOR FORCE [ PEOPLE ]
61.3%
PERCENT IN LABOR FORCE
4.8%
UNEMPLOYMENT RATE
Kilgore Zip Codes
Kilgore Area Codes
Income in Kilgore
Income Overview in Kilgore
Per Capita Income in Kilgore is $27,323, while median incomes of families and households are $69,748 and $58,439 respectively.
| Characteristic | Number | Measure |
| Per Capita Income | 13,400 | $27,323 |
| Median Family Income | 3,180 | $69,748 |
| Mean Family Income | 3,180 | $87,298 |
| Median Household Income | 4,607 | $58,439 |
| Mean Household Income | 4,607 | $75,375 |
| Income Deficit | 3,180 | $0 |
| Wage / Income Gap (%) | 13,400 | 34.70% |
| Wage / Income Gap ($) | 13,400 | 65.30¢ per $1 |
| Gini / Inequality Index | 13,400 | 0.43 |
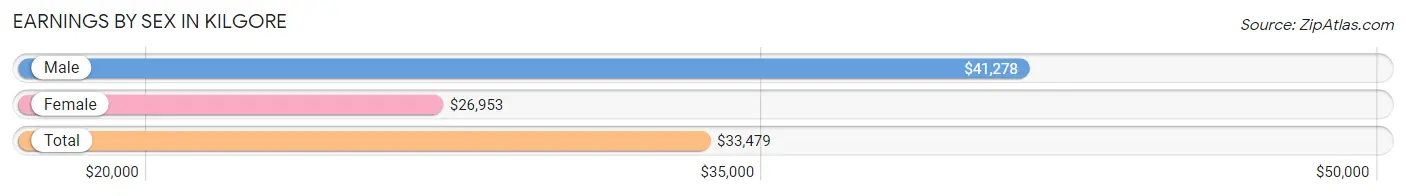
Earnings by Sex in Kilgore
Average Earnings in Kilgore are $33,479, $41,278 for men and $26,953 for women, a difference of 34.7%.
| Sex | Number | Average Earnings |
| Male | 3,740 (57.7%) | $41,278 |
| Female | 2,744 (42.3%) | $26,953 |
| Total | 6,484 (100.0%) | $33,479 |
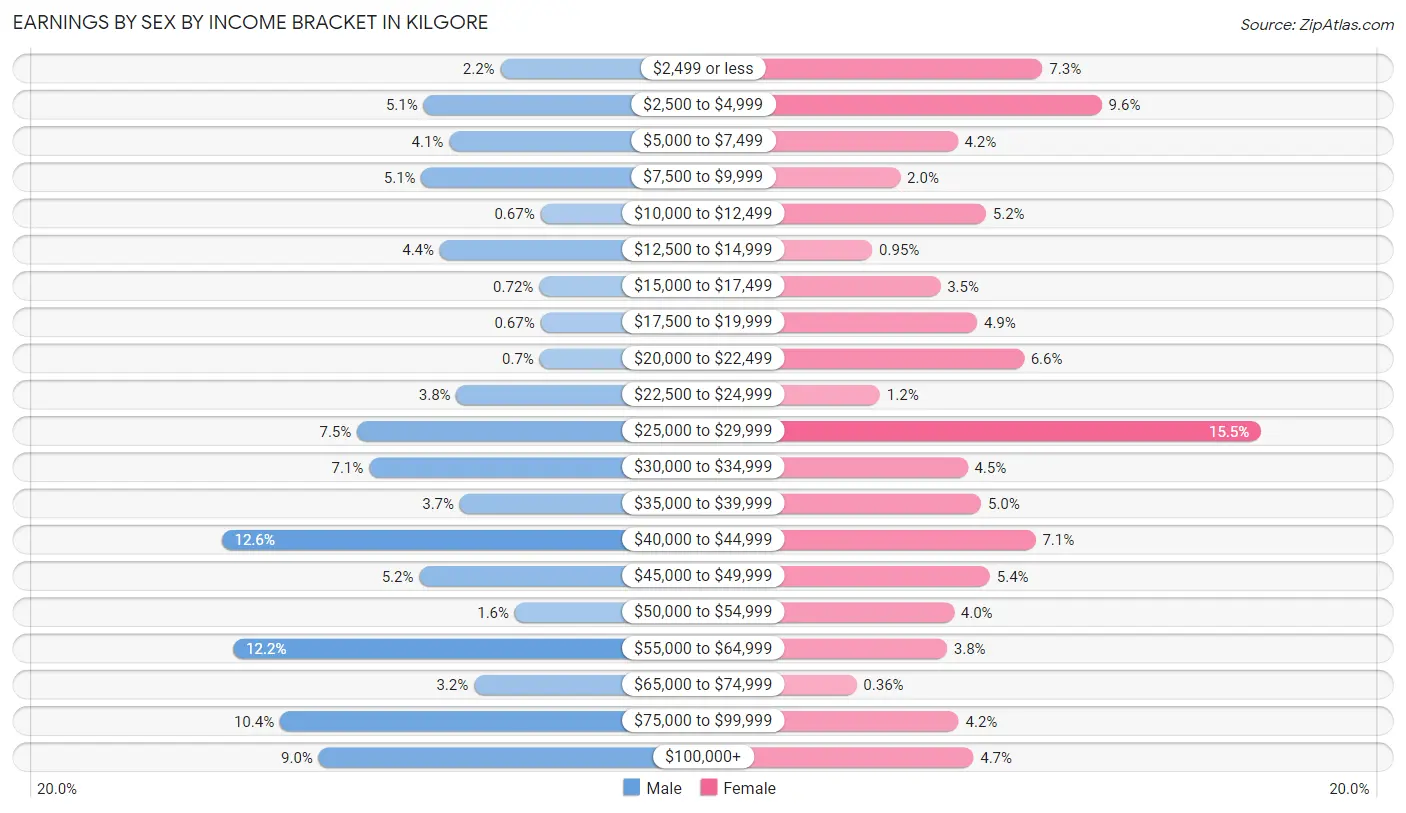
Earnings by Sex by Income Bracket in Kilgore
The most common earnings brackets in Kilgore are $40,000 to $44,999 for men (472 | 12.6%) and $25,000 to $29,999 for women (426 | 15.5%).
| Income | Male | Female |
| $2,499 or less | 81 (2.2%) | 201 (7.3%) |
| $2,500 to $4,999 | 189 (5.1%) | 262 (9.6%) |
| $5,000 to $7,499 | 153 (4.1%) | 114 (4.2%) |
| $7,500 to $9,999 | 192 (5.1%) | 55 (2.0%) |
| $10,000 to $12,499 | 25 (0.7%) | 143 (5.2%) |
| $12,500 to $14,999 | 166 (4.4%) | 26 (0.9%) |
| $15,000 to $17,499 | 27 (0.7%) | 96 (3.5%) |
| $17,500 to $19,999 | 25 (0.7%) | 134 (4.9%) |
| $20,000 to $22,499 | 26 (0.7%) | 182 (6.6%) |
| $22,500 to $24,999 | 143 (3.8%) | 34 (1.2%) |
| $25,000 to $29,999 | 282 (7.5%) | 426 (15.5%) |
| $30,000 to $34,999 | 265 (7.1%) | 124 (4.5%) |
| $35,000 to $39,999 | 138 (3.7%) | 138 (5.0%) |
| $40,000 to $44,999 | 472 (12.6%) | 194 (7.1%) |
| $45,000 to $49,999 | 195 (5.2%) | 147 (5.4%) |
| $50,000 to $54,999 | 61 (1.6%) | 110 (4.0%) |
| $55,000 to $64,999 | 456 (12.2%) | 103 (3.7%) |
| $65,000 to $74,999 | 118 (3.2%) | 10 (0.4%) |
| $75,000 to $99,999 | 390 (10.4%) | 115 (4.2%) |
| $100,000+ | 336 (9.0%) | 130 (4.7%) |
| Total | 3,740 (100.0%) | 2,744 (100.0%) |
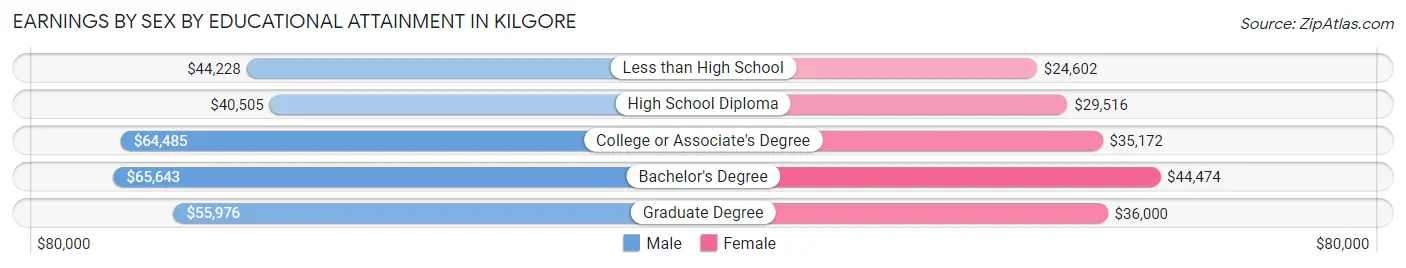
Earnings by Sex by Educational Attainment in Kilgore
Average earnings in Kilgore are $44,371 for men and $29,180 for women, a difference of 34.2%. Men with an educational attainment of bachelor's degree enjoy the highest average annual earnings of $65,643, while those with high school diploma education earn the least with $40,505. Women with an educational attainment of bachelor's degree earn the most with the average annual earnings of $44,474, while those with less than high school education have the smallest earnings of $24,602.
| Educational Attainment | Male Income | Female Income |
| Less than High School | $44,228 | $24,602 |
| High School Diploma | $40,505 | $29,516 |
| College or Associate's Degree | $64,485 | $35,172 |
| Bachelor's Degree | $65,643 | $44,474 |
| Graduate Degree | $55,976 | $36,000 |
| Total | $44,371 | $29,180 |
Family Income in Kilgore
Family Income Brackets in Kilgore
According to the Kilgore family income data, there are 668 families falling into the $50,000 to $74,999 income range, which is the most common income bracket and makes up 21.0% of all families. Conversely, the $10,000 to $14,999 income bracket is the least frequent group with only 60 families (1.9%) belonging to this category.
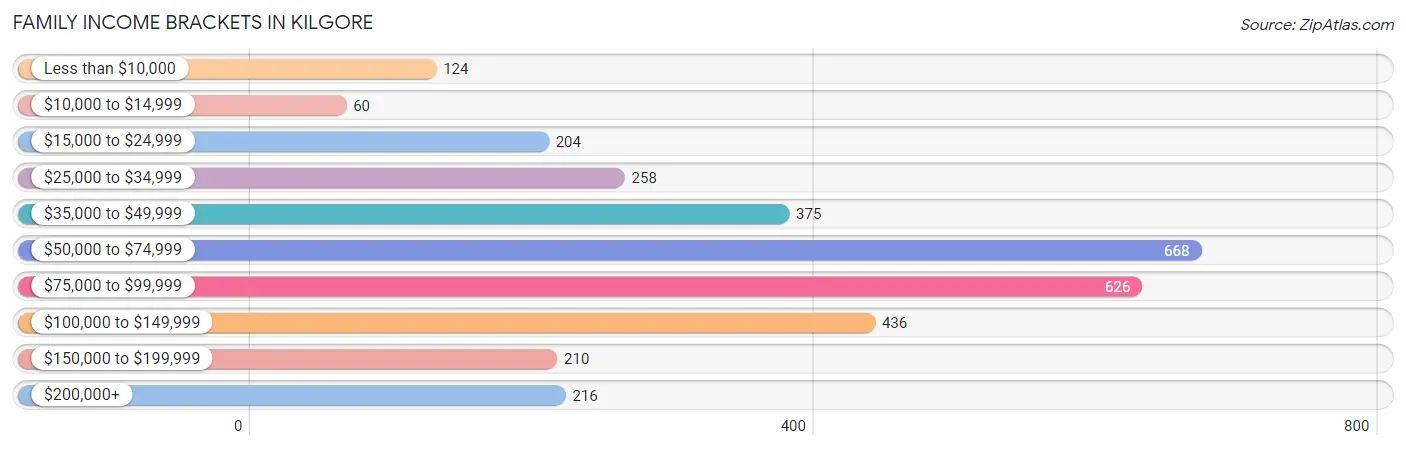
| Income Bracket | # Families | % Families |
| Less than $10,000 | 124 | 3.9% |
| $10,000 to $14,999 | 60 | 1.9% |
| $15,000 to $24,999 | 204 | 6.4% |
| $25,000 to $34,999 | 258 | 8.1% |
| $35,000 to $49,999 | 375 | 11.8% |
| $50,000 to $74,999 | 668 | 21.0% |
| $75,000 to $99,999 | 626 | 19.7% |
| $100,000 to $149,999 | 436 | 13.7% |
| $150,000 to $199,999 | 210 | 6.6% |
| $200,000+ | 216 | 6.8% |
Family Income by Famaliy Size in Kilgore
5-person families (496 | 15.6%) account for the highest median family income in Kilgore with $81,429 per family, while 2-person families (1,455 | 45.8%) have the highest median income of $30,675 per family member.
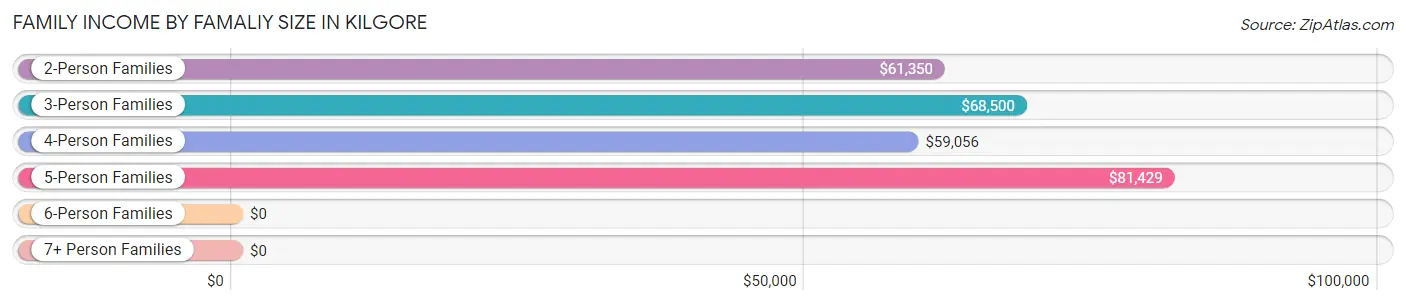
| Income Bracket | # Families | Median Income |
| 2-Person Families | 1,455 (45.8%) | $61,350 |
| 3-Person Families | 406 (12.8%) | $68,500 |
| 4-Person Families | 600 (18.9%) | $59,056 |
| 5-Person Families | 496 (15.6%) | $81,429 |
| 6-Person Families | 211 (6.6%) | $0 |
| 7+ Person Families | 12 (0.4%) | $0 |
| Total | 3,180 (100.0%) | $69,748 |
Family Income by Number of Earners in Kilgore
The median family income in Kilgore is $69,748, with families comprising 3+ earners (414) having the highest median family income of $103,542, while families with no earners (408) have the lowest median family income of $33,889, accounting for 13.0% and 12.8% of families, respectively.
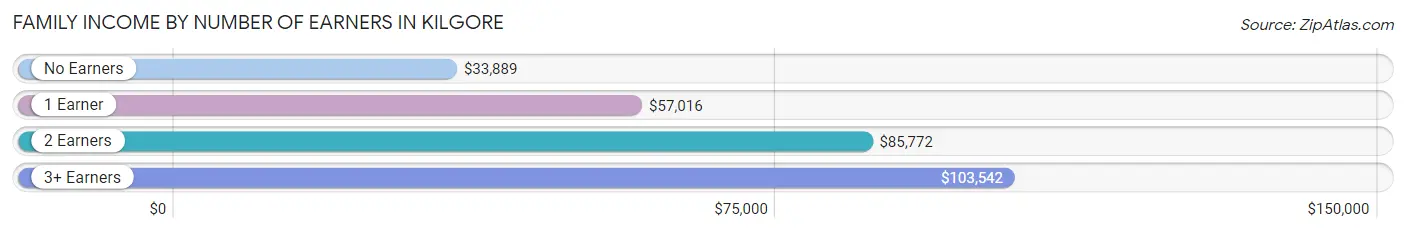
| Number of Earners | # Families | Median Income |
| No Earners | 408 (12.8%) | $33,889 |
| 1 Earner | 1,140 (35.8%) | $57,016 |
| 2 Earners | 1,218 (38.3%) | $85,772 |
| 3+ Earners | 414 (13.0%) | $103,542 |
| Total | 3,180 (100.0%) | $69,748 |
Household Income in Kilgore
Household Income Brackets in Kilgore
With 866 households falling in the category, the $50,000 to $74,999 income range is the most frequent in Kilgore, accounting for 18.8% of all households. In contrast, only 88 households (1.9%) fall into the $10,000 to $14,999 income bracket, making it the least populous group.
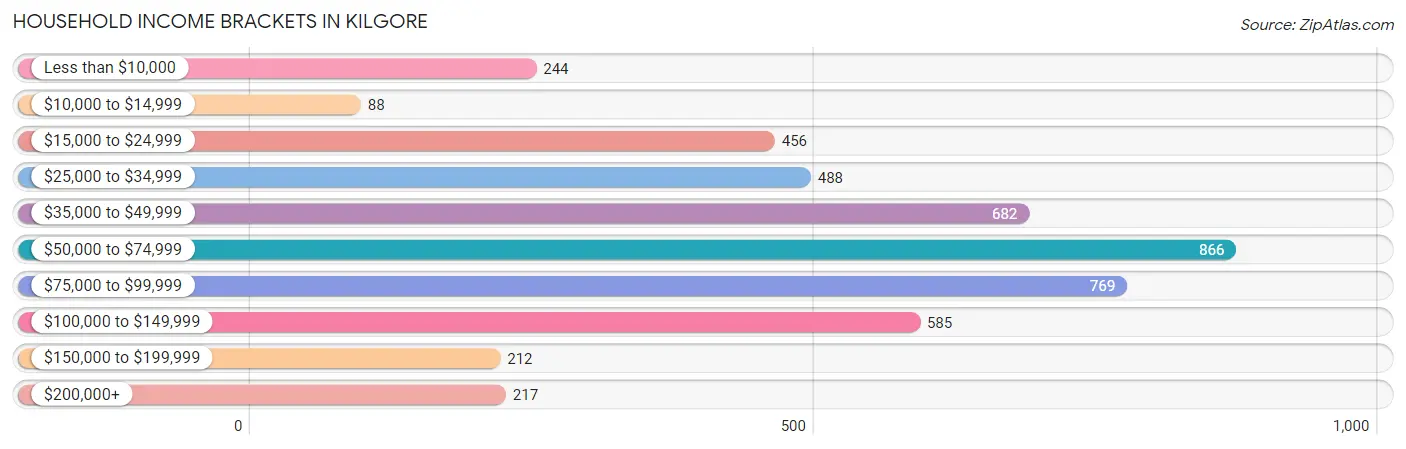
| Income Bracket | # Households | % Households |
| Less than $10,000 | 244 | 5.3% |
| $10,000 to $14,999 | 88 | 1.9% |
| $15,000 to $24,999 | 456 | 9.9% |
| $25,000 to $34,999 | 488 | 10.6% |
| $35,000 to $49,999 | 682 | 14.8% |
| $50,000 to $74,999 | 866 | 18.8% |
| $75,000 to $99,999 | 769 | 16.7% |
| $100,000 to $149,999 | 585 | 12.7% |
| $150,000 to $199,999 | 212 | 4.6% |
| $200,000+ | 217 | 4.7% |
Household Income by Householder Age in Kilgore
The median household income in Kilgore is $58,439, with the highest median household income of $75,365 found in the 25 to 44 years age bracket for the primary householder. A total of 1,687 households (36.6%) fall into this category. Meanwhile, the 15 to 24 years age bracket for the primary householder has the lowest median household income of $0, with 135 households (2.9%) in this group.
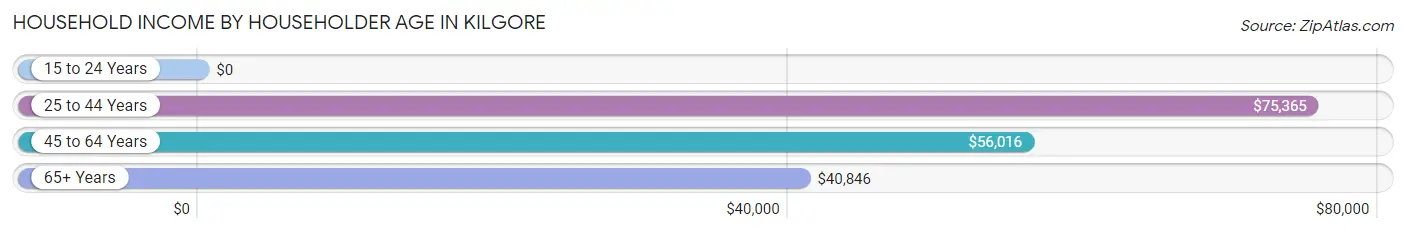
| Income Bracket | # Households | Median Income |
| 15 to 24 Years | 135 (2.9%) | $0 |
| 25 to 44 Years | 1,687 (36.6%) | $75,365 |
| 45 to 64 Years | 1,465 (31.8%) | $56,016 |
| 65+ Years | 1,320 (28.6%) | $40,846 |
| Total | 4,607 (100.0%) | $58,439 |
Poverty in Kilgore
Income Below Poverty by Sex and Age in Kilgore
With 13.4% poverty level for males and 19.5% for females among the residents of Kilgore, 16 and 17 year old males and 5 year old females are the most vulnerable to poverty, with 47 males (35.1%) and 39 females (100.0%) in their respective age groups living below the poverty level.
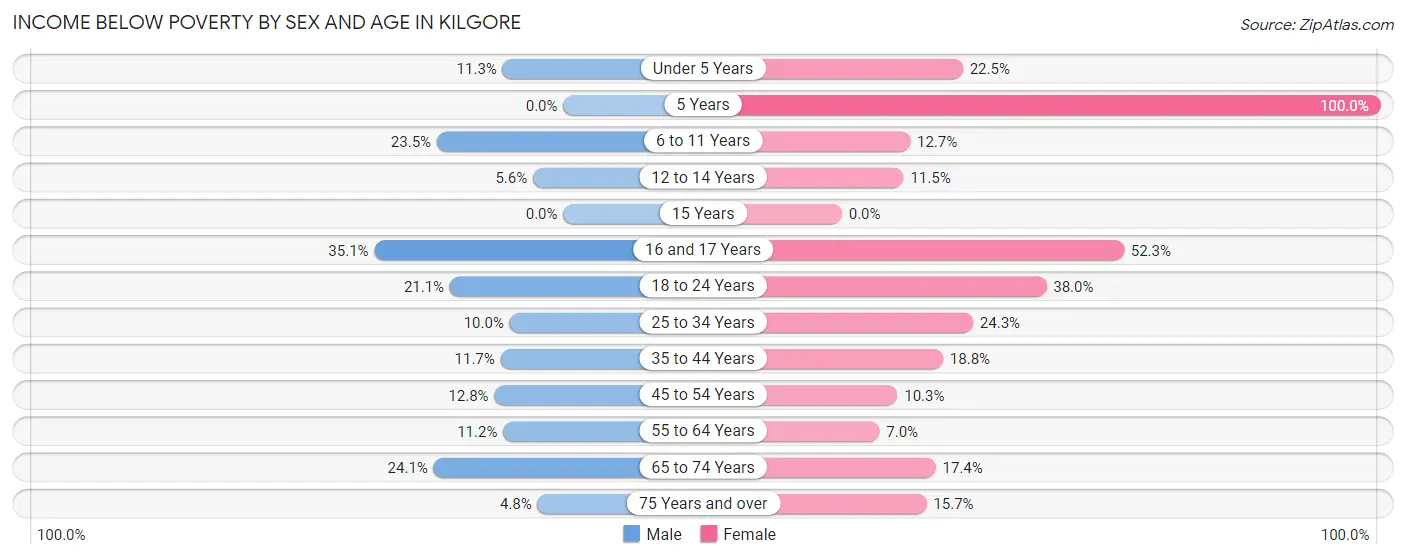
| Age Bracket | Male | Female |
| Under 5 Years | 39 (11.3%) | 123 (22.5%) |
| 5 Years | 0 (0.0%) | 39 (100.0%) |
| 6 to 11 Years | 111 (23.5%) | 79 (12.7%) |
| 12 to 14 Years | 33 (5.6%) | 38 (11.5%) |
| 15 Years | 0 (0.0%) | 0 (0.0%) |
| 16 and 17 Years | 47 (35.1%) | 123 (52.3%) |
| 18 to 24 Years | 100 (21.0%) | 211 (38.0%) |
| 25 to 34 Years | 63 (10.0%) | 156 (24.3%) |
| 35 to 44 Years | 117 (11.7%) | 189 (18.8%) |
| 45 to 54 Years | 129 (12.8%) | 46 (10.3%) |
| 55 to 64 Years | 76 (11.2%) | 53 (7.0%) |
| 65 to 74 Years | 117 (24.1%) | 86 (17.4%) |
| 75 Years and over | 12 (4.8%) | 109 (15.7%) |
| Total | 844 (13.4%) | 1,252 (19.5%) |
Income Above Poverty by Sex and Age in Kilgore
According to the poverty statistics in Kilgore, males aged 5 years and females aged 15 years are the age groups that are most secure financially, with 100.0% of males and 100.0% of females in these age groups living above the poverty line.
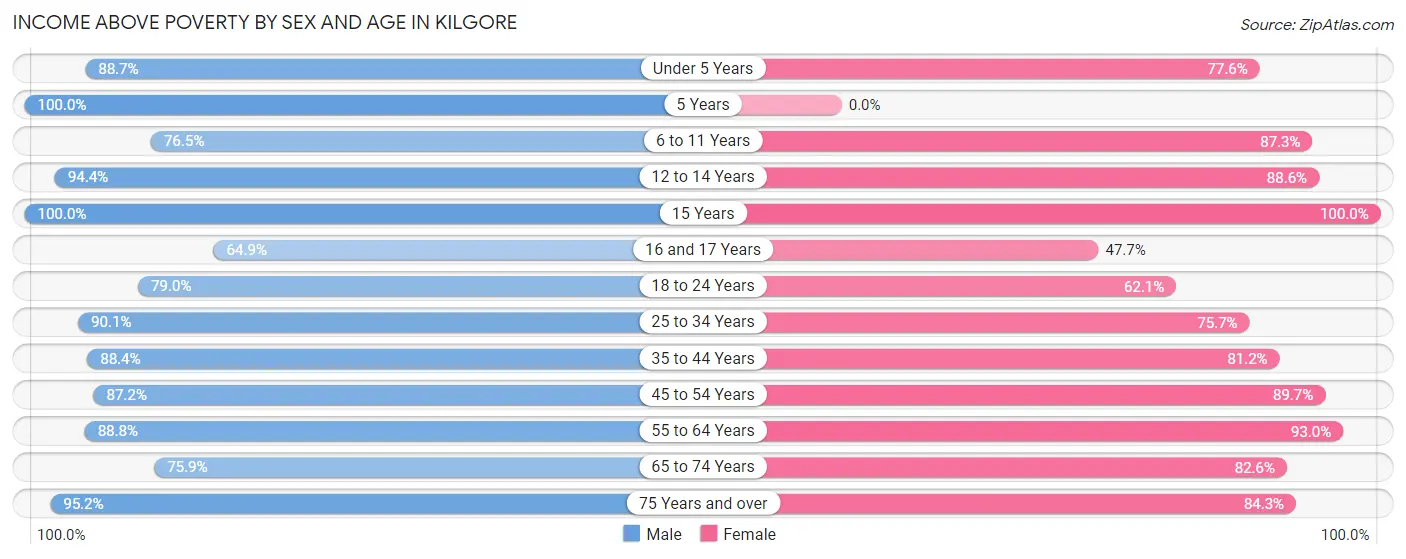
| Age Bracket | Male | Female |
| Under 5 Years | 307 (88.7%) | 425 (77.5%) |
| 5 Years | 137 (100.0%) | 0 (0.0%) |
| 6 to 11 Years | 362 (76.5%) | 545 (87.3%) |
| 12 to 14 Years | 553 (94.4%) | 294 (88.5%) |
| 15 Years | 69 (100.0%) | 61 (100.0%) |
| 16 and 17 Years | 87 (64.9%) | 112 (47.7%) |
| 18 to 24 Years | 375 (78.9%) | 345 (62.1%) |
| 25 to 34 Years | 570 (90.0%) | 485 (75.7%) |
| 35 to 44 Years | 887 (88.3%) | 818 (81.2%) |
| 45 to 54 Years | 879 (87.2%) | 400 (89.7%) |
| 55 to 64 Years | 605 (88.8%) | 707 (93.0%) |
| 65 to 74 Years | 369 (75.9%) | 408 (82.6%) |
| 75 Years and over | 239 (95.2%) | 585 (84.3%) |
| Total | 5,439 (86.6%) | 5,185 (80.5%) |
Income Below Poverty Among Married-Couple Families in Kilgore
The poverty statistics for married-couple families in Kilgore show that 11.7% or 269 of the total 2,309 families live below the poverty line. Families with 1 or 2 children have the highest poverty rate of 13.4%, comprising of 139 families. On the other hand, families with 3 or 4 children have the lowest poverty rate of 8.6%, which includes 25 families.
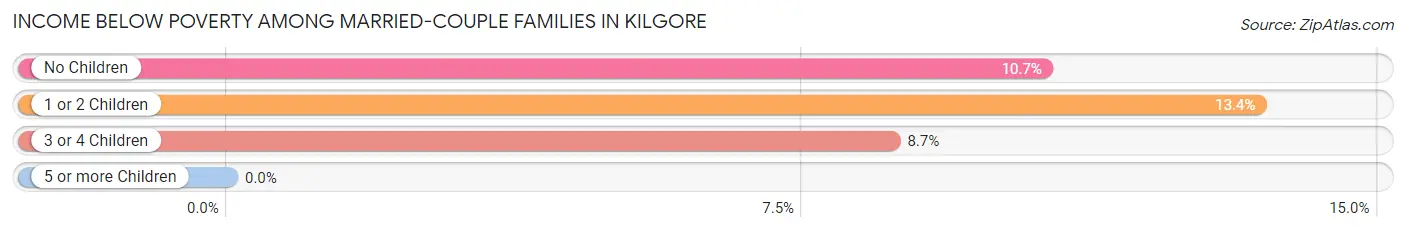
| Children | Above Poverty | Below Poverty |
| No Children | 881 (89.3%) | 105 (10.6%) |
| 1 or 2 Children | 895 (86.6%) | 139 (13.4%) |
| 3 or 4 Children | 264 (91.3%) | 25 (8.6%) |
| 5 or more Children | 0 (0.0%) | 0 (0.0%) |
| Total | 2,040 (88.3%) | 269 (11.7%) |
Income Below Poverty Among Single-Parent Households in Kilgore
According to the poverty data in Kilgore, 7.4% or 27 single-father households and 35.9% or 182 single-mother households are living below the poverty line. Among single-father households, those with no children have the highest poverty rate, with 27 households (12.1%) experiencing poverty. Likewise, among single-mother households, those with 3 or 4 children have the highest poverty rate, with 40 households (100.0%) falling below the poverty line.
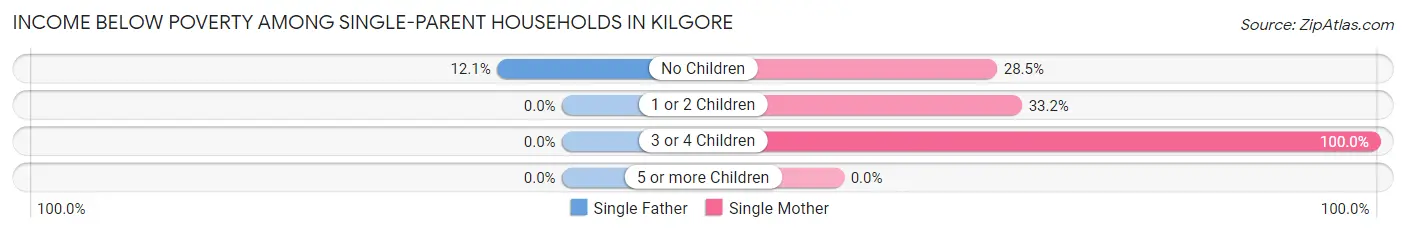
| Children | Single Father | Single Mother |
| No Children | 27 (12.1%) | 79 (28.5%) |
| 1 or 2 Children | 0 (0.0%) | 63 (33.2%) |
| 3 or 4 Children | 0 (0.0%) | 40 (100.0%) |
| 5 or more Children | 0 (0.0%) | 0 (0.0%) |
| Total | 27 (7.4%) | 182 (35.9%) |
Income Below Poverty Among Married-Couple vs Single-Parent Households in Kilgore
The poverty data for Kilgore shows that 269 of the married-couple family households (11.7%) and 209 of the single-parent households (24.0%) are living below the poverty level. Within the married-couple family households, those with 1 or 2 children have the highest poverty rate, with 139 households (13.4%) falling below the poverty line. Among the single-parent households, those with 3 or 4 children have the highest poverty rate, with 40 household (100.0%) living below poverty.
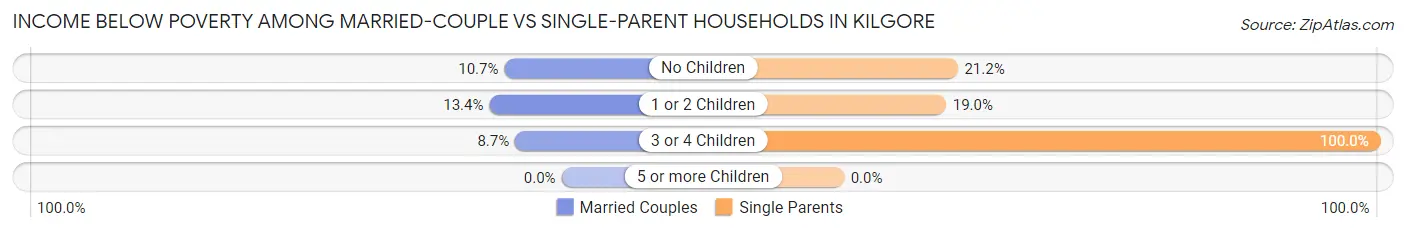
| Children | Married-Couple Families | Single-Parent Households |
| No Children | 105 (10.6%) | 106 (21.2%) |
| 1 or 2 Children | 139 (13.4%) | 63 (19.0%) |
| 3 or 4 Children | 25 (8.6%) | 40 (100.0%) |
| 5 or more Children | 0 (0.0%) | 0 (0.0%) |
| Total | 269 (11.7%) | 209 (24.0%) |
Race in Kilgore
The most populous races in Kilgore are White / Caucasian (8,508 | 63.5%), Hispanic or Latino (3,234 | 24.1%), and Two or more Races (2,507 | 18.7%).
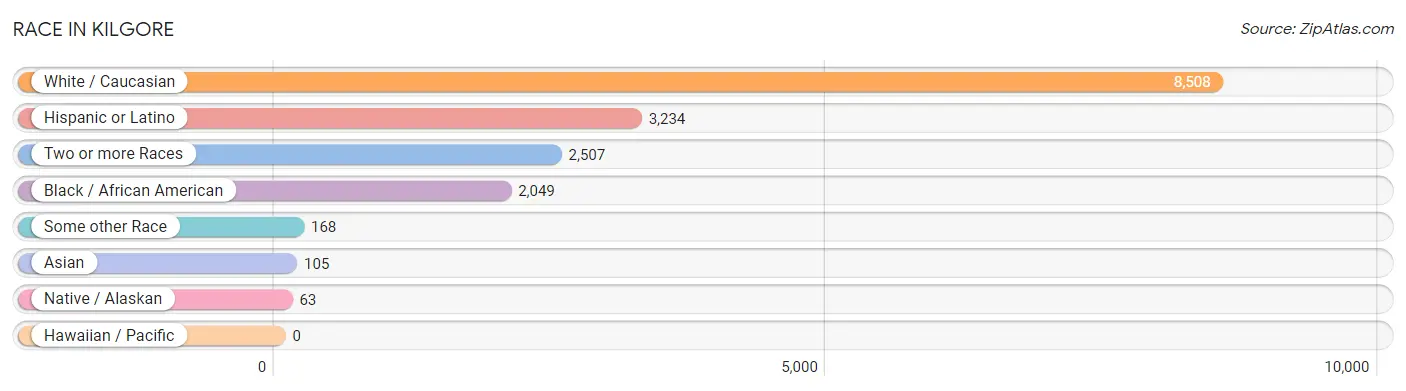
| Race | # Population | % Population |
| Asian | 105 | 0.8% |
| Black / African American | 2,049 | 15.3% |
| Hawaiian / Pacific | 0 | 0.0% |
| Hispanic or Latino | 3,234 | 24.1% |
| Native / Alaskan | 63 | 0.5% |
| White / Caucasian | 8,508 | 63.5% |
| Two or more Races | 2,507 | 18.7% |
| Some other Race | 168 | 1.3% |
| Total | 13,400 | 100.0% |
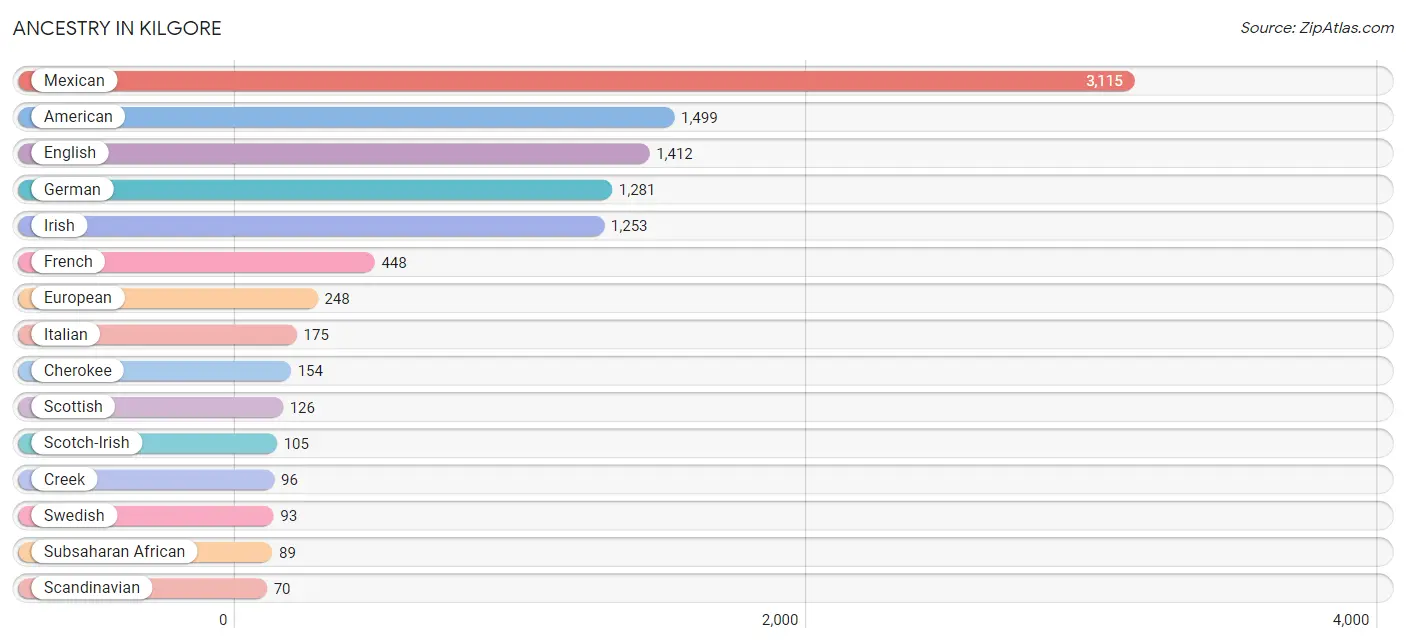
Ancestry in Kilgore
The most populous ancestries reported in Kilgore are Mexican (3,115 | 23.3%), American (1,499 | 11.2%), English (1,412 | 10.5%), German (1,281 | 9.6%), and Irish (1,253 | 9.3%), together accounting for 63.9% of all Kilgore residents.
| Ancestry | # Population | % Population |
| African | 26 | 0.2% |
| Albanian | 10 | 0.1% |
| American | 1,499 | 11.2% |
| Arab | 11 | 0.1% |
| Blackfeet | 45 | 0.3% |
| British | 4 | 0.0% |
| Burmese | 26 | 0.2% |
| Cambodian | 3 | 0.0% |
| Canadian | 7 | 0.1% |
| Central American | 56 | 0.4% |
| Cherokee | 154 | 1.1% |
| Choctaw | 13 | 0.1% |
| Creek | 96 | 0.7% |
| Czech | 3 | 0.0% |
| Danish | 12 | 0.1% |
| Dutch | 31 | 0.2% |
| Dutch West Indian | 18 | 0.1% |
| English | 1,412 | 10.5% |
| European | 248 | 1.8% |
| Filipino | 69 | 0.5% |
| French | 448 | 3.3% |
| French Canadian | 38 | 0.3% |
| German | 1,281 | 9.6% |
| Honduran | 56 | 0.4% |
| Indian (Asian) | 6 | 0.0% |
| Irish | 1,253 | 9.3% |
| Italian | 175 | 1.3% |
| Japanese | 34 | 0.3% |
| Kenyan | 63 | 0.5% |
| Korean | 5 | 0.0% |
| Latvian | 6 | 0.0% |
| Lebanese | 11 | 0.1% |
| Liberian | 4 | 0.0% |
| Mexican | 3,115 | 23.3% |
| Mexican American Indian | 14 | 0.1% |
| Northern European | 8 | 0.1% |
| Norwegian | 18 | 0.1% |
| Pakistani | 24 | 0.2% |
| Polish | 49 | 0.4% |
| Russian | 9 | 0.1% |
| Scandinavian | 70 | 0.5% |
| Scotch-Irish | 105 | 0.8% |
| Scottish | 126 | 0.9% |
| Sioux | 10 | 0.1% |
| Spaniard | 13 | 0.1% |
| Spanish | 23 | 0.2% |
| Sri Lankan | 20 | 0.2% |
| Subsaharan African | 89 | 0.7% |
| Swedish | 93 | 0.7% |
| Swiss | 7 | 0.1% |
| Welsh | 22 | 0.2% | View All 51 Rows |
Immigrants in Kilgore
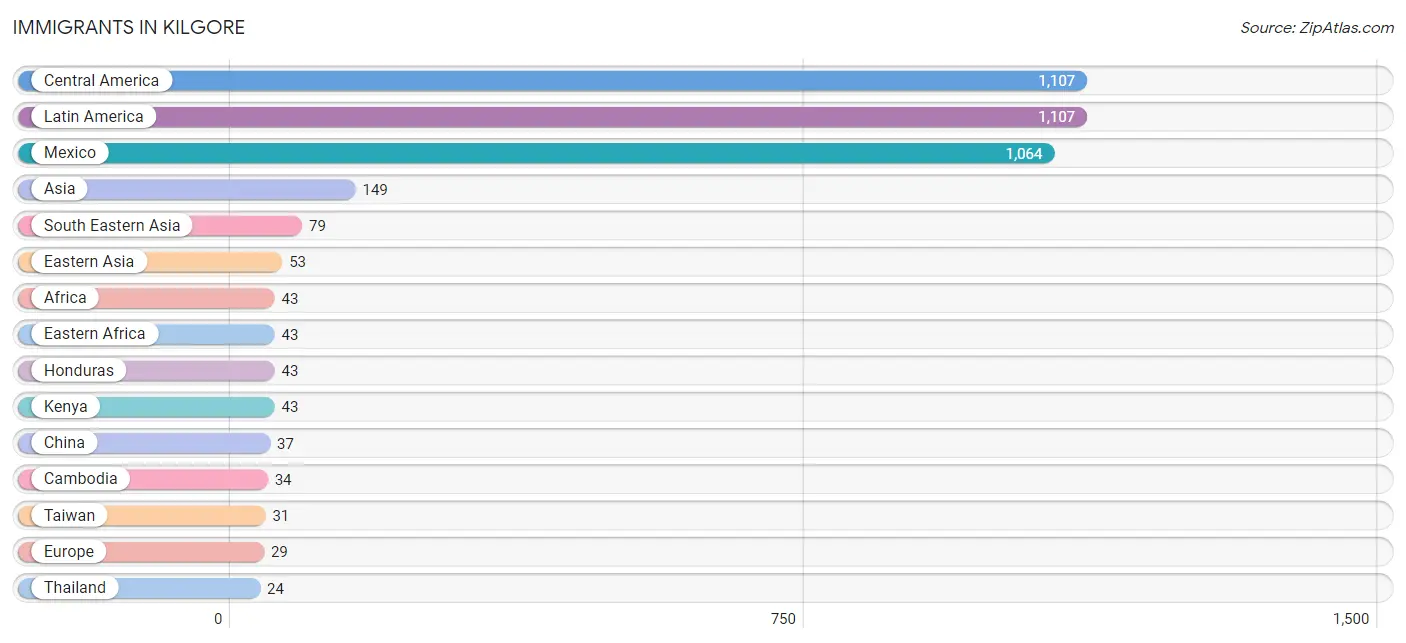
The most numerous immigrant groups reported in Kilgore came from Central America (1,107 | 8.3%), Latin America (1,107 | 8.3%), Mexico (1,064 | 7.9%), Asia (149 | 1.1%), and South Eastern Asia (79 | 0.6%), together accounting for 26.2% of all Kilgore residents.
| Immigration Origin | # Population | % Population |
| Africa | 43 | 0.3% |
| Albania | 10 | 0.1% |
| Asia | 149 | 1.1% |
| Cambodia | 34 | 0.3% |
| Central America | 1,107 | 8.3% |
| China | 37 | 0.3% |
| Eastern Africa | 43 | 0.3% |
| Eastern Asia | 53 | 0.4% |
| Eastern Europe | 16 | 0.1% |
| Europe | 29 | 0.2% |
| Honduras | 43 | 0.3% |
| Italy | 13 | 0.1% |
| Kenya | 43 | 0.3% |
| Korea | 13 | 0.1% |
| Latin America | 1,107 | 8.3% |
| Latvia | 6 | 0.0% |
| Mexico | 1,064 | 7.9% |
| Philippines | 1 | 0.0% |
| South Central Asia | 17 | 0.1% |
| South Eastern Asia | 79 | 0.6% |
| Southern Europe | 13 | 0.1% |
| Sri Lanka | 17 | 0.1% |
| Taiwan | 31 | 0.2% |
| Thailand | 24 | 0.2% |
| Vietnam | 20 | 0.2% | View All 25 Rows |
Sex and Age in Kilgore
Sex and Age in Kilgore
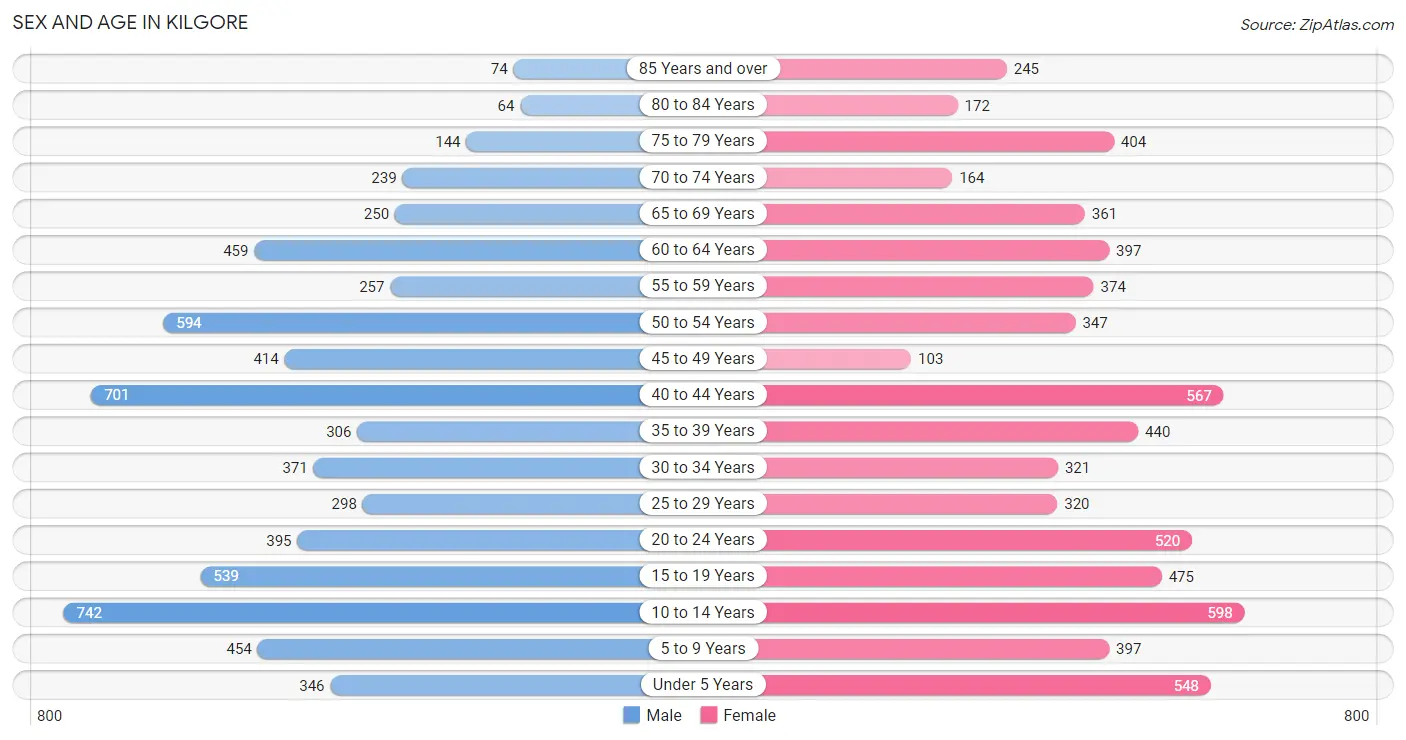
The most populous age groups in Kilgore are 10 to 14 Years (742 | 11.2%) for men and 10 to 14 Years (598 | 8.9%) for women.
| Age Bracket | Male | Female |
| Under 5 Years | 346 (5.2%) | 548 (8.1%) |
| 5 to 9 Years | 454 (6.8%) | 397 (5.9%) |
| 10 to 14 Years | 742 (11.2%) | 598 (8.9%) |
| 15 to 19 Years | 539 (8.1%) | 475 (7.0%) |
| 20 to 24 Years | 395 (5.9%) | 520 (7.7%) |
| 25 to 29 Years | 298 (4.5%) | 320 (4.7%) |
| 30 to 34 Years | 371 (5.6%) | 321 (4.8%) |
| 35 to 39 Years | 306 (4.6%) | 440 (6.5%) |
| 40 to 44 Years | 701 (10.5%) | 567 (8.4%) |
| 45 to 49 Years | 414 (6.2%) | 103 (1.5%) |
| 50 to 54 Years | 594 (8.9%) | 347 (5.1%) |
| 55 to 59 Years | 257 (3.9%) | 374 (5.5%) |
| 60 to 64 Years | 459 (6.9%) | 397 (5.9%) |
| 65 to 69 Years | 250 (3.8%) | 361 (5.3%) |
| 70 to 74 Years | 239 (3.6%) | 164 (2.4%) |
| 75 to 79 Years | 144 (2.2%) | 404 (6.0%) |
| 80 to 84 Years | 64 (1.0%) | 172 (2.5%) |
| 85 Years and over | 74 (1.1%) | 245 (3.6%) |
| Total | 6,647 (100.0%) | 6,753 (100.0%) |
Families and Households in Kilgore
Median Family Size in Kilgore
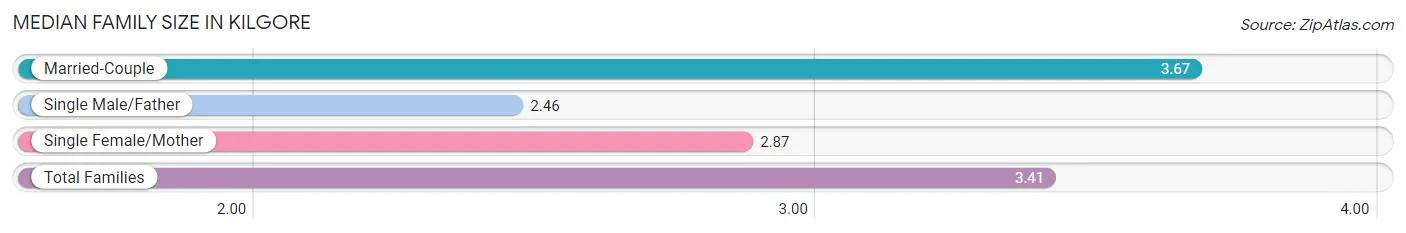
The median family size in Kilgore is 3.41 persons per family, with married-couple families (2,309 | 72.6%) accounting for the largest median family size of 3.67 persons per family. On the other hand, single male/father families (364 | 11.5%) represent the smallest median family size with 2.46 persons per family.
| Family Type | # Families | Family Size |
| Married-Couple | 2,309 (72.6%) | 3.67 |
| Single Male/Father | 364 (11.5%) | 2.46 |
| Single Female/Mother | 507 (15.9%) | 2.87 |
| Total Families | 3,180 (100.0%) | 3.41 |
Median Household Size in Kilgore
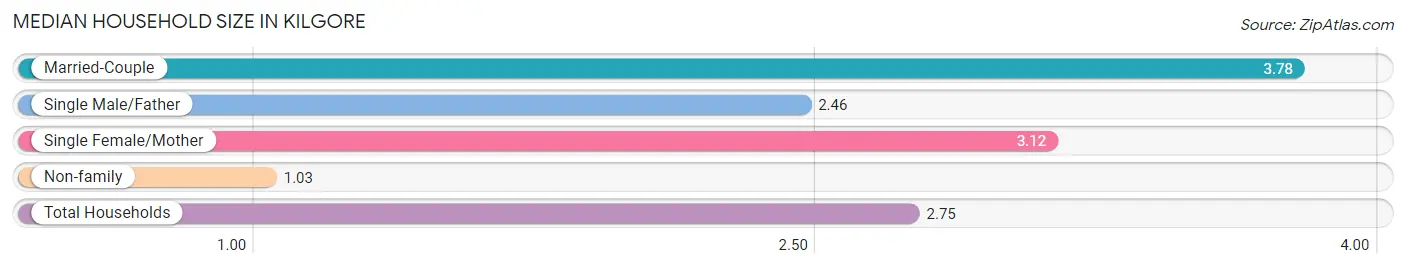
The median household size in Kilgore is 2.75 persons per household, with married-couple households (2,309 | 50.1%) accounting for the largest median household size of 3.78 persons per household. non-family households (1,427 | 31.0%) represent the smallest median household size with 1.03 persons per household.
| Household Type | # Households | Household Size |
| Married-Couple | 2,309 (50.1%) | 3.78 |
| Single Male/Father | 364 (7.9%) | 2.46 |
| Single Female/Mother | 507 (11.0%) | 3.12 |
| Non-family | 1,427 (31.0%) | 1.03 |
| Total Households | 4,607 (100.0%) | 2.75 |
Household Size by Marriage Status in Kilgore
Out of a total of 4,607 households in Kilgore, 3,180 (69.0%) are family households, while 1,427 (31.0%) are nonfamily households. The most numerous type of family households are 2-person households, comprising 1,385, and the most common type of nonfamily households are 1-person households, comprising 1,410.
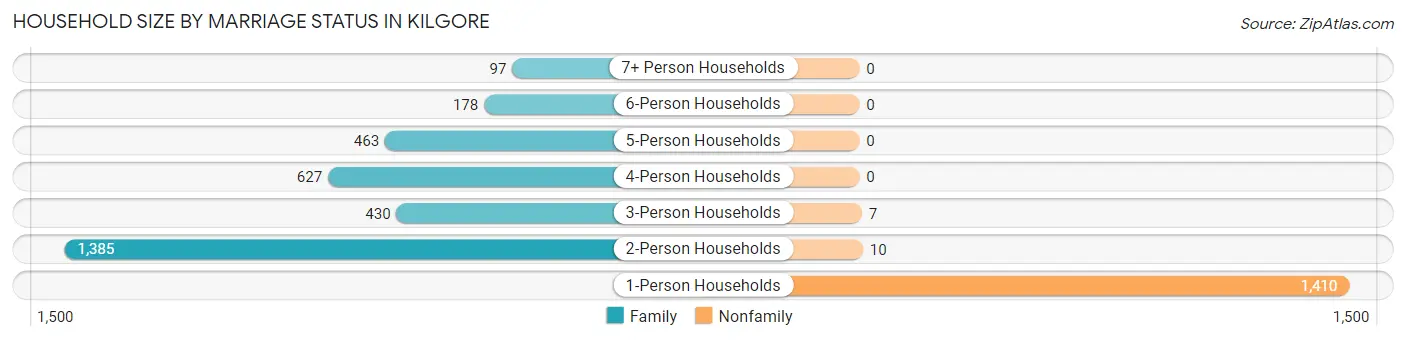
| Household Size | Family Households | Nonfamily Households |
| 1-Person Households | - | 1,410 (30.6%) |
| 2-Person Households | 1,385 (30.1%) | 10 (0.2%) |
| 3-Person Households | 430 (9.3%) | 7 (0.2%) |
| 4-Person Households | 627 (13.6%) | 0 (0.0%) |
| 5-Person Households | 463 (10.1%) | 0 (0.0%) |
| 6-Person Households | 178 (3.9%) | 0 (0.0%) |
| 7+ Person Households | 97 (2.1%) | 0 (0.0%) |
| Total | 3,180 (69.0%) | 1,427 (31.0%) |
Female Fertility in Kilgore
Fertility by Age in Kilgore
Average fertility rate in Kilgore is 66.0 births per 1,000 women. Women in the age bracket of 20 to 34 years have the highest fertility rate with 158.0 births per 1,000 women. Women in the age bracket of 20 to 34 years acount for 95.8% of all women with births.
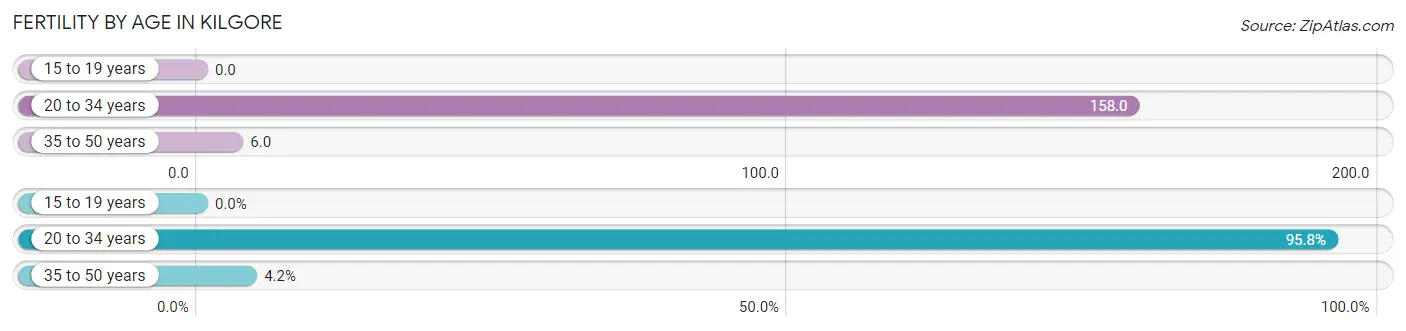
| Age Bracket | Women with Births | Births / 1,000 Women |
| 15 to 19 years | 0 (0.0%) | 0.0 |
| 20 to 34 years | 184 (95.8%) | 158.0 |
| 35 to 50 years | 8 (4.2%) | 6.0 |
| Total | 192 (100.0%) | 66.0 |
Fertility by Age by Marriage Status in Kilgore
26.6% of women with births (192) in Kilgore are married. The highest percentage of unmarried women with births falls into 35 to 50 years age bracket with 100.0% of them unmarried at the time of birth, while the lowest percentage of unmarried women with births belong to 20 to 34 years age bracket with 72.3% of them unmarried.
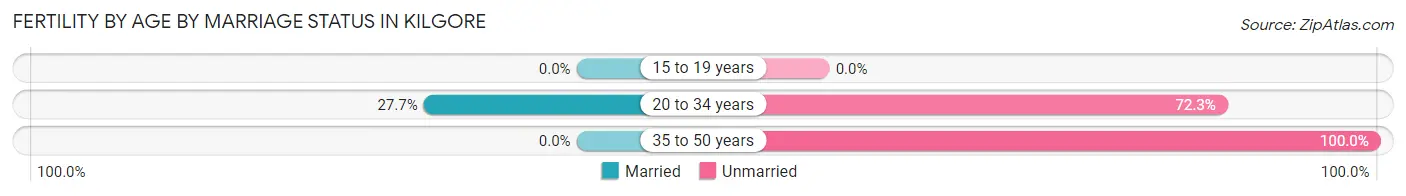
| Age Bracket | Married | Unmarried |
| 15 to 19 years | 0 (0.0%) | 0 (0.0%) |
| 20 to 34 years | 51 (27.7%) | 133 (72.3%) |
| 35 to 50 years | 0 (0.0%) | 8 (100.0%) |
| Total | 51 (26.6%) | 141 (73.4%) |
Fertility by Education in Kilgore
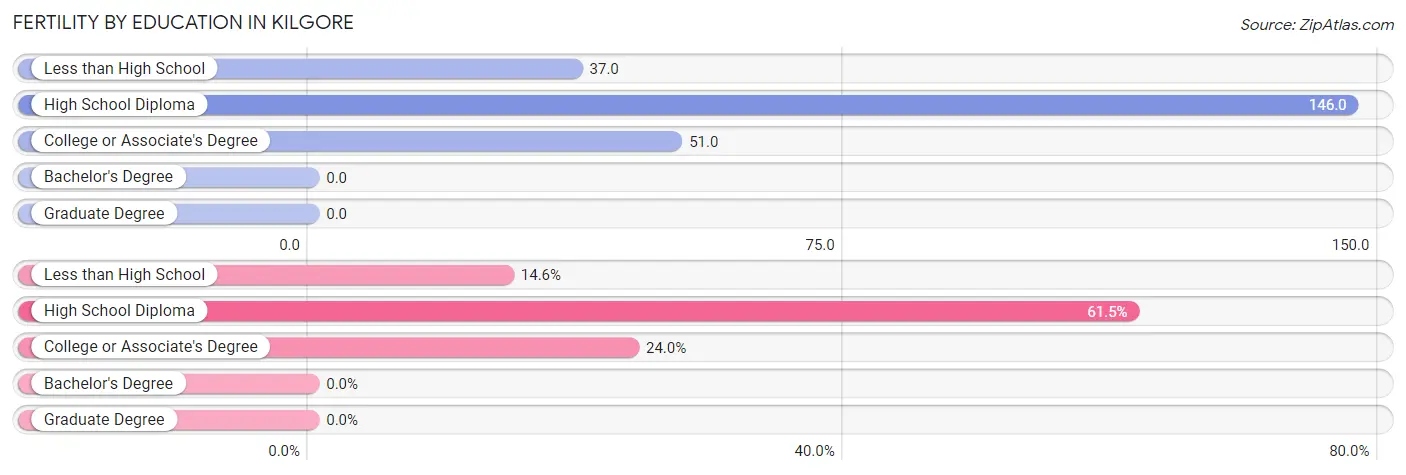
| Educational Attainment | Women with Births | Births / 1,000 Women |
| Less than High School | 28 (14.6%) | 37.0 |
| High School Diploma | 118 (61.5%) | 146.0 |
| College or Associate's Degree | 46 (24.0%) | 51.0 |
| Bachelor's Degree | 0 (0.0%) | 0.0 |
| Graduate Degree | 0 (0.0%) | 0.0 |
| Total | 192 (100.0%) | 66.0 |
Fertility by Education by Marriage Status in Kilgore
73.4% of women with births in Kilgore are unmarried. Women with the educational attainment of high school diploma are most likely to be married with 43.2% of them married at childbirth, while women with the educational attainment of less than high school are least likely to be married with 100.0% of them unmarried at childbirth.
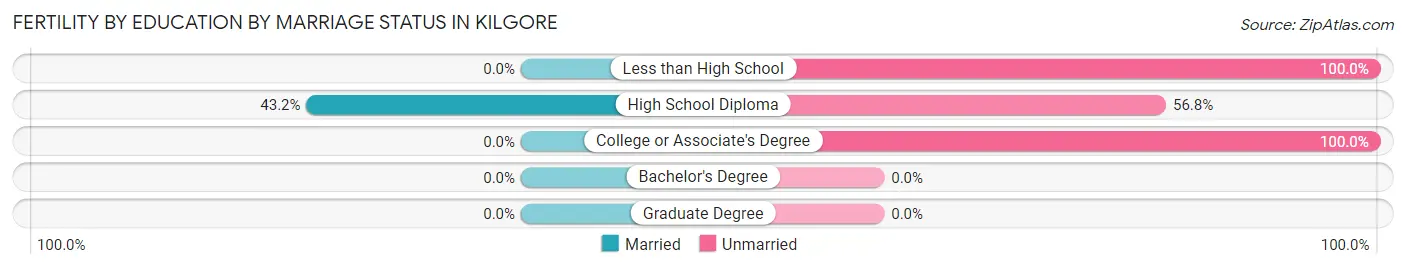
| Educational Attainment | Married | Unmarried |
| Less than High School | 0 (0.0%) | 28 (100.0%) |
| High School Diploma | 51 (43.2%) | 67 (56.8%) |
| College or Associate's Degree | 0 (0.0%) | 46 (100.0%) |
| Bachelor's Degree | 0 (0.0%) | 0 (0.0%) |
| Graduate Degree | 0 (0.0%) | 0 (0.0%) |
| Total | 51 (26.6%) | 141 (73.4%) |
Employment Characteristics in Kilgore
Employment by Class of Employer in Kilgore
Among the 5,908 employed individuals in Kilgore, private company employees (3,873 | 65.6%), self-employed (not incorporated) (643 | 10.9%), and not-for-profit organizations (382 | 6.5%) make up the most common classes of employment.
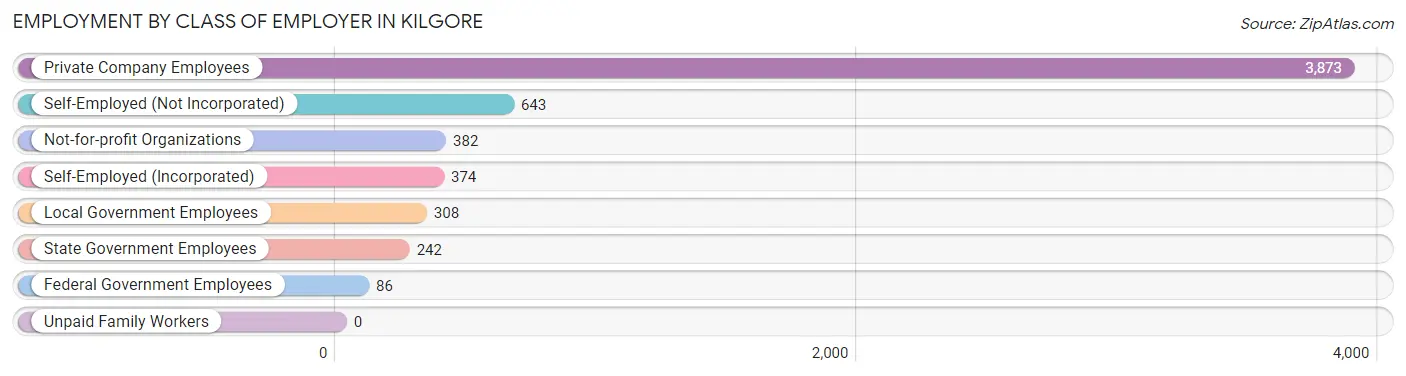
| Employer Class | # Employees | % Employees |
| Private Company Employees | 3,873 | 65.6% |
| Self-Employed (Incorporated) | 374 | 6.3% |
| Self-Employed (Not Incorporated) | 643 | 10.9% |
| Not-for-profit Organizations | 382 | 6.5% |
| Local Government Employees | 308 | 5.2% |
| State Government Employees | 242 | 4.1% |
| Federal Government Employees | 86 | 1.5% |
| Unpaid Family Workers | 0 | 0.0% |
| Total | 5,908 | 100.0% |
Employment Status by Age in Kilgore
According to the labor force statistics for Kilgore, out of the total population over 16 years of age (10,185), 61.3% or 6,243 individuals are in the labor force, with 4.8% or 300 of them unemployed. The age group with the highest labor force participation rate is 25 to 29 years, with 81.9% or 506 individuals in the labor force. Within the labor force, the 16 to 19 years age range has the highest percentage of unemployed individuals, with 13.5% or 59 of them being unemployed.
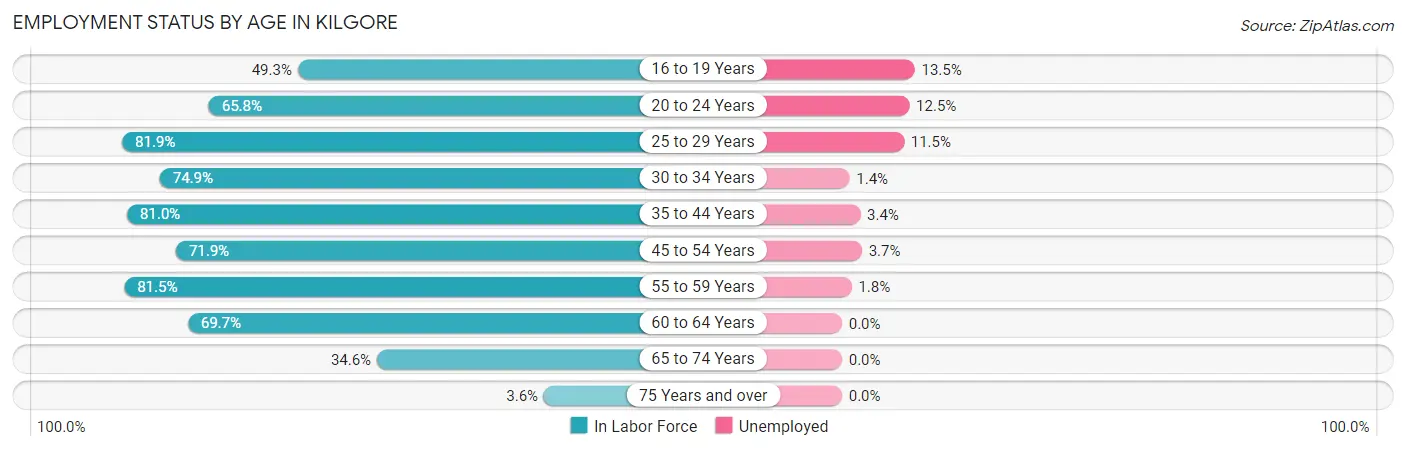
| Age Bracket | In Labor Force | Unemployed |
| 16 to 19 Years | 436 (49.3%) | 59 (13.5%) |
| 20 to 24 Years | 602 (65.8%) | 75 (12.5%) |
| 25 to 29 Years | 506 (81.9%) | 58 (11.5%) |
| 30 to 34 Years | 518 (74.9%) | 7 (1.4%) |
| 35 to 44 Years | 1,631 (81.0%) | 55 (3.4%) |
| 45 to 54 Years | 1,048 (71.9%) | 39 (3.7%) |
| 55 to 59 Years | 514 (81.5%) | 9 (1.8%) |
| 60 to 64 Years | 597 (69.7%) | 0 (0.0%) |
| 65 to 74 Years | 351 (34.6%) | 0 (0.0%) |
| 75 Years and over | 40 (3.6%) | 0 (0.0%) |
| Total | 6,243 (61.3%) | 300 (4.8%) |
Employment Status by Educational Attainment in Kilgore
According to labor force statistics for Kilgore, 76.8% of individuals (4,815) out of the total population between 25 and 64 years of age (6,269) are in the labor force, with 3.4% or 164 of them being unemployed. The group with the highest labor force participation rate are those with the educational attainment of college / associate degree, with 82.9% or 1,416 individuals in the labor force. Within the labor force, individuals with high school diploma education have the highest percentage of unemployment, with 7.9% or 124 of them being unemployed.
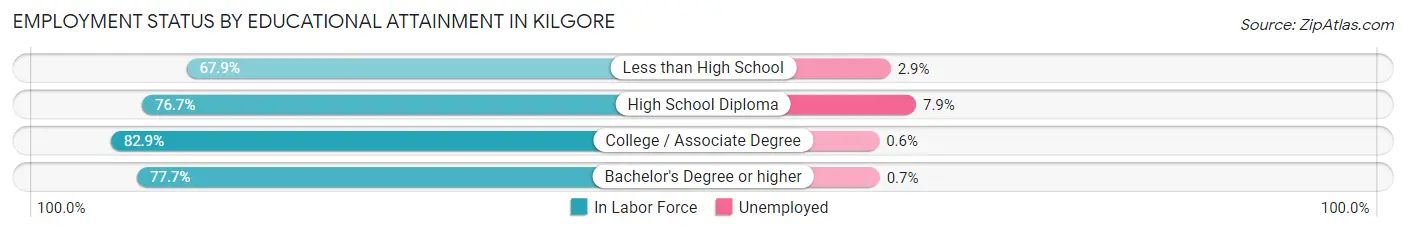
| Educational Attainment | In Labor Force | Unemployed |
| Less than High School | 870 (67.9%) | 37 (2.9%) |
| High School Diploma | 1,575 (76.7%) | 162 (7.9%) |
| College / Associate Degree | 1,416 (82.9%) | 10 (0.6%) |
| Bachelor's Degree or higher | 952 (77.7%) | 9 (0.7%) |
| Total | 4,815 (76.8%) | 213 (3.4%) |
Employment Occupations by Sex in Kilgore
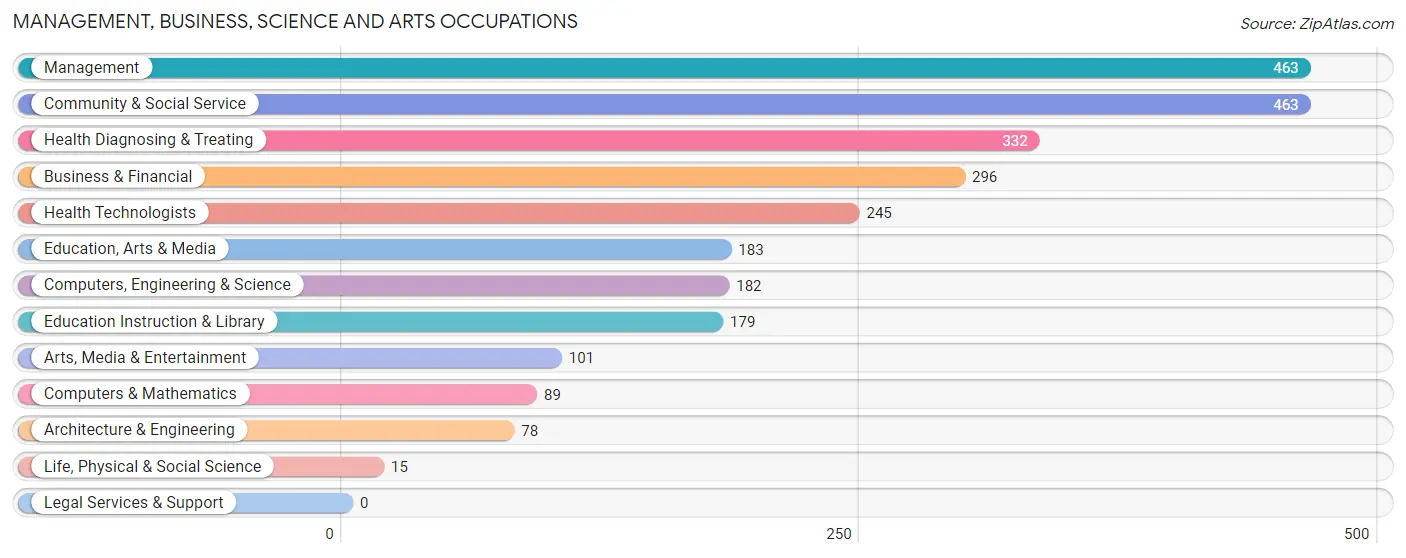
Management, Business, Science and Arts Occupations
The most common Management, Business, Science and Arts occupations in Kilgore are Management (463 | 7.9%), Community & Social Service (463 | 7.9%), Health Diagnosing & Treating (332 | 5.7%), Business & Financial (296 | 5.1%), and Health Technologists (245 | 4.2%).
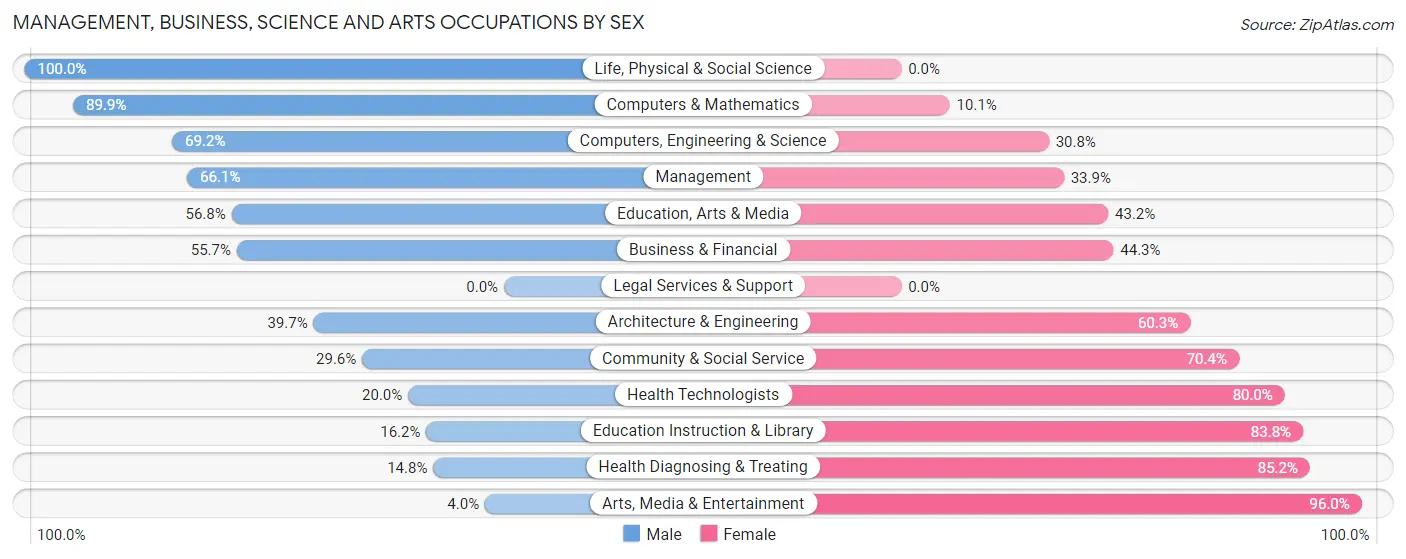
Management, Business, Science and Arts Occupations by Sex
Within the Management, Business, Science and Arts occupations in Kilgore, the most male-oriented occupations are Life, Physical & Social Science (100.0%), Computers & Mathematics (89.9%), and Computers, Engineering & Science (69.2%), while the most female-oriented occupations are Arts, Media & Entertainment (96.0%), Health Diagnosing & Treating (85.2%), and Education Instruction & Library (83.8%).
| Occupation | Male | Female |
| Management | 306 (66.1%) | 157 (33.9%) |
| Business & Financial | 165 (55.7%) | 131 (44.3%) |
| Computers, Engineering & Science | 126 (69.2%) | 56 (30.8%) |
| Computers & Mathematics | 80 (89.9%) | 9 (10.1%) |
| Architecture & Engineering | 31 (39.7%) | 47 (60.3%) |
| Life, Physical & Social Science | 15 (100.0%) | 0 (0.0%) |
| Community & Social Service | 137 (29.6%) | 326 (70.4%) |
| Education, Arts & Media | 104 (56.8%) | 79 (43.2%) |
| Legal Services & Support | 0 (0.0%) | 0 (0.0%) |
| Education Instruction & Library | 29 (16.2%) | 150 (83.8%) |
| Arts, Media & Entertainment | 4 (4.0%) | 97 (96.0%) |
| Health Diagnosing & Treating | 49 (14.8%) | 283 (85.2%) |
| Health Technologists | 49 (20.0%) | 196 (80.0%) |
| Total (Category) | 783 (45.1%) | 953 (54.9%) |
| Total (Overall) | 3,305 (56.4%) | 2,556 (43.6%) |
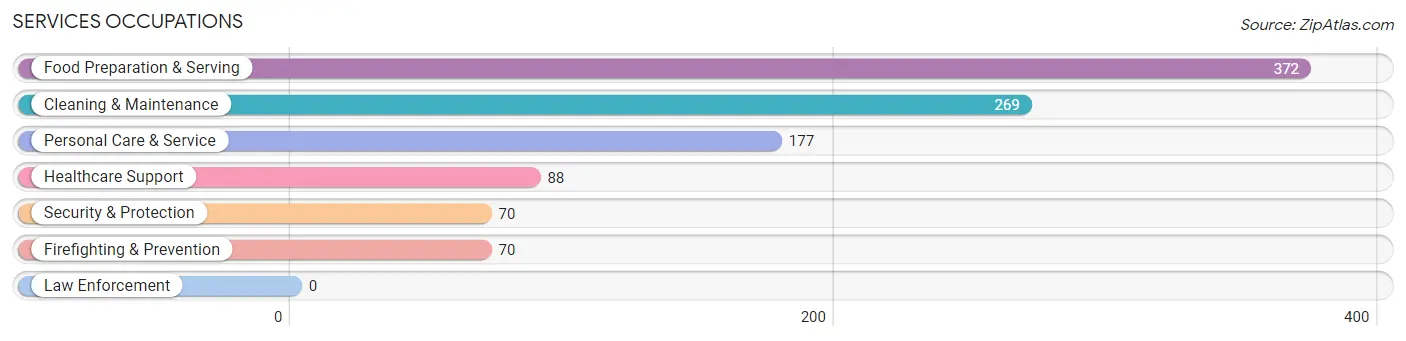
Services Occupations
The most common Services occupations in Kilgore are Food Preparation & Serving (372 | 6.4%), Cleaning & Maintenance (269 | 4.6%), Personal Care & Service (177 | 3.0%), Healthcare Support (88 | 1.5%), and Security & Protection (70 | 1.2%).
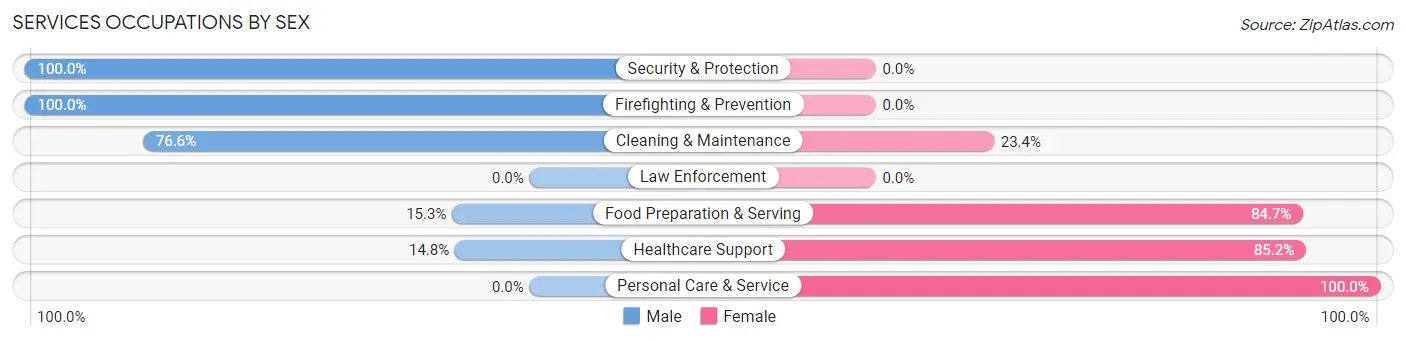
Services Occupations by Sex
Within the Services occupations in Kilgore, the most male-oriented occupations are Security & Protection (100.0%), Firefighting & Prevention (100.0%), and Cleaning & Maintenance (76.6%), while the most female-oriented occupations are Personal Care & Service (100.0%), Healthcare Support (85.2%), and Food Preparation & Serving (84.7%).
| Occupation | Male | Female |
| Healthcare Support | 13 (14.8%) | 75 (85.2%) |
| Security & Protection | 70 (100.0%) | 0 (0.0%) |
| Firefighting & Prevention | 70 (100.0%) | 0 (0.0%) |
| Law Enforcement | 0 (0.0%) | 0 (0.0%) |
| Food Preparation & Serving | 57 (15.3%) | 315 (84.7%) |
| Cleaning & Maintenance | 206 (76.6%) | 63 (23.4%) |
| Personal Care & Service | 0 (0.0%) | 177 (100.0%) |
| Total (Category) | 346 (35.4%) | 630 (64.5%) |
| Total (Overall) | 3,305 (56.4%) | 2,556 (43.6%) |
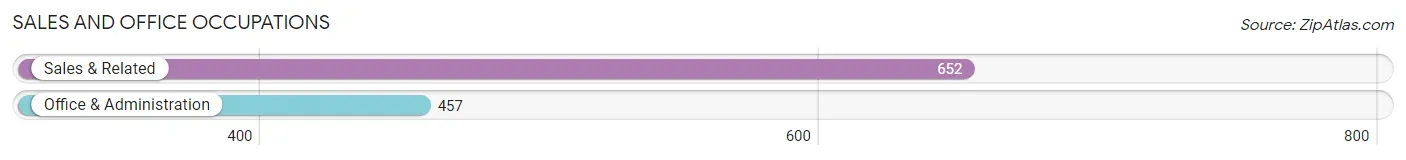
Sales and Office Occupations
The most common Sales and Office occupations in Kilgore are Sales & Related (652 | 11.1%), and Office & Administration (457 | 7.8%).
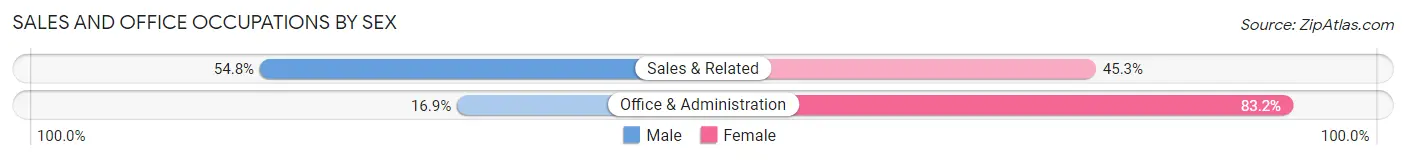
Sales and Office Occupations by Sex
| Occupation | Male | Female |
| Sales & Related | 357 (54.7%) | 295 (45.3%) |
| Office & Administration | 77 (16.9%) | 380 (83.2%) |
| Total (Category) | 434 (39.1%) | 675 (60.9%) |
| Total (Overall) | 3,305 (56.4%) | 2,556 (43.6%) |
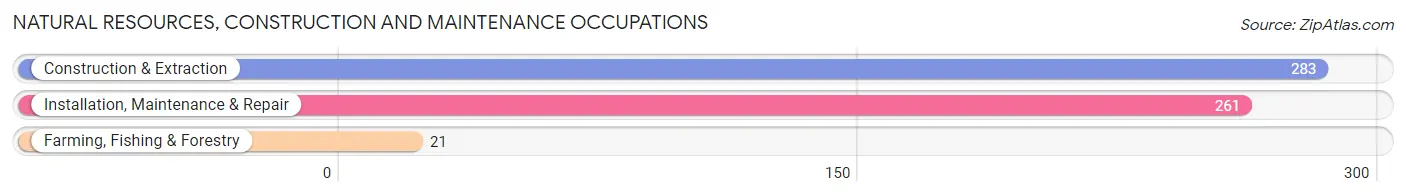
Natural Resources, Construction and Maintenance Occupations
The most common Natural Resources, Construction and Maintenance occupations in Kilgore are Construction & Extraction (283 | 4.8%), Installation, Maintenance & Repair (261 | 4.4%), and Farming, Fishing & Forestry (21 | 0.4%).
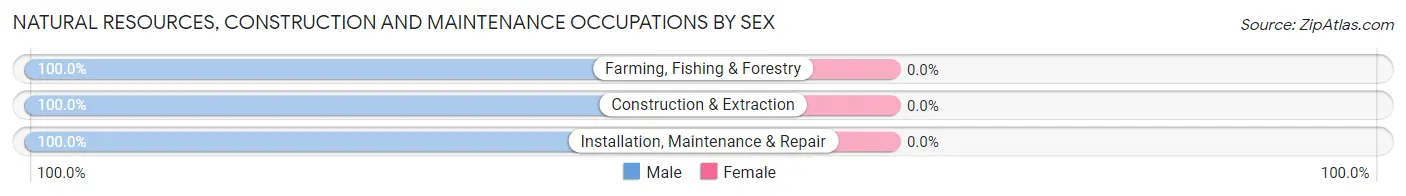
Natural Resources, Construction and Maintenance Occupations by Sex
| Occupation | Male | Female |
| Farming, Fishing & Forestry | 21 (100.0%) | 0 (0.0%) |
| Construction & Extraction | 283 (100.0%) | 0 (0.0%) |
| Installation, Maintenance & Repair | 261 (100.0%) | 0 (0.0%) |
| Total (Category) | 565 (100.0%) | 0 (0.0%) |
| Total (Overall) | 3,305 (56.4%) | 2,556 (43.6%) |
Production, Transportation and Moving Occupations
The most common Production, Transportation and Moving occupations in Kilgore are Production (642 | 11.0%), Material Moving (536 | 9.1%), and Transportation (297 | 5.1%).
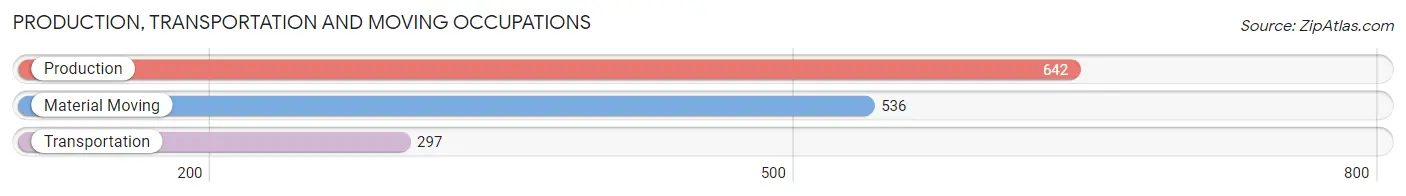
Production, Transportation and Moving Occupations by Sex
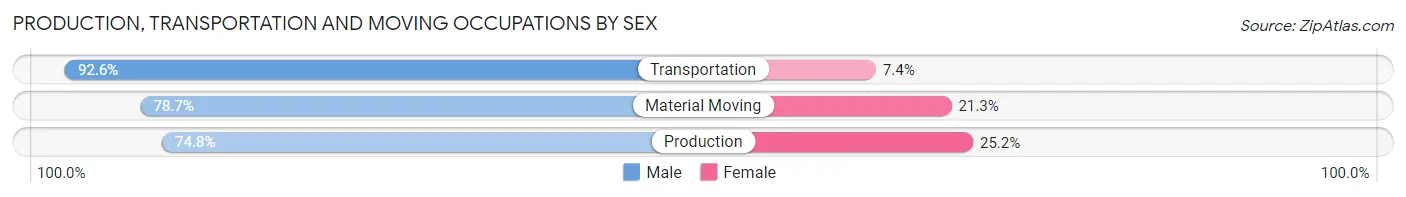
| Occupation | Male | Female |
| Production | 480 (74.8%) | 162 (25.2%) |
| Transportation | 275 (92.6%) | 22 (7.4%) |
| Material Moving | 422 (78.7%) | 114 (21.3%) |
| Total (Category) | 1,177 (79.8%) | 298 (20.2%) |
| Total (Overall) | 3,305 (56.4%) | 2,556 (43.6%) |
Employment Industries by Sex in Kilgore
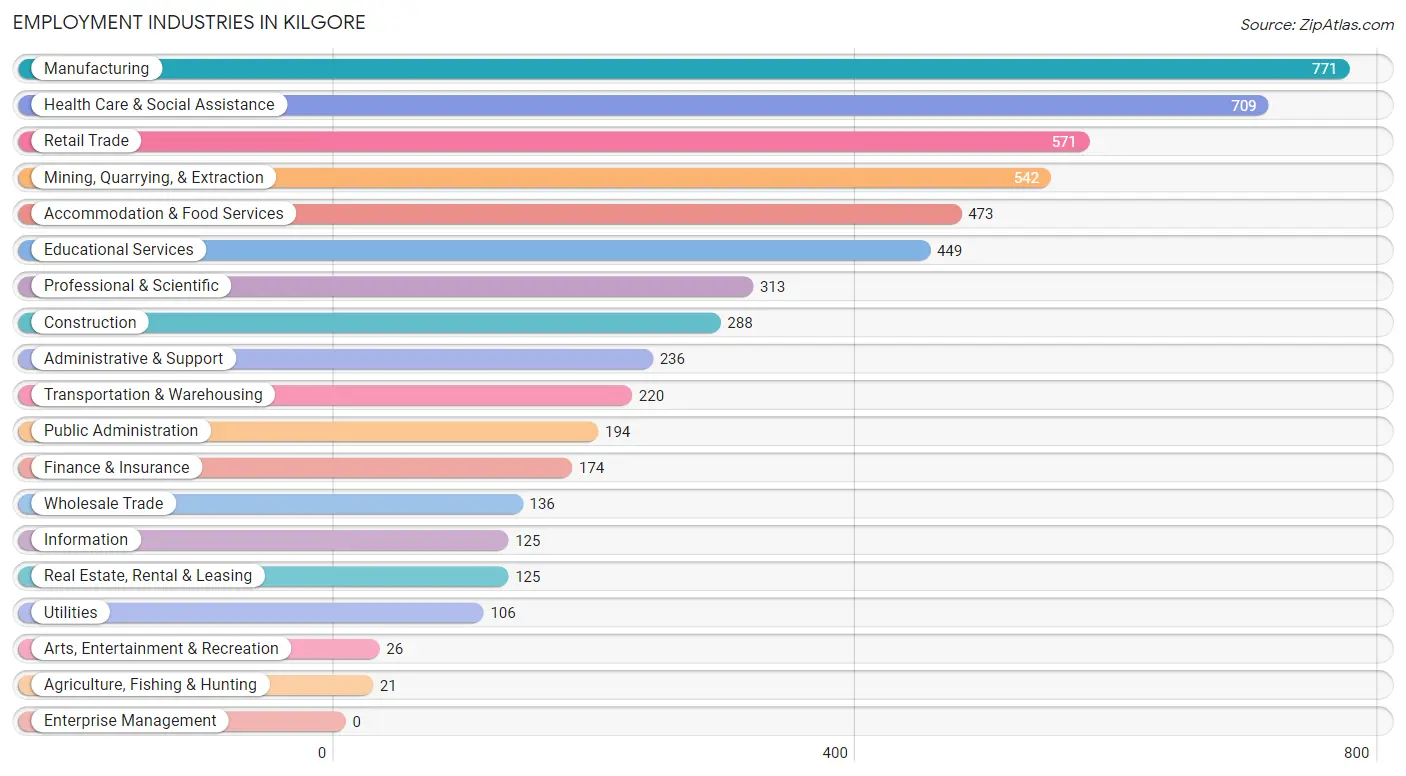
Employment Industries in Kilgore
The major employment industries in Kilgore include Manufacturing (771 | 13.2%), Health Care & Social Assistance (709 | 12.1%), Retail Trade (571 | 9.7%), Mining, Quarrying, & Extraction (542 | 9.2%), and Accommodation & Food Services (473 | 8.1%).
Employment Industries by Sex in Kilgore
The Kilgore industries that see more men than women are Agriculture, Fishing & Hunting (100.0%), Construction (100.0%), and Arts, Entertainment & Recreation (100.0%), whereas the industries that tend to have a higher number of women are Finance & Insurance (82.8%), Health Care & Social Assistance (79.4%), and Real Estate, Rental & Leasing (72.0%).
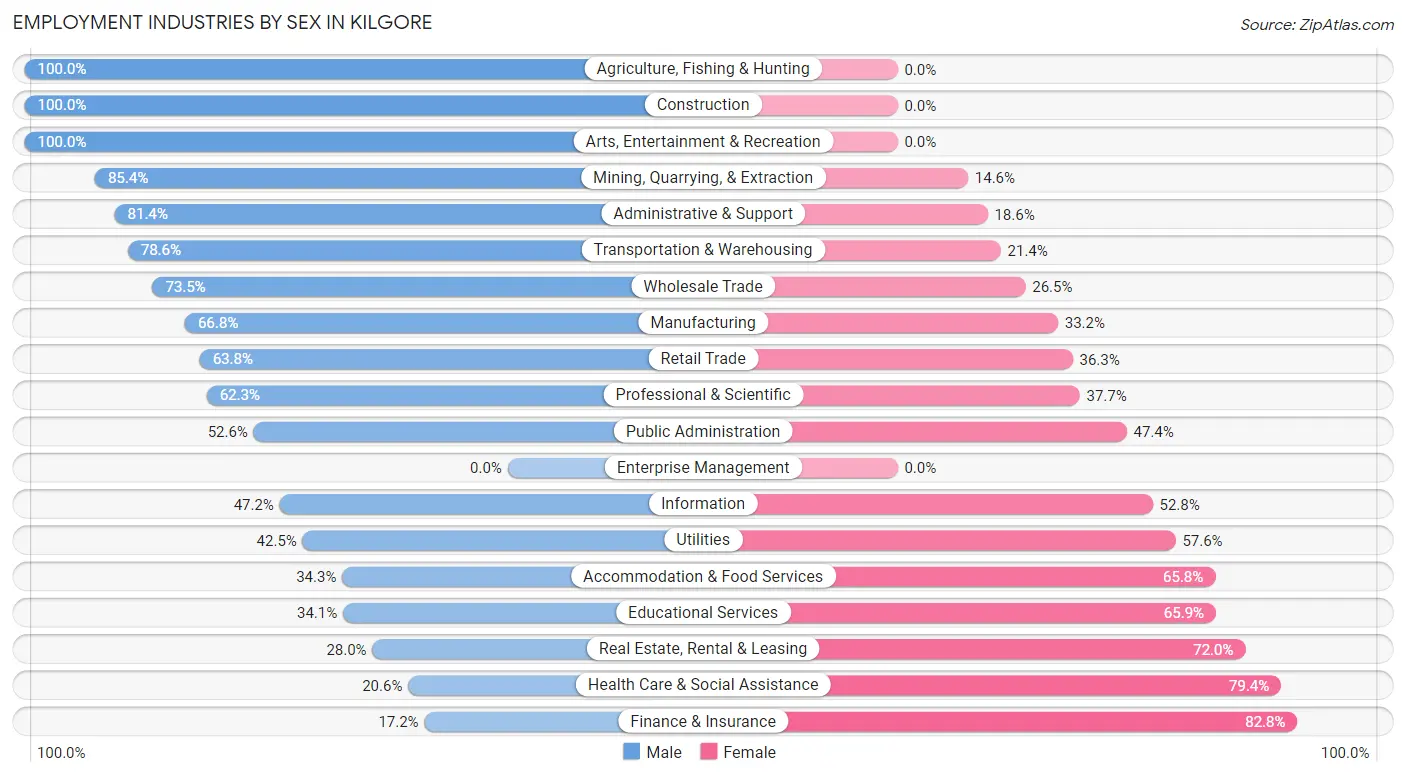
| Industry | Male | Female |
| Agriculture, Fishing & Hunting | 21 (100.0%) | 0 (0.0%) |
| Mining, Quarrying, & Extraction | 463 (85.4%) | 79 (14.6%) |
| Construction | 288 (100.0%) | 0 (0.0%) |
| Manufacturing | 515 (66.8%) | 256 (33.2%) |
| Wholesale Trade | 100 (73.5%) | 36 (26.5%) |
| Retail Trade | 364 (63.7%) | 207 (36.2%) |
| Transportation & Warehousing | 173 (78.6%) | 47 (21.4%) |
| Utilities | 45 (42.4%) | 61 (57.6%) |
| Information | 59 (47.2%) | 66 (52.8%) |
| Finance & Insurance | 30 (17.2%) | 144 (82.8%) |
| Real Estate, Rental & Leasing | 35 (28.0%) | 90 (72.0%) |
| Professional & Scientific | 195 (62.3%) | 118 (37.7%) |
| Enterprise Management | 0 (0.0%) | 0 (0.0%) |
| Administrative & Support | 192 (81.4%) | 44 (18.6%) |
| Educational Services | 153 (34.1%) | 296 (65.9%) |
| Health Care & Social Assistance | 146 (20.6%) | 563 (79.4%) |
| Arts, Entertainment & Recreation | 26 (100.0%) | 0 (0.0%) |
| Accommodation & Food Services | 162 (34.3%) | 311 (65.7%) |
| Public Administration | 102 (52.6%) | 92 (47.4%) |
| Total | 3,305 (56.4%) | 2,556 (43.6%) |
Education in Kilgore
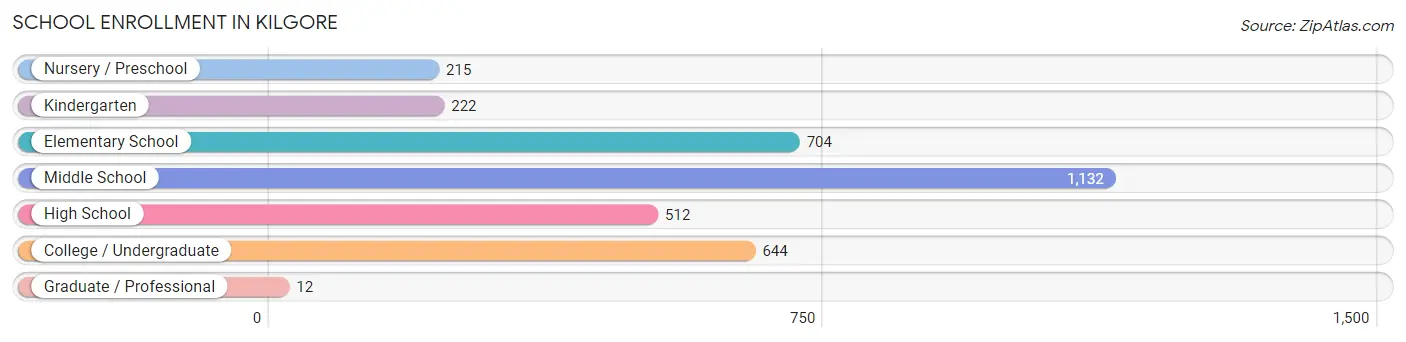
School Enrollment in Kilgore
The most common levels of schooling among the 3,441 students in Kilgore are middle school (1,132 | 32.9%), elementary school (704 | 20.5%), and college / undergraduate (644 | 18.7%).
| School Level | # Students | % Students |
| Nursery / Preschool | 215 | 6.2% |
| Kindergarten | 222 | 6.5% |
| Elementary School | 704 | 20.5% |
| Middle School | 1,132 | 32.9% |
| High School | 512 | 14.9% |
| College / Undergraduate | 644 | 18.7% |
| Graduate / Professional | 12 | 0.4% |
| Total | 3,441 | 100.0% |
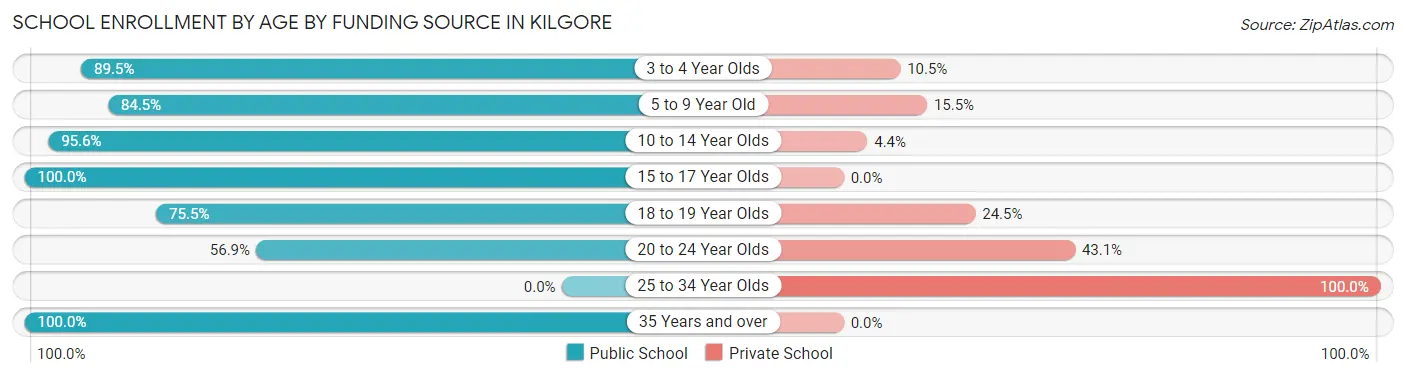
School Enrollment by Age by Funding Source in Kilgore
Out of a total of 3,441 students who are enrolled in schools in Kilgore, 440 (12.8%) attend a private institution, while the remaining 3,001 (87.2%) are enrolled in public schools. The age group of 25 to 34 year olds has the highest likelihood of being enrolled in private schools, with 37 (100.0% in the age bracket) enrolled. Conversely, the age group of 15 to 17 year olds has the lowest likelihood of being enrolled in a private school, with 426 (100.0% in the age bracket) attending a public institution.
| Age Bracket | Public School | Private School |
| 3 to 4 Year Olds | 136 (89.5%) | 16 (10.5%) |
| 5 to 9 Year Old | 719 (84.5%) | 132 (15.5%) |
| 10 to 14 Year Olds | 1,281 (95.6%) | 59 (4.4%) |
| 15 to 17 Year Olds | 426 (100.0%) | 0 (0.0%) |
| 18 to 19 Year Olds | 271 (75.5%) | 88 (24.5%) |
| 20 to 24 Year Olds | 144 (56.9%) | 109 (43.1%) |
| 25 to 34 Year Olds | 0 (0.0%) | 37 (100.0%) |
| 35 Years and over | 23 (100.0%) | 0 (0.0%) |
| Total | 3,001 (87.2%) | 440 (12.8%) |
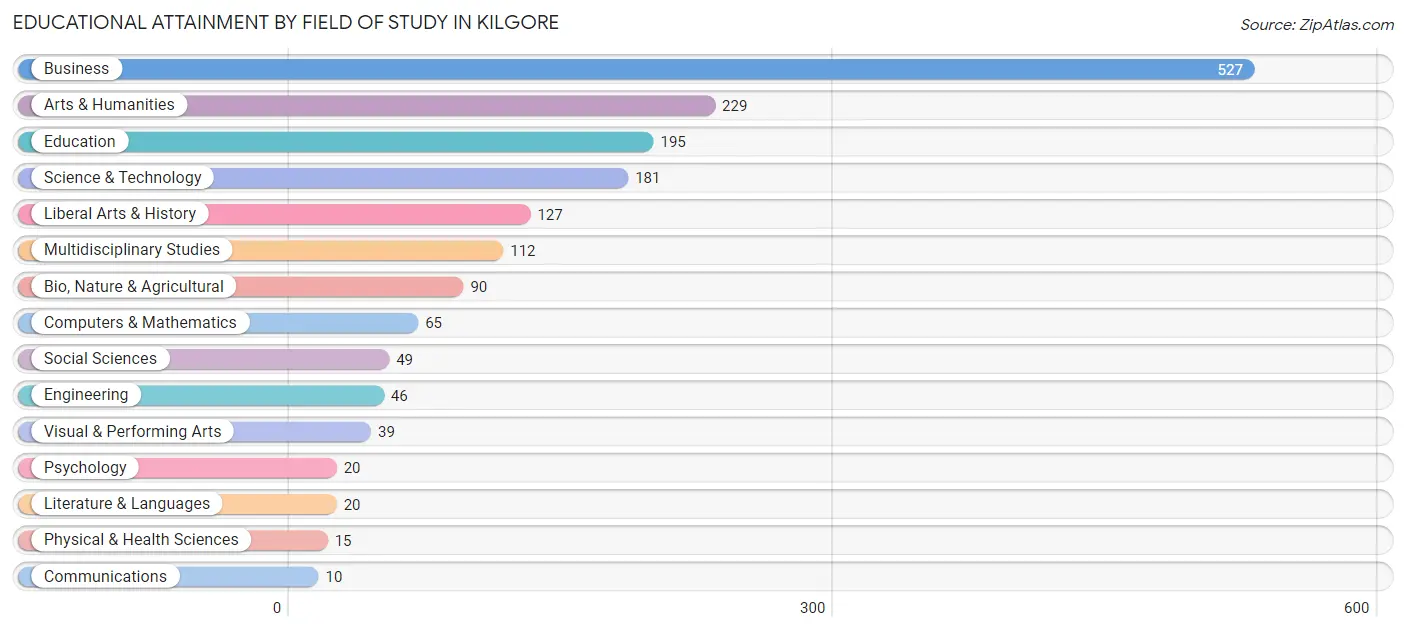
Educational Attainment by Field of Study in Kilgore
Business (527 | 30.5%), arts & humanities (229 | 13.3%), education (195 | 11.3%), science & technology (181 | 10.5%), and liberal arts & history (127 | 7.4%) are the most common fields of study among 1,725 individuals in Kilgore who have obtained a bachelor's degree or higher.
| Field of Study | # Graduates | % Graduates |
| Computers & Mathematics | 65 | 3.8% |
| Bio, Nature & Agricultural | 90 | 5.2% |
| Physical & Health Sciences | 15 | 0.9% |
| Psychology | 20 | 1.2% |
| Social Sciences | 49 | 2.8% |
| Engineering | 46 | 2.7% |
| Multidisciplinary Studies | 112 | 6.5% |
| Science & Technology | 181 | 10.5% |
| Business | 527 | 30.5% |
| Education | 195 | 11.3% |
| Literature & Languages | 20 | 1.2% |
| Liberal Arts & History | 127 | 7.4% |
| Visual & Performing Arts | 39 | 2.3% |
| Communications | 10 | 0.6% |
| Arts & Humanities | 229 | 13.3% |
| Total | 1,725 | 100.0% |
Transportation & Commute in Kilgore
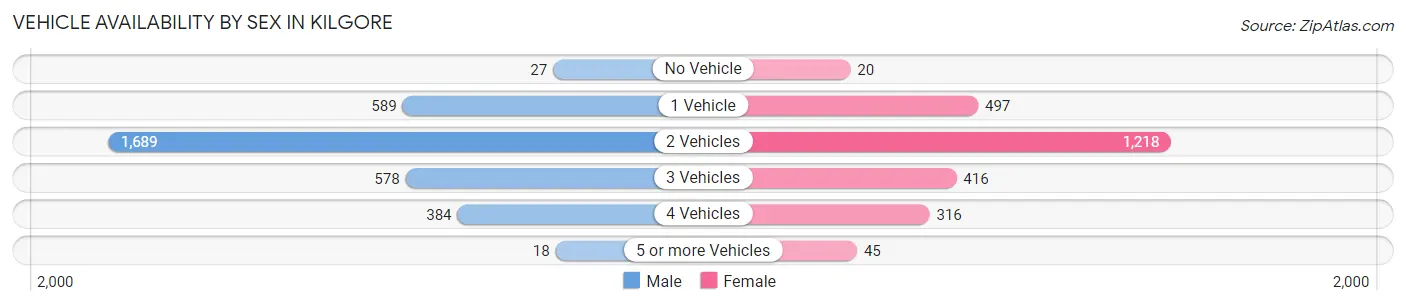
Vehicle Availability by Sex in Kilgore
The most prevalent vehicle ownership categories in Kilgore are males with 2 vehicles (1,689, accounting for 51.4%) and females with 2 vehicles (1,218, making up 67.2%).
| Vehicles Available | Male | Female |
| No Vehicle | 27 (0.8%) | 20 (0.8%) |
| 1 Vehicle | 589 (17.9%) | 497 (19.8%) |
| 2 Vehicles | 1,689 (51.4%) | 1,218 (48.5%) |
| 3 Vehicles | 578 (17.6%) | 416 (16.6%) |
| 4 Vehicles | 384 (11.7%) | 316 (12.6%) |
| 5 or more Vehicles | 18 (0.5%) | 45 (1.8%) |
| Total | 3,285 (100.0%) | 2,512 (100.0%) |
Commute Time in Kilgore
The most frequently occuring commute durations in Kilgore are 10 to 14 minutes (1,300 commuters, 23.3%), 5 to 9 minutes (966 commuters, 17.3%), and 20 to 24 minutes (793 commuters, 14.2%).
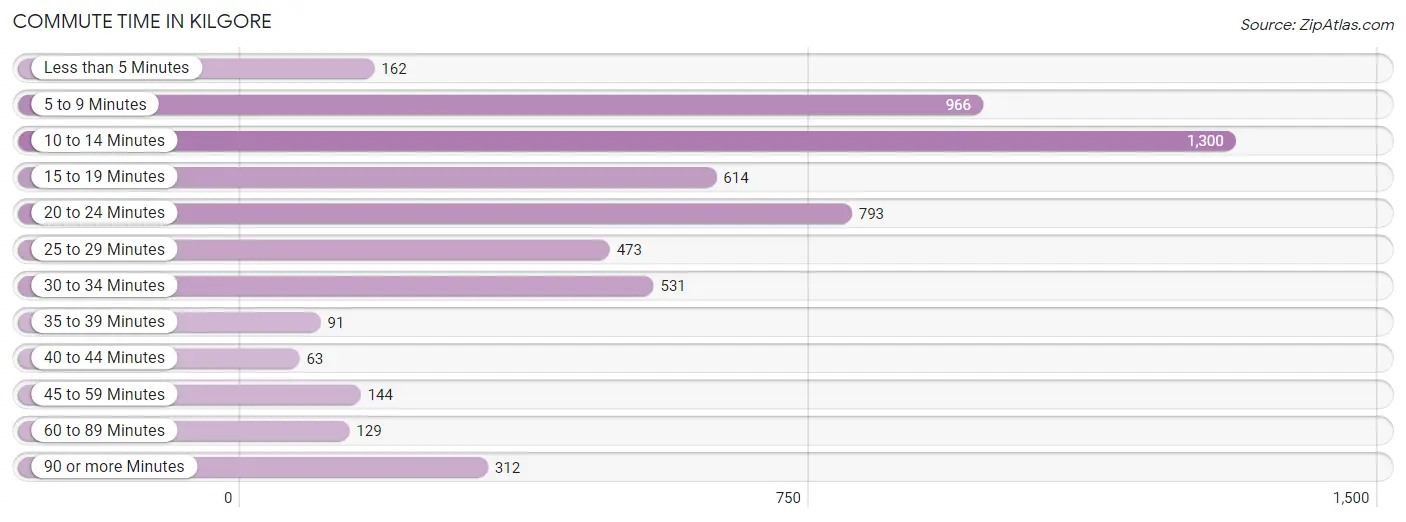
| Commute Time | # Commuters | % Commuters |
| Less than 5 Minutes | 162 | 2.9% |
| 5 to 9 Minutes | 966 | 17.3% |
| 10 to 14 Minutes | 1,300 | 23.3% |
| 15 to 19 Minutes | 614 | 11.0% |
| 20 to 24 Minutes | 793 | 14.2% |
| 25 to 29 Minutes | 473 | 8.5% |
| 30 to 34 Minutes | 531 | 9.5% |
| 35 to 39 Minutes | 91 | 1.6% |
| 40 to 44 Minutes | 63 | 1.1% |
| 45 to 59 Minutes | 144 | 2.6% |
| 60 to 89 Minutes | 129 | 2.3% |
| 90 or more Minutes | 312 | 5.6% |
Commute Time by Sex in Kilgore
The most common commute times in Kilgore are 10 to 14 minutes (854 commuters, 27.2%) for males and 5 to 9 minutes (513 commuters, 21.1%) for females.
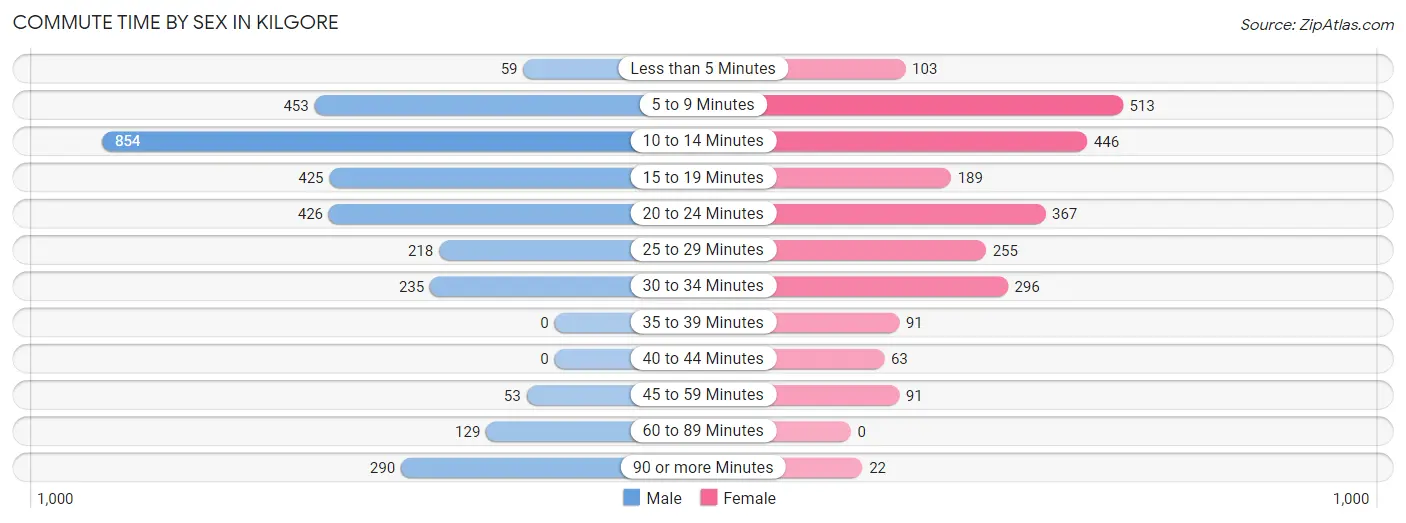
| Commute Time | Male | Female |
| Less than 5 Minutes | 59 (1.9%) | 103 (4.2%) |
| 5 to 9 Minutes | 453 (14.4%) | 513 (21.1%) |
| 10 to 14 Minutes | 854 (27.2%) | 446 (18.3%) |
| 15 to 19 Minutes | 425 (13.5%) | 189 (7.8%) |
| 20 to 24 Minutes | 426 (13.6%) | 367 (15.1%) |
| 25 to 29 Minutes | 218 (6.9%) | 255 (10.5%) |
| 30 to 34 Minutes | 235 (7.5%) | 296 (12.1%) |
| 35 to 39 Minutes | 0 (0.0%) | 91 (3.7%) |
| 40 to 44 Minutes | 0 (0.0%) | 63 (2.6%) |
| 45 to 59 Minutes | 53 (1.7%) | 91 (3.7%) |
| 60 to 89 Minutes | 129 (4.1%) | 0 (0.0%) |
| 90 or more Minutes | 290 (9.2%) | 22 (0.9%) |
Time of Departure to Work by Sex in Kilgore
The most frequent times of departure to work in Kilgore are 6:00 AM to 6:29 AM (499, 15.9%) for males and 7:30 AM to 7:59 AM (551, 22.6%) for females.
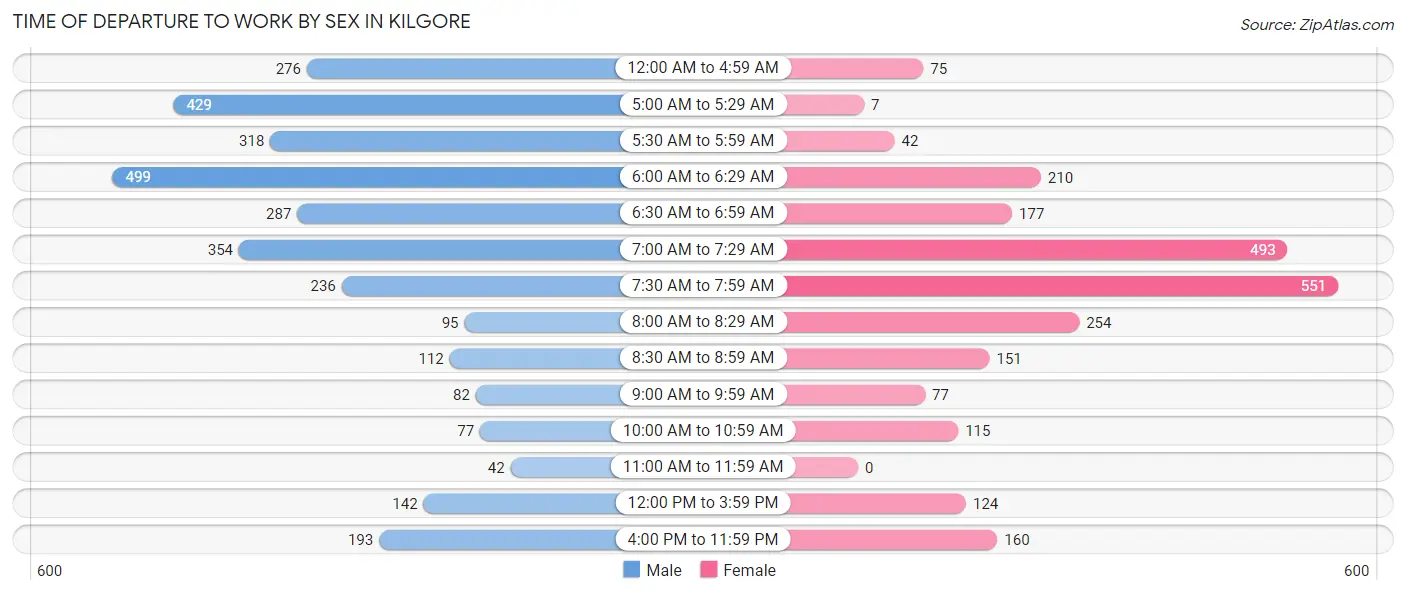
| Time of Departure | Male | Female |
| 12:00 AM to 4:59 AM | 276 (8.8%) | 75 (3.1%) |
| 5:00 AM to 5:29 AM | 429 (13.7%) | 7 (0.3%) |
| 5:30 AM to 5:59 AM | 318 (10.1%) | 42 (1.7%) |
| 6:00 AM to 6:29 AM | 499 (15.9%) | 210 (8.6%) |
| 6:30 AM to 6:59 AM | 287 (9.1%) | 177 (7.3%) |
| 7:00 AM to 7:29 AM | 354 (11.3%) | 493 (20.2%) |
| 7:30 AM to 7:59 AM | 236 (7.5%) | 551 (22.6%) |
| 8:00 AM to 8:29 AM | 95 (3.0%) | 254 (10.4%) |
| 8:30 AM to 8:59 AM | 112 (3.6%) | 151 (6.2%) |
| 9:00 AM to 9:59 AM | 82 (2.6%) | 77 (3.2%) |
| 10:00 AM to 10:59 AM | 77 (2.5%) | 115 (4.7%) |
| 11:00 AM to 11:59 AM | 42 (1.3%) | 0 (0.0%) |
| 12:00 PM to 3:59 PM | 142 (4.5%) | 124 (5.1%) |
| 4:00 PM to 11:59 PM | 193 (6.1%) | 160 (6.6%) |
| Total | 3,142 (100.0%) | 2,436 (100.0%) |
Housing Occupancy in Kilgore
Occupancy by Ownership in Kilgore
Of the total 4,607 dwellings in Kilgore, owner-occupied units account for 3,283 (71.3%), while renter-occupied units make up 1,324 (28.7%).
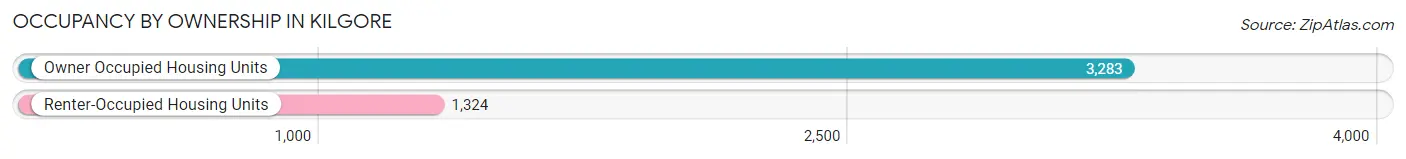
| Occupancy | # Housing Units | % Housing Units |
| Owner Occupied Housing Units | 3,283 | 71.3% |
| Renter-Occupied Housing Units | 1,324 | 28.7% |
| Total Occupied Housing Units | 4,607 | 100.0% |
Occupancy by Household Size in Kilgore
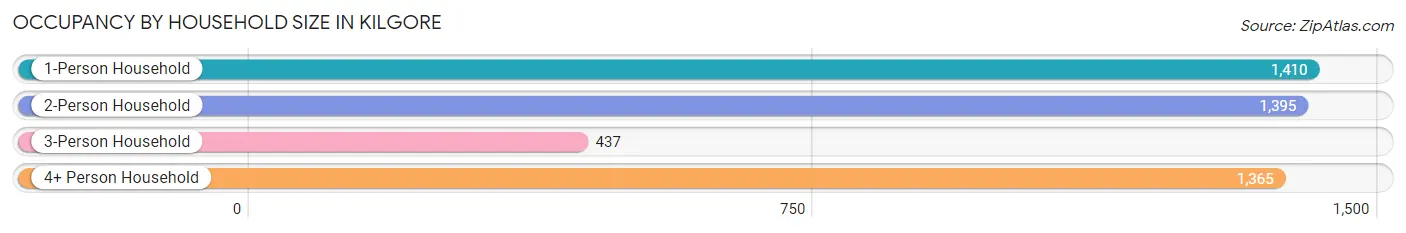
| Household Size | # Housing Units | % Housing Units |
| 1-Person Household | 1,410 | 30.6% |
| 2-Person Household | 1,395 | 30.3% |
| 3-Person Household | 437 | 9.5% |
| 4+ Person Household | 1,365 | 29.6% |
| Total Housing Units | 4,607 | 100.0% |
Occupancy by Ownership by Household Size in Kilgore
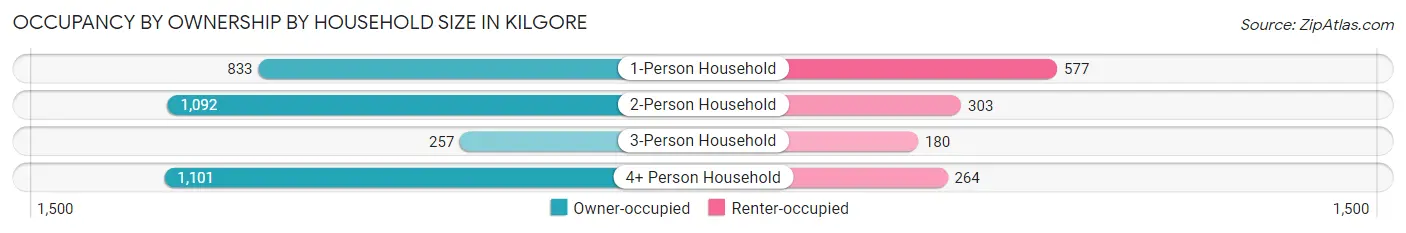
| Household Size | Owner-occupied | Renter-occupied |
| 1-Person Household | 833 (59.1%) | 577 (40.9%) |
| 2-Person Household | 1,092 (78.3%) | 303 (21.7%) |
| 3-Person Household | 257 (58.8%) | 180 (41.2%) |
| 4+ Person Household | 1,101 (80.7%) | 264 (19.3%) |
| Total Housing Units | 3,283 (71.3%) | 1,324 (28.7%) |
Occupancy by Educational Attainment in Kilgore
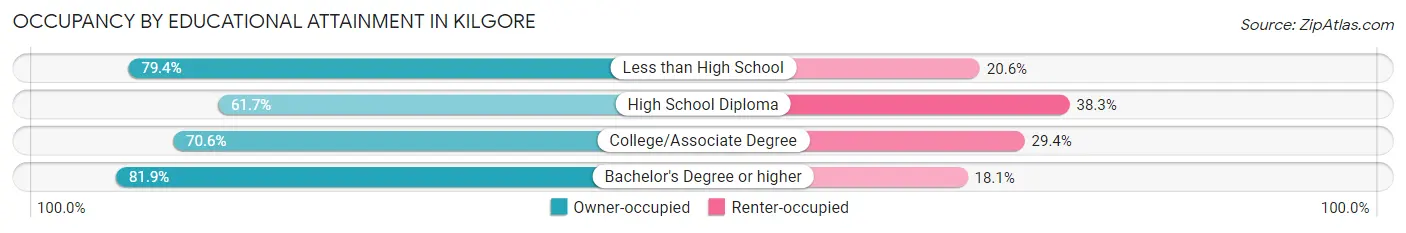
| Household Size | Owner-occupied | Renter-occupied |
| Less than High School | 645 (79.4%) | 167 (20.6%) |
| High School Diploma | 949 (61.7%) | 590 (38.3%) |
| College/Associate Degree | 988 (70.6%) | 412 (29.4%) |
| Bachelor's Degree or higher | 701 (81.9%) | 155 (18.1%) |
Occupancy by Age of Householder in Kilgore
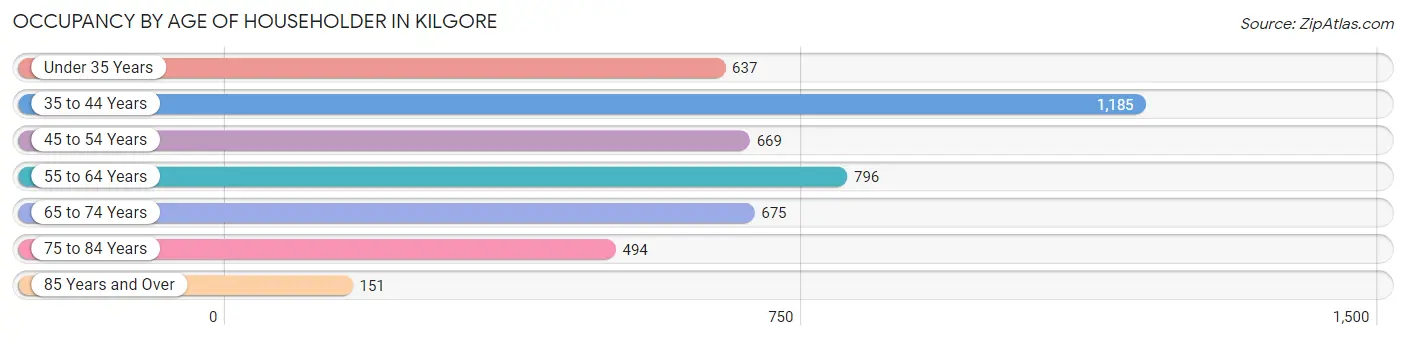
| Age Bracket | # Households | % Households |
| Under 35 Years | 637 | 13.8% |
| 35 to 44 Years | 1,185 | 25.7% |
| 45 to 54 Years | 669 | 14.5% |
| 55 to 64 Years | 796 | 17.3% |
| 65 to 74 Years | 675 | 14.6% |
| 75 to 84 Years | 494 | 10.7% |
| 85 Years and Over | 151 | 3.3% |
| Total | 4,607 | 100.0% |
Housing Finances in Kilgore
Median Income by Occupancy in Kilgore
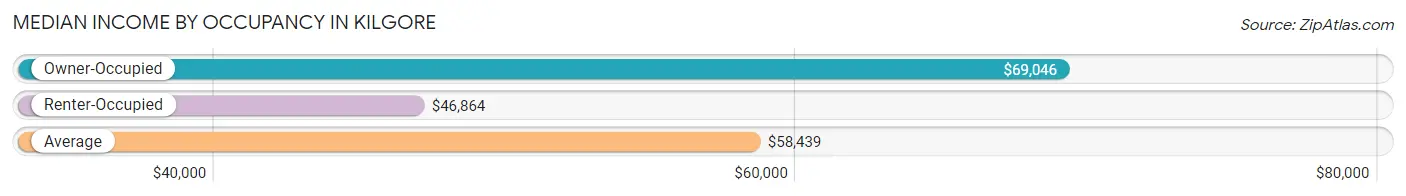
| Occupancy Type | # Households | Median Income |
| Owner-Occupied | 3,283 (71.3%) | $69,046 |
| Renter-Occupied | 1,324 (28.7%) | $46,864 |
| Average | 4,607 (100.0%) | $58,439 |
Occupancy by Householder Income Bracket in Kilgore
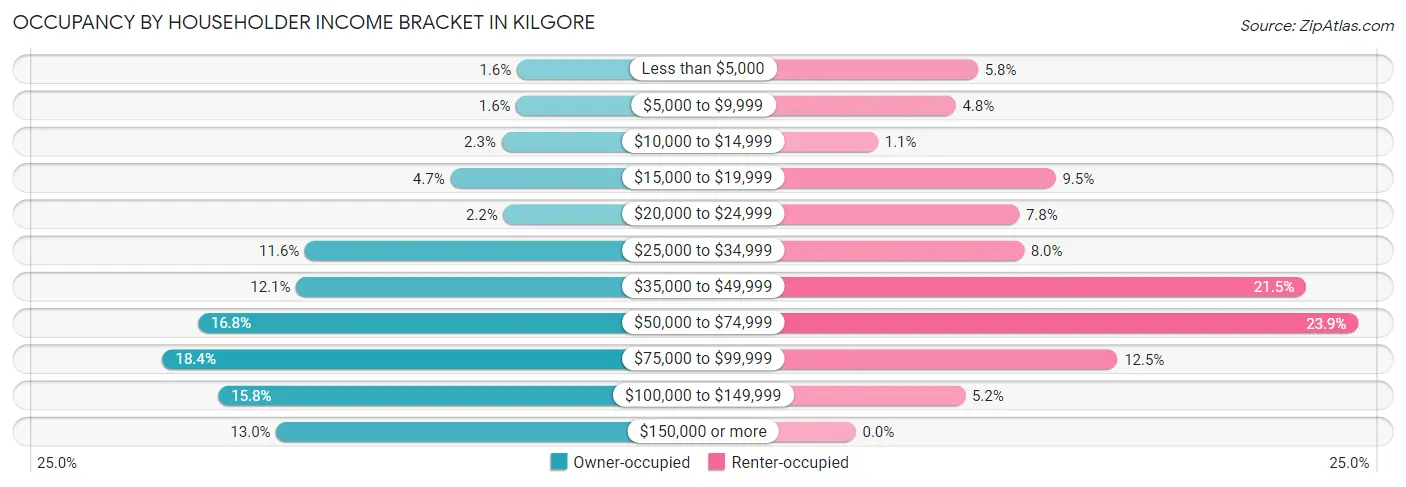
| Income Bracket | Owner-occupied | Renter-occupied |
| Less than $5,000 | 51 (1.5%) | 77 (5.8%) |
| $5,000 to $9,999 | 52 (1.6%) | 63 (4.8%) |
| $10,000 to $14,999 | 75 (2.3%) | 14 (1.1%) |
| $15,000 to $19,999 | 155 (4.7%) | 126 (9.5%) |
| $20,000 to $24,999 | 72 (2.2%) | 103 (7.8%) |
| $25,000 to $34,999 | 382 (11.6%) | 106 (8.0%) |
| $35,000 to $49,999 | 396 (12.1%) | 284 (21.4%) |
| $50,000 to $74,999 | 550 (16.8%) | 317 (23.9%) |
| $75,000 to $99,999 | 605 (18.4%) | 165 (12.5%) |
| $100,000 to $149,999 | 518 (15.8%) | 69 (5.2%) |
| $150,000 or more | 427 (13.0%) | 0 (0.0%) |
| Total | 3,283 (100.0%) | 1,324 (100.0%) |
Monthly Housing Cost Tiers in Kilgore
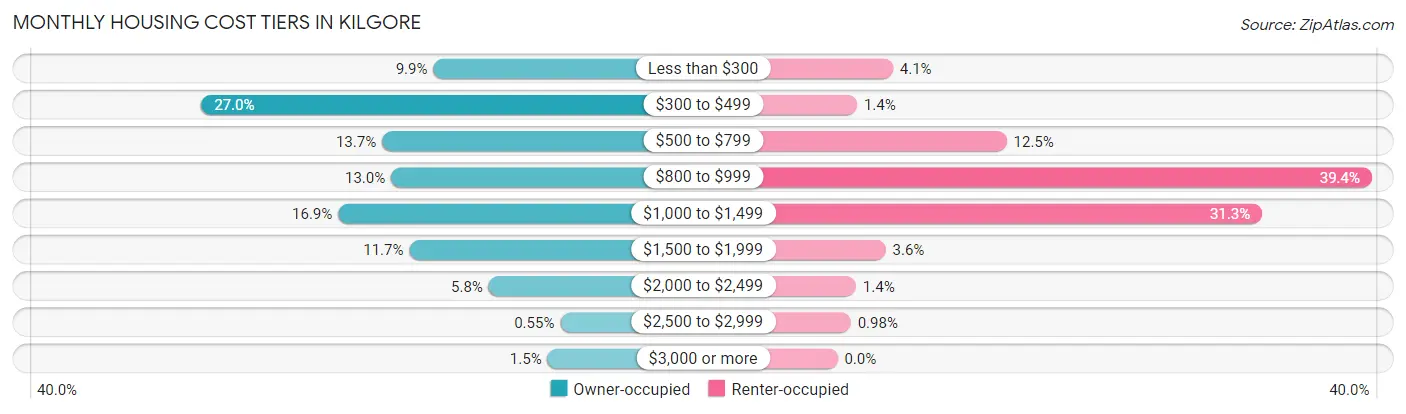
| Monthly Cost | Owner-occupied | Renter-occupied |
| Less than $300 | 325 (9.9%) | 54 (4.1%) |
| $300 to $499 | 886 (27.0%) | 19 (1.4%) |
| $500 to $799 | 449 (13.7%) | 165 (12.5%) |
| $800 to $999 | 427 (13.0%) | 521 (39.4%) |
| $1,000 to $1,499 | 555 (16.9%) | 414 (31.3%) |
| $1,500 to $1,999 | 383 (11.7%) | 47 (3.5%) |
| $2,000 to $2,499 | 191 (5.8%) | 18 (1.4%) |
| $2,500 to $2,999 | 18 (0.5%) | 13 (1.0%) |
| $3,000 or more | 49 (1.5%) | 0 (0.0%) |
| Total | 3,283 (100.0%) | 1,324 (100.0%) |
Physical Housing Characteristics in Kilgore
Housing Structures in Kilgore
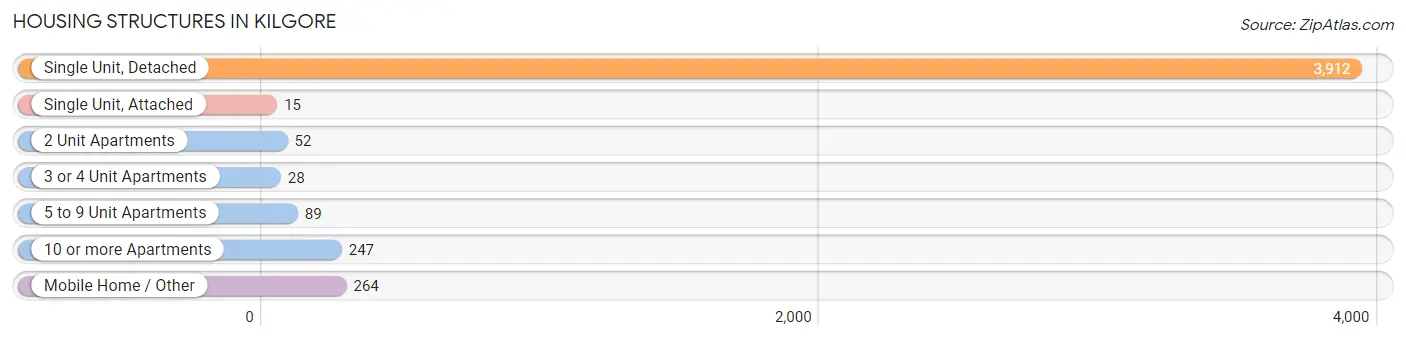
| Structure Type | # Housing Units | % Housing Units |
| Single Unit, Detached | 3,912 | 84.9% |
| Single Unit, Attached | 15 | 0.3% |
| 2 Unit Apartments | 52 | 1.1% |
| 3 or 4 Unit Apartments | 28 | 0.6% |
| 5 to 9 Unit Apartments | 89 | 1.9% |
| 10 or more Apartments | 247 | 5.4% |
| Mobile Home / Other | 264 | 5.7% |
| Total | 4,607 | 100.0% |
Housing Structures by Occupancy in Kilgore
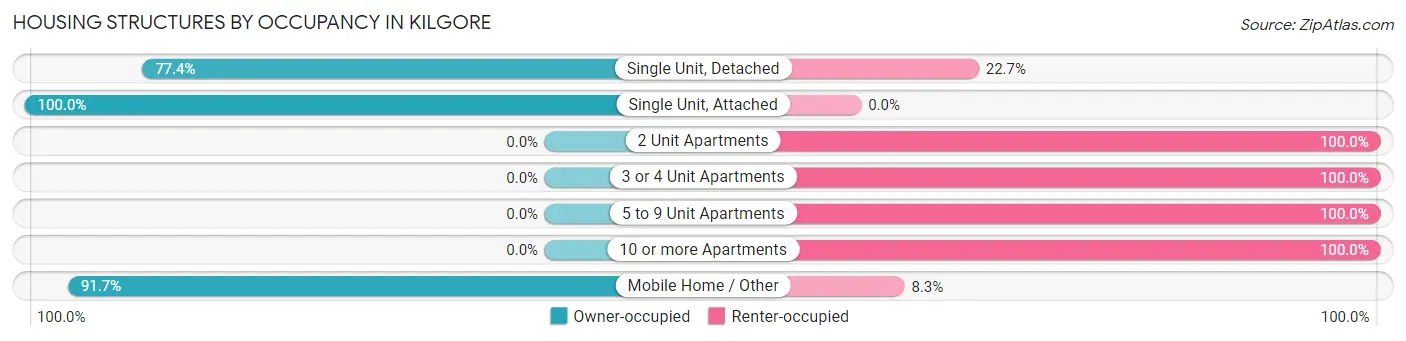
| Structure Type | Owner-occupied | Renter-occupied |
| Single Unit, Detached | 3,026 (77.3%) | 886 (22.7%) |
| Single Unit, Attached | 15 (100.0%) | 0 (0.0%) |
| 2 Unit Apartments | 0 (0.0%) | 52 (100.0%) |
| 3 or 4 Unit Apartments | 0 (0.0%) | 28 (100.0%) |
| 5 to 9 Unit Apartments | 0 (0.0%) | 89 (100.0%) |
| 10 or more Apartments | 0 (0.0%) | 247 (100.0%) |
| Mobile Home / Other | 242 (91.7%) | 22 (8.3%) |
| Total | 3,283 (71.3%) | 1,324 (28.7%) |
Housing Structures by Number of Rooms in Kilgore
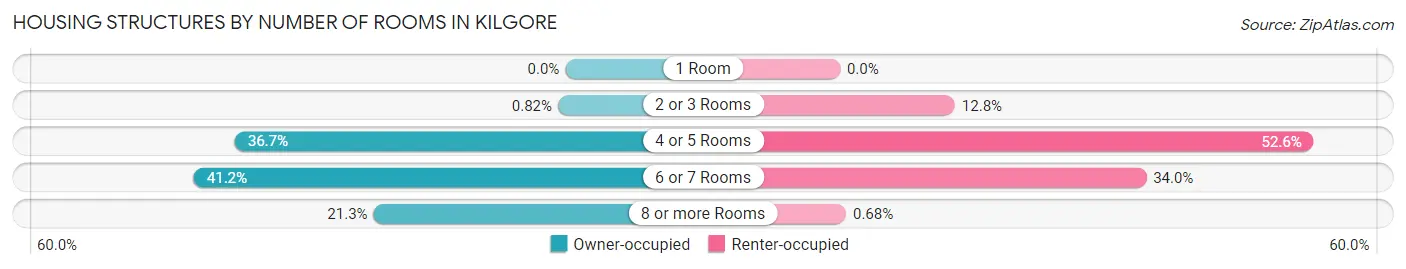
| Number of Rooms | Owner-occupied | Renter-occupied |
| 1 Room | 0 (0.0%) | 0 (0.0%) |
| 2 or 3 Rooms | 27 (0.8%) | 169 (12.8%) |
| 4 or 5 Rooms | 1,204 (36.7%) | 696 (52.6%) |
| 6 or 7 Rooms | 1,353 (41.2%) | 450 (34.0%) |
| 8 or more Rooms | 699 (21.3%) | 9 (0.7%) |
| Total | 3,283 (100.0%) | 1,324 (100.0%) |
Housing Structure by Heating Type in Kilgore
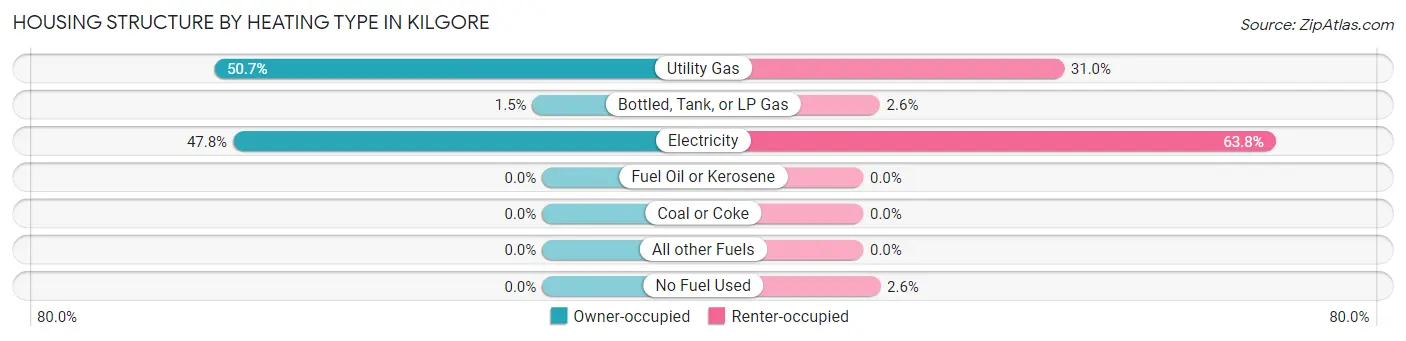
| Heating Type | Owner-occupied | Renter-occupied |
| Utility Gas | 1,665 (50.7%) | 411 (31.0%) |
| Bottled, Tank, or LP Gas | 49 (1.5%) | 34 (2.6%) |
| Electricity | 1,569 (47.8%) | 844 (63.7%) |
| Fuel Oil or Kerosene | 0 (0.0%) | 0 (0.0%) |
| Coal or Coke | 0 (0.0%) | 0 (0.0%) |
| All other Fuels | 0 (0.0%) | 0 (0.0%) |
| No Fuel Used | 0 (0.0%) | 35 (2.6%) |
| Total | 3,283 (100.0%) | 1,324 (100.0%) |
Household Vehicle Usage in Kilgore
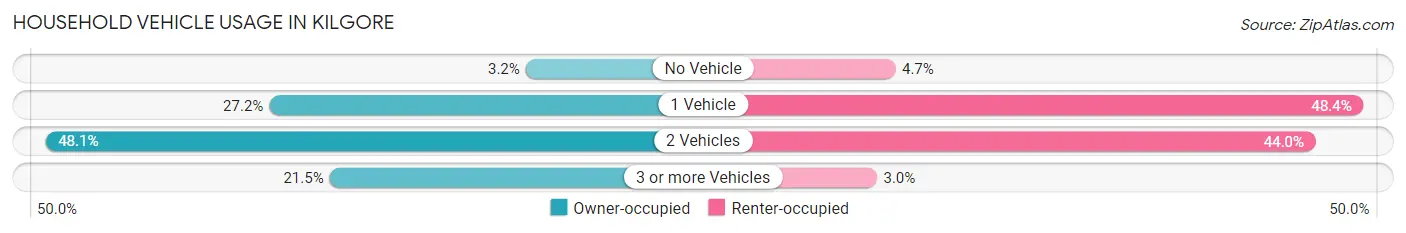
| Vehicles per Household | Owner-occupied | Renter-occupied |
| No Vehicle | 106 (3.2%) | 62 (4.7%) |
| 1 Vehicle | 892 (27.2%) | 641 (48.4%) |
| 2 Vehicles | 1,578 (48.1%) | 582 (44.0%) |
| 3 or more Vehicles | 707 (21.5%) | 39 (2.9%) |
| Total | 3,283 (100.0%) | 1,324 (100.0%) |
Real Estate & Mortgages in Kilgore
Real Estate and Mortgage Overview in Kilgore
| Characteristic | Without Mortgage | With Mortgage |
| Housing Units | 1,788 | 1,495 |
| Median Property Value | $123,000 | $166,700 |
| Median Household Income | $51,815 | $317 |
| Monthly Housing Costs | $431 | $49 |
| Real Estate Taxes | $1,117 | $60 |
Property Value by Mortgage Status in Kilgore
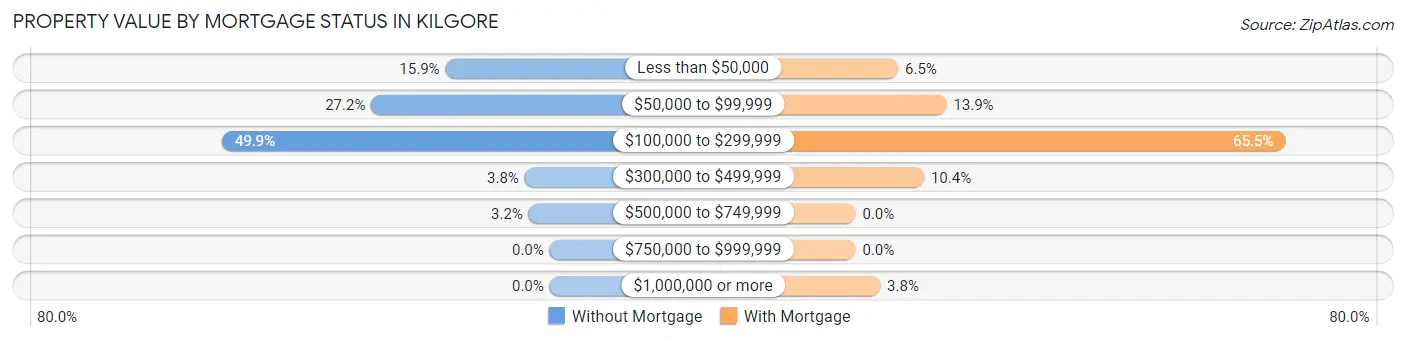
| Property Value | Without Mortgage | With Mortgage |
| Less than $50,000 | 284 (15.9%) | 97 (6.5%) |
| $50,000 to $99,999 | 486 (27.2%) | 207 (13.9%) |
| $100,000 to $299,999 | 893 (49.9%) | 979 (65.5%) |
| $300,000 to $499,999 | 68 (3.8%) | 156 (10.4%) |
| $500,000 to $749,999 | 57 (3.2%) | 0 (0.0%) |
| $750,000 to $999,999 | 0 (0.0%) | 0 (0.0%) |
| $1,000,000 or more | 0 (0.0%) | 56 (3.7%) |
| Total | 1,788 (100.0%) | 1,495 (100.0%) |
Household Income by Mortgage Status in Kilgore
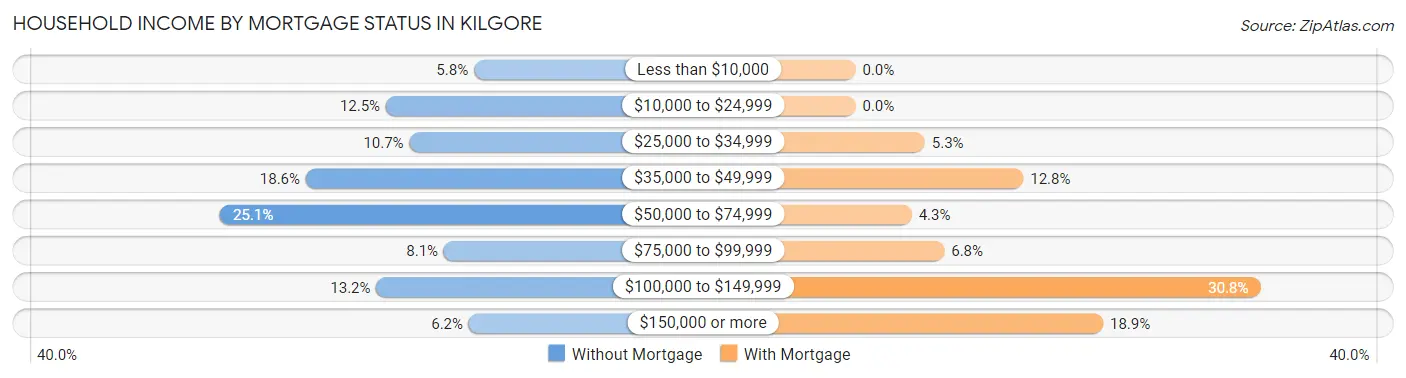
| Household Income | Without Mortgage | With Mortgage |
| Less than $10,000 | 103 (5.8%) | 0 (0.0%) |
| $10,000 to $24,999 | 223 (12.5%) | 0 (0.0%) |
| $25,000 to $34,999 | 191 (10.7%) | 79 (5.3%) |
| $35,000 to $49,999 | 332 (18.6%) | 191 (12.8%) |
| $50,000 to $74,999 | 449 (25.1%) | 64 (4.3%) |
| $75,000 to $99,999 | 144 (8.1%) | 101 (6.8%) |
| $100,000 to $149,999 | 236 (13.2%) | 461 (30.8%) |
| $150,000 or more | 110 (6.1%) | 282 (18.9%) |
| Total | 1,788 (100.0%) | 1,495 (100.0%) |
Property Value to Household Income Ratio in Kilgore
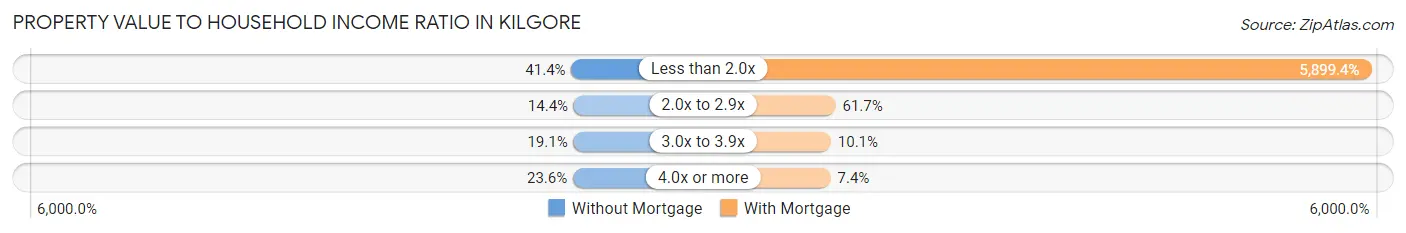
| Value-to-Income Ratio | Without Mortgage | With Mortgage |
| Less than 2.0x | 741 (41.4%) | 88,196 (5,899.4%) |
| 2.0x to 2.9x | 257 (14.4%) | 922 (61.7%) |
| 3.0x to 3.9x | 342 (19.1%) | 151 (10.1%) |
| 4.0x or more | 421 (23.5%) | 110 (7.4%) |
| Total | 1,788 (100.0%) | 1,495 (100.0%) |
Real Estate Taxes by Mortgage Status in Kilgore
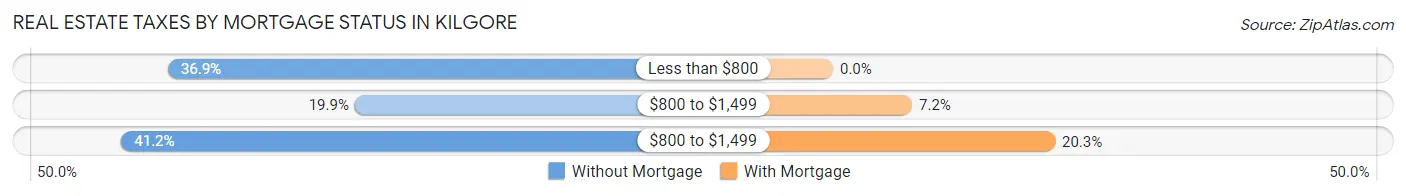
| Property Taxes | Without Mortgage | With Mortgage |
| Less than $800 | 660 (36.9%) | 0 (0.0%) |
| $800 to $1,499 | 355 (19.9%) | 108 (7.2%) |
| $800 to $1,499 | 736 (41.2%) | 303 (20.3%) |
| Total | 1,788 (100.0%) | 1,495 (100.0%) |
Health & Disability in Kilgore
Health Insurance Coverage by Age in Kilgore
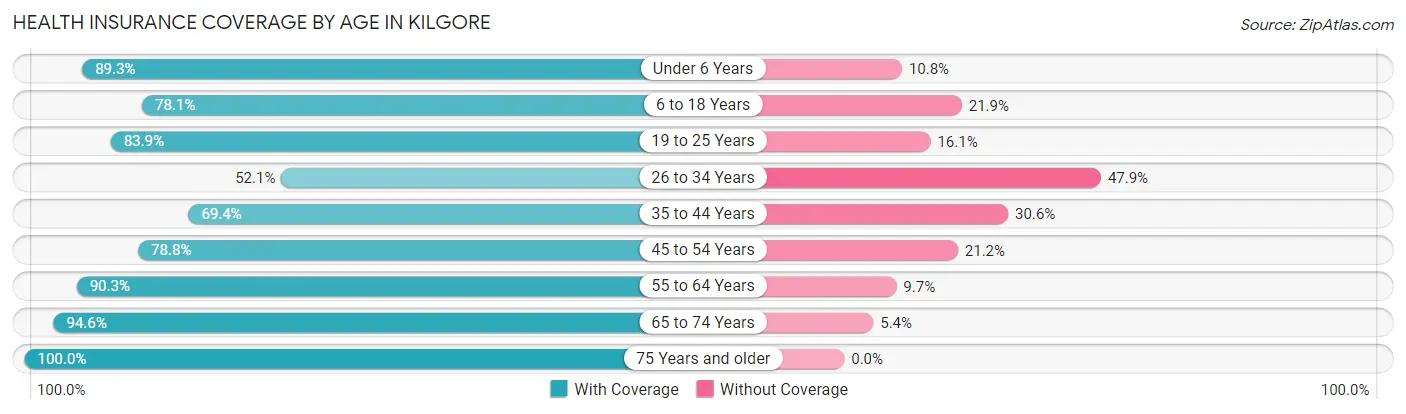
| Age Bracket | With Coverage | Without Coverage |
| Under 6 Years | 955 (89.2%) | 115 (10.7%) |
| 6 to 18 Years | 2,149 (78.1%) | 603 (21.9%) |
| 19 to 25 Years | 1,029 (83.9%) | 197 (16.1%) |
| 26 to 34 Years | 647 (52.1%) | 594 (47.9%) |
| 35 to 44 Years | 1,361 (69.4%) | 599 (30.6%) |
| 45 to 54 Years | 1,146 (78.8%) | 308 (21.2%) |
| 55 to 64 Years | 1,301 (90.3%) | 140 (9.7%) |
| 65 to 74 Years | 927 (94.6%) | 53 (5.4%) |
| 75 Years and older | 945 (100.0%) | 0 (0.0%) |
| Total | 10,460 (80.0%) | 2,609 (20.0%) |
Health Insurance Coverage by Citizenship Status in Kilgore
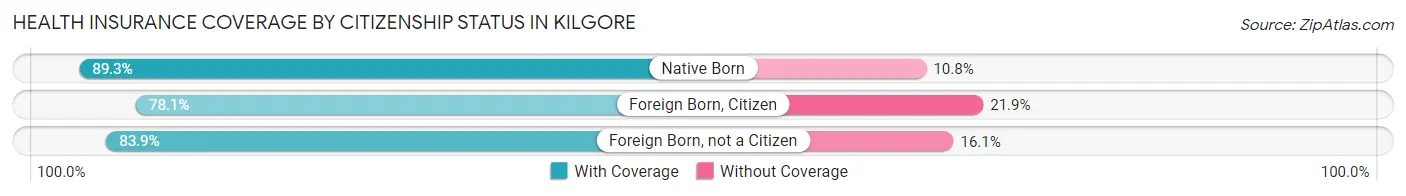
| Citizenship Status | With Coverage | Without Coverage |
| Native Born | 955 (89.2%) | 115 (10.7%) |
| Foreign Born, Citizen | 2,149 (78.1%) | 603 (21.9%) |
| Foreign Born, not a Citizen | 1,029 (83.9%) | 197 (16.1%) |
Health Insurance Coverage by Household Income in Kilgore
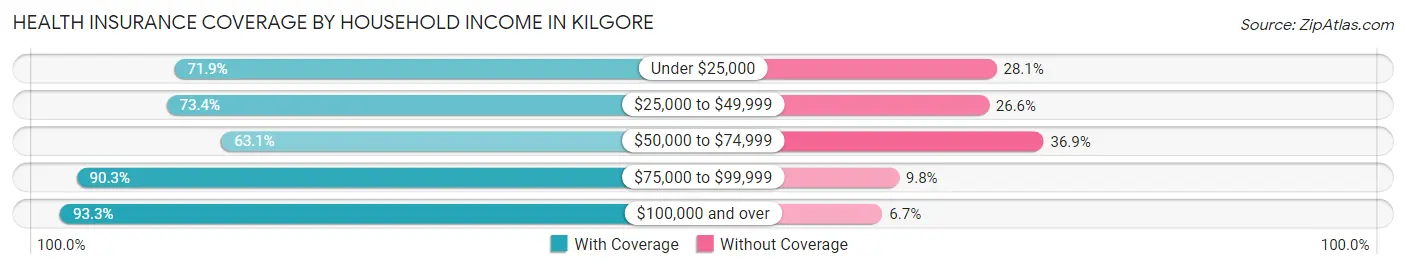
| Household Income | With Coverage | Without Coverage |
| Under $25,000 | 1,156 (71.9%) | 451 (28.1%) |
| $25,000 to $49,999 | 1,761 (73.4%) | 639 (26.6%) |
| $50,000 to $74,999 | 1,458 (63.1%) | 851 (36.9%) |
| $75,000 to $99,999 | 2,324 (90.2%) | 251 (9.8%) |
| $100,000 and over | 3,456 (93.3%) | 247 (6.7%) |
Public vs Private Health Insurance Coverage by Age in Kilgore
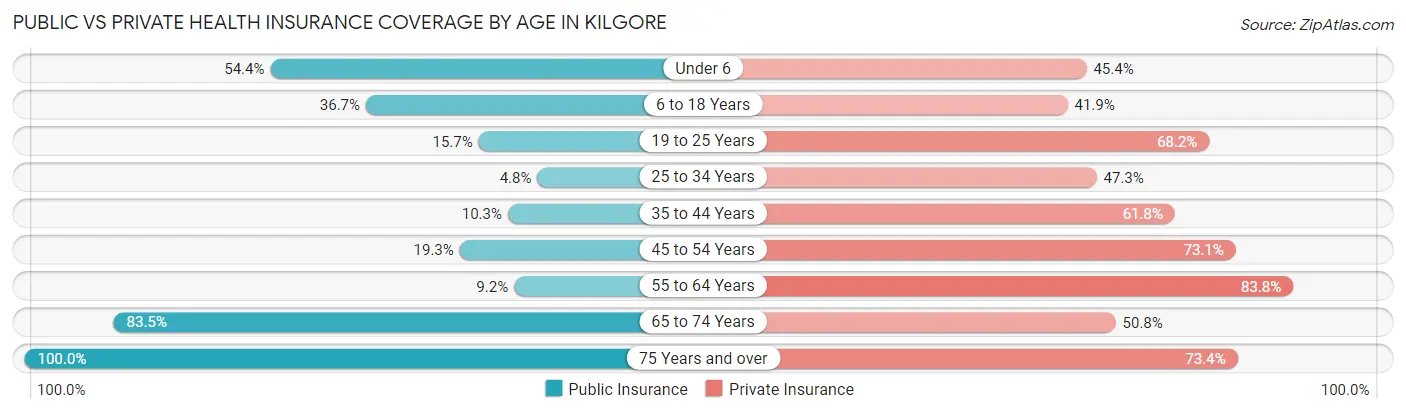
| Age Bracket | Public Insurance | Private Insurance |
| Under 6 | 582 (54.4%) | 486 (45.4%) |
| 6 to 18 Years | 1,009 (36.7%) | 1,153 (41.9%) |
| 19 to 25 Years | 193 (15.7%) | 836 (68.2%) |
| 25 to 34 Years | 60 (4.8%) | 587 (47.3%) |
| 35 to 44 Years | 202 (10.3%) | 1,211 (61.8%) |
| 45 to 54 Years | 280 (19.3%) | 1,063 (73.1%) |
| 55 to 64 Years | 132 (9.2%) | 1,207 (83.8%) |
| 65 to 74 Years | 818 (83.5%) | 498 (50.8%) |
| 75 Years and over | 945 (100.0%) | 694 (73.4%) |
| Total | 4,221 (32.3%) | 7,735 (59.2%) |
Disability Status by Sex by Age in Kilgore
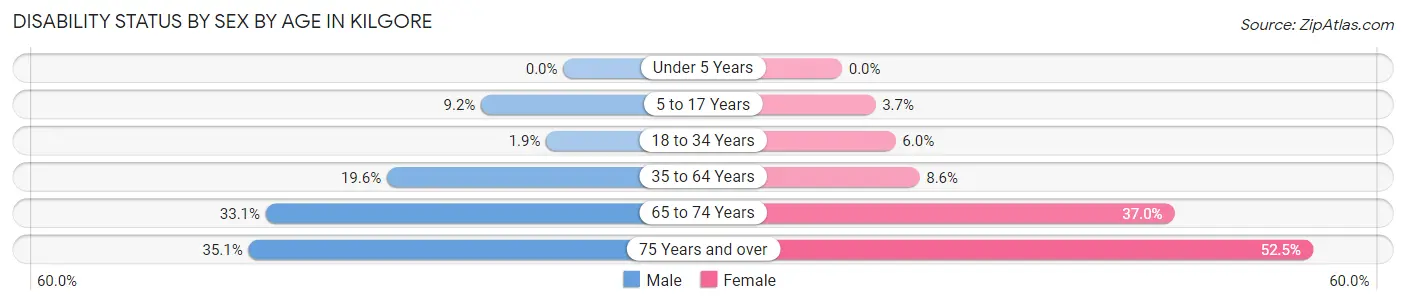
| Age Bracket | Male | Female |
| Under 5 Years | 0 (0.0%) | 0 (0.0%) |
| 5 to 17 Years | 128 (9.1%) | 48 (3.7%) |
| 18 to 34 Years | 26 (1.9%) | 80 (6.0%) |
| 35 to 64 Years | 519 (19.6%) | 191 (8.6%) |
| 65 to 74 Years | 161 (33.1%) | 183 (37.0%) |
| 75 Years and over | 88 (35.1%) | 364 (52.4%) |
Disability Class by Sex by Age in Kilgore
Disability Class: Hearing Difficulty
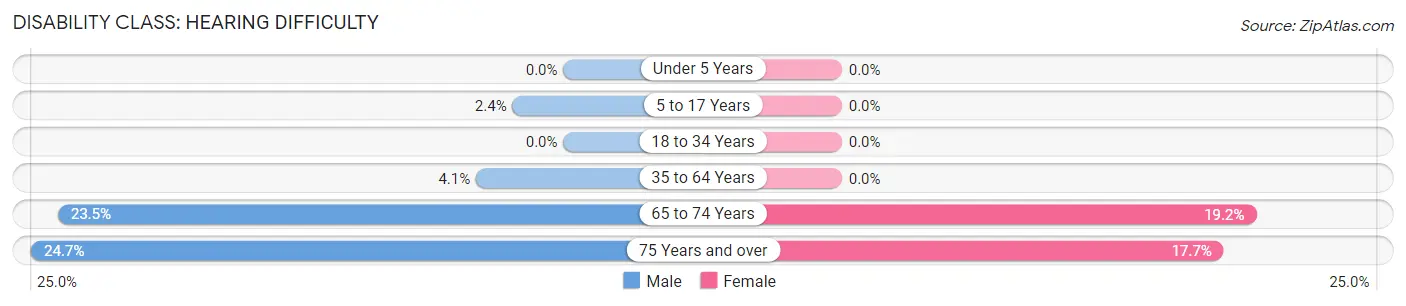
| Age Bracket | Male | Female |
| Under 5 Years | 0 (0.0%) | 0 (0.0%) |
| 5 to 17 Years | 33 (2.4%) | 0 (0.0%) |
| 18 to 34 Years | 0 (0.0%) | 0 (0.0%) |
| 35 to 64 Years | 107 (4.1%) | 0 (0.0%) |
| 65 to 74 Years | 114 (23.5%) | 95 (19.2%) |
| 75 Years and over | 62 (24.7%) | 123 (17.7%) |
Disability Class: Vision Difficulty
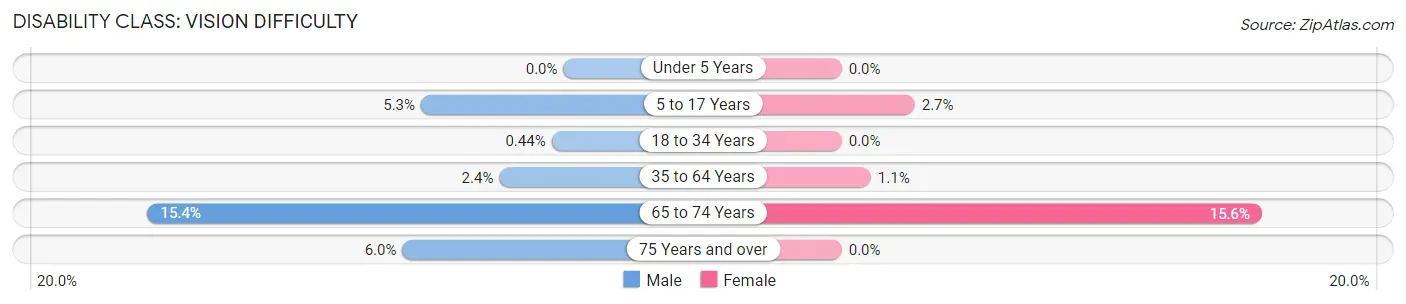
| Age Bracket | Male | Female |
| Under 5 Years | 0 (0.0%) | 0 (0.0%) |
| 5 to 17 Years | 74 (5.3%) | 35 (2.7%) |
| 18 to 34 Years | 6 (0.4%) | 0 (0.0%) |
| 35 to 64 Years | 63 (2.4%) | 24 (1.1%) |
| 65 to 74 Years | 75 (15.4%) | 77 (15.6%) |
| 75 Years and over | 15 (6.0%) | 0 (0.0%) |
Disability Class: Cognitive Difficulty
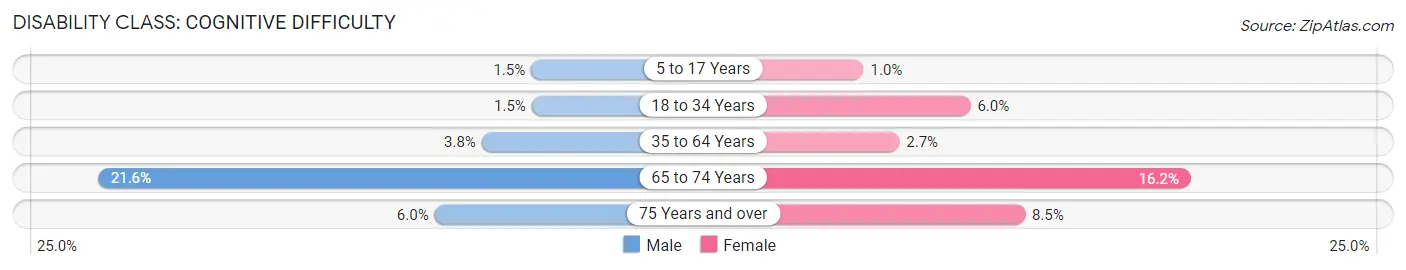
| Age Bracket | Male | Female |
| 5 to 17 Years | 21 (1.5%) | 13 (1.0%) |
| 18 to 34 Years | 20 (1.5%) | 80 (6.0%) |
| 35 to 64 Years | 100 (3.8%) | 59 (2.7%) |
| 65 to 74 Years | 105 (21.6%) | 80 (16.2%) |
| 75 Years and over | 15 (6.0%) | 59 (8.5%) |
Disability Class: Ambulatory Difficulty
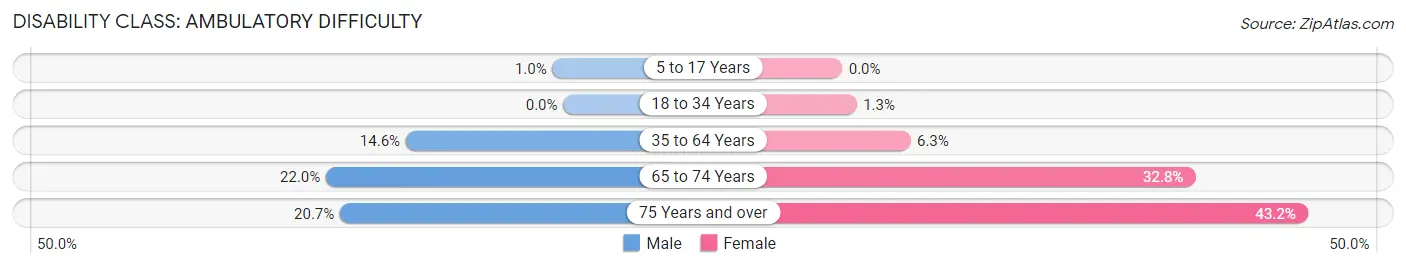
| Age Bracket | Male | Female |
| 5 to 17 Years | 14 (1.0%) | 0 (0.0%) |
| 18 to 34 Years | 0 (0.0%) | 18 (1.3%) |
| 35 to 64 Years | 386 (14.6%) | 140 (6.3%) |
| 65 to 74 Years | 107 (22.0%) | 162 (32.8%) |
| 75 Years and over | 52 (20.7%) | 300 (43.2%) |
Disability Class: Self-Care Difficulty
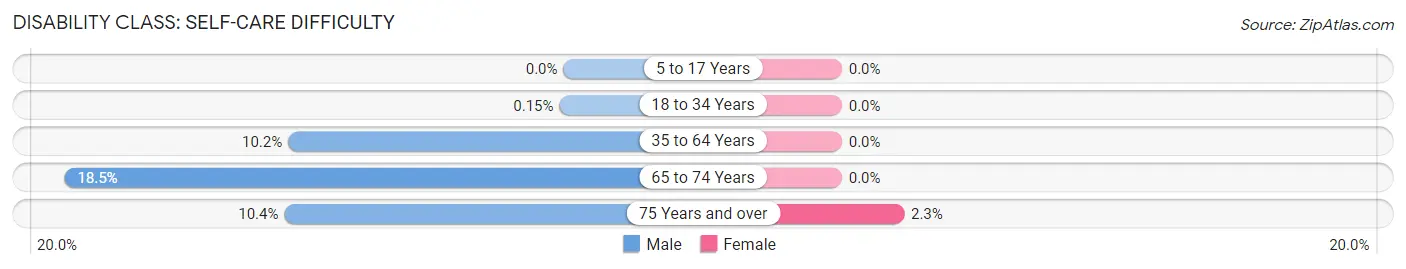
| Age Bracket | Male | Female |
| 5 to 17 Years | 0 (0.0%) | 0 (0.0%) |
| 18 to 34 Years | 2 (0.2%) | 0 (0.0%) |
| 35 to 64 Years | 270 (10.2%) | 0 (0.0%) |
| 65 to 74 Years | 90 (18.5%) | 0 (0.0%) |
| 75 Years and over | 26 (10.4%) | 16 (2.3%) |
Technology Access in Kilgore
Computing Device Access in Kilgore
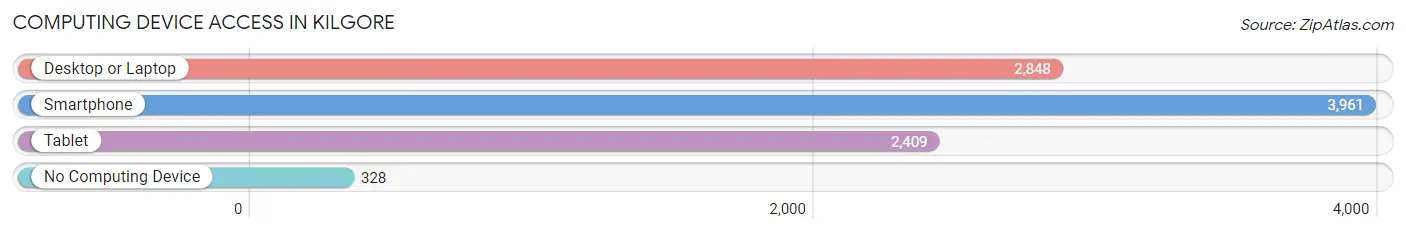
| Device Type | # Households | % Households |
| Desktop or Laptop | 2,848 | 61.8% |
| Smartphone | 3,961 | 86.0% |
| Tablet | 2,409 | 52.3% |
| No Computing Device | 328 | 7.1% |
| Total | 4,607 | 100.0% |
Internet Access in Kilgore
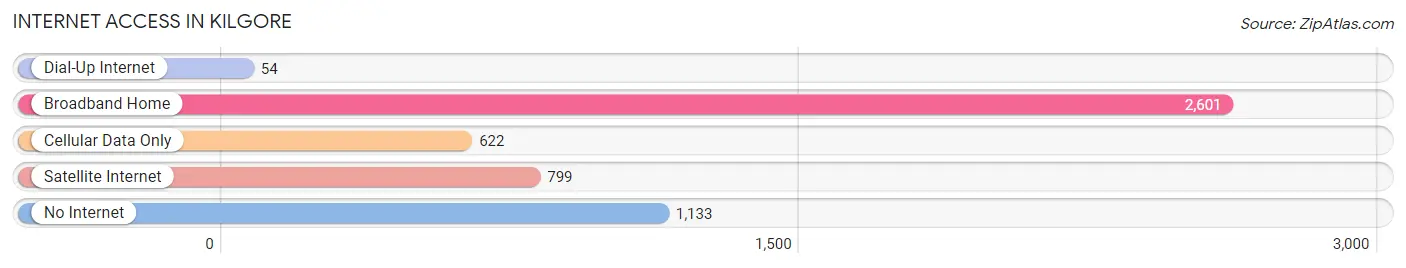
| Internet Type | # Households | % Households |
| Dial-Up Internet | 54 | 1.2% |
| Broadband Home | 2,601 | 56.5% |
| Cellular Data Only | 622 | 13.5% |
| Satellite Internet | 799 | 17.3% |
| No Internet | 1,133 | 24.6% |
| Total | 4,607 | 100.0% |
Kilgore Summary
Kilgore, Texas is a small city located in Gregg County, in the northeastern part of the state. It is situated about 120 miles east of Dallas and about 140 miles north of Houston. The city has a population of about 14,000 people and is part of the Longview-Marshall Metropolitan Statistical Area.
History
Kilgore was founded in 1872 by a group of settlers from Kilgore, Kentucky. The town was named after the Kentucky town, and the settlers brought with them the same name. The town was originally a farming community, but it soon became a center for oil production. In 1930, the East Texas Oil Field was discovered near Kilgore, and the city quickly became a major oil-producing center. The discovery of oil brought a great deal of wealth to the city, and it soon became known as the “Oil Capital of East Texas.”
In the 1950s, Kilgore experienced a population boom as people moved to the city to take advantage of the oil industry. The city also became a center for manufacturing, and many new businesses were established. In the 1960s, Kilgore College was established, and the city became a center for education.
Geography
Kilgore is located in the northeastern part of Texas, in Gregg County. It is situated about 120 miles east of Dallas and about 140 miles north of Houston. The city is located in the East Texas Piney Woods region, and it is surrounded by rolling hills and forests. The city is situated on the banks of the Sabine River, and it is close to several lakes, including Lake O’ the Pines and Lake Cherokee.
Economy
Kilgore’s economy is largely based on the oil industry. The city is home to several oil refineries and related businesses, and it is a major center for oil production. The city is also home to several manufacturing companies, and it is a center for education, with Kilgore College located in the city.
Demographics
As of the 2010 census, Kilgore had a population of 14,050 people. The racial makeup of the city was 75.3% White, 17.2% African American, 0.7% Native American, 0.7% Asian, and 5.9% from other races. The median household income was $37,945, and the median family income was $45,945. The per capita income was $19,945.
Kilgore is a small city with a rich history and a vibrant economy. It is a center for oil production and manufacturing, and it is also a center for education. The city has a diverse population, and it is a great place to live and work.
Common Questions
What is Per Capita Income in Kilgore?
Per Capita income in Kilgore is $27,323.
What is the Median Family Income in Kilgore?
Median Family Income in Kilgore is $69,748.
What is the Median Household income in Kilgore?
Median Household Income in Kilgore is $58,439.
What is Income or Wage Gap in Kilgore?
Income or Wage Gap in Kilgore is 34.7%.
Women in Kilgore earn 65.3 cents for every dollar earned by a man.
What is Inequality or Gini Index in Kilgore?
Inequality or Gini Index in Kilgore is 0.43.
What is the Total Population of Kilgore?
Total Population of Kilgore is 13,400.
What is the Total Male Population of Kilgore?
Total Male Population of Kilgore is 6,647.
What is the Total Female Population of Kilgore?
Total Female Population of Kilgore is 6,753.
What is the Ratio of Males per 100 Females in Kilgore?
There are 98.43 Males per 100 Females in Kilgore.
What is the Ratio of Females per 100 Males in Kilgore?
There are 101.59 Females per 100 Males in Kilgore.
What is the Median Population Age in Kilgore?
Median Population Age in Kilgore is 38.2 Years.
What is the Average Family Size in Kilgore
Average Family Size in Kilgore is 3.4 People.
What is the Average Household Size in Kilgore
Average Household Size in Kilgore is 2.8 People.
How Large is the Labor Force in Kilgore?
There are 6,243 People in the Labor Forcein in Kilgore.
What is the Percentage of People in the Labor Force in Kilgore?
61.3% of People are in the Labor Force in Kilgore.
What is the Unemployment Rate in Kilgore?
Unemployment Rate in Kilgore is 4.8%.