Kermit, TX Map & Demographics
Kermit Map
Kermit Overview
$30,493
PER CAPITA INCOME
$85,417
AVG FAMILY INCOME
$84,931
AVG HOUSEHOLD INCOME
42.9%
WAGE / INCOME GAP [ % ]
57.1¢/ $1
WAGE / INCOME GAP [ $ ]
$11,586
FAMILY INCOME DEFICIT
0.34
INEQUALITY / GINI INDEX
5,984
TOTAL POPULATION
3,075
MALE POPULATION
2,909
FEMALE POPULATION
105.71
MALES / 100 FEMALES
94.60
FEMALES / 100 MALES
33.0
MEDIAN AGE
3.3
AVG FAMILY SIZE
2.8
AVG HOUSEHOLD SIZE
2,728
LABOR FORCE [ PEOPLE ]
61.8%
PERCENT IN LABOR FORCE
2.9%
UNEMPLOYMENT RATE
Kermit Zip Codes
Kermit Area Codes
Income in Kermit
Income Overview in Kermit
Per Capita Income in Kermit is $30,493, while median incomes of families and households are $85,417 and $84,931 respectively.
| Characteristic | Number | Measure |
| Per Capita Income | 5,984 | $30,493 |
| Median Family Income | 1,580 | $85,417 |
| Mean Family Income | 1,580 | $89,559 |
| Median Household Income | 2,110 | $84,931 |
| Mean Household Income | 2,110 | $87,697 |
| Income Deficit | 1,580 | $11,586 |
| Wage / Income Gap (%) | 5,984 | 42.95% |
| Wage / Income Gap ($) | 5,984 | 57.05¢ per $1 |
| Gini / Inequality Index | 5,984 | 0.34 |
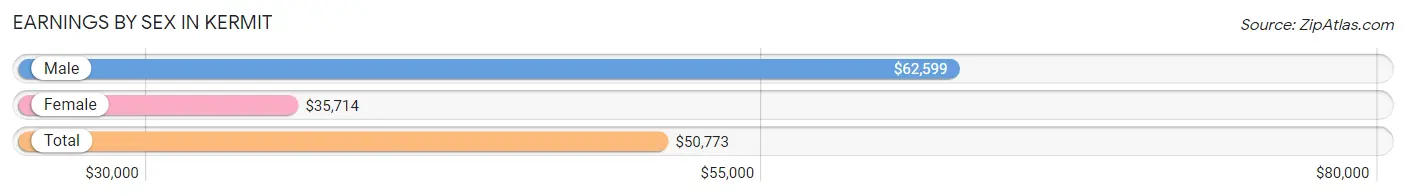
Earnings by Sex in Kermit
Average Earnings in Kermit are $50,773, $62,599 for men and $35,714 for women, a difference of 42.9%.
| Sex | Number | Average Earnings |
| Male | 1,848 (65.7%) | $62,599 |
| Female | 966 (34.3%) | $35,714 |
| Total | 2,814 (100.0%) | $50,773 |
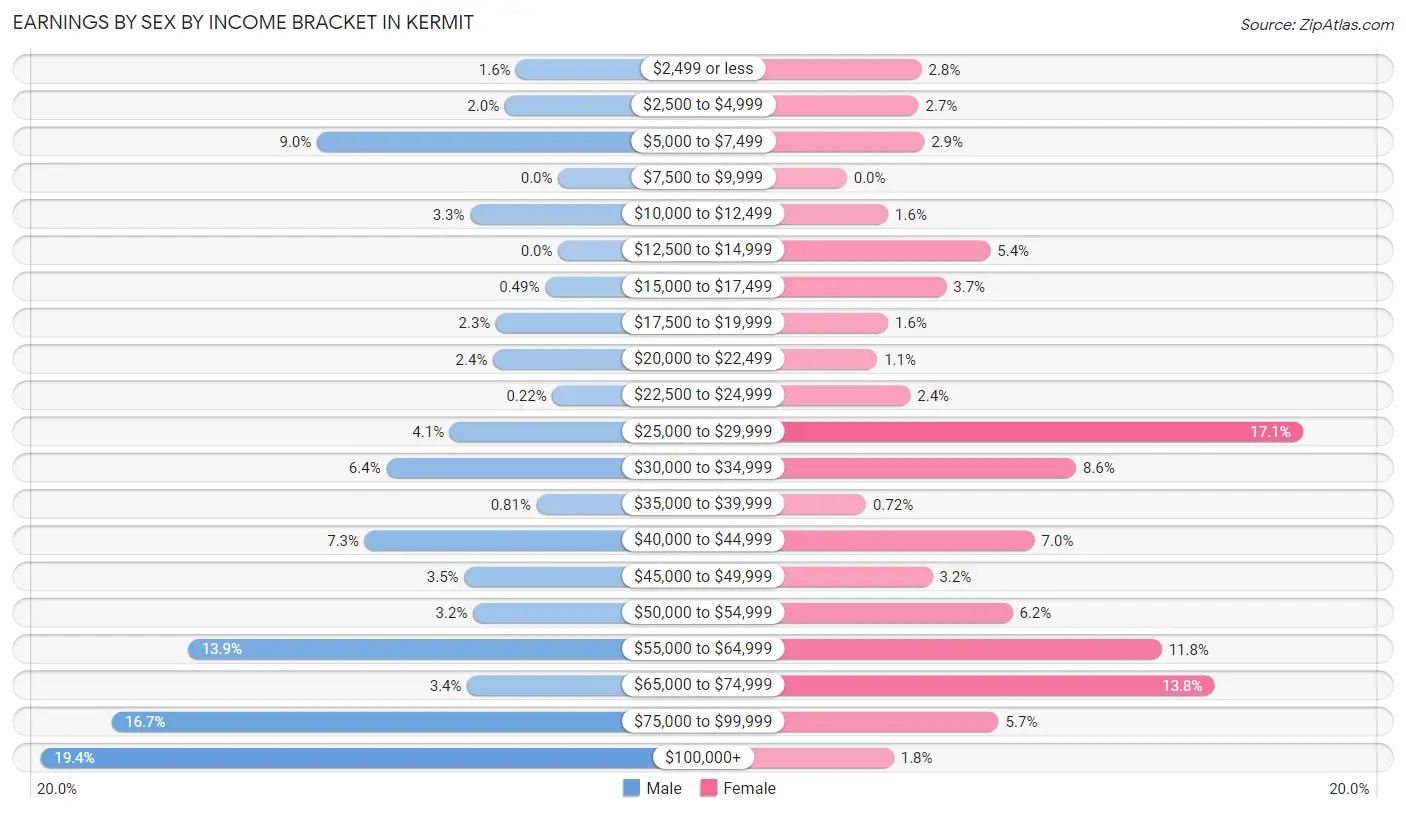
Earnings by Sex by Income Bracket in Kermit
The most common earnings brackets in Kermit are $100,000+ for men (358 | 19.4%) and $25,000 to $29,999 for women (165 | 17.1%).
| Income | Male | Female |
| $2,499 or less | 29 (1.6%) | 27 (2.8%) |
| $2,500 to $4,999 | 37 (2.0%) | 26 (2.7%) |
| $5,000 to $7,499 | 167 (9.0%) | 28 (2.9%) |
| $7,500 to $9,999 | 0 (0.0%) | 0 (0.0%) |
| $10,000 to $12,499 | 61 (3.3%) | 15 (1.5%) |
| $12,500 to $14,999 | 0 (0.0%) | 52 (5.4%) |
| $15,000 to $17,499 | 9 (0.5%) | 36 (3.7%) |
| $17,500 to $19,999 | 43 (2.3%) | 15 (1.5%) |
| $20,000 to $22,499 | 45 (2.4%) | 11 (1.1%) |
| $22,500 to $24,999 | 4 (0.2%) | 23 (2.4%) |
| $25,000 to $29,999 | 75 (4.1%) | 165 (17.1%) |
| $30,000 to $34,999 | 119 (6.4%) | 83 (8.6%) |
| $35,000 to $39,999 | 15 (0.8%) | 7 (0.7%) |
| $40,000 to $44,999 | 134 (7.2%) | 68 (7.0%) |
| $45,000 to $49,999 | 65 (3.5%) | 31 (3.2%) |
| $50,000 to $54,999 | 59 (3.2%) | 60 (6.2%) |
| $55,000 to $64,999 | 256 (13.9%) | 114 (11.8%) |
| $65,000 to $74,999 | 63 (3.4%) | 133 (13.8%) |
| $75,000 to $99,999 | 309 (16.7%) | 55 (5.7%) |
| $100,000+ | 358 (19.4%) | 17 (1.8%) |
| Total | 1,848 (100.0%) | 966 (100.0%) |
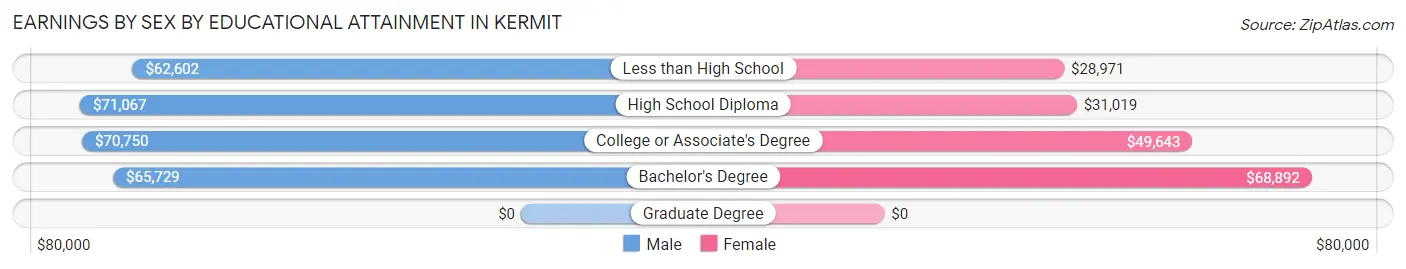
Earnings by Sex by Educational Attainment in Kermit
Average earnings in Kermit are $64,028 for men and $43,125 for women, a difference of 32.7%. Men with an educational attainment of high school diploma enjoy the highest average annual earnings of $71,067, while those with less than high school education earn the least with $62,602. Women with an educational attainment of bachelor's degree earn the most with the average annual earnings of $68,892, while those with less than high school education have the smallest earnings of $28,971.
| Educational Attainment | Male Income | Female Income |
| Less than High School | $62,602 | $28,971 |
| High School Diploma | $71,067 | $31,019 |
| College or Associate's Degree | $70,750 | $49,643 |
| Bachelor's Degree | $65,729 | $68,892 |
| Graduate Degree | - | - |
| Total | $64,028 | $43,125 |
Family Income in Kermit
Family Income Brackets in Kermit
According to the Kermit family income data, there are 447 families falling into the $100,000 to $149,999 income range, which is the most common income bracket and makes up 28.3% of all families. Conversely, the $10,000 to $14,999 income bracket is the least frequent group with only 13 families (0.8%) belonging to this category.
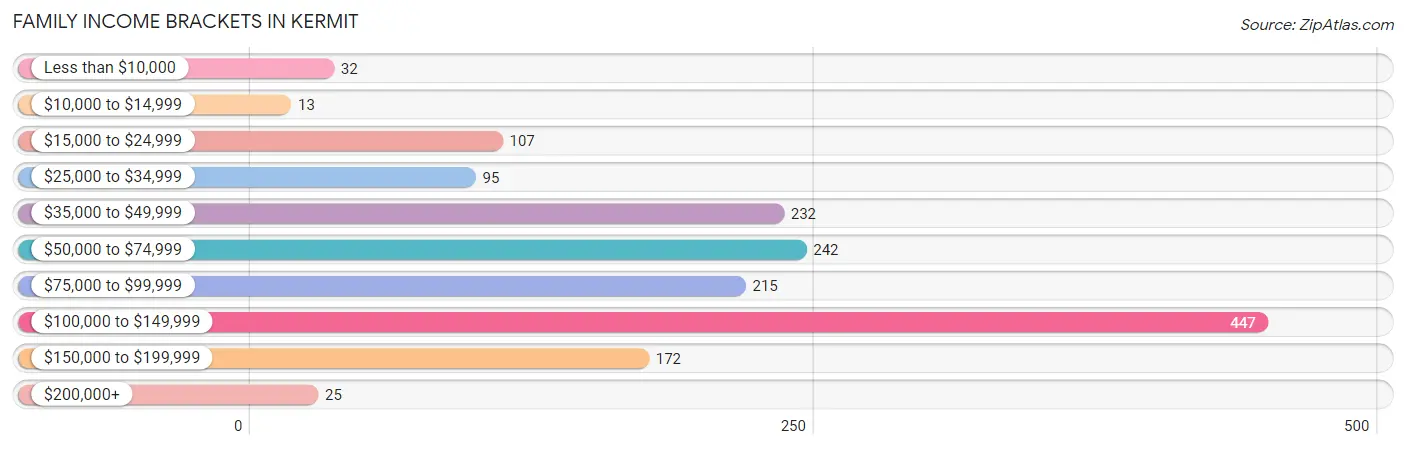
| Income Bracket | # Families | % Families |
| Less than $10,000 | 32 | 2.0% |
| $10,000 to $14,999 | 13 | 0.8% |
| $15,000 to $24,999 | 107 | 6.8% |
| $25,000 to $34,999 | 95 | 6.0% |
| $35,000 to $49,999 | 232 | 14.7% |
| $50,000 to $74,999 | 242 | 15.3% |
| $75,000 to $99,999 | 215 | 13.6% |
| $100,000 to $149,999 | 447 | 28.3% |
| $150,000 to $199,999 | 172 | 10.9% |
| $200,000+ | 25 | 1.6% |
Family Income by Famaliy Size in Kermit
5-person families (209 | 13.2%) account for the highest median family income in Kermit with $127,361 per family, while 3-person families (291 | 18.4%) have the highest median income of $32,830 per family member.
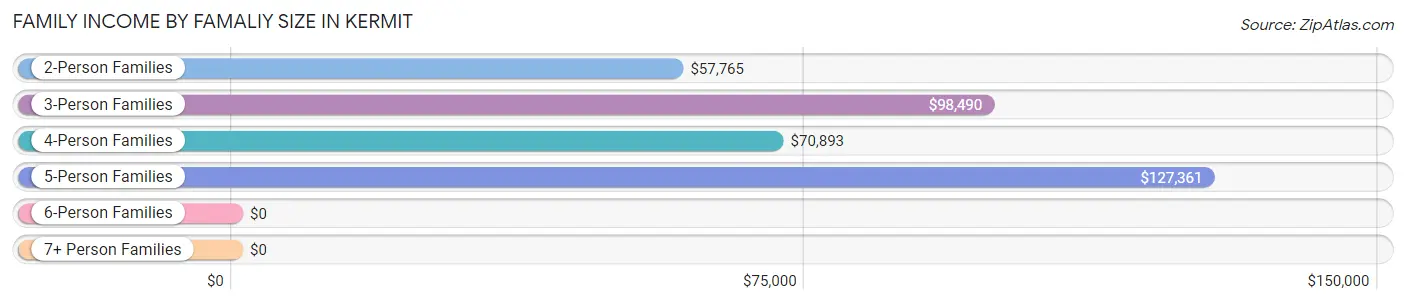
| Income Bracket | # Families | Median Income |
| 2-Person Families | 587 (37.1%) | $57,765 |
| 3-Person Families | 291 (18.4%) | $98,490 |
| 4-Person Families | 339 (21.5%) | $70,893 |
| 5-Person Families | 209 (13.2%) | $127,361 |
| 6-Person Families | 56 (3.5%) | $0 |
| 7+ Person Families | 98 (6.2%) | $0 |
| Total | 1,580 (100.0%) | $85,417 |
Family Income by Number of Earners in Kermit
The median family income in Kermit is $85,417, with families comprising 3+ earners (223) having the highest median family income of $110,563, while families with no earners (168) have the lowest median family income of $20,900, accounting for 14.1% and 10.6% of families, respectively.
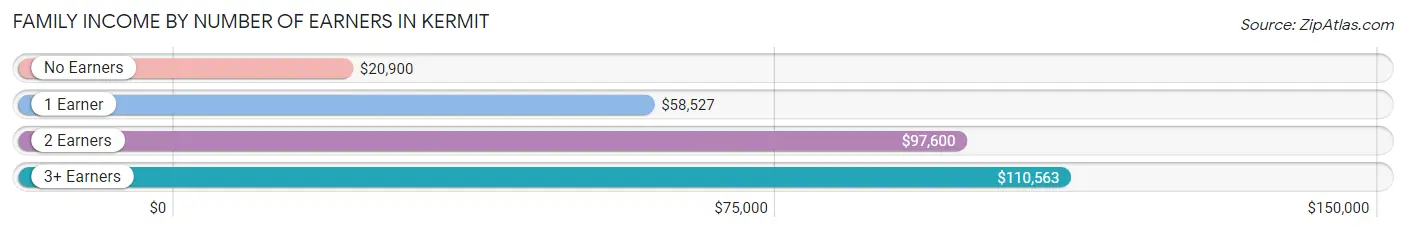
| Number of Earners | # Families | Median Income |
| No Earners | 168 (10.6%) | $20,900 |
| 1 Earner | 515 (32.6%) | $58,527 |
| 2 Earners | 674 (42.7%) | $97,600 |
| 3+ Earners | 223 (14.1%) | $110,563 |
| Total | 1,580 (100.0%) | $85,417 |
Household Income in Kermit
Household Income Brackets in Kermit
With 660 households falling in the category, the $100,000 to $149,999 income range is the most frequent in Kermit, accounting for 31.3% of all households. In contrast, only 15 households (0.7%) fall into the less than $10,000 income bracket, making it the least populous group.
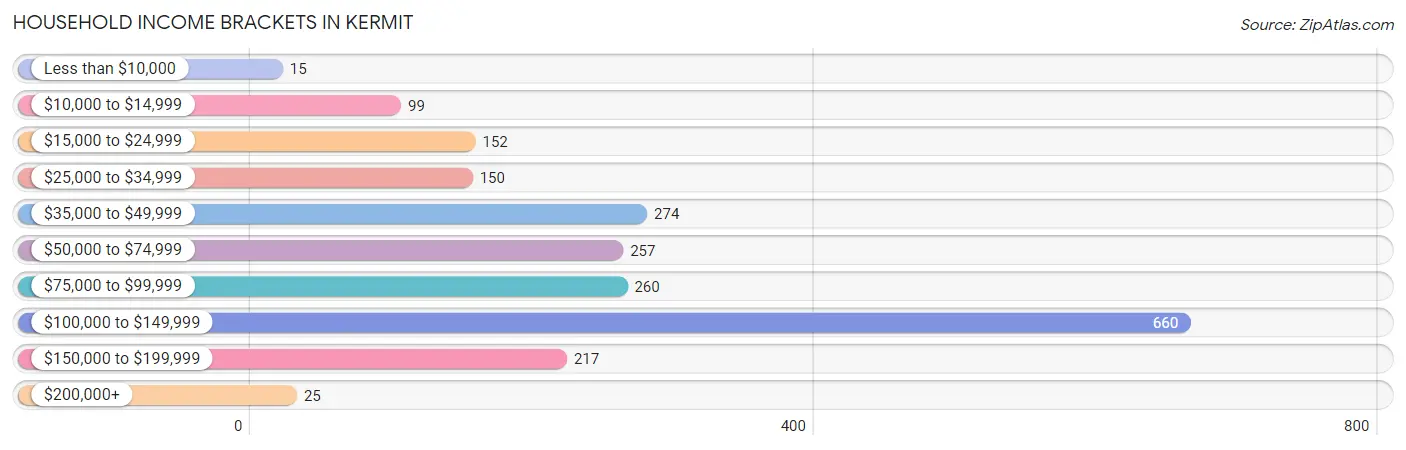
| Income Bracket | # Households | % Households |
| Less than $10,000 | 15 | 0.7% |
| $10,000 to $14,999 | 99 | 4.7% |
| $15,000 to $24,999 | 152 | 7.2% |
| $25,000 to $34,999 | 150 | 7.1% |
| $35,000 to $49,999 | 274 | 13.0% |
| $50,000 to $74,999 | 257 | 12.2% |
| $75,000 to $99,999 | 260 | 12.3% |
| $100,000 to $149,999 | 660 | 31.3% |
| $150,000 to $199,999 | 217 | 10.3% |
| $200,000+ | 25 | 1.2% |
Household Income by Householder Age in Kermit
The median household income in Kermit is $84,931, with the highest median household income of $108,316 found in the 25 to 44 years age bracket for the primary householder. A total of 782 households (37.1%) fall into this category. Meanwhile, the 15 to 24 years age bracket for the primary householder has the lowest median household income of $0, with 87 households (4.1%) in this group.
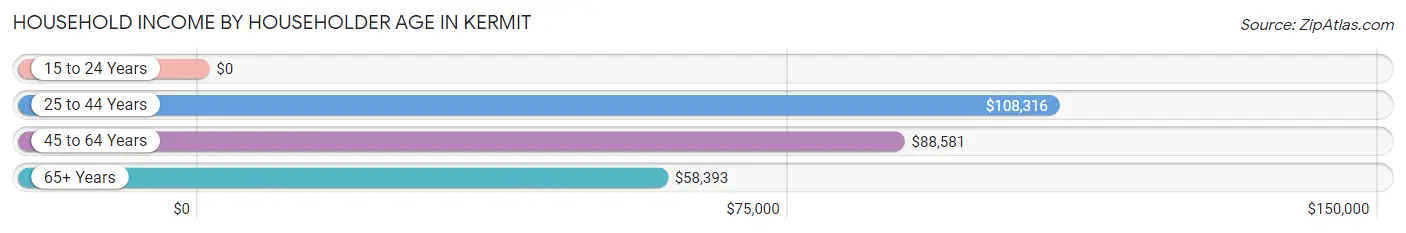
| Income Bracket | # Households | Median Income |
| 15 to 24 Years | 87 (4.1%) | $0 |
| 25 to 44 Years | 782 (37.1%) | $108,316 |
| 45 to 64 Years | 714 (33.8%) | $88,581 |
| 65+ Years | 527 (25.0%) | $58,393 |
| Total | 2,110 (100.0%) | $84,931 |
Poverty in Kermit
Income Below Poverty by Sex and Age in Kermit
With 13.0% poverty level for males and 14.5% for females among the residents of Kermit, 15 year old males and 12 to 14 year old females are the most vulnerable to poverty, with 44 males (67.7%) and 57 females (79.2%) in their respective age groups living below the poverty level.
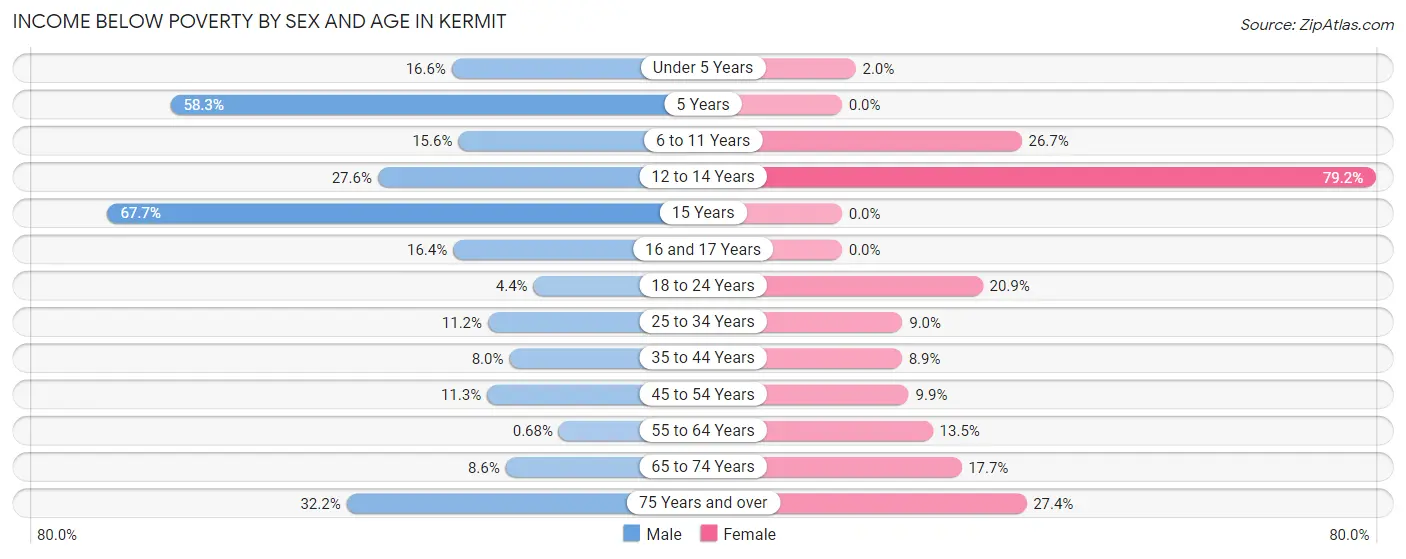
| Age Bracket | Male | Female |
| Under 5 Years | 32 (16.6%) | 5 (2.0%) |
| 5 Years | 35 (58.3%) | 0 (0.0%) |
| 6 to 11 Years | 49 (15.6%) | 75 (26.7%) |
| 12 to 14 Years | 35 (27.6%) | 57 (79.2%) |
| 15 Years | 44 (67.7%) | 0 (0.0%) |
| 16 and 17 Years | 29 (16.4%) | 0 (0.0%) |
| 18 to 24 Years | 13 (4.4%) | 70 (20.9%) |
| 25 to 34 Years | 38 (11.2%) | 23 (9.0%) |
| 35 to 44 Years | 42 (8.0%) | 38 (8.9%) |
| 45 to 54 Years | 33 (11.3%) | 28 (9.9%) |
| 55 to 64 Years | 2 (0.7%) | 39 (13.5%) |
| 65 to 74 Years | 29 (8.6%) | 64 (17.7%) |
| 75 Years and over | 19 (32.2%) | 23 (27.4%) |
| Total | 400 (13.0%) | 422 (14.5%) |
Income Above Poverty by Sex and Age in Kermit
According to the poverty statistics in Kermit, males aged 55 to 64 years and females aged 5 years are the age groups that are most secure financially, with 99.3% of males and 100.0% of females in these age groups living above the poverty line.
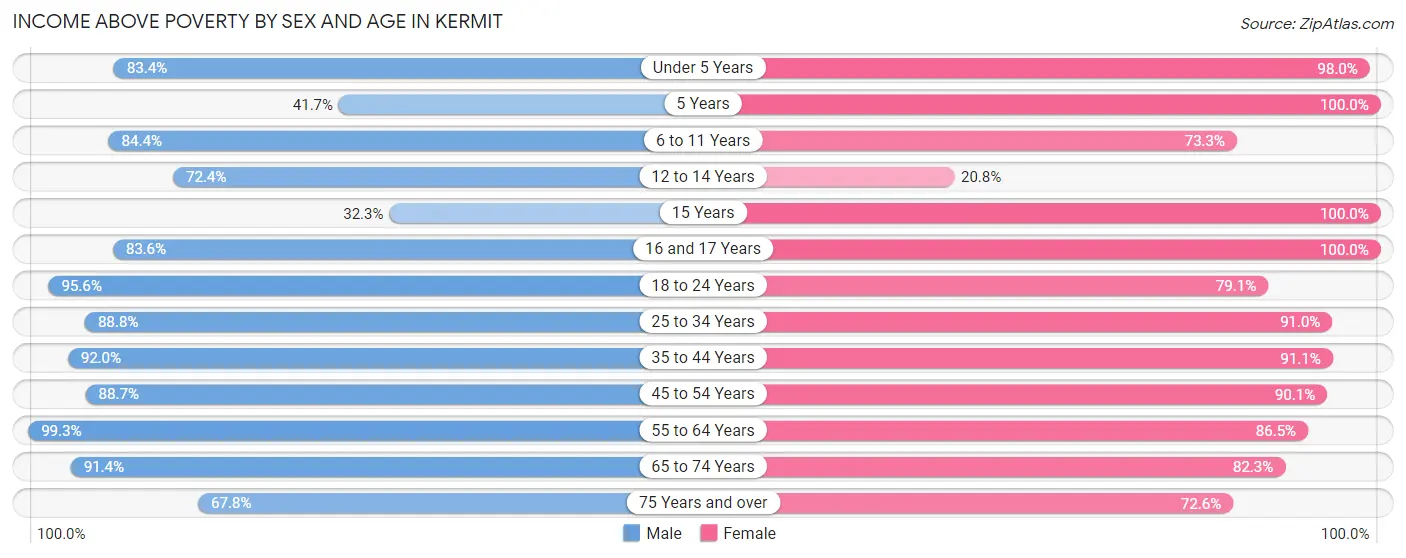
| Age Bracket | Male | Female |
| Under 5 Years | 161 (83.4%) | 240 (98.0%) |
| 5 Years | 25 (41.7%) | 136 (100.0%) |
| 6 to 11 Years | 265 (84.4%) | 206 (73.3%) |
| 12 to 14 Years | 92 (72.4%) | 15 (20.8%) |
| 15 Years | 21 (32.3%) | 76 (100.0%) |
| 16 and 17 Years | 148 (83.6%) | 65 (100.0%) |
| 18 to 24 Years | 280 (95.6%) | 265 (79.1%) |
| 25 to 34 Years | 301 (88.8%) | 233 (91.0%) |
| 35 to 44 Years | 481 (92.0%) | 389 (91.1%) |
| 45 to 54 Years | 258 (88.7%) | 254 (90.1%) |
| 55 to 64 Years | 294 (99.3%) | 250 (86.5%) |
| 65 to 74 Years | 309 (91.4%) | 297 (82.3%) |
| 75 Years and over | 40 (67.8%) | 61 (72.6%) |
| Total | 2,675 (87.0%) | 2,487 (85.5%) |
Income Below Poverty Among Married-Couple Families in Kermit
The poverty statistics for married-couple families in Kermit show that 6.9% or 82 of the total 1,183 families live below the poverty line. Families with 3 or 4 children have the highest poverty rate of 27.0%, comprising of 24 families. On the other hand, families with no children have the lowest poverty rate of 2.7%, which includes 15 families.
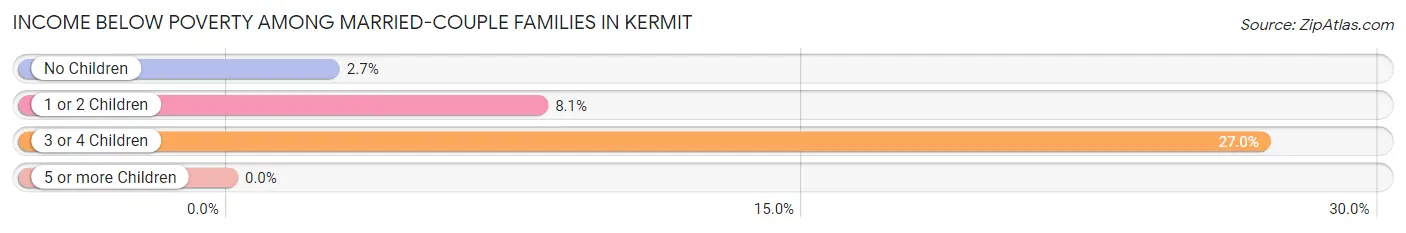
| Children | Above Poverty | Below Poverty |
| No Children | 548 (97.3%) | 15 (2.7%) |
| 1 or 2 Children | 488 (91.9%) | 43 (8.1%) |
| 3 or 4 Children | 65 (73.0%) | 24 (27.0%) |
| 5 or more Children | 0 (0.0%) | 0 (0.0%) |
| Total | 1,101 (93.1%) | 82 (6.9%) |
Income Below Poverty Among Single-Parent Households in Kermit
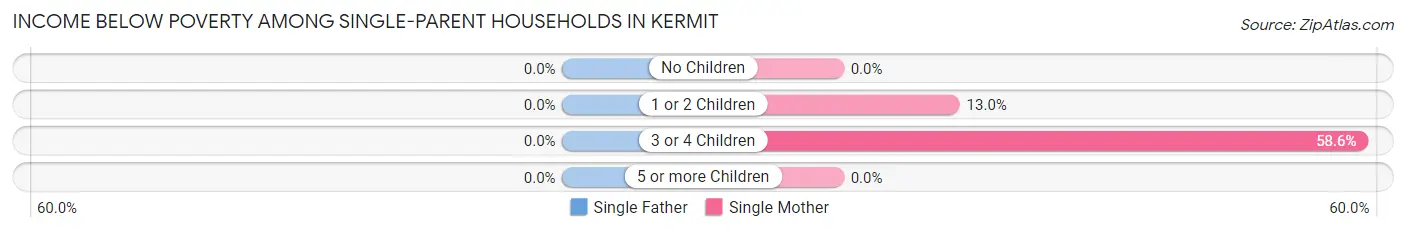
| Children | Single Father | Single Mother |
| No Children | 0 (0.0%) | 0 (0.0%) |
| 1 or 2 Children | 0 (0.0%) | 14 (13.0%) |
| 3 or 4 Children | 0 (0.0%) | 68 (58.6%) |
| 5 or more Children | 0 (0.0%) | 0 (0.0%) |
| Total | 0 (0.0%) | 82 (29.2%) |
Income Below Poverty Among Married-Couple vs Single-Parent Households in Kermit
The poverty data for Kermit shows that 82 of the married-couple family households (6.9%) and 82 of the single-parent households (20.6%) are living below the poverty level. Within the married-couple family households, those with 3 or 4 children have the highest poverty rate, with 24 households (27.0%) falling below the poverty line. Among the single-parent households, those with 3 or 4 children have the highest poverty rate, with 68 household (58.6%) living below poverty.
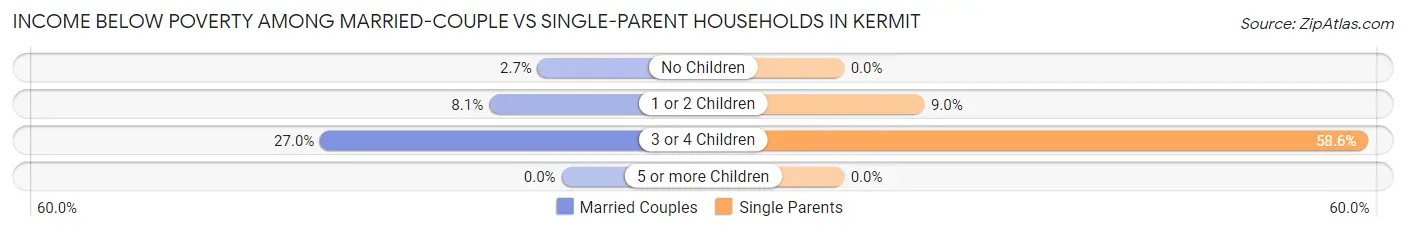
| Children | Married-Couple Families | Single-Parent Households |
| No Children | 15 (2.7%) | 0 (0.0%) |
| 1 or 2 Children | 43 (8.1%) | 14 (9.0%) |
| 3 or 4 Children | 24 (27.0%) | 68 (58.6%) |
| 5 or more Children | 0 (0.0%) | 0 (0.0%) |
| Total | 82 (6.9%) | 82 (20.6%) |
Race in Kermit
The most populous races in Kermit are Hispanic or Latino (4,306 | 72.0%), White / Caucasian (3,532 | 59.0%), and Two or more Races (1,149 | 19.2%).
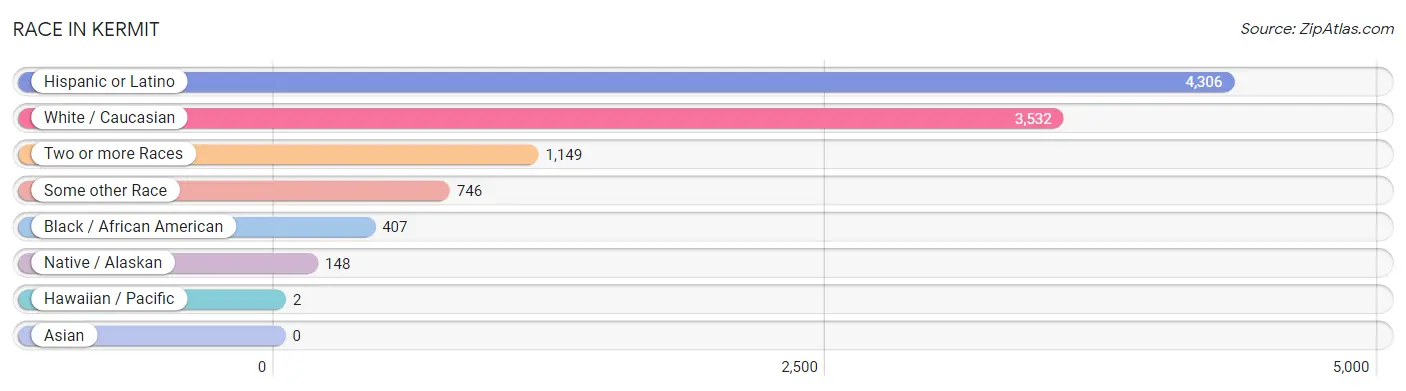
| Race | # Population | % Population |
| Asian | 0 | 0.0% |
| Black / African American | 407 | 6.8% |
| Hawaiian / Pacific | 2 | 0.0% |
| Hispanic or Latino | 4,306 | 72.0% |
| Native / Alaskan | 148 | 2.5% |
| White / Caucasian | 3,532 | 59.0% |
| Two or more Races | 1,149 | 19.2% |
| Some other Race | 746 | 12.5% |
| Total | 5,984 | 100.0% |
Ancestry in Kermit
The most populous ancestries reported in Kermit are Mexican (3,939 | 65.8%), Irish (265 | 4.4%), American (241 | 4.0%), English (189 | 3.2%), and German (134 | 2.2%), together accounting for 79.7% of all Kermit residents.
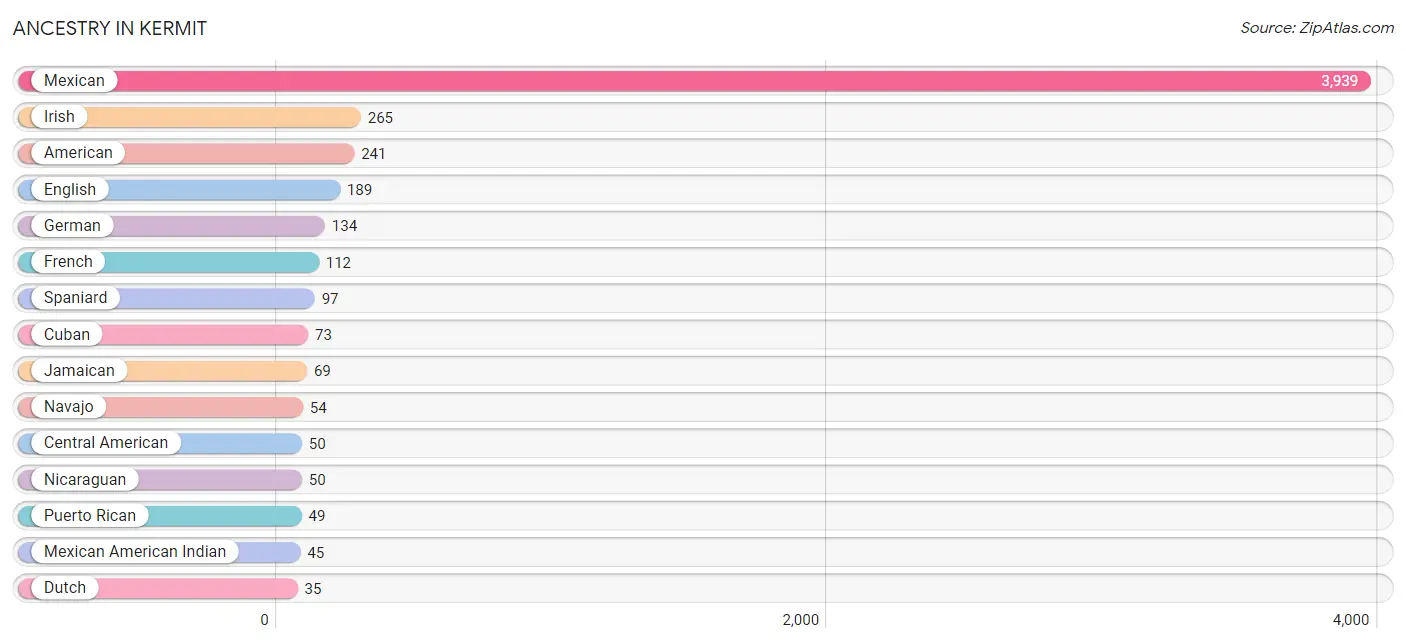
| Ancestry | # Population | % Population |
| American | 241 | 4.0% |
| Apache | 8 | 0.1% |
| British | 15 | 0.3% |
| Central American | 50 | 0.8% |
| Cuban | 73 | 1.2% |
| Dutch | 35 | 0.6% |
| English | 189 | 3.2% |
| European | 25 | 0.4% |
| French | 112 | 1.9% |
| German | 134 | 2.2% |
| Guamanian / Chamorro | 2 | 0.0% |
| Irish | 265 | 4.4% |
| Jamaican | 69 | 1.1% |
| Mexican | 3,939 | 65.8% |
| Mexican American Indian | 45 | 0.7% |
| Navajo | 54 | 0.9% |
| Nicaraguan | 50 | 0.8% |
| Norwegian | 10 | 0.2% |
| Polish | 4 | 0.1% |
| Puerto Rican | 49 | 0.8% |
| Scotch-Irish | 10 | 0.2% |
| Scottish | 15 | 0.3% |
| Spaniard | 97 | 1.6% |
| Welsh | 21 | 0.4% | View All 24 Rows |
Immigrants in Kermit
The most numerous immigrant groups reported in Kermit came from Latin America (962 | 16.1%), Central America (945 | 15.8%), Mexico (921 | 15.4%), Nicaragua (24 | 0.4%), and Caribbean (17 | 0.3%), together accounting for 47.9% of all Kermit residents.
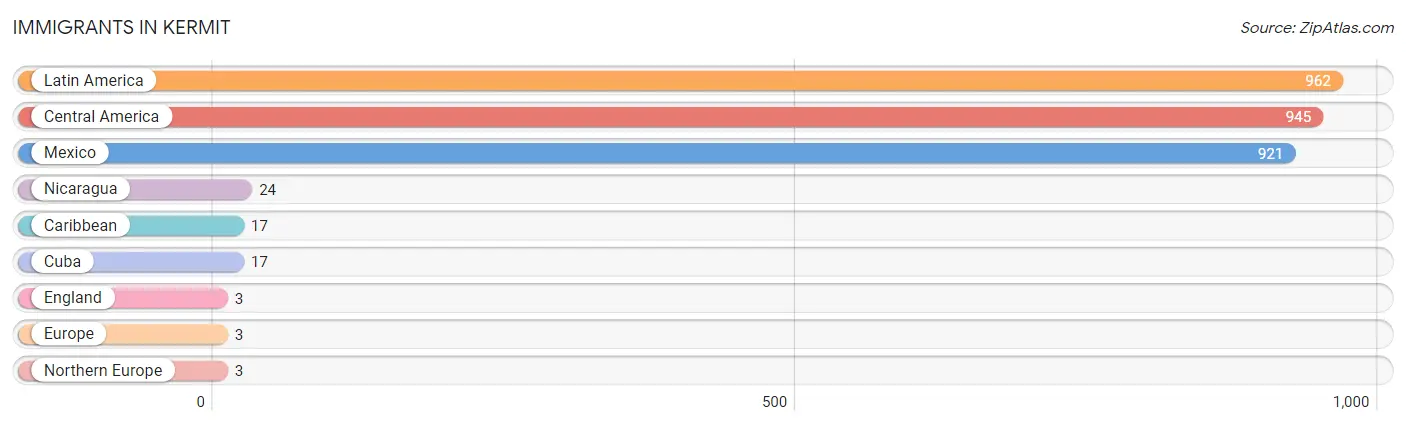
| Immigration Origin | # Population | % Population |
| Caribbean | 17 | 0.3% |
| Central America | 945 | 15.8% |
| Cuba | 17 | 0.3% |
| England | 3 | 0.1% |
| Europe | 3 | 0.1% |
| Latin America | 962 | 16.1% |
| Mexico | 921 | 15.4% |
| Nicaragua | 24 | 0.4% |
| Northern Europe | 3 | 0.1% | View All 9 Rows |
Sex and Age in Kermit
Sex and Age in Kermit
The most populous age groups in Kermit are 15 to 19 Years (313 | 10.2%) for men and 15 to 19 Years (348 | 12.0%) for women.
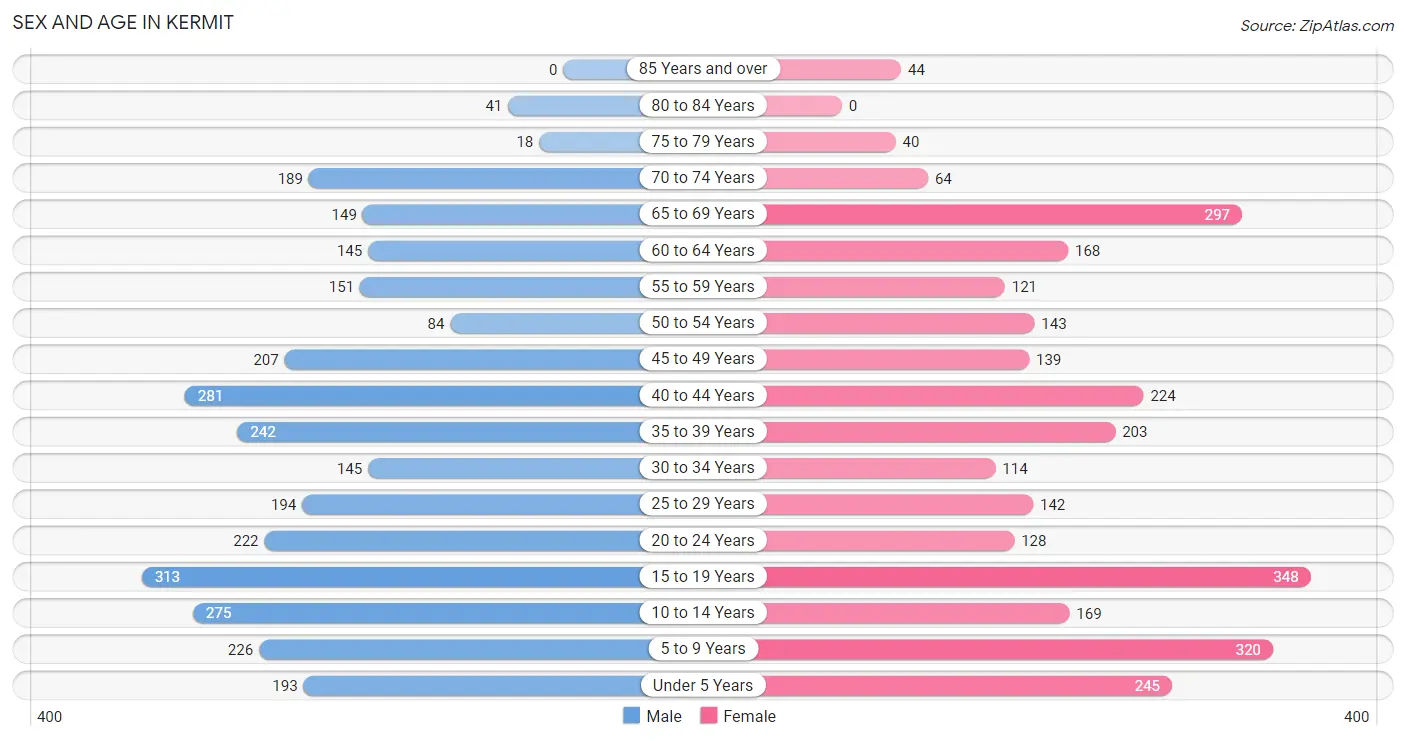
| Age Bracket | Male | Female |
| Under 5 Years | 193 (6.3%) | 245 (8.4%) |
| 5 to 9 Years | 226 (7.3%) | 320 (11.0%) |
| 10 to 14 Years | 275 (8.9%) | 169 (5.8%) |
| 15 to 19 Years | 313 (10.2%) | 348 (12.0%) |
| 20 to 24 Years | 222 (7.2%) | 128 (4.4%) |
| 25 to 29 Years | 194 (6.3%) | 142 (4.9%) |
| 30 to 34 Years | 145 (4.7%) | 114 (3.9%) |
| 35 to 39 Years | 242 (7.9%) | 203 (7.0%) |
| 40 to 44 Years | 281 (9.1%) | 224 (7.7%) |
| 45 to 49 Years | 207 (6.7%) | 139 (4.8%) |
| 50 to 54 Years | 84 (2.7%) | 143 (4.9%) |
| 55 to 59 Years | 151 (4.9%) | 121 (4.2%) |
| 60 to 64 Years | 145 (4.7%) | 168 (5.8%) |
| 65 to 69 Years | 149 (4.9%) | 297 (10.2%) |
| 70 to 74 Years | 189 (6.1%) | 64 (2.2%) |
| 75 to 79 Years | 18 (0.6%) | 40 (1.4%) |
| 80 to 84 Years | 41 (1.3%) | 0 (0.0%) |
| 85 Years and over | 0 (0.0%) | 44 (1.5%) |
| Total | 3,075 (100.0%) | 2,909 (100.0%) |
Families and Households in Kermit
Median Family Size in Kermit
The median family size in Kermit is 3.27 persons per family, with single female/mother families (281 | 17.8%) accounting for the largest median family size of 3.63 persons per family. On the other hand, single male/father families (116 | 7.3%) represent the smallest median family size with 2.02 persons per family.
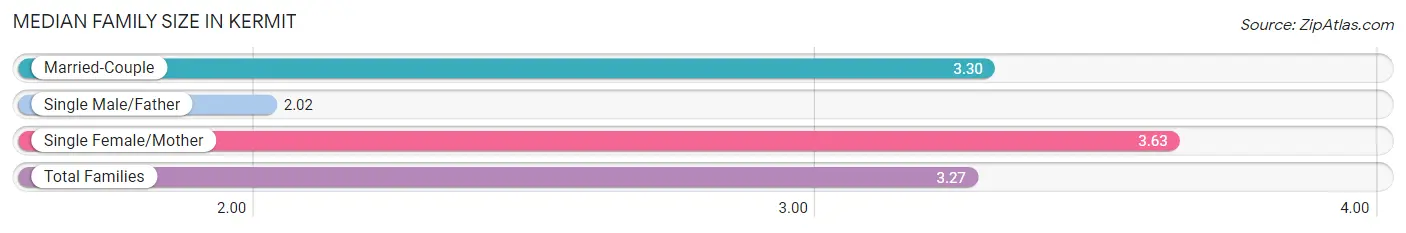
| Family Type | # Families | Family Size |
| Married-Couple | 1,183 (74.9%) | 3.30 |
| Single Male/Father | 116 (7.3%) | 2.02 |
| Single Female/Mother | 281 (17.8%) | 3.63 |
| Total Families | 1,580 (100.0%) | 3.27 |
Median Household Size in Kermit
The median household size in Kermit is 2.84 persons per household, with single female/mother households (281 | 13.3%) accounting for the largest median household size of 4.33 persons per household. non-family households (530 | 25.1%) represent the smallest median household size with 1.04 persons per household.
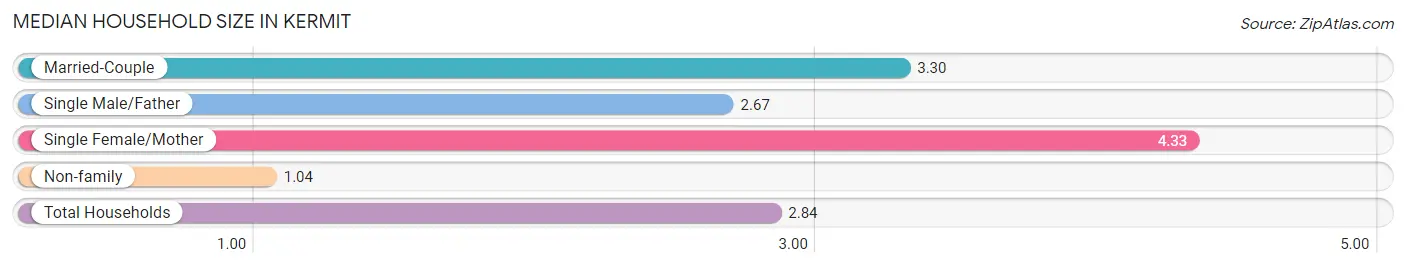
| Household Type | # Households | Household Size |
| Married-Couple | 1,183 (56.1%) | 3.30 |
| Single Male/Father | 116 (5.5%) | 2.67 |
| Single Female/Mother | 281 (13.3%) | 4.33 |
| Non-family | 530 (25.1%) | 1.04 |
| Total Households | 2,110 (100.0%) | 2.84 |
Household Size by Marriage Status in Kermit
Out of a total of 2,110 households in Kermit, 1,580 (74.9%) are family households, while 530 (25.1%) are nonfamily households. The most numerous type of family households are 2-person households, comprising 557, and the most common type of nonfamily households are 1-person households, comprising 494.
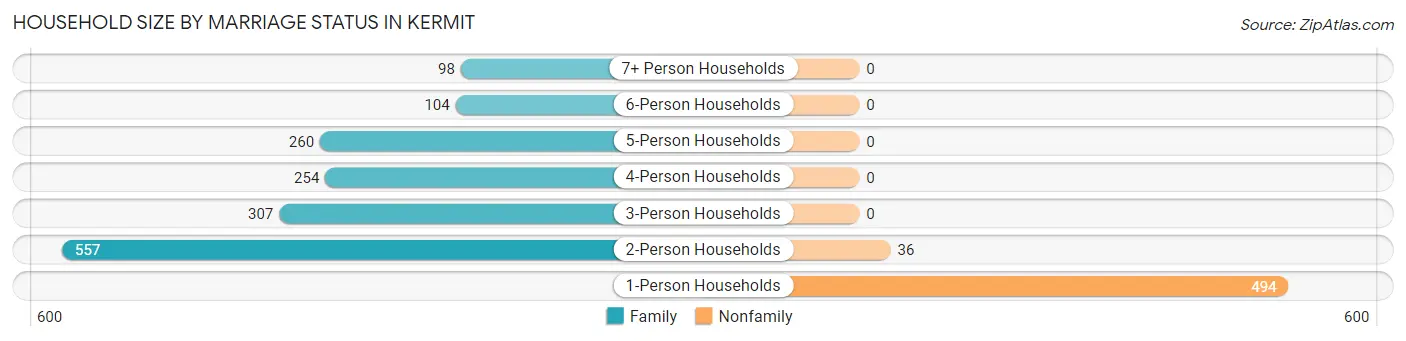
| Household Size | Family Households | Nonfamily Households |
| 1-Person Households | - | 494 (23.4%) |
| 2-Person Households | 557 (26.4%) | 36 (1.7%) |
| 3-Person Households | 307 (14.5%) | 0 (0.0%) |
| 4-Person Households | 254 (12.0%) | 0 (0.0%) |
| 5-Person Households | 260 (12.3%) | 0 (0.0%) |
| 6-Person Households | 104 (4.9%) | 0 (0.0%) |
| 7+ Person Households | 98 (4.6%) | 0 (0.0%) |
| Total | 1,580 (74.9%) | 530 (25.1%) |
Female Fertility in Kermit
Fertility by Age in Kermit
Average fertility rate in Kermit is 77.0 births per 1,000 women. Women in the age bracket of 20 to 34 years have the highest fertility rate with 221.0 births per 1,000 women. Women in the age bracket of 20 to 34 years acount for 84.2% of all women with births.
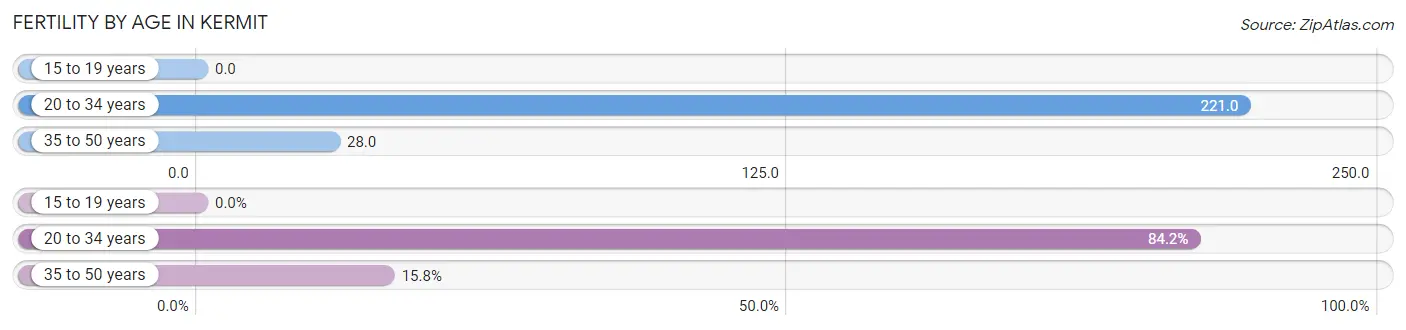
| Age Bracket | Women with Births | Births / 1,000 Women |
| 15 to 19 years | 0 (0.0%) | 0.0 |
| 20 to 34 years | 85 (84.2%) | 221.0 |
| 35 to 50 years | 16 (15.8%) | 28.0 |
| Total | 101 (100.0%) | 77.0 |
Fertility by Age by Marriage Status in Kermit
21.8% of women with births (101) in Kermit are married. The highest percentage of unmarried women with births falls into 20 to 34 years age bracket with 92.9% of them unmarried at the time of birth, while the lowest percentage of unmarried women with births belong to 35 to 50 years age bracket with 0.0% of them unmarried.
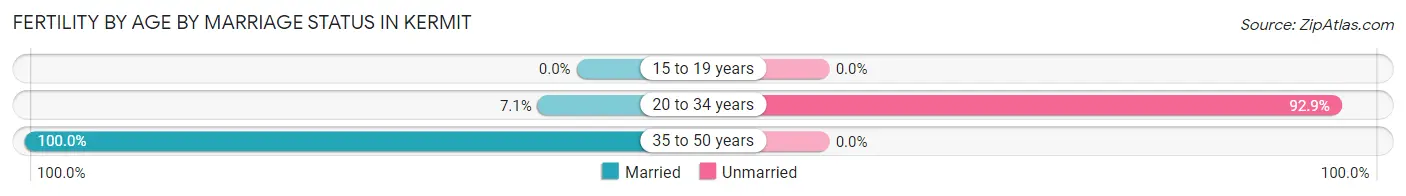
| Age Bracket | Married | Unmarried |
| 15 to 19 years | 0 (0.0%) | 0 (0.0%) |
| 20 to 34 years | 6 (7.1%) | 79 (92.9%) |
| 35 to 50 years | 16 (100.0%) | 0 (0.0%) |
| Total | 22 (21.8%) | 79 (78.2%) |
Fertility by Education in Kermit
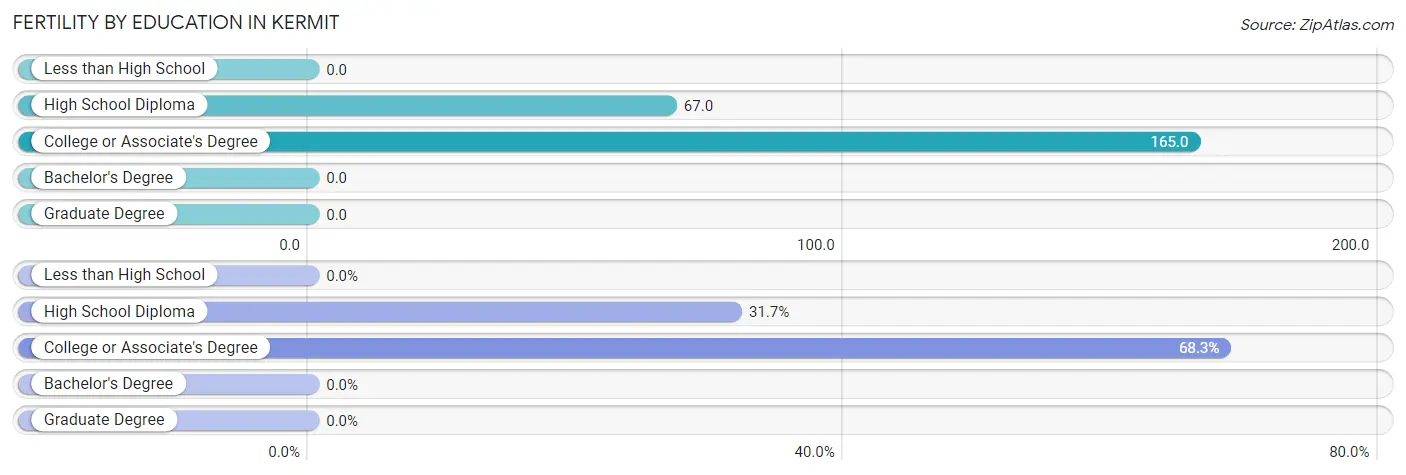
| Educational Attainment | Women with Births | Births / 1,000 Women |
| Less than High School | 0 (0.0%) | 0.0 |
| High School Diploma | 32 (31.7%) | 67.0 |
| College or Associate's Degree | 69 (68.3%) | 165.0 |
| Bachelor's Degree | 0 (0.0%) | 0.0 |
| Graduate Degree | 0 (0.0%) | 0.0 |
| Total | 101 (100.0%) | 77.0 |
Fertility by Education by Marriage Status in Kermit
78.2% of women with births in Kermit are unmarried. Women with the educational attainment of high school diploma are most likely to be married with 50.0% of them married at childbirth, while women with the educational attainment of college or associate's degree are least likely to be married with 91.3% of them unmarried at childbirth.
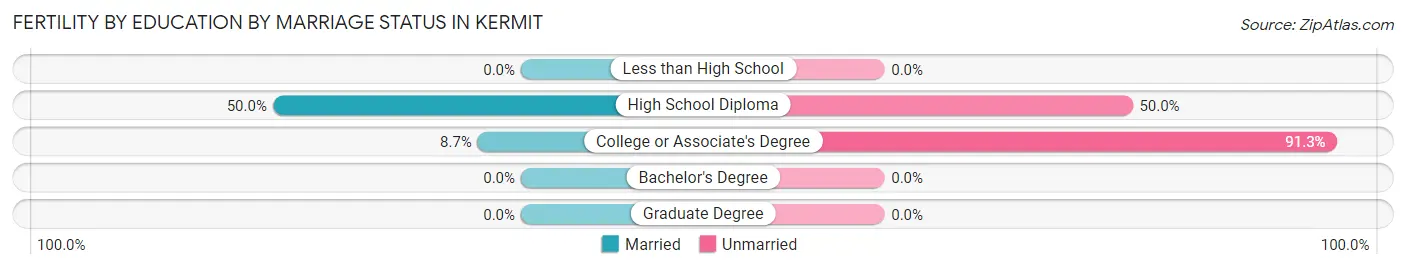
| Educational Attainment | Married | Unmarried |
| Less than High School | 0 (0.0%) | 0 (0.0%) |
| High School Diploma | 16 (50.0%) | 16 (50.0%) |
| College or Associate's Degree | 6 (8.7%) | 63 (91.3%) |
| Bachelor's Degree | 0 (0.0%) | 0 (0.0%) |
| Graduate Degree | 0 (0.0%) | 0 (0.0%) |
| Total | 22 (21.8%) | 79 (78.2%) |
Employment Characteristics in Kermit
Employment by Class of Employer in Kermit
Among the 2,648 employed individuals in Kermit, private company employees (1,731 | 65.4%), local government employees (405 | 15.3%), and federal government employees (162 | 6.1%) make up the most common classes of employment.
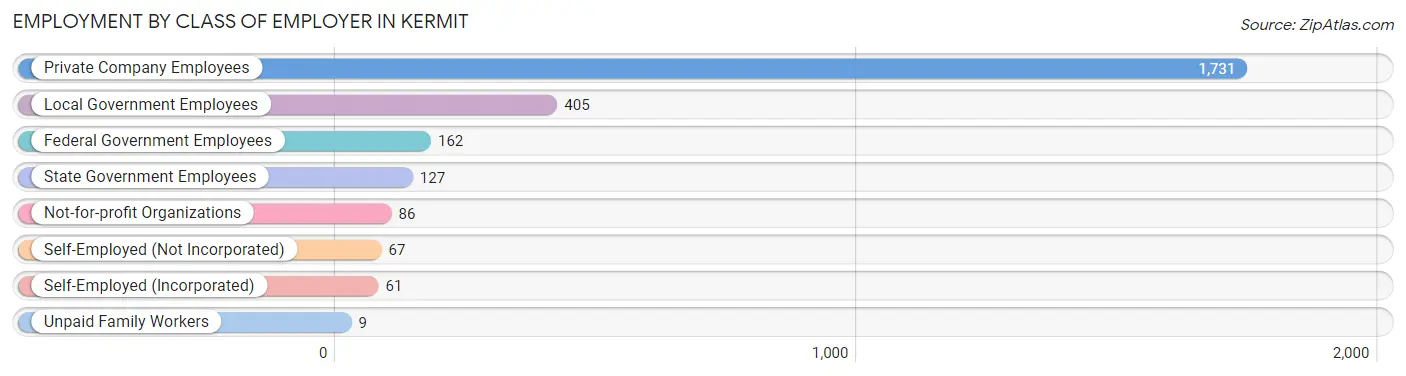
| Employer Class | # Employees | % Employees |
| Private Company Employees | 1,731 | 65.4% |
| Self-Employed (Incorporated) | 61 | 2.3% |
| Self-Employed (Not Incorporated) | 67 | 2.5% |
| Not-for-profit Organizations | 86 | 3.3% |
| Local Government Employees | 405 | 15.3% |
| State Government Employees | 127 | 4.8% |
| Federal Government Employees | 162 | 6.1% |
| Unpaid Family Workers | 9 | 0.3% |
| Total | 2,648 | 100.0% |
Employment Status by Age in Kermit
According to the labor force statistics for Kermit, out of the total population over 16 years of age (4,415), 61.8% or 2,728 individuals are in the labor force, with 2.9% or 79 of them unemployed. The age group with the highest labor force participation rate is 25 to 29 years, with 91.7% or 308 individuals in the labor force. Within the labor force, the 16 to 19 years age range has the highest percentage of unemployed individuals, with 40.0% or 22 of them being unemployed.
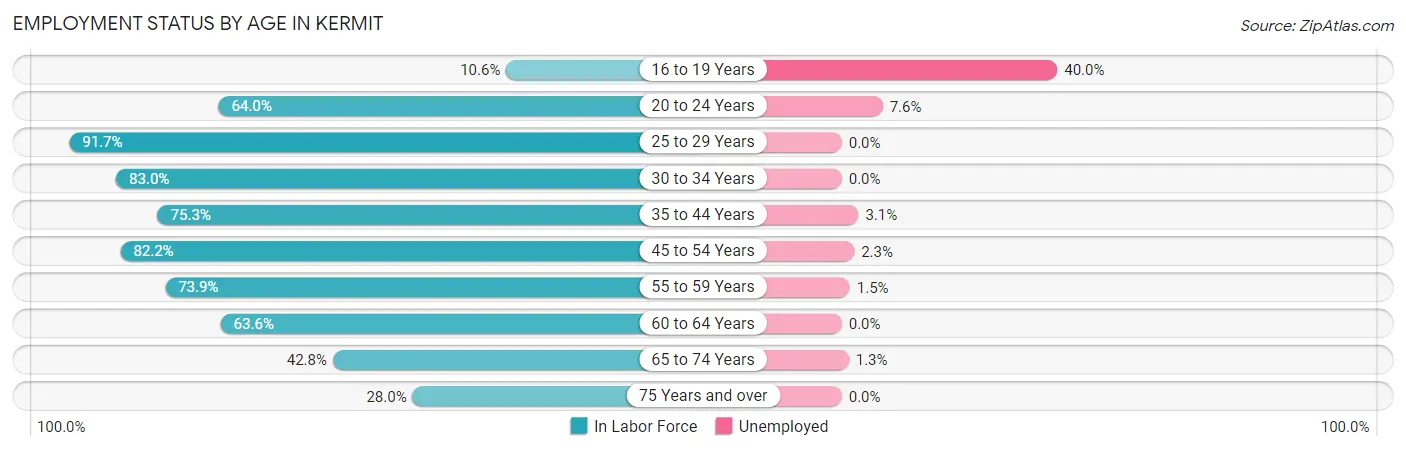
| Age Bracket | In Labor Force | Unemployed |
| 16 to 19 Years | 55 (10.6%) | 22 (40.0%) |
| 20 to 24 Years | 224 (64.0%) | 17 (7.6%) |
| 25 to 29 Years | 308 (91.7%) | 0 (0.0%) |
| 30 to 34 Years | 215 (83.0%) | 0 (0.0%) |
| 35 to 44 Years | 715 (75.3%) | 22 (3.1%) |
| 45 to 54 Years | 471 (82.2%) | 11 (2.3%) |
| 55 to 59 Years | 201 (73.9%) | 3 (1.5%) |
| 60 to 64 Years | 199 (63.6%) | 0 (0.0%) |
| 65 to 74 Years | 299 (42.8%) | 4 (1.3%) |
| 75 Years and over | 40 (28.0%) | 0 (0.0%) |
| Total | 2,728 (61.8%) | 79 (2.9%) |
Employment Status by Educational Attainment in Kermit
According to labor force statistics for Kermit, 78.0% of individuals (2,108) out of the total population between 25 and 64 years of age (2,703) are in the labor force, with 1.7% or 36 of them being unemployed. The group with the highest labor force participation rate are those with the educational attainment of college / associate degree, with 87.0% or 556 individuals in the labor force. Within the labor force, individuals with bachelor's degree or higher education have the highest percentage of unemployment, with 9.4% or 12 of them being unemployed.
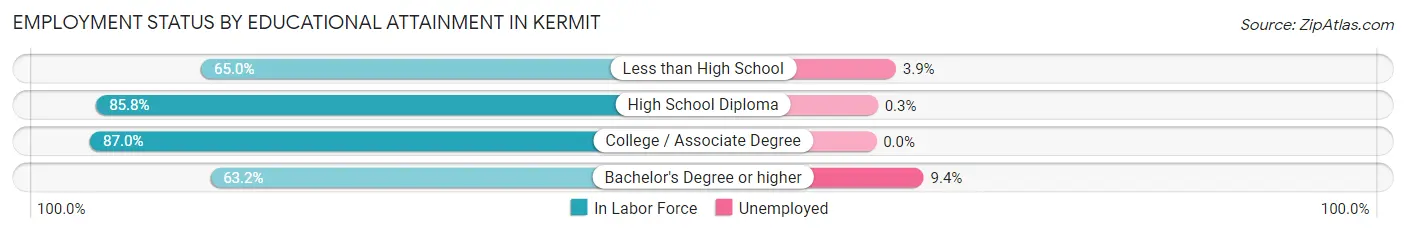
| Educational Attainment | In Labor Force | Unemployed |
| Less than High School | 541 (65.0%) | 32 (3.9%) |
| High School Diploma | 885 (85.8%) | 3 (0.3%) |
| College / Associate Degree | 556 (87.0%) | 0 (0.0%) |
| Bachelor's Degree or higher | 127 (63.2%) | 19 (9.4%) |
| Total | 2,108 (78.0%) | 46 (1.7%) |
Employment Occupations by Sex in Kermit
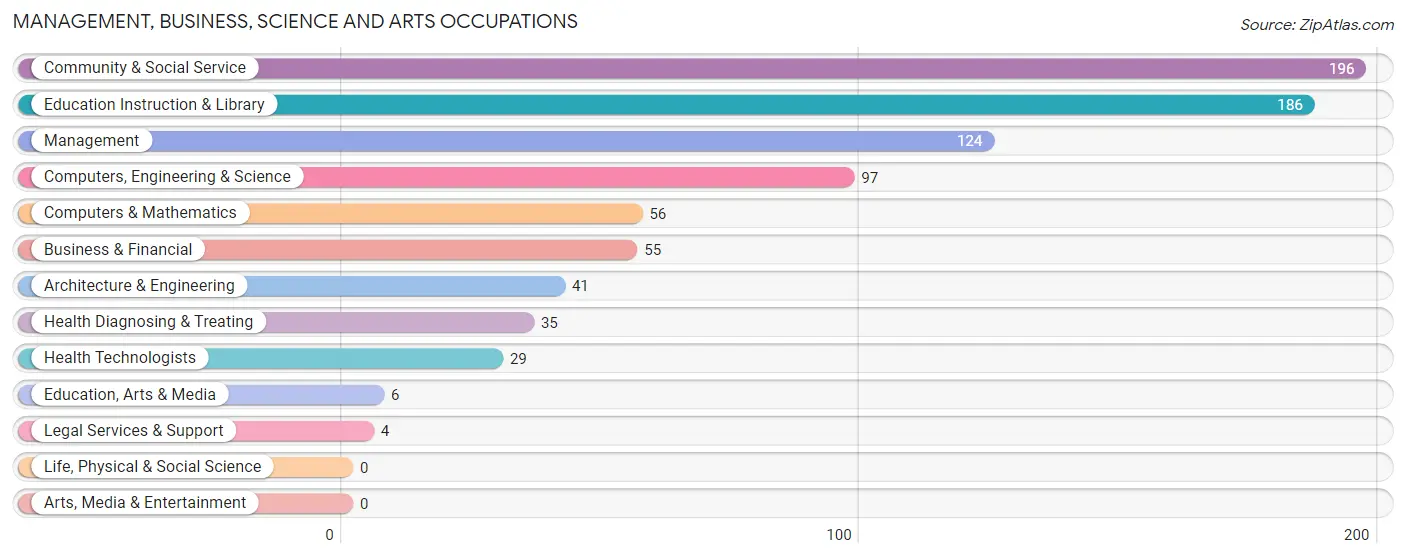
Management, Business, Science and Arts Occupations
The most common Management, Business, Science and Arts occupations in Kermit are Community & Social Service (196 | 7.4%), Education Instruction & Library (186 | 7.0%), Management (124 | 4.7%), Computers, Engineering & Science (97 | 3.7%), and Computers & Mathematics (56 | 2.1%).
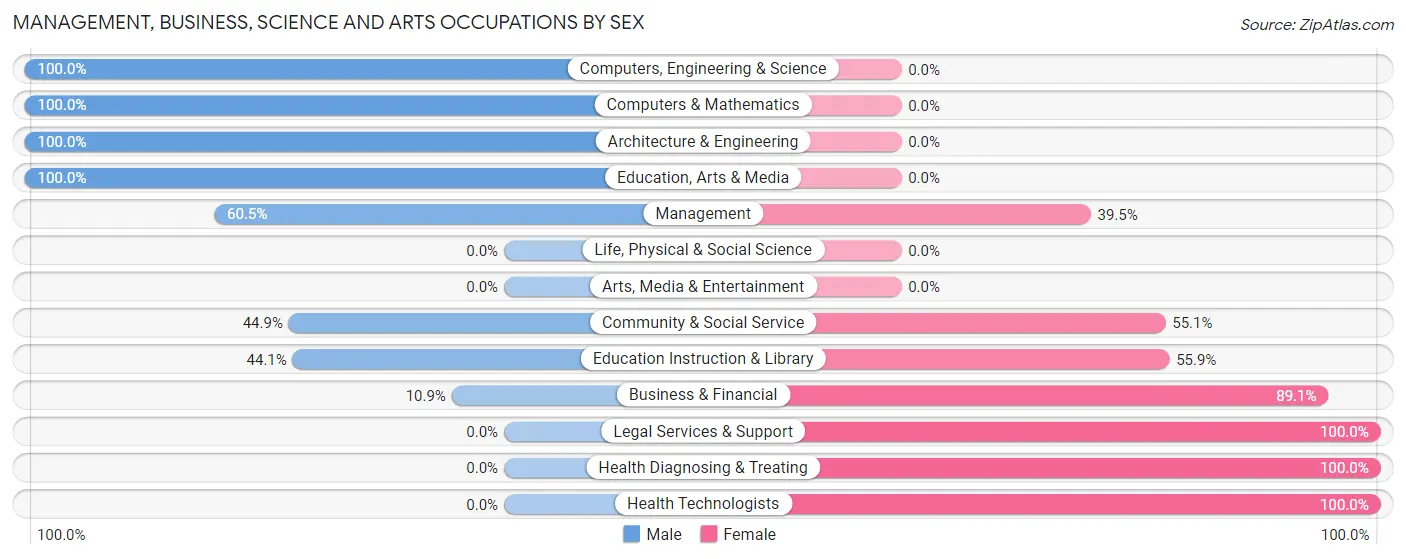
Management, Business, Science and Arts Occupations by Sex
Within the Management, Business, Science and Arts occupations in Kermit, the most male-oriented occupations are Computers, Engineering & Science (100.0%), Computers & Mathematics (100.0%), and Architecture & Engineering (100.0%), while the most female-oriented occupations are Legal Services & Support (100.0%), Health Diagnosing & Treating (100.0%), and Health Technologists (100.0%).
| Occupation | Male | Female |
| Management | 75 (60.5%) | 49 (39.5%) |
| Business & Financial | 6 (10.9%) | 49 (89.1%) |
| Computers, Engineering & Science | 97 (100.0%) | 0 (0.0%) |
| Computers & Mathematics | 56 (100.0%) | 0 (0.0%) |
| Architecture & Engineering | 41 (100.0%) | 0 (0.0%) |
| Life, Physical & Social Science | 0 (0.0%) | 0 (0.0%) |
| Community & Social Service | 88 (44.9%) | 108 (55.1%) |
| Education, Arts & Media | 6 (100.0%) | 0 (0.0%) |
| Legal Services & Support | 0 (0.0%) | 4 (100.0%) |
| Education Instruction & Library | 82 (44.1%) | 104 (55.9%) |
| Arts, Media & Entertainment | 0 (0.0%) | 0 (0.0%) |
| Health Diagnosing & Treating | 0 (0.0%) | 35 (100.0%) |
| Health Technologists | 0 (0.0%) | 29 (100.0%) |
| Total (Category) | 266 (52.5%) | 241 (47.5%) |
| Total (Overall) | 1,758 (66.4%) | 890 (33.6%) |
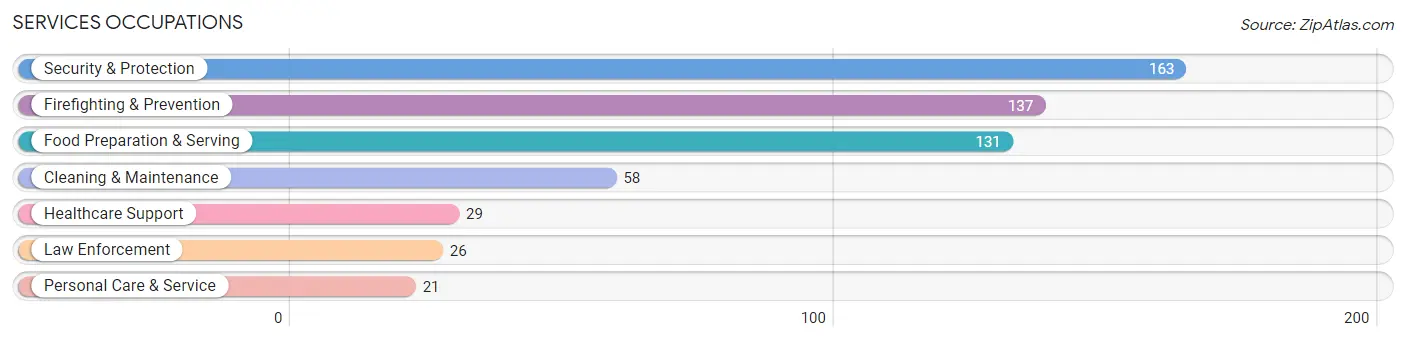
Services Occupations
The most common Services occupations in Kermit are Security & Protection (163 | 6.2%), Firefighting & Prevention (137 | 5.2%), Food Preparation & Serving (131 | 5.0%), Cleaning & Maintenance (58 | 2.2%), and Healthcare Support (29 | 1.1%).
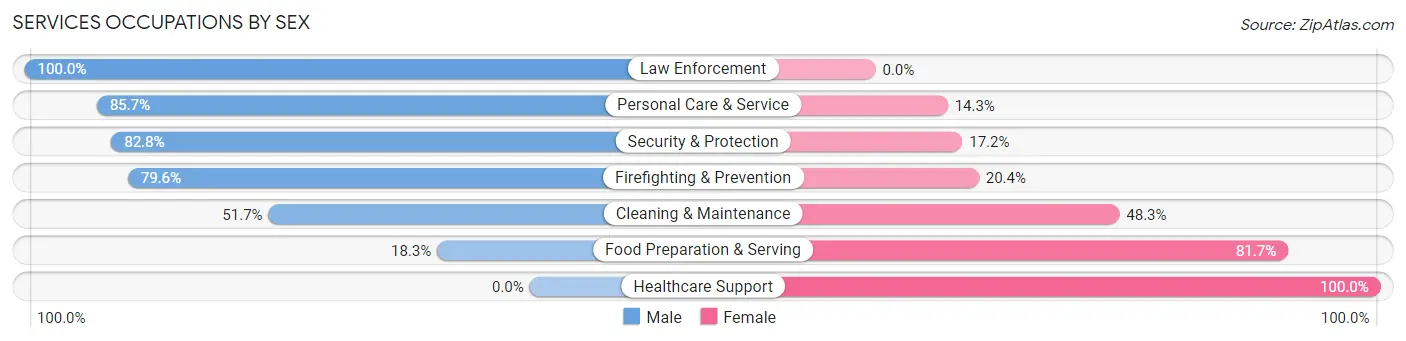
Services Occupations by Sex
Within the Services occupations in Kermit, the most male-oriented occupations are Law Enforcement (100.0%), Personal Care & Service (85.7%), and Security & Protection (82.8%), while the most female-oriented occupations are Healthcare Support (100.0%), Food Preparation & Serving (81.7%), and Cleaning & Maintenance (48.3%).
| Occupation | Male | Female |
| Healthcare Support | 0 (0.0%) | 29 (100.0%) |
| Security & Protection | 135 (82.8%) | 28 (17.2%) |
| Firefighting & Prevention | 109 (79.6%) | 28 (20.4%) |
| Law Enforcement | 26 (100.0%) | 0 (0.0%) |
| Food Preparation & Serving | 24 (18.3%) | 107 (81.7%) |
| Cleaning & Maintenance | 30 (51.7%) | 28 (48.3%) |
| Personal Care & Service | 18 (85.7%) | 3 (14.3%) |
| Total (Category) | 207 (51.5%) | 195 (48.5%) |
| Total (Overall) | 1,758 (66.4%) | 890 (33.6%) |
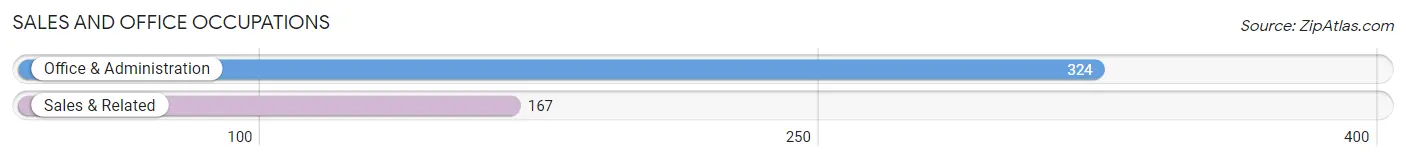
Sales and Office Occupations
The most common Sales and Office occupations in Kermit are Office & Administration (324 | 12.2%), and Sales & Related (167 | 6.3%).
Sales and Office Occupations by Sex
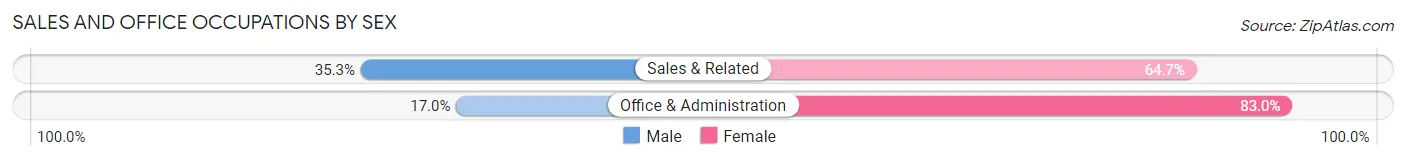
| Occupation | Male | Female |
| Sales & Related | 59 (35.3%) | 108 (64.7%) |
| Office & Administration | 55 (17.0%) | 269 (83.0%) |
| Total (Category) | 114 (23.2%) | 377 (76.8%) |
| Total (Overall) | 1,758 (66.4%) | 890 (33.6%) |
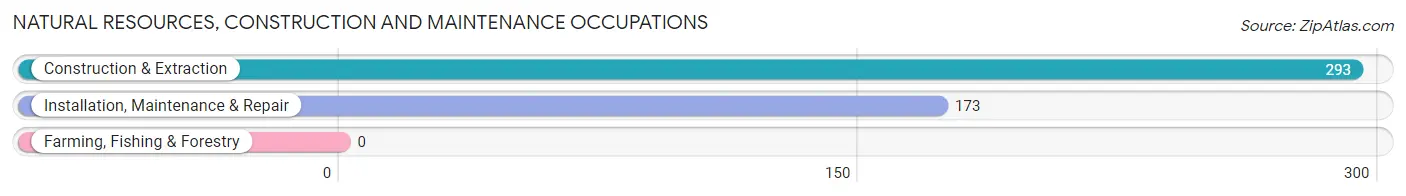
Natural Resources, Construction and Maintenance Occupations
The most common Natural Resources, Construction and Maintenance occupations in Kermit are Construction & Extraction (293 | 11.1%), and Installation, Maintenance & Repair (173 | 6.5%).
Natural Resources, Construction and Maintenance Occupations by Sex
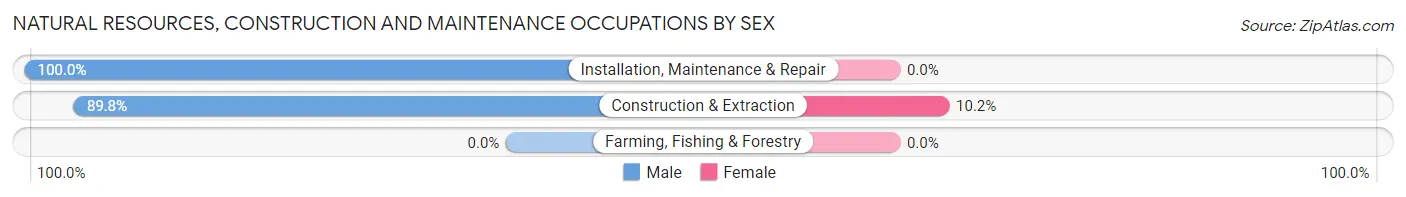
| Occupation | Male | Female |
| Farming, Fishing & Forestry | 0 (0.0%) | 0 (0.0%) |
| Construction & Extraction | 263 (89.8%) | 30 (10.2%) |
| Installation, Maintenance & Repair | 173 (100.0%) | 0 (0.0%) |
| Total (Category) | 436 (93.6%) | 30 (6.4%) |
| Total (Overall) | 1,758 (66.4%) | 890 (33.6%) |
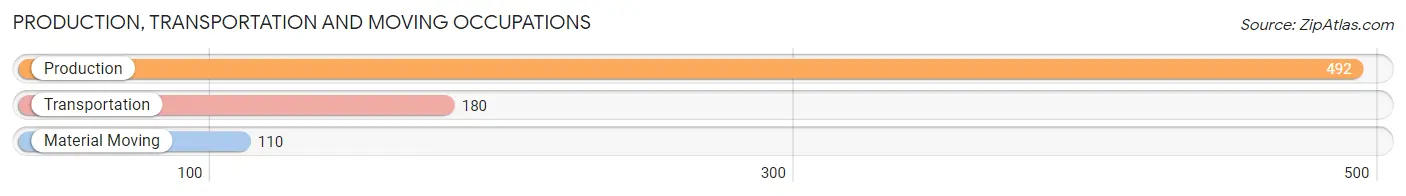
Production, Transportation and Moving Occupations
The most common Production, Transportation and Moving occupations in Kermit are Production (492 | 18.6%), Transportation (180 | 6.8%), and Material Moving (110 | 4.2%).
Production, Transportation and Moving Occupations by Sex
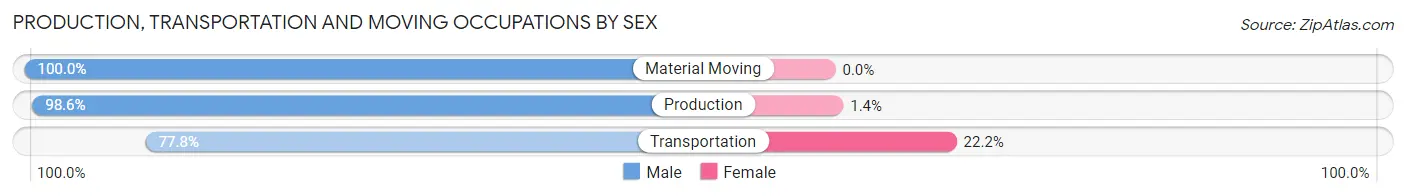
| Occupation | Male | Female |
| Production | 485 (98.6%) | 7 (1.4%) |
| Transportation | 140 (77.8%) | 40 (22.2%) |
| Material Moving | 110 (100.0%) | 0 (0.0%) |
| Total (Category) | 735 (94.0%) | 47 (6.0%) |
| Total (Overall) | 1,758 (66.4%) | 890 (33.6%) |
Employment Industries by Sex in Kermit
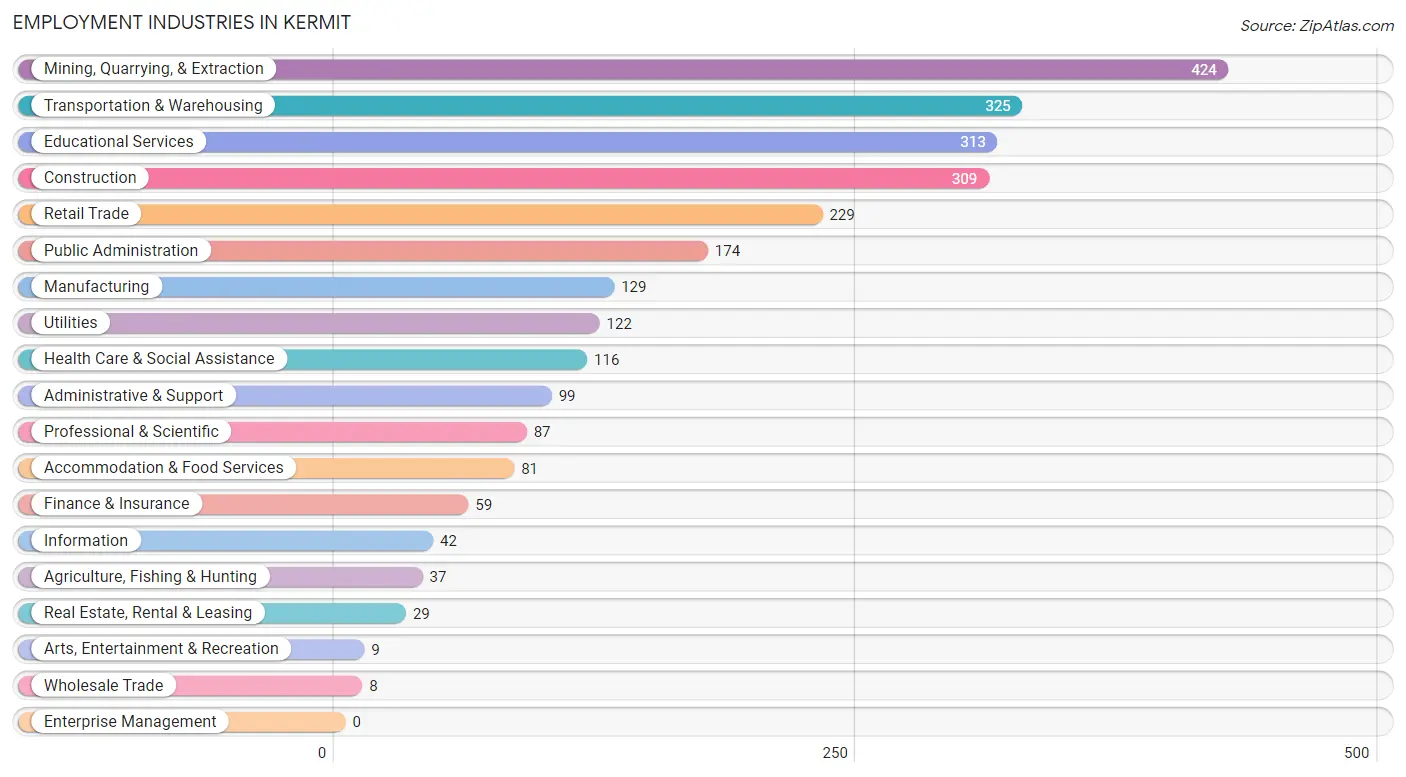
Employment Industries in Kermit
The major employment industries in Kermit include Mining, Quarrying, & Extraction (424 | 16.0%), Transportation & Warehousing (325 | 12.3%), Educational Services (313 | 11.8%), Construction (309 | 11.7%), and Retail Trade (229 | 8.6%).
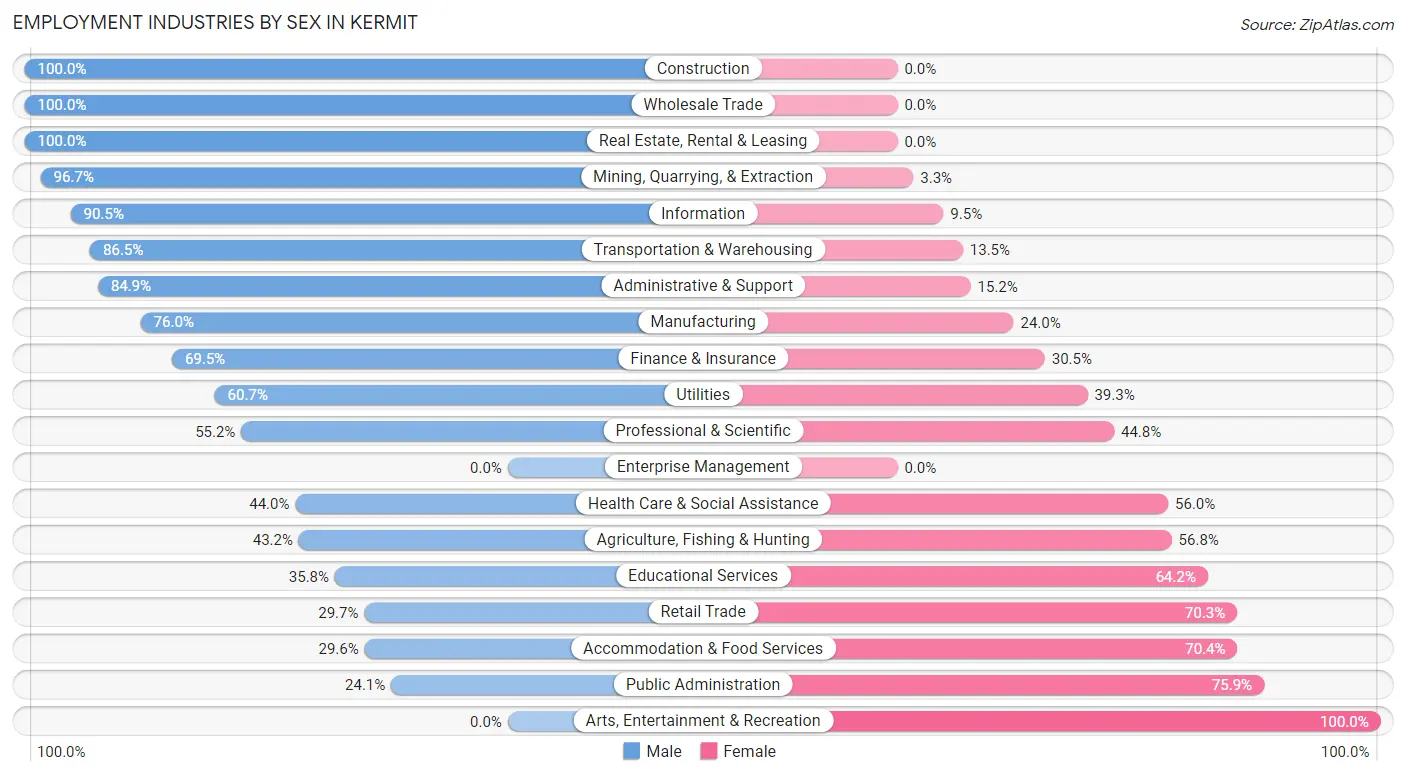
Employment Industries by Sex in Kermit
The Kermit industries that see more men than women are Construction (100.0%), Wholesale Trade (100.0%), and Real Estate, Rental & Leasing (100.0%), whereas the industries that tend to have a higher number of women are Arts, Entertainment & Recreation (100.0%), Public Administration (75.9%), and Accommodation & Food Services (70.4%).
| Industry | Male | Female |
| Agriculture, Fishing & Hunting | 16 (43.2%) | 21 (56.8%) |
| Mining, Quarrying, & Extraction | 410 (96.7%) | 14 (3.3%) |
| Construction | 309 (100.0%) | 0 (0.0%) |
| Manufacturing | 98 (76.0%) | 31 (24.0%) |
| Wholesale Trade | 8 (100.0%) | 0 (0.0%) |
| Retail Trade | 68 (29.7%) | 161 (70.3%) |
| Transportation & Warehousing | 281 (86.5%) | 44 (13.5%) |
| Utilities | 74 (60.7%) | 48 (39.3%) |
| Information | 38 (90.5%) | 4 (9.5%) |
| Finance & Insurance | 41 (69.5%) | 18 (30.5%) |
| Real Estate, Rental & Leasing | 29 (100.0%) | 0 (0.0%) |
| Professional & Scientific | 48 (55.2%) | 39 (44.8%) |
| Enterprise Management | 0 (0.0%) | 0 (0.0%) |
| Administrative & Support | 84 (84.9%) | 15 (15.1%) |
| Educational Services | 112 (35.8%) | 201 (64.2%) |
| Health Care & Social Assistance | 51 (44.0%) | 65 (56.0%) |
| Arts, Entertainment & Recreation | 0 (0.0%) | 9 (100.0%) |
| Accommodation & Food Services | 24 (29.6%) | 57 (70.4%) |
| Public Administration | 42 (24.1%) | 132 (75.9%) |
| Total | 1,758 (66.4%) | 890 (33.6%) |
Education in Kermit
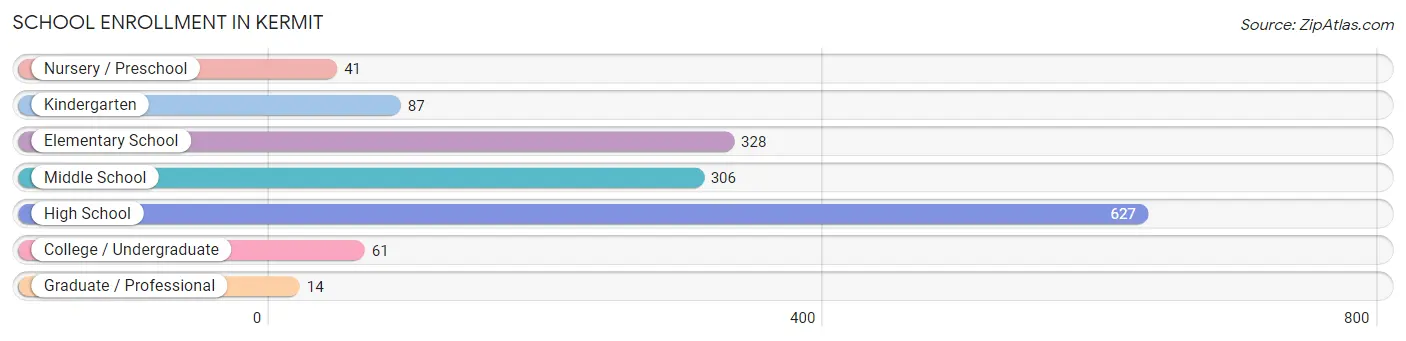
School Enrollment in Kermit
The most common levels of schooling among the 1,464 students in Kermit are high school (627 | 42.8%), elementary school (328 | 22.4%), and middle school (306 | 20.9%).
| School Level | # Students | % Students |
| Nursery / Preschool | 41 | 2.8% |
| Kindergarten | 87 | 5.9% |
| Elementary School | 328 | 22.4% |
| Middle School | 306 | 20.9% |
| High School | 627 | 42.8% |
| College / Undergraduate | 61 | 4.2% |
| Graduate / Professional | 14 | 1.0% |
| Total | 1,464 | 100.0% |
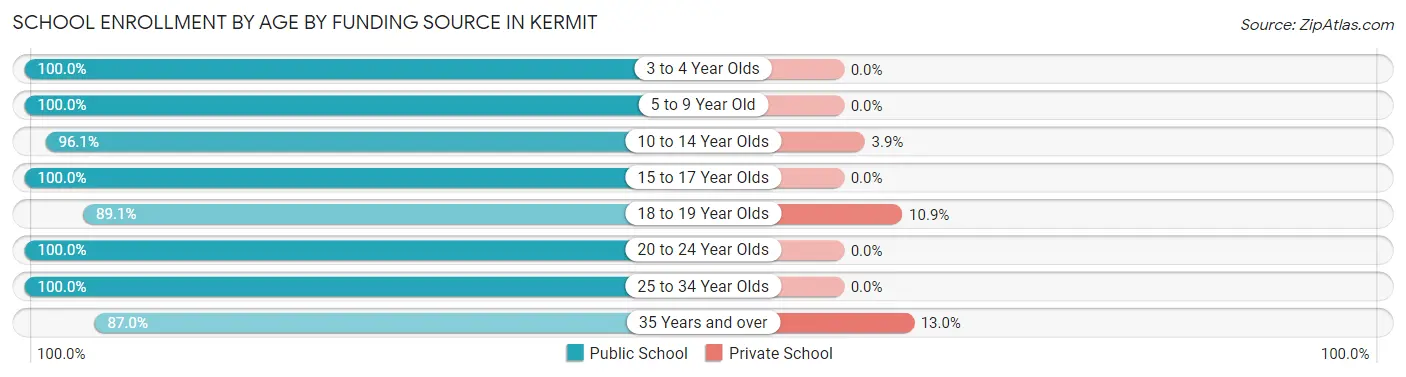
School Enrollment by Age by Funding Source in Kermit
Out of a total of 1,464 students who are enrolled in schools in Kermit, 48 (3.3%) attend a private institution, while the remaining 1,416 (96.7%) are enrolled in public schools. The age group of 35 years and over has the highest likelihood of being enrolled in private schools, with 12 (13.0% in the age bracket) enrolled. Conversely, the age group of 3 to 4 year olds has the lowest likelihood of being enrolled in a private school, with 34 (100.0% in the age bracket) attending a public institution.
| Age Bracket | Public School | Private School |
| 3 to 4 Year Olds | 34 (100.0%) | 0 (0.0%) |
| 5 to 9 Year Old | 401 (100.0%) | 0 (0.0%) |
| 10 to 14 Year Olds | 345 (96.1%) | 14 (3.9%) |
| 15 to 17 Year Olds | 341 (100.0%) | 0 (0.0%) |
| 18 to 19 Year Olds | 180 (89.1%) | 22 (10.9%) |
| 20 to 24 Year Olds | 26 (100.0%) | 0 (0.0%) |
| 25 to 34 Year Olds | 9 (100.0%) | 0 (0.0%) |
| 35 Years and over | 80 (87.0%) | 12 (13.0%) |
| Total | 1,416 (96.7%) | 48 (3.3%) |
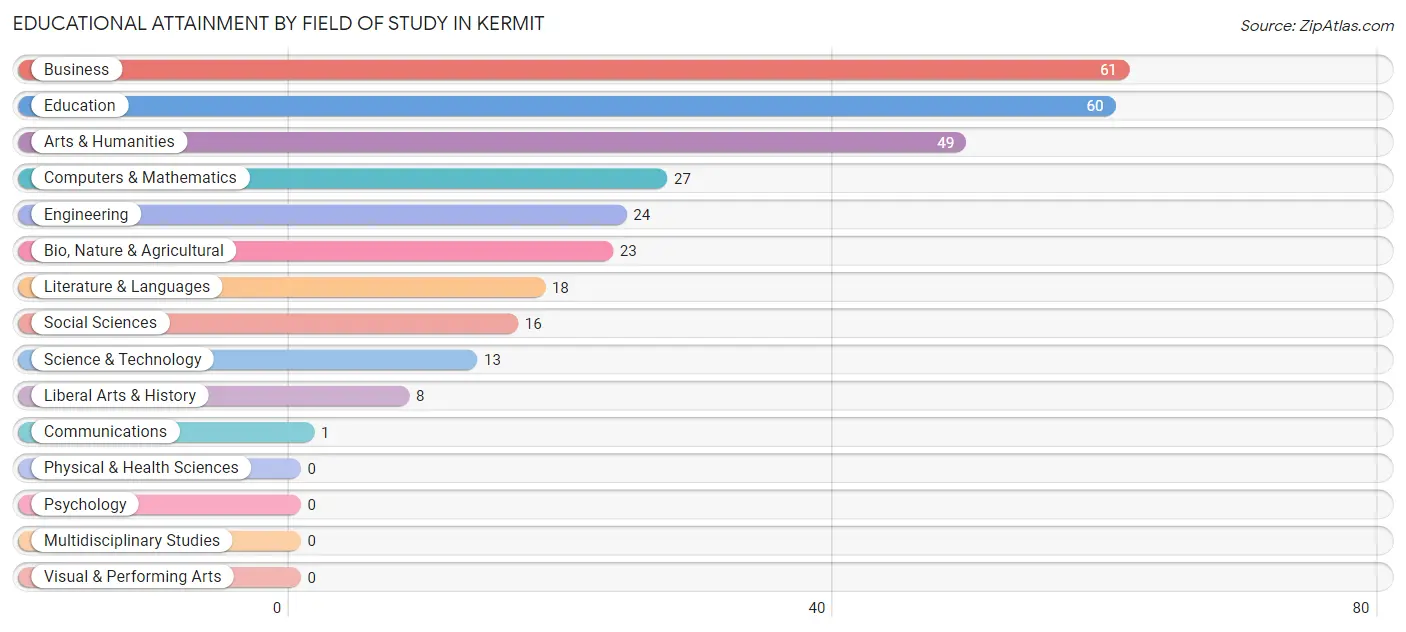
Educational Attainment by Field of Study in Kermit
Business (61 | 20.3%), education (60 | 20.0%), arts & humanities (49 | 16.3%), computers & mathematics (27 | 9.0%), and engineering (24 | 8.0%) are the most common fields of study among 300 individuals in Kermit who have obtained a bachelor's degree or higher.
| Field of Study | # Graduates | % Graduates |
| Computers & Mathematics | 27 | 9.0% |
| Bio, Nature & Agricultural | 23 | 7.7% |
| Physical & Health Sciences | 0 | 0.0% |
| Psychology | 0 | 0.0% |
| Social Sciences | 16 | 5.3% |
| Engineering | 24 | 8.0% |
| Multidisciplinary Studies | 0 | 0.0% |
| Science & Technology | 13 | 4.3% |
| Business | 61 | 20.3% |
| Education | 60 | 20.0% |
| Literature & Languages | 18 | 6.0% |
| Liberal Arts & History | 8 | 2.7% |
| Visual & Performing Arts | 0 | 0.0% |
| Communications | 1 | 0.3% |
| Arts & Humanities | 49 | 16.3% |
| Total | 300 | 100.0% |
Transportation & Commute in Kermit
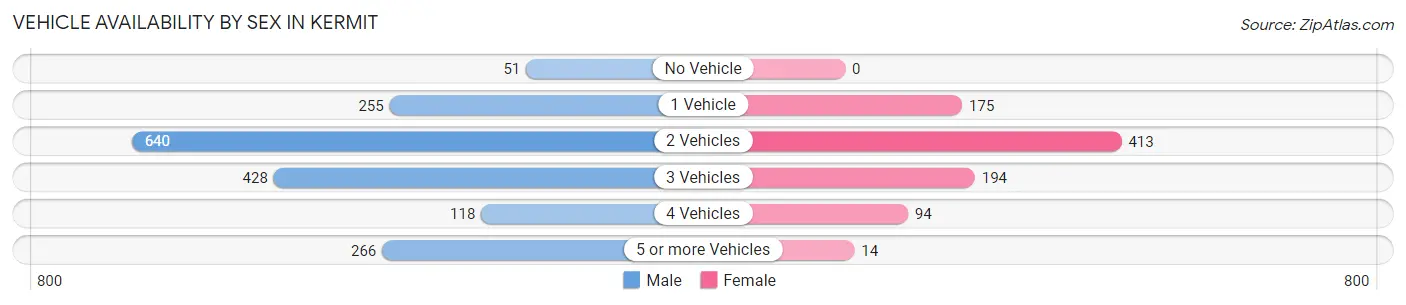
Vehicle Availability by Sex in Kermit
The most prevalent vehicle ownership categories in Kermit are males with 2 vehicles (640, accounting for 36.4%) and females with 2 vehicles (413, making up 71.9%).
| Vehicles Available | Male | Female |
| No Vehicle | 51 (2.9%) | 0 (0.0%) |
| 1 Vehicle | 255 (14.5%) | 175 (19.7%) |
| 2 Vehicles | 640 (36.4%) | 413 (46.4%) |
| 3 Vehicles | 428 (24.3%) | 194 (21.8%) |
| 4 Vehicles | 118 (6.7%) | 94 (10.6%) |
| 5 or more Vehicles | 266 (15.1%) | 14 (1.6%) |
| Total | 1,758 (100.0%) | 890 (100.0%) |
Commute Time in Kermit
The most frequently occuring commute durations in Kermit are 5 to 9 minutes (645 commuters, 24.8%), 60 to 89 minutes (557 commuters, 21.4%), and less than 5 minutes (437 commuters, 16.8%).
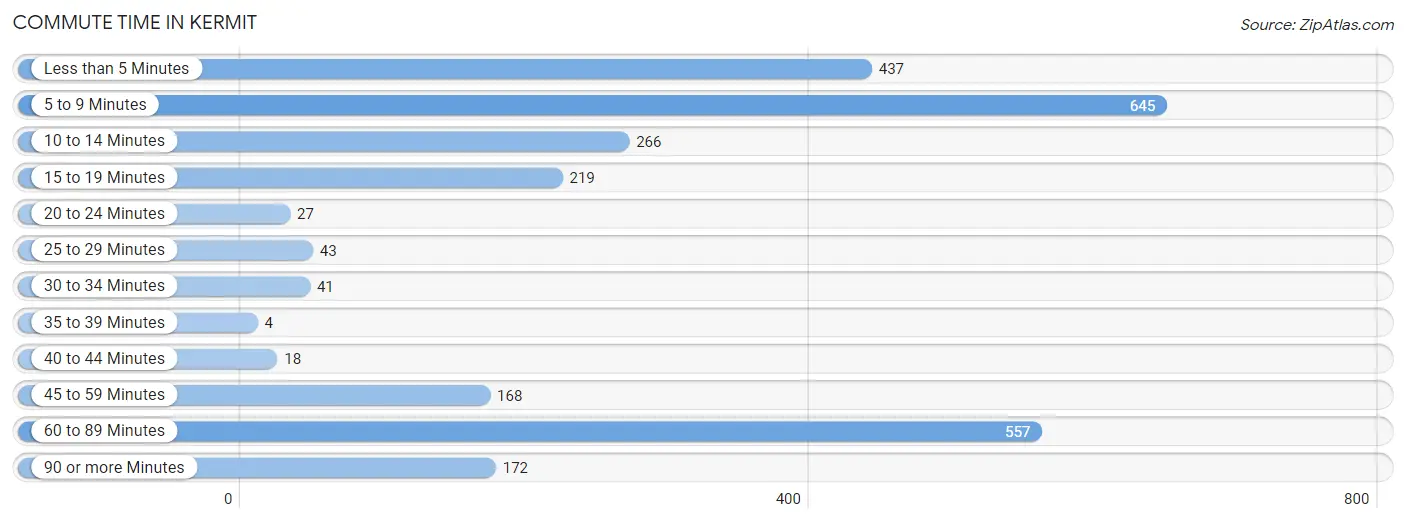
| Commute Time | # Commuters | % Commuters |
| Less than 5 Minutes | 437 | 16.8% |
| 5 to 9 Minutes | 645 | 24.8% |
| 10 to 14 Minutes | 266 | 10.2% |
| 15 to 19 Minutes | 219 | 8.4% |
| 20 to 24 Minutes | 27 | 1.0% |
| 25 to 29 Minutes | 43 | 1.7% |
| 30 to 34 Minutes | 41 | 1.6% |
| 35 to 39 Minutes | 4 | 0.2% |
| 40 to 44 Minutes | 18 | 0.7% |
| 45 to 59 Minutes | 168 | 6.5% |
| 60 to 89 Minutes | 557 | 21.4% |
| 90 or more Minutes | 172 | 6.6% |
Commute Time by Sex in Kermit
The most common commute times in Kermit are 60 to 89 minutes (549 commuters, 31.3%) for males and 5 to 9 minutes (393 commuters, 46.6%) for females.
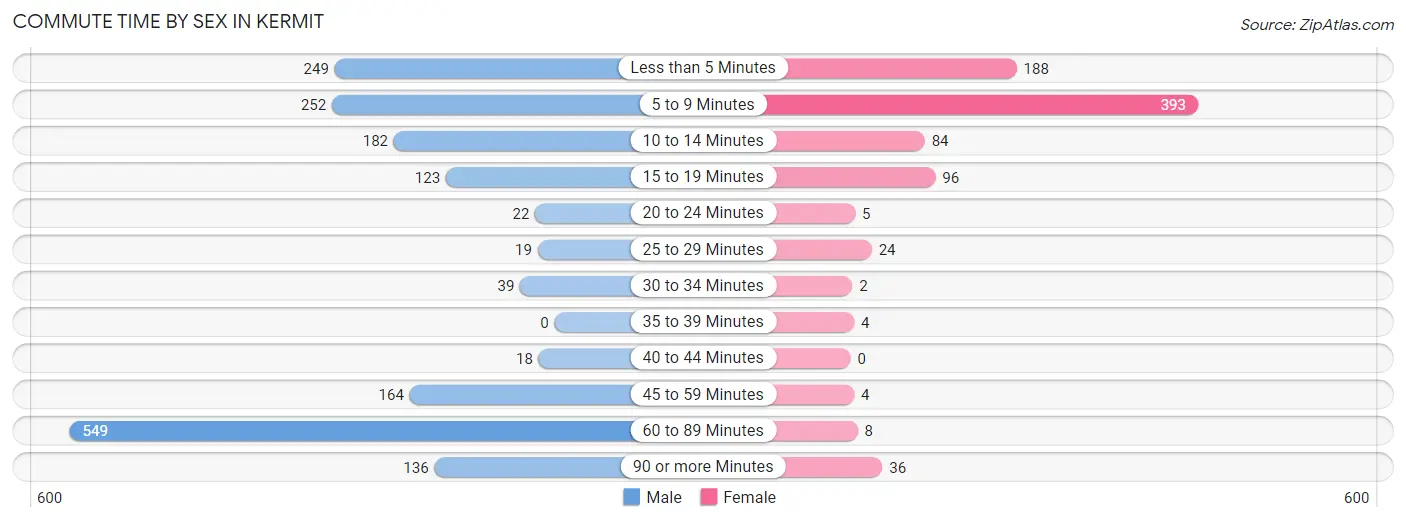
| Commute Time | Male | Female |
| Less than 5 Minutes | 249 (14.2%) | 188 (22.3%) |
| 5 to 9 Minutes | 252 (14.4%) | 393 (46.6%) |
| 10 to 14 Minutes | 182 (10.4%) | 84 (10.0%) |
| 15 to 19 Minutes | 123 (7.0%) | 96 (11.4%) |
| 20 to 24 Minutes | 22 (1.3%) | 5 (0.6%) |
| 25 to 29 Minutes | 19 (1.1%) | 24 (2.8%) |
| 30 to 34 Minutes | 39 (2.2%) | 2 (0.2%) |
| 35 to 39 Minutes | 0 (0.0%) | 4 (0.5%) |
| 40 to 44 Minutes | 18 (1.0%) | 0 (0.0%) |
| 45 to 59 Minutes | 164 (9.4%) | 4 (0.5%) |
| 60 to 89 Minutes | 549 (31.3%) | 8 (0.9%) |
| 90 or more Minutes | 136 (7.8%) | 36 (4.3%) |
Time of Departure to Work by Sex in Kermit
The most frequent times of departure to work in Kermit are 6:00 AM to 6:29 AM (472, 26.9%) for males and 7:30 AM to 7:59 AM (253, 30.0%) for females.
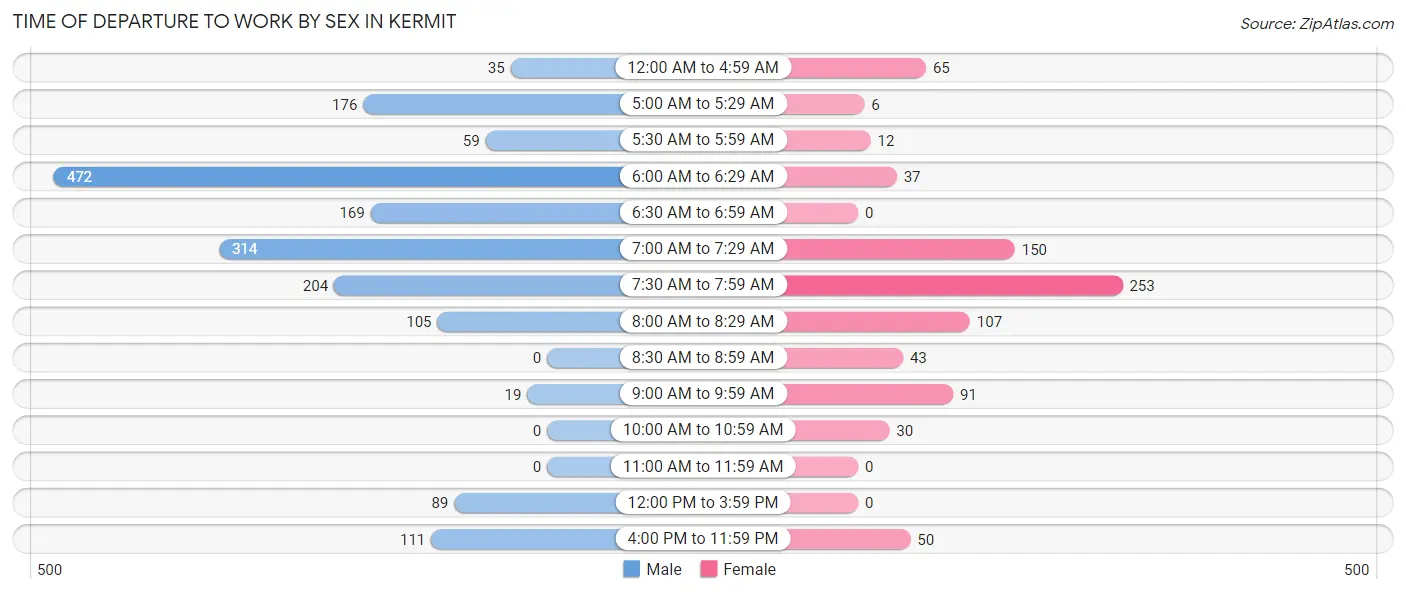
| Time of Departure | Male | Female |
| 12:00 AM to 4:59 AM | 35 (2.0%) | 65 (7.7%) |
| 5:00 AM to 5:29 AM | 176 (10.0%) | 6 (0.7%) |
| 5:30 AM to 5:59 AM | 59 (3.4%) | 12 (1.4%) |
| 6:00 AM to 6:29 AM | 472 (26.9%) | 37 (4.4%) |
| 6:30 AM to 6:59 AM | 169 (9.6%) | 0 (0.0%) |
| 7:00 AM to 7:29 AM | 314 (17.9%) | 150 (17.8%) |
| 7:30 AM to 7:59 AM | 204 (11.6%) | 253 (30.0%) |
| 8:00 AM to 8:29 AM | 105 (6.0%) | 107 (12.7%) |
| 8:30 AM to 8:59 AM | 0 (0.0%) | 43 (5.1%) |
| 9:00 AM to 9:59 AM | 19 (1.1%) | 91 (10.8%) |
| 10:00 AM to 10:59 AM | 0 (0.0%) | 30 (3.5%) |
| 11:00 AM to 11:59 AM | 0 (0.0%) | 0 (0.0%) |
| 12:00 PM to 3:59 PM | 89 (5.1%) | 0 (0.0%) |
| 4:00 PM to 11:59 PM | 111 (6.3%) | 50 (5.9%) |
| Total | 1,753 (100.0%) | 844 (100.0%) |
Housing Occupancy in Kermit
Occupancy by Ownership in Kermit
Of the total 2,110 dwellings in Kermit, owner-occupied units account for 1,718 (81.4%), while renter-occupied units make up 392 (18.6%).
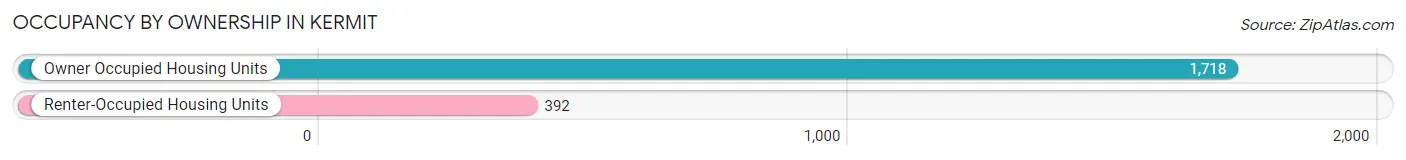
| Occupancy | # Housing Units | % Housing Units |
| Owner Occupied Housing Units | 1,718 | 81.4% |
| Renter-Occupied Housing Units | 392 | 18.6% |
| Total Occupied Housing Units | 2,110 | 100.0% |
Occupancy by Household Size in Kermit
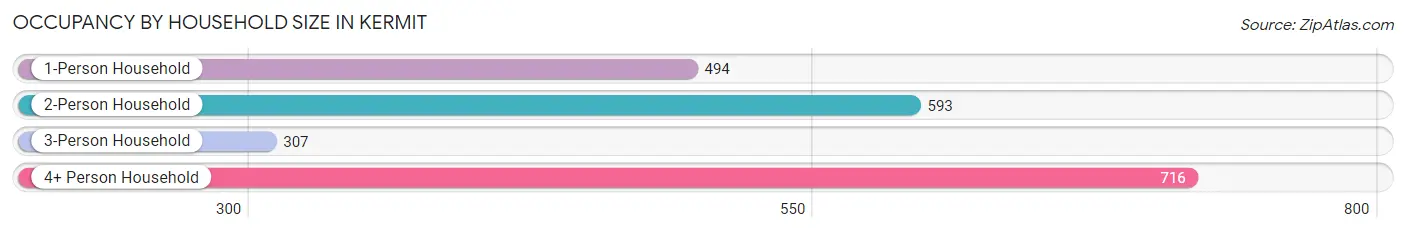
| Household Size | # Housing Units | % Housing Units |
| 1-Person Household | 494 | 23.4% |
| 2-Person Household | 593 | 28.1% |
| 3-Person Household | 307 | 14.5% |
| 4+ Person Household | 716 | 33.9% |
| Total Housing Units | 2,110 | 100.0% |
Occupancy by Ownership by Household Size in Kermit
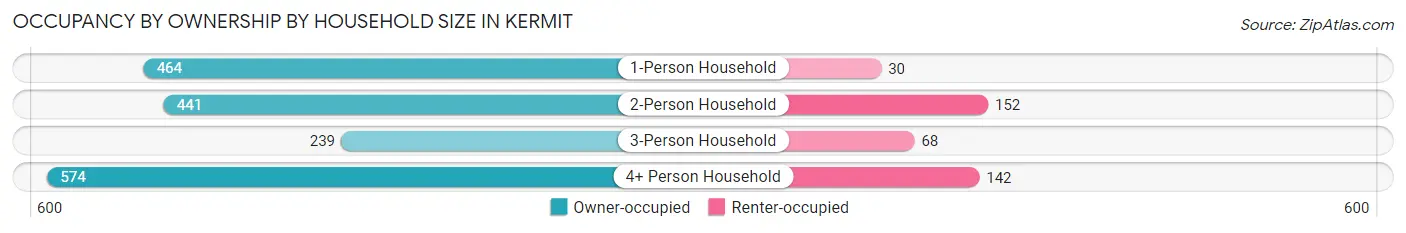
| Household Size | Owner-occupied | Renter-occupied |
| 1-Person Household | 464 (93.9%) | 30 (6.1%) |
| 2-Person Household | 441 (74.4%) | 152 (25.6%) |
| 3-Person Household | 239 (77.8%) | 68 (22.2%) |
| 4+ Person Household | 574 (80.2%) | 142 (19.8%) |
| Total Housing Units | 1,718 (81.4%) | 392 (18.6%) |
Occupancy by Educational Attainment in Kermit
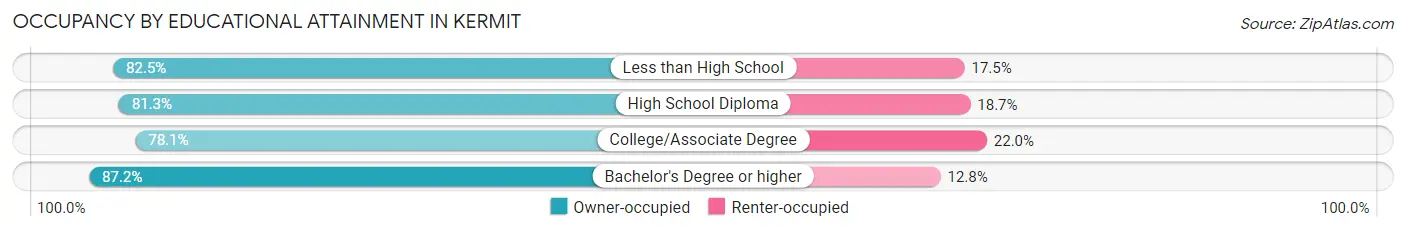
| Household Size | Owner-occupied | Renter-occupied |
| Less than High School | 579 (82.5%) | 123 (17.5%) |
| High School Diploma | 566 (81.3%) | 130 (18.7%) |
| College/Associate Degree | 409 (78.0%) | 115 (22.0%) |
| Bachelor's Degree or higher | 164 (87.2%) | 24 (12.8%) |
Occupancy by Age of Householder in Kermit
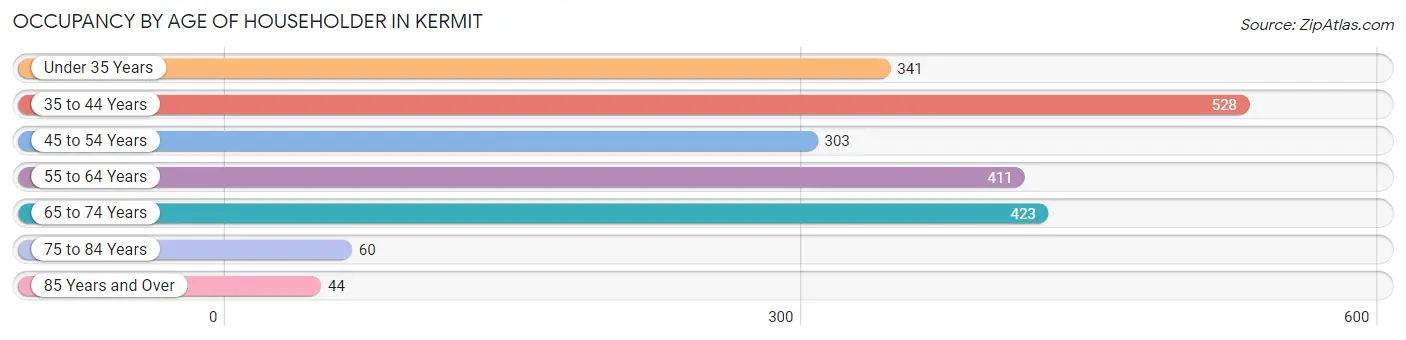
| Age Bracket | # Households | % Households |
| Under 35 Years | 341 | 16.2% |
| 35 to 44 Years | 528 | 25.0% |
| 45 to 54 Years | 303 | 14.4% |
| 55 to 64 Years | 411 | 19.5% |
| 65 to 74 Years | 423 | 20.1% |
| 75 to 84 Years | 60 | 2.8% |
| 85 Years and Over | 44 | 2.1% |
| Total | 2,110 | 100.0% |
Housing Finances in Kermit
Median Income by Occupancy in Kermit
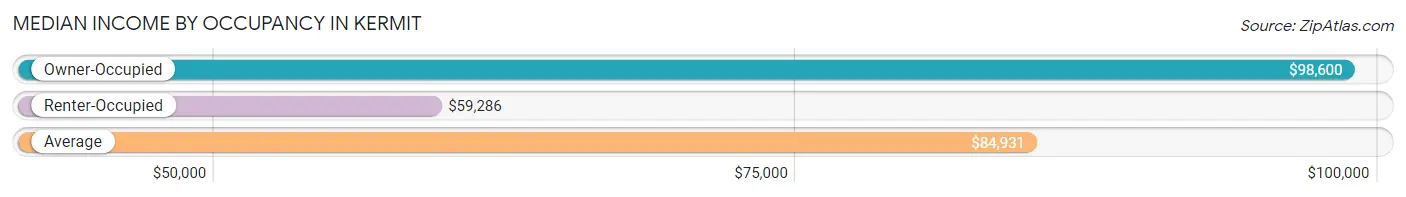
| Occupancy Type | # Households | Median Income |
| Owner-Occupied | 1,718 (81.4%) | $98,600 |
| Renter-Occupied | 392 (18.6%) | $59,286 |
| Average | 2,110 (100.0%) | $84,931 |
Occupancy by Householder Income Bracket in Kermit
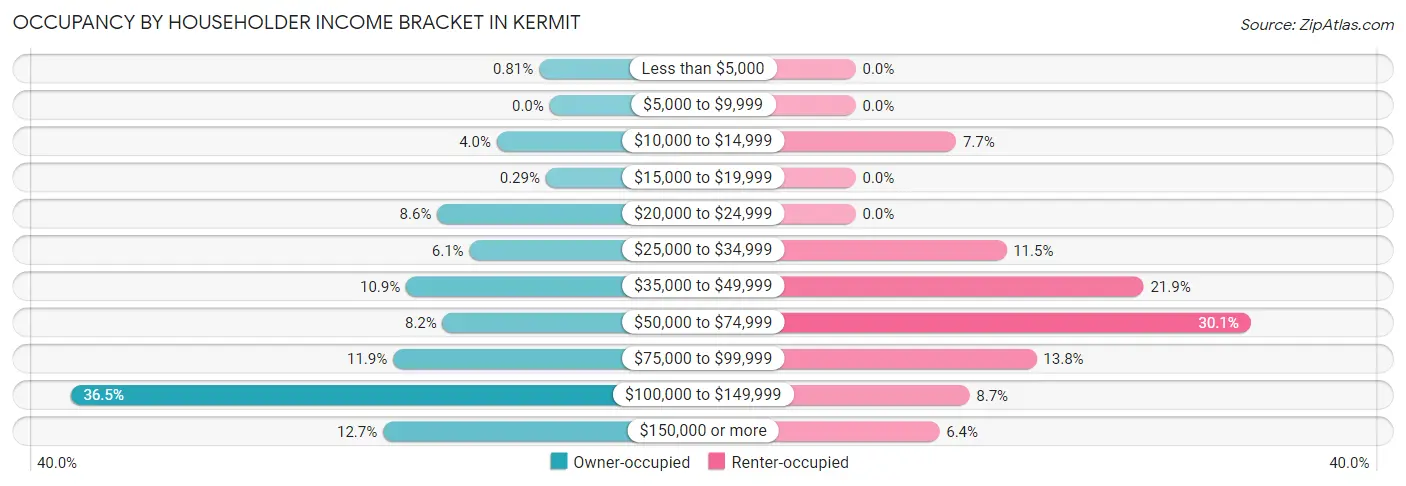
| Income Bracket | Owner-occupied | Renter-occupied |
| Less than $5,000 | 14 (0.8%) | 0 (0.0%) |
| $5,000 to $9,999 | 0 (0.0%) | 0 (0.0%) |
| $10,000 to $14,999 | 69 (4.0%) | 30 (7.6%) |
| $15,000 to $19,999 | 5 (0.3%) | 0 (0.0%) |
| $20,000 to $24,999 | 147 (8.6%) | 0 (0.0%) |
| $25,000 to $34,999 | 105 (6.1%) | 45 (11.5%) |
| $35,000 to $49,999 | 188 (10.9%) | 86 (21.9%) |
| $50,000 to $74,999 | 140 (8.2%) | 118 (30.1%) |
| $75,000 to $99,999 | 205 (11.9%) | 54 (13.8%) |
| $100,000 to $149,999 | 627 (36.5%) | 34 (8.7%) |
| $150,000 or more | 218 (12.7%) | 25 (6.4%) |
| Total | 1,718 (100.0%) | 392 (100.0%) |
Monthly Housing Cost Tiers in Kermit
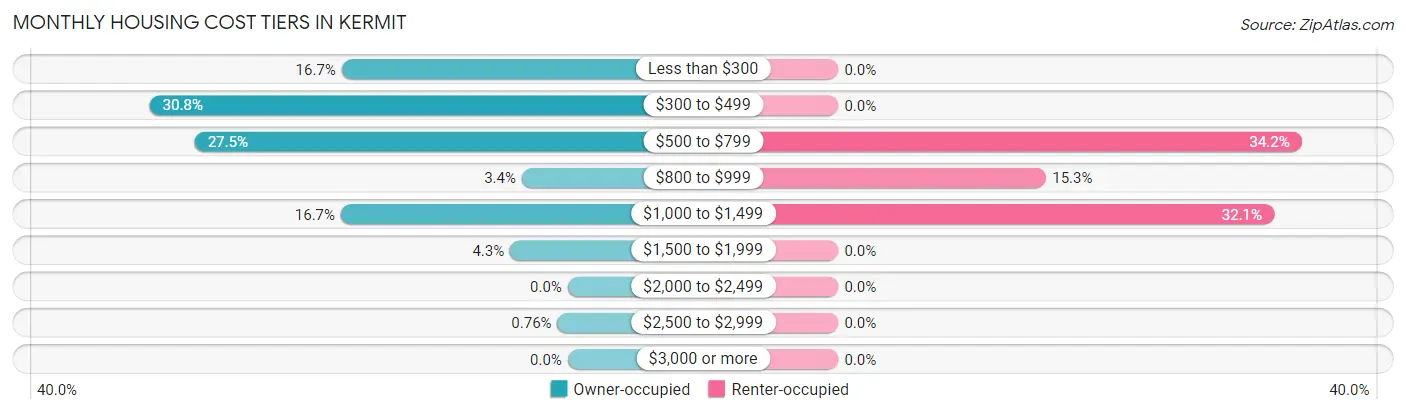
| Monthly Cost | Owner-occupied | Renter-occupied |
| Less than $300 | 286 (16.7%) | 0 (0.0%) |
| $300 to $499 | 529 (30.8%) | 0 (0.0%) |
| $500 to $799 | 472 (27.5%) | 134 (34.2%) |
| $800 to $999 | 58 (3.4%) | 60 (15.3%) |
| $1,000 to $1,499 | 287 (16.7%) | 126 (32.1%) |
| $1,500 to $1,999 | 73 (4.3%) | 0 (0.0%) |
| $2,000 to $2,499 | 0 (0.0%) | 0 (0.0%) |
| $2,500 to $2,999 | 13 (0.8%) | 0 (0.0%) |
| $3,000 or more | 0 (0.0%) | 0 (0.0%) |
| Total | 1,718 (100.0%) | 392 (100.0%) |
Physical Housing Characteristics in Kermit
Housing Structures in Kermit
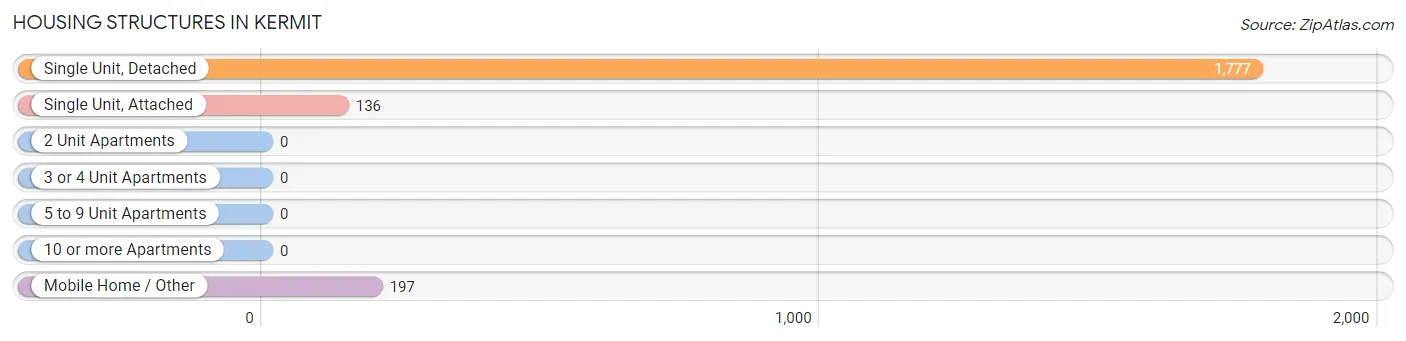
| Structure Type | # Housing Units | % Housing Units |
| Single Unit, Detached | 1,777 | 84.2% |
| Single Unit, Attached | 136 | 6.5% |
| 2 Unit Apartments | 0 | 0.0% |
| 3 or 4 Unit Apartments | 0 | 0.0% |
| 5 to 9 Unit Apartments | 0 | 0.0% |
| 10 or more Apartments | 0 | 0.0% |
| Mobile Home / Other | 197 | 9.3% |
| Total | 2,110 | 100.0% |
Housing Structures by Occupancy in Kermit
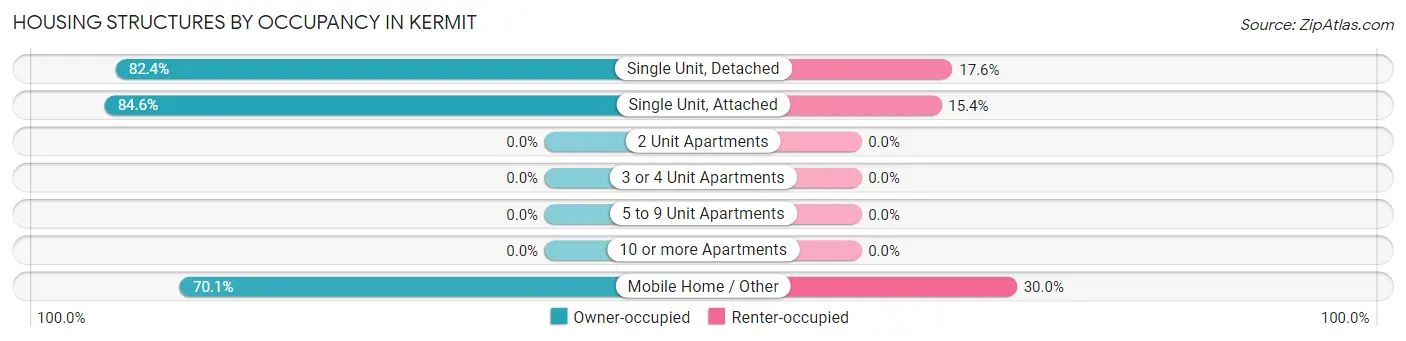
| Structure Type | Owner-occupied | Renter-occupied |
| Single Unit, Detached | 1,465 (82.4%) | 312 (17.6%) |
| Single Unit, Attached | 115 (84.6%) | 21 (15.4%) |
| 2 Unit Apartments | 0 (0.0%) | 0 (0.0%) |
| 3 or 4 Unit Apartments | 0 (0.0%) | 0 (0.0%) |
| 5 to 9 Unit Apartments | 0 (0.0%) | 0 (0.0%) |
| 10 or more Apartments | 0 (0.0%) | 0 (0.0%) |
| Mobile Home / Other | 138 (70.1%) | 59 (29.9%) |
| Total | 1,718 (81.4%) | 392 (18.6%) |
Housing Structures by Number of Rooms in Kermit
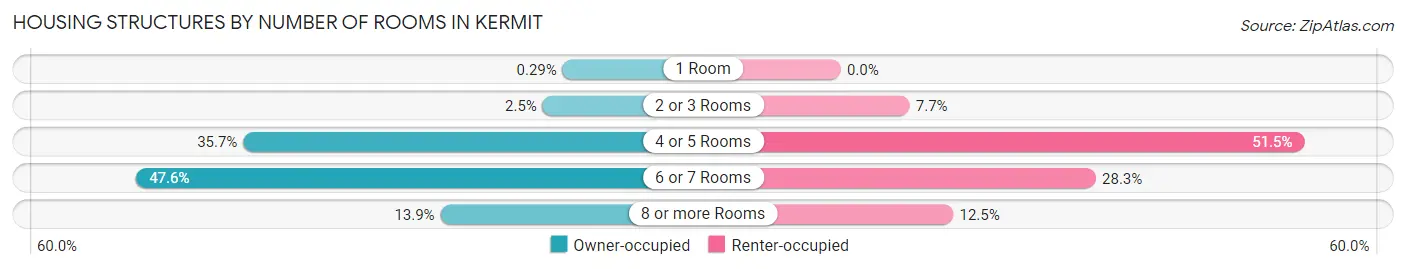
| Number of Rooms | Owner-occupied | Renter-occupied |
| 1 Room | 5 (0.3%) | 0 (0.0%) |
| 2 or 3 Rooms | 43 (2.5%) | 30 (7.6%) |
| 4 or 5 Rooms | 614 (35.7%) | 202 (51.5%) |
| 6 or 7 Rooms | 818 (47.6%) | 111 (28.3%) |
| 8 or more Rooms | 238 (13.9%) | 49 (12.5%) |
| Total | 1,718 (100.0%) | 392 (100.0%) |
Housing Structure by Heating Type in Kermit
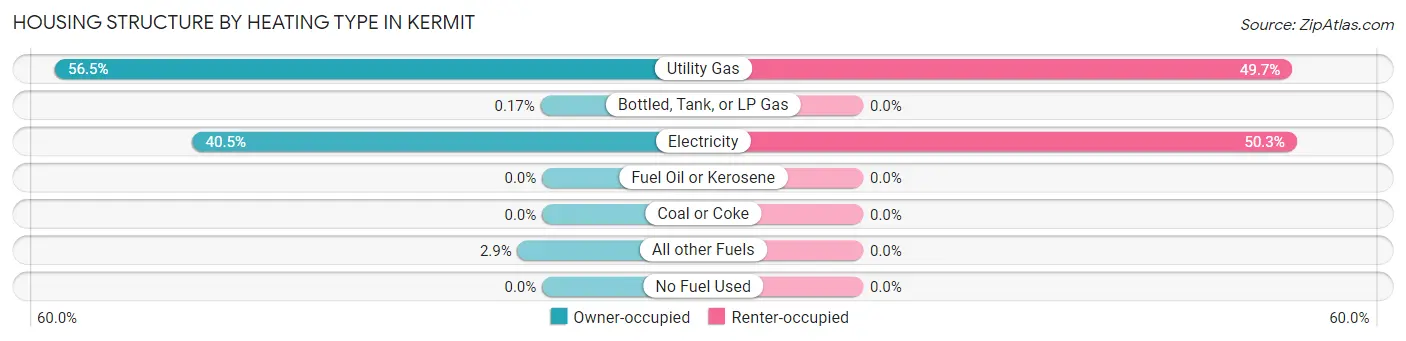
| Heating Type | Owner-occupied | Renter-occupied |
| Utility Gas | 970 (56.5%) | 195 (49.7%) |
| Bottled, Tank, or LP Gas | 3 (0.2%) | 0 (0.0%) |
| Electricity | 696 (40.5%) | 197 (50.3%) |
| Fuel Oil or Kerosene | 0 (0.0%) | 0 (0.0%) |
| Coal or Coke | 0 (0.0%) | 0 (0.0%) |
| All other Fuels | 49 (2.9%) | 0 (0.0%) |
| No Fuel Used | 0 (0.0%) | 0 (0.0%) |
| Total | 1,718 (100.0%) | 392 (100.0%) |
Household Vehicle Usage in Kermit
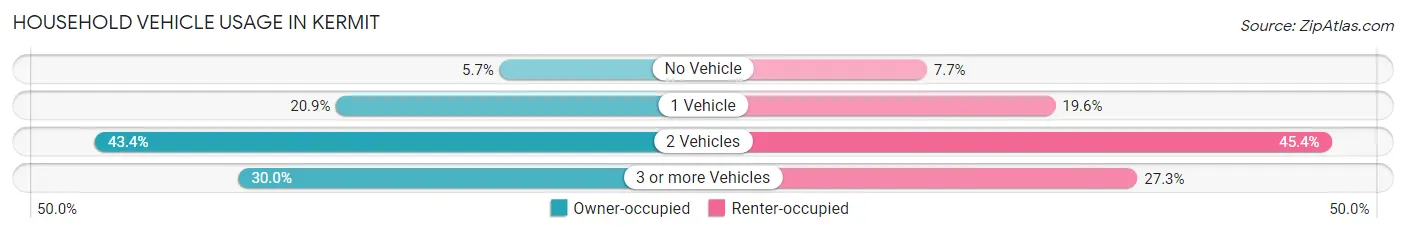
| Vehicles per Household | Owner-occupied | Renter-occupied |
| No Vehicle | 97 (5.7%) | 30 (7.6%) |
| 1 Vehicle | 359 (20.9%) | 77 (19.6%) |
| 2 Vehicles | 746 (43.4%) | 178 (45.4%) |
| 3 or more Vehicles | 516 (30.0%) | 107 (27.3%) |
| Total | 1,718 (100.0%) | 392 (100.0%) |
Real Estate & Mortgages in Kermit
Real Estate and Mortgage Overview in Kermit
| Characteristic | Without Mortgage | With Mortgage |
| Housing Units | 1,317 | 401 |
| Median Property Value | $99,200 | $177,500 |
| Median Household Income | $84,688 | $97 |
| Monthly Housing Costs | $446 | $0 |
| Real Estate Taxes | $1,031 | $10 |
Property Value by Mortgage Status in Kermit
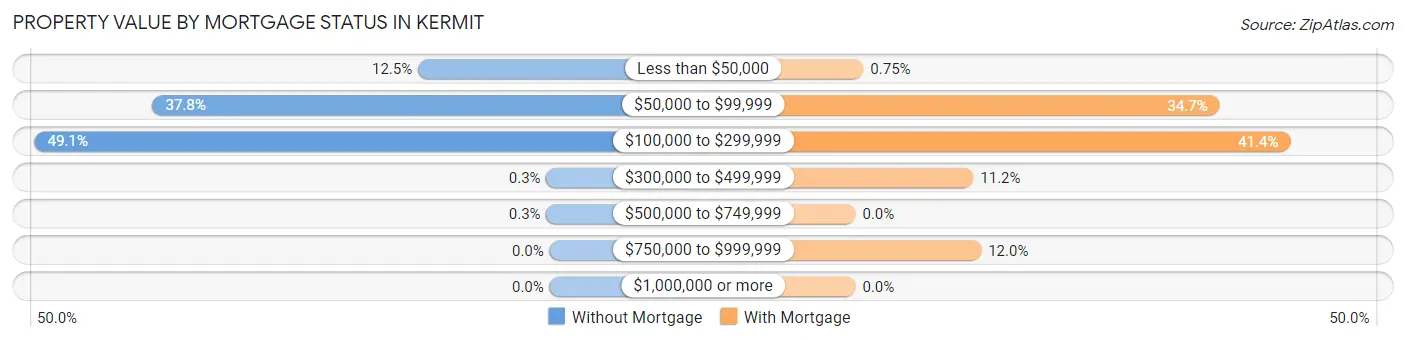
| Property Value | Without Mortgage | With Mortgage |
| Less than $50,000 | 165 (12.5%) | 3 (0.7%) |
| $50,000 to $99,999 | 498 (37.8%) | 139 (34.7%) |
| $100,000 to $299,999 | 646 (49.0%) | 166 (41.4%) |
| $300,000 to $499,999 | 4 (0.3%) | 45 (11.2%) |
| $500,000 to $749,999 | 4 (0.3%) | 0 (0.0%) |
| $750,000 to $999,999 | 0 (0.0%) | 48 (12.0%) |
| $1,000,000 or more | 0 (0.0%) | 0 (0.0%) |
| Total | 1,317 (100.0%) | 401 (100.0%) |
Household Income by Mortgage Status in Kermit
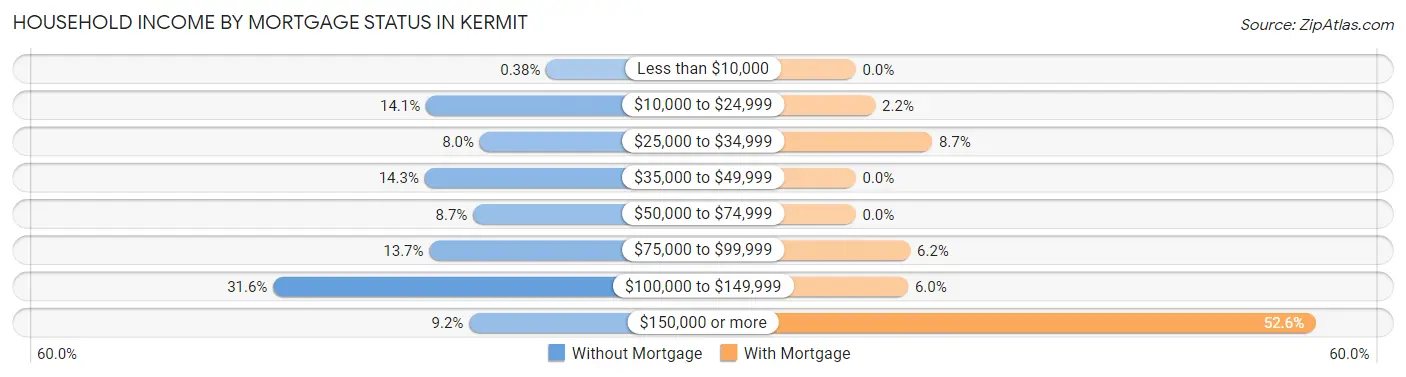
| Household Income | Without Mortgage | With Mortgage |
| Less than $10,000 | 5 (0.4%) | 0 (0.0%) |
| $10,000 to $24,999 | 186 (14.1%) | 9 (2.2%) |
| $25,000 to $34,999 | 105 (8.0%) | 35 (8.7%) |
| $35,000 to $49,999 | 188 (14.3%) | 0 (0.0%) |
| $50,000 to $74,999 | 115 (8.7%) | 0 (0.0%) |
| $75,000 to $99,999 | 181 (13.7%) | 25 (6.2%) |
| $100,000 to $149,999 | 416 (31.6%) | 24 (6.0%) |
| $150,000 or more | 121 (9.2%) | 211 (52.6%) |
| Total | 1,317 (100.0%) | 401 (100.0%) |
Property Value to Household Income Ratio in Kermit
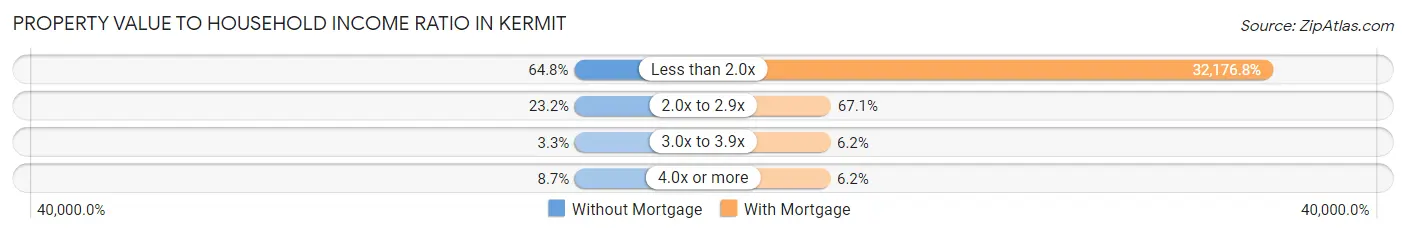
| Value-to-Income Ratio | Without Mortgage | With Mortgage |
| Less than 2.0x | 853 (64.8%) | 129,029 (32,176.8%) |
| 2.0x to 2.9x | 305 (23.2%) | 269 (67.1%) |
| 3.0x to 3.9x | 44 (3.3%) | 25 (6.2%) |
| 4.0x or more | 115 (8.7%) | 25 (6.2%) |
| Total | 1,317 (100.0%) | 401 (100.0%) |
Real Estate Taxes by Mortgage Status in Kermit
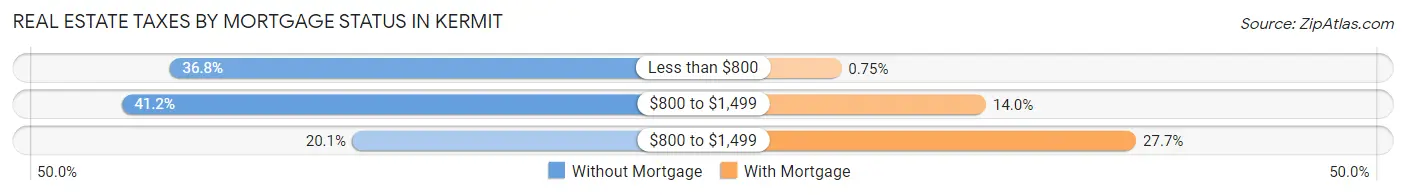
| Property Taxes | Without Mortgage | With Mortgage |
| Less than $800 | 484 (36.7%) | 3 (0.7%) |
| $800 to $1,499 | 542 (41.1%) | 56 (14.0%) |
| $800 to $1,499 | 265 (20.1%) | 111 (27.7%) |
| Total | 1,317 (100.0%) | 401 (100.0%) |
Health & Disability in Kermit
Health Insurance Coverage by Age in Kermit
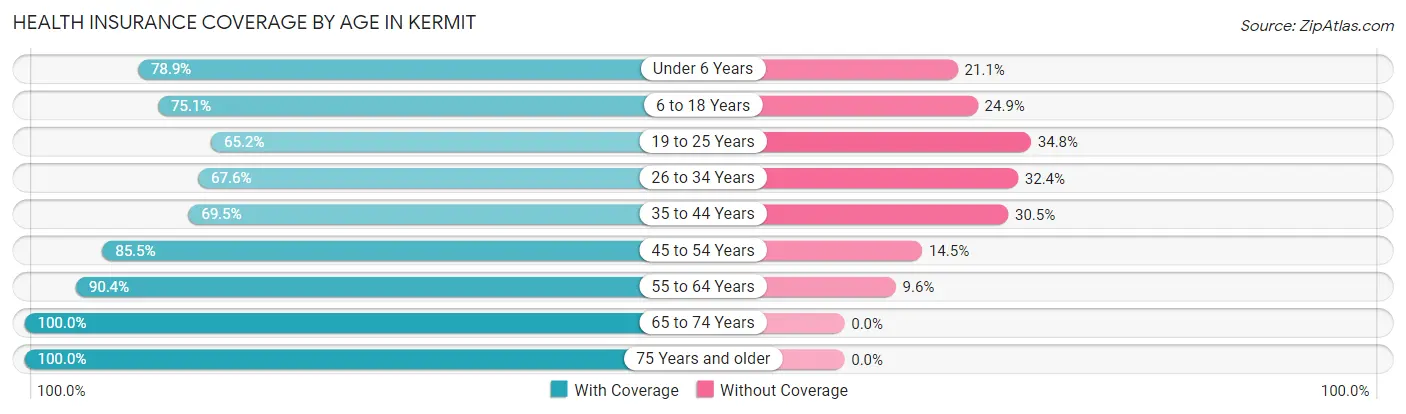
| Age Bracket | With Coverage | Without Coverage |
| Under 6 Years | 500 (78.9%) | 134 (21.1%) |
| 6 to 18 Years | 1,042 (75.1%) | 345 (24.9%) |
| 19 to 25 Years | 298 (65.2%) | 159 (34.8%) |
| 26 to 34 Years | 376 (67.6%) | 180 (32.4%) |
| 35 to 44 Years | 660 (69.5%) | 290 (30.5%) |
| 45 to 54 Years | 490 (85.5%) | 83 (14.5%) |
| 55 to 64 Years | 529 (90.4%) | 56 (9.6%) |
| 65 to 74 Years | 699 (100.0%) | 0 (0.0%) |
| 75 Years and older | 143 (100.0%) | 0 (0.0%) |
| Total | 4,737 (79.2%) | 1,247 (20.8%) |
Health Insurance Coverage by Citizenship Status in Kermit
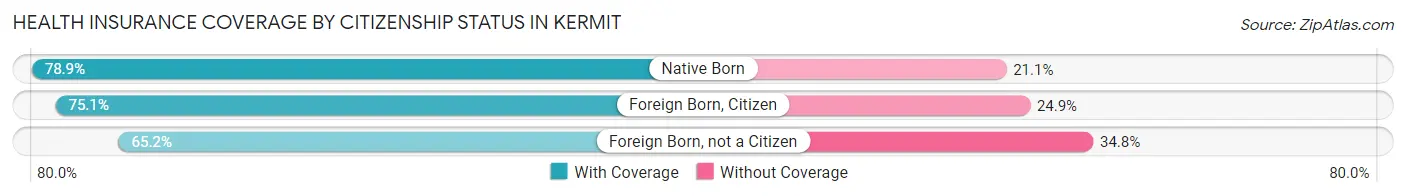
| Citizenship Status | With Coverage | Without Coverage |
| Native Born | 500 (78.9%) | 134 (21.1%) |
| Foreign Born, Citizen | 1,042 (75.1%) | 345 (24.9%) |
| Foreign Born, not a Citizen | 298 (65.2%) | 159 (34.8%) |
Health Insurance Coverage by Household Income in Kermit
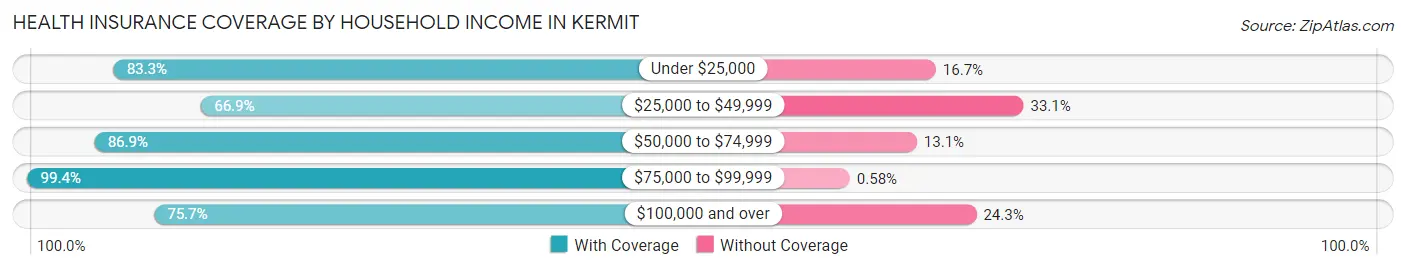
| Household Income | With Coverage | Without Coverage |
| Under $25,000 | 429 (83.3%) | 86 (16.7%) |
| $25,000 to $49,999 | 586 (66.9%) | 290 (33.1%) |
| $50,000 to $74,999 | 641 (86.9%) | 97 (13.1%) |
| $75,000 to $99,999 | 682 (99.4%) | 4 (0.6%) |
| $100,000 and over | 2,399 (75.7%) | 770 (24.3%) |
Public vs Private Health Insurance Coverage by Age in Kermit
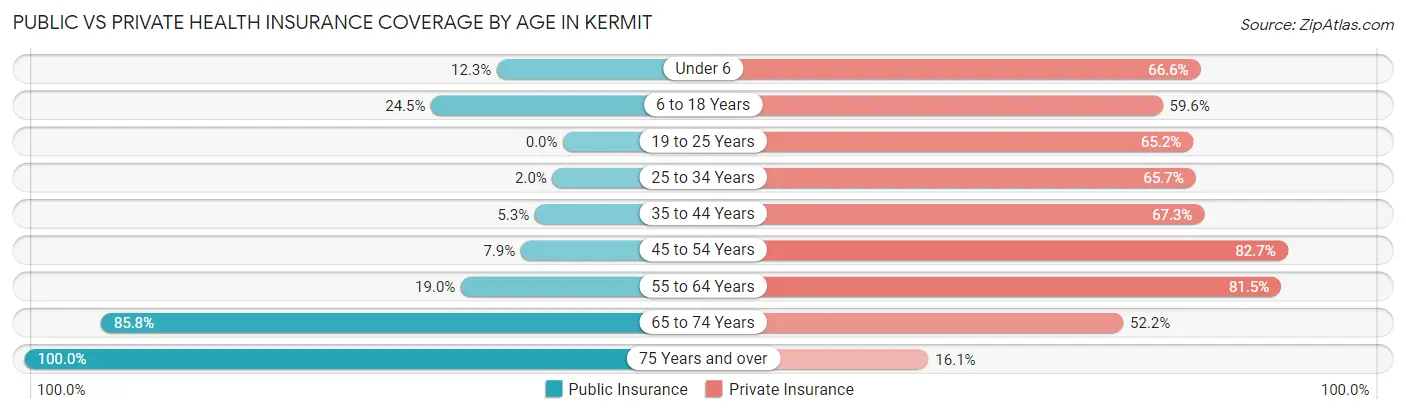
| Age Bracket | Public Insurance | Private Insurance |
| Under 6 | 78 (12.3%) | 422 (66.6%) |
| 6 to 18 Years | 340 (24.5%) | 826 (59.6%) |
| 19 to 25 Years | 0 (0.0%) | 298 (65.2%) |
| 25 to 34 Years | 11 (2.0%) | 365 (65.6%) |
| 35 to 44 Years | 50 (5.3%) | 639 (67.3%) |
| 45 to 54 Years | 45 (7.9%) | 474 (82.7%) |
| 55 to 64 Years | 111 (19.0%) | 477 (81.5%) |
| 65 to 74 Years | 600 (85.8%) | 365 (52.2%) |
| 75 Years and over | 143 (100.0%) | 23 (16.1%) |
| Total | 1,378 (23.0%) | 3,889 (65.0%) |
Disability Status by Sex by Age in Kermit
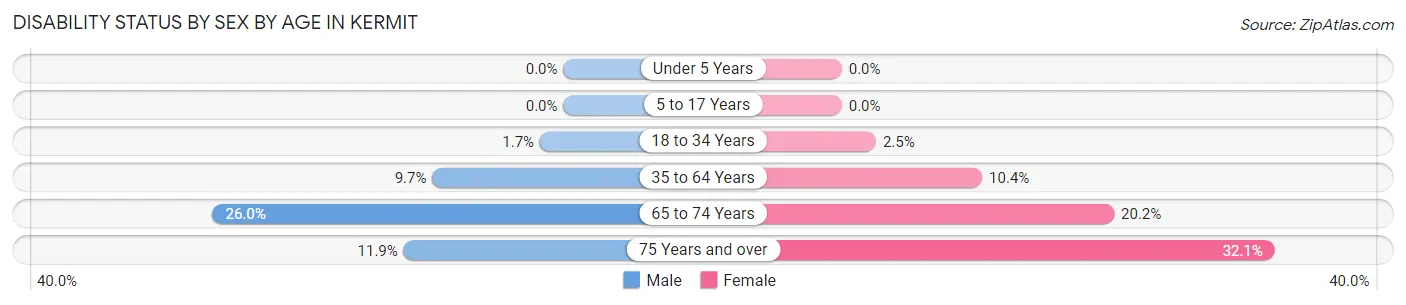
| Age Bracket | Male | Female |
| Under 5 Years | 0 (0.0%) | 0 (0.0%) |
| 5 to 17 Years | 0 (0.0%) | 0 (0.0%) |
| 18 to 34 Years | 11 (1.7%) | 15 (2.5%) |
| 35 to 64 Years | 108 (9.7%) | 104 (10.4%) |
| 65 to 74 Years | 88 (26.0%) | 73 (20.2%) |
| 75 Years and over | 7 (11.9%) | 27 (32.1%) |
Disability Class by Sex by Age in Kermit
Disability Class: Hearing Difficulty
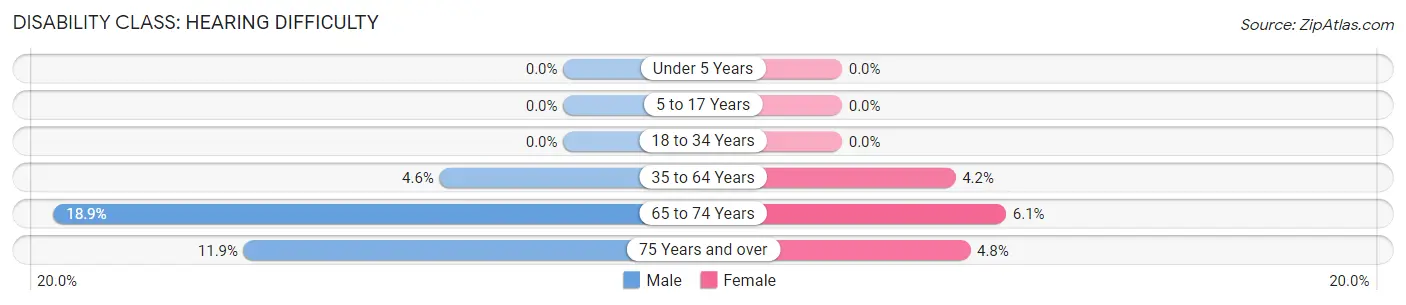
| Age Bracket | Male | Female |
| Under 5 Years | 0 (0.0%) | 0 (0.0%) |
| 5 to 17 Years | 0 (0.0%) | 0 (0.0%) |
| 18 to 34 Years | 0 (0.0%) | 0 (0.0%) |
| 35 to 64 Years | 51 (4.6%) | 42 (4.2%) |
| 65 to 74 Years | 64 (18.9%) | 22 (6.1%) |
| 75 Years and over | 7 (11.9%) | 4 (4.8%) |
Disability Class: Vision Difficulty
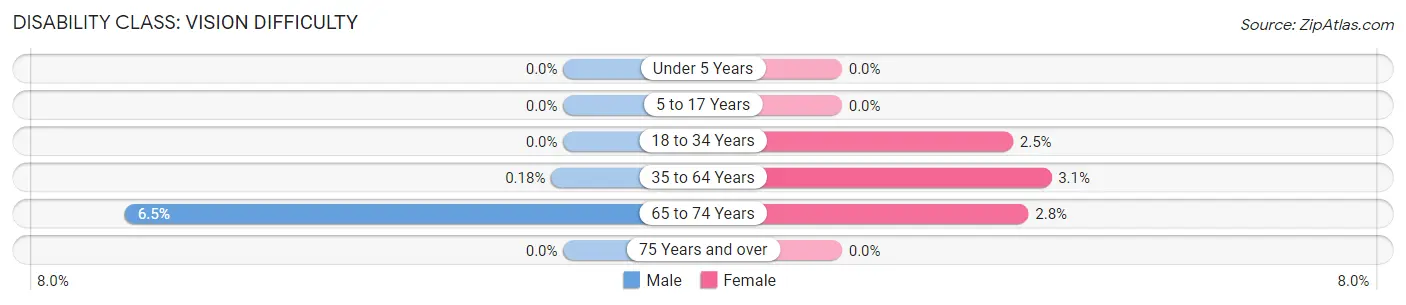
| Age Bracket | Male | Female |
| Under 5 Years | 0 (0.0%) | 0 (0.0%) |
| 5 to 17 Years | 0 (0.0%) | 0 (0.0%) |
| 18 to 34 Years | 0 (0.0%) | 15 (2.5%) |
| 35 to 64 Years | 2 (0.2%) | 31 (3.1%) |
| 65 to 74 Years | 22 (6.5%) | 10 (2.8%) |
| 75 Years and over | 0 (0.0%) | 0 (0.0%) |
Disability Class: Cognitive Difficulty
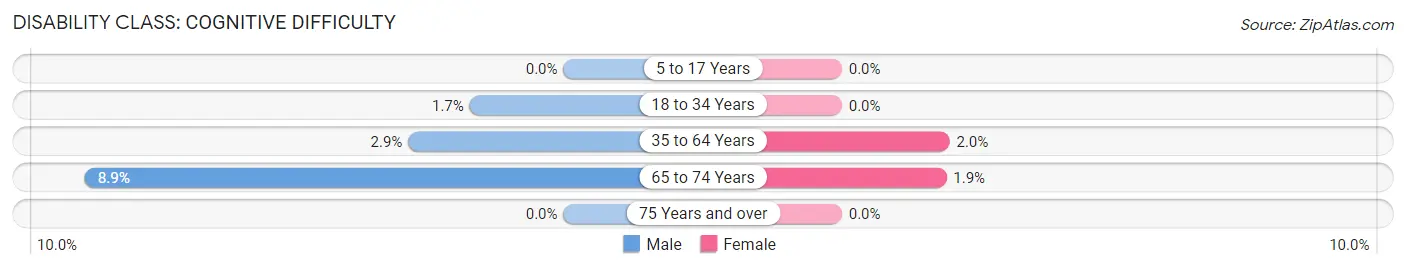
| Age Bracket | Male | Female |
| 5 to 17 Years | 0 (0.0%) | 0 (0.0%) |
| 18 to 34 Years | 11 (1.7%) | 0 (0.0%) |
| 35 to 64 Years | 32 (2.9%) | 20 (2.0%) |
| 65 to 74 Years | 30 (8.9%) | 7 (1.9%) |
| 75 Years and over | 0 (0.0%) | 0 (0.0%) |
Disability Class: Ambulatory Difficulty
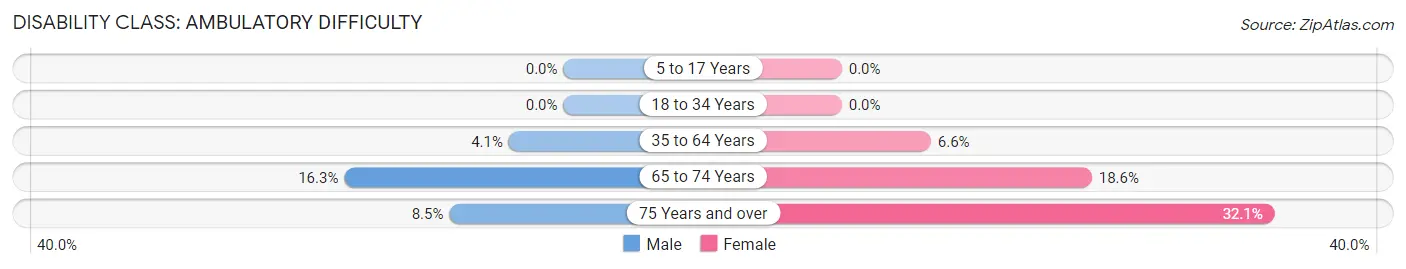
| Age Bracket | Male | Female |
| 5 to 17 Years | 0 (0.0%) | 0 (0.0%) |
| 18 to 34 Years | 0 (0.0%) | 0 (0.0%) |
| 35 to 64 Years | 45 (4.1%) | 66 (6.6%) |
| 65 to 74 Years | 55 (16.3%) | 67 (18.6%) |
| 75 Years and over | 5 (8.5%) | 27 (32.1%) |
Disability Class: Self-Care Difficulty
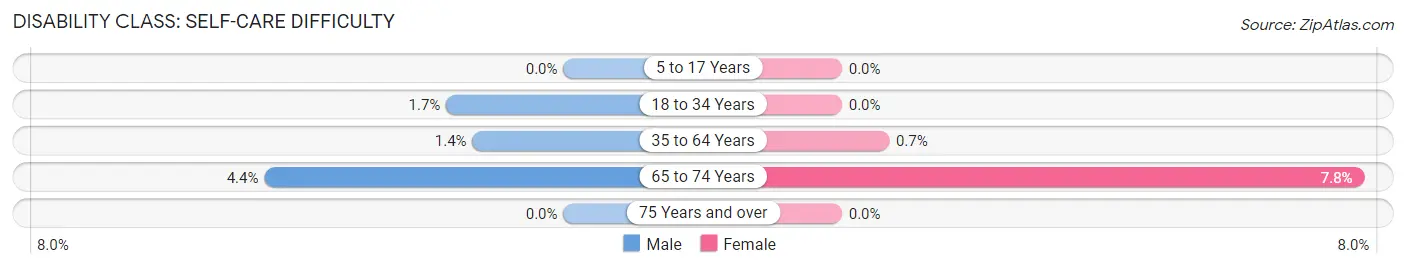
| Age Bracket | Male | Female |
| 5 to 17 Years | 0 (0.0%) | 0 (0.0%) |
| 18 to 34 Years | 11 (1.7%) | 0 (0.0%) |
| 35 to 64 Years | 15 (1.3%) | 7 (0.7%) |
| 65 to 74 Years | 15 (4.4%) | 28 (7.8%) |
| 75 Years and over | 0 (0.0%) | 0 (0.0%) |
Technology Access in Kermit
Computing Device Access in Kermit
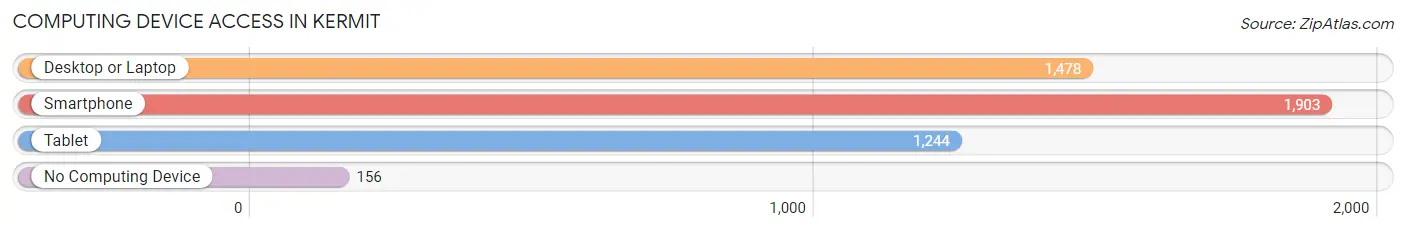
| Device Type | # Households | % Households |
| Desktop or Laptop | 1,478 | 70.1% |
| Smartphone | 1,903 | 90.2% |
| Tablet | 1,244 | 59.0% |
| No Computing Device | 156 | 7.4% |
| Total | 2,110 | 100.0% |
Internet Access in Kermit
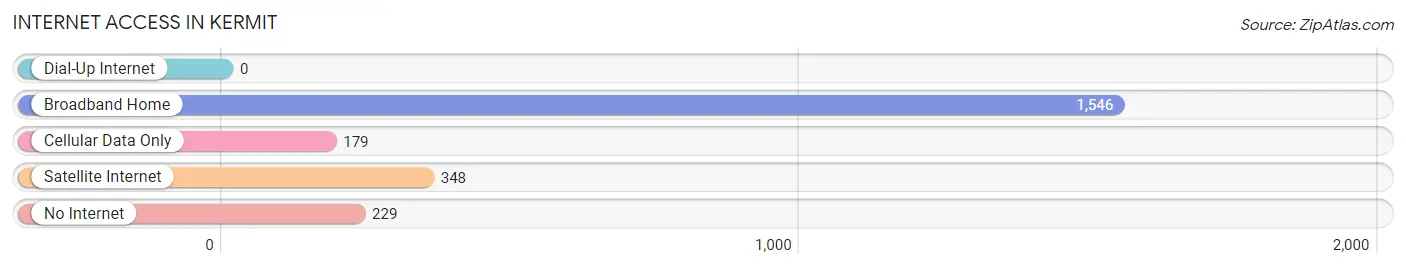
| Internet Type | # Households | % Households |
| Dial-Up Internet | 0 | 0.0% |
| Broadband Home | 1,546 | 73.3% |
| Cellular Data Only | 179 | 8.5% |
| Satellite Internet | 348 | 16.5% |
| No Internet | 229 | 10.8% |
| Total | 2,110 | 100.0% |
Kermit Summary
Kermit is a city located in the western part of Texas, in Winkler County. It is situated at the intersection of U.S. Highway 180 and State Highway 302, approximately 40 miles west of Odessa and 40 miles east of Monahans. The city was named after Kermit Roosevelt, the son of President Theodore Roosevelt.
History
Kermit was founded in 1909 by the Texas and Pacific Railway. The city was originally known as Saratoga, but the name was changed to Kermit in 1910. The city was incorporated in 1911 and was named after Kermit Roosevelt, the son of President Theodore Roosevelt.
The city was a major center for oil production in the early 20th century. In the 1920s, the city was home to several oil refineries and was the site of the first oil well drilled in the Permian Basin. The city was also home to the first natural gas well in the Permian Basin.
In the 1950s, the city experienced a population boom due to the discovery of oil and natural gas in the area. The population peaked at around 10,000 in the 1960s.
Geography
Kermit is located in the western part of Texas, in Winkler County. It is situated at the intersection of U.S. Highway 180 and State Highway 302, approximately 40 miles west of Odessa and 40 miles east of Monahans. The city is located in the Permian Basin, an area of West Texas that is known for its oil and natural gas production.
The city has a total area of 4.2 square miles, all of which is land. The terrain is mostly flat, with some rolling hills in the area. The climate is semi-arid, with hot summers and mild winters.
Economy
Kermit’s economy is largely based on oil and natural gas production. The city is home to several oil and gas companies, including Chevron, ExxonMobil, and ConocoPhillips. The city is also home to several manufacturing companies, including a plastics plant and a steel fabrication plant.
The city is also home to several retail stores, restaurants, and other businesses. The city is served by the Kermit Independent School District, which includes two elementary schools, a middle school, and a high school.
Demographics
As of the 2010 census, the population of Kermit was 6,190. The racial makeup of the city was 75.3% White, 0.7% African American, 0.7% Native American, 0.3% Asian, 0.1% Pacific Islander, 20.3% from other races, and 2.6% from two or more races. Hispanic or Latino of any race were 44.2% of the population.
The median household income in Kermit was $31,944, and the median family income was $37,813. The per capita income was $15,945. About 22.2% of families and 25.7% of the population were below the poverty line, including 36.2% of those under age 18 and 16.2% of those age 65 or over.
Kermit is served by the Winkler County Memorial Hospital, which provides medical care to the city and surrounding area. The city is also served by the Kermit Police Department, which provides law enforcement services to the city.
Common Questions
What is Per Capita Income in Kermit?
Per Capita income in Kermit is $30,493.
What is the Median Family Income in Kermit?
Median Family Income in Kermit is $85,417.
What is the Median Household income in Kermit?
Median Household Income in Kermit is $84,931.
What is Income or Wage Gap in Kermit?
Income or Wage Gap in Kermit is 42.9%.
Women in Kermit earn 57.1 cents for every dollar earned by a man.
What is Family Income Deficit in Kermit?
Family Income Deficit in Kermit is $11,586.
Families that are below poverty line in Kermit earn $11,586 less on average than the poverty threshold level.
What is Inequality or Gini Index in Kermit?
Inequality or Gini Index in Kermit is 0.34.
What is the Total Population of Kermit?
Total Population of Kermit is 5,984.
What is the Total Male Population of Kermit?
Total Male Population of Kermit is 3,075.
What is the Total Female Population of Kermit?
Total Female Population of Kermit is 2,909.
What is the Ratio of Males per 100 Females in Kermit?
There are 105.71 Males per 100 Females in Kermit.
What is the Ratio of Females per 100 Males in Kermit?
There are 94.60 Females per 100 Males in Kermit.
What is the Median Population Age in Kermit?
Median Population Age in Kermit is 33.0 Years.
What is the Average Family Size in Kermit
Average Family Size in Kermit is 3.3 People.
What is the Average Household Size in Kermit
Average Household Size in Kermit is 2.8 People.
How Large is the Labor Force in Kermit?
There are 2,728 People in the Labor Forcein in Kermit.
What is the Percentage of People in the Labor Force in Kermit?
61.8% of People are in the Labor Force in Kermit.
What is the Unemployment Rate in Kermit?
Unemployment Rate in Kermit is 2.9%.