Kaufman, TX Map & Demographics
Kaufman Map
Kaufman Overview
$26,037
PER CAPITA INCOME
$64,640
AVG FAMILY INCOME
$55,349
AVG HOUSEHOLD INCOME
20.4%
WAGE / INCOME GAP [ % ]
79.6¢/ $1
WAGE / INCOME GAP [ $ ]
0.45
INEQUALITY / GINI INDEX
7,520
TOTAL POPULATION
3,697
MALE POPULATION
3,823
FEMALE POPULATION
96.70
MALES / 100 FEMALES
103.41
FEMALES / 100 MALES
30.9
MEDIAN AGE
3.9
AVG FAMILY SIZE
3.0
AVG HOUSEHOLD SIZE
3,385
LABOR FORCE [ PEOPLE ]
63.9%
PERCENT IN LABOR FORCE
5.2%
UNEMPLOYMENT RATE
Kaufman Zip Codes
Income in Kaufman
Income Overview in Kaufman
Per Capita Income in Kaufman is $26,037, while median incomes of families and households are $64,640 and $55,349 respectively.
| Characteristic | Number | Measure |
| Per Capita Income | 7,520 | $26,037 |
| Median Family Income | 1,409 | $64,640 |
| Mean Family Income | 1,409 | $80,683 |
| Median Household Income | 2,288 | $55,349 |
| Mean Household Income | 2,288 | $77,543 |
| Income Deficit | 1,409 | $0 |
| Wage / Income Gap (%) | 7,520 | 20.42% |
| Wage / Income Gap ($) | 7,520 | 79.58¢ per $1 |
| Gini / Inequality Index | 7,520 | 0.45 |
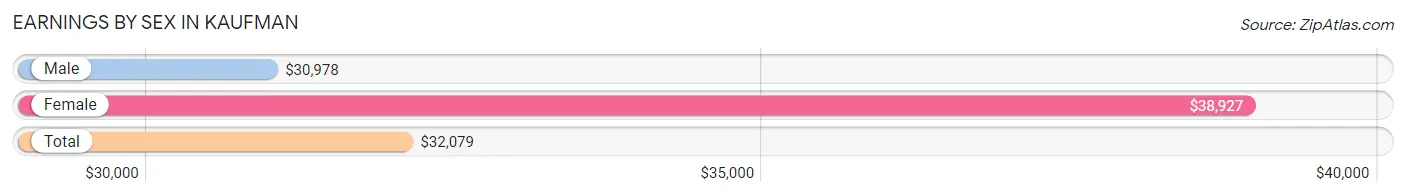
Earnings by Sex in Kaufman
Average Earnings in Kaufman are $32,079, $30,978 for men and $38,927 for women, a difference of 20.4%.
| Sex | Number | Average Earnings |
| Male | 2,148 (58.4%) | $30,978 |
| Female | 1,533 (41.6%) | $38,927 |
| Total | 3,681 (100.0%) | $32,079 |
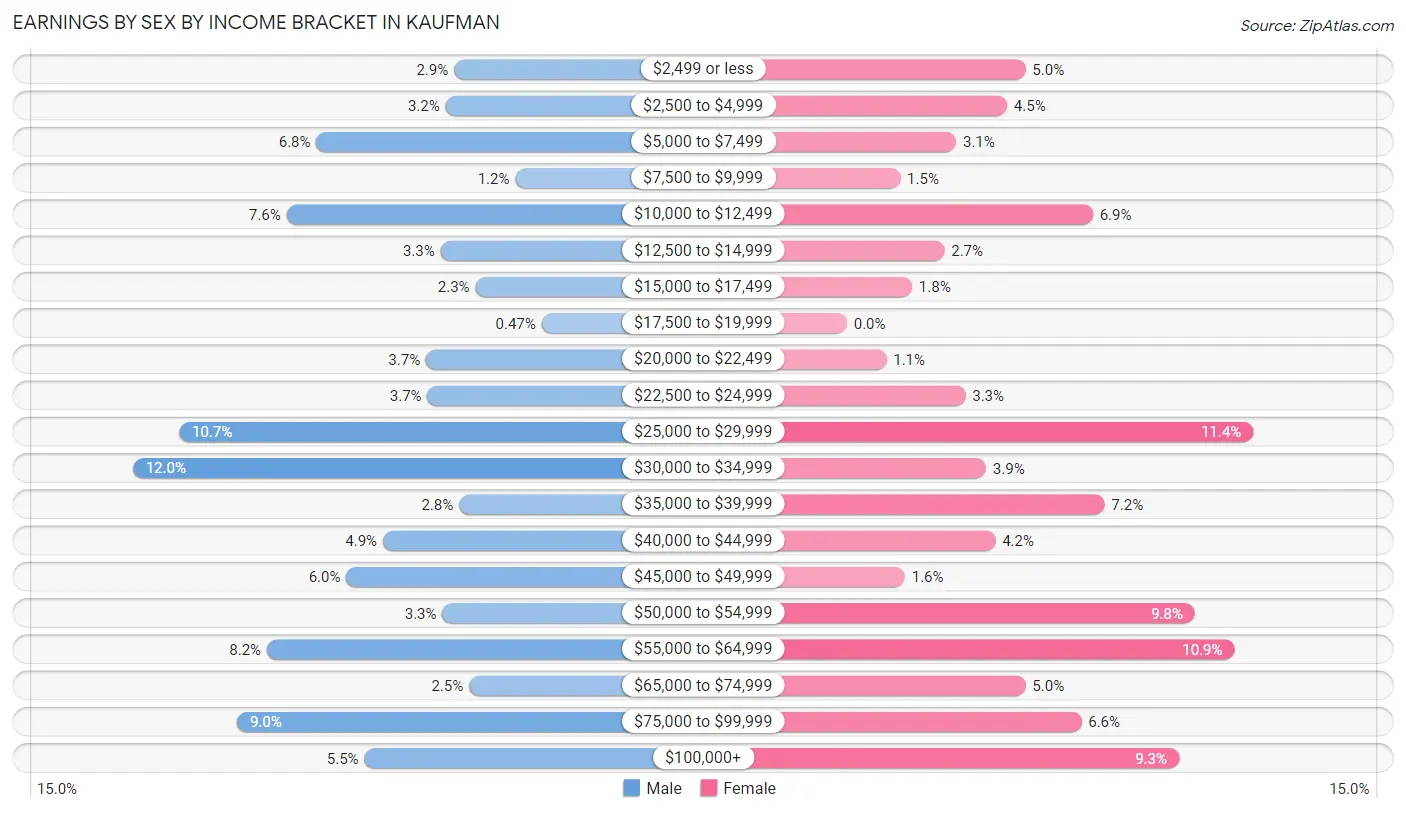
Earnings by Sex by Income Bracket in Kaufman
The most common earnings brackets in Kaufman are $30,000 to $34,999 for men (257 | 12.0%) and $25,000 to $29,999 for women (175 | 11.4%).
| Income | Male | Female |
| $2,499 or less | 63 (2.9%) | 77 (5.0%) |
| $2,500 to $4,999 | 68 (3.2%) | 69 (4.5%) |
| $5,000 to $7,499 | 146 (6.8%) | 47 (3.1%) |
| $7,500 to $9,999 | 26 (1.2%) | 23 (1.5%) |
| $10,000 to $12,499 | 164 (7.6%) | 106 (6.9%) |
| $12,500 to $14,999 | 71 (3.3%) | 42 (2.7%) |
| $15,000 to $17,499 | 50 (2.3%) | 28 (1.8%) |
| $17,500 to $19,999 | 10 (0.5%) | 0 (0.0%) |
| $20,000 to $22,499 | 80 (3.7%) | 17 (1.1%) |
| $22,500 to $24,999 | 79 (3.7%) | 51 (3.3%) |
| $25,000 to $29,999 | 229 (10.7%) | 175 (11.4%) |
| $30,000 to $34,999 | 257 (12.0%) | 60 (3.9%) |
| $35,000 to $39,999 | 60 (2.8%) | 111 (7.2%) |
| $40,000 to $44,999 | 106 (4.9%) | 64 (4.2%) |
| $45,000 to $49,999 | 128 (6.0%) | 25 (1.6%) |
| $50,000 to $54,999 | 70 (3.3%) | 150 (9.8%) |
| $55,000 to $64,999 | 176 (8.2%) | 167 (10.9%) |
| $65,000 to $74,999 | 54 (2.5%) | 77 (5.0%) |
| $75,000 to $99,999 | 194 (9.0%) | 101 (6.6%) |
| $100,000+ | 117 (5.4%) | 143 (9.3%) |
| Total | 2,148 (100.0%) | 1,533 (100.0%) |
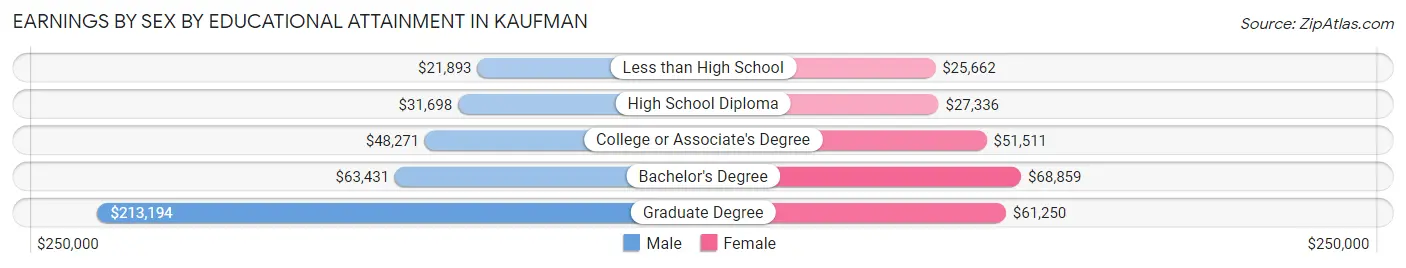
Earnings by Sex by Educational Attainment in Kaufman
Average earnings in Kaufman are $32,083 for men and $41,250 for women, a difference of 22.2%. Men with an educational attainment of graduate degree enjoy the highest average annual earnings of $213,194, while those with less than high school education earn the least with $21,893. Women with an educational attainment of bachelor's degree earn the most with the average annual earnings of $68,859, while those with less than high school education have the smallest earnings of $25,662.
| Educational Attainment | Male Income | Female Income |
| Less than High School | $21,893 | $25,662 |
| High School Diploma | $31,698 | $27,336 |
| College or Associate's Degree | $48,271 | $51,511 |
| Bachelor's Degree | $63,431 | $68,859 |
| Graduate Degree | $213,194 | $61,250 |
| Total | $32,083 | $41,250 |
Family Income in Kaufman
Family Income Brackets in Kaufman
According to the Kaufman family income data, there are 361 families falling into the $100,000 to $149,999 income range, which is the most common income bracket and makes up 25.6% of all families. Conversely, the $10,000 to $14,999 income bracket is the least frequent group with only 18 families (1.3%) belonging to this category.
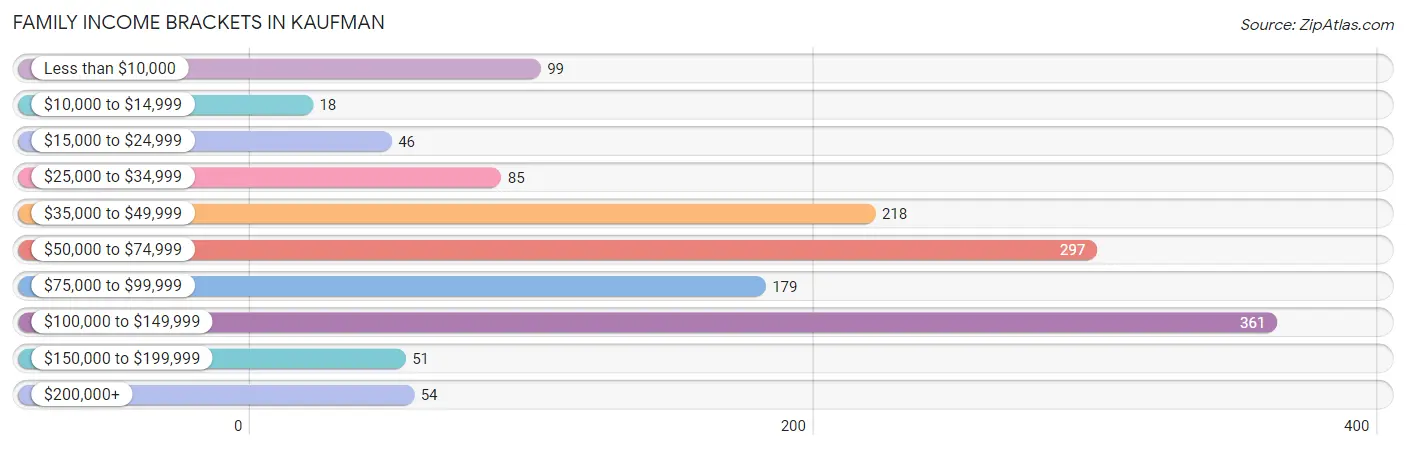
| Income Bracket | # Families | % Families |
| Less than $10,000 | 99 | 7.0% |
| $10,000 to $14,999 | 18 | 1.3% |
| $15,000 to $24,999 | 46 | 3.3% |
| $25,000 to $34,999 | 85 | 6.0% |
| $35,000 to $49,999 | 218 | 15.5% |
| $50,000 to $74,999 | 297 | 21.1% |
| $75,000 to $99,999 | 179 | 12.7% |
| $100,000 to $149,999 | 361 | 25.6% |
| $150,000 to $199,999 | 51 | 3.6% |
| $200,000+ | 54 | 3.8% |
Family Income by Famaliy Size in Kaufman
6-person families (173 | 12.3%) account for the highest median family income in Kaufman with $112,816 per family, while 3-person families (136 | 9.7%) have the highest median income of $27,222 per family member.
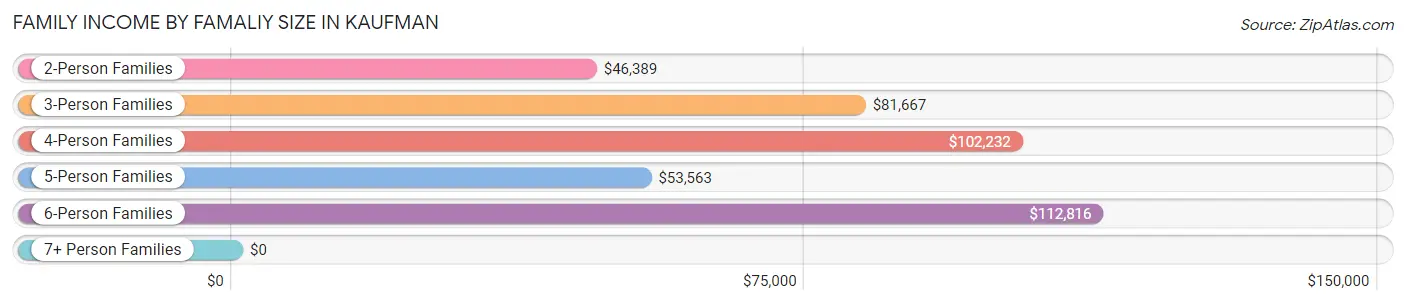
| Income Bracket | # Families | Median Income |
| 2-Person Families | 456 (32.4%) | $46,389 |
| 3-Person Families | 136 (9.7%) | $81,667 |
| 4-Person Families | 379 (26.9%) | $102,232 |
| 5-Person Families | 176 (12.5%) | $53,563 |
| 6-Person Families | 173 (12.3%) | $112,816 |
| 7+ Person Families | 89 (6.3%) | $0 |
| Total | 1,409 (100.0%) | $64,640 |
Family Income by Number of Earners in Kaufman
The median family income in Kaufman is $64,640, with families comprising 3+ earners (237) having the highest median family income of $100,550, while families with no earners (168) have the lowest median family income of $28,382, accounting for 16.8% and 11.9% of families, respectively.
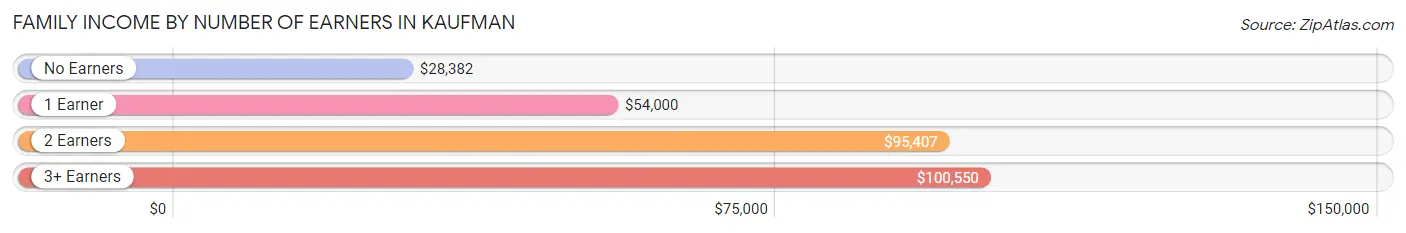
| Number of Earners | # Families | Median Income |
| No Earners | 168 (11.9%) | $28,382 |
| 1 Earner | 512 (36.3%) | $54,000 |
| 2 Earners | 492 (34.9%) | $95,407 |
| 3+ Earners | 237 (16.8%) | $100,550 |
| Total | 1,409 (100.0%) | $64,640 |
Household Income in Kaufman
Household Income Brackets in Kaufman
With 510 households falling in the category, the $100,000 to $149,999 income range is the most frequent in Kaufman, accounting for 22.3% of all households. In contrast, only 73 households (3.2%) fall into the $10,000 to $14,999 income bracket, making it the least populous group.
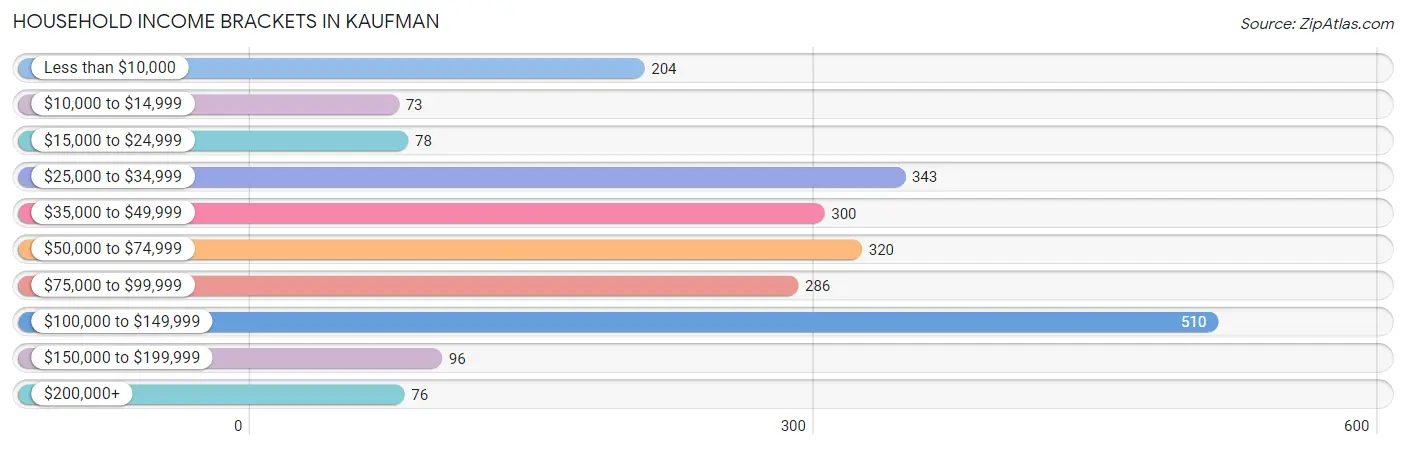
| Income Bracket | # Households | % Households |
| Less than $10,000 | 204 | 8.9% |
| $10,000 to $14,999 | 73 | 3.2% |
| $15,000 to $24,999 | 78 | 3.4% |
| $25,000 to $34,999 | 343 | 15.0% |
| $35,000 to $49,999 | 300 | 13.1% |
| $50,000 to $74,999 | 320 | 14.0% |
| $75,000 to $99,999 | 286 | 12.5% |
| $100,000 to $149,999 | 510 | 22.3% |
| $150,000 to $199,999 | 96 | 4.2% |
| $200,000+ | 76 | 3.3% |
Household Income by Householder Age in Kaufman
The median household income in Kaufman is $55,349, with the highest median household income of $77,843 found in the 45 to 64 years age bracket for the primary householder. A total of 624 households (27.3%) fall into this category. Meanwhile, the 15 to 24 years age bracket for the primary householder has the lowest median household income of $0, with 55 households (2.4%) in this group.
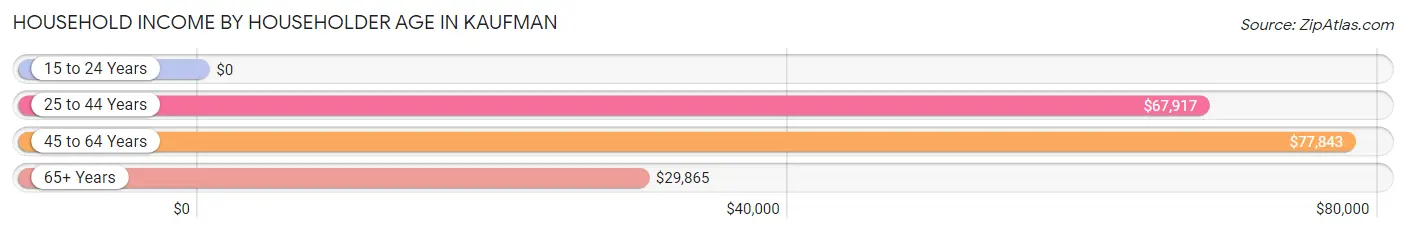
| Income Bracket | # Households | Median Income |
| 15 to 24 Years | 55 (2.4%) | $0 |
| 25 to 44 Years | 1,084 (47.4%) | $67,917 |
| 45 to 64 Years | 624 (27.3%) | $77,843 |
| 65+ Years | 525 (23.0%) | $29,865 |
| Total | 2,288 (100.0%) | $55,349 |
Poverty in Kaufman
Income Below Poverty by Sex and Age in Kaufman
With 16.6% poverty level for males and 19.4% for females among the residents of Kaufman, 12 to 14 year old males and 5 year old females are the most vulnerable to poverty, with 99 males (69.2%) and 17 females (68.0%) in their respective age groups living below the poverty level.
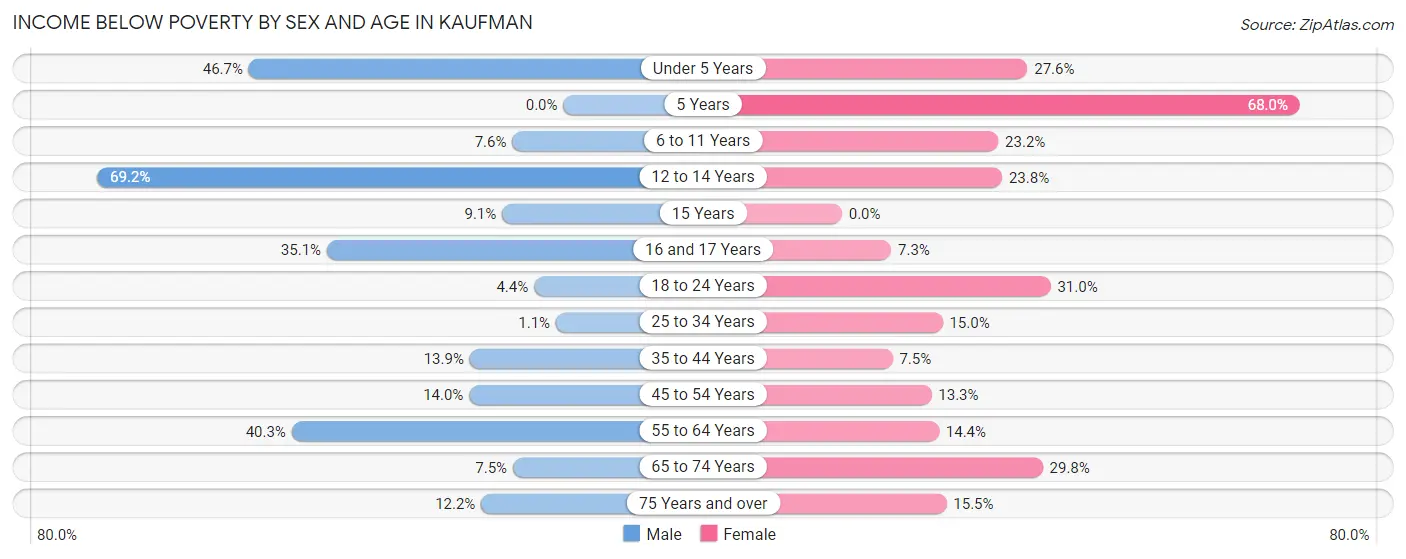
| Age Bracket | Male | Female |
| Under 5 Years | 71 (46.7%) | 116 (27.6%) |
| 5 Years | 0 (0.0%) | 17 (68.0%) |
| 6 to 11 Years | 30 (7.6%) | 137 (23.2%) |
| 12 to 14 Years | 99 (69.2%) | 59 (23.8%) |
| 15 Years | 6 (9.1%) | 0 (0.0%) |
| 16 and 17 Years | 33 (35.1%) | 6 (7.3%) |
| 18 to 24 Years | 14 (4.3%) | 75 (31.0%) |
| 25 to 34 Years | 4 (1.1%) | 90 (14.9%) |
| 35 to 44 Years | 107 (13.9%) | 37 (7.5%) |
| 45 to 54 Years | 39 (14.0%) | 27 (13.3%) |
| 55 to 64 Years | 119 (40.3%) | 32 (14.4%) |
| 65 to 74 Years | 17 (7.5%) | 82 (29.8%) |
| 75 Years and over | 10 (12.2%) | 34 (15.5%) |
| Total | 549 (16.6%) | 712 (19.4%) |
Income Above Poverty by Sex and Age in Kaufman
According to the poverty statistics in Kaufman, males aged 5 years and females aged 15 years are the age groups that are most secure financially, with 100.0% of males and 100.0% of females in these age groups living above the poverty line.
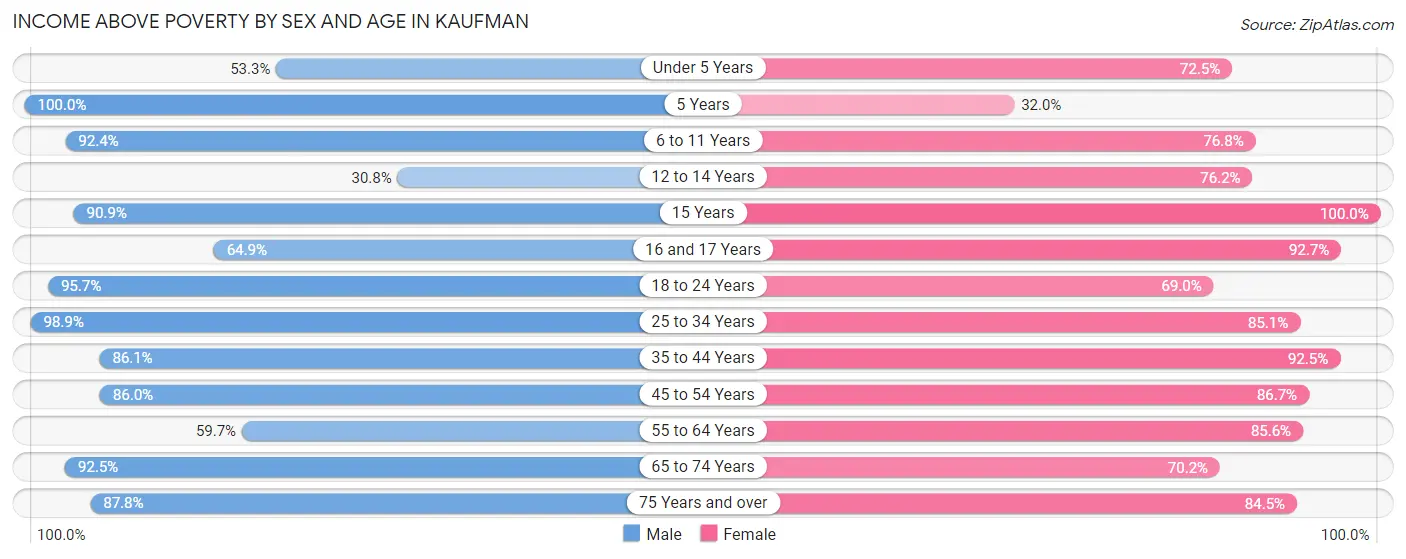
| Age Bracket | Male | Female |
| Under 5 Years | 81 (53.3%) | 305 (72.5%) |
| 5 Years | 120 (100.0%) | 8 (32.0%) |
| 6 to 11 Years | 366 (92.4%) | 453 (76.8%) |
| 12 to 14 Years | 44 (30.8%) | 189 (76.2%) |
| 15 Years | 60 (90.9%) | 55 (100.0%) |
| 16 and 17 Years | 61 (64.9%) | 76 (92.7%) |
| 18 to 24 Years | 308 (95.7%) | 167 (69.0%) |
| 25 to 34 Years | 359 (98.9%) | 512 (85.1%) |
| 35 to 44 Years | 663 (86.1%) | 455 (92.5%) |
| 45 to 54 Years | 240 (86.0%) | 176 (86.7%) |
| 55 to 64 Years | 176 (59.7%) | 190 (85.6%) |
| 65 to 74 Years | 210 (92.5%) | 193 (70.2%) |
| 75 Years and over | 72 (87.8%) | 185 (84.5%) |
| Total | 2,760 (83.4%) | 2,964 (80.6%) |
Income Below Poverty Among Married-Couple Families in Kaufman
The poverty statistics for married-couple families in Kaufman show that 13.1% or 110 of the total 838 families live below the poverty line. Families with 5 or more children have the highest poverty rate of 100.0%, comprising of 34 families. On the other hand, families with no children have the lowest poverty rate of 6.5%, which includes 17 families.
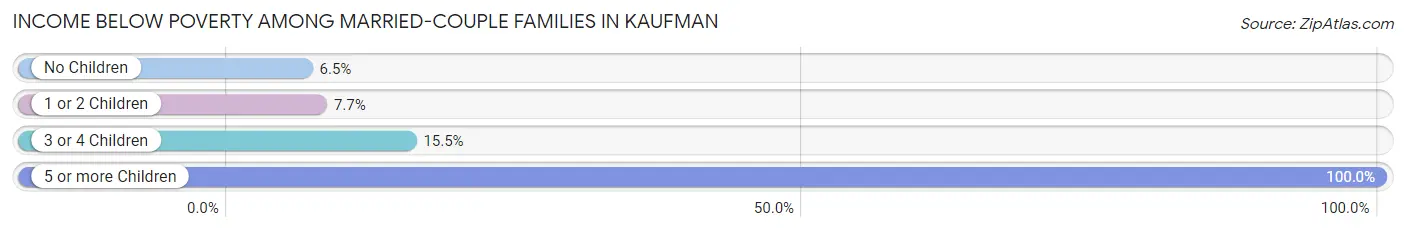
| Children | Above Poverty | Below Poverty |
| No Children | 245 (93.5%) | 17 (6.5%) |
| 1 or 2 Children | 298 (92.3%) | 25 (7.7%) |
| 3 or 4 Children | 185 (84.5%) | 34 (15.5%) |
| 5 or more Children | 0 (0.0%) | 34 (100.0%) |
| Total | 728 (86.9%) | 110 (13.1%) |
Income Below Poverty Among Single-Parent Households in Kaufman
According to the poverty data in Kaufman, 15.0% or 18 single-father households and 18.6% or 84 single-mother households are living below the poverty line. Among single-father households, those with 3 or 4 children have the highest poverty rate, with 18 households (100.0%) experiencing poverty. Likewise, among single-mother households, those with 3 or 4 children have the highest poverty rate, with 15 households (55.6%) falling below the poverty line.
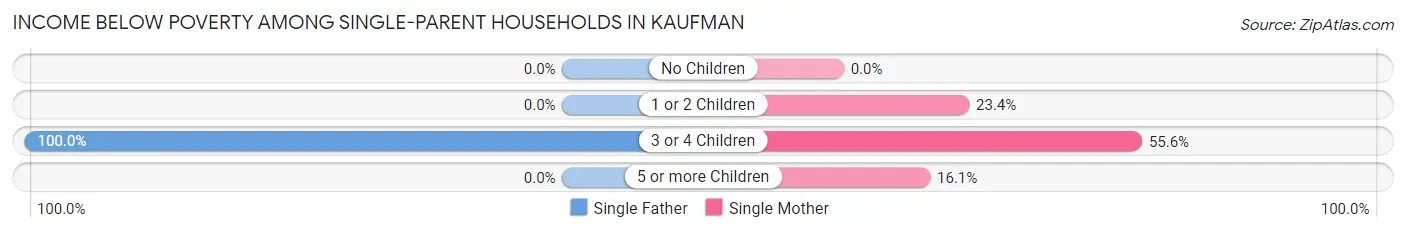
| Children | Single Father | Single Mother |
| No Children | 0 (0.0%) | 0 (0.0%) |
| 1 or 2 Children | 0 (0.0%) | 50 (23.4%) |
| 3 or 4 Children | 18 (100.0%) | 15 (55.6%) |
| 5 or more Children | 0 (0.0%) | 19 (16.1%) |
| Total | 18 (15.0%) | 84 (18.6%) |
Income Below Poverty Among Married-Couple vs Single-Parent Households in Kaufman
The poverty data for Kaufman shows that 110 of the married-couple family households (13.1%) and 102 of the single-parent households (17.9%) are living below the poverty level. Within the married-couple family households, those with 5 or more children have the highest poverty rate, with 34 households (100.0%) falling below the poverty line. Among the single-parent households, those with 3 or 4 children have the highest poverty rate, with 33 household (73.3%) living below poverty.
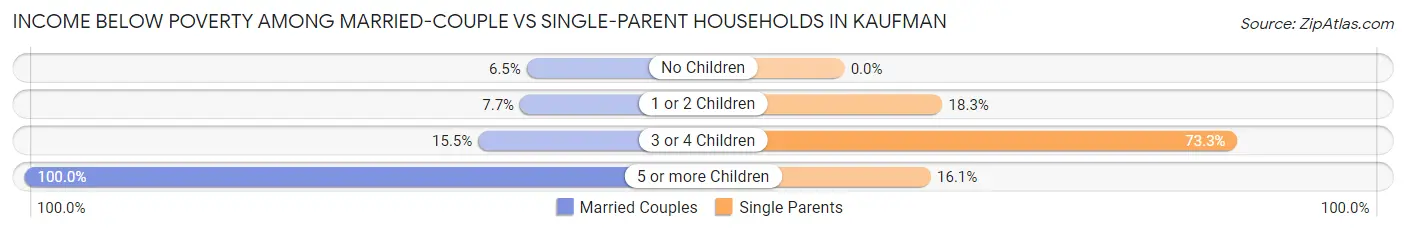
| Children | Married-Couple Families | Single-Parent Households |
| No Children | 17 (6.5%) | 0 (0.0%) |
| 1 or 2 Children | 25 (7.7%) | 50 (18.2%) |
| 3 or 4 Children | 34 (15.5%) | 33 (73.3%) |
| 5 or more Children | 34 (100.0%) | 19 (16.1%) |
| Total | 110 (13.1%) | 102 (17.9%) |
Race in Kaufman
The most populous races in Kaufman are White / Caucasian (5,340 | 71.0%), Hispanic or Latino (2,629 | 35.0%), and Two or more Races (893 | 11.9%).
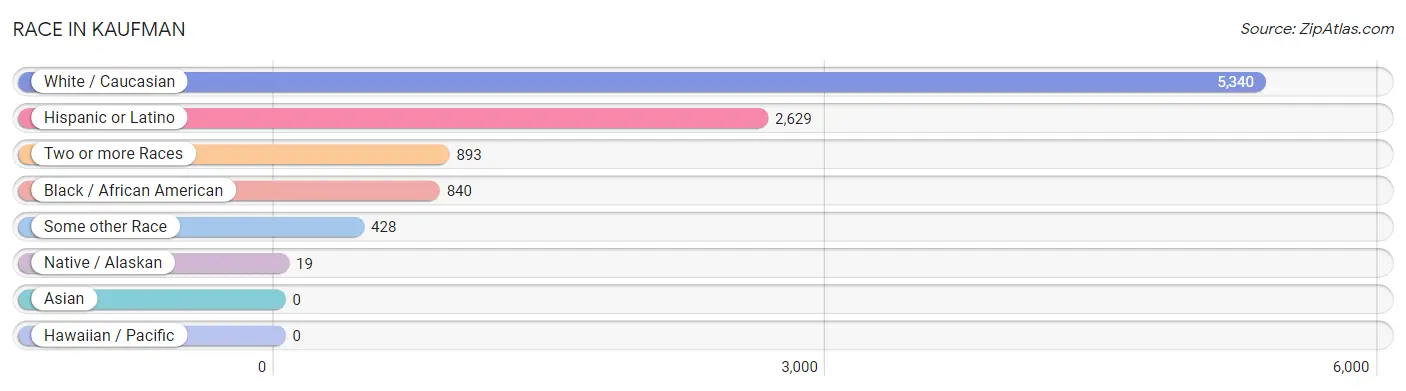
| Race | # Population | % Population |
| Asian | 0 | 0.0% |
| Black / African American | 840 | 11.2% |
| Hawaiian / Pacific | 0 | 0.0% |
| Hispanic or Latino | 2,629 | 35.0% |
| Native / Alaskan | 19 | 0.3% |
| White / Caucasian | 5,340 | 71.0% |
| Two or more Races | 893 | 11.9% |
| Some other Race | 428 | 5.7% |
| Total | 7,520 | 100.0% |
Ancestry in Kaufman
The most populous ancestries reported in Kaufman are Mexican (2,606 | 34.6%), English (538 | 7.1%), Irish (493 | 6.6%), German (401 | 5.3%), and American (295 | 3.9%), together accounting for 57.6% of all Kaufman residents.
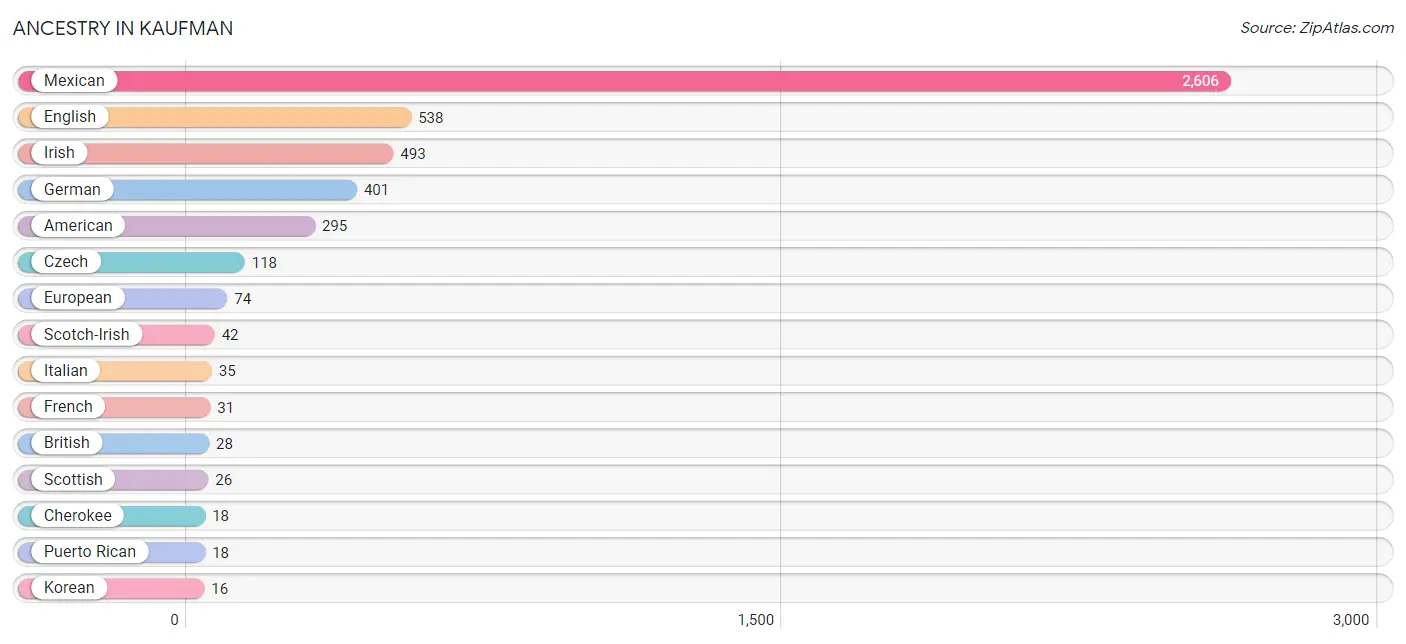
| Ancestry | # Population | % Population |
| American | 295 | 3.9% |
| Apache | 7 | 0.1% |
| Blackfeet | 7 | 0.1% |
| British | 28 | 0.4% |
| Cherokee | 18 | 0.2% |
| Czech | 118 | 1.6% |
| English | 538 | 7.1% |
| European | 74 | 1.0% |
| French | 31 | 0.4% |
| German | 401 | 5.3% |
| Irish | 493 | 6.6% |
| Italian | 35 | 0.5% |
| Kenyan | 8 | 0.1% |
| Korean | 16 | 0.2% |
| Mexican | 2,606 | 34.6% |
| Norwegian | 5 | 0.1% |
| Polish | 4 | 0.1% |
| Puerto Rican | 18 | 0.2% |
| Russian | 8 | 0.1% |
| Scotch-Irish | 42 | 0.6% |
| Scottish | 26 | 0.4% |
| Subsaharan African | 8 | 0.1% |
| Swedish | 12 | 0.2% |
| Swiss | 10 | 0.1% | View All 24 Rows |
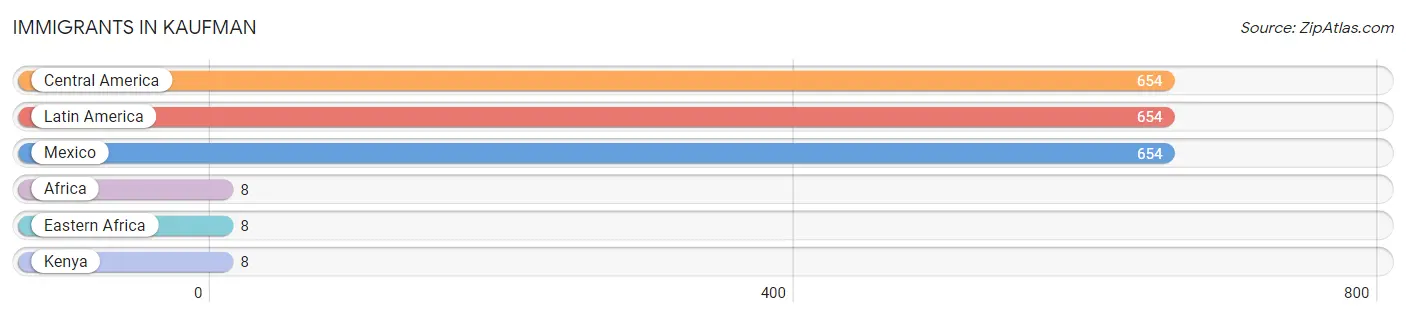
Immigrants in Kaufman
The most numerous immigrant groups reported in Kaufman came from Central America (654 | 8.7%), Latin America (654 | 8.7%), Mexico (654 | 8.7%), Africa (8 | 0.1%), and Eastern Africa (8 | 0.1%), together accounting for 26.3% of all Kaufman residents.
| Immigration Origin | # Population | % Population |
| Africa | 8 | 0.1% |
| Central America | 654 | 8.7% |
| Eastern Africa | 8 | 0.1% |
| Kenya | 8 | 0.1% |
| Latin America | 654 | 8.7% |
| Mexico | 654 | 8.7% | View All 6 Rows |
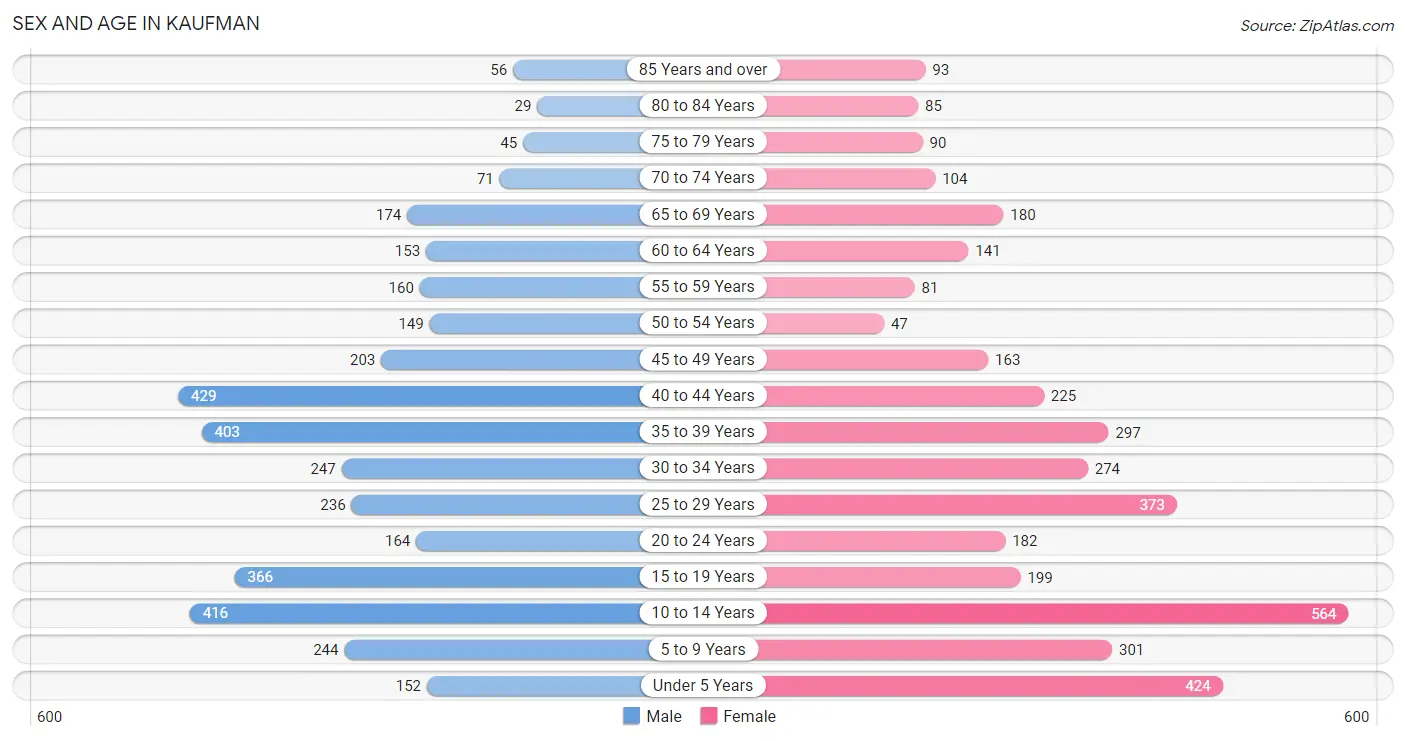
Sex and Age in Kaufman
Sex and Age in Kaufman
The most populous age groups in Kaufman are 40 to 44 Years (429 | 11.6%) for men and 10 to 14 Years (564 | 14.7%) for women.
| Age Bracket | Male | Female |
| Under 5 Years | 152 (4.1%) | 424 (11.1%) |
| 5 to 9 Years | 244 (6.6%) | 301 (7.9%) |
| 10 to 14 Years | 416 (11.3%) | 564 (14.7%) |
| 15 to 19 Years | 366 (9.9%) | 199 (5.2%) |
| 20 to 24 Years | 164 (4.4%) | 182 (4.8%) |
| 25 to 29 Years | 236 (6.4%) | 373 (9.8%) |
| 30 to 34 Years | 247 (6.7%) | 274 (7.2%) |
| 35 to 39 Years | 403 (10.9%) | 297 (7.8%) |
| 40 to 44 Years | 429 (11.6%) | 225 (5.9%) |
| 45 to 49 Years | 203 (5.5%) | 163 (4.3%) |
| 50 to 54 Years | 149 (4.0%) | 47 (1.2%) |
| 55 to 59 Years | 160 (4.3%) | 81 (2.1%) |
| 60 to 64 Years | 153 (4.1%) | 141 (3.7%) |
| 65 to 69 Years | 174 (4.7%) | 180 (4.7%) |
| 70 to 74 Years | 71 (1.9%) | 104 (2.7%) |
| 75 to 79 Years | 45 (1.2%) | 90 (2.4%) |
| 80 to 84 Years | 29 (0.8%) | 85 (2.2%) |
| 85 Years and over | 56 (1.5%) | 93 (2.4%) |
| Total | 3,697 (100.0%) | 3,823 (100.0%) |
Families and Households in Kaufman
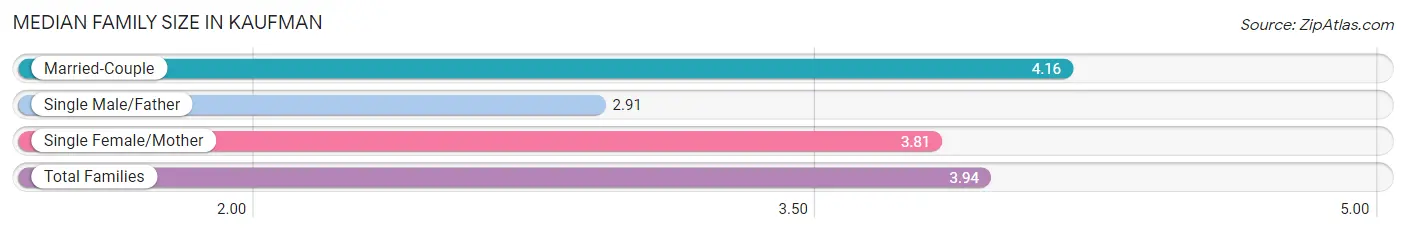
Median Family Size in Kaufman
The median family size in Kaufman is 3.94 persons per family, with married-couple families (838 | 59.5%) accounting for the largest median family size of 4.16 persons per family. On the other hand, single male/father families (120 | 8.5%) represent the smallest median family size with 2.91 persons per family.
| Family Type | # Families | Family Size |
| Married-Couple | 838 (59.5%) | 4.16 |
| Single Male/Father | 120 (8.5%) | 2.91 |
| Single Female/Mother | 451 (32.0%) | 3.81 |
| Total Families | 1,409 (100.0%) | 3.94 |
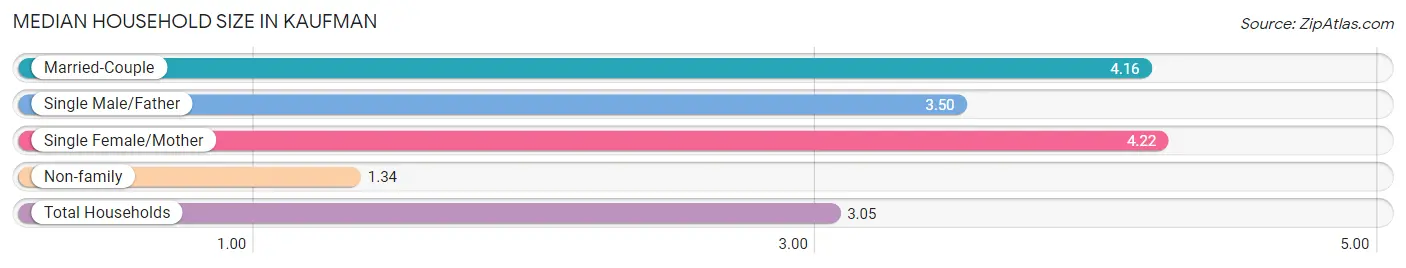
Median Household Size in Kaufman
The median household size in Kaufman is 3.05 persons per household, with single female/mother households (451 | 19.7%) accounting for the largest median household size of 4.22 persons per household. non-family households (879 | 38.4%) represent the smallest median household size with 1.34 persons per household.
| Household Type | # Households | Household Size |
| Married-Couple | 838 (36.6%) | 4.16 |
| Single Male/Father | 120 (5.2%) | 3.50 |
| Single Female/Mother | 451 (19.7%) | 4.22 |
| Non-family | 879 (38.4%) | 1.34 |
| Total Households | 2,288 (100.0%) | 3.05 |
Household Size by Marriage Status in Kaufman
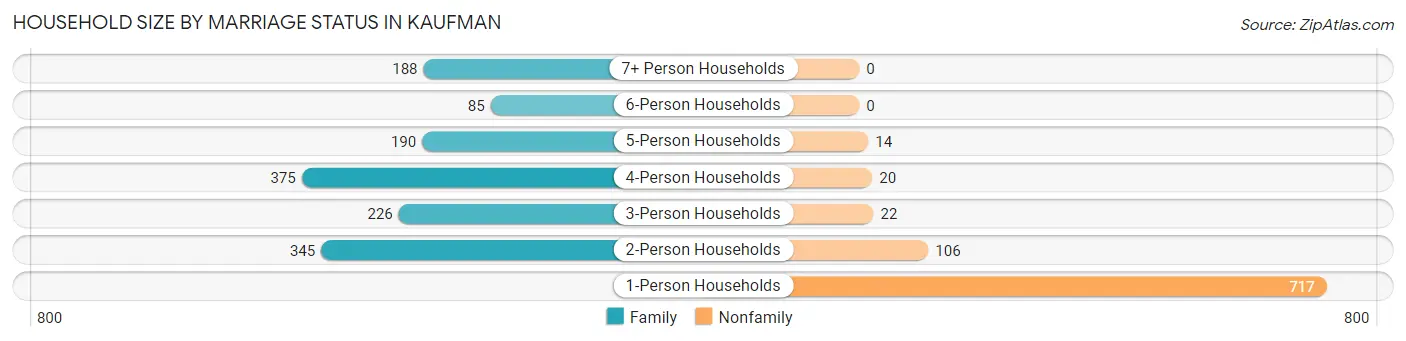
Out of a total of 2,288 households in Kaufman, 1,409 (61.6%) are family households, while 879 (38.4%) are nonfamily households. The most numerous type of family households are 4-person households, comprising 375, and the most common type of nonfamily households are 1-person households, comprising 717.
| Household Size | Family Households | Nonfamily Households |
| 1-Person Households | - | 717 (31.3%) |
| 2-Person Households | 345 (15.1%) | 106 (4.6%) |
| 3-Person Households | 226 (9.9%) | 22 (1.0%) |
| 4-Person Households | 375 (16.4%) | 20 (0.9%) |
| 5-Person Households | 190 (8.3%) | 14 (0.6%) |
| 6-Person Households | 85 (3.7%) | 0 (0.0%) |
| 7+ Person Households | 188 (8.2%) | 0 (0.0%) |
| Total | 1,409 (61.6%) | 879 (38.4%) |
Female Fertility in Kaufman
Fertility by Age in Kaufman
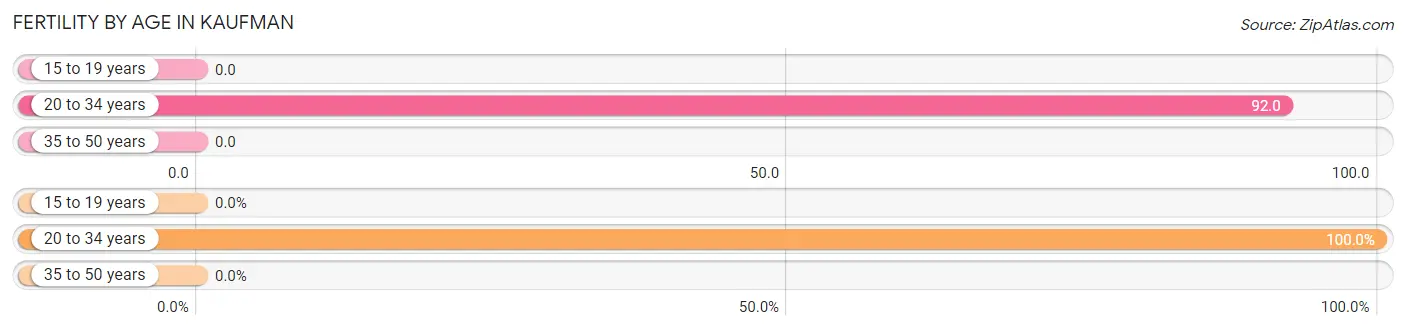
Average fertility rate in Kaufman is 44.0 births per 1,000 women. Women in the age bracket of 20 to 34 years have the highest fertility rate with 92.0 births per 1,000 women. Women in the age bracket of 20 to 34 years acount for 100.0% of all women with births.
| Age Bracket | Women with Births | Births / 1,000 Women |
| 15 to 19 years | 0 (0.0%) | 0.0 |
| 20 to 34 years | 76 (100.0%) | 92.0 |
| 35 to 50 years | 0 (0.0%) | 0.0 |
| Total | 76 (100.0%) | 44.0 |
Fertility by Age by Marriage Status in Kaufman
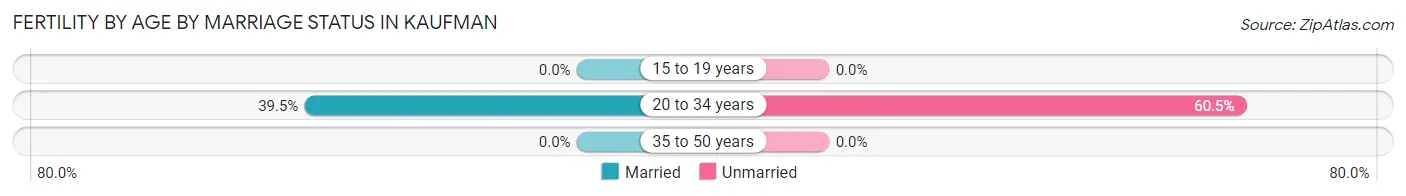
39.5% of women with births (76) in Kaufman are married. The highest percentage of unmarried women with births falls into 20 to 34 years age bracket with 60.5% of them unmarried at the time of birth, while the lowest percentage of unmarried women with births belong to 20 to 34 years age bracket with 60.5% of them unmarried.
| Age Bracket | Married | Unmarried |
| 15 to 19 years | 0 (0.0%) | 0 (0.0%) |
| 20 to 34 years | 30 (39.5%) | 46 (60.5%) |
| 35 to 50 years | 0 (0.0%) | 0 (0.0%) |
| Total | 30 (39.5%) | 46 (60.5%) |
Fertility by Education in Kaufman
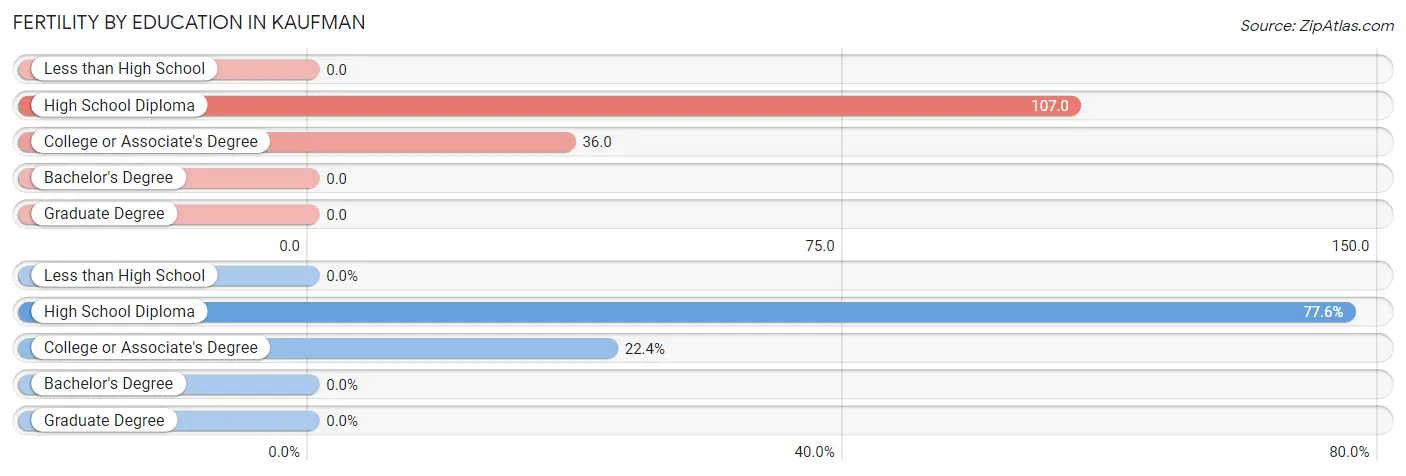
| Educational Attainment | Women with Births | Births / 1,000 Women |
| Less than High School | 0 (0.0%) | 0.0 |
| High School Diploma | 59 (77.6%) | 107.0 |
| College or Associate's Degree | 17 (22.4%) | 36.0 |
| Bachelor's Degree | 0 (0.0%) | 0.0 |
| Graduate Degree | 0 (0.0%) | 0.0 |
| Total | 76 (100.0%) | 44.0 |
Fertility by Education by Marriage Status in Kaufman
60.5% of women with births in Kaufman are unmarried. Women with the educational attainment of college or associate's degree are most likely to be married with 52.9% of them married at childbirth, while women with the educational attainment of high school diploma are least likely to be married with 64.4% of them unmarried at childbirth.
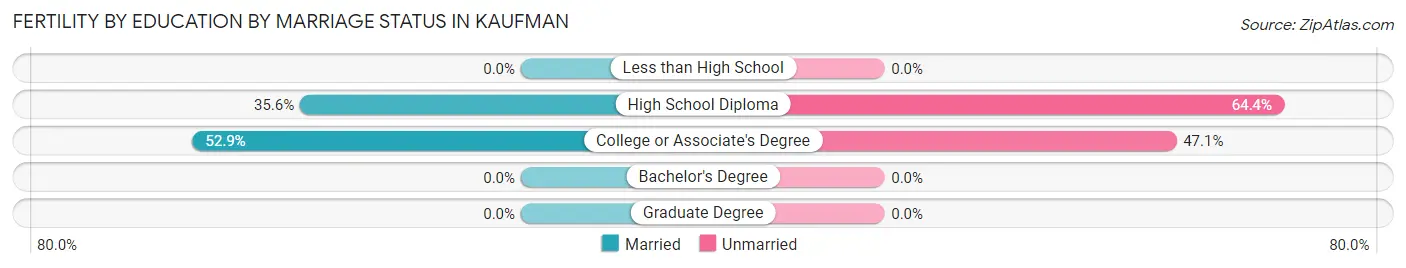
| Educational Attainment | Married | Unmarried |
| Less than High School | 0 (0.0%) | 0 (0.0%) |
| High School Diploma | 21 (35.6%) | 38 (64.4%) |
| College or Associate's Degree | 9 (52.9%) | 8 (47.1%) |
| Bachelor's Degree | 0 (0.0%) | 0 (0.0%) |
| Graduate Degree | 0 (0.0%) | 0 (0.0%) |
| Total | 30 (39.5%) | 46 (60.5%) |
Employment Characteristics in Kaufman
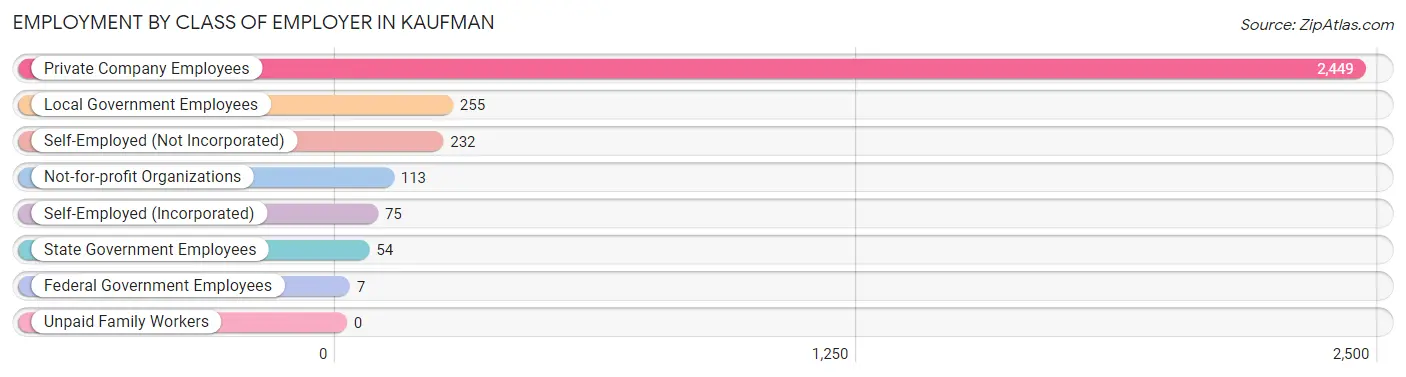
Employment by Class of Employer in Kaufman
Among the 3,185 employed individuals in Kaufman, private company employees (2,449 | 76.9%), local government employees (255 | 8.0%), and self-employed (not incorporated) (232 | 7.3%) make up the most common classes of employment.
| Employer Class | # Employees | % Employees |
| Private Company Employees | 2,449 | 76.9% |
| Self-Employed (Incorporated) | 75 | 2.4% |
| Self-Employed (Not Incorporated) | 232 | 7.3% |
| Not-for-profit Organizations | 113 | 3.5% |
| Local Government Employees | 255 | 8.0% |
| State Government Employees | 54 | 1.7% |
| Federal Government Employees | 7 | 0.2% |
| Unpaid Family Workers | 0 | 0.0% |
| Total | 3,185 | 100.0% |
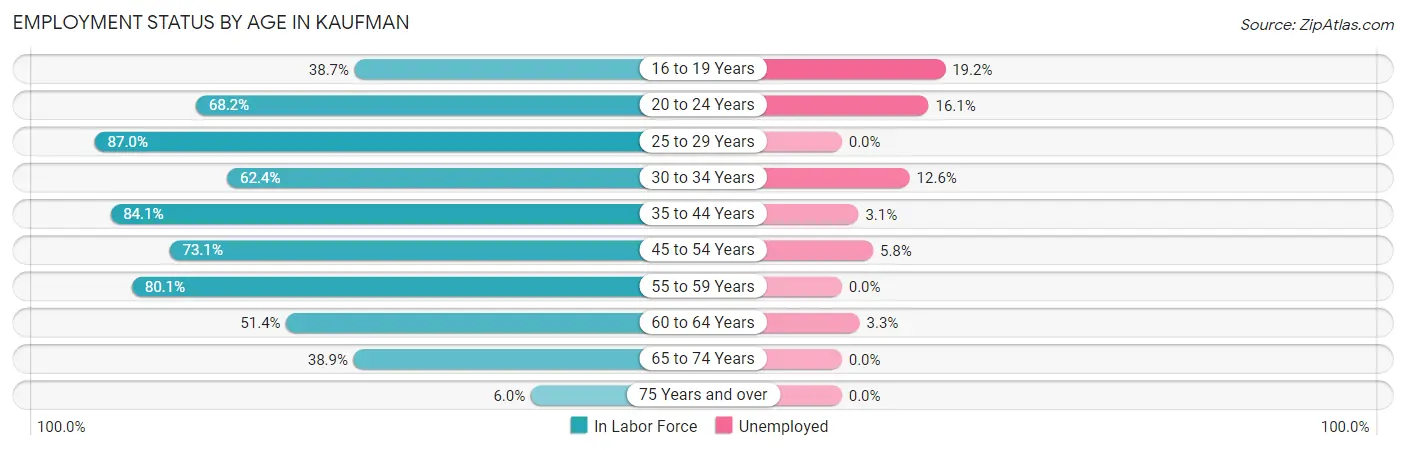
Employment Status by Age in Kaufman
According to the labor force statistics for Kaufman, out of the total population over 16 years of age (5,298), 63.9% or 3,385 individuals are in the labor force, with 5.2% or 176 of them unemployed. The age group with the highest labor force participation rate is 25 to 29 years, with 87.0% or 530 individuals in the labor force. Within the labor force, the 16 to 19 years age range has the highest percentage of unemployed individuals, with 19.2% or 33 of them being unemployed.
| Age Bracket | In Labor Force | Unemployed |
| 16 to 19 Years | 172 (38.7%) | 33 (19.2%) |
| 20 to 24 Years | 236 (68.2%) | 38 (16.1%) |
| 25 to 29 Years | 530 (87.0%) | 0 (0.0%) |
| 30 to 34 Years | 325 (62.4%) | 41 (12.6%) |
| 35 to 44 Years | 1,139 (84.1%) | 35 (3.1%) |
| 45 to 54 Years | 411 (73.1%) | 24 (5.8%) |
| 55 to 59 Years | 193 (80.1%) | 0 (0.0%) |
| 60 to 64 Years | 151 (51.4%) | 5 (3.3%) |
| 65 to 74 Years | 206 (38.9%) | 0 (0.0%) |
| 75 Years and over | 24 (6.0%) | 0 (0.0%) |
| Total | 3,385 (63.9%) | 176 (5.2%) |
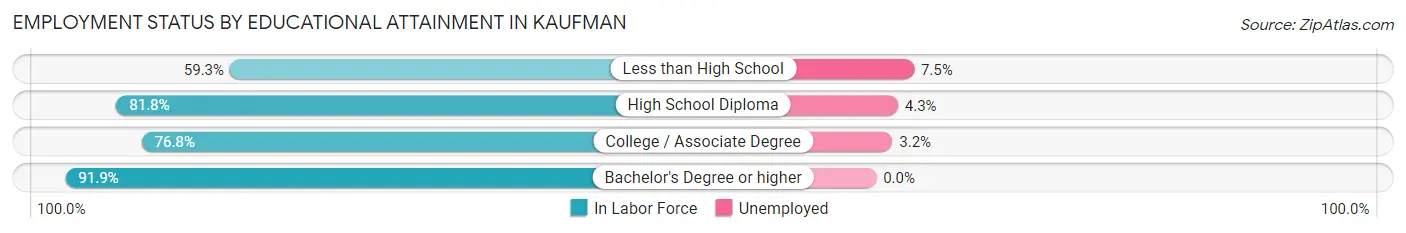
Employment Status by Educational Attainment in Kaufman
According to labor force statistics for Kaufman, 76.8% of individuals (2,750) out of the total population between 25 and 64 years of age (3,581) are in the labor force, with 3.8% or 104 of them being unemployed. The group with the highest labor force participation rate are those with the educational attainment of bachelor's degree or higher, with 91.9% or 444 individuals in the labor force. Within the labor force, individuals with less than high school education have the highest percentage of unemployment, with 7.5% or 35 of them being unemployed.
| Educational Attainment | In Labor Force | Unemployed |
| Less than High School | 467 (59.3%) | 59 (7.5%) |
| High School Diploma | 1,030 (81.8%) | 54 (4.3%) |
| College / Associate Degree | 808 (76.8%) | 34 (3.2%) |
| Bachelor's Degree or higher | 444 (91.9%) | 0 (0.0%) |
| Total | 2,750 (76.8%) | 136 (3.8%) |
Employment Occupations by Sex in Kaufman
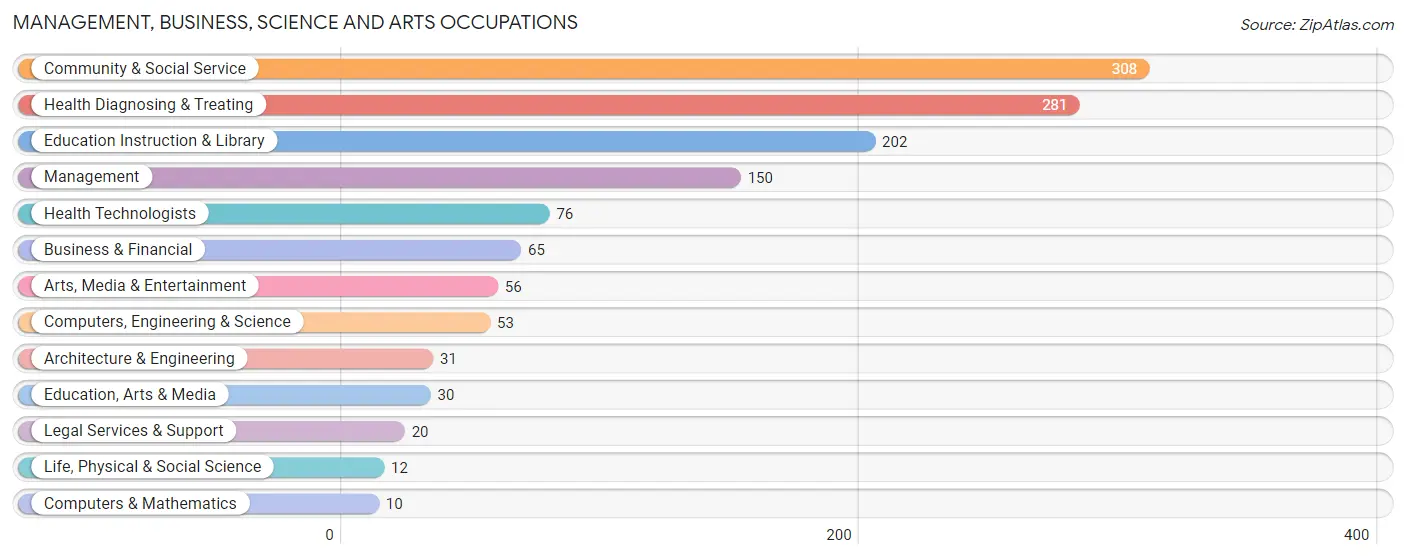
Management, Business, Science and Arts Occupations
The most common Management, Business, Science and Arts occupations in Kaufman are Community & Social Service (308 | 9.6%), Health Diagnosing & Treating (281 | 8.7%), Education Instruction & Library (202 | 6.3%), Management (150 | 4.7%), and Health Technologists (76 | 2.4%).
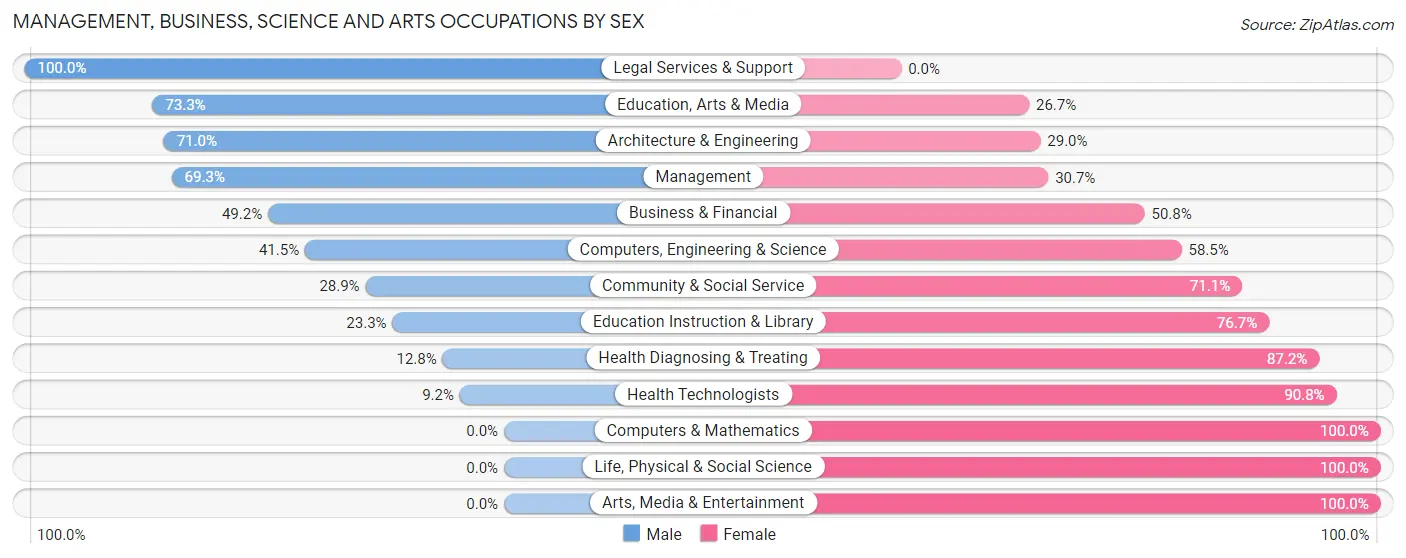
Management, Business, Science and Arts Occupations by Sex
Within the Management, Business, Science and Arts occupations in Kaufman, the most male-oriented occupations are Legal Services & Support (100.0%), Education, Arts & Media (73.3%), and Architecture & Engineering (71.0%), while the most female-oriented occupations are Computers & Mathematics (100.0%), Life, Physical & Social Science (100.0%), and Arts, Media & Entertainment (100.0%).
| Occupation | Male | Female |
| Management | 104 (69.3%) | 46 (30.7%) |
| Business & Financial | 32 (49.2%) | 33 (50.8%) |
| Computers, Engineering & Science | 22 (41.5%) | 31 (58.5%) |
| Computers & Mathematics | 0 (0.0%) | 10 (100.0%) |
| Architecture & Engineering | 22 (71.0%) | 9 (29.0%) |
| Life, Physical & Social Science | 0 (0.0%) | 12 (100.0%) |
| Community & Social Service | 89 (28.9%) | 219 (71.1%) |
| Education, Arts & Media | 22 (73.3%) | 8 (26.7%) |
| Legal Services & Support | 20 (100.0%) | 0 (0.0%) |
| Education Instruction & Library | 47 (23.3%) | 155 (76.7%) |
| Arts, Media & Entertainment | 0 (0.0%) | 56 (100.0%) |
| Health Diagnosing & Treating | 36 (12.8%) | 245 (87.2%) |
| Health Technologists | 7 (9.2%) | 69 (90.8%) |
| Total (Category) | 283 (33.0%) | 574 (67.0%) |
| Total (Overall) | 1,825 (56.8%) | 1,386 (43.2%) |
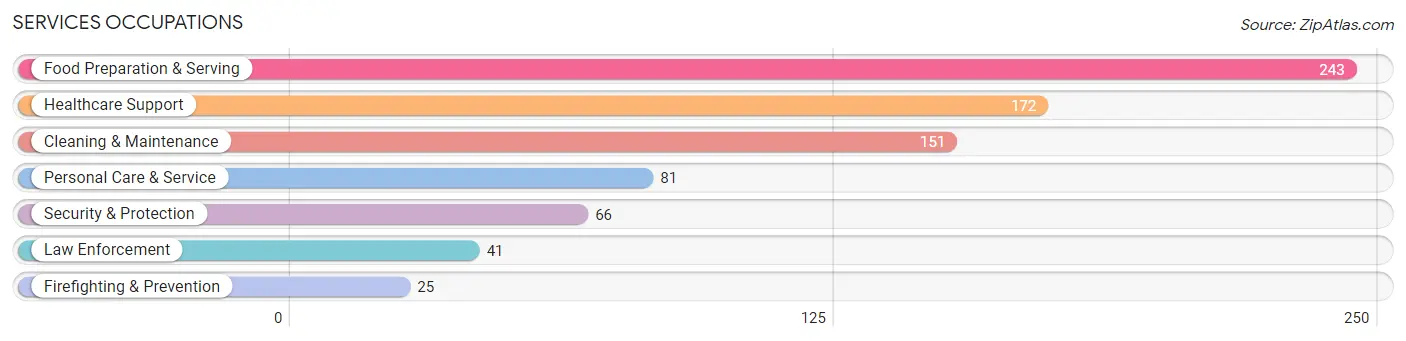
Services Occupations
The most common Services occupations in Kaufman are Food Preparation & Serving (243 | 7.6%), Healthcare Support (172 | 5.4%), Cleaning & Maintenance (151 | 4.7%), Personal Care & Service (81 | 2.5%), and Security & Protection (66 | 2.1%).
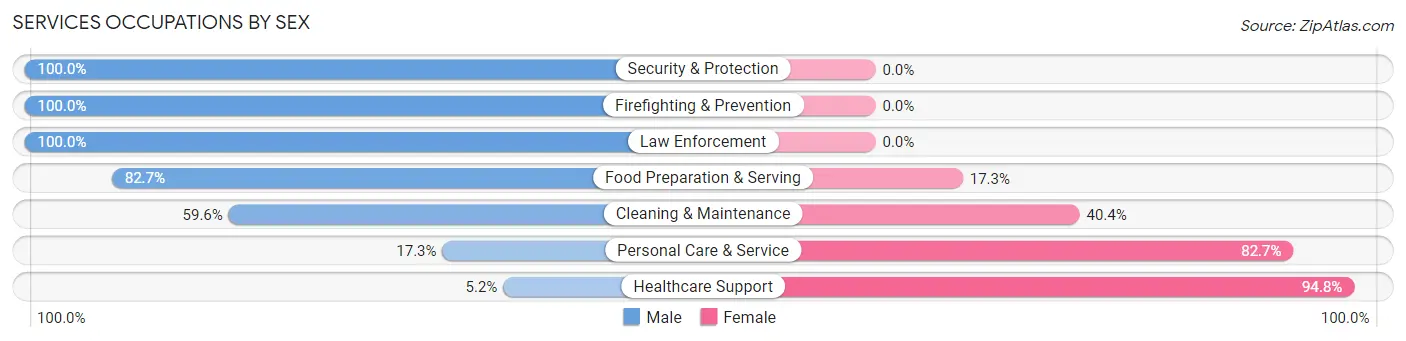
Services Occupations by Sex
Within the Services occupations in Kaufman, the most male-oriented occupations are Security & Protection (100.0%), Firefighting & Prevention (100.0%), and Law Enforcement (100.0%), while the most female-oriented occupations are Healthcare Support (94.8%), Personal Care & Service (82.7%), and Cleaning & Maintenance (40.4%).
| Occupation | Male | Female |
| Healthcare Support | 9 (5.2%) | 163 (94.8%) |
| Security & Protection | 66 (100.0%) | 0 (0.0%) |
| Firefighting & Prevention | 25 (100.0%) | 0 (0.0%) |
| Law Enforcement | 41 (100.0%) | 0 (0.0%) |
| Food Preparation & Serving | 201 (82.7%) | 42 (17.3%) |
| Cleaning & Maintenance | 90 (59.6%) | 61 (40.4%) |
| Personal Care & Service | 14 (17.3%) | 67 (82.7%) |
| Total (Category) | 380 (53.3%) | 333 (46.7%) |
| Total (Overall) | 1,825 (56.8%) | 1,386 (43.2%) |
Sales and Office Occupations
The most common Sales and Office occupations in Kaufman are Office & Administration (342 | 10.6%), and Sales & Related (143 | 4.4%).
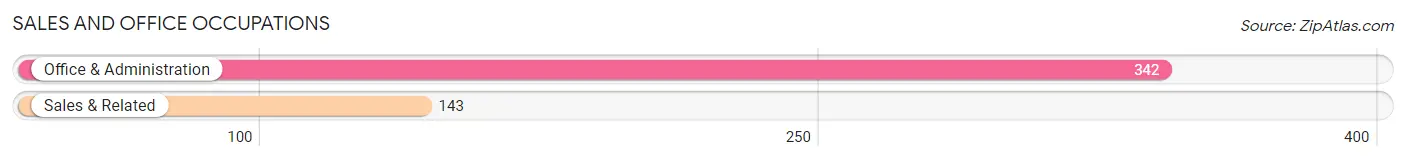
Sales and Office Occupations by Sex

| Occupation | Male | Female |
| Sales & Related | 94 (65.7%) | 49 (34.3%) |
| Office & Administration | 24 (7.0%) | 318 (93.0%) |
| Total (Category) | 118 (24.3%) | 367 (75.7%) |
| Total (Overall) | 1,825 (56.8%) | 1,386 (43.2%) |
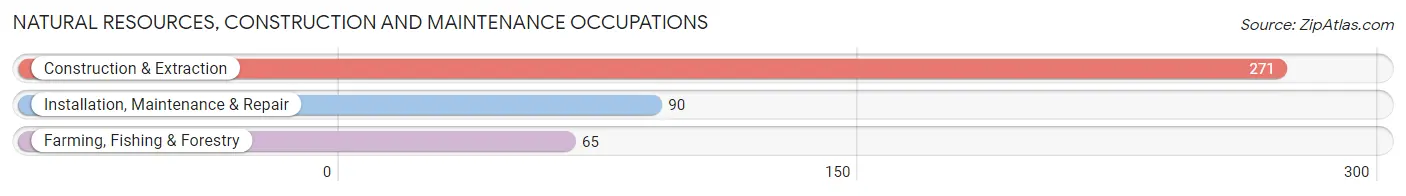
Natural Resources, Construction and Maintenance Occupations
The most common Natural Resources, Construction and Maintenance occupations in Kaufman are Construction & Extraction (271 | 8.4%), Installation, Maintenance & Repair (90 | 2.8%), and Farming, Fishing & Forestry (65 | 2.0%).
Natural Resources, Construction and Maintenance Occupations by Sex
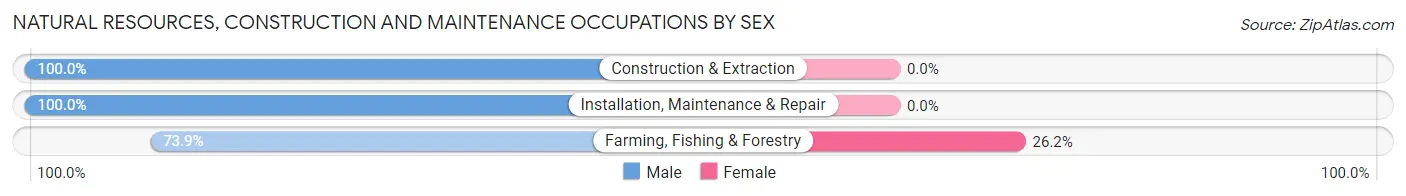
| Occupation | Male | Female |
| Farming, Fishing & Forestry | 48 (73.9%) | 17 (26.2%) |
| Construction & Extraction | 271 (100.0%) | 0 (0.0%) |
| Installation, Maintenance & Repair | 90 (100.0%) | 0 (0.0%) |
| Total (Category) | 409 (96.0%) | 17 (4.0%) |
| Total (Overall) | 1,825 (56.8%) | 1,386 (43.2%) |
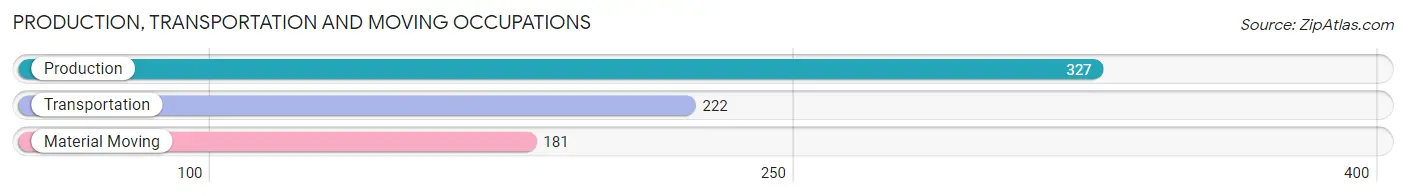
Production, Transportation and Moving Occupations
The most common Production, Transportation and Moving occupations in Kaufman are Production (327 | 10.2%), Transportation (222 | 6.9%), and Material Moving (181 | 5.6%).
Production, Transportation and Moving Occupations by Sex
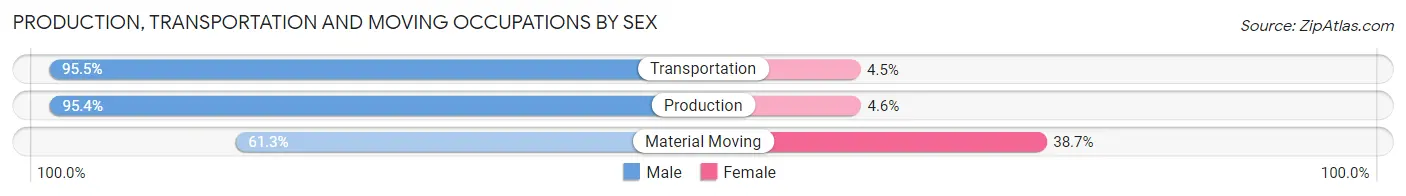
| Occupation | Male | Female |
| Production | 312 (95.4%) | 15 (4.6%) |
| Transportation | 212 (95.5%) | 10 (4.5%) |
| Material Moving | 111 (61.3%) | 70 (38.7%) |
| Total (Category) | 635 (87.0%) | 95 (13.0%) |
| Total (Overall) | 1,825 (56.8%) | 1,386 (43.2%) |
Employment Industries by Sex in Kaufman
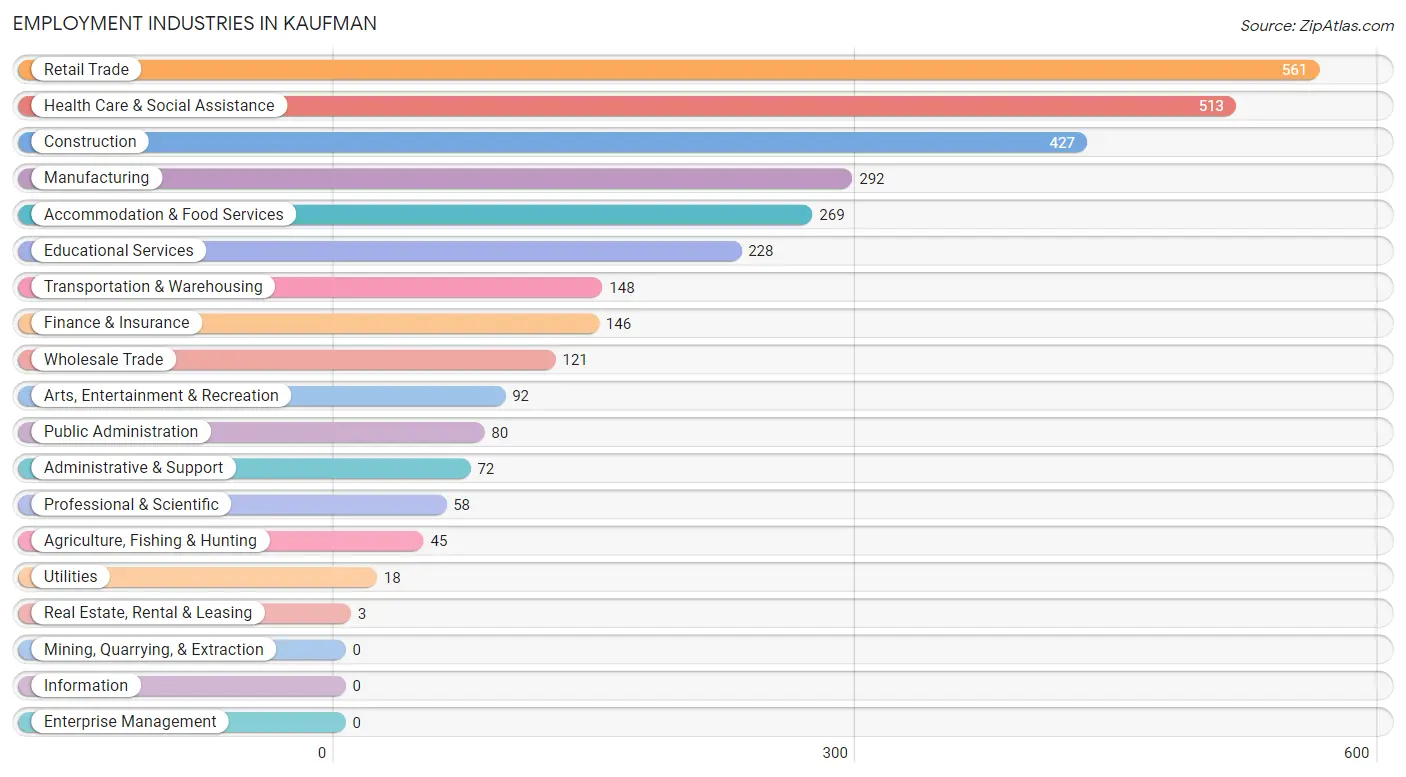
Employment Industries in Kaufman
The major employment industries in Kaufman include Retail Trade (561 | 17.5%), Health Care & Social Assistance (513 | 16.0%), Construction (427 | 13.3%), Manufacturing (292 | 9.1%), and Accommodation & Food Services (269 | 8.4%).
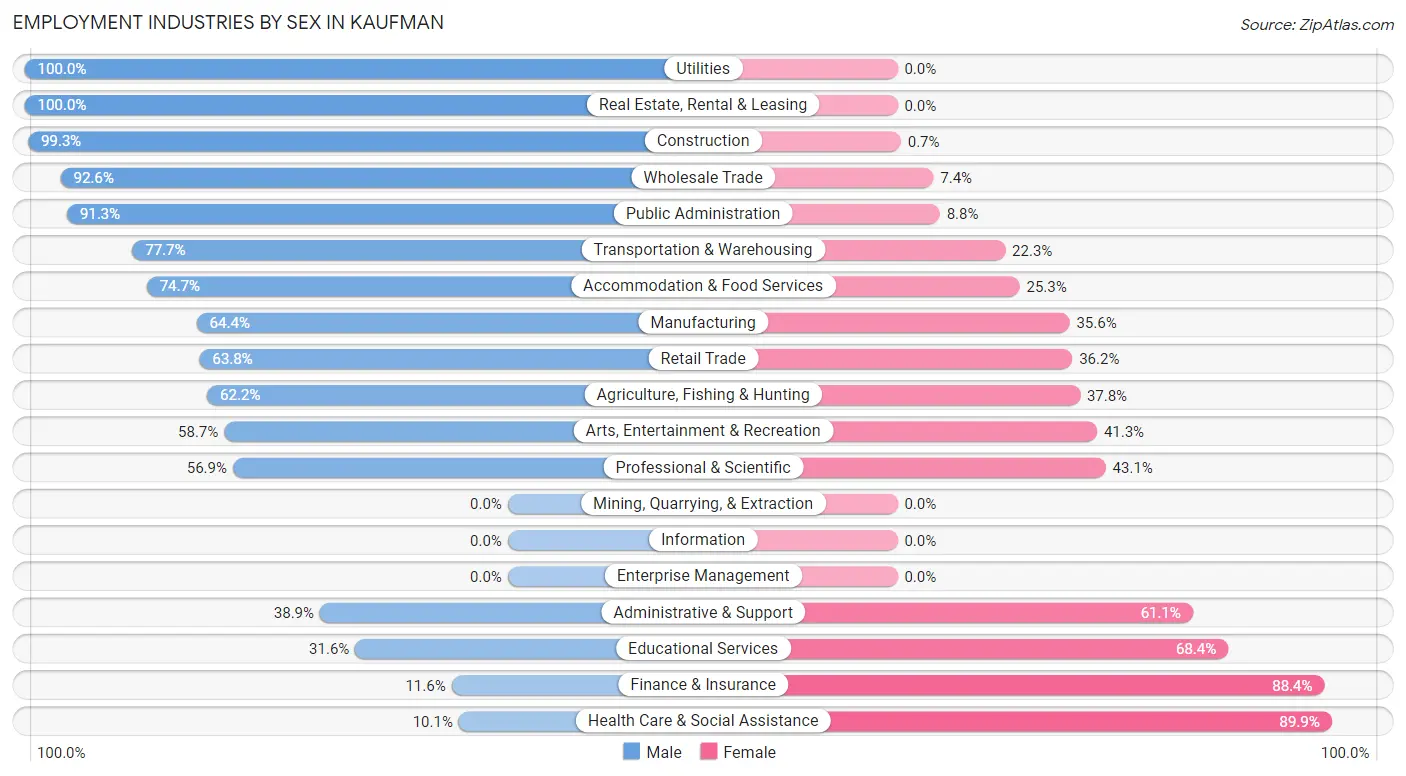
Employment Industries by Sex in Kaufman
The Kaufman industries that see more men than women are Utilities (100.0%), Real Estate, Rental & Leasing (100.0%), and Construction (99.3%), whereas the industries that tend to have a higher number of women are Health Care & Social Assistance (89.9%), Finance & Insurance (88.4%), and Educational Services (68.4%).
| Industry | Male | Female |
| Agriculture, Fishing & Hunting | 28 (62.2%) | 17 (37.8%) |
| Mining, Quarrying, & Extraction | 0 (0.0%) | 0 (0.0%) |
| Construction | 424 (99.3%) | 3 (0.7%) |
| Manufacturing | 188 (64.4%) | 104 (35.6%) |
| Wholesale Trade | 112 (92.6%) | 9 (7.4%) |
| Retail Trade | 358 (63.8%) | 203 (36.2%) |
| Transportation & Warehousing | 115 (77.7%) | 33 (22.3%) |
| Utilities | 18 (100.0%) | 0 (0.0%) |
| Information | 0 (0.0%) | 0 (0.0%) |
| Finance & Insurance | 17 (11.6%) | 129 (88.4%) |
| Real Estate, Rental & Leasing | 3 (100.0%) | 0 (0.0%) |
| Professional & Scientific | 33 (56.9%) | 25 (43.1%) |
| Enterprise Management | 0 (0.0%) | 0 (0.0%) |
| Administrative & Support | 28 (38.9%) | 44 (61.1%) |
| Educational Services | 72 (31.6%) | 156 (68.4%) |
| Health Care & Social Assistance | 52 (10.1%) | 461 (89.9%) |
| Arts, Entertainment & Recreation | 54 (58.7%) | 38 (41.3%) |
| Accommodation & Food Services | 201 (74.7%) | 68 (25.3%) |
| Public Administration | 73 (91.2%) | 7 (8.7%) |
| Total | 1,825 (56.8%) | 1,386 (43.2%) |
Education in Kaufman
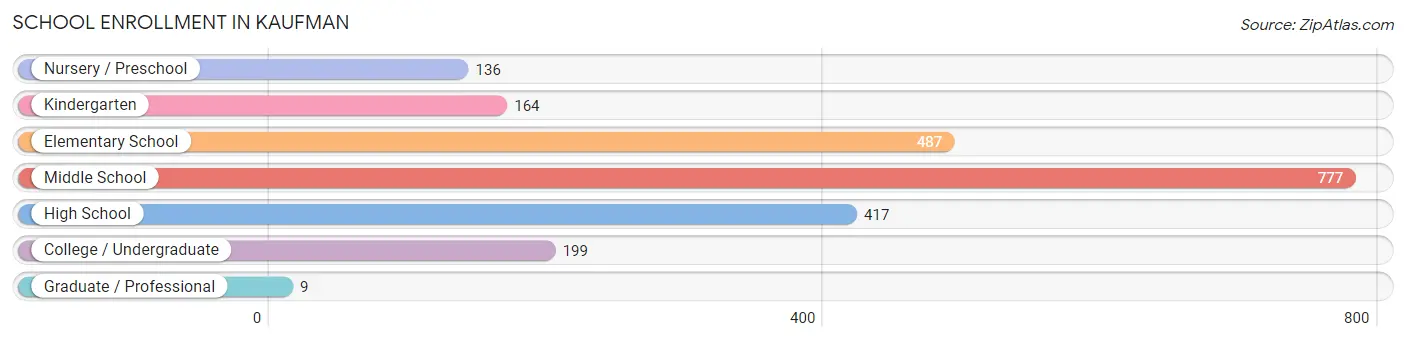
School Enrollment in Kaufman
The most common levels of schooling among the 2,189 students in Kaufman are middle school (777 | 35.5%), elementary school (487 | 22.3%), and high school (417 | 19.1%).
| School Level | # Students | % Students |
| Nursery / Preschool | 136 | 6.2% |
| Kindergarten | 164 | 7.5% |
| Elementary School | 487 | 22.3% |
| Middle School | 777 | 35.5% |
| High School | 417 | 19.1% |
| College / Undergraduate | 199 | 9.1% |
| Graduate / Professional | 9 | 0.4% |
| Total | 2,189 | 100.0% |
School Enrollment by Age by Funding Source in Kaufman
Out of a total of 2,189 students who are enrolled in schools in Kaufman, 247 (11.3%) attend a private institution, while the remaining 1,942 (88.7%) are enrolled in public schools. The age group of 3 to 4 year olds has the highest likelihood of being enrolled in private schools, with 69 (60.0% in the age bracket) enrolled. Conversely, the age group of 15 to 17 year olds has the lowest likelihood of being enrolled in a private school, with 303 (100.0% in the age bracket) attending a public institution.
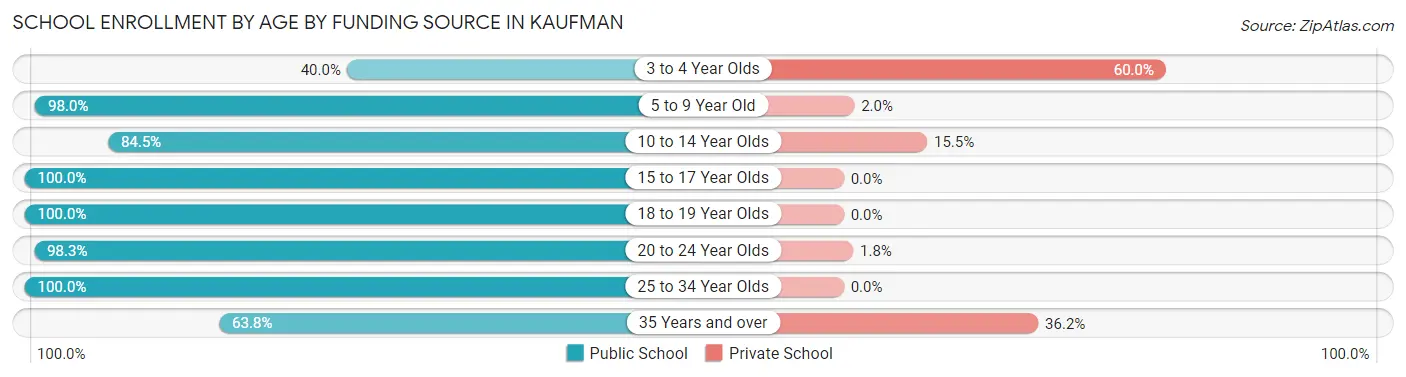
| Age Bracket | Public School | Private School |
| 3 to 4 Year Olds | 46 (40.0%) | 69 (60.0%) |
| 5 to 9 Year Old | 500 (98.0%) | 10 (2.0%) |
| 10 to 14 Year Olds | 778 (84.5%) | 143 (15.5%) |
| 15 to 17 Year Olds | 303 (100.0%) | 0 (0.0%) |
| 18 to 19 Year Olds | 137 (100.0%) | 0 (0.0%) |
| 20 to 24 Year Olds | 56 (98.3%) | 1 (1.8%) |
| 25 to 34 Year Olds | 77 (100.0%) | 0 (0.0%) |
| 35 Years and over | 44 (63.8%) | 25 (36.2%) |
| Total | 1,942 (88.7%) | 247 (11.3%) |
Educational Attainment by Field of Study in Kaufman
Business (153 | 24.8%), education (114 | 18.4%), literature & languages (108 | 17.5%), arts & humanities (85 | 13.8%), and science & technology (40 | 6.5%) are the most common fields of study among 618 individuals in Kaufman who have obtained a bachelor's degree or higher.
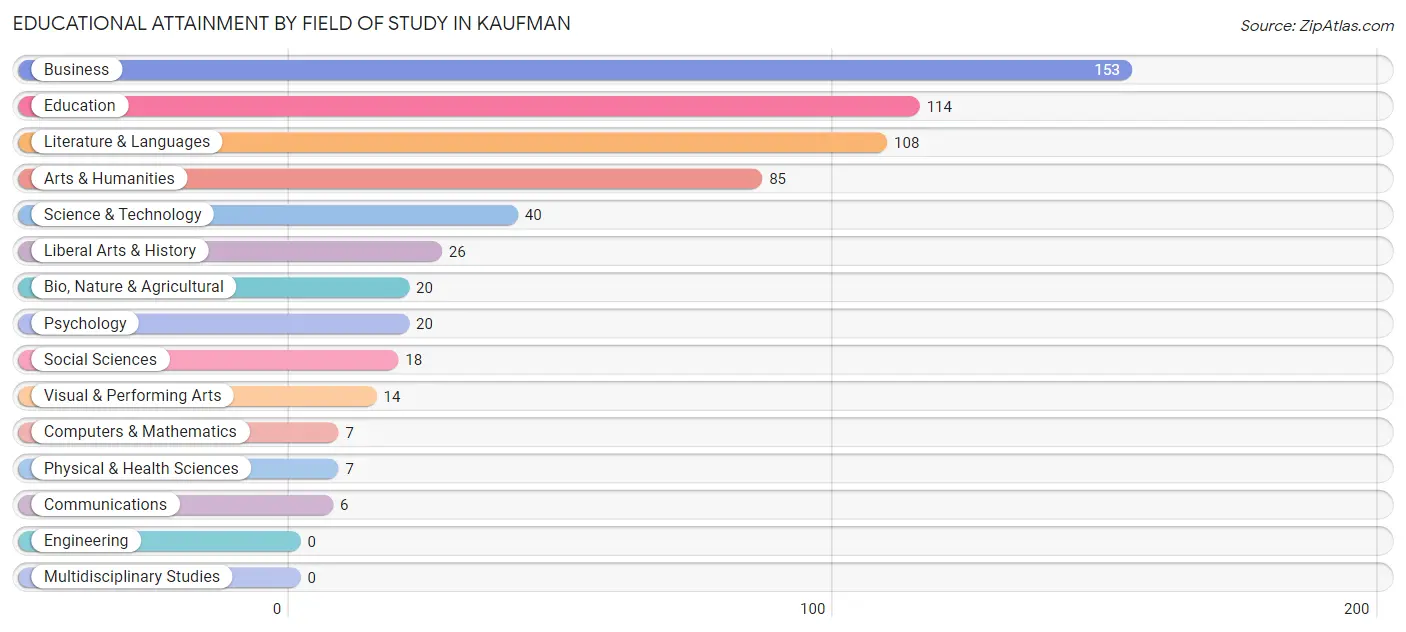
| Field of Study | # Graduates | % Graduates |
| Computers & Mathematics | 7 | 1.1% |
| Bio, Nature & Agricultural | 20 | 3.2% |
| Physical & Health Sciences | 7 | 1.1% |
| Psychology | 20 | 3.2% |
| Social Sciences | 18 | 2.9% |
| Engineering | 0 | 0.0% |
| Multidisciplinary Studies | 0 | 0.0% |
| Science & Technology | 40 | 6.5% |
| Business | 153 | 24.8% |
| Education | 114 | 18.4% |
| Literature & Languages | 108 | 17.5% |
| Liberal Arts & History | 26 | 4.2% |
| Visual & Performing Arts | 14 | 2.3% |
| Communications | 6 | 1.0% |
| Arts & Humanities | 85 | 13.8% |
| Total | 618 | 100.0% |
Transportation & Commute in Kaufman
Vehicle Availability by Sex in Kaufman
The most prevalent vehicle ownership categories in Kaufman are males with 2 vehicles (859, accounting for 47.1%) and females with 2 vehicles (491, making up 63.2%).
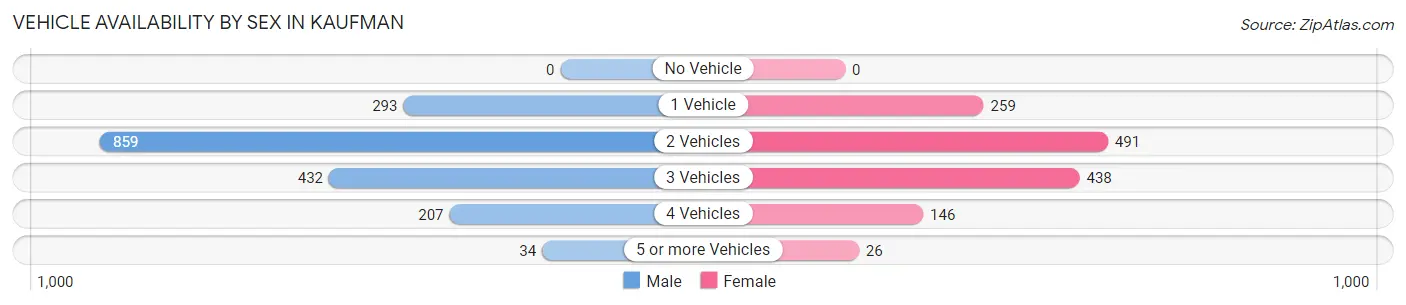
| Vehicles Available | Male | Female |
| No Vehicle | 0 (0.0%) | 0 (0.0%) |
| 1 Vehicle | 293 (16.1%) | 259 (19.0%) |
| 2 Vehicles | 859 (47.1%) | 491 (36.1%) |
| 3 Vehicles | 432 (23.7%) | 438 (32.2%) |
| 4 Vehicles | 207 (11.3%) | 146 (10.7%) |
| 5 or more Vehicles | 34 (1.9%) | 26 (1.9%) |
| Total | 1,825 (100.0%) | 1,360 (100.0%) |
Commute Time in Kaufman
The most frequently occuring commute durations in Kaufman are 5 to 9 minutes (418 commuters, 13.7%), 45 to 59 minutes (396 commuters, 13.0%), and 10 to 14 minutes (386 commuters, 12.7%).
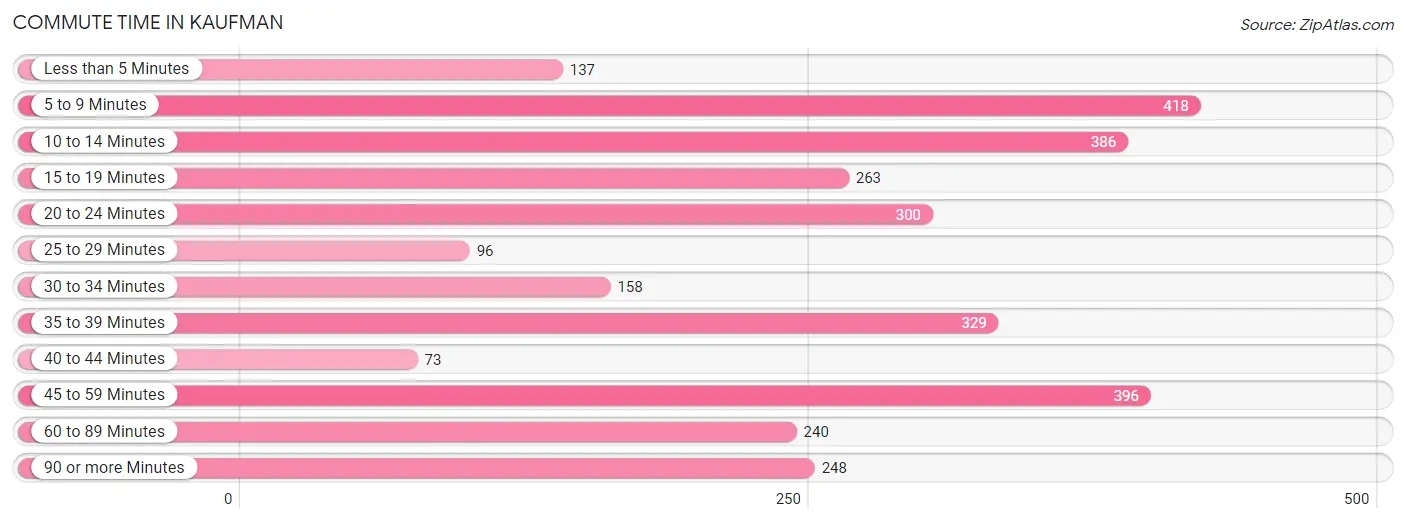
| Commute Time | # Commuters | % Commuters |
| Less than 5 Minutes | 137 | 4.5% |
| 5 to 9 Minutes | 418 | 13.7% |
| 10 to 14 Minutes | 386 | 12.7% |
| 15 to 19 Minutes | 263 | 8.6% |
| 20 to 24 Minutes | 300 | 9.9% |
| 25 to 29 Minutes | 96 | 3.2% |
| 30 to 34 Minutes | 158 | 5.2% |
| 35 to 39 Minutes | 329 | 10.8% |
| 40 to 44 Minutes | 73 | 2.4% |
| 45 to 59 Minutes | 396 | 13.0% |
| 60 to 89 Minutes | 240 | 7.9% |
| 90 or more Minutes | 248 | 8.2% |
Commute Time by Sex in Kaufman
The most common commute times in Kaufman are 45 to 59 minutes (276 commuters, 15.7%) for males and 10 to 14 minutes (215 commuters, 16.8%) for females.
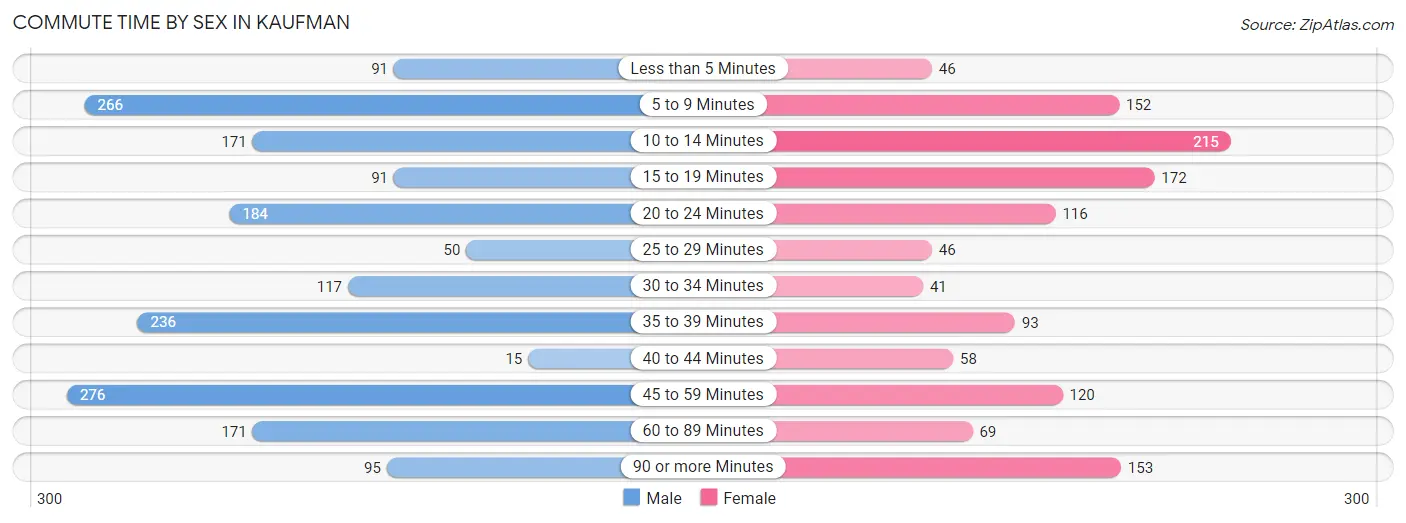
| Commute Time | Male | Female |
| Less than 5 Minutes | 91 (5.2%) | 46 (3.6%) |
| 5 to 9 Minutes | 266 (15.1%) | 152 (11.9%) |
| 10 to 14 Minutes | 171 (9.7%) | 215 (16.8%) |
| 15 to 19 Minutes | 91 (5.2%) | 172 (13.4%) |
| 20 to 24 Minutes | 184 (10.4%) | 116 (9.1%) |
| 25 to 29 Minutes | 50 (2.8%) | 46 (3.6%) |
| 30 to 34 Minutes | 117 (6.6%) | 41 (3.2%) |
| 35 to 39 Minutes | 236 (13.4%) | 93 (7.3%) |
| 40 to 44 Minutes | 15 (0.9%) | 58 (4.5%) |
| 45 to 59 Minutes | 276 (15.7%) | 120 (9.4%) |
| 60 to 89 Minutes | 171 (9.7%) | 69 (5.4%) |
| 90 or more Minutes | 95 (5.4%) | 153 (11.9%) |
Time of Departure to Work by Sex in Kaufman
The most frequent times of departure to work in Kaufman are 5:30 AM to 5:59 AM (377, 21.4%) for males and 7:00 AM to 7:29 AM (302, 23.6%) for females.
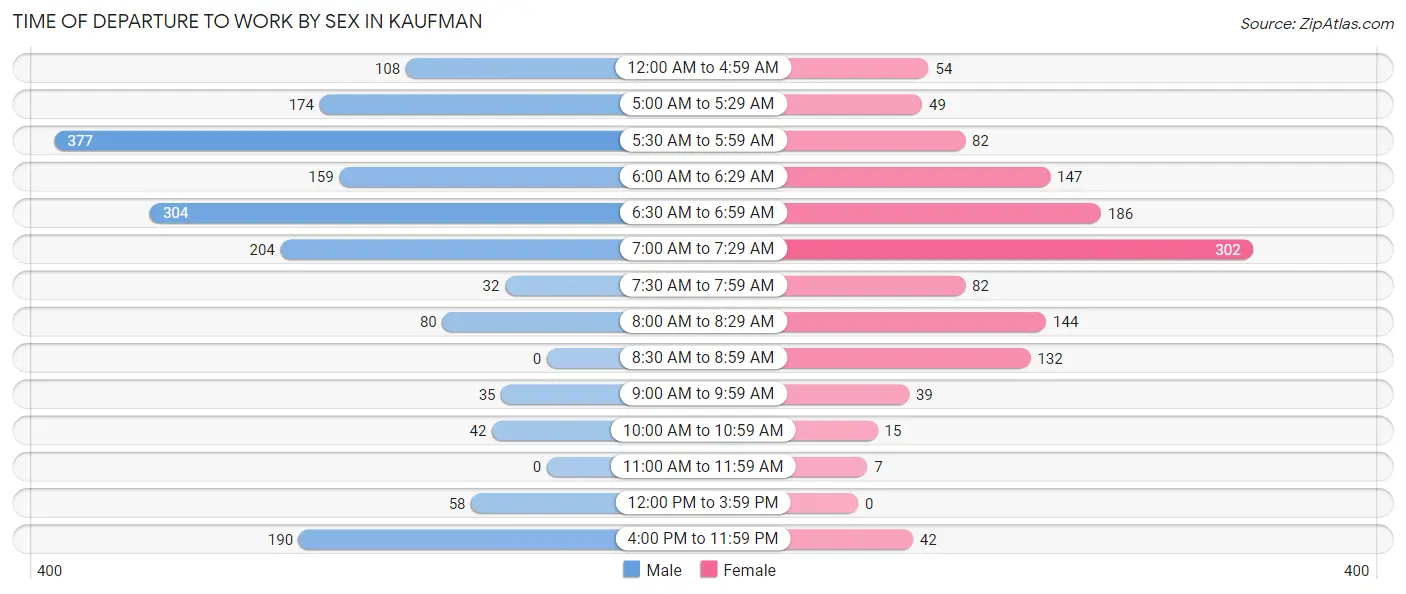
| Time of Departure | Male | Female |
| 12:00 AM to 4:59 AM | 108 (6.1%) | 54 (4.2%) |
| 5:00 AM to 5:29 AM | 174 (9.9%) | 49 (3.8%) |
| 5:30 AM to 5:59 AM | 377 (21.4%) | 82 (6.4%) |
| 6:00 AM to 6:29 AM | 159 (9.0%) | 147 (11.5%) |
| 6:30 AM to 6:59 AM | 304 (17.2%) | 186 (14.5%) |
| 7:00 AM to 7:29 AM | 204 (11.6%) | 302 (23.6%) |
| 7:30 AM to 7:59 AM | 32 (1.8%) | 82 (6.4%) |
| 8:00 AM to 8:29 AM | 80 (4.5%) | 144 (11.2%) |
| 8:30 AM to 8:59 AM | 0 (0.0%) | 132 (10.3%) |
| 9:00 AM to 9:59 AM | 35 (2.0%) | 39 (3.0%) |
| 10:00 AM to 10:59 AM | 42 (2.4%) | 15 (1.2%) |
| 11:00 AM to 11:59 AM | 0 (0.0%) | 7 (0.5%) |
| 12:00 PM to 3:59 PM | 58 (3.3%) | 0 (0.0%) |
| 4:00 PM to 11:59 PM | 190 (10.8%) | 42 (3.3%) |
| Total | 1,763 (100.0%) | 1,281 (100.0%) |
Housing Occupancy in Kaufman
Occupancy by Ownership in Kaufman
Of the total 2,288 dwellings in Kaufman, owner-occupied units account for 934 (40.8%), while renter-occupied units make up 1,354 (59.2%).
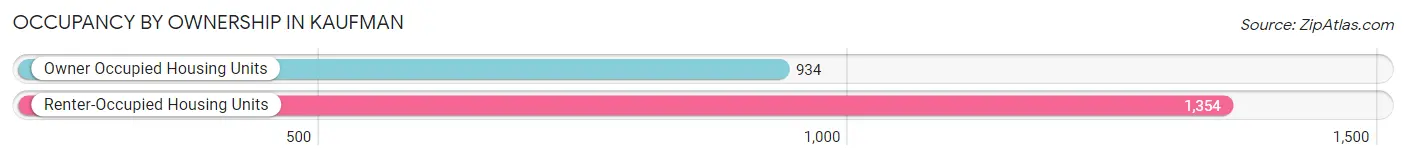
| Occupancy | # Housing Units | % Housing Units |
| Owner Occupied Housing Units | 934 | 40.8% |
| Renter-Occupied Housing Units | 1,354 | 59.2% |
| Total Occupied Housing Units | 2,288 | 100.0% |
Occupancy by Household Size in Kaufman
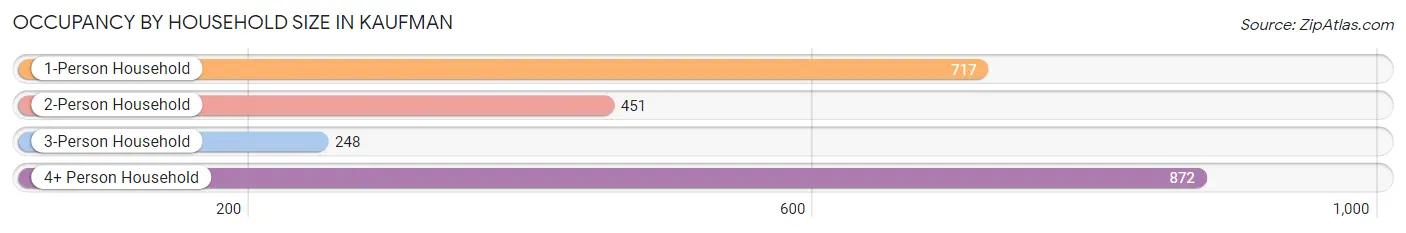
| Household Size | # Housing Units | % Housing Units |
| 1-Person Household | 717 | 31.3% |
| 2-Person Household | 451 | 19.7% |
| 3-Person Household | 248 | 10.8% |
| 4+ Person Household | 872 | 38.1% |
| Total Housing Units | 2,288 | 100.0% |
Occupancy by Ownership by Household Size in Kaufman
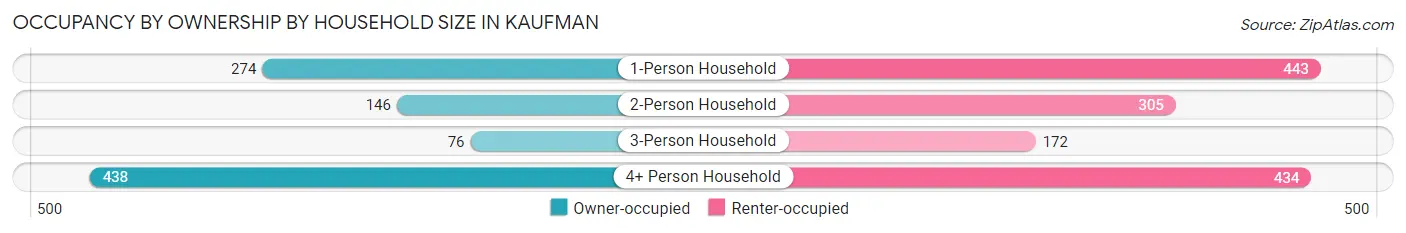
| Household Size | Owner-occupied | Renter-occupied |
| 1-Person Household | 274 (38.2%) | 443 (61.8%) |
| 2-Person Household | 146 (32.4%) | 305 (67.6%) |
| 3-Person Household | 76 (30.6%) | 172 (69.4%) |
| 4+ Person Household | 438 (50.2%) | 434 (49.8%) |
| Total Housing Units | 934 (40.8%) | 1,354 (59.2%) |
Occupancy by Educational Attainment in Kaufman

| Household Size | Owner-occupied | Renter-occupied |
| Less than High School | 259 (52.7%) | 232 (47.2%) |
| High School Diploma | 278 (36.6%) | 482 (63.4%) |
| College/Associate Degree | 224 (38.8%) | 354 (61.3%) |
| Bachelor's Degree or higher | 173 (37.7%) | 286 (62.3%) |
Occupancy by Age of Householder in Kaufman
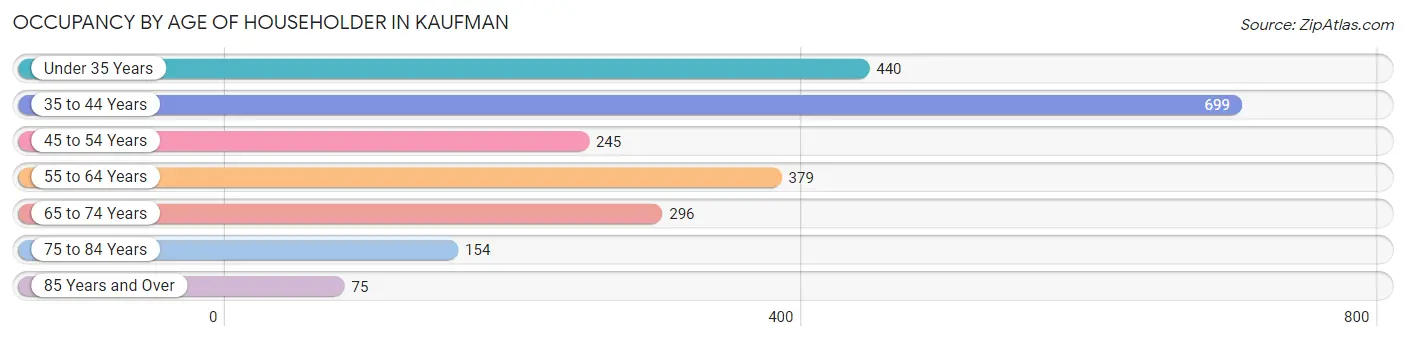
| Age Bracket | # Households | % Households |
| Under 35 Years | 440 | 19.2% |
| 35 to 44 Years | 699 | 30.5% |
| 45 to 54 Years | 245 | 10.7% |
| 55 to 64 Years | 379 | 16.6% |
| 65 to 74 Years | 296 | 12.9% |
| 75 to 84 Years | 154 | 6.7% |
| 85 Years and Over | 75 | 3.3% |
| Total | 2,288 | 100.0% |
Housing Finances in Kaufman
Median Income by Occupancy in Kaufman
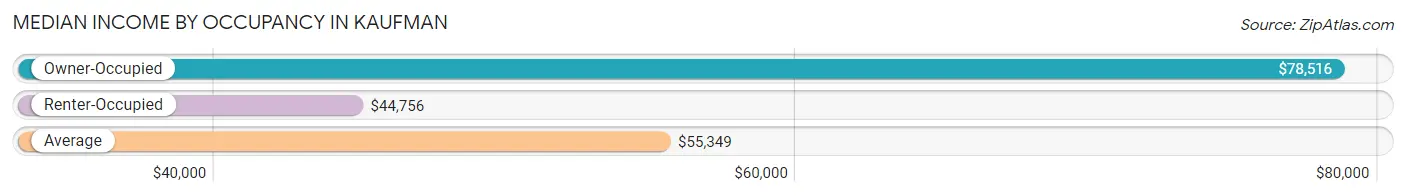
| Occupancy Type | # Households | Median Income |
| Owner-Occupied | 934 (40.8%) | $78,516 |
| Renter-Occupied | 1,354 (59.2%) | $44,756 |
| Average | 2,288 (100.0%) | $55,349 |
Occupancy by Householder Income Bracket in Kaufman
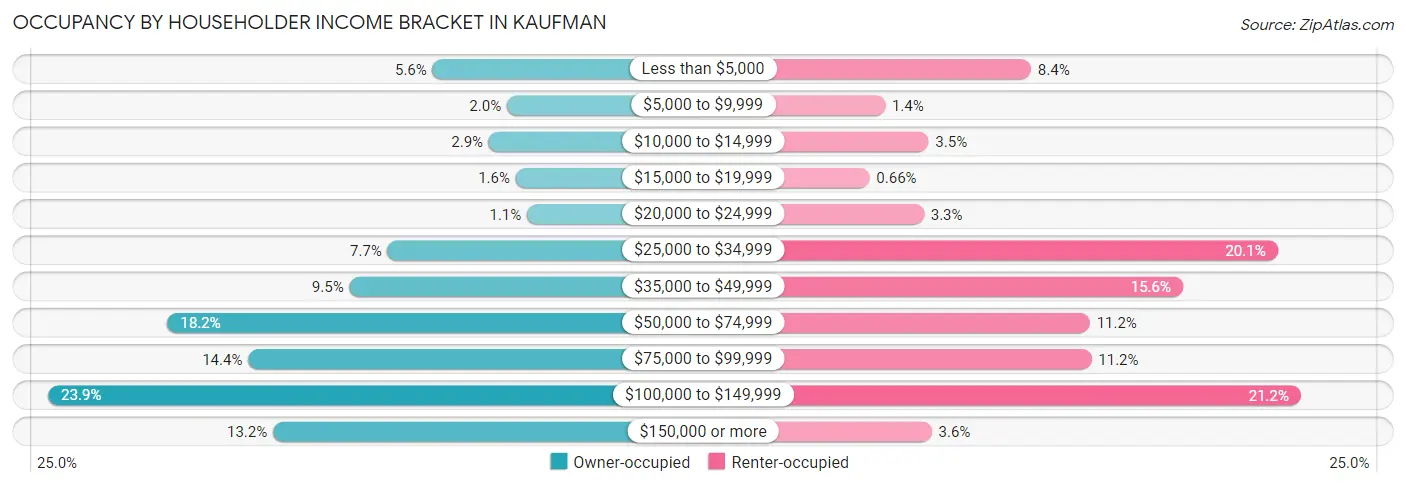
| Income Bracket | Owner-occupied | Renter-occupied |
| Less than $5,000 | 52 (5.6%) | 113 (8.4%) |
| $5,000 to $9,999 | 19 (2.0%) | 19 (1.4%) |
| $10,000 to $14,999 | 27 (2.9%) | 47 (3.5%) |
| $15,000 to $19,999 | 15 (1.6%) | 9 (0.7%) |
| $20,000 to $24,999 | 10 (1.1%) | 44 (3.3%) |
| $25,000 to $34,999 | 72 (7.7%) | 272 (20.1%) |
| $35,000 to $49,999 | 89 (9.5%) | 211 (15.6%) |
| $50,000 to $74,999 | 170 (18.2%) | 151 (11.2%) |
| $75,000 to $99,999 | 134 (14.3%) | 152 (11.2%) |
| $100,000 to $149,999 | 223 (23.9%) | 287 (21.2%) |
| $150,000 or more | 123 (13.2%) | 49 (3.6%) |
| Total | 934 (100.0%) | 1,354 (100.0%) |
Monthly Housing Cost Tiers in Kaufman
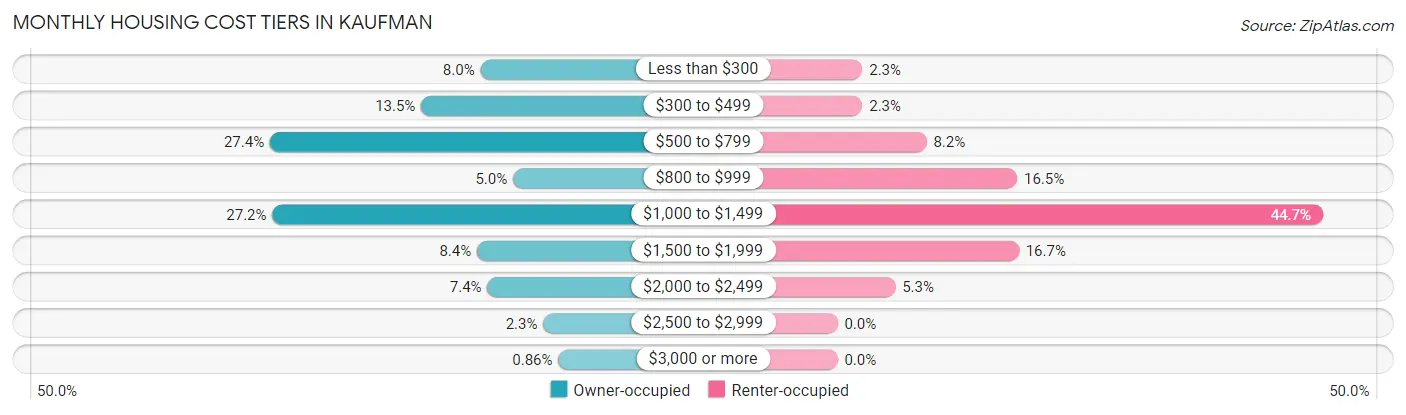
| Monthly Cost | Owner-occupied | Renter-occupied |
| Less than $300 | 75 (8.0%) | 31 (2.3%) |
| $300 to $499 | 126 (13.5%) | 31 (2.3%) |
| $500 to $799 | 256 (27.4%) | 111 (8.2%) |
| $800 to $999 | 47 (5.0%) | 224 (16.5%) |
| $1,000 to $1,499 | 254 (27.2%) | 605 (44.7%) |
| $1,500 to $1,999 | 78 (8.4%) | 226 (16.7%) |
| $2,000 to $2,499 | 69 (7.4%) | 72 (5.3%) |
| $2,500 to $2,999 | 21 (2.2%) | 0 (0.0%) |
| $3,000 or more | 8 (0.9%) | 0 (0.0%) |
| Total | 934 (100.0%) | 1,354 (100.0%) |
Physical Housing Characteristics in Kaufman
Housing Structures in Kaufman
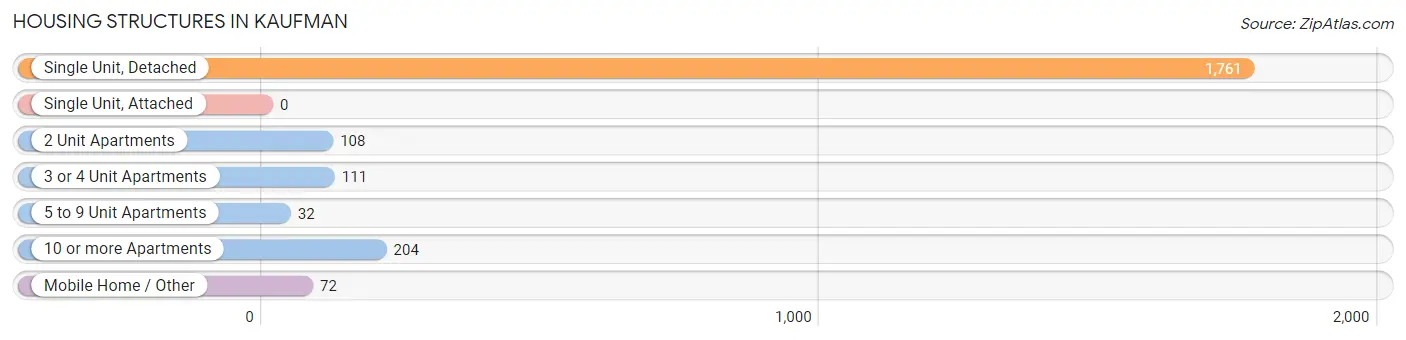
| Structure Type | # Housing Units | % Housing Units |
| Single Unit, Detached | 1,761 | 77.0% |
| Single Unit, Attached | 0 | 0.0% |
| 2 Unit Apartments | 108 | 4.7% |
| 3 or 4 Unit Apartments | 111 | 4.9% |
| 5 to 9 Unit Apartments | 32 | 1.4% |
| 10 or more Apartments | 204 | 8.9% |
| Mobile Home / Other | 72 | 3.2% |
| Total | 2,288 | 100.0% |
Housing Structures by Occupancy in Kaufman
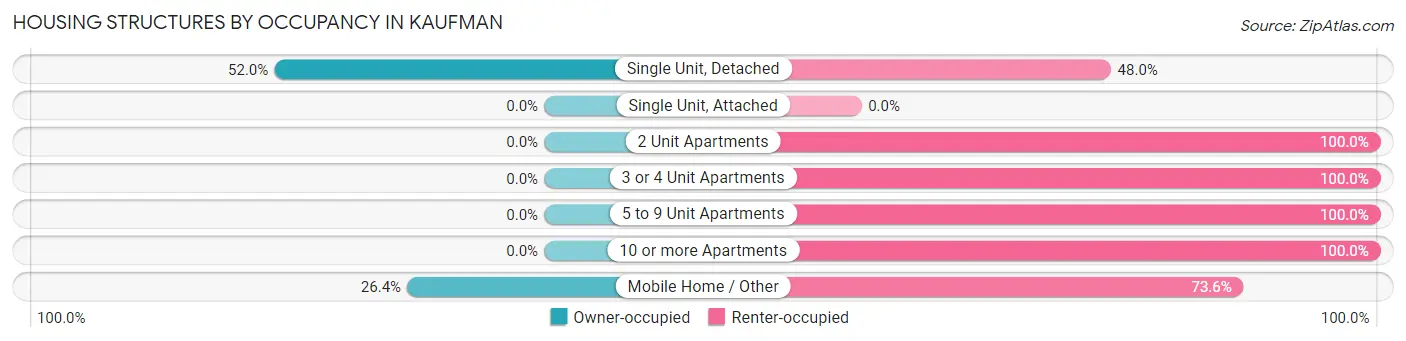
| Structure Type | Owner-occupied | Renter-occupied |
| Single Unit, Detached | 915 (52.0%) | 846 (48.0%) |
| Single Unit, Attached | 0 (0.0%) | 0 (0.0%) |
| 2 Unit Apartments | 0 (0.0%) | 108 (100.0%) |
| 3 or 4 Unit Apartments | 0 (0.0%) | 111 (100.0%) |
| 5 to 9 Unit Apartments | 0 (0.0%) | 32 (100.0%) |
| 10 or more Apartments | 0 (0.0%) | 204 (100.0%) |
| Mobile Home / Other | 19 (26.4%) | 53 (73.6%) |
| Total | 934 (40.8%) | 1,354 (59.2%) |
Housing Structures by Number of Rooms in Kaufman
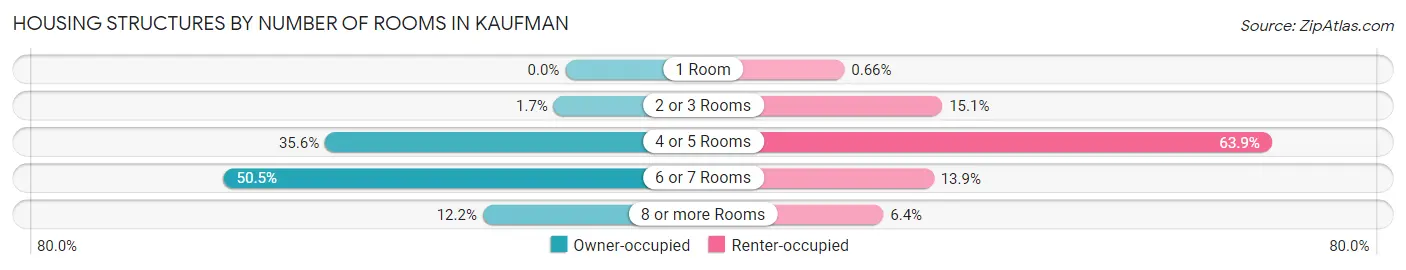
| Number of Rooms | Owner-occupied | Renter-occupied |
| 1 Room | 0 (0.0%) | 9 (0.7%) |
| 2 or 3 Rooms | 16 (1.7%) | 205 (15.1%) |
| 4 or 5 Rooms | 332 (35.5%) | 865 (63.9%) |
| 6 or 7 Rooms | 472 (50.5%) | 188 (13.9%) |
| 8 or more Rooms | 114 (12.2%) | 87 (6.4%) |
| Total | 934 (100.0%) | 1,354 (100.0%) |
Housing Structure by Heating Type in Kaufman
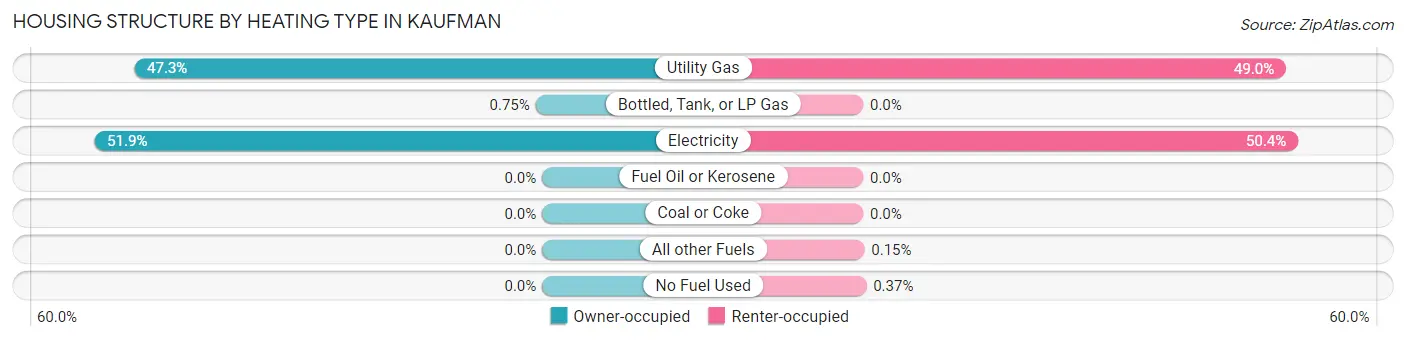
| Heating Type | Owner-occupied | Renter-occupied |
| Utility Gas | 442 (47.3%) | 664 (49.0%) |
| Bottled, Tank, or LP Gas | 7 (0.7%) | 0 (0.0%) |
| Electricity | 485 (51.9%) | 683 (50.4%) |
| Fuel Oil or Kerosene | 0 (0.0%) | 0 (0.0%) |
| Coal or Coke | 0 (0.0%) | 0 (0.0%) |
| All other Fuels | 0 (0.0%) | 2 (0.2%) |
| No Fuel Used | 0 (0.0%) | 5 (0.4%) |
| Total | 934 (100.0%) | 1,354 (100.0%) |
Household Vehicle Usage in Kaufman
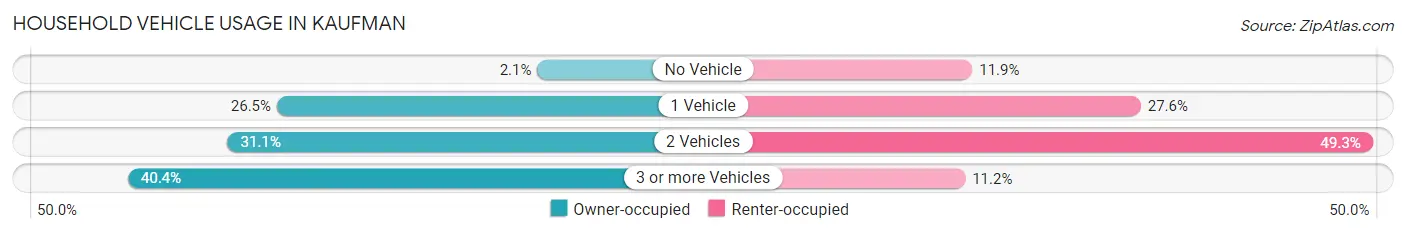
| Vehicles per Household | Owner-occupied | Renter-occupied |
| No Vehicle | 20 (2.1%) | 161 (11.9%) |
| 1 Vehicle | 247 (26.5%) | 374 (27.6%) |
| 2 Vehicles | 290 (31.0%) | 667 (49.3%) |
| 3 or more Vehicles | 377 (40.4%) | 152 (11.2%) |
| Total | 934 (100.0%) | 1,354 (100.0%) |
Real Estate & Mortgages in Kaufman
Real Estate and Mortgage Overview in Kaufman
| Characteristic | Without Mortgage | With Mortgage |
| Housing Units | 444 | 490 |
| Median Property Value | $116,400 | $164,300 |
| Median Household Income | $50,333 | $93 |
| Monthly Housing Costs | $529 | $8 |
| Real Estate Taxes | $1,548 | $1 |
Property Value by Mortgage Status in Kaufman
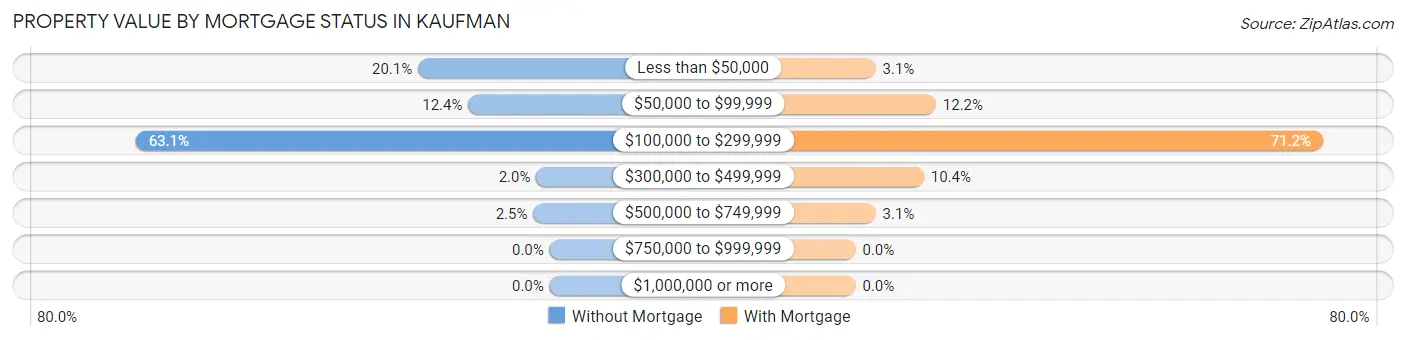
| Property Value | Without Mortgage | With Mortgage |
| Less than $50,000 | 89 (20.1%) | 15 (3.1%) |
| $50,000 to $99,999 | 55 (12.4%) | 60 (12.2%) |
| $100,000 to $299,999 | 280 (63.1%) | 349 (71.2%) |
| $300,000 to $499,999 | 9 (2.0%) | 51 (10.4%) |
| $500,000 to $749,999 | 11 (2.5%) | 15 (3.1%) |
| $750,000 to $999,999 | 0 (0.0%) | 0 (0.0%) |
| $1,000,000 or more | 0 (0.0%) | 0 (0.0%) |
| Total | 444 (100.0%) | 490 (100.0%) |
Household Income by Mortgage Status in Kaufman
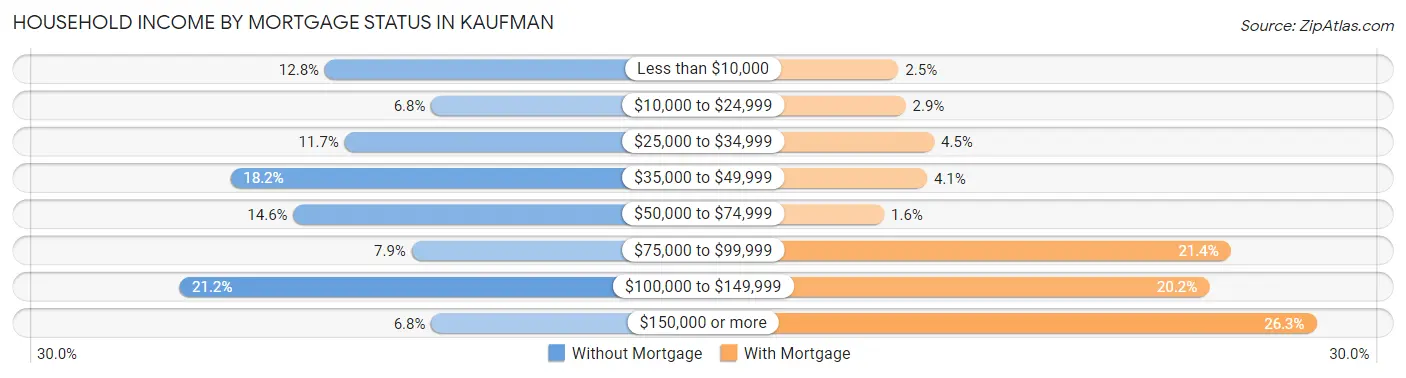
| Household Income | Without Mortgage | With Mortgage |
| Less than $10,000 | 57 (12.8%) | 12 (2.5%) |
| $10,000 to $24,999 | 30 (6.8%) | 14 (2.9%) |
| $25,000 to $34,999 | 52 (11.7%) | 22 (4.5%) |
| $35,000 to $49,999 | 81 (18.2%) | 20 (4.1%) |
| $50,000 to $74,999 | 65 (14.6%) | 8 (1.6%) |
| $75,000 to $99,999 | 35 (7.9%) | 105 (21.4%) |
| $100,000 to $149,999 | 94 (21.2%) | 99 (20.2%) |
| $150,000 or more | 30 (6.8%) | 129 (26.3%) |
| Total | 444 (100.0%) | 490 (100.0%) |
Property Value to Household Income Ratio in Kaufman
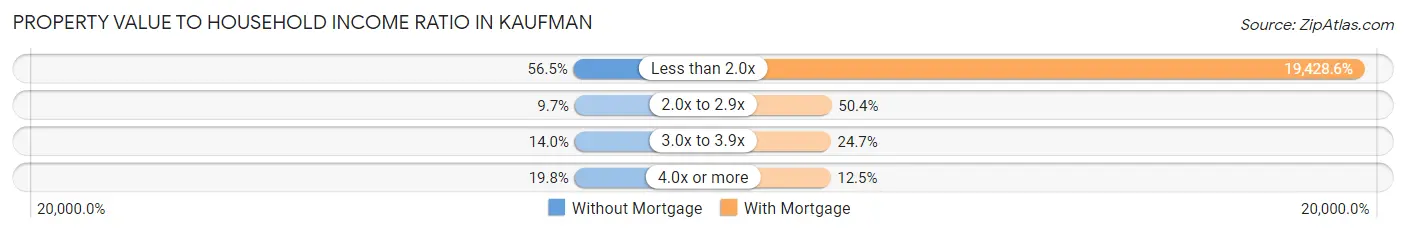
| Value-to-Income Ratio | Without Mortgage | With Mortgage |
| Less than 2.0x | 251 (56.5%) | 95,200 (19,428.6%) |
| 2.0x to 2.9x | 43 (9.7%) | 247 (50.4%) |
| 3.0x to 3.9x | 62 (14.0%) | 121 (24.7%) |
| 4.0x or more | 88 (19.8%) | 61 (12.4%) |
| Total | 444 (100.0%) | 490 (100.0%) |
Real Estate Taxes by Mortgage Status in Kaufman
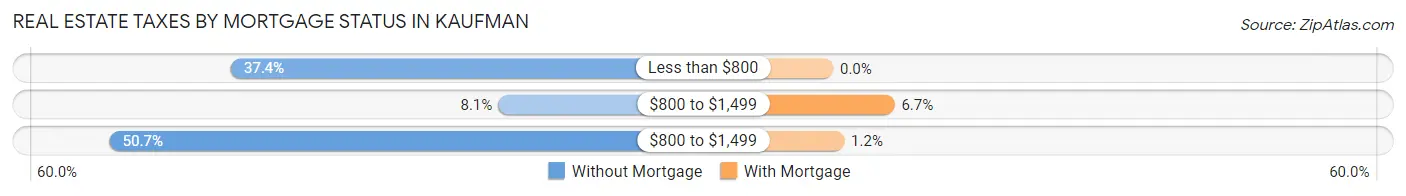
| Property Taxes | Without Mortgage | With Mortgage |
| Less than $800 | 166 (37.4%) | 0 (0.0%) |
| $800 to $1,499 | 36 (8.1%) | 33 (6.7%) |
| $800 to $1,499 | 225 (50.7%) | 6 (1.2%) |
| Total | 444 (100.0%) | 490 (100.0%) |
Health & Disability in Kaufman
Health Insurance Coverage by Age in Kaufman
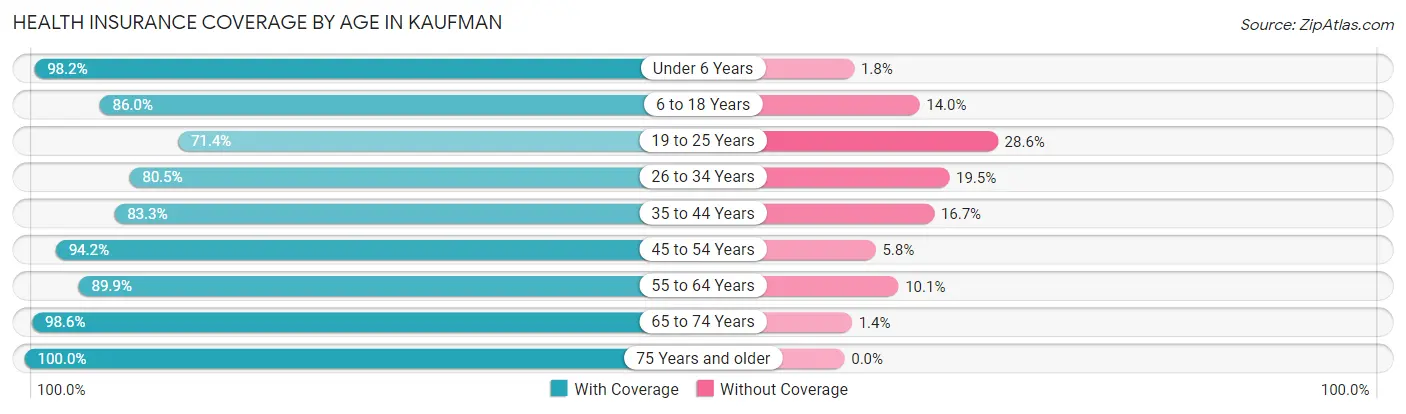
| Age Bracket | With Coverage | Without Coverage |
| Under 6 Years | 708 (98.2%) | 13 (1.8%) |
| 6 to 18 Years | 1,557 (86.0%) | 253 (14.0%) |
| 19 to 25 Years | 417 (71.4%) | 167 (28.6%) |
| 26 to 34 Years | 651 (80.5%) | 158 (19.5%) |
| 35 to 44 Years | 1,051 (83.3%) | 211 (16.7%) |
| 45 to 54 Years | 454 (94.2%) | 28 (5.8%) |
| 55 to 64 Years | 465 (89.9%) | 52 (10.1%) |
| 65 to 74 Years | 495 (98.6%) | 7 (1.4%) |
| 75 Years and older | 301 (100.0%) | 0 (0.0%) |
| Total | 6,099 (87.3%) | 889 (12.7%) |
Health Insurance Coverage by Citizenship Status in Kaufman
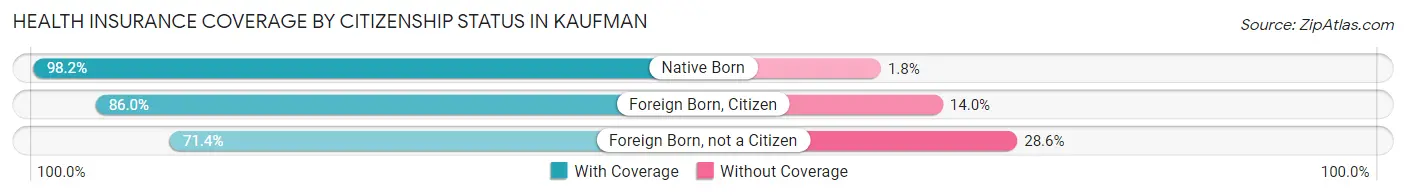
| Citizenship Status | With Coverage | Without Coverage |
| Native Born | 708 (98.2%) | 13 (1.8%) |
| Foreign Born, Citizen | 1,557 (86.0%) | 253 (14.0%) |
| Foreign Born, not a Citizen | 417 (71.4%) | 167 (28.6%) |
Health Insurance Coverage by Household Income in Kaufman
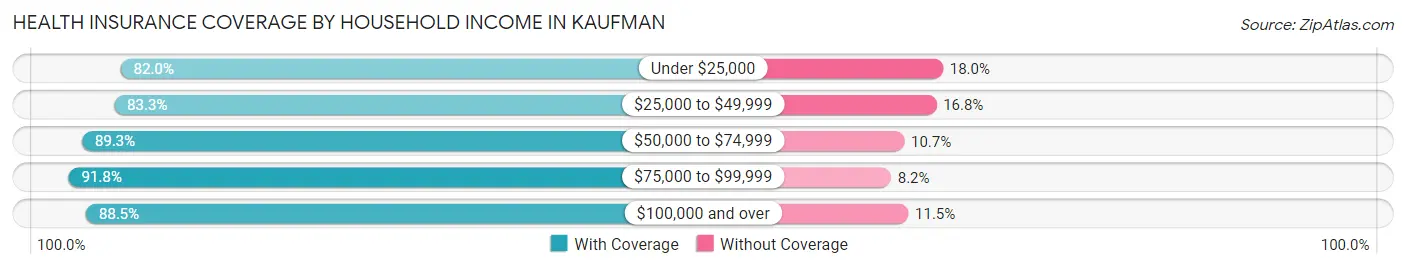
| Household Income | With Coverage | Without Coverage |
| Under $25,000 | 597 (82.0%) | 131 (18.0%) |
| $25,000 to $49,999 | 1,198 (83.3%) | 241 (16.8%) |
| $50,000 to $74,999 | 1,115 (89.3%) | 134 (10.7%) |
| $75,000 to $99,999 | 779 (91.8%) | 70 (8.2%) |
| $100,000 and over | 2,410 (88.5%) | 313 (11.5%) |
Public vs Private Health Insurance Coverage by Age in Kaufman
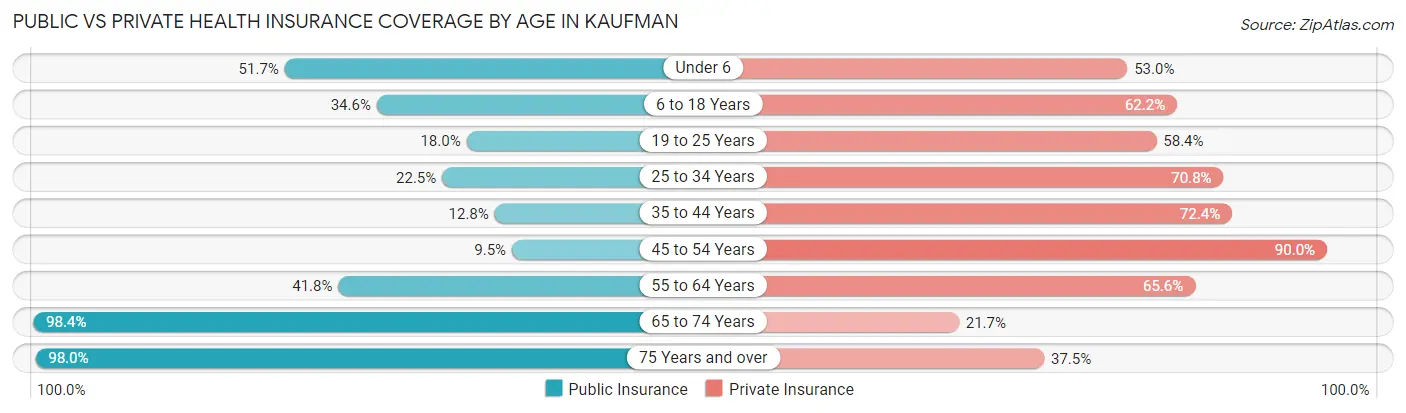
| Age Bracket | Public Insurance | Private Insurance |
| Under 6 | 373 (51.7%) | 382 (53.0%) |
| 6 to 18 Years | 627 (34.6%) | 1,126 (62.2%) |
| 19 to 25 Years | 105 (18.0%) | 341 (58.4%) |
| 25 to 34 Years | 182 (22.5%) | 573 (70.8%) |
| 35 to 44 Years | 161 (12.8%) | 914 (72.4%) |
| 45 to 54 Years | 46 (9.5%) | 434 (90.0%) |
| 55 to 64 Years | 216 (41.8%) | 339 (65.6%) |
| 65 to 74 Years | 494 (98.4%) | 109 (21.7%) |
| 75 Years and over | 295 (98.0%) | 113 (37.5%) |
| Total | 2,499 (35.8%) | 4,331 (62.0%) |
Disability Status by Sex by Age in Kaufman
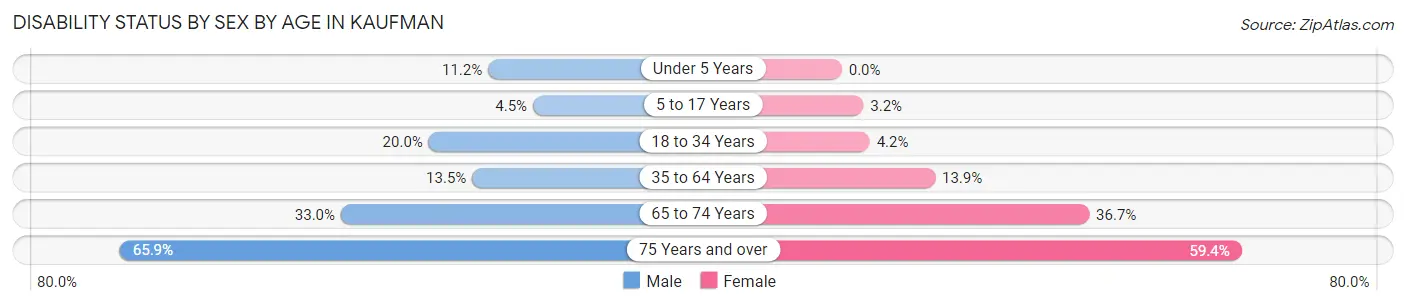
| Age Bracket | Male | Female |
| Under 5 Years | 17 (11.2%) | 0 (0.0%) |
| 5 to 17 Years | 37 (4.5%) | 32 (3.2%) |
| 18 to 34 Years | 137 (20.0%) | 35 (4.2%) |
| 35 to 64 Years | 182 (13.5%) | 127 (13.9%) |
| 65 to 74 Years | 75 (33.0%) | 101 (36.7%) |
| 75 Years and over | 54 (65.8%) | 130 (59.4%) |
Disability Class by Sex by Age in Kaufman
Disability Class: Hearing Difficulty
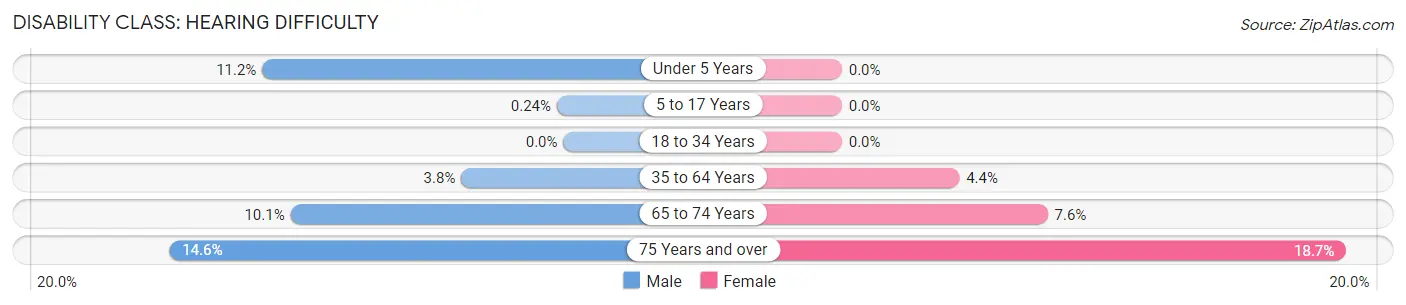
| Age Bracket | Male | Female |
| Under 5 Years | 17 (11.2%) | 0 (0.0%) |
| 5 to 17 Years | 2 (0.2%) | 0 (0.0%) |
| 18 to 34 Years | 0 (0.0%) | 0 (0.0%) |
| 35 to 64 Years | 51 (3.8%) | 40 (4.4%) |
| 65 to 74 Years | 23 (10.1%) | 21 (7.6%) |
| 75 Years and over | 12 (14.6%) | 41 (18.7%) |
Disability Class: Vision Difficulty
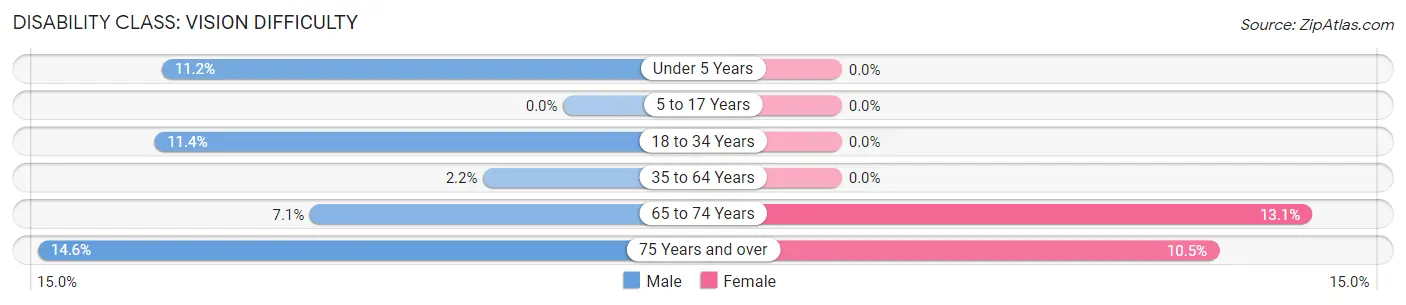
| Age Bracket | Male | Female |
| Under 5 Years | 17 (11.2%) | 0 (0.0%) |
| 5 to 17 Years | 0 (0.0%) | 0 (0.0%) |
| 18 to 34 Years | 78 (11.4%) | 0 (0.0%) |
| 35 to 64 Years | 30 (2.2%) | 0 (0.0%) |
| 65 to 74 Years | 16 (7.0%) | 36 (13.1%) |
| 75 Years and over | 12 (14.6%) | 23 (10.5%) |
Disability Class: Cognitive Difficulty
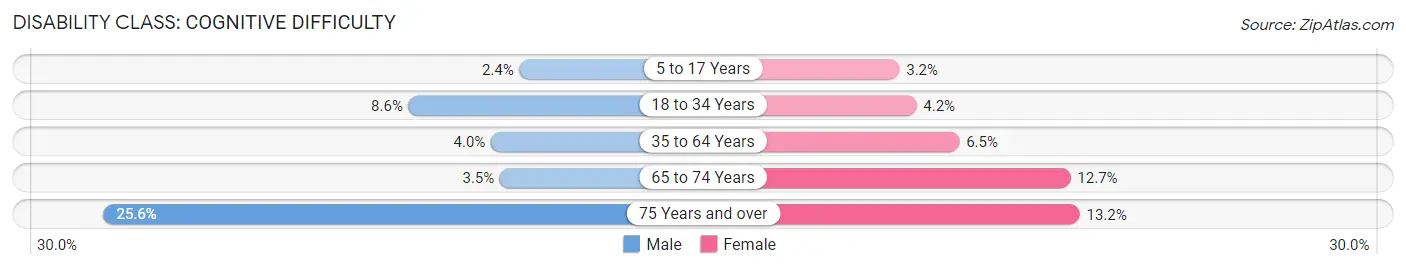
| Age Bracket | Male | Female |
| 5 to 17 Years | 20 (2.4%) | 32 (3.2%) |
| 18 to 34 Years | 59 (8.6%) | 35 (4.2%) |
| 35 to 64 Years | 54 (4.0%) | 60 (6.5%) |
| 65 to 74 Years | 8 (3.5%) | 35 (12.7%) |
| 75 Years and over | 21 (25.6%) | 29 (13.2%) |
Disability Class: Ambulatory Difficulty
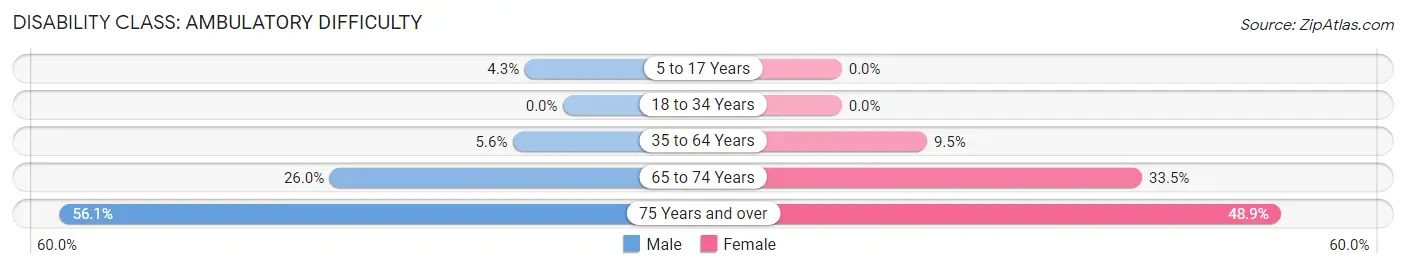
| Age Bracket | Male | Female |
| 5 to 17 Years | 35 (4.3%) | 0 (0.0%) |
| 18 to 34 Years | 0 (0.0%) | 0 (0.0%) |
| 35 to 64 Years | 75 (5.6%) | 87 (9.5%) |
| 65 to 74 Years | 59 (26.0%) | 92 (33.5%) |
| 75 Years and over | 46 (56.1%) | 107 (48.9%) |
Disability Class: Self-Care Difficulty
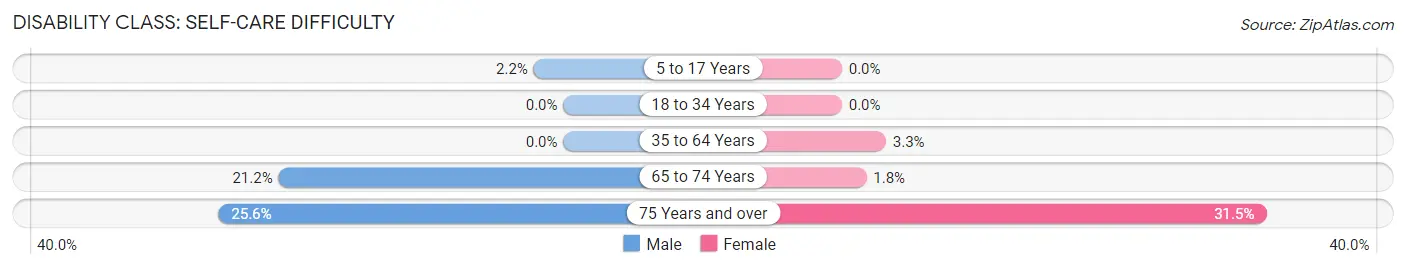
| Age Bracket | Male | Female |
| 5 to 17 Years | 18 (2.2%) | 0 (0.0%) |
| 18 to 34 Years | 0 (0.0%) | 0 (0.0%) |
| 35 to 64 Years | 0 (0.0%) | 30 (3.3%) |
| 65 to 74 Years | 48 (21.1%) | 5 (1.8%) |
| 75 Years and over | 21 (25.6%) | 69 (31.5%) |
Technology Access in Kaufman
Computing Device Access in Kaufman
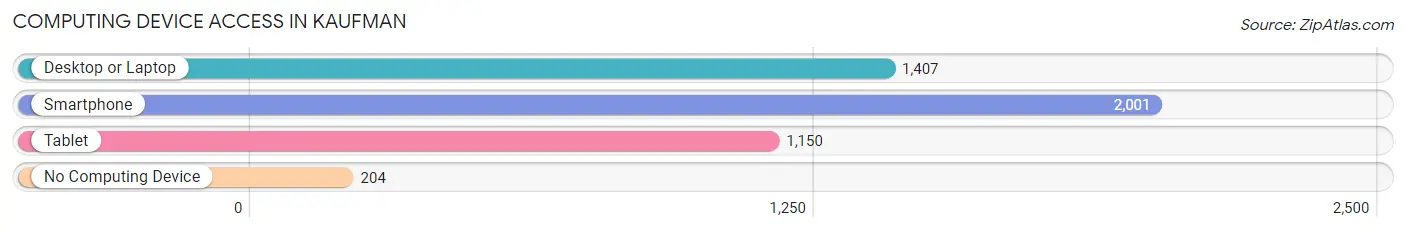
| Device Type | # Households | % Households |
| Desktop or Laptop | 1,407 | 61.5% |
| Smartphone | 2,001 | 87.5% |
| Tablet | 1,150 | 50.3% |
| No Computing Device | 204 | 8.9% |
| Total | 2,288 | 100.0% |
Internet Access in Kaufman
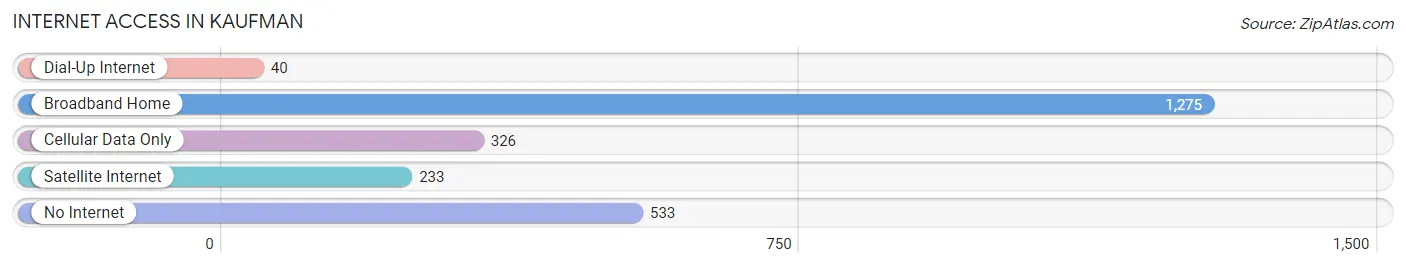
| Internet Type | # Households | % Households |
| Dial-Up Internet | 40 | 1.8% |
| Broadband Home | 1,275 | 55.7% |
| Cellular Data Only | 326 | 14.2% |
| Satellite Internet | 233 | 10.2% |
| No Internet | 533 | 23.3% |
| Total | 2,288 | 100.0% |
Kaufman Summary
Kaufman, Texas is a small city located in Kaufman County, Texas, United States. It is situated approximately 32 miles east of Dallas and is part of the Dallas-Fort Worth metropolitan area. The city has a population of 6,812 as of the 2010 census.
History
Kaufman was founded in 1848 by William Kaufman, a German immigrant who had come to the area in search of a new life. He purchased land from the local Native American tribes and established a trading post. The town was originally called Kings Fort, but was later renamed Kaufman in honor of its founder.
The town grew slowly but steadily over the years, and by the late 19th century it had become a thriving agricultural center. The town was incorporated in 1887 and by the early 20th century it had become a major shipping point for cotton, grain, and livestock.
Geography
Kaufman is located at 32°37'25" North, 96°17'45" West (32.623, -96.296). The city is situated in the eastern part of Kaufman County, approximately 32 miles east of Dallas. It is part of the Dallas-Fort Worth metropolitan area.
The city has a total area of 4.2 square miles, all of which is land. The terrain is mostly flat, with some rolling hills in the northern part of the city. The climate is humid subtropical, with hot summers and mild winters.
Economy
Kaufman’s economy is largely based on agriculture and manufacturing. The city is home to several large agricultural operations, including cotton, grain, and livestock farms. The city is also home to several manufacturing companies, including a plastics plant and a furniture factory.
The city is also home to several retail stores, restaurants, and other businesses. The city’s largest employer is the Kaufman Independent School District, which employs over 1,000 people.
Demographics
As of the 2010 census, Kaufman had a population of 6,812. The racial makeup of the city was 75.3% White, 17.2% African American, 0.7% Native American, 0.5% Asian, 0.1% Pacific Islander, 4.2% from other races, and 2.1% from two or more races. Hispanic or Latino of any race were 11.2% of the population.
The median income for a household in the city was $37,917, and the median income for a family was $45,938. The per capita income for the city was $18,945. About 16.2% of families and 19.2% of the population were below the poverty line, including 28.2% of those under age 18 and 11.2% of those age 65 or over.
Kaufman is served by the Kaufman Independent School District, which includes four elementary schools, one middle school, and one high school. The city is also home to several private schools, including Kaufman Christian Academy and Kaufman Montessori School.
Common Questions
What is Per Capita Income in Kaufman?
Per Capita income in Kaufman is $26,037.
What is the Median Family Income in Kaufman?
Median Family Income in Kaufman is $64,640.
What is the Median Household income in Kaufman?
Median Household Income in Kaufman is $55,349.
What is Income or Wage Gap in Kaufman?
Income or Wage Gap in Kaufman is 20.4%.
Women in Kaufman earn 79.6 cents for every dollar earned by a man.
What is Inequality or Gini Index in Kaufman?
Inequality or Gini Index in Kaufman is 0.45.
What is the Total Population of Kaufman?
Total Population of Kaufman is 7,520.
What is the Total Male Population of Kaufman?
Total Male Population of Kaufman is 3,697.
What is the Total Female Population of Kaufman?
Total Female Population of Kaufman is 3,823.
What is the Ratio of Males per 100 Females in Kaufman?
There are 96.70 Males per 100 Females in Kaufman.
What is the Ratio of Females per 100 Males in Kaufman?
There are 103.41 Females per 100 Males in Kaufman.
What is the Median Population Age in Kaufman?
Median Population Age in Kaufman is 30.9 Years.
What is the Average Family Size in Kaufman
Average Family Size in Kaufman is 3.9 People.
What is the Average Household Size in Kaufman
Average Household Size in Kaufman is 3.0 People.
How Large is the Labor Force in Kaufman?
There are 3,385 People in the Labor Forcein in Kaufman.
What is the Percentage of People in the Labor Force in Kaufman?
63.9% of People are in the Labor Force in Kaufman.
What is the Unemployment Rate in Kaufman?
Unemployment Rate in Kaufman is 5.2%.