Junction, TX Map & Demographics
Junction Map
Junction Overview
$25,589
PER CAPITA INCOME
$71,172
AVG FAMILY INCOME
$55,110
AVG HOUSEHOLD INCOME
26.1%
WAGE / INCOME GAP [ % ]
73.9¢/ $1
WAGE / INCOME GAP [ $ ]
0.45
INEQUALITY / GINI INDEX
2,494
TOTAL POPULATION
1,201
MALE POPULATION
1,293
FEMALE POPULATION
92.88
MALES / 100 FEMALES
107.66
FEMALES / 100 MALES
35.0
MEDIAN AGE
3.7
AVG FAMILY SIZE
2.8
AVG HOUSEHOLD SIZE
1,334
LABOR FORCE [ PEOPLE ]
68.6%
PERCENT IN LABOR FORCE
1.2%
UNEMPLOYMENT RATE
Junction Zip Codes
Junction Area Codes
Income in Junction
Income Overview in Junction
Per Capita Income in Junction is $25,589, while median incomes of families and households are $71,172 and $55,110 respectively.
| Characteristic | Number | Measure |
| Per Capita Income | 2,494 | $25,589 |
| Median Family Income | 535 | $71,172 |
| Mean Family Income | 535 | $84,332 |
| Median Household Income | 883 | $55,110 |
| Mean Household Income | 883 | $70,073 |
| Income Deficit | 535 | $0 |
| Wage / Income Gap (%) | 2,494 | 26.09% |
| Wage / Income Gap ($) | 2,494 | 73.91¢ per $1 |
| Gini / Inequality Index | 2,494 | 0.45 |
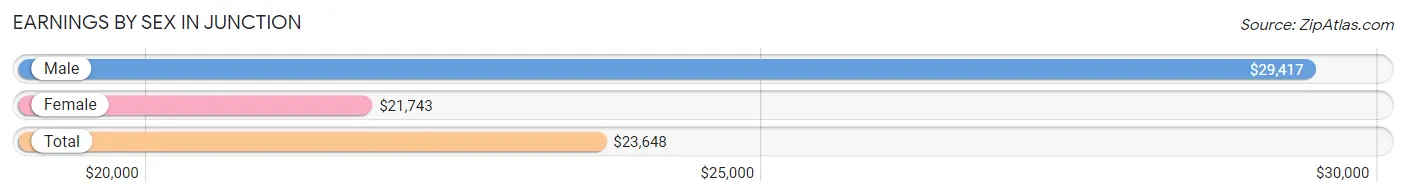
Earnings by Sex in Junction
Average Earnings in Junction are $23,648, $29,417 for men and $21,743 for women, a difference of 26.1%.
| Sex | Number | Average Earnings |
| Male | 737 (53.5%) | $29,417 |
| Female | 641 (46.5%) | $21,743 |
| Total | 1,378 (100.0%) | $23,648 |
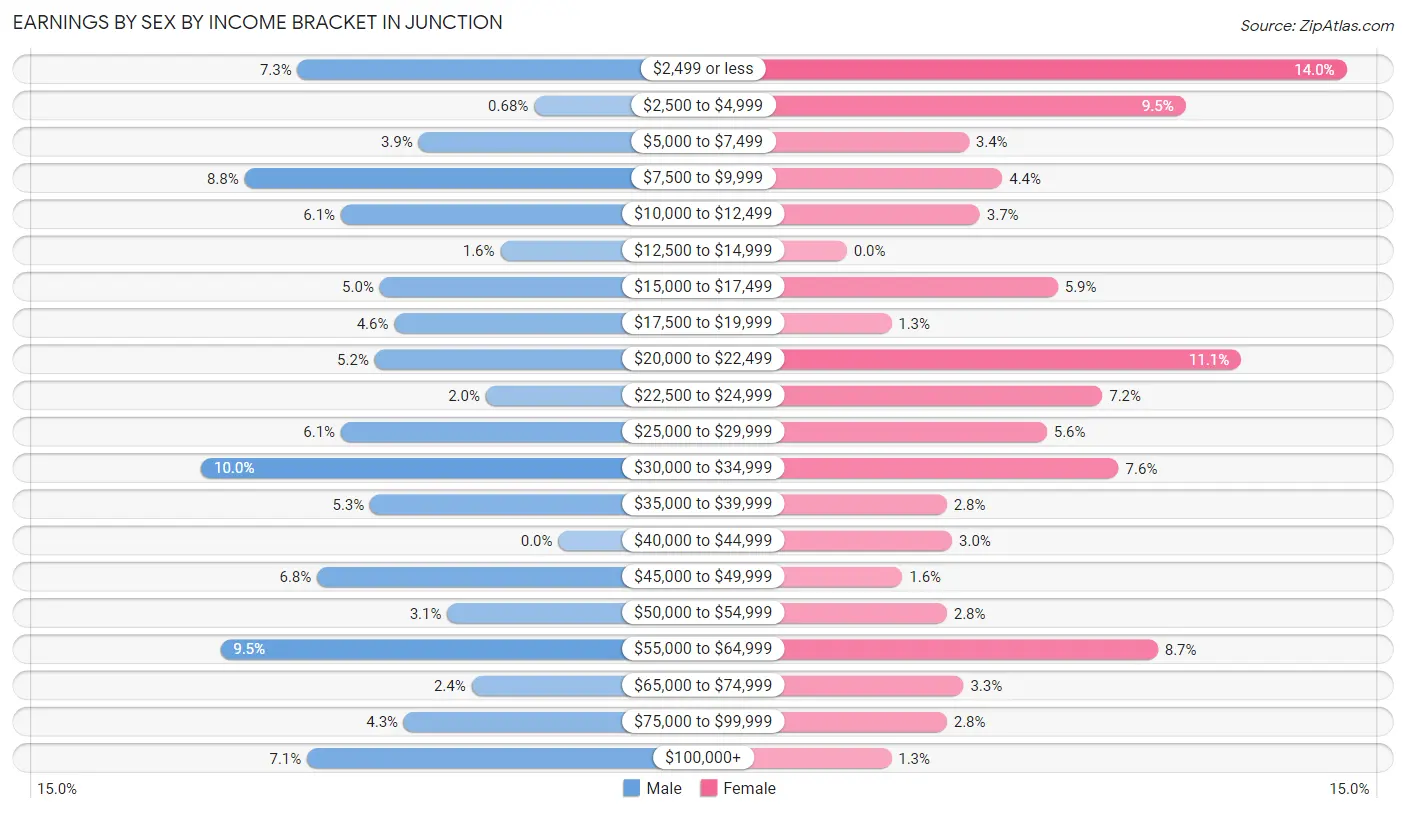
Earnings by Sex by Income Bracket in Junction
The most common earnings brackets in Junction are $30,000 to $34,999 for men (74 | 10.0%) and $2,499 or less for women (90 | 14.0%).
| Income | Male | Female |
| $2,499 or less | 54 (7.3%) | 90 (14.0%) |
| $2,500 to $4,999 | 5 (0.7%) | 61 (9.5%) |
| $5,000 to $7,499 | 29 (3.9%) | 22 (3.4%) |
| $7,500 to $9,999 | 65 (8.8%) | 28 (4.4%) |
| $10,000 to $12,499 | 45 (6.1%) | 24 (3.7%) |
| $12,500 to $14,999 | 12 (1.6%) | 0 (0.0%) |
| $15,000 to $17,499 | 37 (5.0%) | 38 (5.9%) |
| $17,500 to $19,999 | 34 (4.6%) | 8 (1.3%) |
| $20,000 to $22,499 | 38 (5.2%) | 71 (11.1%) |
| $22,500 to $24,999 | 15 (2.0%) | 46 (7.2%) |
| $25,000 to $29,999 | 45 (6.1%) | 36 (5.6%) |
| $30,000 to $34,999 | 74 (10.0%) | 49 (7.6%) |
| $35,000 to $39,999 | 39 (5.3%) | 18 (2.8%) |
| $40,000 to $44,999 | 0 (0.0%) | 19 (3.0%) |
| $45,000 to $49,999 | 50 (6.8%) | 10 (1.6%) |
| $50,000 to $54,999 | 23 (3.1%) | 18 (2.8%) |
| $55,000 to $64,999 | 70 (9.5%) | 56 (8.7%) |
| $65,000 to $74,999 | 18 (2.4%) | 21 (3.3%) |
| $75,000 to $99,999 | 32 (4.3%) | 18 (2.8%) |
| $100,000+ | 52 (7.1%) | 8 (1.3%) |
| Total | 737 (100.0%) | 641 (100.0%) |
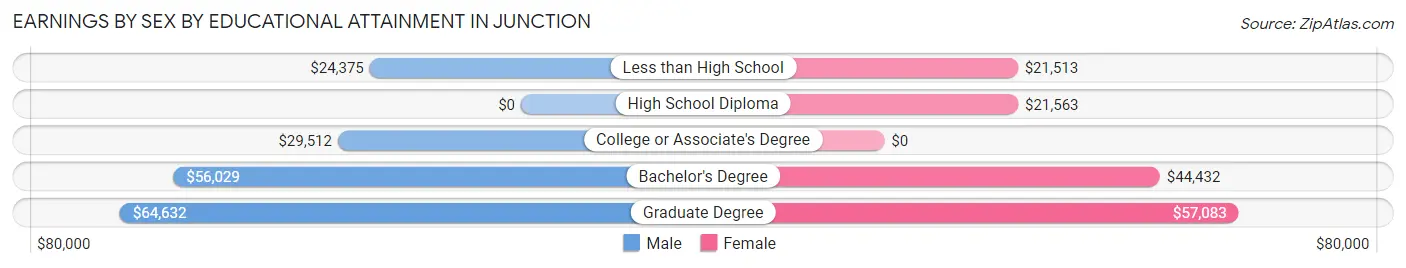
Earnings by Sex by Educational Attainment in Junction
Average earnings in Junction are $34,457 for men and $27,794 for women, a difference of 19.3%. Men with an educational attainment of graduate degree enjoy the highest average annual earnings of $64,632, while those with less than high school education earn the least with $24,375. Women with an educational attainment of graduate degree earn the most with the average annual earnings of $57,083, while those with less than high school education have the smallest earnings of $21,513.
| Educational Attainment | Male Income | Female Income |
| Less than High School | $24,375 | $21,513 |
| High School Diploma | - | - |
| College or Associate's Degree | $29,512 | $0 |
| Bachelor's Degree | $56,029 | $44,432 |
| Graduate Degree | $64,632 | $57,083 |
| Total | $34,457 | $27,794 |
Family Income in Junction
Family Income Brackets in Junction
According to the Junction family income data, there are 129 families falling into the $100,000 to $149,999 income range, which is the most common income bracket and makes up 24.1% of all families. Conversely, the $15,000 to $24,999 income bracket is the least frequent group with only 14 families (2.6%) belonging to this category.
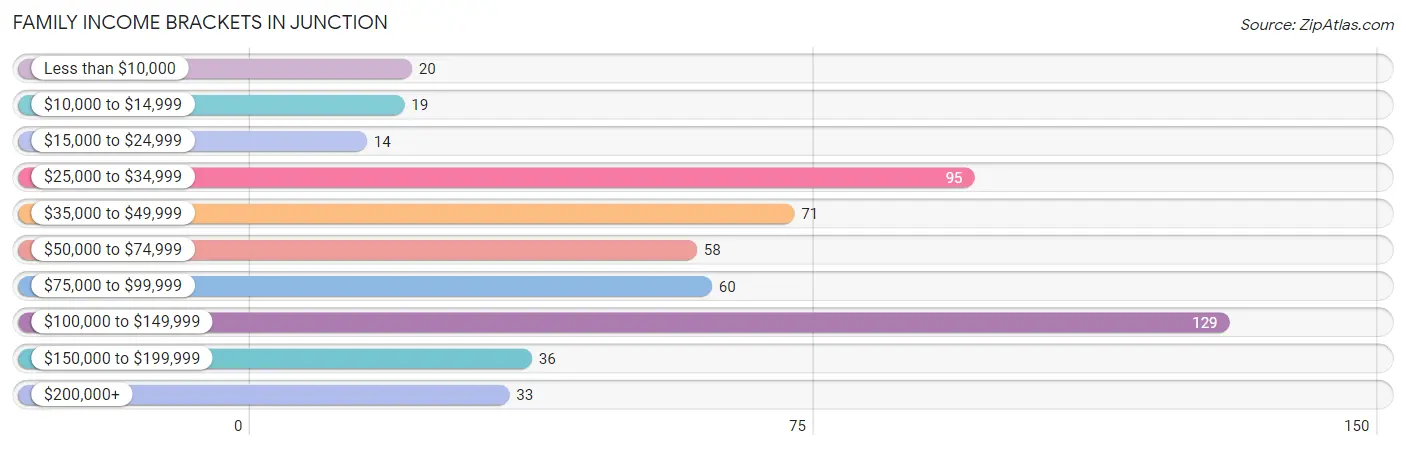
| Income Bracket | # Families | % Families |
| Less than $10,000 | 20 | 3.7% |
| $10,000 to $14,999 | 19 | 3.6% |
| $15,000 to $24,999 | 14 | 2.6% |
| $25,000 to $34,999 | 95 | 17.8% |
| $35,000 to $49,999 | 71 | 13.3% |
| $50,000 to $74,999 | 58 | 10.8% |
| $75,000 to $99,999 | 60 | 11.2% |
| $100,000 to $149,999 | 129 | 24.1% |
| $150,000 to $199,999 | 36 | 6.7% |
| $200,000+ | 33 | 6.2% |
Family Income by Famaliy Size in Junction
6-person families (53 | 9.9%) account for the highest median family income in Junction with $126,726 per family, while 2-person families (188 | 35.1%) have the highest median income of $37,778 per family member.
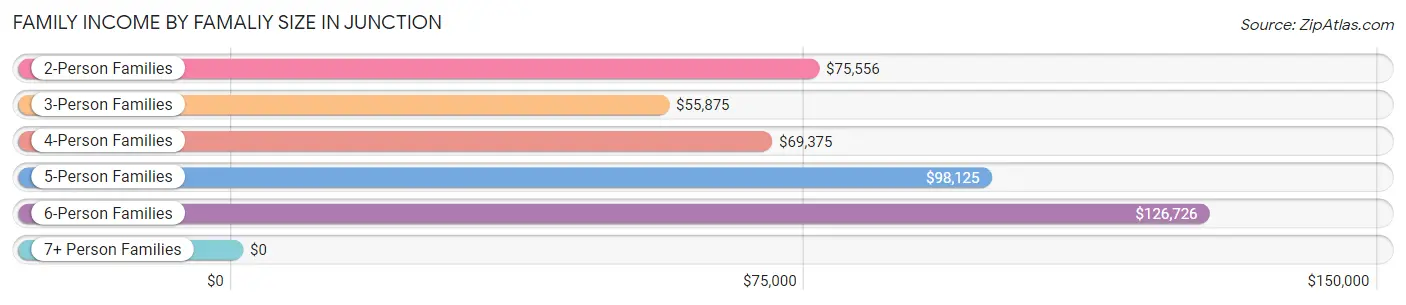
| Income Bracket | # Families | Median Income |
| 2-Person Families | 188 (35.1%) | $75,556 |
| 3-Person Families | 128 (23.9%) | $55,875 |
| 4-Person Families | 150 (28.0%) | $69,375 |
| 5-Person Families | 10 (1.9%) | $98,125 |
| 6-Person Families | 53 (9.9%) | $126,726 |
| 7+ Person Families | 6 (1.1%) | $0 |
| Total | 535 (100.0%) | $71,172 |
Family Income by Number of Earners in Junction
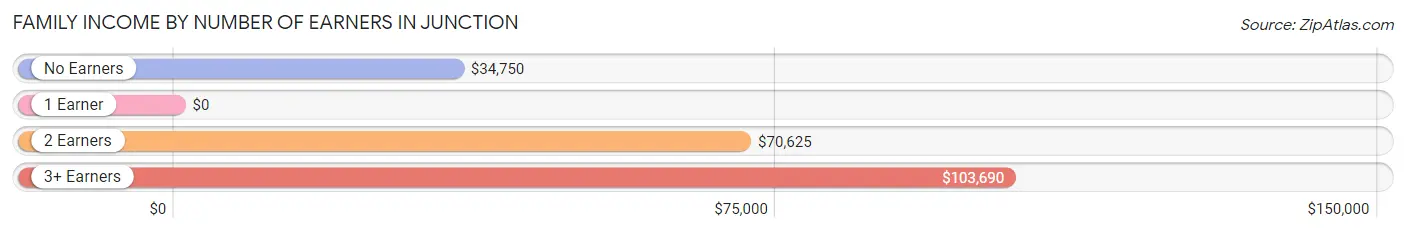
| Number of Earners | # Families | Median Income |
| No Earners | 36 (6.7%) | $34,750 |
| 1 Earner | 174 (32.5%) | $0 |
| 2 Earners | 243 (45.4%) | $70,625 |
| 3+ Earners | 82 (15.3%) | $103,690 |
| Total | 535 (100.0%) | $71,172 |
Household Income in Junction
Household Income Brackets in Junction
With 154 households falling in the category, the $100,000 to $149,999 income range is the most frequent in Junction, accounting for 17.4% of all households. In contrast, only 36 households (4.1%) fall into the $150,000 to $199,999 income bracket, making it the least populous group.
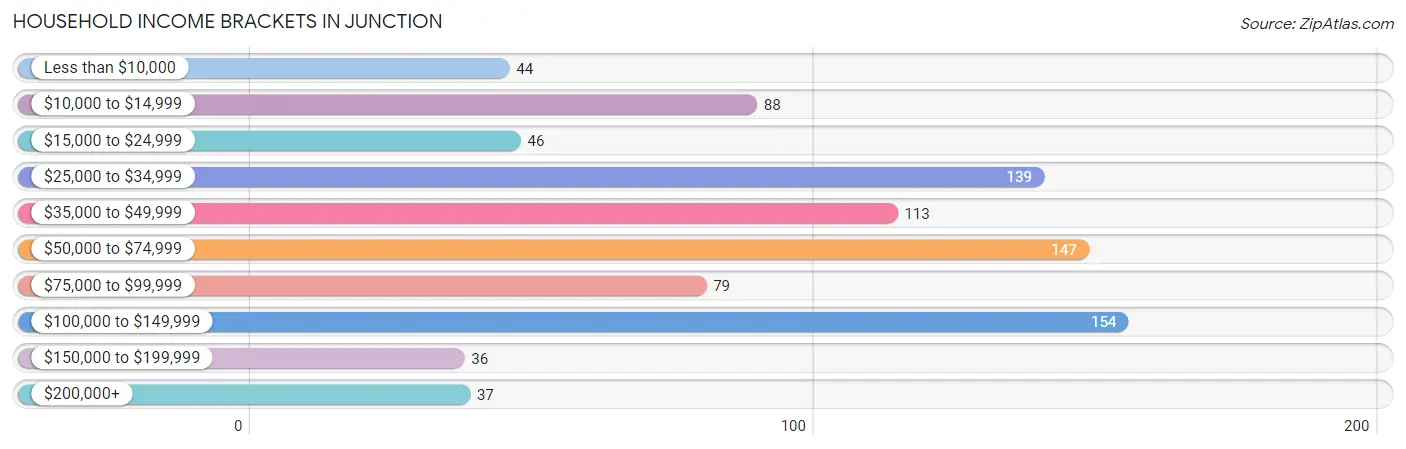
| Income Bracket | # Households | % Households |
| Less than $10,000 | 44 | 5.0% |
| $10,000 to $14,999 | 88 | 10.0% |
| $15,000 to $24,999 | 46 | 5.2% |
| $25,000 to $34,999 | 139 | 15.7% |
| $35,000 to $49,999 | 113 | 12.8% |
| $50,000 to $74,999 | 147 | 16.6% |
| $75,000 to $99,999 | 79 | 8.9% |
| $100,000 to $149,999 | 154 | 17.4% |
| $150,000 to $199,999 | 36 | 4.1% |
| $200,000+ | 37 | 4.2% |
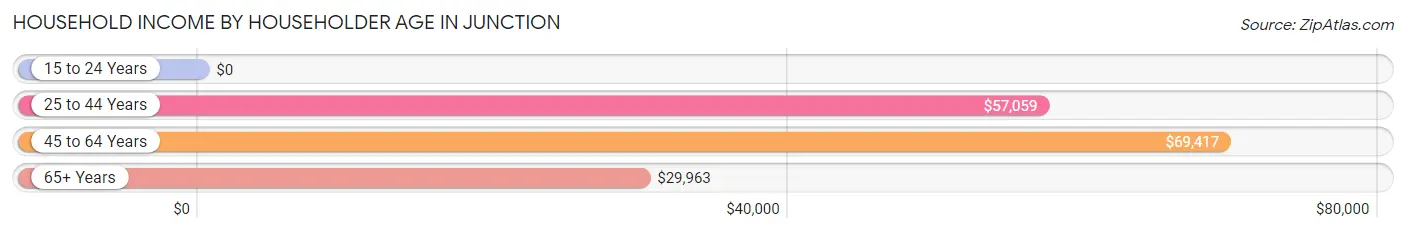
Household Income by Householder Age in Junction
The median household income in Junction is $55,110, with the highest median household income of $69,417 found in the 45 to 64 years age bracket for the primary householder. A total of 219 households (24.8%) fall into this category. Meanwhile, the 15 to 24 years age bracket for the primary householder has the lowest median household income of $0, with 37 households (4.2%) in this group.
| Income Bracket | # Households | Median Income |
| 15 to 24 Years | 37 (4.2%) | $0 |
| 25 to 44 Years | 304 (34.4%) | $57,059 |
| 45 to 64 Years | 219 (24.8%) | $69,417 |
| 65+ Years | 323 (36.6%) | $29,963 |
| Total | 883 (100.0%) | $55,110 |
Poverty in Junction
Income Below Poverty by Sex and Age in Junction
With 13.6% poverty level for males and 17.2% for females among the residents of Junction, 12 to 14 year old males and 65 to 74 year old females are the most vulnerable to poverty, with 14 males (70.0%) and 58 females (34.1%) in their respective age groups living below the poverty level.
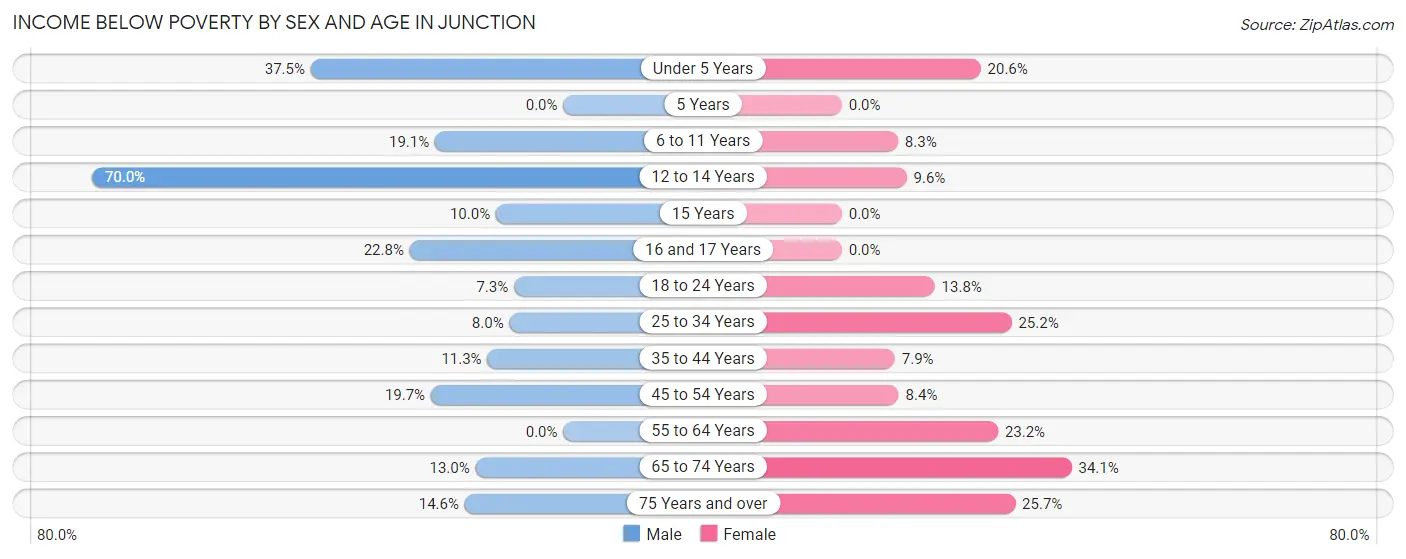
| Age Bracket | Male | Female |
| Under 5 Years | 15 (37.5%) | 27 (20.6%) |
| 5 Years | 0 (0.0%) | 0 (0.0%) |
| 6 to 11 Years | 20 (19.1%) | 9 (8.3%) |
| 12 to 14 Years | 14 (70.0%) | 5 (9.6%) |
| 15 Years | 7 (10.0%) | 0 (0.0%) |
| 16 and 17 Years | 13 (22.8%) | 0 (0.0%) |
| 18 to 24 Years | 12 (7.3%) | 20 (13.8%) |
| 25 to 34 Years | 14 (8.0%) | 32 (25.2%) |
| 35 to 44 Years | 23 (11.3%) | 16 (7.9%) |
| 45 to 54 Years | 23 (19.7%) | 13 (8.4%) |
| 55 to 64 Years | 0 (0.0%) | 16 (23.2%) |
| 65 to 74 Years | 12 (13.0%) | 58 (34.1%) |
| 75 Years and over | 6 (14.6%) | 26 (25.7%) |
| Total | 159 (13.6%) | 222 (17.2%) |
Income Above Poverty by Sex and Age in Junction
According to the poverty statistics in Junction, males aged 55 to 64 years and females aged 15 years are the age groups that are most secure financially, with 100.0% of males and 100.0% of females in these age groups living above the poverty line.
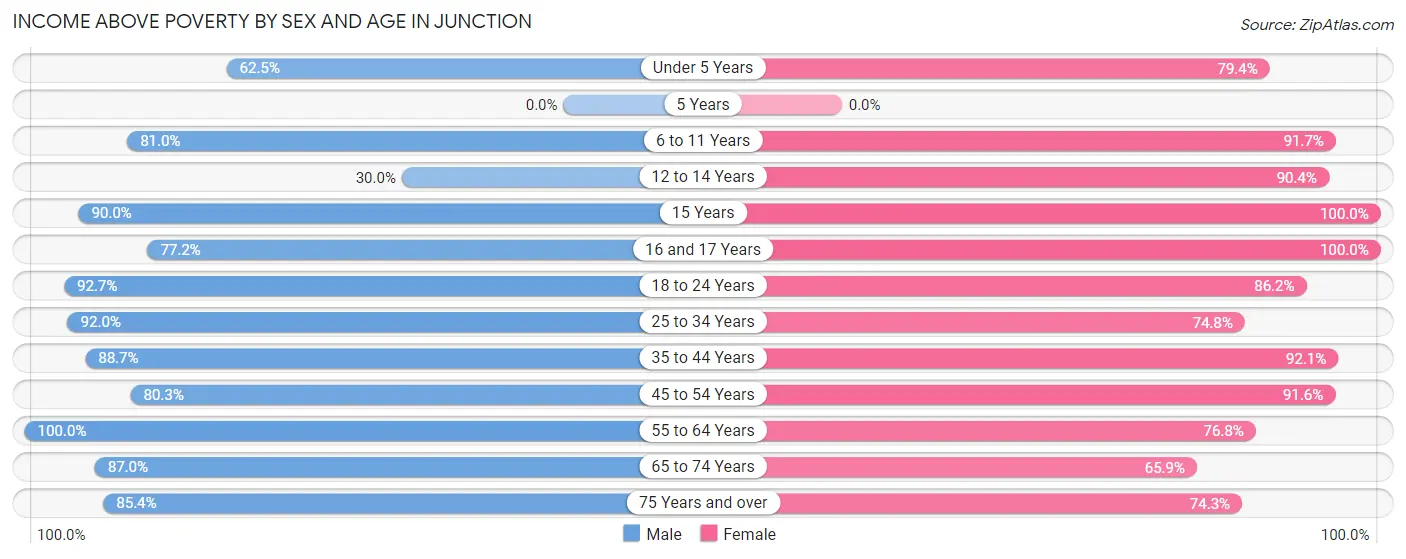
| Age Bracket | Male | Female |
| Under 5 Years | 25 (62.5%) | 104 (79.4%) |
| 5 Years | 0 (0.0%) | 0 (0.0%) |
| 6 to 11 Years | 85 (80.9%) | 99 (91.7%) |
| 12 to 14 Years | 6 (30.0%) | 47 (90.4%) |
| 15 Years | 63 (90.0%) | 20 (100.0%) |
| 16 and 17 Years | 44 (77.2%) | 9 (100.0%) |
| 18 to 24 Years | 152 (92.7%) | 125 (86.2%) |
| 25 to 34 Years | 161 (92.0%) | 95 (74.8%) |
| 35 to 44 Years | 181 (88.7%) | 187 (92.1%) |
| 45 to 54 Years | 94 (80.3%) | 141 (91.6%) |
| 55 to 64 Years | 81 (100.0%) | 53 (76.8%) |
| 65 to 74 Years | 80 (87.0%) | 112 (65.9%) |
| 75 Years and over | 35 (85.4%) | 75 (74.3%) |
| Total | 1,007 (86.4%) | 1,067 (82.8%) |
Income Below Poverty Among Married-Couple Families in Junction
The poverty statistics for married-couple families in Junction show that 5.3% or 23 of the total 433 families live below the poverty line. Families with 5 or more children have the highest poverty rate of 100.0%, comprising of 6 families. On the other hand, families with 3 or 4 children have the lowest poverty rate of 0.0%, which includes 0 families.
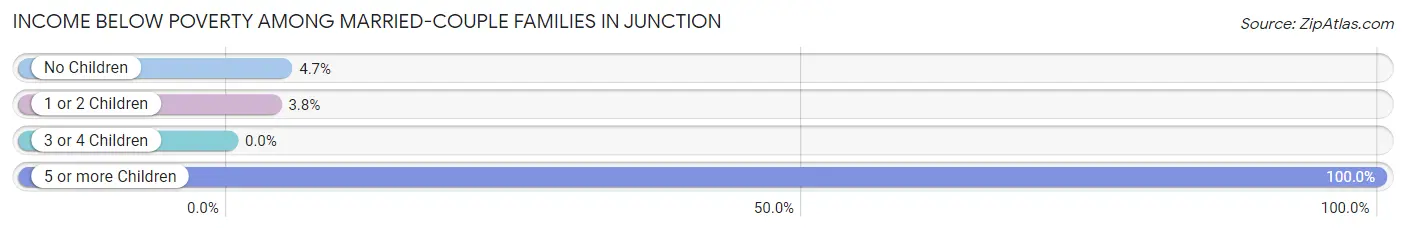
| Children | Above Poverty | Below Poverty |
| No Children | 202 (95.3%) | 10 (4.7%) |
| 1 or 2 Children | 178 (96.2%) | 7 (3.8%) |
| 3 or 4 Children | 30 (100.0%) | 0 (0.0%) |
| 5 or more Children | 0 (0.0%) | 6 (100.0%) |
| Total | 410 (94.7%) | 23 (5.3%) |
Income Below Poverty Among Single-Parent Households in Junction
According to the poverty data in Junction, 50.0% or 12 single-father households and 30.8% or 24 single-mother households are living below the poverty line. Among single-father households, those with 3 or 4 children have the highest poverty rate, with 7 households (100.0%) experiencing poverty. Likewise, among single-mother households, those with 5 or more children have the highest poverty rate, with 2 households (100.0%) falling below the poverty line.
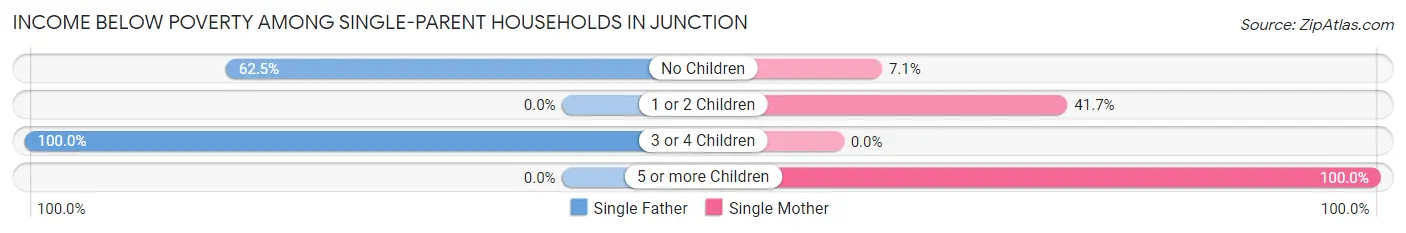
| Children | Single Father | Single Mother |
| No Children | 5 (62.5%) | 2 (7.1%) |
| 1 or 2 Children | 0 (0.0%) | 20 (41.7%) |
| 3 or 4 Children | 7 (100.0%) | 0 (0.0%) |
| 5 or more Children | 0 (0.0%) | 2 (100.0%) |
| Total | 12 (50.0%) | 24 (30.8%) |
Income Below Poverty Among Married-Couple vs Single-Parent Households in Junction
The poverty data for Junction shows that 23 of the married-couple family households (5.3%) and 36 of the single-parent households (35.3%) are living below the poverty level. Within the married-couple family households, those with 5 or more children have the highest poverty rate, with 6 households (100.0%) falling below the poverty line. Among the single-parent households, those with 3 or 4 children have the highest poverty rate, with 7 household (100.0%) living below poverty.
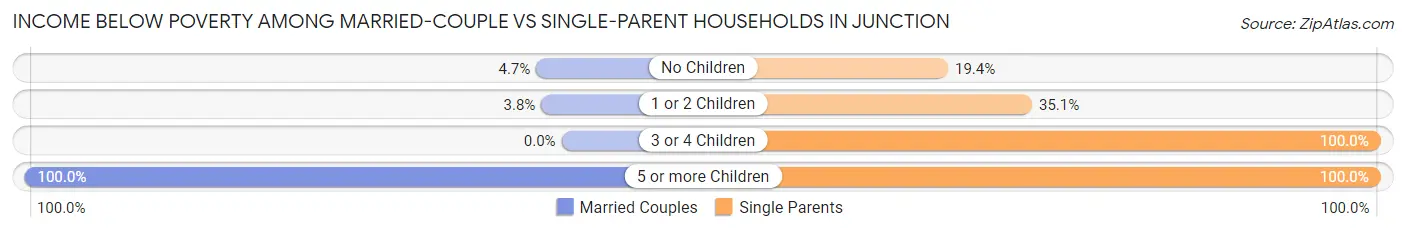
| Children | Married-Couple Families | Single-Parent Households |
| No Children | 10 (4.7%) | 7 (19.4%) |
| 1 or 2 Children | 7 (3.8%) | 20 (35.1%) |
| 3 or 4 Children | 0 (0.0%) | 7 (100.0%) |
| 5 or more Children | 6 (100.0%) | 2 (100.0%) |
| Total | 23 (5.3%) | 36 (35.3%) |
Race in Junction
The most populous races in Junction are White / Caucasian (1,741 | 69.8%), Hispanic or Latino (1,038 | 41.6%), and Two or more Races (509 | 20.4%).
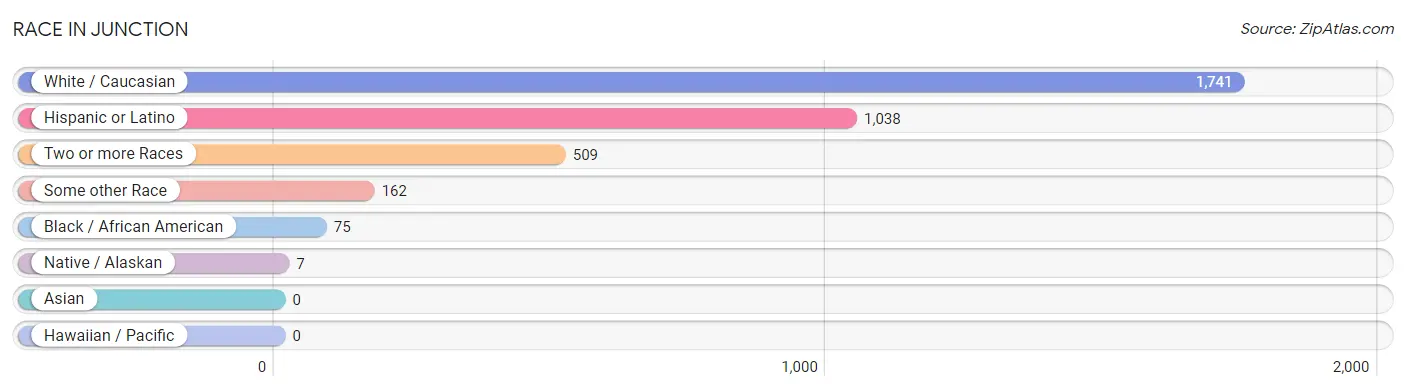
| Race | # Population | % Population |
| Asian | 0 | 0.0% |
| Black / African American | 75 | 3.0% |
| Hawaiian / Pacific | 0 | 0.0% |
| Hispanic or Latino | 1,038 | 41.6% |
| Native / Alaskan | 7 | 0.3% |
| White / Caucasian | 1,741 | 69.8% |
| Two or more Races | 509 | 20.4% |
| Some other Race | 162 | 6.5% |
| Total | 2,494 | 100.0% |
Ancestry in Junction
The most populous ancestries reported in Junction are Mexican (1,001 | 40.1%), German (452 | 18.1%), Irish (214 | 8.6%), English (130 | 5.2%), and American (117 | 4.7%), together accounting for 76.7% of all Junction residents.
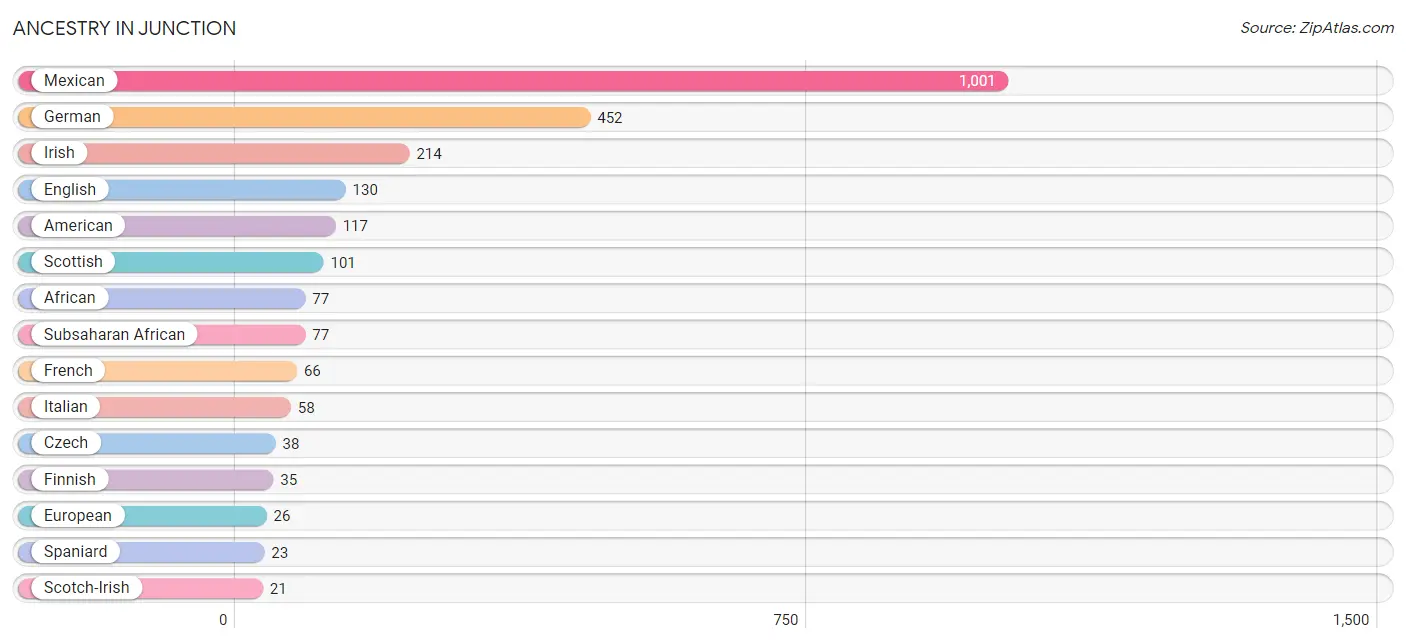
| Ancestry | # Population | % Population |
| African | 77 | 3.1% |
| American | 117 | 4.7% |
| Apache | 12 | 0.5% |
| Blackfeet | 6 | 0.2% |
| British | 6 | 0.2% |
| Central American | 1 | 0.0% |
| Central American Indian | 3 | 0.1% |
| Cherokee | 3 | 0.1% |
| Comanche | 12 | 0.5% |
| Croatian | 5 | 0.2% |
| Czech | 38 | 1.5% |
| Czechoslovakian | 10 | 0.4% |
| English | 130 | 5.2% |
| European | 26 | 1.0% |
| Finnish | 35 | 1.4% |
| French | 66 | 2.6% |
| French Canadian | 9 | 0.4% |
| German | 452 | 18.1% |
| Irish | 214 | 8.6% |
| Italian | 58 | 2.3% |
| Mexican | 1,001 | 40.1% |
| Norwegian | 2 | 0.1% |
| Puerto Rican | 13 | 0.5% |
| Romanian | 5 | 0.2% |
| Salvadoran | 1 | 0.0% |
| Scotch-Irish | 21 | 0.8% |
| Scottish | 101 | 4.1% |
| Spaniard | 23 | 0.9% |
| Subsaharan African | 77 | 3.1% |
| Welsh | 2 | 0.1% | View All 30 Rows |
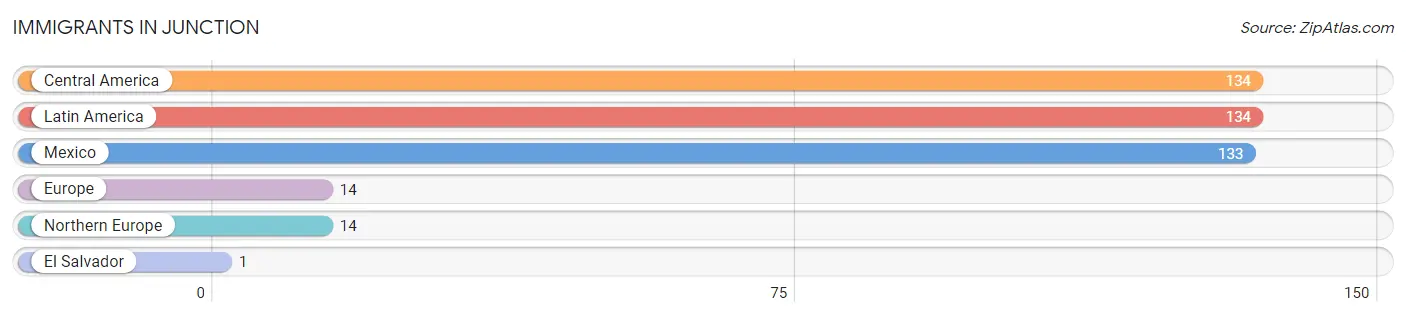
Immigrants in Junction
The most numerous immigrant groups reported in Junction came from Central America (134 | 5.4%), Latin America (134 | 5.4%), Mexico (133 | 5.3%), Europe (14 | 0.6%), and Northern Europe (14 | 0.6%), together accounting for 17.2% of all Junction residents.
| Immigration Origin | # Population | % Population |
| Central America | 134 | 5.4% |
| El Salvador | 1 | 0.0% |
| Europe | 14 | 0.6% |
| Latin America | 134 | 5.4% |
| Mexico | 133 | 5.3% |
| Northern Europe | 14 | 0.6% | View All 6 Rows |
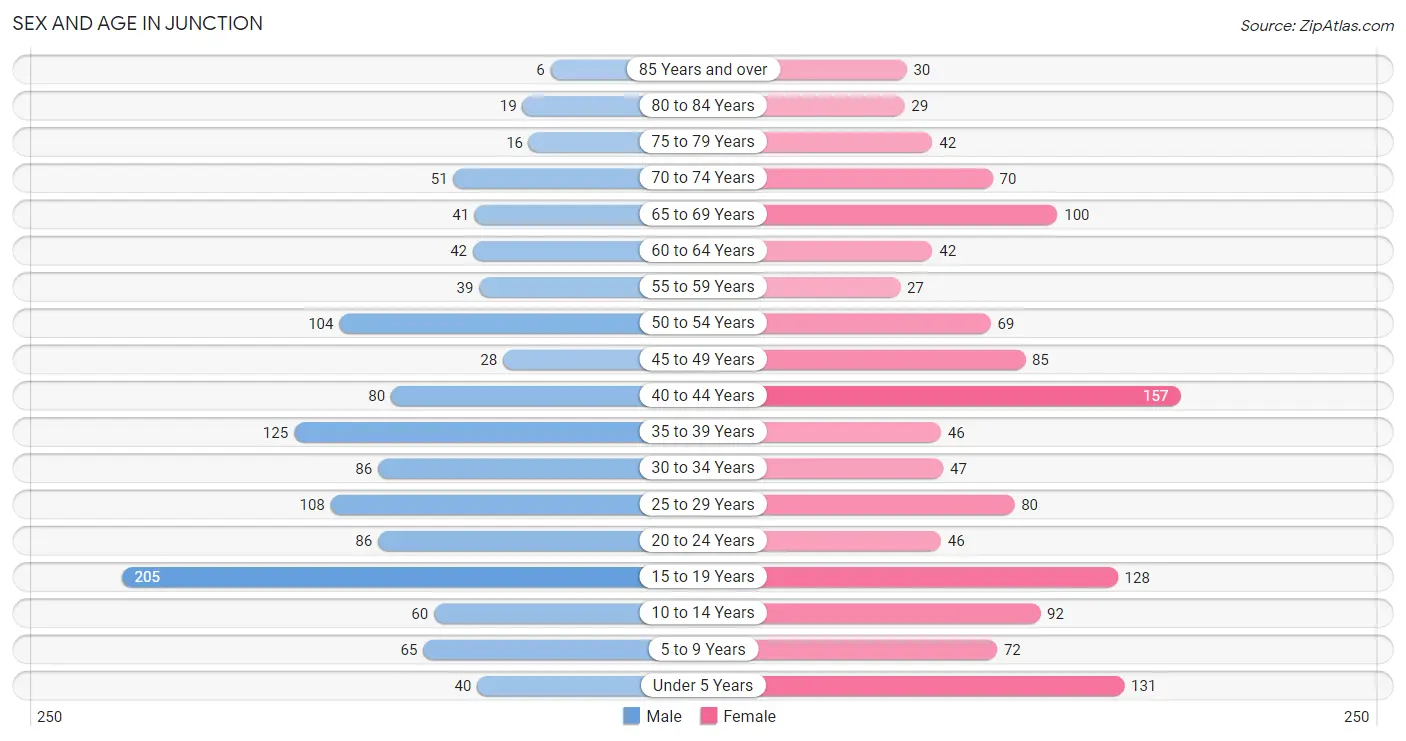
Sex and Age in Junction
Sex and Age in Junction
The most populous age groups in Junction are 15 to 19 Years (205 | 17.1%) for men and 40 to 44 Years (157 | 12.1%) for women.
| Age Bracket | Male | Female |
| Under 5 Years | 40 (3.3%) | 131 (10.1%) |
| 5 to 9 Years | 65 (5.4%) | 72 (5.6%) |
| 10 to 14 Years | 60 (5.0%) | 92 (7.1%) |
| 15 to 19 Years | 205 (17.1%) | 128 (9.9%) |
| 20 to 24 Years | 86 (7.2%) | 46 (3.6%) |
| 25 to 29 Years | 108 (9.0%) | 80 (6.2%) |
| 30 to 34 Years | 86 (7.2%) | 47 (3.6%) |
| 35 to 39 Years | 125 (10.4%) | 46 (3.6%) |
| 40 to 44 Years | 80 (6.7%) | 157 (12.1%) |
| 45 to 49 Years | 28 (2.3%) | 85 (6.6%) |
| 50 to 54 Years | 104 (8.7%) | 69 (5.3%) |
| 55 to 59 Years | 39 (3.3%) | 27 (2.1%) |
| 60 to 64 Years | 42 (3.5%) | 42 (3.3%) |
| 65 to 69 Years | 41 (3.4%) | 100 (7.7%) |
| 70 to 74 Years | 51 (4.3%) | 70 (5.4%) |
| 75 to 79 Years | 16 (1.3%) | 42 (3.3%) |
| 80 to 84 Years | 19 (1.6%) | 29 (2.2%) |
| 85 Years and over | 6 (0.5%) | 30 (2.3%) |
| Total | 1,201 (100.0%) | 1,293 (100.0%) |
Families and Households in Junction
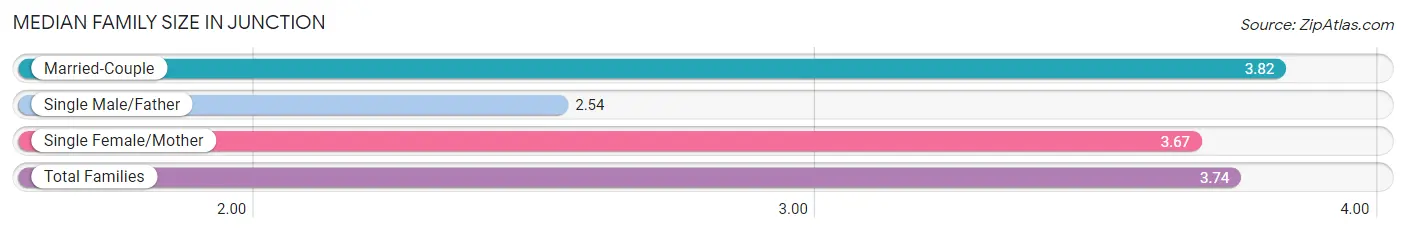
Median Family Size in Junction
The median family size in Junction is 3.74 persons per family, with married-couple families (433 | 80.9%) accounting for the largest median family size of 3.82 persons per family. On the other hand, single male/father families (24 | 4.5%) represent the smallest median family size with 2.54 persons per family.
| Family Type | # Families | Family Size |
| Married-Couple | 433 (80.9%) | 3.82 |
| Single Male/Father | 24 (4.5%) | 2.54 |
| Single Female/Mother | 78 (14.6%) | 3.67 |
| Total Families | 535 (100.0%) | 3.74 |
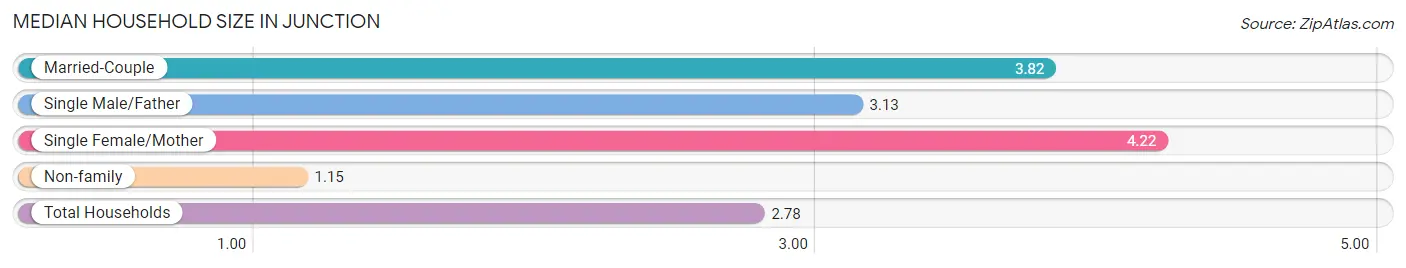
Median Household Size in Junction
The median household size in Junction is 2.78 persons per household, with single female/mother households (78 | 8.8%) accounting for the largest median household size of 4.22 persons per household. non-family households (348 | 39.4%) represent the smallest median household size with 1.15 persons per household.
| Household Type | # Households | Household Size |
| Married-Couple | 433 (49.0%) | 3.82 |
| Single Male/Father | 24 (2.7%) | 3.13 |
| Single Female/Mother | 78 (8.8%) | 4.22 |
| Non-family | 348 (39.4%) | 1.15 |
| Total Households | 883 (100.0%) | 2.78 |
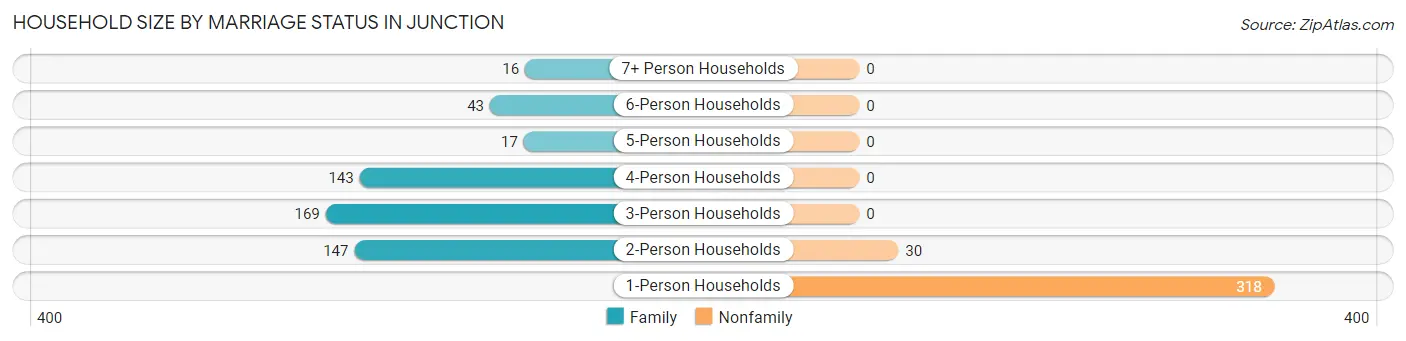
Household Size by Marriage Status in Junction
Out of a total of 883 households in Junction, 535 (60.6%) are family households, while 348 (39.4%) are nonfamily households. The most numerous type of family households are 3-person households, comprising 169, and the most common type of nonfamily households are 1-person households, comprising 318.
| Household Size | Family Households | Nonfamily Households |
| 1-Person Households | - | 318 (36.0%) |
| 2-Person Households | 147 (16.7%) | 30 (3.4%) |
| 3-Person Households | 169 (19.1%) | 0 (0.0%) |
| 4-Person Households | 143 (16.2%) | 0 (0.0%) |
| 5-Person Households | 17 (1.9%) | 0 (0.0%) |
| 6-Person Households | 43 (4.9%) | 0 (0.0%) |
| 7+ Person Households | 16 (1.8%) | 0 (0.0%) |
| Total | 535 (60.6%) | 348 (39.4%) |
Female Fertility in Junction
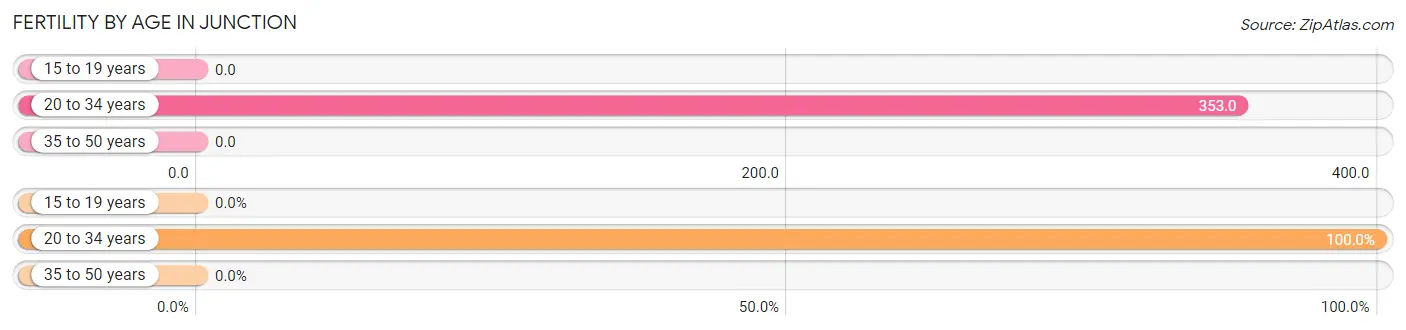
Fertility by Age in Junction
Average fertility rate in Junction is 101.0 births per 1,000 women. Women in the age bracket of 20 to 34 years have the highest fertility rate with 353.0 births per 1,000 women. Women in the age bracket of 20 to 34 years acount for 100.0% of all women with births.
| Age Bracket | Women with Births | Births / 1,000 Women |
| 15 to 19 years | 0 (0.0%) | 0.0 |
| 20 to 34 years | 61 (100.0%) | 353.0 |
| 35 to 50 years | 0 (0.0%) | 0.0 |
| Total | 61 (100.0%) | 101.0 |
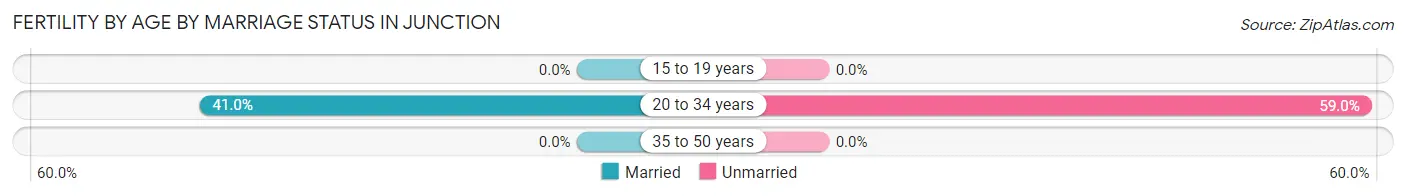
Fertility by Age by Marriage Status in Junction
41.0% of women with births (61) in Junction are married. The highest percentage of unmarried women with births falls into 20 to 34 years age bracket with 59.0% of them unmarried at the time of birth, while the lowest percentage of unmarried women with births belong to 20 to 34 years age bracket with 59.0% of them unmarried.
| Age Bracket | Married | Unmarried |
| 15 to 19 years | 0 (0.0%) | 0 (0.0%) |
| 20 to 34 years | 25 (41.0%) | 36 (59.0%) |
| 35 to 50 years | 0 (0.0%) | 0 (0.0%) |
| Total | 25 (41.0%) | 36 (59.0%) |
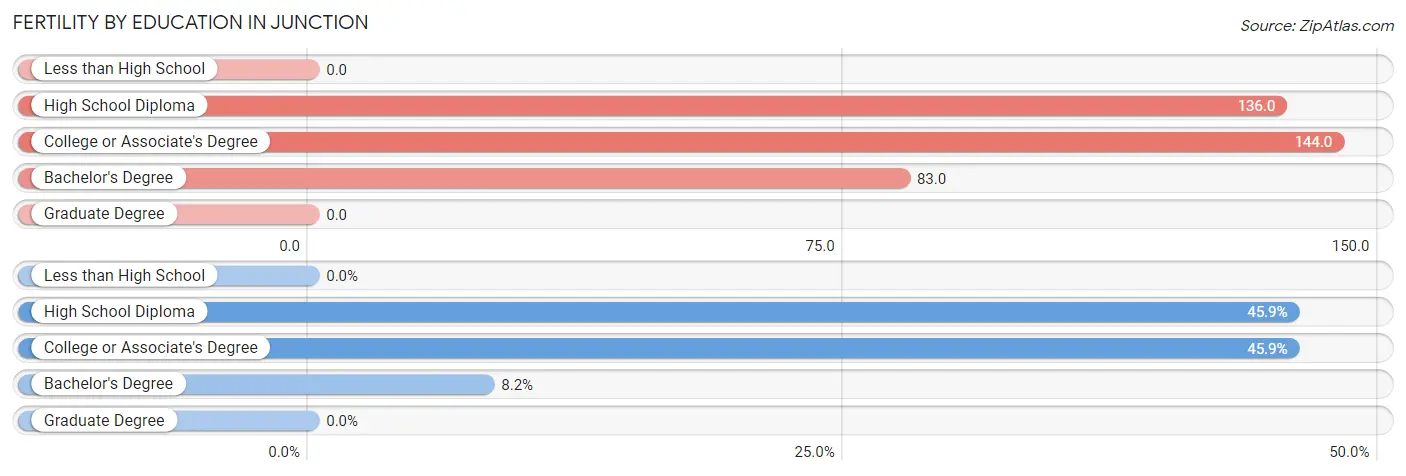
Fertility by Education in Junction
| Educational Attainment | Women with Births | Births / 1,000 Women |
| Less than High School | 0 (0.0%) | 0.0 |
| High School Diploma | 28 (45.9%) | 136.0 |
| College or Associate's Degree | 28 (45.9%) | 144.0 |
| Bachelor's Degree | 5 (8.2%) | 83.0 |
| Graduate Degree | 0 (0.0%) | 0.0 |
| Total | 61 (100.0%) | 101.0 |
Fertility by Education by Marriage Status in Junction
59.0% of women with births in Junction are unmarried. Women with the educational attainment of bachelor's degree are most likely to be married with 100.0% of them married at childbirth, while women with the educational attainment of high school diploma are least likely to be married with 78.6% of them unmarried at childbirth.
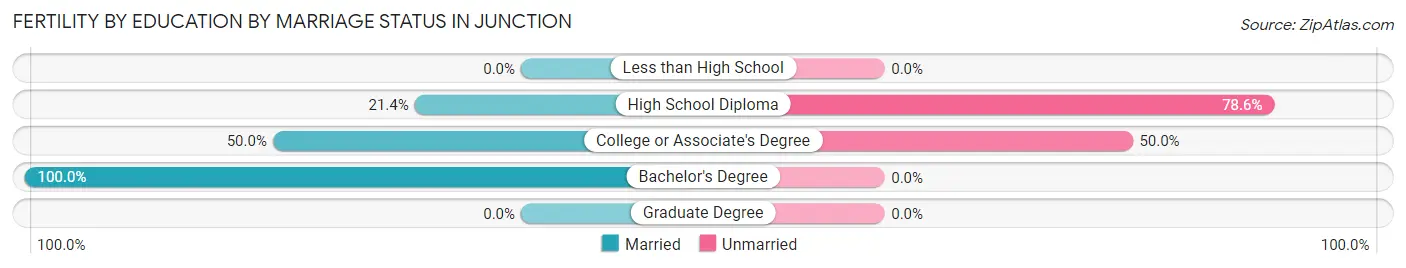
| Educational Attainment | Married | Unmarried |
| Less than High School | 0 (0.0%) | 0 (0.0%) |
| High School Diploma | 6 (21.4%) | 22 (78.6%) |
| College or Associate's Degree | 14 (50.0%) | 14 (50.0%) |
| Bachelor's Degree | 5 (100.0%) | 0 (0.0%) |
| Graduate Degree | 0 (0.0%) | 0 (0.0%) |
| Total | 25 (41.0%) | 36 (59.0%) |
Employment Characteristics in Junction
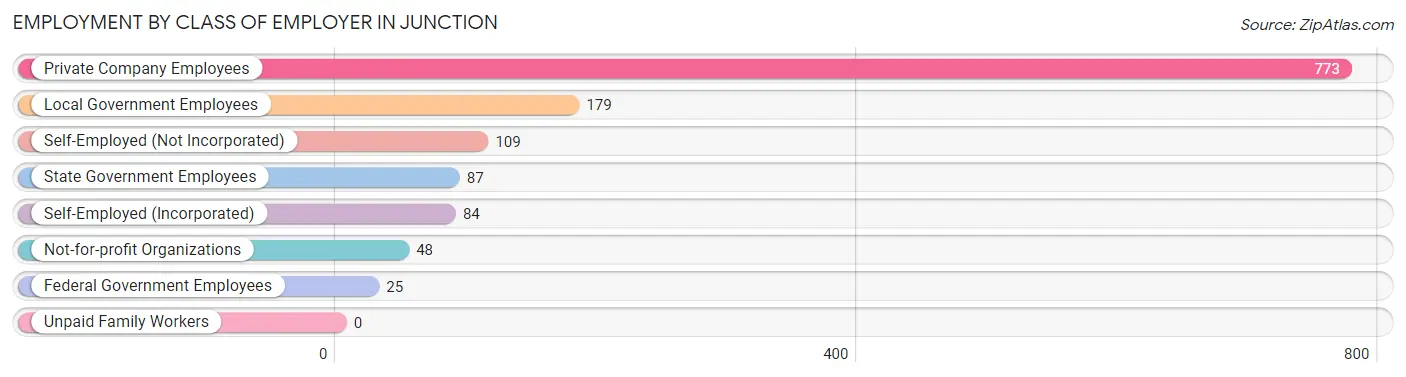
Employment by Class of Employer in Junction
Among the 1,305 employed individuals in Junction, private company employees (773 | 59.2%), local government employees (179 | 13.7%), and self-employed (not incorporated) (109 | 8.4%) make up the most common classes of employment.
| Employer Class | # Employees | % Employees |
| Private Company Employees | 773 | 59.2% |
| Self-Employed (Incorporated) | 84 | 6.4% |
| Self-Employed (Not Incorporated) | 109 | 8.4% |
| Not-for-profit Organizations | 48 | 3.7% |
| Local Government Employees | 179 | 13.7% |
| State Government Employees | 87 | 6.7% |
| Federal Government Employees | 25 | 1.9% |
| Unpaid Family Workers | 0 | 0.0% |
| Total | 1,305 | 100.0% |
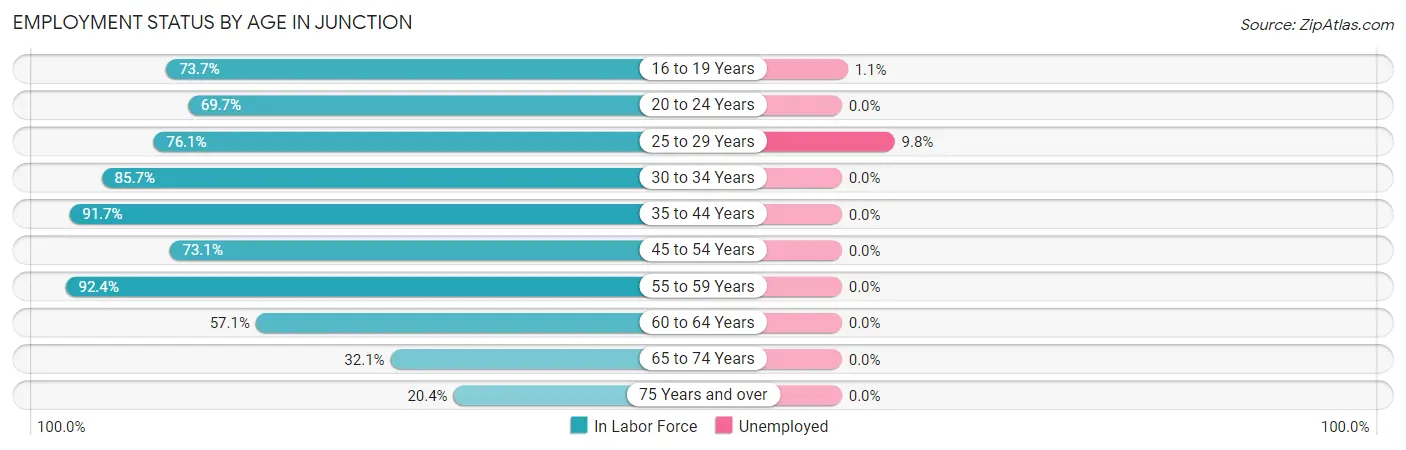
Employment Status by Age in Junction
According to the labor force statistics for Junction, out of the total population over 16 years of age (1,944), 68.6% or 1,334 individuals are in the labor force, with 1.2% or 16 of them unemployed. The age group with the highest labor force participation rate is 55 to 59 years, with 92.4% or 61 individuals in the labor force. Within the labor force, the 25 to 29 years age range has the highest percentage of unemployed individuals, with 9.8% or 14 of them being unemployed.
| Age Bracket | In Labor Force | Unemployed |
| 16 to 19 Years | 179 (73.7%) | 2 (1.1%) |
| 20 to 24 Years | 92 (69.7%) | 0 (0.0%) |
| 25 to 29 Years | 143 (76.1%) | 14 (9.8%) |
| 30 to 34 Years | 114 (85.7%) | 0 (0.0%) |
| 35 to 44 Years | 374 (91.7%) | 0 (0.0%) |
| 45 to 54 Years | 209 (73.1%) | 0 (0.0%) |
| 55 to 59 Years | 61 (92.4%) | 0 (0.0%) |
| 60 to 64 Years | 48 (57.1%) | 0 (0.0%) |
| 65 to 74 Years | 84 (32.1%) | 0 (0.0%) |
| 75 Years and over | 29 (20.4%) | 0 (0.0%) |
| Total | 1,334 (68.6%) | 16 (1.2%) |
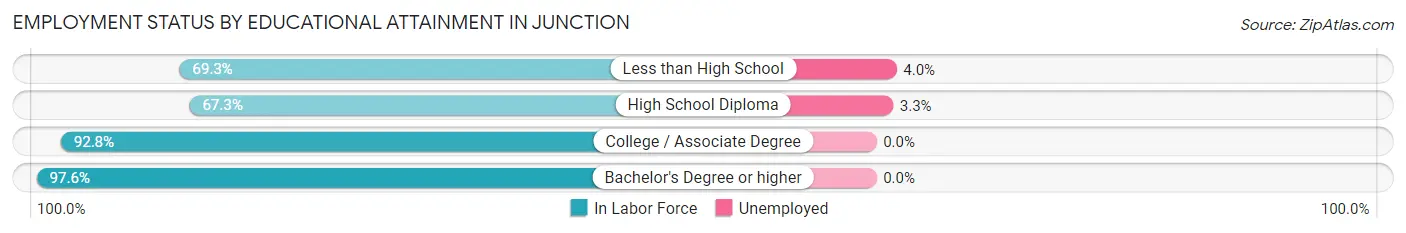
Employment Status by Educational Attainment in Junction
According to labor force statistics for Junction, 81.5% of individuals (949) out of the total population between 25 and 64 years of age (1,165) are in the labor force, with 1.5% or 14 of them being unemployed. The group with the highest labor force participation rate are those with the educational attainment of bachelor's degree or higher, with 97.6% or 200 individuals in the labor force. Within the labor force, individuals with less than high school education have the highest percentage of unemployment, with 4.0% or 6 of them being unemployed.
| Educational Attainment | In Labor Force | Unemployed |
| Less than High School | 149 (69.3%) | 9 (4.0%) |
| High School Diploma | 241 (67.3%) | 12 (3.3%) |
| College / Associate Degree | 359 (92.8%) | 0 (0.0%) |
| Bachelor's Degree or higher | 200 (97.6%) | 0 (0.0%) |
| Total | 949 (81.5%) | 17 (1.5%) |
Employment Occupations by Sex in Junction
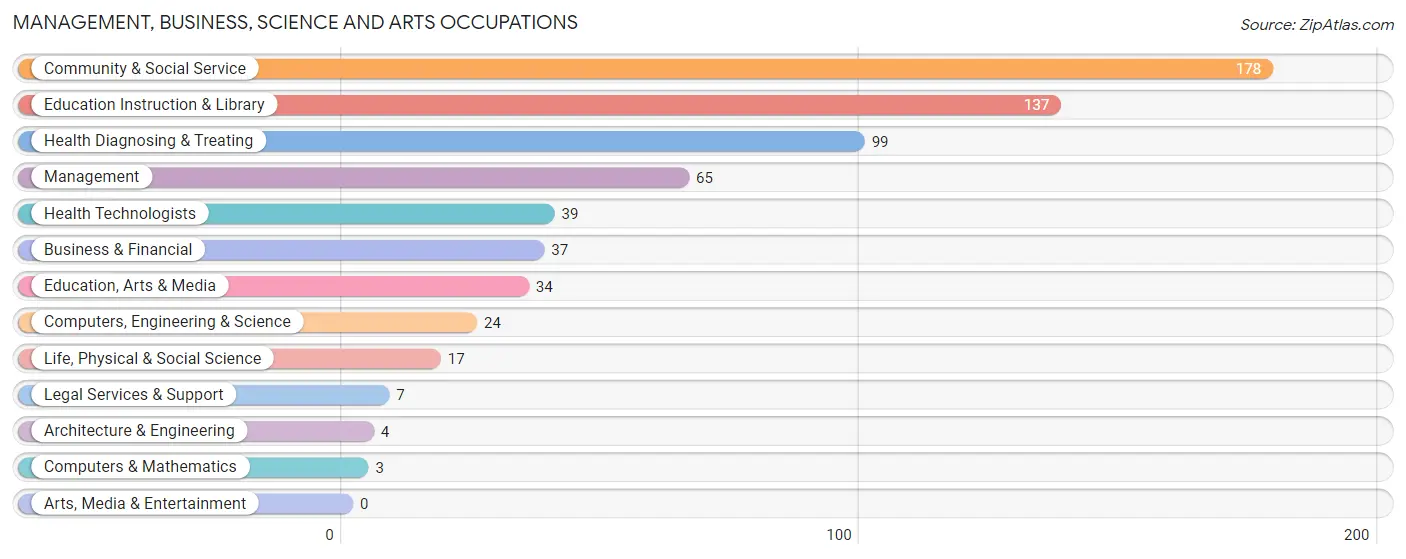
Management, Business, Science and Arts Occupations
The most common Management, Business, Science and Arts occupations in Junction are Community & Social Service (178 | 13.5%), Education Instruction & Library (137 | 10.4%), Health Diagnosing & Treating (99 | 7.5%), Management (65 | 4.9%), and Health Technologists (39 | 3.0%).
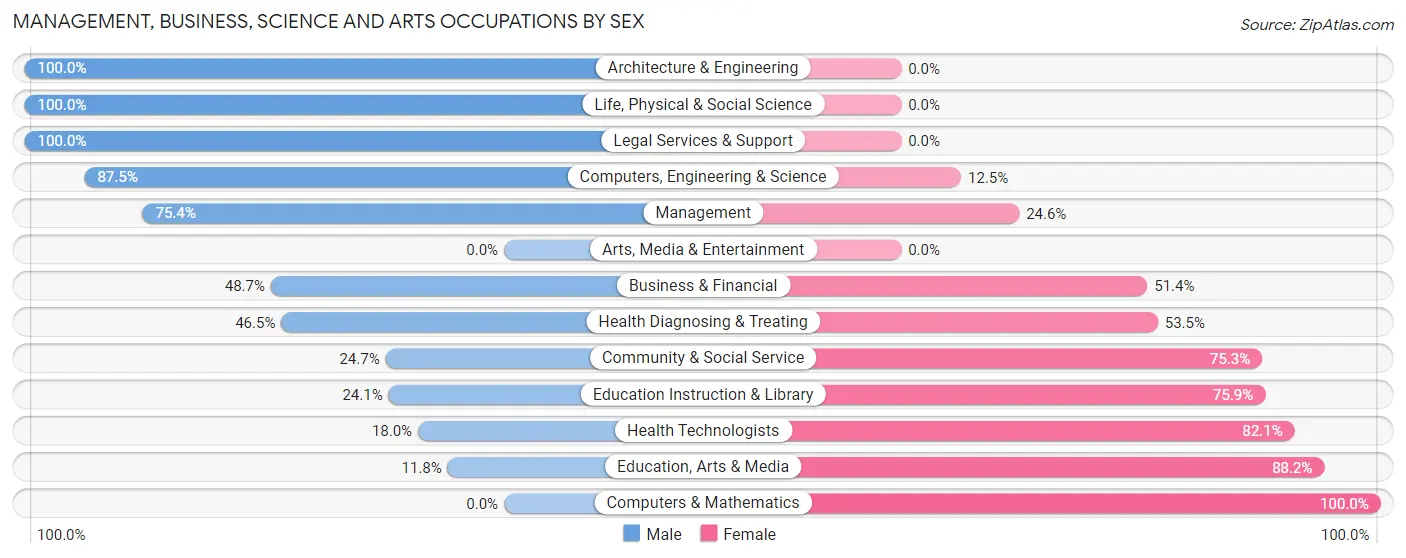
Management, Business, Science and Arts Occupations by Sex
Within the Management, Business, Science and Arts occupations in Junction, the most male-oriented occupations are Architecture & Engineering (100.0%), Life, Physical & Social Science (100.0%), and Legal Services & Support (100.0%), while the most female-oriented occupations are Computers & Mathematics (100.0%), Education, Arts & Media (88.2%), and Health Technologists (82.1%).
| Occupation | Male | Female |
| Management | 49 (75.4%) | 16 (24.6%) |
| Business & Financial | 18 (48.6%) | 19 (51.3%) |
| Computers, Engineering & Science | 21 (87.5%) | 3 (12.5%) |
| Computers & Mathematics | 0 (0.0%) | 3 (100.0%) |
| Architecture & Engineering | 4 (100.0%) | 0 (0.0%) |
| Life, Physical & Social Science | 17 (100.0%) | 0 (0.0%) |
| Community & Social Service | 44 (24.7%) | 134 (75.3%) |
| Education, Arts & Media | 4 (11.8%) | 30 (88.2%) |
| Legal Services & Support | 7 (100.0%) | 0 (0.0%) |
| Education Instruction & Library | 33 (24.1%) | 104 (75.9%) |
| Arts, Media & Entertainment | 0 (0.0%) | 0 (0.0%) |
| Health Diagnosing & Treating | 46 (46.5%) | 53 (53.5%) |
| Health Technologists | 7 (17.9%) | 32 (82.1%) |
| Total (Category) | 178 (44.2%) | 225 (55.8%) |
| Total (Overall) | 691 (52.5%) | 626 (47.5%) |
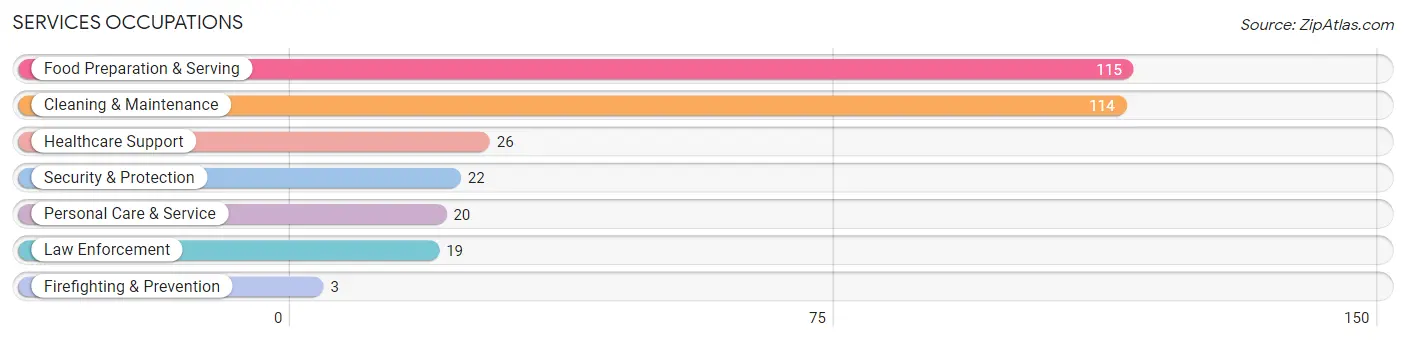
Services Occupations
The most common Services occupations in Junction are Food Preparation & Serving (115 | 8.7%), Cleaning & Maintenance (114 | 8.7%), Healthcare Support (26 | 2.0%), Security & Protection (22 | 1.7%), and Personal Care & Service (20 | 1.5%).
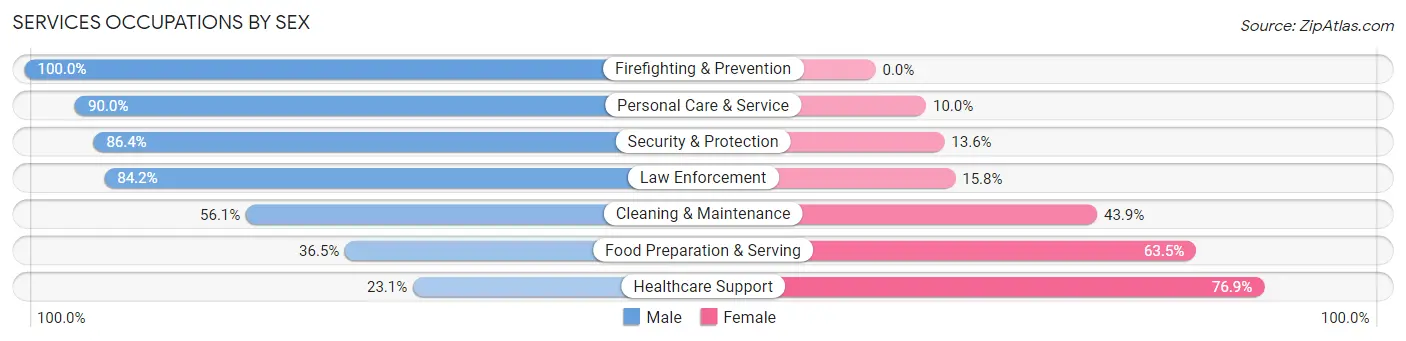
Services Occupations by Sex
Within the Services occupations in Junction, the most male-oriented occupations are Firefighting & Prevention (100.0%), Personal Care & Service (90.0%), and Security & Protection (86.4%), while the most female-oriented occupations are Healthcare Support (76.9%), Food Preparation & Serving (63.5%), and Cleaning & Maintenance (43.9%).
| Occupation | Male | Female |
| Healthcare Support | 6 (23.1%) | 20 (76.9%) |
| Security & Protection | 19 (86.4%) | 3 (13.6%) |
| Firefighting & Prevention | 3 (100.0%) | 0 (0.0%) |
| Law Enforcement | 16 (84.2%) | 3 (15.8%) |
| Food Preparation & Serving | 42 (36.5%) | 73 (63.5%) |
| Cleaning & Maintenance | 64 (56.1%) | 50 (43.9%) |
| Personal Care & Service | 18 (90.0%) | 2 (10.0%) |
| Total (Category) | 149 (50.2%) | 148 (49.8%) |
| Total (Overall) | 691 (52.5%) | 626 (47.5%) |
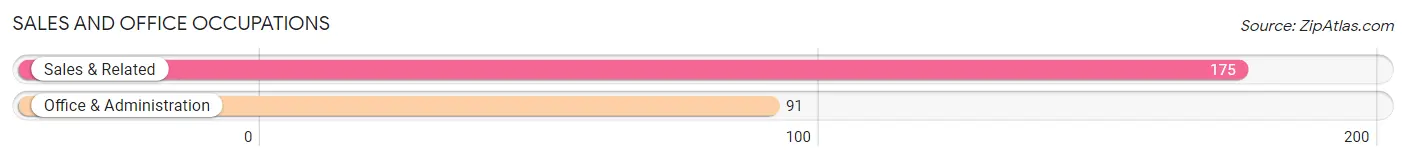
Sales and Office Occupations
The most common Sales and Office occupations in Junction are Sales & Related (175 | 13.3%), and Office & Administration (91 | 6.9%).
Sales and Office Occupations by Sex

| Occupation | Male | Female |
| Sales & Related | 49 (28.0%) | 126 (72.0%) |
| Office & Administration | 16 (17.6%) | 75 (82.4%) |
| Total (Category) | 65 (24.4%) | 201 (75.6%) |
| Total (Overall) | 691 (52.5%) | 626 (47.5%) |
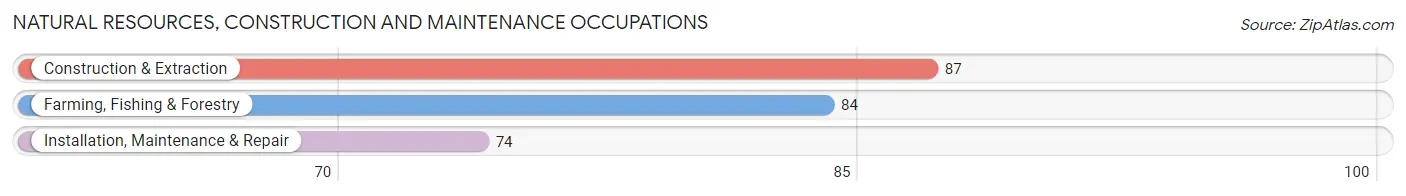
Natural Resources, Construction and Maintenance Occupations
The most common Natural Resources, Construction and Maintenance occupations in Junction are Construction & Extraction (87 | 6.6%), Farming, Fishing & Forestry (84 | 6.4%), and Installation, Maintenance & Repair (74 | 5.6%).
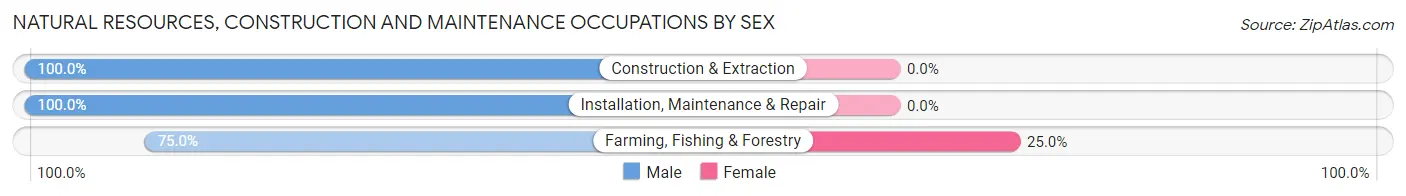
Natural Resources, Construction and Maintenance Occupations by Sex
| Occupation | Male | Female |
| Farming, Fishing & Forestry | 63 (75.0%) | 21 (25.0%) |
| Construction & Extraction | 87 (100.0%) | 0 (0.0%) |
| Installation, Maintenance & Repair | 74 (100.0%) | 0 (0.0%) |
| Total (Category) | 224 (91.4%) | 21 (8.6%) |
| Total (Overall) | 691 (52.5%) | 626 (47.5%) |
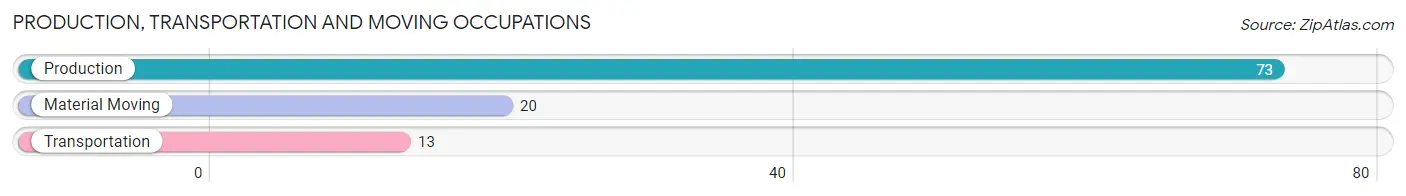
Production, Transportation and Moving Occupations
The most common Production, Transportation and Moving occupations in Junction are Production (73 | 5.5%), Material Moving (20 | 1.5%), and Transportation (13 | 1.0%).
Production, Transportation and Moving Occupations by Sex
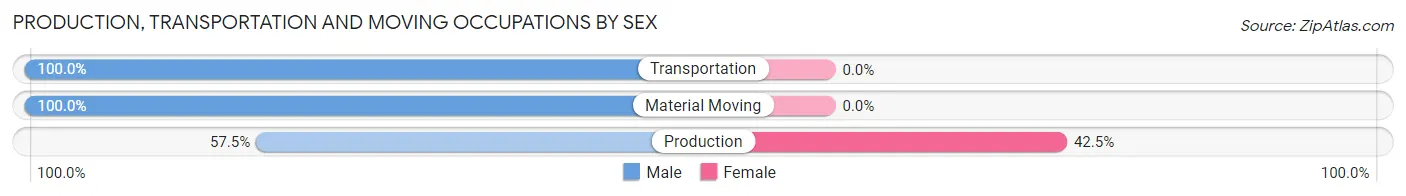
| Occupation | Male | Female |
| Production | 42 (57.5%) | 31 (42.5%) |
| Transportation | 13 (100.0%) | 0 (0.0%) |
| Material Moving | 20 (100.0%) | 0 (0.0%) |
| Total (Category) | 75 (70.8%) | 31 (29.2%) |
| Total (Overall) | 691 (52.5%) | 626 (47.5%) |
Employment Industries by Sex in Junction
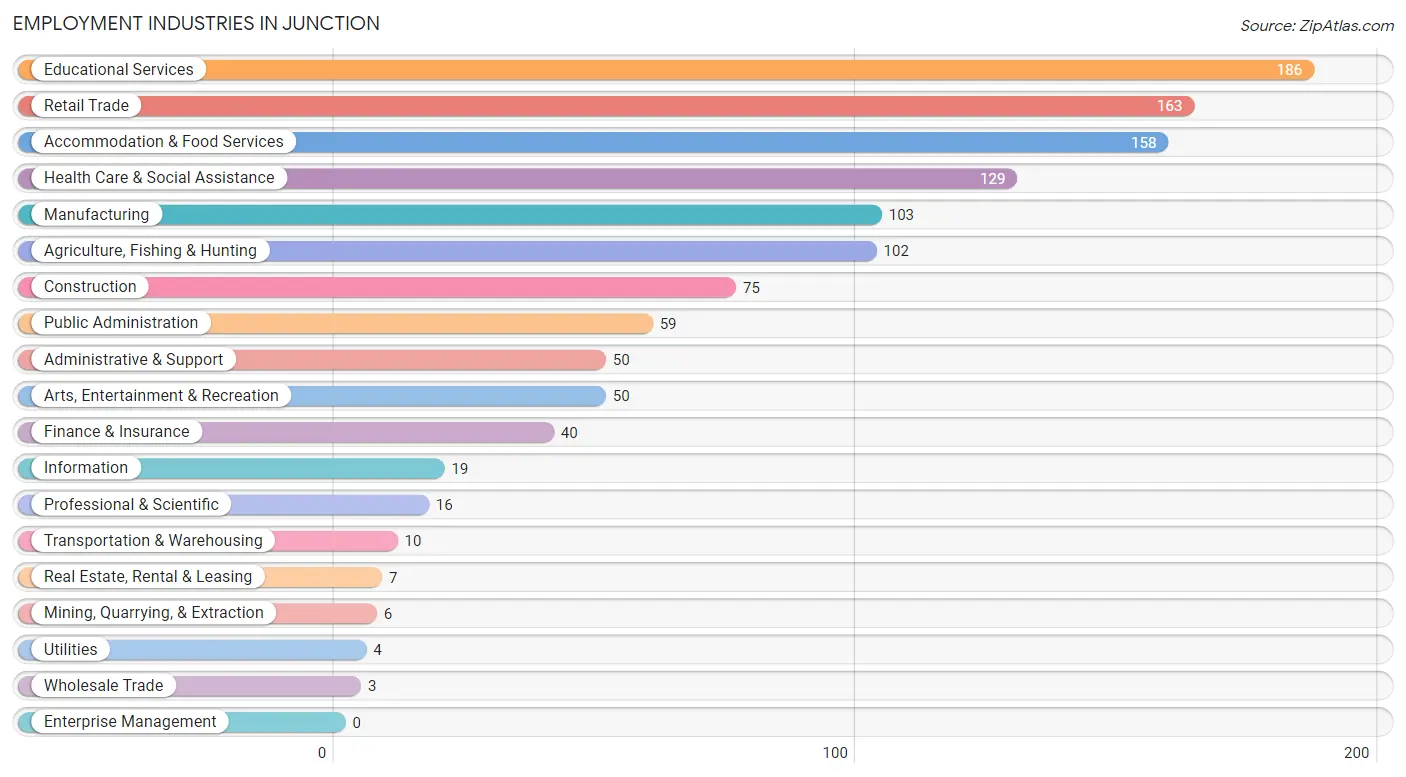
Employment Industries in Junction
The major employment industries in Junction include Educational Services (186 | 14.1%), Retail Trade (163 | 12.4%), Accommodation & Food Services (158 | 12.0%), Health Care & Social Assistance (129 | 9.8%), and Manufacturing (103 | 7.8%).
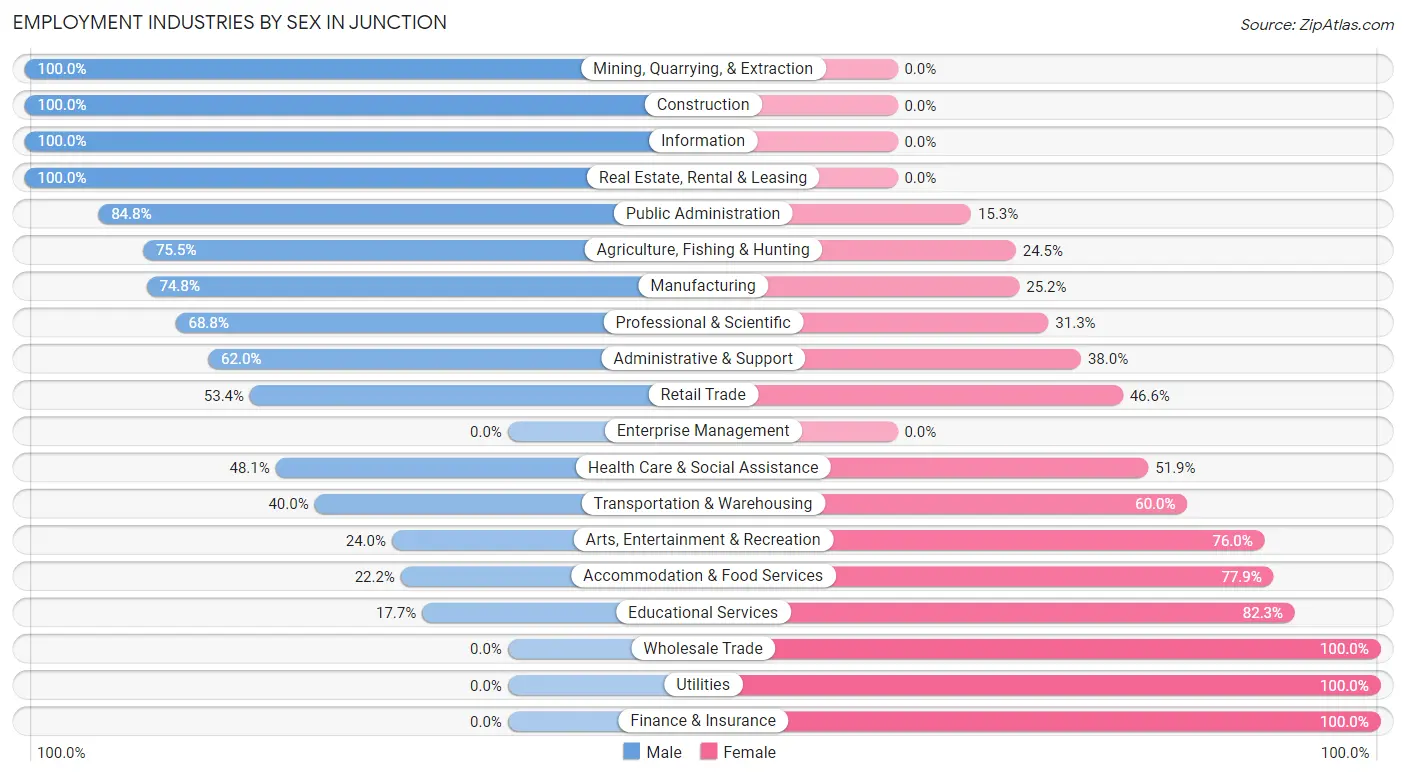
Employment Industries by Sex in Junction
The Junction industries that see more men than women are Mining, Quarrying, & Extraction (100.0%), Construction (100.0%), and Information (100.0%), whereas the industries that tend to have a higher number of women are Wholesale Trade (100.0%), Utilities (100.0%), and Finance & Insurance (100.0%).
| Industry | Male | Female |
| Agriculture, Fishing & Hunting | 77 (75.5%) | 25 (24.5%) |
| Mining, Quarrying, & Extraction | 6 (100.0%) | 0 (0.0%) |
| Construction | 75 (100.0%) | 0 (0.0%) |
| Manufacturing | 77 (74.8%) | 26 (25.2%) |
| Wholesale Trade | 0 (0.0%) | 3 (100.0%) |
| Retail Trade | 87 (53.4%) | 76 (46.6%) |
| Transportation & Warehousing | 4 (40.0%) | 6 (60.0%) |
| Utilities | 0 (0.0%) | 4 (100.0%) |
| Information | 19 (100.0%) | 0 (0.0%) |
| Finance & Insurance | 0 (0.0%) | 40 (100.0%) |
| Real Estate, Rental & Leasing | 7 (100.0%) | 0 (0.0%) |
| Professional & Scientific | 11 (68.8%) | 5 (31.2%) |
| Enterprise Management | 0 (0.0%) | 0 (0.0%) |
| Administrative & Support | 31 (62.0%) | 19 (38.0%) |
| Educational Services | 33 (17.7%) | 153 (82.3%) |
| Health Care & Social Assistance | 62 (48.1%) | 67 (51.9%) |
| Arts, Entertainment & Recreation | 12 (24.0%) | 38 (76.0%) |
| Accommodation & Food Services | 35 (22.2%) | 123 (77.8%) |
| Public Administration | 50 (84.8%) | 9 (15.2%) |
| Total | 691 (52.5%) | 626 (47.5%) |
Education in Junction
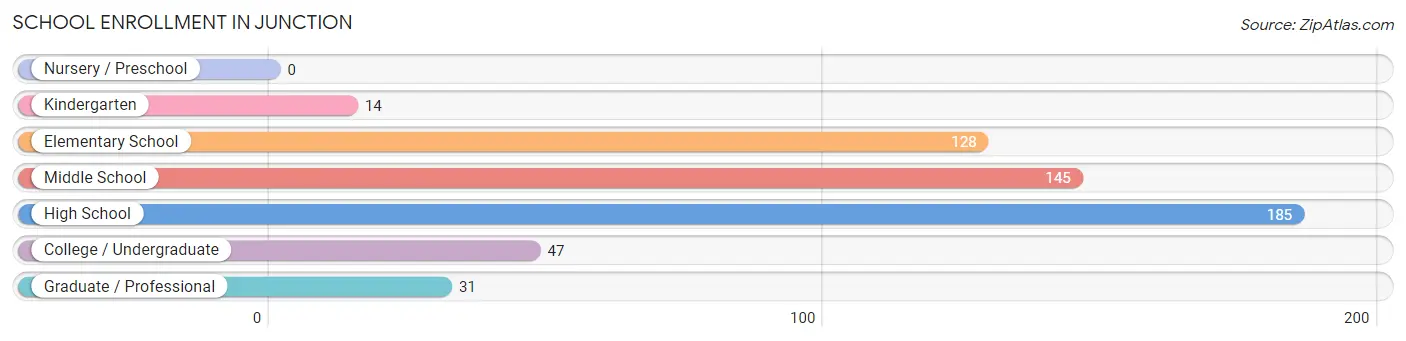
School Enrollment in Junction
The most common levels of schooling among the 550 students in Junction are high school (185 | 33.6%), middle school (145 | 26.4%), and elementary school (128 | 23.3%).
| School Level | # Students | % Students |
| Nursery / Preschool | 0 | 0.0% |
| Kindergarten | 14 | 2.5% |
| Elementary School | 128 | 23.3% |
| Middle School | 145 | 26.4% |
| High School | 185 | 33.6% |
| College / Undergraduate | 47 | 8.6% |
| Graduate / Professional | 31 | 5.6% |
| Total | 550 | 100.0% |
School Enrollment by Age by Funding Source in Junction
Out of a total of 550 students who are enrolled in schools in Junction, 75 (13.6%) attend a private institution, while the remaining 475 (86.4%) are enrolled in public schools. The age group of 20 to 24 year olds has the highest likelihood of being enrolled in private schools, with 9 (100.0% in the age bracket) enrolled. Conversely, the age group of 15 to 17 year olds has the lowest likelihood of being enrolled in a private school, with 156 (100.0% in the age bracket) attending a public institution.
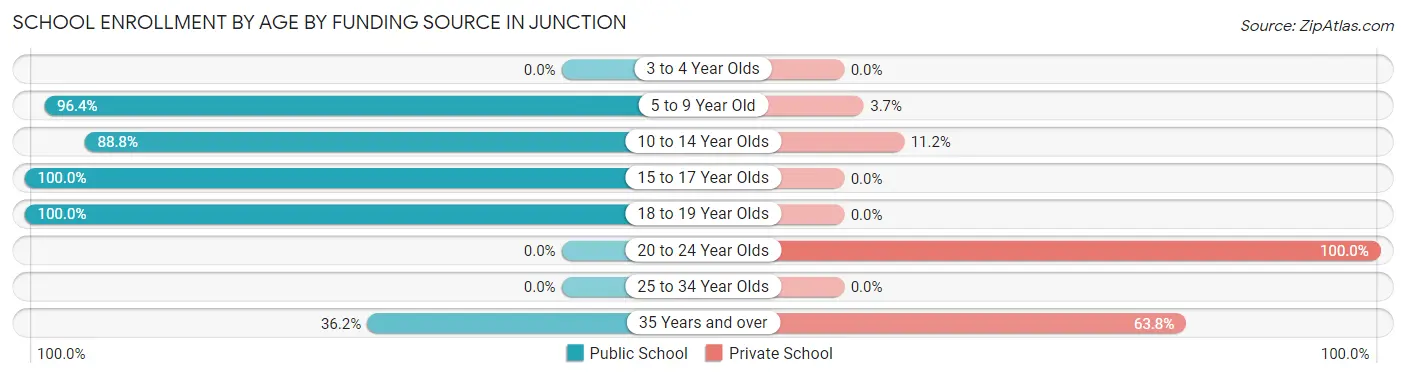
| Age Bracket | Public School | Private School |
| 3 to 4 Year Olds | 0 (0.0%) | 0 (0.0%) |
| 5 to 9 Year Old | 132 (96.4%) | 5 (3.6%) |
| 10 to 14 Year Olds | 135 (88.8%) | 17 (11.2%) |
| 15 to 17 Year Olds | 156 (100.0%) | 0 (0.0%) |
| 18 to 19 Year Olds | 27 (100.0%) | 0 (0.0%) |
| 20 to 24 Year Olds | 0 (0.0%) | 9 (100.0%) |
| 25 to 34 Year Olds | 0 (0.0%) | 0 (0.0%) |
| 35 Years and over | 25 (36.2%) | 44 (63.8%) |
| Total | 475 (86.4%) | 75 (13.6%) |
Educational Attainment by Field of Study in Junction
Arts & humanities (59 | 15.5%), science & technology (58 | 15.3%), business (49 | 12.9%), bio, nature & agricultural (45 | 11.8%), and education (45 | 11.8%) are the most common fields of study among 380 individuals in Junction who have obtained a bachelor's degree or higher.
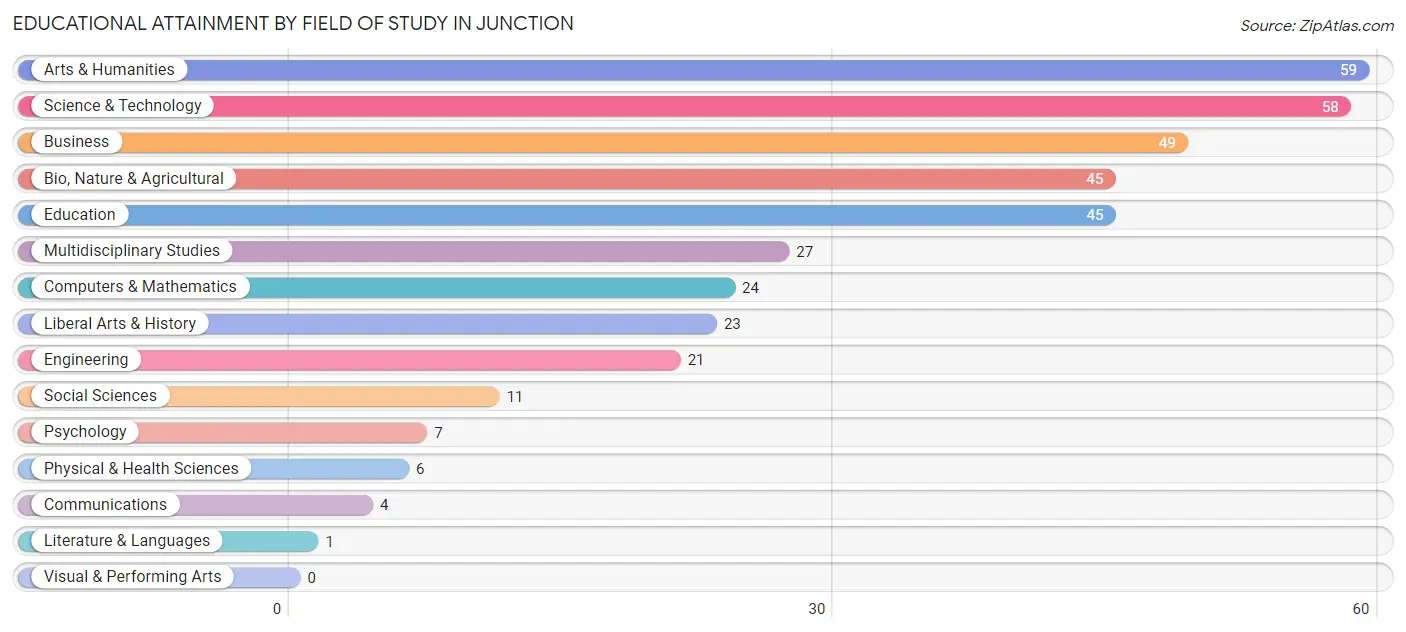
| Field of Study | # Graduates | % Graduates |
| Computers & Mathematics | 24 | 6.3% |
| Bio, Nature & Agricultural | 45 | 11.8% |
| Physical & Health Sciences | 6 | 1.6% |
| Psychology | 7 | 1.8% |
| Social Sciences | 11 | 2.9% |
| Engineering | 21 | 5.5% |
| Multidisciplinary Studies | 27 | 7.1% |
| Science & Technology | 58 | 15.3% |
| Business | 49 | 12.9% |
| Education | 45 | 11.8% |
| Literature & Languages | 1 | 0.3% |
| Liberal Arts & History | 23 | 6.0% |
| Visual & Performing Arts | 0 | 0.0% |
| Communications | 4 | 1.1% |
| Arts & Humanities | 59 | 15.5% |
| Total | 380 | 100.0% |
Transportation & Commute in Junction
Vehicle Availability by Sex in Junction
The most prevalent vehicle ownership categories in Junction are males with 2 vehicles (233, accounting for 34.0%) and females with 2 vehicles (237, making up 37.6%).
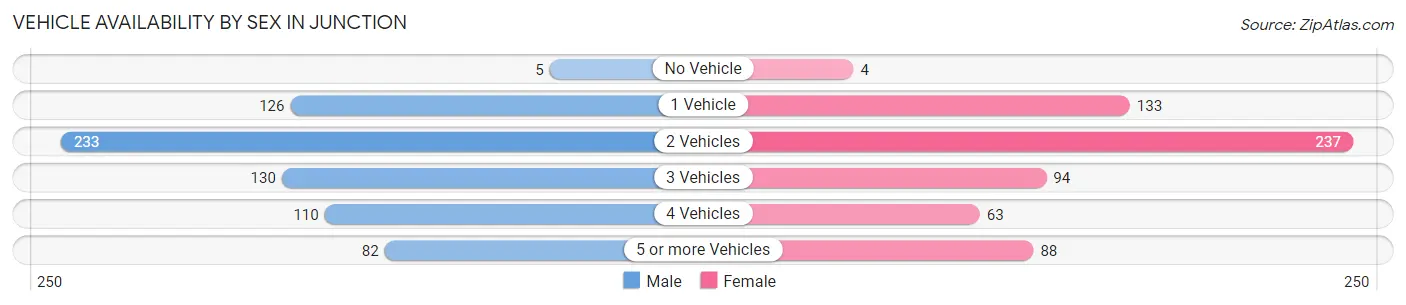
| Vehicles Available | Male | Female |
| No Vehicle | 5 (0.7%) | 4 (0.6%) |
| 1 Vehicle | 126 (18.4%) | 133 (21.5%) |
| 2 Vehicles | 233 (34.0%) | 237 (38.3%) |
| 3 Vehicles | 130 (19.0%) | 94 (15.2%) |
| 4 Vehicles | 110 (16.0%) | 63 (10.2%) |
| 5 or more Vehicles | 82 (11.9%) | 88 (14.2%) |
| Total | 686 (100.0%) | 619 (100.0%) |
Commute Time in Junction
The most frequently occuring commute durations in Junction are 5 to 9 minutes (442 commuters, 34.9%), less than 5 minutes (342 commuters, 27.0%), and 10 to 14 minutes (164 commuters, 12.9%).
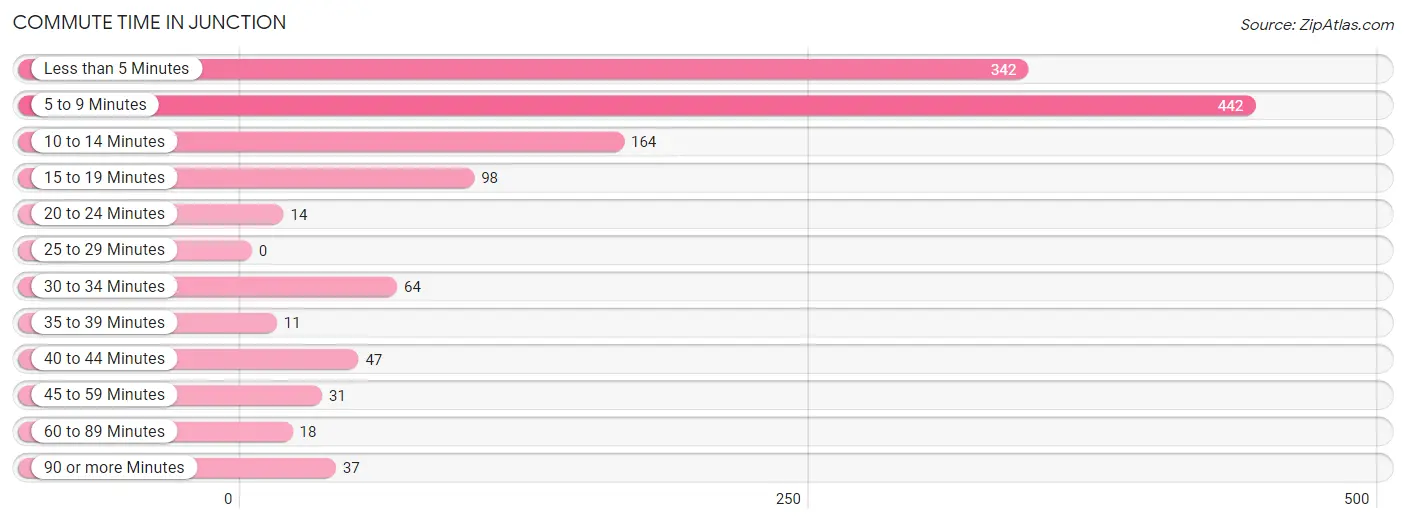
| Commute Time | # Commuters | % Commuters |
| Less than 5 Minutes | 342 | 27.0% |
| 5 to 9 Minutes | 442 | 34.9% |
| 10 to 14 Minutes | 164 | 12.9% |
| 15 to 19 Minutes | 98 | 7.7% |
| 20 to 24 Minutes | 14 | 1.1% |
| 25 to 29 Minutes | 0 | 0.0% |
| 30 to 34 Minutes | 64 | 5.1% |
| 35 to 39 Minutes | 11 | 0.9% |
| 40 to 44 Minutes | 47 | 3.7% |
| 45 to 59 Minutes | 31 | 2.4% |
| 60 to 89 Minutes | 18 | 1.4% |
| 90 or more Minutes | 37 | 2.9% |
Commute Time by Sex in Junction
The most common commute times in Junction are 5 to 9 minutes (192 commuters, 29.4%) for males and 5 to 9 minutes (250 commuters, 40.6%) for females.
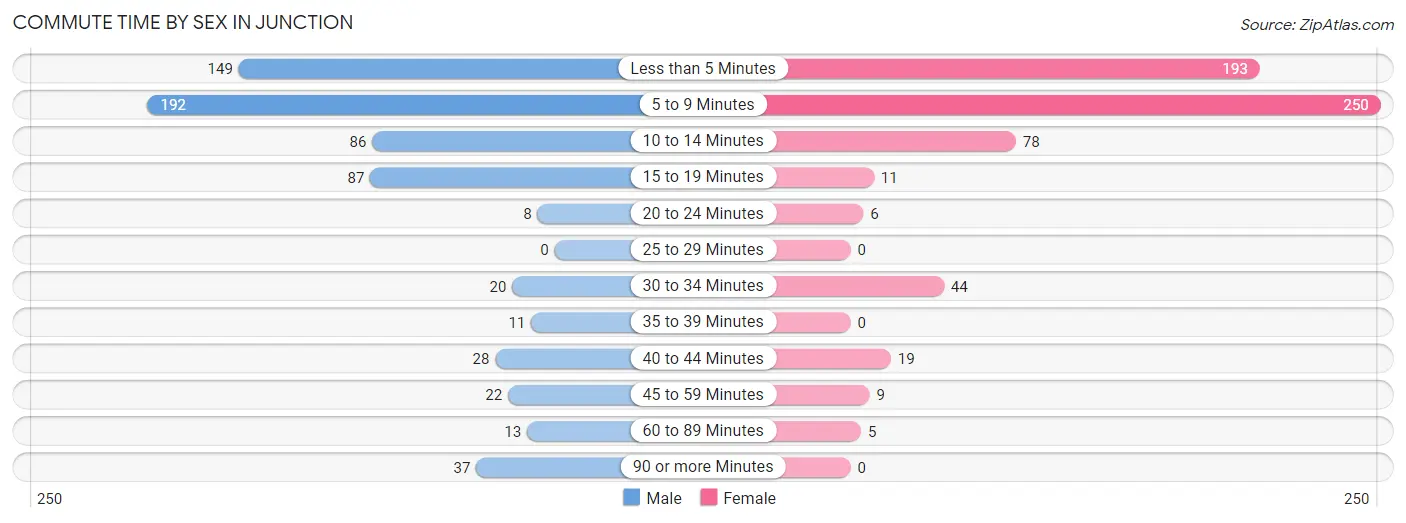
| Commute Time | Male | Female |
| Less than 5 Minutes | 149 (22.8%) | 193 (31.4%) |
| 5 to 9 Minutes | 192 (29.4%) | 250 (40.6%) |
| 10 to 14 Minutes | 86 (13.2%) | 78 (12.7%) |
| 15 to 19 Minutes | 87 (13.3%) | 11 (1.8%) |
| 20 to 24 Minutes | 8 (1.2%) | 6 (1.0%) |
| 25 to 29 Minutes | 0 (0.0%) | 0 (0.0%) |
| 30 to 34 Minutes | 20 (3.1%) | 44 (7.1%) |
| 35 to 39 Minutes | 11 (1.7%) | 0 (0.0%) |
| 40 to 44 Minutes | 28 (4.3%) | 19 (3.1%) |
| 45 to 59 Minutes | 22 (3.4%) | 9 (1.5%) |
| 60 to 89 Minutes | 13 (2.0%) | 5 (0.8%) |
| 90 or more Minutes | 37 (5.7%) | 0 (0.0%) |
Time of Departure to Work by Sex in Junction
The most frequent times of departure to work in Junction are 7:30 AM to 7:59 AM (108, 16.5%) for males and 8:00 AM to 8:29 AM (220, 35.8%) for females.
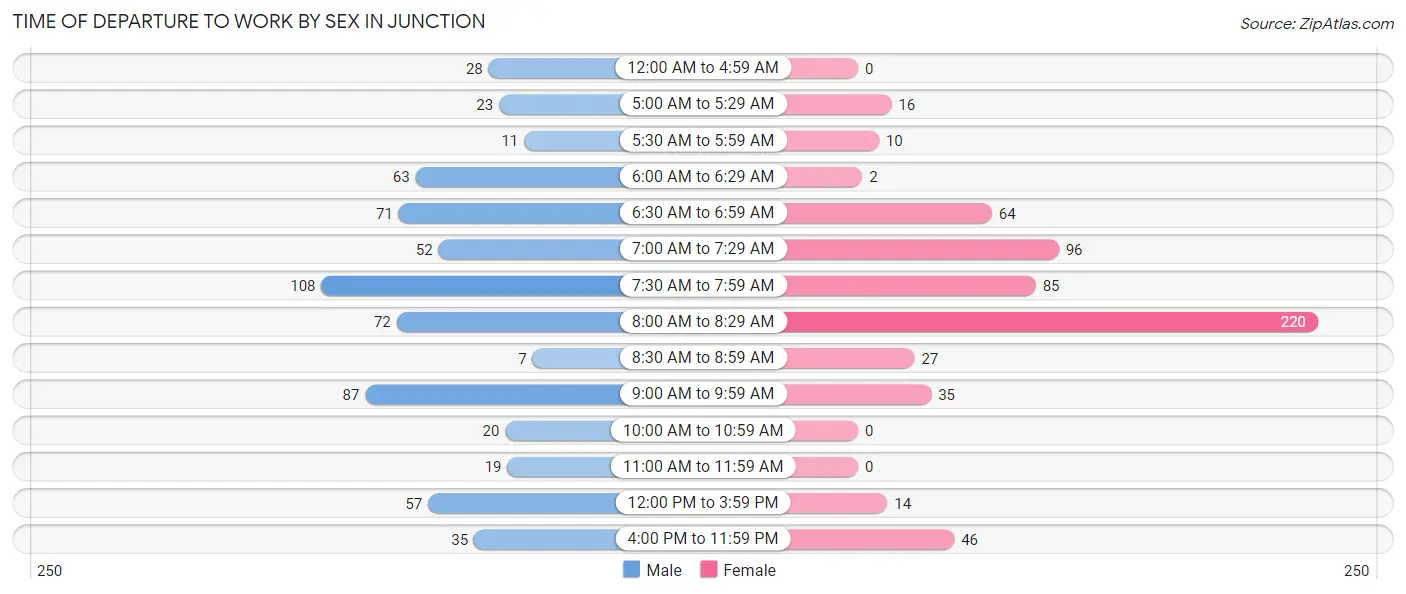
| Time of Departure | Male | Female |
| 12:00 AM to 4:59 AM | 28 (4.3%) | 0 (0.0%) |
| 5:00 AM to 5:29 AM | 23 (3.5%) | 16 (2.6%) |
| 5:30 AM to 5:59 AM | 11 (1.7%) | 10 (1.6%) |
| 6:00 AM to 6:29 AM | 63 (9.7%) | 2 (0.3%) |
| 6:30 AM to 6:59 AM | 71 (10.9%) | 64 (10.4%) |
| 7:00 AM to 7:29 AM | 52 (8.0%) | 96 (15.6%) |
| 7:30 AM to 7:59 AM | 108 (16.5%) | 85 (13.8%) |
| 8:00 AM to 8:29 AM | 72 (11.0%) | 220 (35.8%) |
| 8:30 AM to 8:59 AM | 7 (1.1%) | 27 (4.4%) |
| 9:00 AM to 9:59 AM | 87 (13.3%) | 35 (5.7%) |
| 10:00 AM to 10:59 AM | 20 (3.1%) | 0 (0.0%) |
| 11:00 AM to 11:59 AM | 19 (2.9%) | 0 (0.0%) |
| 12:00 PM to 3:59 PM | 57 (8.7%) | 14 (2.3%) |
| 4:00 PM to 11:59 PM | 35 (5.4%) | 46 (7.5%) |
| Total | 653 (100.0%) | 615 (100.0%) |
Housing Occupancy in Junction
Occupancy by Ownership in Junction
Of the total 883 dwellings in Junction, owner-occupied units account for 596 (67.5%), while renter-occupied units make up 287 (32.5%).
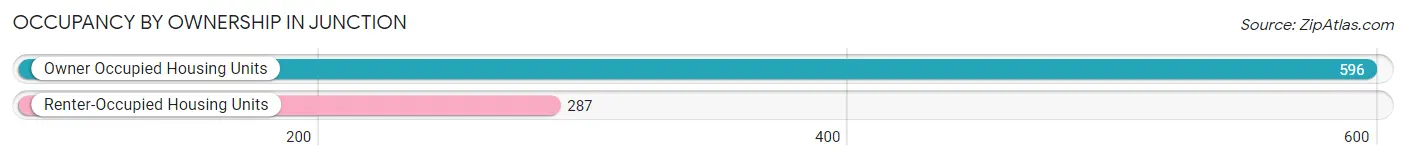
| Occupancy | # Housing Units | % Housing Units |
| Owner Occupied Housing Units | 596 | 67.5% |
| Renter-Occupied Housing Units | 287 | 32.5% |
| Total Occupied Housing Units | 883 | 100.0% |
Occupancy by Household Size in Junction
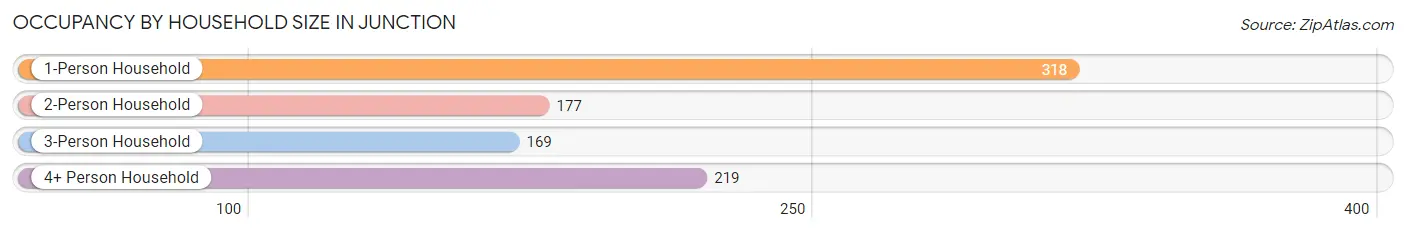
| Household Size | # Housing Units | % Housing Units |
| 1-Person Household | 318 | 36.0% |
| 2-Person Household | 177 | 20.1% |
| 3-Person Household | 169 | 19.1% |
| 4+ Person Household | 219 | 24.8% |
| Total Housing Units | 883 | 100.0% |
Occupancy by Ownership by Household Size in Junction
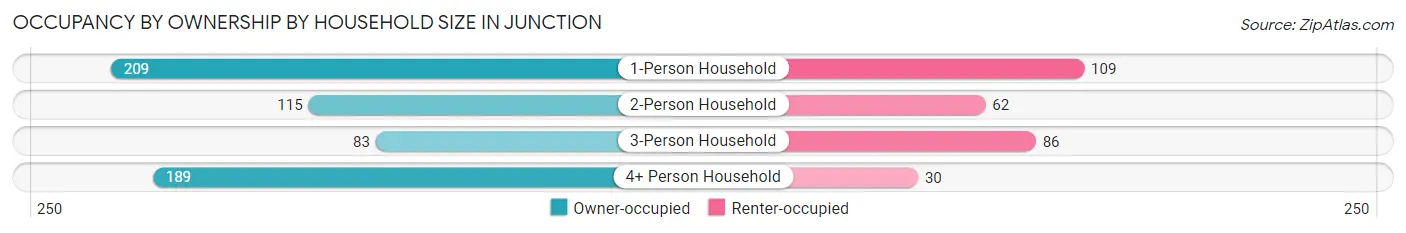
| Household Size | Owner-occupied | Renter-occupied |
| 1-Person Household | 209 (65.7%) | 109 (34.3%) |
| 2-Person Household | 115 (65.0%) | 62 (35.0%) |
| 3-Person Household | 83 (49.1%) | 86 (50.9%) |
| 4+ Person Household | 189 (86.3%) | 30 (13.7%) |
| Total Housing Units | 596 (67.5%) | 287 (32.5%) |
Occupancy by Educational Attainment in Junction
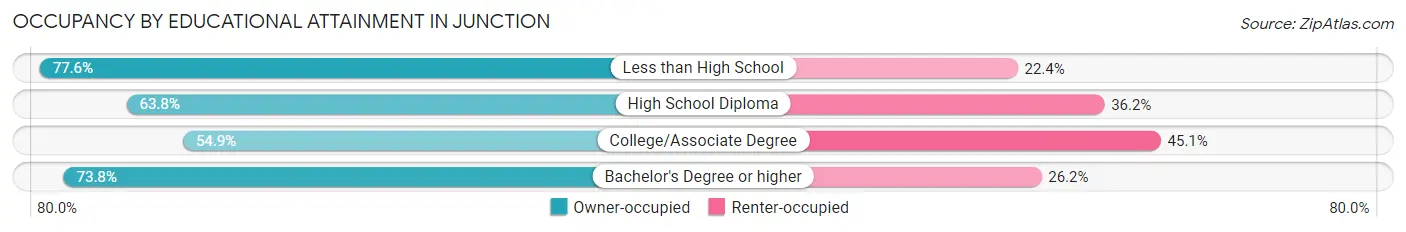
| Household Size | Owner-occupied | Renter-occupied |
| Less than High School | 173 (77.6%) | 50 (22.4%) |
| High School Diploma | 150 (63.8%) | 85 (36.2%) |
| College/Associate Degree | 118 (54.9%) | 97 (45.1%) |
| Bachelor's Degree or higher | 155 (73.8%) | 55 (26.2%) |
Occupancy by Age of Householder in Junction
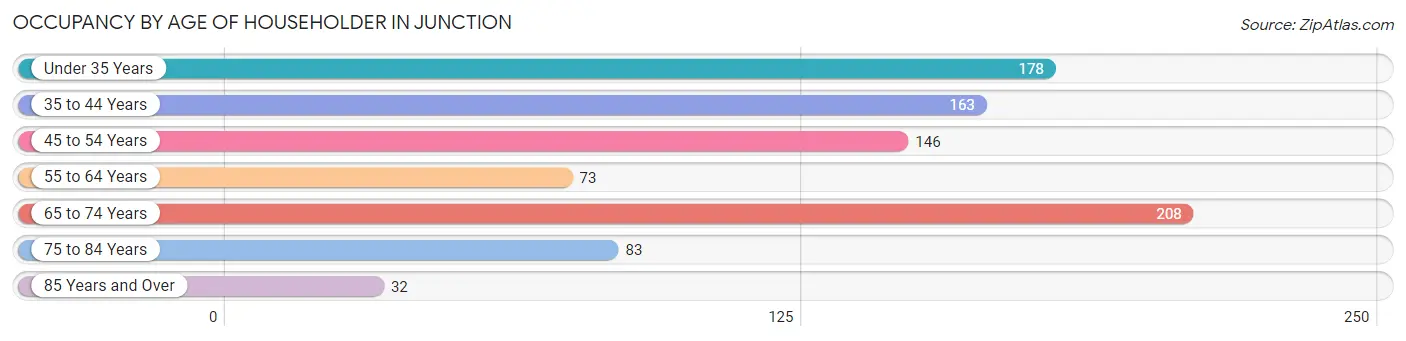
| Age Bracket | # Households | % Households |
| Under 35 Years | 178 | 20.2% |
| 35 to 44 Years | 163 | 18.5% |
| 45 to 54 Years | 146 | 16.5% |
| 55 to 64 Years | 73 | 8.3% |
| 65 to 74 Years | 208 | 23.6% |
| 75 to 84 Years | 83 | 9.4% |
| 85 Years and Over | 32 | 3.6% |
| Total | 883 | 100.0% |
Housing Finances in Junction
Median Income by Occupancy in Junction
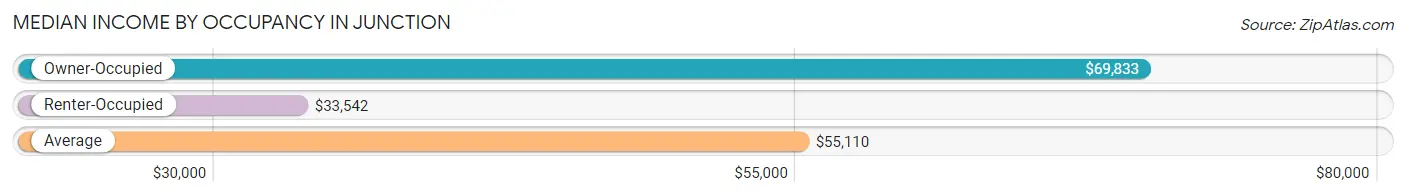
| Occupancy Type | # Households | Median Income |
| Owner-Occupied | 596 (67.5%) | $69,833 |
| Renter-Occupied | 287 (32.5%) | $33,542 |
| Average | 883 (100.0%) | $55,110 |
Occupancy by Householder Income Bracket in Junction
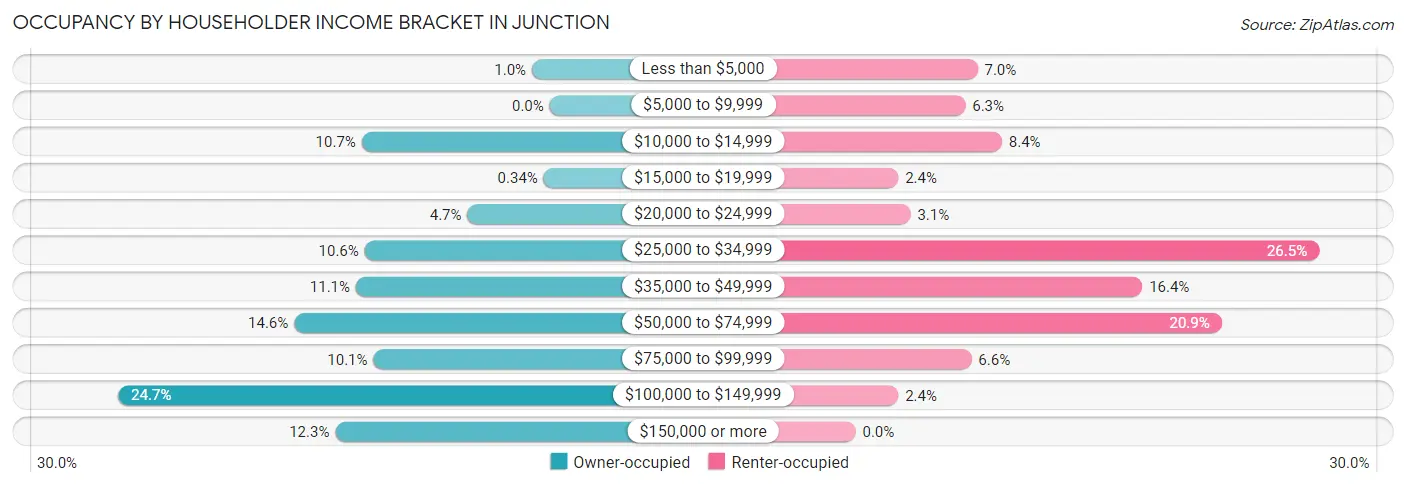
| Income Bracket | Owner-occupied | Renter-occupied |
| Less than $5,000 | 6 (1.0%) | 20 (7.0%) |
| $5,000 to $9,999 | 0 (0.0%) | 18 (6.3%) |
| $10,000 to $14,999 | 64 (10.7%) | 24 (8.4%) |
| $15,000 to $19,999 | 2 (0.3%) | 7 (2.4%) |
| $20,000 to $24,999 | 28 (4.7%) | 9 (3.1%) |
| $25,000 to $34,999 | 63 (10.6%) | 76 (26.5%) |
| $35,000 to $49,999 | 66 (11.1%) | 47 (16.4%) |
| $50,000 to $74,999 | 87 (14.6%) | 60 (20.9%) |
| $75,000 to $99,999 | 60 (10.1%) | 19 (6.6%) |
| $100,000 to $149,999 | 147 (24.7%) | 7 (2.4%) |
| $150,000 or more | 73 (12.2%) | 0 (0.0%) |
| Total | 596 (100.0%) | 287 (100.0%) |
Monthly Housing Cost Tiers in Junction
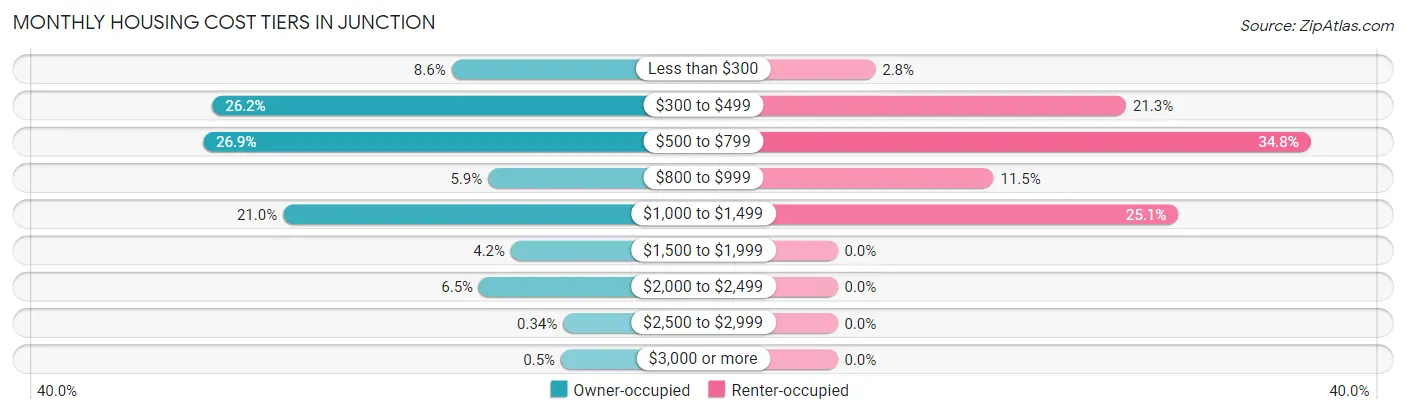
| Monthly Cost | Owner-occupied | Renter-occupied |
| Less than $300 | 51 (8.6%) | 8 (2.8%) |
| $300 to $499 | 156 (26.2%) | 61 (21.2%) |
| $500 to $799 | 160 (26.9%) | 100 (34.8%) |
| $800 to $999 | 35 (5.9%) | 33 (11.5%) |
| $1,000 to $1,499 | 125 (21.0%) | 72 (25.1%) |
| $1,500 to $1,999 | 25 (4.2%) | 0 (0.0%) |
| $2,000 to $2,499 | 39 (6.5%) | 0 (0.0%) |
| $2,500 to $2,999 | 2 (0.3%) | 0 (0.0%) |
| $3,000 or more | 3 (0.5%) | 0 (0.0%) |
| Total | 596 (100.0%) | 287 (100.0%) |
Physical Housing Characteristics in Junction
Housing Structures in Junction
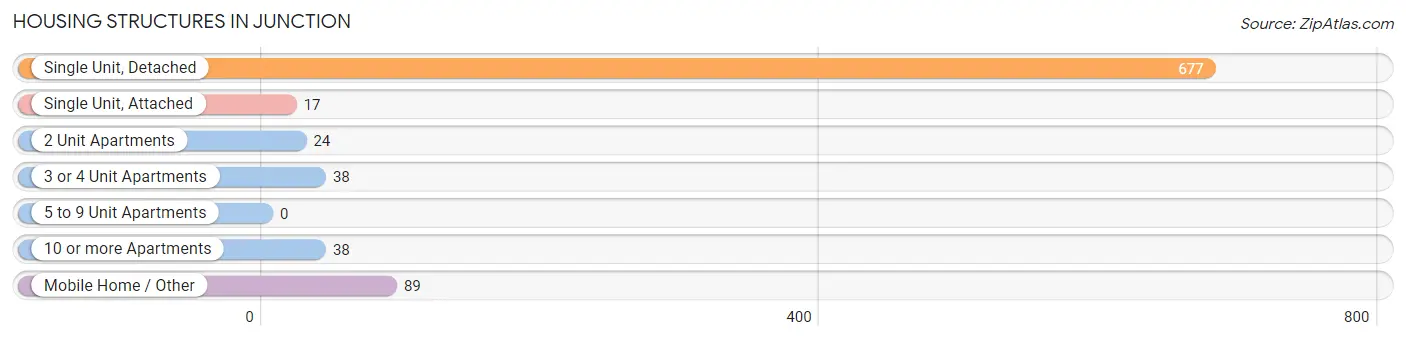
| Structure Type | # Housing Units | % Housing Units |
| Single Unit, Detached | 677 | 76.7% |
| Single Unit, Attached | 17 | 1.9% |
| 2 Unit Apartments | 24 | 2.7% |
| 3 or 4 Unit Apartments | 38 | 4.3% |
| 5 to 9 Unit Apartments | 0 | 0.0% |
| 10 or more Apartments | 38 | 4.3% |
| Mobile Home / Other | 89 | 10.1% |
| Total | 883 | 100.0% |
Housing Structures by Occupancy in Junction
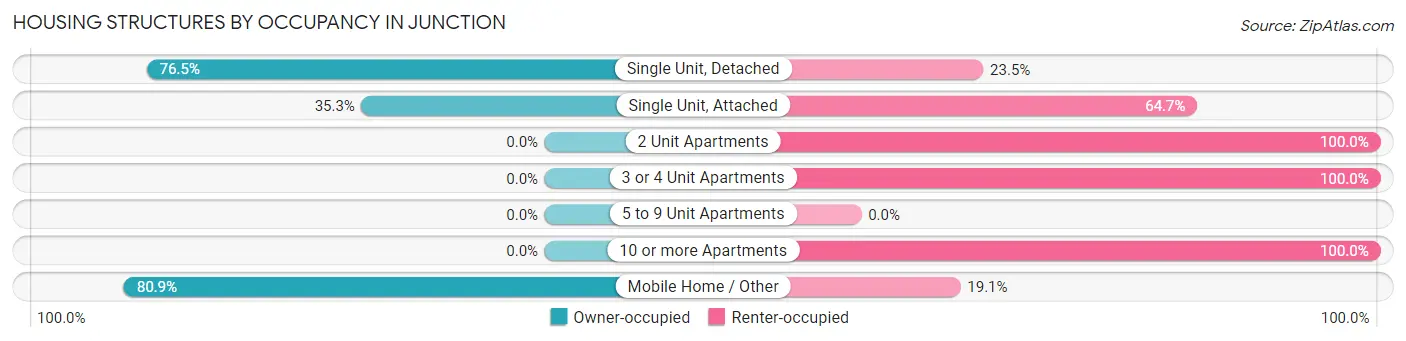
| Structure Type | Owner-occupied | Renter-occupied |
| Single Unit, Detached | 518 (76.5%) | 159 (23.5%) |
| Single Unit, Attached | 6 (35.3%) | 11 (64.7%) |
| 2 Unit Apartments | 0 (0.0%) | 24 (100.0%) |
| 3 or 4 Unit Apartments | 0 (0.0%) | 38 (100.0%) |
| 5 to 9 Unit Apartments | 0 (0.0%) | 0 (0.0%) |
| 10 or more Apartments | 0 (0.0%) | 38 (100.0%) |
| Mobile Home / Other | 72 (80.9%) | 17 (19.1%) |
| Total | 596 (67.5%) | 287 (32.5%) |
Housing Structures by Number of Rooms in Junction
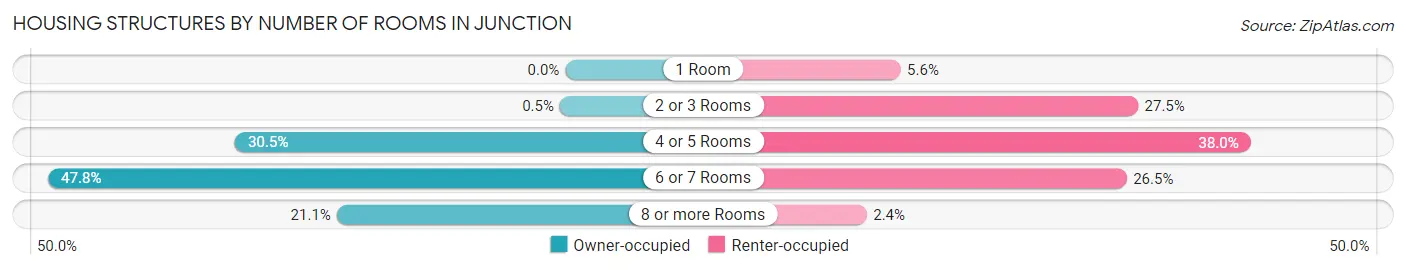
| Number of Rooms | Owner-occupied | Renter-occupied |
| 1 Room | 0 (0.0%) | 16 (5.6%) |
| 2 or 3 Rooms | 3 (0.5%) | 79 (27.5%) |
| 4 or 5 Rooms | 182 (30.5%) | 109 (38.0%) |
| 6 or 7 Rooms | 285 (47.8%) | 76 (26.5%) |
| 8 or more Rooms | 126 (21.1%) | 7 (2.4%) |
| Total | 596 (100.0%) | 287 (100.0%) |
Housing Structure by Heating Type in Junction
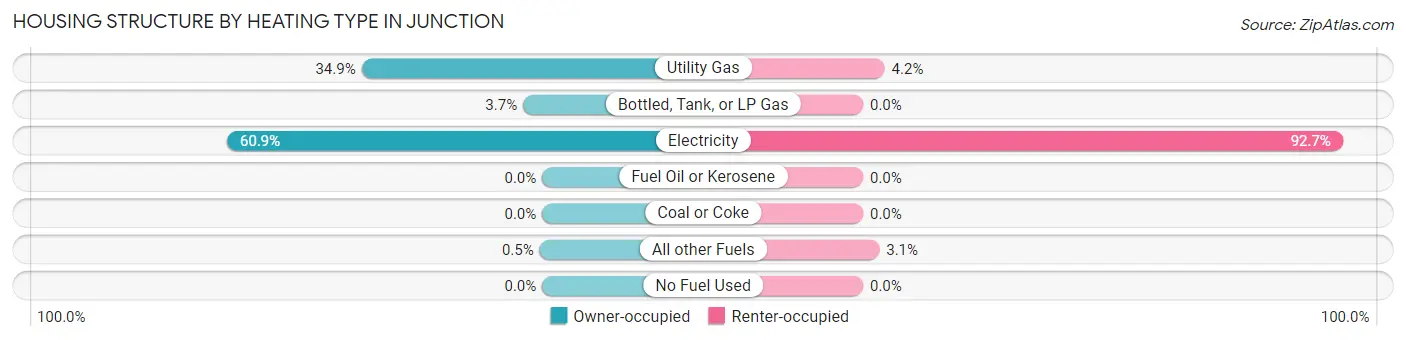
| Heating Type | Owner-occupied | Renter-occupied |
| Utility Gas | 208 (34.9%) | 12 (4.2%) |
| Bottled, Tank, or LP Gas | 22 (3.7%) | 0 (0.0%) |
| Electricity | 363 (60.9%) | 266 (92.7%) |
| Fuel Oil or Kerosene | 0 (0.0%) | 0 (0.0%) |
| Coal or Coke | 0 (0.0%) | 0 (0.0%) |
| All other Fuels | 3 (0.5%) | 9 (3.1%) |
| No Fuel Used | 0 (0.0%) | 0 (0.0%) |
| Total | 596 (100.0%) | 287 (100.0%) |
Household Vehicle Usage in Junction
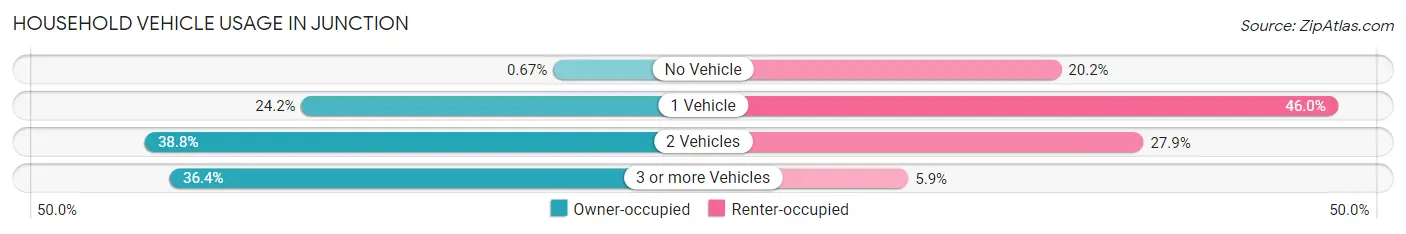
| Vehicles per Household | Owner-occupied | Renter-occupied |
| No Vehicle | 4 (0.7%) | 58 (20.2%) |
| 1 Vehicle | 144 (24.2%) | 132 (46.0%) |
| 2 Vehicles | 231 (38.8%) | 80 (27.9%) |
| 3 or more Vehicles | 217 (36.4%) | 17 (5.9%) |
| Total | 596 (100.0%) | 287 (100.0%) |
Real Estate & Mortgages in Junction
Real Estate and Mortgage Overview in Junction
| Characteristic | Without Mortgage | With Mortgage |
| Housing Units | 409 | 187 |
| Median Property Value | $130,000 | $178,600 |
| Median Household Income | $57,981 | $33 |
| Monthly Housing Costs | $503 | $3 |
| Real Estate Taxes | $1,729 | $7 |
Property Value by Mortgage Status in Junction
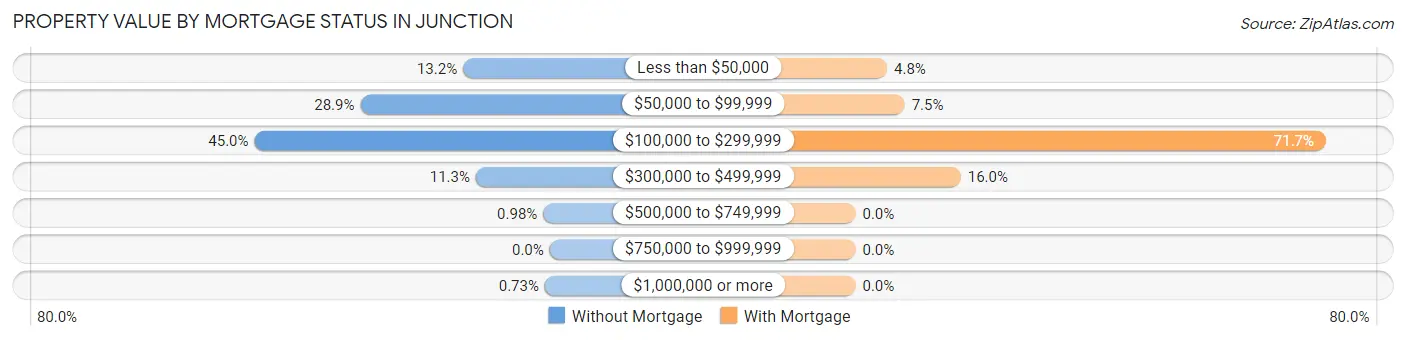
| Property Value | Without Mortgage | With Mortgage |
| Less than $50,000 | 54 (13.2%) | 9 (4.8%) |
| $50,000 to $99,999 | 118 (28.8%) | 14 (7.5%) |
| $100,000 to $299,999 | 184 (45.0%) | 134 (71.7%) |
| $300,000 to $499,999 | 46 (11.3%) | 30 (16.0%) |
| $500,000 to $749,999 | 4 (1.0%) | 0 (0.0%) |
| $750,000 to $999,999 | 0 (0.0%) | 0 (0.0%) |
| $1,000,000 or more | 3 (0.7%) | 0 (0.0%) |
| Total | 409 (100.0%) | 187 (100.0%) |
Household Income by Mortgage Status in Junction
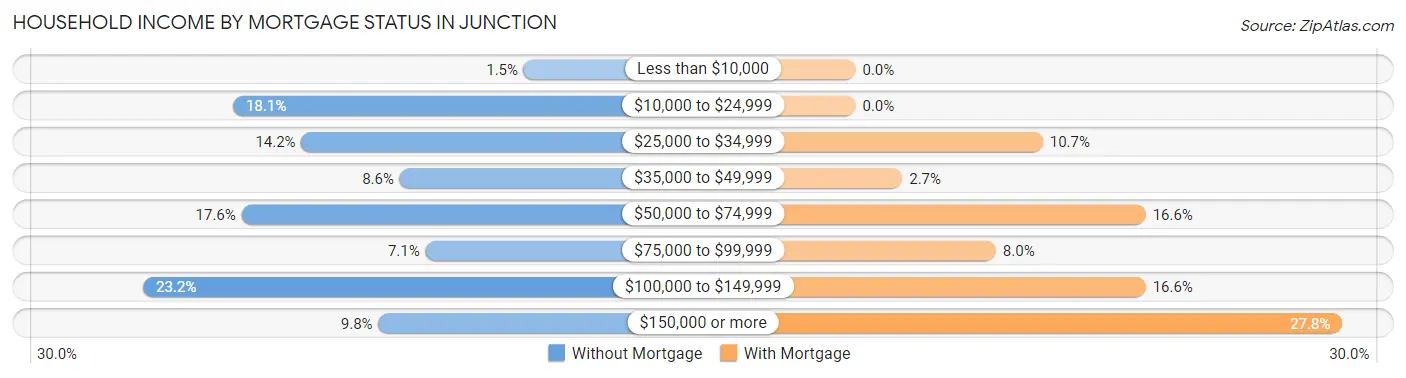
| Household Income | Without Mortgage | With Mortgage |
| Less than $10,000 | 6 (1.5%) | 0 (0.0%) |
| $10,000 to $24,999 | 74 (18.1%) | 0 (0.0%) |
| $25,000 to $34,999 | 58 (14.2%) | 20 (10.7%) |
| $35,000 to $49,999 | 35 (8.6%) | 5 (2.7%) |
| $50,000 to $74,999 | 72 (17.6%) | 31 (16.6%) |
| $75,000 to $99,999 | 29 (7.1%) | 15 (8.0%) |
| $100,000 to $149,999 | 95 (23.2%) | 31 (16.6%) |
| $150,000 or more | 40 (9.8%) | 52 (27.8%) |
| Total | 409 (100.0%) | 187 (100.0%) |
Property Value to Household Income Ratio in Junction
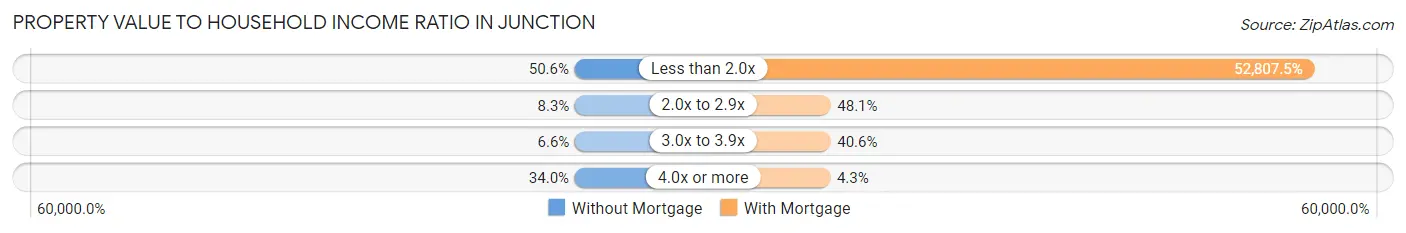
| Value-to-Income Ratio | Without Mortgage | With Mortgage |
| Less than 2.0x | 207 (50.6%) | 98,750 (52,807.5%) |
| 2.0x to 2.9x | 34 (8.3%) | 90 (48.1%) |
| 3.0x to 3.9x | 27 (6.6%) | 76 (40.6%) |
| 4.0x or more | 139 (34.0%) | 8 (4.3%) |
| Total | 409 (100.0%) | 187 (100.0%) |
Real Estate Taxes by Mortgage Status in Junction
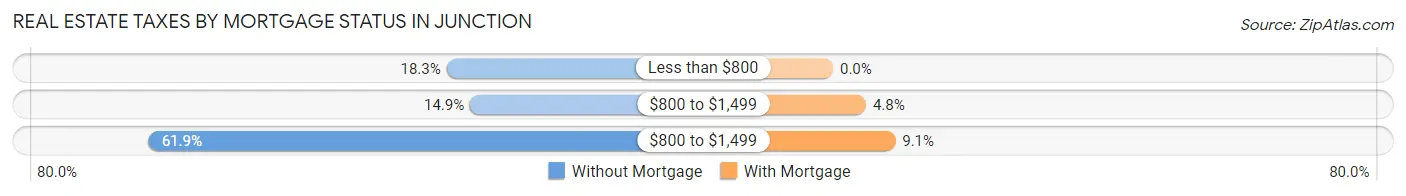
| Property Taxes | Without Mortgage | With Mortgage |
| Less than $800 | 75 (18.3%) | 0 (0.0%) |
| $800 to $1,499 | 61 (14.9%) | 9 (4.8%) |
| $800 to $1,499 | 253 (61.9%) | 17 (9.1%) |
| Total | 409 (100.0%) | 187 (100.0%) |
Health & Disability in Junction
Health Insurance Coverage by Age in Junction
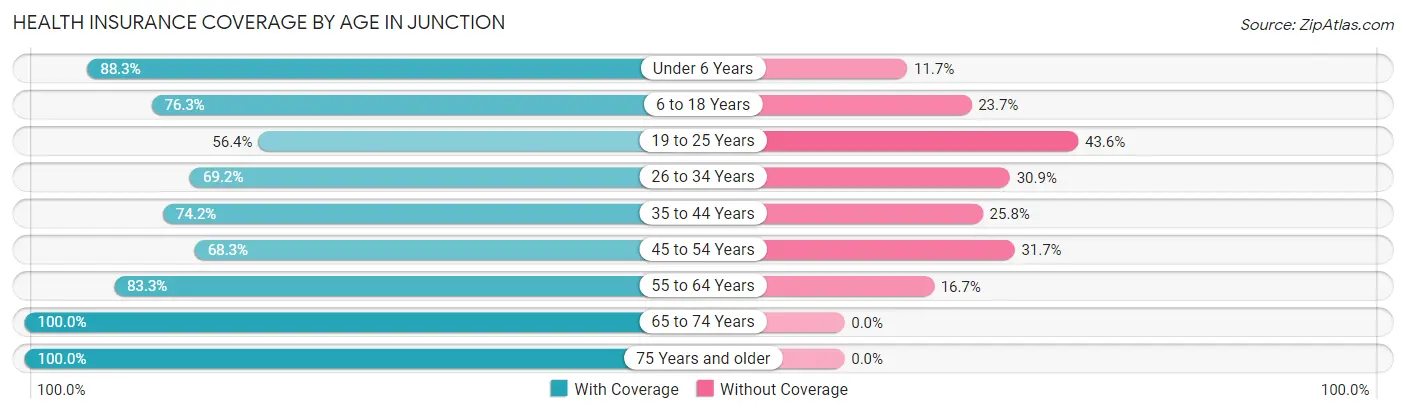
| Age Bracket | With Coverage | Without Coverage |
| Under 6 Years | 151 (88.3%) | 20 (11.7%) |
| 6 to 18 Years | 442 (76.3%) | 137 (23.7%) |
| 19 to 25 Years | 110 (56.4%) | 85 (43.6%) |
| 26 to 34 Years | 195 (69.2%) | 87 (30.8%) |
| 35 to 44 Years | 302 (74.2%) | 105 (25.8%) |
| 45 to 54 Years | 185 (68.3%) | 86 (31.7%) |
| 55 to 64 Years | 125 (83.3%) | 25 (16.7%) |
| 65 to 74 Years | 262 (100.0%) | 0 (0.0%) |
| 75 Years and older | 142 (100.0%) | 0 (0.0%) |
| Total | 1,914 (77.8%) | 545 (22.2%) |
Health Insurance Coverage by Citizenship Status in Junction
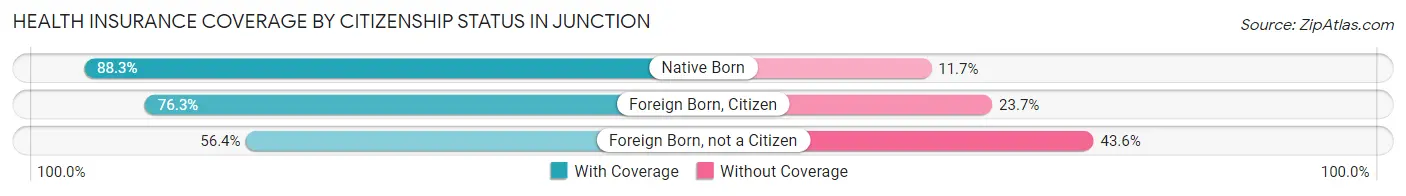
| Citizenship Status | With Coverage | Without Coverage |
| Native Born | 151 (88.3%) | 20 (11.7%) |
| Foreign Born, Citizen | 442 (76.3%) | 137 (23.7%) |
| Foreign Born, not a Citizen | 110 (56.4%) | 85 (43.6%) |
Health Insurance Coverage by Household Income in Junction
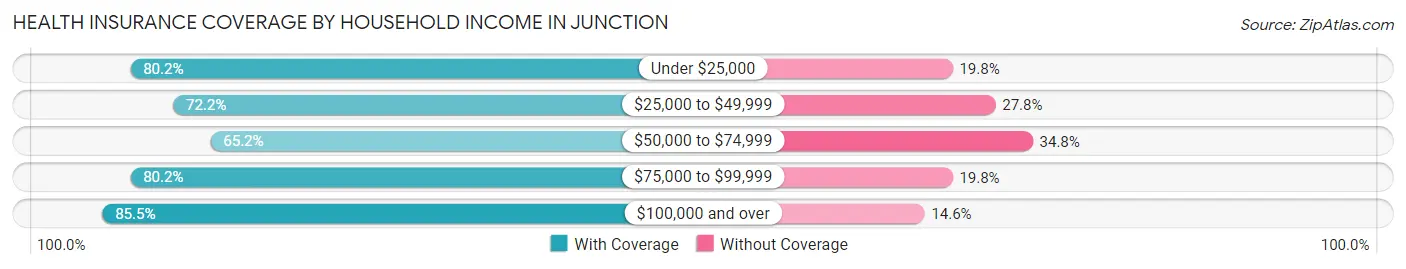
| Household Income | With Coverage | Without Coverage |
| Under $25,000 | 235 (80.2%) | 58 (19.8%) |
| $25,000 to $49,999 | 506 (72.2%) | 195 (27.8%) |
| $50,000 to $74,999 | 206 (65.2%) | 110 (34.8%) |
| $75,000 to $99,999 | 227 (80.2%) | 56 (19.8%) |
| $100,000 and over | 740 (85.5%) | 126 (14.5%) |
Public vs Private Health Insurance Coverage by Age in Junction
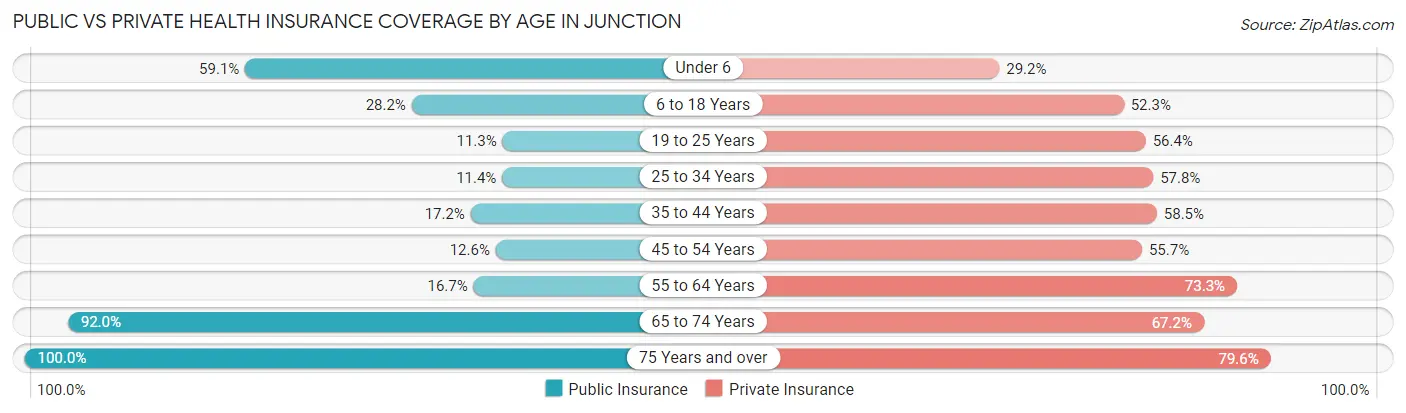
| Age Bracket | Public Insurance | Private Insurance |
| Under 6 | 101 (59.1%) | 50 (29.2%) |
| 6 to 18 Years | 163 (28.1%) | 303 (52.3%) |
| 19 to 25 Years | 22 (11.3%) | 110 (56.4%) |
| 25 to 34 Years | 32 (11.4%) | 163 (57.8%) |
| 35 to 44 Years | 70 (17.2%) | 238 (58.5%) |
| 45 to 54 Years | 34 (12.6%) | 151 (55.7%) |
| 55 to 64 Years | 25 (16.7%) | 110 (73.3%) |
| 65 to 74 Years | 241 (92.0%) | 176 (67.2%) |
| 75 Years and over | 142 (100.0%) | 113 (79.6%) |
| Total | 830 (33.8%) | 1,414 (57.5%) |
Disability Status by Sex by Age in Junction
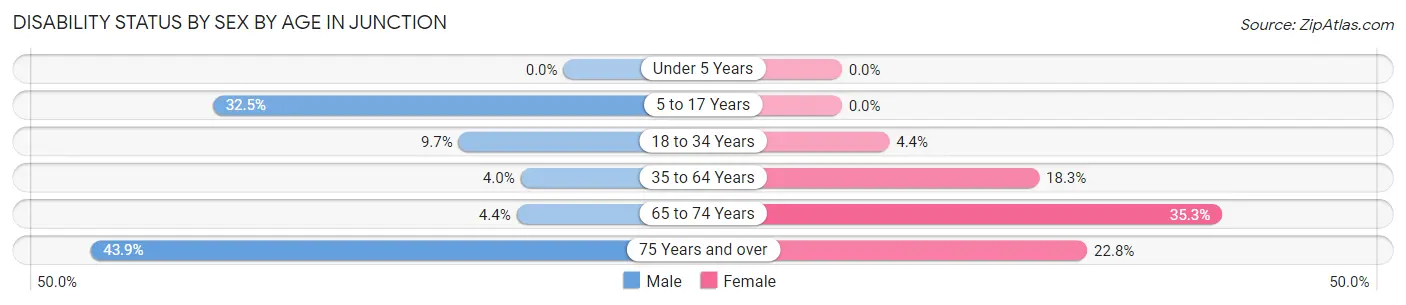
| Age Bracket | Male | Female |
| Under 5 Years | 0 (0.0%) | 0 (0.0%) |
| 5 to 17 Years | 82 (32.5%) | 0 (0.0%) |
| 18 to 34 Years | 33 (9.7%) | 12 (4.4%) |
| 35 to 64 Years | 16 (4.0%) | 78 (18.3%) |
| 65 to 74 Years | 4 (4.3%) | 60 (35.3%) |
| 75 Years and over | 18 (43.9%) | 23 (22.8%) |
Disability Class by Sex by Age in Junction
Disability Class: Hearing Difficulty
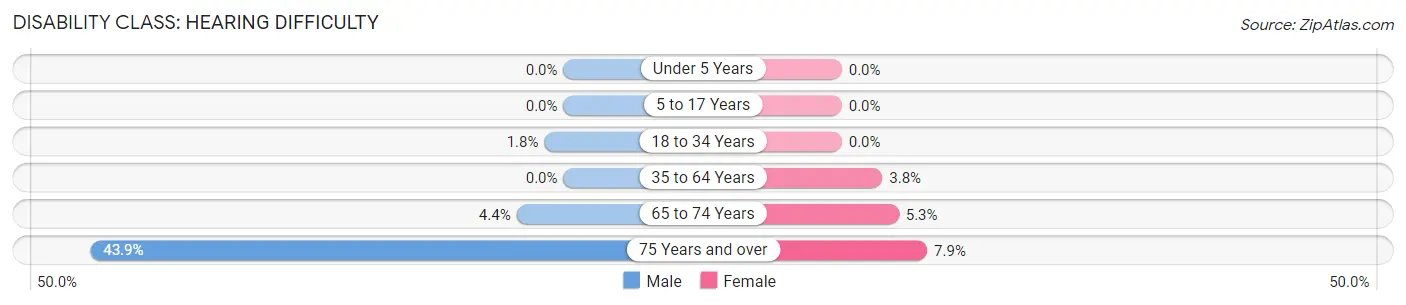
| Age Bracket | Male | Female |
| Under 5 Years | 0 (0.0%) | 0 (0.0%) |
| 5 to 17 Years | 0 (0.0%) | 0 (0.0%) |
| 18 to 34 Years | 6 (1.8%) | 0 (0.0%) |
| 35 to 64 Years | 0 (0.0%) | 16 (3.8%) |
| 65 to 74 Years | 4 (4.3%) | 9 (5.3%) |
| 75 Years and over | 18 (43.9%) | 8 (7.9%) |
Disability Class: Vision Difficulty
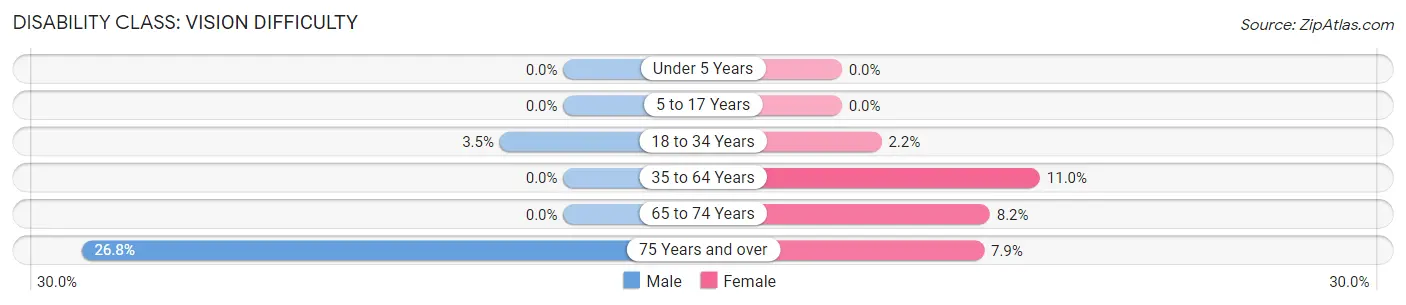
| Age Bracket | Male | Female |
| Under 5 Years | 0 (0.0%) | 0 (0.0%) |
| 5 to 17 Years | 0 (0.0%) | 0 (0.0%) |
| 18 to 34 Years | 12 (3.5%) | 6 (2.2%) |
| 35 to 64 Years | 0 (0.0%) | 47 (11.0%) |
| 65 to 74 Years | 0 (0.0%) | 14 (8.2%) |
| 75 Years and over | 11 (26.8%) | 8 (7.9%) |
Disability Class: Cognitive Difficulty
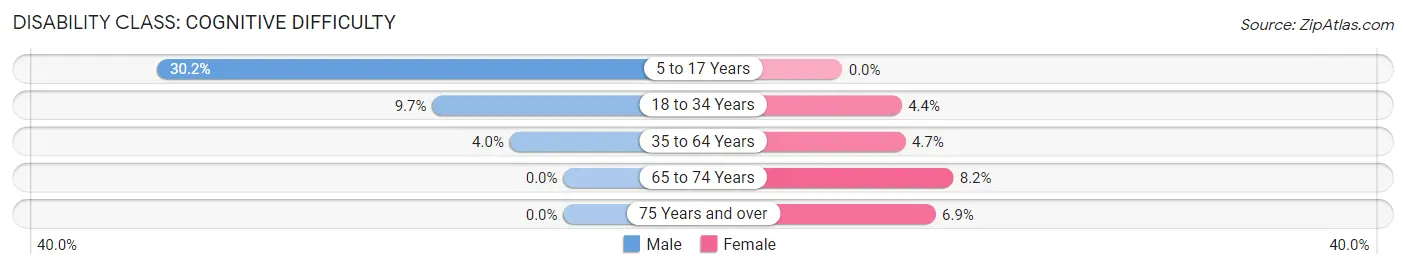
| Age Bracket | Male | Female |
| 5 to 17 Years | 76 (30.2%) | 0 (0.0%) |
| 18 to 34 Years | 33 (9.7%) | 12 (4.4%) |
| 35 to 64 Years | 16 (4.0%) | 20 (4.7%) |
| 65 to 74 Years | 0 (0.0%) | 14 (8.2%) |
| 75 Years and over | 0 (0.0%) | 7 (6.9%) |
Disability Class: Ambulatory Difficulty
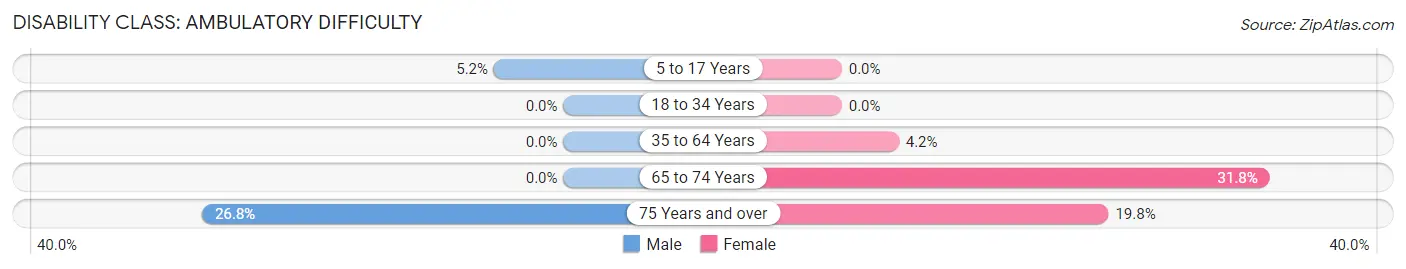
| Age Bracket | Male | Female |
| 5 to 17 Years | 13 (5.2%) | 0 (0.0%) |
| 18 to 34 Years | 0 (0.0%) | 0 (0.0%) |
| 35 to 64 Years | 0 (0.0%) | 18 (4.2%) |
| 65 to 74 Years | 0 (0.0%) | 54 (31.8%) |
| 75 Years and over | 11 (26.8%) | 20 (19.8%) |
Disability Class: Self-Care Difficulty
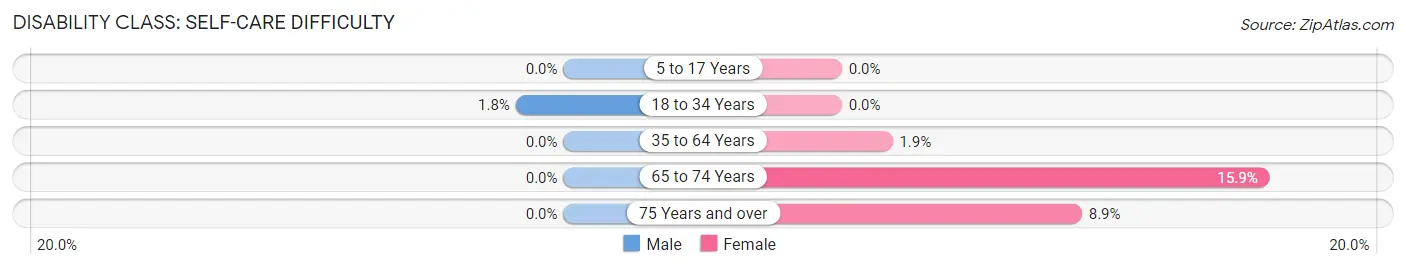
| Age Bracket | Male | Female |
| 5 to 17 Years | 0 (0.0%) | 0 (0.0%) |
| 18 to 34 Years | 6 (1.8%) | 0 (0.0%) |
| 35 to 64 Years | 0 (0.0%) | 8 (1.9%) |
| 65 to 74 Years | 0 (0.0%) | 27 (15.9%) |
| 75 Years and over | 0 (0.0%) | 9 (8.9%) |
Technology Access in Junction
Computing Device Access in Junction
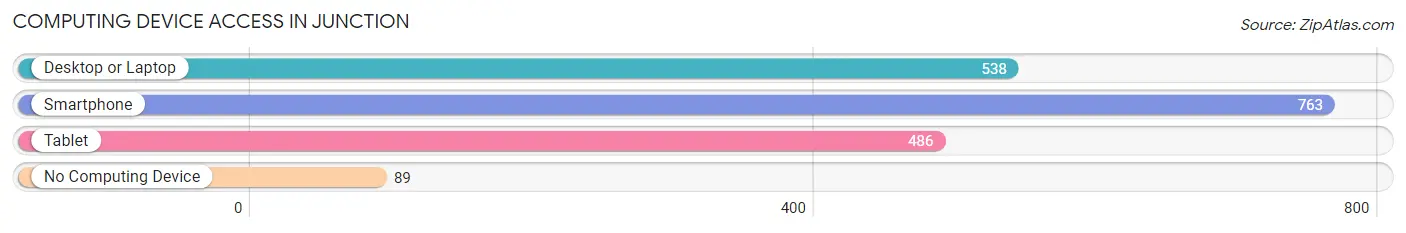
| Device Type | # Households | % Households |
| Desktop or Laptop | 538 | 60.9% |
| Smartphone | 763 | 86.4% |
| Tablet | 486 | 55.0% |
| No Computing Device | 89 | 10.1% |
| Total | 883 | 100.0% |
Internet Access in Junction
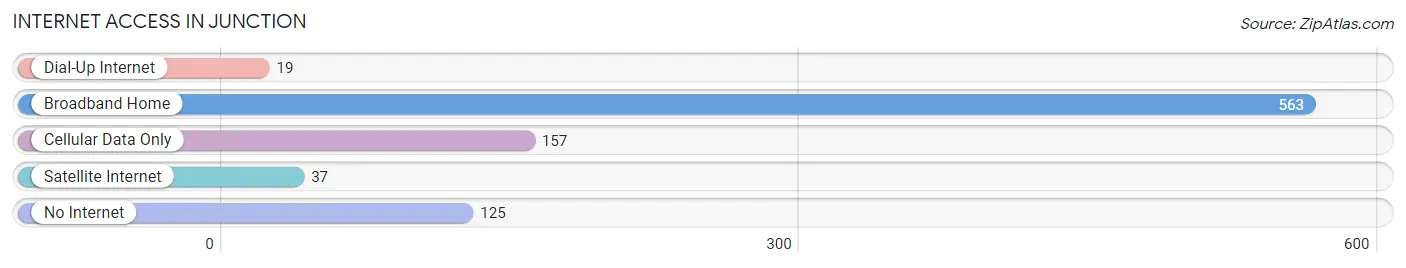
| Internet Type | # Households | % Households |
| Dial-Up Internet | 19 | 2.1% |
| Broadband Home | 563 | 63.8% |
| Cellular Data Only | 157 | 17.8% |
| Satellite Internet | 37 | 4.2% |
| No Internet | 125 | 14.2% |
| Total | 883 | 100.0% |
Junction Summary
Junction, Texas is a small city located in the heart of the Texas Hill Country. It is the county seat of Kimble County and is situated at the junction of the North and South Llano Rivers. The city has a population of 2,618 as of the 2010 census.
History
Junction was founded in 1876 by settlers from nearby Kimbleville. The city was named for its location at the junction of the North and South Llano Rivers. The city was incorporated in 1882 and quickly became a center of commerce for the surrounding area. The first post office was established in 1883 and the first school was built in 1884.
In the late 19th century, Junction was a major stop on the San Antonio and Aransas Pass Railway. The railroad brought in new settlers and businesses, and the city grew rapidly. By the early 20th century, Junction had become a major shipping point for cattle, sheep, and wool.
Geography
Junction is located in the Texas Hill Country, about 90 miles northwest of San Antonio. The city is situated at the junction of the North and South Llano Rivers, which form the headwaters of the Llano River. The city is surrounded by rolling hills and is home to several state parks, including South Llano River State Park and Junction City State Park.
The climate in Junction is semi-arid, with hot summers and mild winters. The average annual temperature is 68°F, and the average annual precipitation is 22 inches.
Economy
The economy of Junction is largely based on agriculture and tourism. The city is home to several large ranches, and the surrounding area is known for its cattle, sheep, and wool production. The city is also a popular tourist destination, with several state parks and recreational areas nearby.
The city is home to several businesses, including a grocery store, a hardware store, and several restaurants. The city also has a small airport, which serves as a hub for private and corporate aircraft.
Demographics
As of the 2010 census, the population of Junction was 2,618. The racial makeup of the city was 94.3% White, 0.7% African American, 0.3% Native American, 0.2% Asian, 0.1% Pacific Islander, 2.7% from other races, and 1.7% from two or more races. Hispanic or Latino of any race were 8.2% of the population.
The median income for a household in Junction was $31,250, and the median income for a family was $37,500. The per capita income for the city was $17,845. About 16.2% of families and 19.2% of the population were below the poverty line, including 25.2% of those under age 18 and 11.2% of those age 65 or over.
Common Questions
What is Per Capita Income in Junction?
Per Capita income in Junction is $25,589.
What is the Median Family Income in Junction?
Median Family Income in Junction is $71,172.
What is the Median Household income in Junction?
Median Household Income in Junction is $55,110.
What is Income or Wage Gap in Junction?
Income or Wage Gap in Junction is 26.1%.
Women in Junction earn 73.9 cents for every dollar earned by a man.
What is Inequality or Gini Index in Junction?
Inequality or Gini Index in Junction is 0.45.
What is the Total Population of Junction?
Total Population of Junction is 2,494.
What is the Total Male Population of Junction?
Total Male Population of Junction is 1,201.
What is the Total Female Population of Junction?
Total Female Population of Junction is 1,293.
What is the Ratio of Males per 100 Females in Junction?
There are 92.88 Males per 100 Females in Junction.
What is the Ratio of Females per 100 Males in Junction?
There are 107.66 Females per 100 Males in Junction.
What is the Median Population Age in Junction?
Median Population Age in Junction is 35.0 Years.
What is the Average Family Size in Junction
Average Family Size in Junction is 3.7 People.
What is the Average Household Size in Junction
Average Household Size in Junction is 2.8 People.
How Large is the Labor Force in Junction?
There are 1,334 People in the Labor Forcein in Junction.
What is the Percentage of People in the Labor Force in Junction?
68.6% of People are in the Labor Force in Junction.
What is the Unemployment Rate in Junction?
Unemployment Rate in Junction is 1.2%.