Jewett, TX Map & Demographics
Jewett Map
Jewett Overview
$28,473
PER CAPITA INCOME
$53,333
AVG FAMILY INCOME
$48,681
AVG HOUSEHOLD INCOME
69.6%
WAGE / INCOME GAP [ % ]
30.4¢/ $1
WAGE / INCOME GAP [ $ ]
0.41
INEQUALITY / GINI INDEX
634
TOTAL POPULATION
320
MALE POPULATION
314
FEMALE POPULATION
101.91
MALES / 100 FEMALES
98.12
FEMALES / 100 MALES
29.5
MEDIAN AGE
4.0
AVG FAMILY SIZE
2.5
AVG HOUSEHOLD SIZE
257
LABOR FORCE [ PEOPLE ]
53.0%
PERCENT IN LABOR FORCE
11.3%
UNEMPLOYMENT RATE
Jewett Zip Codes
Jewett Area Codes
Income in Jewett
Income Overview in Jewett
Per Capita Income in Jewett is $28,473, while median incomes of families and households are $53,333 and $48,681 respectively.
| Characteristic | Number | Measure |
| Per Capita Income | 634 | $28,473 |
| Median Family Income | 108 | $53,333 |
| Mean Family Income | 108 | $77,518 |
| Median Household Income | 245 | $48,681 |
| Mean Household Income | 245 | $65,550 |
| Income Deficit | 108 | $0 |
| Wage / Income Gap (%) | 634 | 69.65% |
| Wage / Income Gap ($) | 634 | 30.35¢ per $1 |
| Gini / Inequality Index | 634 | 0.41 |
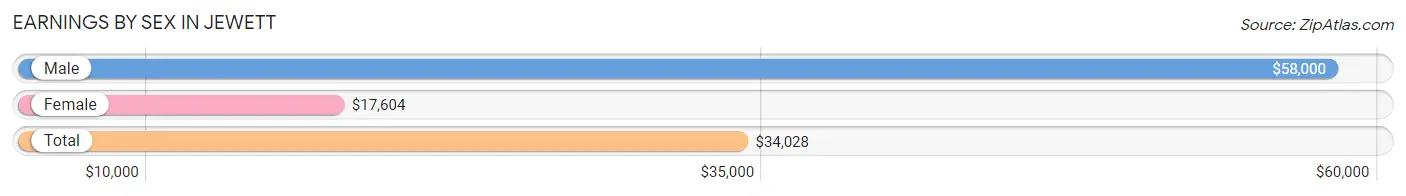
Earnings by Sex in Jewett
Average Earnings in Jewett are $34,028, $58,000 for men and $17,604 for women, a difference of 69.7%.
| Sex | Number | Average Earnings |
| Male | 148 (57.6%) | $58,000 |
| Female | 109 (42.4%) | $17,604 |
| Total | 257 (100.0%) | $34,028 |
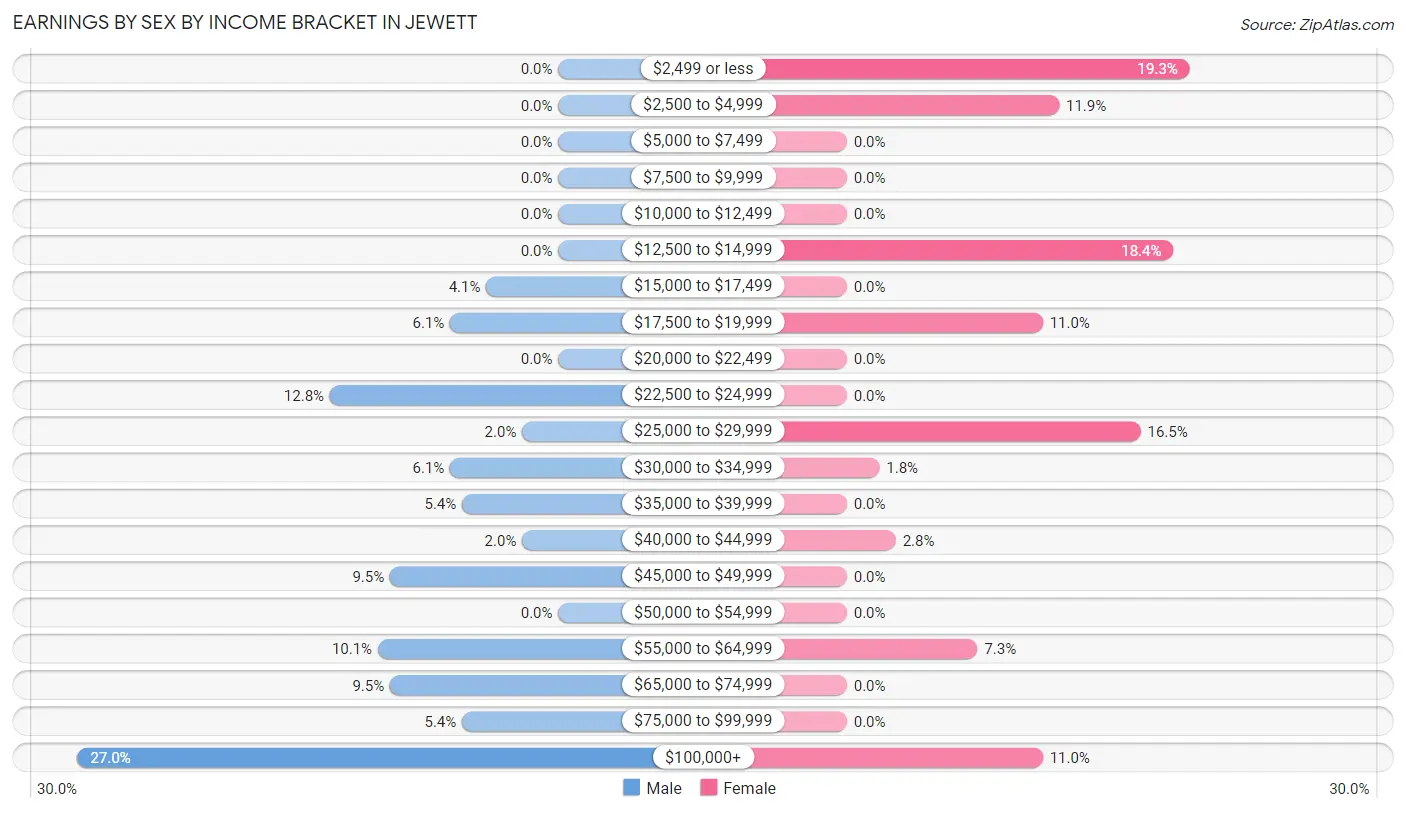
Earnings by Sex by Income Bracket in Jewett
The most common earnings brackets in Jewett are $100,000+ for men (40 | 27.0%) and $2,499 or less for women (21 | 19.3%).
| Income | Male | Female |
| $2,499 or less | 0 (0.0%) | 21 (19.3%) |
| $2,500 to $4,999 | 0 (0.0%) | 13 (11.9%) |
| $5,000 to $7,499 | 0 (0.0%) | 0 (0.0%) |
| $7,500 to $9,999 | 0 (0.0%) | 0 (0.0%) |
| $10,000 to $12,499 | 0 (0.0%) | 0 (0.0%) |
| $12,500 to $14,999 | 0 (0.0%) | 20 (18.3%) |
| $15,000 to $17,499 | 6 (4.1%) | 0 (0.0%) |
| $17,500 to $19,999 | 9 (6.1%) | 12 (11.0%) |
| $20,000 to $22,499 | 0 (0.0%) | 0 (0.0%) |
| $22,500 to $24,999 | 19 (12.8%) | 0 (0.0%) |
| $25,000 to $29,999 | 3 (2.0%) | 18 (16.5%) |
| $30,000 to $34,999 | 9 (6.1%) | 2 (1.8%) |
| $35,000 to $39,999 | 8 (5.4%) | 0 (0.0%) |
| $40,000 to $44,999 | 3 (2.0%) | 3 (2.8%) |
| $45,000 to $49,999 | 14 (9.5%) | 0 (0.0%) |
| $50,000 to $54,999 | 0 (0.0%) | 0 (0.0%) |
| $55,000 to $64,999 | 15 (10.1%) | 8 (7.3%) |
| $65,000 to $74,999 | 14 (9.5%) | 0 (0.0%) |
| $75,000 to $99,999 | 8 (5.4%) | 0 (0.0%) |
| $100,000+ | 40 (27.0%) | 12 (11.0%) |
| Total | 148 (100.0%) | 109 (100.0%) |
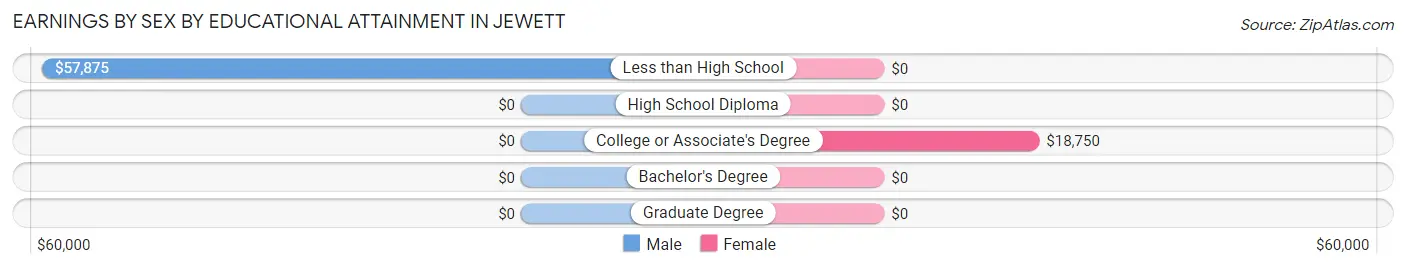
Earnings by Sex by Educational Attainment in Jewett
Average earnings in Jewett are $48,036 for men and $19,896 for women, a difference of 58.6%. Men with an educational attainment of less than high school enjoy the highest average annual earnings of $57,875, while those with less than high school education earn the least with $57,875. Women with an educational attainment of college or associate's degree earn the most with the average annual earnings of $18,750, while those with college or associate's degree education have the smallest earnings of $18,750.
| Educational Attainment | Male Income | Female Income |
| Less than High School | $57,875 | $0 |
| High School Diploma | - | - |
| College or Associate's Degree | - | - |
| Bachelor's Degree | - | - |
| Graduate Degree | - | - |
| Total | $48,036 | $19,896 |
Family Income in Jewett
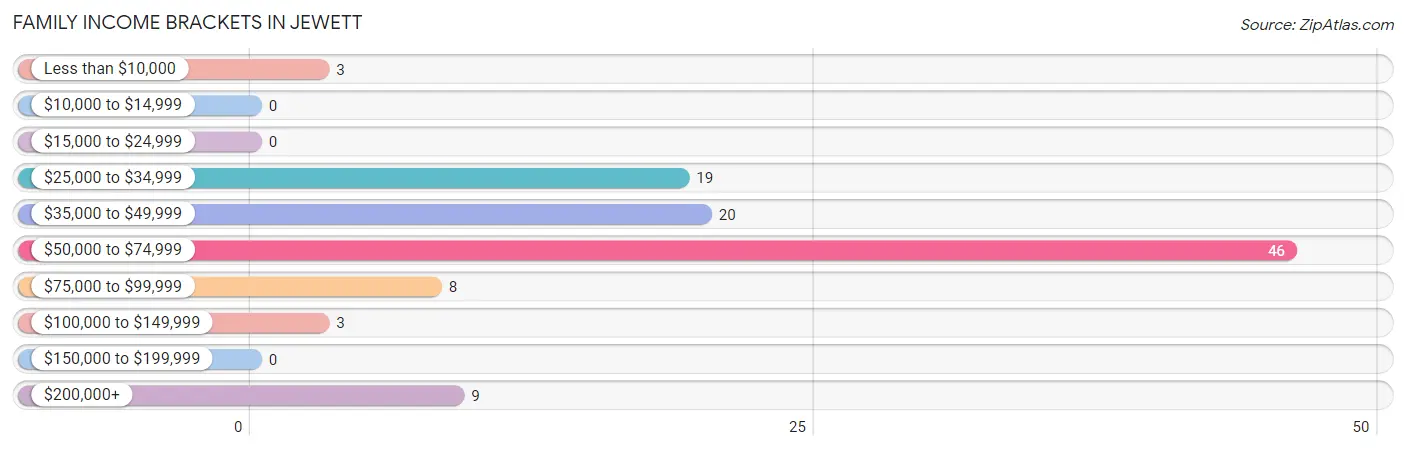
Family Income Brackets in Jewett
According to the Jewett family income data, there are 46 families falling into the $50,000 to $74,999 income range, which is the most common income bracket and makes up 42.6% of all families.
| Income Bracket | # Families | % Families |
| Less than $10,000 | 3 | 2.8% |
| $10,000 to $14,999 | 0 | 0.0% |
| $15,000 to $24,999 | 0 | 0.0% |
| $25,000 to $34,999 | 19 | 17.6% |
| $35,000 to $49,999 | 20 | 18.5% |
| $50,000 to $74,999 | 46 | 42.6% |
| $75,000 to $99,999 | 8 | 7.4% |
| $100,000 to $149,999 | 3 | 2.8% |
| $150,000 to $199,999 | 0 | 0.0% |
| $200,000+ | 9 | 8.3% |
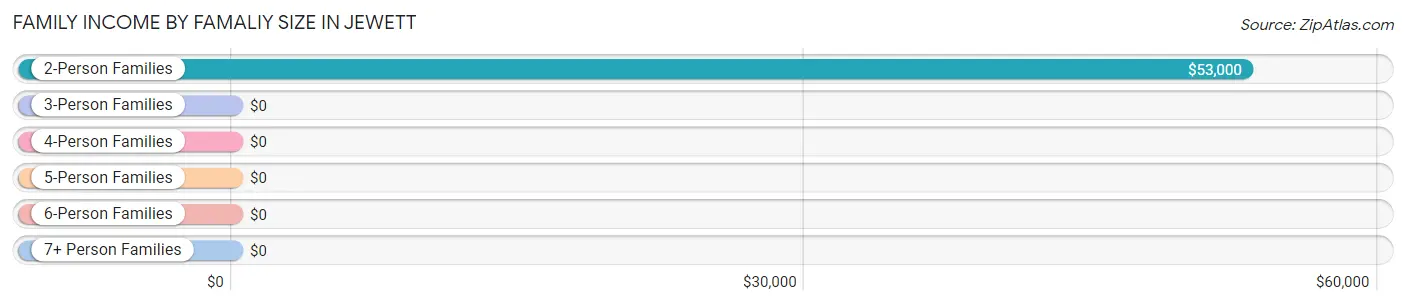
Family Income by Famaliy Size in Jewett
2-person families (64 | 59.3%) account for the highest median family income in Jewett with $53,000 per family, while 2-person families (64 | 59.3%) have the highest median income of $26,500 per family member.
| Income Bracket | # Families | Median Income |
| 2-Person Families | 64 (59.3%) | $53,000 |
| 3-Person Families | 4 (3.7%) | $0 |
| 4-Person Families | 8 (7.4%) | $0 |
| 5-Person Families | 3 (2.8%) | $0 |
| 6-Person Families | 16 (14.8%) | $0 |
| 7+ Person Families | 13 (12.0%) | $0 |
| Total | 108 (100.0%) | $53,333 |
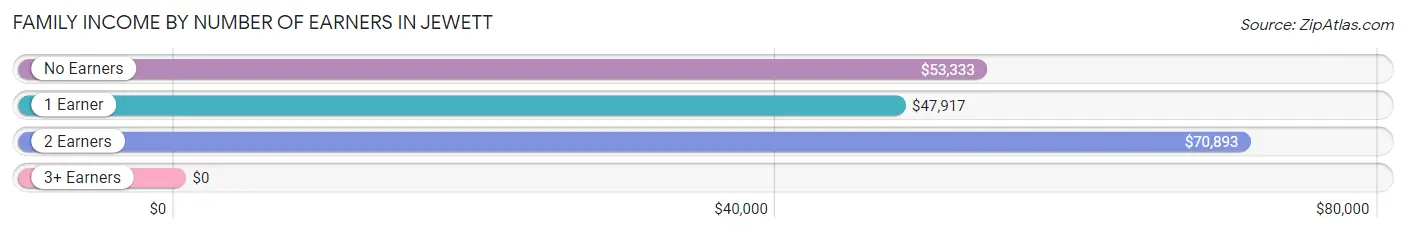
Family Income by Number of Earners in Jewett
| Number of Earners | # Families | Median Income |
| No Earners | 30 (27.8%) | $53,333 |
| 1 Earner | 39 (36.1%) | $47,917 |
| 2 Earners | 39 (36.1%) | $70,893 |
| 3+ Earners | 0 (0.0%) | $0 |
| Total | 108 (100.0%) | $53,333 |
Household Income in Jewett
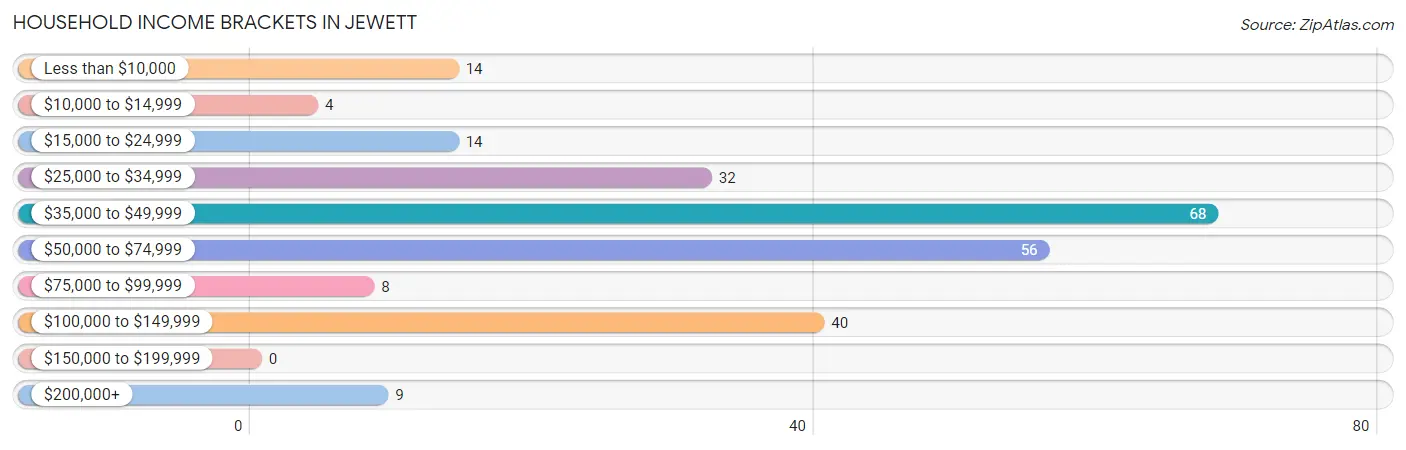
Household Income Brackets in Jewett
With 68 households falling in the category, the $35,000 to $49,999 income range is the most frequent in Jewett, accounting for 27.8% of all households.
| Income Bracket | # Households | % Households |
| Less than $10,000 | 14 | 5.7% |
| $10,000 to $14,999 | 4 | 1.6% |
| $15,000 to $24,999 | 14 | 5.7% |
| $25,000 to $34,999 | 32 | 13.1% |
| $35,000 to $49,999 | 68 | 27.8% |
| $50,000 to $74,999 | 56 | 22.9% |
| $75,000 to $99,999 | 8 | 3.3% |
| $100,000 to $149,999 | 40 | 16.3% |
| $150,000 to $199,999 | 0 | 0.0% |
| $200,000+ | 9 | 3.7% |
Household Income by Householder Age in Jewett
The median household income in Jewett is $48,681, with the highest median household income of $51,964 found in the 45 to 64 years age bracket for the primary householder. A total of 101 households (41.2%) fall into this category. Meanwhile, the 15 to 24 years age bracket for the primary householder has the lowest median household income of $0, with 33 households (13.5%) in this group.
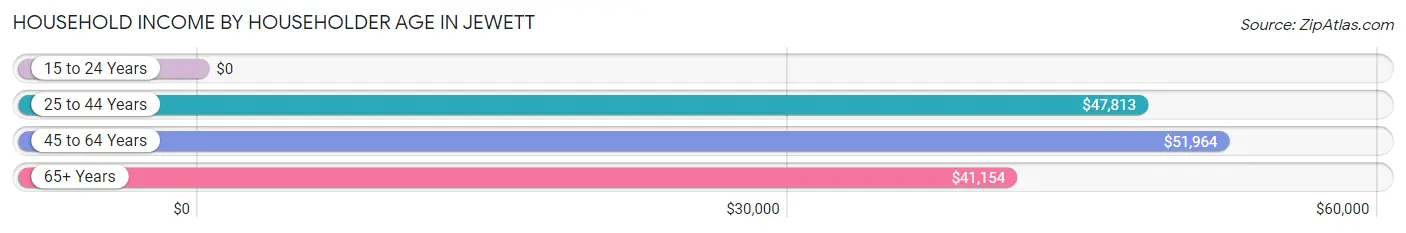
| Income Bracket | # Households | Median Income |
| 15 to 24 Years | 33 (13.5%) | $0 |
| 25 to 44 Years | 75 (30.6%) | $47,813 |
| 45 to 64 Years | 101 (41.2%) | $51,964 |
| 65+ Years | 36 (14.7%) | $41,154 |
| Total | 245 (100.0%) | $48,681 |
Poverty in Jewett
Income Below Poverty by Sex and Age in Jewett
With 10.3% poverty level for males and 31.9% for females among the residents of Jewett, under 5 year old males and 12 to 14 year old females are the most vulnerable to poverty, with 8 males (100.0%) and 10 females (100.0%) in their respective age groups living below the poverty level.
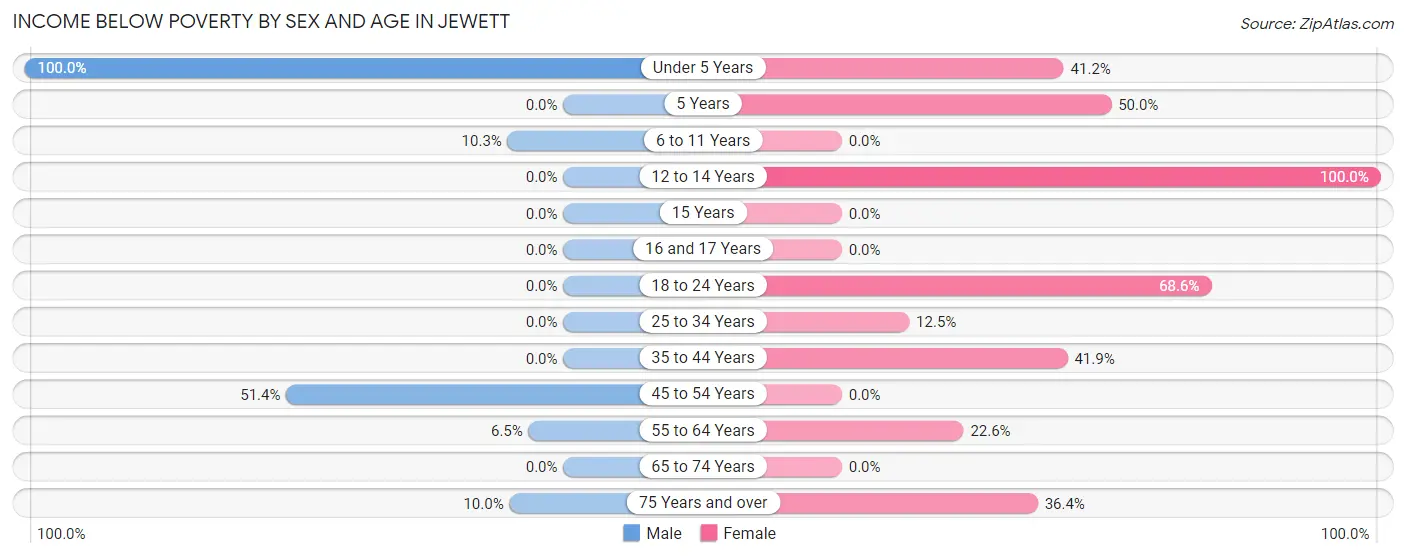
| Age Bracket | Male | Female |
| Under 5 Years | 8 (100.0%) | 7 (41.2%) |
| 5 Years | 0 (0.0%) | 7 (50.0%) |
| 6 to 11 Years | 3 (10.3%) | 0 (0.0%) |
| 12 to 14 Years | 0 (0.0%) | 10 (100.0%) |
| 15 Years | 0 (0.0%) | 0 (0.0%) |
| 16 and 17 Years | 0 (0.0%) | 0 (0.0%) |
| 18 to 24 Years | 0 (0.0%) | 24 (68.6%) |
| 25 to 34 Years | 0 (0.0%) | 3 (12.5%) |
| 35 to 44 Years | 0 (0.0%) | 31 (41.9%) |
| 45 to 54 Years | 18 (51.4%) | 0 (0.0%) |
| 55 to 64 Years | 2 (6.5%) | 14 (22.6%) |
| 65 to 74 Years | 0 (0.0%) | 0 (0.0%) |
| 75 Years and over | 2 (10.0%) | 4 (36.4%) |
| Total | 33 (10.3%) | 100 (31.9%) |
Income Above Poverty by Sex and Age in Jewett
According to the poverty statistics in Jewett, males aged 5 years and females aged 6 to 11 years are the age groups that are most secure financially, with 100.0% of males and 100.0% of females in these age groups living above the poverty line.
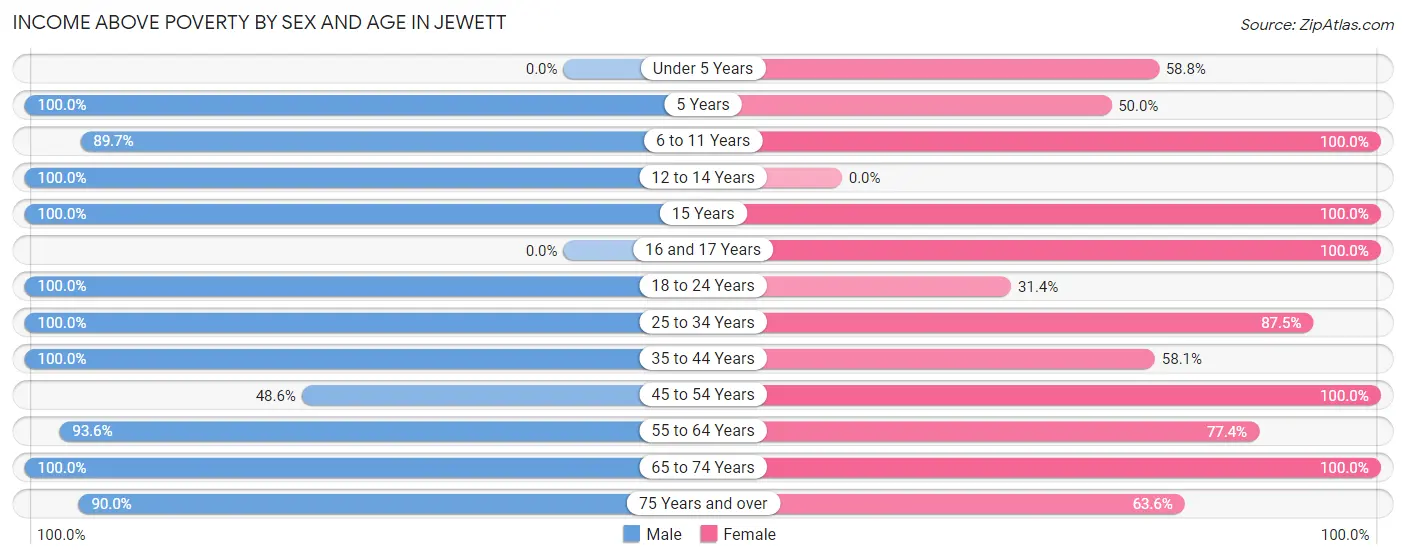
| Age Bracket | Male | Female |
| Under 5 Years | 0 (0.0%) | 10 (58.8%) |
| 5 Years | 5 (100.0%) | 7 (50.0%) |
| 6 to 11 Years | 26 (89.7%) | 10 (100.0%) |
| 12 to 14 Years | 23 (100.0%) | 0 (0.0%) |
| 15 Years | 16 (100.0%) | 17 (100.0%) |
| 16 and 17 Years | 0 (0.0%) | 19 (100.0%) |
| 18 to 24 Years | 78 (100.0%) | 11 (31.4%) |
| 25 to 34 Years | 28 (100.0%) | 21 (87.5%) |
| 35 to 44 Years | 25 (100.0%) | 43 (58.1%) |
| 45 to 54 Years | 17 (48.6%) | 15 (100.0%) |
| 55 to 64 Years | 29 (93.5%) | 48 (77.4%) |
| 65 to 74 Years | 22 (100.0%) | 6 (100.0%) |
| 75 Years and over | 18 (90.0%) | 7 (63.6%) |
| Total | 287 (89.7%) | 214 (68.1%) |
Income Below Poverty Among Married-Couple Families in Jewett
The poverty statistics for married-couple families in Jewett show that 6.9% or 6 of the total 87 families live below the poverty line. Families with 5 or more children have the highest poverty rate of 100.0%, comprising of 6 families. On the other hand, families with no children have the lowest poverty rate of 0.0%, which includes 0 families.
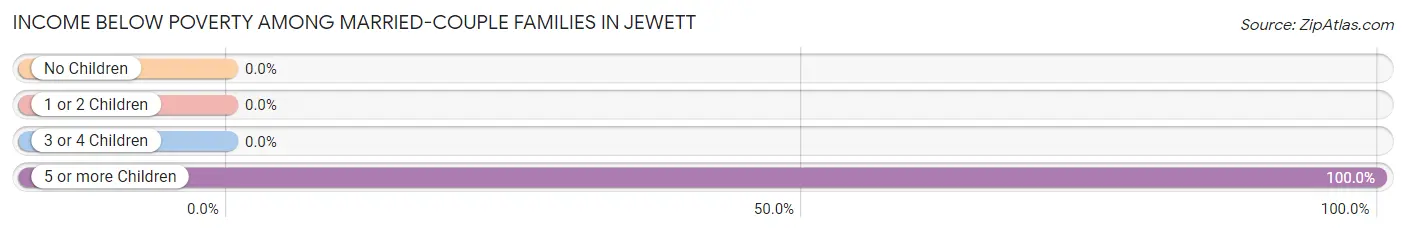
| Children | Above Poverty | Below Poverty |
| No Children | 50 (100.0%) | 0 (0.0%) |
| 1 or 2 Children | 5 (100.0%) | 0 (0.0%) |
| 3 or 4 Children | 26 (100.0%) | 0 (0.0%) |
| 5 or more Children | 0 (0.0%) | 6 (100.0%) |
| Total | 81 (93.1%) | 6 (6.9%) |
Income Below Poverty Among Single-Parent Households in Jewett
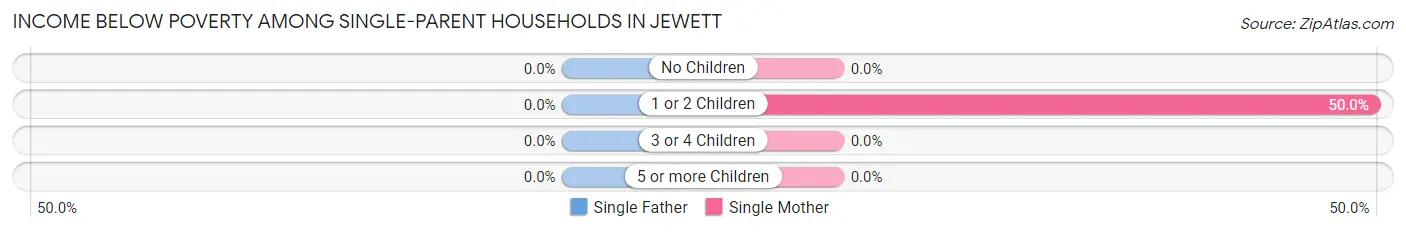
| Children | Single Father | Single Mother |
| No Children | 0 (0.0%) | 0 (0.0%) |
| 1 or 2 Children | 0 (0.0%) | 3 (50.0%) |
| 3 or 4 Children | 0 (0.0%) | 0 (0.0%) |
| 5 or more Children | 0 (0.0%) | 0 (0.0%) |
| Total | 0 (0.0%) | 3 (14.3%) |
Income Below Poverty Among Married-Couple vs Single-Parent Households in Jewett
The poverty data for Jewett shows that 6 of the married-couple family households (6.9%) and 3 of the single-parent households (14.3%) are living below the poverty level. Within the married-couple family households, those with 5 or more children have the highest poverty rate, with 6 households (100.0%) falling below the poverty line. Among the single-parent households, those with 1 or 2 children have the highest poverty rate, with 3 household (50.0%) living below poverty.
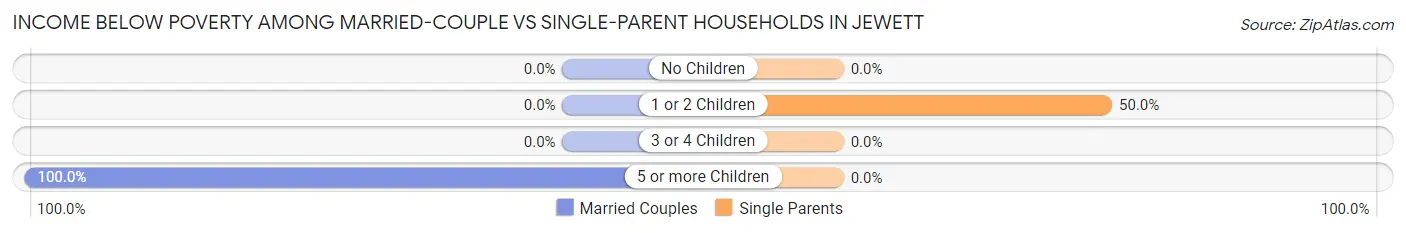
| Children | Married-Couple Families | Single-Parent Households |
| No Children | 0 (0.0%) | 0 (0.0%) |
| 1 or 2 Children | 0 (0.0%) | 3 (50.0%) |
| 3 or 4 Children | 0 (0.0%) | 0 (0.0%) |
| 5 or more Children | 6 (100.0%) | 0 (0.0%) |
| Total | 6 (6.9%) | 3 (14.3%) |
Race in Jewett
The most populous races in Jewett are White / Caucasian (476 | 75.1%), Hispanic or Latino (349 | 55.0%), and Two or more Races (109 | 17.2%).
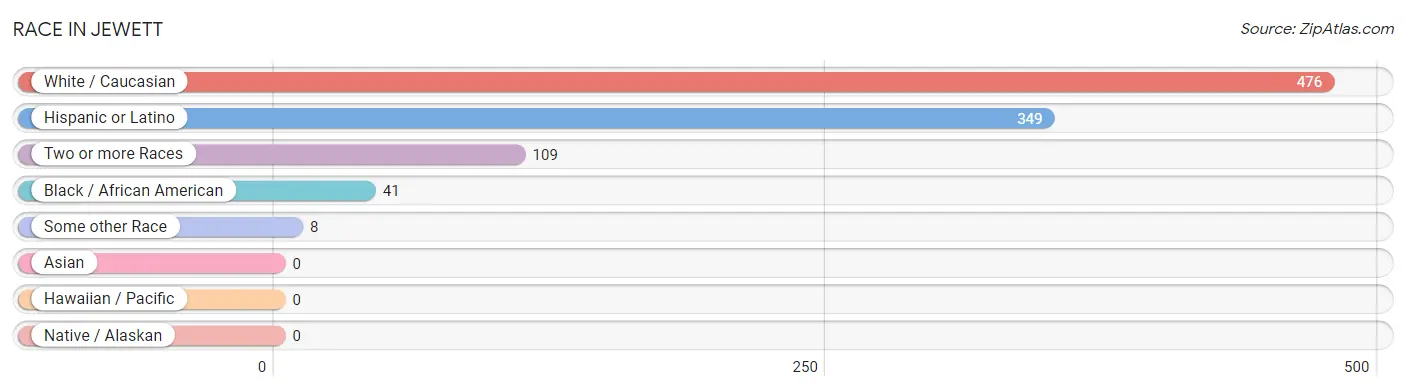
| Race | # Population | % Population |
| Asian | 0 | 0.0% |
| Black / African American | 41 | 6.5% |
| Hawaiian / Pacific | 0 | 0.0% |
| Hispanic or Latino | 349 | 55.0% |
| Native / Alaskan | 0 | 0.0% |
| White / Caucasian | 476 | 75.1% |
| Two or more Races | 109 | 17.2% |
| Some other Race | 8 | 1.3% |
| Total | 634 | 100.0% |
Ancestry in Jewett
The most populous ancestries reported in Jewett are Mexican (294 | 46.4%), English (67 | 10.6%), Central American (46 | 7.3%), Salvadoran (46 | 7.3%), and German (43 | 6.8%), together accounting for 78.2% of all Jewett residents.
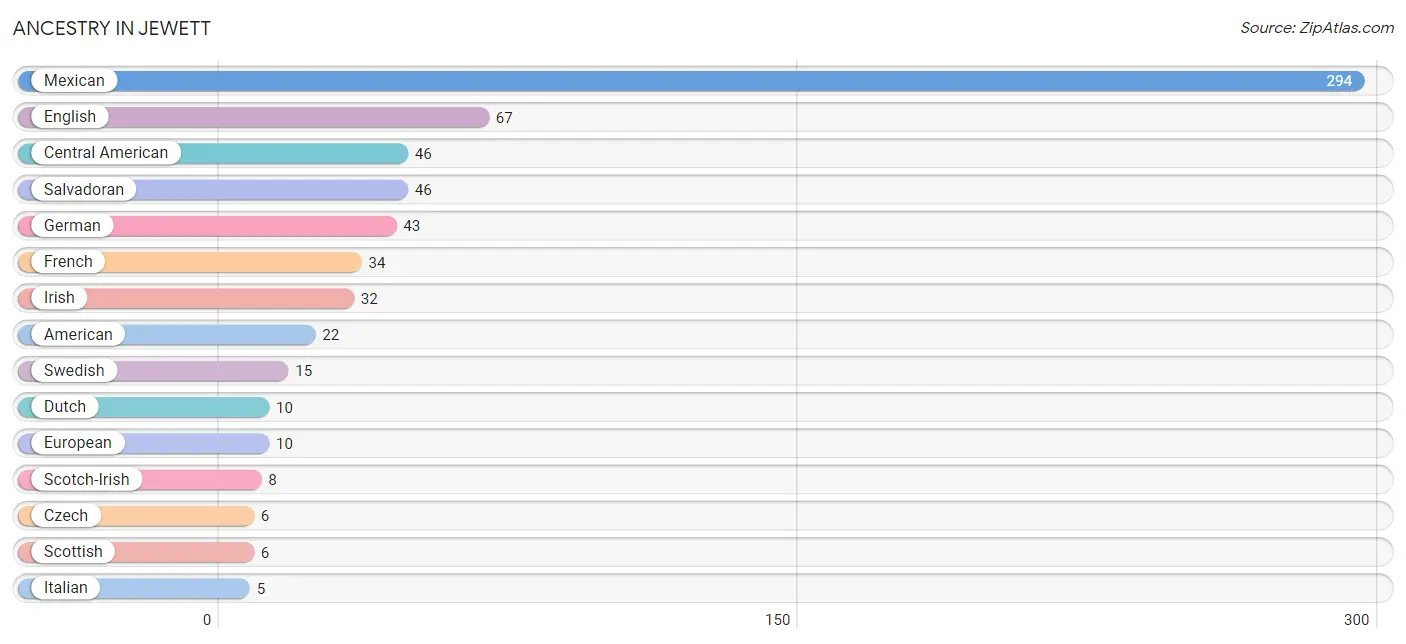
| Ancestry | # Population | % Population |
| American | 22 | 3.5% |
| Central American | 46 | 7.3% |
| Czech | 6 | 0.9% |
| Dutch | 10 | 1.6% |
| English | 67 | 10.6% |
| European | 10 | 1.6% |
| French | 34 | 5.4% |
| German | 43 | 6.8% |
| Irish | 32 | 5.1% |
| Italian | 5 | 0.8% |
| Mexican | 294 | 46.4% |
| Salvadoran | 46 | 7.3% |
| Scotch-Irish | 8 | 1.3% |
| Scottish | 6 | 0.9% |
| Swedish | 15 | 2.4% | View All 15 Rows |
Immigrants in Jewett
The most numerous immigrant groups reported in Jewett came from Central America (76 | 12.0%), Latin America (76 | 12.0%), Mexico (65 | 10.2%), El Salvador (9 | 1.4%), and Belize (2 | 0.3%), together accounting for 36.0% of all Jewett residents.
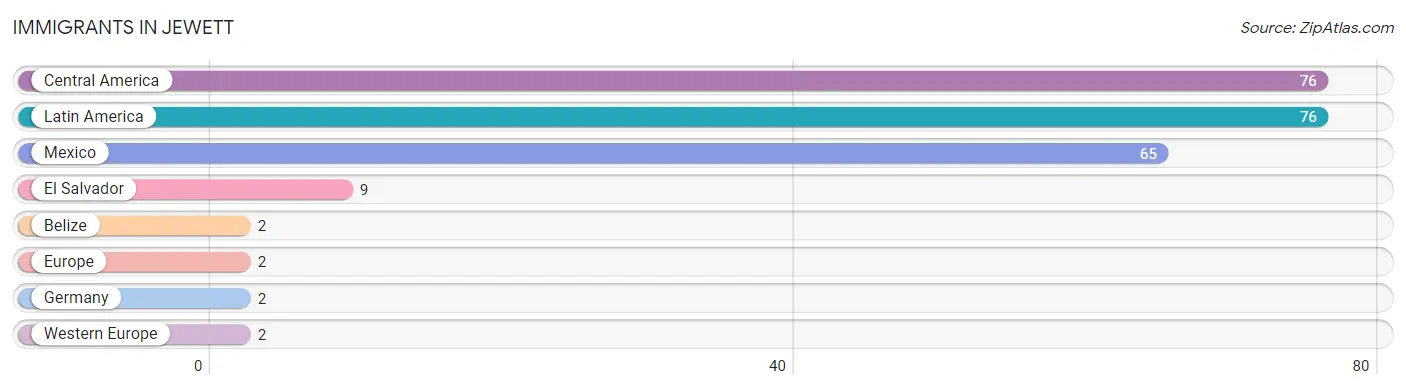
| Immigration Origin | # Population | % Population |
| Belize | 2 | 0.3% |
| Central America | 76 | 12.0% |
| El Salvador | 9 | 1.4% |
| Europe | 2 | 0.3% |
| Germany | 2 | 0.3% |
| Latin America | 76 | 12.0% |
| Mexico | 65 | 10.2% |
| Western Europe | 2 | 0.3% | View All 8 Rows |
Sex and Age in Jewett
Sex and Age in Jewett
The most populous age groups in Jewett are 20 to 24 Years (78 | 24.4%) for men and 35 to 39 Years (55 | 17.5%) for women.
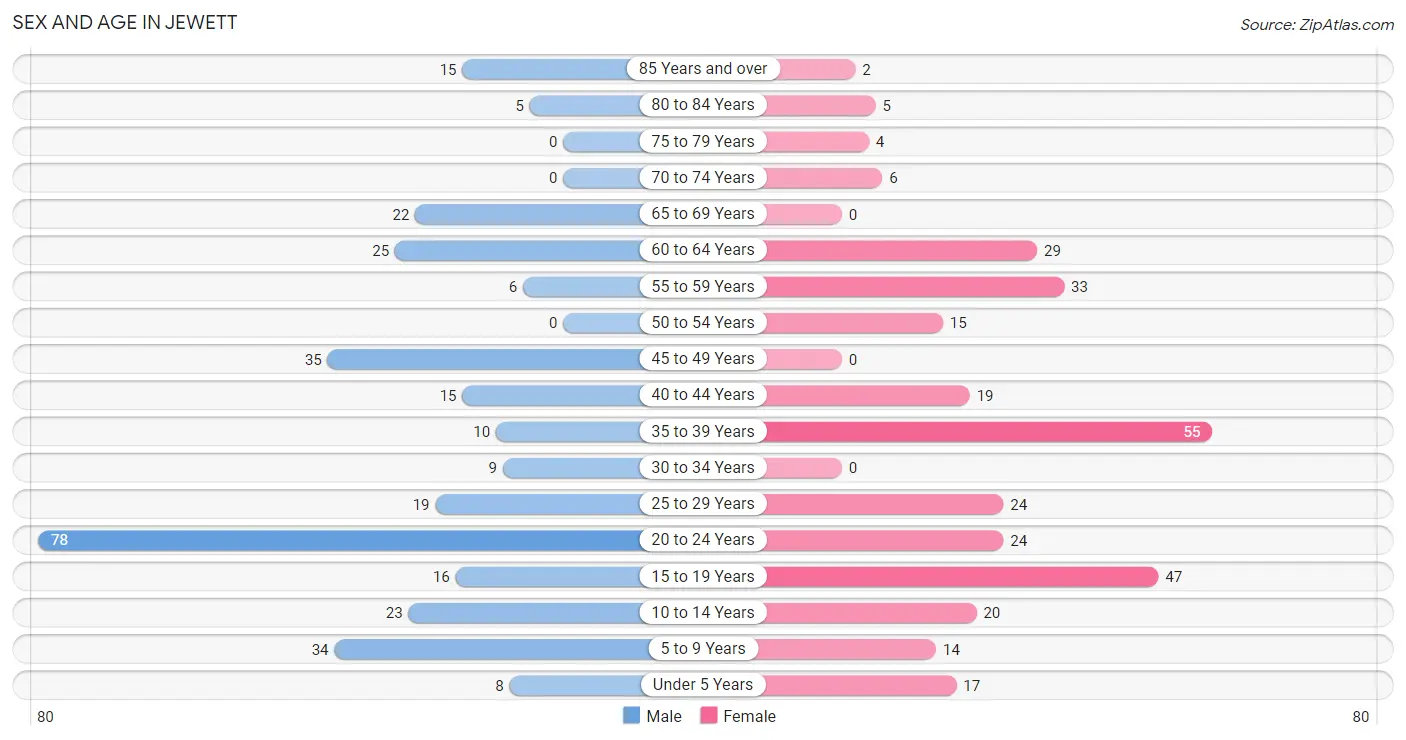
| Age Bracket | Male | Female |
| Under 5 Years | 8 (2.5%) | 17 (5.4%) |
| 5 to 9 Years | 34 (10.6%) | 14 (4.5%) |
| 10 to 14 Years | 23 (7.2%) | 20 (6.4%) |
| 15 to 19 Years | 16 (5.0%) | 47 (15.0%) |
| 20 to 24 Years | 78 (24.4%) | 24 (7.6%) |
| 25 to 29 Years | 19 (5.9%) | 24 (7.6%) |
| 30 to 34 Years | 9 (2.8%) | 0 (0.0%) |
| 35 to 39 Years | 10 (3.1%) | 55 (17.5%) |
| 40 to 44 Years | 15 (4.7%) | 19 (6.0%) |
| 45 to 49 Years | 35 (10.9%) | 0 (0.0%) |
| 50 to 54 Years | 0 (0.0%) | 15 (4.8%) |
| 55 to 59 Years | 6 (1.9%) | 33 (10.5%) |
| 60 to 64 Years | 25 (7.8%) | 29 (9.2%) |
| 65 to 69 Years | 22 (6.9%) | 0 (0.0%) |
| 70 to 74 Years | 0 (0.0%) | 6 (1.9%) |
| 75 to 79 Years | 0 (0.0%) | 4 (1.3%) |
| 80 to 84 Years | 5 (1.6%) | 5 (1.6%) |
| 85 Years and over | 15 (4.7%) | 2 (0.6%) |
| Total | 320 (100.0%) | 314 (100.0%) |
Families and Households in Jewett
Median Family Size in Jewett
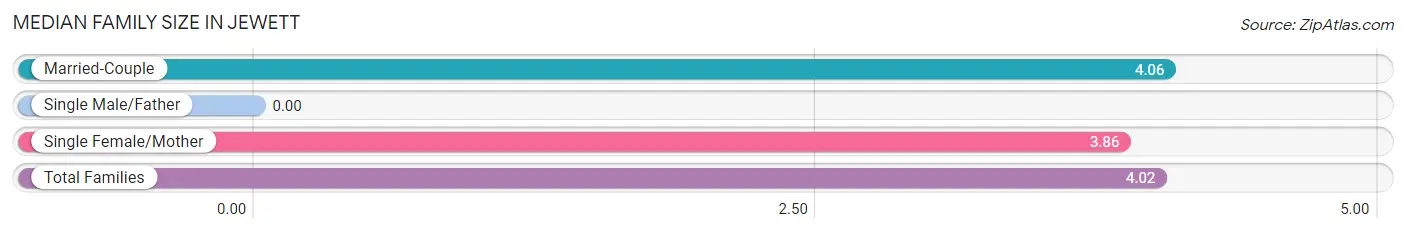
| Family Type | # Families | Family Size |
| Married-Couple | 87 (80.6%) | 4.06 |
| Single Male/Father | 0 (0.0%) | - |
| Single Female/Mother | 21 (19.4%) | 3.86 |
| Total Families | 108 (100.0%) | 4.02 |
Median Household Size in Jewett
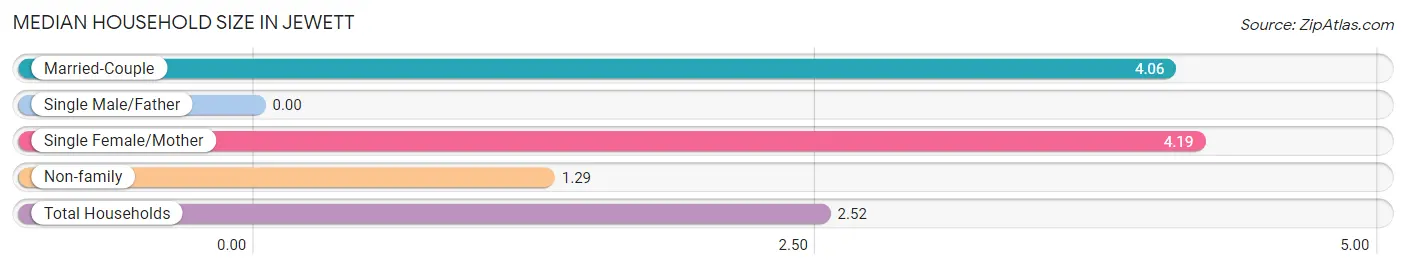
| Household Type | # Households | Household Size |
| Married-Couple | 87 (35.5%) | 4.06 |
| Single Male/Father | 0 (0.0%) | - |
| Single Female/Mother | 21 (8.6%) | 4.19 |
| Non-family | 137 (55.9%) | 1.29 |
| Total Households | 245 (100.0%) | 2.52 |
Household Size by Marriage Status in Jewett
Out of a total of 245 households in Jewett, 108 (44.1%) are family households, while 137 (55.9%) are nonfamily households. The most numerous type of family households are 2-person households, comprising 61, and the most common type of nonfamily households are 1-person households, comprising 96.
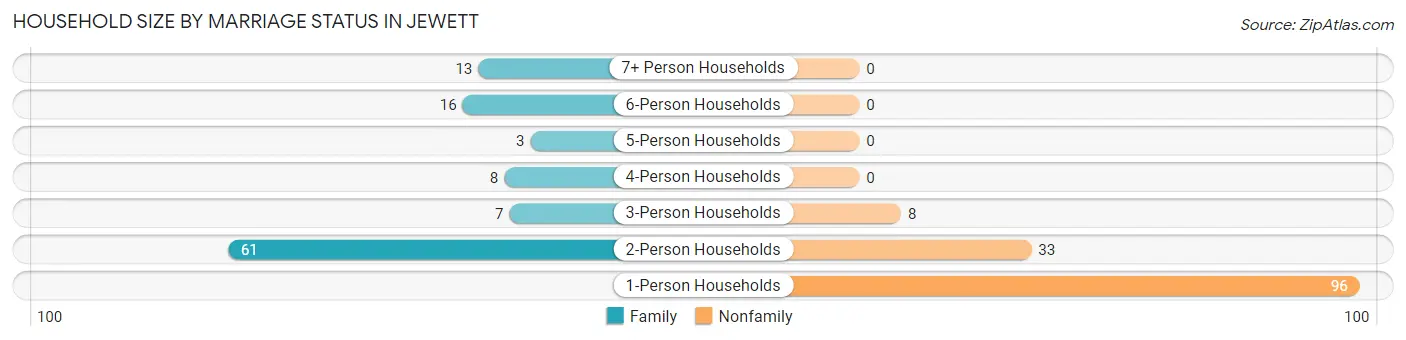
| Household Size | Family Households | Nonfamily Households |
| 1-Person Households | - | 96 (39.2%) |
| 2-Person Households | 61 (24.9%) | 33 (13.5%) |
| 3-Person Households | 7 (2.9%) | 8 (3.3%) |
| 4-Person Households | 8 (3.3%) | 0 (0.0%) |
| 5-Person Households | 3 (1.2%) | 0 (0.0%) |
| 6-Person Households | 16 (6.5%) | 0 (0.0%) |
| 7+ Person Households | 13 (5.3%) | 0 (0.0%) |
| Total | 108 (44.1%) | 137 (55.9%) |
Female Fertility in Jewett
Fertility by Age in Jewett
| Age Bracket | Women with Births | Births / 1,000 Women |
| 15 to 19 years | 0 (0.0%) | 0.0 |
| 20 to 34 years | 0 (0.0%) | 0.0 |
| 35 to 50 years | 0 (0.0%) | 0.0 |
| Total | 0 (0.0%) | 0.0 |
Fertility by Age by Marriage Status in Jewett
| Age Bracket | Married | Unmarried |
| 15 to 19 years | 0 (0.0%) | 0 (0.0%) |
| 20 to 34 years | 0 (0.0%) | 0 (0.0%) |
| 35 to 50 years | 0 (0.0%) | 0 (0.0%) |
| Total | 0 (0.0%) | 0 (0.0%) |
Fertility by Education in Jewett
| Educational Attainment | Women with Births | Births / 1,000 Women |
| Less than High School | 0 (0.0%) | 0.0 |
| High School Diploma | 0 (0.0%) | 0.0 |
| College or Associate's Degree | 0 (0.0%) | 0.0 |
| Bachelor's Degree | 0 (0.0%) | 0.0 |
| Graduate Degree | 0 (0.0%) | 0.0 |
| Total | 0 (0.0%) | 0.0 |
Fertility by Education by Marriage Status in Jewett
| Educational Attainment | Married | Unmarried |
| Less than High School | 0 (0.0%) | 0 (0.0%) |
| High School Diploma | 0 (0.0%) | 0 (0.0%) |
| College or Associate's Degree | 0 (0.0%) | 0 (0.0%) |
| Bachelor's Degree | 0 (0.0%) | 0 (0.0%) |
| Graduate Degree | 0 (0.0%) | 0 (0.0%) |
| Total | 0 (0.0%) | 0 (0.0%) |
Employment Characteristics in Jewett
Employment by Class of Employer in Jewett
Among the 228 employed individuals in Jewett, private company employees (164 | 71.9%), self-employed (not incorporated) (22 | 9.7%), and not-for-profit organizations (20 | 8.8%) make up the most common classes of employment.
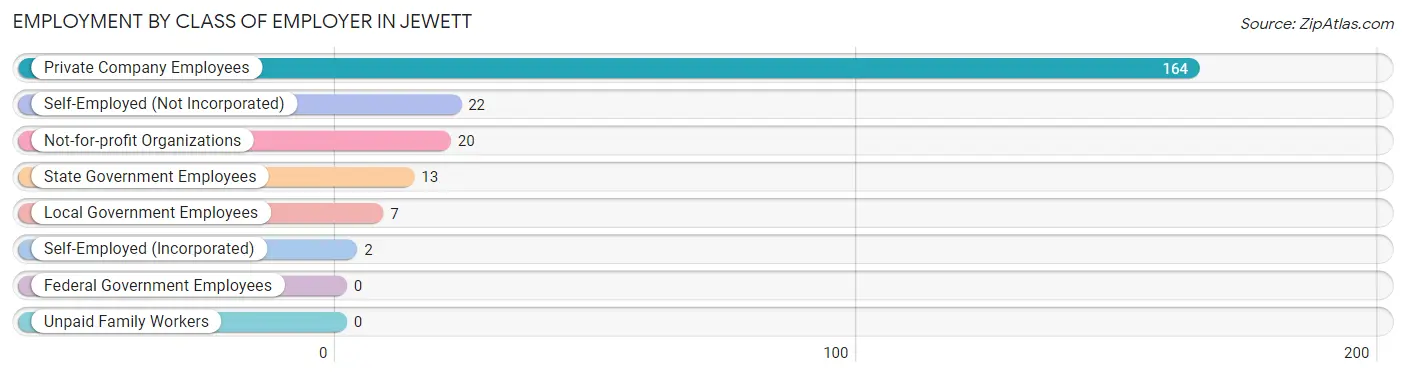
| Employer Class | # Employees | % Employees |
| Private Company Employees | 164 | 71.9% |
| Self-Employed (Incorporated) | 2 | 0.9% |
| Self-Employed (Not Incorporated) | 22 | 9.7% |
| Not-for-profit Organizations | 20 | 8.8% |
| Local Government Employees | 7 | 3.1% |
| State Government Employees | 13 | 5.7% |
| Federal Government Employees | 0 | 0.0% |
| Unpaid Family Workers | 0 | 0.0% |
| Total | 228 | 100.0% |
Employment Status by Age in Jewett
According to the labor force statistics for Jewett, out of the total population over 16 years of age (485), 53.0% or 257 individuals are in the labor force, with 11.3% or 29 of them unemployed. The age group with the highest labor force participation rate is 30 to 34 years, with 100.0% or 9 individuals in the labor force. Within the labor force, the 55 to 59 years age range has the highest percentage of unemployed individuals, with 77.8% or 14 of them being unemployed.
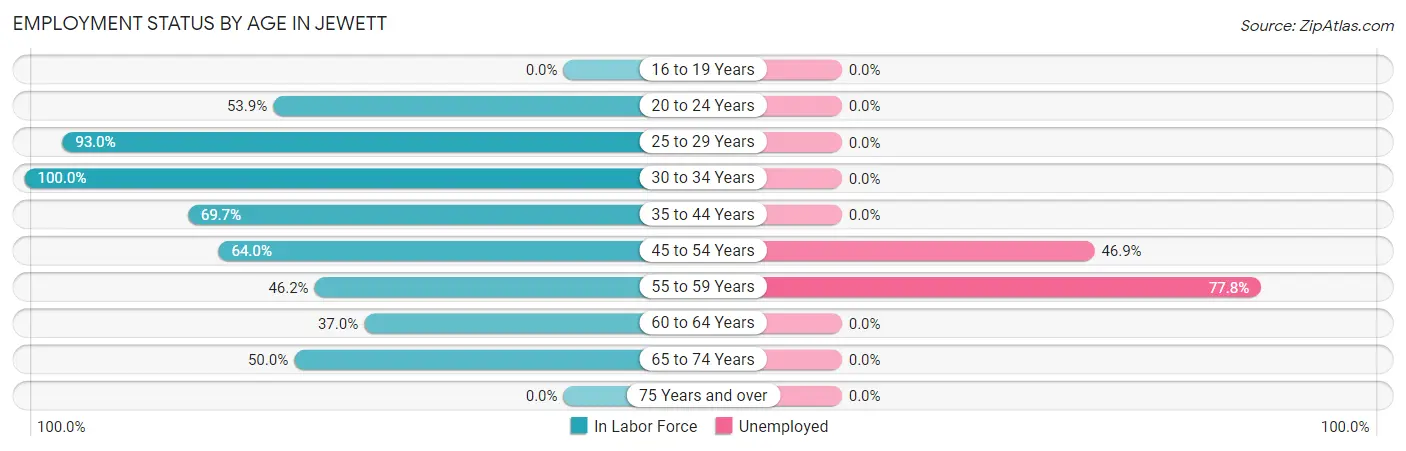
| Age Bracket | In Labor Force | Unemployed |
| 16 to 19 Years | 0 (0.0%) | 0 (0.0%) |
| 20 to 24 Years | 55 (53.9%) | 0 (0.0%) |
| 25 to 29 Years | 40 (93.0%) | 0 (0.0%) |
| 30 to 34 Years | 9 (100.0%) | 0 (0.0%) |
| 35 to 44 Years | 69 (69.7%) | 0 (0.0%) |
| 45 to 54 Years | 32 (64.0%) | 15 (46.9%) |
| 55 to 59 Years | 18 (46.2%) | 14 (77.8%) |
| 60 to 64 Years | 20 (37.0%) | 0 (0.0%) |
| 65 to 74 Years | 14 (50.0%) | 0 (0.0%) |
| 75 Years and over | 0 (0.0%) | 0 (0.0%) |
| Total | 257 (53.0%) | 29 (11.3%) |
Employment Status by Educational Attainment in Jewett
According to labor force statistics for Jewett, 63.9% of individuals (188) out of the total population between 25 and 64 years of age (294) are in the labor force, with 15.4% or 29 of them being unemployed. The group with the highest labor force participation rate are those with the educational attainment of bachelor's degree or higher, with 100.0% or 14 individuals in the labor force. Within the labor force, individuals with bachelor's degree or higher education have the highest percentage of unemployment, with 100.0% or 14 of them being unemployed.
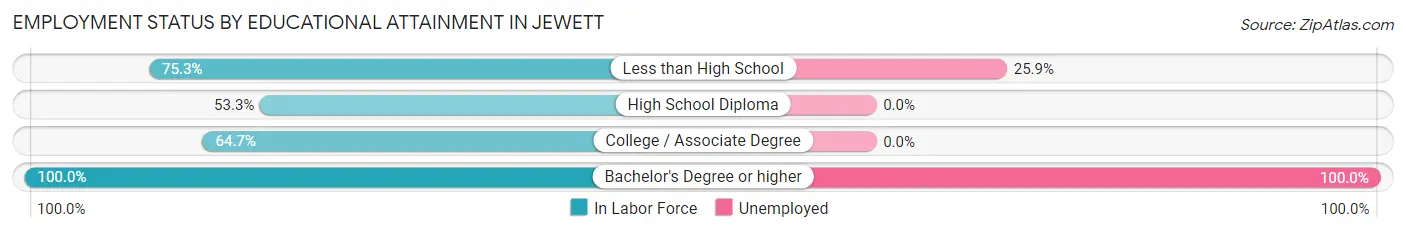
| Educational Attainment | In Labor Force | Unemployed |
| Less than High School | 58 (75.3%) | 20 (25.9%) |
| High School Diploma | 72 (53.3%) | 0 (0.0%) |
| College / Associate Degree | 44 (64.7%) | 0 (0.0%) |
| Bachelor's Degree or higher | 14 (100.0%) | 14 (100.0%) |
| Total | 188 (63.9%) | 45 (15.4%) |
Employment Occupations by Sex in Jewett
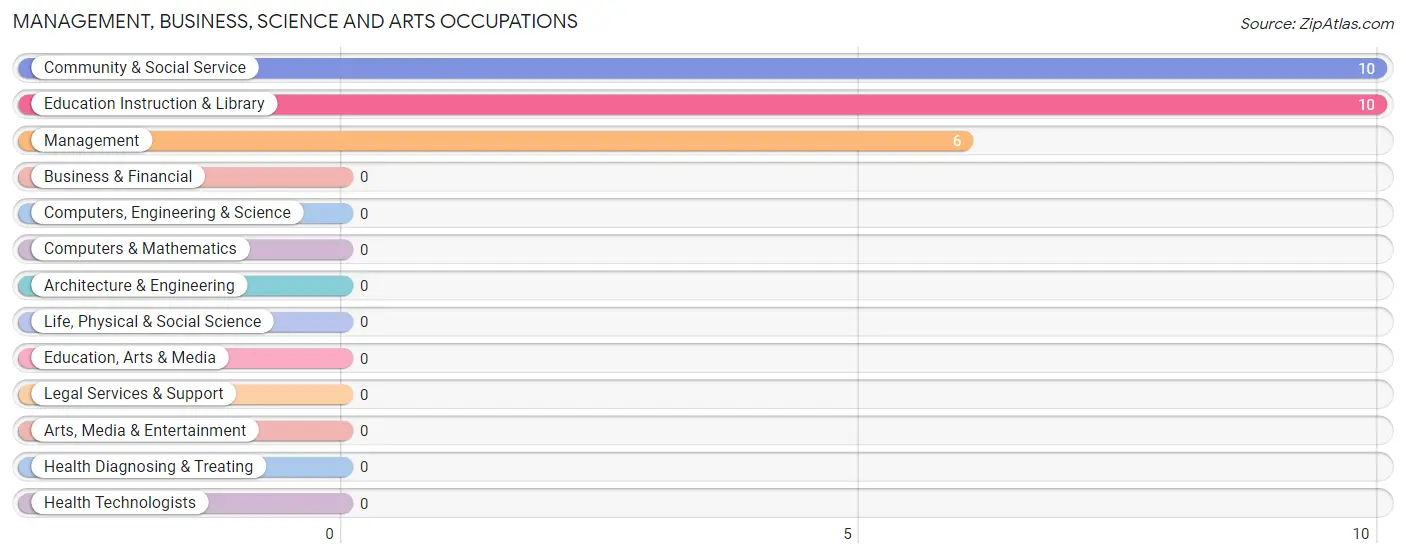
Management, Business, Science and Arts Occupations
The most common Management, Business, Science and Arts occupations in Jewett are Community & Social Service (10 | 4.4%), Education Instruction & Library (10 | 4.4%), and Management (6 | 2.6%).
Management, Business, Science and Arts Occupations by Sex
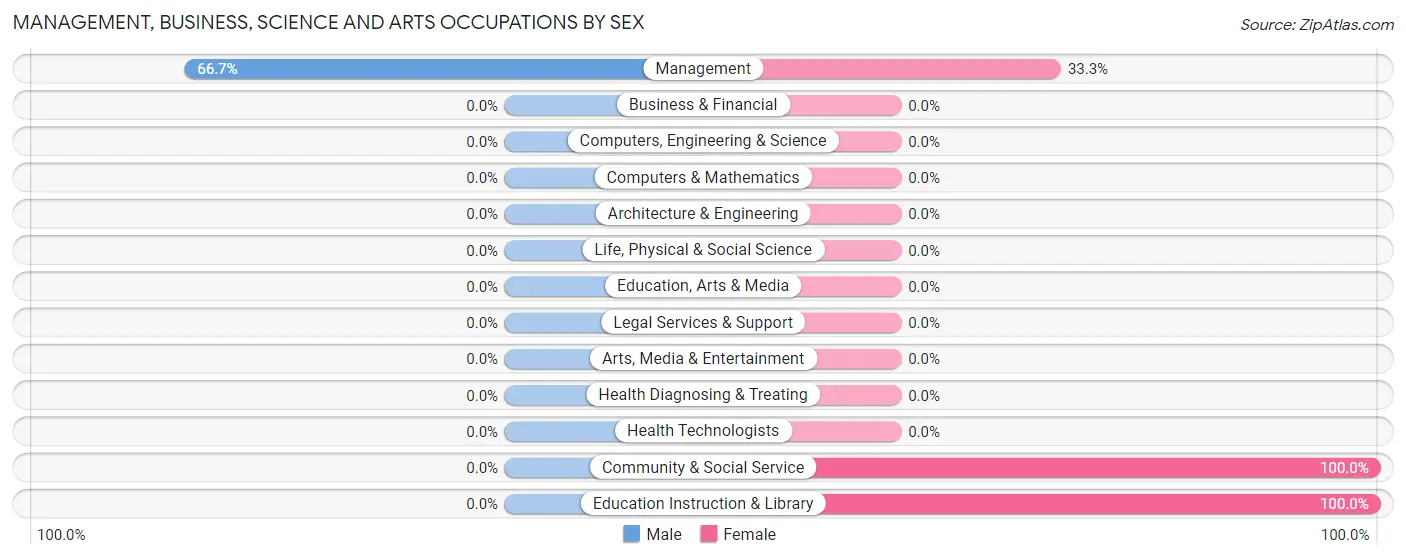
| Occupation | Male | Female |
| Management | 4 (66.7%) | 2 (33.3%) |
| Business & Financial | 0 (0.0%) | 0 (0.0%) |
| Computers, Engineering & Science | 0 (0.0%) | 0 (0.0%) |
| Computers & Mathematics | 0 (0.0%) | 0 (0.0%) |
| Architecture & Engineering | 0 (0.0%) | 0 (0.0%) |
| Life, Physical & Social Science | 0 (0.0%) | 0 (0.0%) |
| Community & Social Service | 0 (0.0%) | 10 (100.0%) |
| Education, Arts & Media | 0 (0.0%) | 0 (0.0%) |
| Legal Services & Support | 0 (0.0%) | 0 (0.0%) |
| Education Instruction & Library | 0 (0.0%) | 10 (100.0%) |
| Arts, Media & Entertainment | 0 (0.0%) | 0 (0.0%) |
| Health Diagnosing & Treating | 0 (0.0%) | 0 (0.0%) |
| Health Technologists | 0 (0.0%) | 0 (0.0%) |
| Total (Category) | 4 (25.0%) | 12 (75.0%) |
| Total (Overall) | 142 (62.3%) | 86 (37.7%) |
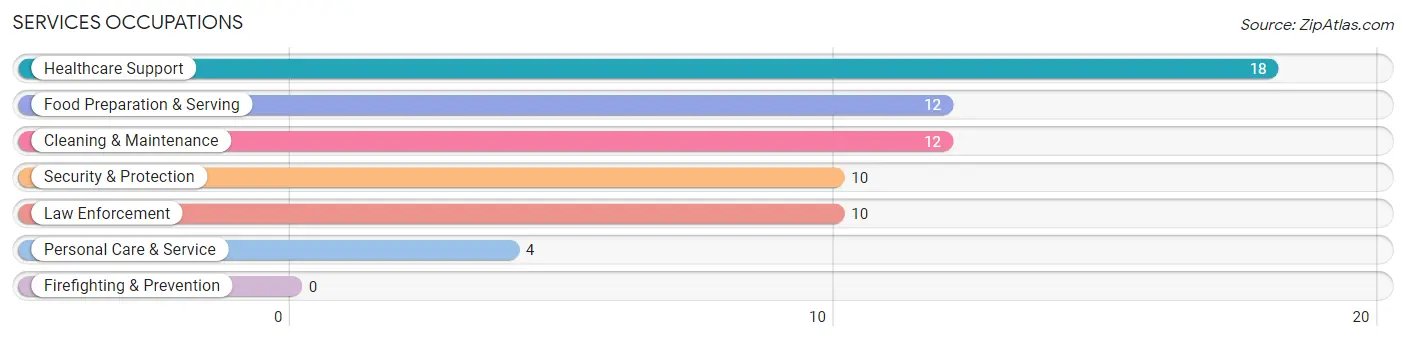
Services Occupations
The most common Services occupations in Jewett are Healthcare Support (18 | 7.9%), Food Preparation & Serving (12 | 5.3%), Cleaning & Maintenance (12 | 5.3%), Security & Protection (10 | 4.4%), and Law Enforcement (10 | 4.4%).
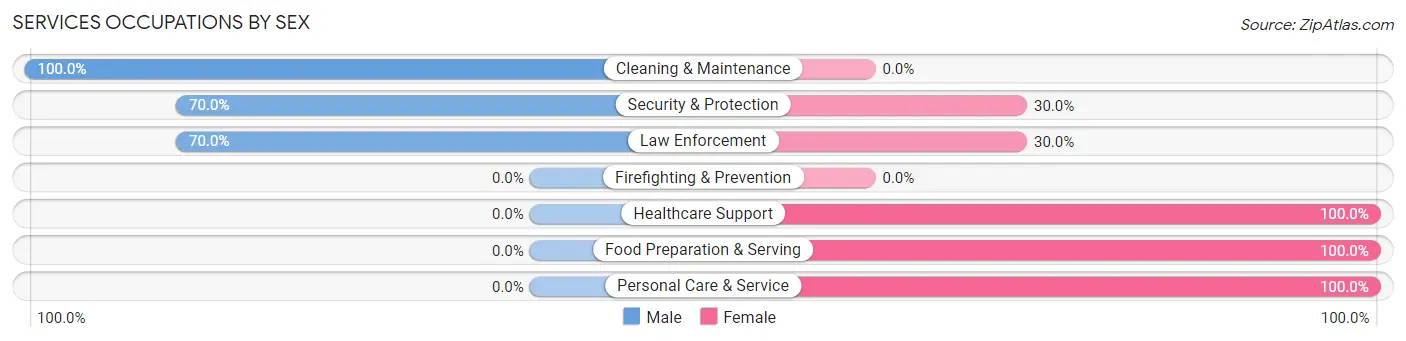
Services Occupations by Sex
Within the Services occupations in Jewett, the most male-oriented occupations are Cleaning & Maintenance (100.0%), Security & Protection (70.0%), and Law Enforcement (70.0%), while the most female-oriented occupations are Healthcare Support (100.0%), Food Preparation & Serving (100.0%), and Personal Care & Service (100.0%).
| Occupation | Male | Female |
| Healthcare Support | 0 (0.0%) | 18 (100.0%) |
| Security & Protection | 7 (70.0%) | 3 (30.0%) |
| Firefighting & Prevention | 0 (0.0%) | 0 (0.0%) |
| Law Enforcement | 7 (70.0%) | 3 (30.0%) |
| Food Preparation & Serving | 0 (0.0%) | 12 (100.0%) |
| Cleaning & Maintenance | 12 (100.0%) | 0 (0.0%) |
| Personal Care & Service | 0 (0.0%) | 4 (100.0%) |
| Total (Category) | 19 (33.9%) | 37 (66.1%) |
| Total (Overall) | 142 (62.3%) | 86 (37.7%) |
Sales and Office Occupations
The most common Sales and Office occupations in Jewett are Office & Administration (20 | 8.8%), and Sales & Related (17 | 7.5%).
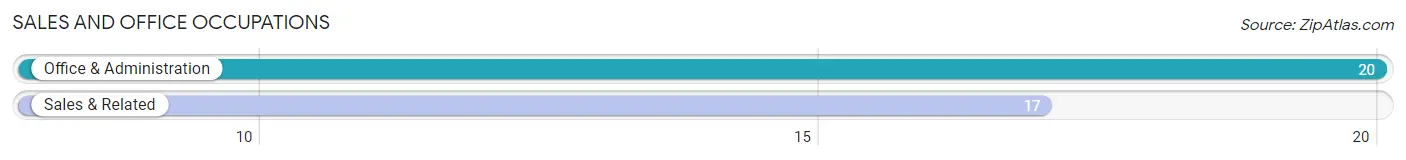
Sales and Office Occupations by Sex
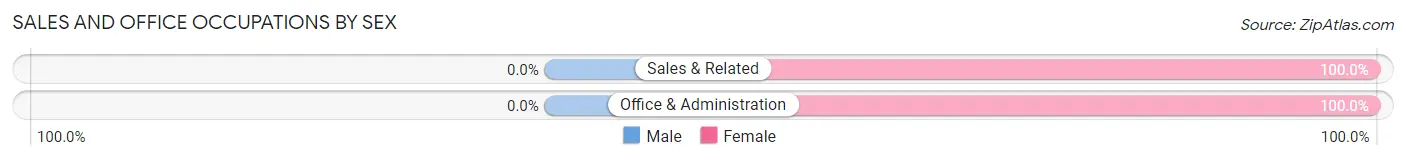
| Occupation | Male | Female |
| Sales & Related | 0 (0.0%) | 17 (100.0%) |
| Office & Administration | 0 (0.0%) | 20 (100.0%) |
| Total (Category) | 0 (0.0%) | 37 (100.0%) |
| Total (Overall) | 142 (62.3%) | 86 (37.7%) |
Natural Resources, Construction and Maintenance Occupations
The most common Natural Resources, Construction and Maintenance occupations in Jewett are , and Construction & Extraction (52 | 22.8%).
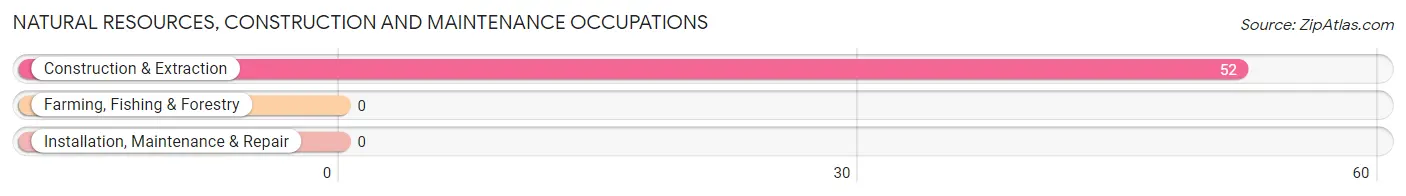
Natural Resources, Construction and Maintenance Occupations by Sex
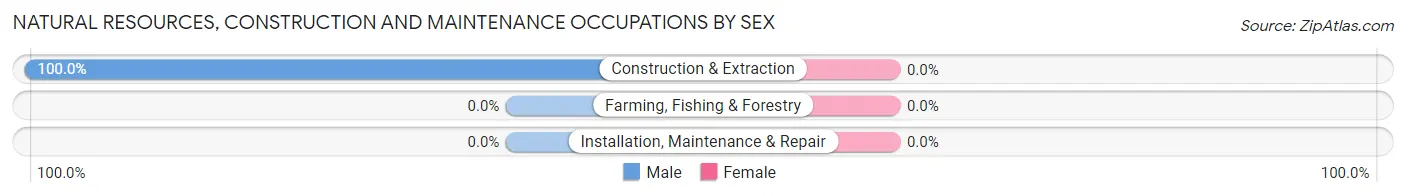
| Occupation | Male | Female |
| Farming, Fishing & Forestry | 0 (0.0%) | 0 (0.0%) |
| Construction & Extraction | 52 (100.0%) | 0 (0.0%) |
| Installation, Maintenance & Repair | 0 (0.0%) | 0 (0.0%) |
| Total (Category) | 52 (100.0%) | 0 (0.0%) |
| Total (Overall) | 142 (62.3%) | 86 (37.7%) |
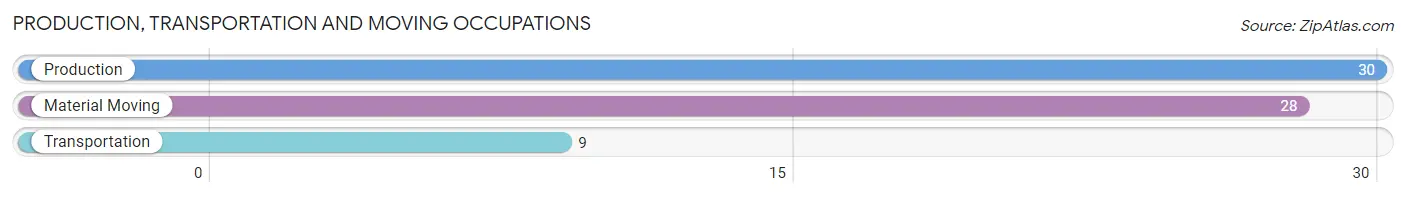
Production, Transportation and Moving Occupations
The most common Production, Transportation and Moving occupations in Jewett are Production (30 | 13.2%), Material Moving (28 | 12.3%), and Transportation (9 | 4.0%).
Production, Transportation and Moving Occupations by Sex
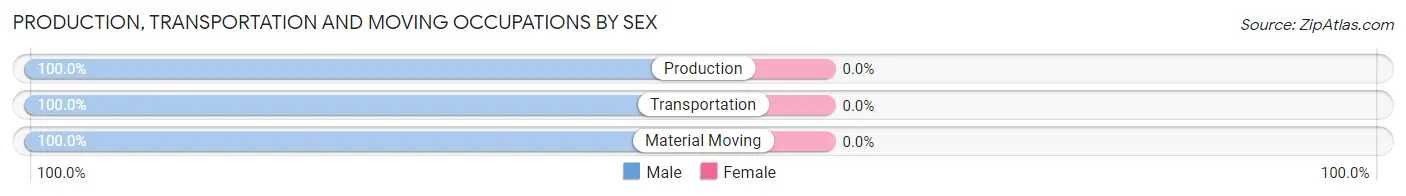
| Occupation | Male | Female |
| Production | 30 (100.0%) | 0 (0.0%) |
| Transportation | 9 (100.0%) | 0 (0.0%) |
| Material Moving | 28 (100.0%) | 0 (0.0%) |
| Total (Category) | 67 (100.0%) | 0 (0.0%) |
| Total (Overall) | 142 (62.3%) | 86 (37.7%) |
Employment Industries by Sex in Jewett
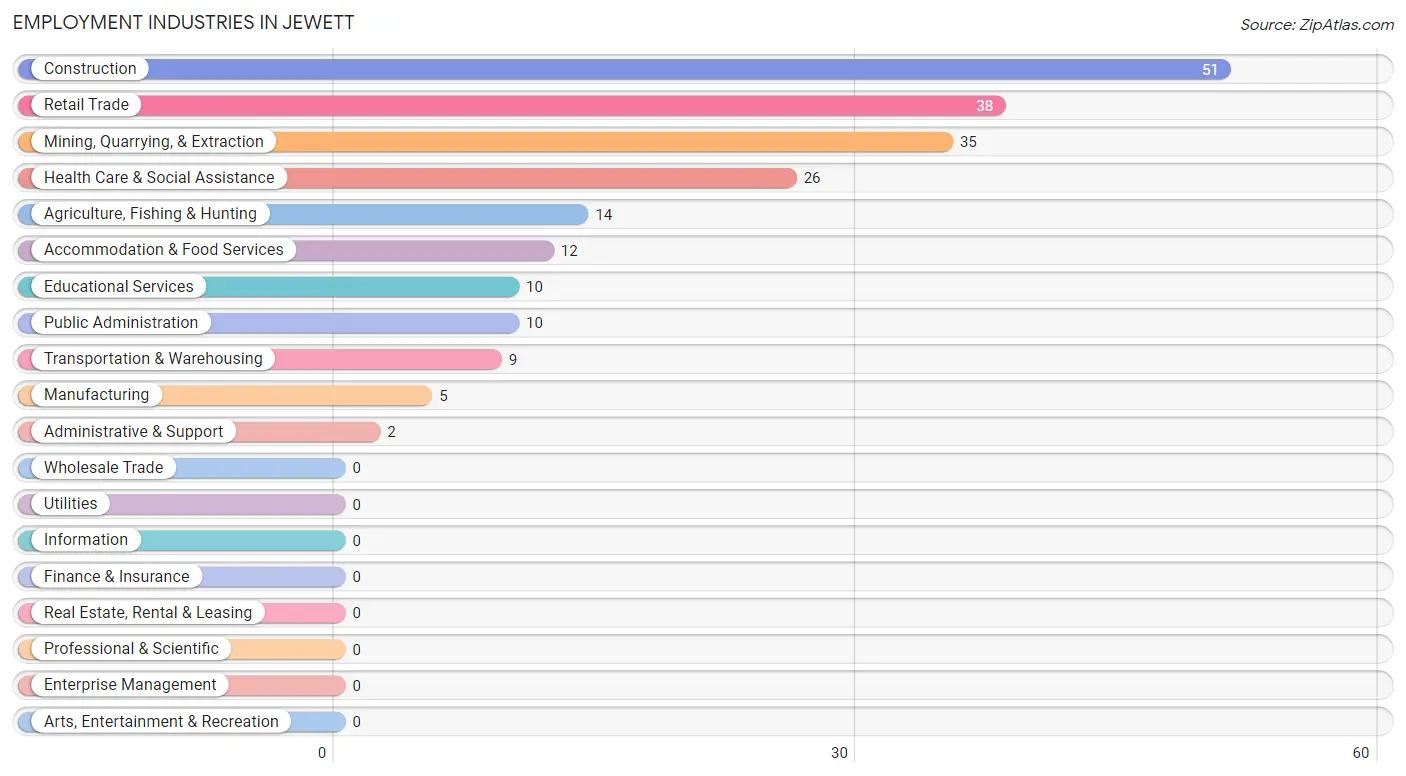
Employment Industries in Jewett
The major employment industries in Jewett include Construction (51 | 22.4%), Retail Trade (38 | 16.7%), Mining, Quarrying, & Extraction (35 | 15.3%), Health Care & Social Assistance (26 | 11.4%), and Agriculture, Fishing & Hunting (14 | 6.1%).
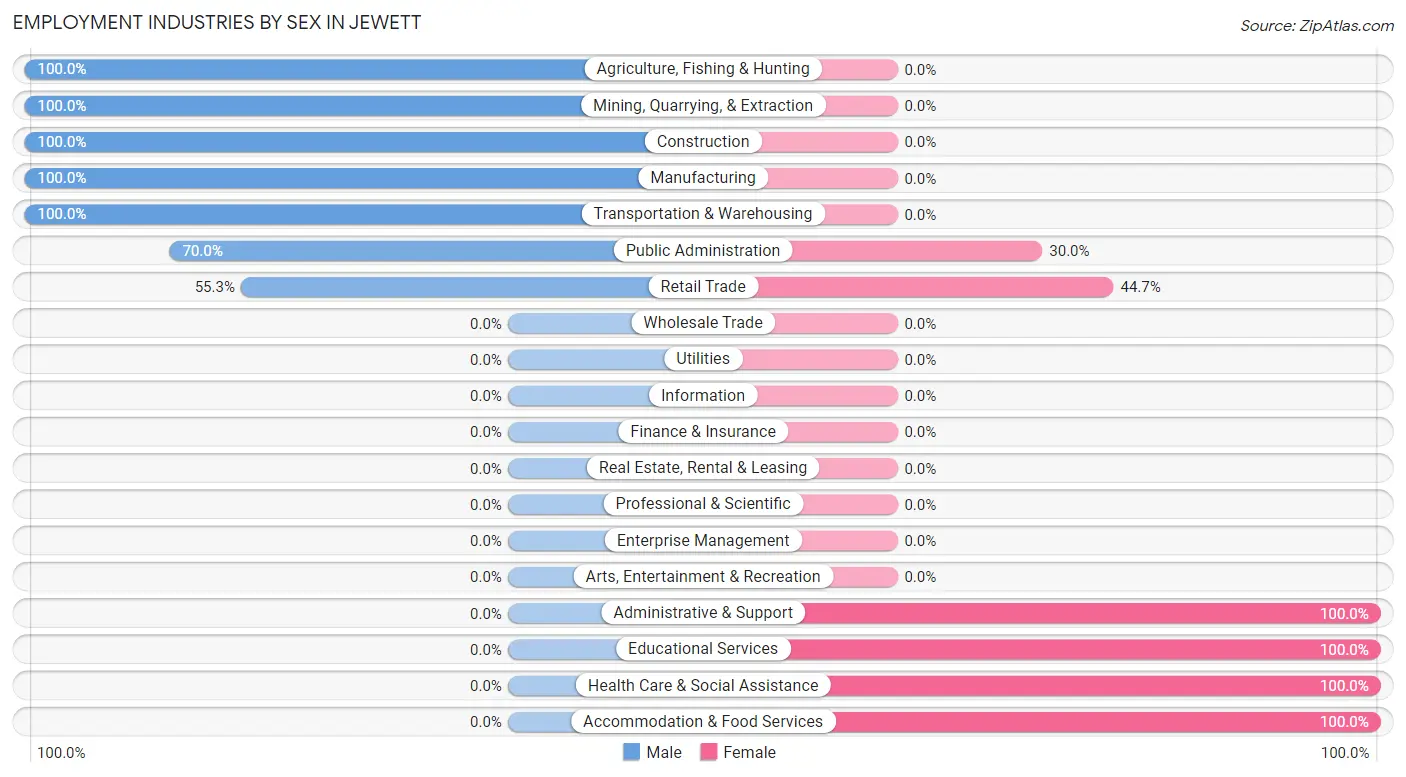
Employment Industries by Sex in Jewett
The Jewett industries that see more men than women are Agriculture, Fishing & Hunting (100.0%), Mining, Quarrying, & Extraction (100.0%), and Construction (100.0%), whereas the industries that tend to have a higher number of women are Administrative & Support (100.0%), Educational Services (100.0%), and Health Care & Social Assistance (100.0%).
| Industry | Male | Female |
| Agriculture, Fishing & Hunting | 14 (100.0%) | 0 (0.0%) |
| Mining, Quarrying, & Extraction | 35 (100.0%) | 0 (0.0%) |
| Construction | 51 (100.0%) | 0 (0.0%) |
| Manufacturing | 5 (100.0%) | 0 (0.0%) |
| Wholesale Trade | 0 (0.0%) | 0 (0.0%) |
| Retail Trade | 21 (55.3%) | 17 (44.7%) |
| Transportation & Warehousing | 9 (100.0%) | 0 (0.0%) |
| Utilities | 0 (0.0%) | 0 (0.0%) |
| Information | 0 (0.0%) | 0 (0.0%) |
| Finance & Insurance | 0 (0.0%) | 0 (0.0%) |
| Real Estate, Rental & Leasing | 0 (0.0%) | 0 (0.0%) |
| Professional & Scientific | 0 (0.0%) | 0 (0.0%) |
| Enterprise Management | 0 (0.0%) | 0 (0.0%) |
| Administrative & Support | 0 (0.0%) | 2 (100.0%) |
| Educational Services | 0 (0.0%) | 10 (100.0%) |
| Health Care & Social Assistance | 0 (0.0%) | 26 (100.0%) |
| Arts, Entertainment & Recreation | 0 (0.0%) | 0 (0.0%) |
| Accommodation & Food Services | 0 (0.0%) | 12 (100.0%) |
| Public Administration | 7 (70.0%) | 3 (30.0%) |
| Total | 142 (62.3%) | 86 (37.7%) |
Education in Jewett
School Enrollment in Jewett
The most common levels of schooling among the 165 students in Jewett are high school (61 | 37.0%), elementary school (39 | 23.6%), and middle school (24 | 14.5%).
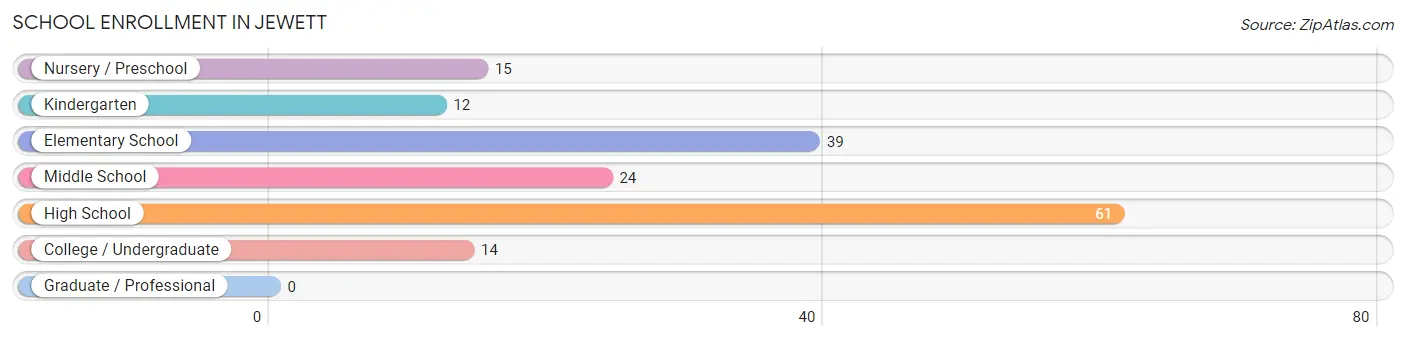
| School Level | # Students | % Students |
| Nursery / Preschool | 15 | 9.1% |
| Kindergarten | 12 | 7.3% |
| Elementary School | 39 | 23.6% |
| Middle School | 24 | 14.5% |
| High School | 61 | 37.0% |
| College / Undergraduate | 14 | 8.5% |
| Graduate / Professional | 0 | 0.0% |
| Total | 165 | 100.0% |
School Enrollment by Age by Funding Source in Jewett
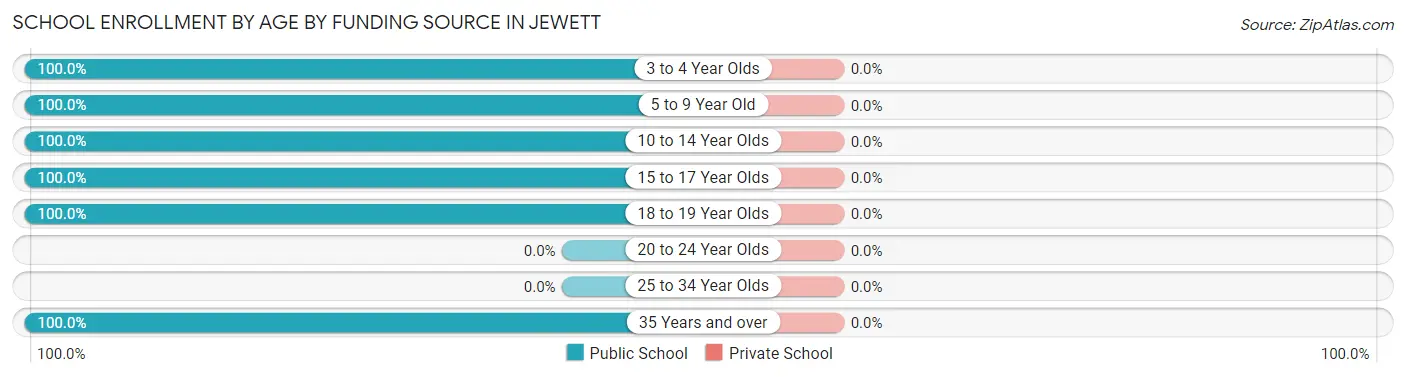
| Age Bracket | Public School | Private School |
| 3 to 4 Year Olds | 15 (100.0%) | 0 (0.0%) |
| 5 to 9 Year Old | 41 (100.0%) | 0 (0.0%) |
| 10 to 14 Year Olds | 43 (100.0%) | 0 (0.0%) |
| 15 to 17 Year Olds | 52 (100.0%) | 0 (0.0%) |
| 18 to 19 Year Olds | 11 (100.0%) | 0 (0.0%) |
| 20 to 24 Year Olds | 0 (0.0%) | 0 (0.0%) |
| 25 to 34 Year Olds | 0 (0.0%) | 0 (0.0%) |
| 35 Years and over | 3 (100.0%) | 0 (0.0%) |
| Total | 165 (100.0%) | 0 (0.0%) |
Educational Attainment by Field of Study in Jewett
Arts & humanities (14 | 60.9%), education (7 | 30.4%), and business (2 | 8.7%) are the most common fields of study among 23 individuals in Jewett who have obtained a bachelor's degree or higher.
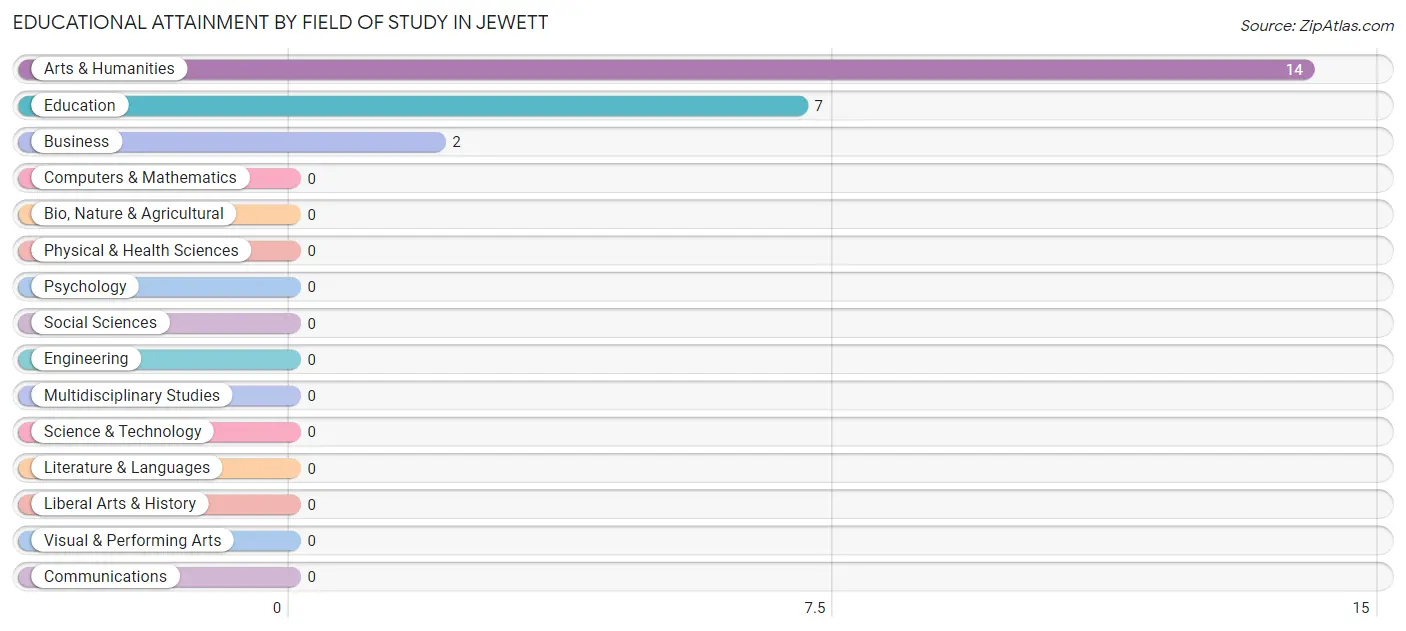
| Field of Study | # Graduates | % Graduates |
| Computers & Mathematics | 0 | 0.0% |
| Bio, Nature & Agricultural | 0 | 0.0% |
| Physical & Health Sciences | 0 | 0.0% |
| Psychology | 0 | 0.0% |
| Social Sciences | 0 | 0.0% |
| Engineering | 0 | 0.0% |
| Multidisciplinary Studies | 0 | 0.0% |
| Science & Technology | 0 | 0.0% |
| Business | 2 | 8.7% |
| Education | 7 | 30.4% |
| Literature & Languages | 0 | 0.0% |
| Liberal Arts & History | 0 | 0.0% |
| Visual & Performing Arts | 0 | 0.0% |
| Communications | 0 | 0.0% |
| Arts & Humanities | 14 | 60.9% |
| Total | 23 | 100.0% |
Transportation & Commute in Jewett
Vehicle Availability by Sex in Jewett
The most prevalent vehicle ownership categories in Jewett are males with 3 vehicles (49, accounting for 35.2%) and females with 3 vehicles (28, making up 57.0%).
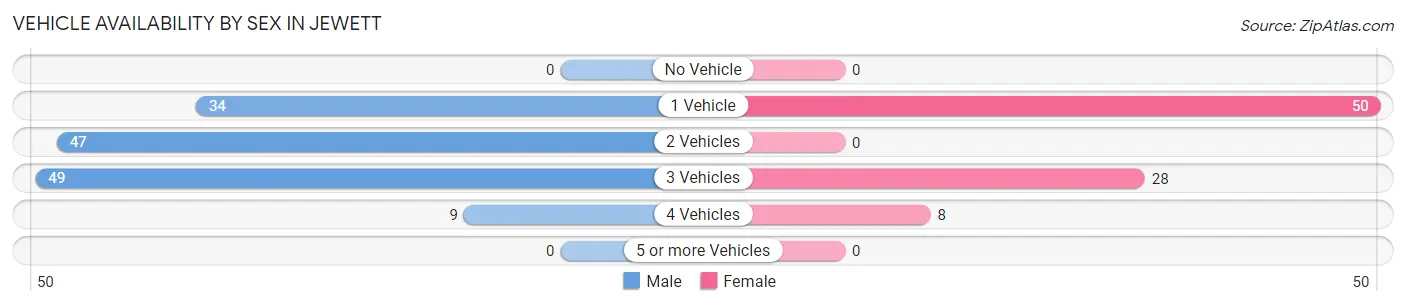
| Vehicles Available | Male | Female |
| No Vehicle | 0 (0.0%) | 0 (0.0%) |
| 1 Vehicle | 34 (24.5%) | 50 (58.1%) |
| 2 Vehicles | 47 (33.8%) | 0 (0.0%) |
| 3 Vehicles | 49 (35.2%) | 28 (32.6%) |
| 4 Vehicles | 9 (6.5%) | 8 (9.3%) |
| 5 or more Vehicles | 0 (0.0%) | 0 (0.0%) |
| Total | 139 (100.0%) | 86 (100.0%) |
Commute Time in Jewett
The most frequently occuring commute durations in Jewett are 5 to 9 minutes (63 commuters, 28.1%), 10 to 14 minutes (36 commuters, 16.1%), and 15 to 19 minutes (20 commuters, 8.9%).
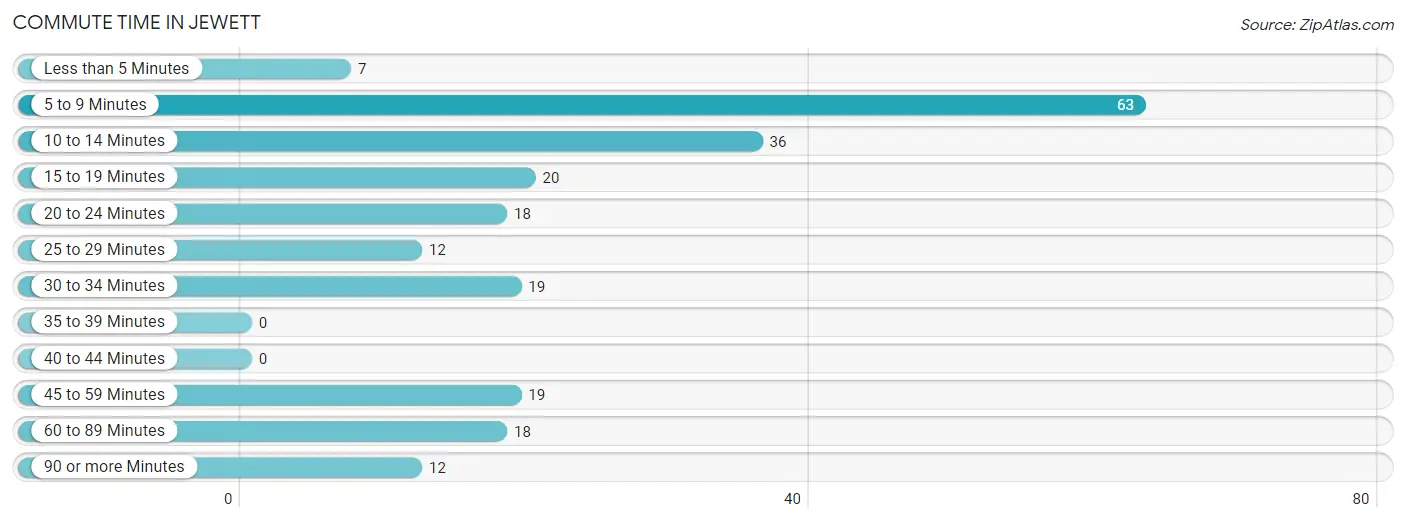
| Commute Time | # Commuters | % Commuters |
| Less than 5 Minutes | 7 | 3.1% |
| 5 to 9 Minutes | 63 | 28.1% |
| 10 to 14 Minutes | 36 | 16.1% |
| 15 to 19 Minutes | 20 | 8.9% |
| 20 to 24 Minutes | 18 | 8.0% |
| 25 to 29 Minutes | 12 | 5.4% |
| 30 to 34 Minutes | 19 | 8.5% |
| 35 to 39 Minutes | 0 | 0.0% |
| 40 to 44 Minutes | 0 | 0.0% |
| 45 to 59 Minutes | 19 | 8.5% |
| 60 to 89 Minutes | 18 | 8.0% |
| 90 or more Minutes | 12 | 5.4% |
Commute Time by Sex in Jewett
The most common commute times in Jewett are 5 to 9 minutes (46 commuters, 32.4%) for males and 10 to 14 minutes (36 commuters, 43.9%) for females.
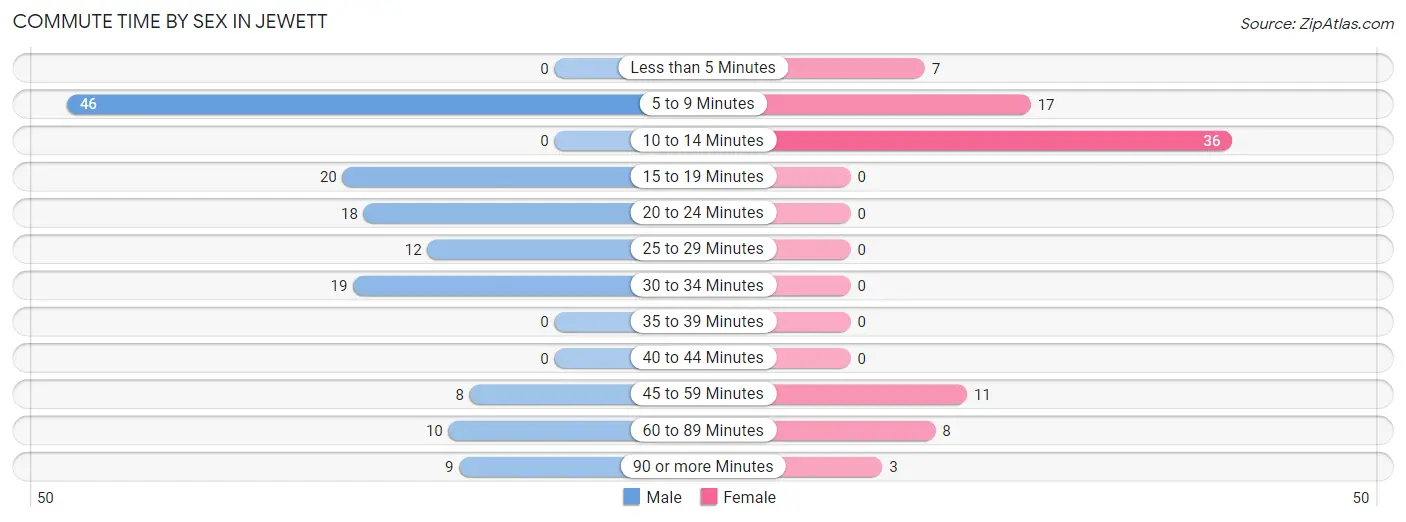
| Commute Time | Male | Female |
| Less than 5 Minutes | 0 (0.0%) | 7 (8.5%) |
| 5 to 9 Minutes | 46 (32.4%) | 17 (20.7%) |
| 10 to 14 Minutes | 0 (0.0%) | 36 (43.9%) |
| 15 to 19 Minutes | 20 (14.1%) | 0 (0.0%) |
| 20 to 24 Minutes | 18 (12.7%) | 0 (0.0%) |
| 25 to 29 Minutes | 12 (8.5%) | 0 (0.0%) |
| 30 to 34 Minutes | 19 (13.4%) | 0 (0.0%) |
| 35 to 39 Minutes | 0 (0.0%) | 0 (0.0%) |
| 40 to 44 Minutes | 0 (0.0%) | 0 (0.0%) |
| 45 to 59 Minutes | 8 (5.6%) | 11 (13.4%) |
| 60 to 89 Minutes | 10 (7.0%) | 8 (9.8%) |
| 90 or more Minutes | 9 (6.3%) | 3 (3.7%) |
Time of Departure to Work by Sex in Jewett
The most frequent times of departure to work in Jewett are 12:00 AM to 4:59 AM (30, 21.1%) for males and 12:00 PM to 3:59 PM (24, 29.3%) for females.
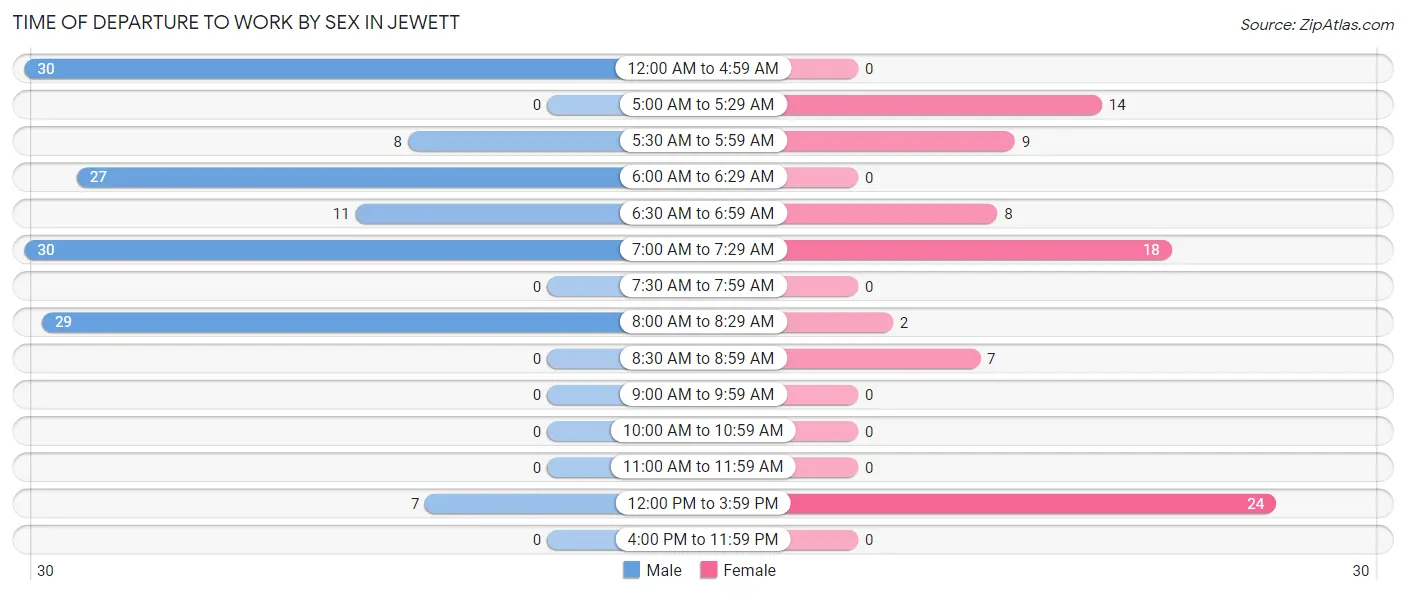
| Time of Departure | Male | Female |
| 12:00 AM to 4:59 AM | 30 (21.1%) | 0 (0.0%) |
| 5:00 AM to 5:29 AM | 0 (0.0%) | 14 (17.1%) |
| 5:30 AM to 5:59 AM | 8 (5.6%) | 9 (11.0%) |
| 6:00 AM to 6:29 AM | 27 (19.0%) | 0 (0.0%) |
| 6:30 AM to 6:59 AM | 11 (7.7%) | 8 (9.8%) |
| 7:00 AM to 7:29 AM | 30 (21.1%) | 18 (22.0%) |
| 7:30 AM to 7:59 AM | 0 (0.0%) | 0 (0.0%) |
| 8:00 AM to 8:29 AM | 29 (20.4%) | 2 (2.4%) |
| 8:30 AM to 8:59 AM | 0 (0.0%) | 7 (8.5%) |
| 9:00 AM to 9:59 AM | 0 (0.0%) | 0 (0.0%) |
| 10:00 AM to 10:59 AM | 0 (0.0%) | 0 (0.0%) |
| 11:00 AM to 11:59 AM | 0 (0.0%) | 0 (0.0%) |
| 12:00 PM to 3:59 PM | 7 (4.9%) | 24 (29.3%) |
| 4:00 PM to 11:59 PM | 0 (0.0%) | 0 (0.0%) |
| Total | 142 (100.0%) | 82 (100.0%) |
Housing Occupancy in Jewett
Occupancy by Ownership in Jewett
Of the total 245 dwellings in Jewett, owner-occupied units account for 156 (63.7%), while renter-occupied units make up 89 (36.3%).
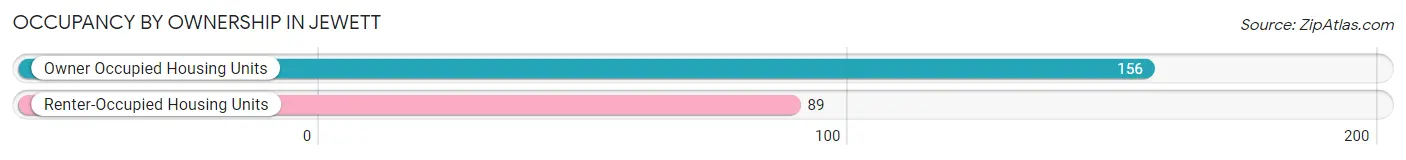
| Occupancy | # Housing Units | % Housing Units |
| Owner Occupied Housing Units | 156 | 63.7% |
| Renter-Occupied Housing Units | 89 | 36.3% |
| Total Occupied Housing Units | 245 | 100.0% |
Occupancy by Household Size in Jewett
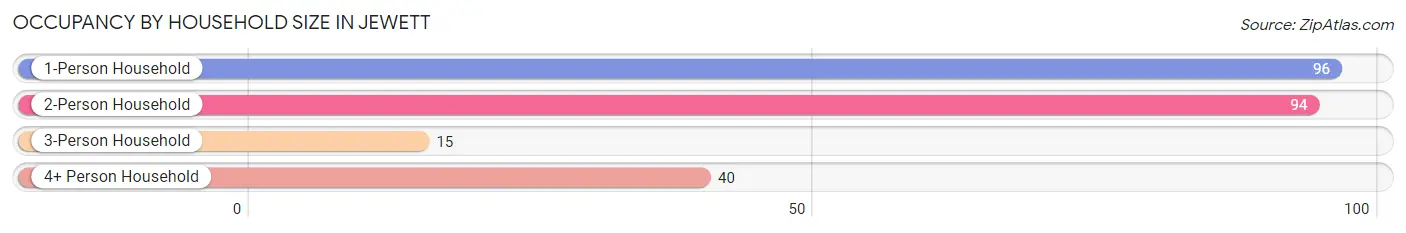
| Household Size | # Housing Units | % Housing Units |
| 1-Person Household | 96 | 39.2% |
| 2-Person Household | 94 | 38.4% |
| 3-Person Household | 15 | 6.1% |
| 4+ Person Household | 40 | 16.3% |
| Total Housing Units | 245 | 100.0% |
Occupancy by Ownership by Household Size in Jewett
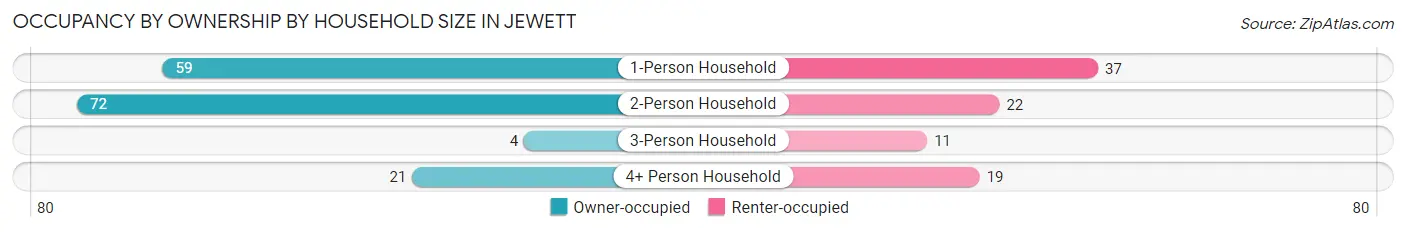
| Household Size | Owner-occupied | Renter-occupied |
| 1-Person Household | 59 (61.5%) | 37 (38.5%) |
| 2-Person Household | 72 (76.6%) | 22 (23.4%) |
| 3-Person Household | 4 (26.7%) | 11 (73.3%) |
| 4+ Person Household | 21 (52.5%) | 19 (47.5%) |
| Total Housing Units | 156 (63.7%) | 89 (36.3%) |
Occupancy by Educational Attainment in Jewett
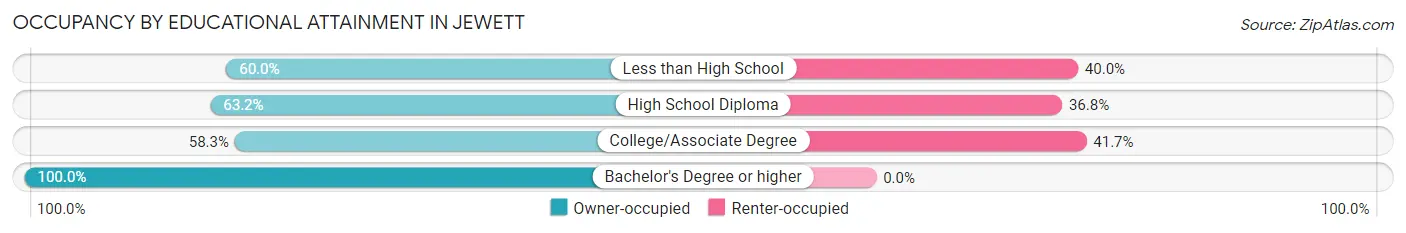
| Household Size | Owner-occupied | Renter-occupied |
| Less than High School | 21 (60.0%) | 14 (40.0%) |
| High School Diploma | 60 (63.2%) | 35 (36.8%) |
| College/Associate Degree | 56 (58.3%) | 40 (41.7%) |
| Bachelor's Degree or higher | 19 (100.0%) | 0 (0.0%) |
Occupancy by Age of Householder in Jewett
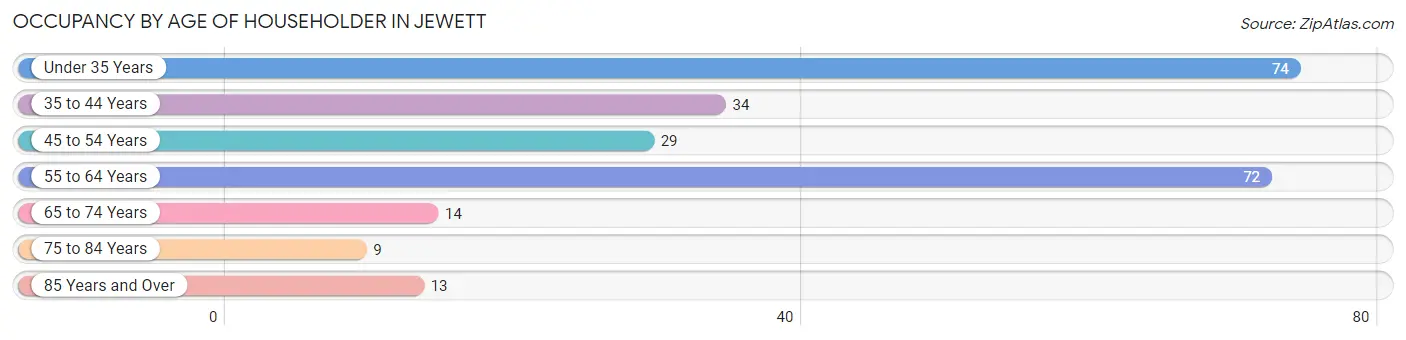
| Age Bracket | # Households | % Households |
| Under 35 Years | 74 | 30.2% |
| 35 to 44 Years | 34 | 13.9% |
| 45 to 54 Years | 29 | 11.8% |
| 55 to 64 Years | 72 | 29.4% |
| 65 to 74 Years | 14 | 5.7% |
| 75 to 84 Years | 9 | 3.7% |
| 85 Years and Over | 13 | 5.3% |
| Total | 245 | 100.0% |
Housing Finances in Jewett
Median Income by Occupancy in Jewett
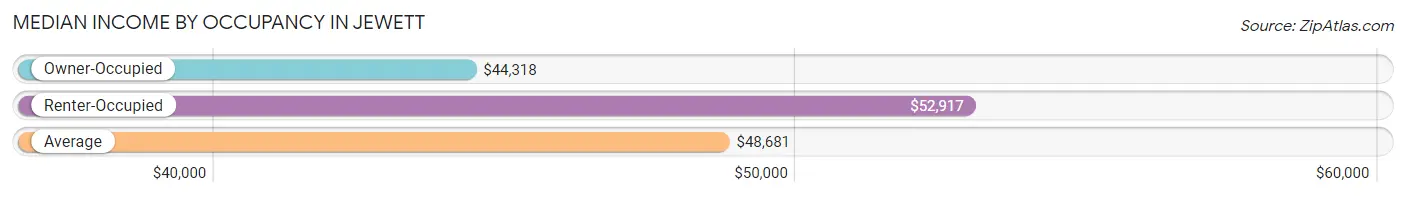
| Occupancy Type | # Households | Median Income |
| Owner-Occupied | 156 (63.7%) | $44,318 |
| Renter-Occupied | 89 (36.3%) | $52,917 |
| Average | 245 (100.0%) | $48,681 |
Occupancy by Householder Income Bracket in Jewett
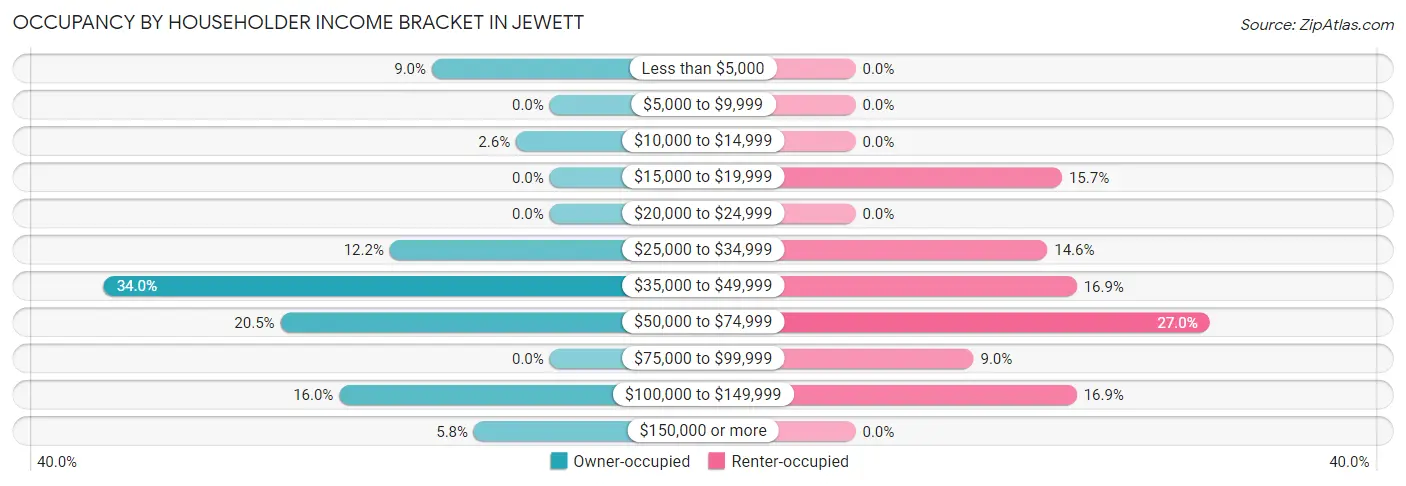
| Income Bracket | Owner-occupied | Renter-occupied |
| Less than $5,000 | 14 (9.0%) | 0 (0.0%) |
| $5,000 to $9,999 | 0 (0.0%) | 0 (0.0%) |
| $10,000 to $14,999 | 4 (2.6%) | 0 (0.0%) |
| $15,000 to $19,999 | 0 (0.0%) | 14 (15.7%) |
| $20,000 to $24,999 | 0 (0.0%) | 0 (0.0%) |
| $25,000 to $34,999 | 19 (12.2%) | 13 (14.6%) |
| $35,000 to $49,999 | 53 (34.0%) | 15 (16.9%) |
| $50,000 to $74,999 | 32 (20.5%) | 24 (27.0%) |
| $75,000 to $99,999 | 0 (0.0%) | 8 (9.0%) |
| $100,000 to $149,999 | 25 (16.0%) | 15 (16.9%) |
| $150,000 or more | 9 (5.8%) | 0 (0.0%) |
| Total | 156 (100.0%) | 89 (100.0%) |
Monthly Housing Cost Tiers in Jewett
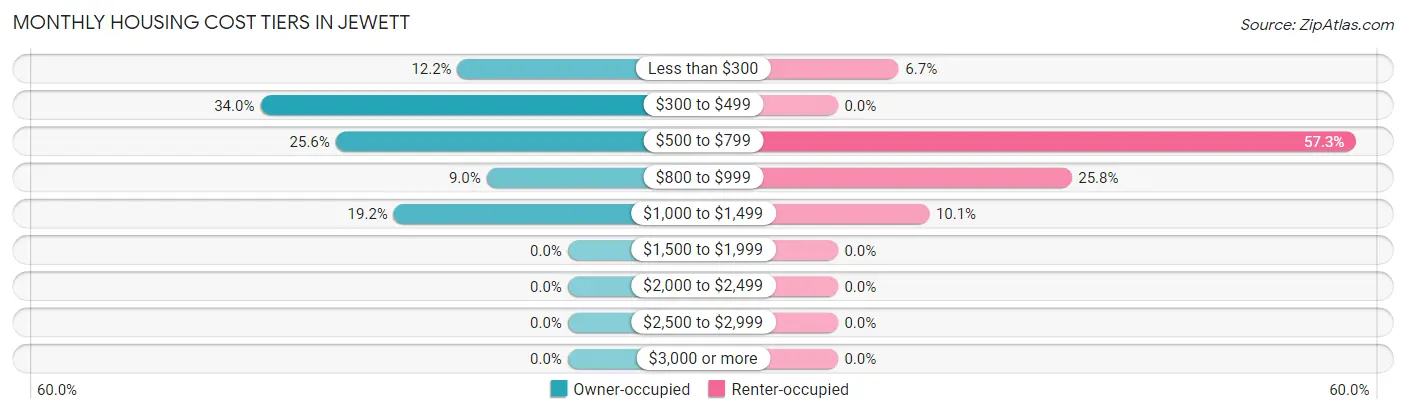
| Monthly Cost | Owner-occupied | Renter-occupied |
| Less than $300 | 19 (12.2%) | 6 (6.7%) |
| $300 to $499 | 53 (34.0%) | 0 (0.0%) |
| $500 to $799 | 40 (25.6%) | 51 (57.3%) |
| $800 to $999 | 14 (9.0%) | 23 (25.8%) |
| $1,000 to $1,499 | 30 (19.2%) | 9 (10.1%) |
| $1,500 to $1,999 | 0 (0.0%) | 0 (0.0%) |
| $2,000 to $2,499 | 0 (0.0%) | 0 (0.0%) |
| $2,500 to $2,999 | 0 (0.0%) | 0 (0.0%) |
| $3,000 or more | 0 (0.0%) | 0 (0.0%) |
| Total | 156 (100.0%) | 89 (100.0%) |
Physical Housing Characteristics in Jewett
Housing Structures in Jewett
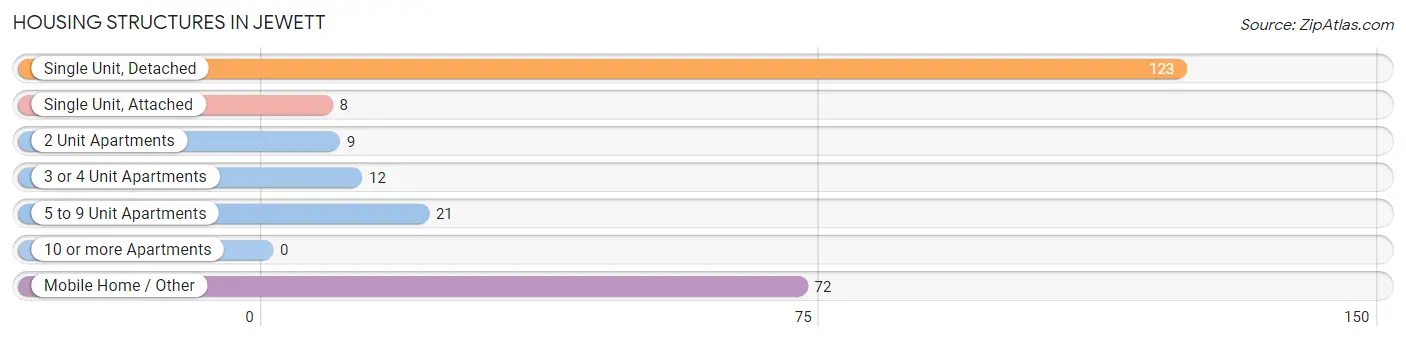
| Structure Type | # Housing Units | % Housing Units |
| Single Unit, Detached | 123 | 50.2% |
| Single Unit, Attached | 8 | 3.3% |
| 2 Unit Apartments | 9 | 3.7% |
| 3 or 4 Unit Apartments | 12 | 4.9% |
| 5 to 9 Unit Apartments | 21 | 8.6% |
| 10 or more Apartments | 0 | 0.0% |
| Mobile Home / Other | 72 | 29.4% |
| Total | 245 | 100.0% |
Housing Structures by Occupancy in Jewett
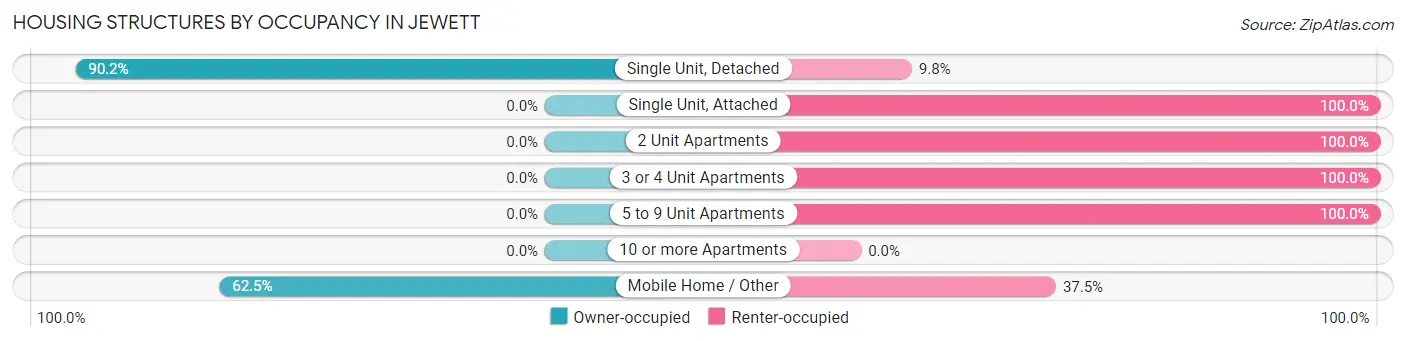
| Structure Type | Owner-occupied | Renter-occupied |
| Single Unit, Detached | 111 (90.2%) | 12 (9.8%) |
| Single Unit, Attached | 0 (0.0%) | 8 (100.0%) |
| 2 Unit Apartments | 0 (0.0%) | 9 (100.0%) |
| 3 or 4 Unit Apartments | 0 (0.0%) | 12 (100.0%) |
| 5 to 9 Unit Apartments | 0 (0.0%) | 21 (100.0%) |
| 10 or more Apartments | 0 (0.0%) | 0 (0.0%) |
| Mobile Home / Other | 45 (62.5%) | 27 (37.5%) |
| Total | 156 (63.7%) | 89 (36.3%) |
Housing Structures by Number of Rooms in Jewett
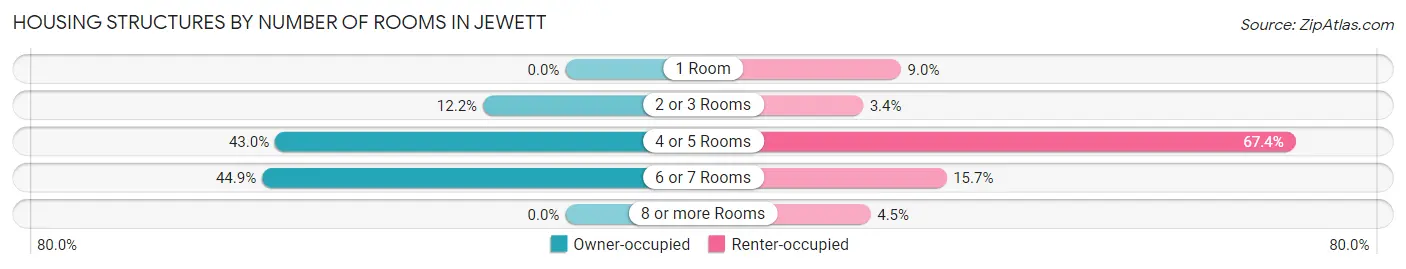
| Number of Rooms | Owner-occupied | Renter-occupied |
| 1 Room | 0 (0.0%) | 8 (9.0%) |
| 2 or 3 Rooms | 19 (12.2%) | 3 (3.4%) |
| 4 or 5 Rooms | 67 (42.9%) | 60 (67.4%) |
| 6 or 7 Rooms | 70 (44.9%) | 14 (15.7%) |
| 8 or more Rooms | 0 (0.0%) | 4 (4.5%) |
| Total | 156 (100.0%) | 89 (100.0%) |
Housing Structure by Heating Type in Jewett
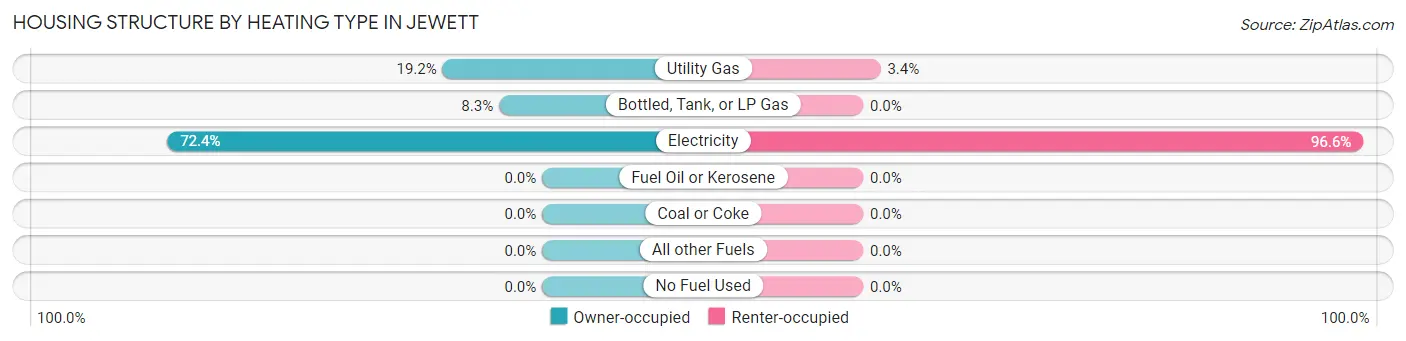
| Heating Type | Owner-occupied | Renter-occupied |
| Utility Gas | 30 (19.2%) | 3 (3.4%) |
| Bottled, Tank, or LP Gas | 13 (8.3%) | 0 (0.0%) |
| Electricity | 113 (72.4%) | 86 (96.6%) |
| Fuel Oil or Kerosene | 0 (0.0%) | 0 (0.0%) |
| Coal or Coke | 0 (0.0%) | 0 (0.0%) |
| All other Fuels | 0 (0.0%) | 0 (0.0%) |
| No Fuel Used | 0 (0.0%) | 0 (0.0%) |
| Total | 156 (100.0%) | 89 (100.0%) |
Household Vehicle Usage in Jewett
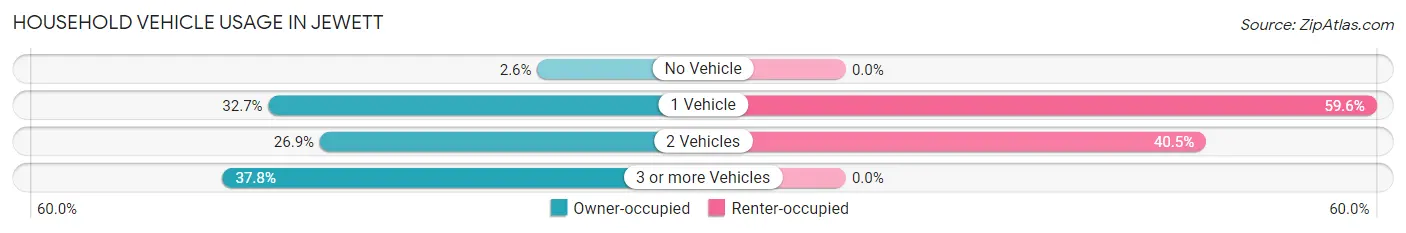
| Vehicles per Household | Owner-occupied | Renter-occupied |
| No Vehicle | 4 (2.6%) | 0 (0.0%) |
| 1 Vehicle | 51 (32.7%) | 53 (59.6%) |
| 2 Vehicles | 42 (26.9%) | 36 (40.5%) |
| 3 or more Vehicles | 59 (37.8%) | 0 (0.0%) |
| Total | 156 (100.0%) | 89 (100.0%) |
Real Estate & Mortgages in Jewett
Real Estate and Mortgage Overview in Jewett
| Characteristic | Without Mortgage | With Mortgage |
| Housing Units | 114 | 42 |
| Median Property Value | $130,000 | $159,000 |
| Median Household Income | $42,308 | $5 |
| Monthly Housing Costs | $457 | $0 |
| Real Estate Taxes | $1,083 | $0 |
Property Value by Mortgage Status in Jewett
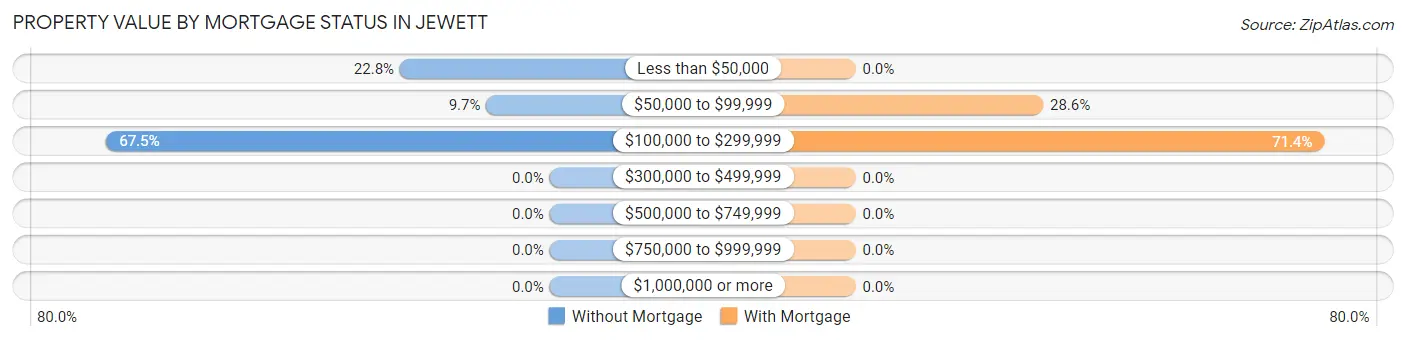
| Property Value | Without Mortgage | With Mortgage |
| Less than $50,000 | 26 (22.8%) | 0 (0.0%) |
| $50,000 to $99,999 | 11 (9.7%) | 12 (28.6%) |
| $100,000 to $299,999 | 77 (67.5%) | 30 (71.4%) |
| $300,000 to $499,999 | 0 (0.0%) | 0 (0.0%) |
| $500,000 to $749,999 | 0 (0.0%) | 0 (0.0%) |
| $750,000 to $999,999 | 0 (0.0%) | 0 (0.0%) |
| $1,000,000 or more | 0 (0.0%) | 0 (0.0%) |
| Total | 114 (100.0%) | 42 (100.0%) |
Household Income by Mortgage Status in Jewett
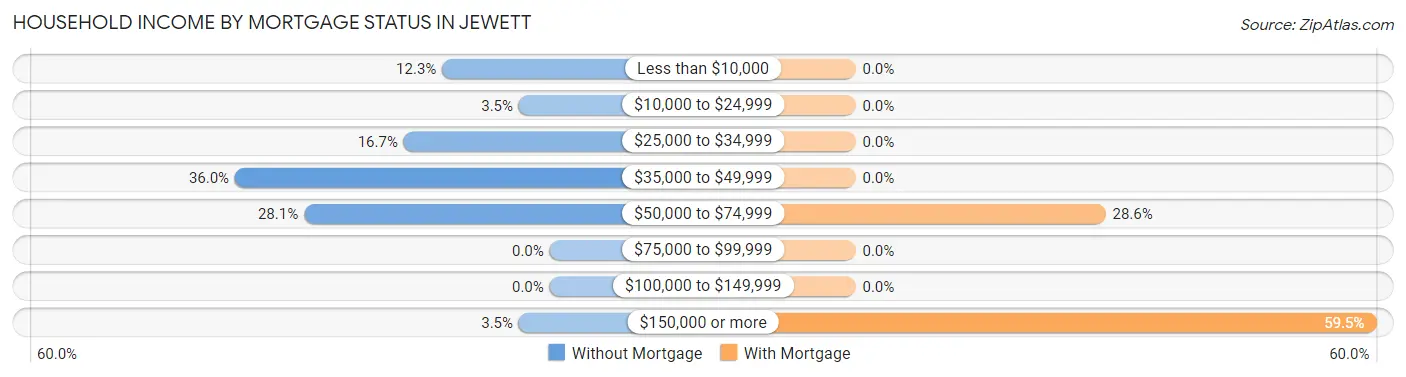
| Household Income | Without Mortgage | With Mortgage |
| Less than $10,000 | 14 (12.3%) | 0 (0.0%) |
| $10,000 to $24,999 | 4 (3.5%) | 0 (0.0%) |
| $25,000 to $34,999 | 19 (16.7%) | 0 (0.0%) |
| $35,000 to $49,999 | 41 (36.0%) | 0 (0.0%) |
| $50,000 to $74,999 | 32 (28.1%) | 12 (28.6%) |
| $75,000 to $99,999 | 0 (0.0%) | 0 (0.0%) |
| $100,000 to $149,999 | 0 (0.0%) | 0 (0.0%) |
| $150,000 or more | 4 (3.5%) | 25 (59.5%) |
| Total | 114 (100.0%) | 42 (100.0%) |
Property Value to Household Income Ratio in Jewett
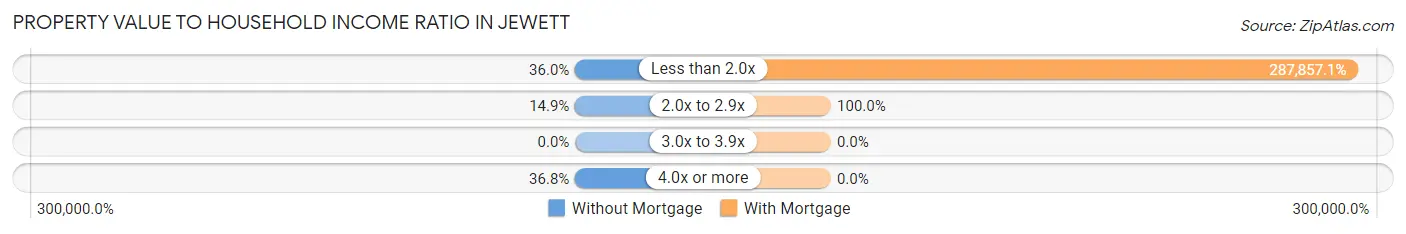
| Value-to-Income Ratio | Without Mortgage | With Mortgage |
| Less than 2.0x | 41 (36.0%) | 120,900 (287,857.1%) |
| 2.0x to 2.9x | 17 (14.9%) | 42 (100.0%) |
| 3.0x to 3.9x | 0 (0.0%) | 0 (0.0%) |
| 4.0x or more | 42 (36.8%) | 0 (0.0%) |
| Total | 114 (100.0%) | 42 (100.0%) |
Real Estate Taxes by Mortgage Status in Jewett
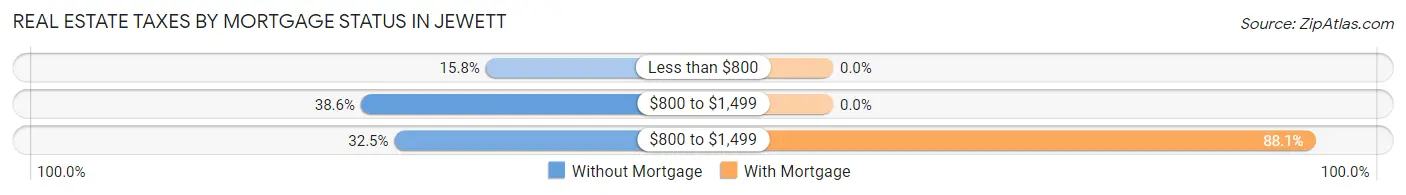
| Property Taxes | Without Mortgage | With Mortgage |
| Less than $800 | 18 (15.8%) | 0 (0.0%) |
| $800 to $1,499 | 44 (38.6%) | 0 (0.0%) |
| $800 to $1,499 | 37 (32.5%) | 37 (88.1%) |
| Total | 114 (100.0%) | 42 (100.0%) |
Health & Disability in Jewett
Health Insurance Coverage by Age in Jewett
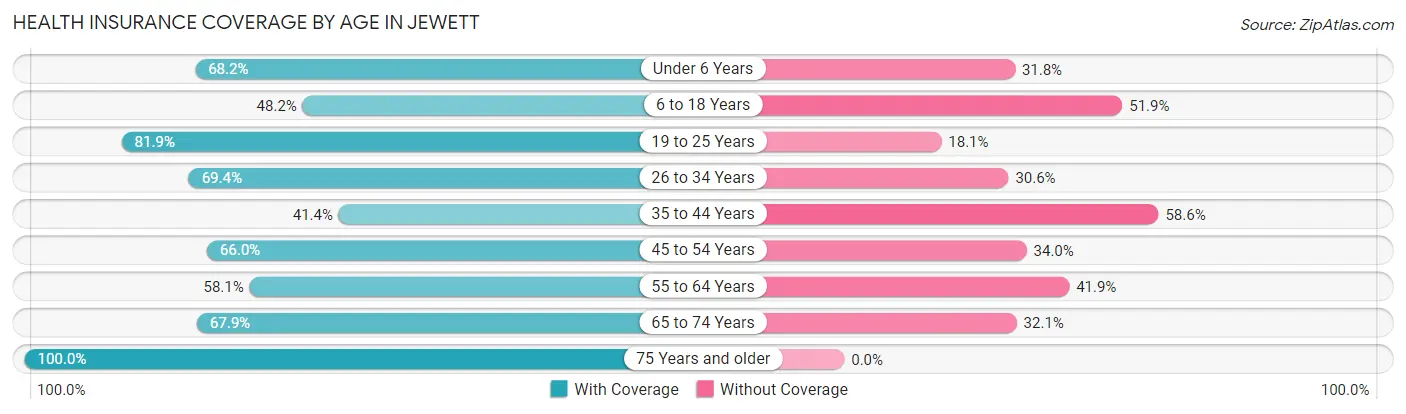
| Age Bracket | With Coverage | Without Coverage |
| Under 6 Years | 30 (68.2%) | 14 (31.8%) |
| 6 to 18 Years | 65 (48.1%) | 70 (51.8%) |
| 19 to 25 Years | 86 (81.9%) | 19 (18.1%) |
| 26 to 34 Years | 34 (69.4%) | 15 (30.6%) |
| 35 to 44 Years | 41 (41.4%) | 58 (58.6%) |
| 45 to 54 Years | 33 (66.0%) | 17 (34.0%) |
| 55 to 64 Years | 54 (58.1%) | 39 (41.9%) |
| 65 to 74 Years | 19 (67.9%) | 9 (32.1%) |
| 75 Years and older | 31 (100.0%) | 0 (0.0%) |
| Total | 393 (62.0%) | 241 (38.0%) |
Health Insurance Coverage by Citizenship Status in Jewett
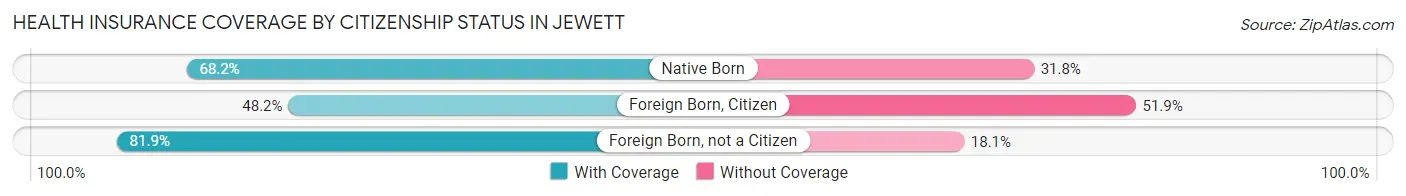
| Citizenship Status | With Coverage | Without Coverage |
| Native Born | 30 (68.2%) | 14 (31.8%) |
| Foreign Born, Citizen | 65 (48.1%) | 70 (51.8%) |
| Foreign Born, not a Citizen | 86 (81.9%) | 19 (18.1%) |
Health Insurance Coverage by Household Income in Jewett
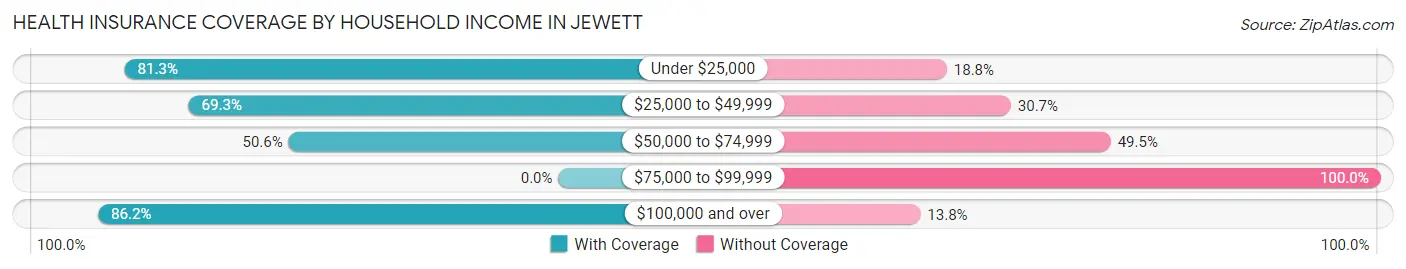
| Household Income | With Coverage | Without Coverage |
| Under $25,000 | 26 (81.2%) | 6 (18.8%) |
| $25,000 to $49,999 | 187 (69.3%) | 83 (30.7%) |
| $50,000 to $74,999 | 92 (50.5%) | 90 (49.4%) |
| $75,000 to $99,999 | 0 (0.0%) | 47 (100.0%) |
| $100,000 and over | 75 (86.2%) | 12 (13.8%) |
Public vs Private Health Insurance Coverage by Age in Jewett
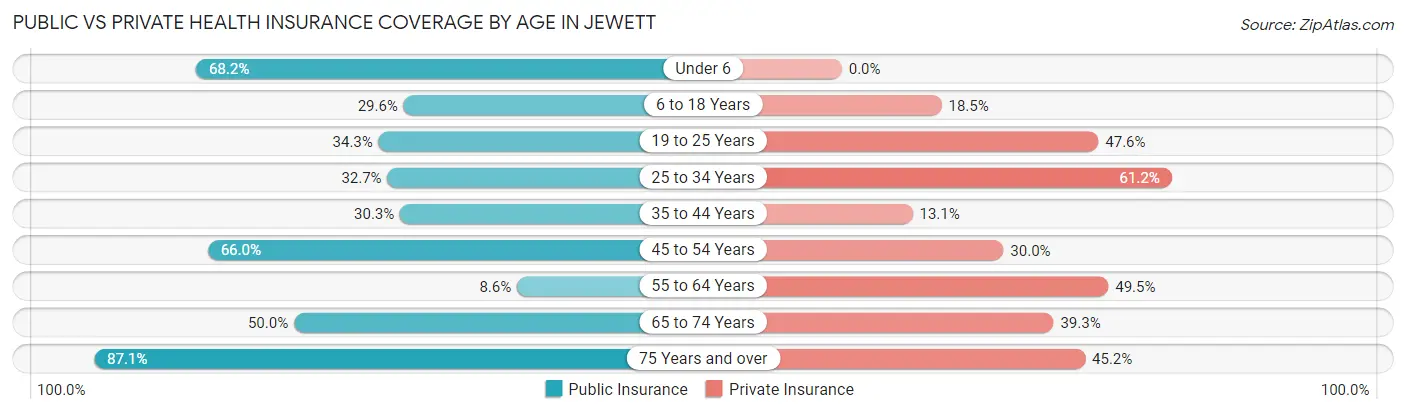
| Age Bracket | Public Insurance | Private Insurance |
| Under 6 | 30 (68.2%) | 0 (0.0%) |
| 6 to 18 Years | 40 (29.6%) | 25 (18.5%) |
| 19 to 25 Years | 36 (34.3%) | 50 (47.6%) |
| 25 to 34 Years | 16 (32.7%) | 30 (61.2%) |
| 35 to 44 Years | 30 (30.3%) | 13 (13.1%) |
| 45 to 54 Years | 33 (66.0%) | 15 (30.0%) |
| 55 to 64 Years | 8 (8.6%) | 46 (49.5%) |
| 65 to 74 Years | 14 (50.0%) | 11 (39.3%) |
| 75 Years and over | 27 (87.1%) | 14 (45.2%) |
| Total | 234 (36.9%) | 204 (32.2%) |
Disability Status by Sex by Age in Jewett
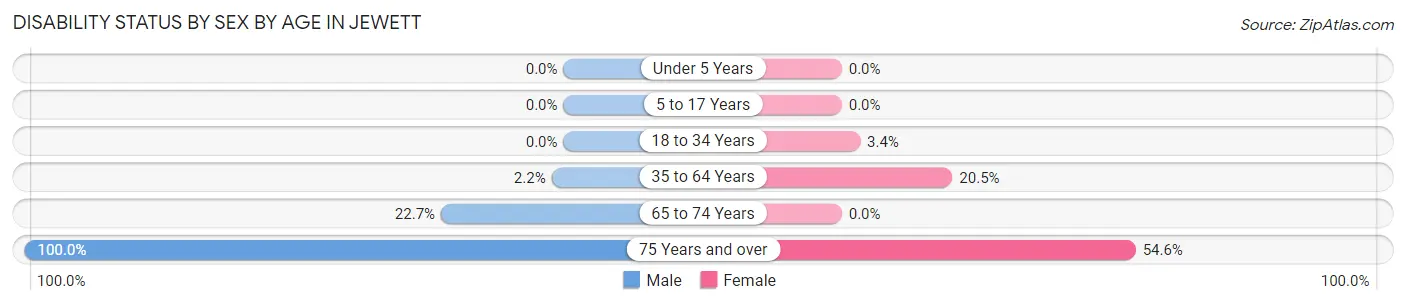
| Age Bracket | Male | Female |
| Under 5 Years | 0 (0.0%) | 0 (0.0%) |
| 5 to 17 Years | 0 (0.0%) | 0 (0.0%) |
| 18 to 34 Years | 0 (0.0%) | 2 (3.4%) |
| 35 to 64 Years | 2 (2.2%) | 31 (20.5%) |
| 65 to 74 Years | 5 (22.7%) | 0 (0.0%) |
| 75 Years and over | 20 (100.0%) | 6 (54.5%) |
Disability Class by Sex by Age in Jewett
Disability Class: Hearing Difficulty
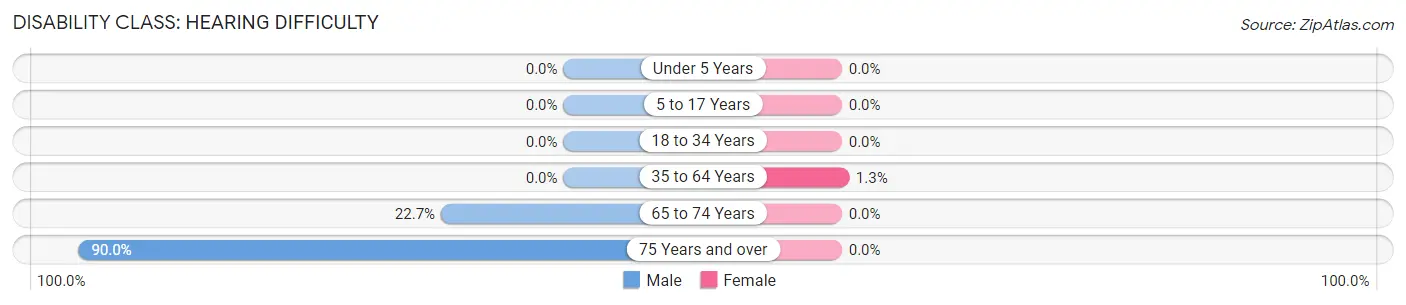
| Age Bracket | Male | Female |
| Under 5 Years | 0 (0.0%) | 0 (0.0%) |
| 5 to 17 Years | 0 (0.0%) | 0 (0.0%) |
| 18 to 34 Years | 0 (0.0%) | 0 (0.0%) |
| 35 to 64 Years | 0 (0.0%) | 2 (1.3%) |
| 65 to 74 Years | 5 (22.7%) | 0 (0.0%) |
| 75 Years and over | 18 (90.0%) | 0 (0.0%) |
Disability Class: Vision Difficulty
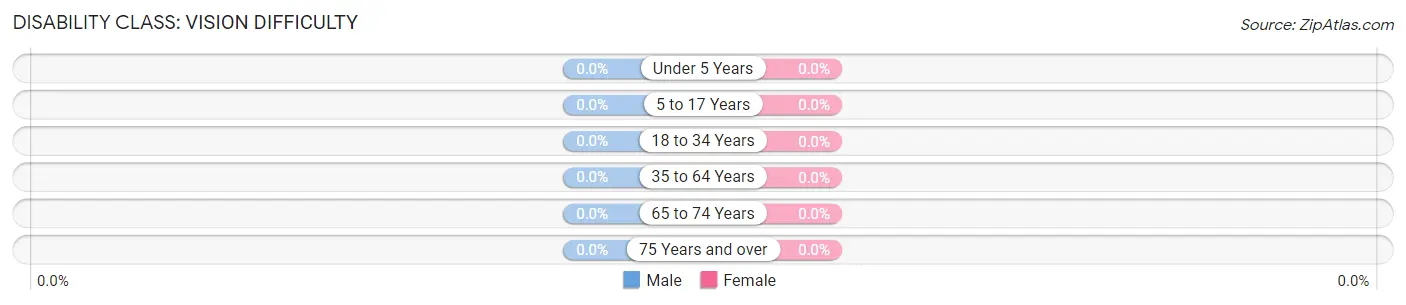
| Age Bracket | Male | Female |
| Under 5 Years | 0 (0.0%) | 0 (0.0%) |
| 5 to 17 Years | 0 (0.0%) | 0 (0.0%) |
| 18 to 34 Years | 0 (0.0%) | 0 (0.0%) |
| 35 to 64 Years | 0 (0.0%) | 0 (0.0%) |
| 65 to 74 Years | 0 (0.0%) | 0 (0.0%) |
| 75 Years and over | 0 (0.0%) | 0 (0.0%) |
Disability Class: Cognitive Difficulty
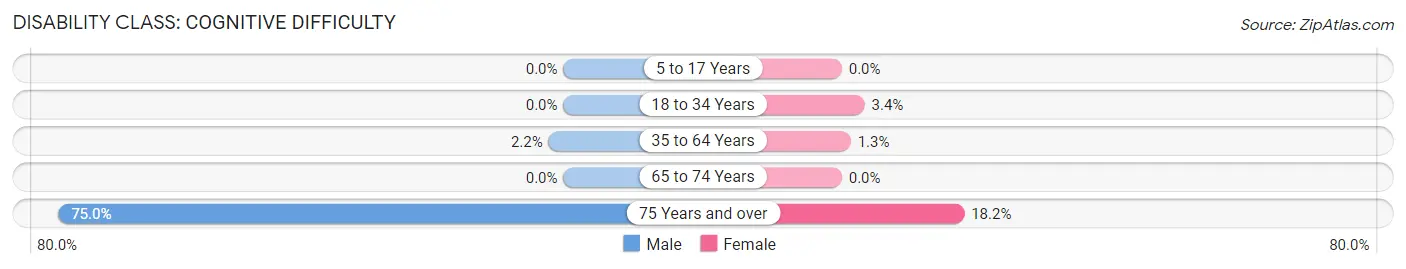
| Age Bracket | Male | Female |
| 5 to 17 Years | 0 (0.0%) | 0 (0.0%) |
| 18 to 34 Years | 0 (0.0%) | 2 (3.4%) |
| 35 to 64 Years | 2 (2.2%) | 2 (1.3%) |
| 65 to 74 Years | 0 (0.0%) | 0 (0.0%) |
| 75 Years and over | 15 (75.0%) | 2 (18.2%) |
Disability Class: Ambulatory Difficulty
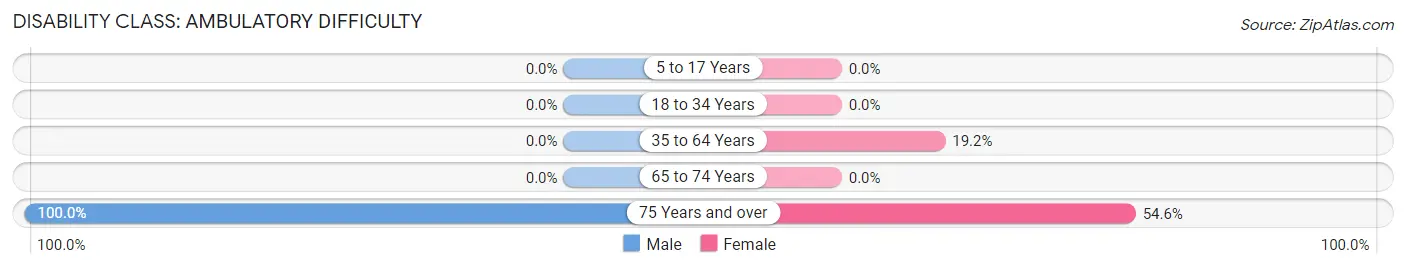
| Age Bracket | Male | Female |
| 5 to 17 Years | 0 (0.0%) | 0 (0.0%) |
| 18 to 34 Years | 0 (0.0%) | 0 (0.0%) |
| 35 to 64 Years | 0 (0.0%) | 29 (19.2%) |
| 65 to 74 Years | 0 (0.0%) | 0 (0.0%) |
| 75 Years and over | 20 (100.0%) | 6 (54.5%) |
Disability Class: Self-Care Difficulty
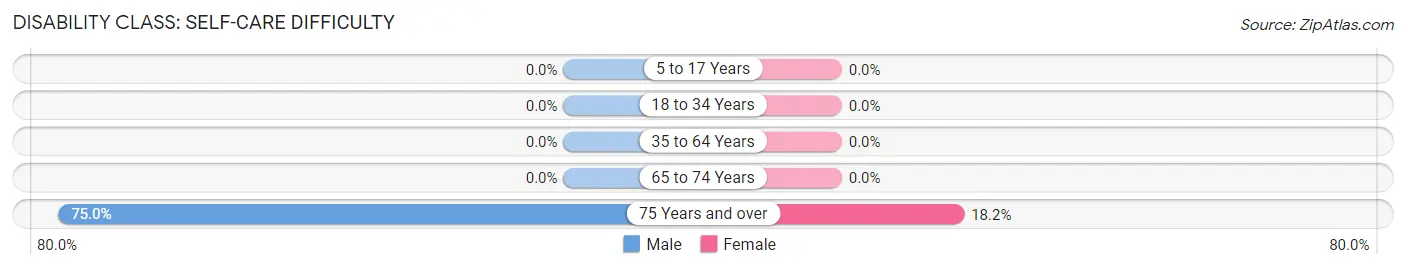
| Age Bracket | Male | Female |
| 5 to 17 Years | 0 (0.0%) | 0 (0.0%) |
| 18 to 34 Years | 0 (0.0%) | 0 (0.0%) |
| 35 to 64 Years | 0 (0.0%) | 0 (0.0%) |
| 65 to 74 Years | 0 (0.0%) | 0 (0.0%) |
| 75 Years and over | 15 (75.0%) | 2 (18.2%) |
Technology Access in Jewett
Computing Device Access in Jewett
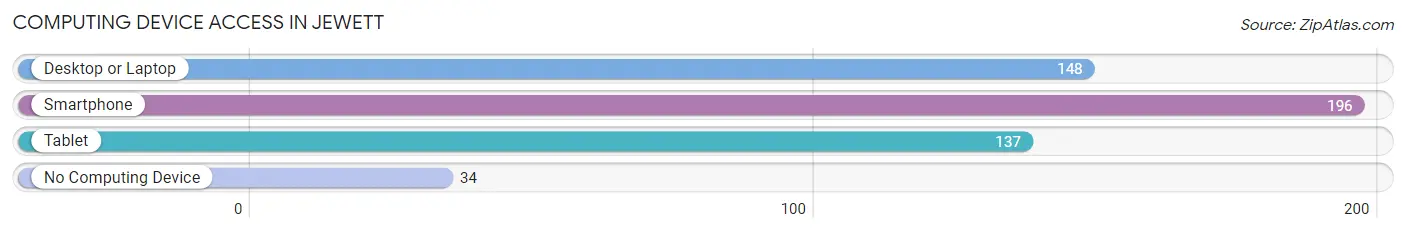
| Device Type | # Households | % Households |
| Desktop or Laptop | 148 | 60.4% |
| Smartphone | 196 | 80.0% |
| Tablet | 137 | 55.9% |
| No Computing Device | 34 | 13.9% |
| Total | 245 | 100.0% |
Internet Access in Jewett
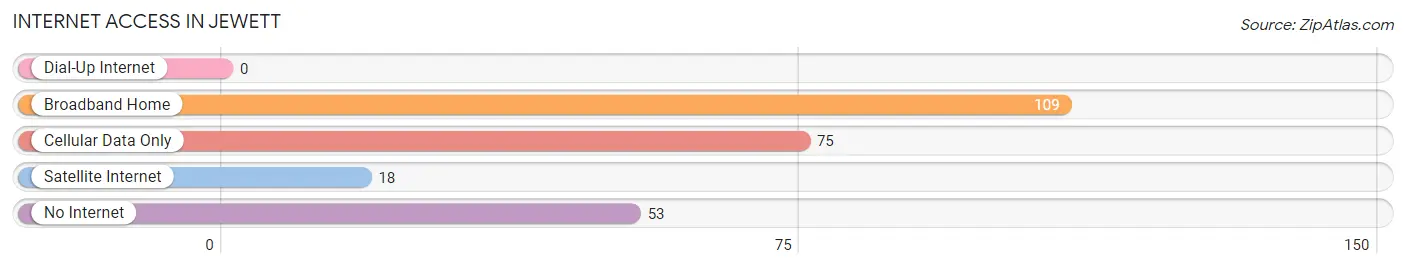
| Internet Type | # Households | % Households |
| Dial-Up Internet | 0 | 0.0% |
| Broadband Home | 109 | 44.5% |
| Cellular Data Only | 75 | 30.6% |
| Satellite Internet | 18 | 7.3% |
| No Internet | 53 | 21.6% |
| Total | 245 | 100.0% |
Jewett Summary
History
The small town of Jewett, Texas is located in Leon County, Texas, and is part of the larger metropolitan area of Waco. The town was founded in 1873 by a group of settlers from the nearby town of Centerville. The settlers were looking for a place to settle and start a new life, and they chose the area around Jewett because of its fertile soil and abundant natural resources. The town was named after a local settler, John Jewett, who had been a prominent figure in the area since the early 1800s.
The town of Jewett quickly grew and prospered, becoming a center of commerce and industry in the area. The town was home to several businesses, including a cotton gin, a sawmill, and a gristmill. The town also had a post office, a bank, and a hotel. The town was also home to several churches, including the First Baptist Church of Jewett, which was founded in 1875.
In the early 1900s, the town of Jewett experienced a period of growth and prosperity. The town was home to several businesses, including a cotton gin, a sawmill, and a gristmill. The town also had a post office, a bank, and a hotel. The town was also home to several churches, including the First Baptist Church of Jewett, which was founded in 1875.
The town of Jewett experienced a period of decline in the mid-1900s, as the local economy shifted away from agriculture and industry. The town was hit hard by the Great Depression, and many of the businesses in the town closed their doors. The town also experienced a period of population decline, as many of the town's residents moved away in search of better opportunities.
In the late 20th century, the town of Jewett experienced a period of revitalization. The town was home to several new businesses, including a grocery store, a hardware store, and a restaurant. The town also experienced a period of population growth, as many of the town's former residents returned to the area.
Geography
Jewett is located in Leon County, Texas, and is part of the larger metropolitan area of Waco. The town is situated in the rolling hills of Central Texas, and is surrounded by lush green pastures and woodlands. The town is located near the Leon River, which provides a source of water for the town and its surrounding area. The town is also located near several lakes, including Lake Limestone and Lake Leon.
The town of Jewett has a total area of 1.3 square miles, all of which is land. The town has a humid subtropical climate, with hot summers and mild winters. The average temperature in the town is around 70 degrees Fahrenheit, and the average annual precipitation is around 40 inches.
Economy
The economy of Jewett is largely based on agriculture and tourism. The town is home to several farms, which produce a variety of crops, including cotton, corn, and soybeans. The town is also home to several tourist attractions, including the Leon River Nature Park and the Leon County Historical Museum.
The town of Jewett is also home to several businesses, including a grocery store, a hardware store, and a restaurant. The town is also home to several churches, including the First Baptist Church of Jewett, which was founded in 1875.
Demographics
As of the 2010 census, the town of Jewett had a population of 1,845 people. The racial makeup of the town was 94.3% White, 0.7% African American, 0.2% Native American, 0.2% Asian, 0.1% Pacific Islander, 2.7% from other races, and 1.9% from two or more races. Hispanic or Latino of any race were 5.2% of the population.
The median income for a household in the town was $31,250, and the median income for a family was $37,500. The per capita income for the town was $15,945. About 15.2% of families and 18.2% of the population were below the poverty line, including 25.2% of those under age 18 and 11.2% of those age 65 or over.
Common Questions
What is Per Capita Income in Jewett?
Per Capita income in Jewett is $28,473.
What is the Median Family Income in Jewett?
Median Family Income in Jewett is $53,333.
What is the Median Household income in Jewett?
Median Household Income in Jewett is $48,681.
What is Income or Wage Gap in Jewett?
Income or Wage Gap in Jewett is 69.6%.
Women in Jewett earn 30.4 cents for every dollar earned by a man.
What is Inequality or Gini Index in Jewett?
Inequality or Gini Index in Jewett is 0.41.
What is the Total Population of Jewett?
Total Population of Jewett is 634.
What is the Total Male Population of Jewett?
Total Male Population of Jewett is 320.
What is the Total Female Population of Jewett?
Total Female Population of Jewett is 314.
What is the Ratio of Males per 100 Females in Jewett?
There are 101.91 Males per 100 Females in Jewett.
What is the Ratio of Females per 100 Males in Jewett?
There are 98.12 Females per 100 Males in Jewett.
What is the Median Population Age in Jewett?
Median Population Age in Jewett is 29.5 Years.
What is the Average Family Size in Jewett
Average Family Size in Jewett is 4.0 People.
What is the Average Household Size in Jewett
Average Household Size in Jewett is 2.5 People.
How Large is the Labor Force in Jewett?
There are 257 People in the Labor Forcein in Jewett.
What is the Percentage of People in the Labor Force in Jewett?
53.0% of People are in the Labor Force in Jewett.
What is the Unemployment Rate in Jewett?
Unemployment Rate in Jewett is 11.3%.