Jacksonville, TX Map & Demographics
Jacksonville Map
Jacksonville Overview
$20,924
PER CAPITA INCOME
$50,923
AVG FAMILY INCOME
$49,750
AVG HOUSEHOLD INCOME
30.9%
WAGE / INCOME GAP [ % ]
69.1¢/ $1
WAGE / INCOME GAP [ $ ]
$10,044
FAMILY INCOME DEFICIT
0.46
INEQUALITY / GINI INDEX
14,104
TOTAL POPULATION
6,492
MALE POPULATION
7,612
FEMALE POPULATION
85.29
MALES / 100 FEMALES
117.25
FEMALES / 100 MALES
28.2
MEDIAN AGE
3.3
AVG FAMILY SIZE
3.0
AVG HOUSEHOLD SIZE
6,175
LABOR FORCE [ PEOPLE ]
60.6%
PERCENT IN LABOR FORCE
7.9%
UNEMPLOYMENT RATE
Jacksonville Zip Codes
Jacksonville Area Codes
Income in Jacksonville
Income Overview in Jacksonville
Per Capita Income in Jacksonville is $20,924, while median incomes of families and households are $50,923 and $49,750 respectively.
| Characteristic | Number | Measure |
| Per Capita Income | 14,104 | $20,924 |
| Median Family Income | 3,621 | $50,923 |
| Mean Family Income | 3,621 | $65,717 |
| Median Household Income | 4,582 | $49,750 |
| Mean Household Income | 4,582 | $61,722 |
| Income Deficit | 3,621 | $10,044 |
| Wage / Income Gap (%) | 14,104 | 30.90% |
| Wage / Income Gap ($) | 14,104 | 69.10¢ per $1 |
| Gini / Inequality Index | 14,104 | 0.46 |
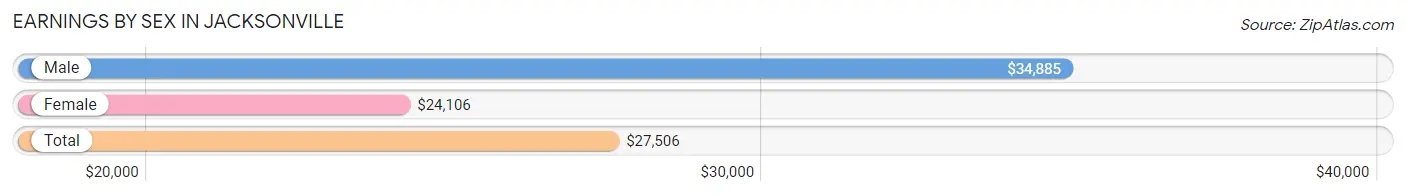
Earnings by Sex in Jacksonville
Average Earnings in Jacksonville are $27,506, $34,885 for men and $24,106 for women, a difference of 30.9%.
| Sex | Number | Average Earnings |
| Male | 3,116 (48.4%) | $34,885 |
| Female | 3,324 (51.6%) | $24,106 |
| Total | 6,440 (100.0%) | $27,506 |
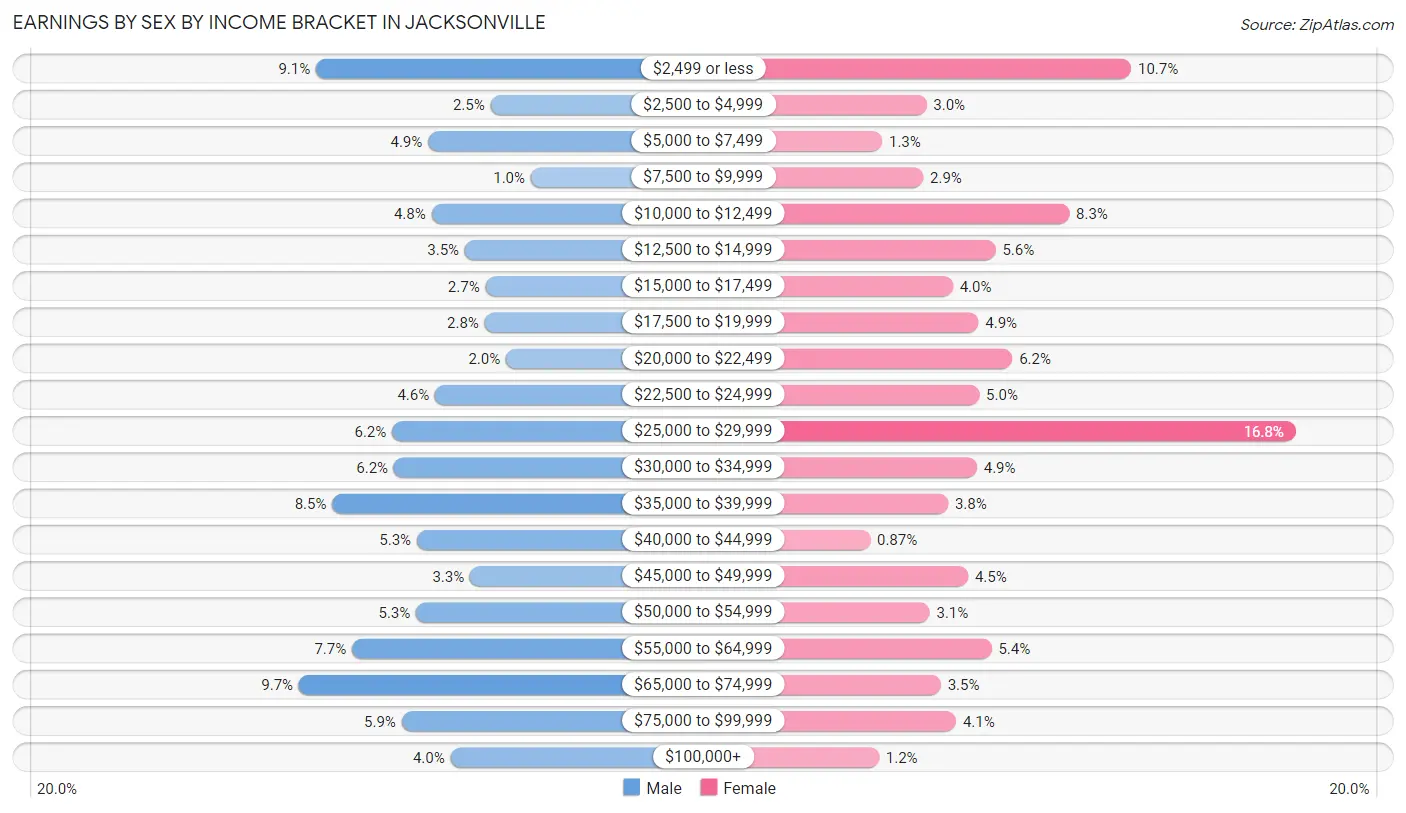
Earnings by Sex by Income Bracket in Jacksonville
The most common earnings brackets in Jacksonville are $65,000 to $74,999 for men (303 | 9.7%) and $25,000 to $29,999 for women (559 | 16.8%).
| Income | Male | Female |
| $2,499 or less | 283 (9.1%) | 354 (10.6%) |
| $2,500 to $4,999 | 79 (2.5%) | 99 (3.0%) |
| $5,000 to $7,499 | 152 (4.9%) | 44 (1.3%) |
| $7,500 to $9,999 | 32 (1.0%) | 95 (2.9%) |
| $10,000 to $12,499 | 148 (4.8%) | 277 (8.3%) |
| $12,500 to $14,999 | 109 (3.5%) | 185 (5.6%) |
| $15,000 to $17,499 | 85 (2.7%) | 132 (4.0%) |
| $17,500 to $19,999 | 86 (2.8%) | 164 (4.9%) |
| $20,000 to $22,499 | 61 (2.0%) | 206 (6.2%) |
| $22,500 to $24,999 | 144 (4.6%) | 165 (5.0%) |
| $25,000 to $29,999 | 194 (6.2%) | 559 (16.8%) |
| $30,000 to $34,999 | 192 (6.2%) | 162 (4.9%) |
| $35,000 to $39,999 | 264 (8.5%) | 126 (3.8%) |
| $40,000 to $44,999 | 165 (5.3%) | 29 (0.9%) |
| $45,000 to $49,999 | 103 (3.3%) | 151 (4.5%) |
| $50,000 to $54,999 | 166 (5.3%) | 103 (3.1%) |
| $55,000 to $64,999 | 241 (7.7%) | 180 (5.4%) |
| $65,000 to $74,999 | 303 (9.7%) | 117 (3.5%) |
| $75,000 to $99,999 | 183 (5.9%) | 136 (4.1%) |
| $100,000+ | 126 (4.0%) | 40 (1.2%) |
| Total | 3,116 (100.0%) | 3,324 (100.0%) |
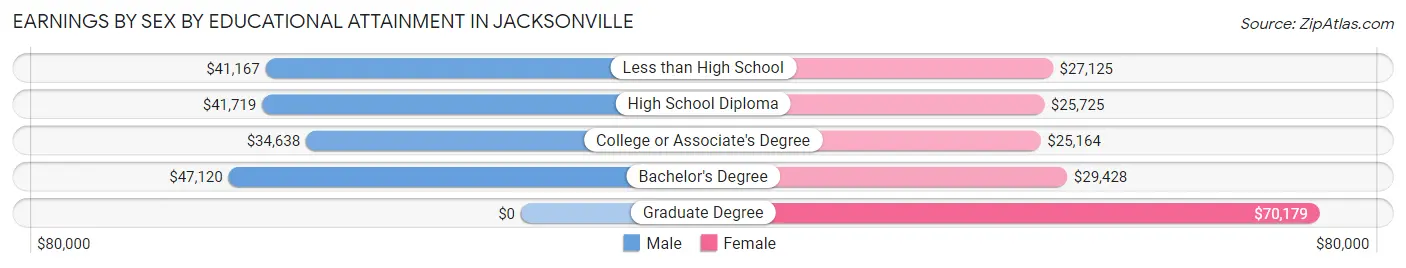
Earnings by Sex by Educational Attainment in Jacksonville
Average earnings in Jacksonville are $42,330 for men and $28,231 for women, a difference of 33.3%. Men with an educational attainment of bachelor's degree enjoy the highest average annual earnings of $47,120, while those with college or associate's degree education earn the least with $34,638. Women with an educational attainment of graduate degree earn the most with the average annual earnings of $70,179, while those with college or associate's degree education have the smallest earnings of $25,164.
| Educational Attainment | Male Income | Female Income |
| Less than High School | $41,167 | $27,125 |
| High School Diploma | $41,719 | $25,725 |
| College or Associate's Degree | $34,638 | $25,164 |
| Bachelor's Degree | $47,120 | $29,428 |
| Graduate Degree | - | - |
| Total | $42,330 | $28,231 |
Family Income in Jacksonville
Family Income Brackets in Jacksonville
According to the Jacksonville family income data, there are 1,003 families falling into the $50,000 to $74,999 income range, which is the most common income bracket and makes up 27.7% of all families. Conversely, the $150,000 to $199,999 income bracket is the least frequent group with only 62 families (1.7%) belonging to this category.
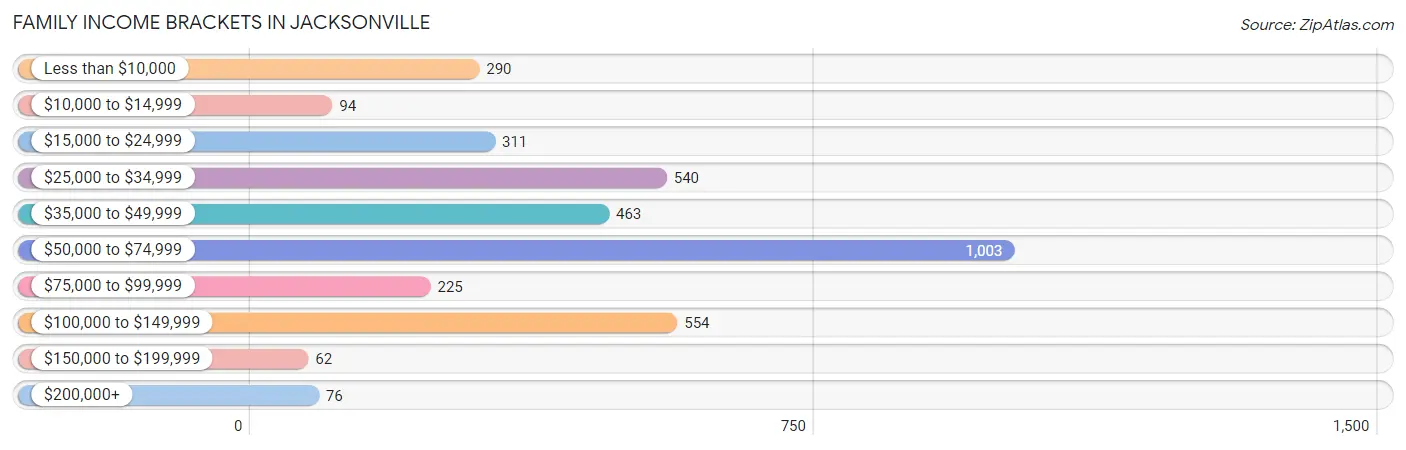
| Income Bracket | # Families | % Families |
| Less than $10,000 | 290 | 8.0% |
| $10,000 to $14,999 | 94 | 2.6% |
| $15,000 to $24,999 | 311 | 8.6% |
| $25,000 to $34,999 | 540 | 14.9% |
| $35,000 to $49,999 | 463 | 12.8% |
| $50,000 to $74,999 | 1,003 | 27.7% |
| $75,000 to $99,999 | 225 | 6.2% |
| $100,000 to $149,999 | 554 | 15.3% |
| $150,000 to $199,999 | 62 | 1.7% |
| $200,000+ | 76 | 2.1% |
Family Income by Famaliy Size in Jacksonville
6-person families (240 | 6.6%) account for the highest median family income in Jacksonville with $121,327 per family, while 5-person families (266 | 7.3%) have the highest median income of $23,596 per family member.
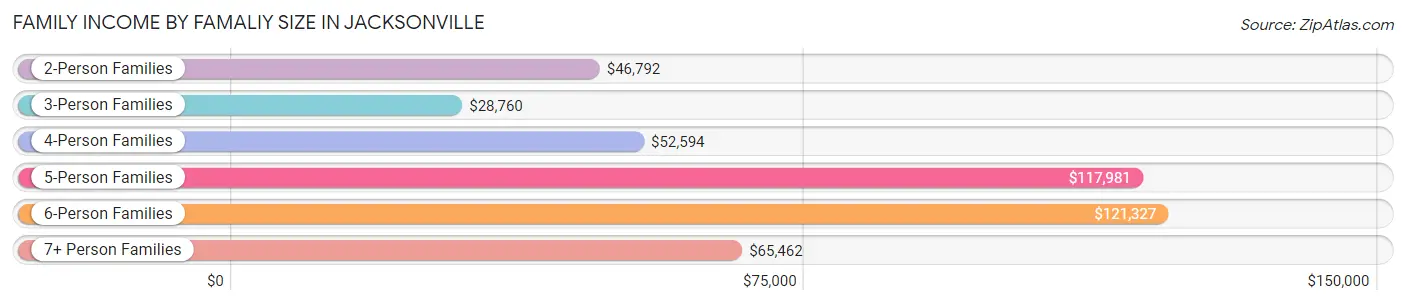
| Income Bracket | # Families | Median Income |
| 2-Person Families | 1,530 (42.2%) | $46,792 |
| 3-Person Families | 794 (21.9%) | $28,760 |
| 4-Person Families | 584 (16.1%) | $52,594 |
| 5-Person Families | 266 (7.3%) | $117,981 |
| 6-Person Families | 240 (6.6%) | $121,327 |
| 7+ Person Families | 207 (5.7%) | $65,462 |
| Total | 3,621 (100.0%) | $50,923 |
Family Income by Number of Earners in Jacksonville
The median family income in Jacksonville is $50,923, with families comprising 3+ earners (346) having the highest median family income of $121,852, while families with no earners (498) have the lowest median family income of $27,813, accounting for 9.6% and 13.8% of families, respectively.
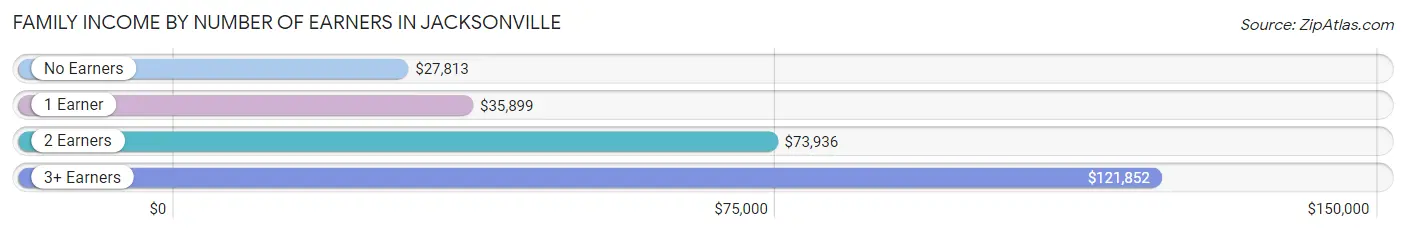
| Number of Earners | # Families | Median Income |
| No Earners | 498 (13.8%) | $27,813 |
| 1 Earner | 1,583 (43.7%) | $35,899 |
| 2 Earners | 1,194 (33.0%) | $73,936 |
| 3+ Earners | 346 (9.6%) | $121,852 |
| Total | 3,621 (100.0%) | $50,923 |
Household Income in Jacksonville
Household Income Brackets in Jacksonville
With 1,100 households falling in the category, the $50,000 to $74,999 income range is the most frequent in Jacksonville, accounting for 24.0% of all households. In contrast, only 73 households (1.6%) fall into the $200,000+ income bracket, making it the least populous group.
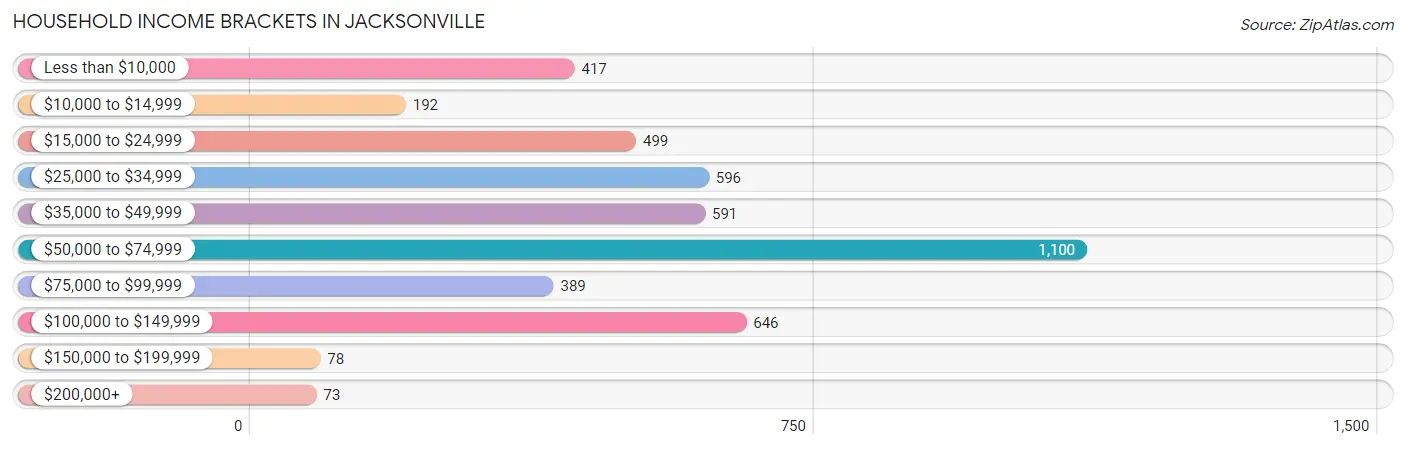
| Income Bracket | # Households | % Households |
| Less than $10,000 | 417 | 9.1% |
| $10,000 to $14,999 | 192 | 4.2% |
| $15,000 to $24,999 | 499 | 10.9% |
| $25,000 to $34,999 | 596 | 13.0% |
| $35,000 to $49,999 | 591 | 12.9% |
| $50,000 to $74,999 | 1,100 | 24.0% |
| $75,000 to $99,999 | 389 | 8.5% |
| $100,000 to $149,999 | 646 | 14.1% |
| $150,000 to $199,999 | 78 | 1.7% |
| $200,000+ | 73 | 1.6% |
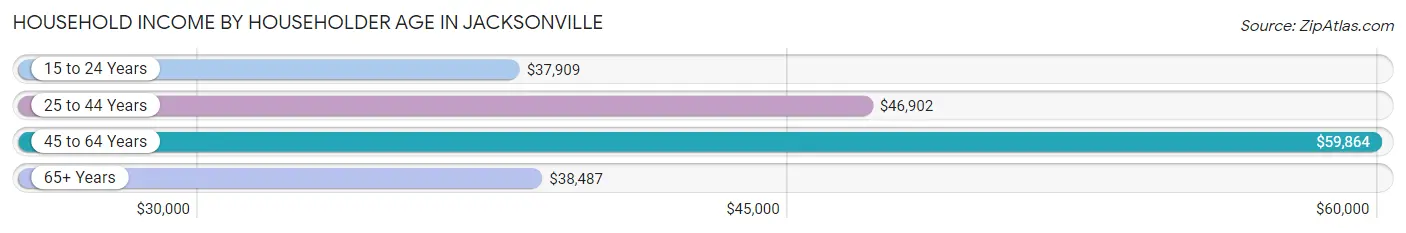
Household Income by Householder Age in Jacksonville
The median household income in Jacksonville is $49,750, with the highest median household income of $59,864 found in the 45 to 64 years age bracket for the primary householder. A total of 1,611 households (35.2%) fall into this category. Meanwhile, the 15 to 24 years age bracket for the primary householder has the lowest median household income of $37,909, with 297 households (6.5%) in this group.
| Income Bracket | # Households | Median Income |
| 15 to 24 Years | 297 (6.5%) | $37,909 |
| 25 to 44 Years | 1,543 (33.7%) | $46,902 |
| 45 to 64 Years | 1,611 (35.2%) | $59,864 |
| 65+ Years | 1,131 (24.7%) | $38,487 |
| Total | 4,582 (100.0%) | $49,750 |
Poverty in Jacksonville
Income Below Poverty by Sex and Age in Jacksonville
With 23.4% poverty level for males and 23.9% for females among the residents of Jacksonville, under 5 year old males and 18 to 24 year old females are the most vulnerable to poverty, with 303 males (44.1%) and 386 females (41.6%) in their respective age groups living below the poverty level.
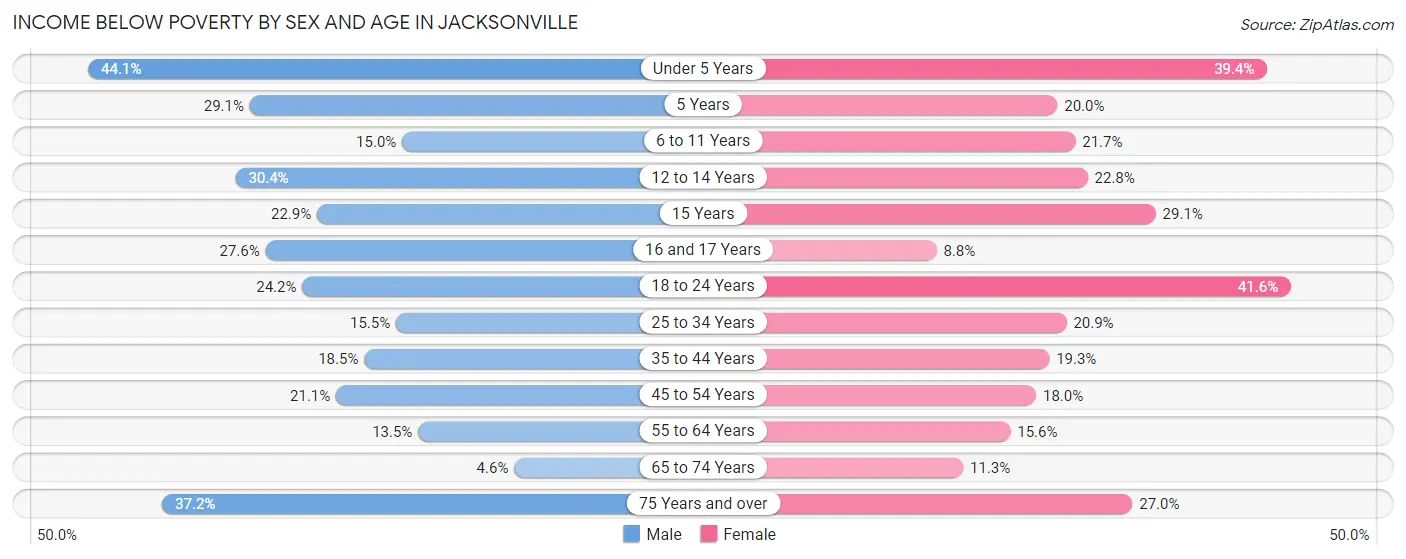
| Age Bracket | Male | Female |
| Under 5 Years | 303 (44.1%) | 323 (39.4%) |
| 5 Years | 55 (29.1%) | 1 (20.0%) |
| 6 to 11 Years | 95 (15.0%) | 135 (21.7%) |
| 12 to 14 Years | 112 (30.4%) | 78 (22.8%) |
| 15 Years | 24 (22.9%) | 37 (29.1%) |
| 16 and 17 Years | 55 (27.6%) | 37 (8.8%) |
| 18 to 24 Years | 205 (24.2%) | 386 (41.6%) |
| 25 to 34 Years | 98 (15.5%) | 176 (20.8%) |
| 35 to 44 Years | 107 (18.5%) | 189 (19.3%) |
| 45 to 54 Years | 162 (21.1%) | 137 (18.0%) |
| 55 to 64 Years | 61 (13.5%) | 81 (15.6%) |
| 65 to 74 Years | 13 (4.6%) | 62 (11.3%) |
| 75 Years and over | 140 (37.2%) | 124 (27.0%) |
| Total | 1,430 (23.4%) | 1,766 (23.9%) |
Income Above Poverty by Sex and Age in Jacksonville
According to the poverty statistics in Jacksonville, males aged 65 to 74 years and females aged 16 and 17 years are the age groups that are most secure financially, with 95.4% of males and 91.2% of females in these age groups living above the poverty line.
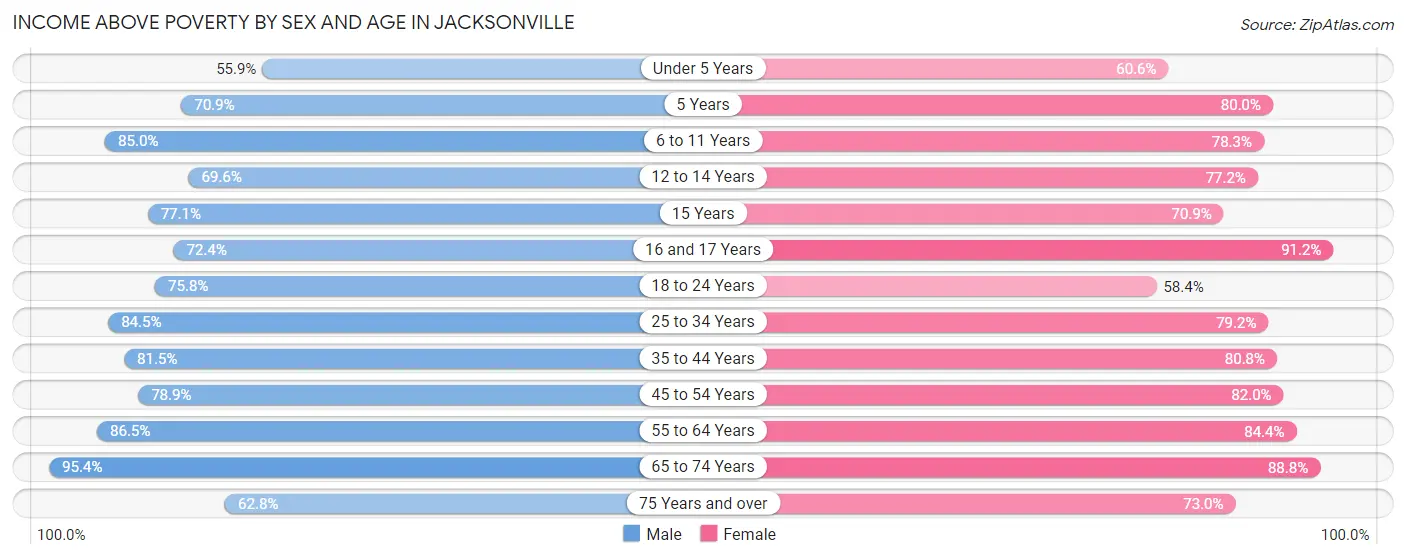
| Age Bracket | Male | Female |
| Under 5 Years | 384 (55.9%) | 497 (60.6%) |
| 5 Years | 134 (70.9%) | 4 (80.0%) |
| 6 to 11 Years | 540 (85.0%) | 488 (78.3%) |
| 12 to 14 Years | 256 (69.6%) | 264 (77.2%) |
| 15 Years | 81 (77.1%) | 90 (70.9%) |
| 16 and 17 Years | 144 (72.4%) | 384 (91.2%) |
| 18 to 24 Years | 641 (75.8%) | 542 (58.4%) |
| 25 to 34 Years | 533 (84.5%) | 668 (79.1%) |
| 35 to 44 Years | 472 (81.5%) | 793 (80.7%) |
| 45 to 54 Years | 606 (78.9%) | 623 (82.0%) |
| 55 to 64 Years | 392 (86.5%) | 437 (84.4%) |
| 65 to 74 Years | 272 (95.4%) | 489 (88.7%) |
| 75 Years and over | 236 (62.8%) | 336 (73.0%) |
| Total | 4,691 (76.6%) | 5,615 (76.1%) |
Income Below Poverty Among Married-Couple Families in Jacksonville
The poverty statistics for married-couple families in Jacksonville show that 18.2% or 391 of the total 2,142 families live below the poverty line. Families with 3 or 4 children have the highest poverty rate of 40.2%, comprising of 171 families. On the other hand, families with 5 or more children have the lowest poverty rate of 3.2%, which includes 3 families.
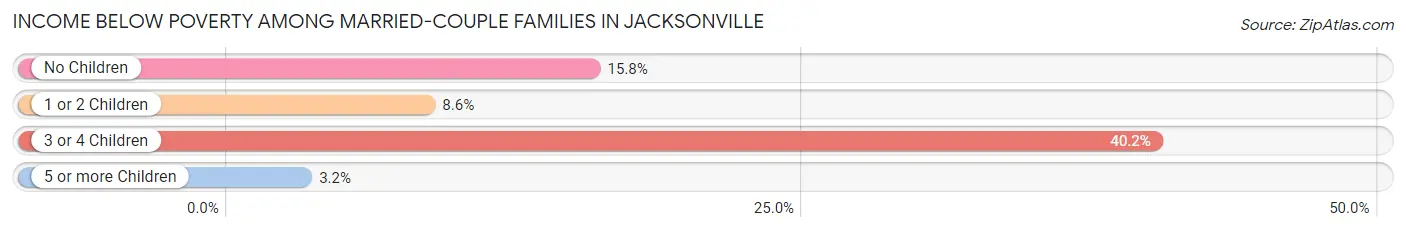
| Children | Above Poverty | Below Poverty |
| No Children | 907 (84.2%) | 170 (15.8%) |
| 1 or 2 Children | 500 (91.4%) | 47 (8.6%) |
| 3 or 4 Children | 254 (59.8%) | 171 (40.2%) |
| 5 or more Children | 90 (96.8%) | 3 (3.2%) |
| Total | 1,751 (81.8%) | 391 (18.2%) |
Income Below Poverty Among Single-Parent Households in Jacksonville
According to the poverty data in Jacksonville, 20.4% or 78 single-father households and 31.4% or 344 single-mother households are living below the poverty line. Among single-father households, those with 3 or 4 children have the highest poverty rate, with 29 households (30.8%) experiencing poverty. Likewise, among single-mother households, those with 3 or 4 children have the highest poverty rate, with 98 households (100.0%) falling below the poverty line.
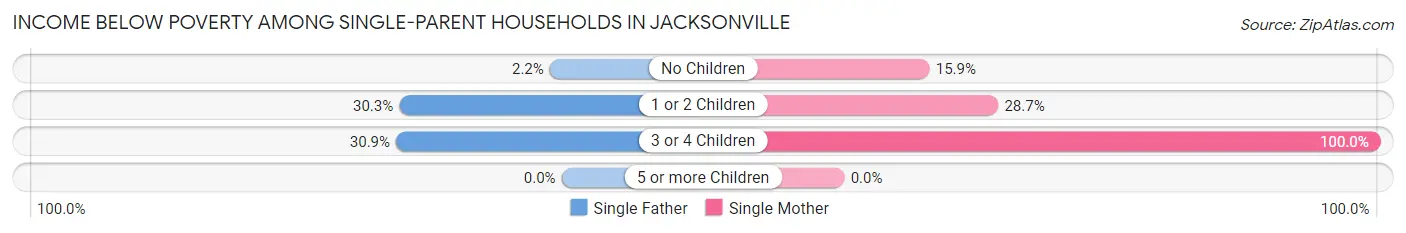
| Children | Single Father | Single Mother |
| No Children | 3 (2.2%) | 46 (15.9%) |
| 1 or 2 Children | 46 (30.3%) | 200 (28.6%) |
| 3 or 4 Children | 29 (30.8%) | 98 (100.0%) |
| 5 or more Children | 0 (0.0%) | 0 (0.0%) |
| Total | 78 (20.4%) | 344 (31.4%) |
Income Below Poverty Among Married-Couple vs Single-Parent Households in Jacksonville
The poverty data for Jacksonville shows that 391 of the married-couple family households (18.2%) and 422 of the single-parent households (28.5%) are living below the poverty level. Within the married-couple family households, those with 3 or 4 children have the highest poverty rate, with 171 households (40.2%) falling below the poverty line. Among the single-parent households, those with 3 or 4 children have the highest poverty rate, with 127 household (66.1%) living below poverty.
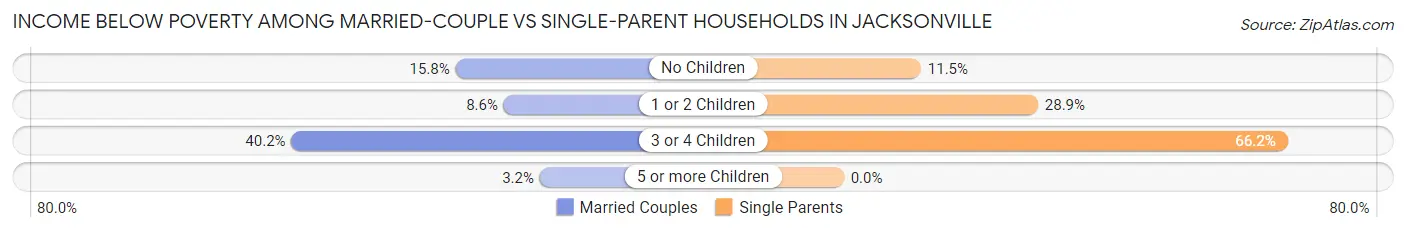
| Children | Married-Couple Families | Single-Parent Households |
| No Children | 170 (15.8%) | 49 (11.5%) |
| 1 or 2 Children | 47 (8.6%) | 246 (28.9%) |
| 3 or 4 Children | 171 (40.2%) | 127 (66.1%) |
| 5 or more Children | 3 (3.2%) | 0 (0.0%) |
| Total | 391 (18.2%) | 422 (28.5%) |
Race in Jacksonville
The most populous races in Jacksonville are White / Caucasian (8,661 | 61.4%), Hispanic or Latino (5,541 | 39.3%), and Black / African American (2,488 | 17.6%).
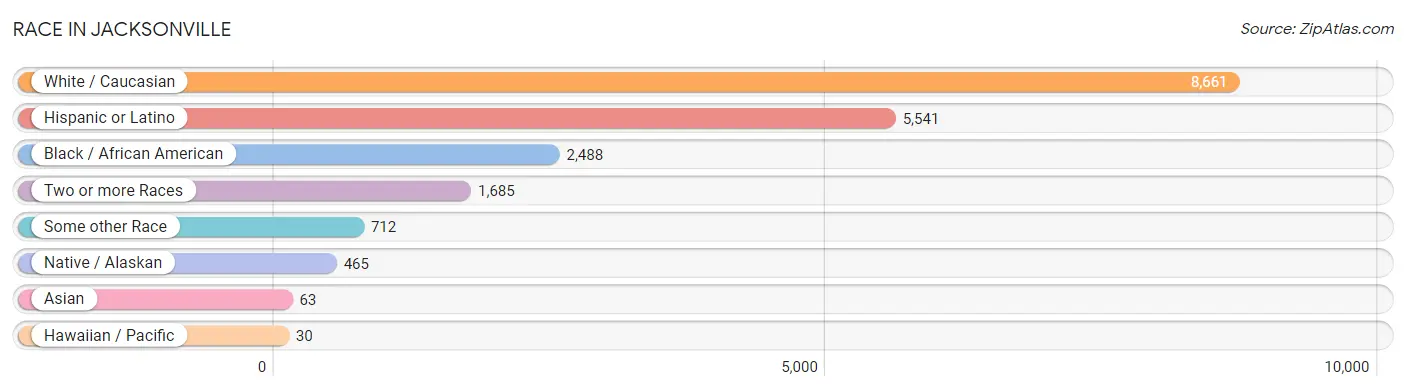
| Race | # Population | % Population |
| Asian | 63 | 0.4% |
| Black / African American | 2,488 | 17.6% |
| Hawaiian / Pacific | 30 | 0.2% |
| Hispanic or Latino | 5,541 | 39.3% |
| Native / Alaskan | 465 | 3.3% |
| White / Caucasian | 8,661 | 61.4% |
| Two or more Races | 1,685 | 11.9% |
| Some other Race | 712 | 5.1% |
| Total | 14,104 | 100.0% |
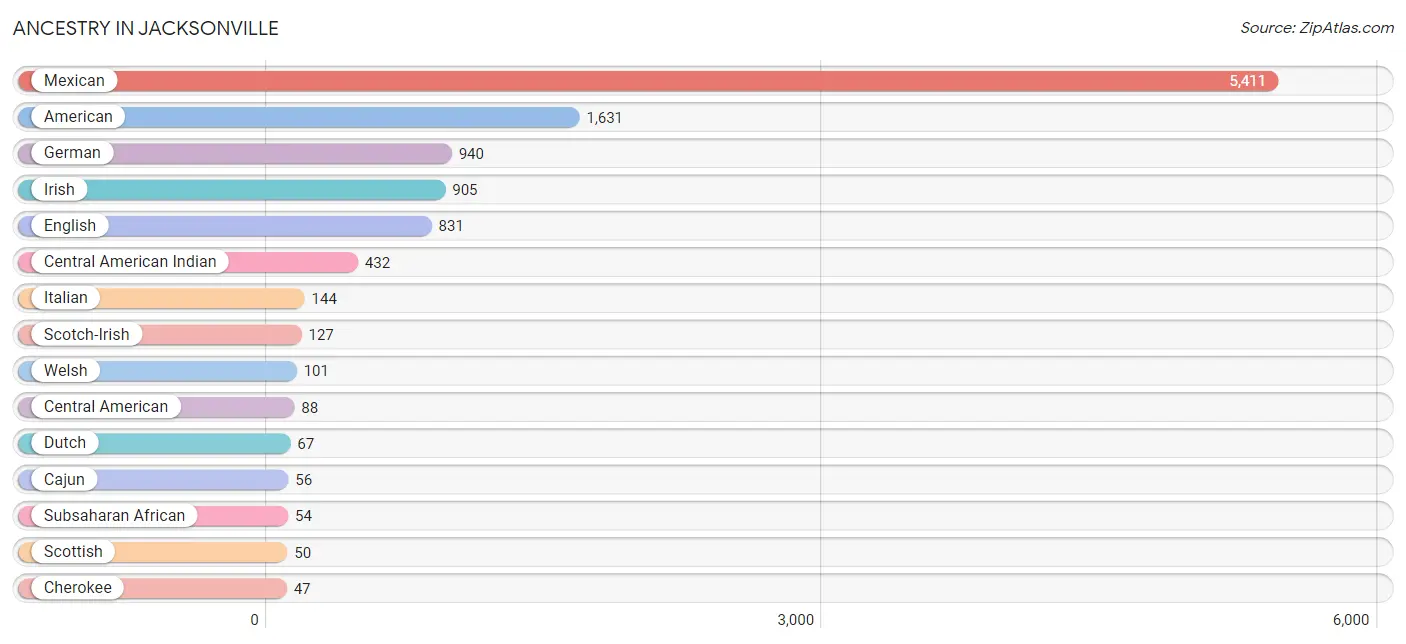
Ancestry in Jacksonville
The most populous ancestries reported in Jacksonville are Mexican (5,411 | 38.4%), American (1,631 | 11.6%), German (940 | 6.7%), Irish (905 | 6.4%), and English (831 | 5.9%), together accounting for 68.9% of all Jacksonville residents.
| Ancestry | # Population | % Population |
| African | 46 | 0.3% |
| American | 1,631 | 11.6% |
| Australian | 9 | 0.1% |
| Bhutanese | 3 | 0.0% |
| Brazilian | 17 | 0.1% |
| British | 20 | 0.1% |
| Cajun | 56 | 0.4% |
| Central American | 88 | 0.6% |
| Central American Indian | 432 | 3.1% |
| Cherokee | 47 | 0.3% |
| Czech | 18 | 0.1% |
| Danish | 9 | 0.1% |
| Dutch | 67 | 0.5% |
| Eastern European | 30 | 0.2% |
| English | 831 | 5.9% |
| European | 47 | 0.3% |
| Finnish | 7 | 0.1% |
| French | 43 | 0.3% |
| German | 940 | 6.7% |
| Guamanian / Chamorro | 9 | 0.1% |
| Guatemalan | 38 | 0.3% |
| Indian (Asian) | 28 | 0.2% |
| Irish | 905 | 6.4% |
| Italian | 144 | 1.0% |
| Korean | 30 | 0.2% |
| Mexican | 5,411 | 38.4% |
| Mexican American Indian | 22 | 0.2% |
| Nicaraguan | 40 | 0.3% |
| Nigerian | 8 | 0.1% |
| Northern European | 16 | 0.1% |
| Norwegian | 22 | 0.2% |
| Polish | 9 | 0.1% |
| Portuguese | 10 | 0.1% |
| Salvadoran | 10 | 0.1% |
| Samoan | 43 | 0.3% |
| Scotch-Irish | 127 | 0.9% |
| Scottish | 50 | 0.4% |
| Spaniard | 6 | 0.0% |
| Spanish | 16 | 0.1% |
| Subsaharan African | 54 | 0.4% |
| Swedish | 35 | 0.3% |
| Thai | 2 | 0.0% |
| Welsh | 101 | 0.7% | View All 43 Rows |
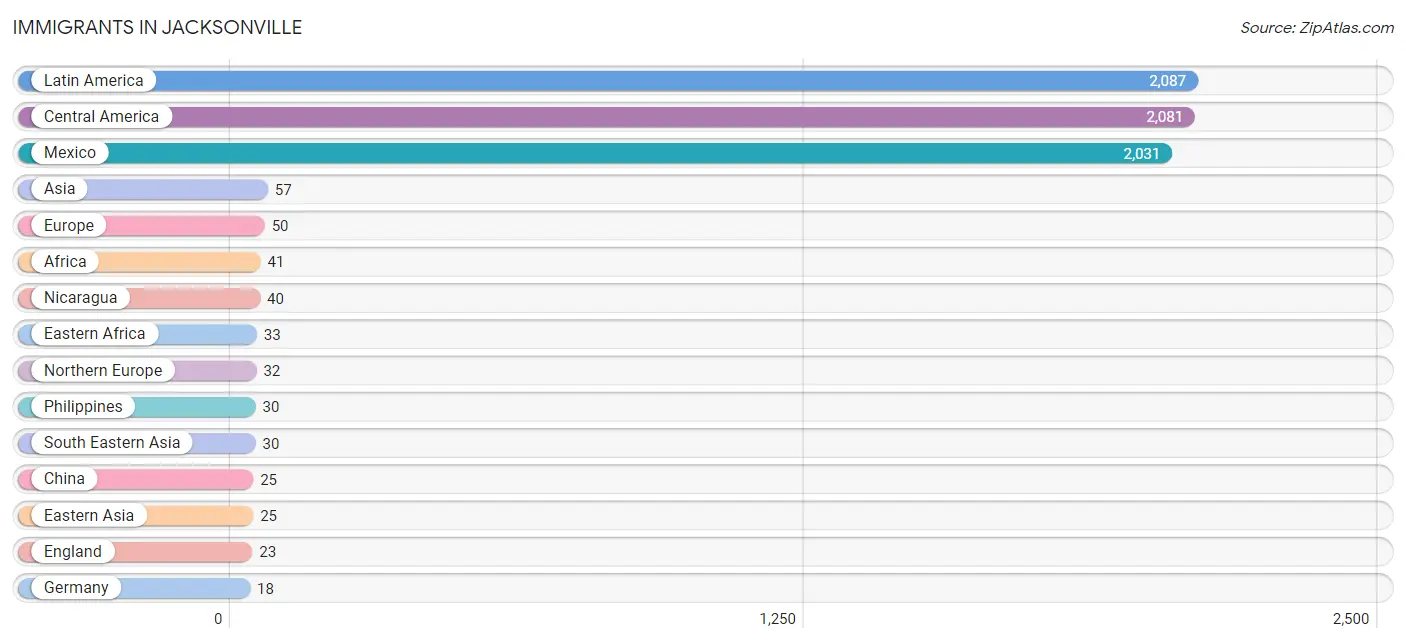
Immigrants in Jacksonville
The most numerous immigrant groups reported in Jacksonville came from Latin America (2,087 | 14.8%), Central America (2,081 | 14.7%), Mexico (2,031 | 14.4%), Asia (57 | 0.4%), and Europe (50 | 0.4%), together accounting for 44.7% of all Jacksonville residents.
| Immigration Origin | # Population | % Population |
| Africa | 41 | 0.3% |
| Asia | 57 | 0.4% |
| Brazil | 6 | 0.0% |
| Canada | 7 | 0.1% |
| Central America | 2,081 | 14.7% |
| China | 25 | 0.2% |
| Eastern Africa | 33 | 0.2% |
| Eastern Asia | 25 | 0.2% |
| El Salvador | 10 | 0.1% |
| England | 23 | 0.2% |
| Eritrea | 16 | 0.1% |
| Ethiopia | 17 | 0.1% |
| Europe | 50 | 0.4% |
| Germany | 18 | 0.1% |
| India | 2 | 0.0% |
| Latin America | 2,087 | 14.8% |
| Mexico | 2,031 | 14.4% |
| Nicaragua | 40 | 0.3% |
| Nigeria | 8 | 0.1% |
| Northern Europe | 32 | 0.2% |
| Philippines | 30 | 0.2% |
| South America | 6 | 0.0% |
| South Central Asia | 2 | 0.0% |
| South Eastern Asia | 30 | 0.2% |
| Western Africa | 8 | 0.1% |
| Western Europe | 18 | 0.1% | View All 26 Rows |
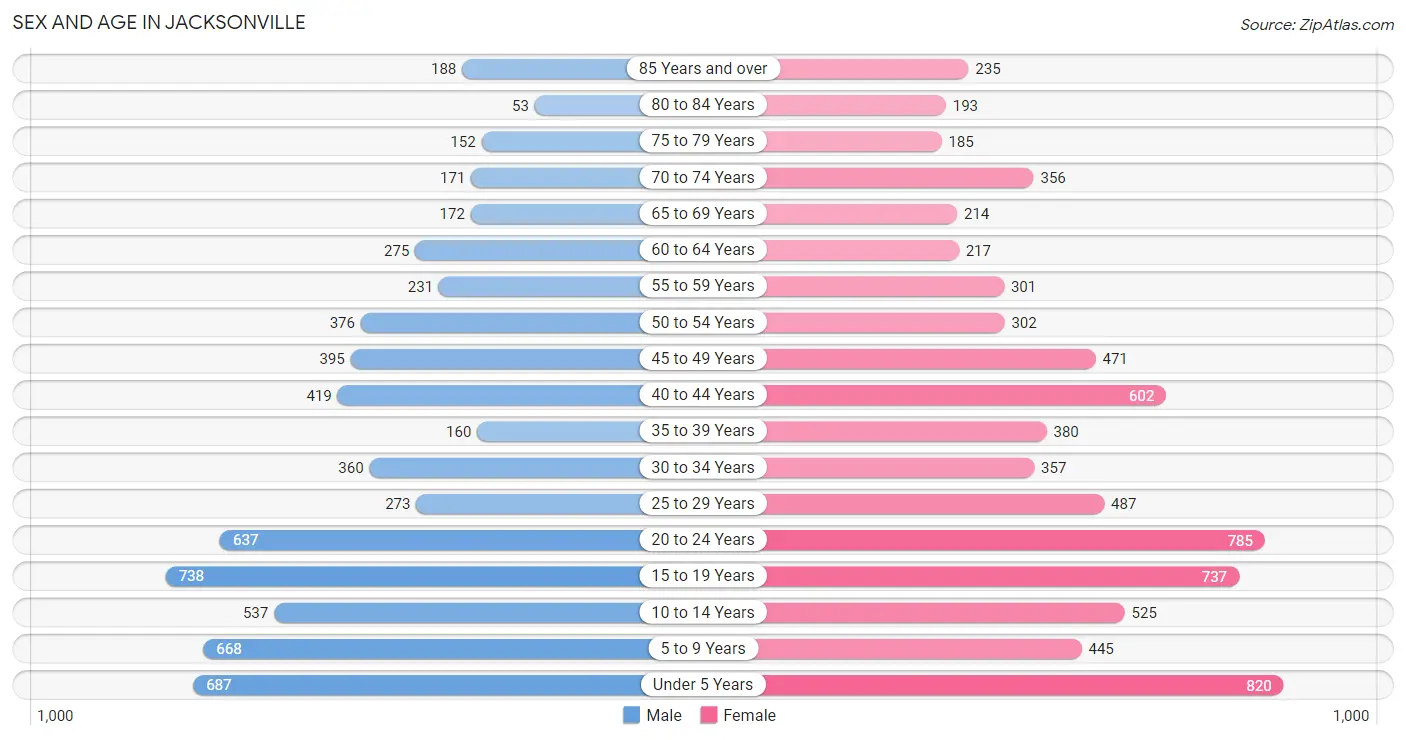
Sex and Age in Jacksonville
Sex and Age in Jacksonville
The most populous age groups in Jacksonville are 15 to 19 Years (738 | 11.4%) for men and Under 5 Years (820 | 10.8%) for women.
| Age Bracket | Male | Female |
| Under 5 Years | 687 (10.6%) | 820 (10.8%) |
| 5 to 9 Years | 668 (10.3%) | 445 (5.9%) |
| 10 to 14 Years | 537 (8.3%) | 525 (6.9%) |
| 15 to 19 Years | 738 (11.4%) | 737 (9.7%) |
| 20 to 24 Years | 637 (9.8%) | 785 (10.3%) |
| 25 to 29 Years | 273 (4.2%) | 487 (6.4%) |
| 30 to 34 Years | 360 (5.6%) | 357 (4.7%) |
| 35 to 39 Years | 160 (2.5%) | 380 (5.0%) |
| 40 to 44 Years | 419 (6.5%) | 602 (7.9%) |
| 45 to 49 Years | 395 (6.1%) | 471 (6.2%) |
| 50 to 54 Years | 376 (5.8%) | 302 (4.0%) |
| 55 to 59 Years | 231 (3.6%) | 301 (4.0%) |
| 60 to 64 Years | 275 (4.2%) | 217 (2.9%) |
| 65 to 69 Years | 172 (2.6%) | 214 (2.8%) |
| 70 to 74 Years | 171 (2.6%) | 356 (4.7%) |
| 75 to 79 Years | 152 (2.3%) | 185 (2.4%) |
| 80 to 84 Years | 53 (0.8%) | 193 (2.5%) |
| 85 Years and over | 188 (2.9%) | 235 (3.1%) |
| Total | 6,492 (100.0%) | 7,612 (100.0%) |
Families and Households in Jacksonville
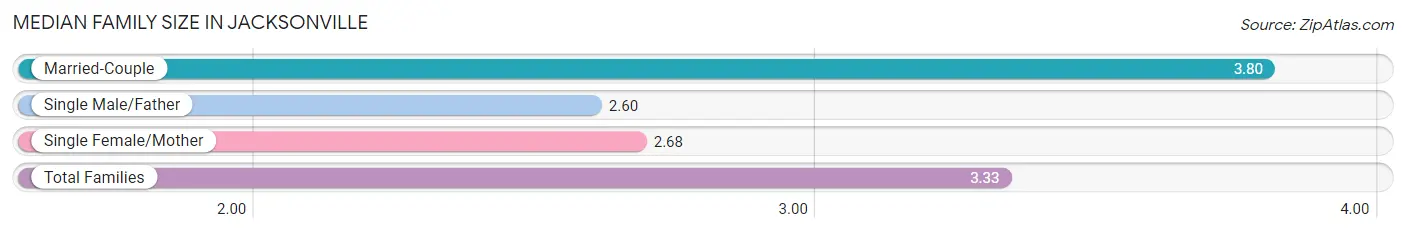
Median Family Size in Jacksonville
The median family size in Jacksonville is 3.33 persons per family, with married-couple families (2,142 | 59.2%) accounting for the largest median family size of 3.8 persons per family. On the other hand, single male/father families (382 | 10.5%) represent the smallest median family size with 2.60 persons per family.
| Family Type | # Families | Family Size |
| Married-Couple | 2,142 (59.2%) | 3.80 |
| Single Male/Father | 382 (10.5%) | 2.60 |
| Single Female/Mother | 1,097 (30.3%) | 2.68 |
| Total Families | 3,621 (100.0%) | 3.33 |
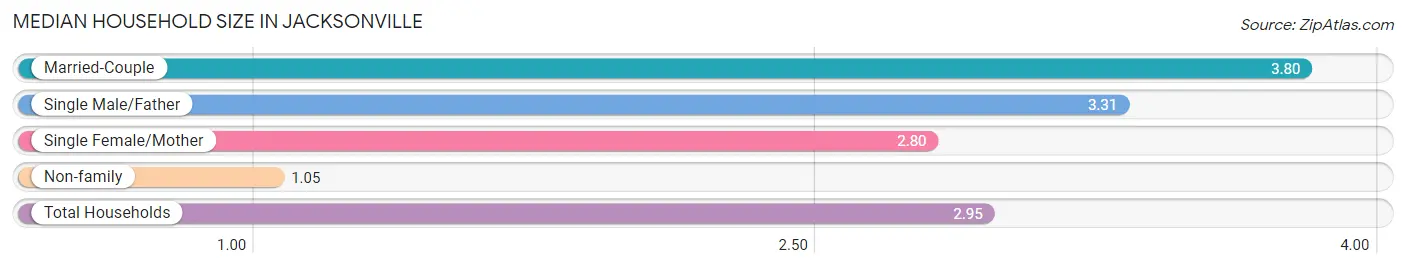
Median Household Size in Jacksonville
The median household size in Jacksonville is 2.95 persons per household, with married-couple households (2,142 | 46.8%) accounting for the largest median household size of 3.8 persons per household. non-family households (961 | 21.0%) represent the smallest median household size with 1.05 persons per household.
| Household Type | # Households | Household Size |
| Married-Couple | 2,142 (46.8%) | 3.80 |
| Single Male/Father | 382 (8.3%) | 3.31 |
| Single Female/Mother | 1,097 (23.9%) | 2.80 |
| Non-family | 961 (21.0%) | 1.05 |
| Total Households | 4,582 (100.0%) | 2.95 |
Household Size by Marriage Status in Jacksonville
Out of a total of 4,582 households in Jacksonville, 3,621 (79.0%) are family households, while 961 (21.0%) are nonfamily households. The most numerous type of family households are 2-person households, comprising 1,389, and the most common type of nonfamily households are 1-person households, comprising 898.
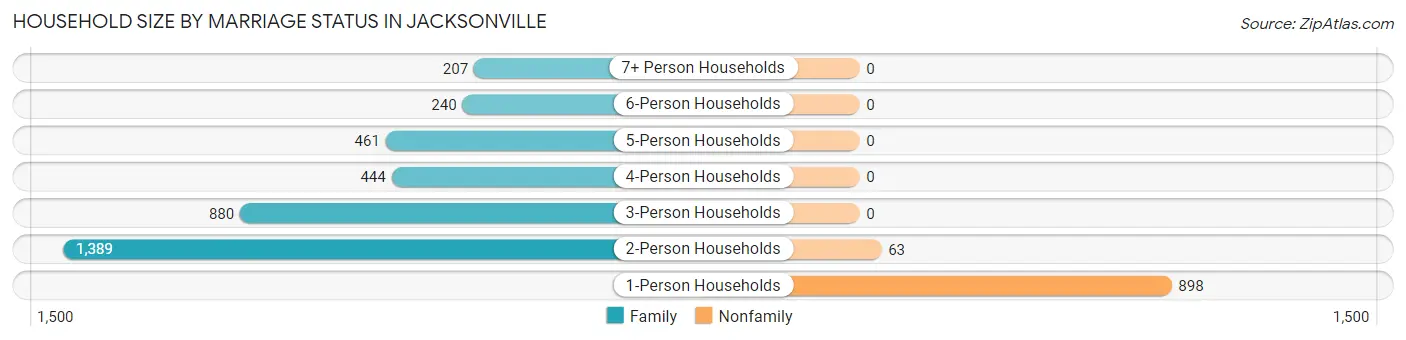
| Household Size | Family Households | Nonfamily Households |
| 1-Person Households | - | 898 (19.6%) |
| 2-Person Households | 1,389 (30.3%) | 63 (1.4%) |
| 3-Person Households | 880 (19.2%) | 0 (0.0%) |
| 4-Person Households | 444 (9.7%) | 0 (0.0%) |
| 5-Person Households | 461 (10.1%) | 0 (0.0%) |
| 6-Person Households | 240 (5.2%) | 0 (0.0%) |
| 7+ Person Households | 207 (4.5%) | 0 (0.0%) |
| Total | 3,621 (79.0%) | 961 (21.0%) |
Female Fertility in Jacksonville
Fertility by Age in Jacksonville
Average fertility rate in Jacksonville is 181.0 births per 1,000 women. Women in the age bracket of 20 to 34 years have the highest fertility rate with 353.0 births per 1,000 women. Women in the age bracket of 20 to 34 years acount for 80.4% of all women with births.
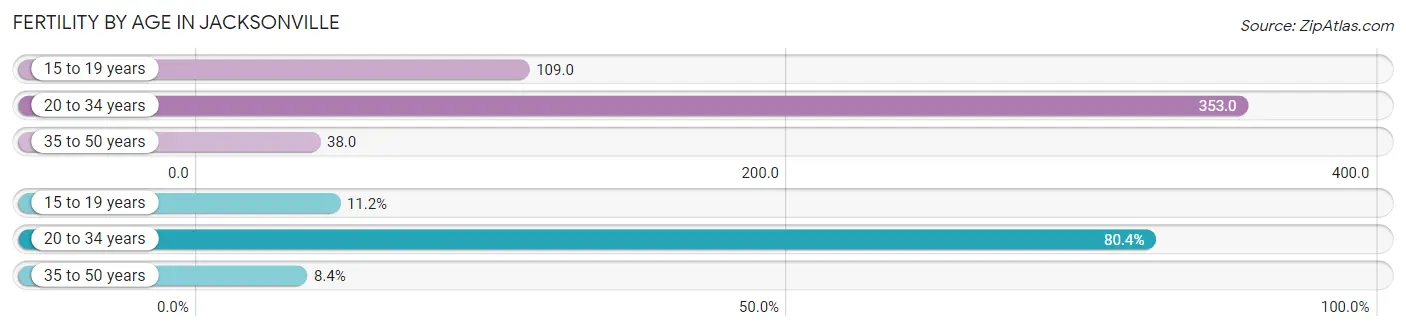
| Age Bracket | Women with Births | Births / 1,000 Women |
| 15 to 19 years | 80 (11.2%) | 109.0 |
| 20 to 34 years | 575 (80.4%) | 353.0 |
| 35 to 50 years | 60 (8.4%) | 38.0 |
| Total | 715 (100.0%) | 181.0 |
Fertility by Age by Marriage Status in Jacksonville
62.9% of women with births (715) in Jacksonville are married. The highest percentage of unmarried women with births falls into 15 to 19 years age bracket with 100.0% of them unmarried at the time of birth, while the lowest percentage of unmarried women with births belong to 35 to 50 years age bracket with 15.0% of them unmarried.
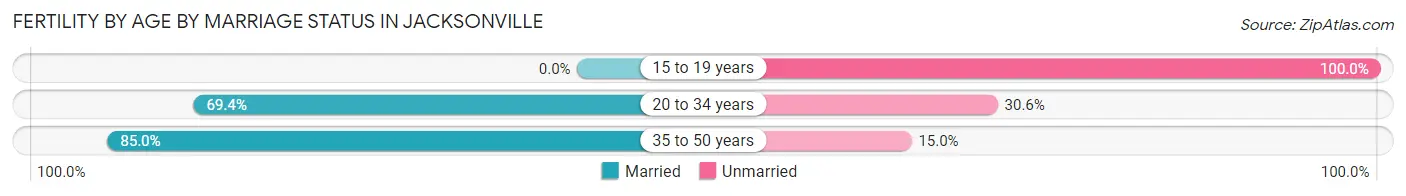
| Age Bracket | Married | Unmarried |
| 15 to 19 years | 0 (0.0%) | 80 (100.0%) |
| 20 to 34 years | 399 (69.4%) | 176 (30.6%) |
| 35 to 50 years | 51 (85.0%) | 9 (15.0%) |
| Total | 450 (62.9%) | 265 (37.1%) |
Fertility by Education in Jacksonville
Average fertility rate in Jacksonville is 181.0 births per 1,000 women. Women with the education attainment of graduate degree have the highest fertility rate of 401.0 births per 1,000 women, while women with the education attainment of high school diploma have the lowest fertility at 98.0 births per 1,000 women. Women with the education attainment of less than high school represent 37.9% of all women with births.
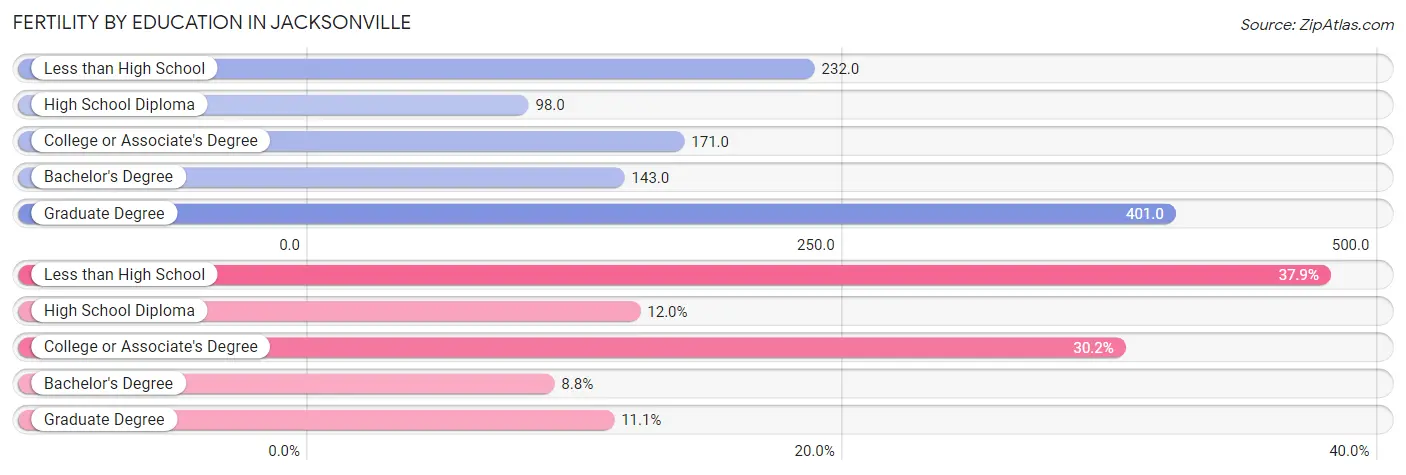
| Educational Attainment | Women with Births | Births / 1,000 Women |
| Less than High School | 271 (37.9%) | 232.0 |
| High School Diploma | 86 (12.0%) | 98.0 |
| College or Associate's Degree | 216 (30.2%) | 171.0 |
| Bachelor's Degree | 63 (8.8%) | 143.0 |
| Graduate Degree | 79 (11.1%) | 401.0 |
| Total | 715 (100.0%) | 181.0 |
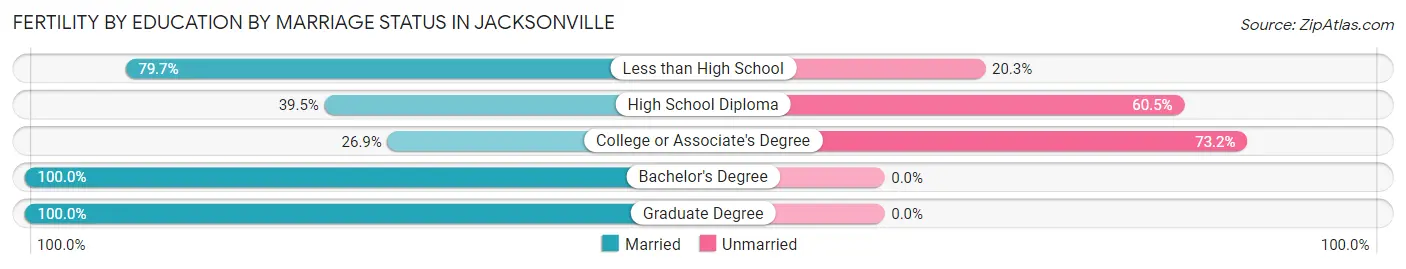
Fertility by Education by Marriage Status in Jacksonville
37.1% of women with births in Jacksonville are unmarried. Women with the educational attainment of bachelor's degree are most likely to be married with 100.0% of them married at childbirth, while women with the educational attainment of college or associate's degree are least likely to be married with 73.2% of them unmarried at childbirth.
| Educational Attainment | Married | Unmarried |
| Less than High School | 216 (79.7%) | 55 (20.3%) |
| High School Diploma | 34 (39.5%) | 52 (60.5%) |
| College or Associate's Degree | 58 (26.9%) | 158 (73.2%) |
| Bachelor's Degree | 63 (100.0%) | 0 (0.0%) |
| Graduate Degree | 79 (100.0%) | 0 (0.0%) |
| Total | 450 (62.9%) | 265 (37.1%) |
Employment Characteristics in Jacksonville
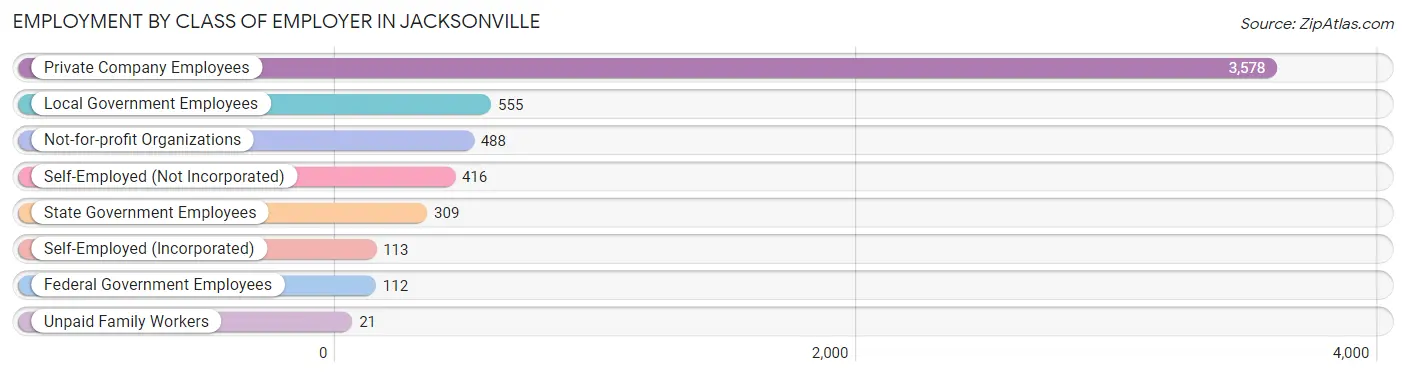
Employment by Class of Employer in Jacksonville
Among the 5,592 employed individuals in Jacksonville, private company employees (3,578 | 64.0%), local government employees (555 | 9.9%), and not-for-profit organizations (488 | 8.7%) make up the most common classes of employment.
| Employer Class | # Employees | % Employees |
| Private Company Employees | 3,578 | 64.0% |
| Self-Employed (Incorporated) | 113 | 2.0% |
| Self-Employed (Not Incorporated) | 416 | 7.4% |
| Not-for-profit Organizations | 488 | 8.7% |
| Local Government Employees | 555 | 9.9% |
| State Government Employees | 309 | 5.5% |
| Federal Government Employees | 112 | 2.0% |
| Unpaid Family Workers | 21 | 0.4% |
| Total | 5,592 | 100.0% |
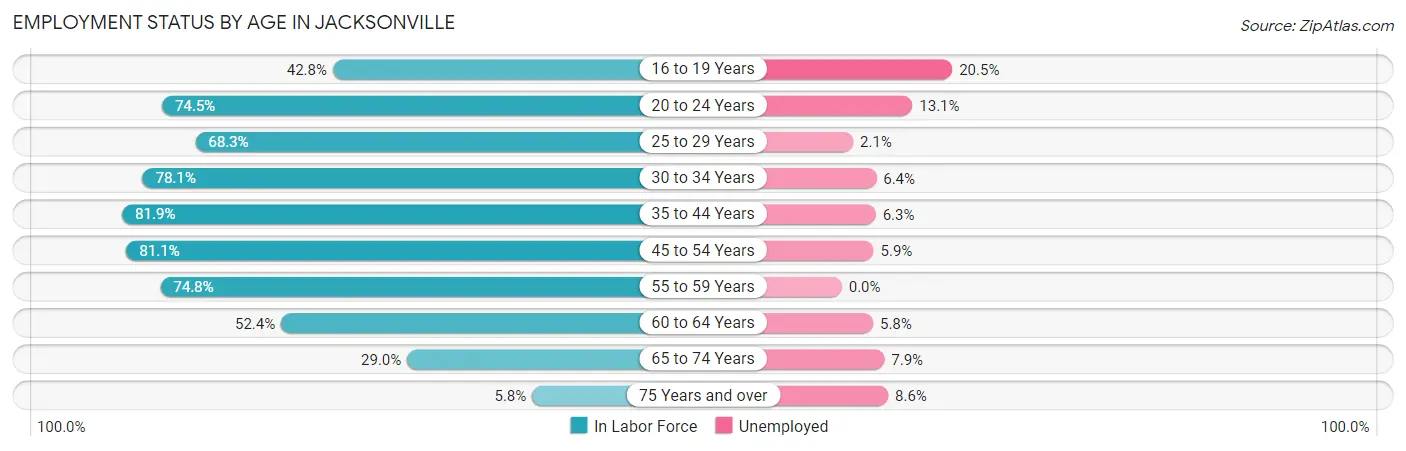
Employment Status by Age in Jacksonville
According to the labor force statistics for Jacksonville, out of the total population over 16 years of age (10,190), 60.6% or 6,175 individuals are in the labor force, with 7.9% or 488 of them unemployed. The age group with the highest labor force participation rate is 35 to 44 years, with 81.9% or 1,278 individuals in the labor force. Within the labor force, the 16 to 19 years age range has the highest percentage of unemployed individuals, with 20.5% or 109 of them being unemployed.
| Age Bracket | In Labor Force | Unemployed |
| 16 to 19 Years | 532 (42.8%) | 109 (20.5%) |
| 20 to 24 Years | 1,059 (74.5%) | 139 (13.1%) |
| 25 to 29 Years | 519 (68.3%) | 11 (2.1%) |
| 30 to 34 Years | 560 (78.1%) | 36 (6.4%) |
| 35 to 44 Years | 1,278 (81.9%) | 81 (6.3%) |
| 45 to 54 Years | 1,252 (81.1%) | 74 (5.9%) |
| 55 to 59 Years | 398 (74.8%) | 0 (0.0%) |
| 60 to 64 Years | 258 (52.4%) | 15 (5.8%) |
| 65 to 74 Years | 265 (29.0%) | 21 (7.9%) |
| 75 Years and over | 58 (5.8%) | 5 (8.6%) |
| Total | 6,175 (60.6%) | 488 (7.9%) |
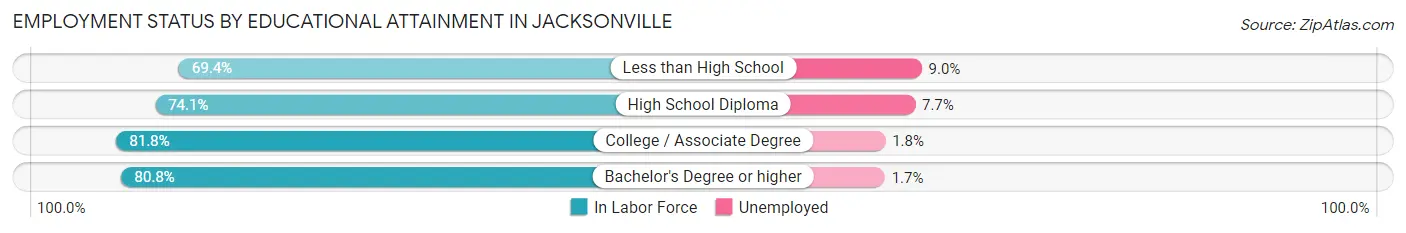
Employment Status by Educational Attainment in Jacksonville
According to labor force statistics for Jacksonville, 76.1% of individuals (4,266) out of the total population between 25 and 64 years of age (5,606) are in the labor force, with 5.1% or 218 of them being unemployed. The group with the highest labor force participation rate are those with the educational attainment of college / associate degree, with 81.8% or 1,200 individuals in the labor force. Within the labor force, individuals with less than high school education have the highest percentage of unemployment, with 9.0% or 103 of them being unemployed.
| Educational Attainment | In Labor Force | Unemployed |
| Less than High School | 1,149 (69.4%) | 149 (9.0%) |
| High School Diploma | 981 (74.1%) | 102 (7.7%) |
| College / Associate Degree | 1,200 (81.8%) | 26 (1.8%) |
| Bachelor's Degree or higher | 937 (80.8%) | 20 (1.7%) |
| Total | 4,266 (76.1%) | 286 (5.1%) |
Employment Occupations by Sex in Jacksonville
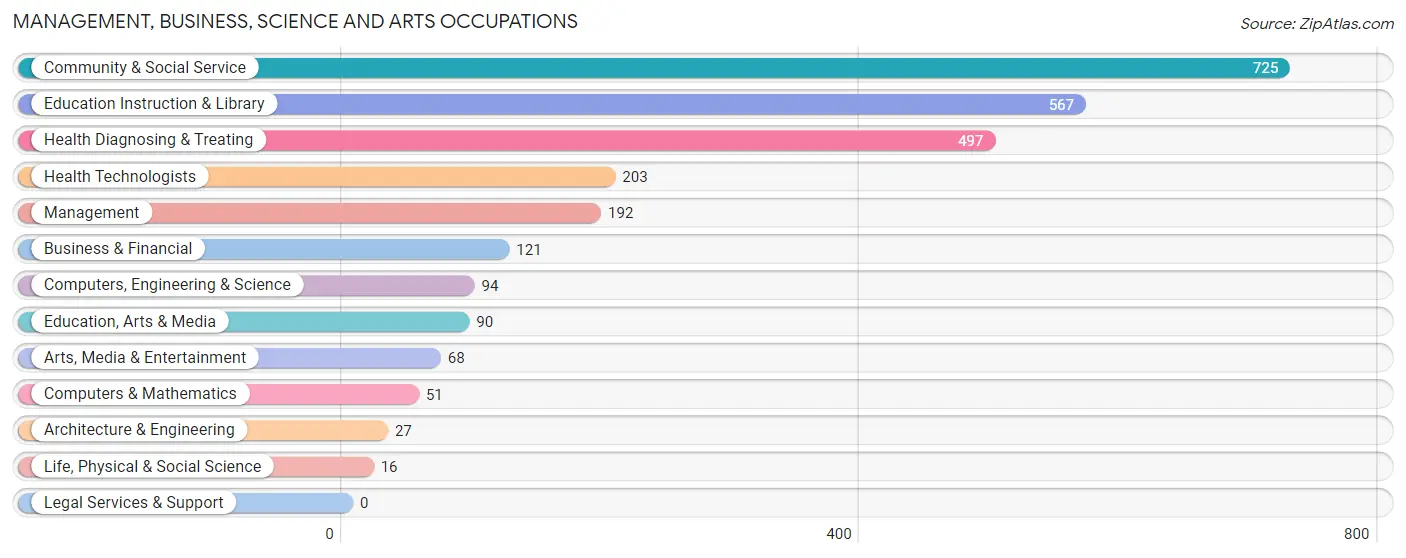
Management, Business, Science and Arts Occupations
The most common Management, Business, Science and Arts occupations in Jacksonville are Community & Social Service (725 | 12.7%), Education Instruction & Library (567 | 10.0%), Health Diagnosing & Treating (497 | 8.7%), Health Technologists (203 | 3.6%), and Management (192 | 3.4%).
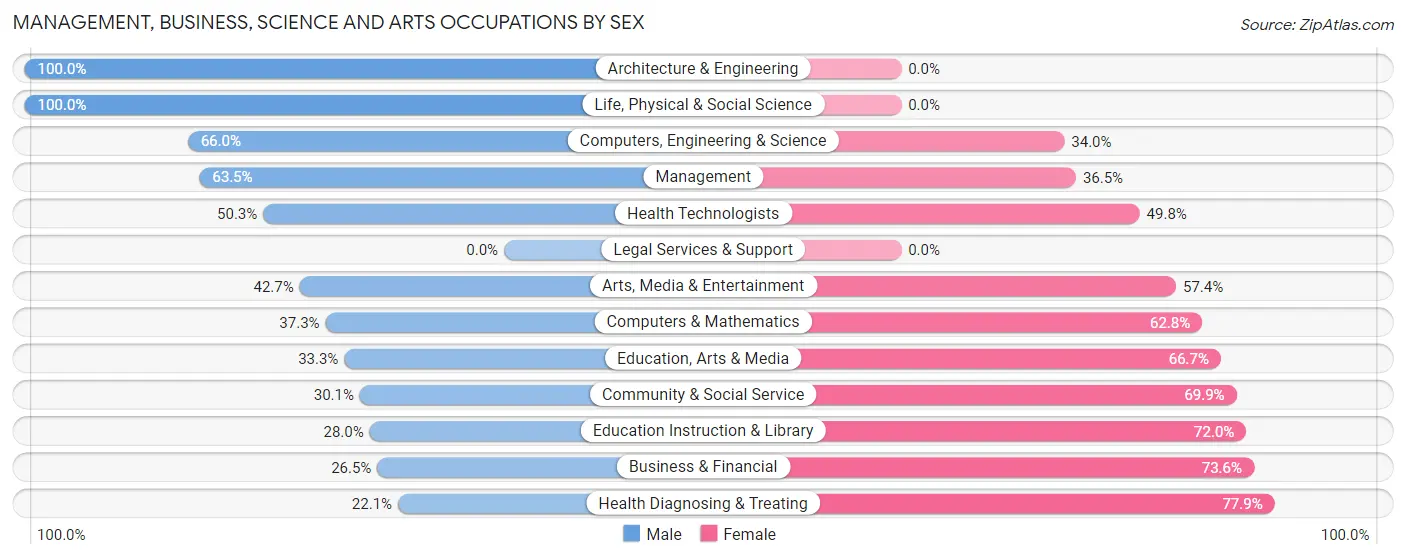
Management, Business, Science and Arts Occupations by Sex
Within the Management, Business, Science and Arts occupations in Jacksonville, the most male-oriented occupations are Architecture & Engineering (100.0%), Life, Physical & Social Science (100.0%), and Computers, Engineering & Science (66.0%), while the most female-oriented occupations are Health Diagnosing & Treating (77.9%), Business & Financial (73.6%), and Education Instruction & Library (72.0%).
| Occupation | Male | Female |
| Management | 122 (63.5%) | 70 (36.5%) |
| Business & Financial | 32 (26.5%) | 89 (73.6%) |
| Computers, Engineering & Science | 62 (66.0%) | 32 (34.0%) |
| Computers & Mathematics | 19 (37.2%) | 32 (62.7%) |
| Architecture & Engineering | 27 (100.0%) | 0 (0.0%) |
| Life, Physical & Social Science | 16 (100.0%) | 0 (0.0%) |
| Community & Social Service | 218 (30.1%) | 507 (69.9%) |
| Education, Arts & Media | 30 (33.3%) | 60 (66.7%) |
| Legal Services & Support | 0 (0.0%) | 0 (0.0%) |
| Education Instruction & Library | 159 (28.0%) | 408 (72.0%) |
| Arts, Media & Entertainment | 29 (42.6%) | 39 (57.4%) |
| Health Diagnosing & Treating | 110 (22.1%) | 387 (77.9%) |
| Health Technologists | 102 (50.2%) | 101 (49.7%) |
| Total (Category) | 544 (33.4%) | 1,085 (66.6%) |
| Total (Overall) | 2,750 (48.3%) | 2,939 (51.7%) |
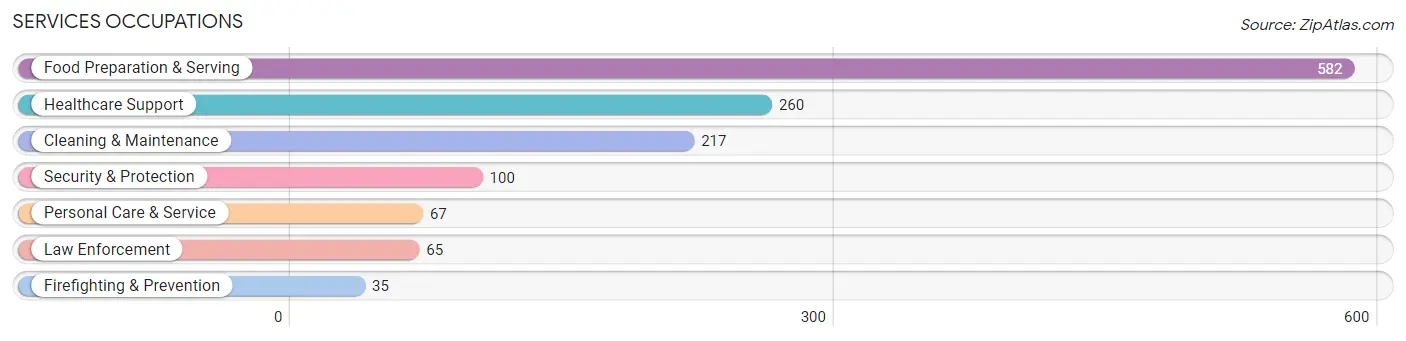
Services Occupations
The most common Services occupations in Jacksonville are Food Preparation & Serving (582 | 10.2%), Healthcare Support (260 | 4.6%), Cleaning & Maintenance (217 | 3.8%), Security & Protection (100 | 1.8%), and Personal Care & Service (67 | 1.2%).
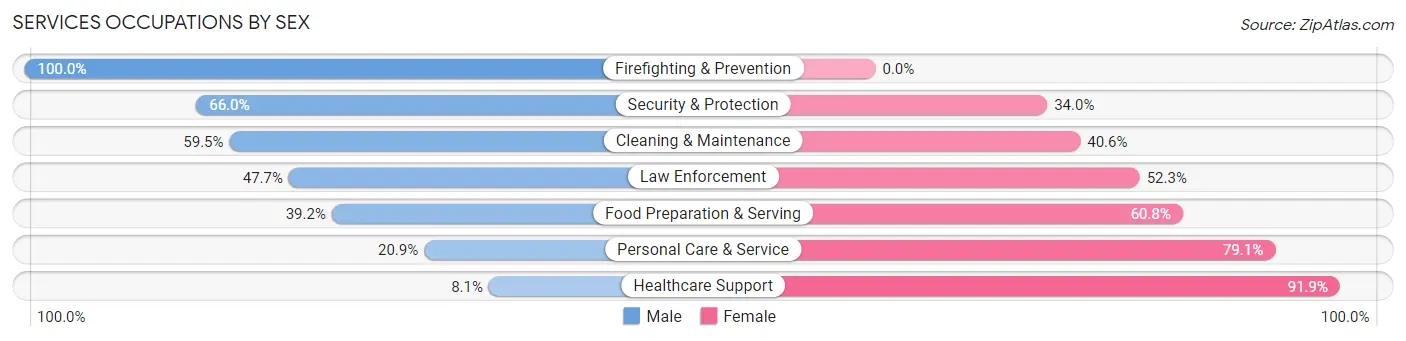
Services Occupations by Sex
Within the Services occupations in Jacksonville, the most male-oriented occupations are Firefighting & Prevention (100.0%), Security & Protection (66.0%), and Cleaning & Maintenance (59.5%), while the most female-oriented occupations are Healthcare Support (91.9%), Personal Care & Service (79.1%), and Food Preparation & Serving (60.8%).
| Occupation | Male | Female |
| Healthcare Support | 21 (8.1%) | 239 (91.9%) |
| Security & Protection | 66 (66.0%) | 34 (34.0%) |
| Firefighting & Prevention | 35 (100.0%) | 0 (0.0%) |
| Law Enforcement | 31 (47.7%) | 34 (52.3%) |
| Food Preparation & Serving | 228 (39.2%) | 354 (60.8%) |
| Cleaning & Maintenance | 129 (59.5%) | 88 (40.6%) |
| Personal Care & Service | 14 (20.9%) | 53 (79.1%) |
| Total (Category) | 458 (37.4%) | 768 (62.6%) |
| Total (Overall) | 2,750 (48.3%) | 2,939 (51.7%) |
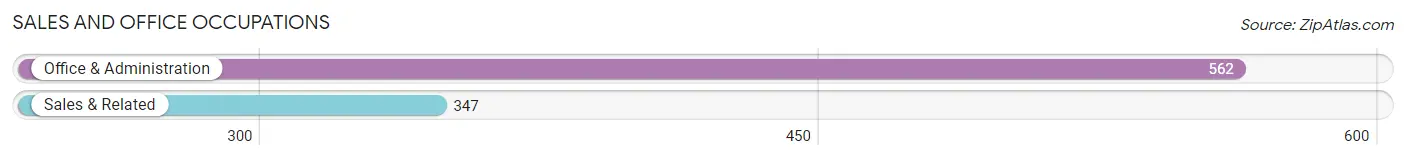
Sales and Office Occupations
The most common Sales and Office occupations in Jacksonville are Office & Administration (562 | 9.9%), and Sales & Related (347 | 6.1%).
Sales and Office Occupations by Sex
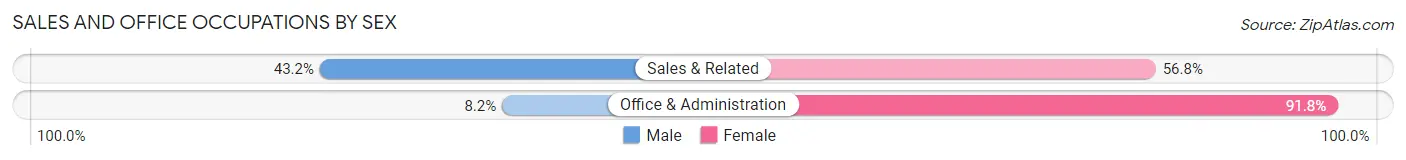
| Occupation | Male | Female |
| Sales & Related | 150 (43.2%) | 197 (56.8%) |
| Office & Administration | 46 (8.2%) | 516 (91.8%) |
| Total (Category) | 196 (21.6%) | 713 (78.4%) |
| Total (Overall) | 2,750 (48.3%) | 2,939 (51.7%) |
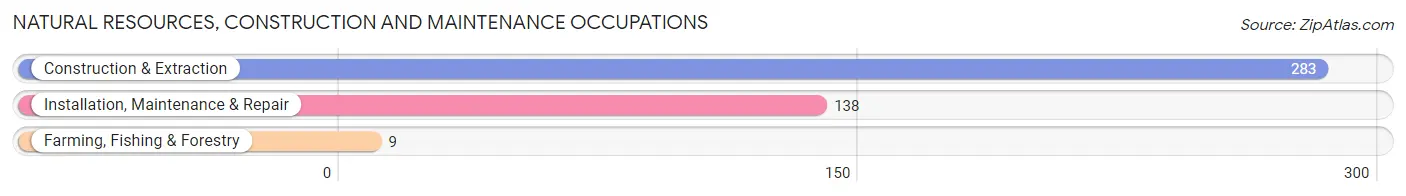
Natural Resources, Construction and Maintenance Occupations
The most common Natural Resources, Construction and Maintenance occupations in Jacksonville are Construction & Extraction (283 | 5.0%), Installation, Maintenance & Repair (138 | 2.4%), and Farming, Fishing & Forestry (9 | 0.2%).
Natural Resources, Construction and Maintenance Occupations by Sex
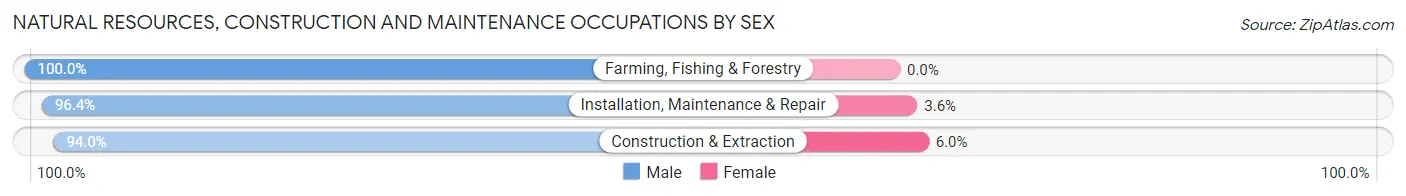
| Occupation | Male | Female |
| Farming, Fishing & Forestry | 9 (100.0%) | 0 (0.0%) |
| Construction & Extraction | 266 (94.0%) | 17 (6.0%) |
| Installation, Maintenance & Repair | 133 (96.4%) | 5 (3.6%) |
| Total (Category) | 408 (94.9%) | 22 (5.1%) |
| Total (Overall) | 2,750 (48.3%) | 2,939 (51.7%) |
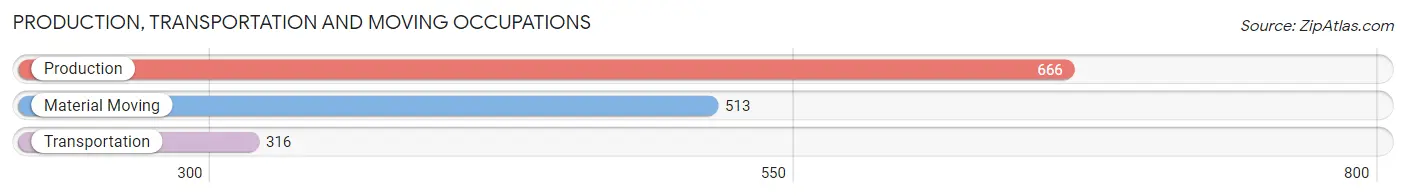
Production, Transportation and Moving Occupations
The most common Production, Transportation and Moving occupations in Jacksonville are Production (666 | 11.7%), Material Moving (513 | 9.0%), and Transportation (316 | 5.6%).
Production, Transportation and Moving Occupations by Sex
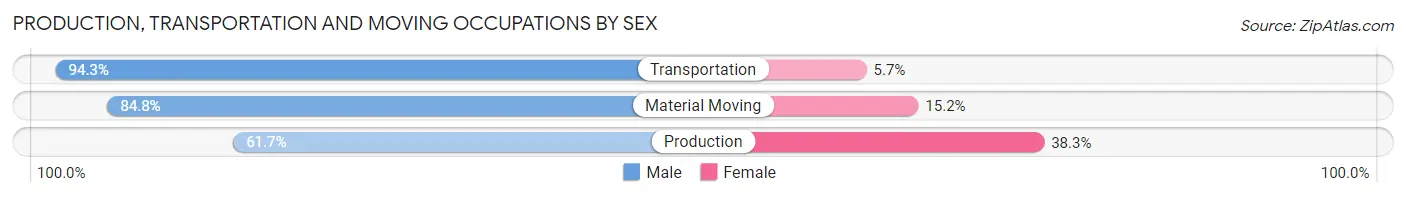
| Occupation | Male | Female |
| Production | 411 (61.7%) | 255 (38.3%) |
| Transportation | 298 (94.3%) | 18 (5.7%) |
| Material Moving | 435 (84.8%) | 78 (15.2%) |
| Total (Category) | 1,144 (76.5%) | 351 (23.5%) |
| Total (Overall) | 2,750 (48.3%) | 2,939 (51.7%) |
Employment Industries by Sex in Jacksonville
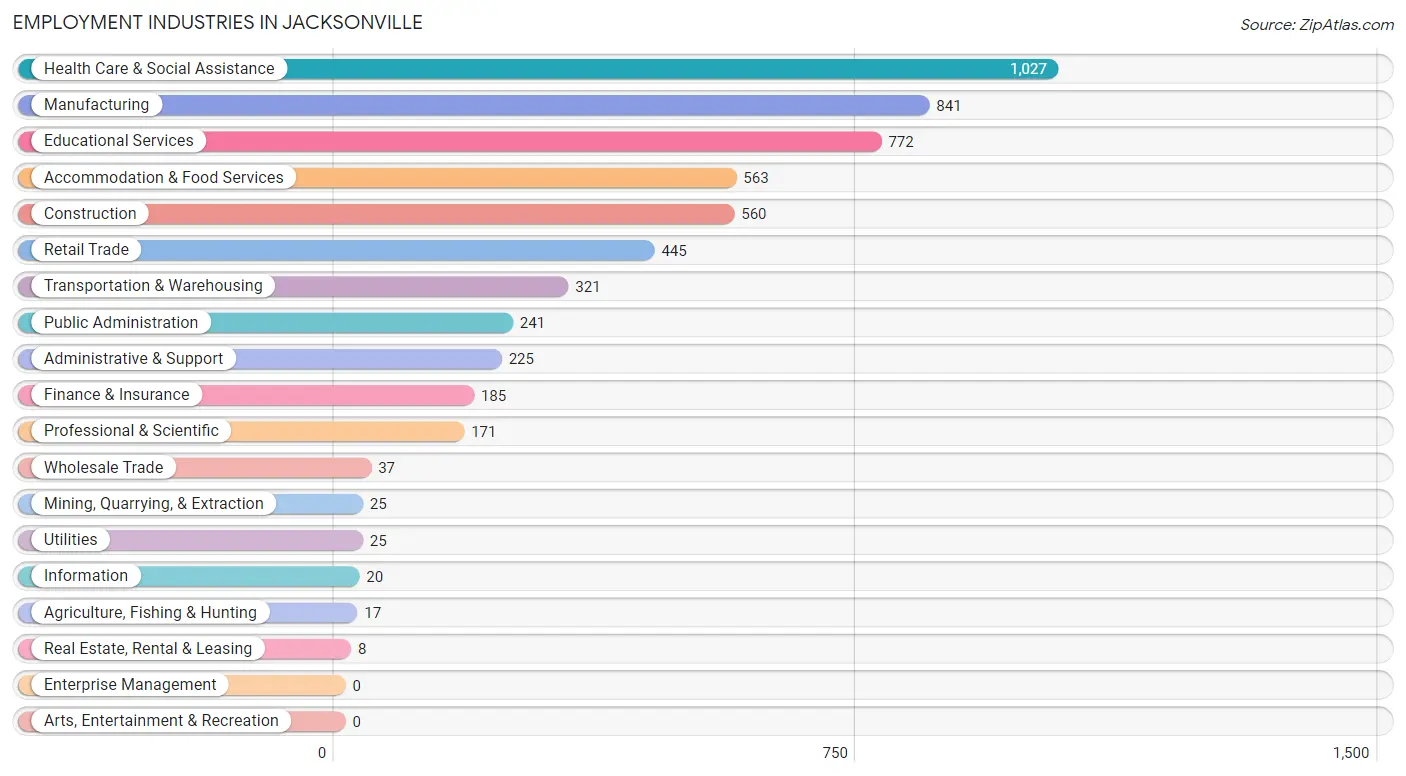
Employment Industries in Jacksonville
The major employment industries in Jacksonville include Health Care & Social Assistance (1,027 | 18.0%), Manufacturing (841 | 14.8%), Educational Services (772 | 13.6%), Accommodation & Food Services (563 | 9.9%), and Construction (560 | 9.8%).
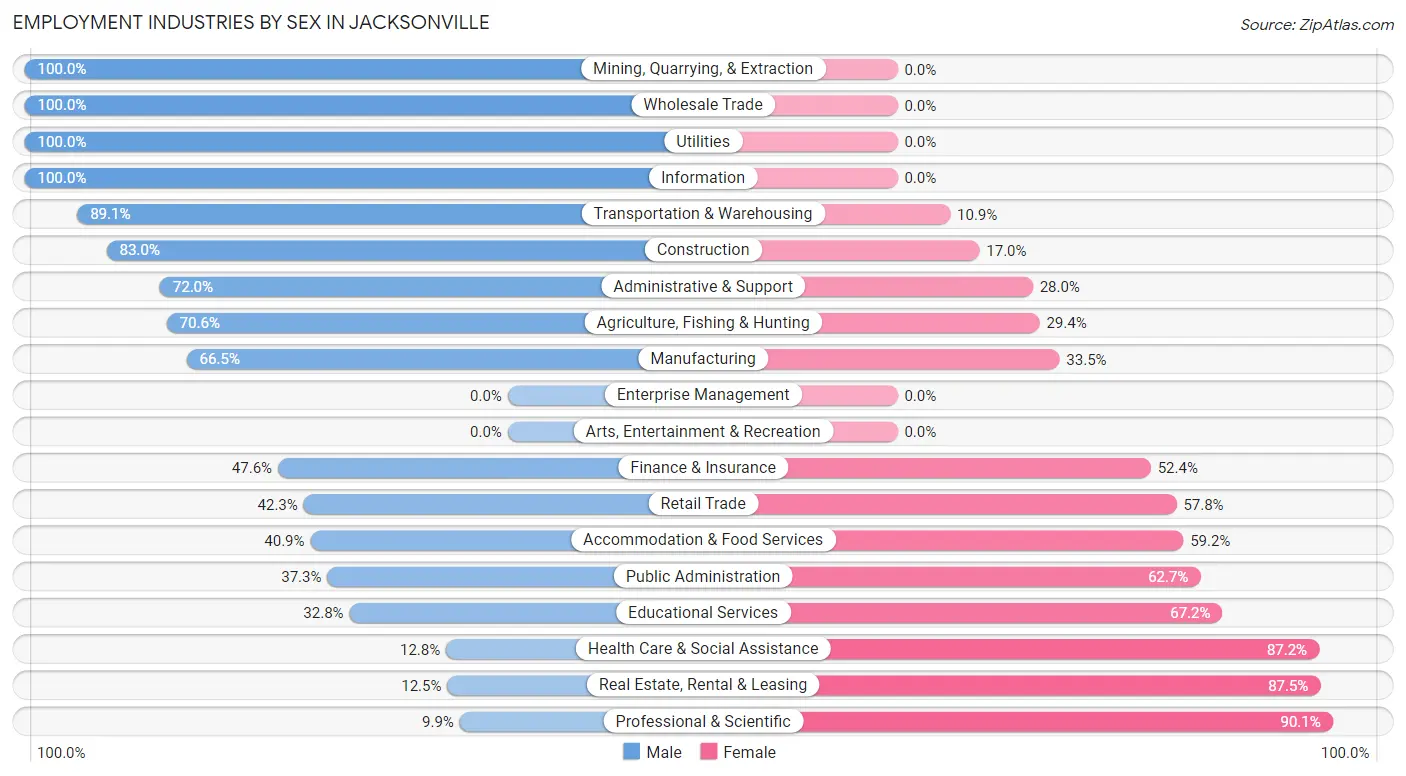
Employment Industries by Sex in Jacksonville
The Jacksonville industries that see more men than women are Mining, Quarrying, & Extraction (100.0%), Wholesale Trade (100.0%), and Utilities (100.0%), whereas the industries that tend to have a higher number of women are Professional & Scientific (90.1%), Real Estate, Rental & Leasing (87.5%), and Health Care & Social Assistance (87.2%).
| Industry | Male | Female |
| Agriculture, Fishing & Hunting | 12 (70.6%) | 5 (29.4%) |
| Mining, Quarrying, & Extraction | 25 (100.0%) | 0 (0.0%) |
| Construction | 465 (83.0%) | 95 (17.0%) |
| Manufacturing | 559 (66.5%) | 282 (33.5%) |
| Wholesale Trade | 37 (100.0%) | 0 (0.0%) |
| Retail Trade | 188 (42.2%) | 257 (57.8%) |
| Transportation & Warehousing | 286 (89.1%) | 35 (10.9%) |
| Utilities | 25 (100.0%) | 0 (0.0%) |
| Information | 20 (100.0%) | 0 (0.0%) |
| Finance & Insurance | 88 (47.6%) | 97 (52.4%) |
| Real Estate, Rental & Leasing | 1 (12.5%) | 7 (87.5%) |
| Professional & Scientific | 17 (9.9%) | 154 (90.1%) |
| Enterprise Management | 0 (0.0%) | 0 (0.0%) |
| Administrative & Support | 162 (72.0%) | 63 (28.0%) |
| Educational Services | 253 (32.8%) | 519 (67.2%) |
| Health Care & Social Assistance | 131 (12.8%) | 896 (87.2%) |
| Arts, Entertainment & Recreation | 0 (0.0%) | 0 (0.0%) |
| Accommodation & Food Services | 230 (40.8%) | 333 (59.2%) |
| Public Administration | 90 (37.3%) | 151 (62.7%) |
| Total | 2,750 (48.3%) | 2,939 (51.7%) |
Education in Jacksonville
School Enrollment in Jacksonville
The most common levels of schooling among the 4,277 students in Jacksonville are high school (999 | 23.4%), middle school (950 | 22.2%), and college / undergraduate (904 | 21.1%).
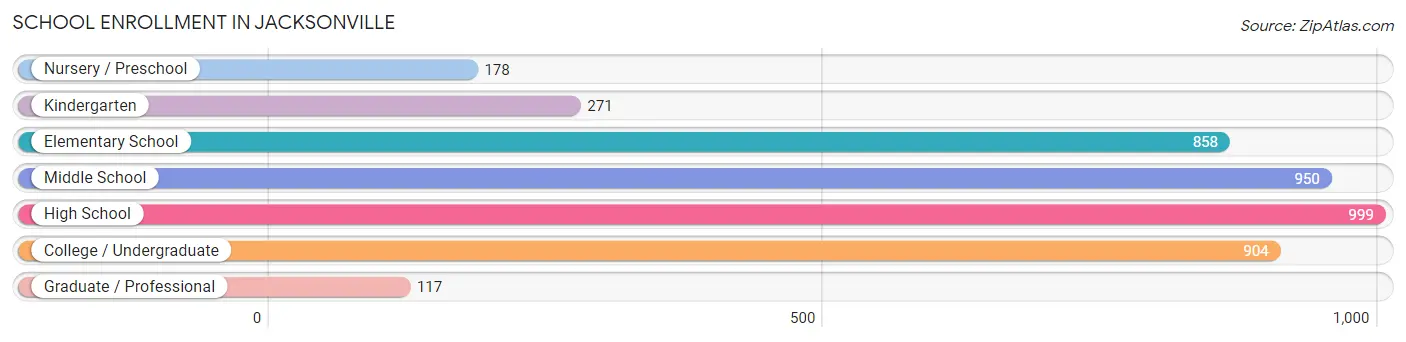
| School Level | # Students | % Students |
| Nursery / Preschool | 178 | 4.2% |
| Kindergarten | 271 | 6.3% |
| Elementary School | 858 | 20.1% |
| Middle School | 950 | 22.2% |
| High School | 999 | 23.4% |
| College / Undergraduate | 904 | 21.1% |
| Graduate / Professional | 117 | 2.7% |
| Total | 4,277 | 100.0% |
School Enrollment by Age by Funding Source in Jacksonville
Out of a total of 4,277 students who are enrolled in schools in Jacksonville, 381 (8.9%) attend a private institution, while the remaining 3,896 (91.1%) are enrolled in public schools. The age group of 35 years and over has the highest likelihood of being enrolled in private schools, with 63 (49.6% in the age bracket) enrolled. Conversely, the age group of 3 to 4 year olds has the lowest likelihood of being enrolled in a private school, with 130 (100.0% in the age bracket) attending a public institution.
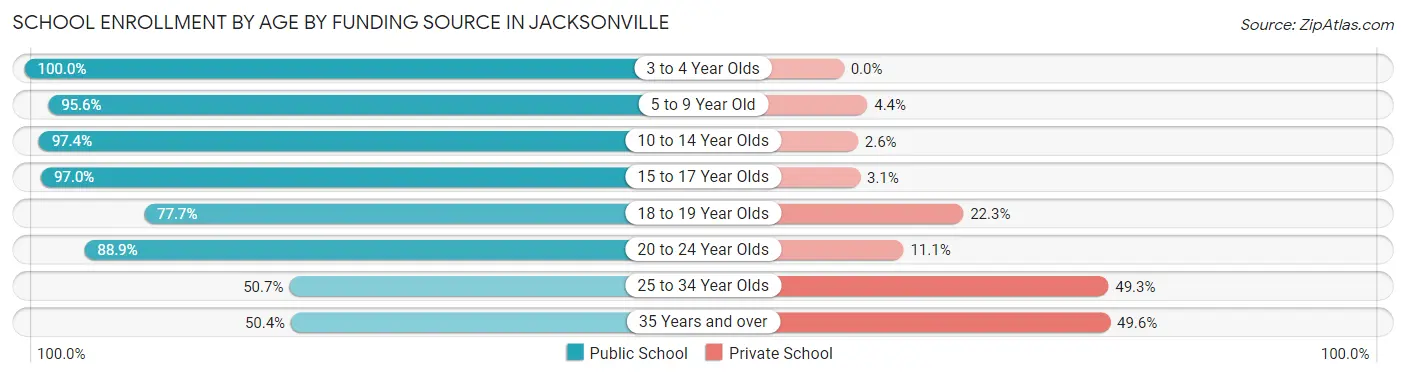
| Age Bracket | Public School | Private School |
| 3 to 4 Year Olds | 130 (100.0%) | 0 (0.0%) |
| 5 to 9 Year Old | 1,064 (95.6%) | 49 (4.4%) |
| 10 to 14 Year Olds | 1,034 (97.4%) | 28 (2.6%) |
| 15 to 17 Year Olds | 826 (97.0%) | 26 (3.0%) |
| 18 to 19 Year Olds | 349 (77.7%) | 100 (22.3%) |
| 20 to 24 Year Olds | 359 (88.9%) | 45 (11.1%) |
| 25 to 34 Year Olds | 71 (50.7%) | 69 (49.3%) |
| 35 Years and over | 64 (50.4%) | 63 (49.6%) |
| Total | 3,896 (91.1%) | 381 (8.9%) |
Educational Attainment by Field of Study in Jacksonville
Arts & humanities (310 | 18.3%), science & technology (288 | 17.0%), business (262 | 15.5%), education (249 | 14.7%), and liberal arts & history (119 | 7.0%) are the most common fields of study among 1,691 individuals in Jacksonville who have obtained a bachelor's degree or higher.
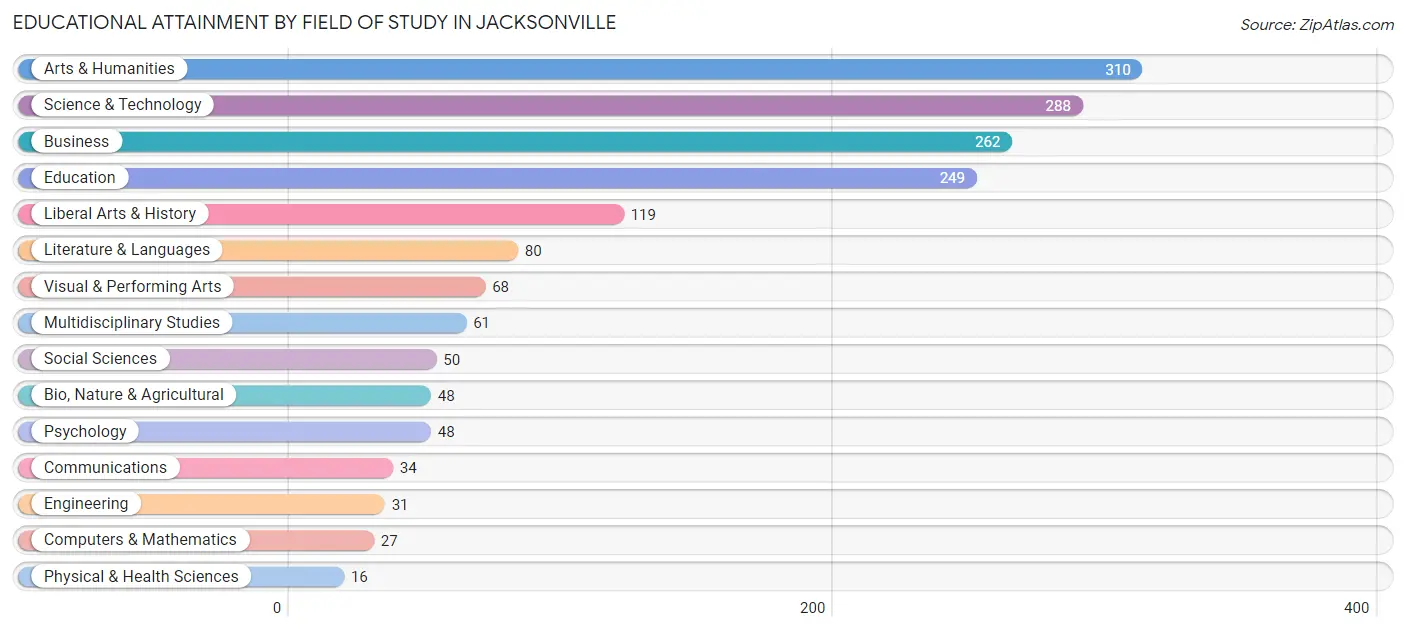
| Field of Study | # Graduates | % Graduates |
| Computers & Mathematics | 27 | 1.6% |
| Bio, Nature & Agricultural | 48 | 2.8% |
| Physical & Health Sciences | 16 | 0.9% |
| Psychology | 48 | 2.8% |
| Social Sciences | 50 | 3.0% |
| Engineering | 31 | 1.8% |
| Multidisciplinary Studies | 61 | 3.6% |
| Science & Technology | 288 | 17.0% |
| Business | 262 | 15.5% |
| Education | 249 | 14.7% |
| Literature & Languages | 80 | 4.7% |
| Liberal Arts & History | 119 | 7.0% |
| Visual & Performing Arts | 68 | 4.0% |
| Communications | 34 | 2.0% |
| Arts & Humanities | 310 | 18.3% |
| Total | 1,691 | 100.0% |
Transportation & Commute in Jacksonville
Vehicle Availability by Sex in Jacksonville
The most prevalent vehicle ownership categories in Jacksonville are males with 2 vehicles (1,178, accounting for 45.5%) and females with 2 vehicles (992, making up 40.5%).
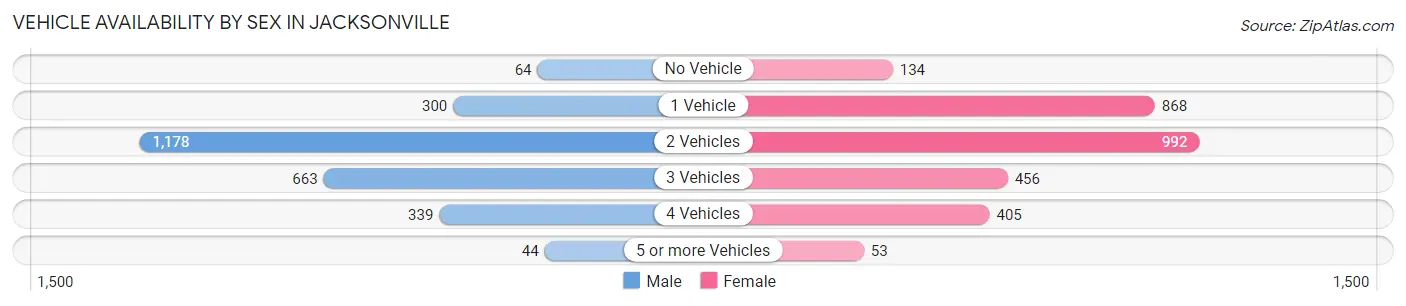
| Vehicles Available | Male | Female |
| No Vehicle | 64 (2.5%) | 134 (4.6%) |
| 1 Vehicle | 300 (11.6%) | 868 (29.8%) |
| 2 Vehicles | 1,178 (45.5%) | 992 (34.1%) |
| 3 Vehicles | 663 (25.6%) | 456 (15.7%) |
| 4 Vehicles | 339 (13.1%) | 405 (13.9%) |
| 5 or more Vehicles | 44 (1.7%) | 53 (1.8%) |
| Total | 2,588 (100.0%) | 2,908 (100.0%) |
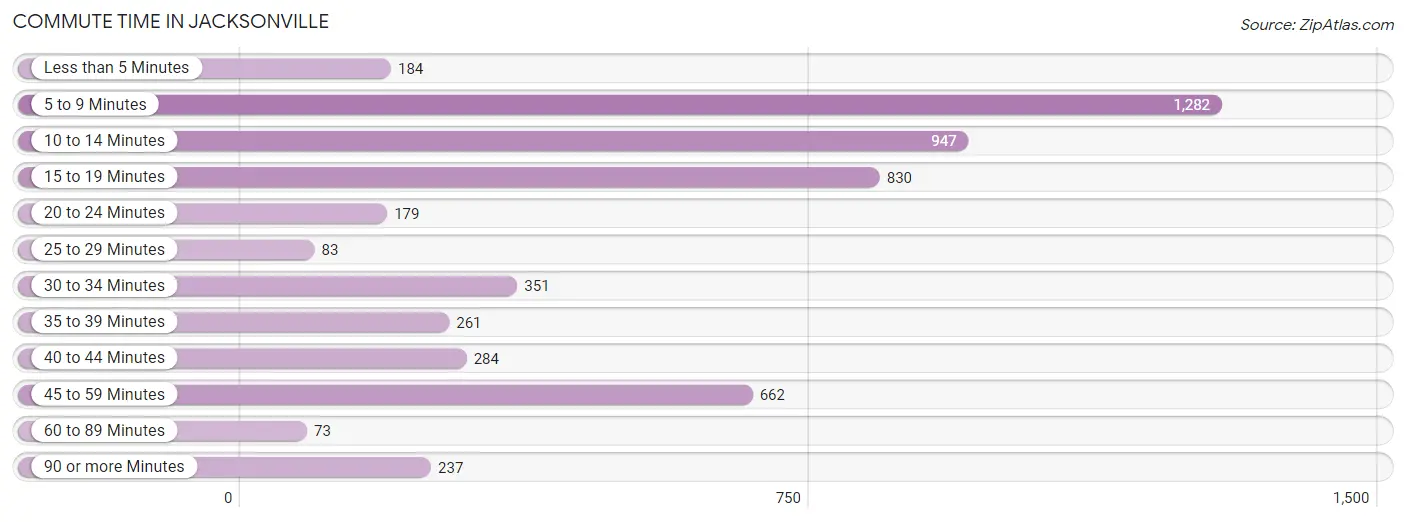
Commute Time in Jacksonville
The most frequently occuring commute durations in Jacksonville are 5 to 9 minutes (1,282 commuters, 23.9%), 10 to 14 minutes (947 commuters, 17.6%), and 15 to 19 minutes (830 commuters, 15.4%).
| Commute Time | # Commuters | % Commuters |
| Less than 5 Minutes | 184 | 3.4% |
| 5 to 9 Minutes | 1,282 | 23.9% |
| 10 to 14 Minutes | 947 | 17.6% |
| 15 to 19 Minutes | 830 | 15.4% |
| 20 to 24 Minutes | 179 | 3.3% |
| 25 to 29 Minutes | 83 | 1.5% |
| 30 to 34 Minutes | 351 | 6.5% |
| 35 to 39 Minutes | 261 | 4.9% |
| 40 to 44 Minutes | 284 | 5.3% |
| 45 to 59 Minutes | 662 | 12.3% |
| 60 to 89 Minutes | 73 | 1.4% |
| 90 or more Minutes | 237 | 4.4% |
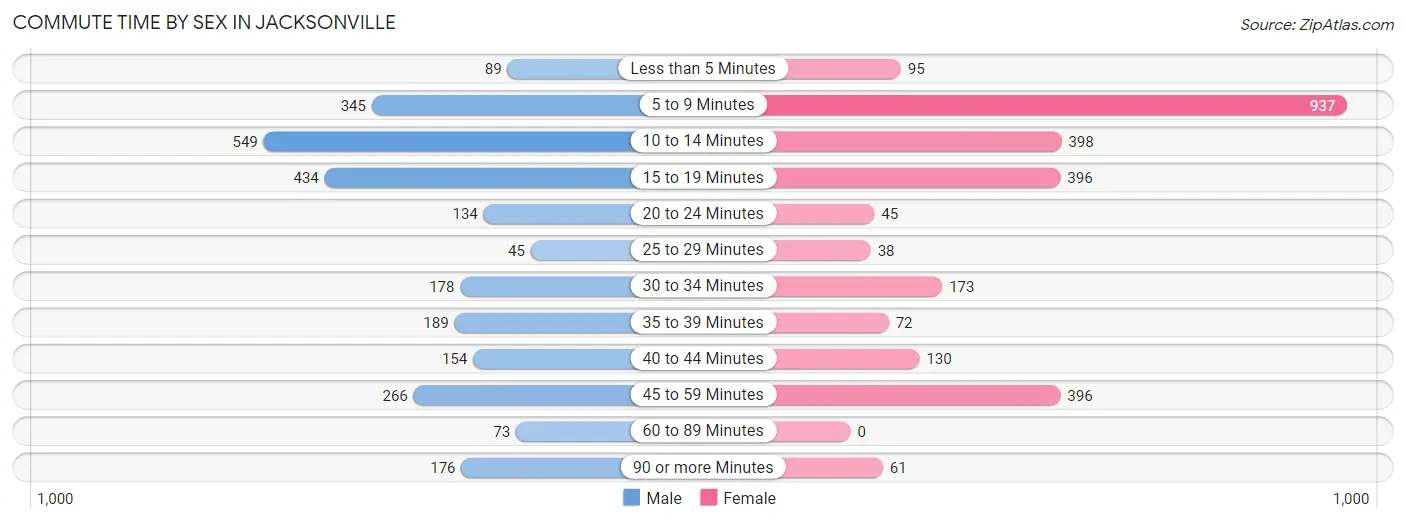
Commute Time by Sex in Jacksonville
The most common commute times in Jacksonville are 10 to 14 minutes (549 commuters, 20.9%) for males and 5 to 9 minutes (937 commuters, 34.2%) for females.
| Commute Time | Male | Female |
| Less than 5 Minutes | 89 (3.4%) | 95 (3.5%) |
| 5 to 9 Minutes | 345 (13.1%) | 937 (34.2%) |
| 10 to 14 Minutes | 549 (20.9%) | 398 (14.5%) |
| 15 to 19 Minutes | 434 (16.5%) | 396 (14.4%) |
| 20 to 24 Minutes | 134 (5.1%) | 45 (1.6%) |
| 25 to 29 Minutes | 45 (1.7%) | 38 (1.4%) |
| 30 to 34 Minutes | 178 (6.8%) | 173 (6.3%) |
| 35 to 39 Minutes | 189 (7.2%) | 72 (2.6%) |
| 40 to 44 Minutes | 154 (5.9%) | 130 (4.7%) |
| 45 to 59 Minutes | 266 (10.1%) | 396 (14.4%) |
| 60 to 89 Minutes | 73 (2.8%) | 0 (0.0%) |
| 90 or more Minutes | 176 (6.7%) | 61 (2.2%) |
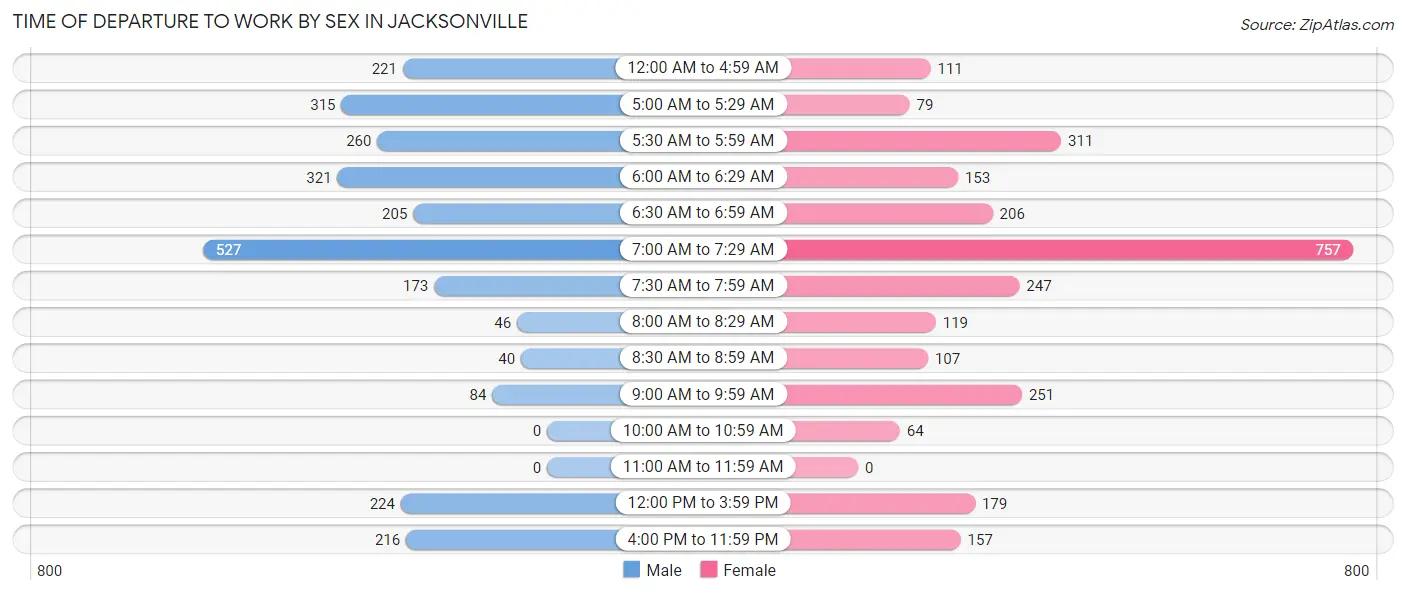
Time of Departure to Work by Sex in Jacksonville
The most frequent times of departure to work in Jacksonville are 7:00 AM to 7:29 AM (527, 20.0%) for males and 7:00 AM to 7:29 AM (757, 27.6%) for females.
| Time of Departure | Male | Female |
| 12:00 AM to 4:59 AM | 221 (8.4%) | 111 (4.1%) |
| 5:00 AM to 5:29 AM | 315 (12.0%) | 79 (2.9%) |
| 5:30 AM to 5:59 AM | 260 (9.9%) | 311 (11.4%) |
| 6:00 AM to 6:29 AM | 321 (12.2%) | 153 (5.6%) |
| 6:30 AM to 6:59 AM | 205 (7.8%) | 206 (7.5%) |
| 7:00 AM to 7:29 AM | 527 (20.0%) | 757 (27.6%) |
| 7:30 AM to 7:59 AM | 173 (6.6%) | 247 (9.0%) |
| 8:00 AM to 8:29 AM | 46 (1.8%) | 119 (4.3%) |
| 8:30 AM to 8:59 AM | 40 (1.5%) | 107 (3.9%) |
| 9:00 AM to 9:59 AM | 84 (3.2%) | 251 (9.2%) |
| 10:00 AM to 10:59 AM | 0 (0.0%) | 64 (2.3%) |
| 11:00 AM to 11:59 AM | 0 (0.0%) | 0 (0.0%) |
| 12:00 PM to 3:59 PM | 224 (8.5%) | 179 (6.5%) |
| 4:00 PM to 11:59 PM | 216 (8.2%) | 157 (5.7%) |
| Total | 2,632 (100.0%) | 2,741 (100.0%) |
Housing Occupancy in Jacksonville
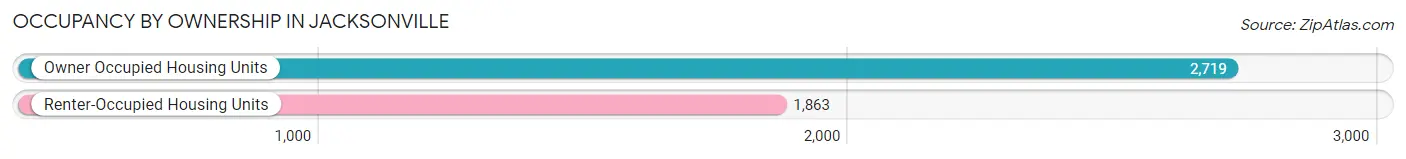
Occupancy by Ownership in Jacksonville
Of the total 4,582 dwellings in Jacksonville, owner-occupied units account for 2,719 (59.3%), while renter-occupied units make up 1,863 (40.7%).
| Occupancy | # Housing Units | % Housing Units |
| Owner Occupied Housing Units | 2,719 | 59.3% |
| Renter-Occupied Housing Units | 1,863 | 40.7% |
| Total Occupied Housing Units | 4,582 | 100.0% |
Occupancy by Household Size in Jacksonville
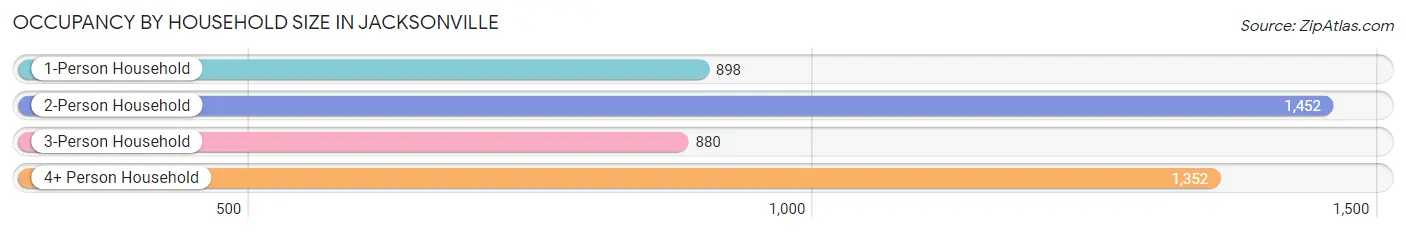
| Household Size | # Housing Units | % Housing Units |
| 1-Person Household | 898 | 19.6% |
| 2-Person Household | 1,452 | 31.7% |
| 3-Person Household | 880 | 19.2% |
| 4+ Person Household | 1,352 | 29.5% |
| Total Housing Units | 4,582 | 100.0% |
Occupancy by Ownership by Household Size in Jacksonville
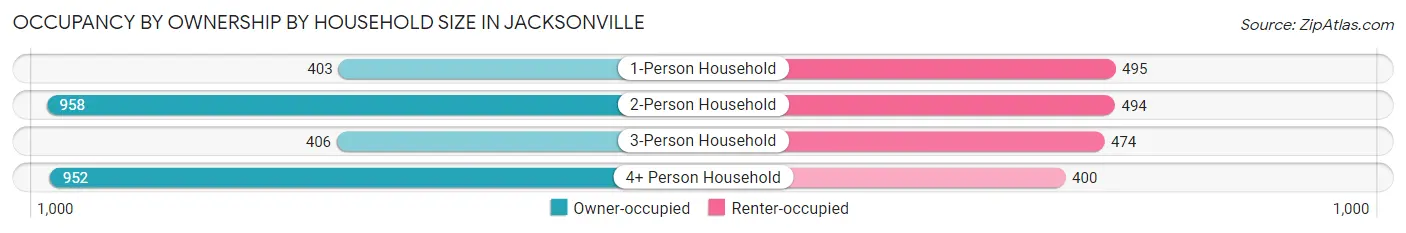
| Household Size | Owner-occupied | Renter-occupied |
| 1-Person Household | 403 (44.9%) | 495 (55.1%) |
| 2-Person Household | 958 (66.0%) | 494 (34.0%) |
| 3-Person Household | 406 (46.1%) | 474 (53.9%) |
| 4+ Person Household | 952 (70.4%) | 400 (29.6%) |
| Total Housing Units | 2,719 (59.3%) | 1,863 (40.7%) |
Occupancy by Educational Attainment in Jacksonville
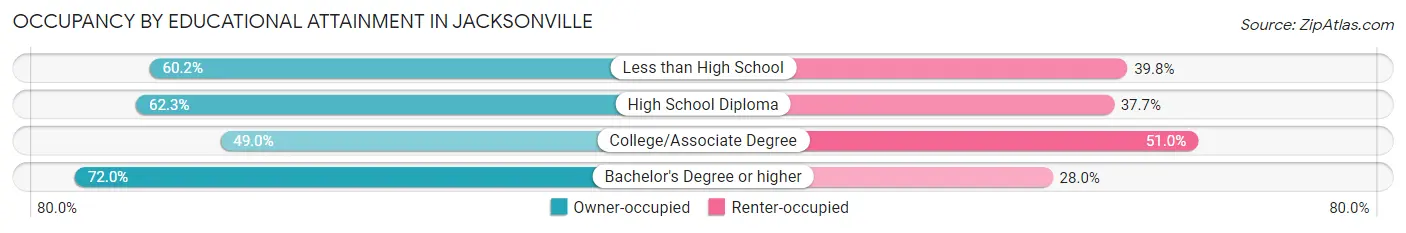
| Household Size | Owner-occupied | Renter-occupied |
| Less than High School | 662 (60.2%) | 438 (39.8%) |
| High School Diploma | 617 (62.3%) | 373 (37.7%) |
| College/Associate Degree | 753 (49.0%) | 785 (51.0%) |
| Bachelor's Degree or higher | 687 (72.0%) | 267 (28.0%) |
Occupancy by Age of Householder in Jacksonville
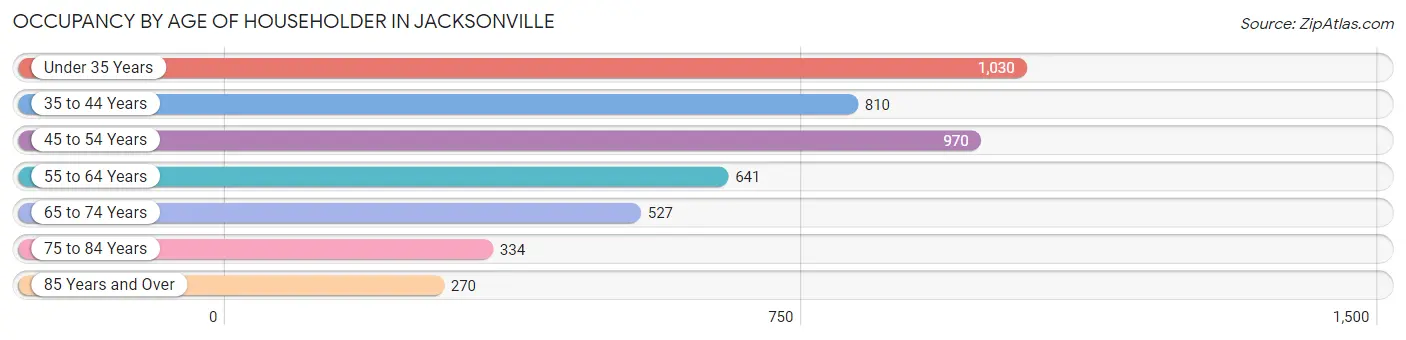
| Age Bracket | # Households | % Households |
| Under 35 Years | 1,030 | 22.5% |
| 35 to 44 Years | 810 | 17.7% |
| 45 to 54 Years | 970 | 21.2% |
| 55 to 64 Years | 641 | 14.0% |
| 65 to 74 Years | 527 | 11.5% |
| 75 to 84 Years | 334 | 7.3% |
| 85 Years and Over | 270 | 5.9% |
| Total | 4,582 | 100.0% |
Housing Finances in Jacksonville
Median Income by Occupancy in Jacksonville
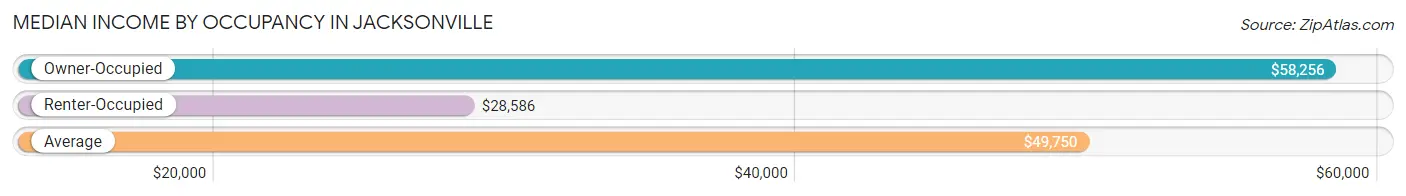
| Occupancy Type | # Households | Median Income |
| Owner-Occupied | 2,719 (59.3%) | $58,256 |
| Renter-Occupied | 1,863 (40.7%) | $28,586 |
| Average | 4,582 (100.0%) | $49,750 |
Occupancy by Householder Income Bracket in Jacksonville
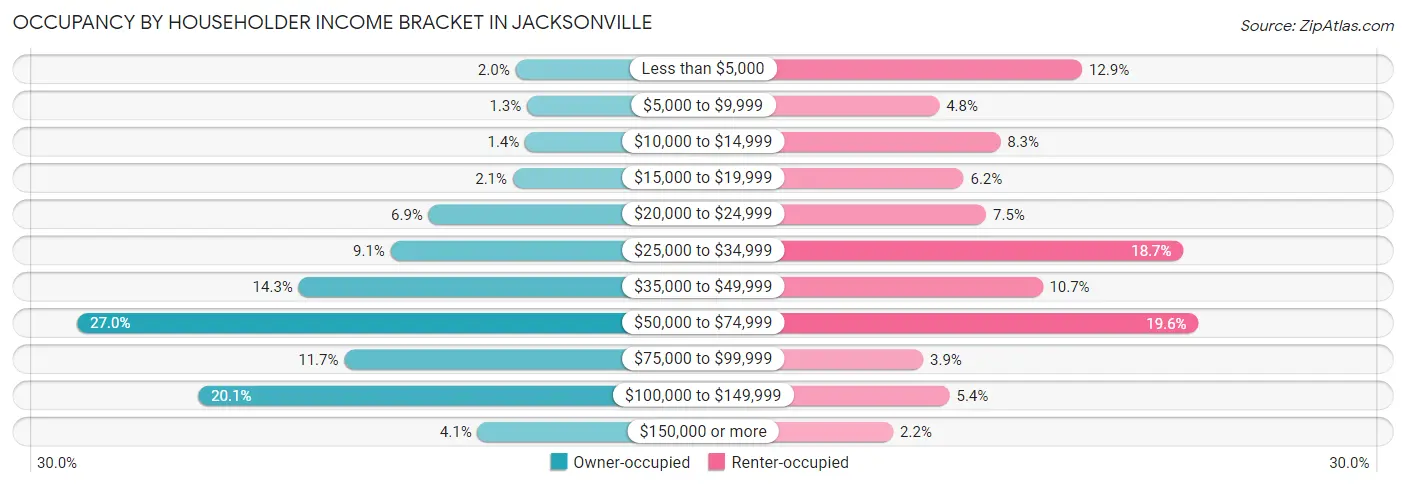
| Income Bracket | Owner-occupied | Renter-occupied |
| Less than $5,000 | 53 (1.9%) | 241 (12.9%) |
| $5,000 to $9,999 | 35 (1.3%) | 89 (4.8%) |
| $10,000 to $14,999 | 38 (1.4%) | 154 (8.3%) |
| $15,000 to $19,999 | 57 (2.1%) | 115 (6.2%) |
| $20,000 to $24,999 | 188 (6.9%) | 139 (7.5%) |
| $25,000 to $34,999 | 247 (9.1%) | 349 (18.7%) |
| $35,000 to $49,999 | 390 (14.3%) | 199 (10.7%) |
| $50,000 to $74,999 | 734 (27.0%) | 365 (19.6%) |
| $75,000 to $99,999 | 319 (11.7%) | 72 (3.9%) |
| $100,000 to $149,999 | 546 (20.1%) | 100 (5.4%) |
| $150,000 or more | 112 (4.1%) | 40 (2.1%) |
| Total | 2,719 (100.0%) | 1,863 (100.0%) |
Monthly Housing Cost Tiers in Jacksonville
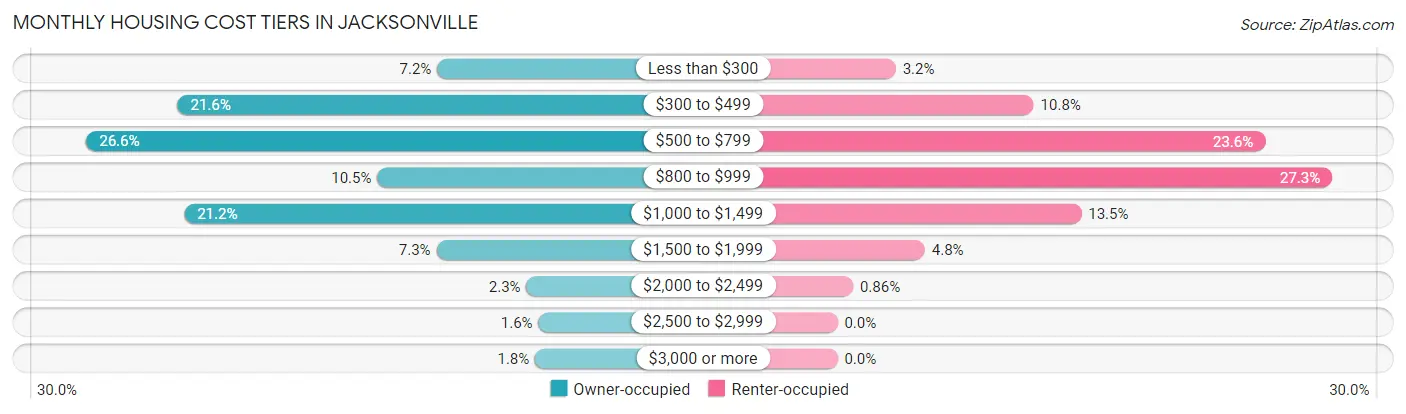
| Monthly Cost | Owner-occupied | Renter-occupied |
| Less than $300 | 196 (7.2%) | 60 (3.2%) |
| $300 to $499 | 586 (21.5%) | 202 (10.8%) |
| $500 to $799 | 723 (26.6%) | 440 (23.6%) |
| $800 to $999 | 286 (10.5%) | 509 (27.3%) |
| $1,000 to $1,499 | 576 (21.2%) | 251 (13.5%) |
| $1,500 to $1,999 | 197 (7.2%) | 90 (4.8%) |
| $2,000 to $2,499 | 62 (2.3%) | 16 (0.9%) |
| $2,500 to $2,999 | 44 (1.6%) | 0 (0.0%) |
| $3,000 or more | 49 (1.8%) | 0 (0.0%) |
| Total | 2,719 (100.0%) | 1,863 (100.0%) |
Physical Housing Characteristics in Jacksonville
Housing Structures in Jacksonville
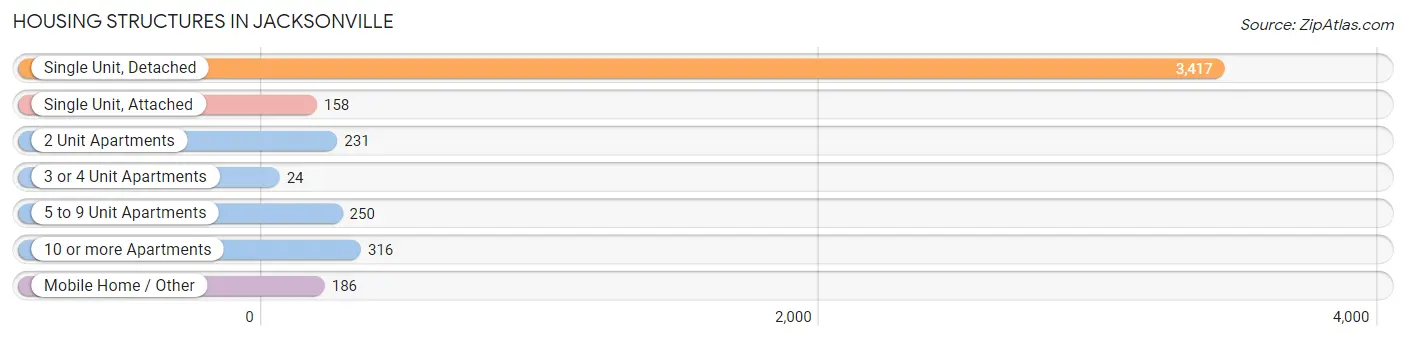
| Structure Type | # Housing Units | % Housing Units |
| Single Unit, Detached | 3,417 | 74.6% |
| Single Unit, Attached | 158 | 3.5% |
| 2 Unit Apartments | 231 | 5.0% |
| 3 or 4 Unit Apartments | 24 | 0.5% |
| 5 to 9 Unit Apartments | 250 | 5.5% |
| 10 or more Apartments | 316 | 6.9% |
| Mobile Home / Other | 186 | 4.1% |
| Total | 4,582 | 100.0% |
Housing Structures by Occupancy in Jacksonville
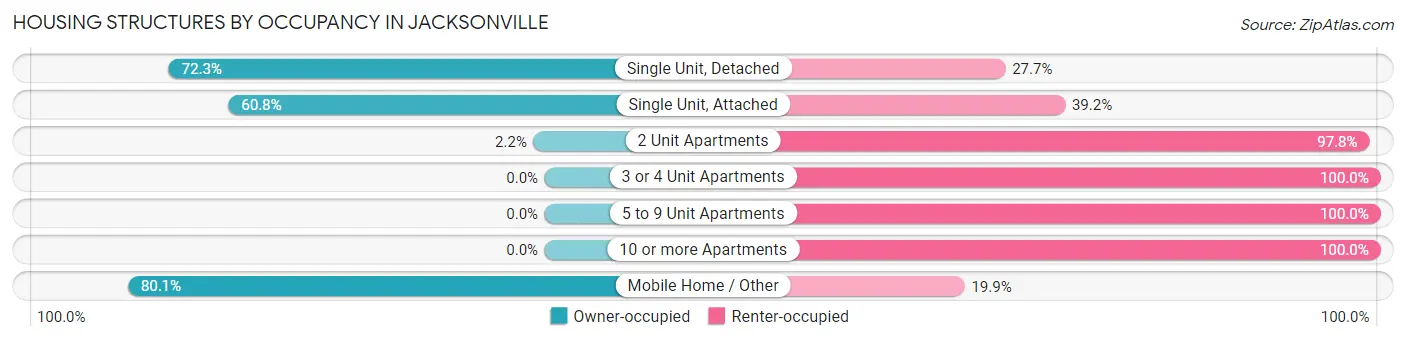
| Structure Type | Owner-occupied | Renter-occupied |
| Single Unit, Detached | 2,469 (72.3%) | 948 (27.7%) |
| Single Unit, Attached | 96 (60.8%) | 62 (39.2%) |
| 2 Unit Apartments | 5 (2.2%) | 226 (97.8%) |
| 3 or 4 Unit Apartments | 0 (0.0%) | 24 (100.0%) |
| 5 to 9 Unit Apartments | 0 (0.0%) | 250 (100.0%) |
| 10 or more Apartments | 0 (0.0%) | 316 (100.0%) |
| Mobile Home / Other | 149 (80.1%) | 37 (19.9%) |
| Total | 2,719 (59.3%) | 1,863 (40.7%) |
Housing Structures by Number of Rooms in Jacksonville
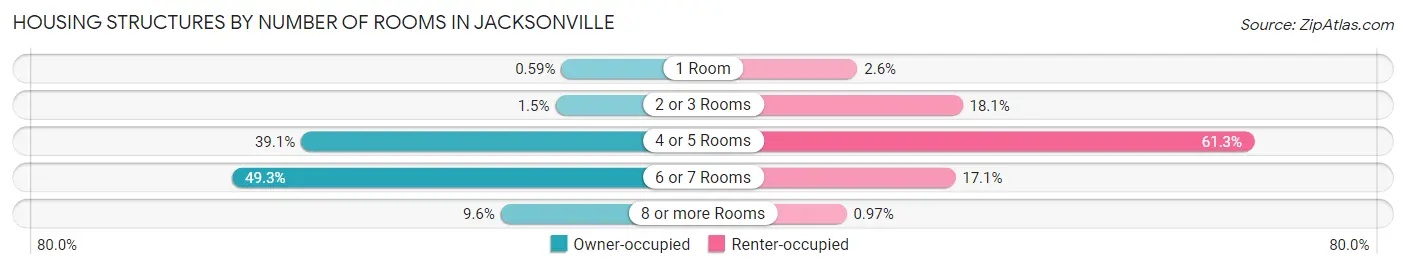
| Number of Rooms | Owner-occupied | Renter-occupied |
| 1 Room | 16 (0.6%) | 48 (2.6%) |
| 2 or 3 Rooms | 40 (1.5%) | 338 (18.1%) |
| 4 or 5 Rooms | 1,063 (39.1%) | 1,141 (61.3%) |
| 6 or 7 Rooms | 1,340 (49.3%) | 318 (17.1%) |
| 8 or more Rooms | 260 (9.6%) | 18 (1.0%) |
| Total | 2,719 (100.0%) | 1,863 (100.0%) |
Housing Structure by Heating Type in Jacksonville
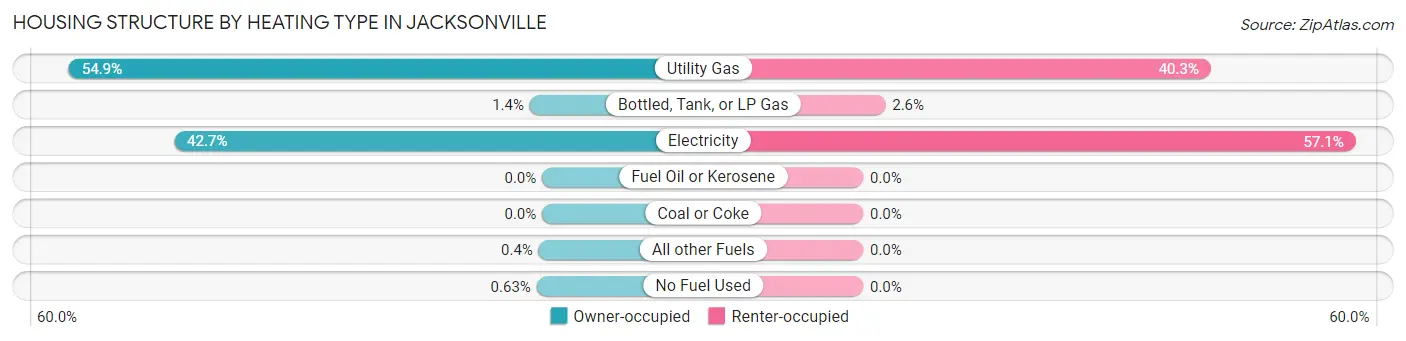
| Heating Type | Owner-occupied | Renter-occupied |
| Utility Gas | 1,492 (54.9%) | 751 (40.3%) |
| Bottled, Tank, or LP Gas | 39 (1.4%) | 48 (2.6%) |
| Electricity | 1,160 (42.7%) | 1,064 (57.1%) |
| Fuel Oil or Kerosene | 0 (0.0%) | 0 (0.0%) |
| Coal or Coke | 0 (0.0%) | 0 (0.0%) |
| All other Fuels | 11 (0.4%) | 0 (0.0%) |
| No Fuel Used | 17 (0.6%) | 0 (0.0%) |
| Total | 2,719 (100.0%) | 1,863 (100.0%) |
Household Vehicle Usage in Jacksonville
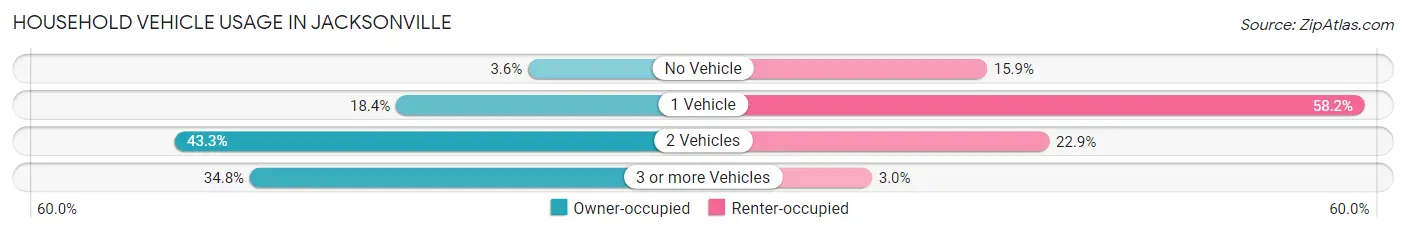
| Vehicles per Household | Owner-occupied | Renter-occupied |
| No Vehicle | 98 (3.6%) | 296 (15.9%) |
| 1 Vehicle | 500 (18.4%) | 1,085 (58.2%) |
| 2 Vehicles | 1,176 (43.2%) | 426 (22.9%) |
| 3 or more Vehicles | 945 (34.8%) | 56 (3.0%) |
| Total | 2,719 (100.0%) | 1,863 (100.0%) |
Real Estate & Mortgages in Jacksonville
Real Estate and Mortgage Overview in Jacksonville
| Characteristic | Without Mortgage | With Mortgage |
| Housing Units | 1,465 | 1,254 |
| Median Property Value | $99,100 | $127,700 |
| Median Household Income | $48,125 | $62 |
| Monthly Housing Costs | $486 | $49 |
| Real Estate Taxes | $1,484 | $42 |
Property Value by Mortgage Status in Jacksonville
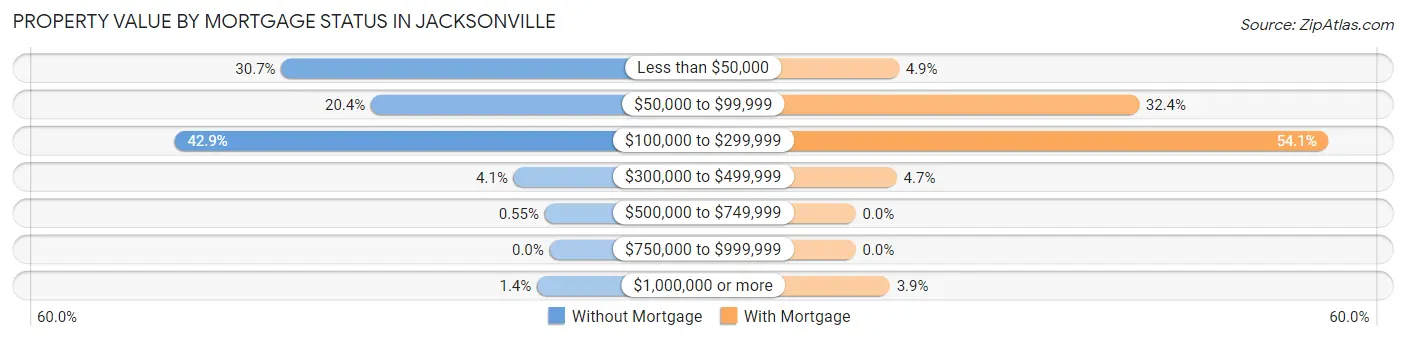
| Property Value | Without Mortgage | With Mortgage |
| Less than $50,000 | 449 (30.6%) | 62 (4.9%) |
| $50,000 to $99,999 | 299 (20.4%) | 406 (32.4%) |
| $100,000 to $299,999 | 628 (42.9%) | 678 (54.1%) |
| $300,000 to $499,999 | 60 (4.1%) | 59 (4.7%) |
| $500,000 to $749,999 | 8 (0.5%) | 0 (0.0%) |
| $750,000 to $999,999 | 0 (0.0%) | 0 (0.0%) |
| $1,000,000 or more | 21 (1.4%) | 49 (3.9%) |
| Total | 1,465 (100.0%) | 1,254 (100.0%) |
Household Income by Mortgage Status in Jacksonville
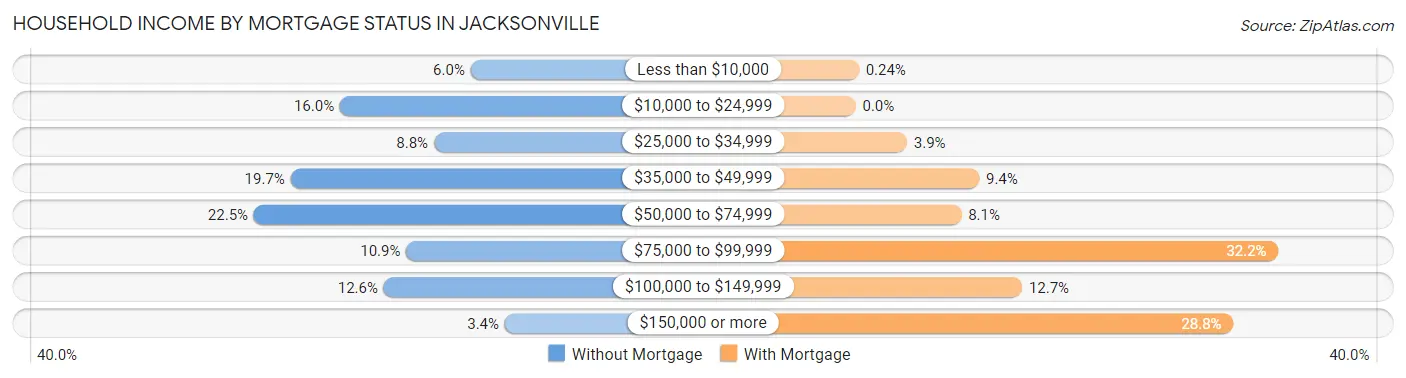
| Household Income | Without Mortgage | With Mortgage |
| Less than $10,000 | 88 (6.0%) | 3 (0.2%) |
| $10,000 to $24,999 | 234 (16.0%) | 0 (0.0%) |
| $25,000 to $34,999 | 129 (8.8%) | 49 (3.9%) |
| $35,000 to $49,999 | 289 (19.7%) | 118 (9.4%) |
| $50,000 to $74,999 | 330 (22.5%) | 101 (8.1%) |
| $75,000 to $99,999 | 160 (10.9%) | 404 (32.2%) |
| $100,000 to $149,999 | 185 (12.6%) | 159 (12.7%) |
| $150,000 or more | 50 (3.4%) | 361 (28.8%) |
| Total | 1,465 (100.0%) | 1,254 (100.0%) |
Property Value to Household Income Ratio in Jacksonville
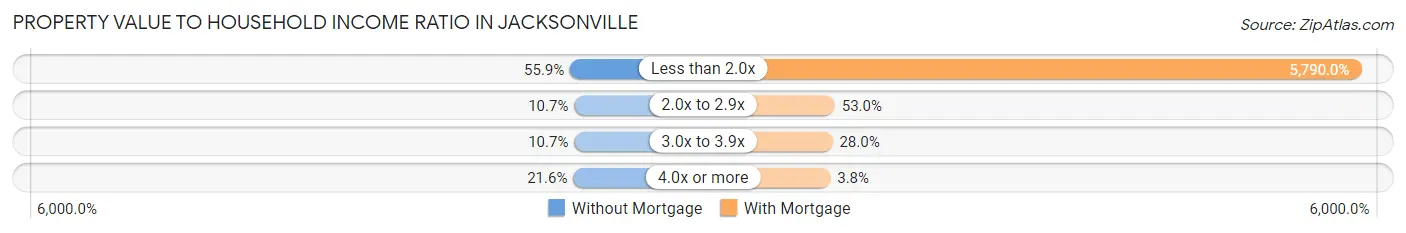
| Value-to-Income Ratio | Without Mortgage | With Mortgage |
| Less than 2.0x | 819 (55.9%) | 72,606 (5,790.0%) |
| 2.0x to 2.9x | 156 (10.6%) | 665 (53.0%) |
| 3.0x to 3.9x | 156 (10.6%) | 351 (28.0%) |
| 4.0x or more | 317 (21.6%) | 48 (3.8%) |
| Total | 1,465 (100.0%) | 1,254 (100.0%) |
Real Estate Taxes by Mortgage Status in Jacksonville
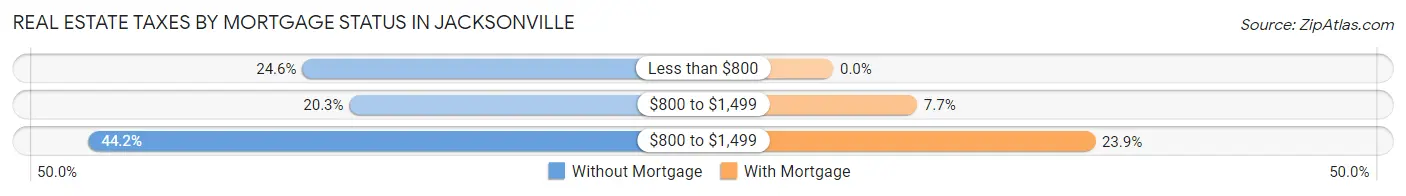
| Property Taxes | Without Mortgage | With Mortgage |
| Less than $800 | 361 (24.6%) | 0 (0.0%) |
| $800 to $1,499 | 298 (20.3%) | 96 (7.7%) |
| $800 to $1,499 | 647 (44.2%) | 300 (23.9%) |
| Total | 1,465 (100.0%) | 1,254 (100.0%) |
Health & Disability in Jacksonville
Health Insurance Coverage by Age in Jacksonville
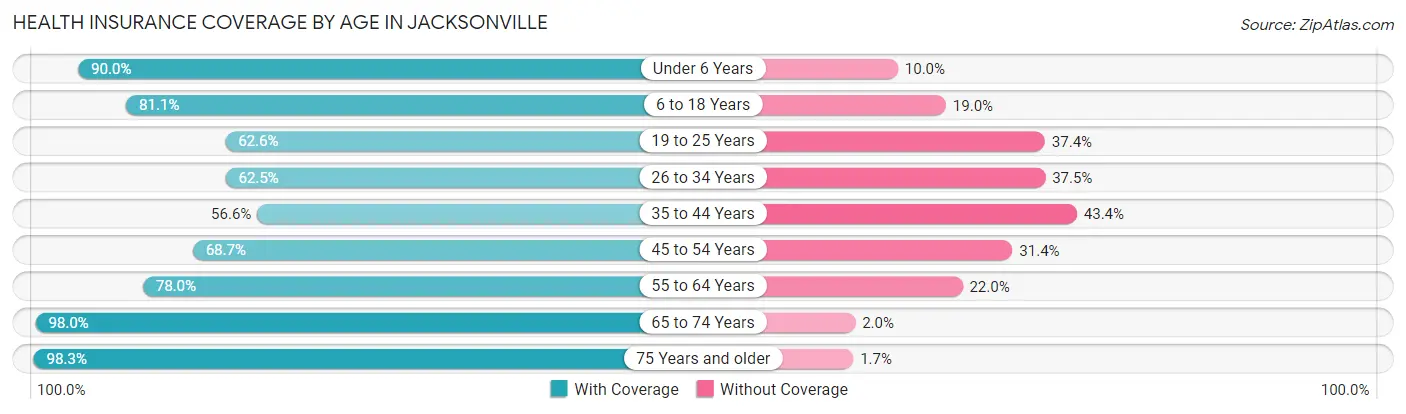
| Age Bracket | With Coverage | Without Coverage |
| Under 6 Years | 1,531 (90.0%) | 170 (10.0%) |
| 6 to 18 Years | 2,485 (81.0%) | 581 (19.0%) |
| 19 to 25 Years | 1,183 (62.6%) | 707 (37.4%) |
| 26 to 34 Years | 873 (62.5%) | 523 (37.5%) |
| 35 to 44 Years | 884 (56.6%) | 677 (43.4%) |
| 45 to 54 Years | 1,049 (68.6%) | 479 (31.4%) |
| 55 to 64 Years | 757 (78.0%) | 214 (22.0%) |
| 65 to 74 Years | 819 (98.0%) | 17 (2.0%) |
| 75 Years and older | 822 (98.3%) | 14 (1.7%) |
| Total | 10,403 (75.5%) | 3,382 (24.5%) |
Health Insurance Coverage by Citizenship Status in Jacksonville
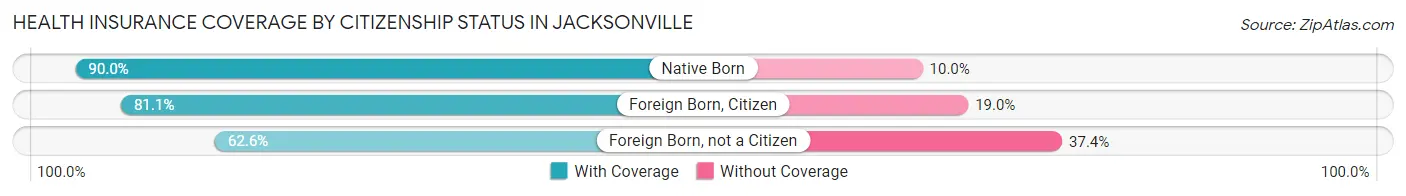
| Citizenship Status | With Coverage | Without Coverage |
| Native Born | 1,531 (90.0%) | 170 (10.0%) |
| Foreign Born, Citizen | 2,485 (81.0%) | 581 (19.0%) |
| Foreign Born, not a Citizen | 1,183 (62.6%) | 707 (37.4%) |
Health Insurance Coverage by Household Income in Jacksonville
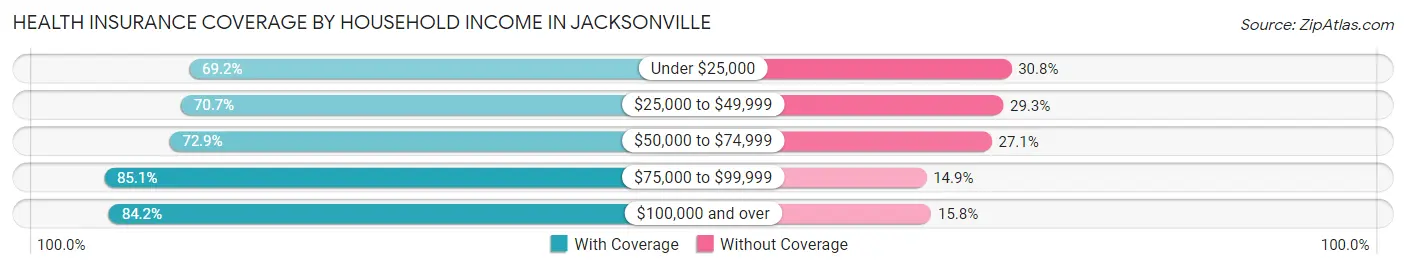
| Household Income | With Coverage | Without Coverage |
| Under $25,000 | 1,453 (69.2%) | 647 (30.8%) |
| $25,000 to $49,999 | 2,420 (70.7%) | 1,002 (29.3%) |
| $50,000 to $74,999 | 2,805 (72.9%) | 1,044 (27.1%) |
| $75,000 to $99,999 | 990 (85.1%) | 173 (14.9%) |
| $100,000 and over | 2,503 (84.2%) | 469 (15.8%) |
Public vs Private Health Insurance Coverage by Age in Jacksonville
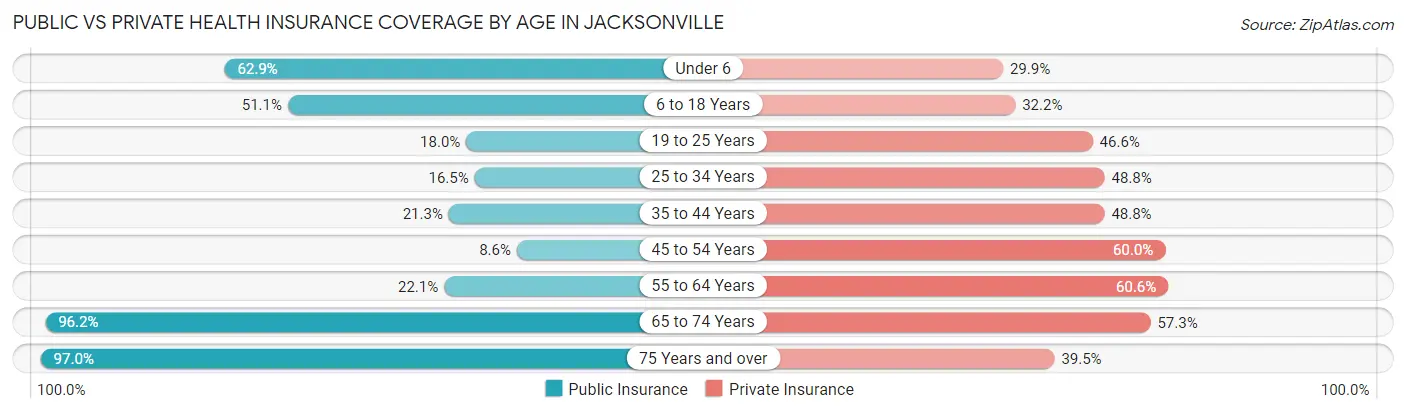
| Age Bracket | Public Insurance | Private Insurance |
| Under 6 | 1,070 (62.9%) | 509 (29.9%) |
| 6 to 18 Years | 1,568 (51.1%) | 987 (32.2%) |
| 19 to 25 Years | 341 (18.0%) | 880 (46.6%) |
| 25 to 34 Years | 230 (16.5%) | 681 (48.8%) |
| 35 to 44 Years | 332 (21.3%) | 761 (48.7%) |
| 45 to 54 Years | 132 (8.6%) | 917 (60.0%) |
| 55 to 64 Years | 215 (22.1%) | 588 (60.6%) |
| 65 to 74 Years | 804 (96.2%) | 479 (57.3%) |
| 75 Years and over | 811 (97.0%) | 330 (39.5%) |
| Total | 5,503 (39.9%) | 6,132 (44.5%) |
Disability Status by Sex by Age in Jacksonville
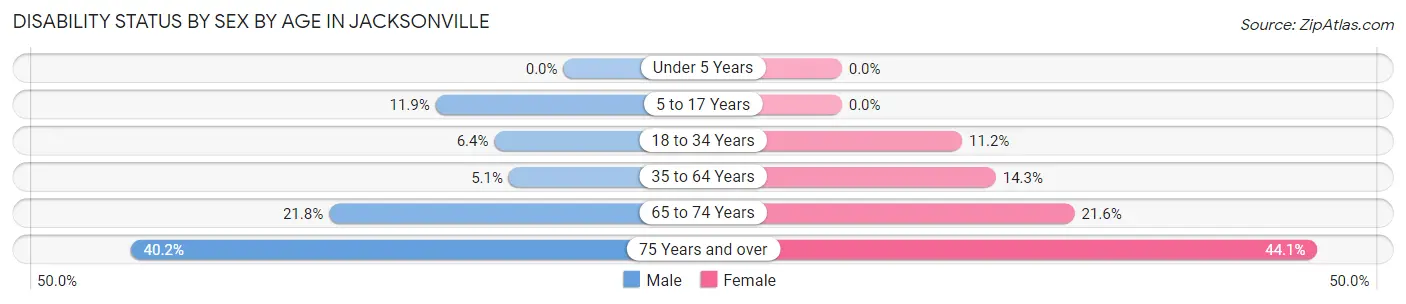
| Age Bracket | Male | Female |
| Under 5 Years | 0 (0.0%) | 0 (0.0%) |
| 5 to 17 Years | 179 (11.9%) | 0 (0.0%) |
| 18 to 34 Years | 109 (6.4%) | 203 (11.2%) |
| 35 to 64 Years | 91 (5.1%) | 323 (14.3%) |
| 65 to 74 Years | 62 (21.7%) | 119 (21.6%) |
| 75 Years and over | 151 (40.2%) | 203 (44.1%) |
Disability Class by Sex by Age in Jacksonville
Disability Class: Hearing Difficulty
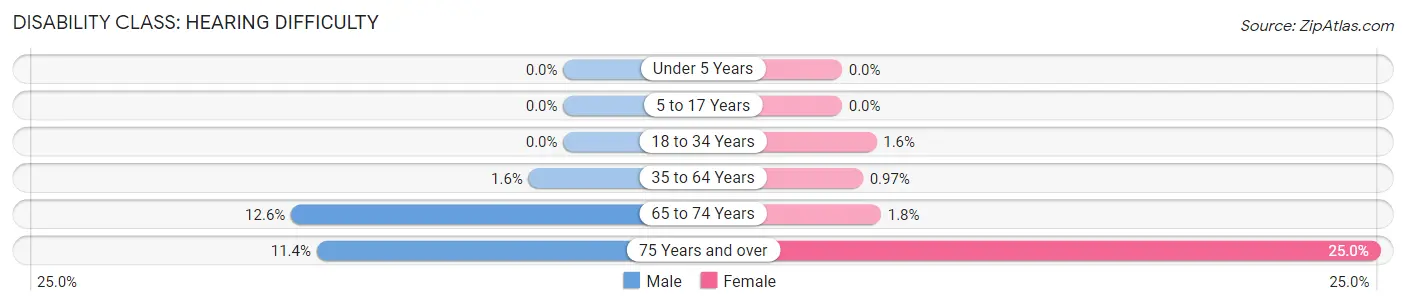
| Age Bracket | Male | Female |
| Under 5 Years | 0 (0.0%) | 0 (0.0%) |
| 5 to 17 Years | 0 (0.0%) | 0 (0.0%) |
| 18 to 34 Years | 0 (0.0%) | 29 (1.6%) |
| 35 to 64 Years | 29 (1.6%) | 22 (1.0%) |
| 65 to 74 Years | 36 (12.6%) | 10 (1.8%) |
| 75 Years and over | 43 (11.4%) | 115 (25.0%) |
Disability Class: Vision Difficulty
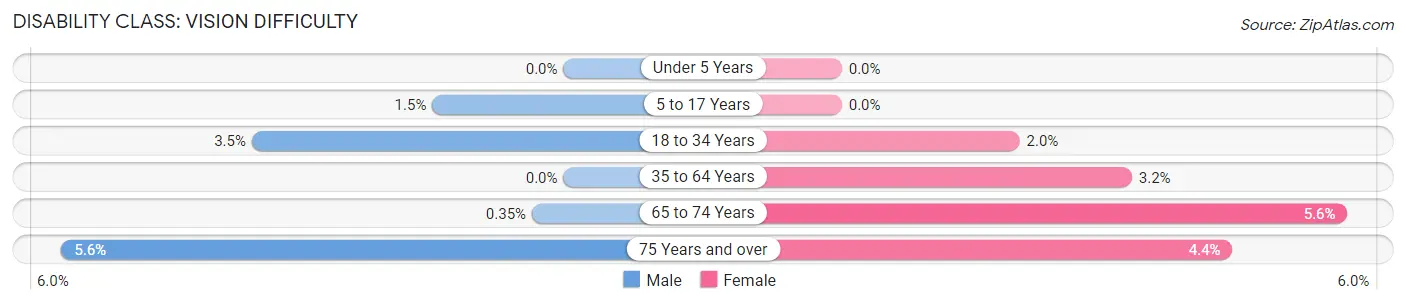
| Age Bracket | Male | Female |
| Under 5 Years | 0 (0.0%) | 0 (0.0%) |
| 5 to 17 Years | 22 (1.5%) | 0 (0.0%) |
| 18 to 34 Years | 59 (3.5%) | 36 (2.0%) |
| 35 to 64 Years | 0 (0.0%) | 73 (3.2%) |
| 65 to 74 Years | 1 (0.4%) | 31 (5.6%) |
| 75 Years and over | 21 (5.6%) | 20 (4.3%) |
Disability Class: Cognitive Difficulty
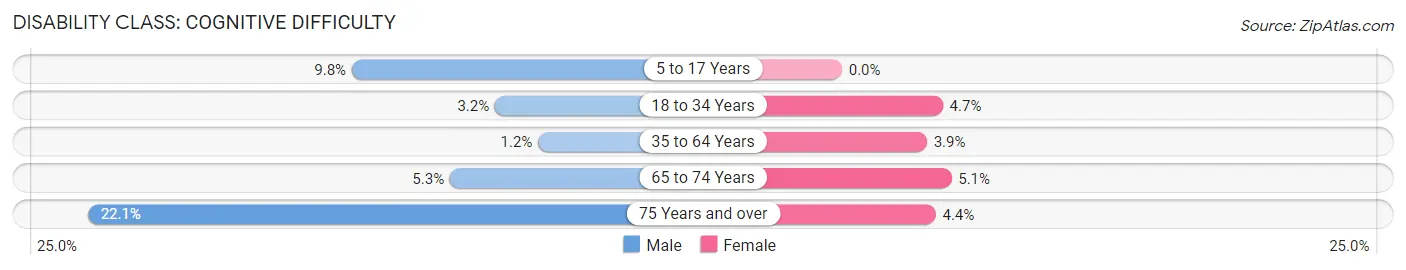
| Age Bracket | Male | Female |
| 5 to 17 Years | 148 (9.8%) | 0 (0.0%) |
| 18 to 34 Years | 54 (3.2%) | 85 (4.7%) |
| 35 to 64 Years | 21 (1.2%) | 89 (3.9%) |
| 65 to 74 Years | 15 (5.3%) | 28 (5.1%) |
| 75 Years and over | 83 (22.1%) | 20 (4.3%) |
Disability Class: Ambulatory Difficulty
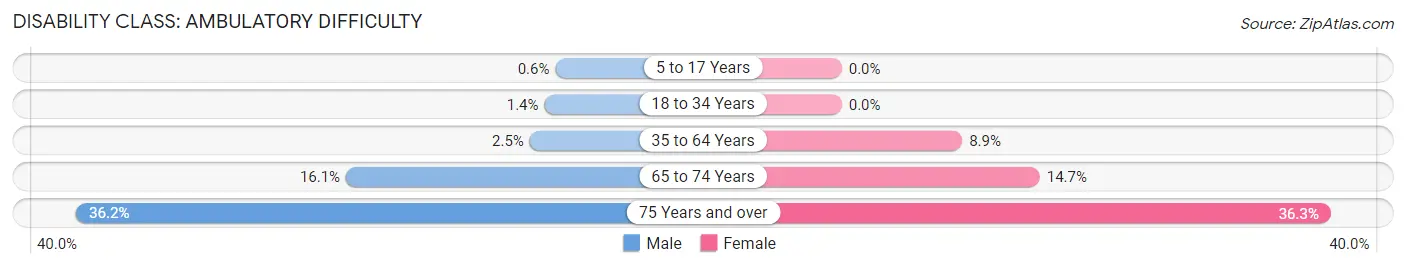
| Age Bracket | Male | Female |
| 5 to 17 Years | 9 (0.6%) | 0 (0.0%) |
| 18 to 34 Years | 24 (1.4%) | 0 (0.0%) |
| 35 to 64 Years | 45 (2.5%) | 202 (8.9%) |
| 65 to 74 Years | 46 (16.1%) | 81 (14.7%) |
| 75 Years and over | 136 (36.2%) | 167 (36.3%) |
Disability Class: Self-Care Difficulty
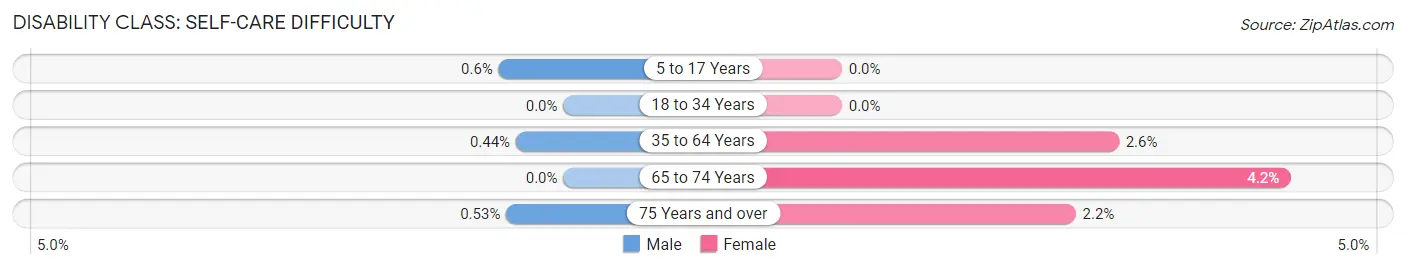
| Age Bracket | Male | Female |
| 5 to 17 Years | 9 (0.6%) | 0 (0.0%) |
| 18 to 34 Years | 0 (0.0%) | 0 (0.0%) |
| 35 to 64 Years | 8 (0.4%) | 58 (2.6%) |
| 65 to 74 Years | 0 (0.0%) | 23 (4.2%) |
| 75 Years and over | 2 (0.5%) | 10 (2.2%) |
Technology Access in Jacksonville
Computing Device Access in Jacksonville
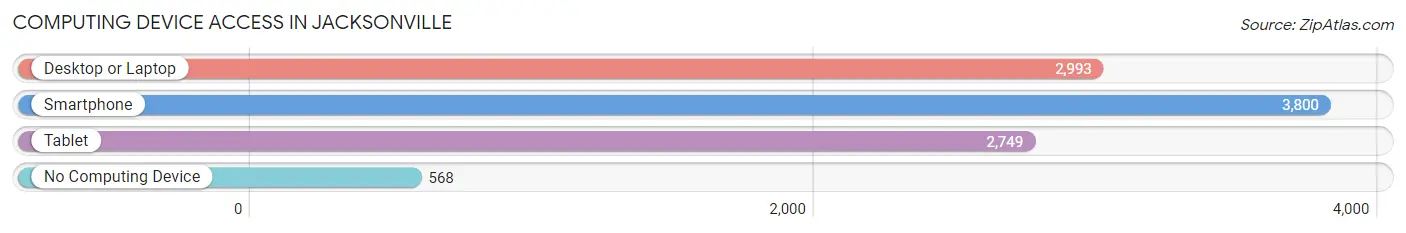
| Device Type | # Households | % Households |
| Desktop or Laptop | 2,993 | 65.3% |
| Smartphone | 3,800 | 82.9% |
| Tablet | 2,749 | 60.0% |
| No Computing Device | 568 | 12.4% |
| Total | 4,582 | 100.0% |
Internet Access in Jacksonville
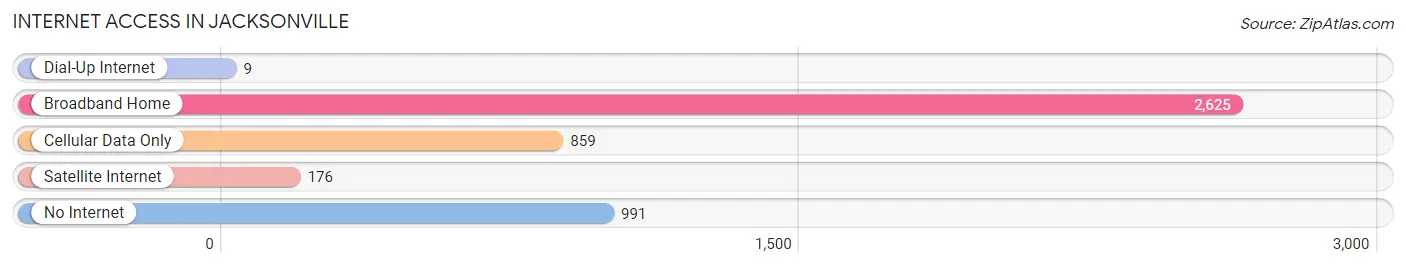
| Internet Type | # Households | % Households |
| Dial-Up Internet | 9 | 0.2% |
| Broadband Home | 2,625 | 57.3% |
| Cellular Data Only | 859 | 18.8% |
| Satellite Internet | 176 | 3.8% |
| No Internet | 991 | 21.6% |
| Total | 4,582 | 100.0% |
Jacksonville Summary
Jacksonville is a city located in Cherokee County, Texas, United States. The population was 14,544 at the 2010 census. It is the principal city of the Jacksonville Micropolitan Statistical Area, which includes all of Cherokee County, and part of the larger Tyler–Jacksonville combined statistical area.
Geography
Jacksonville is located at the intersection of U.S. Highway 69 and State Highway 79, approximately 130 miles (210 km) southeast of Dallas. According to the United States Census Bureau, the city has a total area of 10.3 square miles (26.7 km2), of which 10.2 square miles (26.4 km2) is land and 0.1 square miles (0.3 km2) (0.78%) is water.
History
The area around Jacksonville was first settled in 1847 by settlers from the Peters Colony. The town was named after Jacksonville, Illinois, the hometown of the first postmaster, and was incorporated in 1872.
The city was a center of cotton production and processing for much of the 20th century. The city's economy was also bolstered by the opening of the Lone Star Army Ammunition Plant in 1941. The plant was closed in 1992, but the city's economy has since diversified.
Economy
The economy of Jacksonville is largely based on agriculture, manufacturing, and retail. The city is home to several large employers, including the Jacksonville Independent School District, the Cherokee County government, and the East Texas Medical Center.
The city is also home to several small businesses, including a number of restaurants, retail stores, and service providers.
Demographics
As of the 2010 census, there were 14,544 people, 5,717 households, and 3,717 families residing in the city. The population density was 1,421.3 people per square mile (548.7/km2). There were 6,521 housing units at an average density of 637.2 per square mile (246.2/km2). The racial makeup of the city was 73.2% White, 17.3% African American, 0.6% Native American, 0.7% Asian, 6.2% from other races, and 2.0% from two or more races. Hispanic or Latino of any race were 12.7% of the population.
There were 5,717 households, out of which 32.2% had children under the age of 18 living with them, 44.2% were married couples living together, 17.2% had a female householder with no husband present, and 33.7% were non-families. 28.7% of all households were made up of individuals, and 13.2% had someone living alone who was 65 years of age or older. The average household size was 2.50 and the average family size was 3.09.
In the city, the population was spread out, with 26.2% under the age of 18, 9.3% from 18 to 24, 26.2% from 25 to 44, 22.2% from 45 to 64, and 16.1% who were 65 years of age or older. The median age was 36 years. For every 100 females, there were 88.7 males. For every 100 females age 18 and over, there were 84.2 males.
The median income for a household in the city was $30,945, and the median income for a family was $37,813. Males had a median income of $30,945 versus $21,813 for females. The per capita income for the city was $16,945. About 14.2% of families and 17.7% of the population were below the poverty line, including 24.2% of those under age 18 and 13.2% of those age 65 or over.
Common Questions
What is Per Capita Income in Jacksonville?
Per Capita income in Jacksonville is $20,924.
What is the Median Family Income in Jacksonville?
Median Family Income in Jacksonville is $50,923.
What is the Median Household income in Jacksonville?
Median Household Income in Jacksonville is $49,750.
What is Income or Wage Gap in Jacksonville?
Income or Wage Gap in Jacksonville is 30.9%.
Women in Jacksonville earn 69.1 cents for every dollar earned by a man.
What is Family Income Deficit in Jacksonville?
Family Income Deficit in Jacksonville is $10,044.
Families that are below poverty line in Jacksonville earn $10,044 less on average than the poverty threshold level.
What is Inequality or Gini Index in Jacksonville?
Inequality or Gini Index in Jacksonville is 0.46.
What is the Total Population of Jacksonville?
Total Population of Jacksonville is 14,104.
What is the Total Male Population of Jacksonville?
Total Male Population of Jacksonville is 6,492.
What is the Total Female Population of Jacksonville?
Total Female Population of Jacksonville is 7,612.
What is the Ratio of Males per 100 Females in Jacksonville?
There are 85.29 Males per 100 Females in Jacksonville.
What is the Ratio of Females per 100 Males in Jacksonville?
There are 117.25 Females per 100 Males in Jacksonville.
What is the Median Population Age in Jacksonville?
Median Population Age in Jacksonville is 28.2 Years.
What is the Average Family Size in Jacksonville
Average Family Size in Jacksonville is 3.3 People.
What is the Average Household Size in Jacksonville
Average Household Size in Jacksonville is 3.0 People.
How Large is the Labor Force in Jacksonville?
There are 6,175 People in the Labor Forcein in Jacksonville.
What is the Percentage of People in the Labor Force in Jacksonville?
60.6% of People are in the Labor Force in Jacksonville.
What is the Unemployment Rate in Jacksonville?
Unemployment Rate in Jacksonville is 7.9%.