Itasca, TX Map & Demographics
Itasca Map
Itasca Overview
$26,577
PER CAPITA INCOME
$73,977
AVG FAMILY INCOME
$58,098
AVG HOUSEHOLD INCOME
14.3%
WAGE / INCOME GAP [ % ]
85.7¢/ $1
WAGE / INCOME GAP [ $ ]
0.39
INEQUALITY / GINI INDEX
2,025
TOTAL POPULATION
928
MALE POPULATION
1,097
FEMALE POPULATION
84.59
MALES / 100 FEMALES
118.21
FEMALES / 100 MALES
36.2
MEDIAN AGE
3.6
AVG FAMILY SIZE
2.9
AVG HOUSEHOLD SIZE
1,035
LABOR FORCE [ PEOPLE ]
65.5%
PERCENT IN LABOR FORCE
1.0%
UNEMPLOYMENT RATE
Itasca Zip Codes
Itasca Area Codes
Income in Itasca
Income Overview in Itasca
Per Capita Income in Itasca is $26,577, while median incomes of families and households are $73,977 and $58,098 respectively.
| Characteristic | Number | Measure |
| Per Capita Income | 2,025 | $26,577 |
| Median Family Income | 449 | $73,977 |
| Mean Family Income | 449 | $86,668 |
| Median Household Income | 673 | $58,098 |
| Mean Household Income | 673 | $73,362 |
| Income Deficit | 449 | $0 |
| Wage / Income Gap (%) | 2,025 | 14.31% |
| Wage / Income Gap ($) | 2,025 | 85.69¢ per $1 |
| Gini / Inequality Index | 2,025 | 0.39 |
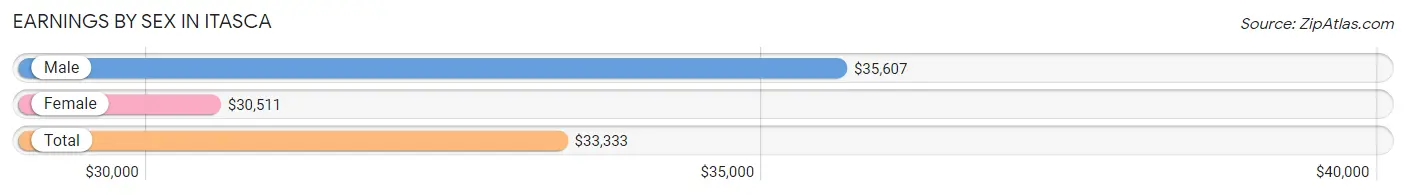
Earnings by Sex in Itasca
Average Earnings in Itasca are $33,333, $35,607 for men and $30,511 for women, a difference of 14.3%.
| Sex | Number | Average Earnings |
| Male | 535 (50.5%) | $35,607 |
| Female | 525 (49.5%) | $30,511 |
| Total | 1,060 (100.0%) | $33,333 |
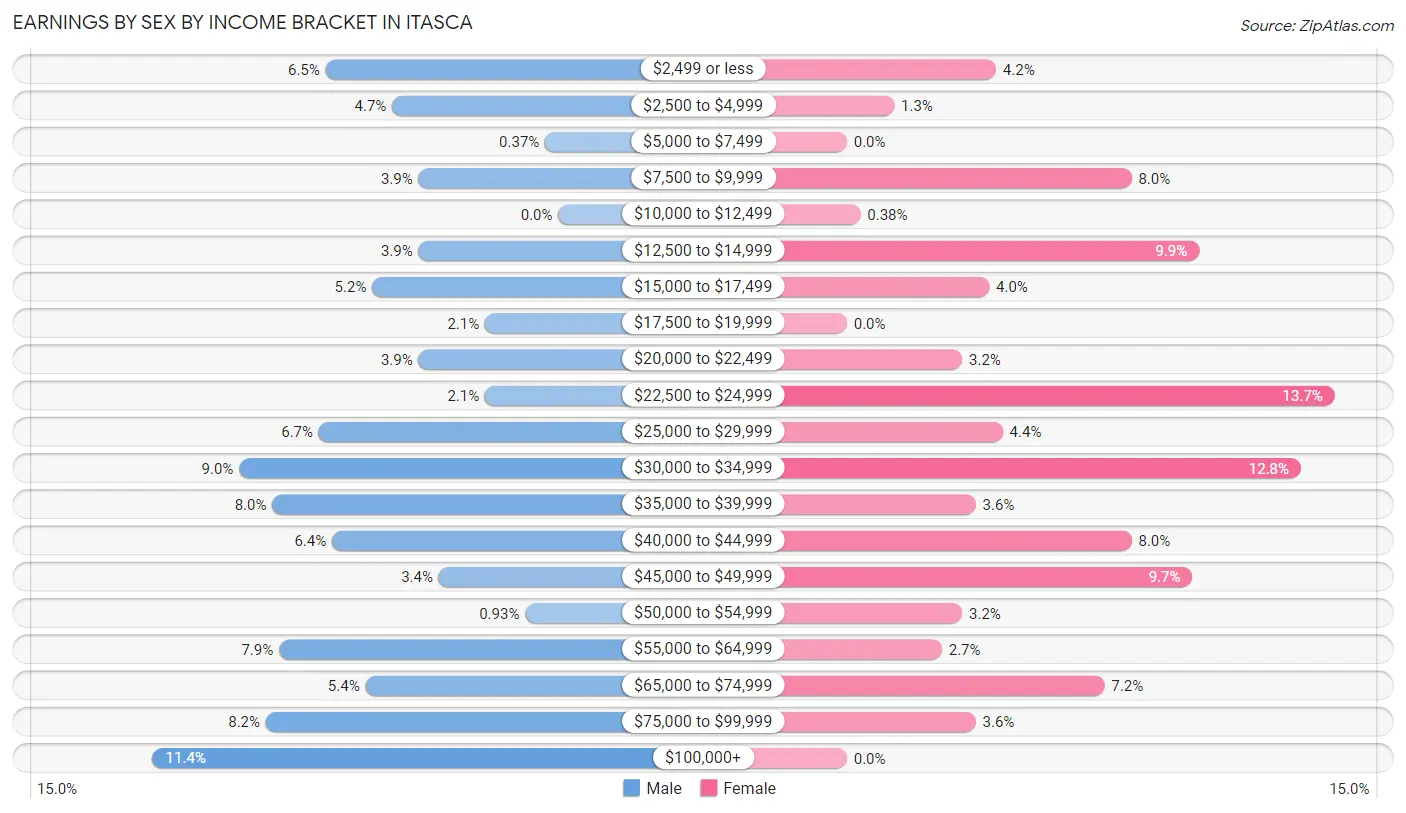
Earnings by Sex by Income Bracket in Itasca
The most common earnings brackets in Itasca are $100,000+ for men (61 | 11.4%) and $22,500 to $24,999 for women (72 | 13.7%).
| Income | Male | Female |
| $2,499 or less | 35 (6.5%) | 22 (4.2%) |
| $2,500 to $4,999 | 25 (4.7%) | 7 (1.3%) |
| $5,000 to $7,499 | 2 (0.4%) | 0 (0.0%) |
| $7,500 to $9,999 | 21 (3.9%) | 42 (8.0%) |
| $10,000 to $12,499 | 0 (0.0%) | 2 (0.4%) |
| $12,500 to $14,999 | 21 (3.9%) | 52 (9.9%) |
| $15,000 to $17,499 | 28 (5.2%) | 21 (4.0%) |
| $17,500 to $19,999 | 11 (2.1%) | 0 (0.0%) |
| $20,000 to $22,499 | 21 (3.9%) | 17 (3.2%) |
| $22,500 to $24,999 | 11 (2.1%) | 72 (13.7%) |
| $25,000 to $29,999 | 36 (6.7%) | 23 (4.4%) |
| $30,000 to $34,999 | 48 (9.0%) | 67 (12.8%) |
| $35,000 to $39,999 | 43 (8.0%) | 19 (3.6%) |
| $40,000 to $44,999 | 34 (6.4%) | 42 (8.0%) |
| $45,000 to $49,999 | 18 (3.4%) | 51 (9.7%) |
| $50,000 to $54,999 | 5 (0.9%) | 17 (3.2%) |
| $55,000 to $64,999 | 42 (7.9%) | 14 (2.7%) |
| $65,000 to $74,999 | 29 (5.4%) | 38 (7.2%) |
| $75,000 to $99,999 | 44 (8.2%) | 19 (3.6%) |
| $100,000+ | 61 (11.4%) | 0 (0.0%) |
| Total | 535 (100.0%) | 525 (100.0%) |
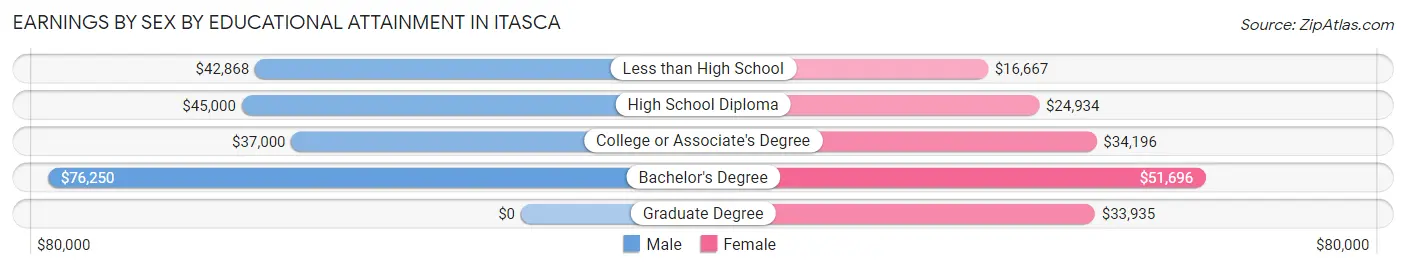
Earnings by Sex by Educational Attainment in Itasca
Average earnings in Itasca are $43,333 for men and $33,500 for women, a difference of 22.7%. Men with an educational attainment of bachelor's degree enjoy the highest average annual earnings of $76,250, while those with college or associate's degree education earn the least with $37,000. Women with an educational attainment of bachelor's degree earn the most with the average annual earnings of $51,696, while those with less than high school education have the smallest earnings of $16,667.
| Educational Attainment | Male Income | Female Income |
| Less than High School | $42,868 | $16,667 |
| High School Diploma | $45,000 | $24,934 |
| College or Associate's Degree | $37,000 | $34,196 |
| Bachelor's Degree | $76,250 | $51,696 |
| Graduate Degree | - | - |
| Total | $43,333 | $33,500 |
Family Income in Itasca
Family Income Brackets in Itasca
According to the Itasca family income data, there are 103 families falling into the $50,000 to $74,999 income range, which is the most common income bracket and makes up 22.9% of all families.
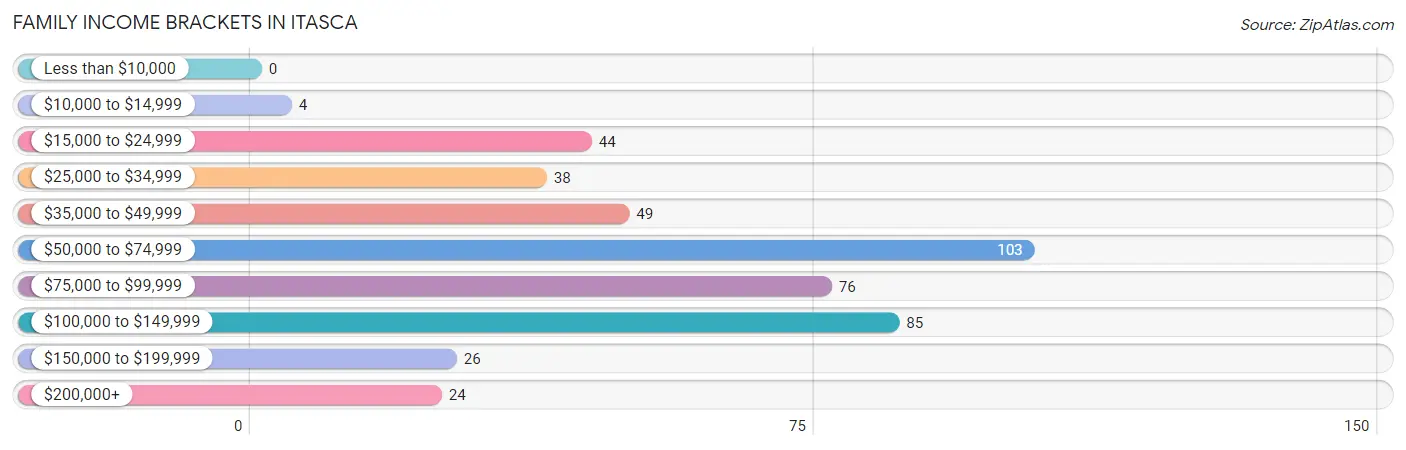
| Income Bracket | # Families | % Families |
| Less than $10,000 | 0 | 0.0% |
| $10,000 to $14,999 | 4 | 0.9% |
| $15,000 to $24,999 | 44 | 9.8% |
| $25,000 to $34,999 | 38 | 8.5% |
| $35,000 to $49,999 | 49 | 10.9% |
| $50,000 to $74,999 | 103 | 22.9% |
| $75,000 to $99,999 | 76 | 16.9% |
| $100,000 to $149,999 | 85 | 18.9% |
| $150,000 to $199,999 | 26 | 5.8% |
| $200,000+ | 24 | 5.3% |
Family Income by Famaliy Size in Itasca
5-person families (101 | 22.5%) account for the highest median family income in Itasca with $99,087 per family, while 2-person families (194 | 43.2%) have the highest median income of $35,938 per family member.
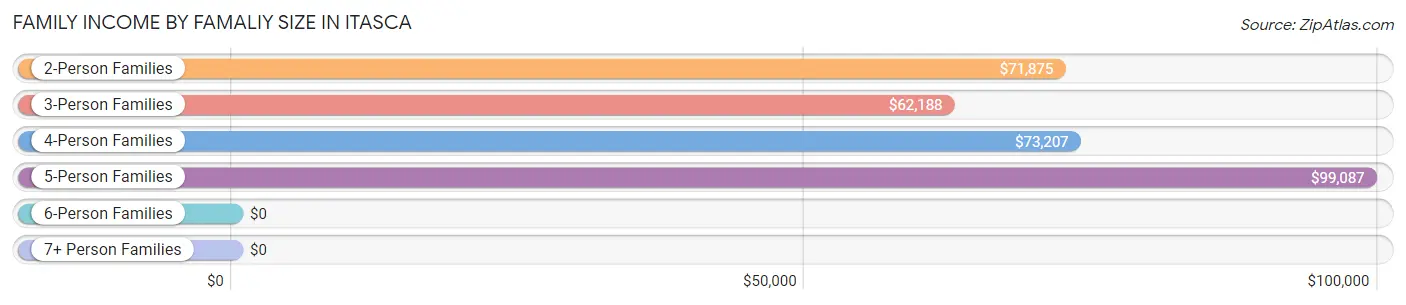
| Income Bracket | # Families | Median Income |
| 2-Person Families | 194 (43.2%) | $71,875 |
| 3-Person Families | 101 (22.5%) | $62,188 |
| 4-Person Families | 41 (9.1%) | $73,207 |
| 5-Person Families | 101 (22.5%) | $99,087 |
| 6-Person Families | 3 (0.7%) | $0 |
| 7+ Person Families | 9 (2.0%) | $0 |
| Total | 449 (100.0%) | $73,977 |
Family Income by Number of Earners in Itasca
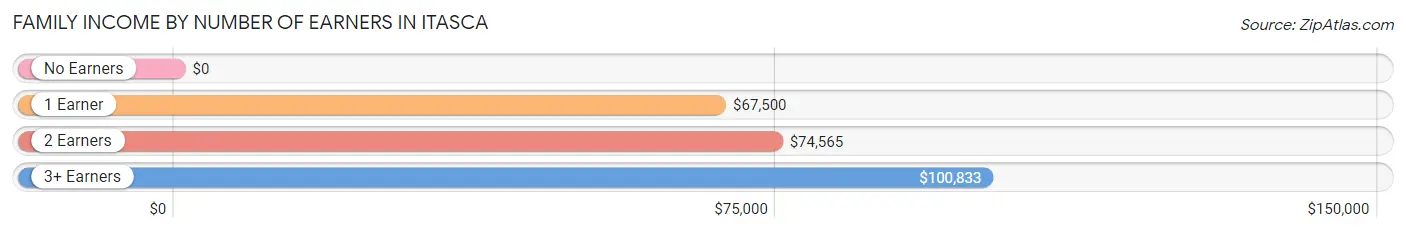
| Number of Earners | # Families | Median Income |
| No Earners | 45 (10.0%) | $0 |
| 1 Earner | 160 (35.6%) | $67,500 |
| 2 Earners | 134 (29.8%) | $74,565 |
| 3+ Earners | 110 (24.5%) | $100,833 |
| Total | 449 (100.0%) | $73,977 |
Household Income in Itasca
Household Income Brackets in Itasca
With 136 households falling in the category, the $35,000 to $49,999 income range is the most frequent in Itasca, accounting for 20.2% of all households. In contrast, only 7 households (1.0%) fall into the less than $10,000 income bracket, making it the least populous group.
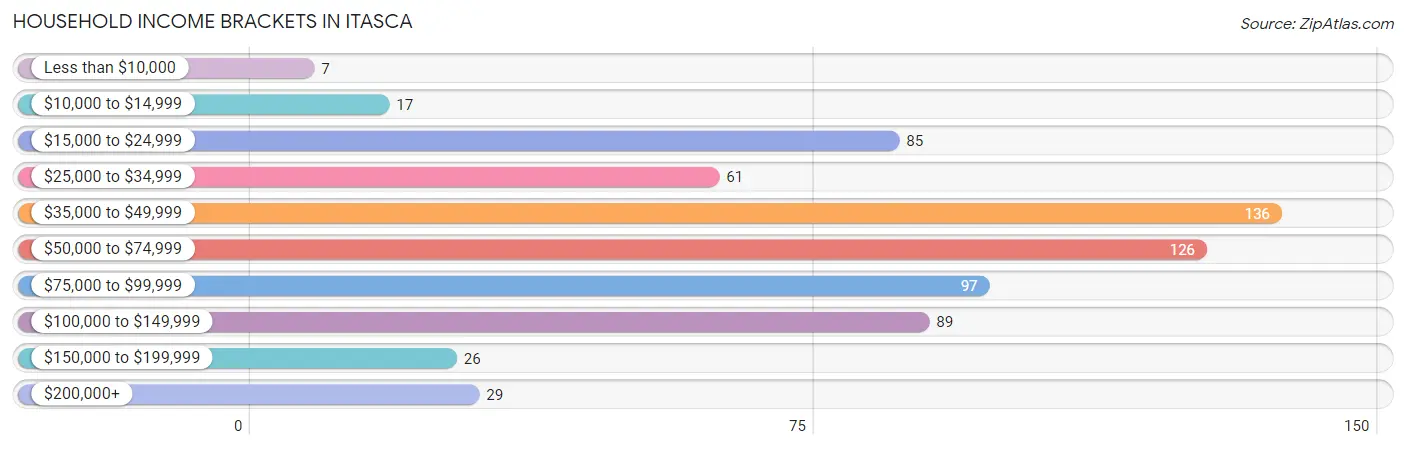
| Income Bracket | # Households | % Households |
| Less than $10,000 | 7 | 1.0% |
| $10,000 to $14,999 | 17 | 2.5% |
| $15,000 to $24,999 | 85 | 12.6% |
| $25,000 to $34,999 | 61 | 9.1% |
| $35,000 to $49,999 | 136 | 20.2% |
| $50,000 to $74,999 | 126 | 18.7% |
| $75,000 to $99,999 | 97 | 14.4% |
| $100,000 to $149,999 | 89 | 13.2% |
| $150,000 to $199,999 | 26 | 3.9% |
| $200,000+ | 29 | 4.3% |
Household Income by Householder Age in Itasca
The median household income in Itasca is $58,098, with the highest median household income of $98,108 found in the 15 to 24 years age bracket for the primary householder. A total of 56 households (8.3%) fall into this category. Meanwhile, the 45 to 64 years age bracket for the primary householder has the lowest median household income of $39,438, with 214 households (31.8%) in this group.
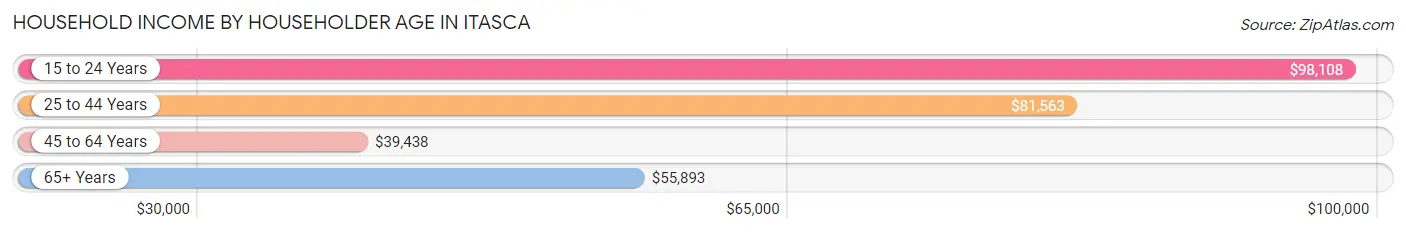
| Income Bracket | # Households | Median Income |
| 15 to 24 Years | 56 (8.3%) | $98,108 |
| 25 to 44 Years | 213 (31.7%) | $81,563 |
| 45 to 64 Years | 214 (31.8%) | $39,438 |
| 65+ Years | 190 (28.2%) | $55,893 |
| Total | 673 (100.0%) | $58,098 |
Poverty in Itasca
Income Below Poverty by Sex and Age in Itasca
With 5.4% poverty level for males and 10.5% for females among the residents of Itasca, under 5 year old males and 15 year old females are the most vulnerable to poverty, with 21 males (43.8%) and 13 females (38.2%) in their respective age groups living below the poverty level.
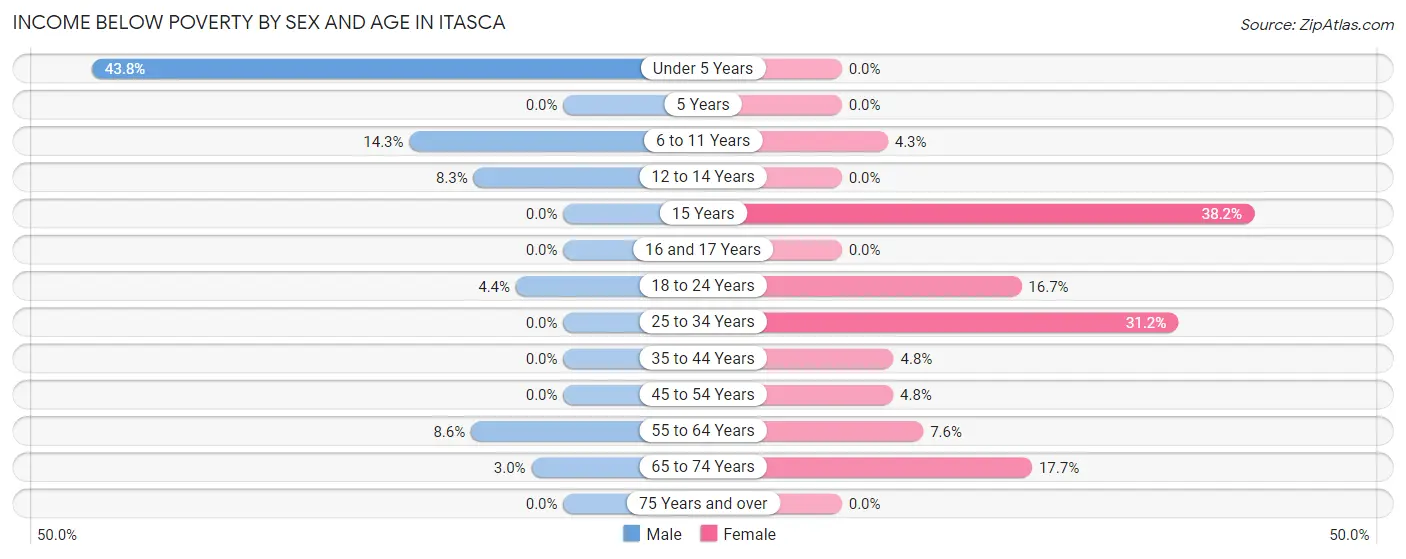
| Age Bracket | Male | Female |
| Under 5 Years | 21 (43.8%) | 0 (0.0%) |
| 5 Years | 0 (0.0%) | 0 (0.0%) |
| 6 to 11 Years | 5 (14.3%) | 5 (4.3%) |
| 12 to 14 Years | 4 (8.3%) | 0 (0.0%) |
| 15 Years | 0 (0.0%) | 13 (38.2%) |
| 16 and 17 Years | 0 (0.0%) | 0 (0.0%) |
| 18 to 24 Years | 6 (4.4%) | 15 (16.7%) |
| 25 to 34 Years | 0 (0.0%) | 44 (31.2%) |
| 35 to 44 Years | 0 (0.0%) | 5 (4.8%) |
| 45 to 54 Years | 0 (0.0%) | 5 (4.8%) |
| 55 to 64 Years | 9 (8.6%) | 13 (7.6%) |
| 65 to 74 Years | 4 (3.0%) | 12 (17.6%) |
| 75 Years and over | 0 (0.0%) | 0 (0.0%) |
| Total | 49 (5.4%) | 112 (10.5%) |
Income Above Poverty by Sex and Age in Itasca
According to the poverty statistics in Itasca, males aged 16 and 17 years and females aged under 5 years are the age groups that are most secure financially, with 100.0% of males and 100.0% of females in these age groups living above the poverty line.
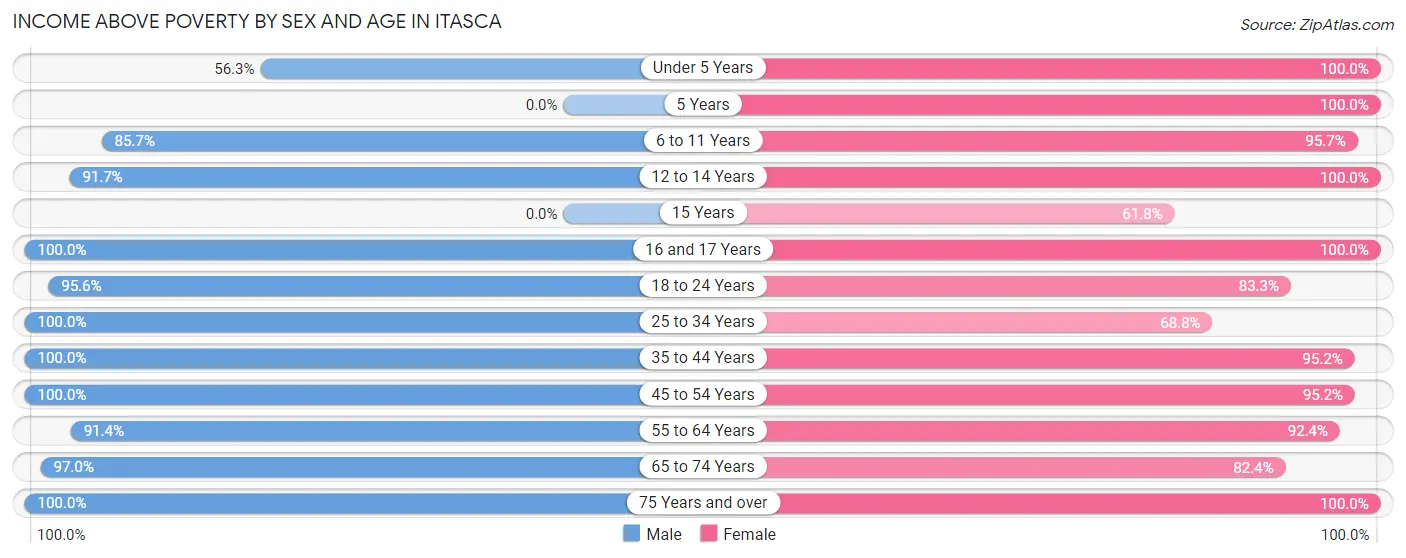
| Age Bracket | Male | Female |
| Under 5 Years | 27 (56.2%) | 44 (100.0%) |
| 5 Years | 0 (0.0%) | 12 (100.0%) |
| 6 to 11 Years | 30 (85.7%) | 112 (95.7%) |
| 12 to 14 Years | 44 (91.7%) | 101 (100.0%) |
| 15 Years | 0 (0.0%) | 21 (61.8%) |
| 16 and 17 Years | 41 (100.0%) | 33 (100.0%) |
| 18 to 24 Years | 130 (95.6%) | 75 (83.3%) |
| 25 to 34 Years | 107 (100.0%) | 97 (68.8%) |
| 35 to 44 Years | 152 (100.0%) | 99 (95.2%) |
| 45 to 54 Years | 57 (100.0%) | 100 (95.2%) |
| 55 to 64 Years | 96 (91.4%) | 159 (92.4%) |
| 65 to 74 Years | 131 (97.0%) | 56 (82.4%) |
| 75 Years and over | 35 (100.0%) | 44 (100.0%) |
| Total | 850 (94.6%) | 953 (89.5%) |
Income Below Poverty Among Married-Couple Families in Itasca
The poverty statistics for married-couple families in Itasca show that 3.5% or 10 of the total 286 families live below the poverty line. Families with 1 or 2 children have the highest poverty rate of 7.8%, comprising of 10 families. On the other hand, families with no children have the lowest poverty rate of 0.0%, which includes 0 families.
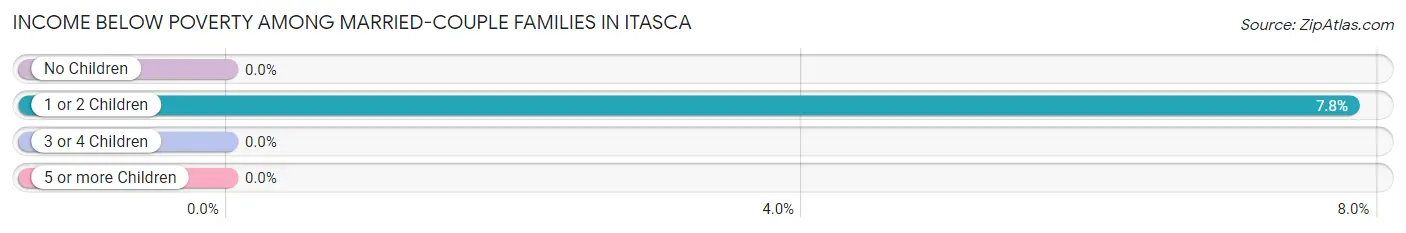
| Children | Above Poverty | Below Poverty |
| No Children | 126 (100.0%) | 0 (0.0%) |
| 1 or 2 Children | 118 (92.2%) | 10 (7.8%) |
| 3 or 4 Children | 32 (100.0%) | 0 (0.0%) |
| 5 or more Children | 0 (0.0%) | 0 (0.0%) |
| Total | 276 (96.5%) | 10 (3.5%) |
Income Below Poverty Among Single-Parent Households in Itasca
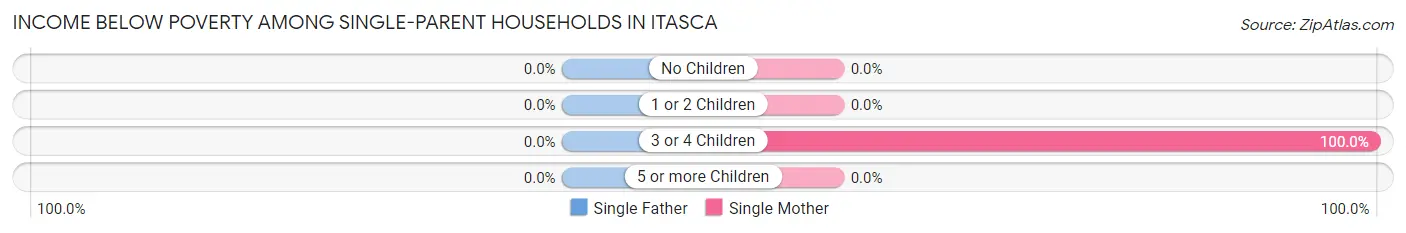
| Children | Single Father | Single Mother |
| No Children | 0 (0.0%) | 0 (0.0%) |
| 1 or 2 Children | 0 (0.0%) | 0 (0.0%) |
| 3 or 4 Children | 0 (0.0%) | 6 (100.0%) |
| 5 or more Children | 0 (0.0%) | 0 (0.0%) |
| Total | 0 (0.0%) | 6 (8.0%) |
Income Below Poverty Among Married-Couple vs Single-Parent Households in Itasca
The poverty data for Itasca shows that 10 of the married-couple family households (3.5%) and 6 of the single-parent households (3.7%) are living below the poverty level. Within the married-couple family households, those with 1 or 2 children have the highest poverty rate, with 10 households (7.8%) falling below the poverty line. Among the single-parent households, those with 3 or 4 children have the highest poverty rate, with 6 household (100.0%) living below poverty.
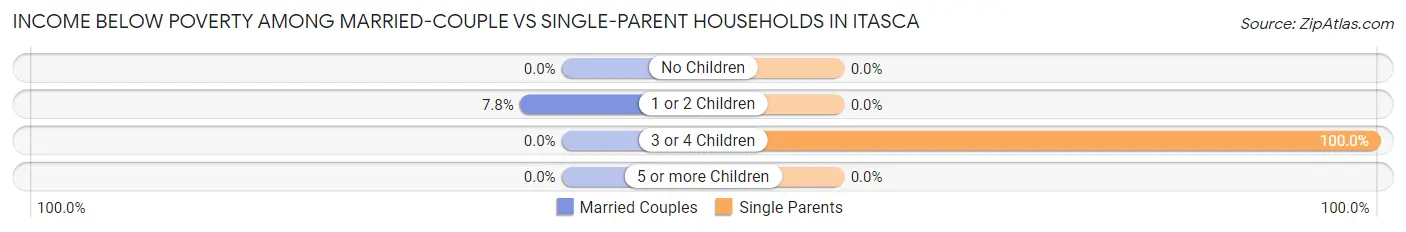
| Children | Married-Couple Families | Single-Parent Households |
| No Children | 0 (0.0%) | 0 (0.0%) |
| 1 or 2 Children | 10 (7.8%) | 0 (0.0%) |
| 3 or 4 Children | 0 (0.0%) | 6 (100.0%) |
| 5 or more Children | 0 (0.0%) | 0 (0.0%) |
| Total | 10 (3.5%) | 6 (3.7%) |
Race in Itasca
The most populous races in Itasca are White / Caucasian (1,331 | 65.7%), Hispanic or Latino (881 | 43.5%), and Some other Race (372 | 18.4%).
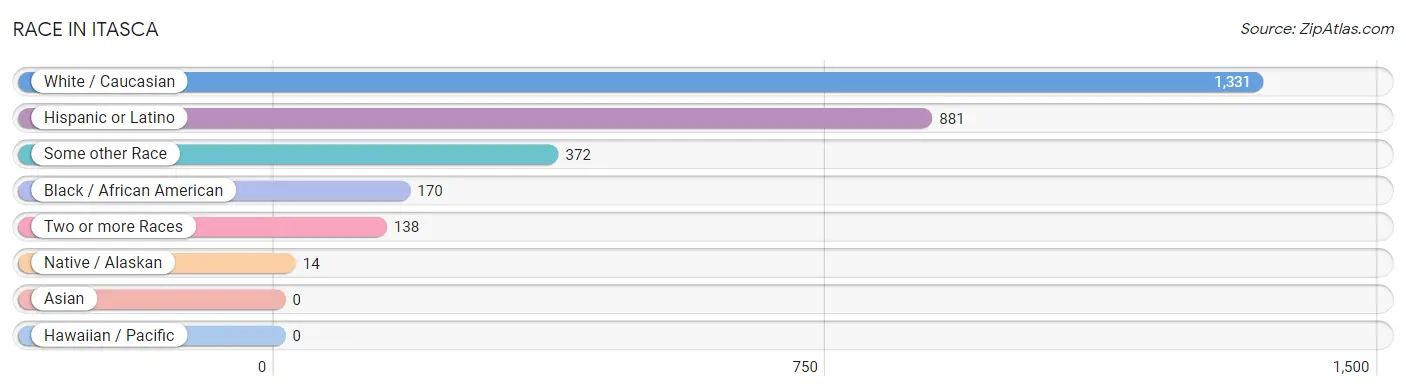
| Race | # Population | % Population |
| Asian | 0 | 0.0% |
| Black / African American | 170 | 8.4% |
| Hawaiian / Pacific | 0 | 0.0% |
| Hispanic or Latino | 881 | 43.5% |
| Native / Alaskan | 14 | 0.7% |
| White / Caucasian | 1,331 | 65.7% |
| Two or more Races | 138 | 6.8% |
| Some other Race | 372 | 18.4% |
| Total | 2,025 | 100.0% |
Ancestry in Itasca
The most populous ancestries reported in Itasca are Mexican (799 | 39.5%), German (142 | 7.0%), American (106 | 5.2%), English (94 | 4.6%), and Irish (77 | 3.8%), together accounting for 60.1% of all Itasca residents.
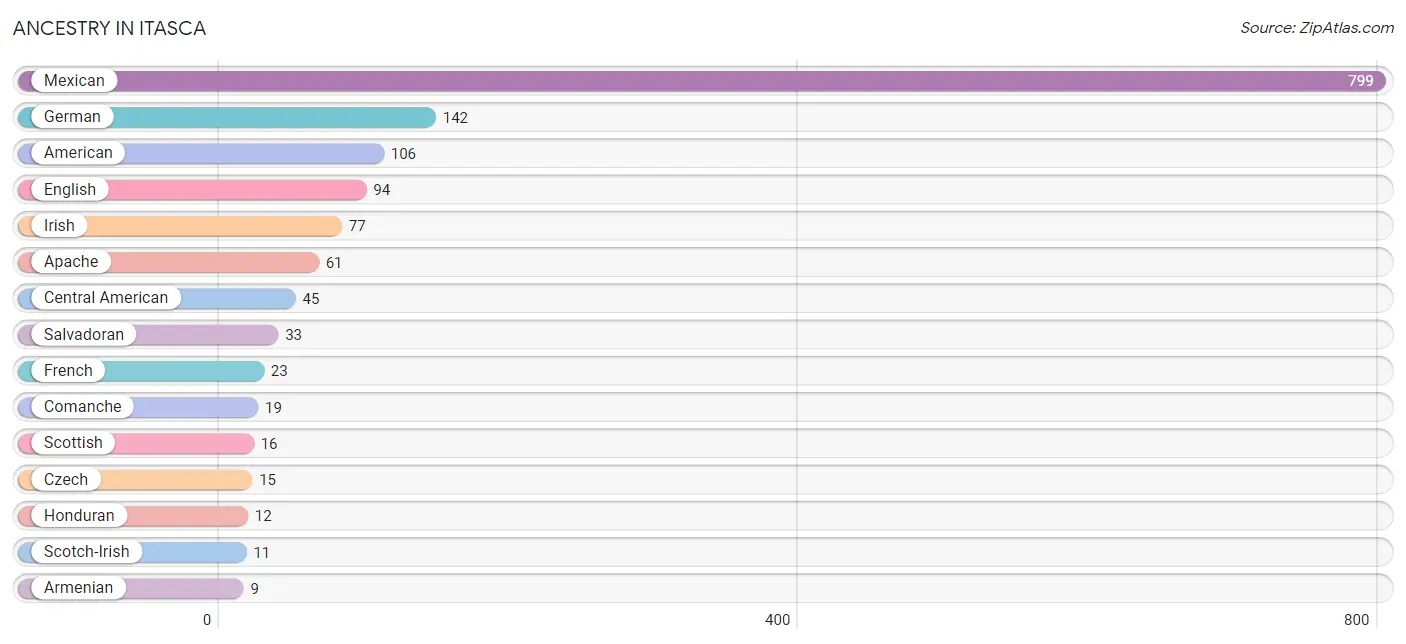
| Ancestry | # Population | % Population |
| African | 6 | 0.3% |
| American | 106 | 5.2% |
| Apache | 61 | 3.0% |
| Armenian | 9 | 0.4% |
| British | 4 | 0.2% |
| Central American | 45 | 2.2% |
| Cherokee | 3 | 0.2% |
| Comanche | 19 | 0.9% |
| Czech | 15 | 0.7% |
| Danish | 5 | 0.3% |
| Dutch | 5 | 0.3% |
| English | 94 | 4.6% |
| French | 23 | 1.1% |
| German | 142 | 7.0% |
| Honduran | 12 | 0.6% |
| Iranian | 6 | 0.3% |
| Irish | 77 | 3.8% |
| Lumbee | 6 | 0.3% |
| Mexican | 799 | 39.5% |
| Norwegian | 4 | 0.2% |
| Polish | 4 | 0.2% |
| Salvadoran | 33 | 1.6% |
| Scotch-Irish | 11 | 0.5% |
| Scottish | 16 | 0.8% |
| Subsaharan African | 6 | 0.3% |
| Swedish | 4 | 0.2% |
| Swiss | 7 | 0.4% | View All 27 Rows |
Immigrants in Itasca
The most numerous immigrant groups reported in Itasca came from Central America (116 | 5.7%), Latin America (116 | 5.7%), Mexico (108 | 5.3%), Europe (40 | 2.0%), and Germany (40 | 2.0%), together accounting for 20.8% of all Itasca residents.
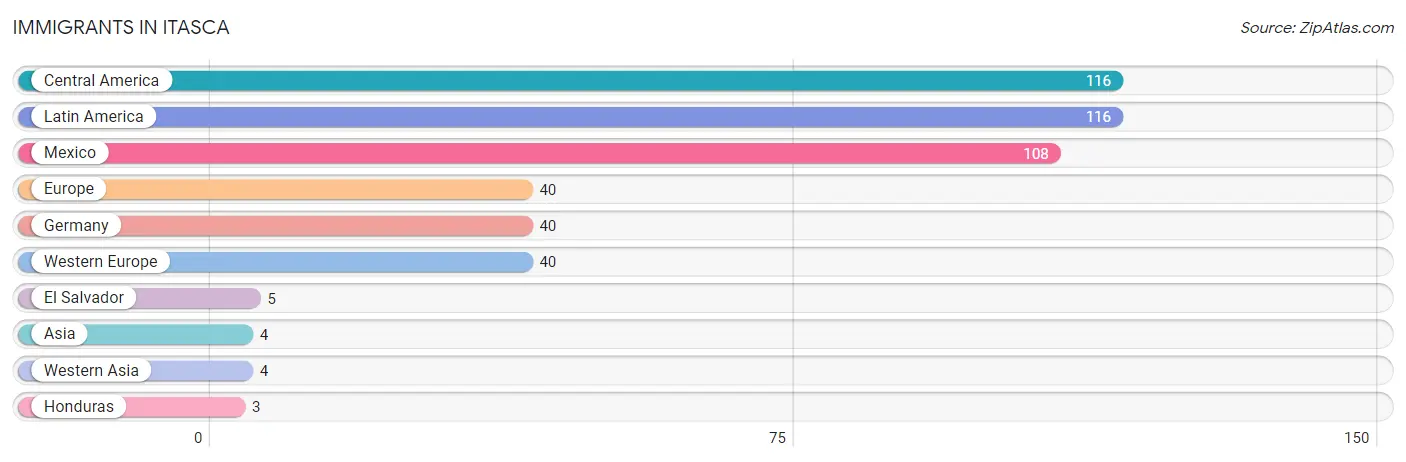
| Immigration Origin | # Population | % Population |
| Asia | 4 | 0.2% |
| Central America | 116 | 5.7% |
| El Salvador | 5 | 0.3% |
| Europe | 40 | 2.0% |
| Germany | 40 | 2.0% |
| Honduras | 3 | 0.2% |
| Latin America | 116 | 5.7% |
| Mexico | 108 | 5.3% |
| Western Asia | 4 | 0.2% |
| Western Europe | 40 | 2.0% | View All 10 Rows |
Sex and Age in Itasca
Sex and Age in Itasca
The most populous age groups in Itasca are 20 to 24 Years (108 | 11.6%) for men and 10 to 14 Years (127 | 11.6%) for women.
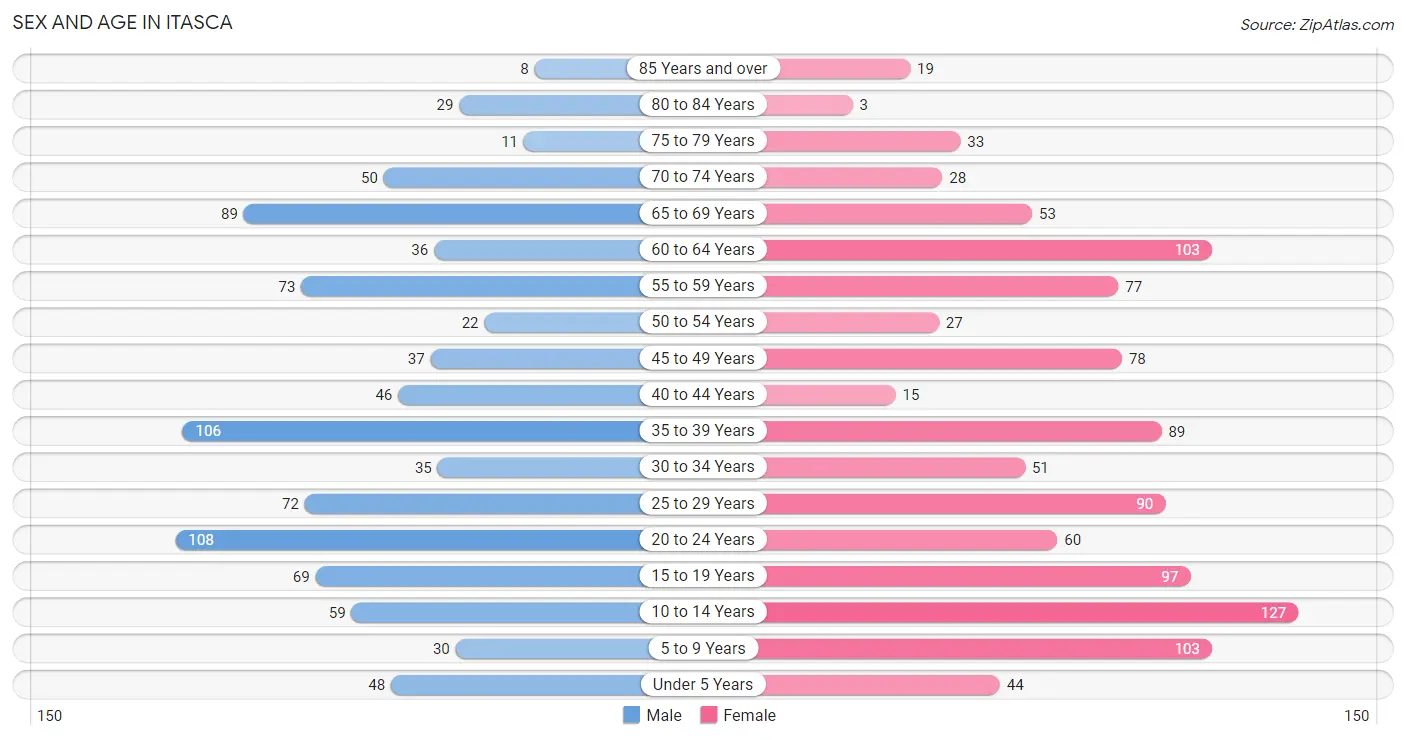
| Age Bracket | Male | Female |
| Under 5 Years | 48 (5.2%) | 44 (4.0%) |
| 5 to 9 Years | 30 (3.2%) | 103 (9.4%) |
| 10 to 14 Years | 59 (6.4%) | 127 (11.6%) |
| 15 to 19 Years | 69 (7.4%) | 97 (8.8%) |
| 20 to 24 Years | 108 (11.6%) | 60 (5.5%) |
| 25 to 29 Years | 72 (7.8%) | 90 (8.2%) |
| 30 to 34 Years | 35 (3.8%) | 51 (4.6%) |
| 35 to 39 Years | 106 (11.4%) | 89 (8.1%) |
| 40 to 44 Years | 46 (5.0%) | 15 (1.4%) |
| 45 to 49 Years | 37 (4.0%) | 78 (7.1%) |
| 50 to 54 Years | 22 (2.4%) | 27 (2.5%) |
| 55 to 59 Years | 73 (7.9%) | 77 (7.0%) |
| 60 to 64 Years | 36 (3.9%) | 103 (9.4%) |
| 65 to 69 Years | 89 (9.6%) | 53 (4.8%) |
| 70 to 74 Years | 50 (5.4%) | 28 (2.5%) |
| 75 to 79 Years | 11 (1.2%) | 33 (3.0%) |
| 80 to 84 Years | 29 (3.1%) | 3 (0.3%) |
| 85 Years and over | 8 (0.9%) | 19 (1.7%) |
| Total | 928 (100.0%) | 1,097 (100.0%) |
Families and Households in Itasca
Median Family Size in Itasca
The median family size in Itasca is 3.61 persons per family, with married-couple families (286 | 63.7%) accounting for the largest median family size of 4.07 persons per family. On the other hand, single female/mother families (75 | 16.7%) represent the smallest median family size with 2.80 persons per family.
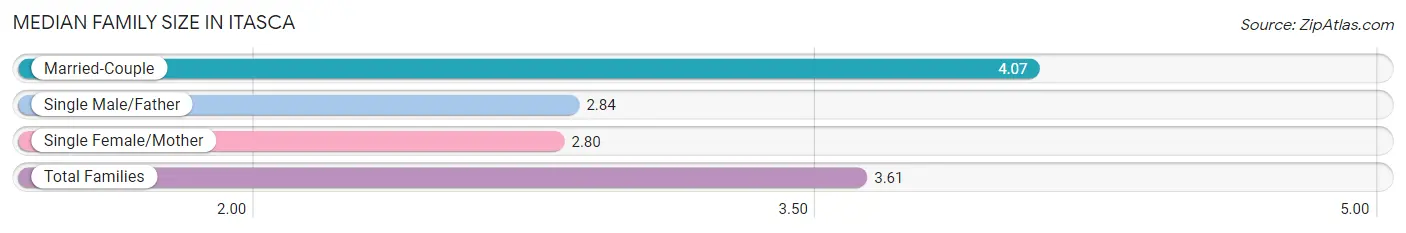
| Family Type | # Families | Family Size |
| Married-Couple | 286 (63.7%) | 4.07 |
| Single Male/Father | 88 (19.6%) | 2.84 |
| Single Female/Mother | 75 (16.7%) | 2.80 |
| Total Families | 449 (100.0%) | 3.61 |
Median Household Size in Itasca
The median household size in Itasca is 2.93 persons per household, with married-couple households (286 | 42.5%) accounting for the largest median household size of 4.17 persons per household. non-family households (224 | 33.3%) represent the smallest median household size with 1.13 persons per household.
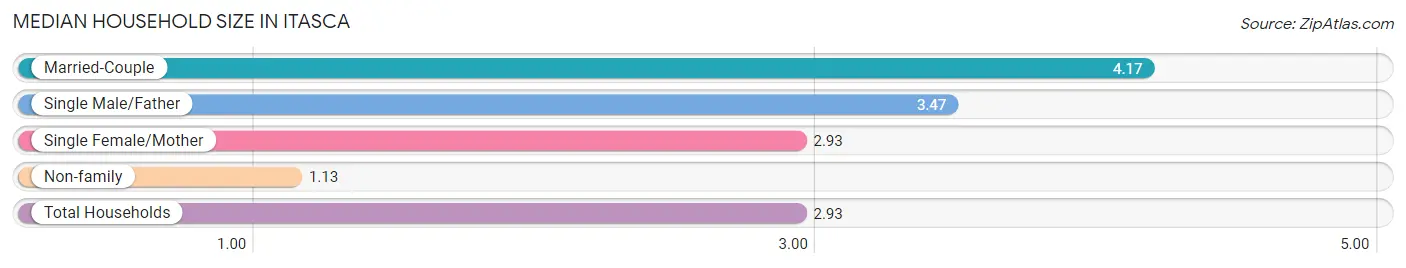
| Household Type | # Households | Household Size |
| Married-Couple | 286 (42.5%) | 4.17 |
| Single Male/Father | 88 (13.1%) | 3.47 |
| Single Female/Mother | 75 (11.1%) | 2.93 |
| Non-family | 224 (33.3%) | 1.13 |
| Total Households | 673 (100.0%) | 2.93 |
Household Size by Marriage Status in Itasca
Out of a total of 673 households in Itasca, 449 (66.7%) are family households, while 224 (33.3%) are nonfamily households. The most numerous type of family households are 3-person households, comprising 147, and the most common type of nonfamily households are 1-person households, comprising 199.
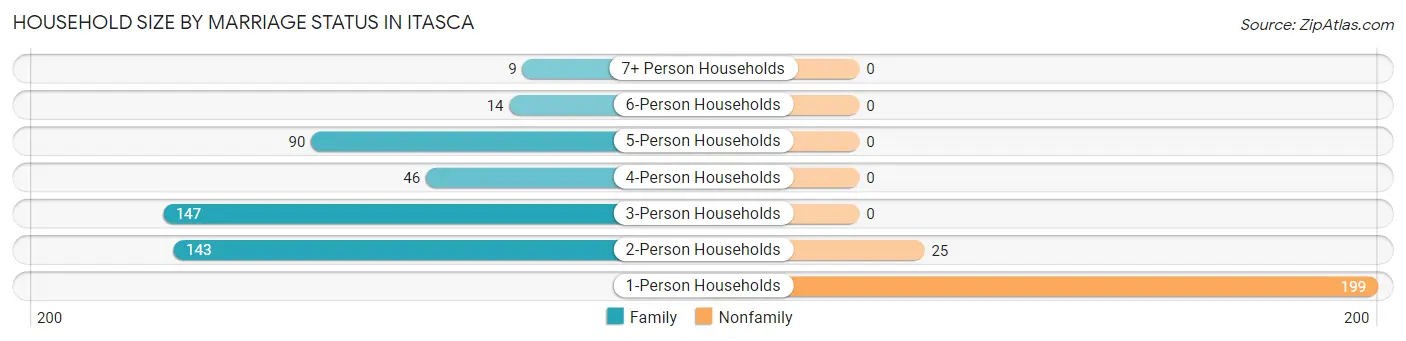
| Household Size | Family Households | Nonfamily Households |
| 1-Person Households | - | 199 (29.6%) |
| 2-Person Households | 143 (21.2%) | 25 (3.7%) |
| 3-Person Households | 147 (21.8%) | 0 (0.0%) |
| 4-Person Households | 46 (6.8%) | 0 (0.0%) |
| 5-Person Households | 90 (13.4%) | 0 (0.0%) |
| 6-Person Households | 14 (2.1%) | 0 (0.0%) |
| 7+ Person Households | 9 (1.3%) | 0 (0.0%) |
| Total | 449 (66.7%) | 224 (33.3%) |
Female Fertility in Itasca
Fertility by Age in Itasca
Average fertility rate in Itasca is 6.0 births per 1,000 women. Women in the age bracket of 20 to 34 years have the highest fertility rate with 15.0 births per 1,000 women. Women in the age bracket of 20 to 34 years acount for 100.0% of all women with births.
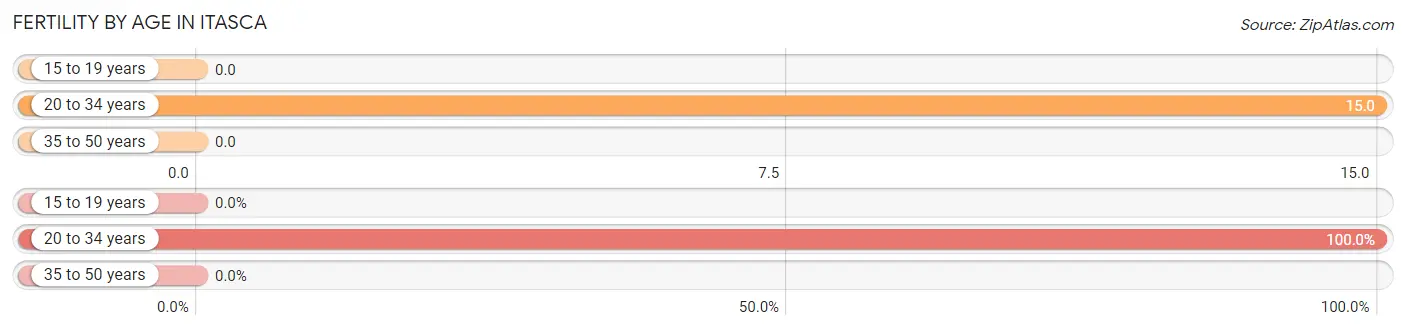
| Age Bracket | Women with Births | Births / 1,000 Women |
| 15 to 19 years | 0 (0.0%) | 0.0 |
| 20 to 34 years | 3 (100.0%) | 15.0 |
| 35 to 50 years | 0 (0.0%) | 0.0 |
| Total | 3 (100.0%) | 6.0 |
Fertility by Age by Marriage Status in Itasca
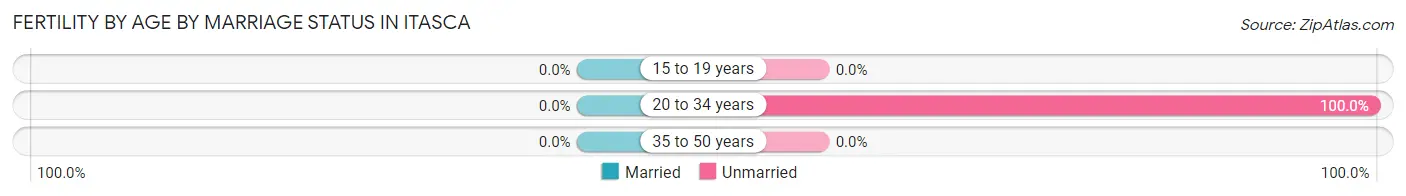
| Age Bracket | Married | Unmarried |
| 15 to 19 years | 0 (0.0%) | 0 (0.0%) |
| 20 to 34 years | 0 (0.0%) | 3 (100.0%) |
| 35 to 50 years | 0 (0.0%) | 0 (0.0%) |
| Total | 0 (0.0%) | 3 (100.0%) |
Fertility by Education in Itasca
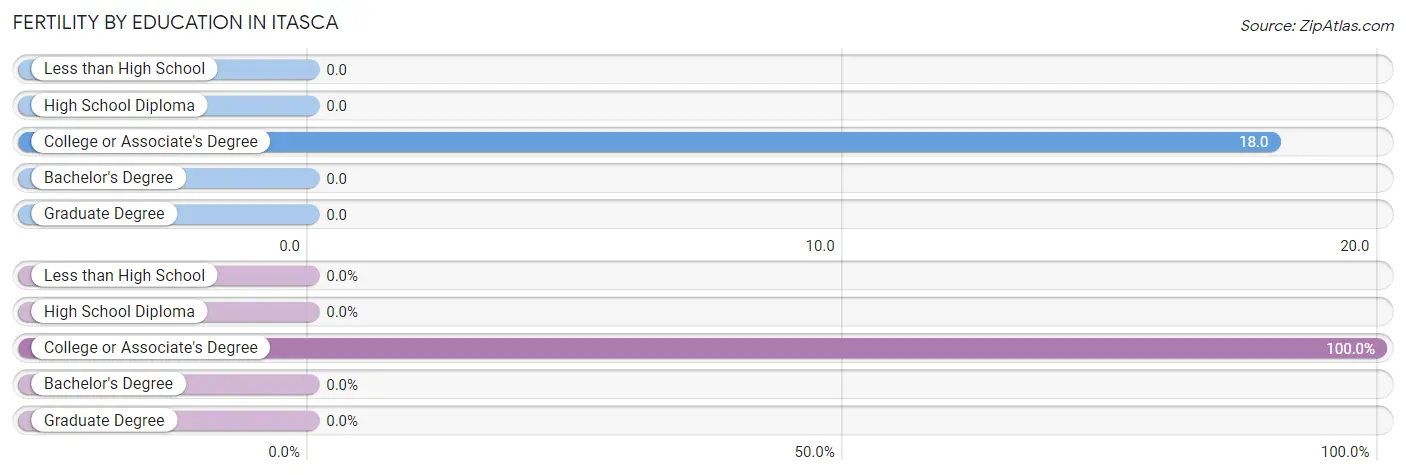
| Educational Attainment | Women with Births | Births / 1,000 Women |
| Less than High School | 0 (0.0%) | 0.0 |
| High School Diploma | 0 (0.0%) | 0.0 |
| College or Associate's Degree | 3 (100.0%) | 18.0 |
| Bachelor's Degree | 0 (0.0%) | 0.0 |
| Graduate Degree | 0 (0.0%) | 0.0 |
| Total | 3 (100.0%) | 6.0 |
Fertility by Education by Marriage Status in Itasca
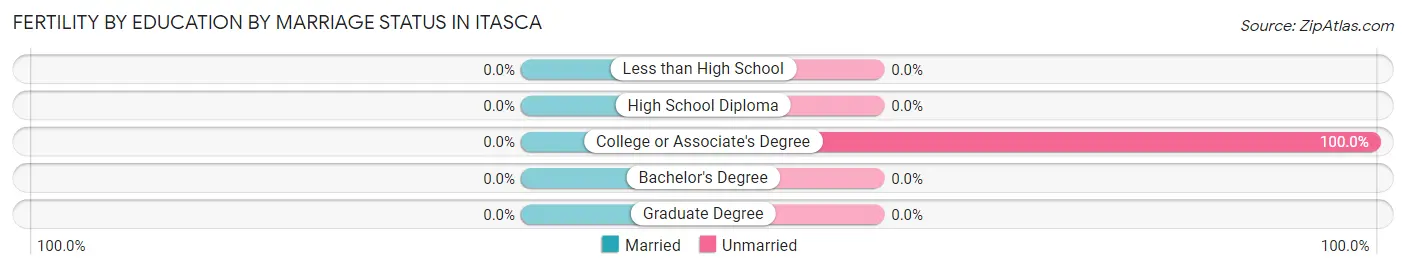
| Educational Attainment | Married | Unmarried |
| Less than High School | 0 (0.0%) | 0 (0.0%) |
| High School Diploma | 0 (0.0%) | 0 (0.0%) |
| College or Associate's Degree | 0 (0.0%) | 3 (100.0%) |
| Bachelor's Degree | 0 (0.0%) | 0 (0.0%) |
| Graduate Degree | 0 (0.0%) | 0 (0.0%) |
| Total | 0 (0.0%) | 3 (100.0%) |
Employment Characteristics in Itasca
Employment by Class of Employer in Itasca
Among the 974 employed individuals in Itasca, private company employees (708 | 72.7%), local government employees (104 | 10.7%), and self-employed (not incorporated) (88 | 9.0%) make up the most common classes of employment.
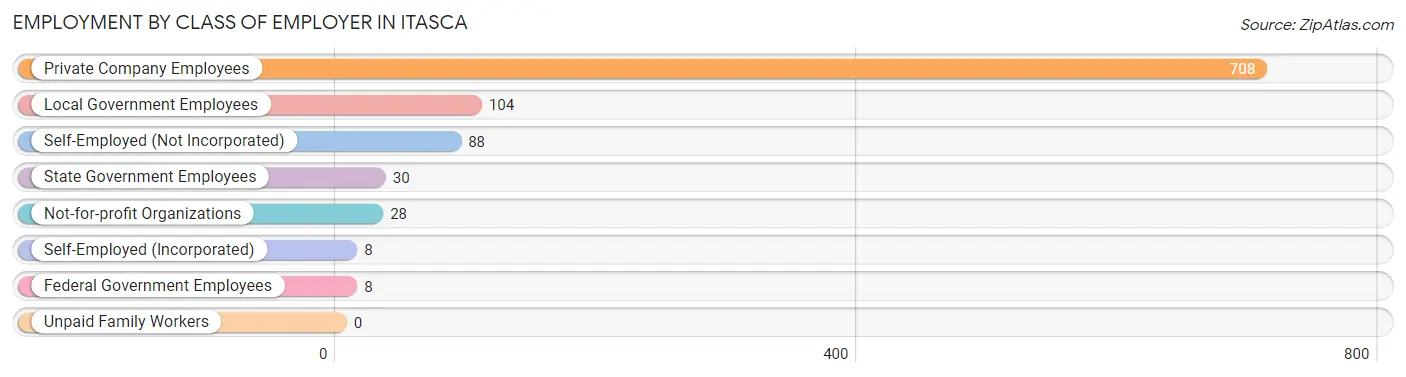
| Employer Class | # Employees | % Employees |
| Private Company Employees | 708 | 72.7% |
| Self-Employed (Incorporated) | 8 | 0.8% |
| Self-Employed (Not Incorporated) | 88 | 9.0% |
| Not-for-profit Organizations | 28 | 2.9% |
| Local Government Employees | 104 | 10.7% |
| State Government Employees | 30 | 3.1% |
| Federal Government Employees | 8 | 0.8% |
| Unpaid Family Workers | 0 | 0.0% |
| Total | 974 | 100.0% |
Employment Status by Age in Itasca
According to the labor force statistics for Itasca, out of the total population over 16 years of age (1,580), 65.5% or 1,035 individuals are in the labor force, with 1.0% or 10 of them unemployed. The age group with the highest labor force participation rate is 35 to 44 years, with 96.5% or 247 individuals in the labor force. Within the labor force, the 55 to 59 years age range has the highest percentage of unemployed individuals, with 5.4% or 5 of them being unemployed.
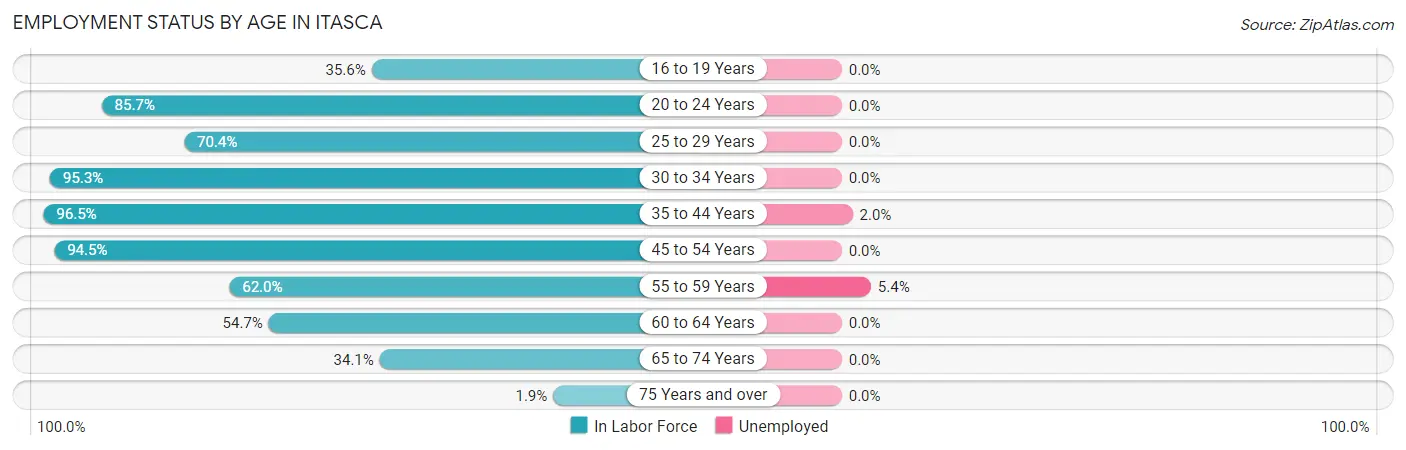
| Age Bracket | In Labor Force | Unemployed |
| 16 to 19 Years | 47 (35.6%) | 0 (0.0%) |
| 20 to 24 Years | 144 (85.7%) | 0 (0.0%) |
| 25 to 29 Years | 114 (70.4%) | 0 (0.0%) |
| 30 to 34 Years | 82 (95.3%) | 0 (0.0%) |
| 35 to 44 Years | 247 (96.5%) | 5 (2.0%) |
| 45 to 54 Years | 155 (94.5%) | 0 (0.0%) |
| 55 to 59 Years | 93 (62.0%) | 5 (5.4%) |
| 60 to 64 Years | 76 (54.7%) | 0 (0.0%) |
| 65 to 74 Years | 75 (34.1%) | 0 (0.0%) |
| 75 Years and over | 2 (1.9%) | 0 (0.0%) |
| Total | 1,035 (65.5%) | 10 (1.0%) |
Employment Status by Educational Attainment in Itasca
According to labor force statistics for Itasca, 80.1% of individuals (767) out of the total population between 25 and 64 years of age (957) are in the labor force, with 1.3% or 10 of them being unemployed. The group with the highest labor force participation rate are those with the educational attainment of high school diploma, with 85.5% or 337 individuals in the labor force. Within the labor force, individuals with less than high school education have the highest percentage of unemployment, with 9.3% or 5 of them being unemployed.
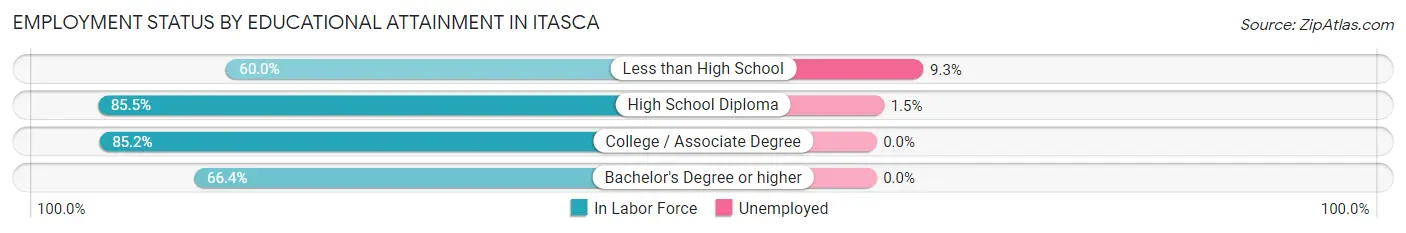
| Educational Attainment | In Labor Force | Unemployed |
| Less than High School | 54 (60.0%) | 8 (9.3%) |
| High School Diploma | 337 (85.5%) | 6 (1.5%) |
| College / Associate Degree | 281 (85.2%) | 0 (0.0%) |
| Bachelor's Degree or higher | 95 (66.4%) | 0 (0.0%) |
| Total | 767 (80.1%) | 12 (1.3%) |
Employment Occupations by Sex in Itasca
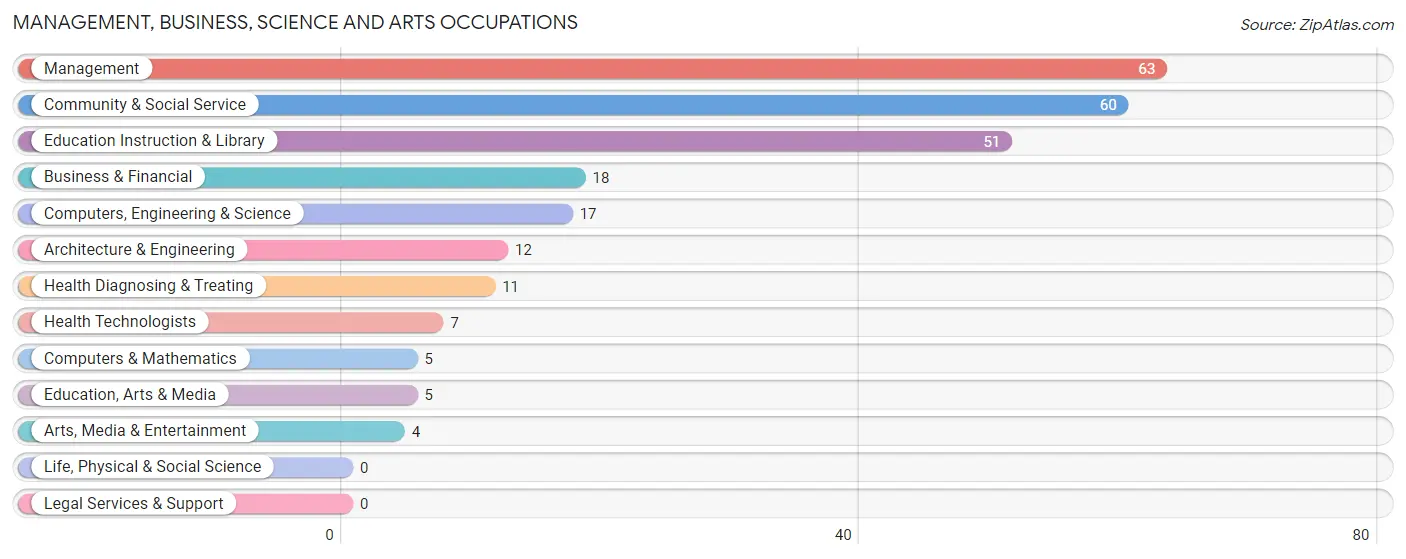
Management, Business, Science and Arts Occupations
The most common Management, Business, Science and Arts occupations in Itasca are Management (63 | 6.1%), Community & Social Service (60 | 5.9%), Education Instruction & Library (51 | 5.0%), Business & Financial (18 | 1.8%), and Computers, Engineering & Science (17 | 1.7%).
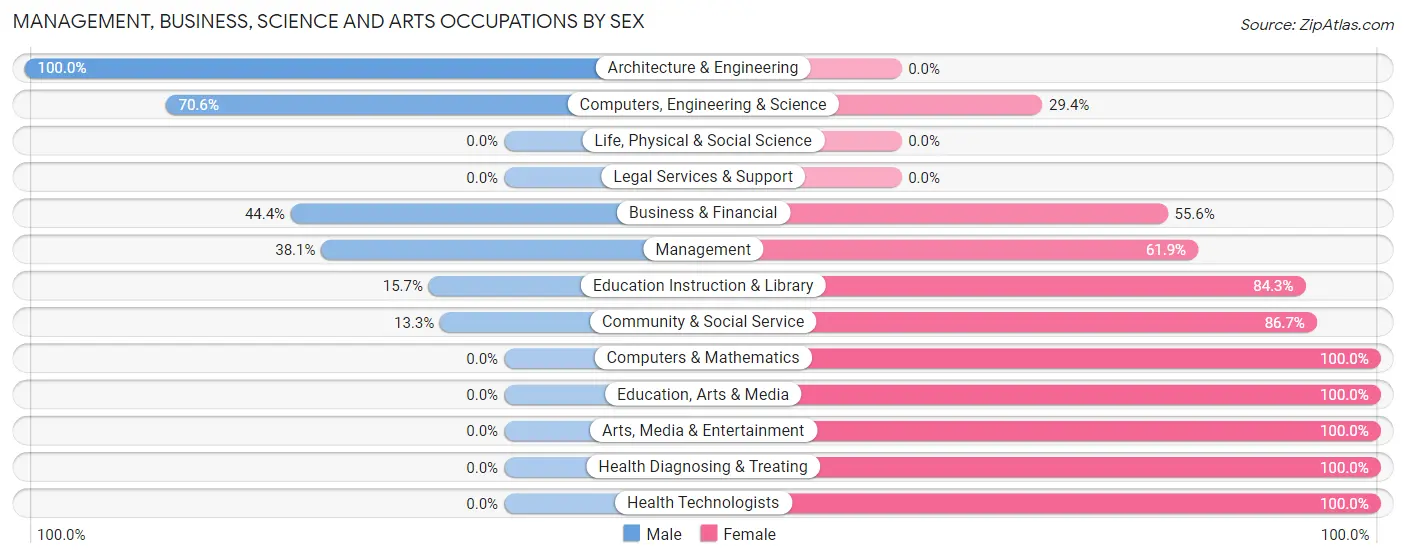
Management, Business, Science and Arts Occupations by Sex
Within the Management, Business, Science and Arts occupations in Itasca, the most male-oriented occupations are Architecture & Engineering (100.0%), Computers, Engineering & Science (70.6%), and Business & Financial (44.4%), while the most female-oriented occupations are Computers & Mathematics (100.0%), Education, Arts & Media (100.0%), and Arts, Media & Entertainment (100.0%).
| Occupation | Male | Female |
| Management | 24 (38.1%) | 39 (61.9%) |
| Business & Financial | 8 (44.4%) | 10 (55.6%) |
| Computers, Engineering & Science | 12 (70.6%) | 5 (29.4%) |
| Computers & Mathematics | 0 (0.0%) | 5 (100.0%) |
| Architecture & Engineering | 12 (100.0%) | 0 (0.0%) |
| Life, Physical & Social Science | 0 (0.0%) | 0 (0.0%) |
| Community & Social Service | 8 (13.3%) | 52 (86.7%) |
| Education, Arts & Media | 0 (0.0%) | 5 (100.0%) |
| Legal Services & Support | 0 (0.0%) | 0 (0.0%) |
| Education Instruction & Library | 8 (15.7%) | 43 (84.3%) |
| Arts, Media & Entertainment | 0 (0.0%) | 4 (100.0%) |
| Health Diagnosing & Treating | 0 (0.0%) | 11 (100.0%) |
| Health Technologists | 0 (0.0%) | 7 (100.0%) |
| Total (Category) | 52 (30.8%) | 117 (69.2%) |
| Total (Overall) | 514 (50.1%) | 511 (49.8%) |
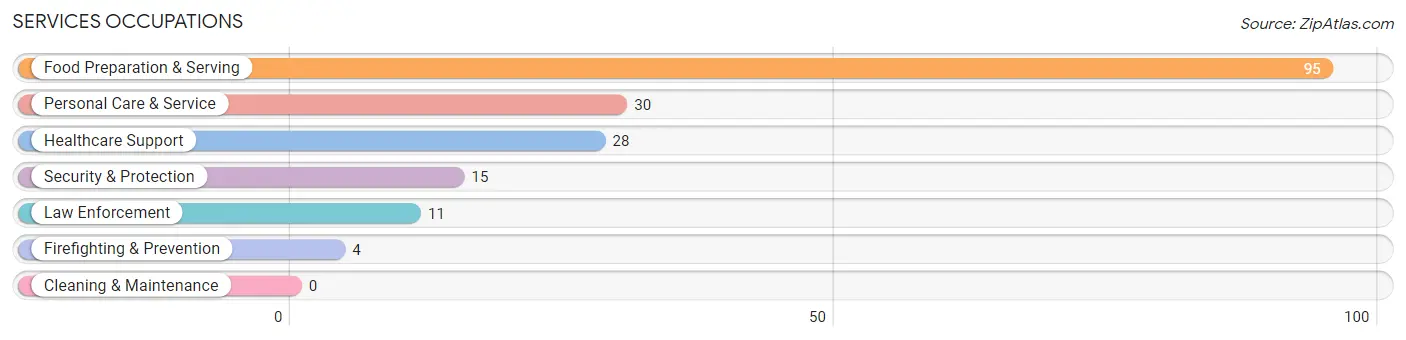
Services Occupations
The most common Services occupations in Itasca are Food Preparation & Serving (95 | 9.3%), Personal Care & Service (30 | 2.9%), Healthcare Support (28 | 2.7%), Security & Protection (15 | 1.5%), and Law Enforcement (11 | 1.1%).
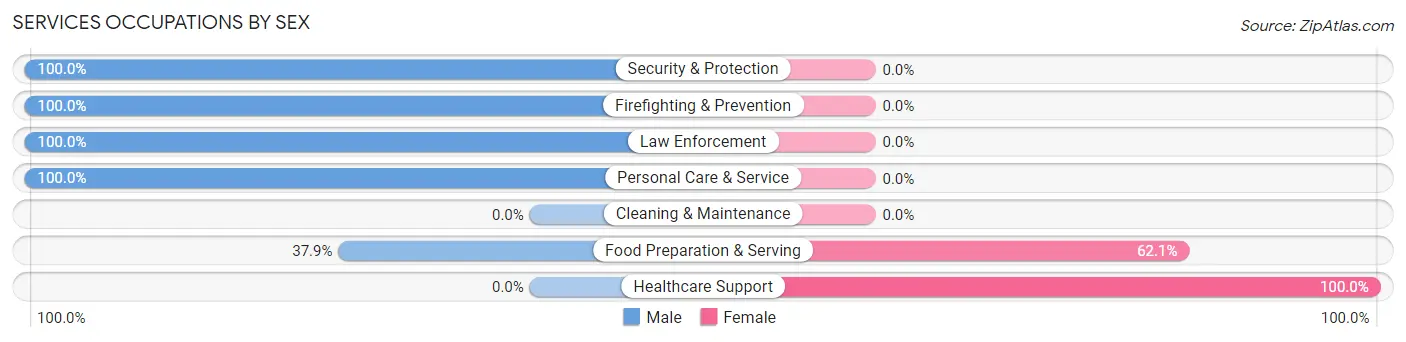
Services Occupations by Sex
Within the Services occupations in Itasca, the most male-oriented occupations are Security & Protection (100.0%), Firefighting & Prevention (100.0%), and Law Enforcement (100.0%), while the most female-oriented occupations are Healthcare Support (100.0%), and Food Preparation & Serving (62.1%).
| Occupation | Male | Female |
| Healthcare Support | 0 (0.0%) | 28 (100.0%) |
| Security & Protection | 15 (100.0%) | 0 (0.0%) |
| Firefighting & Prevention | 4 (100.0%) | 0 (0.0%) |
| Law Enforcement | 11 (100.0%) | 0 (0.0%) |
| Food Preparation & Serving | 36 (37.9%) | 59 (62.1%) |
| Cleaning & Maintenance | 0 (0.0%) | 0 (0.0%) |
| Personal Care & Service | 30 (100.0%) | 0 (0.0%) |
| Total (Category) | 81 (48.2%) | 87 (51.8%) |
| Total (Overall) | 514 (50.1%) | 511 (49.8%) |
Sales and Office Occupations
The most common Sales and Office occupations in Itasca are Office & Administration (115 | 11.2%), and Sales & Related (107 | 10.4%).
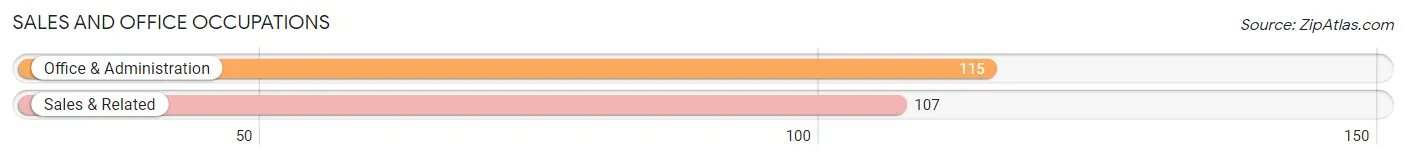
Sales and Office Occupations by Sex
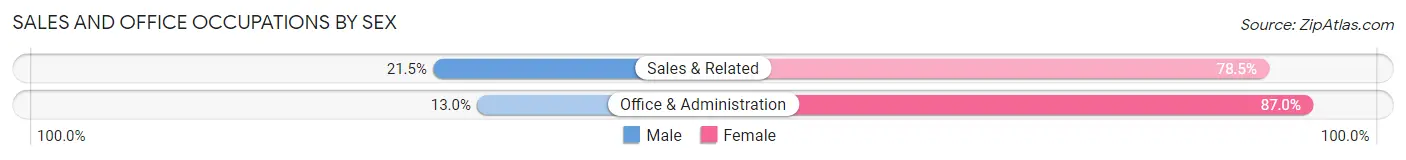
| Occupation | Male | Female |
| Sales & Related | 23 (21.5%) | 84 (78.5%) |
| Office & Administration | 15 (13.0%) | 100 (87.0%) |
| Total (Category) | 38 (17.1%) | 184 (82.9%) |
| Total (Overall) | 514 (50.1%) | 511 (49.8%) |
Natural Resources, Construction and Maintenance Occupations
The most common Natural Resources, Construction and Maintenance occupations in Itasca are Construction & Extraction (85 | 8.3%), Installation, Maintenance & Repair (38 | 3.7%), and Farming, Fishing & Forestry (29 | 2.8%).
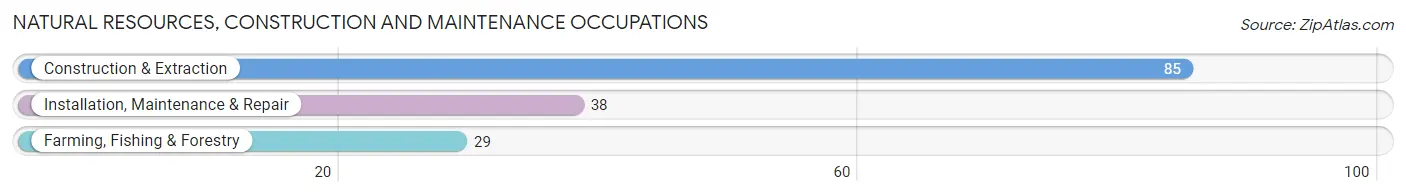
Natural Resources, Construction and Maintenance Occupations by Sex
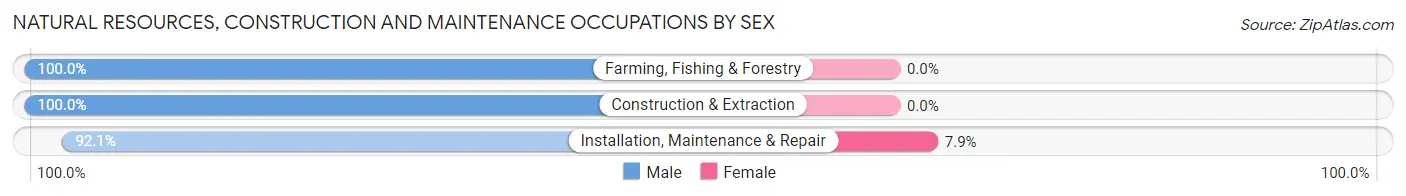
| Occupation | Male | Female |
| Farming, Fishing & Forestry | 29 (100.0%) | 0 (0.0%) |
| Construction & Extraction | 85 (100.0%) | 0 (0.0%) |
| Installation, Maintenance & Repair | 35 (92.1%) | 3 (7.9%) |
| Total (Category) | 149 (98.0%) | 3 (2.0%) |
| Total (Overall) | 514 (50.1%) | 511 (49.8%) |
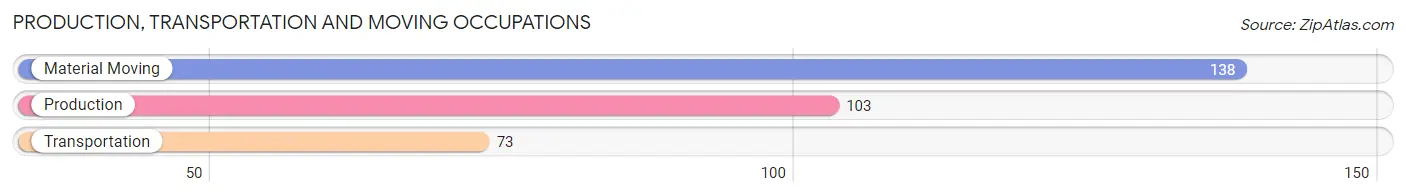
Production, Transportation and Moving Occupations
The most common Production, Transportation and Moving occupations in Itasca are Material Moving (138 | 13.5%), Production (103 | 10.1%), and Transportation (73 | 7.1%).
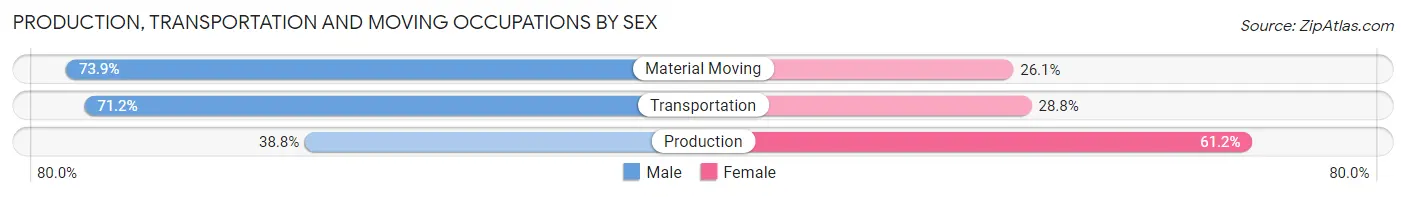
Production, Transportation and Moving Occupations by Sex
| Occupation | Male | Female |
| Production | 40 (38.8%) | 63 (61.2%) |
| Transportation | 52 (71.2%) | 21 (28.8%) |
| Material Moving | 102 (73.9%) | 36 (26.1%) |
| Total (Category) | 194 (61.8%) | 120 (38.2%) |
| Total (Overall) | 514 (50.1%) | 511 (49.8%) |
Employment Industries by Sex in Itasca
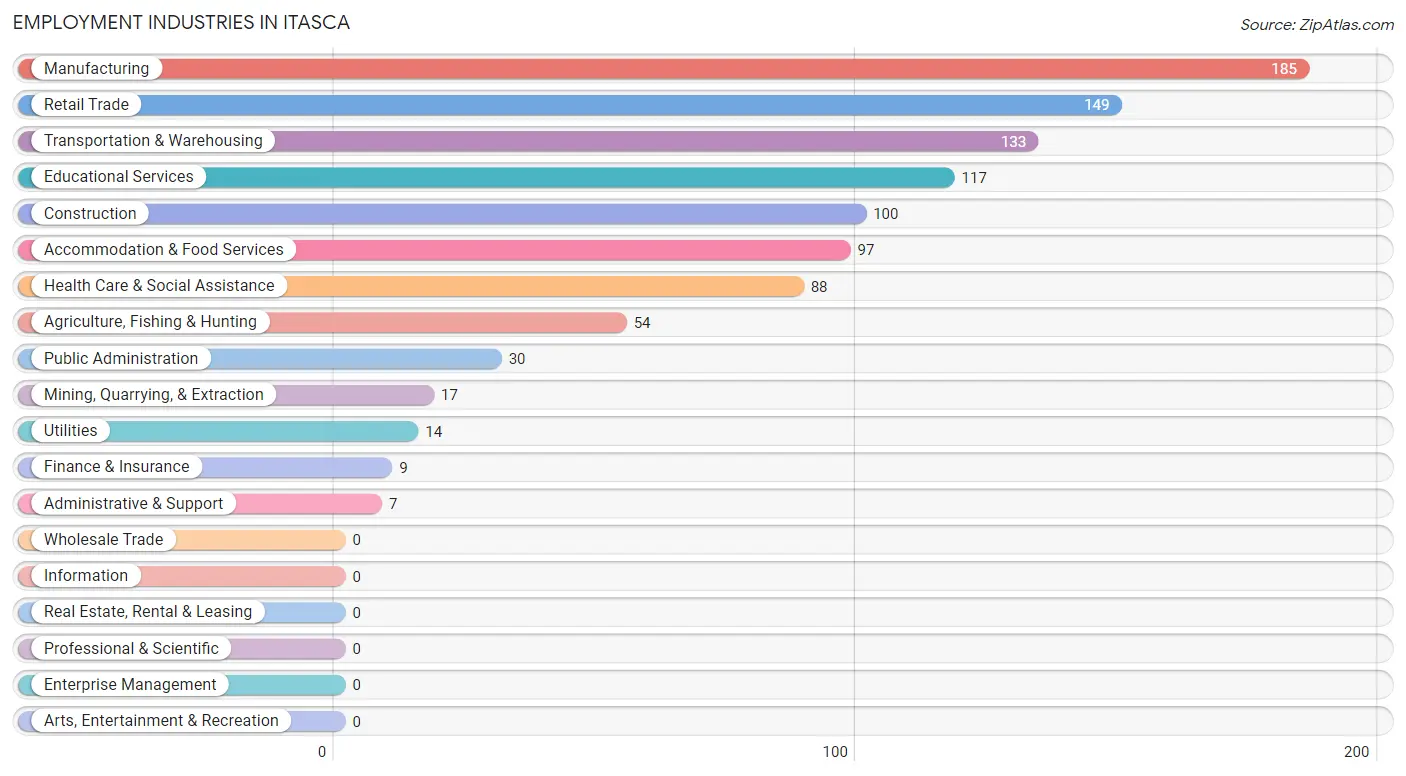
Employment Industries in Itasca
The major employment industries in Itasca include Manufacturing (185 | 18.0%), Retail Trade (149 | 14.5%), Transportation & Warehousing (133 | 13.0%), Educational Services (117 | 11.4%), and Construction (100 | 9.8%).
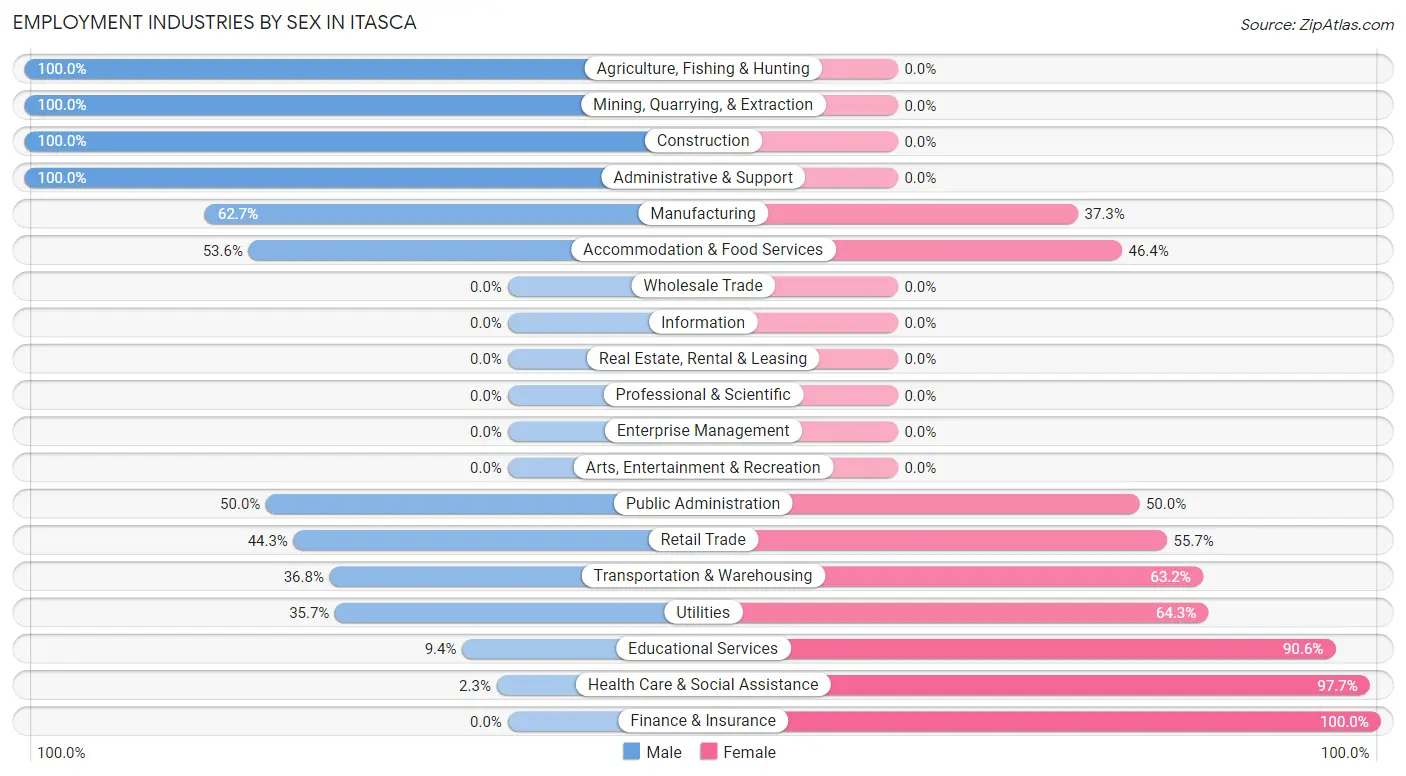
Employment Industries by Sex in Itasca
The Itasca industries that see more men than women are Agriculture, Fishing & Hunting (100.0%), Mining, Quarrying, & Extraction (100.0%), and Construction (100.0%), whereas the industries that tend to have a higher number of women are Finance & Insurance (100.0%), Health Care & Social Assistance (97.7%), and Educational Services (90.6%).
| Industry | Male | Female |
| Agriculture, Fishing & Hunting | 54 (100.0%) | 0 (0.0%) |
| Mining, Quarrying, & Extraction | 17 (100.0%) | 0 (0.0%) |
| Construction | 100 (100.0%) | 0 (0.0%) |
| Manufacturing | 116 (62.7%) | 69 (37.3%) |
| Wholesale Trade | 0 (0.0%) | 0 (0.0%) |
| Retail Trade | 66 (44.3%) | 83 (55.7%) |
| Transportation & Warehousing | 49 (36.8%) | 84 (63.2%) |
| Utilities | 5 (35.7%) | 9 (64.3%) |
| Information | 0 (0.0%) | 0 (0.0%) |
| Finance & Insurance | 0 (0.0%) | 9 (100.0%) |
| Real Estate, Rental & Leasing | 0 (0.0%) | 0 (0.0%) |
| Professional & Scientific | 0 (0.0%) | 0 (0.0%) |
| Enterprise Management | 0 (0.0%) | 0 (0.0%) |
| Administrative & Support | 7 (100.0%) | 0 (0.0%) |
| Educational Services | 11 (9.4%) | 106 (90.6%) |
| Health Care & Social Assistance | 2 (2.3%) | 86 (97.7%) |
| Arts, Entertainment & Recreation | 0 (0.0%) | 0 (0.0%) |
| Accommodation & Food Services | 52 (53.6%) | 45 (46.4%) |
| Public Administration | 15 (50.0%) | 15 (50.0%) |
| Total | 514 (50.1%) | 511 (49.8%) |
Education in Itasca
School Enrollment in Itasca
The most common levels of schooling among the 592 students in Itasca are high school (170 | 28.7%), middle school (149 | 25.2%), and elementary school (121 | 20.4%).
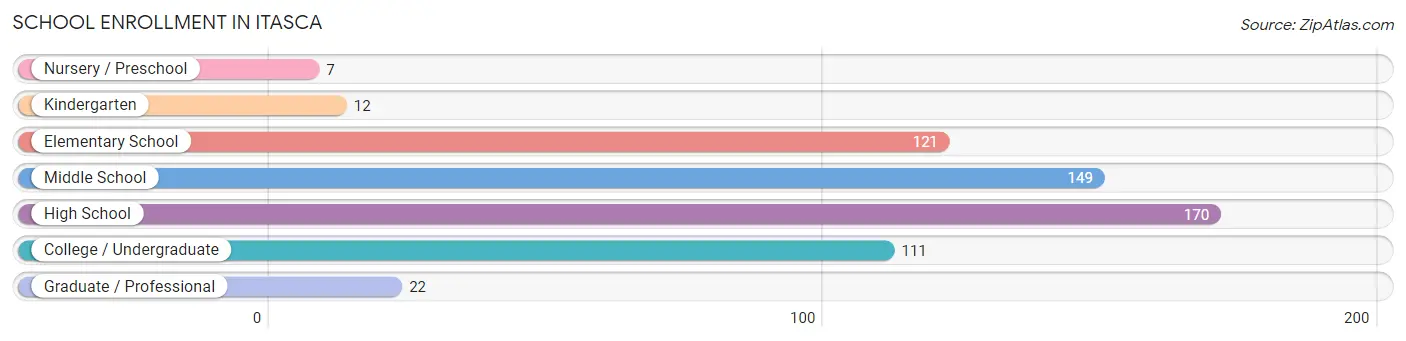
| School Level | # Students | % Students |
| Nursery / Preschool | 7 | 1.2% |
| Kindergarten | 12 | 2.0% |
| Elementary School | 121 | 20.4% |
| Middle School | 149 | 25.2% |
| High School | 170 | 28.7% |
| College / Undergraduate | 111 | 18.8% |
| Graduate / Professional | 22 | 3.7% |
| Total | 592 | 100.0% |
School Enrollment by Age by Funding Source in Itasca
Out of a total of 592 students who are enrolled in schools in Itasca, 9 (1.5%) attend a private institution, while the remaining 583 (98.5%) are enrolled in public schools. The age group of 35 years and over has the highest likelihood of being enrolled in private schools, with 5 (23.8% in the age bracket) enrolled. Conversely, the age group of 3 to 4 year olds has the lowest likelihood of being enrolled in a private school, with 7 (100.0% in the age bracket) attending a public institution.
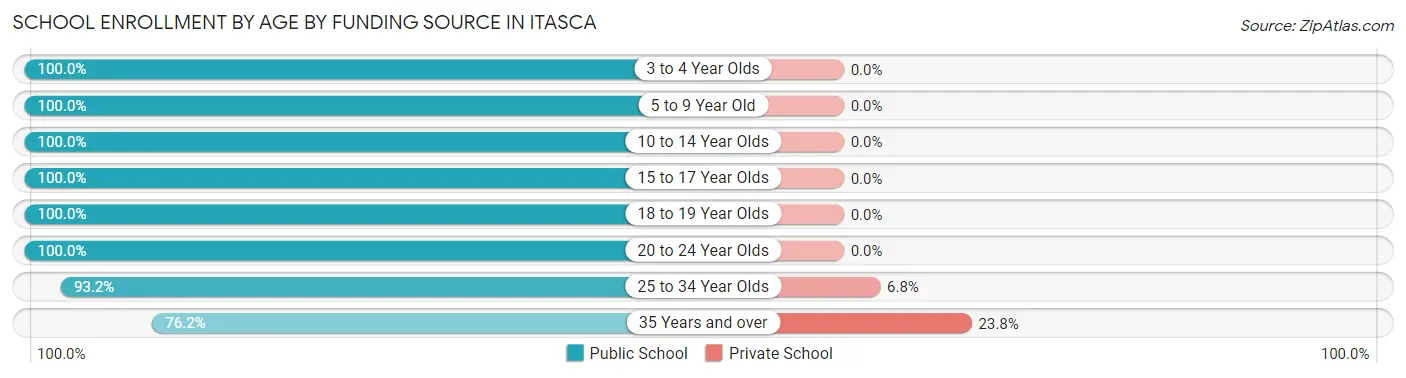
| Age Bracket | Public School | Private School |
| 3 to 4 Year Olds | 7 (100.0%) | 0 (0.0%) |
| 5 to 9 Year Old | 133 (100.0%) | 0 (0.0%) |
| 10 to 14 Year Olds | 186 (100.0%) | 0 (0.0%) |
| 15 to 17 Year Olds | 108 (100.0%) | 0 (0.0%) |
| 18 to 19 Year Olds | 4 (100.0%) | 0 (0.0%) |
| 20 to 24 Year Olds | 74 (100.0%) | 0 (0.0%) |
| 25 to 34 Year Olds | 55 (93.2%) | 4 (6.8%) |
| 35 Years and over | 16 (76.2%) | 5 (23.8%) |
| Total | 583 (98.5%) | 9 (1.5%) |
Educational Attainment by Field of Study in Itasca
Business (53 | 31.0%), computers & mathematics (29 | 17.0%), psychology (21 | 12.3%), liberal arts & history (20 | 11.7%), and communications (14 | 8.2%) are the most common fields of study among 171 individuals in Itasca who have obtained a bachelor's degree or higher.
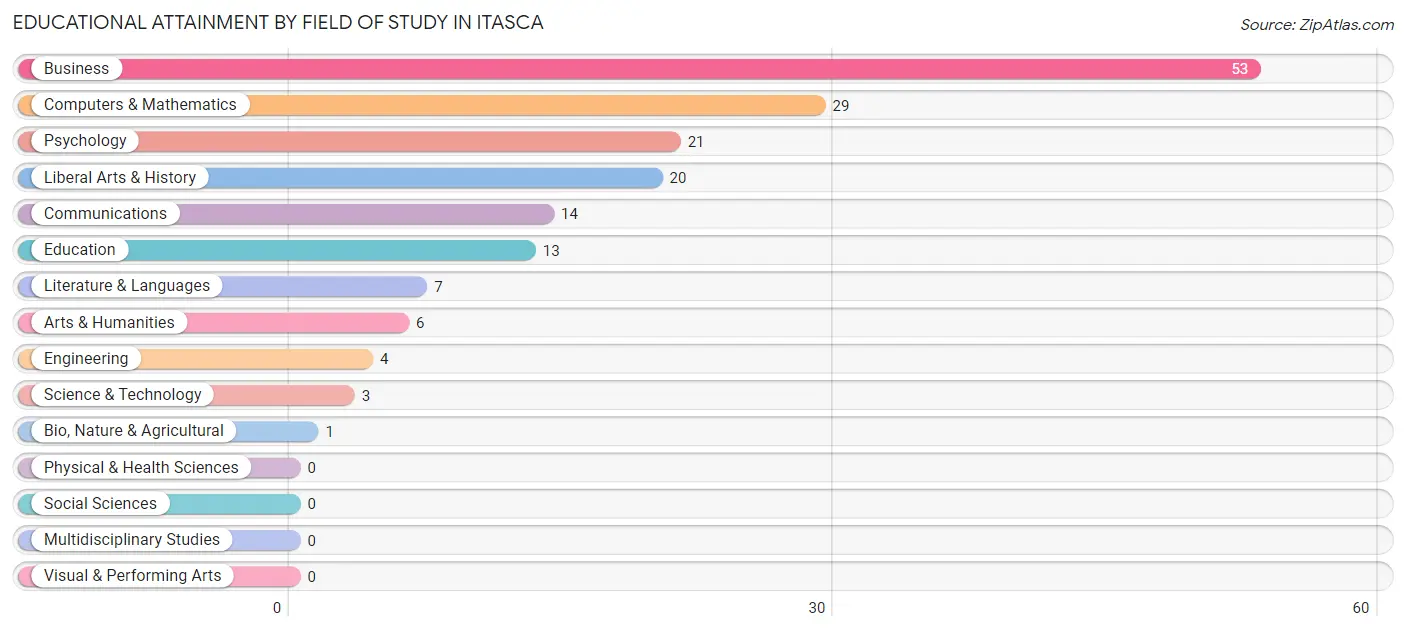
| Field of Study | # Graduates | % Graduates |
| Computers & Mathematics | 29 | 17.0% |
| Bio, Nature & Agricultural | 1 | 0.6% |
| Physical & Health Sciences | 0 | 0.0% |
| Psychology | 21 | 12.3% |
| Social Sciences | 0 | 0.0% |
| Engineering | 4 | 2.3% |
| Multidisciplinary Studies | 0 | 0.0% |
| Science & Technology | 3 | 1.8% |
| Business | 53 | 31.0% |
| Education | 13 | 7.6% |
| Literature & Languages | 7 | 4.1% |
| Liberal Arts & History | 20 | 11.7% |
| Visual & Performing Arts | 0 | 0.0% |
| Communications | 14 | 8.2% |
| Arts & Humanities | 6 | 3.5% |
| Total | 171 | 100.0% |
Transportation & Commute in Itasca
Vehicle Availability by Sex in Itasca
The most prevalent vehicle ownership categories in Itasca are males with 2 vehicles (184, accounting for 36.3%) and females with 2 vehicles (102, making up 39.4%).
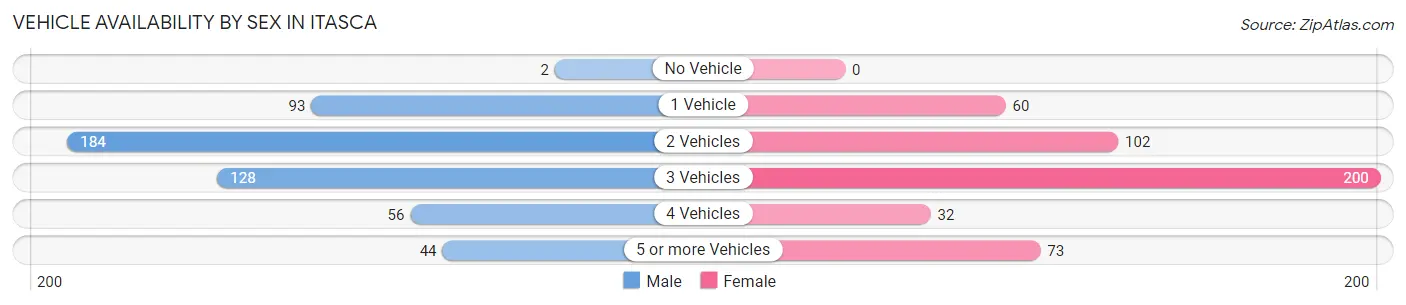
| Vehicles Available | Male | Female |
| No Vehicle | 2 (0.4%) | 0 (0.0%) |
| 1 Vehicle | 93 (18.3%) | 60 (12.9%) |
| 2 Vehicles | 184 (36.3%) | 102 (21.8%) |
| 3 Vehicles | 128 (25.3%) | 200 (42.8%) |
| 4 Vehicles | 56 (11.1%) | 32 (6.9%) |
| 5 or more Vehicles | 44 (8.7%) | 73 (15.6%) |
| Total | 507 (100.0%) | 467 (100.0%) |
Commute Time in Itasca
The most frequently occuring commute durations in Itasca are 15 to 19 minutes (163 commuters, 17.6%), 40 to 44 minutes (94 commuters, 10.2%), and 60 to 89 minutes (91 commuters, 9.8%).
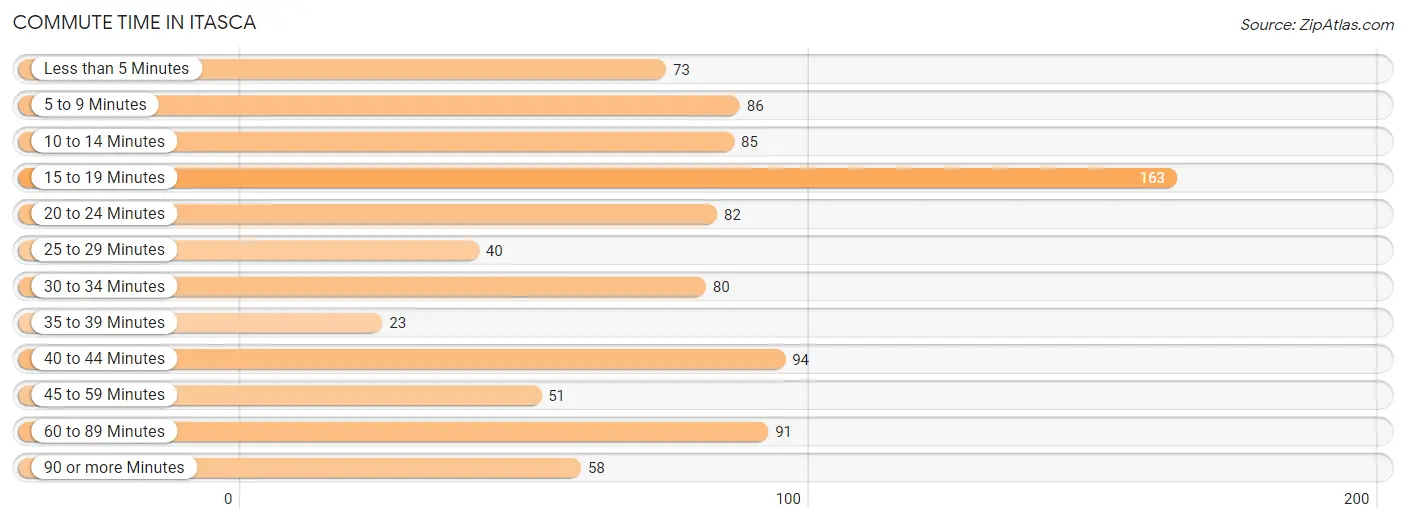
| Commute Time | # Commuters | % Commuters |
| Less than 5 Minutes | 73 | 7.9% |
| 5 to 9 Minutes | 86 | 9.3% |
| 10 to 14 Minutes | 85 | 9.2% |
| 15 to 19 Minutes | 163 | 17.6% |
| 20 to 24 Minutes | 82 | 8.9% |
| 25 to 29 Minutes | 40 | 4.3% |
| 30 to 34 Minutes | 80 | 8.6% |
| 35 to 39 Minutes | 23 | 2.5% |
| 40 to 44 Minutes | 94 | 10.2% |
| 45 to 59 Minutes | 51 | 5.5% |
| 60 to 89 Minutes | 91 | 9.8% |
| 90 or more Minutes | 58 | 6.3% |
Commute Time by Sex in Itasca
The most common commute times in Itasca are 15 to 19 minutes (88 commuters, 17.5%) for males and 15 to 19 minutes (75 commuters, 17.7%) for females.
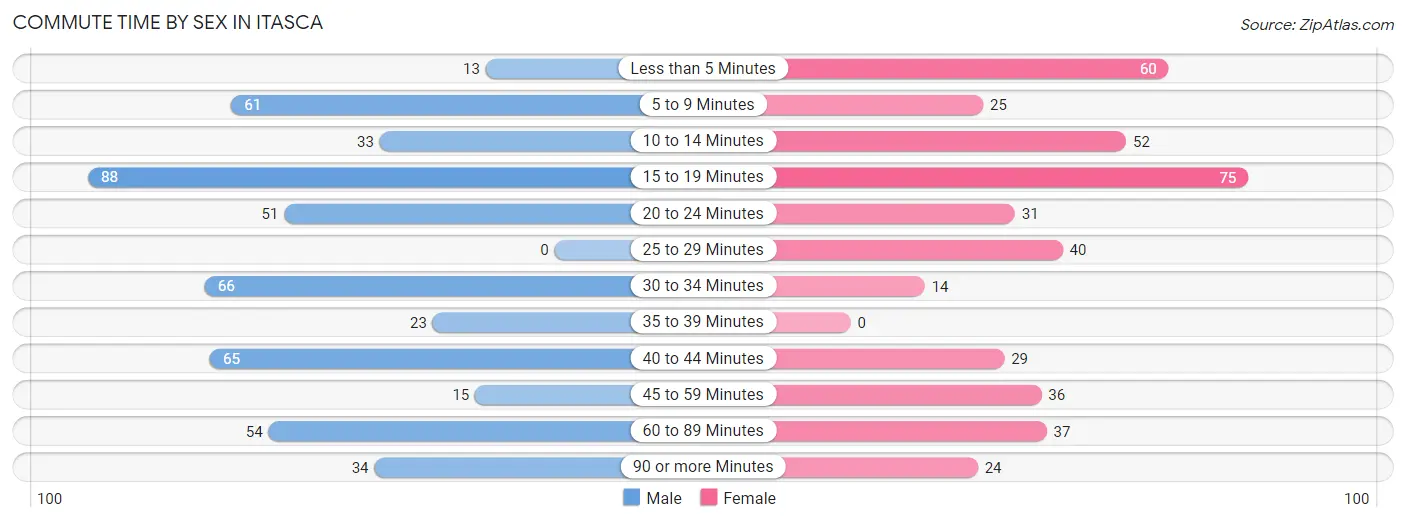
| Commute Time | Male | Female |
| Less than 5 Minutes | 13 (2.6%) | 60 (14.2%) |
| 5 to 9 Minutes | 61 (12.1%) | 25 (5.9%) |
| 10 to 14 Minutes | 33 (6.6%) | 52 (12.3%) |
| 15 to 19 Minutes | 88 (17.5%) | 75 (17.7%) |
| 20 to 24 Minutes | 51 (10.1%) | 31 (7.3%) |
| 25 to 29 Minutes | 0 (0.0%) | 40 (9.5%) |
| 30 to 34 Minutes | 66 (13.1%) | 14 (3.3%) |
| 35 to 39 Minutes | 23 (4.6%) | 0 (0.0%) |
| 40 to 44 Minutes | 65 (12.9%) | 29 (6.9%) |
| 45 to 59 Minutes | 15 (3.0%) | 36 (8.5%) |
| 60 to 89 Minutes | 54 (10.7%) | 37 (8.7%) |
| 90 or more Minutes | 34 (6.8%) | 24 (5.7%) |
Time of Departure to Work by Sex in Itasca
The most frequent times of departure to work in Itasca are 12:00 PM to 3:59 PM (88, 17.5%) for males and 6:00 AM to 6:29 AM (83, 19.6%) for females.
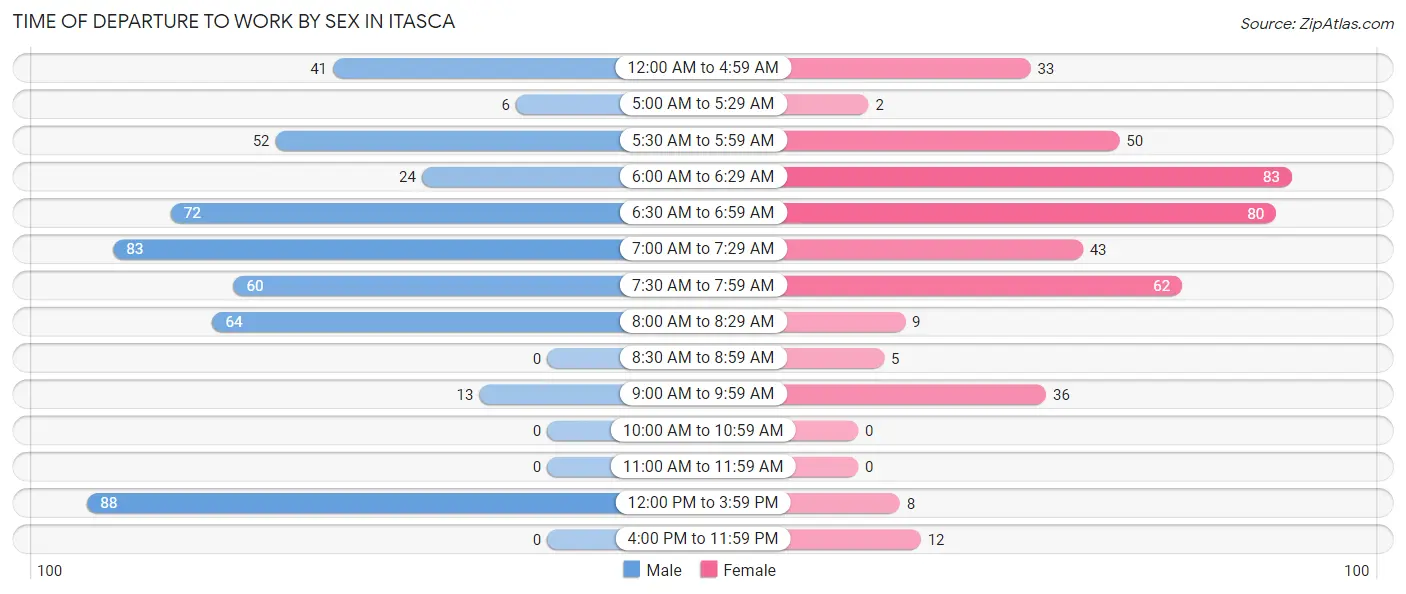
| Time of Departure | Male | Female |
| 12:00 AM to 4:59 AM | 41 (8.2%) | 33 (7.8%) |
| 5:00 AM to 5:29 AM | 6 (1.2%) | 2 (0.5%) |
| 5:30 AM to 5:59 AM | 52 (10.3%) | 50 (11.8%) |
| 6:00 AM to 6:29 AM | 24 (4.8%) | 83 (19.6%) |
| 6:30 AM to 6:59 AM | 72 (14.3%) | 80 (18.9%) |
| 7:00 AM to 7:29 AM | 83 (16.5%) | 43 (10.2%) |
| 7:30 AM to 7:59 AM | 60 (11.9%) | 62 (14.7%) |
| 8:00 AM to 8:29 AM | 64 (12.7%) | 9 (2.1%) |
| 8:30 AM to 8:59 AM | 0 (0.0%) | 5 (1.2%) |
| 9:00 AM to 9:59 AM | 13 (2.6%) | 36 (8.5%) |
| 10:00 AM to 10:59 AM | 0 (0.0%) | 0 (0.0%) |
| 11:00 AM to 11:59 AM | 0 (0.0%) | 0 (0.0%) |
| 12:00 PM to 3:59 PM | 88 (17.5%) | 8 (1.9%) |
| 4:00 PM to 11:59 PM | 0 (0.0%) | 12 (2.8%) |
| Total | 503 (100.0%) | 423 (100.0%) |
Housing Occupancy in Itasca
Occupancy by Ownership in Itasca
Of the total 673 dwellings in Itasca, owner-occupied units account for 496 (73.7%), while renter-occupied units make up 177 (26.3%).
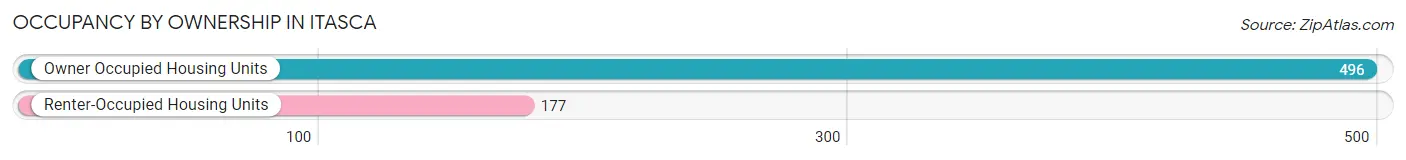
| Occupancy | # Housing Units | % Housing Units |
| Owner Occupied Housing Units | 496 | 73.7% |
| Renter-Occupied Housing Units | 177 | 26.3% |
| Total Occupied Housing Units | 673 | 100.0% |
Occupancy by Household Size in Itasca
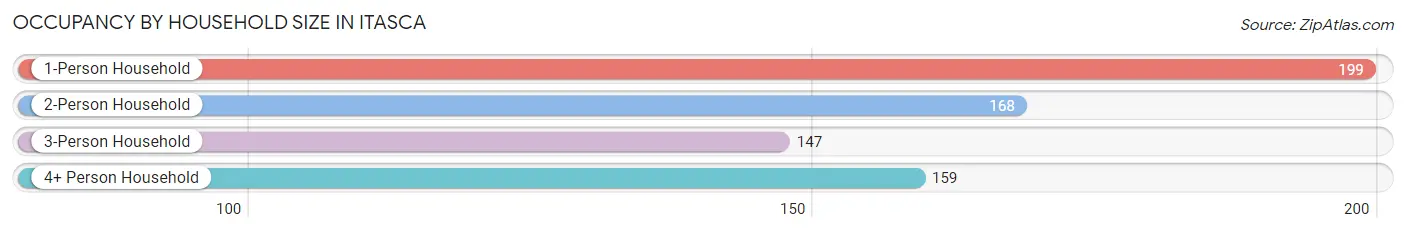
| Household Size | # Housing Units | % Housing Units |
| 1-Person Household | 199 | 29.6% |
| 2-Person Household | 168 | 25.0% |
| 3-Person Household | 147 | 21.8% |
| 4+ Person Household | 159 | 23.6% |
| Total Housing Units | 673 | 100.0% |
Occupancy by Ownership by Household Size in Itasca
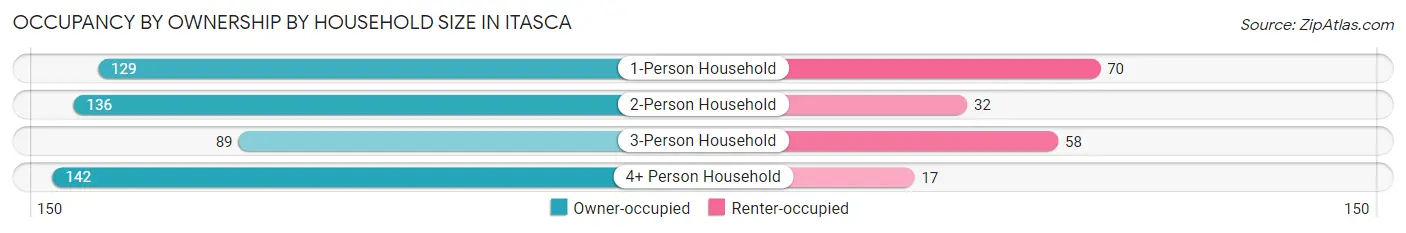
| Household Size | Owner-occupied | Renter-occupied |
| 1-Person Household | 129 (64.8%) | 70 (35.2%) |
| 2-Person Household | 136 (80.9%) | 32 (19.1%) |
| 3-Person Household | 89 (60.5%) | 58 (39.5%) |
| 4+ Person Household | 142 (89.3%) | 17 (10.7%) |
| Total Housing Units | 496 (73.7%) | 177 (26.3%) |
Occupancy by Educational Attainment in Itasca
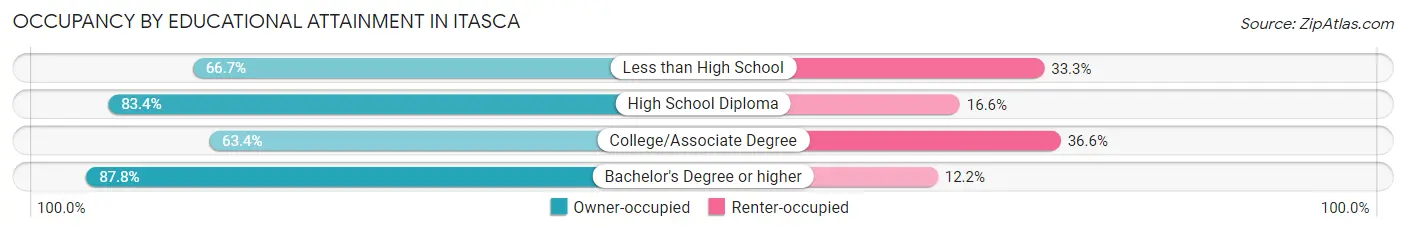
| Household Size | Owner-occupied | Renter-occupied |
| Less than High School | 56 (66.7%) | 28 (33.3%) |
| High School Diploma | 186 (83.4%) | 37 (16.6%) |
| College/Associate Degree | 175 (63.4%) | 101 (36.6%) |
| Bachelor's Degree or higher | 79 (87.8%) | 11 (12.2%) |
Occupancy by Age of Householder in Itasca
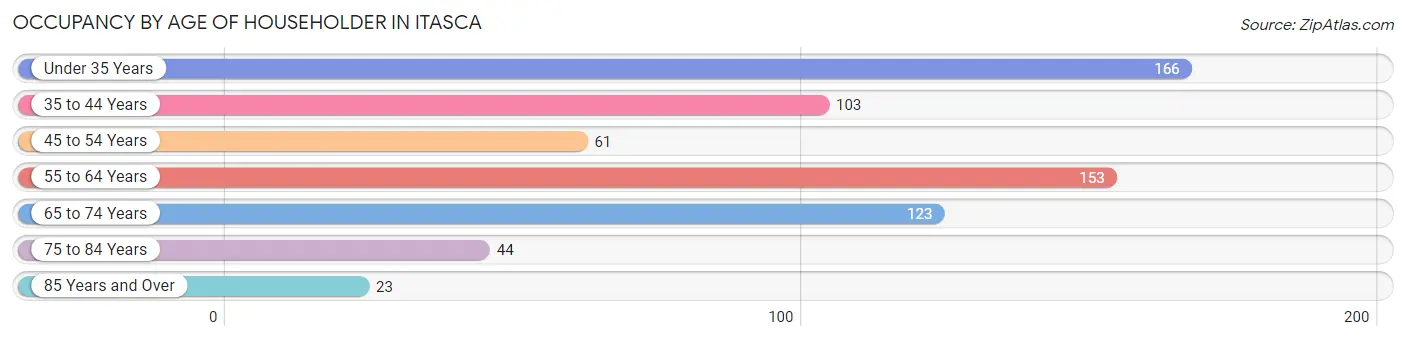
| Age Bracket | # Households | % Households |
| Under 35 Years | 166 | 24.7% |
| 35 to 44 Years | 103 | 15.3% |
| 45 to 54 Years | 61 | 9.1% |
| 55 to 64 Years | 153 | 22.7% |
| 65 to 74 Years | 123 | 18.3% |
| 75 to 84 Years | 44 | 6.5% |
| 85 Years and Over | 23 | 3.4% |
| Total | 673 | 100.0% |
Housing Finances in Itasca
Median Income by Occupancy in Itasca
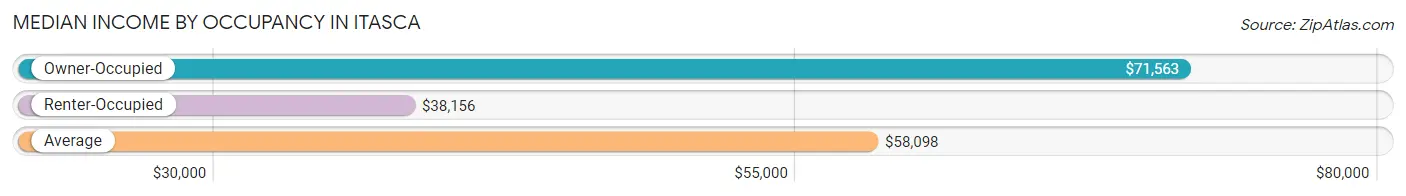
| Occupancy Type | # Households | Median Income |
| Owner-Occupied | 496 (73.7%) | $71,563 |
| Renter-Occupied | 177 (26.3%) | $38,156 |
| Average | 673 (100.0%) | $58,098 |
Occupancy by Householder Income Bracket in Itasca
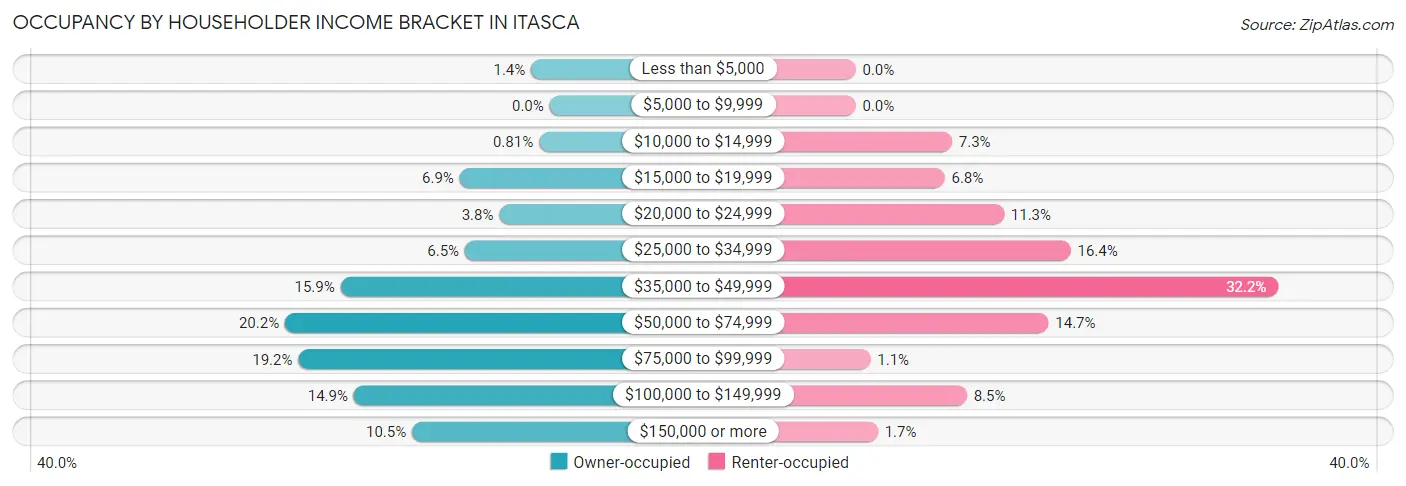
| Income Bracket | Owner-occupied | Renter-occupied |
| Less than $5,000 | 7 (1.4%) | 0 (0.0%) |
| $5,000 to $9,999 | 0 (0.0%) | 0 (0.0%) |
| $10,000 to $14,999 | 4 (0.8%) | 13 (7.3%) |
| $15,000 to $19,999 | 34 (6.9%) | 12 (6.8%) |
| $20,000 to $24,999 | 19 (3.8%) | 20 (11.3%) |
| $25,000 to $34,999 | 32 (6.5%) | 29 (16.4%) |
| $35,000 to $49,999 | 79 (15.9%) | 57 (32.2%) |
| $50,000 to $74,999 | 100 (20.2%) | 26 (14.7%) |
| $75,000 to $99,999 | 95 (19.2%) | 2 (1.1%) |
| $100,000 to $149,999 | 74 (14.9%) | 15 (8.5%) |
| $150,000 or more | 52 (10.5%) | 3 (1.7%) |
| Total | 496 (100.0%) | 177 (100.0%) |
Monthly Housing Cost Tiers in Itasca
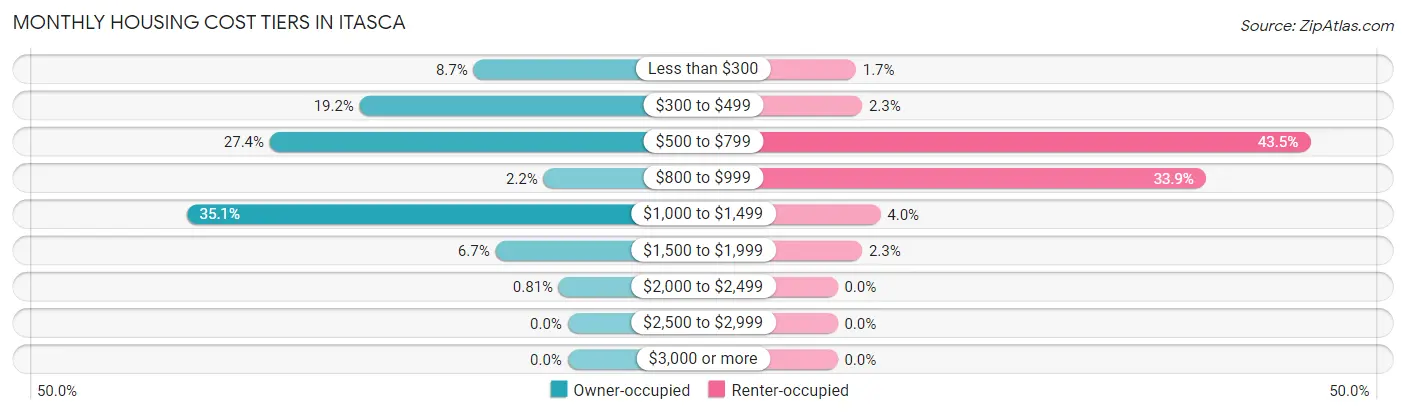
| Monthly Cost | Owner-occupied | Renter-occupied |
| Less than $300 | 43 (8.7%) | 3 (1.7%) |
| $300 to $499 | 95 (19.2%) | 4 (2.3%) |
| $500 to $799 | 136 (27.4%) | 77 (43.5%) |
| $800 to $999 | 11 (2.2%) | 60 (33.9%) |
| $1,000 to $1,499 | 174 (35.1%) | 7 (4.0%) |
| $1,500 to $1,999 | 33 (6.7%) | 4 (2.3%) |
| $2,000 to $2,499 | 4 (0.8%) | 0 (0.0%) |
| $2,500 to $2,999 | 0 (0.0%) | 0 (0.0%) |
| $3,000 or more | 0 (0.0%) | 0 (0.0%) |
| Total | 496 (100.0%) | 177 (100.0%) |
Physical Housing Characteristics in Itasca
Housing Structures in Itasca
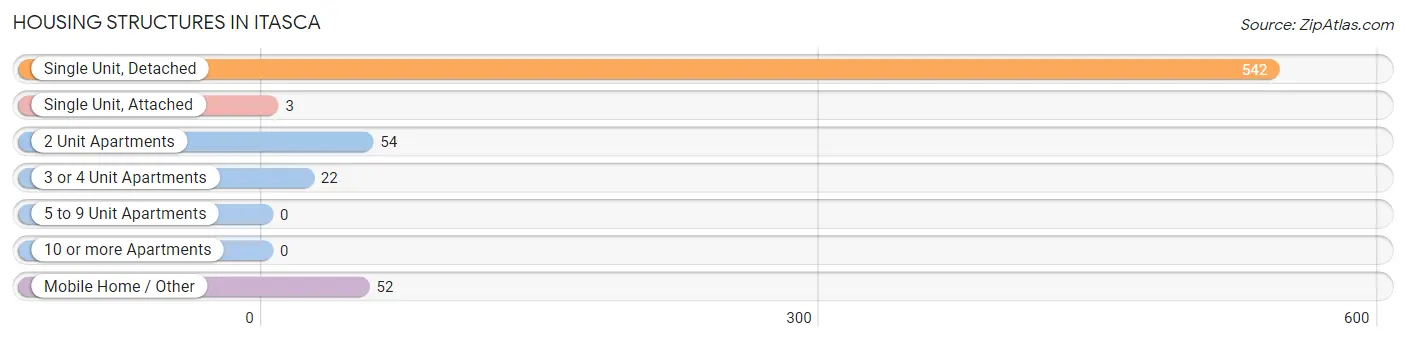
| Structure Type | # Housing Units | % Housing Units |
| Single Unit, Detached | 542 | 80.5% |
| Single Unit, Attached | 3 | 0.4% |
| 2 Unit Apartments | 54 | 8.0% |
| 3 or 4 Unit Apartments | 22 | 3.3% |
| 5 to 9 Unit Apartments | 0 | 0.0% |
| 10 or more Apartments | 0 | 0.0% |
| Mobile Home / Other | 52 | 7.7% |
| Total | 673 | 100.0% |
Housing Structures by Occupancy in Itasca
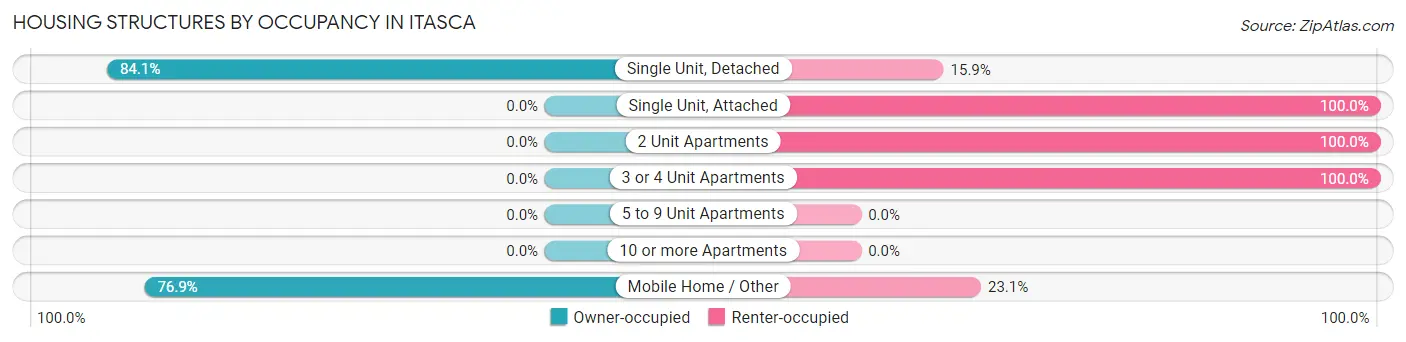
| Structure Type | Owner-occupied | Renter-occupied |
| Single Unit, Detached | 456 (84.1%) | 86 (15.9%) |
| Single Unit, Attached | 0 (0.0%) | 3 (100.0%) |
| 2 Unit Apartments | 0 (0.0%) | 54 (100.0%) |
| 3 or 4 Unit Apartments | 0 (0.0%) | 22 (100.0%) |
| 5 to 9 Unit Apartments | 0 (0.0%) | 0 (0.0%) |
| 10 or more Apartments | 0 (0.0%) | 0 (0.0%) |
| Mobile Home / Other | 40 (76.9%) | 12 (23.1%) |
| Total | 496 (73.7%) | 177 (26.3%) |
Housing Structures by Number of Rooms in Itasca
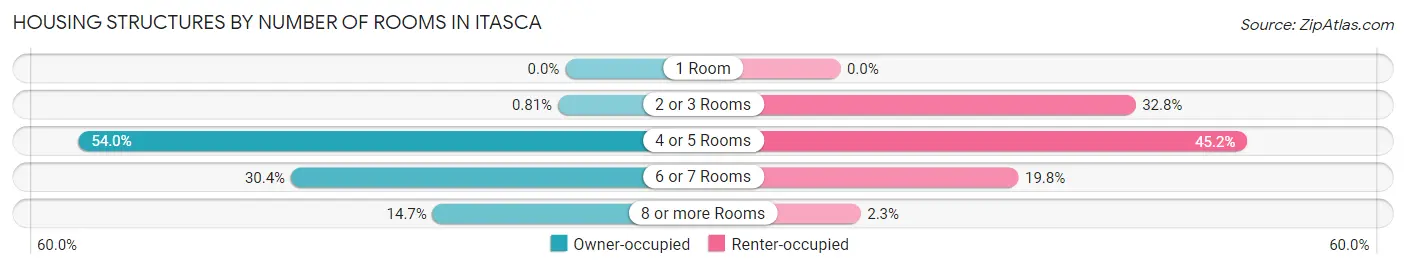
| Number of Rooms | Owner-occupied | Renter-occupied |
| 1 Room | 0 (0.0%) | 0 (0.0%) |
| 2 or 3 Rooms | 4 (0.8%) | 58 (32.8%) |
| 4 or 5 Rooms | 268 (54.0%) | 80 (45.2%) |
| 6 or 7 Rooms | 151 (30.4%) | 35 (19.8%) |
| 8 or more Rooms | 73 (14.7%) | 4 (2.3%) |
| Total | 496 (100.0%) | 177 (100.0%) |
Housing Structure by Heating Type in Itasca
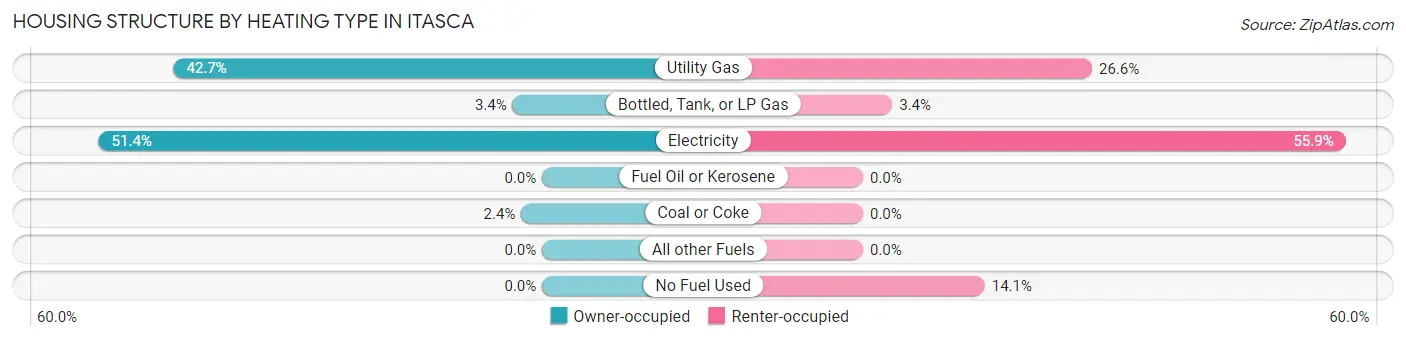
| Heating Type | Owner-occupied | Renter-occupied |
| Utility Gas | 212 (42.7%) | 47 (26.6%) |
| Bottled, Tank, or LP Gas | 17 (3.4%) | 6 (3.4%) |
| Electricity | 255 (51.4%) | 99 (55.9%) |
| Fuel Oil or Kerosene | 0 (0.0%) | 0 (0.0%) |
| Coal or Coke | 12 (2.4%) | 0 (0.0%) |
| All other Fuels | 0 (0.0%) | 0 (0.0%) |
| No Fuel Used | 0 (0.0%) | 25 (14.1%) |
| Total | 496 (100.0%) | 177 (100.0%) |
Household Vehicle Usage in Itasca
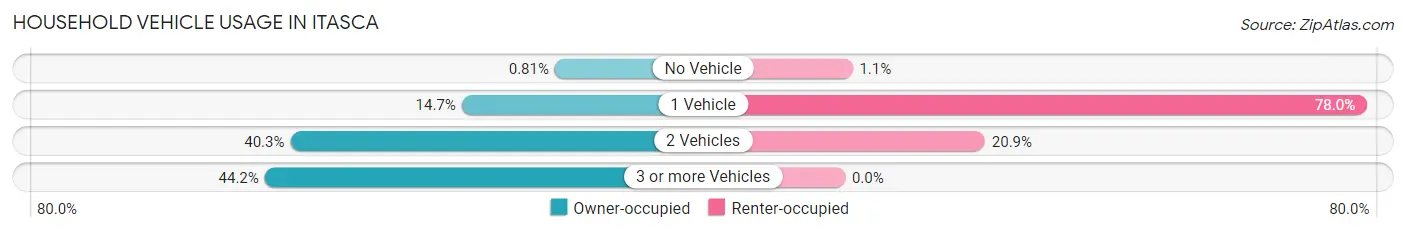
| Vehicles per Household | Owner-occupied | Renter-occupied |
| No Vehicle | 4 (0.8%) | 2 (1.1%) |
| 1 Vehicle | 73 (14.7%) | 138 (78.0%) |
| 2 Vehicles | 200 (40.3%) | 37 (20.9%) |
| 3 or more Vehicles | 219 (44.2%) | 0 (0.0%) |
| Total | 496 (100.0%) | 177 (100.0%) |
Real Estate & Mortgages in Itasca
Real Estate and Mortgage Overview in Itasca
| Characteristic | Without Mortgage | With Mortgage |
| Housing Units | 230 | 266 |
| Median Property Value | $74,900 | $107,300 |
| Median Household Income | $51,250 | $42 |
| Monthly Housing Costs | $451 | $0 |
| Real Estate Taxes | $1,411 | $23 |
Property Value by Mortgage Status in Itasca
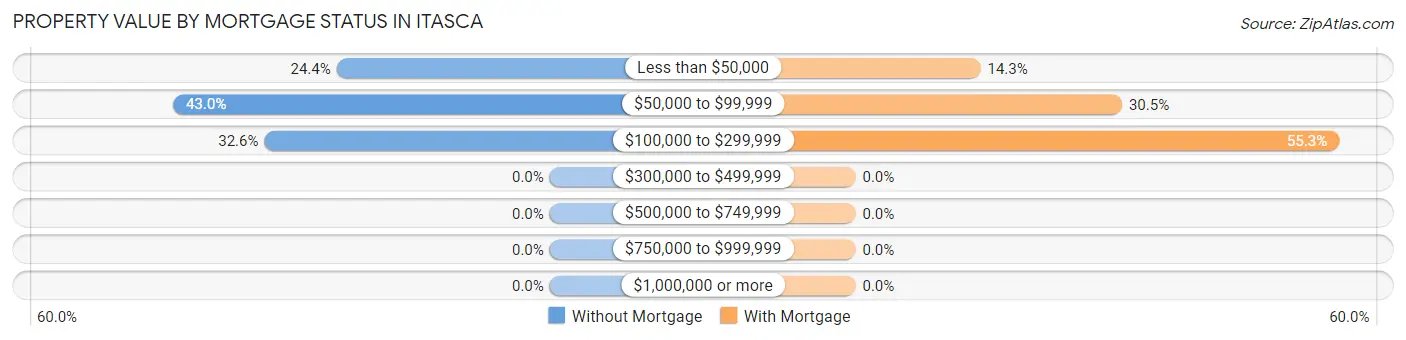
| Property Value | Without Mortgage | With Mortgage |
| Less than $50,000 | 56 (24.3%) | 38 (14.3%) |
| $50,000 to $99,999 | 99 (43.0%) | 81 (30.4%) |
| $100,000 to $299,999 | 75 (32.6%) | 147 (55.3%) |
| $300,000 to $499,999 | 0 (0.0%) | 0 (0.0%) |
| $500,000 to $749,999 | 0 (0.0%) | 0 (0.0%) |
| $750,000 to $999,999 | 0 (0.0%) | 0 (0.0%) |
| $1,000,000 or more | 0 (0.0%) | 0 (0.0%) |
| Total | 230 (100.0%) | 266 (100.0%) |
Household Income by Mortgage Status in Itasca
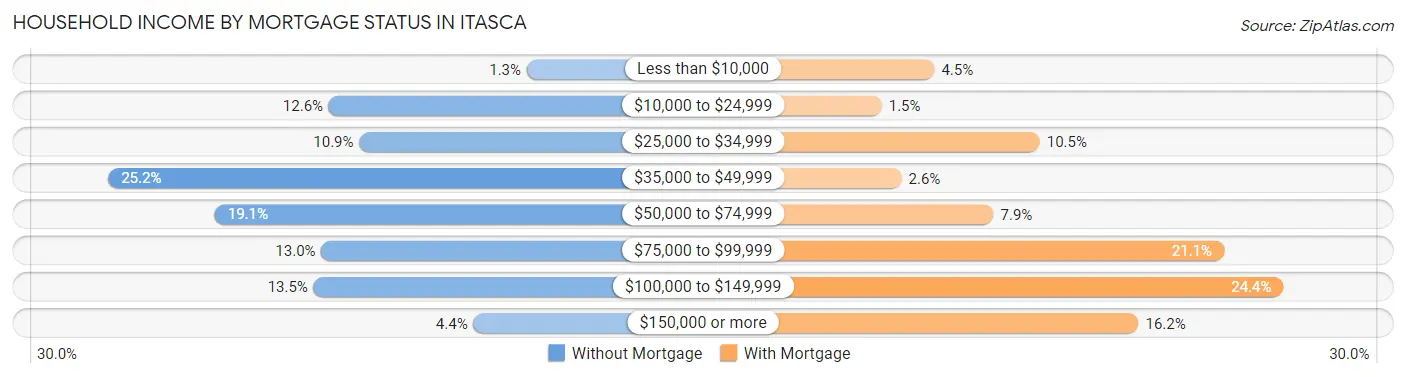
| Household Income | Without Mortgage | With Mortgage |
| Less than $10,000 | 3 (1.3%) | 12 (4.5%) |
| $10,000 to $24,999 | 29 (12.6%) | 4 (1.5%) |
| $25,000 to $34,999 | 25 (10.9%) | 28 (10.5%) |
| $35,000 to $49,999 | 58 (25.2%) | 7 (2.6%) |
| $50,000 to $74,999 | 44 (19.1%) | 21 (7.9%) |
| $75,000 to $99,999 | 30 (13.0%) | 56 (21.0%) |
| $100,000 to $149,999 | 31 (13.5%) | 65 (24.4%) |
| $150,000 or more | 10 (4.3%) | 43 (16.2%) |
| Total | 230 (100.0%) | 266 (100.0%) |
Property Value to Household Income Ratio in Itasca
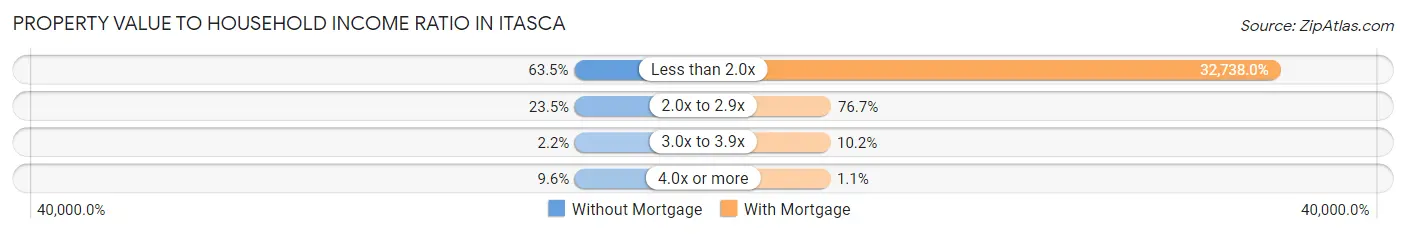
| Value-to-Income Ratio | Without Mortgage | With Mortgage |
| Less than 2.0x | 146 (63.5%) | 87,083 (32,738.0%) |
| 2.0x to 2.9x | 54 (23.5%) | 204 (76.7%) |
| 3.0x to 3.9x | 5 (2.2%) | 27 (10.2%) |
| 4.0x or more | 22 (9.6%) | 3 (1.1%) |
| Total | 230 (100.0%) | 266 (100.0%) |
Real Estate Taxes by Mortgage Status in Itasca
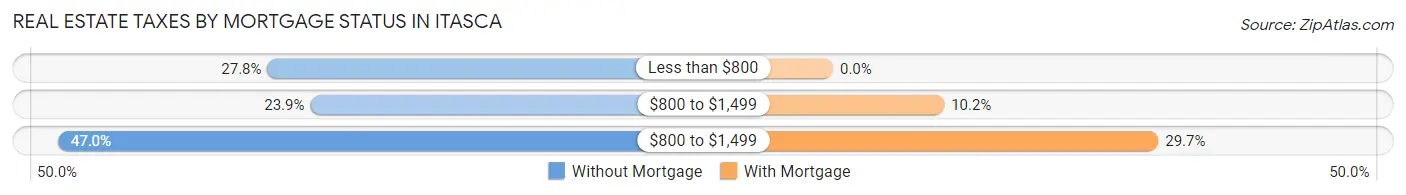
| Property Taxes | Without Mortgage | With Mortgage |
| Less than $800 | 64 (27.8%) | 0 (0.0%) |
| $800 to $1,499 | 55 (23.9%) | 27 (10.2%) |
| $800 to $1,499 | 108 (47.0%) | 79 (29.7%) |
| Total | 230 (100.0%) | 266 (100.0%) |
Health & Disability in Itasca
Health Insurance Coverage by Age in Itasca
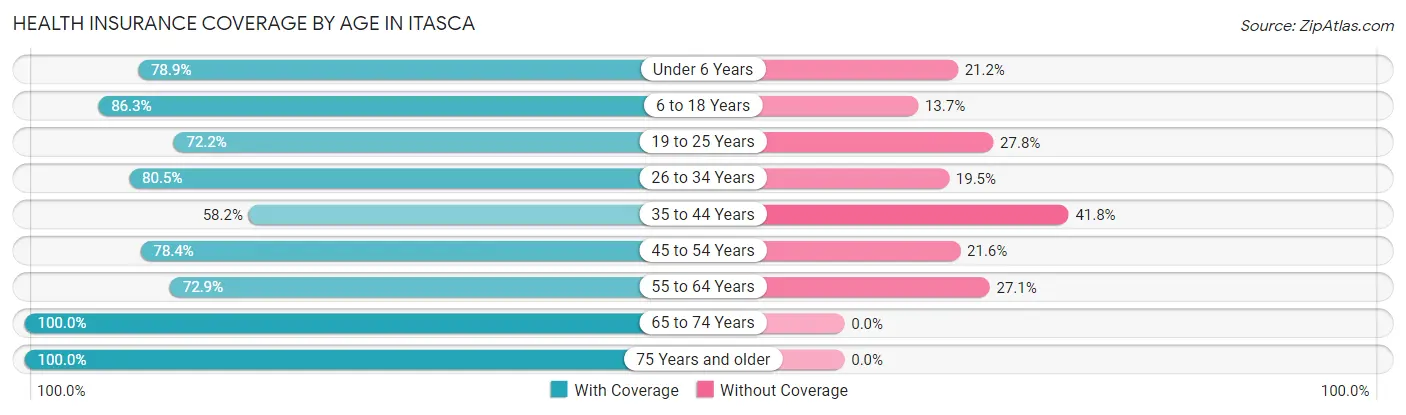
| Age Bracket | With Coverage | Without Coverage |
| Under 6 Years | 82 (78.8%) | 22 (21.1%) |
| 6 to 18 Years | 383 (86.3%) | 61 (13.7%) |
| 19 to 25 Years | 177 (72.2%) | 68 (27.8%) |
| 26 to 34 Years | 161 (80.5%) | 39 (19.5%) |
| 35 to 44 Years | 149 (58.2%) | 107 (41.8%) |
| 45 to 54 Years | 127 (78.4%) | 35 (21.6%) |
| 55 to 64 Years | 202 (72.9%) | 75 (27.1%) |
| 65 to 74 Years | 203 (100.0%) | 0 (0.0%) |
| 75 Years and older | 79 (100.0%) | 0 (0.0%) |
| Total | 1,563 (79.3%) | 407 (20.7%) |
Health Insurance Coverage by Citizenship Status in Itasca
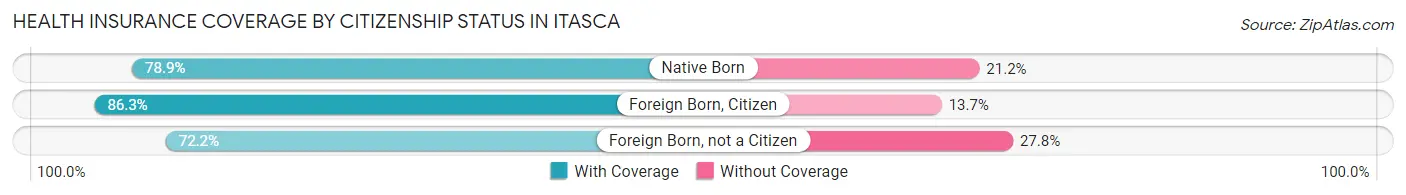
| Citizenship Status | With Coverage | Without Coverage |
| Native Born | 82 (78.8%) | 22 (21.1%) |
| Foreign Born, Citizen | 383 (86.3%) | 61 (13.7%) |
| Foreign Born, not a Citizen | 177 (72.2%) | 68 (27.8%) |
Health Insurance Coverage by Household Income in Itasca
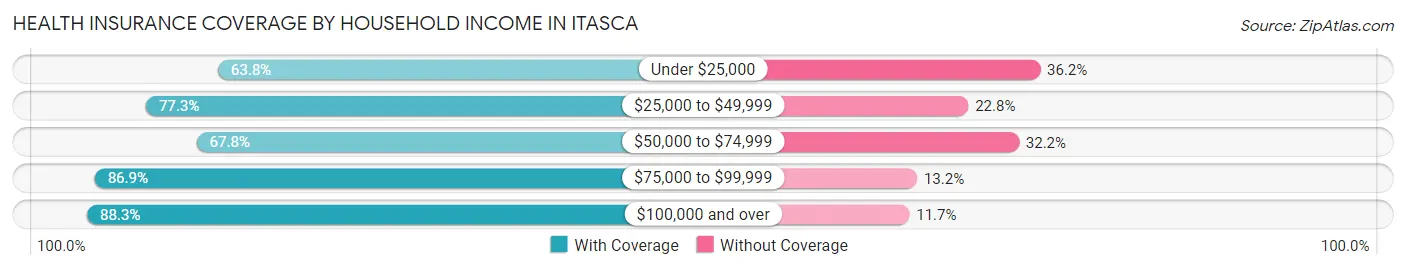
| Household Income | With Coverage | Without Coverage |
| Under $25,000 | 125 (63.8%) | 71 (36.2%) |
| $25,000 to $49,999 | 387 (77.2%) | 114 (22.8%) |
| $50,000 to $74,999 | 227 (67.8%) | 108 (32.2%) |
| $75,000 to $99,999 | 251 (86.9%) | 38 (13.2%) |
| $100,000 and over | 573 (88.3%) | 76 (11.7%) |
Public vs Private Health Insurance Coverage by Age in Itasca
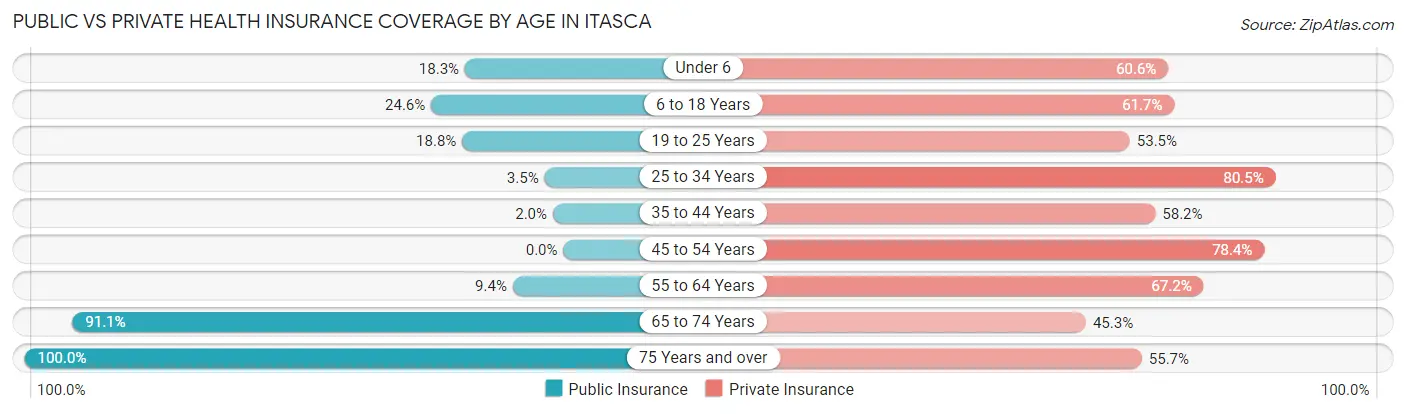
| Age Bracket | Public Insurance | Private Insurance |
| Under 6 | 19 (18.3%) | 63 (60.6%) |
| 6 to 18 Years | 109 (24.5%) | 274 (61.7%) |
| 19 to 25 Years | 46 (18.8%) | 131 (53.5%) |
| 25 to 34 Years | 7 (3.5%) | 161 (80.5%) |
| 35 to 44 Years | 5 (1.9%) | 149 (58.2%) |
| 45 to 54 Years | 0 (0.0%) | 127 (78.4%) |
| 55 to 64 Years | 26 (9.4%) | 186 (67.1%) |
| 65 to 74 Years | 185 (91.1%) | 92 (45.3%) |
| 75 Years and over | 79 (100.0%) | 44 (55.7%) |
| Total | 476 (24.2%) | 1,227 (62.3%) |
Disability Status by Sex by Age in Itasca
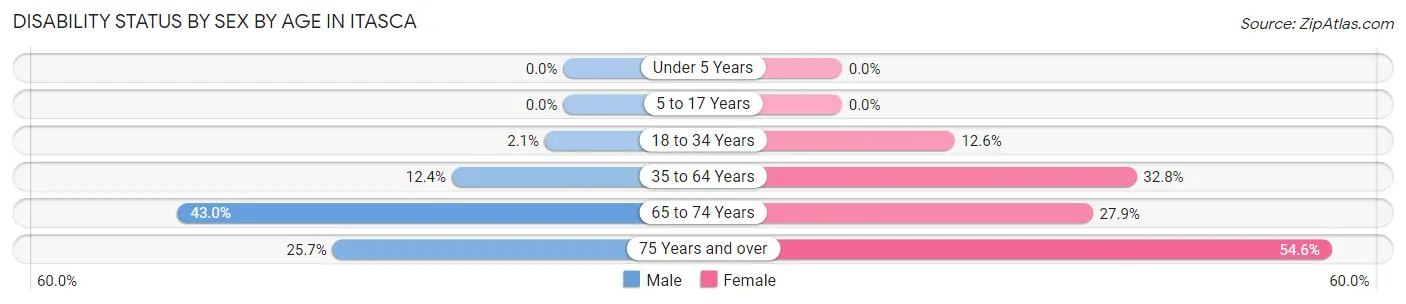
| Age Bracket | Male | Female |
| Under 5 Years | 0 (0.0%) | 0 (0.0%) |
| 5 to 17 Years | 0 (0.0%) | 0 (0.0%) |
| 18 to 34 Years | 5 (2.1%) | 29 (12.6%) |
| 35 to 64 Years | 39 (12.4%) | 125 (32.8%) |
| 65 to 74 Years | 58 (43.0%) | 19 (27.9%) |
| 75 Years and over | 9 (25.7%) | 24 (54.5%) |
Disability Class by Sex by Age in Itasca
Disability Class: Hearing Difficulty
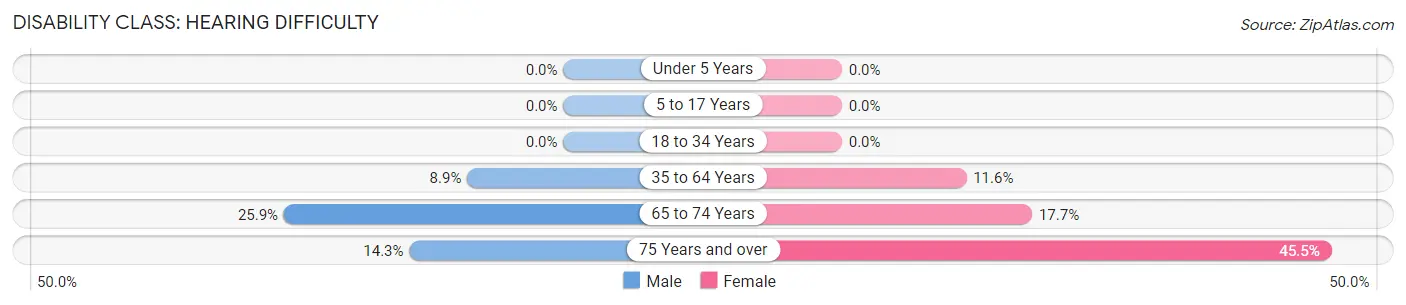
| Age Bracket | Male | Female |
| Under 5 Years | 0 (0.0%) | 0 (0.0%) |
| 5 to 17 Years | 0 (0.0%) | 0 (0.0%) |
| 18 to 34 Years | 0 (0.0%) | 0 (0.0%) |
| 35 to 64 Years | 28 (8.9%) | 44 (11.6%) |
| 65 to 74 Years | 35 (25.9%) | 12 (17.6%) |
| 75 Years and over | 5 (14.3%) | 20 (45.5%) |
Disability Class: Vision Difficulty
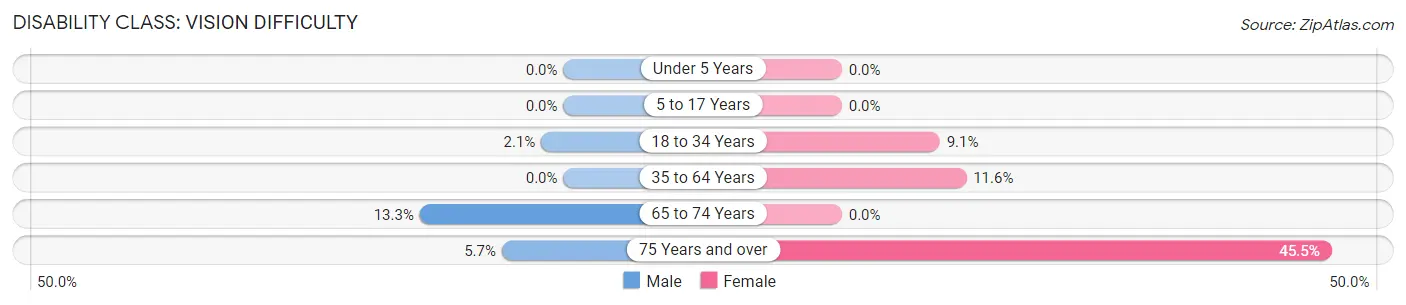
| Age Bracket | Male | Female |
| Under 5 Years | 0 (0.0%) | 0 (0.0%) |
| 5 to 17 Years | 0 (0.0%) | 0 (0.0%) |
| 18 to 34 Years | 5 (2.1%) | 21 (9.1%) |
| 35 to 64 Years | 0 (0.0%) | 44 (11.6%) |
| 65 to 74 Years | 18 (13.3%) | 0 (0.0%) |
| 75 Years and over | 2 (5.7%) | 20 (45.5%) |
Disability Class: Cognitive Difficulty
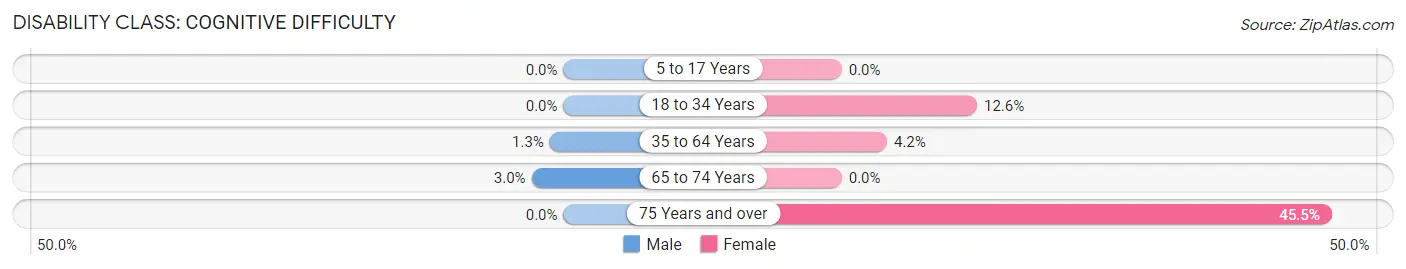
| Age Bracket | Male | Female |
| 5 to 17 Years | 0 (0.0%) | 0 (0.0%) |
| 18 to 34 Years | 0 (0.0%) | 29 (12.6%) |
| 35 to 64 Years | 4 (1.3%) | 16 (4.2%) |
| 65 to 74 Years | 4 (3.0%) | 0 (0.0%) |
| 75 Years and over | 0 (0.0%) | 20 (45.5%) |
Disability Class: Ambulatory Difficulty
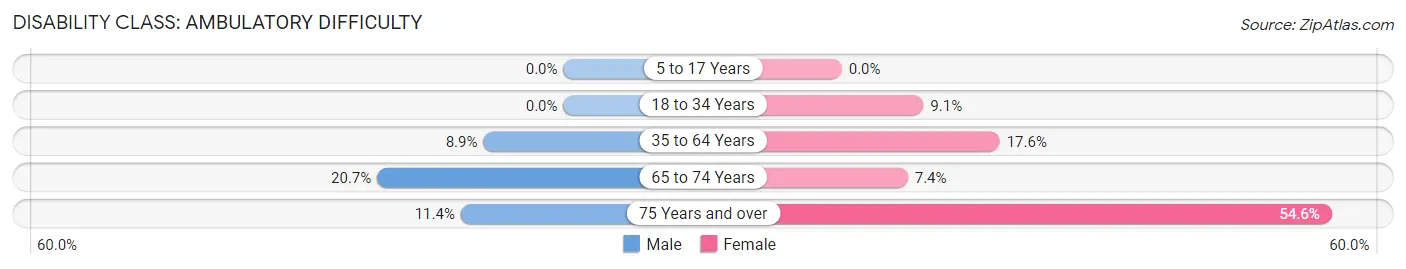
| Age Bracket | Male | Female |
| 5 to 17 Years | 0 (0.0%) | 0 (0.0%) |
| 18 to 34 Years | 0 (0.0%) | 21 (9.1%) |
| 35 to 64 Years | 28 (8.9%) | 67 (17.6%) |
| 65 to 74 Years | 28 (20.7%) | 5 (7.3%) |
| 75 Years and over | 4 (11.4%) | 24 (54.5%) |
Disability Class: Self-Care Difficulty
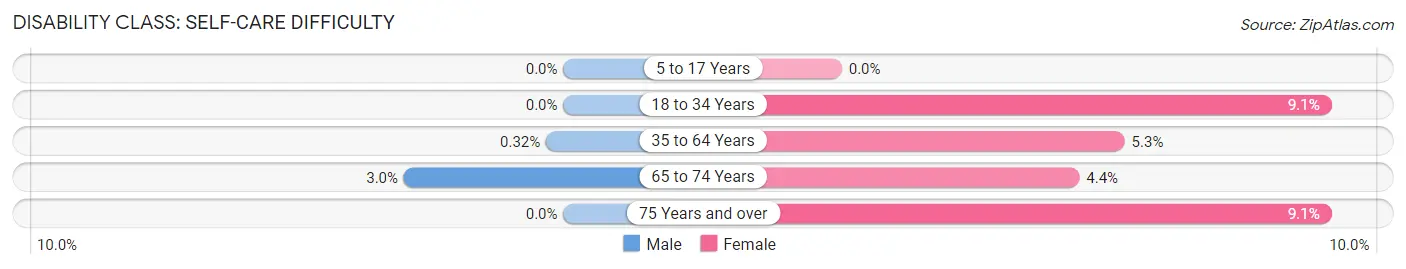
| Age Bracket | Male | Female |
| 5 to 17 Years | 0 (0.0%) | 0 (0.0%) |
| 18 to 34 Years | 0 (0.0%) | 21 (9.1%) |
| 35 to 64 Years | 1 (0.3%) | 20 (5.2%) |
| 65 to 74 Years | 4 (3.0%) | 3 (4.4%) |
| 75 Years and over | 0 (0.0%) | 4 (9.1%) |
Technology Access in Itasca
Computing Device Access in Itasca
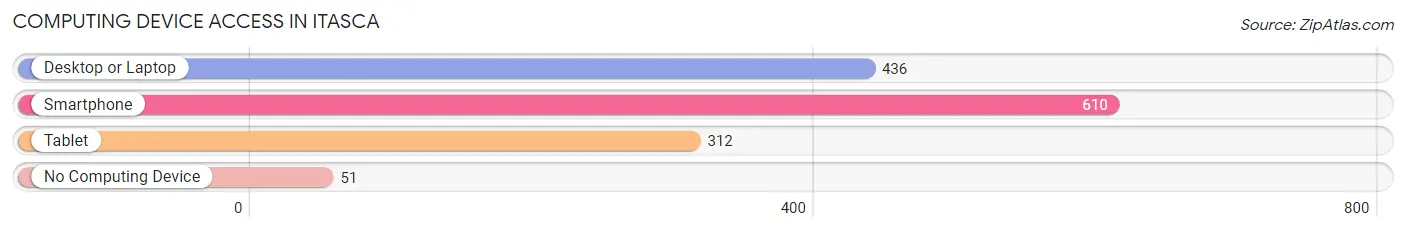
| Device Type | # Households | % Households |
| Desktop or Laptop | 436 | 64.8% |
| Smartphone | 610 | 90.6% |
| Tablet | 312 | 46.4% |
| No Computing Device | 51 | 7.6% |
| Total | 673 | 100.0% |
Internet Access in Itasca
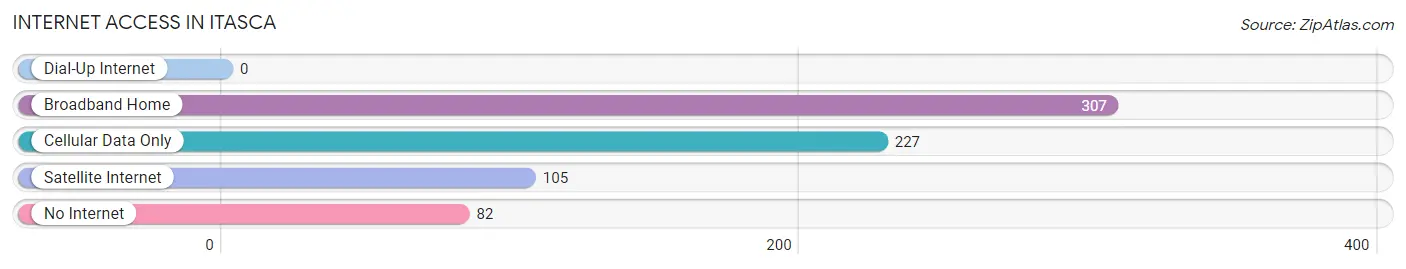
| Internet Type | # Households | % Households |
| Dial-Up Internet | 0 | 0.0% |
| Broadband Home | 307 | 45.6% |
| Cellular Data Only | 227 | 33.7% |
| Satellite Internet | 105 | 15.6% |
| No Internet | 82 | 12.2% |
| Total | 673 | 100.0% |
Itasca Summary
Itasca is a small city located in Hill County, Texas, United States. It is situated about 40 miles south of Dallas and is part of the Dallas-Fort Worth metropolitan area. The population of Itasca was 2,072 at the 2010 census.
History
Itasca was founded in 1881 by the Houston and Texas Central Railway. The town was named after the Itasca State Park in Minnesota, which was named after Lake Itasca, the source of the Mississippi River. The town was incorporated in 1883 and was a major shipping point for cotton and other agricultural products.
In the early 1900s, Itasca was a thriving community with a population of over 1,000. The town had several stores, a bank, a hotel, a cotton gin, and a school. The town also had a newspaper, the Itasca News, which was published from 1902 to 1910.
In the 1920s, the population of Itasca began to decline as the railroad industry declined. The town was hit hard by the Great Depression and many of the businesses closed. The population continued to decline until the 1950s when the town began to experience a resurgence.
Geography
Itasca is located at the intersection of Interstate 35 and State Highway 22. It is situated in the rolling hills of Hill County, about 40 miles south of Dallas. The city has a total area of 1.7 square miles, all of which is land.
The climate in Itasca is hot and humid in the summer and mild in the winter. The average annual temperature is 68 degrees Fahrenheit. The average annual precipitation is 37 inches.
Economy
The economy of Itasca is largely based on agriculture. The town is home to several farms and ranches that produce cotton, corn, hay, and other crops. The town also has several businesses that provide services to the local community, such as auto repair shops, restaurants, and convenience stores.
The town is also home to several manufacturing companies, including a plastics manufacturer and a metal fabrication company. The town is also home to a large trucking company that provides transportation services to the Dallas-Fort Worth area.
Demographics
As of the 2010 census, the population of Itasca was 2,072. The racial makeup of the town was 79.3% White, 15.2% Hispanic or Latino, 2.2% African American, 0.7% Native American, 0.3% Asian, and 2.5% from other races.
The median household income in Itasca was $37,917 in 2010. The per capita income was $17,917. The median age of the population was 37.7 years.
Itasca is a small town with a rich history and a bright future. The town is home to a diverse population and a strong economy. It is a great place to live, work, and raise a family.
Common Questions
What is Per Capita Income in Itasca?
Per Capita income in Itasca is $26,577.
What is the Median Family Income in Itasca?
Median Family Income in Itasca is $73,977.
What is the Median Household income in Itasca?
Median Household Income in Itasca is $58,098.
What is Income or Wage Gap in Itasca?
Income or Wage Gap in Itasca is 14.3%.
Women in Itasca earn 85.7 cents for every dollar earned by a man.
What is Inequality or Gini Index in Itasca?
Inequality or Gini Index in Itasca is 0.39.
What is the Total Population of Itasca?
Total Population of Itasca is 2,025.
What is the Total Male Population of Itasca?
Total Male Population of Itasca is 928.
What is the Total Female Population of Itasca?
Total Female Population of Itasca is 1,097.
What is the Ratio of Males per 100 Females in Itasca?
There are 84.59 Males per 100 Females in Itasca.
What is the Ratio of Females per 100 Males in Itasca?
There are 118.21 Females per 100 Males in Itasca.
What is the Median Population Age in Itasca?
Median Population Age in Itasca is 36.2 Years.
What is the Average Family Size in Itasca
Average Family Size in Itasca is 3.6 People.
What is the Average Household Size in Itasca
Average Household Size in Itasca is 2.9 People.
How Large is the Labor Force in Itasca?
There are 1,035 People in the Labor Forcein in Itasca.
What is the Percentage of People in the Labor Force in Itasca?
65.5% of People are in the Labor Force in Itasca.
What is the Unemployment Rate in Itasca?
Unemployment Rate in Itasca is 1.0%.