Iraan, TX Map & Demographics
Iraan Map
Iraan Overview
$26,938
PER CAPITA INCOME
$54,453
AVG HOUSEHOLD INCOME
19.9%
WAGE / INCOME GAP [ % ]
80.1¢/ $1
WAGE / INCOME GAP [ $ ]
0.45
INEQUALITY / GINI INDEX
1,585
TOTAL POPULATION
729
MALE POPULATION
856
FEMALE POPULATION
85.16
MALES / 100 FEMALES
117.42
FEMALES / 100 MALES
24.9
MEDIAN AGE
4.3
AVG FAMILY SIZE
3.3
AVG HOUSEHOLD SIZE
594
LABOR FORCE [ PEOPLE ]
58.2%
PERCENT IN LABOR FORCE
Iraan Zip Codes
Iraan Area Codes
Income in Iraan
Income Overview in Iraan
| Characteristic | Number | Measure |
| Per Capita Income | 1,585 | $26,938 |
| Median Family Income | 317 | $0 |
| Mean Family Income | 317 | $115,459 |
| Median Household Income | 480 | $54,453 |
| Mean Household Income | 480 | $90,556 |
| Income Deficit | 317 | $0 |
| Wage / Income Gap (%) | 1,585 | 19.89% |
| Wage / Income Gap ($) | 1,585 | 80.11¢ per $1 |
| Gini / Inequality Index | 1,585 | 0.45 |
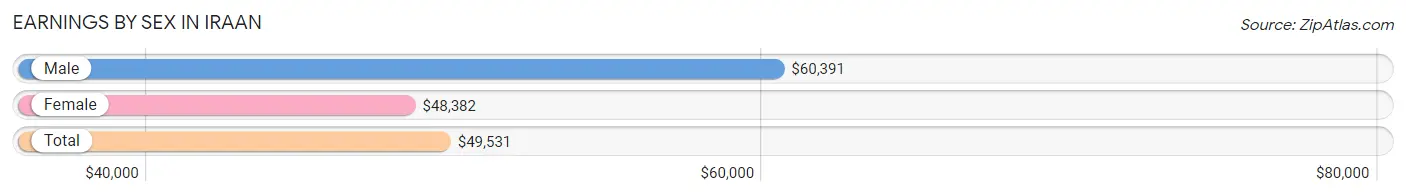
Earnings by Sex in Iraan
Average Earnings in Iraan are $49,531, $60,391 for men and $48,382 for women, a difference of 19.9%.
| Sex | Number | Average Earnings |
| Male | 390 (62.7%) | $60,391 |
| Female | 232 (37.3%) | $48,382 |
| Total | 622 (100.0%) | $49,531 |
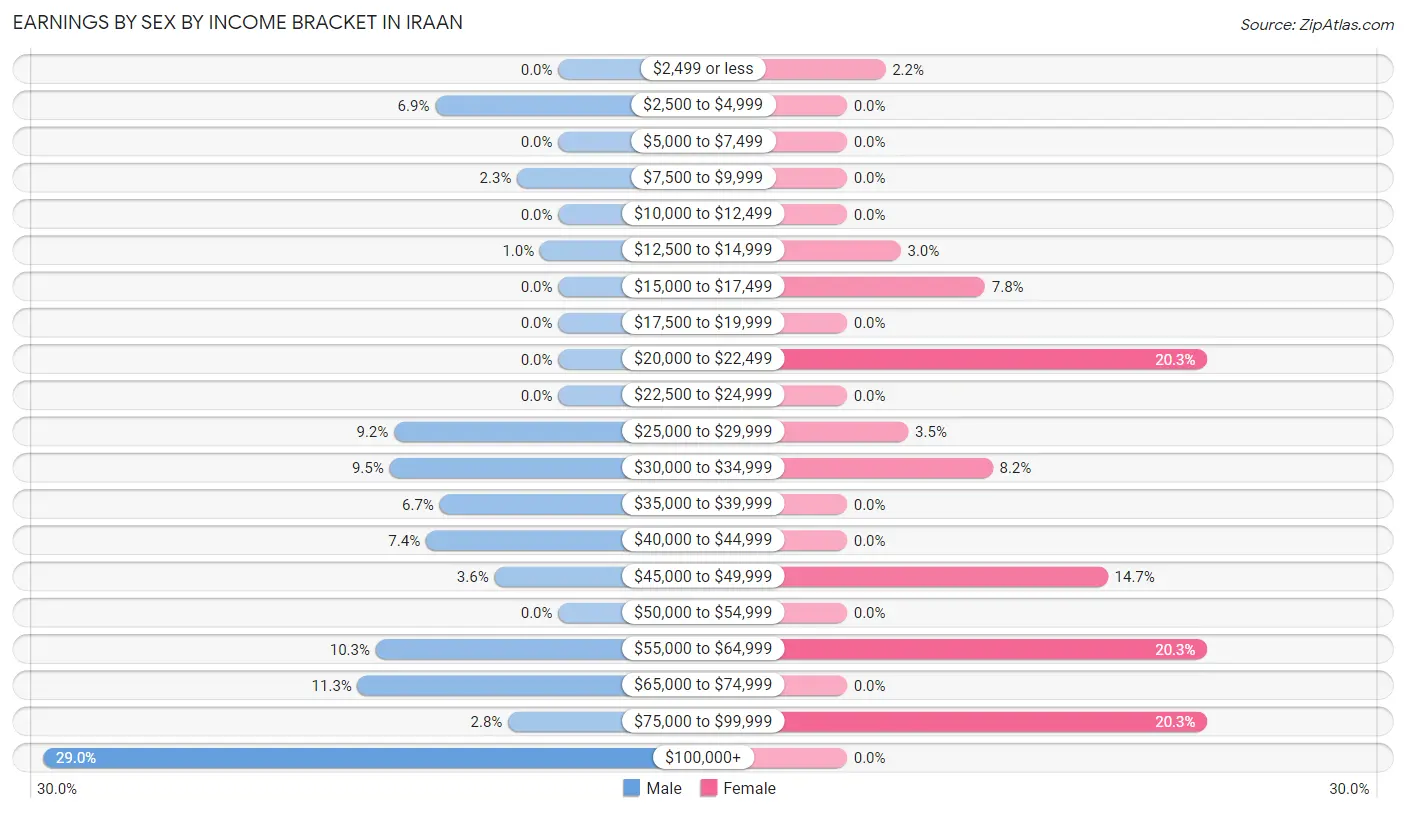
Earnings by Sex by Income Bracket in Iraan
The most common earnings brackets in Iraan are $100,000+ for men (113 | 29.0%) and $20,000 to $22,499 for women (47 | 20.3%).
| Income | Male | Female |
| $2,499 or less | 0 (0.0%) | 5 (2.2%) |
| $2,500 to $4,999 | 27 (6.9%) | 0 (0.0%) |
| $5,000 to $7,499 | 0 (0.0%) | 0 (0.0%) |
| $7,500 to $9,999 | 9 (2.3%) | 0 (0.0%) |
| $10,000 to $12,499 | 0 (0.0%) | 0 (0.0%) |
| $12,500 to $14,999 | 4 (1.0%) | 7 (3.0%) |
| $15,000 to $17,499 | 0 (0.0%) | 18 (7.8%) |
| $17,500 to $19,999 | 0 (0.0%) | 0 (0.0%) |
| $20,000 to $22,499 | 0 (0.0%) | 47 (20.3%) |
| $22,500 to $24,999 | 0 (0.0%) | 0 (0.0%) |
| $25,000 to $29,999 | 36 (9.2%) | 8 (3.5%) |
| $30,000 to $34,999 | 37 (9.5%) | 19 (8.2%) |
| $35,000 to $39,999 | 26 (6.7%) | 0 (0.0%) |
| $40,000 to $44,999 | 29 (7.4%) | 0 (0.0%) |
| $45,000 to $49,999 | 14 (3.6%) | 34 (14.7%) |
| $50,000 to $54,999 | 0 (0.0%) | 0 (0.0%) |
| $55,000 to $64,999 | 40 (10.3%) | 47 (20.3%) |
| $65,000 to $74,999 | 44 (11.3%) | 0 (0.0%) |
| $75,000 to $99,999 | 11 (2.8%) | 47 (20.3%) |
| $100,000+ | 113 (29.0%) | 0 (0.0%) |
| Total | 390 (100.0%) | 232 (100.0%) |
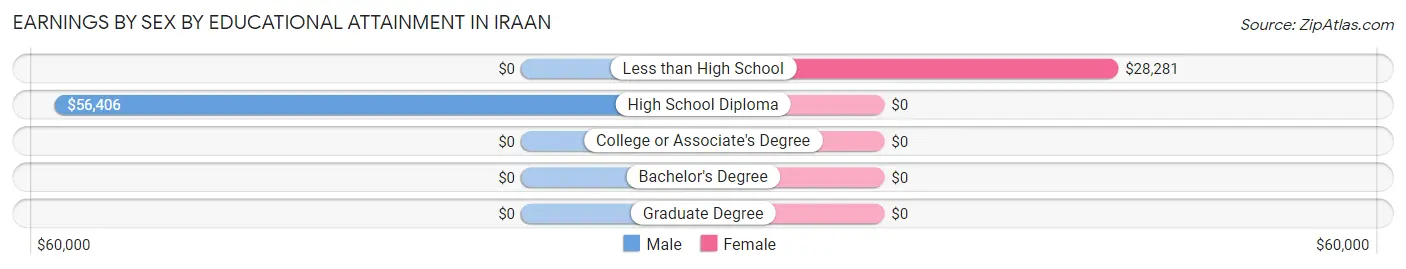
Earnings by Sex by Educational Attainment in Iraan
| Educational Attainment | Male Income | Female Income |
| Less than High School | - | - |
| High School Diploma | $56,406 | $0 |
| College or Associate's Degree | - | - |
| Bachelor's Degree | - | - |
| Graduate Degree | - | - |
| Total | $70,994 | $0 |
Family Income in Iraan
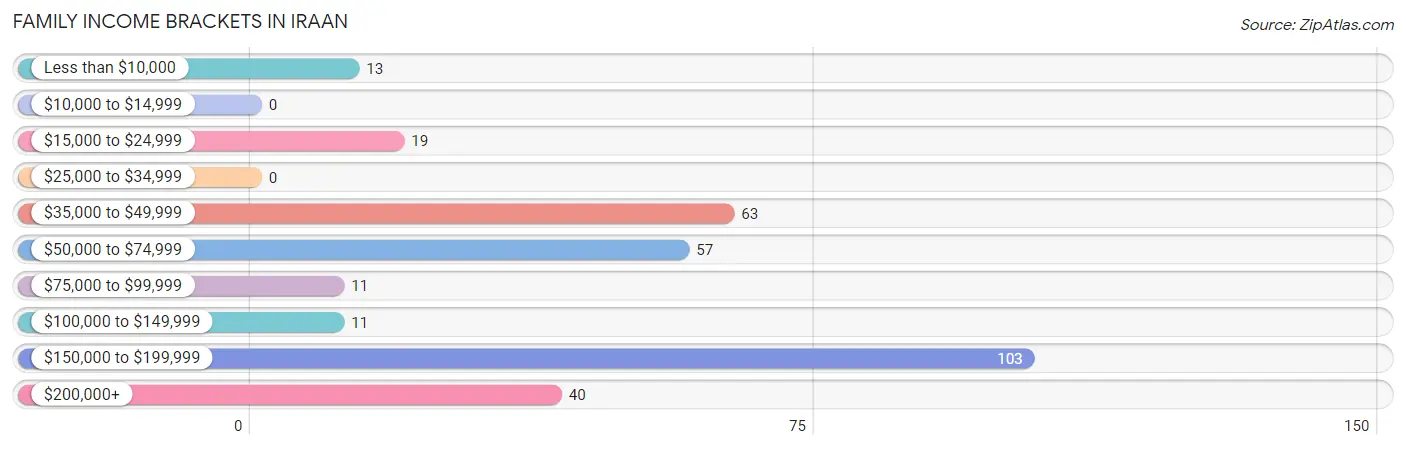
Family Income Brackets in Iraan
According to the Iraan family income data, there are 103 families falling into the $150,000 to $199,999 income range, which is the most common income bracket and makes up 32.5% of all families.
| Income Bracket | # Families | % Families |
| Less than $10,000 | 13 | 4.1% |
| $10,000 to $14,999 | 0 | 0.0% |
| $15,000 to $24,999 | 19 | 6.0% |
| $25,000 to $34,999 | 0 | 0.0% |
| $35,000 to $49,999 | 63 | 19.9% |
| $50,000 to $74,999 | 57 | 18.0% |
| $75,000 to $99,999 | 11 | 3.5% |
| $100,000 to $149,999 | 11 | 3.5% |
| $150,000 to $199,999 | 103 | 32.5% |
| $200,000+ | 40 | 12.6% |
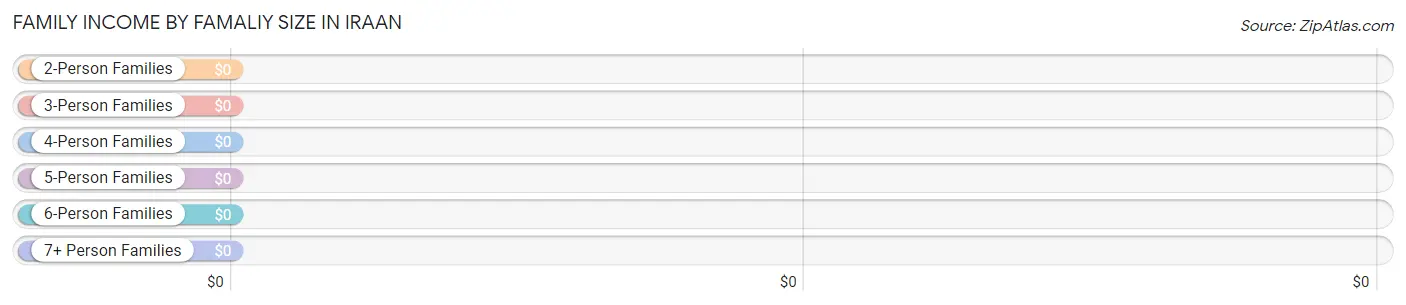
Family Income by Famaliy Size in Iraan
| Income Bracket | # Families | Median Income |
| 2-Person Families | 122 (38.5%) | $0 |
| 3-Person Families | 107 (33.8%) | $0 |
| 4-Person Families | 34 (10.7%) | $0 |
| 5-Person Families | 14 (4.4%) | $0 |
| 6-Person Families | 29 (9.1%) | $0 |
| 7+ Person Families | 11 (3.5%) | $0 |
| Total | 317 (100.0%) | $0 |
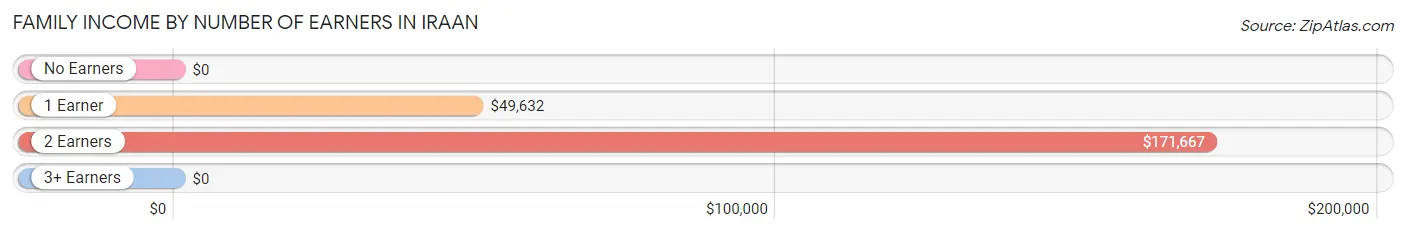
Family Income by Number of Earners in Iraan
| Number of Earners | # Families | Median Income |
| No Earners | 32 (10.1%) | $0 |
| 1 Earner | 116 (36.6%) | $49,632 |
| 2 Earners | 150 (47.3%) | $171,667 |
| 3+ Earners | 19 (6.0%) | $0 |
| Total | 317 (100.0%) | $0 |
Household Income in Iraan
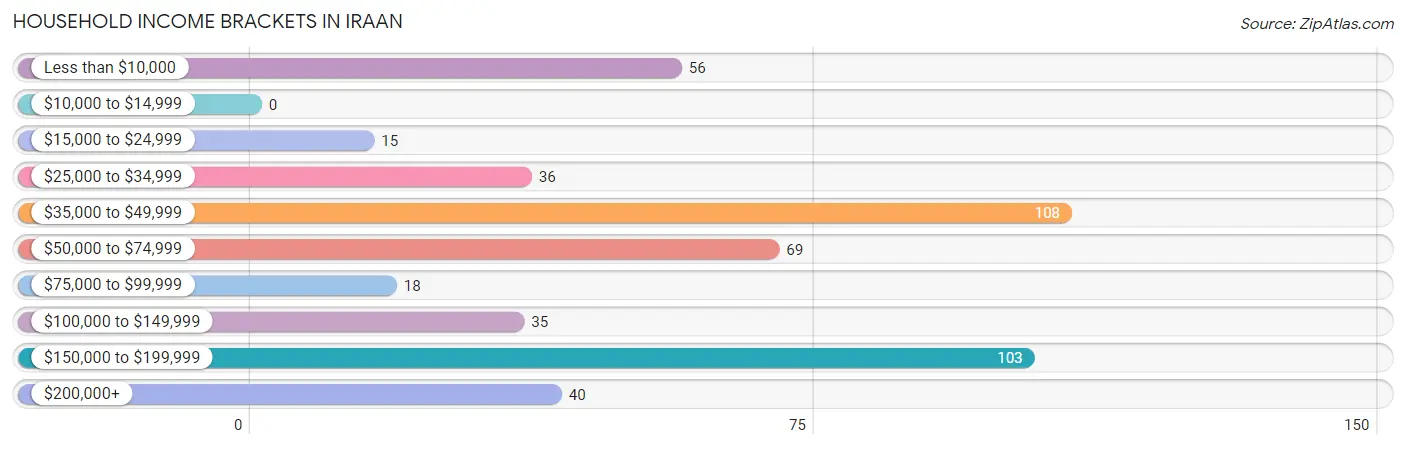
Household Income Brackets in Iraan
With 108 households falling in the category, the $35,000 to $49,999 income range is the most frequent in Iraan, accounting for 22.5% of all households.
| Income Bracket | # Households | % Households |
| Less than $10,000 | 56 | 11.7% |
| $10,000 to $14,999 | 0 | 0.0% |
| $15,000 to $24,999 | 15 | 3.1% |
| $25,000 to $34,999 | 36 | 7.5% |
| $35,000 to $49,999 | 108 | 22.5% |
| $50,000 to $74,999 | 69 | 14.4% |
| $75,000 to $99,999 | 18 | 3.8% |
| $100,000 to $149,999 | 35 | 7.3% |
| $150,000 to $199,999 | 103 | 21.5% |
| $200,000+ | 40 | 8.3% |
Household Income by Householder Age in Iraan
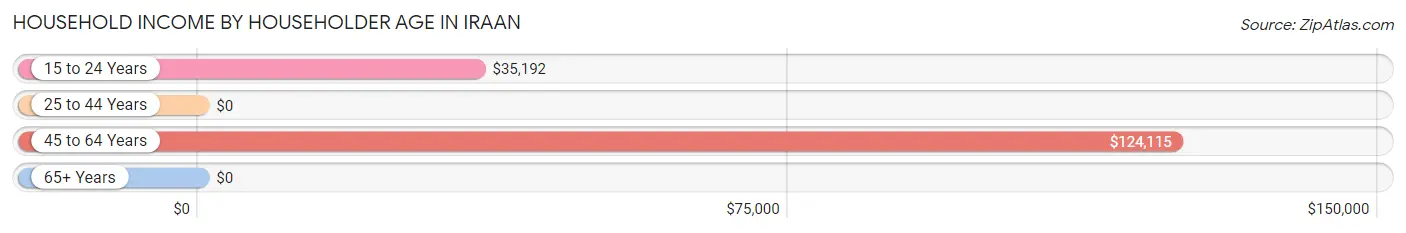
The median household income in Iraan is $54,453, with the highest median household income of $124,115 found in the 45 to 64 years age bracket for the primary householder. A total of 173 households (36.0%) fall into this category. Meanwhile, the 25 to 44 years age bracket for the primary householder has the lowest median household income of $0, with 93 households (19.4%) in this group.
| Income Bracket | # Households | Median Income |
| 15 to 24 Years | 116 (24.2%) | $35,192 |
| 25 to 44 Years | 93 (19.4%) | $0 |
| 45 to 64 Years | 173 (36.0%) | $124,115 |
| 65+ Years | 98 (20.4%) | $0 |
| Total | 480 (100.0%) | $54,453 |
Poverty in Iraan
Income Below Poverty by Sex and Age in Iraan
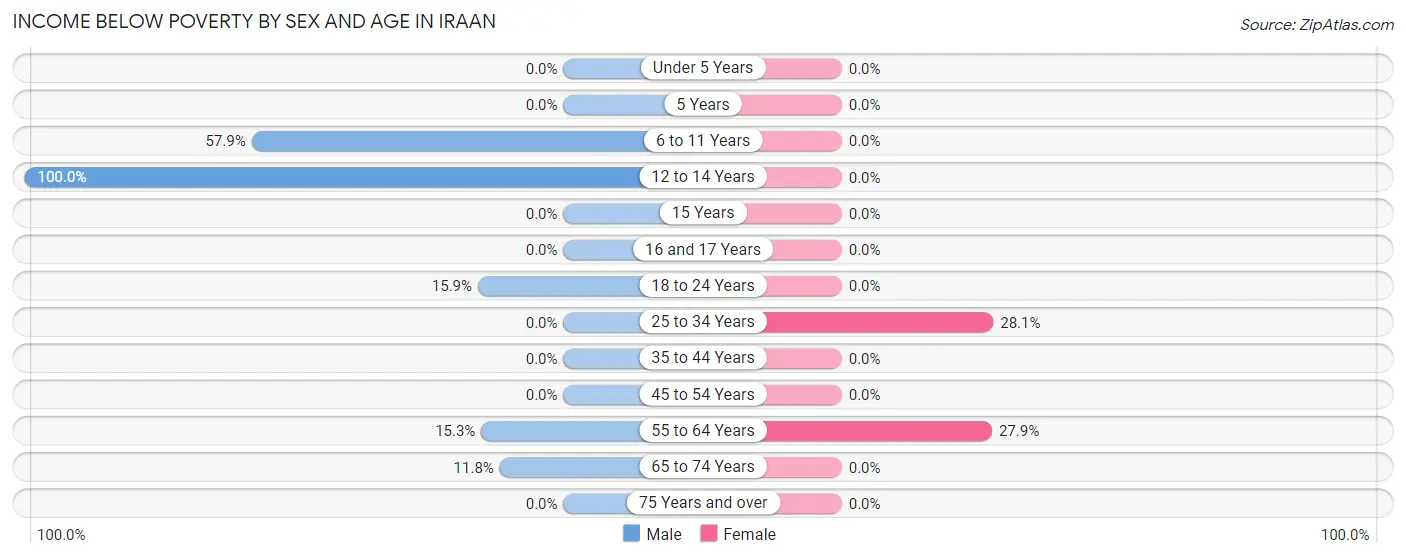
With 20.8% poverty level for males and 5.7% for females among the residents of Iraan, 12 to 14 year old males and 25 to 34 year old females are the most vulnerable to poverty, with 55 males (100.0%) and 18 females (28.1%) in their respective age groups living below the poverty level.
| Age Bracket | Male | Female |
| Under 5 Years | 0 (0.0%) | 0 (0.0%) |
| 5 Years | 0 (0.0%) | 0 (0.0%) |
| 6 to 11 Years | 55 (57.9%) | 0 (0.0%) |
| 12 to 14 Years | 55 (100.0%) | 0 (0.0%) |
| 15 Years | 0 (0.0%) | 0 (0.0%) |
| 16 and 17 Years | 0 (0.0%) | 0 (0.0%) |
| 18 to 24 Years | 20 (15.9%) | 0 (0.0%) |
| 25 to 34 Years | 0 (0.0%) | 18 (28.1%) |
| 35 to 44 Years | 0 (0.0%) | 0 (0.0%) |
| 45 to 54 Years | 0 (0.0%) | 0 (0.0%) |
| 55 to 64 Years | 9 (15.2%) | 29 (27.9%) |
| 65 to 74 Years | 13 (11.8%) | 0 (0.0%) |
| 75 Years and over | 0 (0.0%) | 0 (0.0%) |
| Total | 152 (20.8%) | 47 (5.7%) |
Income Above Poverty by Sex and Age in Iraan
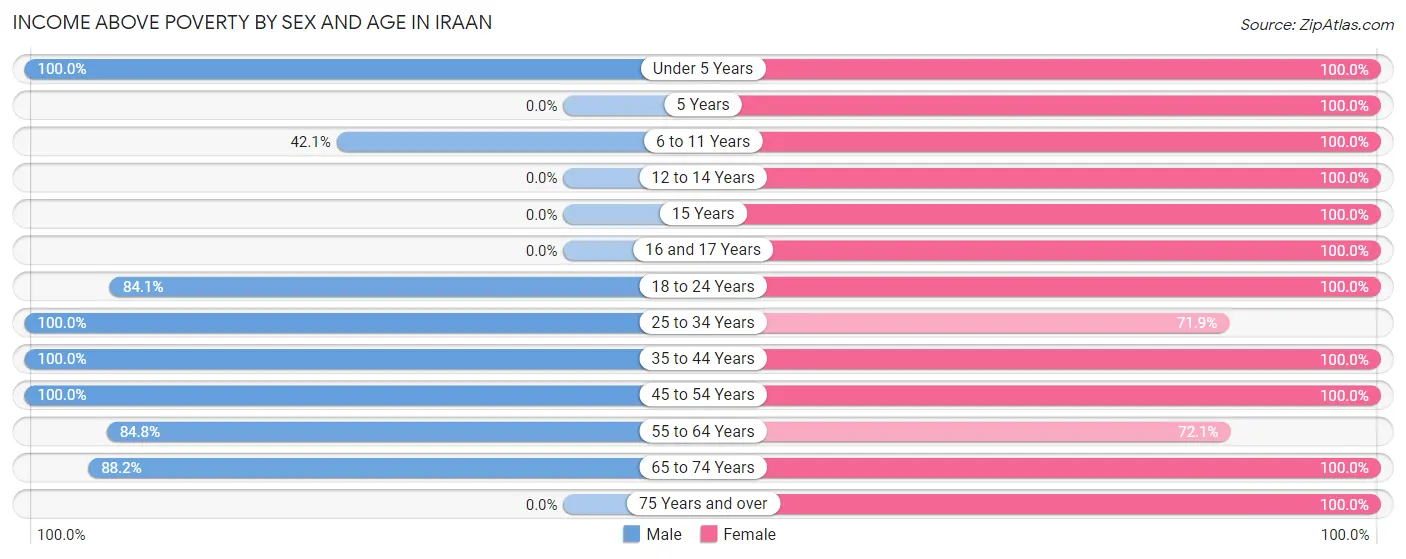
According to the poverty statistics in Iraan, males aged under 5 years and females aged under 5 years are the age groups that are most secure financially, with 100.0% of males and 100.0% of females in these age groups living above the poverty line.
| Age Bracket | Male | Female |
| Under 5 Years | 65 (100.0%) | 129 (100.0%) |
| 5 Years | 0 (0.0%) | 5 (100.0%) |
| 6 to 11 Years | 40 (42.1%) | 95 (100.0%) |
| 12 to 14 Years | 0 (0.0%) | 32 (100.0%) |
| 15 Years | 0 (0.0%) | 53 (100.0%) |
| 16 and 17 Years | 0 (0.0%) | 62 (100.0%) |
| 18 to 24 Years | 106 (84.1%) | 48 (100.0%) |
| 25 to 34 Years | 100 (100.0%) | 46 (71.9%) |
| 35 to 44 Years | 33 (100.0%) | 132 (100.0%) |
| 45 to 54 Years | 86 (100.0%) | 33 (100.0%) |
| 55 to 64 Years | 50 (84.8%) | 75 (72.1%) |
| 65 to 74 Years | 97 (88.2%) | 56 (100.0%) |
| 75 Years and over | 0 (0.0%) | 8 (100.0%) |
| Total | 577 (79.1%) | 774 (94.3%) |
Income Below Poverty Among Married-Couple Families in Iraan
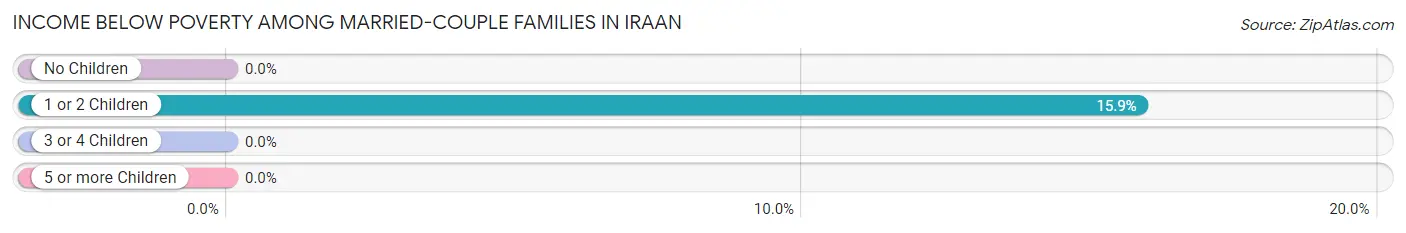
The poverty statistics for married-couple families in Iraan show that 5.6% or 13 of the total 232 families live below the poverty line. Families with 1 or 2 children have the highest poverty rate of 15.9%, comprising of 13 families. On the other hand, families with no children have the lowest poverty rate of 0.0%, which includes 0 families.
| Children | Above Poverty | Below Poverty |
| No Children | 115 (100.0%) | 0 (0.0%) |
| 1 or 2 Children | 69 (84.2%) | 13 (15.9%) |
| 3 or 4 Children | 35 (100.0%) | 0 (0.0%) |
| 5 or more Children | 0 (0.0%) | 0 (0.0%) |
| Total | 219 (94.4%) | 13 (5.6%) |
Income Below Poverty Among Single-Parent Households in Iraan

| Children | Single Father | Single Mother |
| No Children | 0 (0.0%) | 0 (0.0%) |
| 1 or 2 Children | 0 (0.0%) | 0 (0.0%) |
| 3 or 4 Children | 0 (0.0%) | 0 (0.0%) |
| 5 or more Children | 0 (0.0%) | 0 (0.0%) |
| Total | 0 (0.0%) | 0 (0.0%) |
Income Below Poverty Among Married-Couple vs Single-Parent Households in Iraan
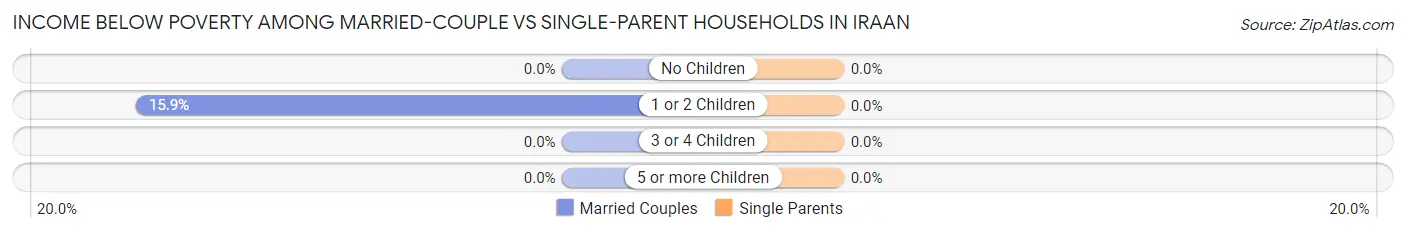
| Children | Married-Couple Families | Single-Parent Households |
| No Children | 0 (0.0%) | 0 (0.0%) |
| 1 or 2 Children | 13 (15.9%) | 0 (0.0%) |
| 3 or 4 Children | 0 (0.0%) | 0 (0.0%) |
| 5 or more Children | 0 (0.0%) | 0 (0.0%) |
| Total | 13 (5.6%) | 0 (0.0%) |
Race in Iraan
The most populous races in Iraan are White / Caucasian (1,018 | 64.2%), Hispanic or Latino (554 | 34.9%), and Some other Race (249 | 15.7%).
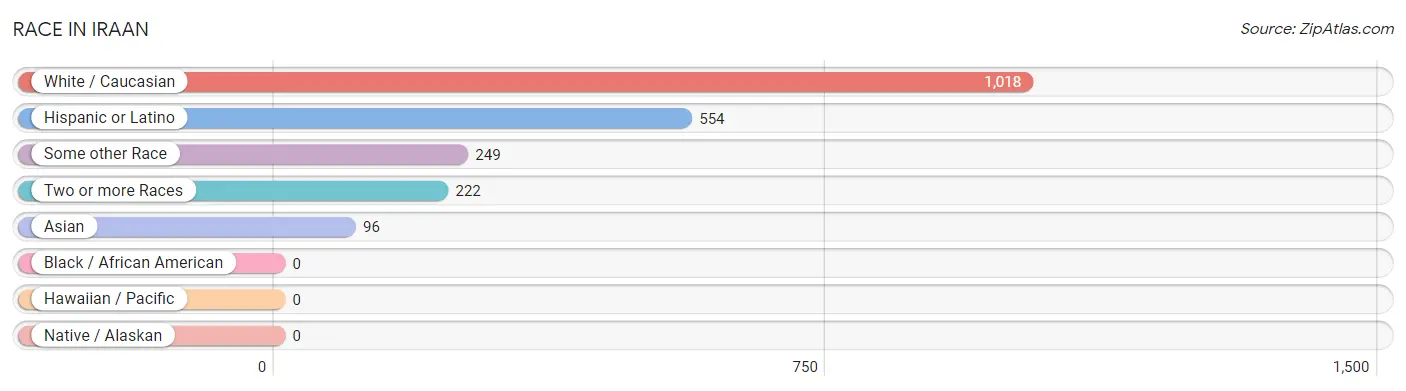
| Race | # Population | % Population |
| Asian | 96 | 6.1% |
| Black / African American | 0 | 0.0% |
| Hawaiian / Pacific | 0 | 0.0% |
| Hispanic or Latino | 554 | 34.9% |
| Native / Alaskan | 0 | 0.0% |
| White / Caucasian | 1,018 | 64.2% |
| Two or more Races | 222 | 14.0% |
| Some other Race | 249 | 15.7% |
| Total | 1,585 | 100.0% |
Ancestry in Iraan
The most populous ancestries reported in Iraan are Mexican (554 | 34.9%), Italian (138 | 8.7%), English (129 | 8.1%), German (106 | 6.7%), and Sri Lankan (96 | 6.1%), together accounting for 64.5% of all Iraan residents.
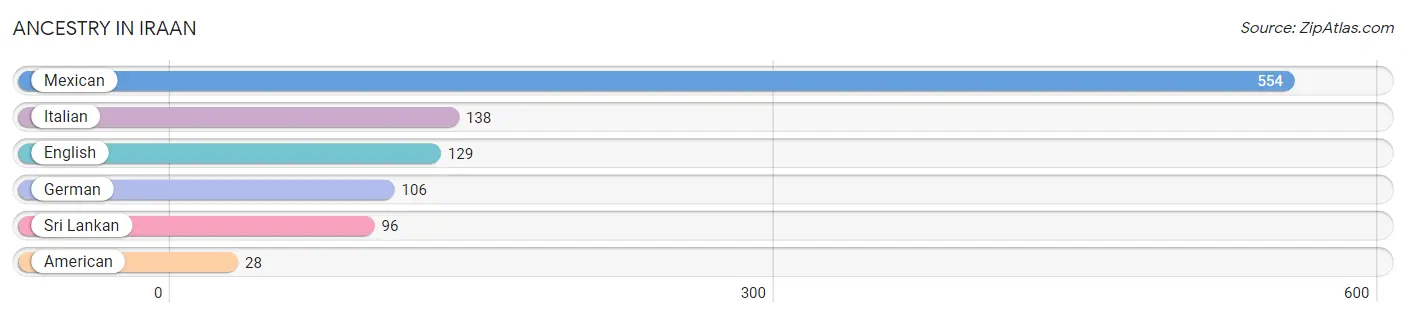
| Ancestry | # Population | % Population |
| American | 28 | 1.8% |
| English | 129 | 8.1% |
| German | 106 | 6.7% |
| Italian | 138 | 8.7% |
| Mexican | 554 | 34.9% |
| Sri Lankan | 96 | 6.1% | View All 6 Rows |
Immigrants in Iraan
The most numerous immigrant groups reported in Iraan came from Central America (185 | 11.7%), Latin America (185 | 11.7%), Mexico (185 | 11.7%), Asia (96 | 6.1%), and South Eastern Asia (96 | 6.1%), together accounting for 47.1% of all Iraan residents.
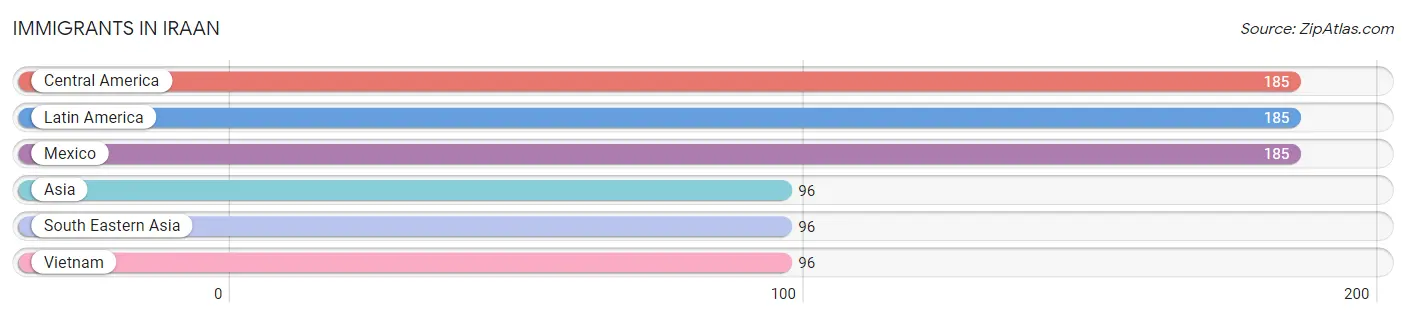
| Immigration Origin | # Population | % Population |
| Asia | 96 | 6.1% |
| Central America | 185 | 11.7% |
| Latin America | 185 | 11.7% |
| Mexico | 185 | 11.7% |
| South Eastern Asia | 96 | 6.1% |
| Vietnam | 96 | 6.1% | View All 6 Rows |
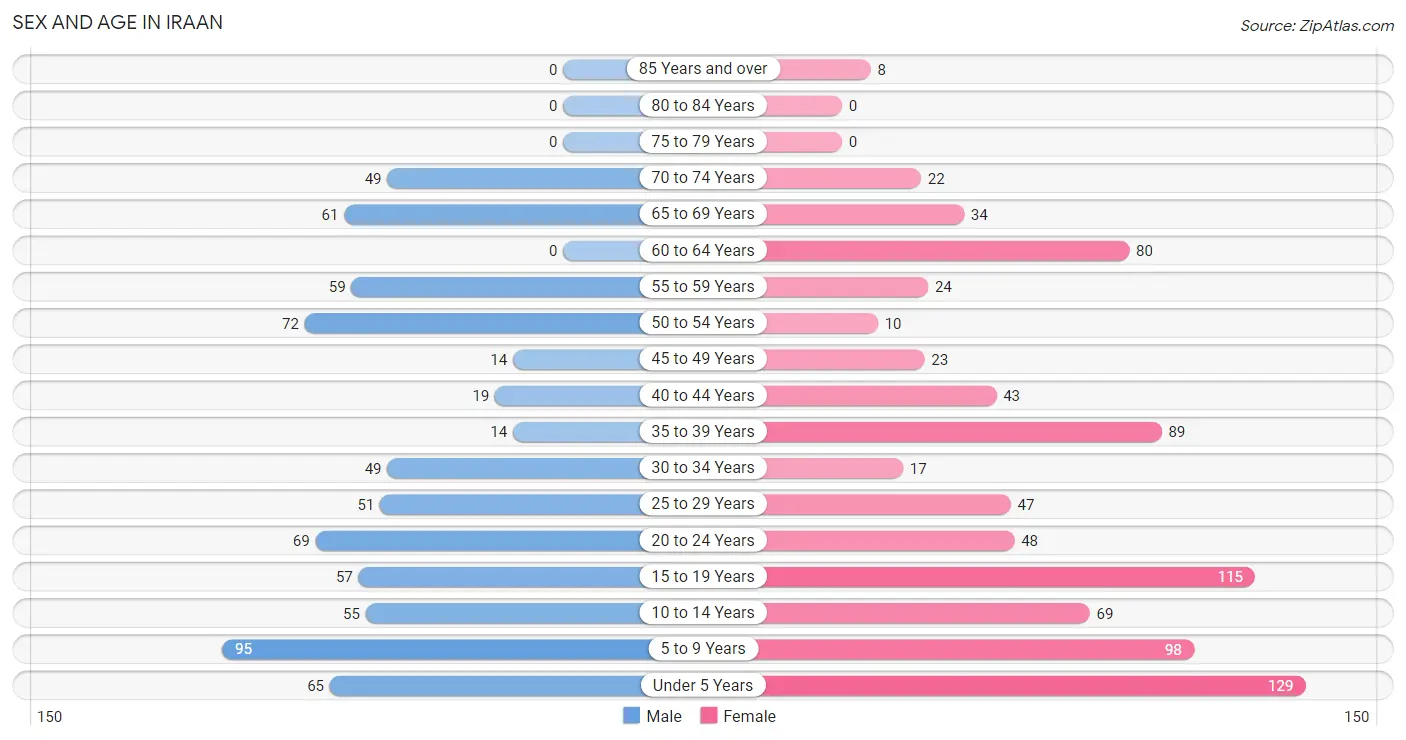
Sex and Age in Iraan
Sex and Age in Iraan
The most populous age groups in Iraan are 5 to 9 Years (95 | 13.0%) for men and Under 5 Years (129 | 15.1%) for women.
| Age Bracket | Male | Female |
| Under 5 Years | 65 (8.9%) | 129 (15.1%) |
| 5 to 9 Years | 95 (13.0%) | 98 (11.5%) |
| 10 to 14 Years | 55 (7.5%) | 69 (8.1%) |
| 15 to 19 Years | 57 (7.8%) | 115 (13.4%) |
| 20 to 24 Years | 69 (9.5%) | 48 (5.6%) |
| 25 to 29 Years | 51 (7.0%) | 47 (5.5%) |
| 30 to 34 Years | 49 (6.7%) | 17 (2.0%) |
| 35 to 39 Years | 14 (1.9%) | 89 (10.4%) |
| 40 to 44 Years | 19 (2.6%) | 43 (5.0%) |
| 45 to 49 Years | 14 (1.9%) | 23 (2.7%) |
| 50 to 54 Years | 72 (9.9%) | 10 (1.2%) |
| 55 to 59 Years | 59 (8.1%) | 24 (2.8%) |
| 60 to 64 Years | 0 (0.0%) | 80 (9.3%) |
| 65 to 69 Years | 61 (8.4%) | 34 (4.0%) |
| 70 to 74 Years | 49 (6.7%) | 22 (2.6%) |
| 75 to 79 Years | 0 (0.0%) | 0 (0.0%) |
| 80 to 84 Years | 0 (0.0%) | 0 (0.0%) |
| 85 Years and over | 0 (0.0%) | 8 (0.9%) |
| Total | 729 (100.0%) | 856 (100.0%) |
Families and Households in Iraan
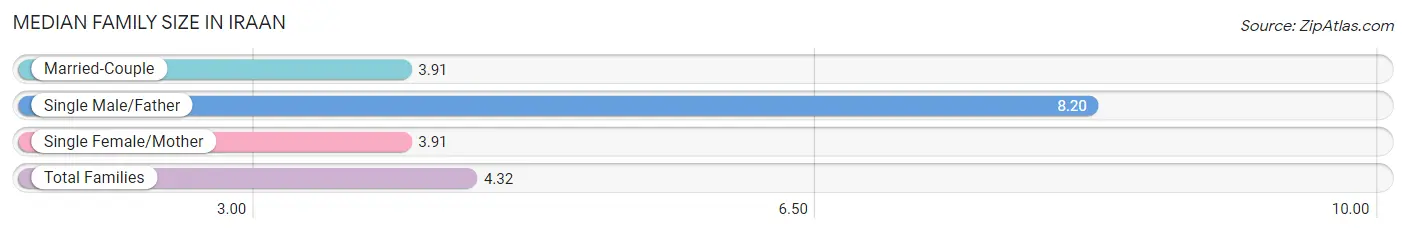
Median Family Size in Iraan
The median family size in Iraan is 4.32 persons per family, with single male/father families (30 | 9.5%) accounting for the largest median family size of 8.2 persons per family. On the other hand, married-couple families (232 | 73.2%) represent the smallest median family size with 3.91 persons per family.
| Family Type | # Families | Family Size |
| Married-Couple | 232 (73.2%) | 3.91 |
| Single Male/Father | 30 (9.5%) | 8.20 |
| Single Female/Mother | 55 (17.3%) | 3.91 |
| Total Families | 317 (100.0%) | 4.32 |
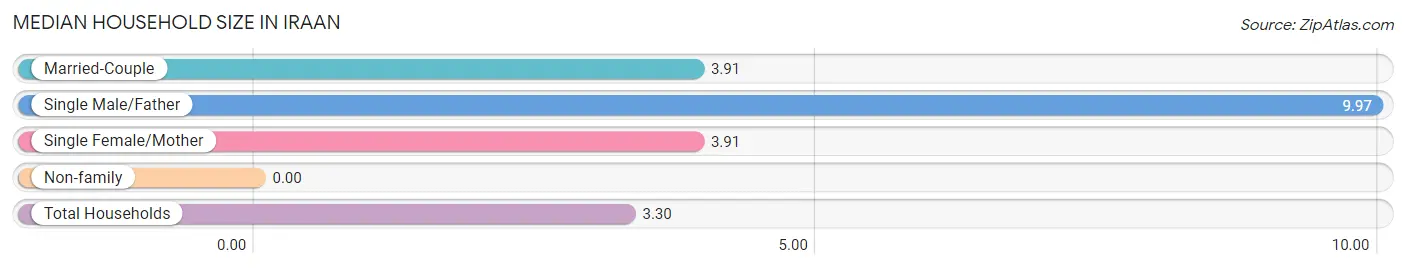
Median Household Size in Iraan
| Household Type | # Households | Household Size |
| Married-Couple | 232 (48.3%) | 3.91 |
| Single Male/Father | 30 (6.2%) | 9.97 |
| Single Female/Mother | 55 (11.5%) | 3.91 |
| Non-family | 163 (34.0%) | - |
| Total Households | 480 (100.0%) | 3.30 |
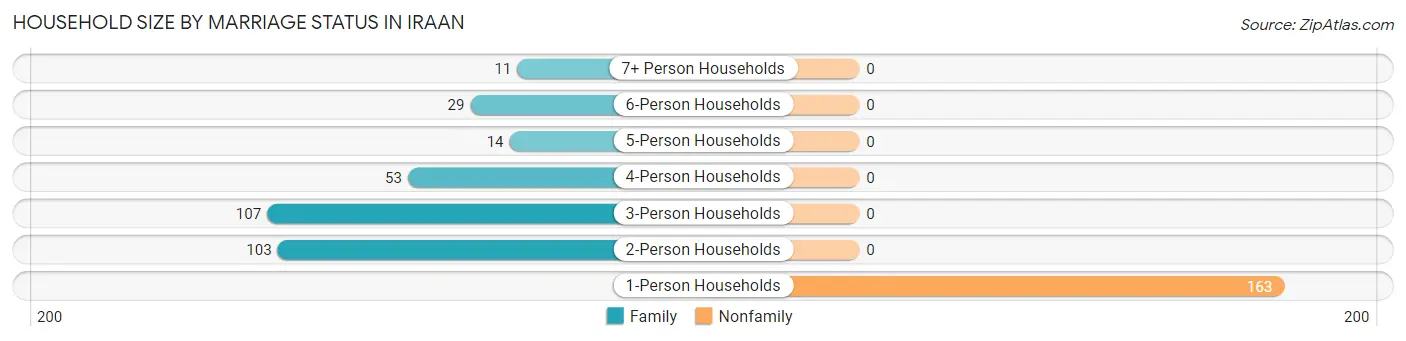
Household Size by Marriage Status in Iraan
Out of a total of 480 households in Iraan, 317 (66.0%) are family households, while 163 (34.0%) are nonfamily households. The most numerous type of family households are 3-person households, comprising 107, and the most common type of nonfamily households are 1-person households, comprising 163.
| Household Size | Family Households | Nonfamily Households |
| 1-Person Households | - | 163 (34.0%) |
| 2-Person Households | 103 (21.5%) | 0 (0.0%) |
| 3-Person Households | 107 (22.3%) | 0 (0.0%) |
| 4-Person Households | 53 (11.0%) | 0 (0.0%) |
| 5-Person Households | 14 (2.9%) | 0 (0.0%) |
| 6-Person Households | 29 (6.0%) | 0 (0.0%) |
| 7+ Person Households | 11 (2.3%) | 0 (0.0%) |
| Total | 317 (66.0%) | 163 (34.0%) |
Female Fertility in Iraan
Fertility by Age in Iraan
Average fertility rate in Iraan is 75.0 births per 1,000 women. Women in the age bracket of 20 to 34 years have the highest fertility rate with 259.0 births per 1,000 women. Women in the age bracket of 20 to 34 years acount for 100.0% of all women with births.
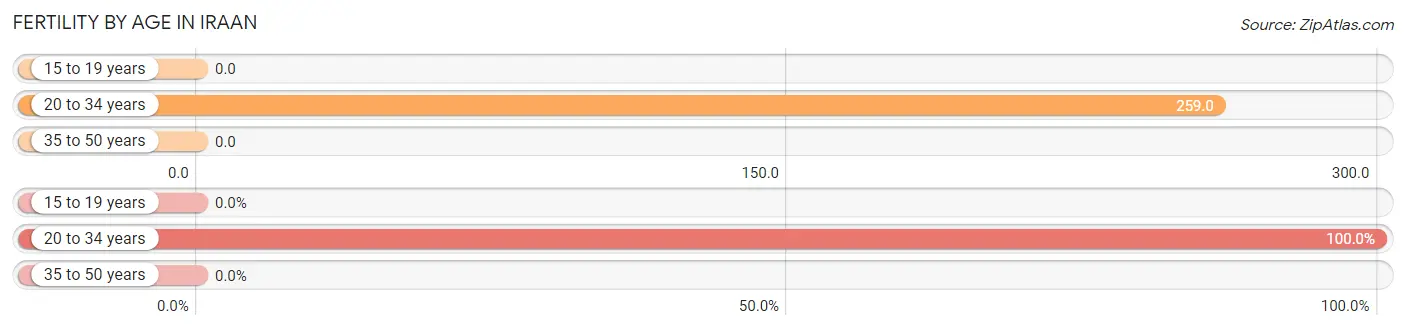
| Age Bracket | Women with Births | Births / 1,000 Women |
| 15 to 19 years | 0 (0.0%) | 0.0 |
| 20 to 34 years | 29 (100.0%) | 259.0 |
| 35 to 50 years | 0 (0.0%) | 0.0 |
| Total | 29 (100.0%) | 75.0 |
Fertility by Age by Marriage Status in Iraan
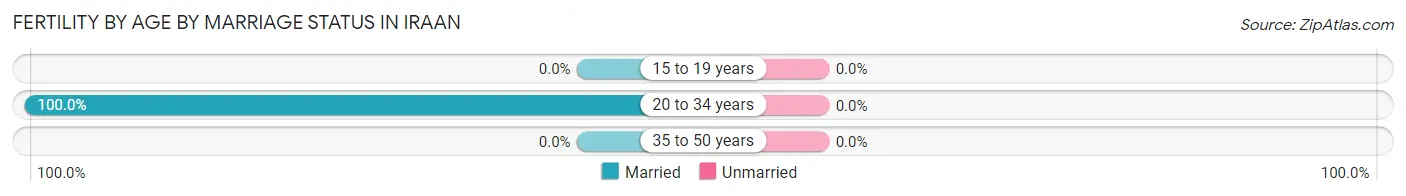
| Age Bracket | Married | Unmarried |
| 15 to 19 years | 0 (0.0%) | 0 (0.0%) |
| 20 to 34 years | 29 (100.0%) | 0 (0.0%) |
| 35 to 50 years | 0 (0.0%) | 0 (0.0%) |
| Total | 29 (100.0%) | 0 (0.0%) |
Fertility by Education in Iraan
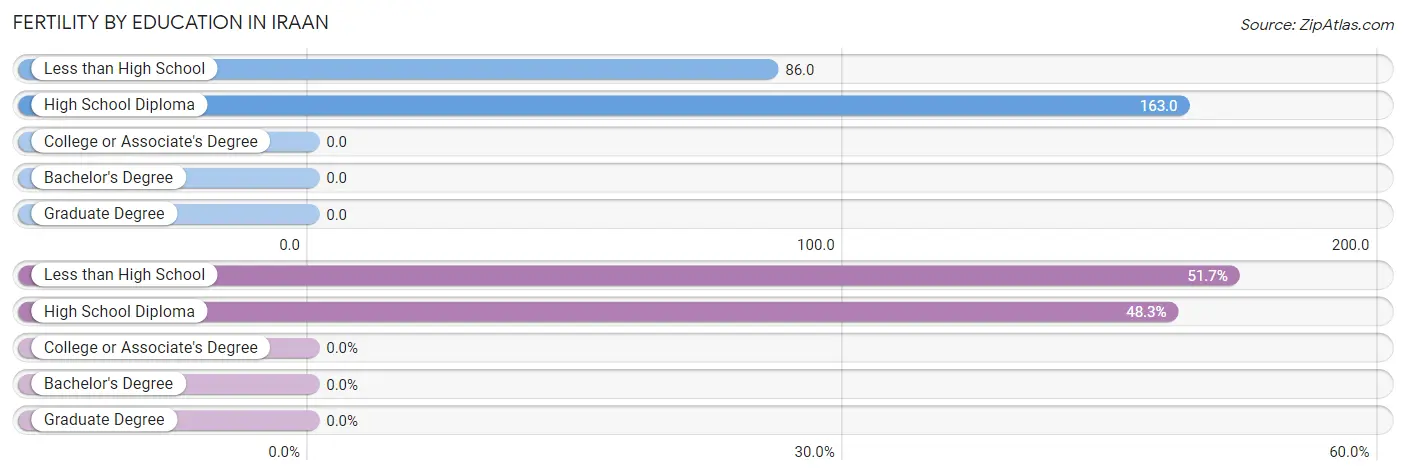
| Educational Attainment | Women with Births | Births / 1,000 Women |
| Less than High School | 15 (51.7%) | 86.0 |
| High School Diploma | 14 (48.3%) | 163.0 |
| College or Associate's Degree | 0 (0.0%) | 0.0 |
| Bachelor's Degree | 0 (0.0%) | 0.0 |
| Graduate Degree | 0 (0.0%) | 0.0 |
| Total | 29 (100.0%) | 75.0 |
Fertility by Education by Marriage Status in Iraan
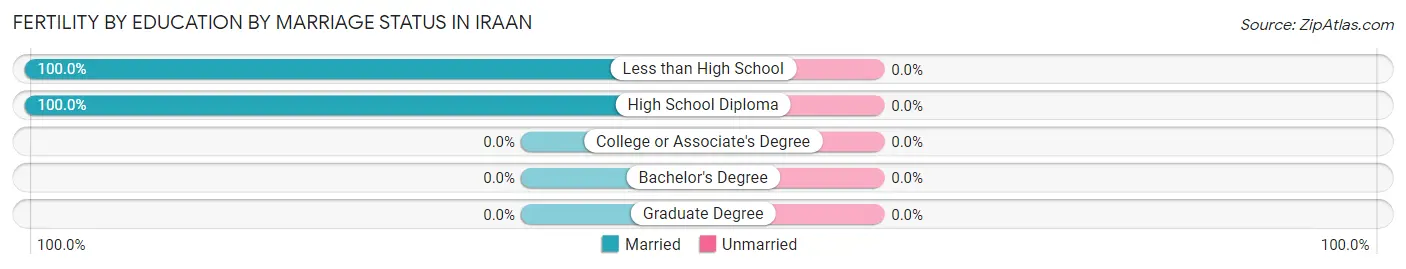
| Educational Attainment | Married | Unmarried |
| Less than High School | 15 (100.0%) | 0 (0.0%) |
| High School Diploma | 14 (100.0%) | 0 (0.0%) |
| College or Associate's Degree | 0 (0.0%) | 0 (0.0%) |
| Bachelor's Degree | 0 (0.0%) | 0 (0.0%) |
| Graduate Degree | 0 (0.0%) | 0 (0.0%) |
| Total | 29 (100.0%) | 0 (0.0%) |
Employment Characteristics in Iraan
Employment by Class of Employer in Iraan
Among the 594 employed individuals in Iraan, private company employees (459 | 77.3%), local government employees (69 | 11.6%), and self-employed (not incorporated) (27 | 4.5%) make up the most common classes of employment.
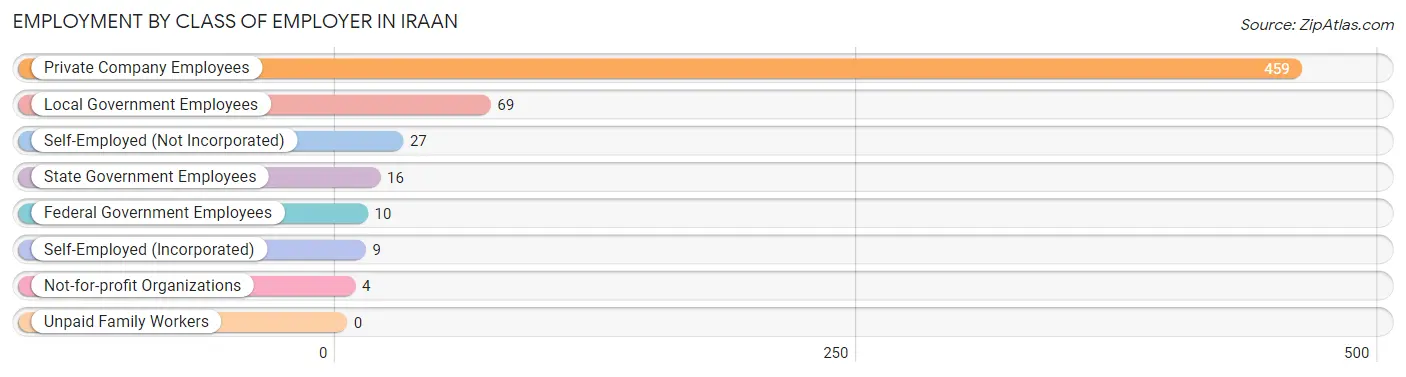
| Employer Class | # Employees | % Employees |
| Private Company Employees | 459 | 77.3% |
| Self-Employed (Incorporated) | 9 | 1.5% |
| Self-Employed (Not Incorporated) | 27 | 4.5% |
| Not-for-profit Organizations | 4 | 0.7% |
| Local Government Employees | 69 | 11.6% |
| State Government Employees | 16 | 2.7% |
| Federal Government Employees | 10 | 1.7% |
| Unpaid Family Workers | 0 | 0.0% |
| Total | 594 | 100.0% |
Employment Status by Age in Iraan
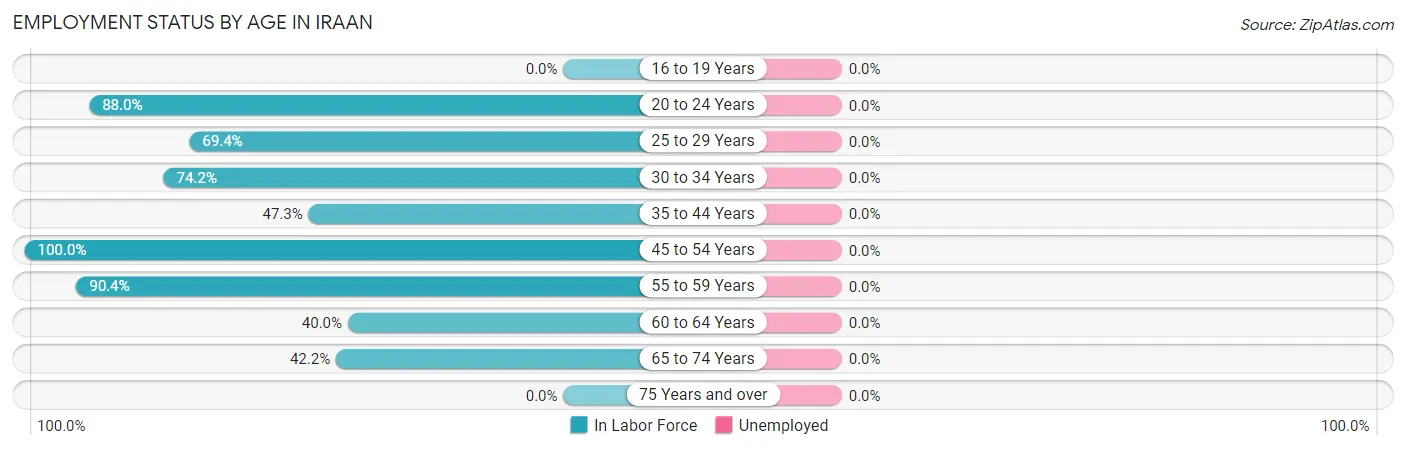
| Age Bracket | In Labor Force | Unemployed |
| 16 to 19 Years | 0 (0.0%) | 0 (0.0%) |
| 20 to 24 Years | 103 (88.0%) | 0 (0.0%) |
| 25 to 29 Years | 68 (69.4%) | 0 (0.0%) |
| 30 to 34 Years | 49 (74.2%) | 0 (0.0%) |
| 35 to 44 Years | 78 (47.3%) | 0 (0.0%) |
| 45 to 54 Years | 119 (100.0%) | 0 (0.0%) |
| 55 to 59 Years | 75 (90.4%) | 0 (0.0%) |
| 60 to 64 Years | 32 (40.0%) | 0 (0.0%) |
| 65 to 74 Years | 70 (42.2%) | 0 (0.0%) |
| 75 Years and over | 0 (0.0%) | 0 (0.0%) |
| Total | 594 (58.2%) | 0 (0.0%) |
Employment Status by Educational Attainment in Iraan
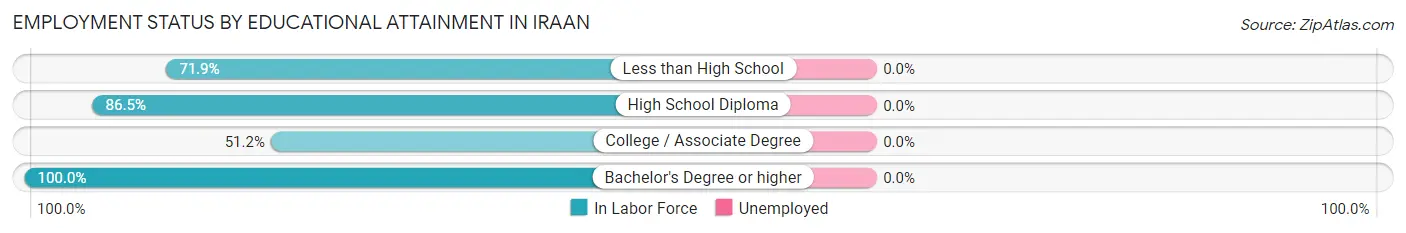
| Educational Attainment | In Labor Force | Unemployed |
| Less than High School | 92 (71.9%) | 0 (0.0%) |
| High School Diploma | 96 (86.5%) | 0 (0.0%) |
| College / Associate Degree | 146 (51.2%) | 0 (0.0%) |
| Bachelor's Degree or higher | 87 (100.0%) | 0 (0.0%) |
| Total | 421 (68.9%) | 0 (0.0%) |
Employment Occupations by Sex in Iraan
Management, Business, Science and Arts Occupations
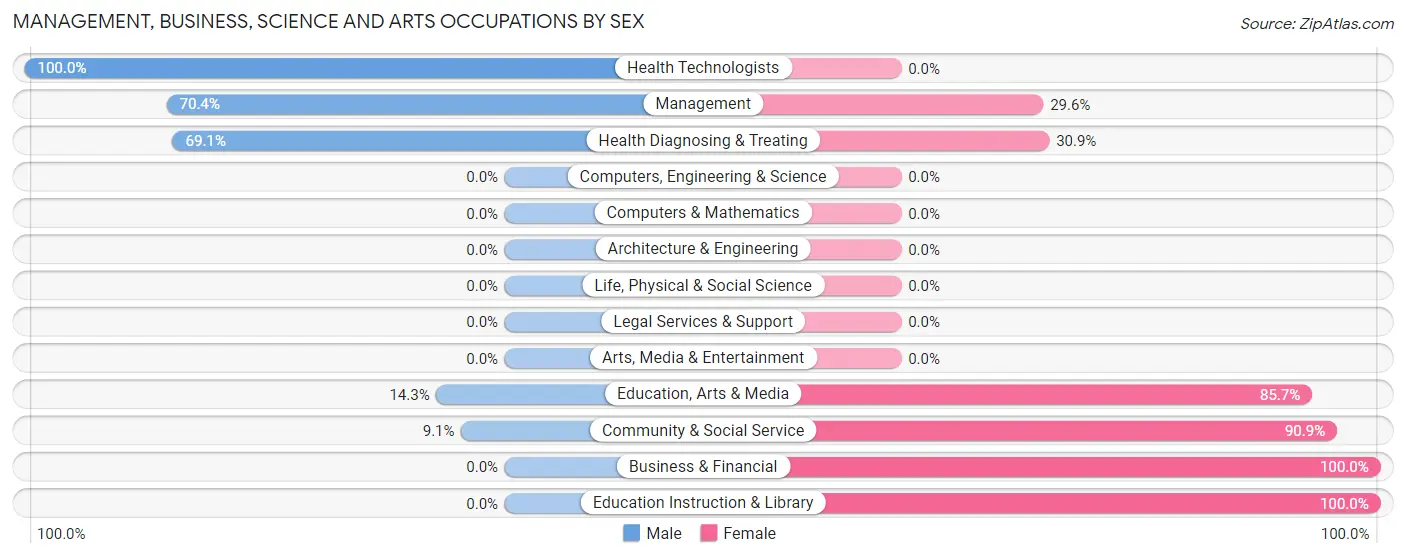
The most common Management, Business, Science and Arts occupations in Iraan are Health Diagnosing & Treating (68 | 11.6%), Community & Social Service (44 | 7.5%), Health Technologists (33 | 5.7%), Education, Arts & Media (28 | 4.8%), and Management (27 | 4.6%).
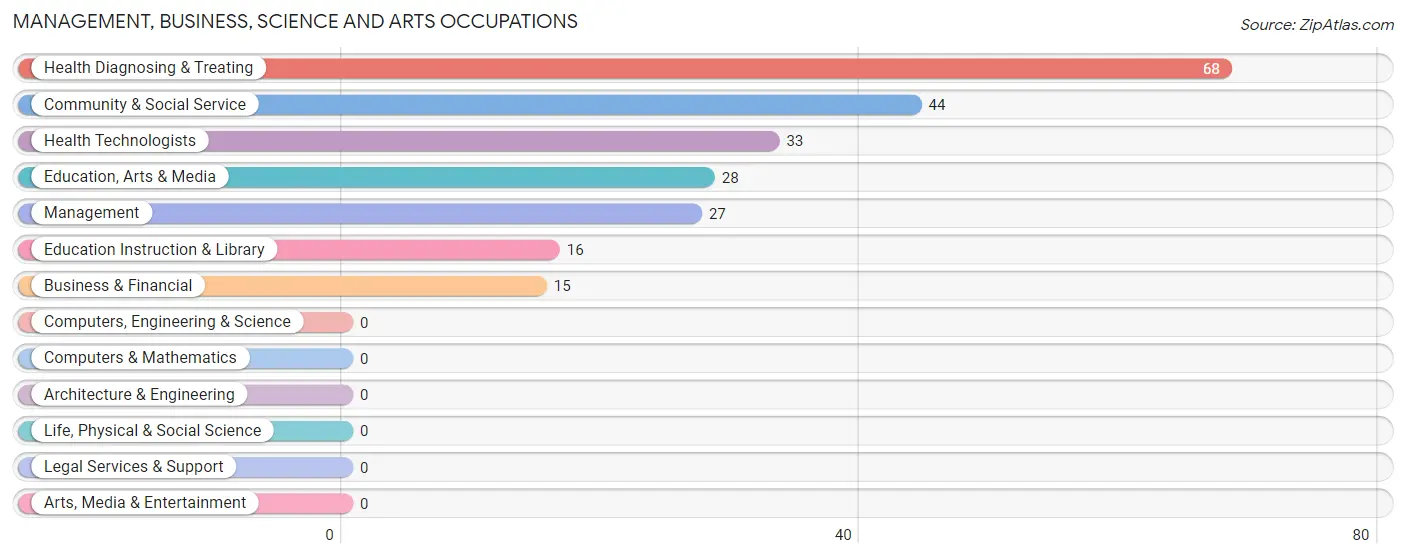
Management, Business, Science and Arts Occupations by Sex
Within the Management, Business, Science and Arts occupations in Iraan, the most male-oriented occupations are Health Technologists (100.0%), Management (70.4%), and Health Diagnosing & Treating (69.1%), while the most female-oriented occupations are Business & Financial (100.0%), Education Instruction & Library (100.0%), and Community & Social Service (90.9%).
| Occupation | Male | Female |
| Management | 19 (70.4%) | 8 (29.6%) |
| Business & Financial | 0 (0.0%) | 15 (100.0%) |
| Computers, Engineering & Science | 0 (0.0%) | 0 (0.0%) |
| Computers & Mathematics | 0 (0.0%) | 0 (0.0%) |
| Architecture & Engineering | 0 (0.0%) | 0 (0.0%) |
| Life, Physical & Social Science | 0 (0.0%) | 0 (0.0%) |
| Community & Social Service | 4 (9.1%) | 40 (90.9%) |
| Education, Arts & Media | 4 (14.3%) | 24 (85.7%) |
| Legal Services & Support | 0 (0.0%) | 0 (0.0%) |
| Education Instruction & Library | 0 (0.0%) | 16 (100.0%) |
| Arts, Media & Entertainment | 0 (0.0%) | 0 (0.0%) |
| Health Diagnosing & Treating | 47 (69.1%) | 21 (30.9%) |
| Health Technologists | 33 (100.0%) | 0 (0.0%) |
| Total (Category) | 70 (45.5%) | 84 (54.5%) |
| Total (Overall) | 360 (61.6%) | 224 (38.4%) |
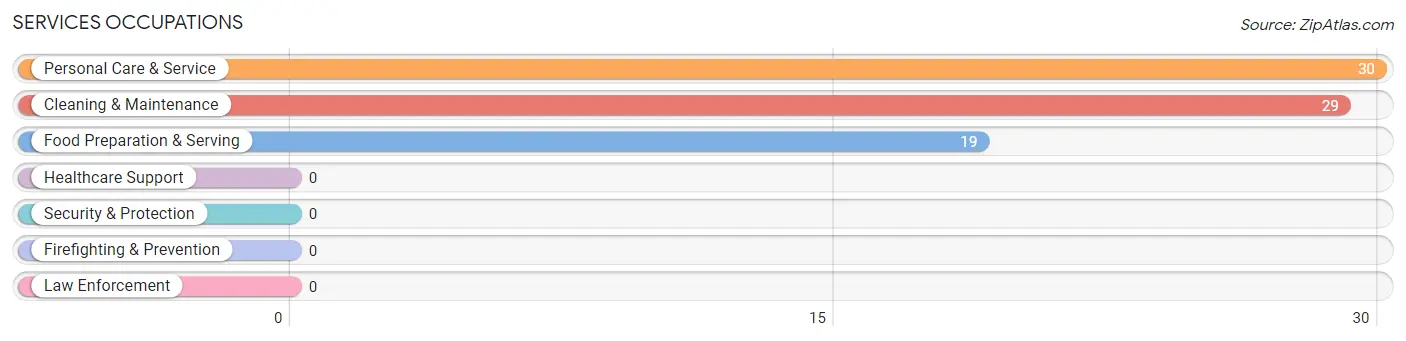
Services Occupations
The most common Services occupations in Iraan are Personal Care & Service (30 | 5.1%), Cleaning & Maintenance (29 | 5.0%), and Food Preparation & Serving (19 | 3.3%).
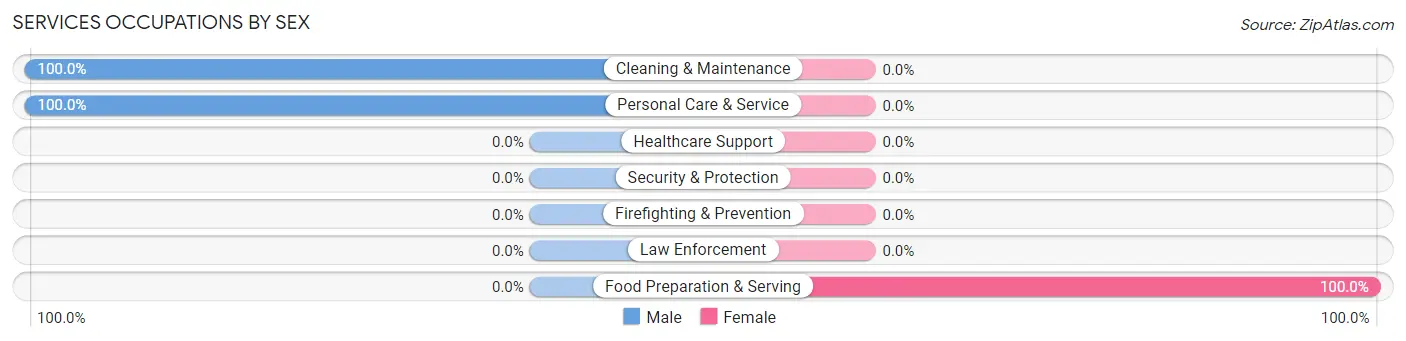
Services Occupations by Sex
| Occupation | Male | Female |
| Healthcare Support | 0 (0.0%) | 0 (0.0%) |
| Security & Protection | 0 (0.0%) | 0 (0.0%) |
| Firefighting & Prevention | 0 (0.0%) | 0 (0.0%) |
| Law Enforcement | 0 (0.0%) | 0 (0.0%) |
| Food Preparation & Serving | 0 (0.0%) | 19 (100.0%) |
| Cleaning & Maintenance | 29 (100.0%) | 0 (0.0%) |
| Personal Care & Service | 30 (100.0%) | 0 (0.0%) |
| Total (Category) | 59 (75.6%) | 19 (24.4%) |
| Total (Overall) | 360 (61.6%) | 224 (38.4%) |
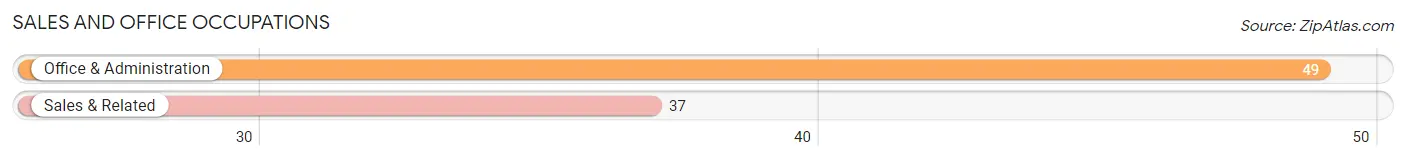
Sales and Office Occupations
The most common Sales and Office occupations in Iraan are Office & Administration (49 | 8.4%), and Sales & Related (37 | 6.3%).
Sales and Office Occupations by Sex
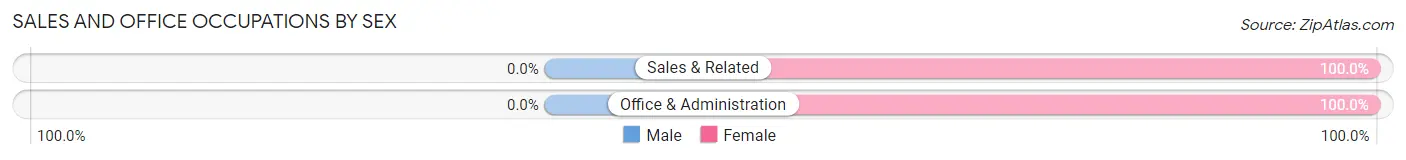
| Occupation | Male | Female |
| Sales & Related | 0 (0.0%) | 37 (100.0%) |
| Office & Administration | 0 (0.0%) | 49 (100.0%) |
| Total (Category) | 0 (0.0%) | 86 (100.0%) |
| Total (Overall) | 360 (61.6%) | 224 (38.4%) |
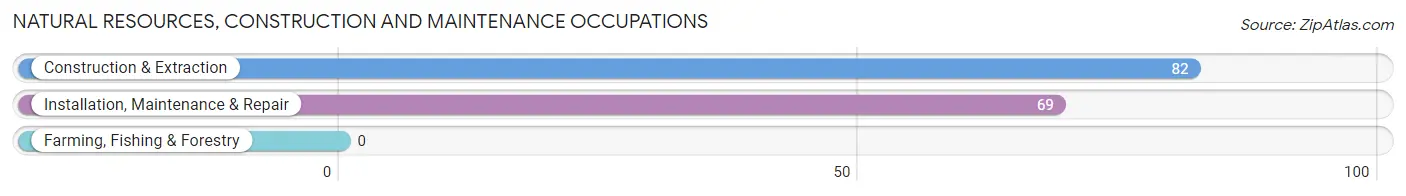
Natural Resources, Construction and Maintenance Occupations
The most common Natural Resources, Construction and Maintenance occupations in Iraan are Construction & Extraction (82 | 14.0%), and Installation, Maintenance & Repair (69 | 11.8%).
Natural Resources, Construction and Maintenance Occupations by Sex
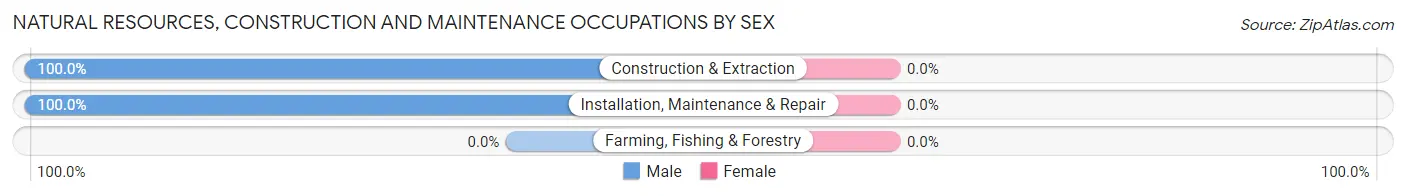
| Occupation | Male | Female |
| Farming, Fishing & Forestry | 0 (0.0%) | 0 (0.0%) |
| Construction & Extraction | 82 (100.0%) | 0 (0.0%) |
| Installation, Maintenance & Repair | 69 (100.0%) | 0 (0.0%) |
| Total (Category) | 151 (100.0%) | 0 (0.0%) |
| Total (Overall) | 360 (61.6%) | 224 (38.4%) |
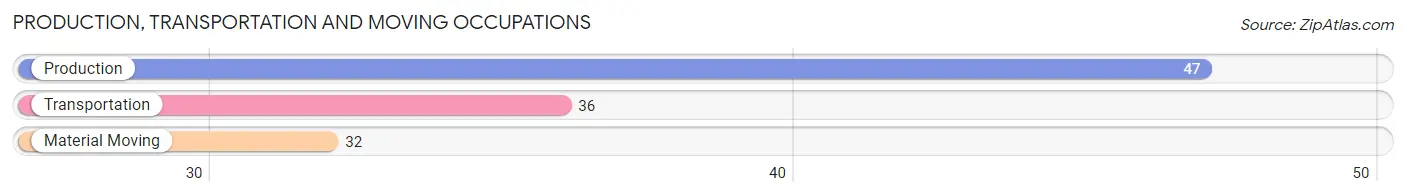
Production, Transportation and Moving Occupations
The most common Production, Transportation and Moving occupations in Iraan are Production (47 | 8.1%), Transportation (36 | 6.2%), and Material Moving (32 | 5.5%).
Production, Transportation and Moving Occupations by Sex
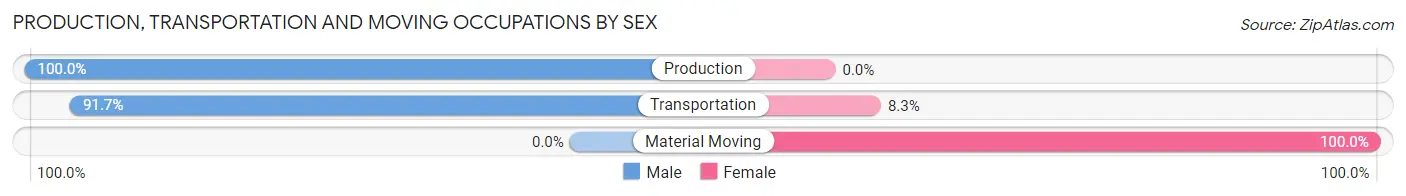
| Occupation | Male | Female |
| Production | 47 (100.0%) | 0 (0.0%) |
| Transportation | 33 (91.7%) | 3 (8.3%) |
| Material Moving | 0 (0.0%) | 32 (100.0%) |
| Total (Category) | 80 (69.6%) | 35 (30.4%) |
| Total (Overall) | 360 (61.6%) | 224 (38.4%) |
Employment Industries by Sex in Iraan
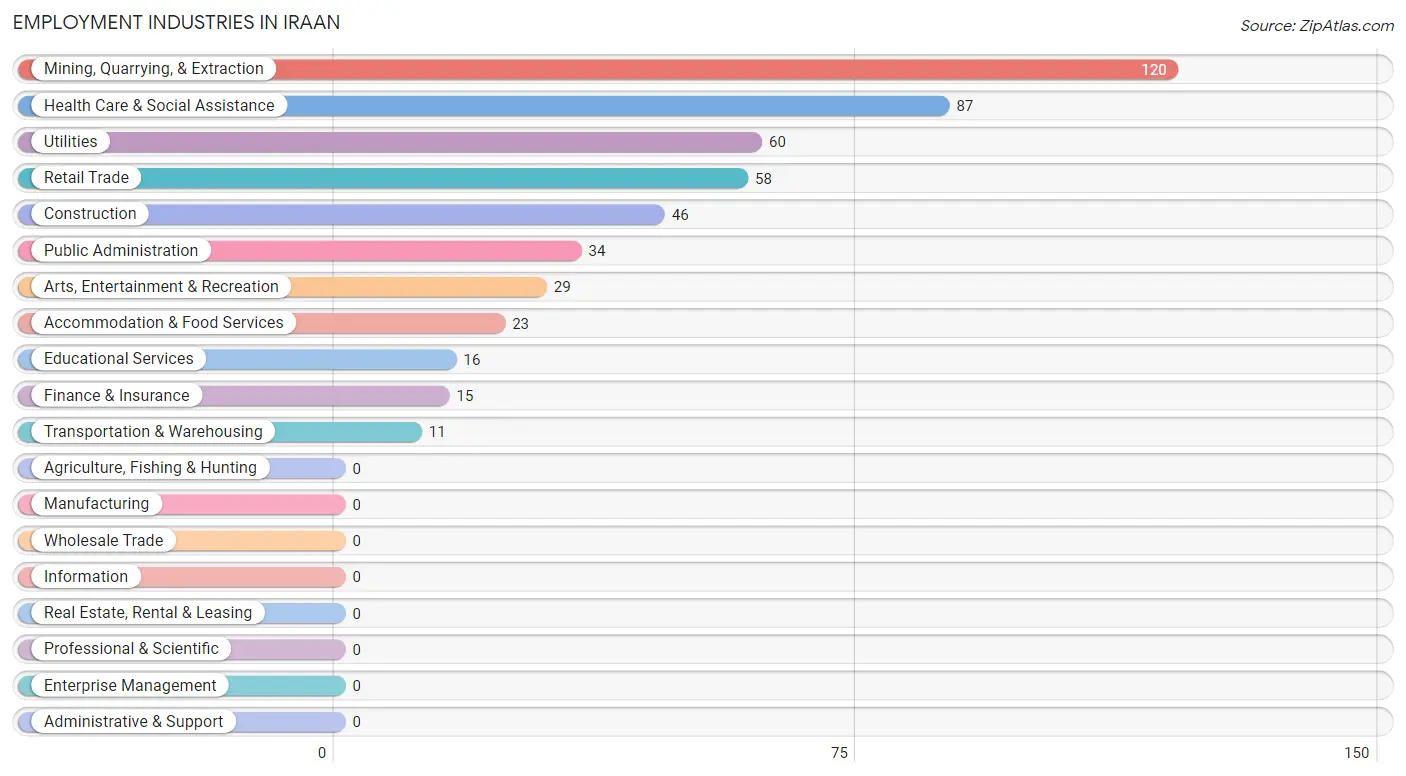
Employment Industries in Iraan
The major employment industries in Iraan include Mining, Quarrying, & Extraction (120 | 20.5%), Health Care & Social Assistance (87 | 14.9%), Utilities (60 | 10.3%), Retail Trade (58 | 9.9%), and Construction (46 | 7.9%).
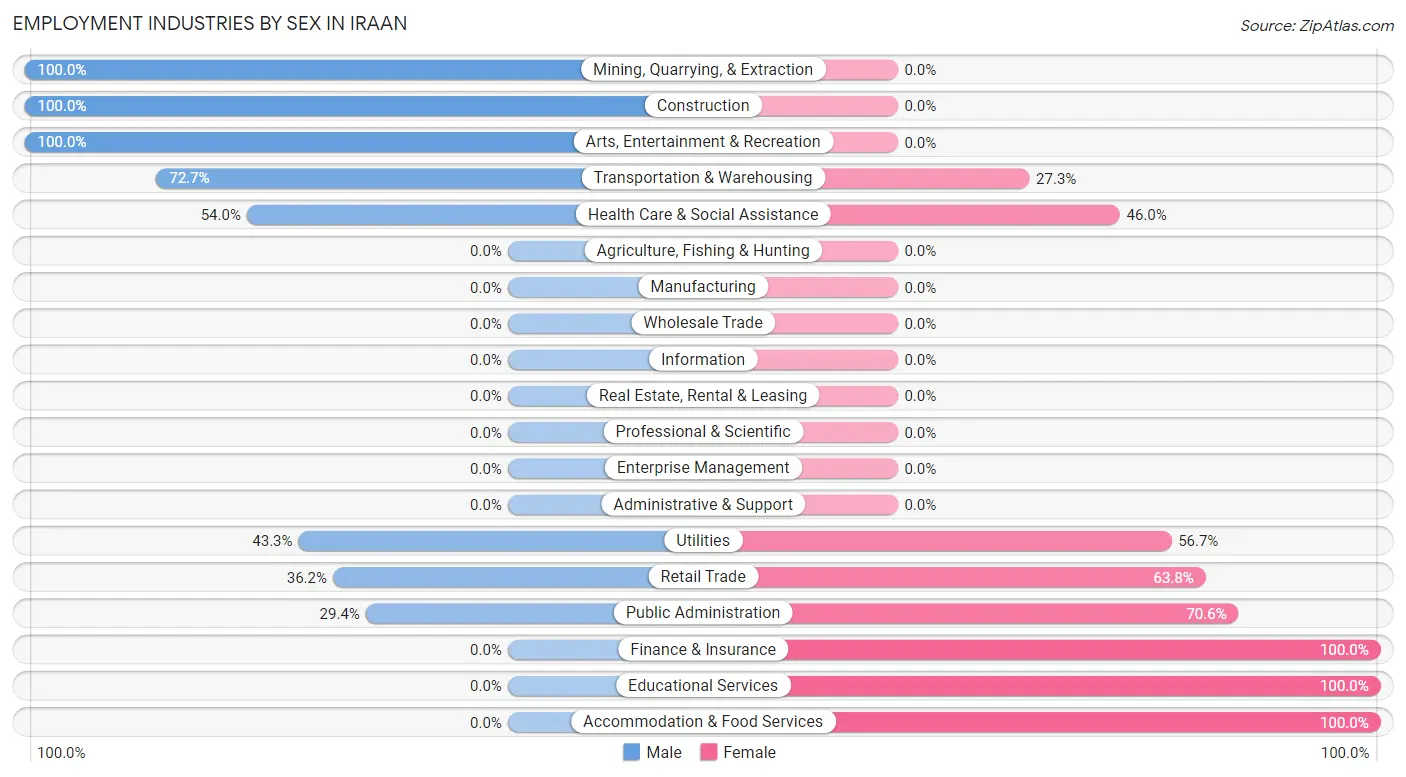
Employment Industries by Sex in Iraan
The Iraan industries that see more men than women are Mining, Quarrying, & Extraction (100.0%), Construction (100.0%), and Arts, Entertainment & Recreation (100.0%), whereas the industries that tend to have a higher number of women are Finance & Insurance (100.0%), Educational Services (100.0%), and Accommodation & Food Services (100.0%).
| Industry | Male | Female |
| Agriculture, Fishing & Hunting | 0 (0.0%) | 0 (0.0%) |
| Mining, Quarrying, & Extraction | 120 (100.0%) | 0 (0.0%) |
| Construction | 46 (100.0%) | 0 (0.0%) |
| Manufacturing | 0 (0.0%) | 0 (0.0%) |
| Wholesale Trade | 0 (0.0%) | 0 (0.0%) |
| Retail Trade | 21 (36.2%) | 37 (63.8%) |
| Transportation & Warehousing | 8 (72.7%) | 3 (27.3%) |
| Utilities | 26 (43.3%) | 34 (56.7%) |
| Information | 0 (0.0%) | 0 (0.0%) |
| Finance & Insurance | 0 (0.0%) | 15 (100.0%) |
| Real Estate, Rental & Leasing | 0 (0.0%) | 0 (0.0%) |
| Professional & Scientific | 0 (0.0%) | 0 (0.0%) |
| Enterprise Management | 0 (0.0%) | 0 (0.0%) |
| Administrative & Support | 0 (0.0%) | 0 (0.0%) |
| Educational Services | 0 (0.0%) | 16 (100.0%) |
| Health Care & Social Assistance | 47 (54.0%) | 40 (46.0%) |
| Arts, Entertainment & Recreation | 29 (100.0%) | 0 (0.0%) |
| Accommodation & Food Services | 0 (0.0%) | 23 (100.0%) |
| Public Administration | 10 (29.4%) | 24 (70.6%) |
| Total | 360 (61.6%) | 224 (38.4%) |
Education in Iraan
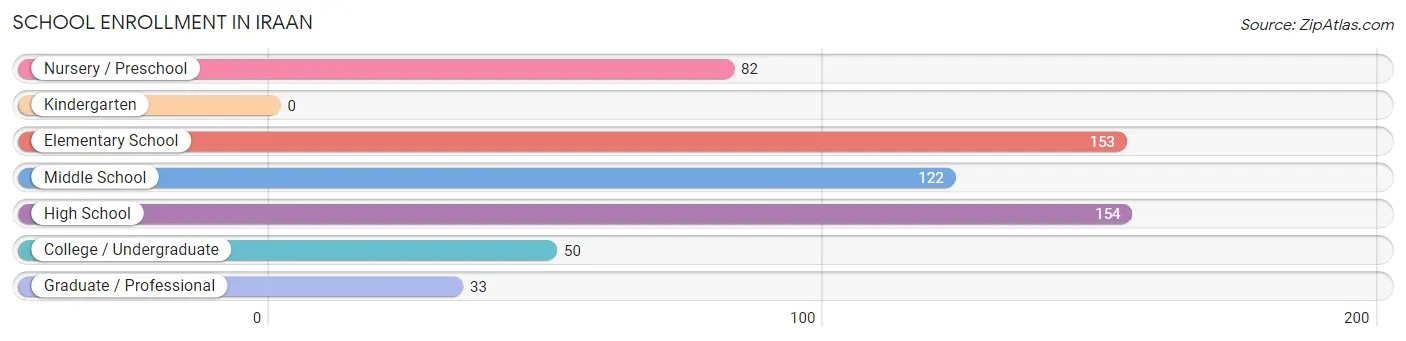
School Enrollment in Iraan
The most common levels of schooling among the 594 students in Iraan are high school (154 | 25.9%), elementary school (153 | 25.8%), and middle school (122 | 20.5%).
| School Level | # Students | % Students |
| Nursery / Preschool | 82 | 13.8% |
| Kindergarten | 0 | 0.0% |
| Elementary School | 153 | 25.8% |
| Middle School | 122 | 20.5% |
| High School | 154 | 25.9% |
| College / Undergraduate | 50 | 8.4% |
| Graduate / Professional | 33 | 5.6% |
| Total | 594 | 100.0% |
School Enrollment by Age by Funding Source in Iraan
Out of a total of 594 students who are enrolled in schools in Iraan, 5 (0.8%) attend a private institution, while the remaining 589 (99.2%) are enrolled in public schools. The age group of 5 to 9 year old has the highest likelihood of being enrolled in private schools, with 5 (3.2% in the age bracket) enrolled. Conversely, the age group of 3 to 4 year olds has the lowest likelihood of being enrolled in a private school, with 77 (100.0% in the age bracket) attending a public institution.
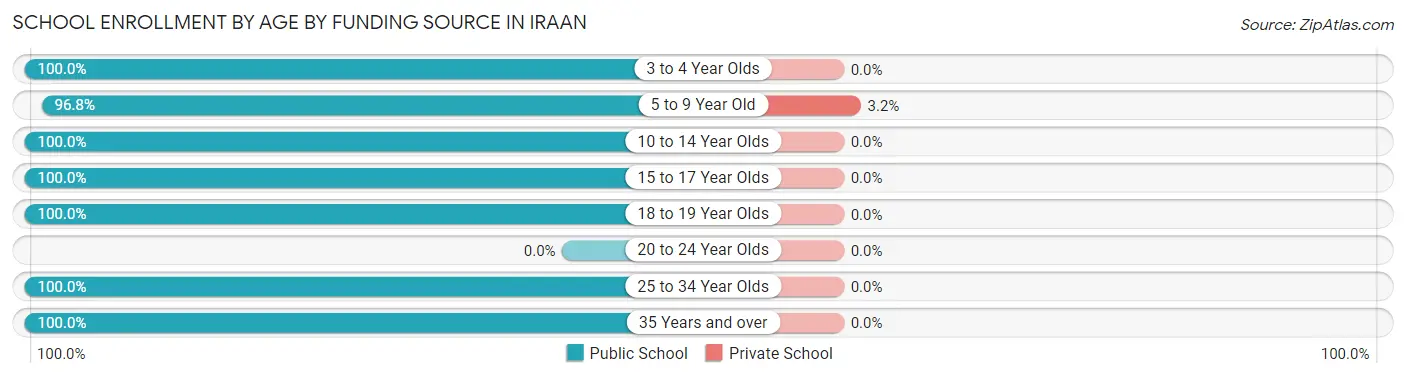
| Age Bracket | Public School | Private School |
| 3 to 4 Year Olds | 77 (100.0%) | 0 (0.0%) |
| 5 to 9 Year Old | 153 (96.8%) | 5 (3.2%) |
| 10 to 14 Year Olds | 124 (100.0%) | 0 (0.0%) |
| 15 to 17 Year Olds | 115 (100.0%) | 0 (0.0%) |
| 18 to 19 Year Olds | 57 (100.0%) | 0 (0.0%) |
| 20 to 24 Year Olds | 0 (0.0%) | 0 (0.0%) |
| 25 to 34 Year Olds | 30 (100.0%) | 0 (0.0%) |
| 35 Years and over | 33 (100.0%) | 0 (0.0%) |
| Total | 589 (99.2%) | 5 (0.8%) |
Educational Attainment by Field of Study in Iraan
Business (58 | 47.9%), science & technology (33 | 27.3%), education (16 | 13.2%), and psychology (14 | 11.6%) are the most common fields of study among 121 individuals in Iraan who have obtained a bachelor's degree or higher.
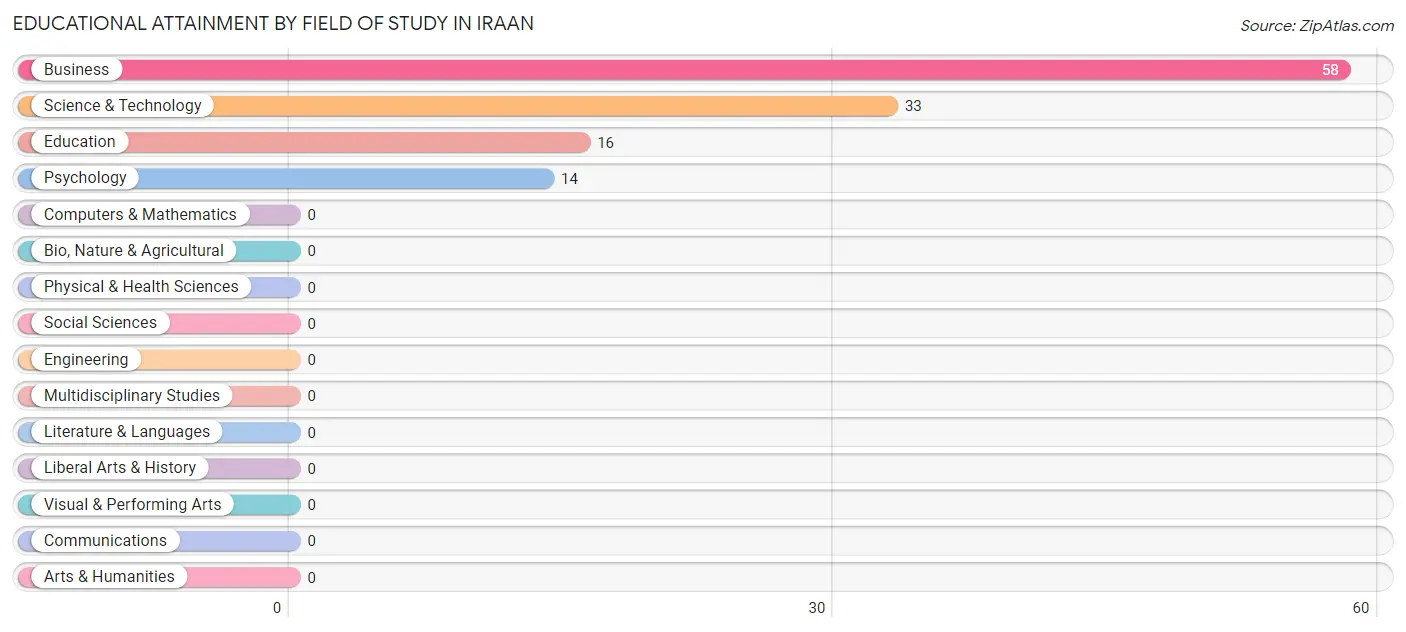
| Field of Study | # Graduates | % Graduates |
| Computers & Mathematics | 0 | 0.0% |
| Bio, Nature & Agricultural | 0 | 0.0% |
| Physical & Health Sciences | 0 | 0.0% |
| Psychology | 14 | 11.6% |
| Social Sciences | 0 | 0.0% |
| Engineering | 0 | 0.0% |
| Multidisciplinary Studies | 0 | 0.0% |
| Science & Technology | 33 | 27.3% |
| Business | 58 | 47.9% |
| Education | 16 | 13.2% |
| Literature & Languages | 0 | 0.0% |
| Liberal Arts & History | 0 | 0.0% |
| Visual & Performing Arts | 0 | 0.0% |
| Communications | 0 | 0.0% |
| Arts & Humanities | 0 | 0.0% |
| Total | 121 | 100.0% |
Transportation & Commute in Iraan
Vehicle Availability by Sex in Iraan
The most prevalent vehicle ownership categories in Iraan are males with 2 vehicles (207, accounting for 55.9%) and females with 2 vehicles (81, making up 92.4%).
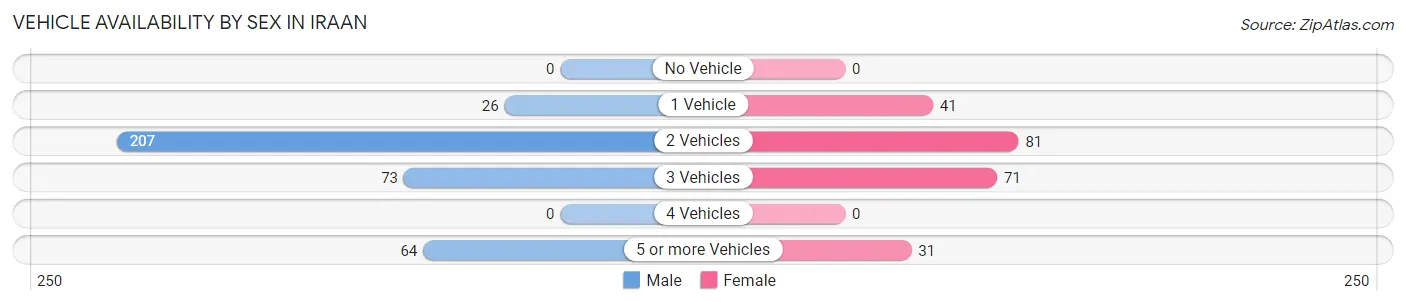
| Vehicles Available | Male | Female |
| No Vehicle | 0 (0.0%) | 0 (0.0%) |
| 1 Vehicle | 26 (7.0%) | 41 (18.3%) |
| 2 Vehicles | 207 (55.9%) | 81 (36.2%) |
| 3 Vehicles | 73 (19.7%) | 71 (31.7%) |
| 4 Vehicles | 0 (0.0%) | 0 (0.0%) |
| 5 or more Vehicles | 64 (17.3%) | 31 (13.8%) |
| Total | 370 (100.0%) | 224 (100.0%) |
Commute Time in Iraan
The most frequently occuring commute durations in Iraan are 5 to 9 minutes (215 commuters, 36.7%), less than 5 minutes (203 commuters, 34.6%), and 30 to 34 minutes (57 commuters, 9.7%).
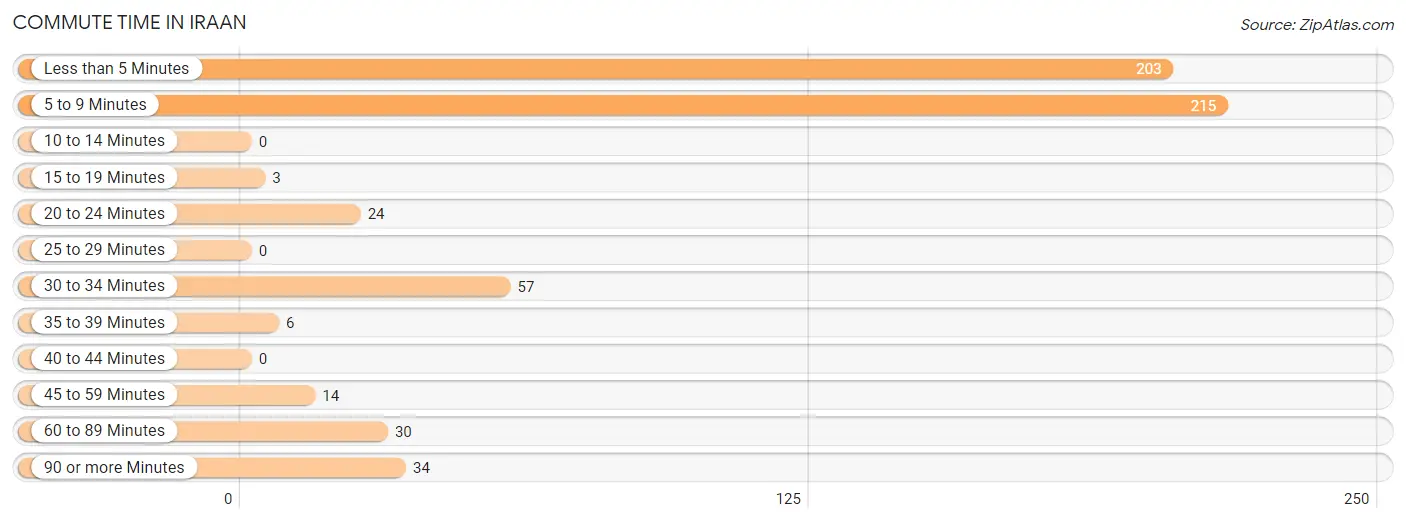
| Commute Time | # Commuters | % Commuters |
| Less than 5 Minutes | 203 | 34.6% |
| 5 to 9 Minutes | 215 | 36.7% |
| 10 to 14 Minutes | 0 | 0.0% |
| 15 to 19 Minutes | 3 | 0.5% |
| 20 to 24 Minutes | 24 | 4.1% |
| 25 to 29 Minutes | 0 | 0.0% |
| 30 to 34 Minutes | 57 | 9.7% |
| 35 to 39 Minutes | 6 | 1.0% |
| 40 to 44 Minutes | 0 | 0.0% |
| 45 to 59 Minutes | 14 | 2.4% |
| 60 to 89 Minutes | 30 | 5.1% |
| 90 or more Minutes | 34 | 5.8% |
Commute Time by Sex in Iraan
The most common commute times in Iraan are 5 to 9 minutes (175 commuters, 47.3%) for males and less than 5 minutes (99 commuters, 45.8%) for females.
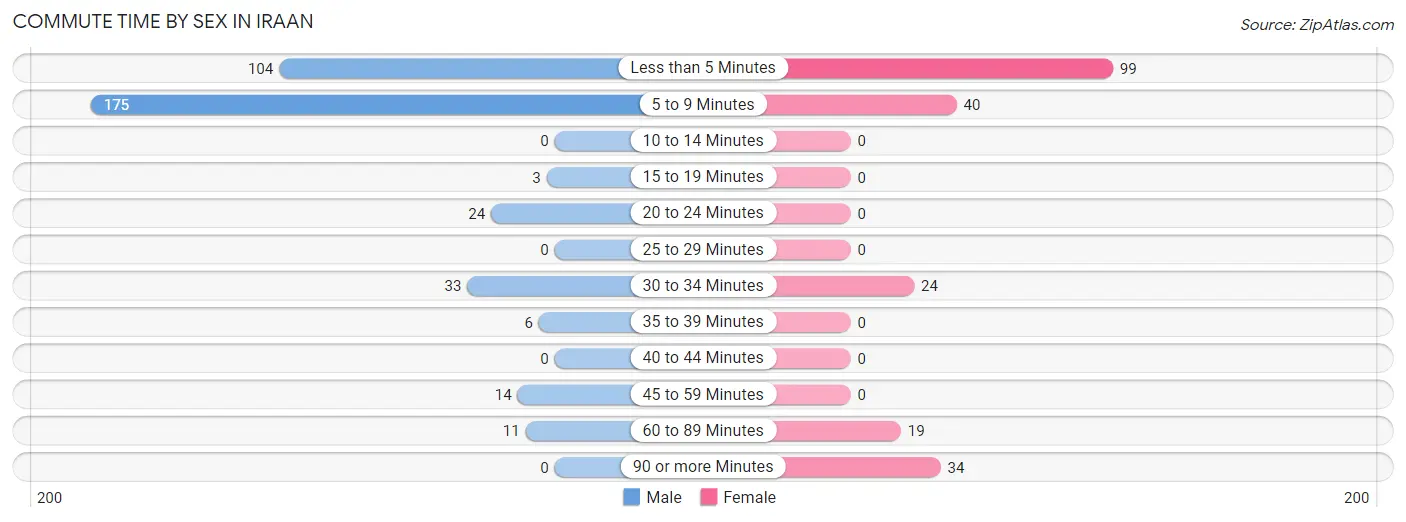
| Commute Time | Male | Female |
| Less than 5 Minutes | 104 (28.1%) | 99 (45.8%) |
| 5 to 9 Minutes | 175 (47.3%) | 40 (18.5%) |
| 10 to 14 Minutes | 0 (0.0%) | 0 (0.0%) |
| 15 to 19 Minutes | 3 (0.8%) | 0 (0.0%) |
| 20 to 24 Minutes | 24 (6.5%) | 0 (0.0%) |
| 25 to 29 Minutes | 0 (0.0%) | 0 (0.0%) |
| 30 to 34 Minutes | 33 (8.9%) | 24 (11.1%) |
| 35 to 39 Minutes | 6 (1.6%) | 0 (0.0%) |
| 40 to 44 Minutes | 0 (0.0%) | 0 (0.0%) |
| 45 to 59 Minutes | 14 (3.8%) | 0 (0.0%) |
| 60 to 89 Minutes | 11 (3.0%) | 19 (8.8%) |
| 90 or more Minutes | 0 (0.0%) | 34 (15.7%) |
Time of Departure to Work by Sex in Iraan
The most frequent times of departure to work in Iraan are 6:30 AM to 6:59 AM (113, 30.5%) for males and 6:00 AM to 6:29 AM (84, 38.9%) for females.
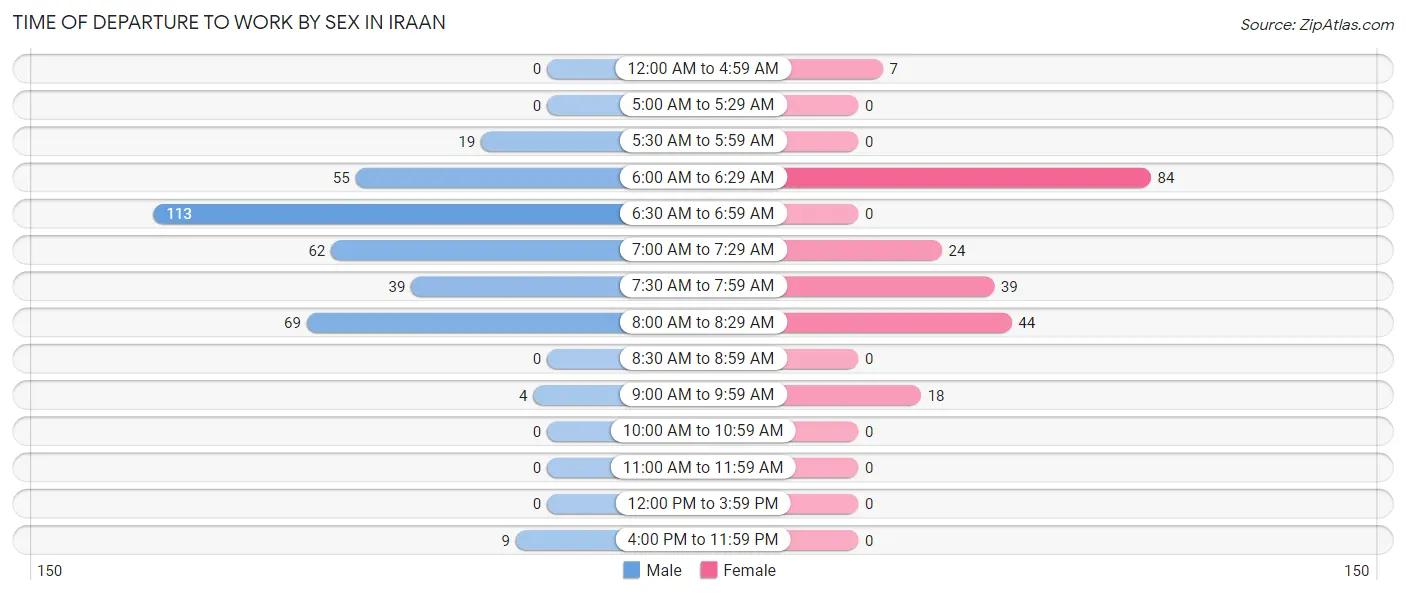
| Time of Departure | Male | Female |
| 12:00 AM to 4:59 AM | 0 (0.0%) | 7 (3.2%) |
| 5:00 AM to 5:29 AM | 0 (0.0%) | 0 (0.0%) |
| 5:30 AM to 5:59 AM | 19 (5.1%) | 0 (0.0%) |
| 6:00 AM to 6:29 AM | 55 (14.9%) | 84 (38.9%) |
| 6:30 AM to 6:59 AM | 113 (30.5%) | 0 (0.0%) |
| 7:00 AM to 7:29 AM | 62 (16.8%) | 24 (11.1%) |
| 7:30 AM to 7:59 AM | 39 (10.5%) | 39 (18.1%) |
| 8:00 AM to 8:29 AM | 69 (18.6%) | 44 (20.4%) |
| 8:30 AM to 8:59 AM | 0 (0.0%) | 0 (0.0%) |
| 9:00 AM to 9:59 AM | 4 (1.1%) | 18 (8.3%) |
| 10:00 AM to 10:59 AM | 0 (0.0%) | 0 (0.0%) |
| 11:00 AM to 11:59 AM | 0 (0.0%) | 0 (0.0%) |
| 12:00 PM to 3:59 PM | 0 (0.0%) | 0 (0.0%) |
| 4:00 PM to 11:59 PM | 9 (2.4%) | 0 (0.0%) |
| Total | 370 (100.0%) | 216 (100.0%) |
Housing Occupancy in Iraan
Occupancy by Ownership in Iraan
Of the total 480 dwellings in Iraan, owner-occupied units account for 308 (64.2%), while renter-occupied units make up 172 (35.8%).
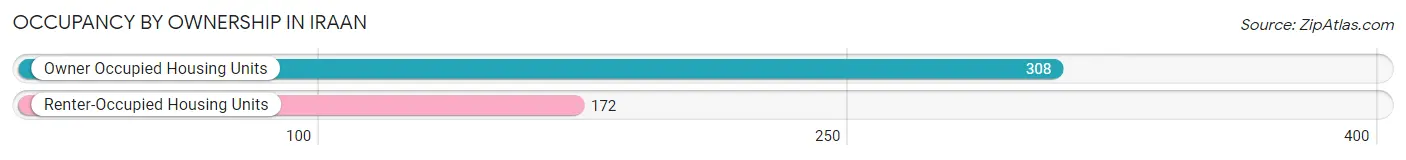
| Occupancy | # Housing Units | % Housing Units |
| Owner Occupied Housing Units | 308 | 64.2% |
| Renter-Occupied Housing Units | 172 | 35.8% |
| Total Occupied Housing Units | 480 | 100.0% |
Occupancy by Household Size in Iraan
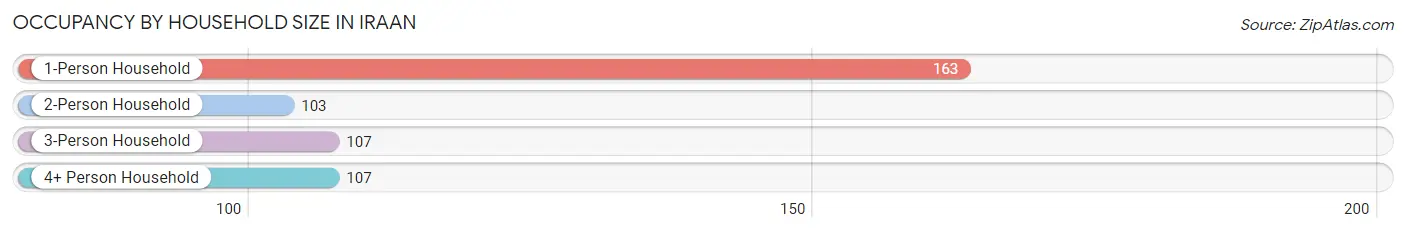
| Household Size | # Housing Units | % Housing Units |
| 1-Person Household | 163 | 34.0% |
| 2-Person Household | 103 | 21.5% |
| 3-Person Household | 107 | 22.3% |
| 4+ Person Household | 107 | 22.3% |
| Total Housing Units | 480 | 100.0% |
Occupancy by Ownership by Household Size in Iraan
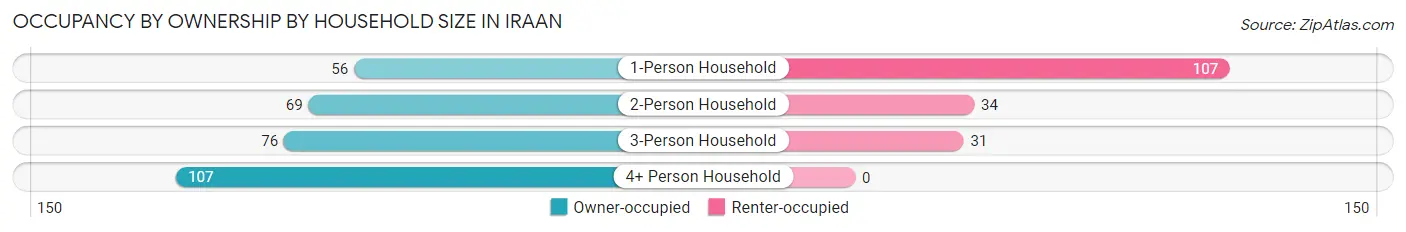
| Household Size | Owner-occupied | Renter-occupied |
| 1-Person Household | 56 (34.4%) | 107 (65.6%) |
| 2-Person Household | 69 (67.0%) | 34 (33.0%) |
| 3-Person Household | 76 (71.0%) | 31 (29.0%) |
| 4+ Person Household | 107 (100.0%) | 0 (0.0%) |
| Total Housing Units | 308 (64.2%) | 172 (35.8%) |
Occupancy by Educational Attainment in Iraan
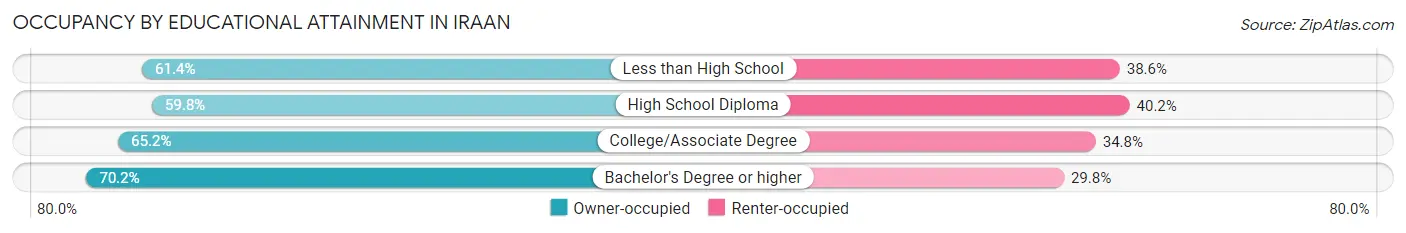
| Household Size | Owner-occupied | Renter-occupied |
| Less than High School | 27 (61.4%) | 17 (38.6%) |
| High School Diploma | 61 (59.8%) | 41 (40.2%) |
| College/Associate Degree | 187 (65.2%) | 100 (34.8%) |
| Bachelor's Degree or higher | 33 (70.2%) | 14 (29.8%) |
Occupancy by Age of Householder in Iraan
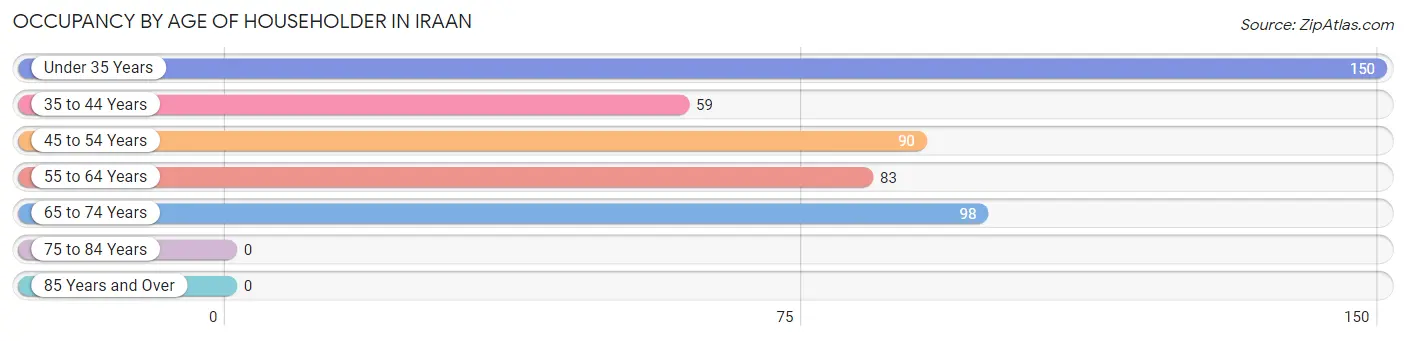
| Age Bracket | # Households | % Households |
| Under 35 Years | 150 | 31.2% |
| 35 to 44 Years | 59 | 12.3% |
| 45 to 54 Years | 90 | 18.8% |
| 55 to 64 Years | 83 | 17.3% |
| 65 to 74 Years | 98 | 20.4% |
| 75 to 84 Years | 0 | 0.0% |
| 85 Years and Over | 0 | 0.0% |
| Total | 480 | 100.0% |
Housing Finances in Iraan
Median Income by Occupancy in Iraan
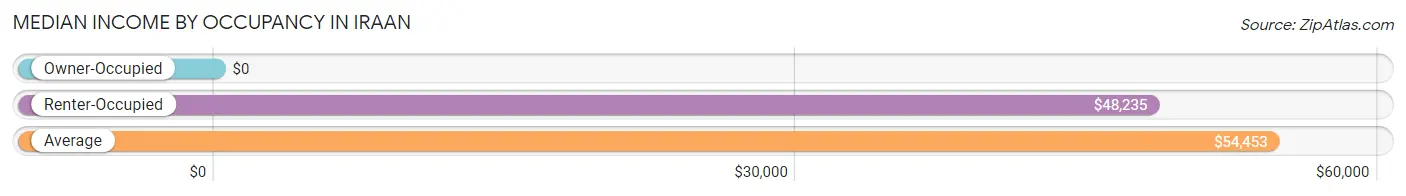
| Occupancy Type | # Households | Median Income |
| Owner-Occupied | 308 (64.2%) | $0 |
| Renter-Occupied | 172 (35.8%) | $48,235 |
| Average | 480 (100.0%) | $54,453 |
Occupancy by Householder Income Bracket in Iraan
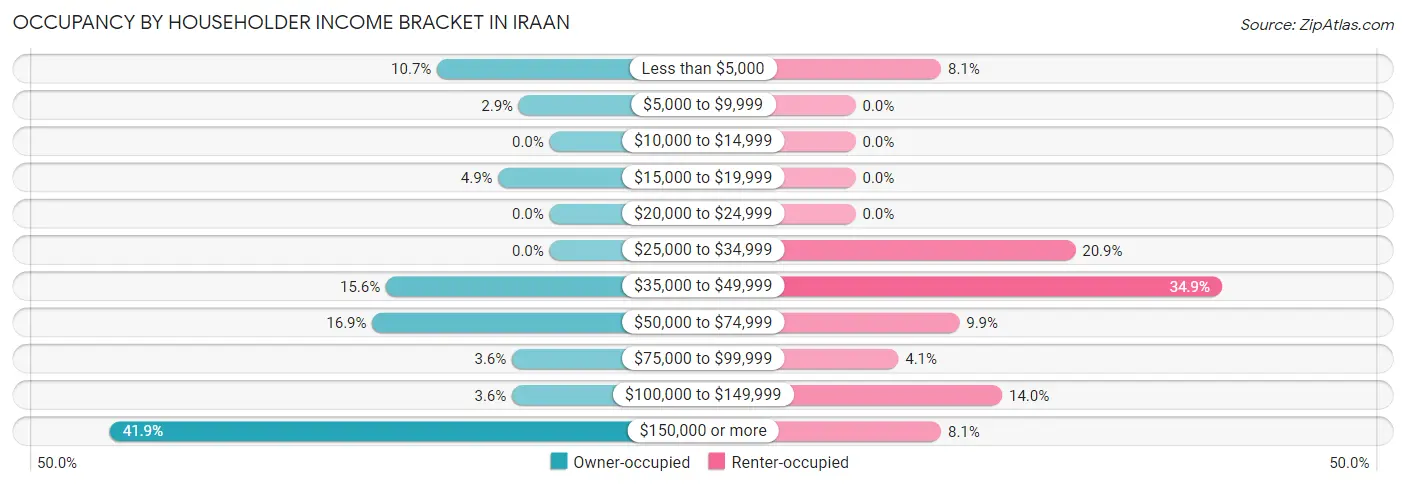
| Income Bracket | Owner-occupied | Renter-occupied |
| Less than $5,000 | 33 (10.7%) | 14 (8.1%) |
| $5,000 to $9,999 | 9 (2.9%) | 0 (0.0%) |
| $10,000 to $14,999 | 0 (0.0%) | 0 (0.0%) |
| $15,000 to $19,999 | 15 (4.9%) | 0 (0.0%) |
| $20,000 to $24,999 | 0 (0.0%) | 0 (0.0%) |
| $25,000 to $34,999 | 0 (0.0%) | 36 (20.9%) |
| $35,000 to $49,999 | 48 (15.6%) | 60 (34.9%) |
| $50,000 to $74,999 | 52 (16.9%) | 17 (9.9%) |
| $75,000 to $99,999 | 11 (3.6%) | 7 (4.1%) |
| $100,000 to $149,999 | 11 (3.6%) | 24 (14.0%) |
| $150,000 or more | 129 (41.9%) | 14 (8.1%) |
| Total | 308 (100.0%) | 172 (100.0%) |
Monthly Housing Cost Tiers in Iraan
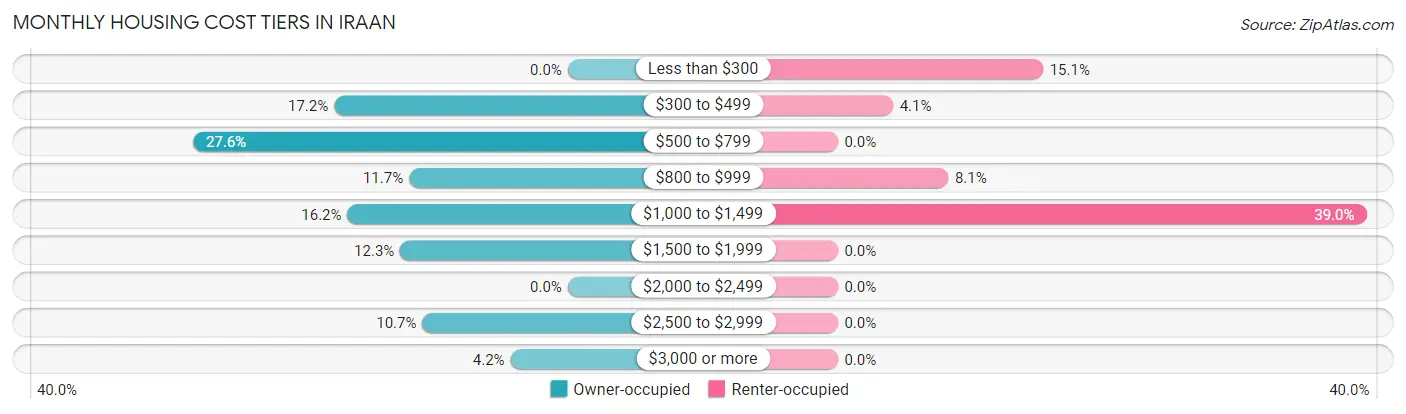
| Monthly Cost | Owner-occupied | Renter-occupied |
| Less than $300 | 0 (0.0%) | 26 (15.1%) |
| $300 to $499 | 53 (17.2%) | 7 (4.1%) |
| $500 to $799 | 85 (27.6%) | 0 (0.0%) |
| $800 to $999 | 36 (11.7%) | 14 (8.1%) |
| $1,000 to $1,499 | 50 (16.2%) | 67 (39.0%) |
| $1,500 to $1,999 | 38 (12.3%) | 0 (0.0%) |
| $2,000 to $2,499 | 0 (0.0%) | 0 (0.0%) |
| $2,500 to $2,999 | 33 (10.7%) | 0 (0.0%) |
| $3,000 or more | 13 (4.2%) | 0 (0.0%) |
| Total | 308 (100.0%) | 172 (100.0%) |
Physical Housing Characteristics in Iraan
Housing Structures in Iraan
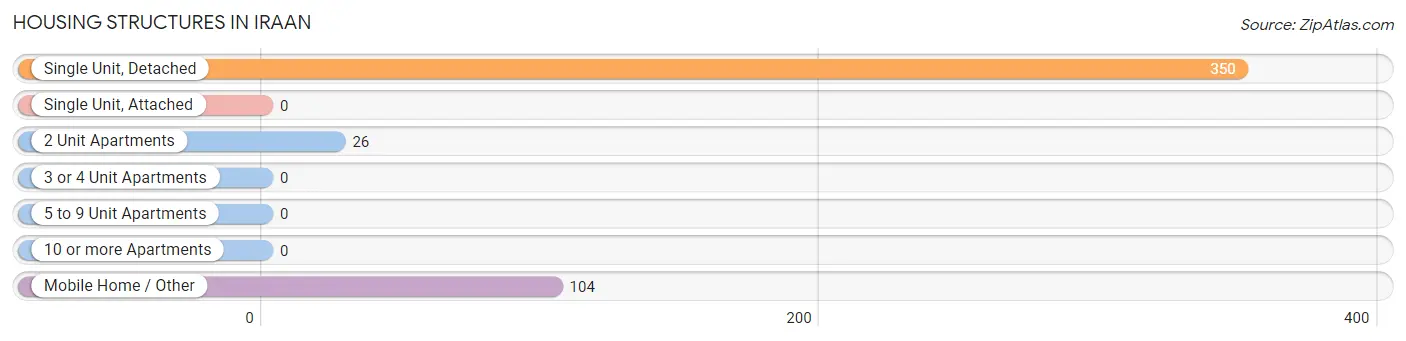
| Structure Type | # Housing Units | % Housing Units |
| Single Unit, Detached | 350 | 72.9% |
| Single Unit, Attached | 0 | 0.0% |
| 2 Unit Apartments | 26 | 5.4% |
| 3 or 4 Unit Apartments | 0 | 0.0% |
| 5 to 9 Unit Apartments | 0 | 0.0% |
| 10 or more Apartments | 0 | 0.0% |
| Mobile Home / Other | 104 | 21.7% |
| Total | 480 | 100.0% |
Housing Structures by Occupancy in Iraan
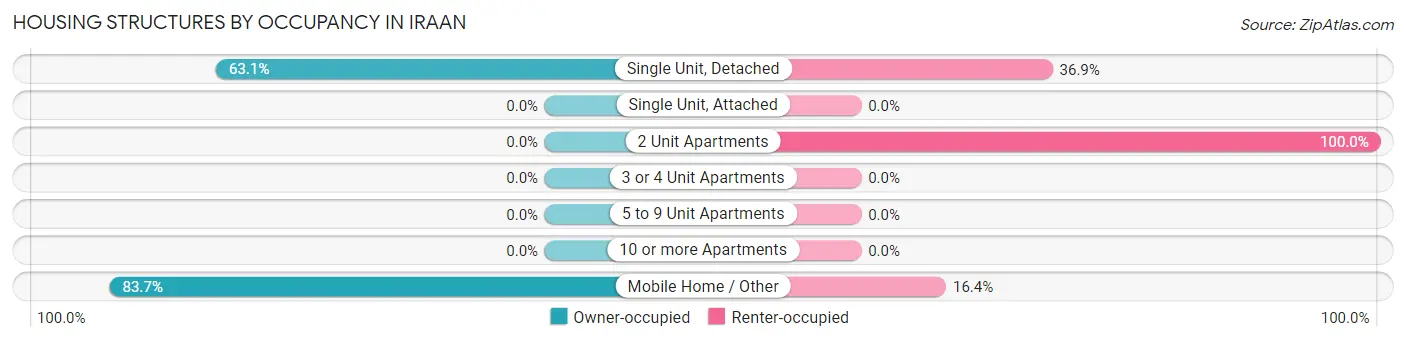
| Structure Type | Owner-occupied | Renter-occupied |
| Single Unit, Detached | 221 (63.1%) | 129 (36.9%) |
| Single Unit, Attached | 0 (0.0%) | 0 (0.0%) |
| 2 Unit Apartments | 0 (0.0%) | 26 (100.0%) |
| 3 or 4 Unit Apartments | 0 (0.0%) | 0 (0.0%) |
| 5 to 9 Unit Apartments | 0 (0.0%) | 0 (0.0%) |
| 10 or more Apartments | 0 (0.0%) | 0 (0.0%) |
| Mobile Home / Other | 87 (83.7%) | 17 (16.4%) |
| Total | 308 (64.2%) | 172 (35.8%) |
Housing Structures by Number of Rooms in Iraan
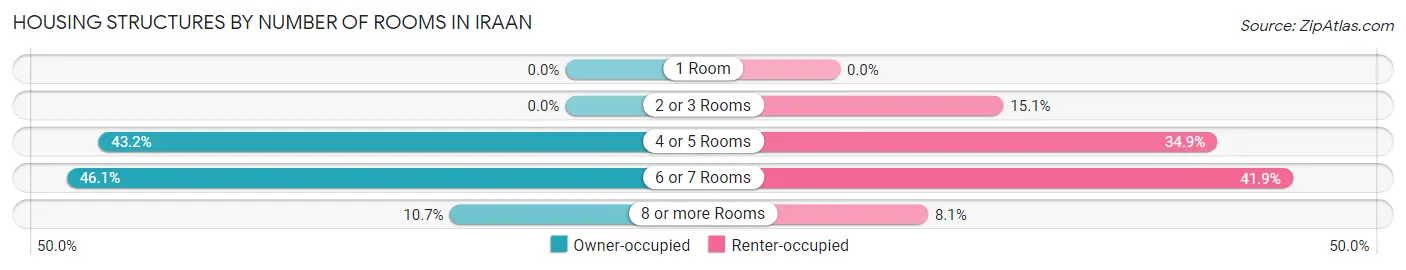
| Number of Rooms | Owner-occupied | Renter-occupied |
| 1 Room | 0 (0.0%) | 0 (0.0%) |
| 2 or 3 Rooms | 0 (0.0%) | 26 (15.1%) |
| 4 or 5 Rooms | 133 (43.2%) | 60 (34.9%) |
| 6 or 7 Rooms | 142 (46.1%) | 72 (41.9%) |
| 8 or more Rooms | 33 (10.7%) | 14 (8.1%) |
| Total | 308 (100.0%) | 172 (100.0%) |
Housing Structure by Heating Type in Iraan
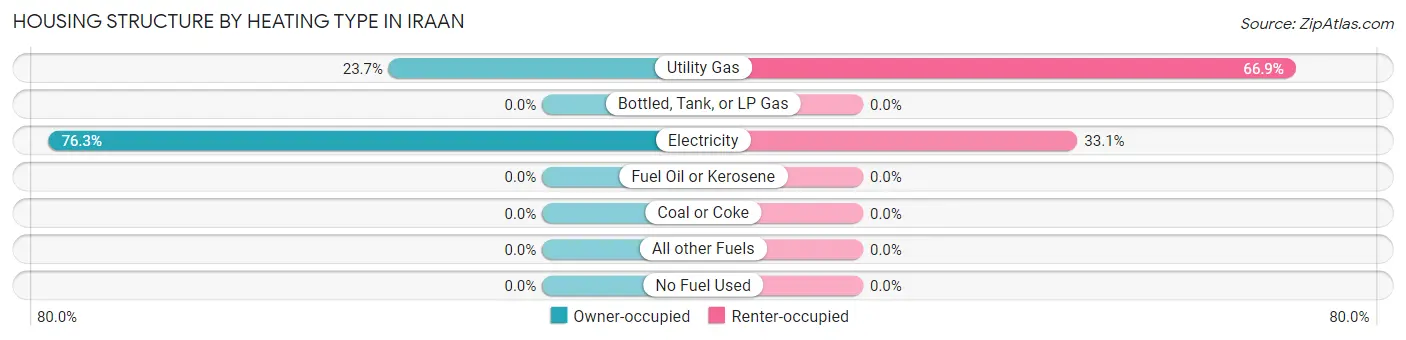
| Heating Type | Owner-occupied | Renter-occupied |
| Utility Gas | 73 (23.7%) | 115 (66.9%) |
| Bottled, Tank, or LP Gas | 0 (0.0%) | 0 (0.0%) |
| Electricity | 235 (76.3%) | 57 (33.1%) |
| Fuel Oil or Kerosene | 0 (0.0%) | 0 (0.0%) |
| Coal or Coke | 0 (0.0%) | 0 (0.0%) |
| All other Fuels | 0 (0.0%) | 0 (0.0%) |
| No Fuel Used | 0 (0.0%) | 0 (0.0%) |
| Total | 308 (100.0%) | 172 (100.0%) |
Household Vehicle Usage in Iraan
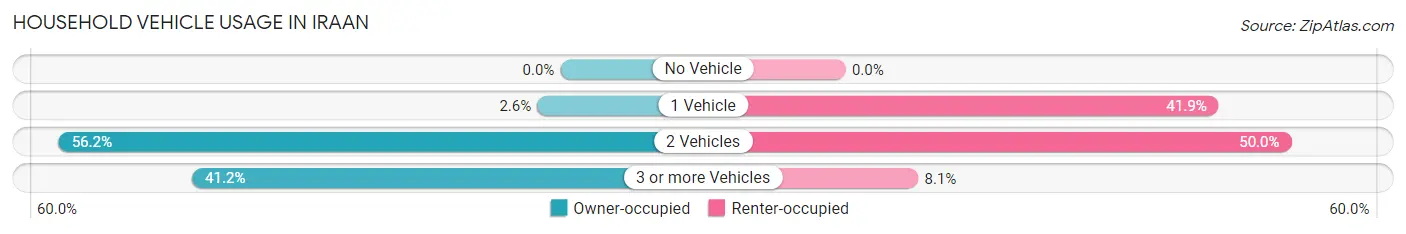
| Vehicles per Household | Owner-occupied | Renter-occupied |
| No Vehicle | 0 (0.0%) | 0 (0.0%) |
| 1 Vehicle | 8 (2.6%) | 72 (41.9%) |
| 2 Vehicles | 173 (56.2%) | 86 (50.0%) |
| 3 or more Vehicles | 127 (41.2%) | 14 (8.1%) |
| Total | 308 (100.0%) | 172 (100.0%) |
Real Estate & Mortgages in Iraan
Real Estate and Mortgage Overview in Iraan
| Characteristic | Without Mortgage | With Mortgage |
| Housing Units | 167 | 141 |
| Median Property Value | $147,100 | $182,700 |
| Median Household Income | $53,008 | $83 |
| Monthly Housing Costs | $674 | $13 |
| Real Estate Taxes | $1,192 | $15 |
Property Value by Mortgage Status in Iraan
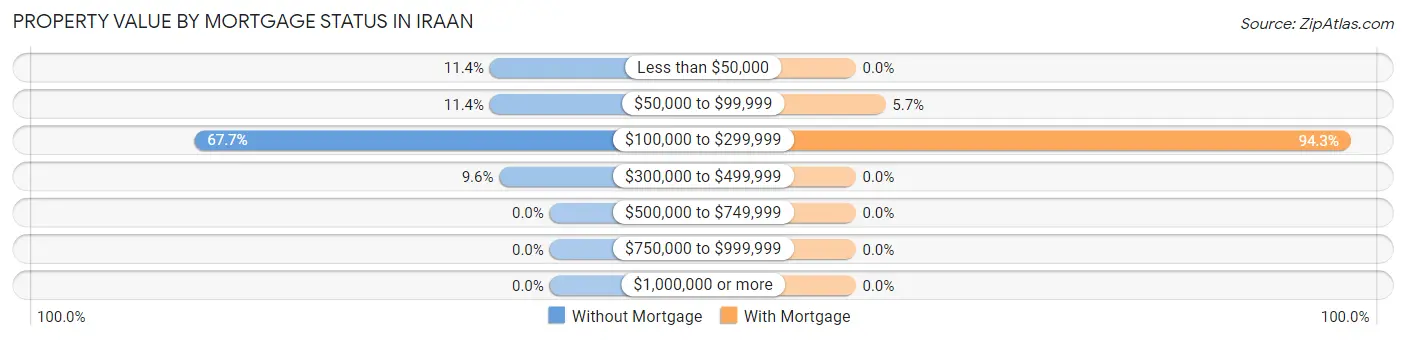
| Property Value | Without Mortgage | With Mortgage |
| Less than $50,000 | 19 (11.4%) | 0 (0.0%) |
| $50,000 to $99,999 | 19 (11.4%) | 8 (5.7%) |
| $100,000 to $299,999 | 113 (67.7%) | 133 (94.3%) |
| $300,000 to $499,999 | 16 (9.6%) | 0 (0.0%) |
| $500,000 to $749,999 | 0 (0.0%) | 0 (0.0%) |
| $750,000 to $999,999 | 0 (0.0%) | 0 (0.0%) |
| $1,000,000 or more | 0 (0.0%) | 0 (0.0%) |
| Total | 167 (100.0%) | 141 (100.0%) |
Household Income by Mortgage Status in Iraan
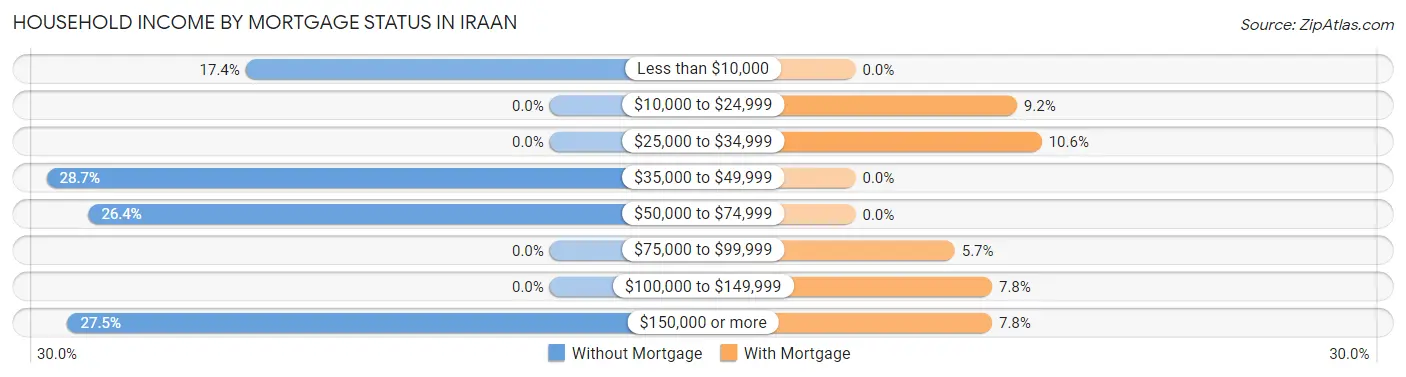
| Household Income | Without Mortgage | With Mortgage |
| Less than $10,000 | 29 (17.4%) | 0 (0.0%) |
| $10,000 to $24,999 | 0 (0.0%) | 13 (9.2%) |
| $25,000 to $34,999 | 0 (0.0%) | 15 (10.6%) |
| $35,000 to $49,999 | 48 (28.7%) | 0 (0.0%) |
| $50,000 to $74,999 | 44 (26.4%) | 0 (0.0%) |
| $75,000 to $99,999 | 0 (0.0%) | 8 (5.7%) |
| $100,000 to $149,999 | 0 (0.0%) | 11 (7.8%) |
| $150,000 or more | 46 (27.5%) | 11 (7.8%) |
| Total | 167 (100.0%) | 141 (100.0%) |
Property Value to Household Income Ratio in Iraan
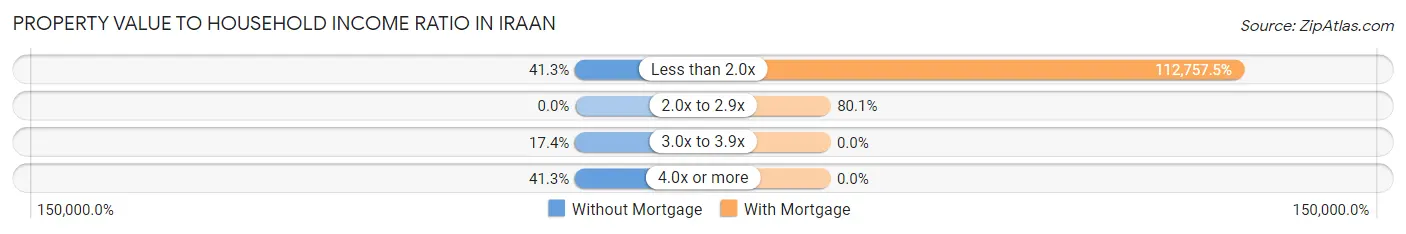
| Value-to-Income Ratio | Without Mortgage | With Mortgage |
| Less than 2.0x | 69 (41.3%) | 158,988 (112,757.4%) |
| 2.0x to 2.9x | 0 (0.0%) | 113 (80.1%) |
| 3.0x to 3.9x | 29 (17.4%) | 0 (0.0%) |
| 4.0x or more | 69 (41.3%) | 0 (0.0%) |
| Total | 167 (100.0%) | 141 (100.0%) |
Real Estate Taxes by Mortgage Status in Iraan
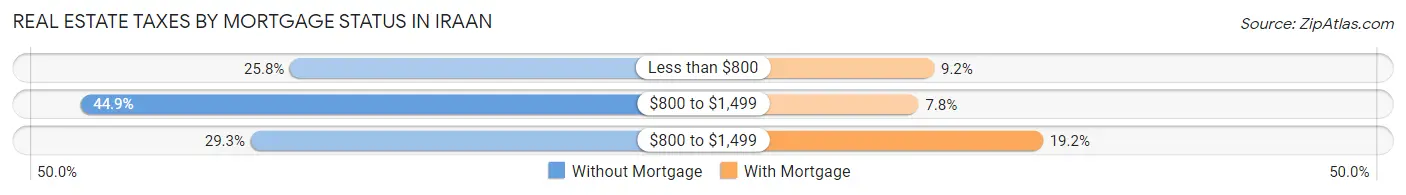
| Property Taxes | Without Mortgage | With Mortgage |
| Less than $800 | 43 (25.8%) | 13 (9.2%) |
| $800 to $1,499 | 75 (44.9%) | 11 (7.8%) |
| $800 to $1,499 | 49 (29.3%) | 27 (19.2%) |
| Total | 167 (100.0%) | 141 (100.0%) |
Health & Disability in Iraan
Health Insurance Coverage by Age in Iraan
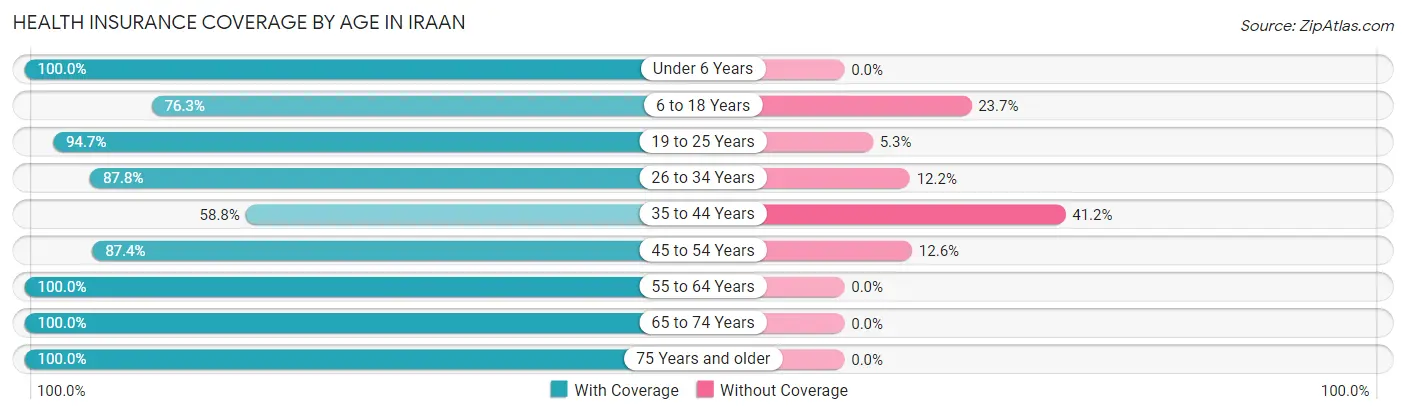
| Age Bracket | With Coverage | Without Coverage |
| Under 6 Years | 199 (100.0%) | 0 (0.0%) |
| 6 to 18 Years | 358 (76.3%) | 111 (23.7%) |
| 19 to 25 Years | 125 (94.7%) | 7 (5.3%) |
| 26 to 34 Years | 144 (87.8%) | 20 (12.2%) |
| 35 to 44 Years | 97 (58.8%) | 68 (41.2%) |
| 45 to 54 Years | 104 (87.4%) | 15 (12.6%) |
| 55 to 64 Years | 153 (100.0%) | 0 (0.0%) |
| 65 to 74 Years | 166 (100.0%) | 0 (0.0%) |
| 75 Years and older | 8 (100.0%) | 0 (0.0%) |
| Total | 1,354 (86.0%) | 221 (14.0%) |
Health Insurance Coverage by Citizenship Status in Iraan
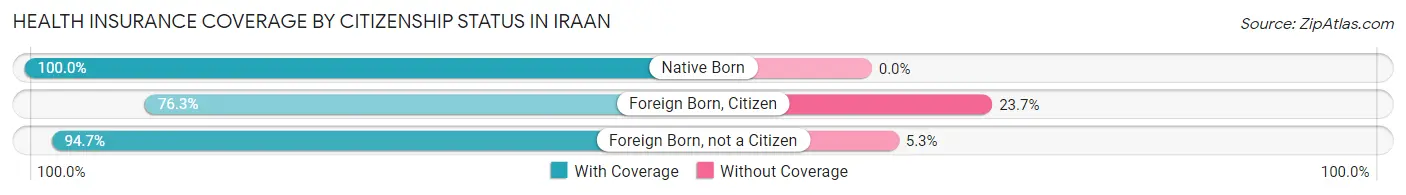
| Citizenship Status | With Coverage | Without Coverage |
| Native Born | 199 (100.0%) | 0 (0.0%) |
| Foreign Born, Citizen | 358 (76.3%) | 111 (23.7%) |
| Foreign Born, not a Citizen | 125 (94.7%) | 7 (5.3%) |
Health Insurance Coverage by Household Income in Iraan
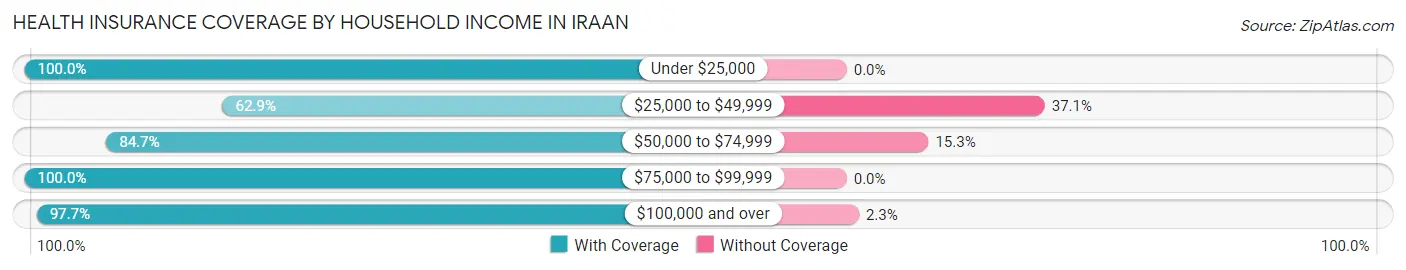
| Household Income | With Coverage | Without Coverage |
| Under $25,000 | 196 (100.0%) | 0 (0.0%) |
| $25,000 to $49,999 | 295 (62.9%) | 174 (37.1%) |
| $50,000 to $74,999 | 177 (84.7%) | 32 (15.3%) |
| $75,000 to $99,999 | 44 (100.0%) | 0 (0.0%) |
| $100,000 and over | 642 (97.7%) | 15 (2.3%) |
Public vs Private Health Insurance Coverage by Age in Iraan
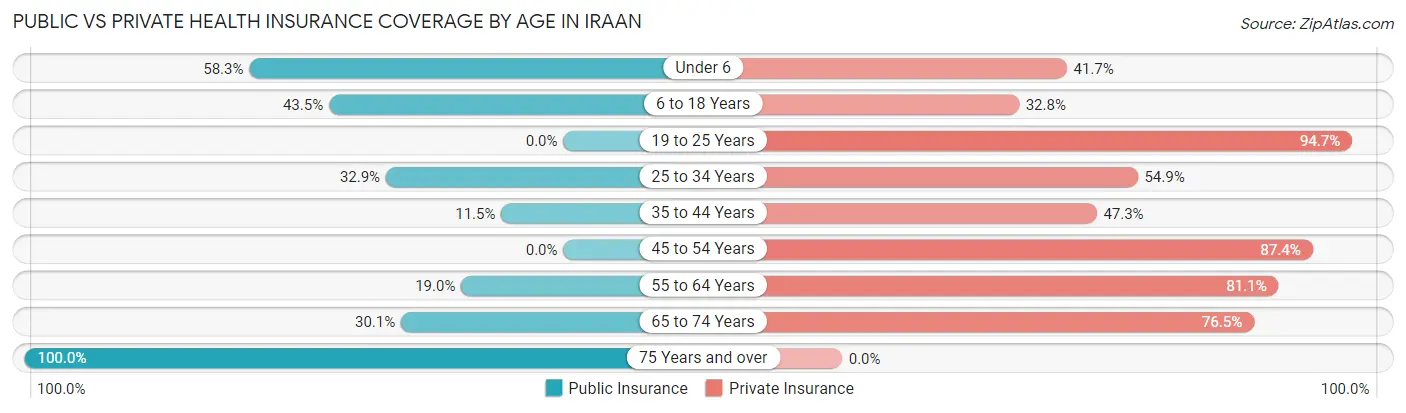
| Age Bracket | Public Insurance | Private Insurance |
| Under 6 | 116 (58.3%) | 83 (41.7%) |
| 6 to 18 Years | 204 (43.5%) | 154 (32.8%) |
| 19 to 25 Years | 0 (0.0%) | 125 (94.7%) |
| 25 to 34 Years | 54 (32.9%) | 90 (54.9%) |
| 35 to 44 Years | 19 (11.5%) | 78 (47.3%) |
| 45 to 54 Years | 0 (0.0%) | 104 (87.4%) |
| 55 to 64 Years | 29 (19.0%) | 124 (81.0%) |
| 65 to 74 Years | 50 (30.1%) | 127 (76.5%) |
| 75 Years and over | 8 (100.0%) | 0 (0.0%) |
| Total | 480 (30.5%) | 885 (56.2%) |
Disability Status by Sex by Age in Iraan
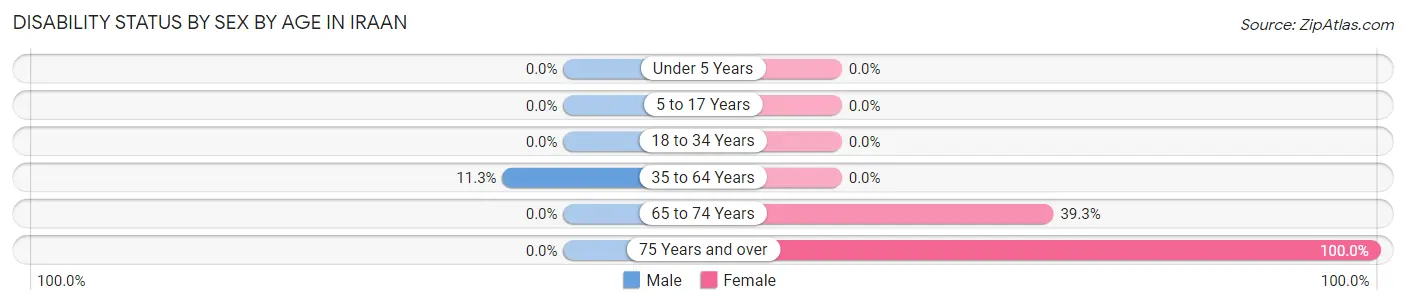
| Age Bracket | Male | Female |
| Under 5 Years | 0 (0.0%) | 0 (0.0%) |
| 5 to 17 Years | 0 (0.0%) | 0 (0.0%) |
| 18 to 34 Years | 0 (0.0%) | 0 (0.0%) |
| 35 to 64 Years | 19 (11.3%) | 0 (0.0%) |
| 65 to 74 Years | 0 (0.0%) | 22 (39.3%) |
| 75 Years and over | 0 (0.0%) | 8 (100.0%) |
Disability Class by Sex by Age in Iraan
Disability Class: Hearing Difficulty
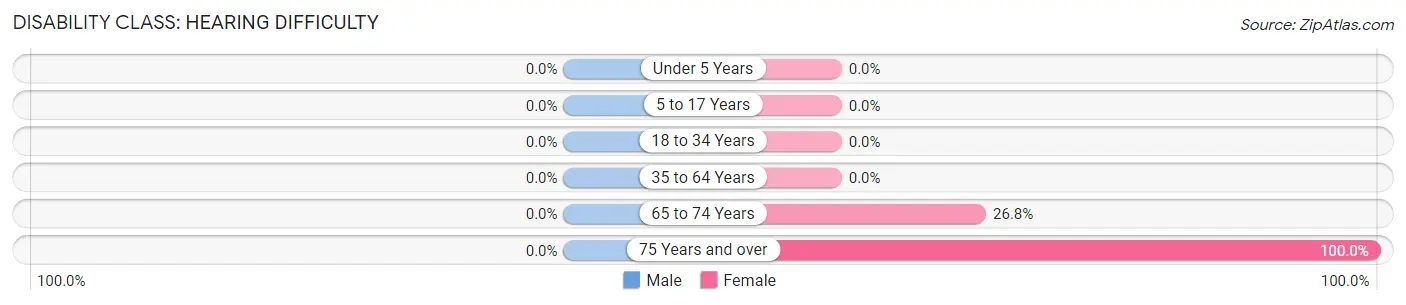
| Age Bracket | Male | Female |
| Under 5 Years | 0 (0.0%) | 0 (0.0%) |
| 5 to 17 Years | 0 (0.0%) | 0 (0.0%) |
| 18 to 34 Years | 0 (0.0%) | 0 (0.0%) |
| 35 to 64 Years | 0 (0.0%) | 0 (0.0%) |
| 65 to 74 Years | 0 (0.0%) | 15 (26.8%) |
| 75 Years and over | 0 (0.0%) | 8 (100.0%) |
Disability Class: Vision Difficulty

| Age Bracket | Male | Female |
| Under 5 Years | 0 (0.0%) | 0 (0.0%) |
| 5 to 17 Years | 0 (0.0%) | 0 (0.0%) |
| 18 to 34 Years | 0 (0.0%) | 0 (0.0%) |
| 35 to 64 Years | 19 (11.3%) | 0 (0.0%) |
| 65 to 74 Years | 0 (0.0%) | 22 (39.3%) |
| 75 Years and over | 0 (0.0%) | 8 (100.0%) |
Disability Class: Cognitive Difficulty
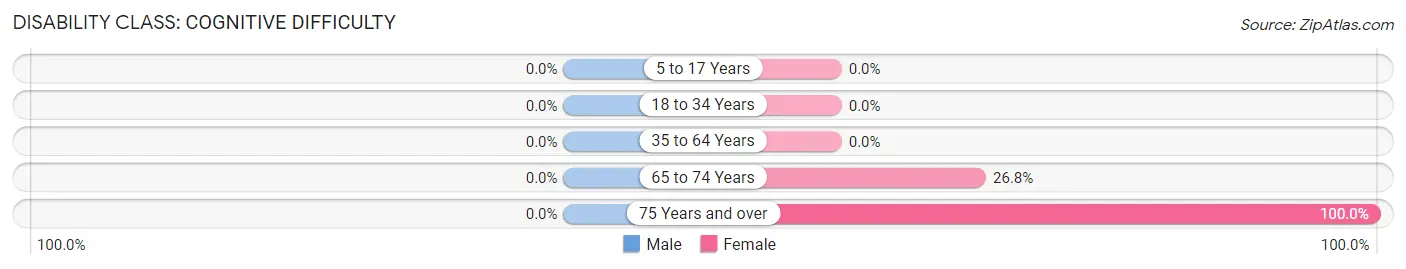
| Age Bracket | Male | Female |
| 5 to 17 Years | 0 (0.0%) | 0 (0.0%) |
| 18 to 34 Years | 0 (0.0%) | 0 (0.0%) |
| 35 to 64 Years | 0 (0.0%) | 0 (0.0%) |
| 65 to 74 Years | 0 (0.0%) | 15 (26.8%) |
| 75 Years and over | 0 (0.0%) | 8 (100.0%) |
Disability Class: Ambulatory Difficulty

| Age Bracket | Male | Female |
| 5 to 17 Years | 0 (0.0%) | 0 (0.0%) |
| 18 to 34 Years | 0 (0.0%) | 0 (0.0%) |
| 35 to 64 Years | 0 (0.0%) | 0 (0.0%) |
| 65 to 74 Years | 0 (0.0%) | 15 (26.8%) |
| 75 Years and over | 0 (0.0%) | 8 (100.0%) |
Disability Class: Self-Care Difficulty

| Age Bracket | Male | Female |
| 5 to 17 Years | 0 (0.0%) | 0 (0.0%) |
| 18 to 34 Years | 0 (0.0%) | 0 (0.0%) |
| 35 to 64 Years | 0 (0.0%) | 0 (0.0%) |
| 65 to 74 Years | 0 (0.0%) | 15 (26.8%) |
| 75 Years and over | 0 (0.0%) | 8 (100.0%) |
Technology Access in Iraan
Computing Device Access in Iraan
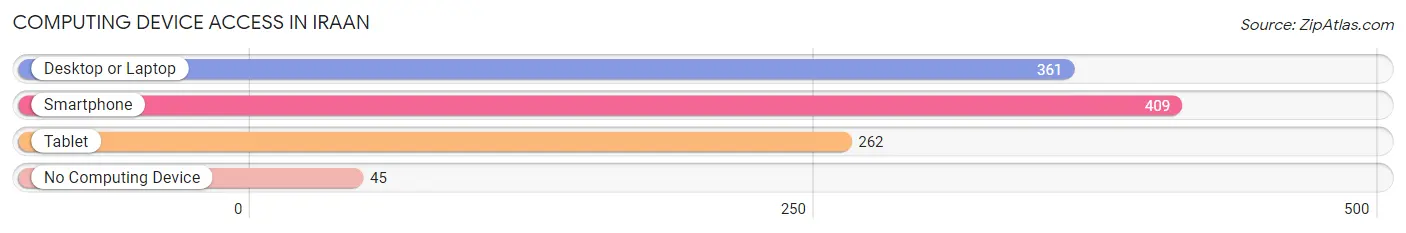
| Device Type | # Households | % Households |
| Desktop or Laptop | 361 | 75.2% |
| Smartphone | 409 | 85.2% |
| Tablet | 262 | 54.6% |
| No Computing Device | 45 | 9.4% |
| Total | 480 | 100.0% |
Internet Access in Iraan
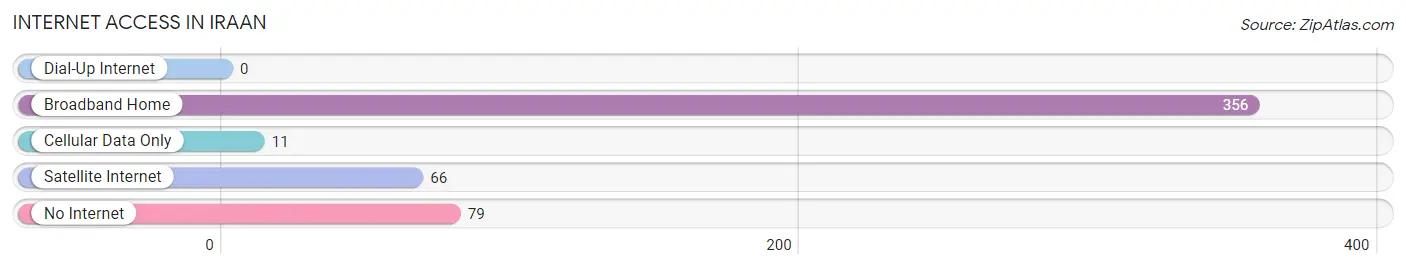
| Internet Type | # Households | % Households |
| Dial-Up Internet | 0 | 0.0% |
| Broadband Home | 356 | 74.2% |
| Cellular Data Only | 11 | 2.3% |
| Satellite Internet | 66 | 13.8% |
| No Internet | 79 | 16.5% |
| Total | 480 | 100.0% |
Iraan Summary
Iraan, Texas is a small town located in Pecos County, Texas, United States. It is situated on the banks of the Pecos River, approximately 90 miles southwest of San Angelo and about 200 miles southeast of El Paso. The population of Iraan was 1,039 at the 2010 census.
Geography
Iraan is located at 31°17'25" North, 102°45'45" West (31.290278, -102.762500). According to the United States Census Bureau, the town has a total area of 1.2 square miles (3.1 km2), all of it land.
History
Iraan was founded in 1927 by the Iraan Oil and Refining Company, which was owned by the Texas Pacific Coal and Oil Company. The town was named after Ira and Ann Yates, the parents of the company's president. The town grew rapidly in the 1930s and 1940s, and by the 1950s it had become a major oil-producing center.
Economy
Iraan's economy is largely based on oil and gas production. The town is home to several oil and gas companies, including Iraan Oil and Refining Company, which is the largest employer in the area. Other major employers include the Pecos County Electric Cooperative, the Iraan-Sheffield Independent School District, and the Iraan General Hospital.
Demographics
As of the 2010 census, there were 1,039 people, 393 households, and 279 families residing in Iraan. The population density was 862.5 people per square mile (333.2/km2). The racial makeup of the town was 81.2% White, 0.2% African American, 0.7% Native American, 0.2% Asian, 0.1% Pacific Islander, 15.7% from other races, and 2.0% from two or more races. Hispanic or Latino of any race were 37.2% of the population.
There were 393 households, out of which 33.2% had children under the age of 18 living with them, 54.2% were married couples living together, 11.2% had a female householder with no husband present, and 28.7% were non-families. 24.3% of all households were made up of individuals, and 11.2% had someone living alone who was 65 years of age or older. The average household size was 2.64 and the average family size was 3.14.
In the town, the population was spread out, with 28.2% under the age of 18, 8.2% from 18 to 24, 25.2% from 25 to 44, 24.2% from 45 to 64, and 14.2% who were 65 years of age or older. The median age was 36 years. For every 100 females, there were 97.2 males. For every 100 females age 18 and over, there were 94.2 males.
The median income for a household in the town was $30,000, and the median income for a family was $35,000. Males had a median income of $30,000 versus $20,000 for females. The per capita income for the town was $14,000. About 16.7% of families and 19.2% of the population were below the poverty line, including 25.2% of those under age 18 and 15.2% of those age 65 or over.
Common Questions
What is Per Capita Income in Iraan?
Per Capita income in Iraan is $26,938.
What is the Median Household income in Iraan?
Median Household Income in Iraan is $54,453.
What is Income or Wage Gap in Iraan?
Income or Wage Gap in Iraan is 19.9%.
Women in Iraan earn 80.1 cents for every dollar earned by a man.
What is Inequality or Gini Index in Iraan?
Inequality or Gini Index in Iraan is 0.45.
What is the Total Population of Iraan?
Total Population of Iraan is 1,585.
What is the Total Male Population of Iraan?
Total Male Population of Iraan is 729.
What is the Total Female Population of Iraan?
Total Female Population of Iraan is 856.
What is the Ratio of Males per 100 Females in Iraan?
There are 85.16 Males per 100 Females in Iraan.
What is the Ratio of Females per 100 Males in Iraan?
There are 117.42 Females per 100 Males in Iraan.
What is the Median Population Age in Iraan?
Median Population Age in Iraan is 24.9 Years.
What is the Average Family Size in Iraan
Average Family Size in Iraan is 4.3 People.
What is the Average Household Size in Iraan
Average Household Size in Iraan is 3.3 People.
How Large is the Labor Force in Iraan?
There are 594 People in the Labor Forcein in Iraan.
What is the Percentage of People in the Labor Force in Iraan?
58.2% of People are in the Labor Force in Iraan.