Imperial, TX Map & Demographics
Imperial Map
Imperial Overview
$45,951
PER CAPITA INCOME
$105,769
AVG HOUSEHOLD INCOME
0.40
INEQUALITY / GINI INDEX
258
TOTAL POPULATION
156
MALE POPULATION
102
FEMALE POPULATION
152.94
MALES / 100 FEMALES
65.38
FEMALES / 100 MALES
36.4
MEDIAN AGE
3.0
AVG FAMILY SIZE
2.7
AVG HOUSEHOLD SIZE
132
LABOR FORCE [ PEOPLE ]
67.0%
PERCENT IN LABOR FORCE
Imperial Zip Codes
Imperial Area Codes
Income in Imperial
Income Overview in Imperial
| Characteristic | Number | Measure |
| Per Capita Income | 258 | $45,951 |
| Median Family Income | 74 | $0 |
| Mean Family Income | 74 | $154,827 |
| Median Household Income | 94 | $105,769 |
| Mean Household Income | 94 | $128,896 |
| Income Deficit | 74 | $0 |
| Wage / Income Gap (%) | 258 | 0.00% |
| Wage / Income Gap ($) | 258 | 100.00¢ per $1 |
| Gini / Inequality Index | 258 | 0.40 |
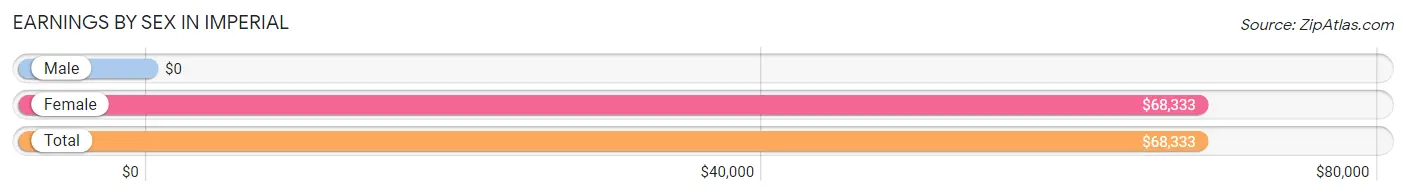
Earnings by Sex in Imperial
| Sex | Number | Average Earnings |
| Male | 66 (50.0%) | $0 |
| Female | 66 (50.0%) | $68,333 |
| Total | 132 (100.0%) | $68,333 |
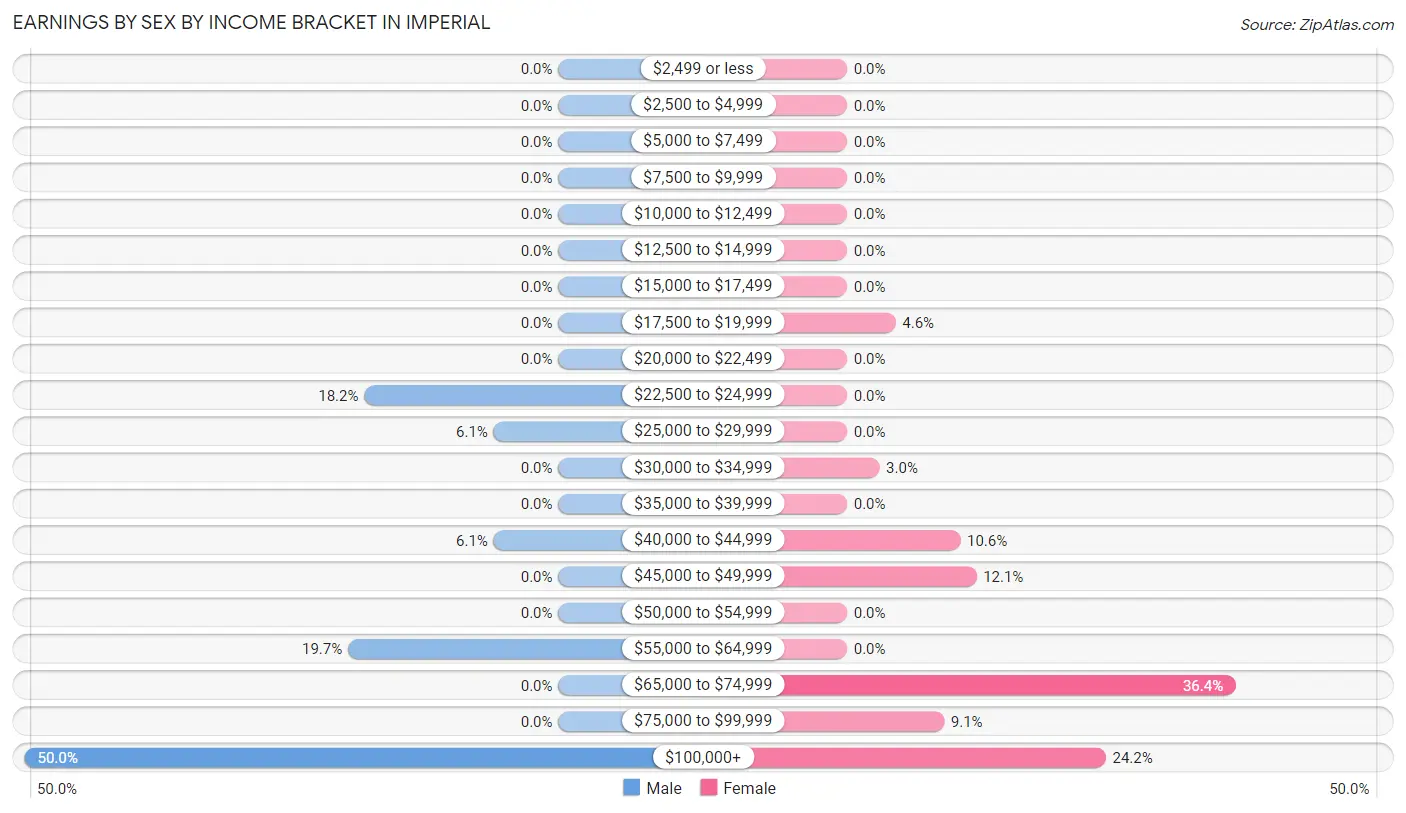
Earnings by Sex by Income Bracket in Imperial
The most common earnings brackets in Imperial are $100,000+ for men (33 | 50.0%) and $65,000 to $74,999 for women (24 | 36.4%).
| Income | Male | Female |
| $2,499 or less | 0 (0.0%) | 0 (0.0%) |
| $2,500 to $4,999 | 0 (0.0%) | 0 (0.0%) |
| $5,000 to $7,499 | 0 (0.0%) | 0 (0.0%) |
| $7,500 to $9,999 | 0 (0.0%) | 0 (0.0%) |
| $10,000 to $12,499 | 0 (0.0%) | 0 (0.0%) |
| $12,500 to $14,999 | 0 (0.0%) | 0 (0.0%) |
| $15,000 to $17,499 | 0 (0.0%) | 0 (0.0%) |
| $17,500 to $19,999 | 0 (0.0%) | 3 (4.5%) |
| $20,000 to $22,499 | 0 (0.0%) | 0 (0.0%) |
| $22,500 to $24,999 | 12 (18.2%) | 0 (0.0%) |
| $25,000 to $29,999 | 4 (6.1%) | 0 (0.0%) |
| $30,000 to $34,999 | 0 (0.0%) | 2 (3.0%) |
| $35,000 to $39,999 | 0 (0.0%) | 0 (0.0%) |
| $40,000 to $44,999 | 4 (6.1%) | 7 (10.6%) |
| $45,000 to $49,999 | 0 (0.0%) | 8 (12.1%) |
| $50,000 to $54,999 | 0 (0.0%) | 0 (0.0%) |
| $55,000 to $64,999 | 13 (19.7%) | 0 (0.0%) |
| $65,000 to $74,999 | 0 (0.0%) | 24 (36.4%) |
| $75,000 to $99,999 | 0 (0.0%) | 6 (9.1%) |
| $100,000+ | 33 (50.0%) | 16 (24.2%) |
| Total | 66 (100.0%) | 66 (100.0%) |
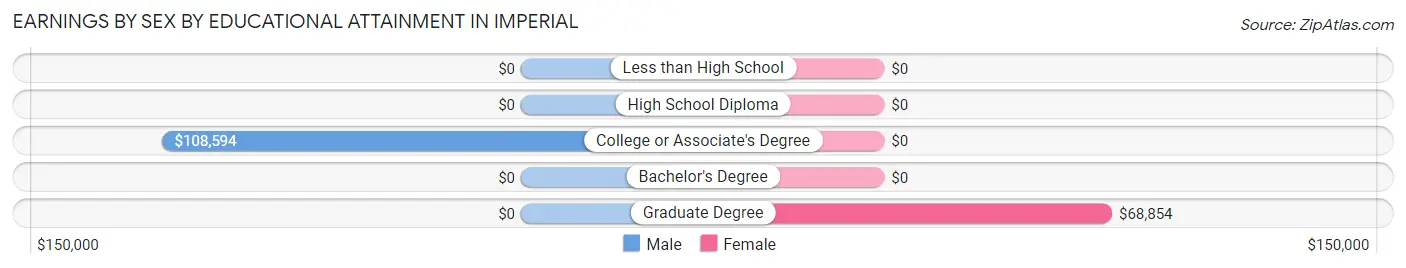
Earnings by Sex by Educational Attainment in Imperial
| Educational Attainment | Male Income | Female Income |
| Less than High School | - | - |
| High School Diploma | - | - |
| College or Associate's Degree | $108,594 | $0 |
| Bachelor's Degree | - | - |
| Graduate Degree | - | - |
| Total | - | - |
Family Income in Imperial
Family Income Brackets in Imperial
According to the Imperial family income data, there are 33 families falling into the $200,000+ income range, which is the most common income bracket and makes up 44.6% of all families.
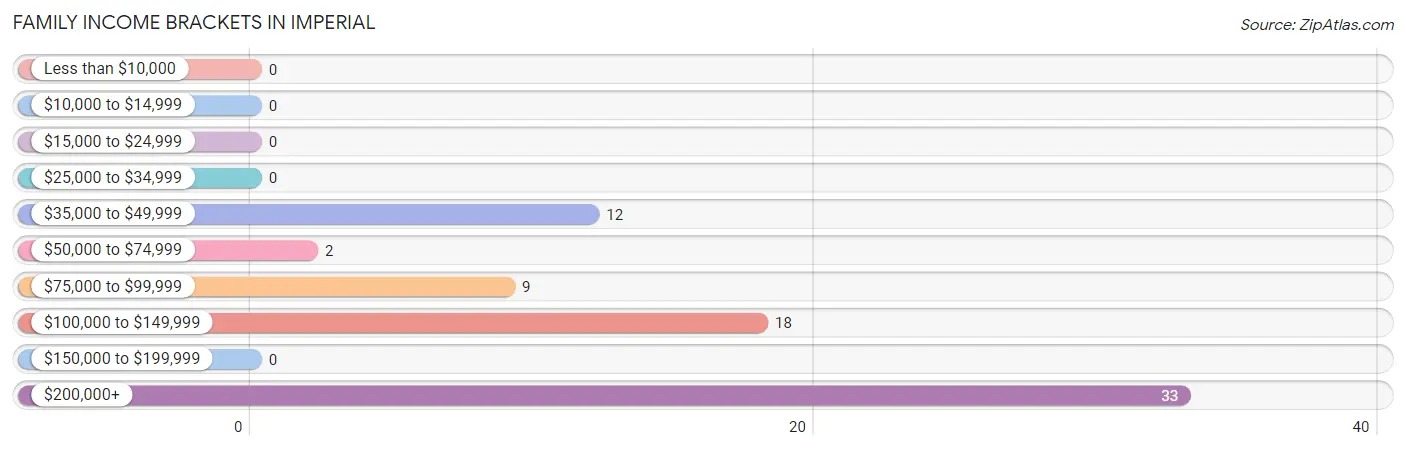
| Income Bracket | # Families | % Families |
| Less than $10,000 | 0 | 0.0% |
| $10,000 to $14,999 | 0 | 0.0% |
| $15,000 to $24,999 | 0 | 0.0% |
| $25,000 to $34,999 | 0 | 0.0% |
| $35,000 to $49,999 | 12 | 16.2% |
| $50,000 to $74,999 | 2 | 2.7% |
| $75,000 to $99,999 | 9 | 12.2% |
| $100,000 to $149,999 | 18 | 24.3% |
| $150,000 to $199,999 | 0 | 0.0% |
| $200,000+ | 33 | 44.6% |
Family Income by Famaliy Size in Imperial
3-person families (25 | 33.8%) account for the highest median family income in Imperial with $250,001 per family, while 3-person families (25 | 33.8%) have the highest median income of $83,334 per family member.
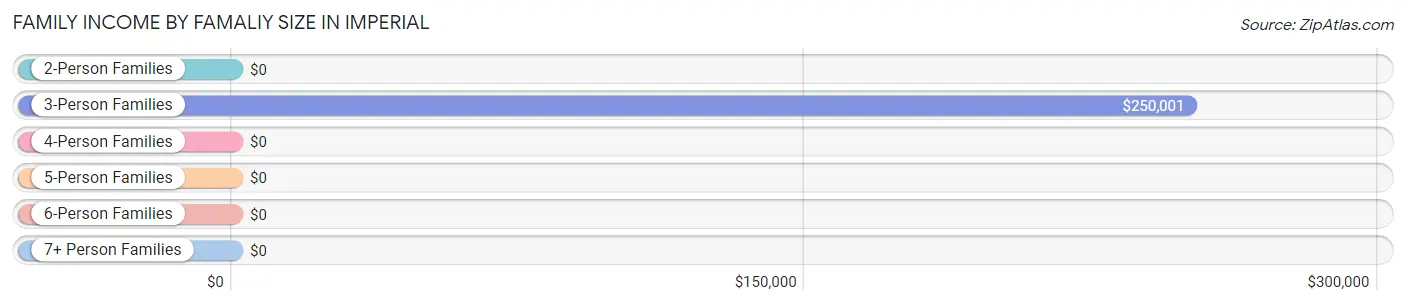
| Income Bracket | # Families | Median Income |
| 2-Person Families | 21 (28.4%) | $0 |
| 3-Person Families | 25 (33.8%) | $250,001 |
| 4-Person Families | 15 (20.3%) | $0 |
| 5-Person Families | 13 (17.6%) | $0 |
| 6-Person Families | 0 (0.0%) | $0 |
| 7+ Person Families | 0 (0.0%) | $0 |
| Total | 74 (100.0%) | $0 |
Family Income by Number of Earners in Imperial
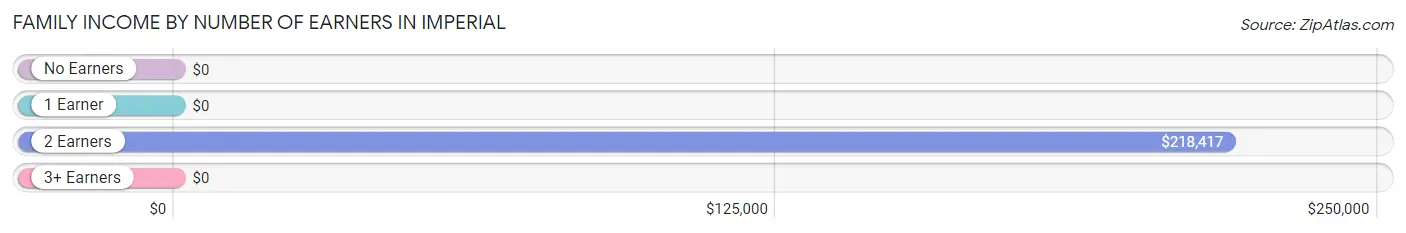
| Number of Earners | # Families | Median Income |
| No Earners | 0 (0.0%) | $0 |
| 1 Earner | 19 (25.7%) | $0 |
| 2 Earners | 51 (68.9%) | $218,417 |
| 3+ Earners | 4 (5.4%) | $0 |
| Total | 74 (100.0%) | $0 |
Household Income in Imperial
Household Income Brackets in Imperial
With 33 households falling in the category, the $200,000+ income range is the most frequent in Imperial, accounting for 35.1% of all households.
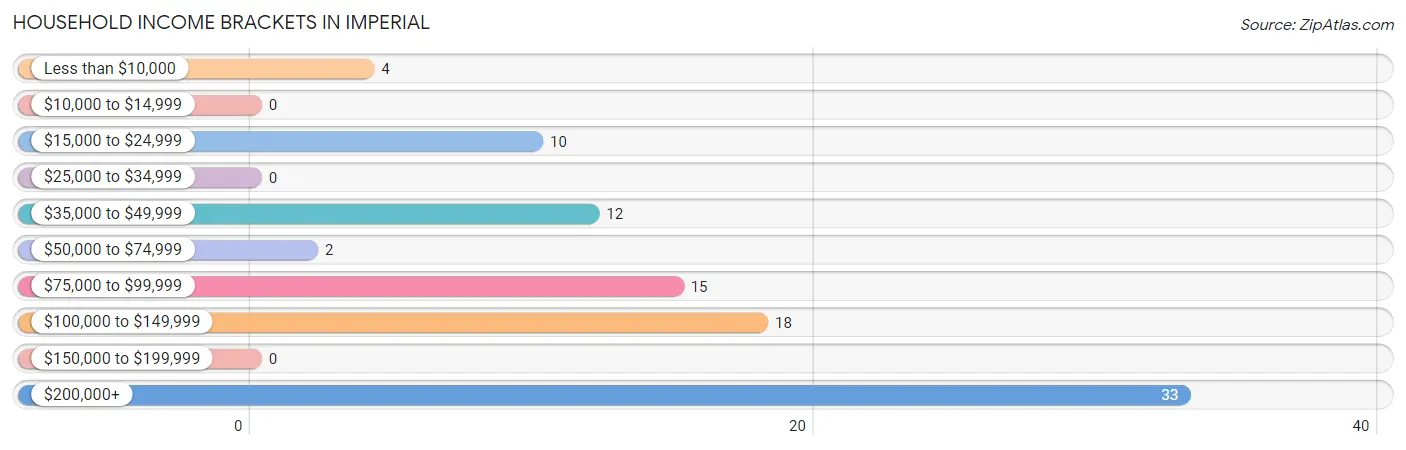
| Income Bracket | # Households | % Households |
| Less than $10,000 | 4 | 4.3% |
| $10,000 to $14,999 | 0 | 0.0% |
| $15,000 to $24,999 | 10 | 10.6% |
| $25,000 to $34,999 | 0 | 0.0% |
| $35,000 to $49,999 | 12 | 12.8% |
| $50,000 to $74,999 | 2 | 2.1% |
| $75,000 to $99,999 | 15 | 16.0% |
| $100,000 to $149,999 | 18 | 19.1% |
| $150,000 to $199,999 | 0 | 0.0% |
| $200,000+ | 33 | 35.1% |
Household Income by Householder Age in Imperial
The median household income in Imperial is $105,769, with the highest median household income of $219,000 found in the 25 to 44 years age bracket for the primary householder. A total of 44 households (46.8%) fall into this category.
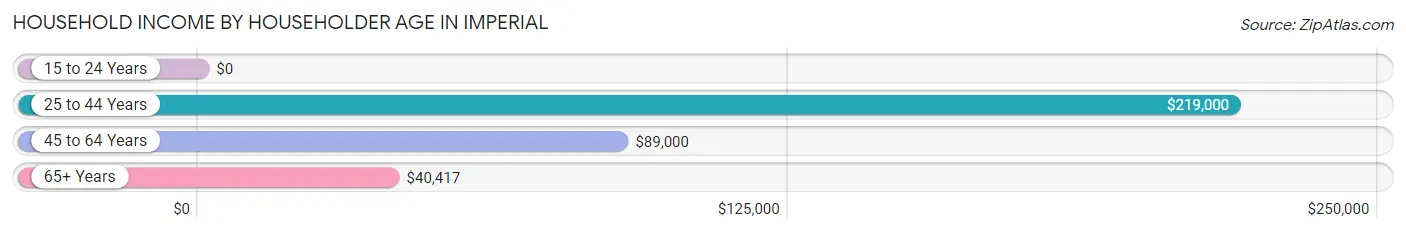
| Income Bracket | # Households | Median Income |
| 15 to 24 Years | 0 (0.0%) | $0 |
| 25 to 44 Years | 44 (46.8%) | $219,000 |
| 45 to 64 Years | 26 (27.7%) | $89,000 |
| 65+ Years | 24 (25.5%) | $40,417 |
| Total | 94 (100.0%) | $105,769 |
Poverty in Imperial
Income Below Poverty by Sex and Age in Imperial
With 7.7% poverty level for males and 3.9% for females among the residents of Imperial, 18 to 24 year old males and 55 to 64 year old females are the most vulnerable to poverty, with 12 males (54.5%) and 4 females (11.4%) in their respective age groups living below the poverty level.
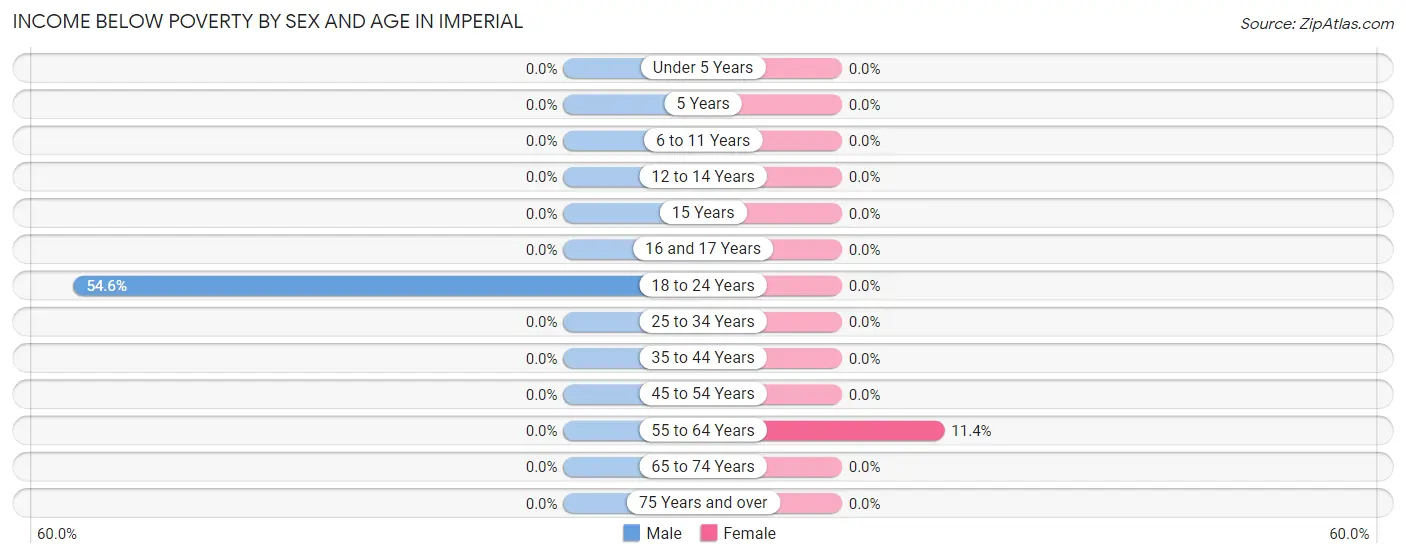
| Age Bracket | Male | Female |
| Under 5 Years | 0 (0.0%) | 0 (0.0%) |
| 5 Years | 0 (0.0%) | 0 (0.0%) |
| 6 to 11 Years | 0 (0.0%) | 0 (0.0%) |
| 12 to 14 Years | 0 (0.0%) | 0 (0.0%) |
| 15 Years | 0 (0.0%) | 0 (0.0%) |
| 16 and 17 Years | 0 (0.0%) | 0 (0.0%) |
| 18 to 24 Years | 12 (54.5%) | 0 (0.0%) |
| 25 to 34 Years | 0 (0.0%) | 0 (0.0%) |
| 35 to 44 Years | 0 (0.0%) | 0 (0.0%) |
| 45 to 54 Years | 0 (0.0%) | 0 (0.0%) |
| 55 to 64 Years | 0 (0.0%) | 4 (11.4%) |
| 65 to 74 Years | 0 (0.0%) | 0 (0.0%) |
| 75 Years and over | 0 (0.0%) | 0 (0.0%) |
| Total | 12 (7.7%) | 4 (3.9%) |
Income Above Poverty by Sex and Age in Imperial
According to the poverty statistics in Imperial, males aged under 5 years and females aged 18 to 24 years are the age groups that are most secure financially, with 100.0% of males and 100.0% of females in these age groups living above the poverty line.
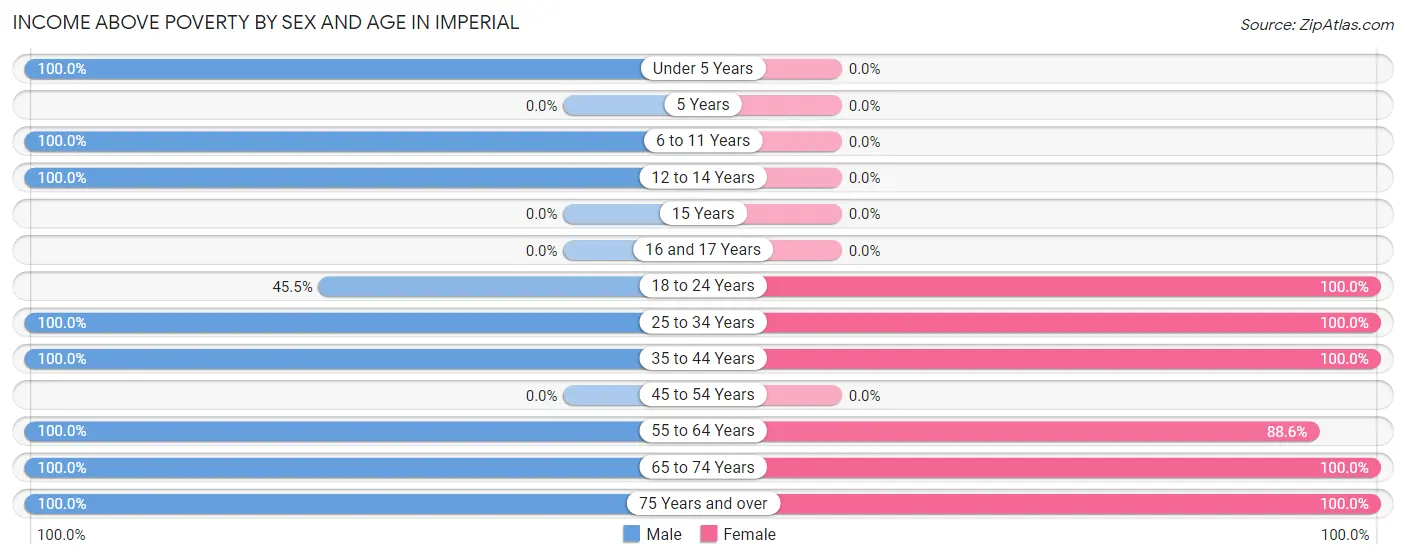
| Age Bracket | Male | Female |
| Under 5 Years | 29 (100.0%) | 0 (0.0%) |
| 5 Years | 0 (0.0%) | 0 (0.0%) |
| 6 to 11 Years | 11 (100.0%) | 0 (0.0%) |
| 12 to 14 Years | 21 (100.0%) | 0 (0.0%) |
| 15 Years | 0 (0.0%) | 0 (0.0%) |
| 16 and 17 Years | 0 (0.0%) | 0 (0.0%) |
| 18 to 24 Years | 10 (45.5%) | 3 (100.0%) |
| 25 to 34 Years | 13 (100.0%) | 24 (100.0%) |
| 35 to 44 Years | 31 (100.0%) | 12 (100.0%) |
| 45 to 54 Years | 0 (0.0%) | 0 (0.0%) |
| 55 to 64 Years | 11 (100.0%) | 31 (88.6%) |
| 65 to 74 Years | 6 (100.0%) | 4 (100.0%) |
| 75 Years and over | 12 (100.0%) | 24 (100.0%) |
| Total | 144 (92.3%) | 98 (96.1%) |
Income Below Poverty Among Married-Couple Families in Imperial
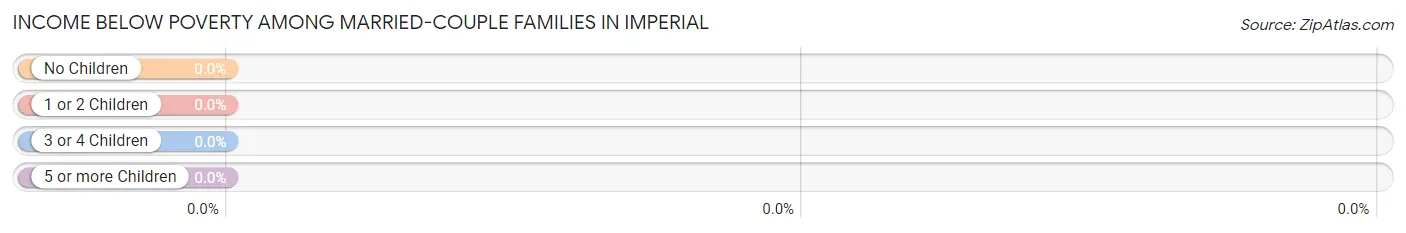
| Children | Above Poverty | Below Poverty |
| No Children | 45 (100.0%) | 0 (0.0%) |
| 1 or 2 Children | 16 (100.0%) | 0 (0.0%) |
| 3 or 4 Children | 13 (100.0%) | 0 (0.0%) |
| 5 or more Children | 0 (0.0%) | 0 (0.0%) |
| Total | 74 (100.0%) | 0 (0.0%) |
Income Below Poverty Among Single-Parent Households in Imperial
| Children | Single Father | Single Mother |
| No Children | 0 (0.0%) | 0 (0.0%) |
| 1 or 2 Children | 0 (0.0%) | 0 (0.0%) |
| 3 or 4 Children | 0 (0.0%) | 0 (0.0%) |
| 5 or more Children | 0 (0.0%) | 0 (0.0%) |
| Total | 0 (0.0%) | 0 (0.0%) |
Income Below Poverty Among Married-Couple vs Single-Parent Households in Imperial
| Children | Married-Couple Families | Single-Parent Households |
| No Children | 0 (0.0%) | 0 (0.0%) |
| 1 or 2 Children | 0 (0.0%) | 0 (0.0%) |
| 3 or 4 Children | 0 (0.0%) | 0 (0.0%) |
| 5 or more Children | 0 (0.0%) | 0 (0.0%) |
| Total | 0 (0.0%) | 0 (0.0%) |
Race in Imperial
The most populous races in Imperial are White / Caucasian (205 | 79.5%), Hispanic or Latino (66 | 25.6%), and Some other Race (53 | 20.5%).
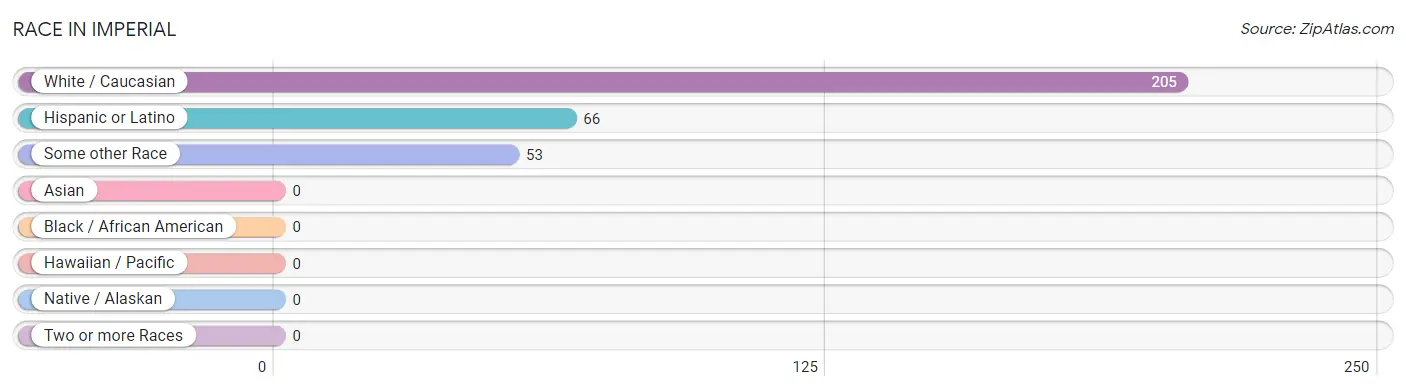
| Race | # Population | % Population |
| Asian | 0 | 0.0% |
| Black / African American | 0 | 0.0% |
| Hawaiian / Pacific | 0 | 0.0% |
| Hispanic or Latino | 66 | 25.6% |
| Native / Alaskan | 0 | 0.0% |
| White / Caucasian | 205 | 79.5% |
| Two or more Races | 0 | 0.0% |
| Some other Race | 53 | 20.5% |
| Total | 258 | 100.0% |
Ancestry in Imperial
The most populous ancestries reported in Imperial are Mexican (66 | 25.6%), English (28 | 10.8%), Scotch-Irish (14 | 5.4%), and German (6 | 2.3%), together accounting for 44.2% of all Imperial residents.
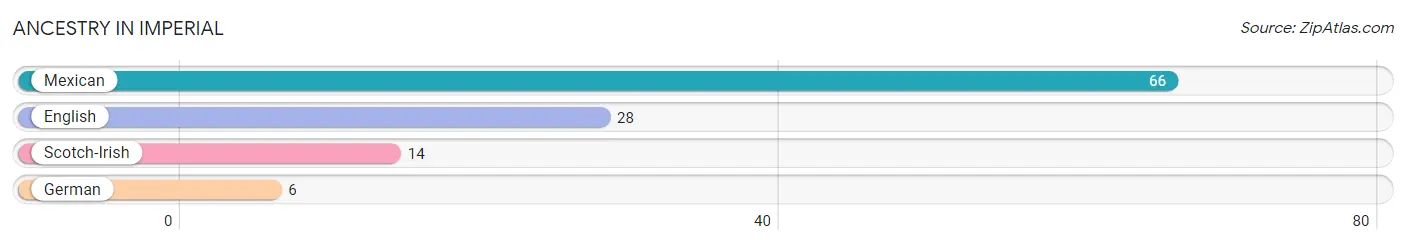
| Ancestry | # Population | % Population |
| English | 28 | 10.8% |
| German | 6 | 2.3% |
| Mexican | 66 | 25.6% |
| Scotch-Irish | 14 | 5.4% | View All 4 Rows |
Immigrants in Imperial
The most numerous immigrant groups reported in Imperial came from Central America (6 | 2.3%), Latin America (6 | 2.3%), and Mexico (6 | 2.3%), together accounting for 7.0% of all Imperial residents.
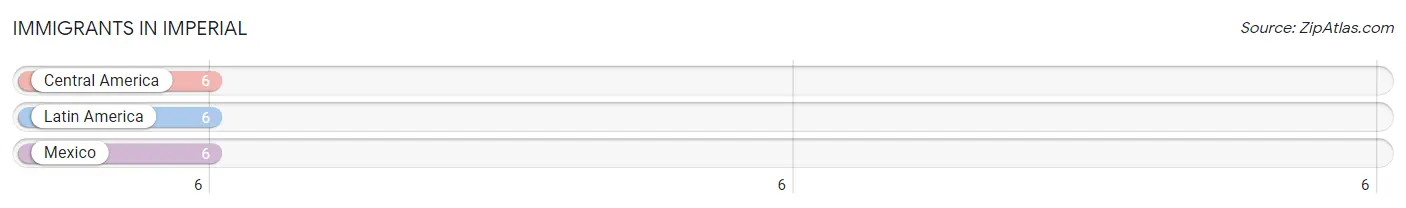
| Immigration Origin | # Population | % Population |
| Central America | 6 | 2.3% |
| Latin America | 6 | 2.3% |
| Mexico | 6 | 2.3% | View All 3 Rows |
Sex and Age in Imperial
Sex and Age in Imperial
The most populous age groups in Imperial are 35 to 39 Years (31 | 19.9%) for men and 30 to 34 Years (24 | 23.5%) for women.
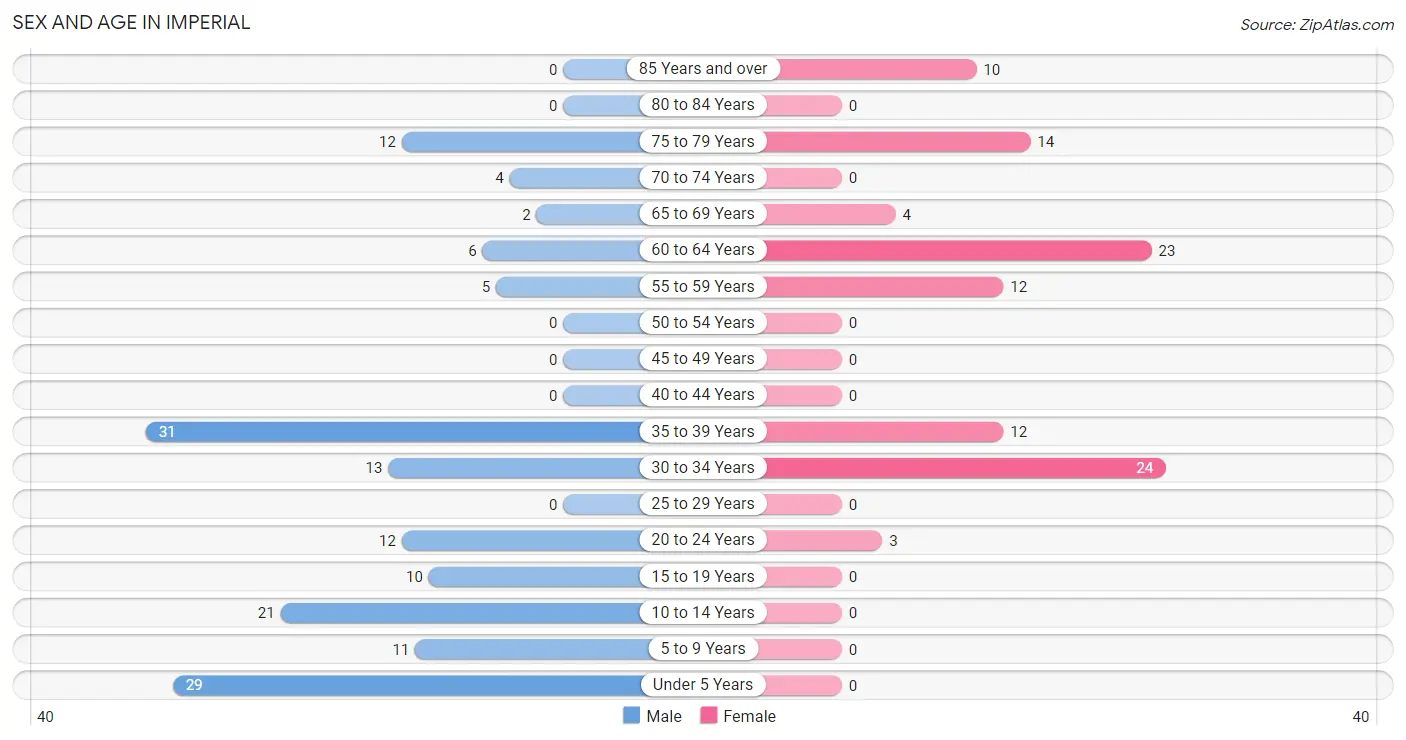
| Age Bracket | Male | Female |
| Under 5 Years | 29 (18.6%) | 0 (0.0%) |
| 5 to 9 Years | 11 (7.0%) | 0 (0.0%) |
| 10 to 14 Years | 21 (13.5%) | 0 (0.0%) |
| 15 to 19 Years | 10 (6.4%) | 0 (0.0%) |
| 20 to 24 Years | 12 (7.7%) | 3 (2.9%) |
| 25 to 29 Years | 0 (0.0%) | 0 (0.0%) |
| 30 to 34 Years | 13 (8.3%) | 24 (23.5%) |
| 35 to 39 Years | 31 (19.9%) | 12 (11.8%) |
| 40 to 44 Years | 0 (0.0%) | 0 (0.0%) |
| 45 to 49 Years | 0 (0.0%) | 0 (0.0%) |
| 50 to 54 Years | 0 (0.0%) | 0 (0.0%) |
| 55 to 59 Years | 5 (3.2%) | 12 (11.8%) |
| 60 to 64 Years | 6 (3.8%) | 23 (22.6%) |
| 65 to 69 Years | 2 (1.3%) | 4 (3.9%) |
| 70 to 74 Years | 4 (2.6%) | 0 (0.0%) |
| 75 to 79 Years | 12 (7.7%) | 14 (13.7%) |
| 80 to 84 Years | 0 (0.0%) | 0 (0.0%) |
| 85 Years and over | 0 (0.0%) | 10 (9.8%) |
| Total | 156 (100.0%) | 102 (100.0%) |
Families and Households in Imperial
Median Family Size in Imperial
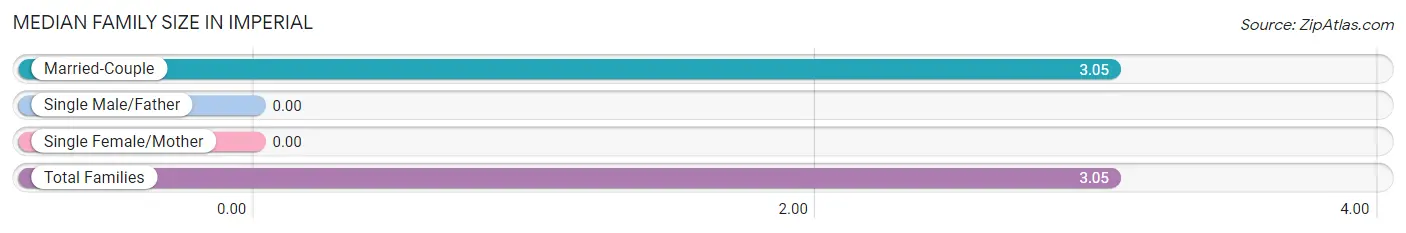
| Family Type | # Families | Family Size |
| Married-Couple | 74 (100.0%) | 3.05 |
| Single Male/Father | 0 (0.0%) | - |
| Single Female/Mother | 0 (0.0%) | - |
| Total Families | 74 (100.0%) | 3.05 |
Median Household Size in Imperial
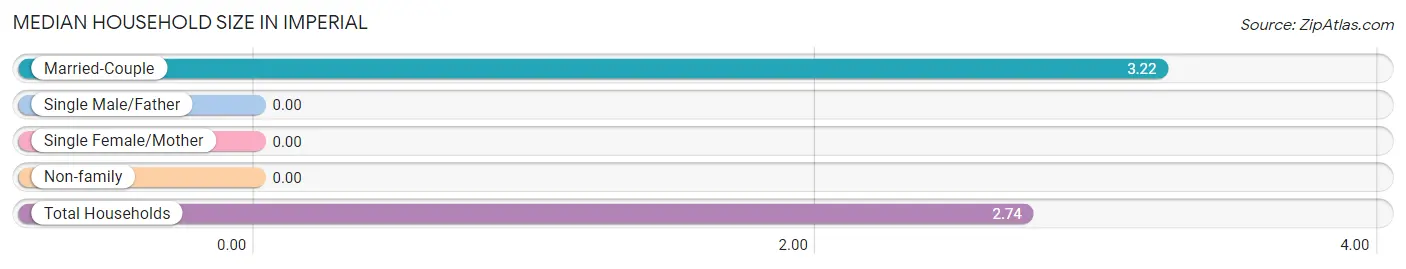
| Household Type | # Households | Household Size |
| Married-Couple | 74 (78.7%) | 3.22 |
| Single Male/Father | 0 (0.0%) | - |
| Single Female/Mother | 0 (0.0%) | - |
| Non-family | 20 (21.3%) | - |
| Total Households | 94 (100.0%) | 2.74 |
Household Size by Marriage Status in Imperial
Out of a total of 94 households in Imperial, 74 (78.7%) are family households, while 20 (21.3%) are nonfamily households. The most numerous type of family households are 5-person households, comprising 28, and the most common type of nonfamily households are 1-person households, comprising 20.
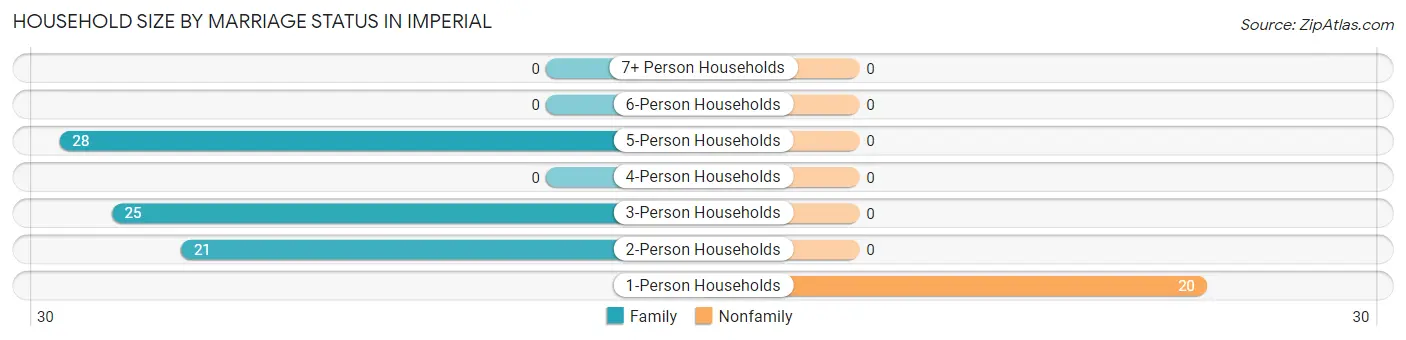
| Household Size | Family Households | Nonfamily Households |
| 1-Person Households | - | 20 (21.3%) |
| 2-Person Households | 21 (22.3%) | 0 (0.0%) |
| 3-Person Households | 25 (26.6%) | 0 (0.0%) |
| 4-Person Households | 0 (0.0%) | 0 (0.0%) |
| 5-Person Households | 28 (29.8%) | 0 (0.0%) |
| 6-Person Households | 0 (0.0%) | 0 (0.0%) |
| 7+ Person Households | 0 (0.0%) | 0 (0.0%) |
| Total | 74 (78.7%) | 20 (21.3%) |
Female Fertility in Imperial
Fertility by Age in Imperial
| Age Bracket | Women with Births | Births / 1,000 Women |
| 15 to 19 years | 0 (0.0%) | 0.0 |
| 20 to 34 years | 0 (0.0%) | 0.0 |
| 35 to 50 years | 0 (0.0%) | 0.0 |
| Total | 0 (0.0%) | 0.0 |
Fertility by Age by Marriage Status in Imperial
| Age Bracket | Married | Unmarried |
| 15 to 19 years | 0 (0.0%) | 0 (0.0%) |
| 20 to 34 years | 0 (0.0%) | 0 (0.0%) |
| 35 to 50 years | 0 (0.0%) | 0 (0.0%) |
| Total | 0 (0.0%) | 0 (0.0%) |
Fertility by Education in Imperial
| Educational Attainment | Women with Births | Births / 1,000 Women |
| Less than High School | 0 (0.0%) | 0.0 |
| High School Diploma | 0 (0.0%) | 0.0 |
| College or Associate's Degree | 0 (0.0%) | 0.0 |
| Bachelor's Degree | 0 (0.0%) | 0.0 |
| Graduate Degree | 0 (0.0%) | 0.0 |
| Total | 0 (0.0%) | 0.0 |
Fertility by Education by Marriage Status in Imperial
| Educational Attainment | Married | Unmarried |
| Less than High School | 0 (0.0%) | 0 (0.0%) |
| High School Diploma | 0 (0.0%) | 0 (0.0%) |
| College or Associate's Degree | 0 (0.0%) | 0 (0.0%) |
| Bachelor's Degree | 0 (0.0%) | 0 (0.0%) |
| Graduate Degree | 0 (0.0%) | 0 (0.0%) |
| Total | 0 (0.0%) | 0 (0.0%) |
Employment Characteristics in Imperial
Employment by Class of Employer in Imperial
Among the 132 employed individuals in Imperial, private company employees (93 | 70.5%), local government employees (22 | 16.7%), and state government employees (13 | 9.9%) make up the most common classes of employment.
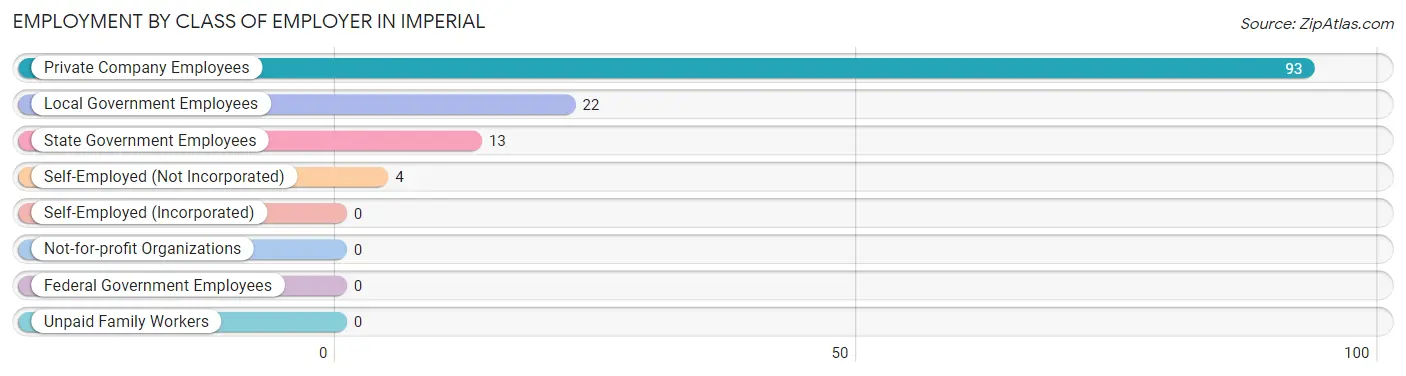
| Employer Class | # Employees | % Employees |
| Private Company Employees | 93 | 70.5% |
| Self-Employed (Incorporated) | 0 | 0.0% |
| Self-Employed (Not Incorporated) | 4 | 3.0% |
| Not-for-profit Organizations | 0 | 0.0% |
| Local Government Employees | 22 | 16.7% |
| State Government Employees | 13 | 9.9% |
| Federal Government Employees | 0 | 0.0% |
| Unpaid Family Workers | 0 | 0.0% |
| Total | 132 | 100.0% |
Employment Status by Age in Imperial
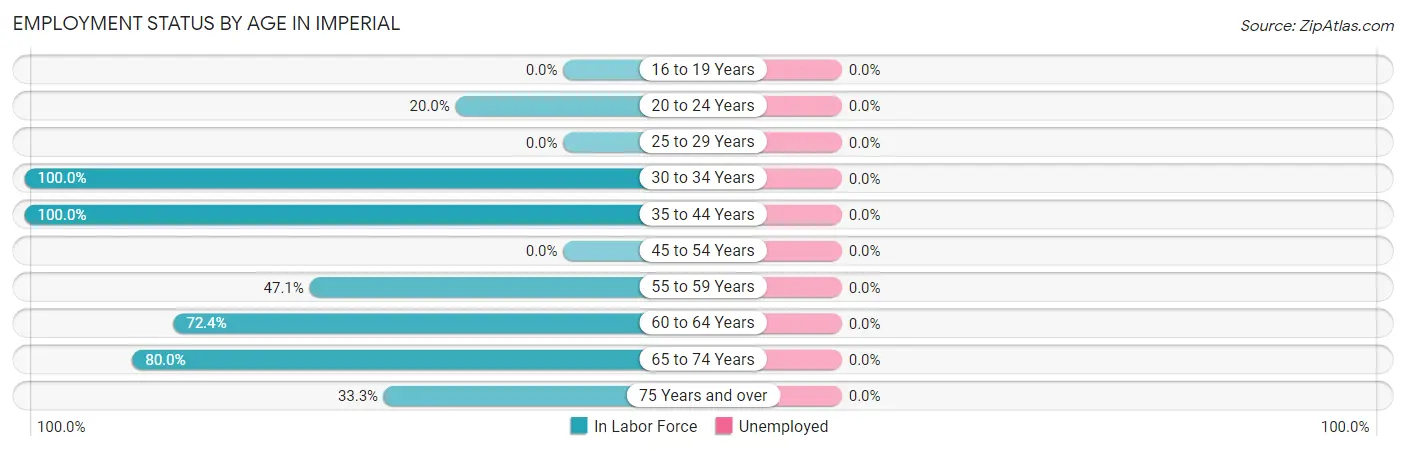
| Age Bracket | In Labor Force | Unemployed |
| 16 to 19 Years | 0 (0.0%) | 0 (0.0%) |
| 20 to 24 Years | 3 (20.0%) | 0 (0.0%) |
| 25 to 29 Years | 0 (0.0%) | 0 (0.0%) |
| 30 to 34 Years | 37 (100.0%) | 0 (0.0%) |
| 35 to 44 Years | 43 (100.0%) | 0 (0.0%) |
| 45 to 54 Years | 0 (0.0%) | 0 (0.0%) |
| 55 to 59 Years | 8 (47.1%) | 0 (0.0%) |
| 60 to 64 Years | 21 (72.4%) | 0 (0.0%) |
| 65 to 74 Years | 8 (80.0%) | 0 (0.0%) |
| 75 Years and over | 12 (33.3%) | 0 (0.0%) |
| Total | 132 (67.0%) | 0 (0.0%) |
Employment Status by Educational Attainment in Imperial
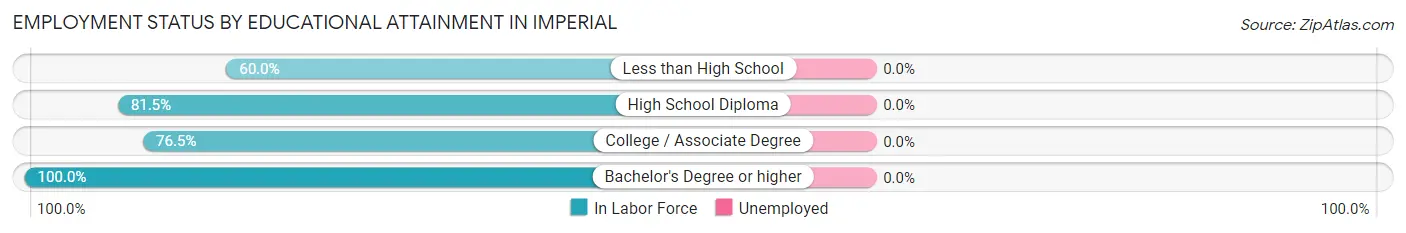
| Educational Attainment | In Labor Force | Unemployed |
| Less than High School | 6 (60.0%) | 0 (0.0%) |
| High School Diploma | 22 (81.5%) | 0 (0.0%) |
| College / Associate Degree | 26 (76.5%) | 0 (0.0%) |
| Bachelor's Degree or higher | 55 (100.0%) | 0 (0.0%) |
| Total | 109 (86.5%) | 0 (0.0%) |
Employment Occupations by Sex in Imperial
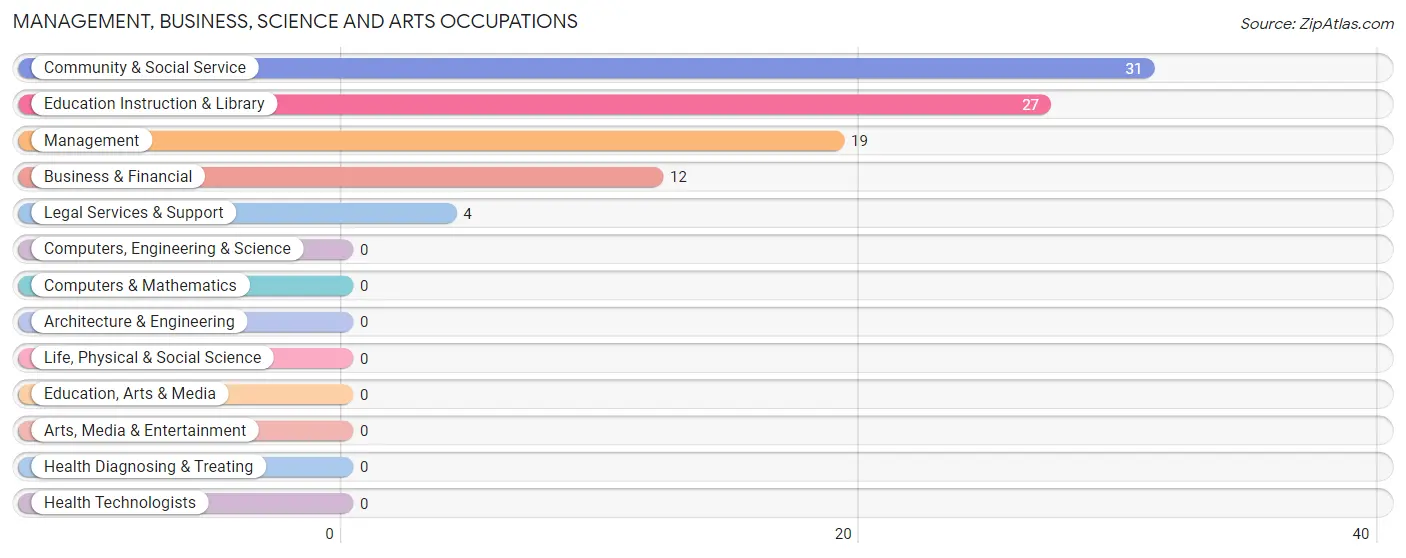
Management, Business, Science and Arts Occupations
The most common Management, Business, Science and Arts occupations in Imperial are Community & Social Service (31 | 23.5%), Education Instruction & Library (27 | 20.4%), Management (19 | 14.4%), Business & Financial (12 | 9.1%), and Legal Services & Support (4 | 3.0%).
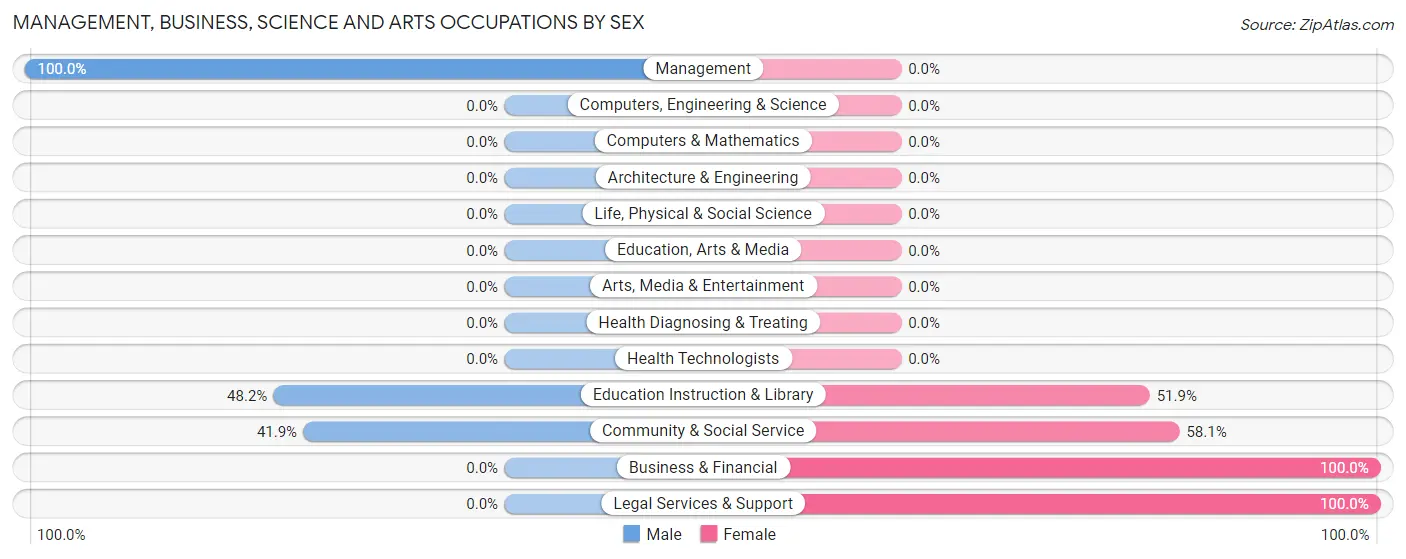
Management, Business, Science and Arts Occupations by Sex
Within the Management, Business, Science and Arts occupations in Imperial, the most male-oriented occupations are Management (100.0%), Education Instruction & Library (48.1%), and Community & Social Service (41.9%), while the most female-oriented occupations are Business & Financial (100.0%), Legal Services & Support (100.0%), and Community & Social Service (58.1%).
| Occupation | Male | Female |
| Management | 19 (100.0%) | 0 (0.0%) |
| Business & Financial | 0 (0.0%) | 12 (100.0%) |
| Computers, Engineering & Science | 0 (0.0%) | 0 (0.0%) |
| Computers & Mathematics | 0 (0.0%) | 0 (0.0%) |
| Architecture & Engineering | 0 (0.0%) | 0 (0.0%) |
| Life, Physical & Social Science | 0 (0.0%) | 0 (0.0%) |
| Community & Social Service | 13 (41.9%) | 18 (58.1%) |
| Education, Arts & Media | 0 (0.0%) | 0 (0.0%) |
| Legal Services & Support | 0 (0.0%) | 4 (100.0%) |
| Education Instruction & Library | 13 (48.1%) | 14 (51.8%) |
| Arts, Media & Entertainment | 0 (0.0%) | 0 (0.0%) |
| Health Diagnosing & Treating | 0 (0.0%) | 0 (0.0%) |
| Health Technologists | 0 (0.0%) | 0 (0.0%) |
| Total (Category) | 32 (51.6%) | 30 (48.4%) |
| Total (Overall) | 66 (50.0%) | 66 (50.0%) |
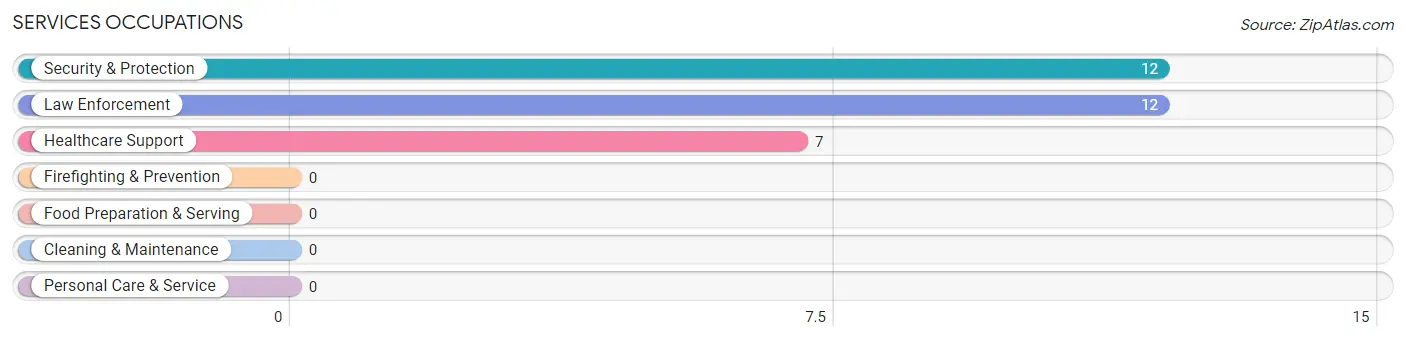
Services Occupations
The most common Services occupations in Imperial are Security & Protection (12 | 9.1%), Law Enforcement (12 | 9.1%), and Healthcare Support (7 | 5.3%).
Services Occupations by Sex
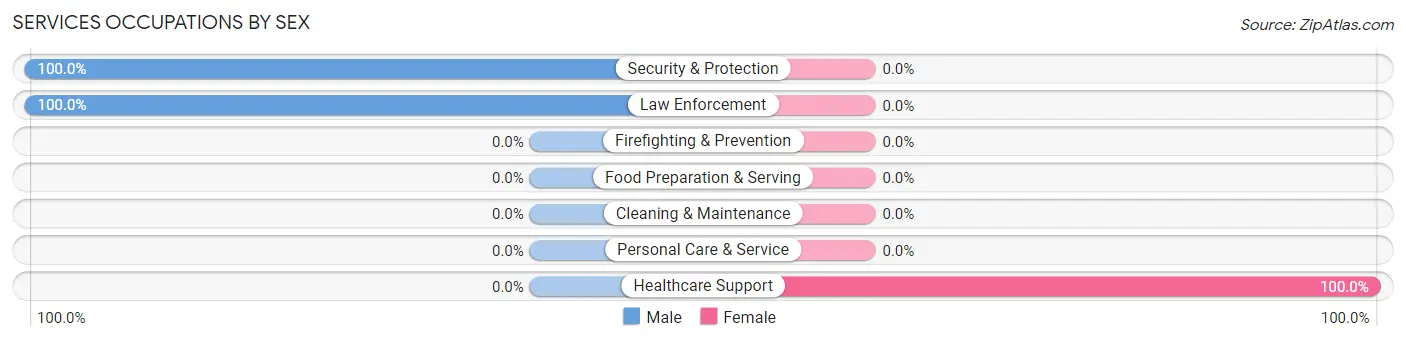
| Occupation | Male | Female |
| Healthcare Support | 0 (0.0%) | 7 (100.0%) |
| Security & Protection | 12 (100.0%) | 0 (0.0%) |
| Firefighting & Prevention | 0 (0.0%) | 0 (0.0%) |
| Law Enforcement | 12 (100.0%) | 0 (0.0%) |
| Food Preparation & Serving | 0 (0.0%) | 0 (0.0%) |
| Cleaning & Maintenance | 0 (0.0%) | 0 (0.0%) |
| Personal Care & Service | 0 (0.0%) | 0 (0.0%) |
| Total (Category) | 12 (63.2%) | 7 (36.8%) |
| Total (Overall) | 66 (50.0%) | 66 (50.0%) |
Sales and Office Occupations
The most common Sales and Office occupations in Imperial are Office & Administration (24 | 18.2%), and Sales & Related (5 | 3.8%).
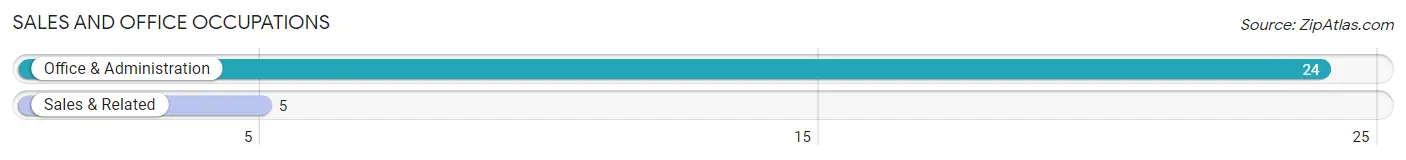
Sales and Office Occupations by Sex
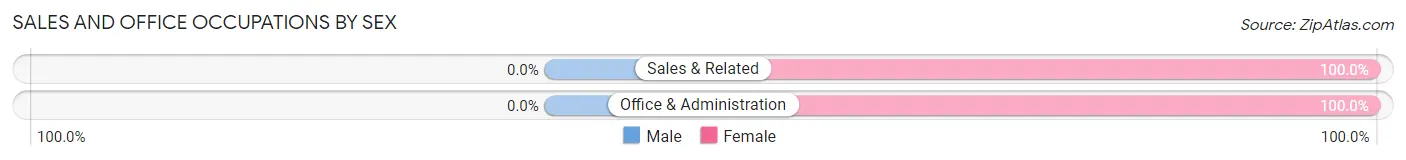
| Occupation | Male | Female |
| Sales & Related | 0 (0.0%) | 5 (100.0%) |
| Office & Administration | 0 (0.0%) | 24 (100.0%) |
| Total (Category) | 0 (0.0%) | 29 (100.0%) |
| Total (Overall) | 66 (50.0%) | 66 (50.0%) |
Natural Resources, Construction and Maintenance Occupations
The most common Natural Resources, Construction and Maintenance occupations in Imperial are , and Construction & Extraction (2 | 1.5%).
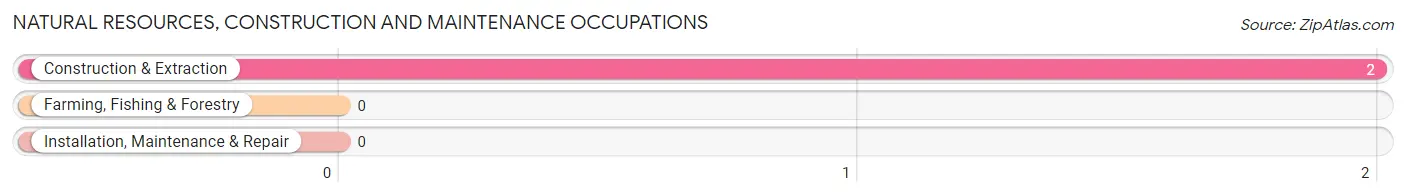
Natural Resources, Construction and Maintenance Occupations by Sex
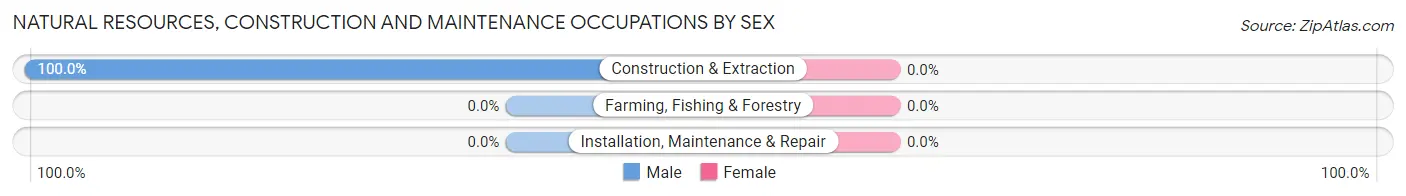
| Occupation | Male | Female |
| Farming, Fishing & Forestry | 0 (0.0%) | 0 (0.0%) |
| Construction & Extraction | 2 (100.0%) | 0 (0.0%) |
| Installation, Maintenance & Repair | 0 (0.0%) | 0 (0.0%) |
| Total (Category) | 2 (100.0%) | 0 (0.0%) |
| Total (Overall) | 66 (50.0%) | 66 (50.0%) |
Production, Transportation and Moving Occupations
The most common Production, Transportation and Moving occupations in Imperial are Production (16 | 12.1%), and Material Moving (4 | 3.0%).
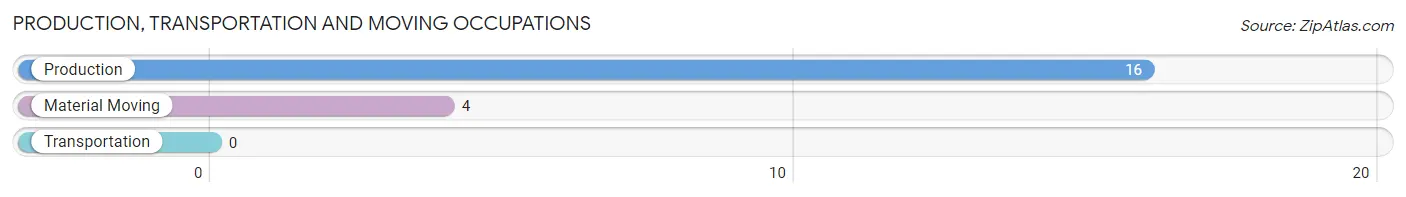
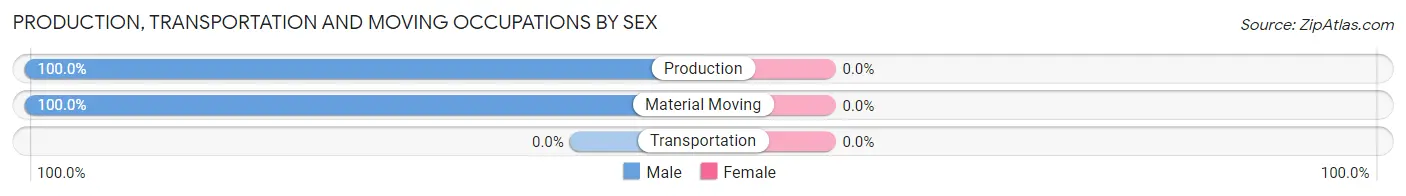
Production, Transportation and Moving Occupations by Sex
| Occupation | Male | Female |
| Production | 16 (100.0%) | 0 (0.0%) |
| Transportation | 0 (0.0%) | 0 (0.0%) |
| Material Moving | 4 (100.0%) | 0 (0.0%) |
| Total (Category) | 20 (100.0%) | 0 (0.0%) |
| Total (Overall) | 66 (50.0%) | 66 (50.0%) |
Employment Industries by Sex in Imperial
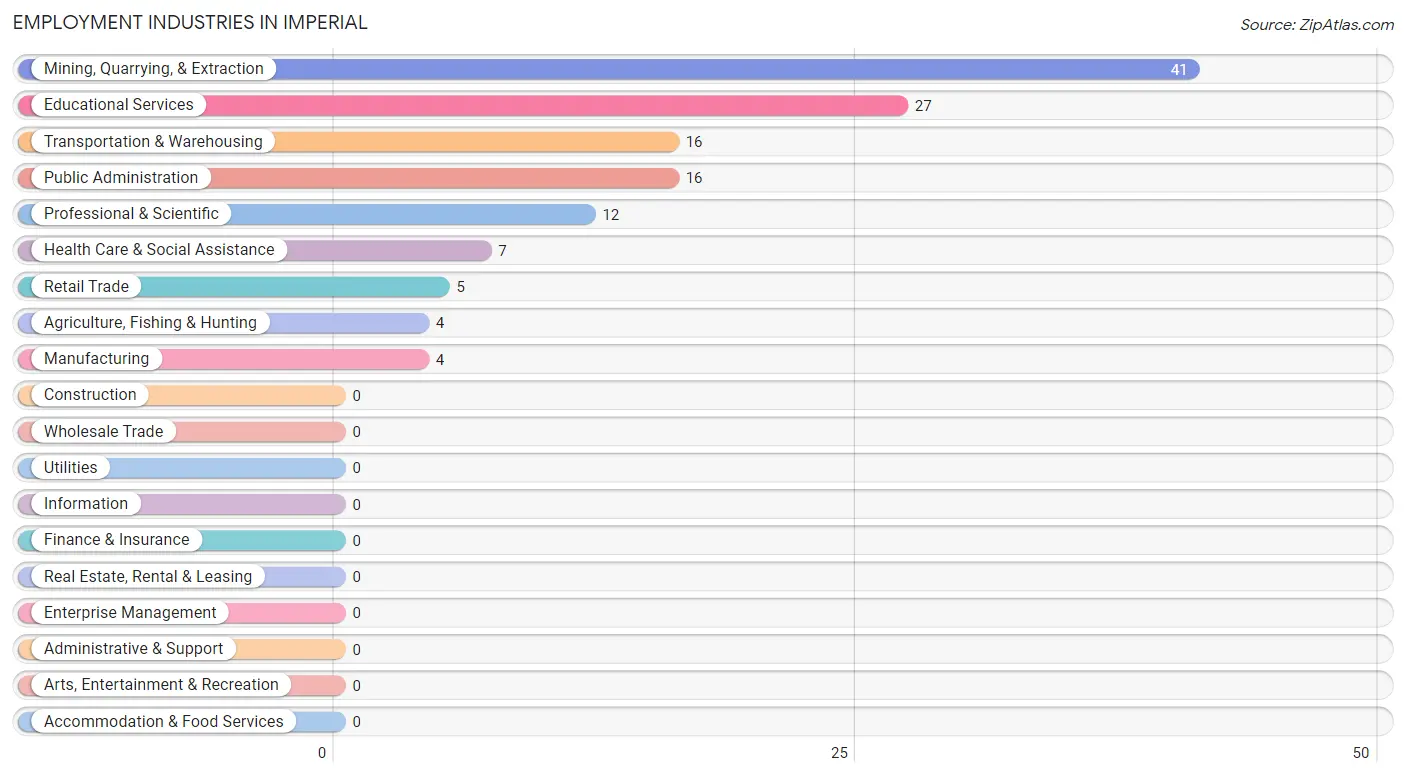
Employment Industries in Imperial
The major employment industries in Imperial include Mining, Quarrying, & Extraction (41 | 31.1%), Educational Services (27 | 20.4%), Transportation & Warehousing (16 | 12.1%), Public Administration (16 | 12.1%), and Professional & Scientific (12 | 9.1%).
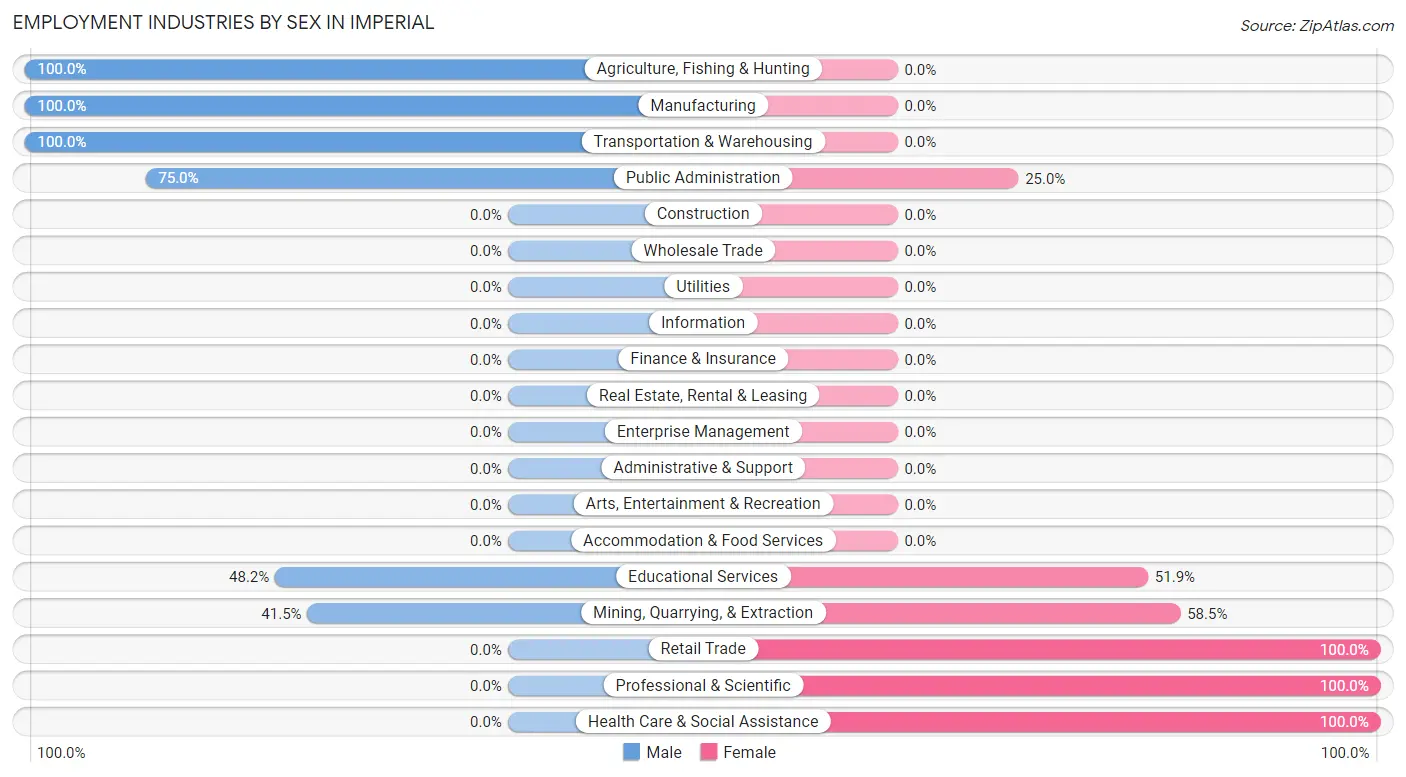
Employment Industries by Sex in Imperial
The Imperial industries that see more men than women are Agriculture, Fishing & Hunting (100.0%), Manufacturing (100.0%), and Transportation & Warehousing (100.0%), whereas the industries that tend to have a higher number of women are Retail Trade (100.0%), Professional & Scientific (100.0%), and Health Care & Social Assistance (100.0%).
| Industry | Male | Female |
| Agriculture, Fishing & Hunting | 4 (100.0%) | 0 (0.0%) |
| Mining, Quarrying, & Extraction | 17 (41.5%) | 24 (58.5%) |
| Construction | 0 (0.0%) | 0 (0.0%) |
| Manufacturing | 4 (100.0%) | 0 (0.0%) |
| Wholesale Trade | 0 (0.0%) | 0 (0.0%) |
| Retail Trade | 0 (0.0%) | 5 (100.0%) |
| Transportation & Warehousing | 16 (100.0%) | 0 (0.0%) |
| Utilities | 0 (0.0%) | 0 (0.0%) |
| Information | 0 (0.0%) | 0 (0.0%) |
| Finance & Insurance | 0 (0.0%) | 0 (0.0%) |
| Real Estate, Rental & Leasing | 0 (0.0%) | 0 (0.0%) |
| Professional & Scientific | 0 (0.0%) | 12 (100.0%) |
| Enterprise Management | 0 (0.0%) | 0 (0.0%) |
| Administrative & Support | 0 (0.0%) | 0 (0.0%) |
| Educational Services | 13 (48.1%) | 14 (51.8%) |
| Health Care & Social Assistance | 0 (0.0%) | 7 (100.0%) |
| Arts, Entertainment & Recreation | 0 (0.0%) | 0 (0.0%) |
| Accommodation & Food Services | 0 (0.0%) | 0 (0.0%) |
| Public Administration | 12 (75.0%) | 4 (25.0%) |
| Total | 66 (50.0%) | 66 (50.0%) |
Education in Imperial
School Enrollment in Imperial
The most common levels of schooling among the 54 students in Imperial are middle school (21 | 38.9%), college / undergraduate (12 | 22.2%), and kindergarten (11 | 20.4%).
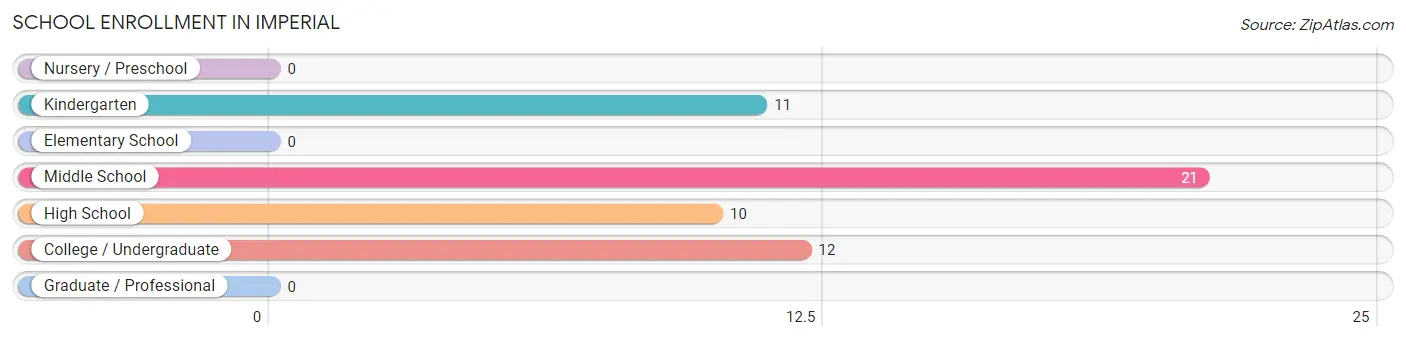
| School Level | # Students | % Students |
| Nursery / Preschool | 0 | 0.0% |
| Kindergarten | 11 | 20.4% |
| Elementary School | 0 | 0.0% |
| Middle School | 21 | 38.9% |
| High School | 10 | 18.5% |
| College / Undergraduate | 12 | 22.2% |
| Graduate / Professional | 0 | 0.0% |
| Total | 54 | 100.0% |
School Enrollment by Age by Funding Source in Imperial
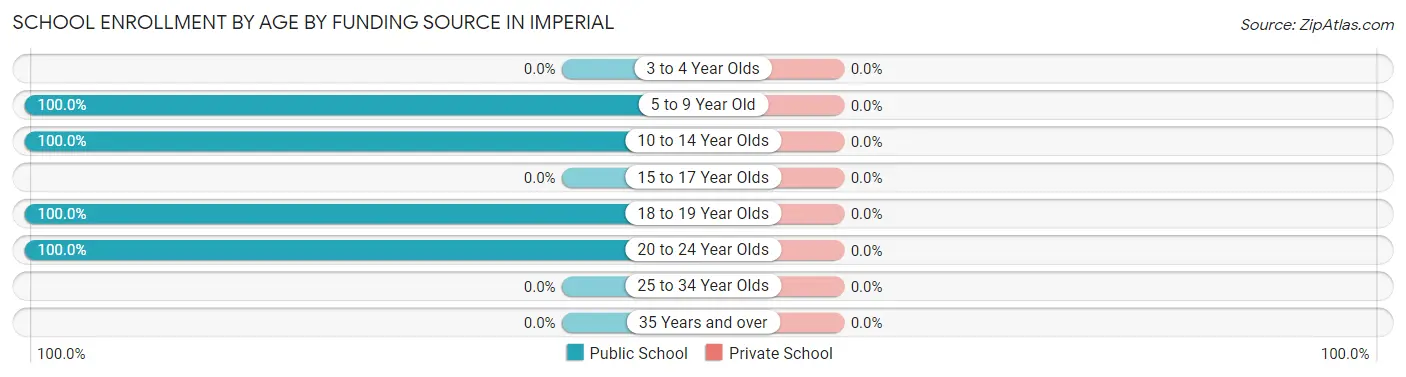
| Age Bracket | Public School | Private School |
| 3 to 4 Year Olds | 0 (0.0%) | 0 (0.0%) |
| 5 to 9 Year Old | 11 (100.0%) | 0 (0.0%) |
| 10 to 14 Year Olds | 21 (100.0%) | 0 (0.0%) |
| 15 to 17 Year Olds | 0 (0.0%) | 0 (0.0%) |
| 18 to 19 Year Olds | 10 (100.0%) | 0 (0.0%) |
| 20 to 24 Year Olds | 12 (100.0%) | 0 (0.0%) |
| 25 to 34 Year Olds | 0 (0.0%) | 0 (0.0%) |
| 35 Years and over | 0 (0.0%) | 0 (0.0%) |
| Total | 54 (100.0%) | 0 (0.0%) |
Educational Attainment by Field of Study in Imperial
Bio, nature & agricultural (22 | 40.0%), arts & humanities (13 | 23.6%), engineering (12 | 21.8%), and education (8 | 14.5%) are the most common fields of study among 55 individuals in Imperial who have obtained a bachelor's degree or higher.
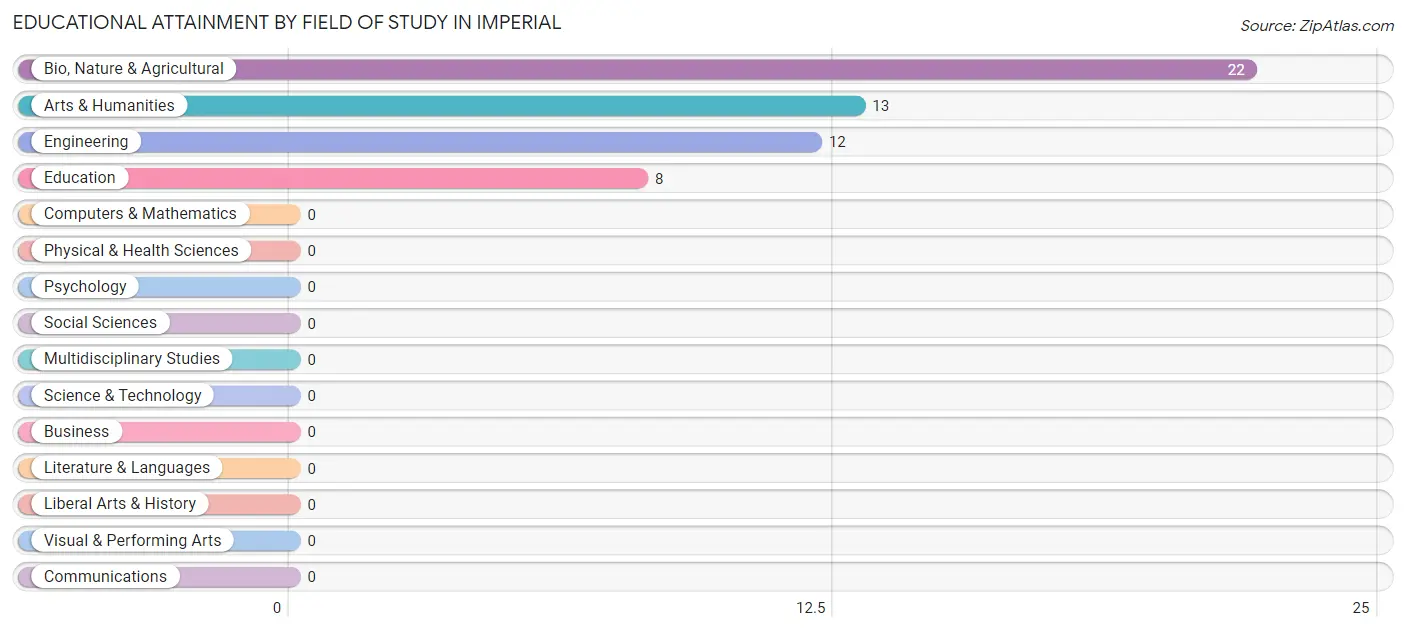
| Field of Study | # Graduates | % Graduates |
| Computers & Mathematics | 0 | 0.0% |
| Bio, Nature & Agricultural | 22 | 40.0% |
| Physical & Health Sciences | 0 | 0.0% |
| Psychology | 0 | 0.0% |
| Social Sciences | 0 | 0.0% |
| Engineering | 12 | 21.8% |
| Multidisciplinary Studies | 0 | 0.0% |
| Science & Technology | 0 | 0.0% |
| Business | 0 | 0.0% |
| Education | 8 | 14.5% |
| Literature & Languages | 0 | 0.0% |
| Liberal Arts & History | 0 | 0.0% |
| Visual & Performing Arts | 0 | 0.0% |
| Communications | 0 | 0.0% |
| Arts & Humanities | 13 | 23.6% |
| Total | 55 | 100.0% |
Transportation & Commute in Imperial
Vehicle Availability by Sex in Imperial
The most prevalent vehicle ownership categories in Imperial are males with 4 vehicles (31, accounting for 47.0%) and females with 4 vehicles (28, making up 47.0%).
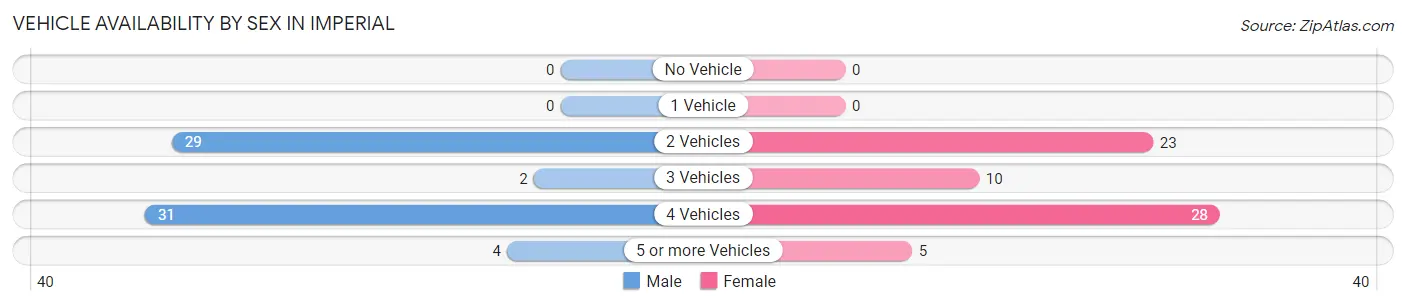
| Vehicles Available | Male | Female |
| No Vehicle | 0 (0.0%) | 0 (0.0%) |
| 1 Vehicle | 0 (0.0%) | 0 (0.0%) |
| 2 Vehicles | 29 (43.9%) | 23 (34.8%) |
| 3 Vehicles | 2 (3.0%) | 10 (15.1%) |
| 4 Vehicles | 31 (47.0%) | 28 (42.4%) |
| 5 or more Vehicles | 4 (6.1%) | 5 (7.6%) |
| Total | 66 (100.0%) | 66 (100.0%) |
Commute Time in Imperial
The most frequently occuring commute durations in Imperial are 5 to 9 minutes (43 commuters, 32.6%), 30 to 34 minutes (29 commuters, 22.0%), and 20 to 24 minutes (22 commuters, 16.7%).
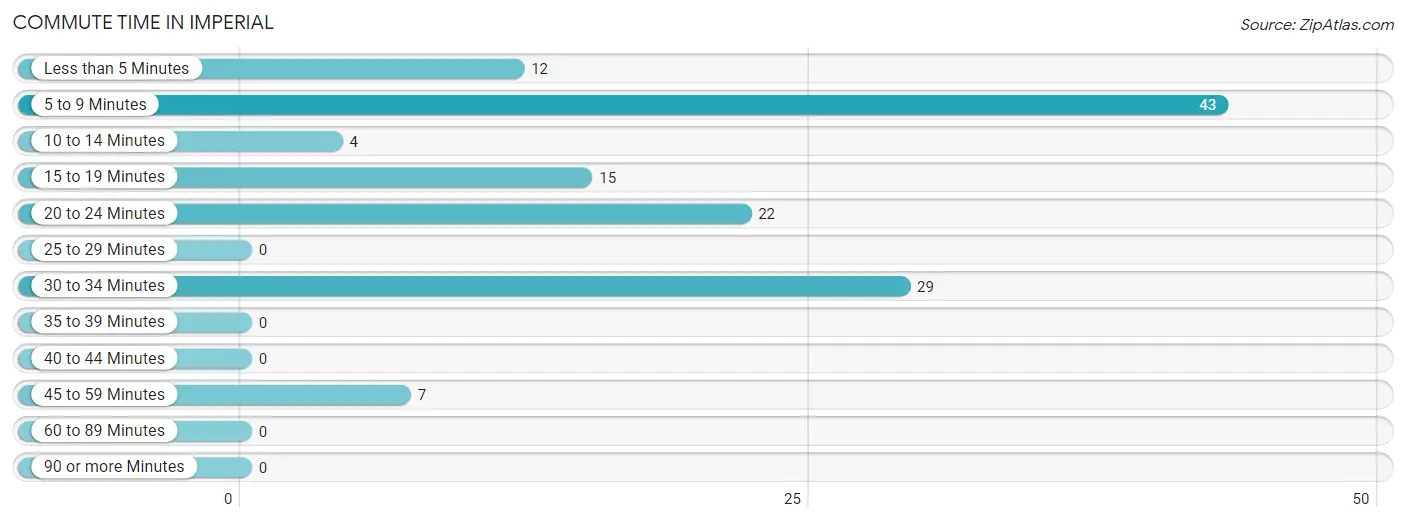
| Commute Time | # Commuters | % Commuters |
| Less than 5 Minutes | 12 | 9.1% |
| 5 to 9 Minutes | 43 | 32.6% |
| 10 to 14 Minutes | 4 | 3.0% |
| 15 to 19 Minutes | 15 | 11.4% |
| 20 to 24 Minutes | 22 | 16.7% |
| 25 to 29 Minutes | 0 | 0.0% |
| 30 to 34 Minutes | 29 | 22.0% |
| 35 to 39 Minutes | 0 | 0.0% |
| 40 to 44 Minutes | 0 | 0.0% |
| 45 to 59 Minutes | 7 | 5.3% |
| 60 to 89 Minutes | 0 | 0.0% |
| 90 or more Minutes | 0 | 0.0% |
Commute Time by Sex in Imperial
The most common commute times in Imperial are 5 to 9 minutes (25 commuters, 37.9%) for males and 5 to 9 minutes (18 commuters, 27.3%) for females.
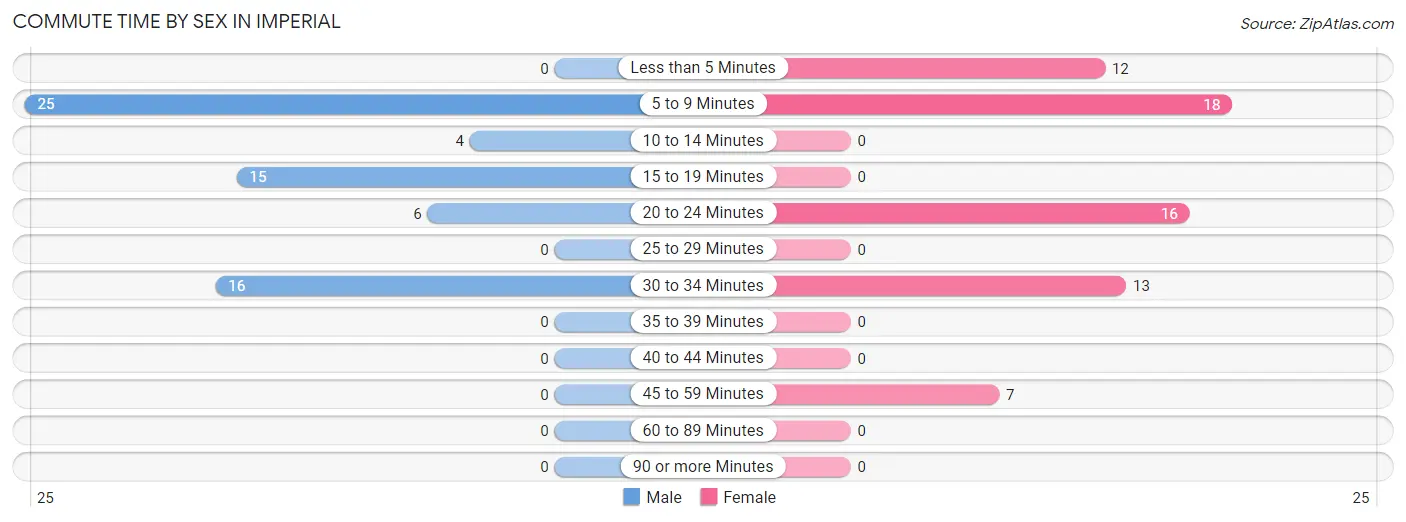
| Commute Time | Male | Female |
| Less than 5 Minutes | 0 (0.0%) | 12 (18.2%) |
| 5 to 9 Minutes | 25 (37.9%) | 18 (27.3%) |
| 10 to 14 Minutes | 4 (6.1%) | 0 (0.0%) |
| 15 to 19 Minutes | 15 (22.7%) | 0 (0.0%) |
| 20 to 24 Minutes | 6 (9.1%) | 16 (24.2%) |
| 25 to 29 Minutes | 0 (0.0%) | 0 (0.0%) |
| 30 to 34 Minutes | 16 (24.2%) | 13 (19.7%) |
| 35 to 39 Minutes | 0 (0.0%) | 0 (0.0%) |
| 40 to 44 Minutes | 0 (0.0%) | 0 (0.0%) |
| 45 to 59 Minutes | 0 (0.0%) | 7 (10.6%) |
| 60 to 89 Minutes | 0 (0.0%) | 0 (0.0%) |
| 90 or more Minutes | 0 (0.0%) | 0 (0.0%) |
Time of Departure to Work by Sex in Imperial
The most frequent times of departure to work in Imperial are 6:30 AM to 6:59 AM (31, 47.0%) for males and 7:00 AM to 7:29 AM (24, 36.4%) for females.
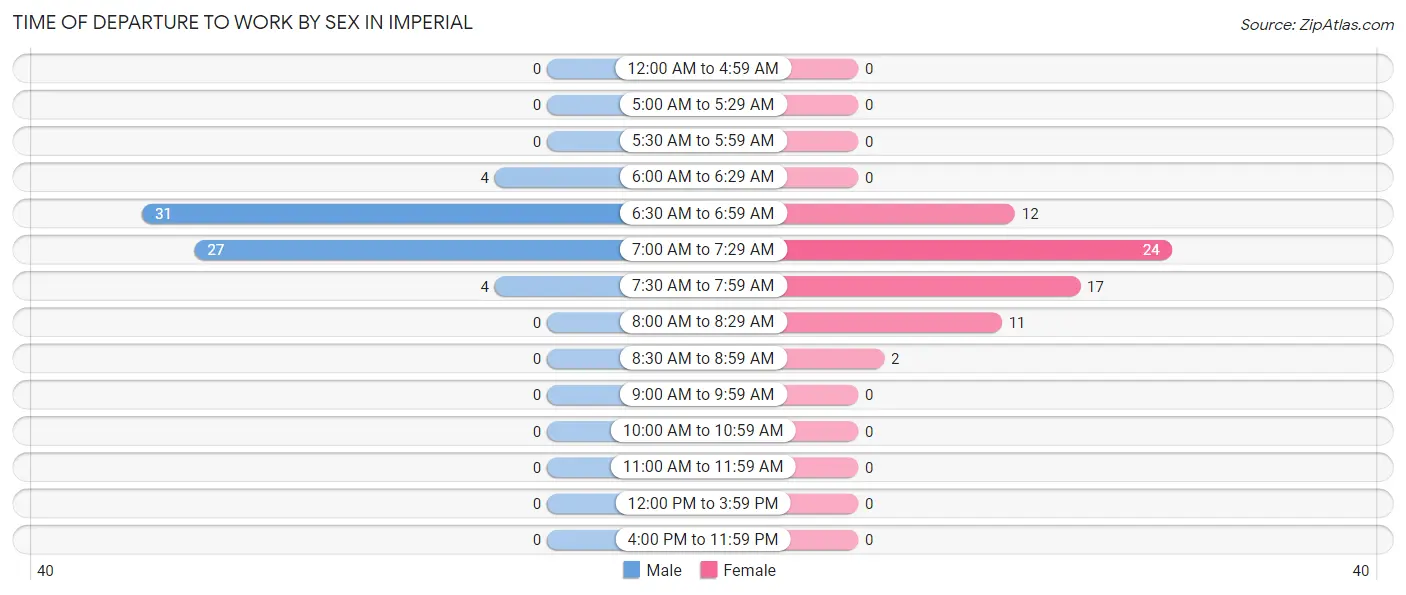
| Time of Departure | Male | Female |
| 12:00 AM to 4:59 AM | 0 (0.0%) | 0 (0.0%) |
| 5:00 AM to 5:29 AM | 0 (0.0%) | 0 (0.0%) |
| 5:30 AM to 5:59 AM | 0 (0.0%) | 0 (0.0%) |
| 6:00 AM to 6:29 AM | 4 (6.1%) | 0 (0.0%) |
| 6:30 AM to 6:59 AM | 31 (47.0%) | 12 (18.2%) |
| 7:00 AM to 7:29 AM | 27 (40.9%) | 24 (36.4%) |
| 7:30 AM to 7:59 AM | 4 (6.1%) | 17 (25.8%) |
| 8:00 AM to 8:29 AM | 0 (0.0%) | 11 (16.7%) |
| 8:30 AM to 8:59 AM | 0 (0.0%) | 2 (3.0%) |
| 9:00 AM to 9:59 AM | 0 (0.0%) | 0 (0.0%) |
| 10:00 AM to 10:59 AM | 0 (0.0%) | 0 (0.0%) |
| 11:00 AM to 11:59 AM | 0 (0.0%) | 0 (0.0%) |
| 12:00 PM to 3:59 PM | 0 (0.0%) | 0 (0.0%) |
| 4:00 PM to 11:59 PM | 0 (0.0%) | 0 (0.0%) |
| Total | 66 (100.0%) | 66 (100.0%) |
Housing Occupancy in Imperial
Occupancy by Ownership in Imperial
Of the total 94 dwellings in Imperial, owner-occupied units account for 65 (69.2%), while renter-occupied units make up 29 (30.8%).
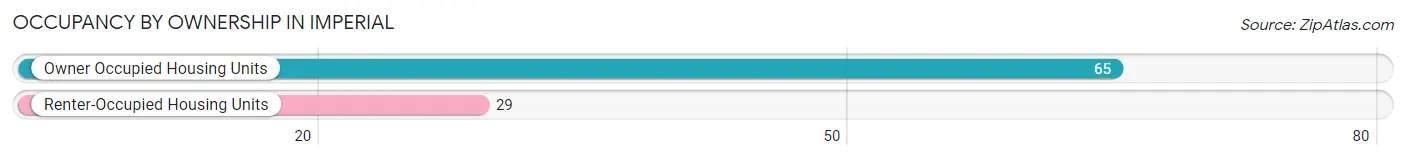
| Occupancy | # Housing Units | % Housing Units |
| Owner Occupied Housing Units | 65 | 69.2% |
| Renter-Occupied Housing Units | 29 | 30.8% |
| Total Occupied Housing Units | 94 | 100.0% |
Occupancy by Household Size in Imperial
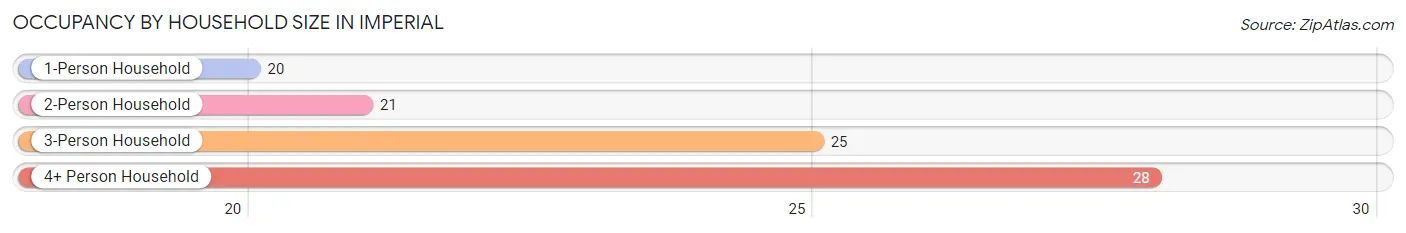
| Household Size | # Housing Units | % Housing Units |
| 1-Person Household | 20 | 21.3% |
| 2-Person Household | 21 | 22.3% |
| 3-Person Household | 25 | 26.6% |
| 4+ Person Household | 28 | 29.8% |
| Total Housing Units | 94 | 100.0% |
Occupancy by Ownership by Household Size in Imperial
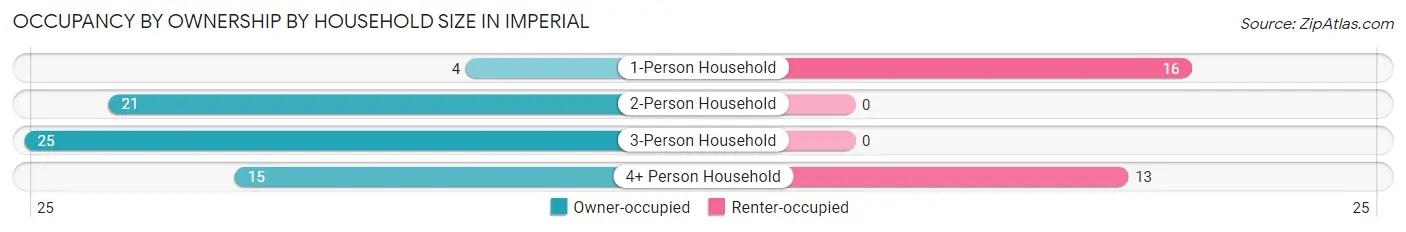
| Household Size | Owner-occupied | Renter-occupied |
| 1-Person Household | 4 (20.0%) | 16 (80.0%) |
| 2-Person Household | 21 (100.0%) | 0 (0.0%) |
| 3-Person Household | 25 (100.0%) | 0 (0.0%) |
| 4+ Person Household | 15 (53.6%) | 13 (46.4%) |
| Total Housing Units | 65 (69.2%) | 29 (30.8%) |
Occupancy by Educational Attainment in Imperial
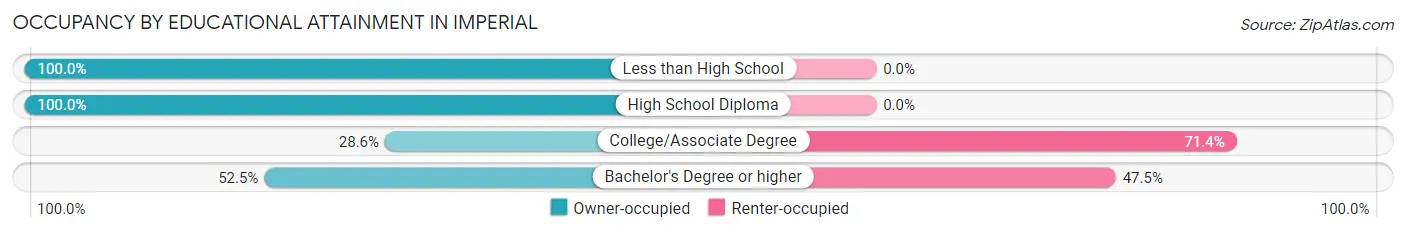
| Household Size | Owner-occupied | Renter-occupied |
| Less than High School | 8 (100.0%) | 0 (0.0%) |
| High School Diploma | 32 (100.0%) | 0 (0.0%) |
| College/Associate Degree | 4 (28.6%) | 10 (71.4%) |
| Bachelor's Degree or higher | 21 (52.5%) | 19 (47.5%) |
Occupancy by Age of Householder in Imperial
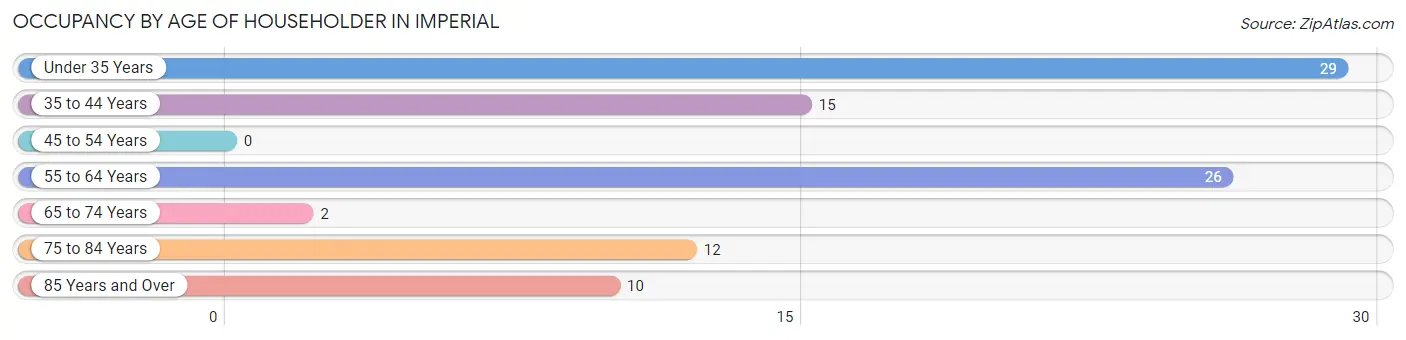
| Age Bracket | # Households | % Households |
| Under 35 Years | 29 | 30.8% |
| 35 to 44 Years | 15 | 16.0% |
| 45 to 54 Years | 0 | 0.0% |
| 55 to 64 Years | 26 | 27.7% |
| 65 to 74 Years | 2 | 2.1% |
| 75 to 84 Years | 12 | 12.8% |
| 85 Years and Over | 10 | 10.6% |
| Total | 94 | 100.0% |
Housing Finances in Imperial
Median Income by Occupancy in Imperial
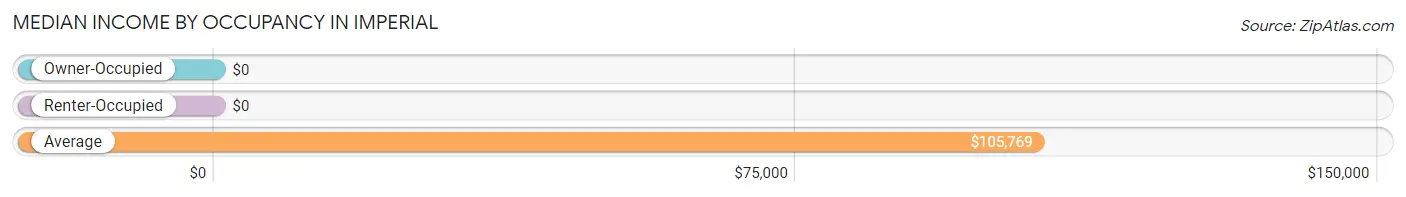
| Occupancy Type | # Households | Median Income |
| Owner-Occupied | 65 (69.2%) | $0 |
| Renter-Occupied | 29 (30.8%) | $0 |
| Average | 94 (100.0%) | $105,769 |
Occupancy by Householder Income Bracket in Imperial
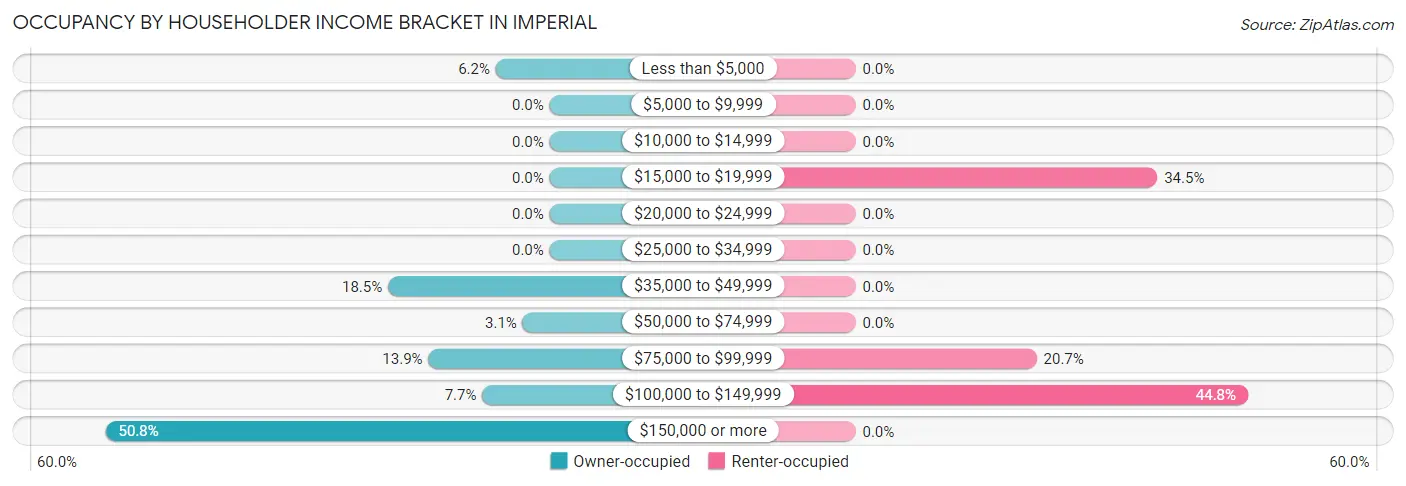
| Income Bracket | Owner-occupied | Renter-occupied |
| Less than $5,000 | 4 (6.1%) | 0 (0.0%) |
| $5,000 to $9,999 | 0 (0.0%) | 0 (0.0%) |
| $10,000 to $14,999 | 0 (0.0%) | 0 (0.0%) |
| $15,000 to $19,999 | 0 (0.0%) | 10 (34.5%) |
| $20,000 to $24,999 | 0 (0.0%) | 0 (0.0%) |
| $25,000 to $34,999 | 0 (0.0%) | 0 (0.0%) |
| $35,000 to $49,999 | 12 (18.5%) | 0 (0.0%) |
| $50,000 to $74,999 | 2 (3.1%) | 0 (0.0%) |
| $75,000 to $99,999 | 9 (13.9%) | 6 (20.7%) |
| $100,000 to $149,999 | 5 (7.7%) | 13 (44.8%) |
| $150,000 or more | 33 (50.8%) | 0 (0.0%) |
| Total | 65 (100.0%) | 29 (100.0%) |
Monthly Housing Cost Tiers in Imperial
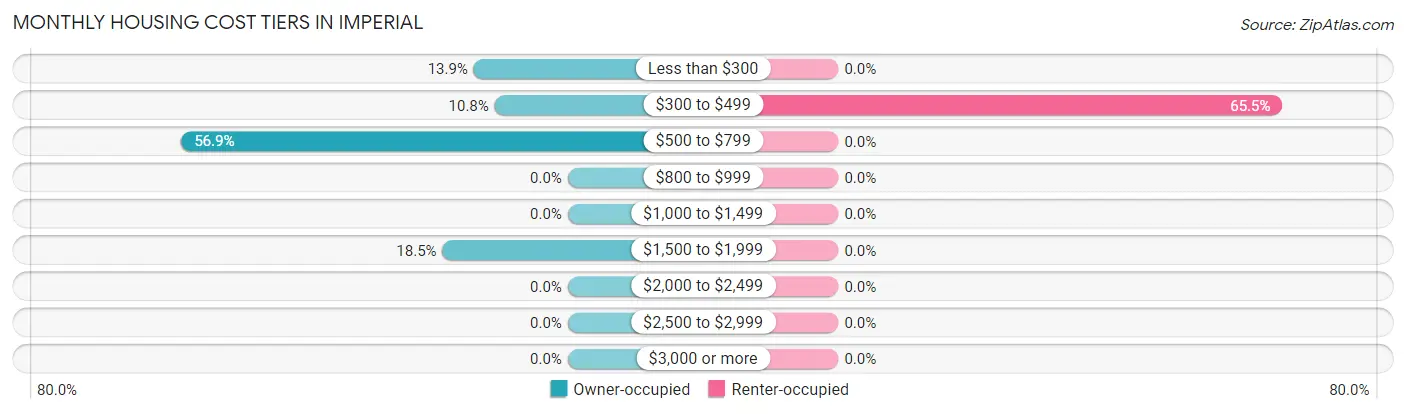
| Monthly Cost | Owner-occupied | Renter-occupied |
| Less than $300 | 9 (13.9%) | 0 (0.0%) |
| $300 to $499 | 7 (10.8%) | 19 (65.5%) |
| $500 to $799 | 37 (56.9%) | 0 (0.0%) |
| $800 to $999 | 0 (0.0%) | 0 (0.0%) |
| $1,000 to $1,499 | 0 (0.0%) | 0 (0.0%) |
| $1,500 to $1,999 | 12 (18.5%) | 0 (0.0%) |
| $2,000 to $2,499 | 0 (0.0%) | 0 (0.0%) |
| $2,500 to $2,999 | 0 (0.0%) | 0 (0.0%) |
| $3,000 or more | 0 (0.0%) | 0 (0.0%) |
| Total | 65 (100.0%) | 29 (100.0%) |
Physical Housing Characteristics in Imperial
Housing Structures in Imperial
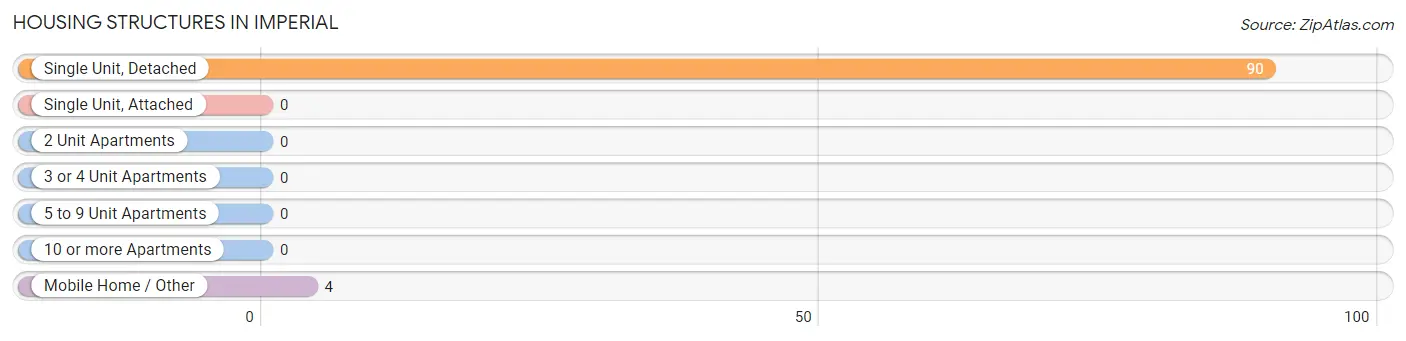
| Structure Type | # Housing Units | % Housing Units |
| Single Unit, Detached | 90 | 95.7% |
| Single Unit, Attached | 0 | 0.0% |
| 2 Unit Apartments | 0 | 0.0% |
| 3 or 4 Unit Apartments | 0 | 0.0% |
| 5 to 9 Unit Apartments | 0 | 0.0% |
| 10 or more Apartments | 0 | 0.0% |
| Mobile Home / Other | 4 | 4.3% |
| Total | 94 | 100.0% |
Housing Structures by Occupancy in Imperial
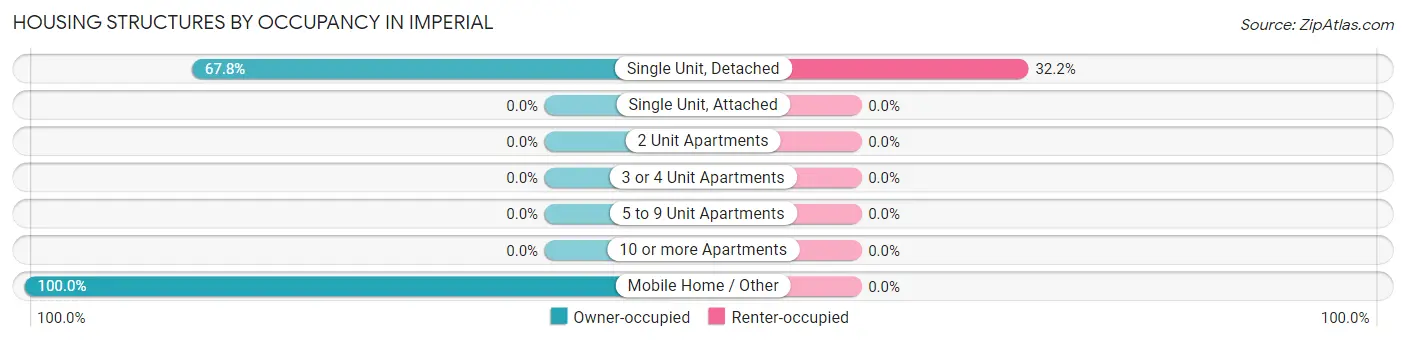
| Structure Type | Owner-occupied | Renter-occupied |
| Single Unit, Detached | 61 (67.8%) | 29 (32.2%) |
| Single Unit, Attached | 0 (0.0%) | 0 (0.0%) |
| 2 Unit Apartments | 0 (0.0%) | 0 (0.0%) |
| 3 or 4 Unit Apartments | 0 (0.0%) | 0 (0.0%) |
| 5 to 9 Unit Apartments | 0 (0.0%) | 0 (0.0%) |
| 10 or more Apartments | 0 (0.0%) | 0 (0.0%) |
| Mobile Home / Other | 4 (100.0%) | 0 (0.0%) |
| Total | 65 (69.2%) | 29 (30.8%) |
Housing Structures by Number of Rooms in Imperial
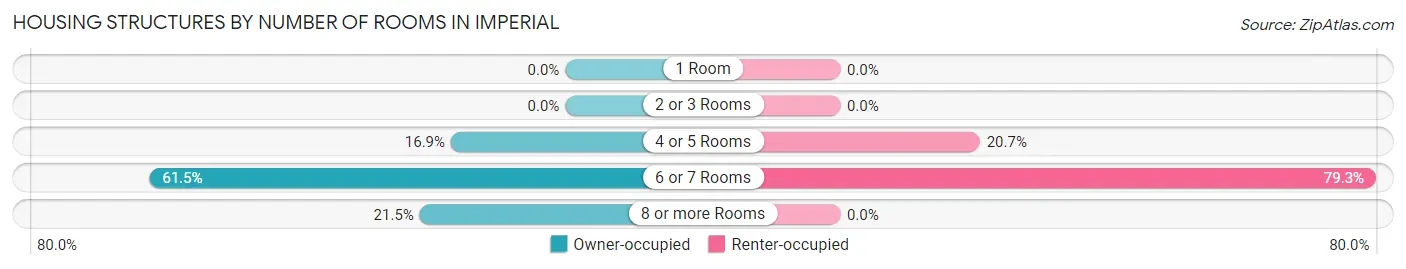
| Number of Rooms | Owner-occupied | Renter-occupied |
| 1 Room | 0 (0.0%) | 0 (0.0%) |
| 2 or 3 Rooms | 0 (0.0%) | 0 (0.0%) |
| 4 or 5 Rooms | 11 (16.9%) | 6 (20.7%) |
| 6 or 7 Rooms | 40 (61.5%) | 23 (79.3%) |
| 8 or more Rooms | 14 (21.5%) | 0 (0.0%) |
| Total | 65 (100.0%) | 29 (100.0%) |
Housing Structure by Heating Type in Imperial
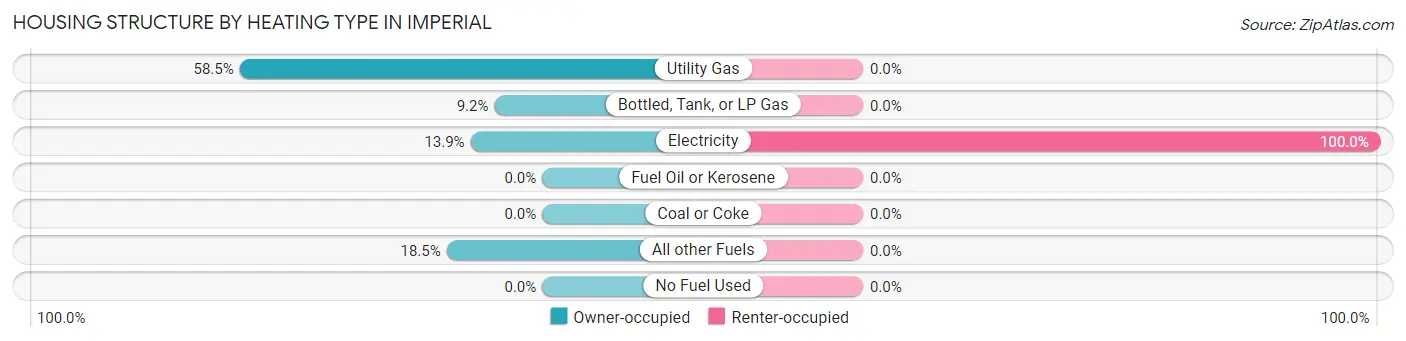
| Heating Type | Owner-occupied | Renter-occupied |
| Utility Gas | 38 (58.5%) | 0 (0.0%) |
| Bottled, Tank, or LP Gas | 6 (9.2%) | 0 (0.0%) |
| Electricity | 9 (13.9%) | 29 (100.0%) |
| Fuel Oil or Kerosene | 0 (0.0%) | 0 (0.0%) |
| Coal or Coke | 0 (0.0%) | 0 (0.0%) |
| All other Fuels | 12 (18.5%) | 0 (0.0%) |
| No Fuel Used | 0 (0.0%) | 0 (0.0%) |
| Total | 65 (100.0%) | 29 (100.0%) |
Household Vehicle Usage in Imperial
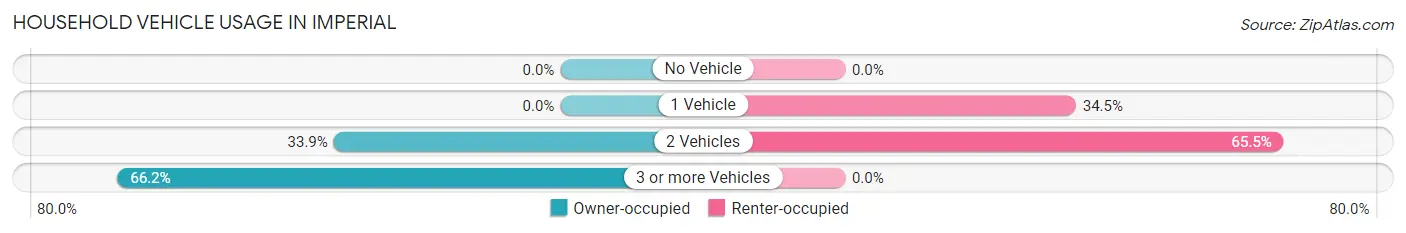
| Vehicles per Household | Owner-occupied | Renter-occupied |
| No Vehicle | 0 (0.0%) | 0 (0.0%) |
| 1 Vehicle | 0 (0.0%) | 10 (34.5%) |
| 2 Vehicles | 22 (33.9%) | 19 (65.5%) |
| 3 or more Vehicles | 43 (66.1%) | 0 (0.0%) |
| Total | 65 (100.0%) | 29 (100.0%) |
Real Estate & Mortgages in Imperial
Real Estate and Mortgage Overview in Imperial
| Characteristic | Without Mortgage | With Mortgage |
| Housing Units | 65 | 0 |
| Median Property Value | - | - |
| Median Household Income | - | - |
| Monthly Housing Costs | $547 | $0 |
| Real Estate Taxes | $1,016 | $0 |
Property Value by Mortgage Status in Imperial
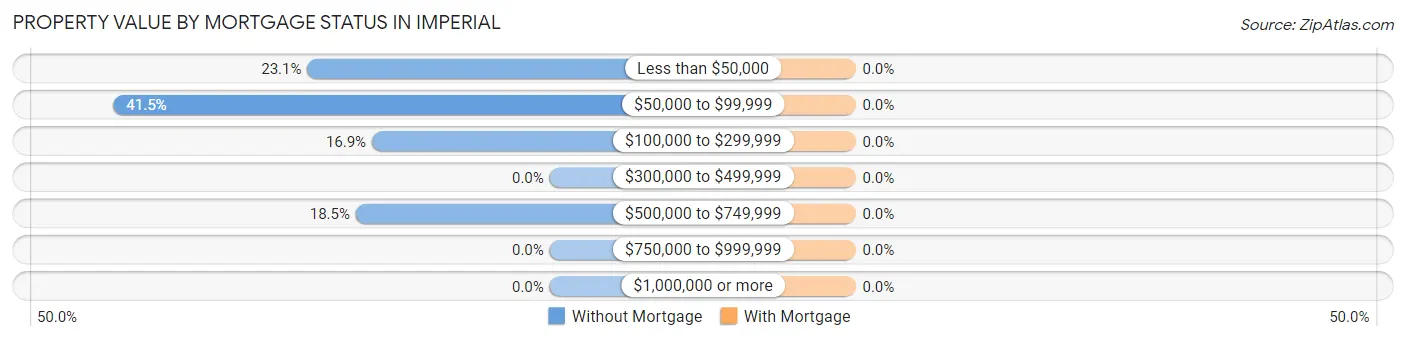
| Property Value | Without Mortgage | With Mortgage |
| Less than $50,000 | 15 (23.1%) | 0 (0.0%) |
| $50,000 to $99,999 | 27 (41.5%) | 0 (0.0%) |
| $100,000 to $299,999 | 11 (16.9%) | 0 (0.0%) |
| $300,000 to $499,999 | 0 (0.0%) | 0 (0.0%) |
| $500,000 to $749,999 | 12 (18.5%) | 0 (0.0%) |
| $750,000 to $999,999 | 0 (0.0%) | 0 (0.0%) |
| $1,000,000 or more | 0 (0.0%) | 0 (0.0%) |
| Total | 65 (100.0%) | 0 (0.0%) |
Household Income by Mortgage Status in Imperial
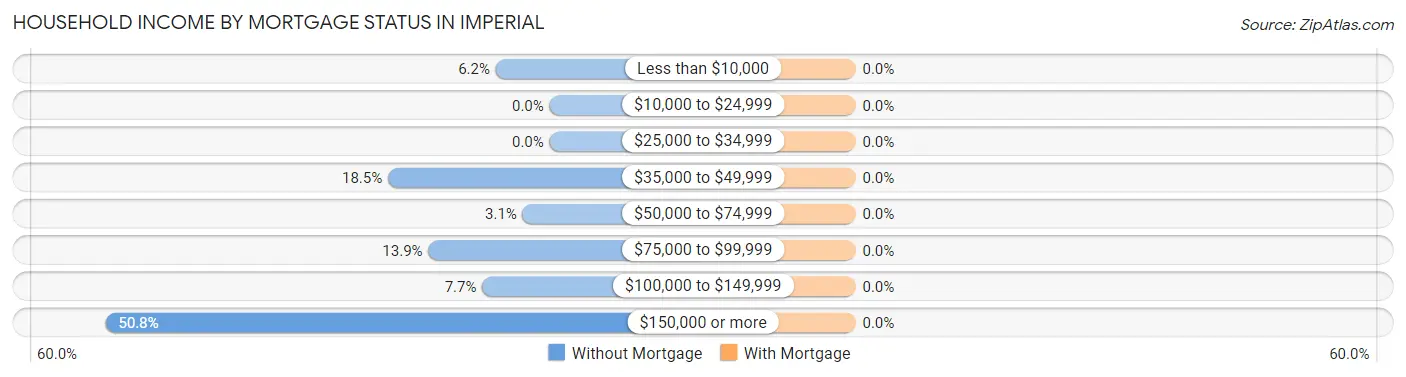
| Household Income | Without Mortgage | With Mortgage |
| Less than $10,000 | 4 (6.1%) | 0 (0.0%) |
| $10,000 to $24,999 | 0 (0.0%) | 0 (0.0%) |
| $25,000 to $34,999 | 0 (0.0%) | 0 (0.0%) |
| $35,000 to $49,999 | 12 (18.5%) | 0 (0.0%) |
| $50,000 to $74,999 | 2 (3.1%) | 0 (0.0%) |
| $75,000 to $99,999 | 9 (13.9%) | 0 (0.0%) |
| $100,000 to $149,999 | 5 (7.7%) | 0 (0.0%) |
| $150,000 or more | 33 (50.8%) | 0 (0.0%) |
| Total | 65 (100.0%) | 0 (0.0%) |
Property Value to Household Income Ratio in Imperial
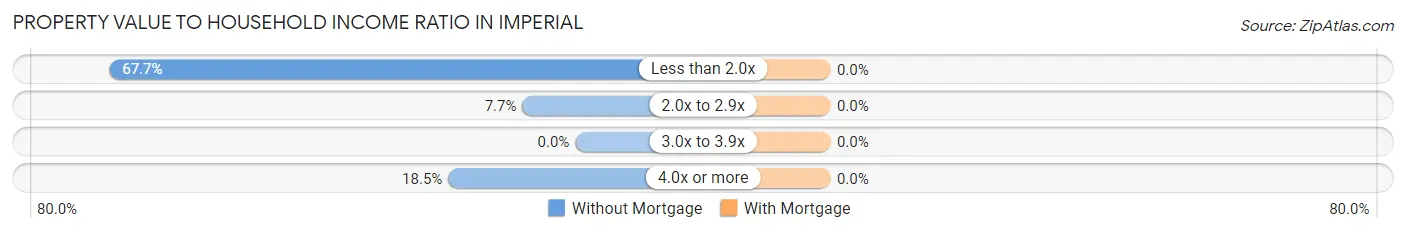
| Value-to-Income Ratio | Without Mortgage | With Mortgage |
| Less than 2.0x | 44 (67.7%) | 0 (0.0%) |
| 2.0x to 2.9x | 5 (7.7%) | 0 (0.0%) |
| 3.0x to 3.9x | 0 (0.0%) | 0 (0.0%) |
| 4.0x or more | 12 (18.5%) | 0 (0.0%) |
| Total | 65 (100.0%) | 0 (0.0%) |
Real Estate Taxes by Mortgage Status in Imperial
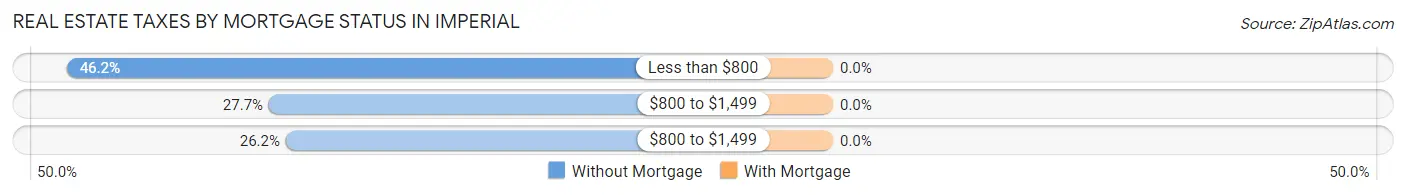
| Property Taxes | Without Mortgage | With Mortgage |
| Less than $800 | 30 (46.2%) | 0 (0.0%) |
| $800 to $1,499 | 18 (27.7%) | 0 (0.0%) |
| $800 to $1,499 | 17 (26.2%) | 0 (0.0%) |
| Total | 65 (100.0%) | 0 (0.0%) |
Health & Disability in Imperial
Health Insurance Coverage by Age in Imperial
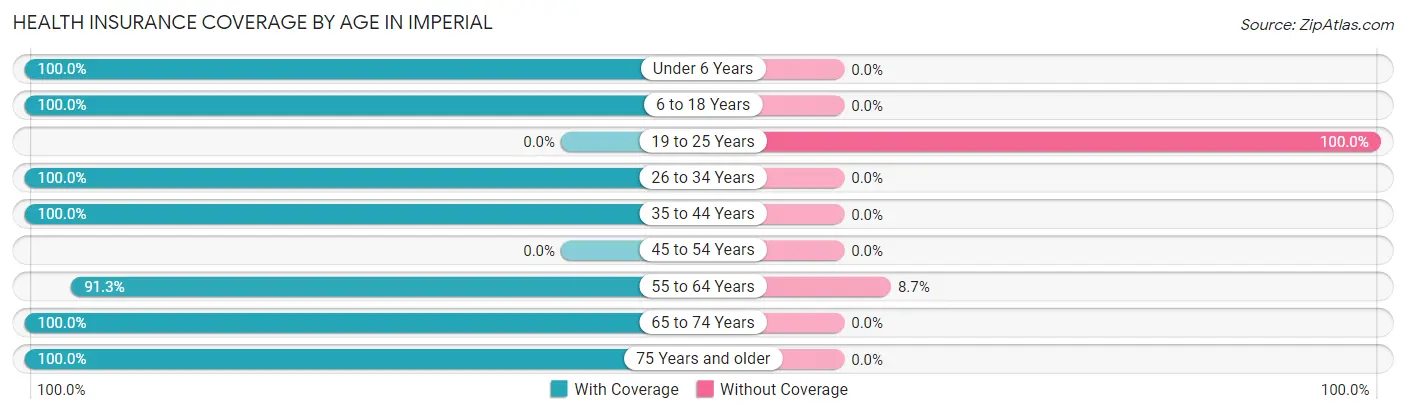
| Age Bracket | With Coverage | Without Coverage |
| Under 6 Years | 29 (100.0%) | 0 (0.0%) |
| 6 to 18 Years | 42 (100.0%) | 0 (0.0%) |
| 19 to 25 Years | 0 (0.0%) | 15 (100.0%) |
| 26 to 34 Years | 37 (100.0%) | 0 (0.0%) |
| 35 to 44 Years | 43 (100.0%) | 0 (0.0%) |
| 45 to 54 Years | 0 (0.0%) | 0 (0.0%) |
| 55 to 64 Years | 42 (91.3%) | 4 (8.7%) |
| 65 to 74 Years | 10 (100.0%) | 0 (0.0%) |
| 75 Years and older | 36 (100.0%) | 0 (0.0%) |
| Total | 239 (92.6%) | 19 (7.4%) |
Health Insurance Coverage by Citizenship Status in Imperial
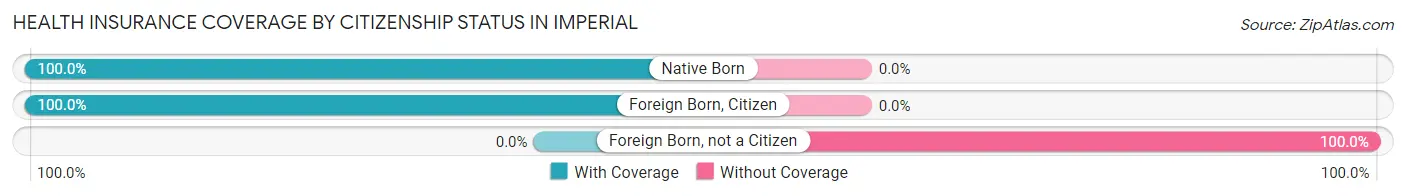
| Citizenship Status | With Coverage | Without Coverage |
| Native Born | 29 (100.0%) | 0 (0.0%) |
| Foreign Born, Citizen | 42 (100.0%) | 0 (0.0%) |
| Foreign Born, not a Citizen | 0 (0.0%) | 15 (100.0%) |
Health Insurance Coverage by Household Income in Imperial
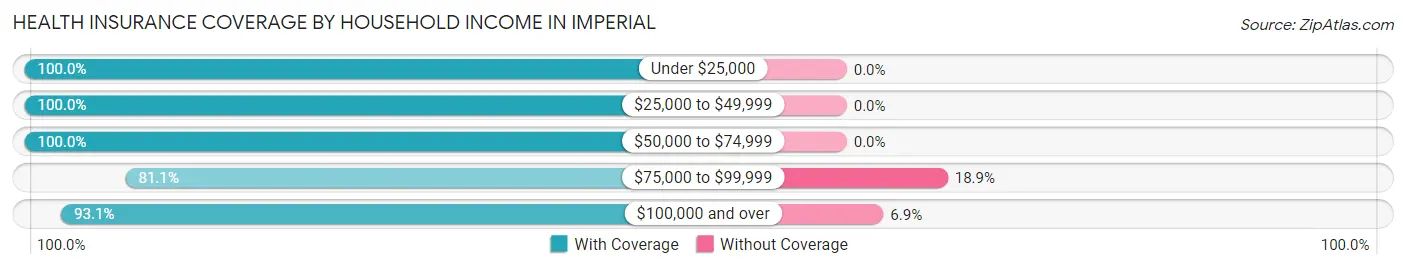
| Household Income | With Coverage | Without Coverage |
| Under $25,000 | 14 (100.0%) | 0 (0.0%) |
| $25,000 to $49,999 | 26 (100.0%) | 0 (0.0%) |
| $50,000 to $74,999 | 6 (100.0%) | 0 (0.0%) |
| $75,000 to $99,999 | 30 (81.1%) | 7 (18.9%) |
| $100,000 and over | 163 (93.1%) | 12 (6.9%) |
Public vs Private Health Insurance Coverage by Age in Imperial
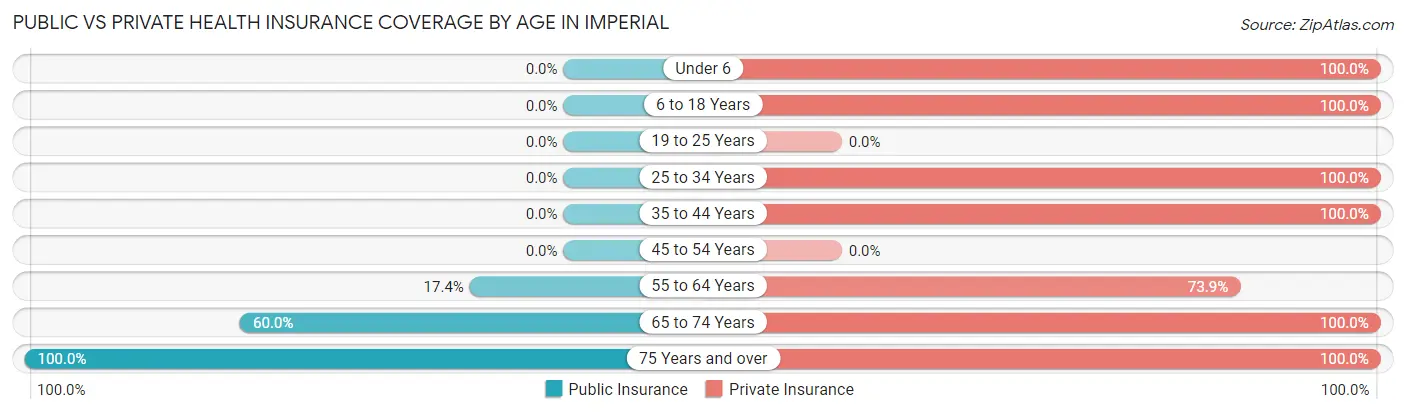
| Age Bracket | Public Insurance | Private Insurance |
| Under 6 | 0 (0.0%) | 29 (100.0%) |
| 6 to 18 Years | 0 (0.0%) | 42 (100.0%) |
| 19 to 25 Years | 0 (0.0%) | 0 (0.0%) |
| 25 to 34 Years | 0 (0.0%) | 37 (100.0%) |
| 35 to 44 Years | 0 (0.0%) | 43 (100.0%) |
| 45 to 54 Years | 0 (0.0%) | 0 (0.0%) |
| 55 to 64 Years | 8 (17.4%) | 34 (73.9%) |
| 65 to 74 Years | 6 (60.0%) | 10 (100.0%) |
| 75 Years and over | 36 (100.0%) | 36 (100.0%) |
| Total | 50 (19.4%) | 231 (89.5%) |
Disability Status by Sex by Age in Imperial
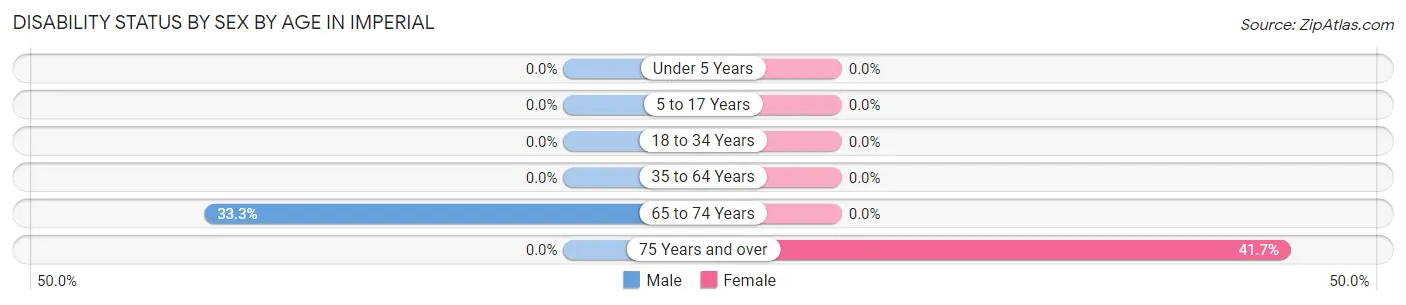
| Age Bracket | Male | Female |
| Under 5 Years | 0 (0.0%) | 0 (0.0%) |
| 5 to 17 Years | 0 (0.0%) | 0 (0.0%) |
| 18 to 34 Years | 0 (0.0%) | 0 (0.0%) |
| 35 to 64 Years | 0 (0.0%) | 0 (0.0%) |
| 65 to 74 Years | 2 (33.3%) | 0 (0.0%) |
| 75 Years and over | 0 (0.0%) | 10 (41.7%) |
Disability Class by Sex by Age in Imperial
Disability Class: Hearing Difficulty
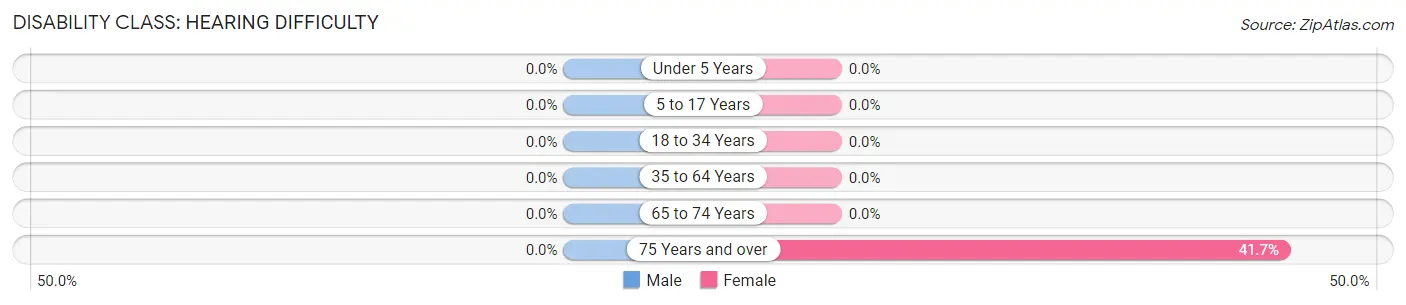
| Age Bracket | Male | Female |
| Under 5 Years | 0 (0.0%) | 0 (0.0%) |
| 5 to 17 Years | 0 (0.0%) | 0 (0.0%) |
| 18 to 34 Years | 0 (0.0%) | 0 (0.0%) |
| 35 to 64 Years | 0 (0.0%) | 0 (0.0%) |
| 65 to 74 Years | 0 (0.0%) | 0 (0.0%) |
| 75 Years and over | 0 (0.0%) | 10 (41.7%) |
Disability Class: Vision Difficulty
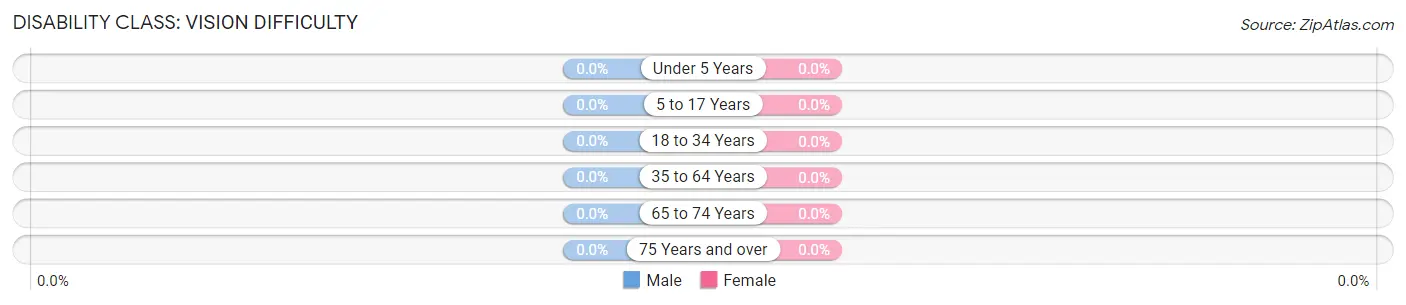
| Age Bracket | Male | Female |
| Under 5 Years | 0 (0.0%) | 0 (0.0%) |
| 5 to 17 Years | 0 (0.0%) | 0 (0.0%) |
| 18 to 34 Years | 0 (0.0%) | 0 (0.0%) |
| 35 to 64 Years | 0 (0.0%) | 0 (0.0%) |
| 65 to 74 Years | 0 (0.0%) | 0 (0.0%) |
| 75 Years and over | 0 (0.0%) | 0 (0.0%) |
Disability Class: Cognitive Difficulty
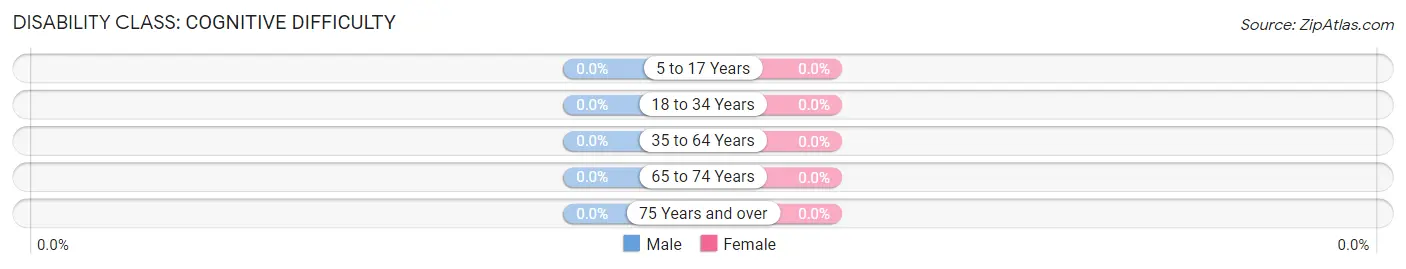
| Age Bracket | Male | Female |
| 5 to 17 Years | 0 (0.0%) | 0 (0.0%) |
| 18 to 34 Years | 0 (0.0%) | 0 (0.0%) |
| 35 to 64 Years | 0 (0.0%) | 0 (0.0%) |
| 65 to 74 Years | 0 (0.0%) | 0 (0.0%) |
| 75 Years and over | 0 (0.0%) | 0 (0.0%) |
Disability Class: Ambulatory Difficulty
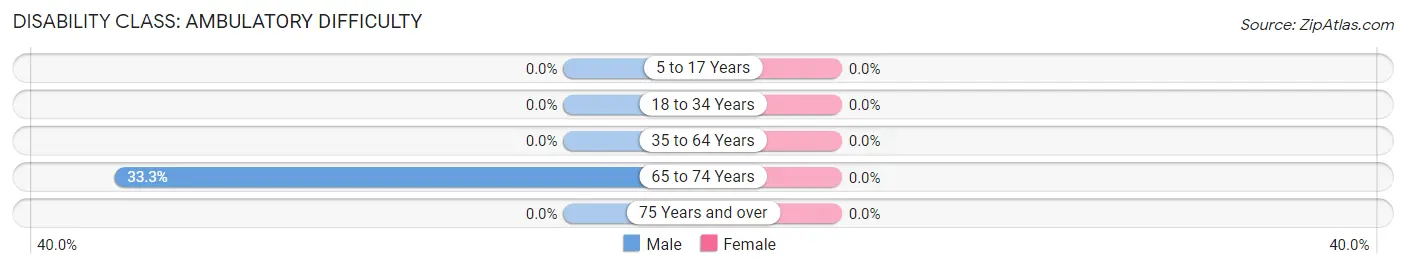
| Age Bracket | Male | Female |
| 5 to 17 Years | 0 (0.0%) | 0 (0.0%) |
| 18 to 34 Years | 0 (0.0%) | 0 (0.0%) |
| 35 to 64 Years | 0 (0.0%) | 0 (0.0%) |
| 65 to 74 Years | 2 (33.3%) | 0 (0.0%) |
| 75 Years and over | 0 (0.0%) | 0 (0.0%) |
Disability Class: Self-Care Difficulty
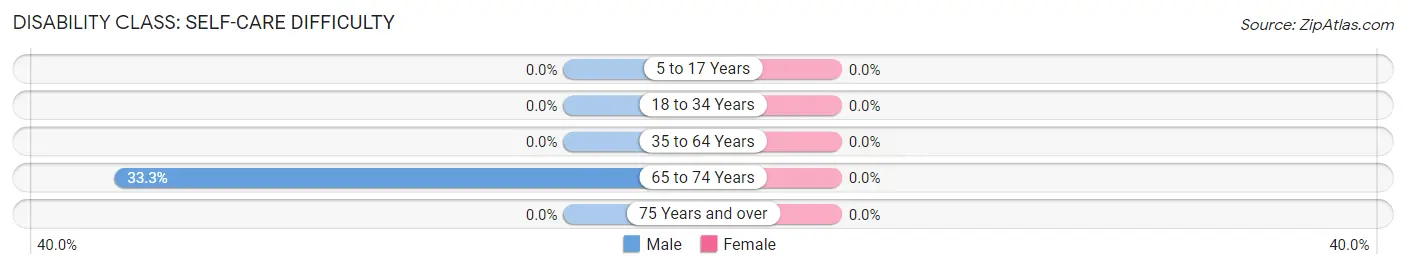
| Age Bracket | Male | Female |
| 5 to 17 Years | 0 (0.0%) | 0 (0.0%) |
| 18 to 34 Years | 0 (0.0%) | 0 (0.0%) |
| 35 to 64 Years | 0 (0.0%) | 0 (0.0%) |
| 65 to 74 Years | 2 (33.3%) | 0 (0.0%) |
| 75 Years and over | 0 (0.0%) | 0 (0.0%) |
Technology Access in Imperial
Computing Device Access in Imperial
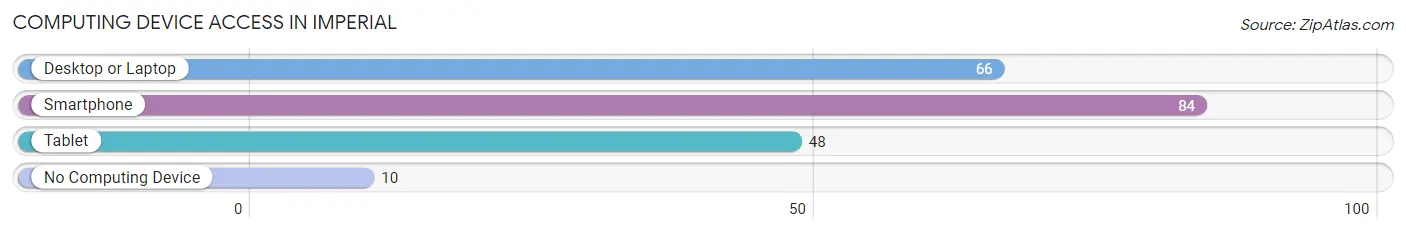
| Device Type | # Households | % Households |
| Desktop or Laptop | 66 | 70.2% |
| Smartphone | 84 | 89.4% |
| Tablet | 48 | 51.1% |
| No Computing Device | 10 | 10.6% |
| Total | 94 | 100.0% |
Internet Access in Imperial
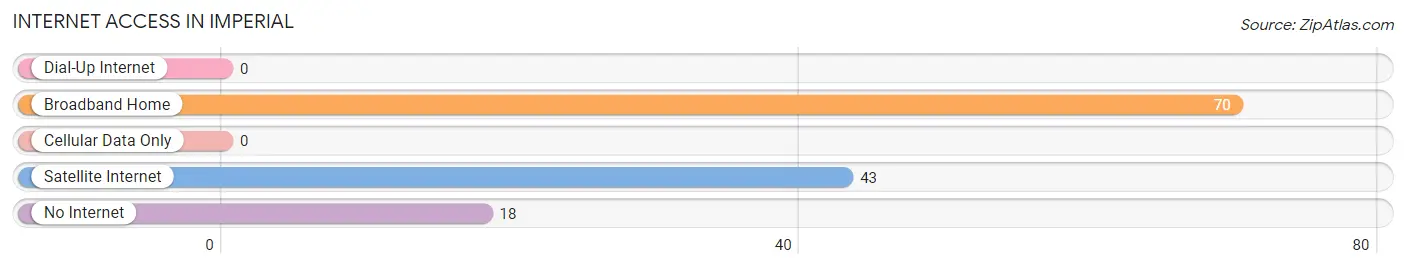
| Internet Type | # Households | % Households |
| Dial-Up Internet | 0 | 0.0% |
| Broadband Home | 70 | 74.5% |
| Cellular Data Only | 0 | 0.0% |
| Satellite Internet | 43 | 45.7% |
| No Internet | 18 | 19.2% |
| Total | 94 | 100.0% |
Imperial Summary
Imperial is a small town located in the southern part of Texas, in the county of Pecos. It is situated on the banks of the Pecos River, and is surrounded by the Chihuahuan Desert. The town has a population of around 1,500 people, and is known for its rich history and culture.
History
Imperial was founded in 1881 by a group of settlers from the nearby town of Fort Stockton. The settlers were looking for a place to settle and start a new life, and Imperial seemed to fit the bill. The town was named after the nearby Imperial Ranch, which was owned by the prominent rancher, John Chisum. The town quickly grew, and by the early 1900s, it had become a bustling center of commerce and industry.
The town was home to a number of businesses, including a hotel, a general store, a blacksmith shop, and a saloon. The town also had a school, a post office, and a bank. In the early 1900s, Imperial was a major stop on the Texas and Pacific Railway, and the town was a popular destination for travelers.
Geography
Imperial is located in the southern part of Texas, in the county of Pecos. It is situated on the banks of the Pecos River, and is surrounded by the Chihuahuan Desert. The town is located at an elevation of 2,400 feet, and has a semi-arid climate. The average temperature in the summer is around 90 degrees Fahrenheit, and the average temperature in the winter is around 50 degrees Fahrenheit.
Economy
Imperial’s economy is largely based on agriculture and ranching. The town is home to a number of farms and ranches, and the surrounding area is known for its production of cotton, sorghum, and other crops. The town is also home to a number of businesses, including a hotel, a general store, a blacksmith shop, and a saloon.
Demographics
As of the 2010 census, Imperial had a population of 1,500 people. The racial makeup of the town was 94.7% White, 0.7% African American, 0.7% Native American, 0.7% Asian, and 3.3% from other races. The median household income was $25,000, and the median family income was $30,000. The per capita income was $14,000.
Conclusion
Imperial is a small town located in the southern part of Texas, in the county of Pecos. It is situated on the banks of the Pecos River, and is surrounded by the Chihuahuan Desert. The town has a population of around 1,500 people, and is known for its rich history and culture. The town’s economy is largely based on agriculture and ranching, and the town is home to a number of businesses. The racial makeup of the town is 94.7% White, 0.7% African American, 0.7% Native American, 0.7% Asian, and 3.3% from other races. The median household income was $25,000, and the median family income was $30,000.
Common Questions
What is Per Capita Income in Imperial?
Per Capita income in Imperial is $45,951.
What is the Median Household income in Imperial?
Median Household Income in Imperial is $105,769.
What is Inequality or Gini Index in Imperial?
Inequality or Gini Index in Imperial is 0.40.
What is the Total Population of Imperial?
Total Population of Imperial is 258.
What is the Total Male Population of Imperial?
Total Male Population of Imperial is 156.
What is the Total Female Population of Imperial?
Total Female Population of Imperial is 102.
What is the Ratio of Males per 100 Females in Imperial?
There are 152.94 Males per 100 Females in Imperial.
What is the Ratio of Females per 100 Males in Imperial?
There are 65.38 Females per 100 Males in Imperial.
What is the Median Population Age in Imperial?
Median Population Age in Imperial is 36.4 Years.
What is the Average Family Size in Imperial
Average Family Size in Imperial is 3.0 People.
What is the Average Household Size in Imperial
Average Household Size in Imperial is 2.7 People.
How Large is the Labor Force in Imperial?
There are 132 People in the Labor Forcein in Imperial.
What is the Percentage of People in the Labor Force in Imperial?
67.0% of People are in the Labor Force in Imperial.