Howe, TX Map & Demographics
Howe Map
Howe Overview
$25,530
PER CAPITA INCOME
$62,772
AVG FAMILY INCOME
$59,375
AVG HOUSEHOLD INCOME
17.8%
WAGE / INCOME GAP [ % ]
82.2¢/ $1
WAGE / INCOME GAP [ $ ]
0.44
INEQUALITY / GINI INDEX
3,553
TOTAL POPULATION
1,664
MALE POPULATION
1,889
FEMALE POPULATION
88.09
MALES / 100 FEMALES
113.52
FEMALES / 100 MALES
28.2
MEDIAN AGE
3.7
AVG FAMILY SIZE
3.1
AVG HOUSEHOLD SIZE
1,849
LABOR FORCE [ PEOPLE ]
75.4%
PERCENT IN LABOR FORCE
5.3%
UNEMPLOYMENT RATE
Howe Zip Codes
Howe Area Codes
Income in Howe
Income Overview in Howe
Per Capita Income in Howe is $25,530, while median incomes of families and households are $62,772 and $59,375 respectively.
| Characteristic | Number | Measure |
| Per Capita Income | 3,553 | $25,530 |
| Median Family Income | 833 | $62,772 |
| Mean Family Income | 833 | $79,890 |
| Median Household Income | 1,161 | $59,375 |
| Mean Household Income | 1,161 | $75,290 |
| Income Deficit | 833 | $0 |
| Wage / Income Gap (%) | 3,553 | 17.82% |
| Wage / Income Gap ($) | 3,553 | 82.18¢ per $1 |
| Gini / Inequality Index | 3,553 | 0.44 |
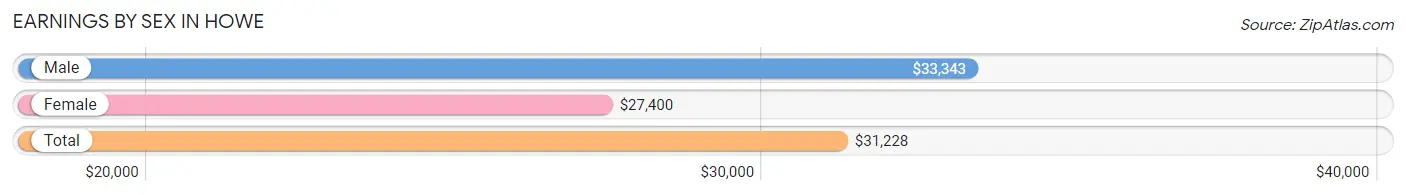
Earnings by Sex in Howe
Average Earnings in Howe are $31,228, $33,343 for men and $27,400 for women, a difference of 17.8%.
| Sex | Number | Average Earnings |
| Male | 972 (52.7%) | $33,343 |
| Female | 872 (47.3%) | $27,400 |
| Total | 1,844 (100.0%) | $31,228 |
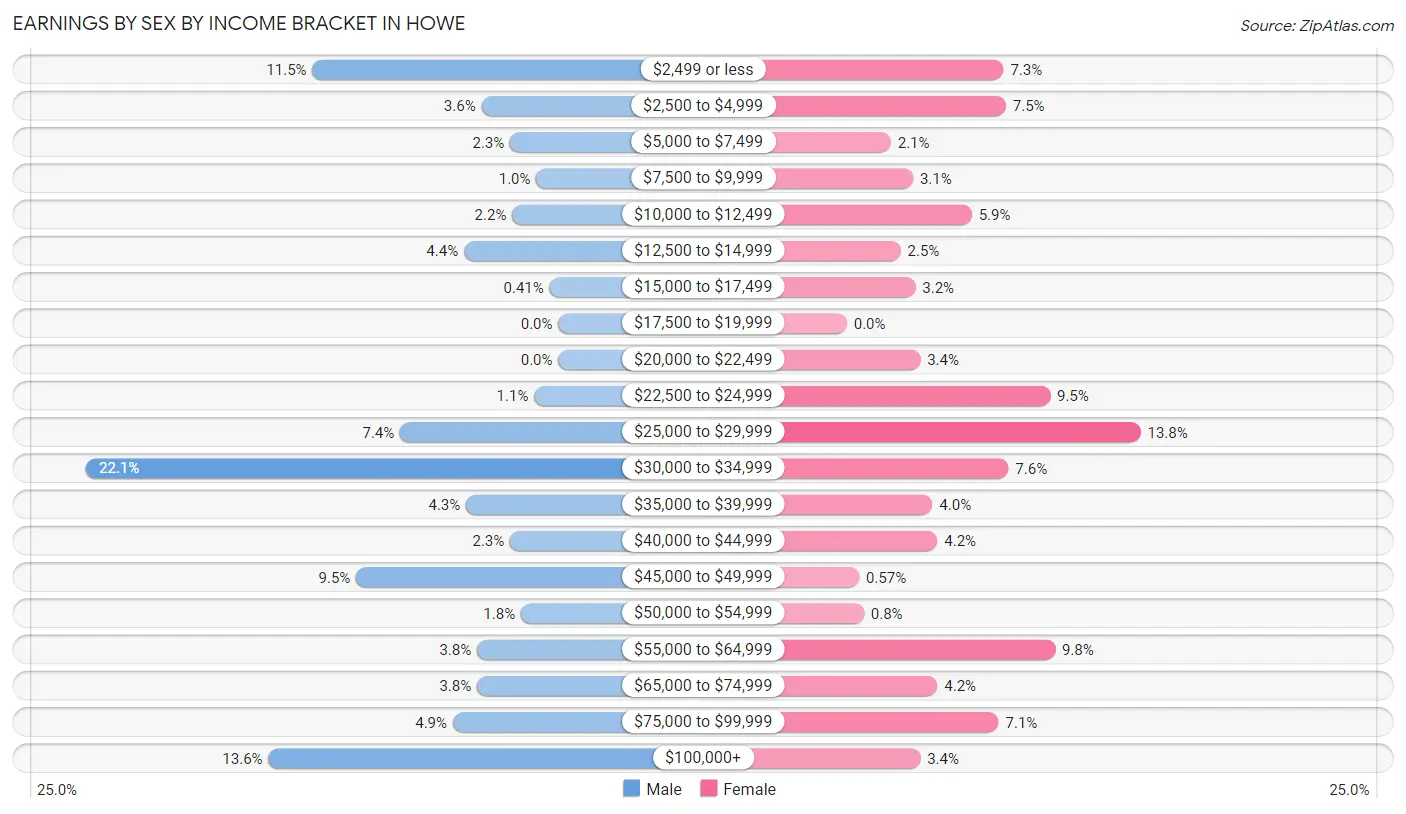
Earnings by Sex by Income Bracket in Howe
The most common earnings brackets in Howe are $30,000 to $34,999 for men (215 | 22.1%) and $25,000 to $29,999 for women (120 | 13.8%).
| Income | Male | Female |
| $2,499 or less | 112 (11.5%) | 64 (7.3%) |
| $2,500 to $4,999 | 35 (3.6%) | 65 (7.4%) |
| $5,000 to $7,499 | 22 (2.3%) | 18 (2.1%) |
| $7,500 to $9,999 | 10 (1.0%) | 27 (3.1%) |
| $10,000 to $12,499 | 21 (2.2%) | 51 (5.9%) |
| $12,500 to $14,999 | 43 (4.4%) | 22 (2.5%) |
| $15,000 to $17,499 | 4 (0.4%) | 28 (3.2%) |
| $17,500 to $19,999 | 0 (0.0%) | 0 (0.0%) |
| $20,000 to $22,499 | 0 (0.0%) | 30 (3.4%) |
| $22,500 to $24,999 | 11 (1.1%) | 83 (9.5%) |
| $25,000 to $29,999 | 72 (7.4%) | 120 (13.8%) |
| $30,000 to $34,999 | 215 (22.1%) | 66 (7.6%) |
| $35,000 to $39,999 | 42 (4.3%) | 35 (4.0%) |
| $40,000 to $44,999 | 22 (2.3%) | 37 (4.2%) |
| $45,000 to $49,999 | 92 (9.5%) | 5 (0.6%) |
| $50,000 to $54,999 | 17 (1.8%) | 7 (0.8%) |
| $55,000 to $64,999 | 37 (3.8%) | 85 (9.8%) |
| $65,000 to $74,999 | 37 (3.8%) | 37 (4.2%) |
| $75,000 to $99,999 | 48 (4.9%) | 62 (7.1%) |
| $100,000+ | 132 (13.6%) | 30 (3.4%) |
| Total | 972 (100.0%) | 872 (100.0%) |
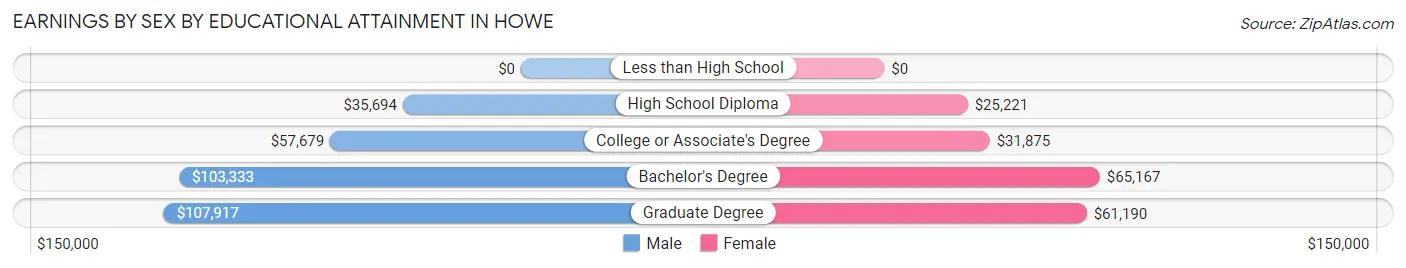
Earnings by Sex by Educational Attainment in Howe
Average earnings in Howe are $35,046 for men and $29,464 for women, a difference of 15.9%. Men with an educational attainment of graduate degree enjoy the highest average annual earnings of $107,917, while those with high school diploma education earn the least with $35,694. Women with an educational attainment of bachelor's degree earn the most with the average annual earnings of $65,167, while those with high school diploma education have the smallest earnings of $25,221.
| Educational Attainment | Male Income | Female Income |
| Less than High School | - | - |
| High School Diploma | $35,694 | $25,221 |
| College or Associate's Degree | $57,679 | $31,875 |
| Bachelor's Degree | $103,333 | $65,167 |
| Graduate Degree | $107,917 | $61,190 |
| Total | $35,046 | $29,464 |
Family Income in Howe
Family Income Brackets in Howe
According to the Howe family income data, there are 160 families falling into the $25,000 to $34,999 income range, which is the most common income bracket and makes up 19.2% of all families.
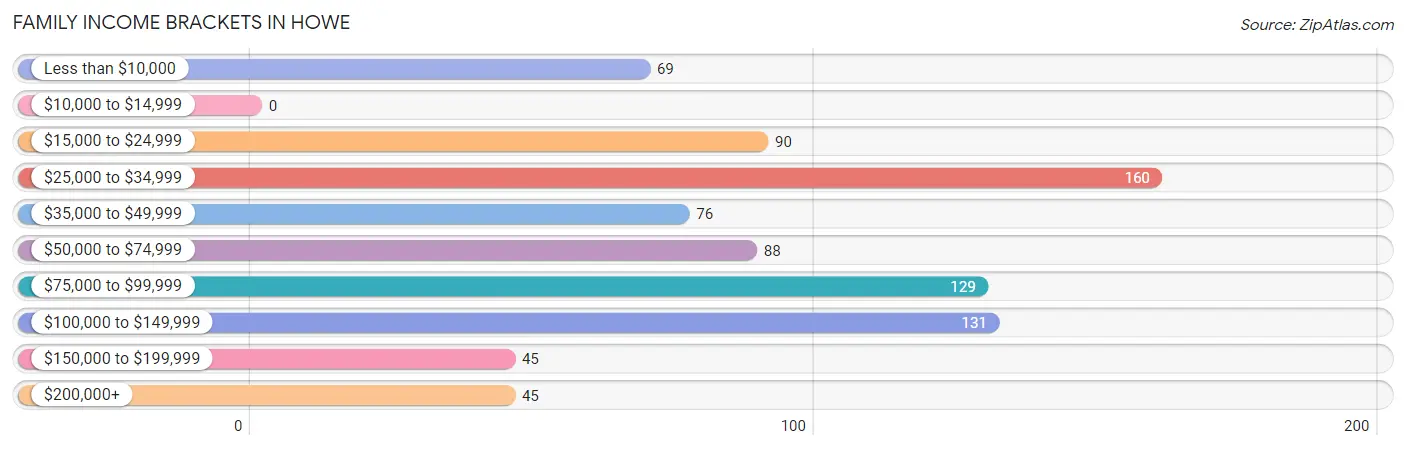
| Income Bracket | # Families | % Families |
| Less than $10,000 | 69 | 8.3% |
| $10,000 to $14,999 | 0 | 0.0% |
| $15,000 to $24,999 | 90 | 10.8% |
| $25,000 to $34,999 | 160 | 19.2% |
| $35,000 to $49,999 | 76 | 9.1% |
| $50,000 to $74,999 | 88 | 10.6% |
| $75,000 to $99,999 | 129 | 15.5% |
| $100,000 to $149,999 | 131 | 15.7% |
| $150,000 to $199,999 | 45 | 5.4% |
| $200,000+ | 45 | 5.4% |
Family Income by Famaliy Size in Howe
3-person families (178 | 21.4%) account for the highest median family income in Howe with $65,536 per family, while 2-person families (220 | 26.4%) have the highest median income of $31,562 per family member.
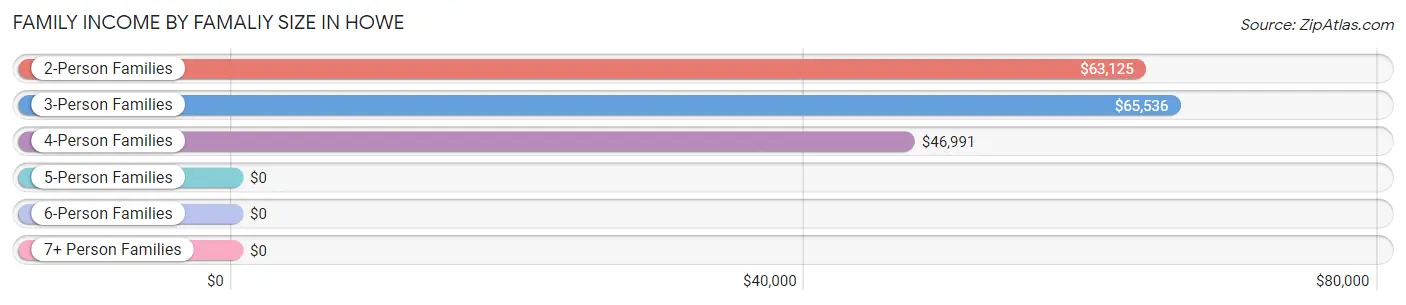
| Income Bracket | # Families | Median Income |
| 2-Person Families | 220 (26.4%) | $63,125 |
| 3-Person Families | 178 (21.4%) | $65,536 |
| 4-Person Families | 349 (41.9%) | $46,991 |
| 5-Person Families | 47 (5.6%) | $0 |
| 6-Person Families | 14 (1.7%) | $0 |
| 7+ Person Families | 25 (3.0%) | $0 |
| Total | 833 (100.0%) | $62,772 |
Family Income by Number of Earners in Howe
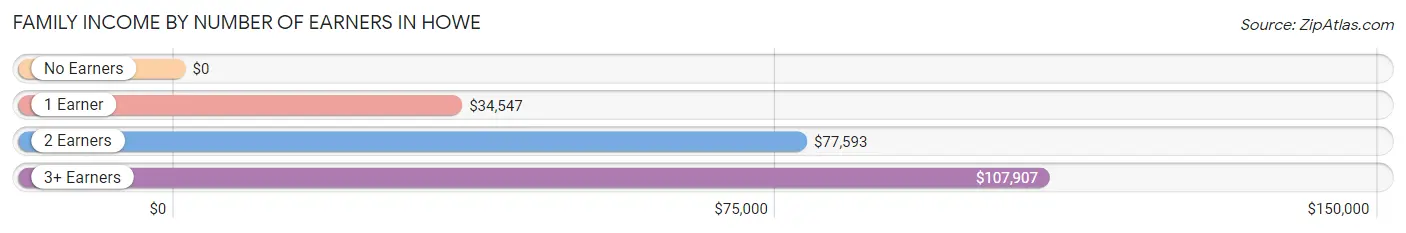
| Number of Earners | # Families | Median Income |
| No Earners | 80 (9.6%) | $0 |
| 1 Earner | 293 (35.2%) | $34,547 |
| 2 Earners | 284 (34.1%) | $77,593 |
| 3+ Earners | 176 (21.1%) | $107,907 |
| Total | 833 (100.0%) | $62,772 |
Household Income in Howe
Household Income Brackets in Howe
With 226 households falling in the category, the $100,000 to $149,999 income range is the most frequent in Howe, accounting for 19.5% of all households. In contrast, only 19 households (1.6%) fall into the $10,000 to $14,999 income bracket, making it the least populous group.
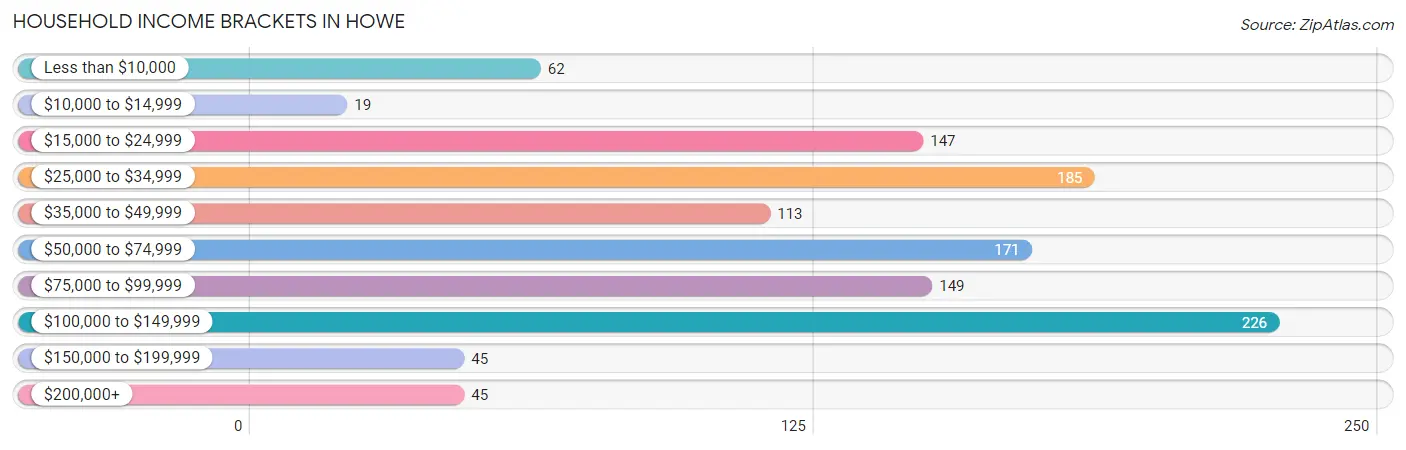
| Income Bracket | # Households | % Households |
| Less than $10,000 | 62 | 5.3% |
| $10,000 to $14,999 | 19 | 1.6% |
| $15,000 to $24,999 | 147 | 12.7% |
| $25,000 to $34,999 | 185 | 15.9% |
| $35,000 to $49,999 | 113 | 9.7% |
| $50,000 to $74,999 | 171 | 14.7% |
| $75,000 to $99,999 | 149 | 12.8% |
| $100,000 to $149,999 | 226 | 19.5% |
| $150,000 to $199,999 | 45 | 3.9% |
| $200,000+ | 45 | 3.9% |
Household Income by Householder Age in Howe
The median household income in Howe is $59,375, with the highest median household income of $108,197 found in the 45 to 64 years age bracket for the primary householder. A total of 252 households (21.7%) fall into this category. Meanwhile, the 15 to 24 years age bracket for the primary householder has the lowest median household income of $30,597, with 141 households (12.1%) in this group.
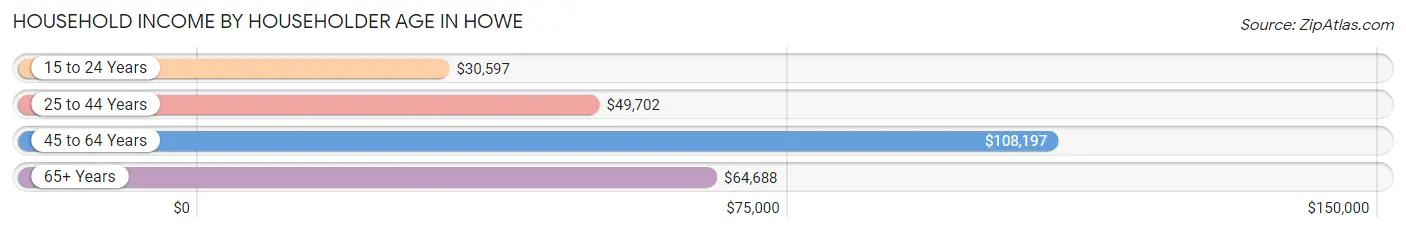
| Income Bracket | # Households | Median Income |
| 15 to 24 Years | 141 (12.1%) | $30,597 |
| 25 to 44 Years | 583 (50.2%) | $49,702 |
| 45 to 64 Years | 252 (21.7%) | $108,197 |
| 65+ Years | 185 (15.9%) | $64,688 |
| Total | 1,161 (100.0%) | $59,375 |
Poverty in Howe
Income Below Poverty by Sex and Age in Howe
With 23.4% poverty level for males and 30.7% for females among the residents of Howe, 5 year old males and under 5 year old females are the most vulnerable to poverty, with 57 males (89.1%) and 162 females (71.1%) in their respective age groups living below the poverty level.
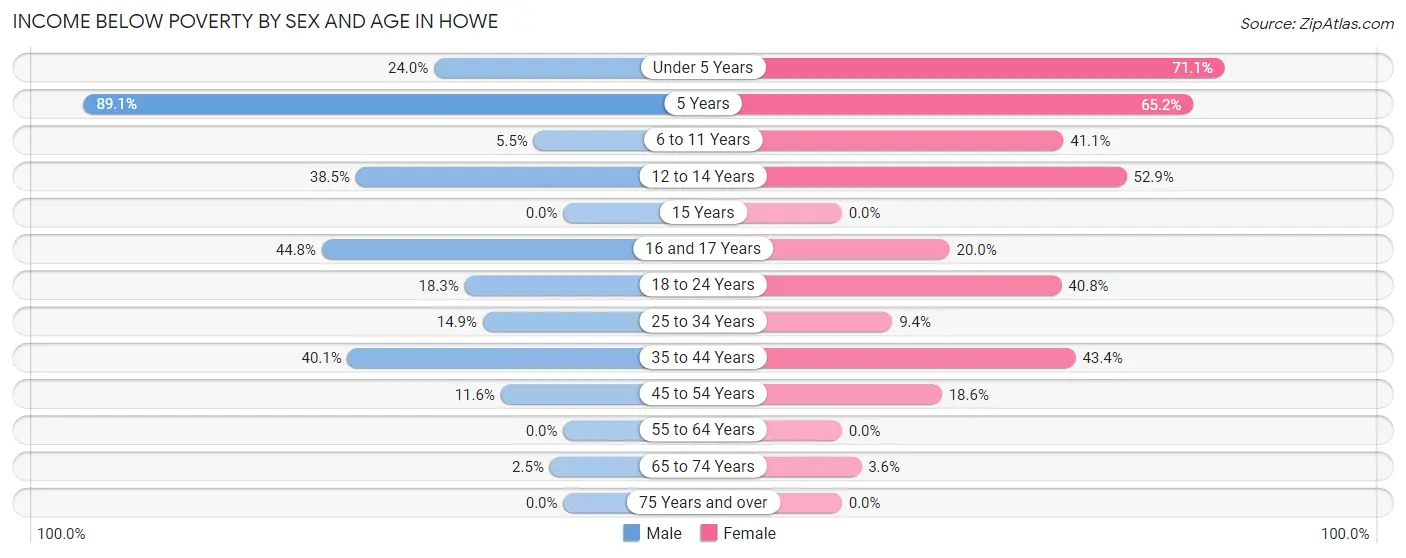
| Age Bracket | Male | Female |
| Under 5 Years | 24 (24.0%) | 162 (71.1%) |
| 5 Years | 57 (89.1%) | 15 (65.2%) |
| 6 to 11 Years | 7 (5.5%) | 104 (41.1%) |
| 12 to 14 Years | 47 (38.5%) | 65 (52.8%) |
| 15 Years | 0 (0.0%) | 0 (0.0%) |
| 16 and 17 Years | 26 (44.8%) | 10 (20.0%) |
| 18 to 24 Years | 33 (18.3%) | 64 (40.8%) |
| 25 to 34 Years | 46 (14.9%) | 38 (9.4%) |
| 35 to 44 Years | 137 (40.1%) | 95 (43.4%) |
| 45 to 54 Years | 10 (11.6%) | 23 (18.5%) |
| 55 to 64 Years | 0 (0.0%) | 0 (0.0%) |
| 65 to 74 Years | 2 (2.5%) | 3 (3.6%) |
| 75 Years and over | 0 (0.0%) | 0 (0.0%) |
| Total | 389 (23.4%) | 579 (30.7%) |
Income Above Poverty by Sex and Age in Howe
According to the poverty statistics in Howe, males aged 15 years and females aged 15 years are the age groups that are most secure financially, with 100.0% of males and 100.0% of females in these age groups living above the poverty line.
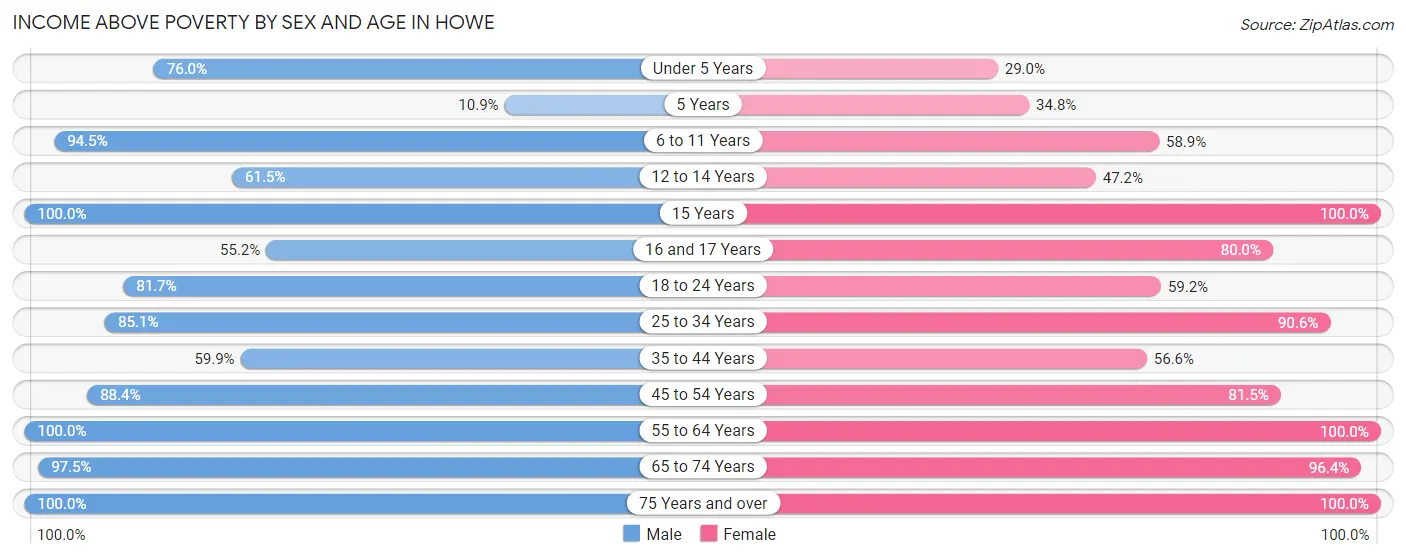
| Age Bracket | Male | Female |
| Under 5 Years | 76 (76.0%) | 66 (28.9%) |
| 5 Years | 7 (10.9%) | 8 (34.8%) |
| 6 to 11 Years | 120 (94.5%) | 149 (58.9%) |
| 12 to 14 Years | 75 (61.5%) | 58 (47.1%) |
| 15 Years | 36 (100.0%) | 22 (100.0%) |
| 16 and 17 Years | 32 (55.2%) | 40 (80.0%) |
| 18 to 24 Years | 147 (81.7%) | 93 (59.2%) |
| 25 to 34 Years | 262 (85.1%) | 368 (90.6%) |
| 35 to 44 Years | 205 (59.9%) | 124 (56.6%) |
| 45 to 54 Years | 76 (88.4%) | 101 (81.5%) |
| 55 to 64 Years | 127 (100.0%) | 150 (100.0%) |
| 65 to 74 Years | 77 (97.5%) | 80 (96.4%) |
| 75 Years and over | 35 (100.0%) | 48 (100.0%) |
| Total | 1,275 (76.6%) | 1,307 (69.3%) |
Income Below Poverty Among Married-Couple Families in Howe
The poverty statistics for married-couple families in Howe show that 14.7% or 82 of the total 558 families live below the poverty line. Families with 5 or more children have the highest poverty rate of 72.0%, comprising of 18 families. On the other hand, families with no children have the lowest poverty rate of 0.0%, which includes 0 families.
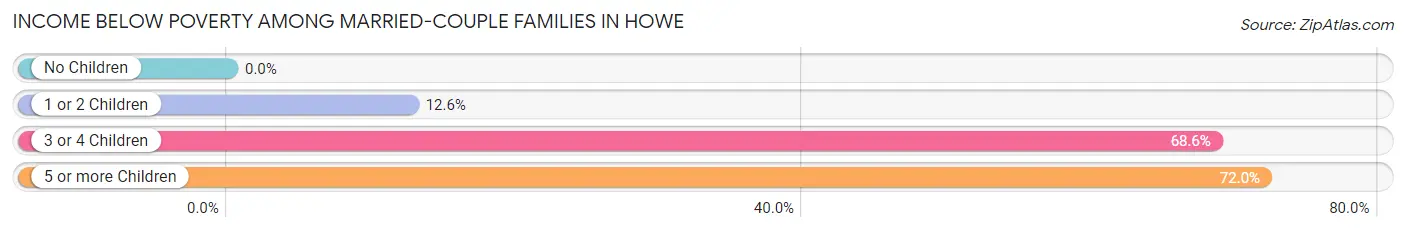
| Children | Above Poverty | Below Poverty |
| No Children | 180 (100.0%) | 0 (0.0%) |
| 1 or 2 Children | 278 (87.4%) | 40 (12.6%) |
| 3 or 4 Children | 11 (31.4%) | 24 (68.6%) |
| 5 or more Children | 7 (28.0%) | 18 (72.0%) |
| Total | 476 (85.3%) | 82 (14.7%) |
Income Below Poverty Among Single-Parent Households in Howe
According to the poverty data in Howe, 40.0% or 34 single-father households and 45.3% or 86 single-mother households are living below the poverty line. Among single-father households, those with 3 or 4 children have the highest poverty rate, with 30 households (71.4%) experiencing poverty. Likewise, among single-mother households, those with 3 or 4 children have the highest poverty rate, with 12 households (100.0%) falling below the poverty line.
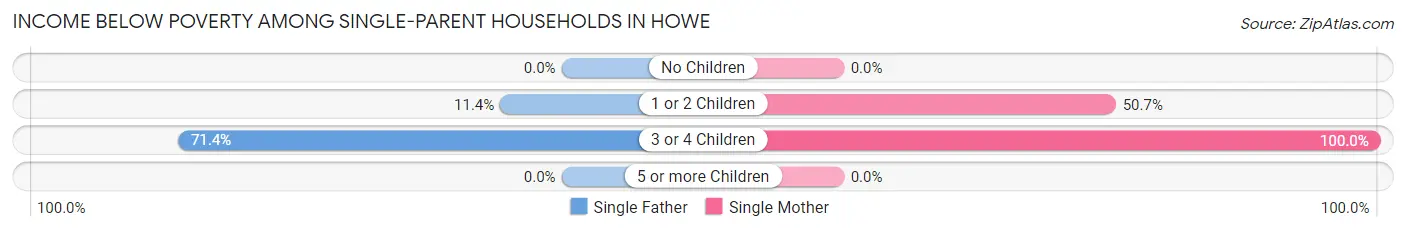
| Children | Single Father | Single Mother |
| No Children | 0 (0.0%) | 0 (0.0%) |
| 1 or 2 Children | 4 (11.4%) | 74 (50.7%) |
| 3 or 4 Children | 30 (71.4%) | 12 (100.0%) |
| 5 or more Children | 0 (0.0%) | 0 (0.0%) |
| Total | 34 (40.0%) | 86 (45.3%) |
Income Below Poverty Among Married-Couple vs Single-Parent Households in Howe
The poverty data for Howe shows that 82 of the married-couple family households (14.7%) and 120 of the single-parent households (43.6%) are living below the poverty level. Within the married-couple family households, those with 5 or more children have the highest poverty rate, with 18 households (72.0%) falling below the poverty line. Among the single-parent households, those with 3 or 4 children have the highest poverty rate, with 42 household (77.8%) living below poverty.
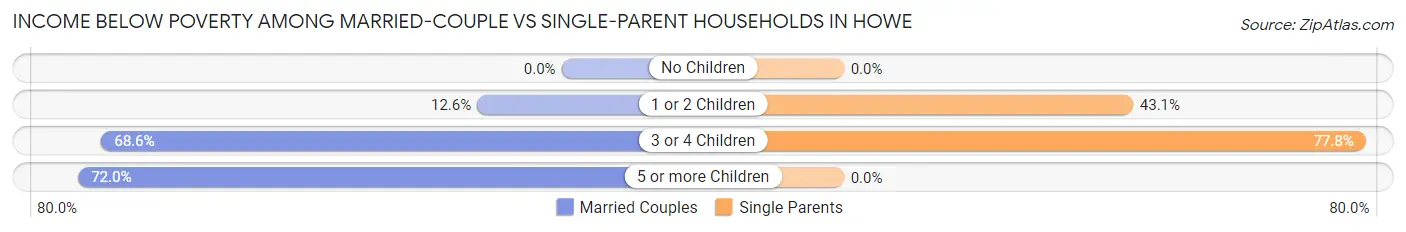
| Children | Married-Couple Families | Single-Parent Households |
| No Children | 0 (0.0%) | 0 (0.0%) |
| 1 or 2 Children | 40 (12.6%) | 78 (43.1%) |
| 3 or 4 Children | 24 (68.6%) | 42 (77.8%) |
| 5 or more Children | 18 (72.0%) | 0 (0.0%) |
| Total | 82 (14.7%) | 120 (43.6%) |
Race in Howe
The most populous races in Howe are White / Caucasian (2,795 | 78.7%), Hispanic or Latino (998 | 28.1%), and Two or more Races (429 | 12.1%).
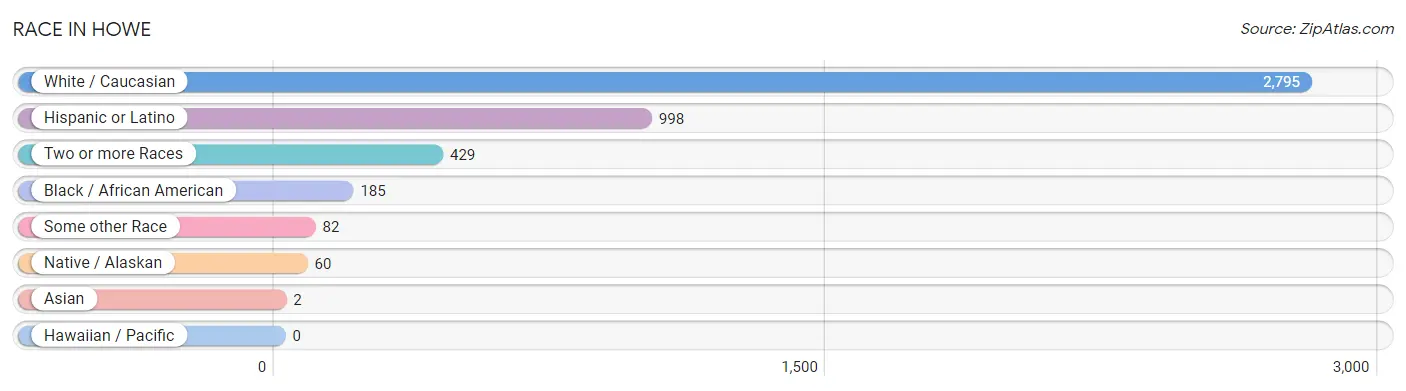
| Race | # Population | % Population |
| Asian | 2 | 0.1% |
| Black / African American | 185 | 5.2% |
| Hawaiian / Pacific | 0 | 0.0% |
| Hispanic or Latino | 998 | 28.1% |
| Native / Alaskan | 60 | 1.7% |
| White / Caucasian | 2,795 | 78.7% |
| Two or more Races | 429 | 12.1% |
| Some other Race | 82 | 2.3% |
| Total | 3,553 | 100.0% |
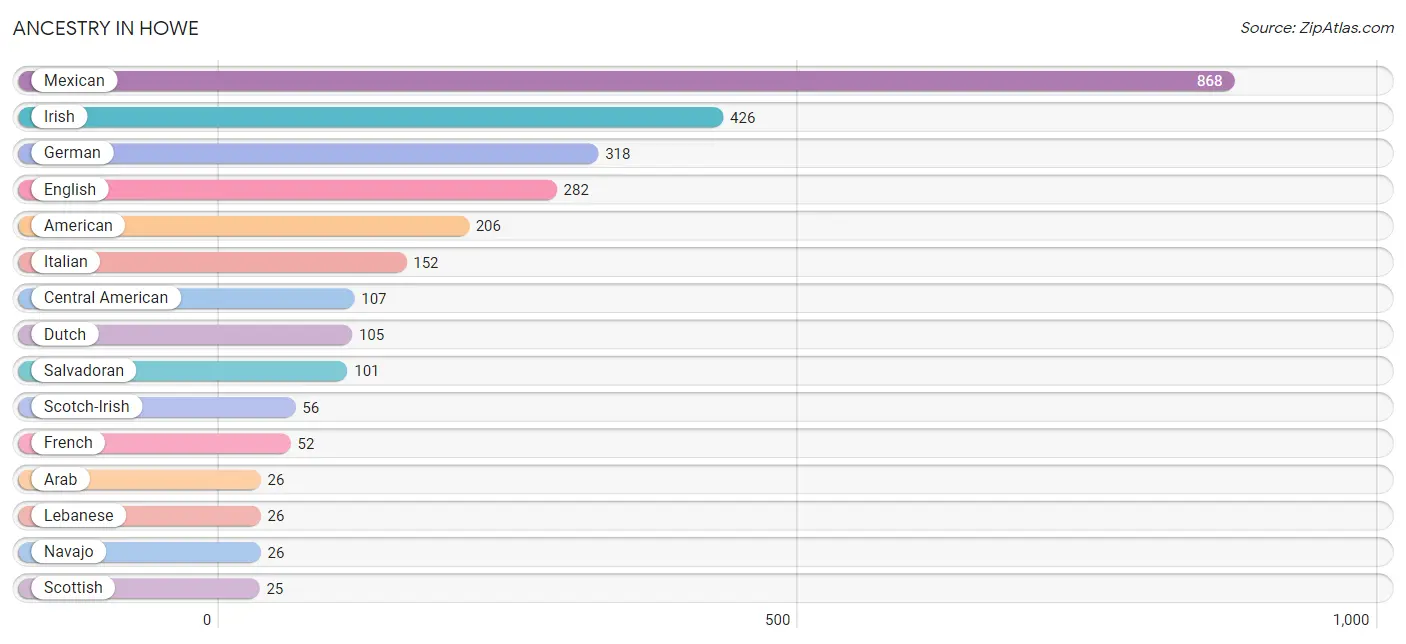
Ancestry in Howe
The most populous ancestries reported in Howe are Mexican (868 | 24.4%), Irish (426 | 12.0%), German (318 | 8.9%), English (282 | 7.9%), and American (206 | 5.8%), together accounting for 59.1% of all Howe residents.
| Ancestry | # Population | % Population |
| African | 3 | 0.1% |
| American | 206 | 5.8% |
| Arab | 26 | 0.7% |
| British | 6 | 0.2% |
| Canadian | 4 | 0.1% |
| Central American | 107 | 3.0% |
| Chickasaw | 22 | 0.6% |
| Choctaw | 18 | 0.5% |
| Dutch | 105 | 3.0% |
| English | 282 | 7.9% |
| European | 18 | 0.5% |
| French | 52 | 1.5% |
| French Canadian | 3 | 0.1% |
| German | 318 | 8.9% |
| Guatemalan | 6 | 0.2% |
| Icelander | 6 | 0.2% |
| Irish | 426 | 12.0% |
| Italian | 152 | 4.3% |
| Korean | 6 | 0.2% |
| Lebanese | 26 | 0.7% |
| Mexican | 868 | 24.4% |
| Navajo | 26 | 0.7% |
| Nigerian | 18 | 0.5% |
| Norwegian | 13 | 0.4% |
| Puerto Rican | 6 | 0.2% |
| Salvadoran | 101 | 2.8% |
| Scandinavian | 7 | 0.2% |
| Scotch-Irish | 56 | 1.6% |
| Scottish | 25 | 0.7% |
| Spanish | 10 | 0.3% |
| Sri Lankan | 2 | 0.1% |
| Subsaharan African | 21 | 0.6% |
| Swedish | 4 | 0.1% | View All 33 Rows |
Immigrants in Howe
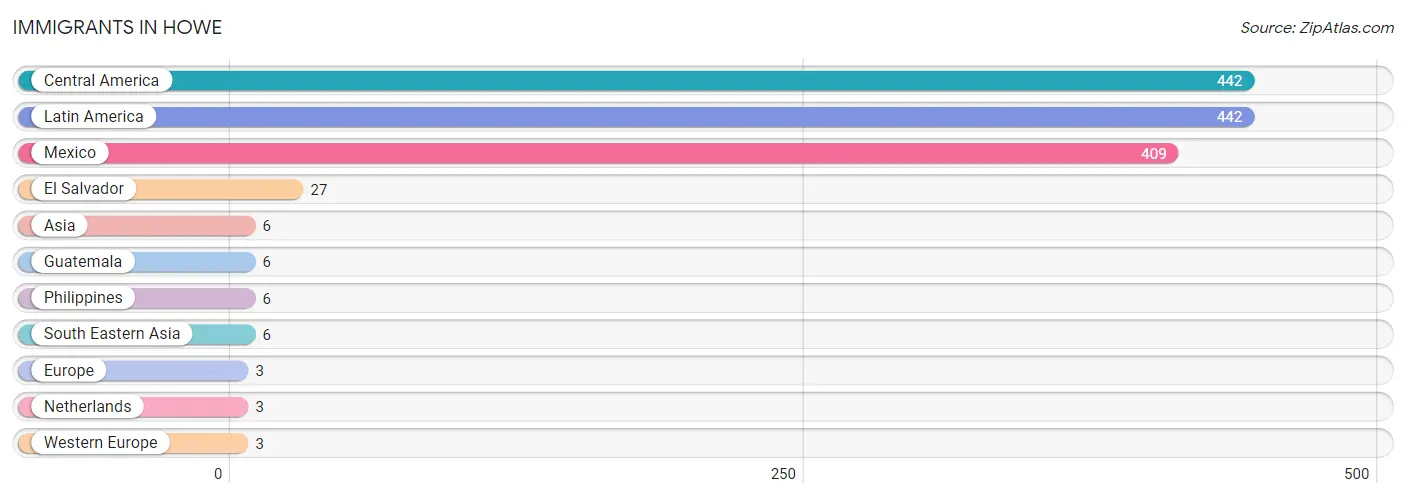
The most numerous immigrant groups reported in Howe came from Central America (442 | 12.4%), Latin America (442 | 12.4%), Mexico (409 | 11.5%), El Salvador (27 | 0.8%), and Asia (6 | 0.2%), together accounting for 37.3% of all Howe residents.
| Immigration Origin | # Population | % Population |
| Asia | 6 | 0.2% |
| Central America | 442 | 12.4% |
| El Salvador | 27 | 0.8% |
| Europe | 3 | 0.1% |
| Guatemala | 6 | 0.2% |
| Latin America | 442 | 12.4% |
| Mexico | 409 | 11.5% |
| Netherlands | 3 | 0.1% |
| Philippines | 6 | 0.2% |
| South Eastern Asia | 6 | 0.2% |
| Western Europe | 3 | 0.1% | View All 11 Rows |
Sex and Age in Howe
Sex and Age in Howe
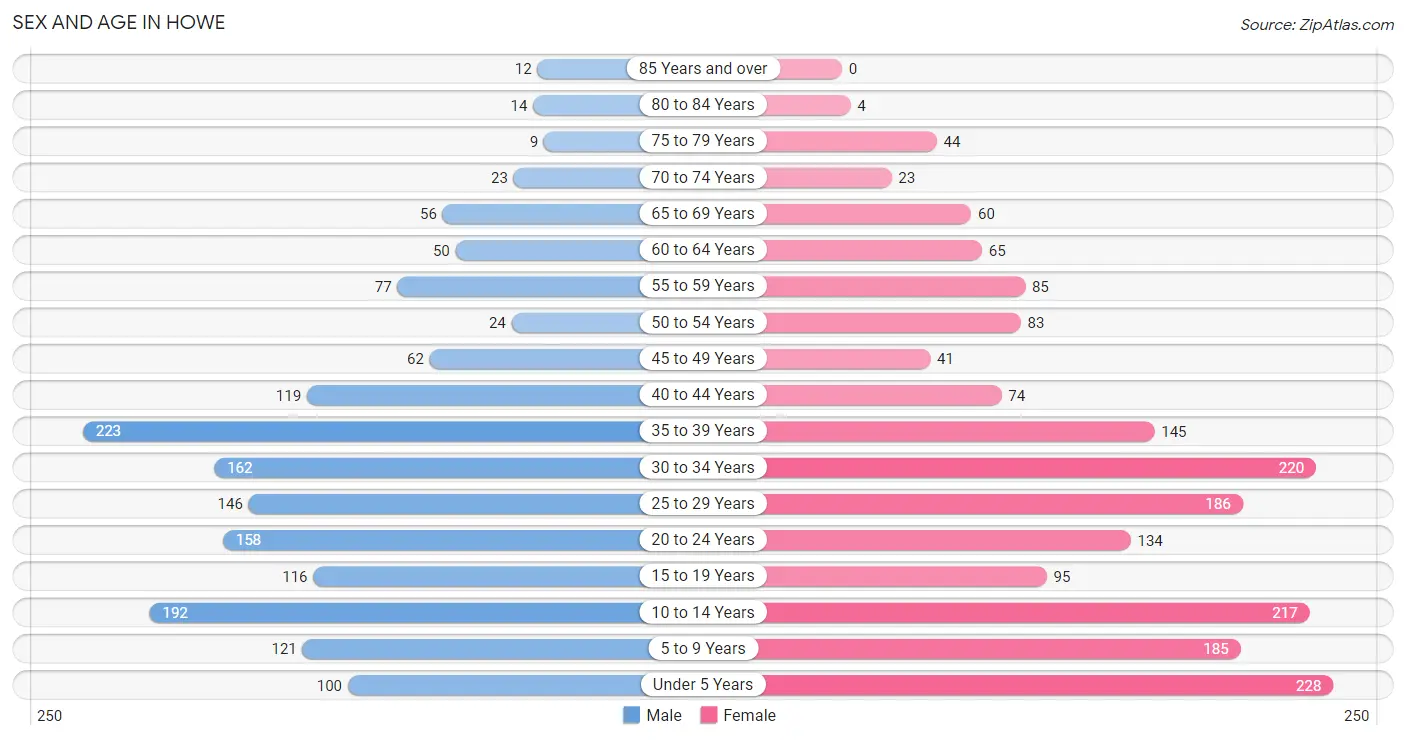
The most populous age groups in Howe are 35 to 39 Years (223 | 13.4%) for men and Under 5 Years (228 | 12.1%) for women.
| Age Bracket | Male | Female |
| Under 5 Years | 100 (6.0%) | 228 (12.1%) |
| 5 to 9 Years | 121 (7.3%) | 185 (9.8%) |
| 10 to 14 Years | 192 (11.5%) | 217 (11.5%) |
| 15 to 19 Years | 116 (7.0%) | 95 (5.0%) |
| 20 to 24 Years | 158 (9.5%) | 134 (7.1%) |
| 25 to 29 Years | 146 (8.8%) | 186 (9.9%) |
| 30 to 34 Years | 162 (9.7%) | 220 (11.7%) |
| 35 to 39 Years | 223 (13.4%) | 145 (7.7%) |
| 40 to 44 Years | 119 (7.1%) | 74 (3.9%) |
| 45 to 49 Years | 62 (3.7%) | 41 (2.2%) |
| 50 to 54 Years | 24 (1.4%) | 83 (4.4%) |
| 55 to 59 Years | 77 (4.6%) | 85 (4.5%) |
| 60 to 64 Years | 50 (3.0%) | 65 (3.4%) |
| 65 to 69 Years | 56 (3.4%) | 60 (3.2%) |
| 70 to 74 Years | 23 (1.4%) | 23 (1.2%) |
| 75 to 79 Years | 9 (0.5%) | 44 (2.3%) |
| 80 to 84 Years | 14 (0.8%) | 4 (0.2%) |
| 85 Years and over | 12 (0.7%) | 0 (0.0%) |
| Total | 1,664 (100.0%) | 1,889 (100.0%) |
Families and Households in Howe
Median Family Size in Howe
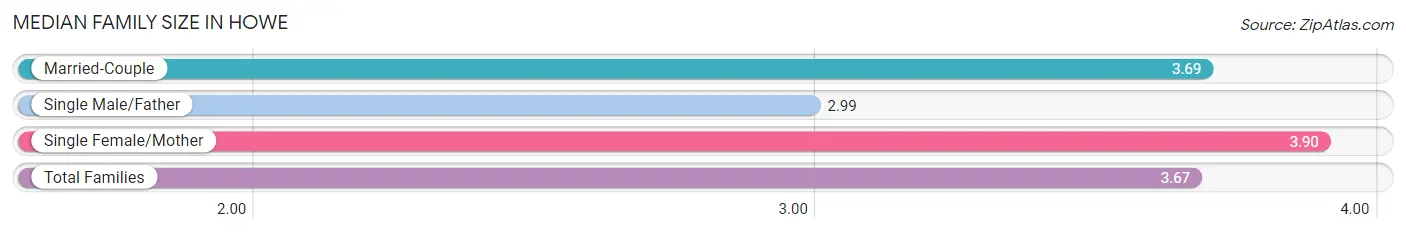
The median family size in Howe is 3.67 persons per family, with single female/mother families (190 | 22.8%) accounting for the largest median family size of 3.9 persons per family. On the other hand, single male/father families (85 | 10.2%) represent the smallest median family size with 2.99 persons per family.
| Family Type | # Families | Family Size |
| Married-Couple | 558 (67.0%) | 3.69 |
| Single Male/Father | 85 (10.2%) | 2.99 |
| Single Female/Mother | 190 (22.8%) | 3.90 |
| Total Families | 833 (100.0%) | 3.67 |
Median Household Size in Howe
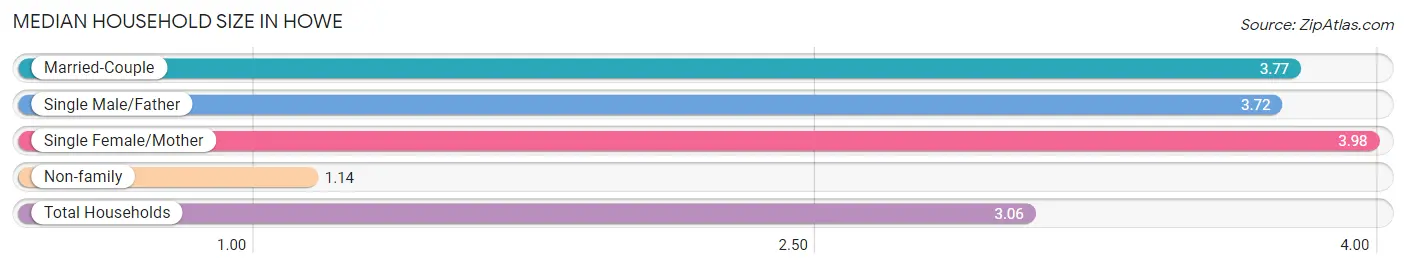
The median household size in Howe is 3.06 persons per household, with single female/mother households (190 | 16.4%) accounting for the largest median household size of 3.98 persons per household. non-family households (328 | 28.2%) represent the smallest median household size with 1.14 persons per household.
| Household Type | # Households | Household Size |
| Married-Couple | 558 (48.1%) | 3.77 |
| Single Male/Father | 85 (7.3%) | 3.72 |
| Single Female/Mother | 190 (16.4%) | 3.98 |
| Non-family | 328 (28.2%) | 1.14 |
| Total Households | 1,161 (100.0%) | 3.06 |
Household Size by Marriage Status in Howe
Out of a total of 1,161 households in Howe, 833 (71.8%) are family households, while 328 (28.2%) are nonfamily households. The most numerous type of family households are 4-person households, comprising 297, and the most common type of nonfamily households are 1-person households, comprising 291.
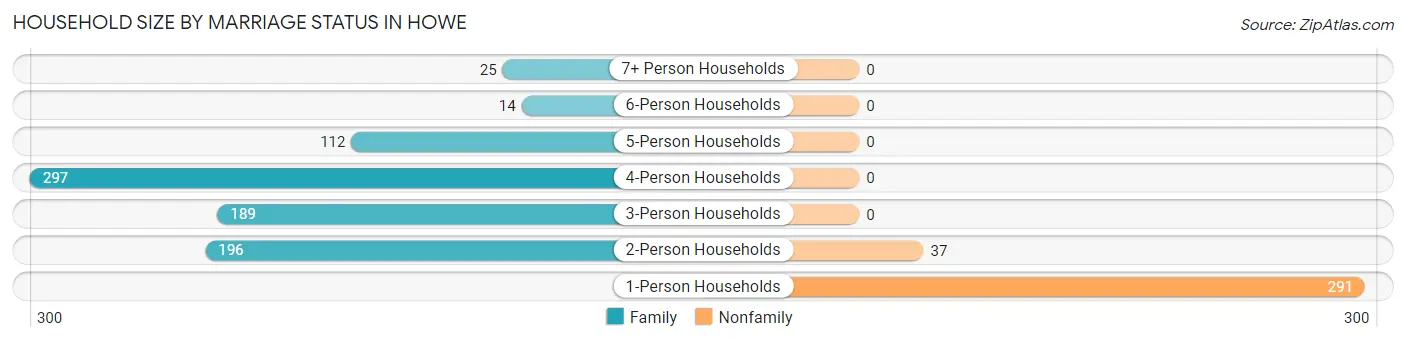
| Household Size | Family Households | Nonfamily Households |
| 1-Person Households | - | 291 (25.1%) |
| 2-Person Households | 196 (16.9%) | 37 (3.2%) |
| 3-Person Households | 189 (16.3%) | 0 (0.0%) |
| 4-Person Households | 297 (25.6%) | 0 (0.0%) |
| 5-Person Households | 112 (9.7%) | 0 (0.0%) |
| 6-Person Households | 14 (1.2%) | 0 (0.0%) |
| 7+ Person Households | 25 (2.1%) | 0 (0.0%) |
| Total | 833 (71.8%) | 328 (28.2%) |
Female Fertility in Howe
Fertility by Age in Howe
Average fertility rate in Howe is 39.0 births per 1,000 women. Women in the age bracket of 20 to 34 years have the highest fertility rate with 69.0 births per 1,000 women. Women in the age bracket of 20 to 34 years acount for 100.0% of all women with births.
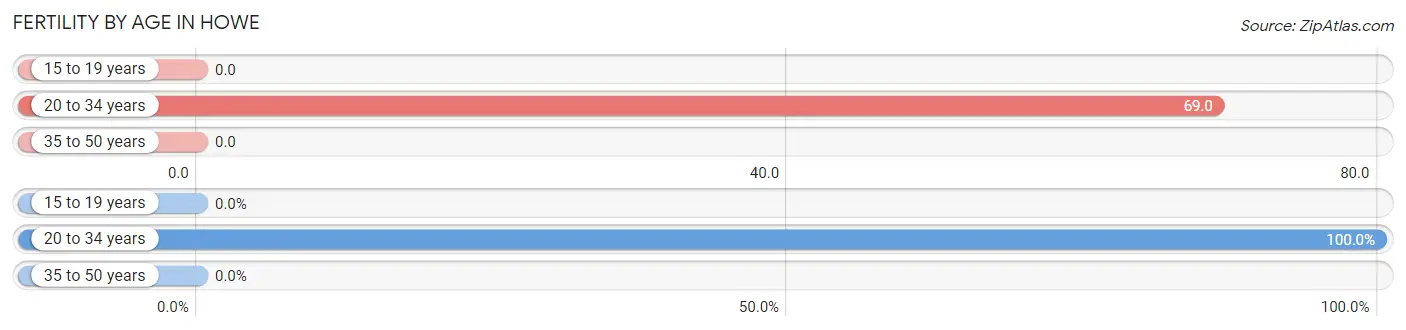
| Age Bracket | Women with Births | Births / 1,000 Women |
| 15 to 19 years | 0 (0.0%) | 0.0 |
| 20 to 34 years | 37 (100.0%) | 69.0 |
| 35 to 50 years | 0 (0.0%) | 0.0 |
| Total | 37 (100.0%) | 39.0 |
Fertility by Age by Marriage Status in Howe
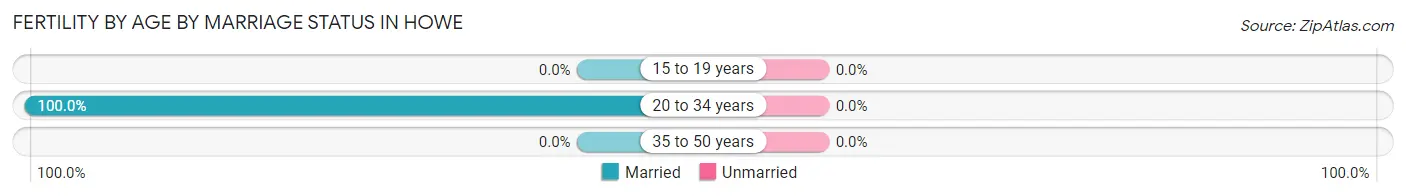
| Age Bracket | Married | Unmarried |
| 15 to 19 years | 0 (0.0%) | 0 (0.0%) |
| 20 to 34 years | 37 (100.0%) | 0 (0.0%) |
| 35 to 50 years | 0 (0.0%) | 0 (0.0%) |
| Total | 37 (100.0%) | 0 (0.0%) |
Fertility by Education in Howe
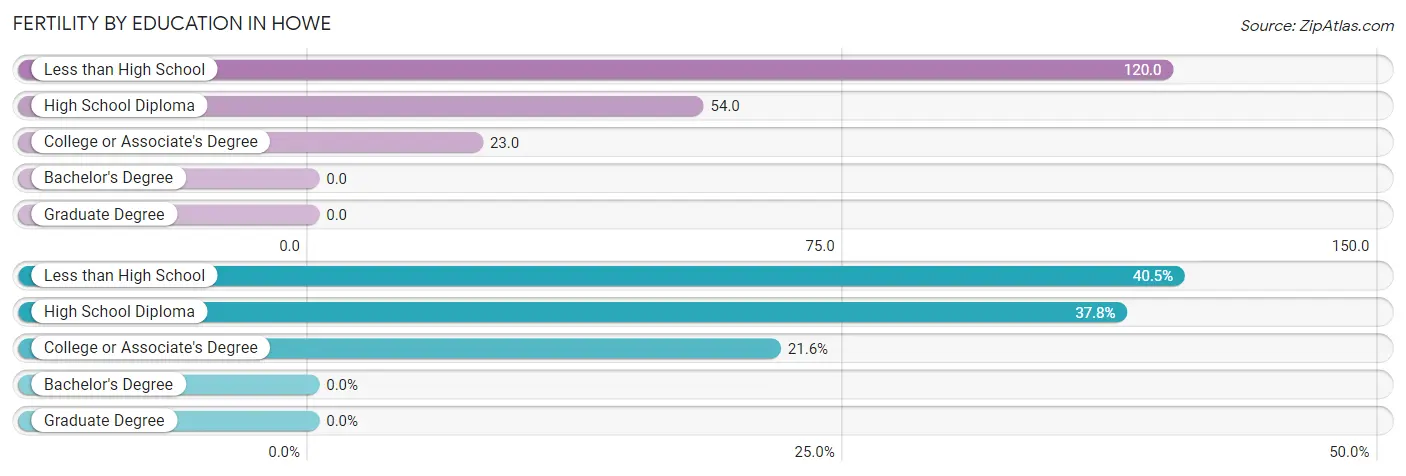
| Educational Attainment | Women with Births | Births / 1,000 Women |
| Less than High School | 15 (40.5%) | 120.0 |
| High School Diploma | 14 (37.8%) | 54.0 |
| College or Associate's Degree | 8 (21.6%) | 23.0 |
| Bachelor's Degree | 0 (0.0%) | 0.0 |
| Graduate Degree | 0 (0.0%) | 0.0 |
| Total | 37 (100.0%) | 39.0 |
Fertility by Education by Marriage Status in Howe
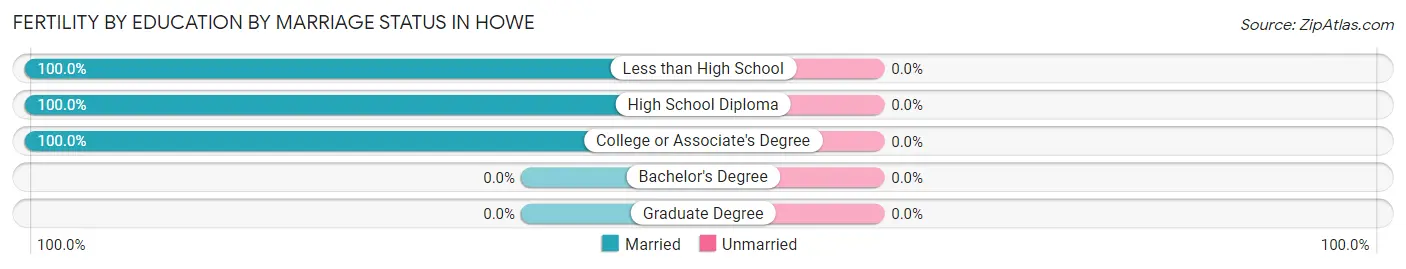
| Educational Attainment | Married | Unmarried |
| Less than High School | 15 (100.0%) | 0 (0.0%) |
| High School Diploma | 14 (100.0%) | 0 (0.0%) |
| College or Associate's Degree | 8 (100.0%) | 0 (0.0%) |
| Bachelor's Degree | 0 (0.0%) | 0 (0.0%) |
| Graduate Degree | 0 (0.0%) | 0 (0.0%) |
| Total | 37 (100.0%) | 0 (0.0%) |
Employment Characteristics in Howe
Employment by Class of Employer in Howe
Among the 1,721 employed individuals in Howe, private company employees (1,285 | 74.7%), local government employees (195 | 11.3%), and not-for-profit organizations (81 | 4.7%) make up the most common classes of employment.
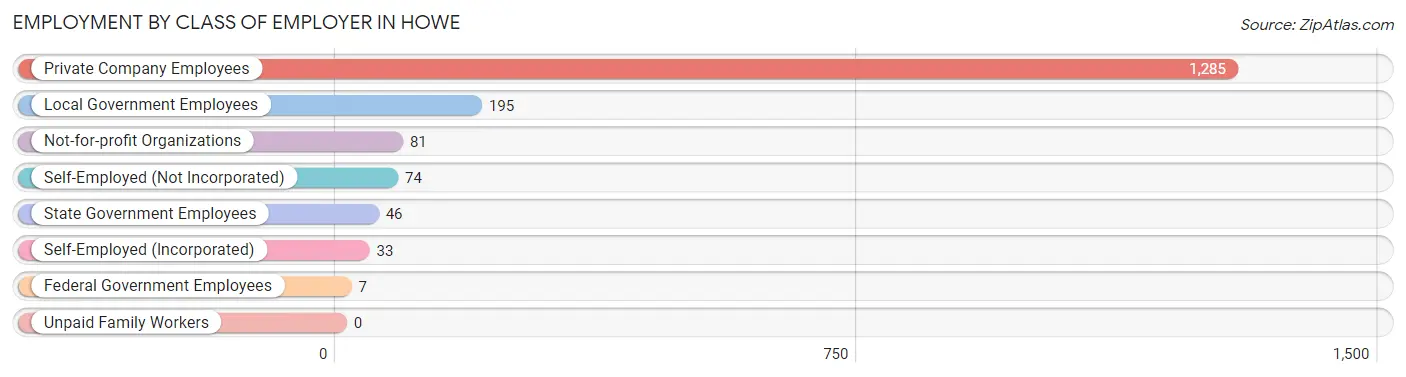
| Employer Class | # Employees | % Employees |
| Private Company Employees | 1,285 | 74.7% |
| Self-Employed (Incorporated) | 33 | 1.9% |
| Self-Employed (Not Incorporated) | 74 | 4.3% |
| Not-for-profit Organizations | 81 | 4.7% |
| Local Government Employees | 195 | 11.3% |
| State Government Employees | 46 | 2.7% |
| Federal Government Employees | 7 | 0.4% |
| Unpaid Family Workers | 0 | 0.0% |
| Total | 1,721 | 100.0% |
Employment Status by Age in Howe
According to the labor force statistics for Howe, out of the total population over 16 years of age (2,452), 75.4% or 1,849 individuals are in the labor force, with 5.3% or 98 of them unemployed. The age group with the highest labor force participation rate is 25 to 29 years, with 100.0% or 332 individuals in the labor force. Within the labor force, the 55 to 59 years age range has the highest percentage of unemployed individuals, with 14.3% or 18 of them being unemployed.
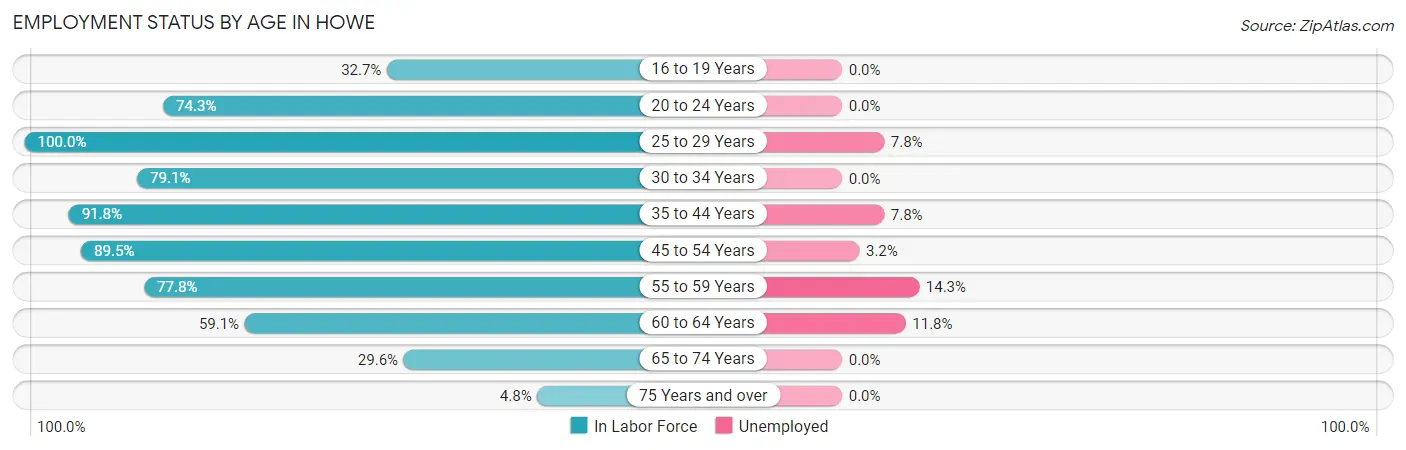
| Age Bracket | In Labor Force | Unemployed |
| 16 to 19 Years | 50 (32.7%) | 0 (0.0%) |
| 20 to 24 Years | 217 (74.3%) | 0 (0.0%) |
| 25 to 29 Years | 332 (100.0%) | 26 (7.8%) |
| 30 to 34 Years | 302 (79.1%) | 0 (0.0%) |
| 35 to 44 Years | 515 (91.8%) | 40 (7.8%) |
| 45 to 54 Years | 188 (89.5%) | 6 (3.2%) |
| 55 to 59 Years | 126 (77.8%) | 18 (14.3%) |
| 60 to 64 Years | 68 (59.1%) | 8 (11.8%) |
| 65 to 74 Years | 48 (29.6%) | 0 (0.0%) |
| 75 Years and over | 4 (4.8%) | 0 (0.0%) |
| Total | 1,849 (75.4%) | 98 (5.3%) |
Employment Status by Educational Attainment in Howe
According to labor force statistics for Howe, 86.9% of individuals (1,531) out of the total population between 25 and 64 years of age (1,762) are in the labor force, with 6.4% or 98 of them being unemployed. The group with the highest labor force participation rate are those with the educational attainment of less than high school, with 98.2% or 279 individuals in the labor force. Within the labor force, individuals with less than high school education have the highest percentage of unemployment, with 11.8% or 33 of them being unemployed.
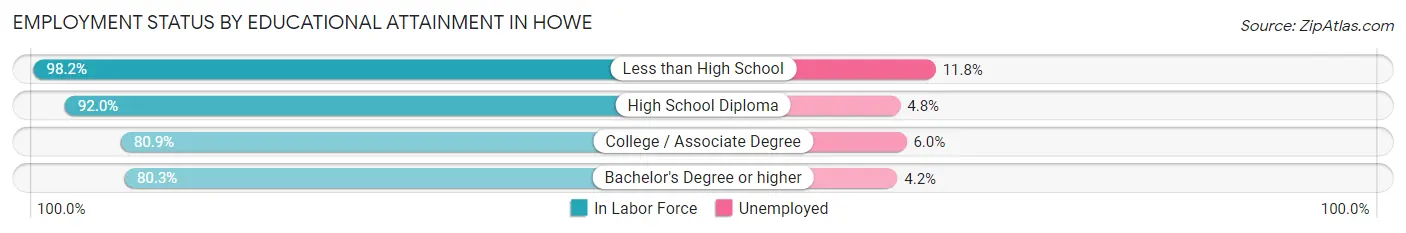
| Educational Attainment | In Labor Force | Unemployed |
| Less than High School | 279 (98.2%) | 34 (11.8%) |
| High School Diploma | 484 (92.0%) | 25 (4.8%) |
| College / Associate Degree | 532 (80.9%) | 39 (6.0%) |
| Bachelor's Degree or higher | 236 (80.3%) | 12 (4.2%) |
| Total | 1,531 (86.9%) | 113 (6.4%) |
Employment Occupations by Sex in Howe
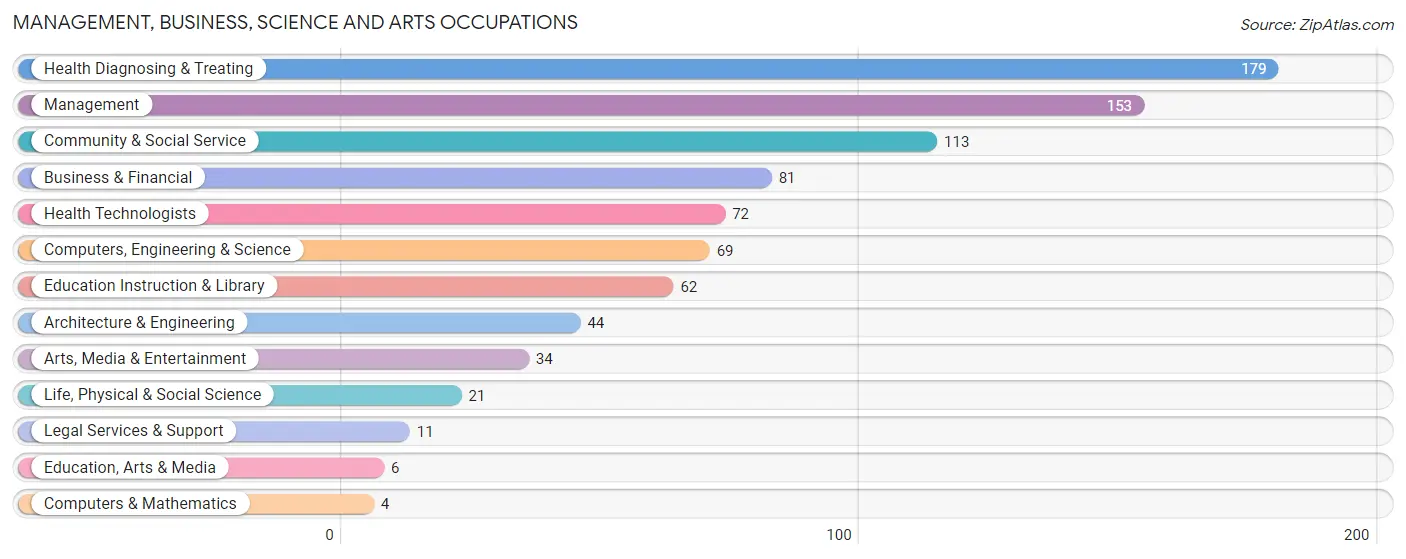
Management, Business, Science and Arts Occupations
The most common Management, Business, Science and Arts occupations in Howe are Health Diagnosing & Treating (179 | 10.2%), Management (153 | 8.7%), Community & Social Service (113 | 6.5%), Business & Financial (81 | 4.6%), and Health Technologists (72 | 4.1%).
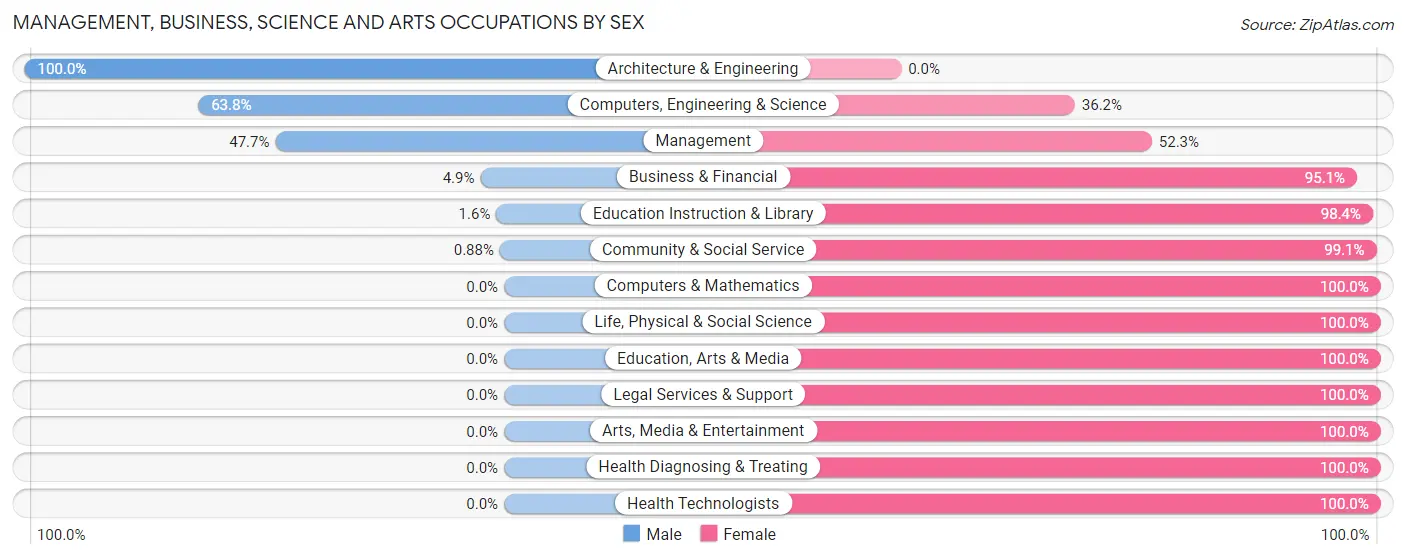
Management, Business, Science and Arts Occupations by Sex
Within the Management, Business, Science and Arts occupations in Howe, the most male-oriented occupations are Architecture & Engineering (100.0%), Computers, Engineering & Science (63.8%), and Management (47.7%), while the most female-oriented occupations are Computers & Mathematics (100.0%), Life, Physical & Social Science (100.0%), and Education, Arts & Media (100.0%).
| Occupation | Male | Female |
| Management | 73 (47.7%) | 80 (52.3%) |
| Business & Financial | 4 (4.9%) | 77 (95.1%) |
| Computers, Engineering & Science | 44 (63.8%) | 25 (36.2%) |
| Computers & Mathematics | 0 (0.0%) | 4 (100.0%) |
| Architecture & Engineering | 44 (100.0%) | 0 (0.0%) |
| Life, Physical & Social Science | 0 (0.0%) | 21 (100.0%) |
| Community & Social Service | 1 (0.9%) | 112 (99.1%) |
| Education, Arts & Media | 0 (0.0%) | 6 (100.0%) |
| Legal Services & Support | 0 (0.0%) | 11 (100.0%) |
| Education Instruction & Library | 1 (1.6%) | 61 (98.4%) |
| Arts, Media & Entertainment | 0 (0.0%) | 34 (100.0%) |
| Health Diagnosing & Treating | 0 (0.0%) | 179 (100.0%) |
| Health Technologists | 0 (0.0%) | 72 (100.0%) |
| Total (Category) | 122 (20.5%) | 473 (79.5%) |
| Total (Overall) | 907 (51.8%) | 845 (48.2%) |
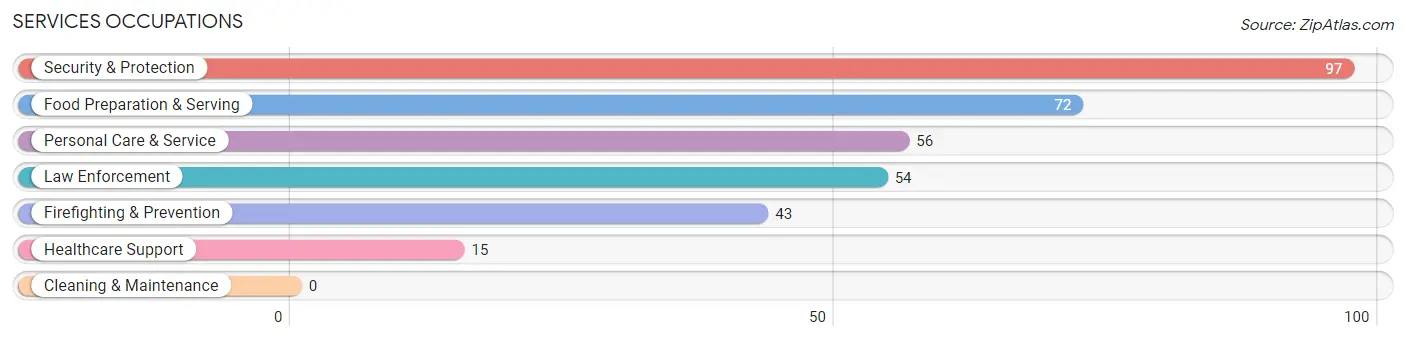
Services Occupations
The most common Services occupations in Howe are Security & Protection (97 | 5.5%), Food Preparation & Serving (72 | 4.1%), Personal Care & Service (56 | 3.2%), Law Enforcement (54 | 3.1%), and Firefighting & Prevention (43 | 2.5%).
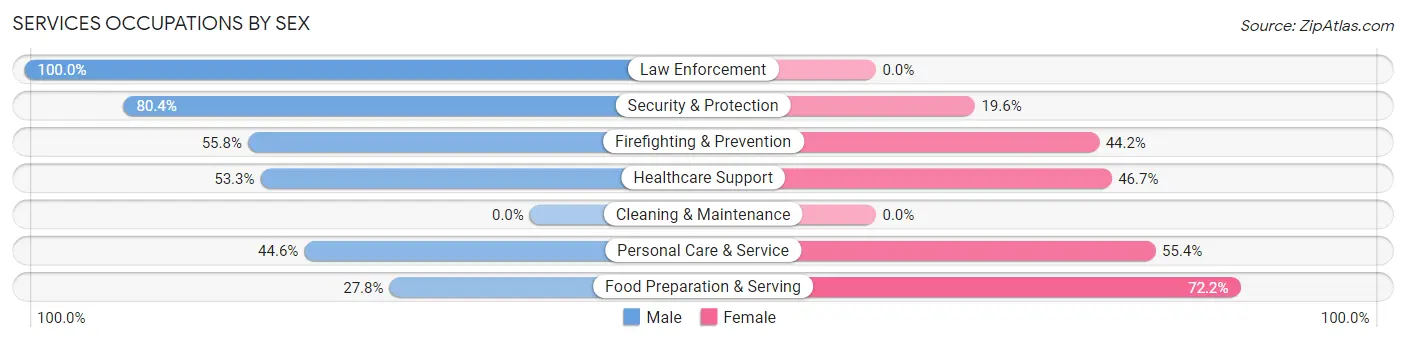
Services Occupations by Sex
Within the Services occupations in Howe, the most male-oriented occupations are Law Enforcement (100.0%), Security & Protection (80.4%), and Firefighting & Prevention (55.8%), while the most female-oriented occupations are Food Preparation & Serving (72.2%), Personal Care & Service (55.4%), and Healthcare Support (46.7%).
| Occupation | Male | Female |
| Healthcare Support | 8 (53.3%) | 7 (46.7%) |
| Security & Protection | 78 (80.4%) | 19 (19.6%) |
| Firefighting & Prevention | 24 (55.8%) | 19 (44.2%) |
| Law Enforcement | 54 (100.0%) | 0 (0.0%) |
| Food Preparation & Serving | 20 (27.8%) | 52 (72.2%) |
| Cleaning & Maintenance | 0 (0.0%) | 0 (0.0%) |
| Personal Care & Service | 25 (44.6%) | 31 (55.4%) |
| Total (Category) | 131 (54.6%) | 109 (45.4%) |
| Total (Overall) | 907 (51.8%) | 845 (48.2%) |
Sales and Office Occupations
The most common Sales and Office occupations in Howe are Office & Administration (170 | 9.7%), and Sales & Related (153 | 8.7%).
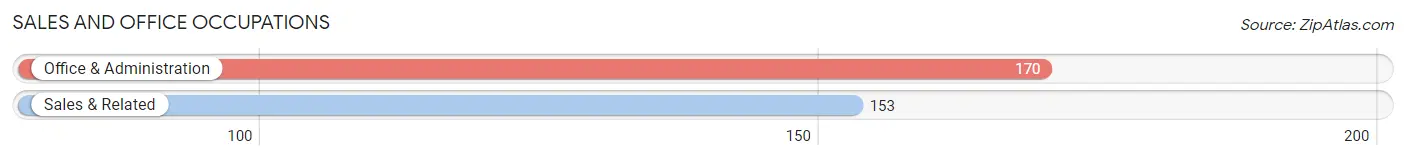
Sales and Office Occupations by Sex
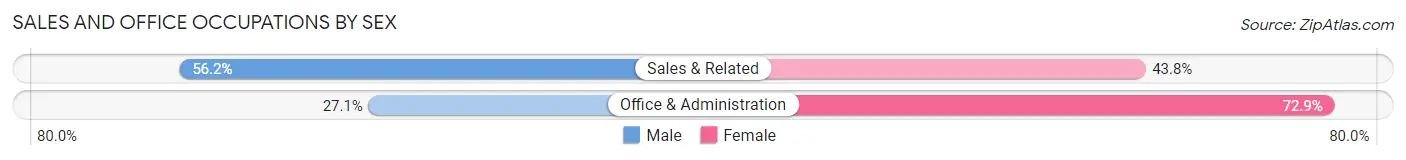
| Occupation | Male | Female |
| Sales & Related | 86 (56.2%) | 67 (43.8%) |
| Office & Administration | 46 (27.1%) | 124 (72.9%) |
| Total (Category) | 132 (40.9%) | 191 (59.1%) |
| Total (Overall) | 907 (51.8%) | 845 (48.2%) |
Natural Resources, Construction and Maintenance Occupations
The most common Natural Resources, Construction and Maintenance occupations in Howe are Construction & Extraction (189 | 10.8%), and Installation, Maintenance & Repair (134 | 7.6%).
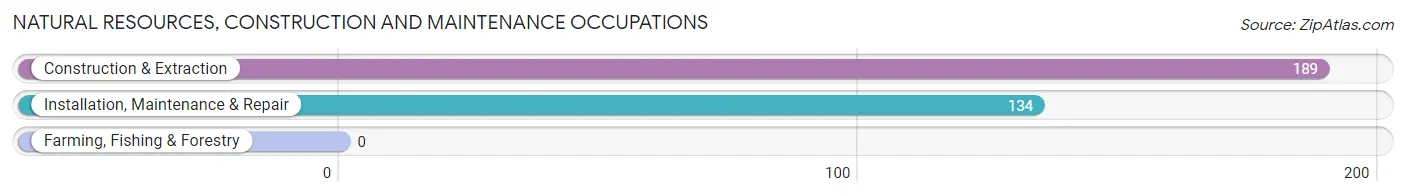
Natural Resources, Construction and Maintenance Occupations by Sex
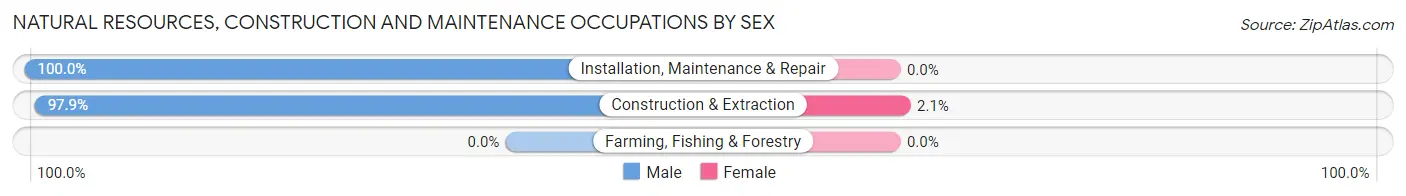
| Occupation | Male | Female |
| Farming, Fishing & Forestry | 0 (0.0%) | 0 (0.0%) |
| Construction & Extraction | 185 (97.9%) | 4 (2.1%) |
| Installation, Maintenance & Repair | 134 (100.0%) | 0 (0.0%) |
| Total (Category) | 319 (98.8%) | 4 (1.2%) |
| Total (Overall) | 907 (51.8%) | 845 (48.2%) |
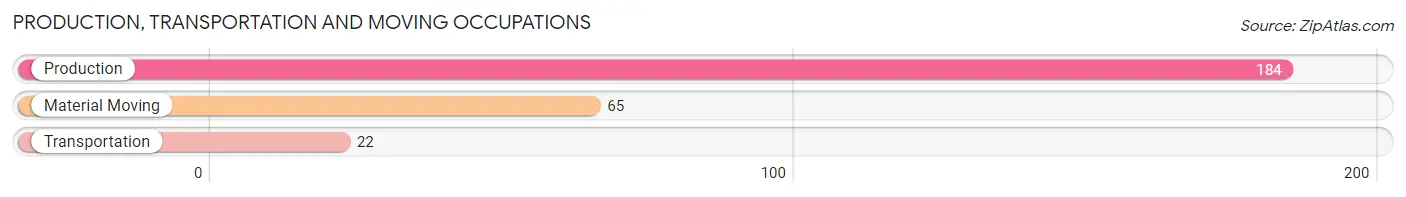
Production, Transportation and Moving Occupations
The most common Production, Transportation and Moving occupations in Howe are Production (184 | 10.5%), Material Moving (65 | 3.7%), and Transportation (22 | 1.3%).
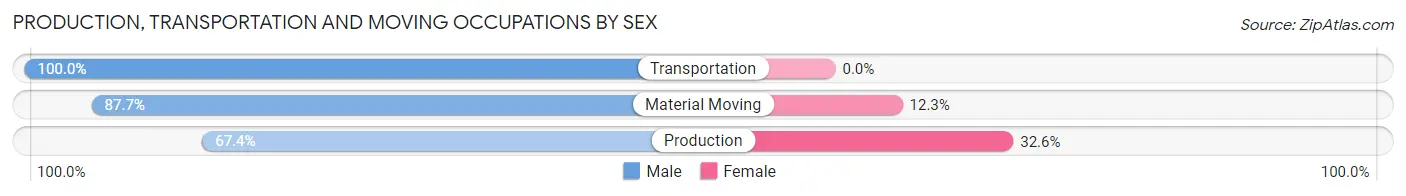
Production, Transportation and Moving Occupations by Sex
| Occupation | Male | Female |
| Production | 124 (67.4%) | 60 (32.6%) |
| Transportation | 22 (100.0%) | 0 (0.0%) |
| Material Moving | 57 (87.7%) | 8 (12.3%) |
| Total (Category) | 203 (74.9%) | 68 (25.1%) |
| Total (Overall) | 907 (51.8%) | 845 (48.2%) |
Employment Industries by Sex in Howe
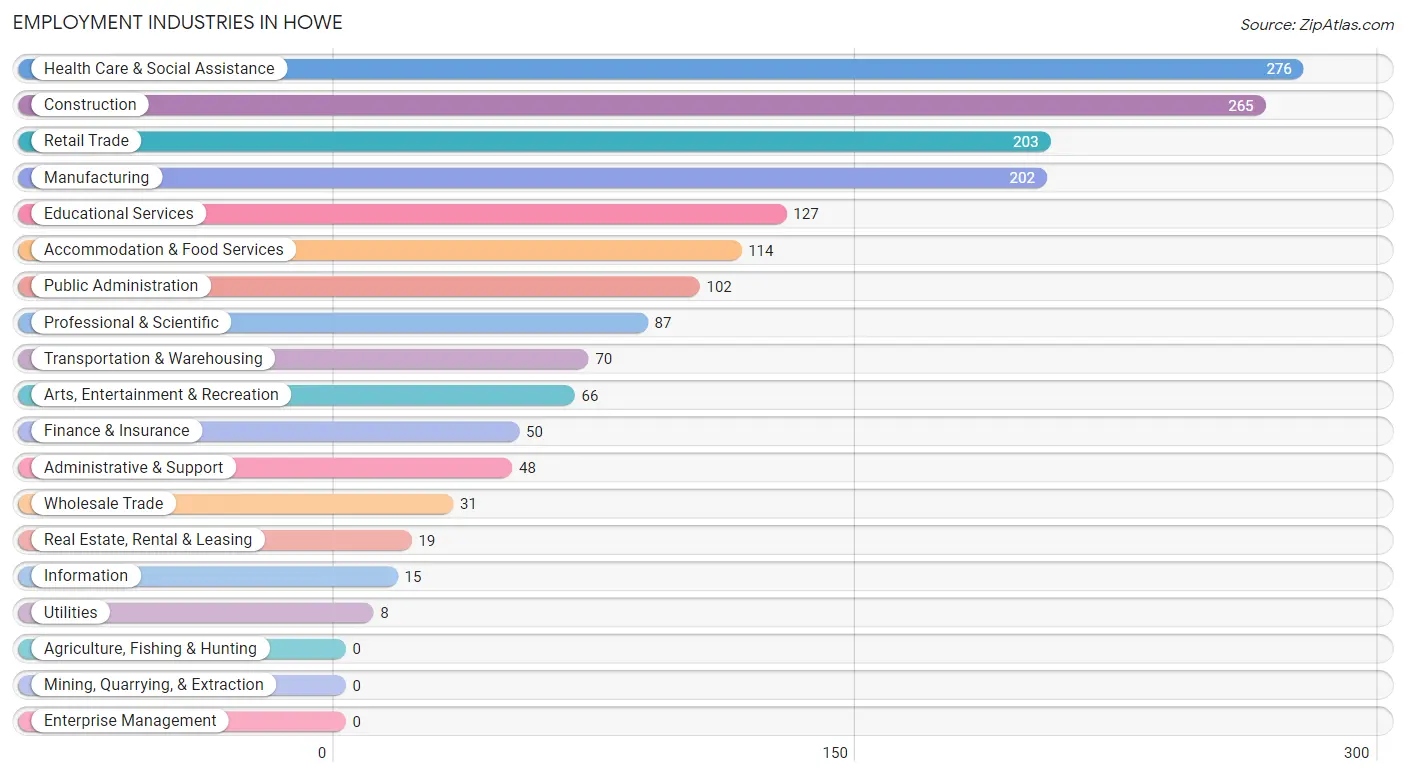
Employment Industries in Howe
The major employment industries in Howe include Health Care & Social Assistance (276 | 15.8%), Construction (265 | 15.1%), Retail Trade (203 | 11.6%), Manufacturing (202 | 11.5%), and Educational Services (127 | 7.2%).
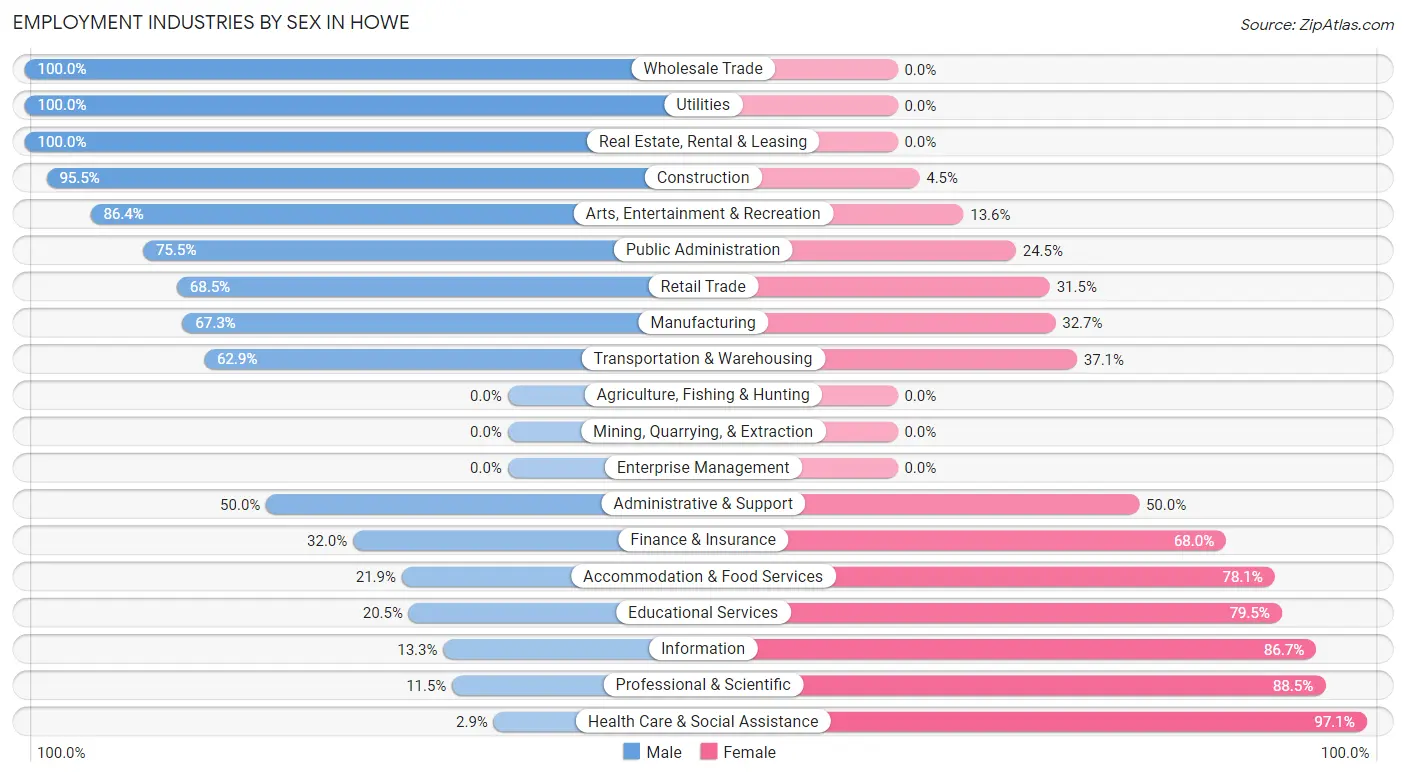
Employment Industries by Sex in Howe
The Howe industries that see more men than women are Wholesale Trade (100.0%), Utilities (100.0%), and Real Estate, Rental & Leasing (100.0%), whereas the industries that tend to have a higher number of women are Health Care & Social Assistance (97.1%), Professional & Scientific (88.5%), and Information (86.7%).
| Industry | Male | Female |
| Agriculture, Fishing & Hunting | 0 (0.0%) | 0 (0.0%) |
| Mining, Quarrying, & Extraction | 0 (0.0%) | 0 (0.0%) |
| Construction | 253 (95.5%) | 12 (4.5%) |
| Manufacturing | 136 (67.3%) | 66 (32.7%) |
| Wholesale Trade | 31 (100.0%) | 0 (0.0%) |
| Retail Trade | 139 (68.5%) | 64 (31.5%) |
| Transportation & Warehousing | 44 (62.9%) | 26 (37.1%) |
| Utilities | 8 (100.0%) | 0 (0.0%) |
| Information | 2 (13.3%) | 13 (86.7%) |
| Finance & Insurance | 16 (32.0%) | 34 (68.0%) |
| Real Estate, Rental & Leasing | 19 (100.0%) | 0 (0.0%) |
| Professional & Scientific | 10 (11.5%) | 77 (88.5%) |
| Enterprise Management | 0 (0.0%) | 0 (0.0%) |
| Administrative & Support | 24 (50.0%) | 24 (50.0%) |
| Educational Services | 26 (20.5%) | 101 (79.5%) |
| Health Care & Social Assistance | 8 (2.9%) | 268 (97.1%) |
| Arts, Entertainment & Recreation | 57 (86.4%) | 9 (13.6%) |
| Accommodation & Food Services | 25 (21.9%) | 89 (78.1%) |
| Public Administration | 77 (75.5%) | 25 (24.5%) |
| Total | 907 (51.8%) | 845 (48.2%) |
Education in Howe
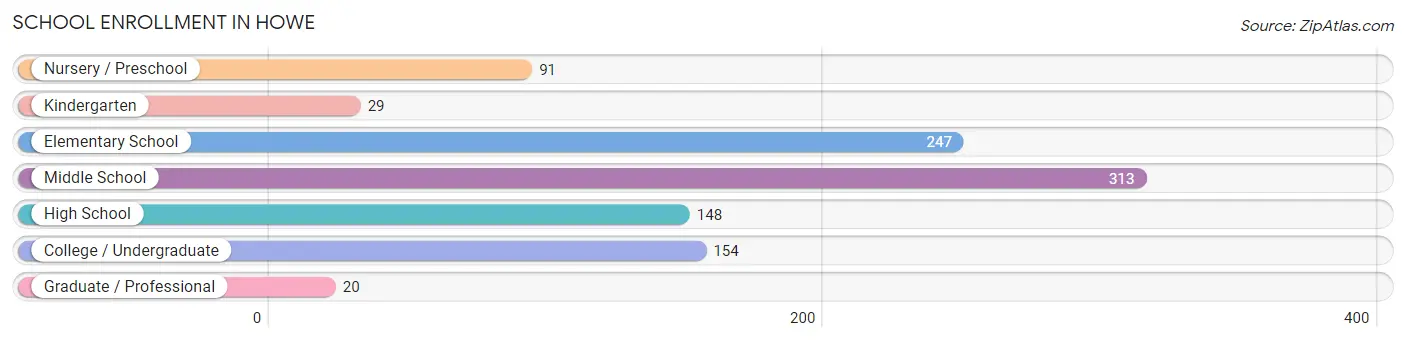
School Enrollment in Howe
The most common levels of schooling among the 1,002 students in Howe are middle school (313 | 31.2%), elementary school (247 | 24.6%), and college / undergraduate (154 | 15.4%).
| School Level | # Students | % Students |
| Nursery / Preschool | 91 | 9.1% |
| Kindergarten | 29 | 2.9% |
| Elementary School | 247 | 24.6% |
| Middle School | 313 | 31.2% |
| High School | 148 | 14.8% |
| College / Undergraduate | 154 | 15.4% |
| Graduate / Professional | 20 | 2.0% |
| Total | 1,002 | 100.0% |
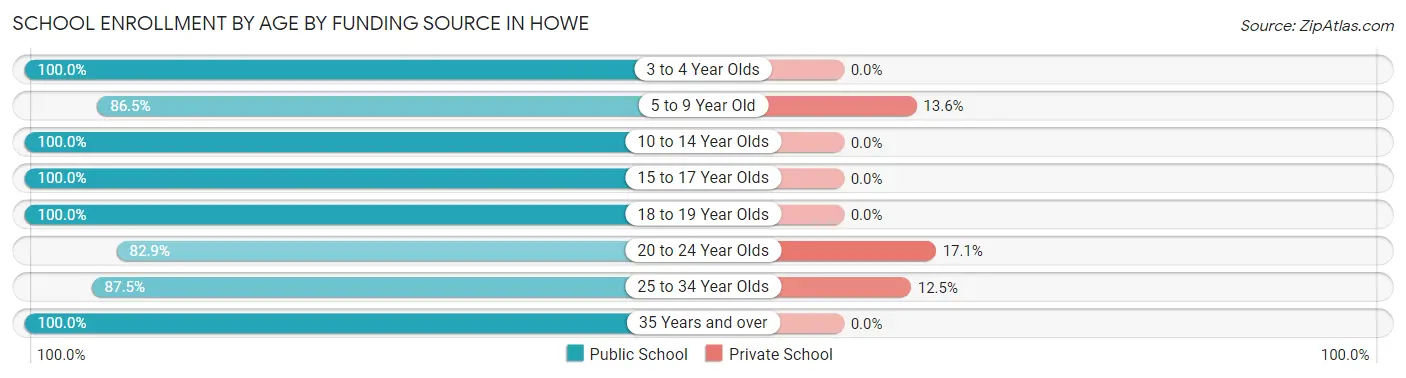
School Enrollment by Age by Funding Source in Howe
Out of a total of 1,002 students who are enrolled in schools in Howe, 53 (5.3%) attend a private institution, while the remaining 949 (94.7%) are enrolled in public schools. The age group of 20 to 24 year olds has the highest likelihood of being enrolled in private schools, with 6 (17.1% in the age bracket) enrolled. Conversely, the age group of 3 to 4 year olds has the lowest likelihood of being enrolled in a private school, with 39 (100.0% in the age bracket) attending a public institution.
| Age Bracket | Public School | Private School |
| 3 to 4 Year Olds | 39 (100.0%) | 0 (0.0%) |
| 5 to 9 Year Old | 236 (86.5%) | 37 (13.6%) |
| 10 to 14 Year Olds | 354 (100.0%) | 0 (0.0%) |
| 15 to 17 Year Olds | 162 (100.0%) | 0 (0.0%) |
| 18 to 19 Year Olds | 34 (100.0%) | 0 (0.0%) |
| 20 to 24 Year Olds | 29 (82.9%) | 6 (17.1%) |
| 25 to 34 Year Olds | 70 (87.5%) | 10 (12.5%) |
| 35 Years and over | 25 (100.0%) | 0 (0.0%) |
| Total | 949 (94.7%) | 53 (5.3%) |
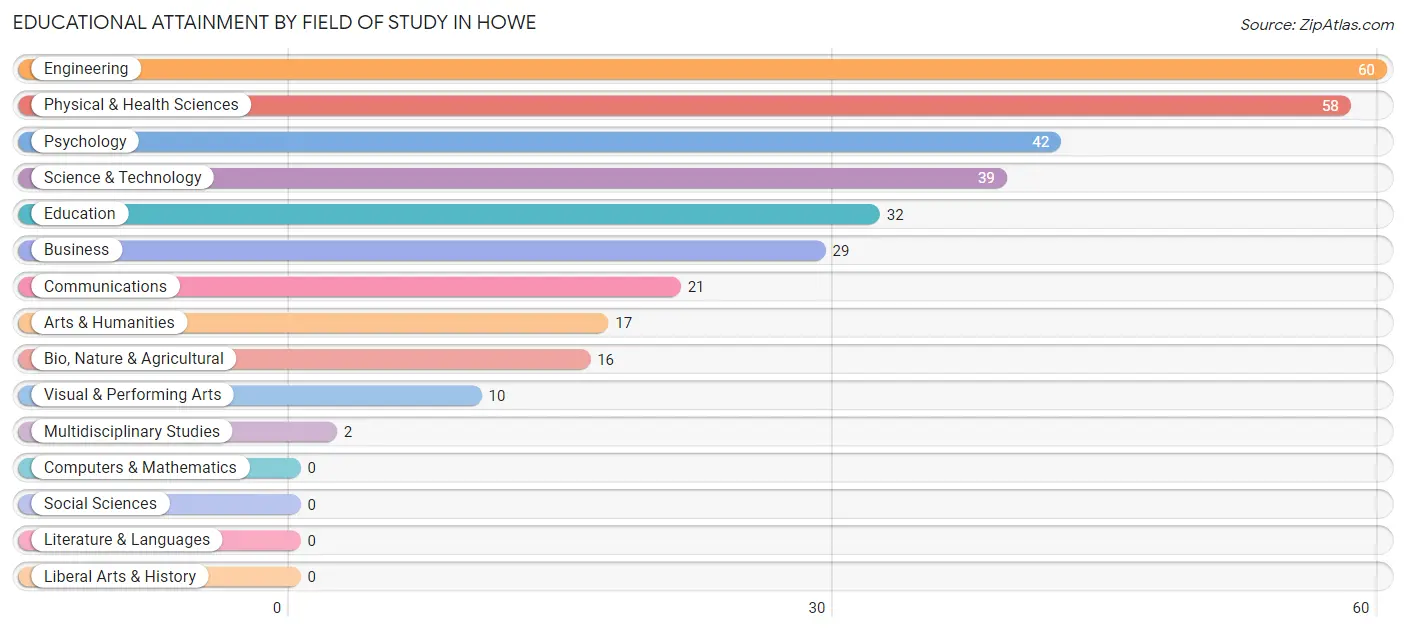
Educational Attainment by Field of Study in Howe
Engineering (60 | 18.4%), physical & health sciences (58 | 17.8%), psychology (42 | 12.9%), science & technology (39 | 12.0%), and education (32 | 9.8%) are the most common fields of study among 326 individuals in Howe who have obtained a bachelor's degree or higher.
| Field of Study | # Graduates | % Graduates |
| Computers & Mathematics | 0 | 0.0% |
| Bio, Nature & Agricultural | 16 | 4.9% |
| Physical & Health Sciences | 58 | 17.8% |
| Psychology | 42 | 12.9% |
| Social Sciences | 0 | 0.0% |
| Engineering | 60 | 18.4% |
| Multidisciplinary Studies | 2 | 0.6% |
| Science & Technology | 39 | 12.0% |
| Business | 29 | 8.9% |
| Education | 32 | 9.8% |
| Literature & Languages | 0 | 0.0% |
| Liberal Arts & History | 0 | 0.0% |
| Visual & Performing Arts | 10 | 3.1% |
| Communications | 21 | 6.4% |
| Arts & Humanities | 17 | 5.2% |
| Total | 326 | 100.0% |
Transportation & Commute in Howe
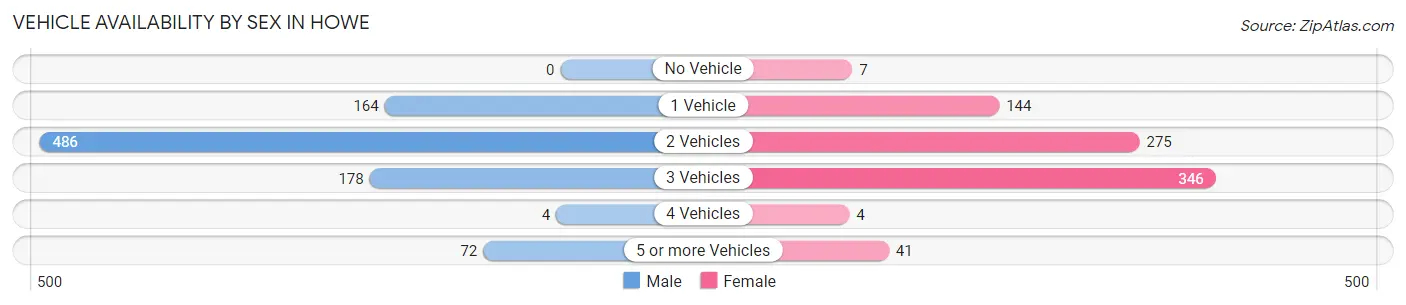
Vehicle Availability by Sex in Howe
The most prevalent vehicle ownership categories in Howe are males with 2 vehicles (486, accounting for 53.8%) and females with 2 vehicles (275, making up 59.5%).
| Vehicles Available | Male | Female |
| No Vehicle | 0 (0.0%) | 7 (0.9%) |
| 1 Vehicle | 164 (18.1%) | 144 (17.6%) |
| 2 Vehicles | 486 (53.8%) | 275 (33.7%) |
| 3 Vehicles | 178 (19.7%) | 346 (42.3%) |
| 4 Vehicles | 4 (0.4%) | 4 (0.5%) |
| 5 or more Vehicles | 72 (8.0%) | 41 (5.0%) |
| Total | 904 (100.0%) | 817 (100.0%) |
Commute Time in Howe
The most frequently occuring commute durations in Howe are 20 to 24 minutes (275 commuters, 16.8%), 10 to 14 minutes (242 commuters, 14.8%), and 15 to 19 minutes (193 commuters, 11.8%).
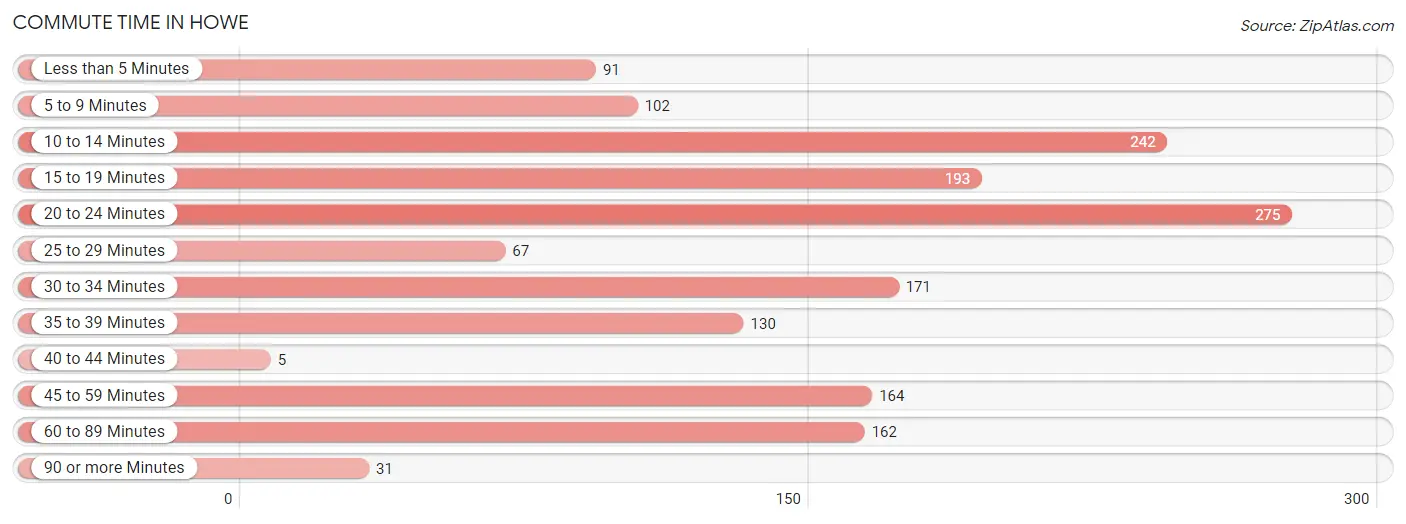
| Commute Time | # Commuters | % Commuters |
| Less than 5 Minutes | 91 | 5.6% |
| 5 to 9 Minutes | 102 | 6.2% |
| 10 to 14 Minutes | 242 | 14.8% |
| 15 to 19 Minutes | 193 | 11.8% |
| 20 to 24 Minutes | 275 | 16.8% |
| 25 to 29 Minutes | 67 | 4.1% |
| 30 to 34 Minutes | 171 | 10.5% |
| 35 to 39 Minutes | 130 | 8.0% |
| 40 to 44 Minutes | 5 | 0.3% |
| 45 to 59 Minutes | 164 | 10.0% |
| 60 to 89 Minutes | 162 | 9.9% |
| 90 or more Minutes | 31 | 1.9% |
Commute Time by Sex in Howe
The most common commute times in Howe are 10 to 14 minutes (156 commuters, 17.3%) for males and 15 to 19 minutes (152 commuters, 20.8%) for females.
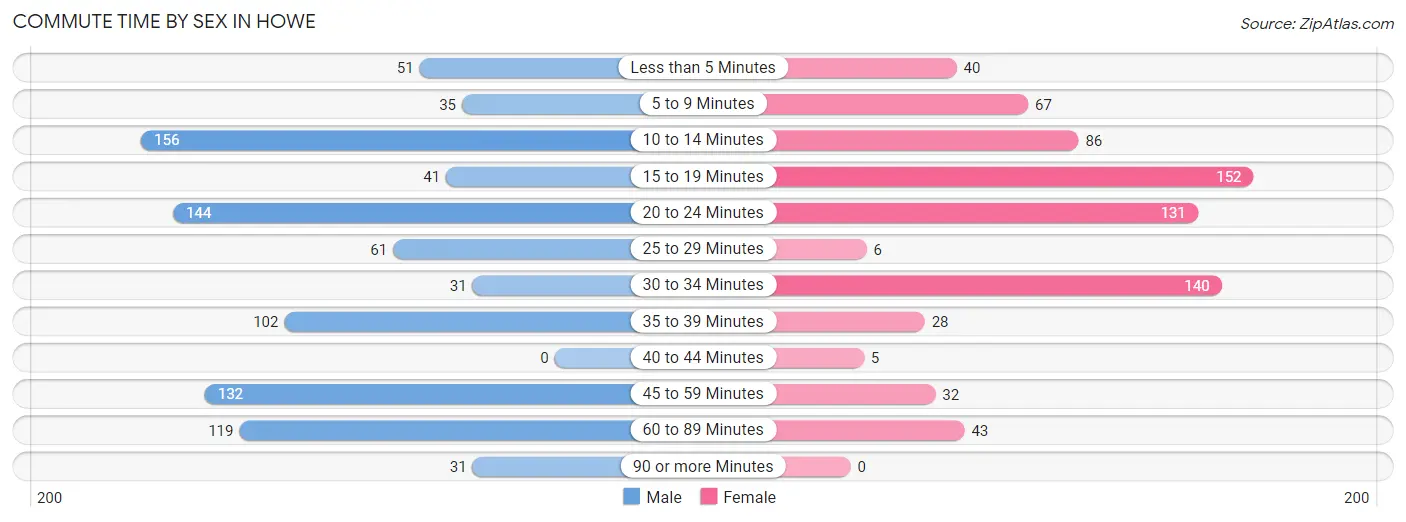
| Commute Time | Male | Female |
| Less than 5 Minutes | 51 (5.7%) | 40 (5.5%) |
| 5 to 9 Minutes | 35 (3.9%) | 67 (9.2%) |
| 10 to 14 Minutes | 156 (17.3%) | 86 (11.8%) |
| 15 to 19 Minutes | 41 (4.5%) | 152 (20.8%) |
| 20 to 24 Minutes | 144 (16.0%) | 131 (17.9%) |
| 25 to 29 Minutes | 61 (6.8%) | 6 (0.8%) |
| 30 to 34 Minutes | 31 (3.4%) | 140 (19.2%) |
| 35 to 39 Minutes | 102 (11.3%) | 28 (3.8%) |
| 40 to 44 Minutes | 0 (0.0%) | 5 (0.7%) |
| 45 to 59 Minutes | 132 (14.6%) | 32 (4.4%) |
| 60 to 89 Minutes | 119 (13.2%) | 43 (5.9%) |
| 90 or more Minutes | 31 (3.4%) | 0 (0.0%) |
Time of Departure to Work by Sex in Howe
The most frequent times of departure to work in Howe are 4:00 PM to 11:59 PM (173, 19.2%) for males and 6:30 AM to 6:59 AM (150, 20.5%) for females.
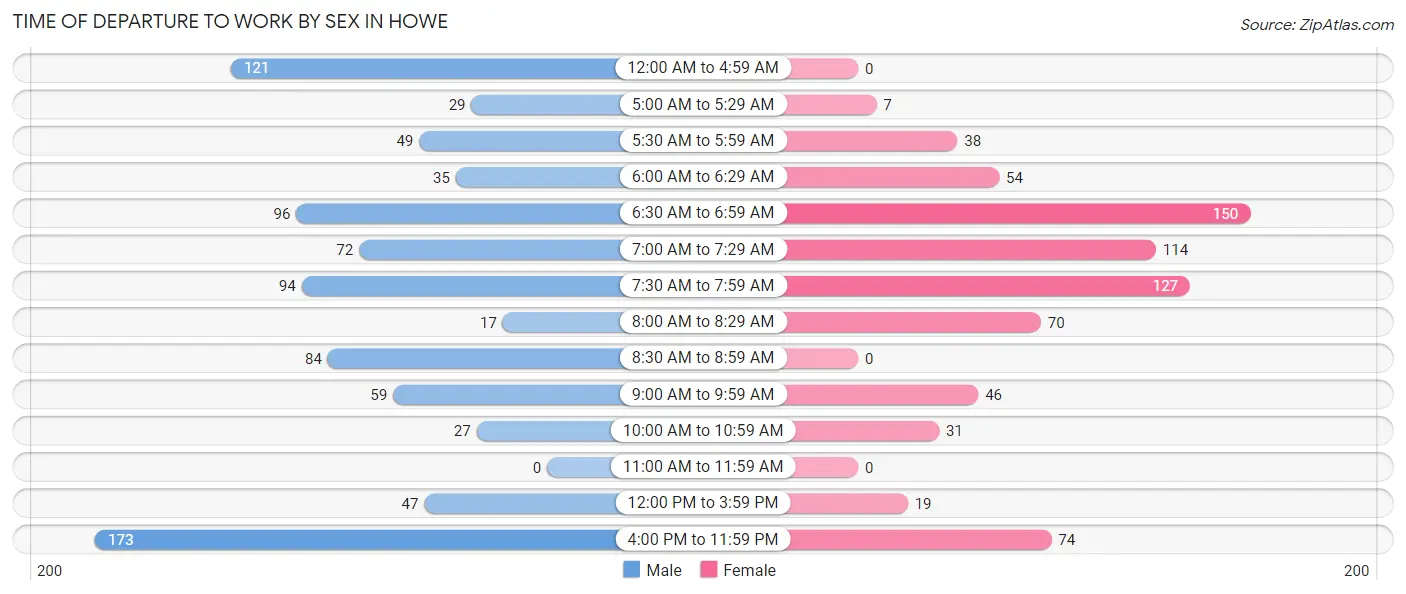
| Time of Departure | Male | Female |
| 12:00 AM to 4:59 AM | 121 (13.4%) | 0 (0.0%) |
| 5:00 AM to 5:29 AM | 29 (3.2%) | 7 (1.0%) |
| 5:30 AM to 5:59 AM | 49 (5.4%) | 38 (5.2%) |
| 6:00 AM to 6:29 AM | 35 (3.9%) | 54 (7.4%) |
| 6:30 AM to 6:59 AM | 96 (10.6%) | 150 (20.5%) |
| 7:00 AM to 7:29 AM | 72 (8.0%) | 114 (15.6%) |
| 7:30 AM to 7:59 AM | 94 (10.4%) | 127 (17.4%) |
| 8:00 AM to 8:29 AM | 17 (1.9%) | 70 (9.6%) |
| 8:30 AM to 8:59 AM | 84 (9.3%) | 0 (0.0%) |
| 9:00 AM to 9:59 AM | 59 (6.5%) | 46 (6.3%) |
| 10:00 AM to 10:59 AM | 27 (3.0%) | 31 (4.3%) |
| 11:00 AM to 11:59 AM | 0 (0.0%) | 0 (0.0%) |
| 12:00 PM to 3:59 PM | 47 (5.2%) | 19 (2.6%) |
| 4:00 PM to 11:59 PM | 173 (19.2%) | 74 (10.1%) |
| Total | 903 (100.0%) | 730 (100.0%) |
Housing Occupancy in Howe
Occupancy by Ownership in Howe
Of the total 1,161 dwellings in Howe, owner-occupied units account for 615 (53.0%), while renter-occupied units make up 546 (47.0%).
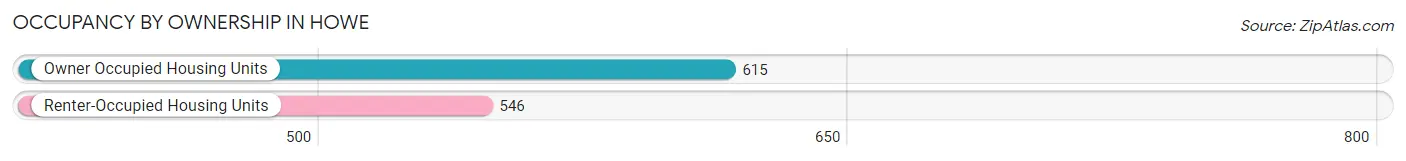
| Occupancy | # Housing Units | % Housing Units |
| Owner Occupied Housing Units | 615 | 53.0% |
| Renter-Occupied Housing Units | 546 | 47.0% |
| Total Occupied Housing Units | 1,161 | 100.0% |
Occupancy by Household Size in Howe
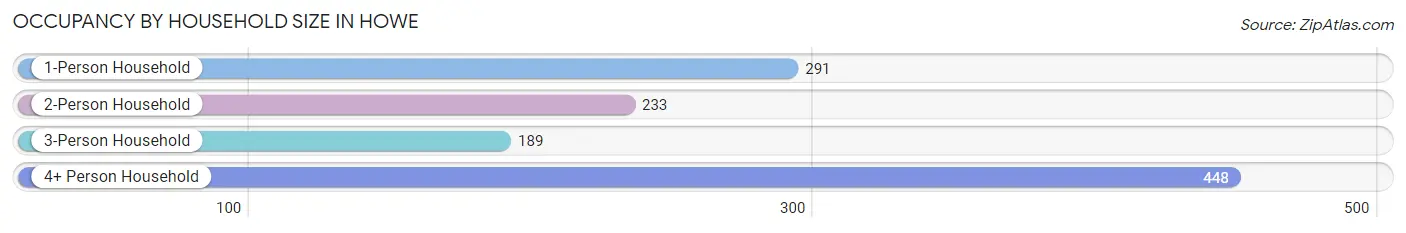
| Household Size | # Housing Units | % Housing Units |
| 1-Person Household | 291 | 25.1% |
| 2-Person Household | 233 | 20.1% |
| 3-Person Household | 189 | 16.3% |
| 4+ Person Household | 448 | 38.6% |
| Total Housing Units | 1,161 | 100.0% |
Occupancy by Ownership by Household Size in Howe
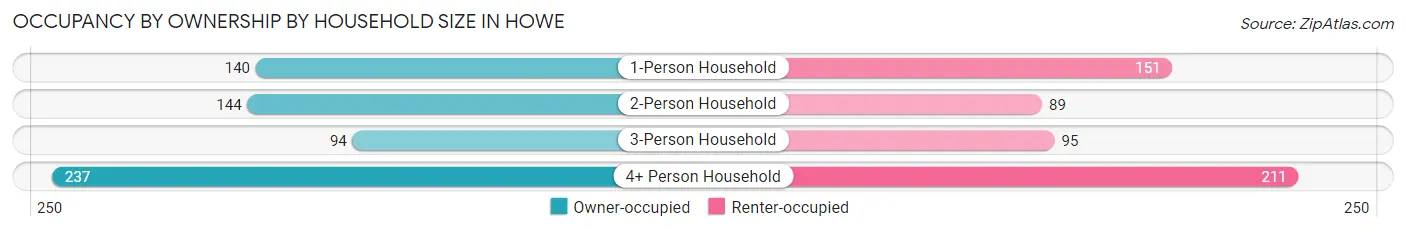
| Household Size | Owner-occupied | Renter-occupied |
| 1-Person Household | 140 (48.1%) | 151 (51.9%) |
| 2-Person Household | 144 (61.8%) | 89 (38.2%) |
| 3-Person Household | 94 (49.7%) | 95 (50.3%) |
| 4+ Person Household | 237 (52.9%) | 211 (47.1%) |
| Total Housing Units | 615 (53.0%) | 546 (47.0%) |
Occupancy by Educational Attainment in Howe
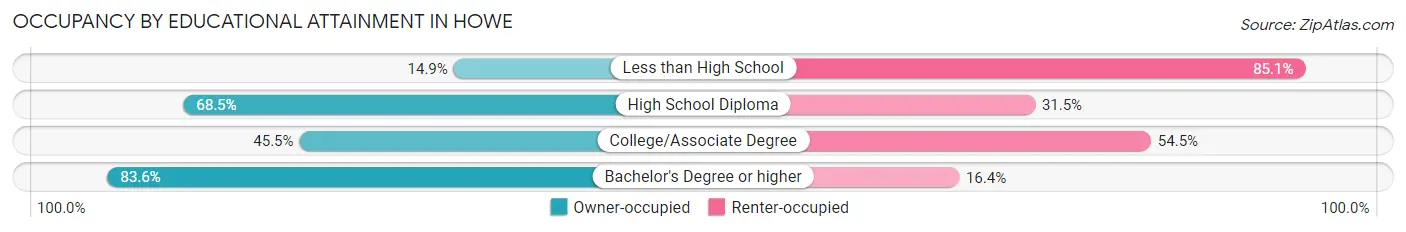
| Household Size | Owner-occupied | Renter-occupied |
| Less than High School | 23 (14.9%) | 131 (85.1%) |
| High School Diploma | 246 (68.5%) | 113 (31.5%) |
| College/Associate Degree | 234 (45.5%) | 280 (54.5%) |
| Bachelor's Degree or higher | 112 (83.6%) | 22 (16.4%) |
Occupancy by Age of Householder in Howe
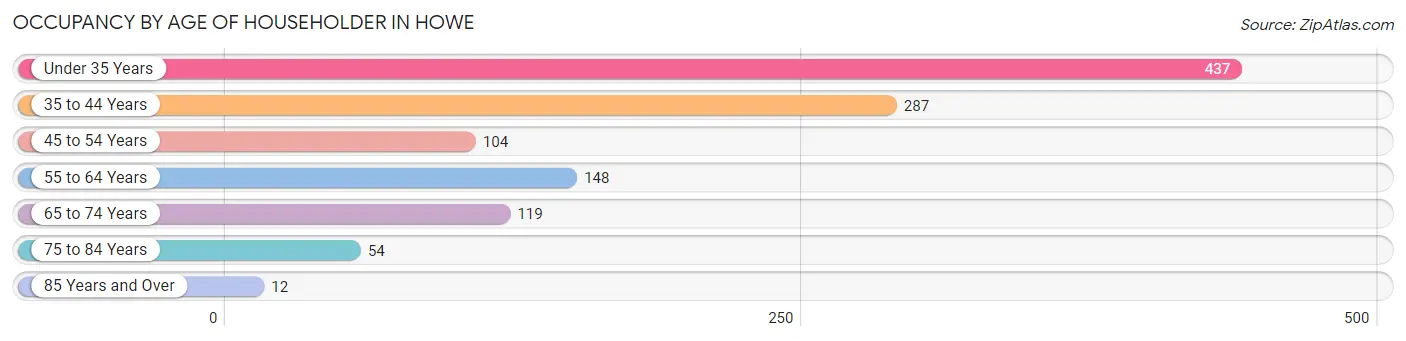
| Age Bracket | # Households | % Households |
| Under 35 Years | 437 | 37.6% |
| 35 to 44 Years | 287 | 24.7% |
| 45 to 54 Years | 104 | 9.0% |
| 55 to 64 Years | 148 | 12.8% |
| 65 to 74 Years | 119 | 10.2% |
| 75 to 84 Years | 54 | 4.6% |
| 85 Years and Over | 12 | 1.0% |
| Total | 1,161 | 100.0% |
Housing Finances in Howe
Median Income by Occupancy in Howe
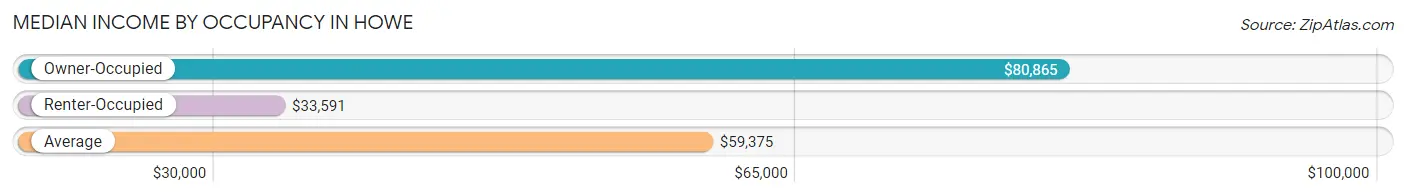
| Occupancy Type | # Households | Median Income |
| Owner-Occupied | 615 (53.0%) | $80,865 |
| Renter-Occupied | 546 (47.0%) | $33,591 |
| Average | 1,161 (100.0%) | $59,375 |
Occupancy by Householder Income Bracket in Howe
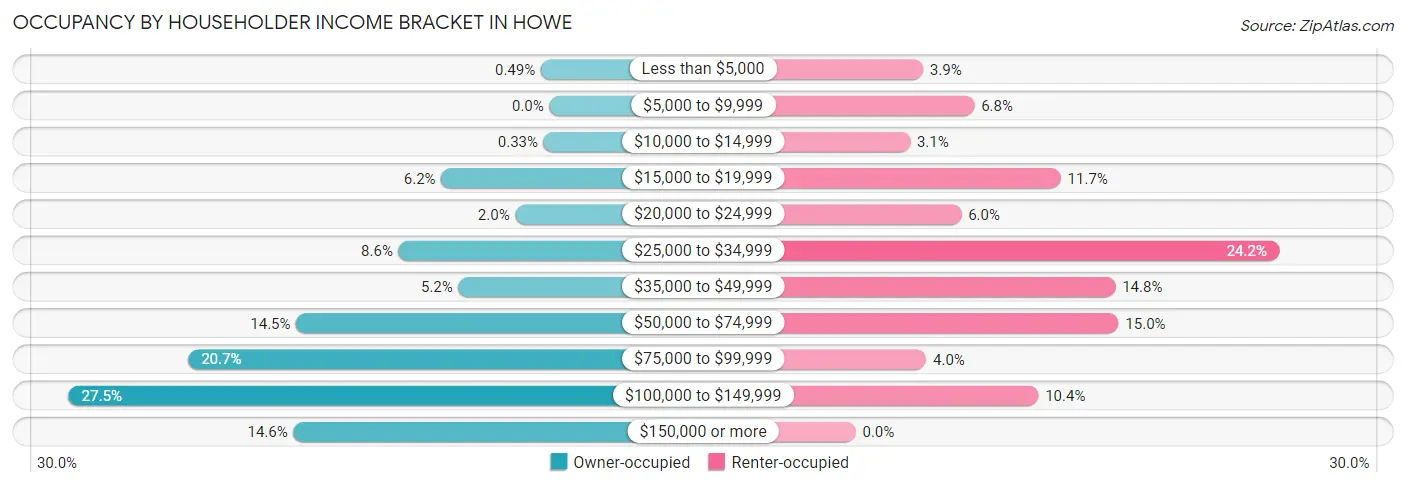
| Income Bracket | Owner-occupied | Renter-occupied |
| Less than $5,000 | 3 (0.5%) | 21 (3.8%) |
| $5,000 to $9,999 | 0 (0.0%) | 37 (6.8%) |
| $10,000 to $14,999 | 2 (0.3%) | 17 (3.1%) |
| $15,000 to $19,999 | 38 (6.2%) | 64 (11.7%) |
| $20,000 to $24,999 | 12 (1.9%) | 33 (6.0%) |
| $25,000 to $34,999 | 53 (8.6%) | 132 (24.2%) |
| $35,000 to $49,999 | 32 (5.2%) | 81 (14.8%) |
| $50,000 to $74,999 | 89 (14.5%) | 82 (15.0%) |
| $75,000 to $99,999 | 127 (20.6%) | 22 (4.0%) |
| $100,000 to $149,999 | 169 (27.5%) | 57 (10.4%) |
| $150,000 or more | 90 (14.6%) | 0 (0.0%) |
| Total | 615 (100.0%) | 546 (100.0%) |
Monthly Housing Cost Tiers in Howe
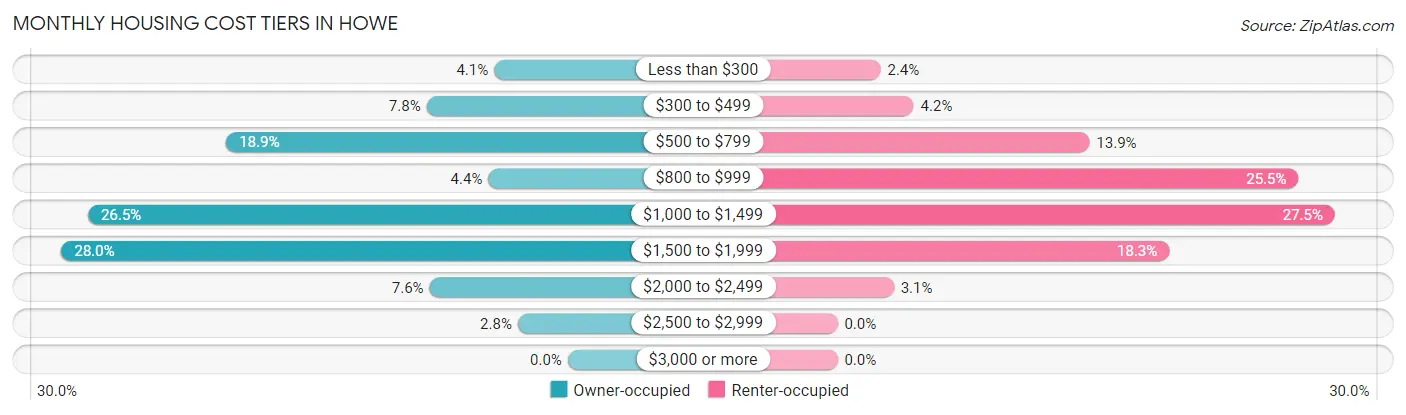
| Monthly Cost | Owner-occupied | Renter-occupied |
| Less than $300 | 25 (4.1%) | 13 (2.4%) |
| $300 to $499 | 48 (7.8%) | 23 (4.2%) |
| $500 to $799 | 116 (18.9%) | 76 (13.9%) |
| $800 to $999 | 27 (4.4%) | 139 (25.5%) |
| $1,000 to $1,499 | 163 (26.5%) | 150 (27.5%) |
| $1,500 to $1,999 | 172 (28.0%) | 100 (18.3%) |
| $2,000 to $2,499 | 47 (7.6%) | 17 (3.1%) |
| $2,500 to $2,999 | 17 (2.8%) | 0 (0.0%) |
| $3,000 or more | 0 (0.0%) | 0 (0.0%) |
| Total | 615 (100.0%) | 546 (100.0%) |
Physical Housing Characteristics in Howe
Housing Structures in Howe
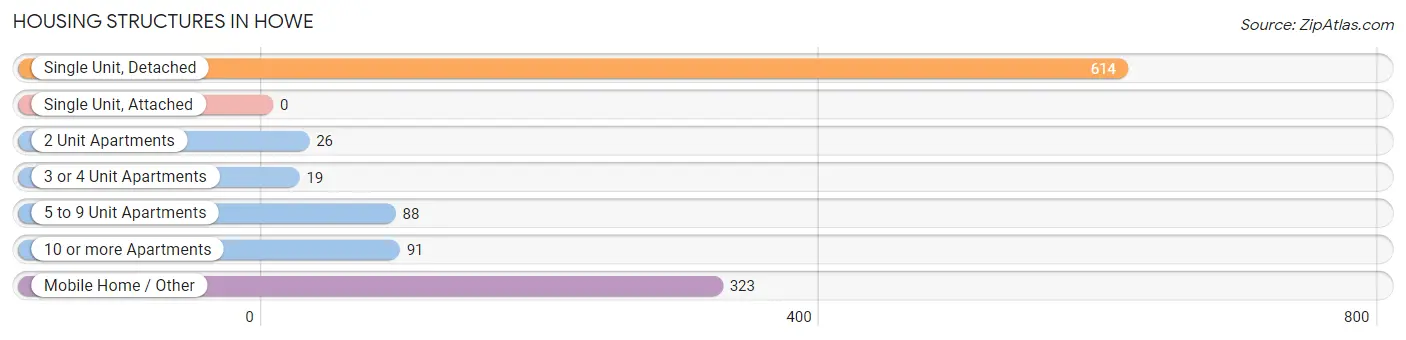
| Structure Type | # Housing Units | % Housing Units |
| Single Unit, Detached | 614 | 52.9% |
| Single Unit, Attached | 0 | 0.0% |
| 2 Unit Apartments | 26 | 2.2% |
| 3 or 4 Unit Apartments | 19 | 1.6% |
| 5 to 9 Unit Apartments | 88 | 7.6% |
| 10 or more Apartments | 91 | 7.8% |
| Mobile Home / Other | 323 | 27.8% |
| Total | 1,161 | 100.0% |
Housing Structures by Occupancy in Howe
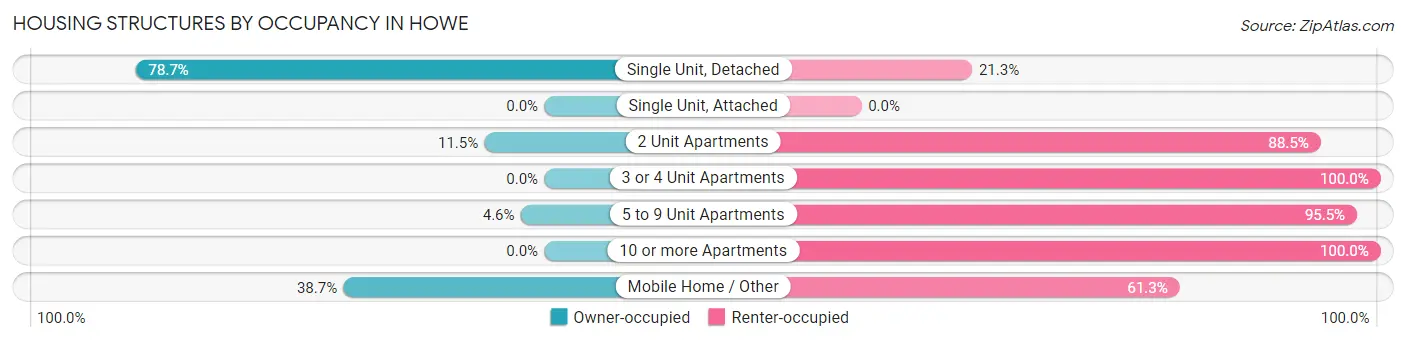
| Structure Type | Owner-occupied | Renter-occupied |
| Single Unit, Detached | 483 (78.7%) | 131 (21.3%) |
| Single Unit, Attached | 0 (0.0%) | 0 (0.0%) |
| 2 Unit Apartments | 3 (11.5%) | 23 (88.5%) |
| 3 or 4 Unit Apartments | 0 (0.0%) | 19 (100.0%) |
| 5 to 9 Unit Apartments | 4 (4.5%) | 84 (95.5%) |
| 10 or more Apartments | 0 (0.0%) | 91 (100.0%) |
| Mobile Home / Other | 125 (38.7%) | 198 (61.3%) |
| Total | 615 (53.0%) | 546 (47.0%) |
Housing Structures by Number of Rooms in Howe
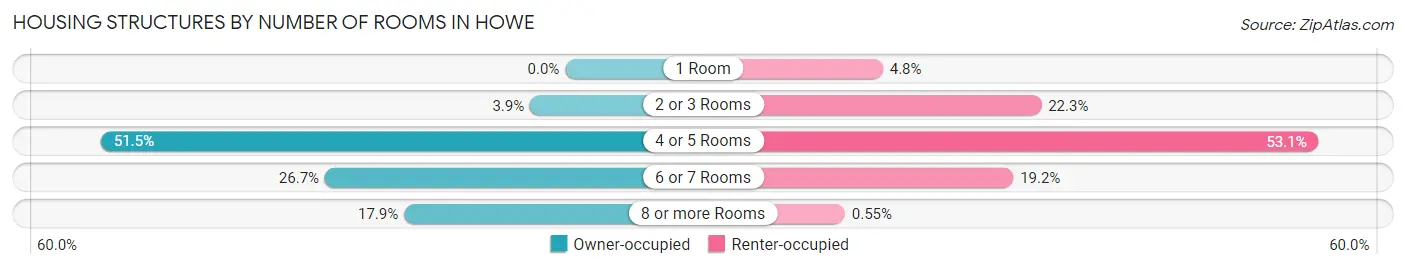
| Number of Rooms | Owner-occupied | Renter-occupied |
| 1 Room | 0 (0.0%) | 26 (4.8%) |
| 2 or 3 Rooms | 24 (3.9%) | 122 (22.3%) |
| 4 or 5 Rooms | 317 (51.5%) | 290 (53.1%) |
| 6 or 7 Rooms | 164 (26.7%) | 105 (19.2%) |
| 8 or more Rooms | 110 (17.9%) | 3 (0.5%) |
| Total | 615 (100.0%) | 546 (100.0%) |
Housing Structure by Heating Type in Howe
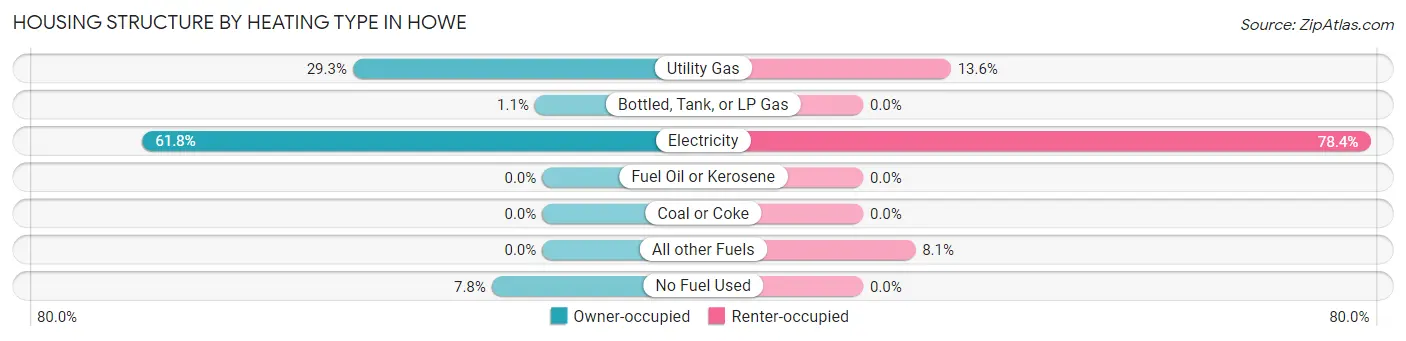
| Heating Type | Owner-occupied | Renter-occupied |
| Utility Gas | 180 (29.3%) | 74 (13.6%) |
| Bottled, Tank, or LP Gas | 7 (1.1%) | 0 (0.0%) |
| Electricity | 380 (61.8%) | 428 (78.4%) |
| Fuel Oil or Kerosene | 0 (0.0%) | 0 (0.0%) |
| Coal or Coke | 0 (0.0%) | 0 (0.0%) |
| All other Fuels | 0 (0.0%) | 44 (8.1%) |
| No Fuel Used | 48 (7.8%) | 0 (0.0%) |
| Total | 615 (100.0%) | 546 (100.0%) |
Household Vehicle Usage in Howe
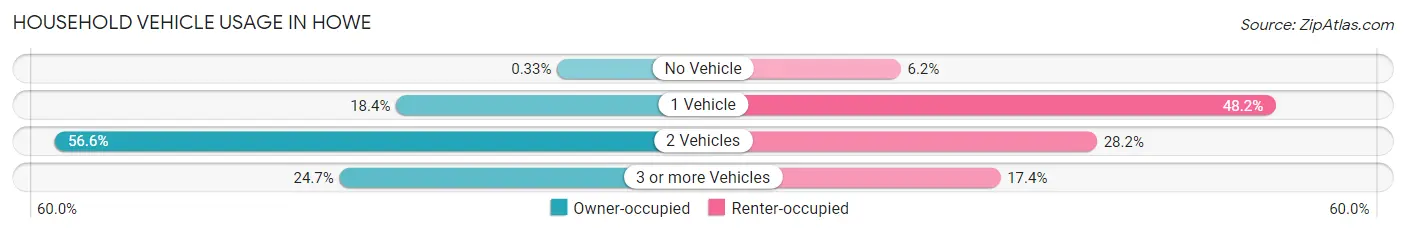
| Vehicles per Household | Owner-occupied | Renter-occupied |
| No Vehicle | 2 (0.3%) | 34 (6.2%) |
| 1 Vehicle | 113 (18.4%) | 263 (48.2%) |
| 2 Vehicles | 348 (56.6%) | 154 (28.2%) |
| 3 or more Vehicles | 152 (24.7%) | 95 (17.4%) |
| Total | 615 (100.0%) | 546 (100.0%) |
Real Estate & Mortgages in Howe
Real Estate and Mortgage Overview in Howe
| Characteristic | Without Mortgage | With Mortgage |
| Housing Units | 216 | 399 |
| Median Property Value | $97,900 | $191,300 |
| Median Household Income | $61,667 | $47 |
| Monthly Housing Costs | $600 | $0 |
| Real Estate Taxes | $1,419 | $38 |
Property Value by Mortgage Status in Howe
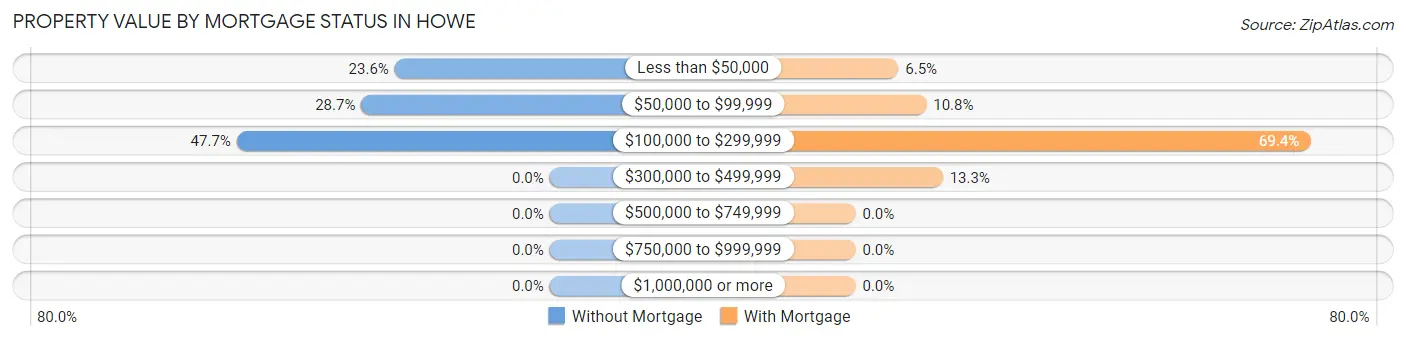
| Property Value | Without Mortgage | With Mortgage |
| Less than $50,000 | 51 (23.6%) | 26 (6.5%) |
| $50,000 to $99,999 | 62 (28.7%) | 43 (10.8%) |
| $100,000 to $299,999 | 103 (47.7%) | 277 (69.4%) |
| $300,000 to $499,999 | 0 (0.0%) | 53 (13.3%) |
| $500,000 to $749,999 | 0 (0.0%) | 0 (0.0%) |
| $750,000 to $999,999 | 0 (0.0%) | 0 (0.0%) |
| $1,000,000 or more | 0 (0.0%) | 0 (0.0%) |
| Total | 216 (100.0%) | 399 (100.0%) |
Household Income by Mortgage Status in Howe
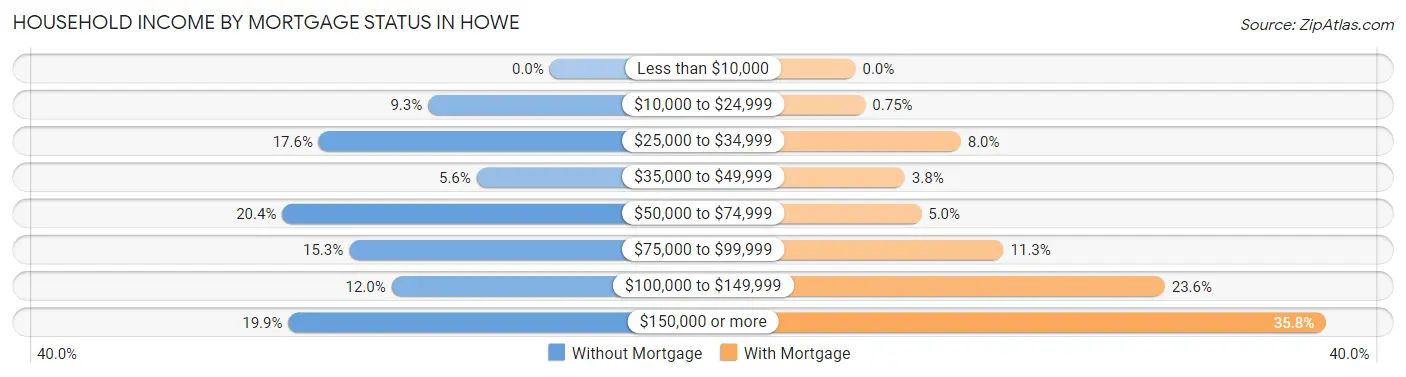
| Household Income | Without Mortgage | With Mortgage |
| Less than $10,000 | 0 (0.0%) | 0 (0.0%) |
| $10,000 to $24,999 | 20 (9.3%) | 3 (0.7%) |
| $25,000 to $34,999 | 38 (17.6%) | 32 (8.0%) |
| $35,000 to $49,999 | 12 (5.6%) | 15 (3.8%) |
| $50,000 to $74,999 | 44 (20.4%) | 20 (5.0%) |
| $75,000 to $99,999 | 33 (15.3%) | 45 (11.3%) |
| $100,000 to $149,999 | 26 (12.0%) | 94 (23.6%) |
| $150,000 or more | 43 (19.9%) | 143 (35.8%) |
| Total | 216 (100.0%) | 399 (100.0%) |
Property Value to Household Income Ratio in Howe
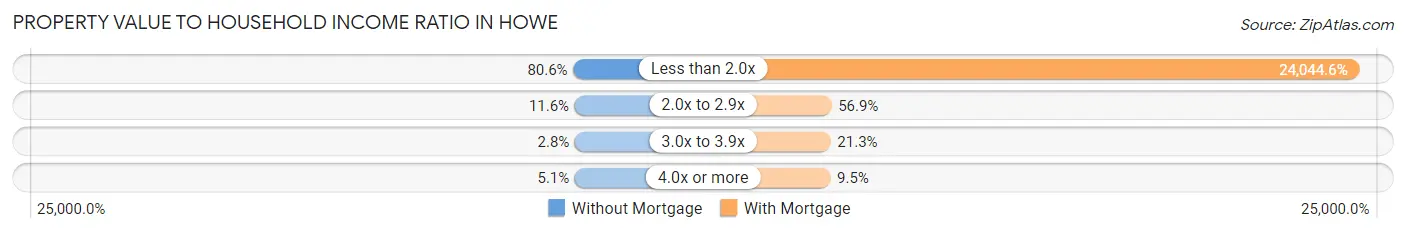
| Value-to-Income Ratio | Without Mortgage | With Mortgage |
| Less than 2.0x | 174 (80.6%) | 95,938 (24,044.6%) |
| 2.0x to 2.9x | 25 (11.6%) | 227 (56.9%) |
| 3.0x to 3.9x | 6 (2.8%) | 85 (21.3%) |
| 4.0x or more | 11 (5.1%) | 38 (9.5%) |
| Total | 216 (100.0%) | 399 (100.0%) |
Real Estate Taxes by Mortgage Status in Howe
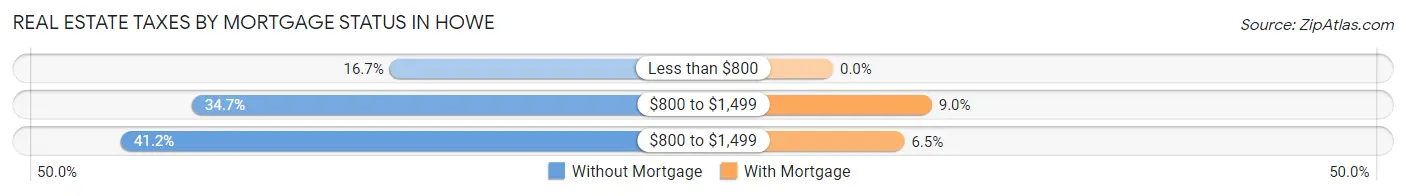
| Property Taxes | Without Mortgage | With Mortgage |
| Less than $800 | 36 (16.7%) | 0 (0.0%) |
| $800 to $1,499 | 75 (34.7%) | 36 (9.0%) |
| $800 to $1,499 | 89 (41.2%) | 26 (6.5%) |
| Total | 216 (100.0%) | 399 (100.0%) |
Health & Disability in Howe
Health Insurance Coverage by Age in Howe
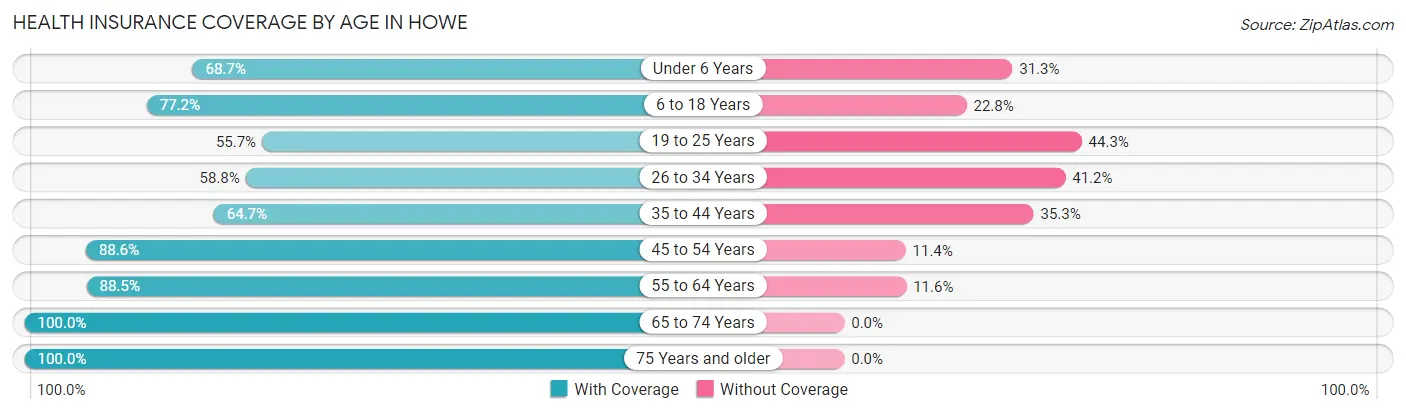
| Age Bracket | With Coverage | Without Coverage |
| Under 6 Years | 285 (68.7%) | 130 (31.3%) |
| 6 to 18 Years | 613 (77.2%) | 181 (22.8%) |
| 19 to 25 Years | 199 (55.7%) | 158 (44.3%) |
| 26 to 34 Years | 408 (58.8%) | 286 (41.2%) |
| 35 to 44 Years | 363 (64.7%) | 198 (35.3%) |
| 45 to 54 Years | 186 (88.6%) | 24 (11.4%) |
| 55 to 64 Years | 245 (88.4%) | 32 (11.6%) |
| 65 to 74 Years | 162 (100.0%) | 0 (0.0%) |
| 75 Years and older | 83 (100.0%) | 0 (0.0%) |
| Total | 2,544 (71.6%) | 1,009 (28.4%) |
Health Insurance Coverage by Citizenship Status in Howe
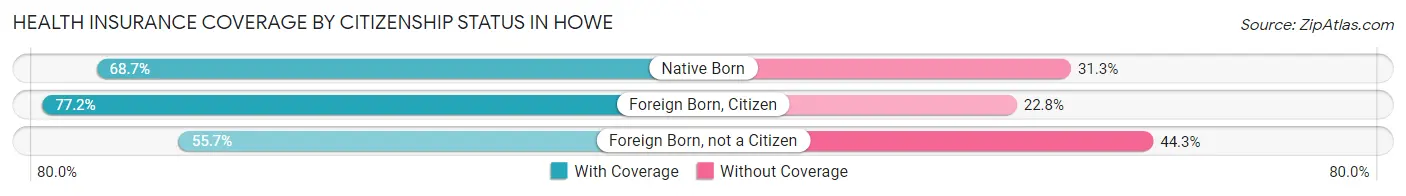
| Citizenship Status | With Coverage | Without Coverage |
| Native Born | 285 (68.7%) | 130 (31.3%) |
| Foreign Born, Citizen | 613 (77.2%) | 181 (22.8%) |
| Foreign Born, not a Citizen | 199 (55.7%) | 158 (44.3%) |
Health Insurance Coverage by Household Income in Howe
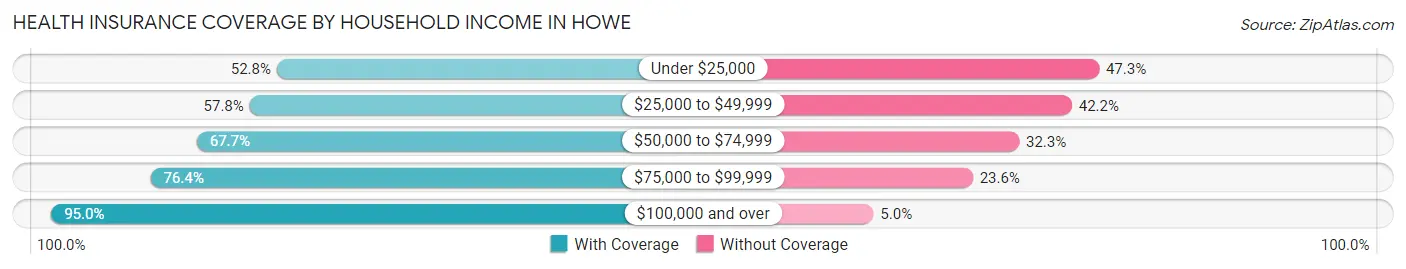
| Household Income | With Coverage | Without Coverage |
| Under $25,000 | 355 (52.7%) | 318 (47.2%) |
| $25,000 to $49,999 | 513 (57.8%) | 374 (42.2%) |
| $50,000 to $74,999 | 319 (67.7%) | 152 (32.3%) |
| $75,000 to $99,999 | 366 (76.4%) | 113 (23.6%) |
| $100,000 and over | 991 (95.0%) | 52 (5.0%) |
Public vs Private Health Insurance Coverage by Age in Howe
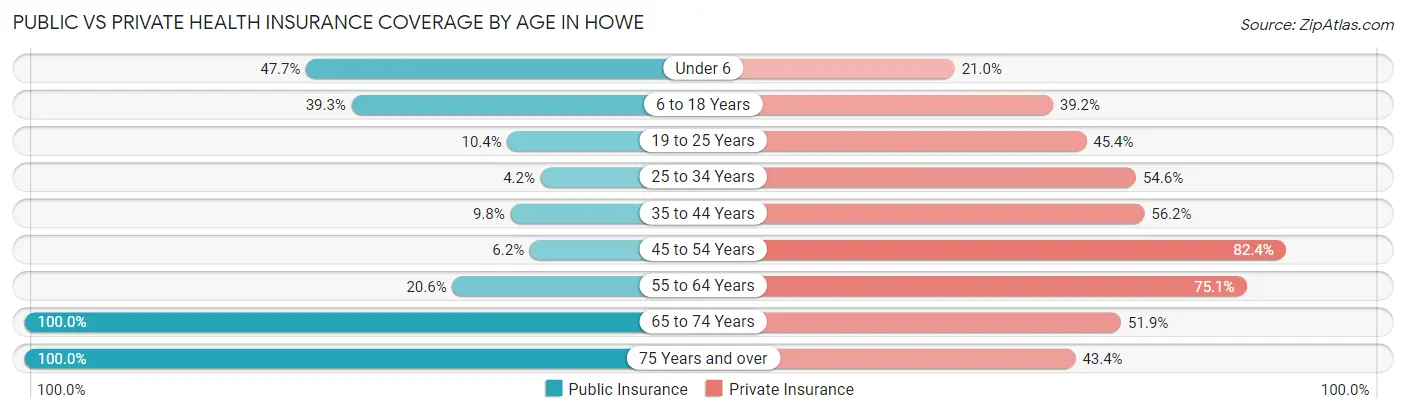
| Age Bracket | Public Insurance | Private Insurance |
| Under 6 | 198 (47.7%) | 87 (21.0%) |
| 6 to 18 Years | 312 (39.3%) | 311 (39.2%) |
| 19 to 25 Years | 37 (10.4%) | 162 (45.4%) |
| 25 to 34 Years | 29 (4.2%) | 379 (54.6%) |
| 35 to 44 Years | 55 (9.8%) | 315 (56.1%) |
| 45 to 54 Years | 13 (6.2%) | 173 (82.4%) |
| 55 to 64 Years | 57 (20.6%) | 208 (75.1%) |
| 65 to 74 Years | 162 (100.0%) | 84 (51.8%) |
| 75 Years and over | 83 (100.0%) | 36 (43.4%) |
| Total | 946 (26.6%) | 1,755 (49.4%) |
Disability Status by Sex by Age in Howe
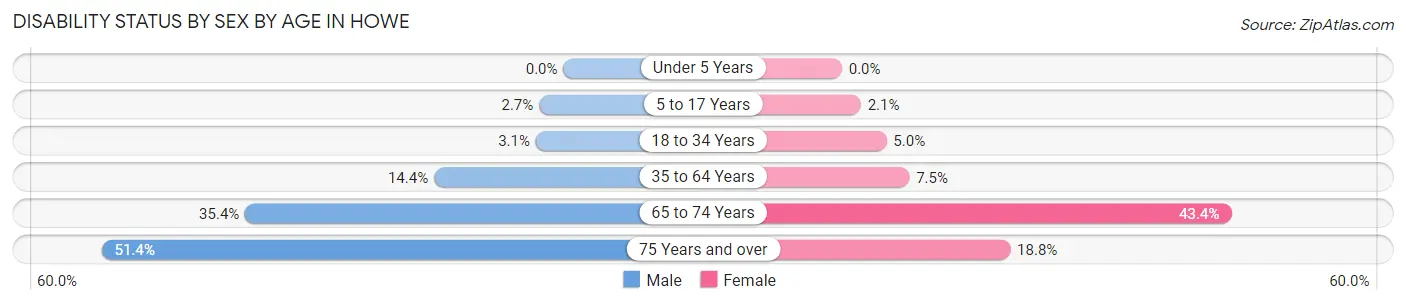
| Age Bracket | Male | Female |
| Under 5 Years | 0 (0.0%) | 0 (0.0%) |
| 5 to 17 Years | 11 (2.7%) | 10 (2.1%) |
| 18 to 34 Years | 15 (3.1%) | 28 (5.0%) |
| 35 to 64 Years | 80 (14.4%) | 37 (7.5%) |
| 65 to 74 Years | 28 (35.4%) | 36 (43.4%) |
| 75 Years and over | 18 (51.4%) | 9 (18.8%) |
Disability Class by Sex by Age in Howe
Disability Class: Hearing Difficulty
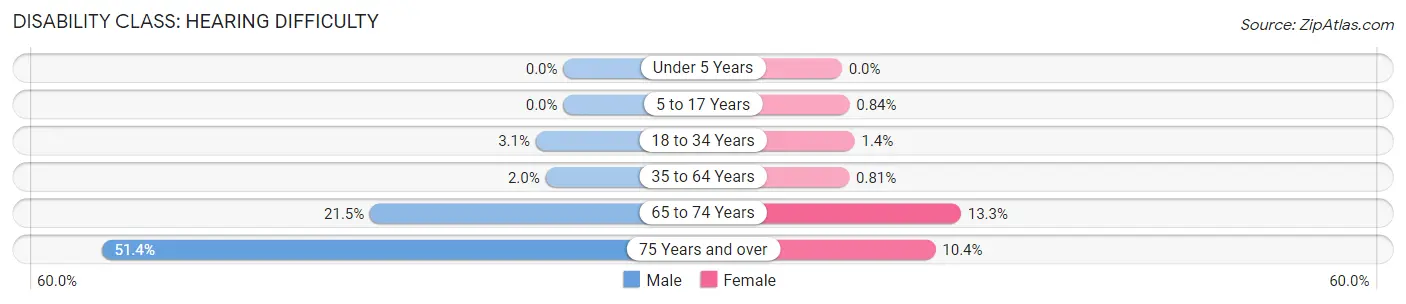
| Age Bracket | Male | Female |
| Under 5 Years | 0 (0.0%) | 0 (0.0%) |
| 5 to 17 Years | 0 (0.0%) | 4 (0.8%) |
| 18 to 34 Years | 15 (3.1%) | 8 (1.4%) |
| 35 to 64 Years | 11 (2.0%) | 4 (0.8%) |
| 65 to 74 Years | 17 (21.5%) | 11 (13.3%) |
| 75 Years and over | 18 (51.4%) | 5 (10.4%) |
Disability Class: Vision Difficulty
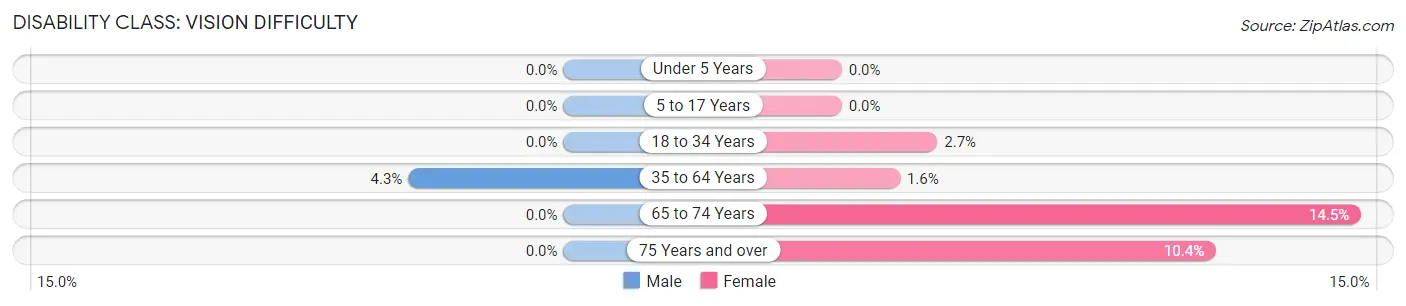
| Age Bracket | Male | Female |
| Under 5 Years | 0 (0.0%) | 0 (0.0%) |
| 5 to 17 Years | 0 (0.0%) | 0 (0.0%) |
| 18 to 34 Years | 0 (0.0%) | 15 (2.7%) |
| 35 to 64 Years | 24 (4.3%) | 8 (1.6%) |
| 65 to 74 Years | 0 (0.0%) | 12 (14.5%) |
| 75 Years and over | 0 (0.0%) | 5 (10.4%) |
Disability Class: Cognitive Difficulty
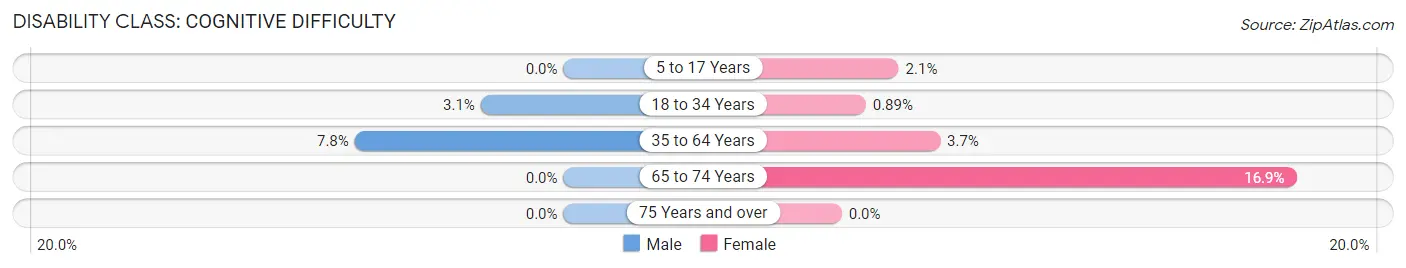
| Age Bracket | Male | Female |
| 5 to 17 Years | 0 (0.0%) | 10 (2.1%) |
| 18 to 34 Years | 15 (3.1%) | 5 (0.9%) |
| 35 to 64 Years | 43 (7.7%) | 18 (3.6%) |
| 65 to 74 Years | 0 (0.0%) | 14 (16.9%) |
| 75 Years and over | 0 (0.0%) | 0 (0.0%) |
Disability Class: Ambulatory Difficulty
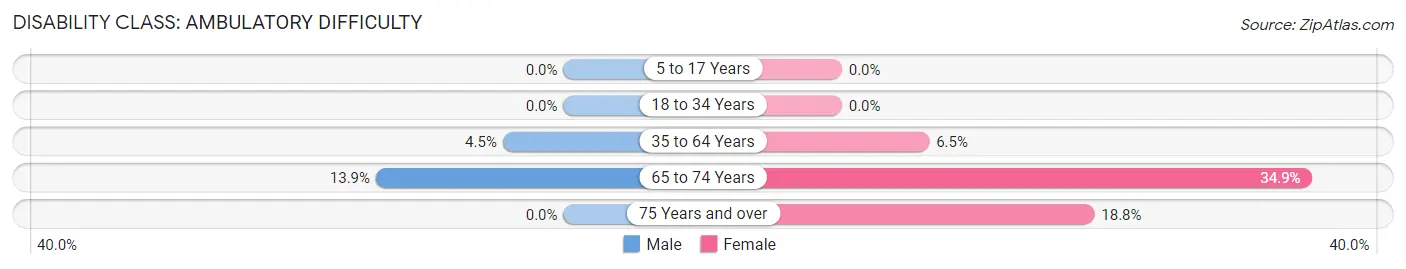
| Age Bracket | Male | Female |
| 5 to 17 Years | 0 (0.0%) | 0 (0.0%) |
| 18 to 34 Years | 0 (0.0%) | 0 (0.0%) |
| 35 to 64 Years | 25 (4.5%) | 32 (6.5%) |
| 65 to 74 Years | 11 (13.9%) | 29 (34.9%) |
| 75 Years and over | 0 (0.0%) | 9 (18.8%) |
Disability Class: Self-Care Difficulty
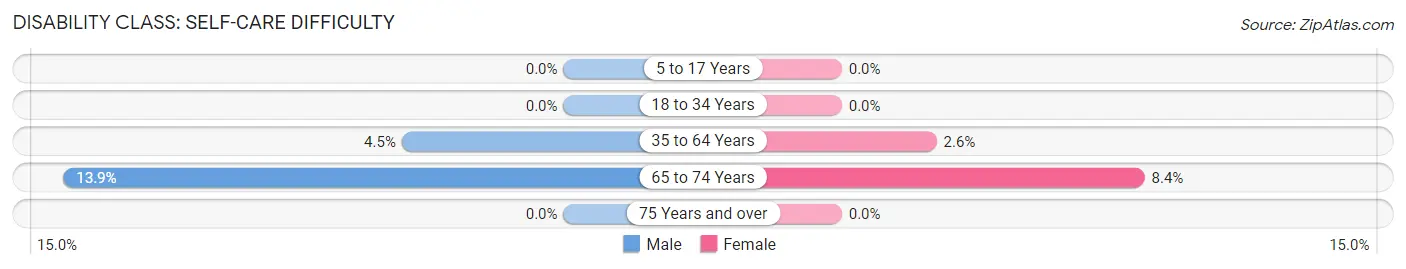
| Age Bracket | Male | Female |
| 5 to 17 Years | 0 (0.0%) | 0 (0.0%) |
| 18 to 34 Years | 0 (0.0%) | 0 (0.0%) |
| 35 to 64 Years | 25 (4.5%) | 13 (2.6%) |
| 65 to 74 Years | 11 (13.9%) | 7 (8.4%) |
| 75 Years and over | 0 (0.0%) | 0 (0.0%) |
Technology Access in Howe
Computing Device Access in Howe
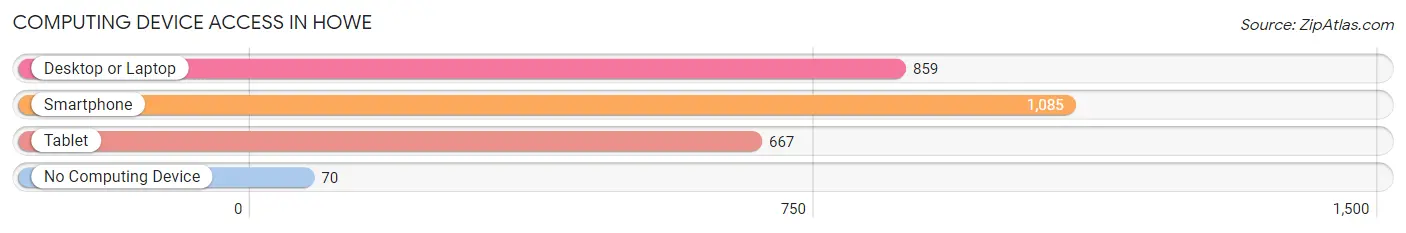
| Device Type | # Households | % Households |
| Desktop or Laptop | 859 | 74.0% |
| Smartphone | 1,085 | 93.4% |
| Tablet | 667 | 57.5% |
| No Computing Device | 70 | 6.0% |
| Total | 1,161 | 100.0% |
Internet Access in Howe
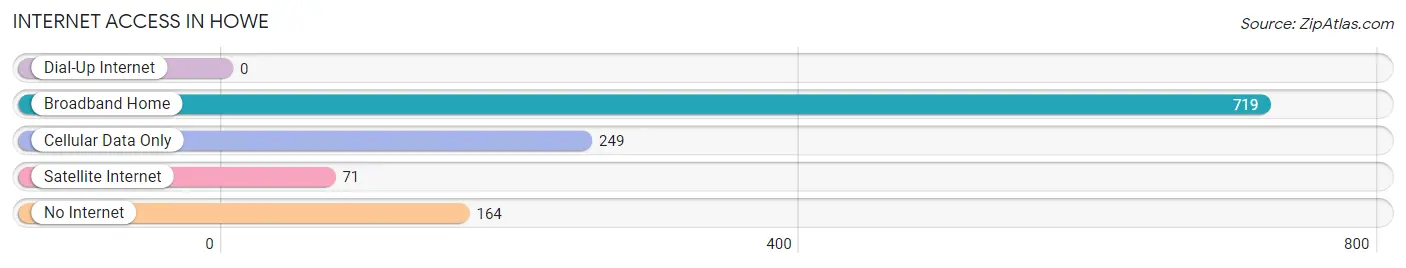
| Internet Type | # Households | % Households |
| Dial-Up Internet | 0 | 0.0% |
| Broadband Home | 719 | 61.9% |
| Cellular Data Only | 249 | 21.4% |
| Satellite Internet | 71 | 6.1% |
| No Internet | 164 | 14.1% |
| Total | 1,161 | 100.0% |
Howe Summary
Howe, Texas is a small city located in Grayson County, Texas. It is situated about 20 miles north of the Dallas-Fort Worth Metroplex and is part of the Sherman-Denison Metropolitan Statistical Area. The city has a population of approximately 3,000 people and is known for its rural charm and small-town atmosphere.
History
The area that is now Howe was first settled in the 1840s by a group of settlers from Tennessee. The town was originally called “Howe’s Station” after the first settler, William Howe. The town was officially incorporated in 1881 and was named after Howe.
In the late 19th century, Howe was a thriving agricultural community. The town was home to several cotton gins, a grist mill, and a sawmill. The town also had a hotel, a bank, and several stores.
In the early 20th century, Howe began to experience a decline in population as many of its residents moved to larger cities in search of better economic opportunities. The Great Depression further exacerbated the decline in population.
In the 1950s, Howe began to experience a resurgence in population as people moved back to the area in search of a more rural lifestyle. The town has since experienced steady growth and is now home to a variety of businesses and industries.
Geography
Howe is located in Grayson County, Texas. It is situated about 20 miles north of the Dallas-Fort Worth Metroplex and is part of the Sherman-Denison Metropolitan Statistical Area. The city has a total area of 2.3 square miles, all of which is land.
The city is located in the Blackland Prairie region of Texas and is characterized by rolling hills and flat plains. The climate is generally mild and humid, with hot summers and mild winters.
Economy
The economy of Howe is largely based on agriculture and manufacturing. The city is home to several large agricultural operations, including cotton farms, cattle ranches, and poultry farms.
The city is also home to several manufacturing companies, including a plastics manufacturer, a metal fabrication company, and a food processing plant.
Demographics
As of the 2010 census, Howe had a population of 3,039. The racial makeup of the city was 79.3% White, 15.2% Hispanic or Latino, 1.7% African American, 0.7% Native American, 0.3% Asian, and 2.9% from other races.
The median household income in Howe was $41,944, and the median family income was $50,917. The per capita income was $20,845. About 11.3% of families and 14.2% of the population were below the poverty line.
Howe is served by the Howe Independent School District. The district has one elementary school, one middle school, and one high school. The city is also home to several private schools, including Howe Christian Academy and Howe Montessori School.
Common Questions
What is Per Capita Income in Howe?
Per Capita income in Howe is $25,530.
What is the Median Family Income in Howe?
Median Family Income in Howe is $62,772.
What is the Median Household income in Howe?
Median Household Income in Howe is $59,375.
What is Income or Wage Gap in Howe?
Income or Wage Gap in Howe is 17.8%.
Women in Howe earn 82.2 cents for every dollar earned by a man.
What is Inequality or Gini Index in Howe?
Inequality or Gini Index in Howe is 0.44.
What is the Total Population of Howe?
Total Population of Howe is 3,553.
What is the Total Male Population of Howe?
Total Male Population of Howe is 1,664.
What is the Total Female Population of Howe?
Total Female Population of Howe is 1,889.
What is the Ratio of Males per 100 Females in Howe?
There are 88.09 Males per 100 Females in Howe.
What is the Ratio of Females per 100 Males in Howe?
There are 113.52 Females per 100 Males in Howe.
What is the Median Population Age in Howe?
Median Population Age in Howe is 28.2 Years.
What is the Average Family Size in Howe
Average Family Size in Howe is 3.7 People.
What is the Average Household Size in Howe
Average Household Size in Howe is 3.1 People.
How Large is the Labor Force in Howe?
There are 1,849 People in the Labor Forcein in Howe.
What is the Percentage of People in the Labor Force in Howe?
75.4% of People are in the Labor Force in Howe.
What is the Unemployment Rate in Howe?
Unemployment Rate in Howe is 5.3%.