Holiday Lakes, TX Map & Demographics
Holiday Lakes Map
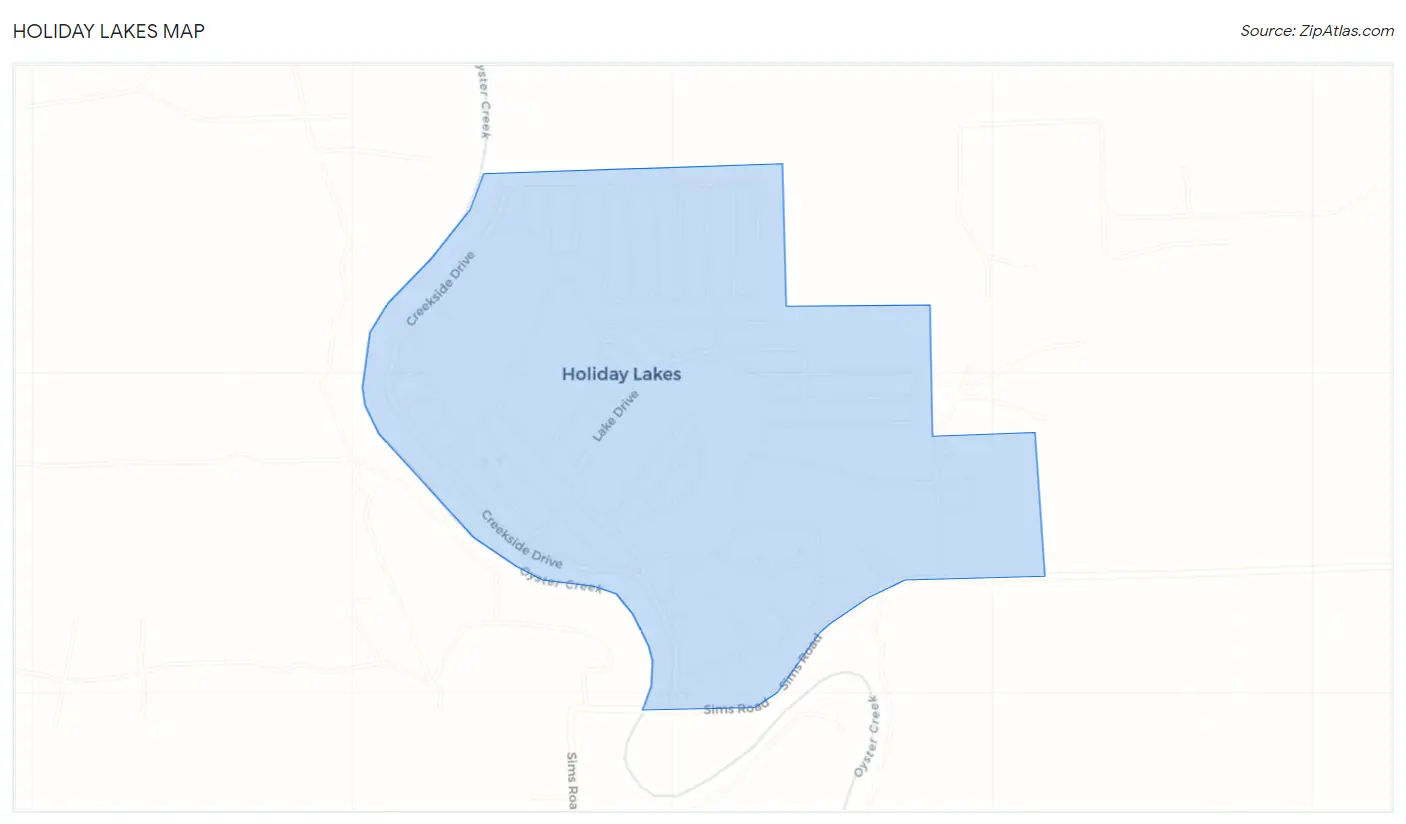
Holiday Lakes Overview
$18,547
PER CAPITA INCOME
$36,350
AVG FAMILY INCOME
$41,500
AVG HOUSEHOLD INCOME
41.0%
WAGE / INCOME GAP [ % ]
59.0¢/ $1
WAGE / INCOME GAP [ $ ]
0.42
INEQUALITY / GINI INDEX
834
TOTAL POPULATION
407
MALE POPULATION
427
FEMALE POPULATION
95.32
MALES / 100 FEMALES
104.91
FEMALES / 100 MALES
32.2
MEDIAN AGE
3.5
AVG FAMILY SIZE
3.2
AVG HOUSEHOLD SIZE
331
LABOR FORCE [ PEOPLE ]
52.7%
PERCENT IN LABOR FORCE
6.6%
UNEMPLOYMENT RATE
Holiday Lakes Area Codes
Income in Holiday Lakes
Income Overview in Holiday Lakes
Per Capita Income in Holiday Lakes is $18,547, while median incomes of families and households are $36,350 and $41,500 respectively.
| Characteristic | Number | Measure |
| Per Capita Income | 834 | $18,547 |
| Median Family Income | 221 | $36,350 |
| Mean Family Income | 221 | $54,904 |
| Median Household Income | 264 | $41,500 |
| Mean Household Income | 264 | $54,320 |
| Income Deficit | 221 | $0 |
| Wage / Income Gap (%) | 834 | 41.03% |
| Wage / Income Gap ($) | 834 | 58.97¢ per $1 |
| Gini / Inequality Index | 834 | 0.42 |
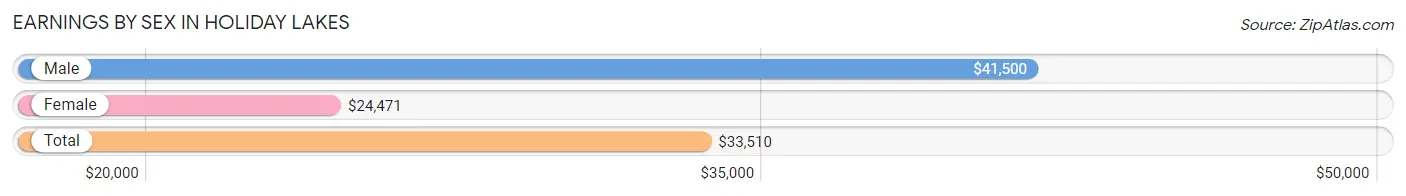
Earnings by Sex in Holiday Lakes
Average Earnings in Holiday Lakes are $33,510, $41,500 for men and $24,471 for women, a difference of 41.0%.
| Sex | Number | Average Earnings |
| Male | 194 (59.7%) | $41,500 |
| Female | 131 (40.3%) | $24,471 |
| Total | 325 (100.0%) | $33,510 |
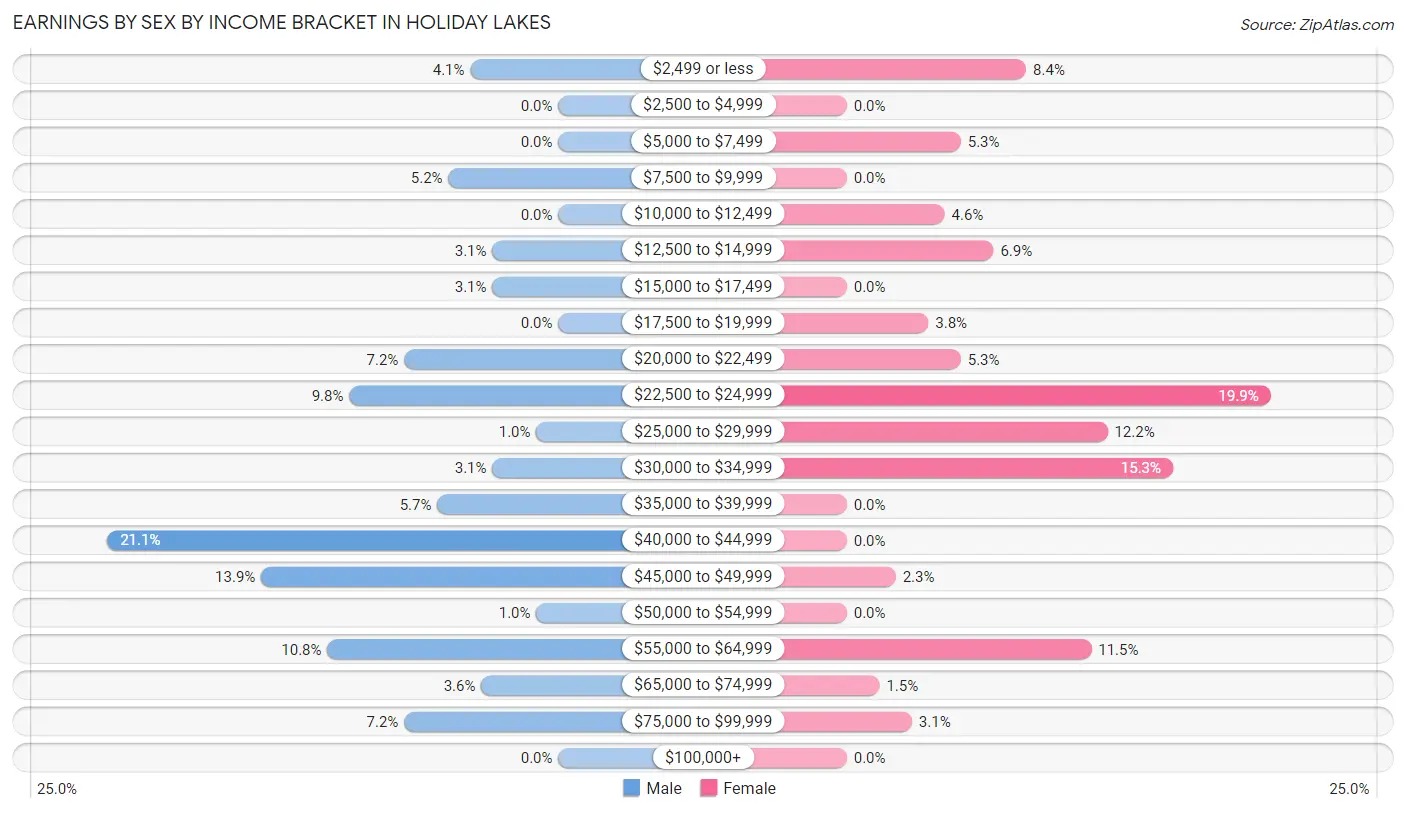
Earnings by Sex by Income Bracket in Holiday Lakes
The most common earnings brackets in Holiday Lakes are $40,000 to $44,999 for men (41 | 21.1%) and $22,500 to $24,999 for women (26 | 19.9%).
| Income | Male | Female |
| $2,499 or less | 8 (4.1%) | 11 (8.4%) |
| $2,500 to $4,999 | 0 (0.0%) | 0 (0.0%) |
| $5,000 to $7,499 | 0 (0.0%) | 7 (5.3%) |
| $7,500 to $9,999 | 10 (5.1%) | 0 (0.0%) |
| $10,000 to $12,499 | 0 (0.0%) | 6 (4.6%) |
| $12,500 to $14,999 | 6 (3.1%) | 9 (6.9%) |
| $15,000 to $17,499 | 6 (3.1%) | 0 (0.0%) |
| $17,500 to $19,999 | 0 (0.0%) | 5 (3.8%) |
| $20,000 to $22,499 | 14 (7.2%) | 7 (5.3%) |
| $22,500 to $24,999 | 19 (9.8%) | 26 (19.9%) |
| $25,000 to $29,999 | 2 (1.0%) | 16 (12.2%) |
| $30,000 to $34,999 | 6 (3.1%) | 20 (15.3%) |
| $35,000 to $39,999 | 11 (5.7%) | 0 (0.0%) |
| $40,000 to $44,999 | 41 (21.1%) | 0 (0.0%) |
| $45,000 to $49,999 | 27 (13.9%) | 3 (2.3%) |
| $50,000 to $54,999 | 2 (1.0%) | 0 (0.0%) |
| $55,000 to $64,999 | 21 (10.8%) | 15 (11.5%) |
| $65,000 to $74,999 | 7 (3.6%) | 2 (1.5%) |
| $75,000 to $99,999 | 14 (7.2%) | 4 (3.0%) |
| $100,000+ | 0 (0.0%) | 0 (0.0%) |
| Total | 194 (100.0%) | 131 (100.0%) |
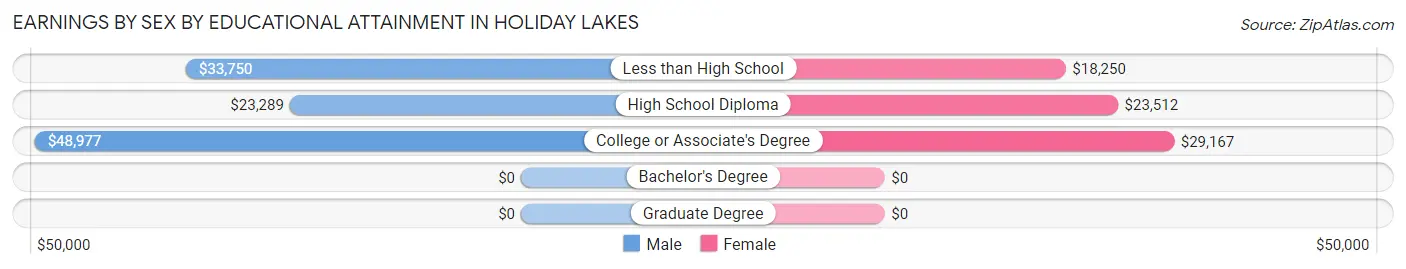
Earnings by Sex by Educational Attainment in Holiday Lakes
Average earnings in Holiday Lakes are $35,114 for men and $23,942 for women, a difference of 31.8%. Men with an educational attainment of college or associate's degree enjoy the highest average annual earnings of $48,977, while those with high school diploma education earn the least with $23,289. Women with an educational attainment of college or associate's degree earn the most with the average annual earnings of $29,167, while those with less than high school education have the smallest earnings of $18,250.
| Educational Attainment | Male Income | Female Income |
| Less than High School | $33,750 | $18,250 |
| High School Diploma | $23,289 | $23,512 |
| College or Associate's Degree | $48,977 | $29,167 |
| Bachelor's Degree | - | - |
| Graduate Degree | - | - |
| Total | $35,114 | $23,942 |
Family Income in Holiday Lakes
Family Income Brackets in Holiday Lakes
According to the Holiday Lakes family income data, there are 56 families falling into the $15,000 to $24,999 income range, which is the most common income bracket and makes up 25.3% of all families. Conversely, the $200,000+ income bracket is the least frequent group with only 4 families (1.8%) belonging to this category.
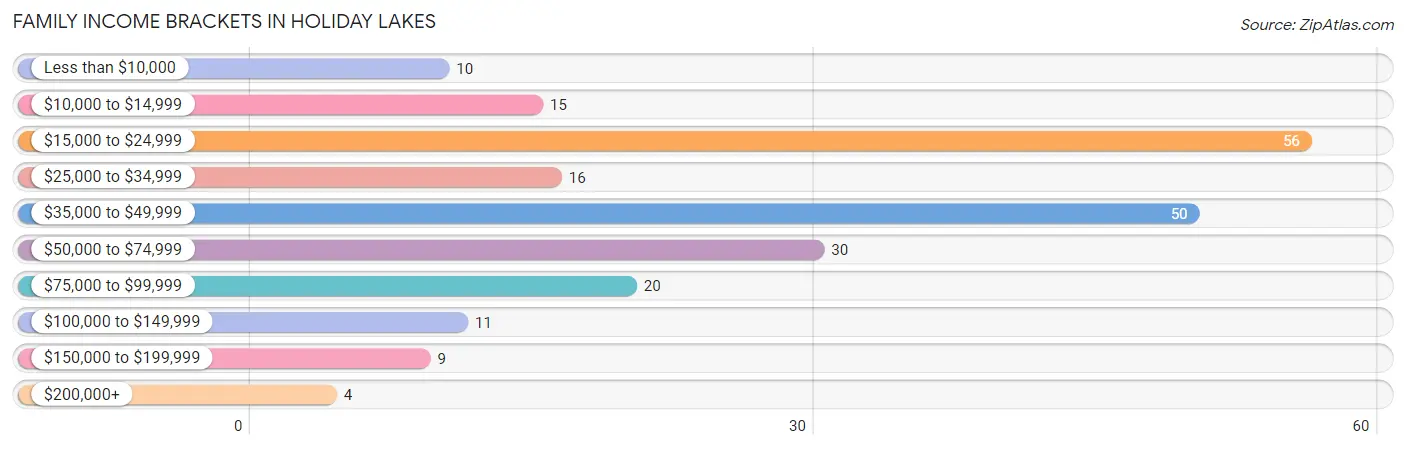
| Income Bracket | # Families | % Families |
| Less than $10,000 | 10 | 4.5% |
| $10,000 to $14,999 | 15 | 6.8% |
| $15,000 to $24,999 | 56 | 25.3% |
| $25,000 to $34,999 | 16 | 7.2% |
| $35,000 to $49,999 | 50 | 22.6% |
| $50,000 to $74,999 | 30 | 13.6% |
| $75,000 to $99,999 | 20 | 9.0% |
| $100,000 to $149,999 | 11 | 5.0% |
| $150,000 to $199,999 | 9 | 4.1% |
| $200,000+ | 4 | 1.8% |
Family Income by Famaliy Size in Holiday Lakes
4-person families (59 | 26.7%) account for the highest median family income in Holiday Lakes with $55,250 per family, while 4-person families (59 | 26.7%) have the highest median income of $13,812 per family member.
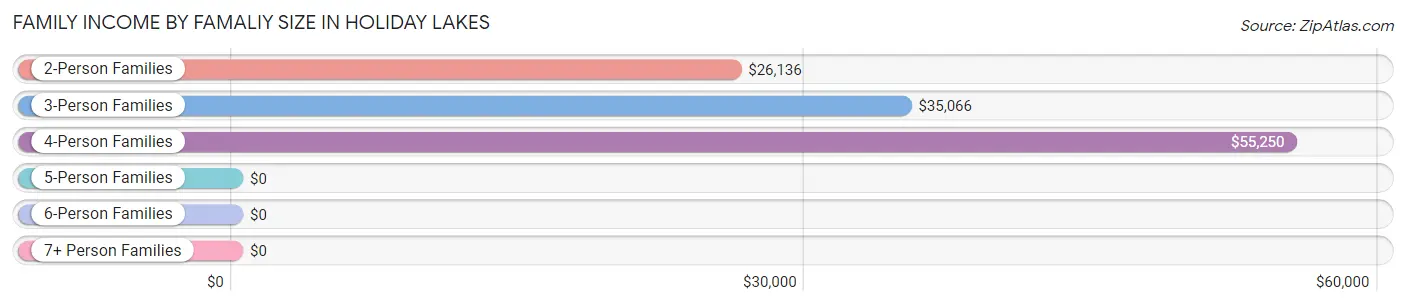
| Income Bracket | # Families | Median Income |
| 2-Person Families | 84 (38.0%) | $26,136 |
| 3-Person Families | 55 (24.9%) | $35,066 |
| 4-Person Families | 59 (26.7%) | $55,250 |
| 5-Person Families | 16 (7.2%) | $0 |
| 6-Person Families | 0 (0.0%) | $0 |
| 7+ Person Families | 7 (3.2%) | $0 |
| Total | 221 (100.0%) | $36,350 |
Family Income by Number of Earners in Holiday Lakes
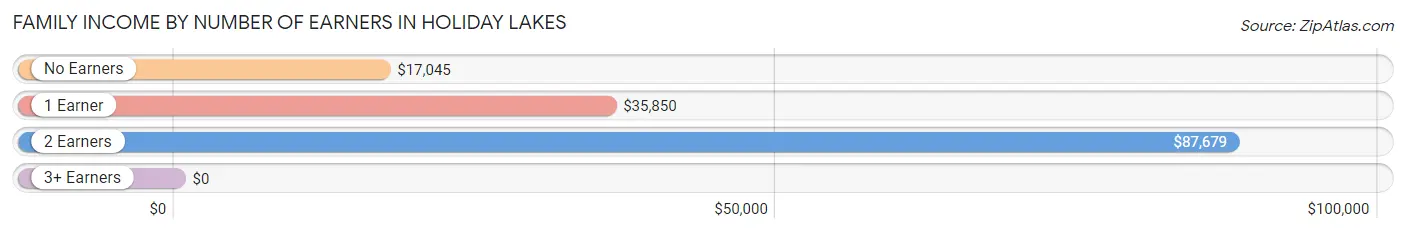
| Number of Earners | # Families | Median Income |
| No Earners | 38 (17.2%) | $17,045 |
| 1 Earner | 125 (56.6%) | $35,850 |
| 2 Earners | 49 (22.2%) | $87,679 |
| 3+ Earners | 9 (4.1%) | $0 |
| Total | 221 (100.0%) | $36,350 |
Household Income in Holiday Lakes
Household Income Brackets in Holiday Lakes
With 70 households falling in the category, the $35,000 to $49,999 income range is the most frequent in Holiday Lakes, accounting for 26.5% of all households. In contrast, only 4 households (1.5%) fall into the $200,000+ income bracket, making it the least populous group.
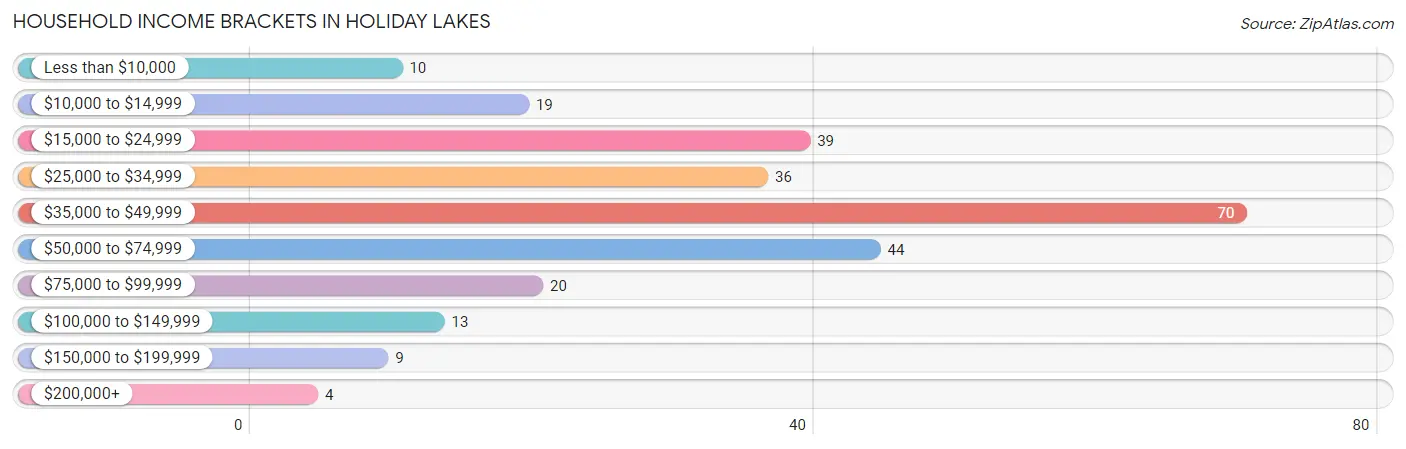
| Income Bracket | # Households | % Households |
| Less than $10,000 | 10 | 3.8% |
| $10,000 to $14,999 | 19 | 7.2% |
| $15,000 to $24,999 | 39 | 14.8% |
| $25,000 to $34,999 | 36 | 13.6% |
| $35,000 to $49,999 | 70 | 26.5% |
| $50,000 to $74,999 | 44 | 16.7% |
| $75,000 to $99,999 | 20 | 7.6% |
| $100,000 to $149,999 | 13 | 4.9% |
| $150,000 to $199,999 | 9 | 3.4% |
| $200,000+ | 4 | 1.5% |
Household Income by Householder Age in Holiday Lakes
The median household income in Holiday Lakes is $41,500, with the highest median household income of $49,091 found in the 45 to 64 years age bracket for the primary householder. A total of 80 households (30.3%) fall into this category. Meanwhile, the 15 to 24 years age bracket for the primary householder has the lowest median household income of $0, with 10 households (3.8%) in this group.
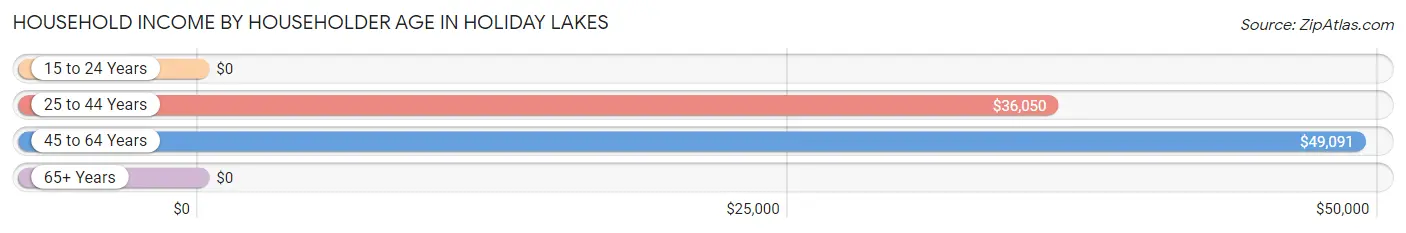
| Income Bracket | # Households | Median Income |
| 15 to 24 Years | 10 (3.8%) | $0 |
| 25 to 44 Years | 119 (45.1%) | $36,050 |
| 45 to 64 Years | 80 (30.3%) | $49,091 |
| 65+ Years | 55 (20.8%) | $0 |
| Total | 264 (100.0%) | $41,500 |
Poverty in Holiday Lakes
Income Below Poverty by Sex and Age in Holiday Lakes
With 29.5% poverty level for males and 27.4% for females among the residents of Holiday Lakes, 12 to 14 year old males and 6 to 11 year old females are the most vulnerable to poverty, with 6 males (100.0%) and 12 females (80.0%) in their respective age groups living below the poverty level.
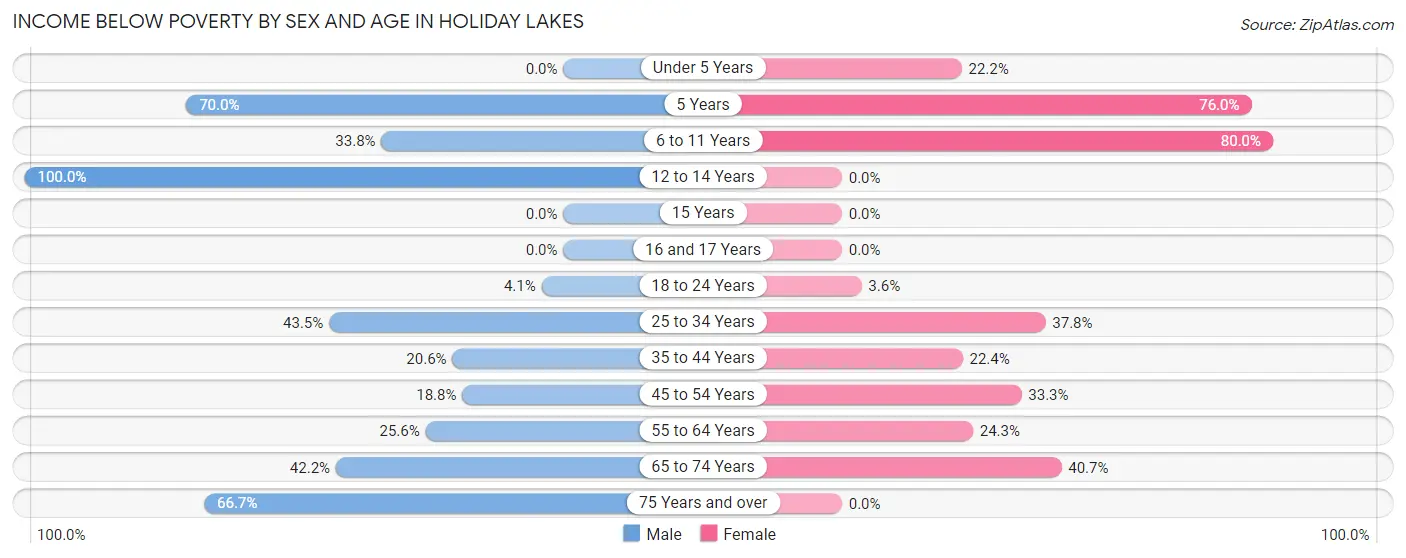
| Age Bracket | Male | Female |
| Under 5 Years | 0 (0.0%) | 6 (22.2%) |
| 5 Years | 14 (70.0%) | 19 (76.0%) |
| 6 to 11 Years | 26 (33.8%) | 12 (80.0%) |
| 12 to 14 Years | 6 (100.0%) | 0 (0.0%) |
| 15 Years | 0 (0.0%) | 0 (0.0%) |
| 16 and 17 Years | 0 (0.0%) | 0 (0.0%) |
| 18 to 24 Years | 3 (4.1%) | 2 (3.6%) |
| 25 to 34 Years | 20 (43.5%) | 17 (37.8%) |
| 35 to 44 Years | 14 (20.6%) | 13 (22.4%) |
| 45 to 54 Years | 3 (18.8%) | 17 (33.3%) |
| 55 to 64 Years | 11 (25.6%) | 9 (24.3%) |
| 65 to 74 Years | 19 (42.2%) | 22 (40.7%) |
| 75 Years and over | 4 (66.7%) | 0 (0.0%) |
| Total | 120 (29.5%) | 117 (27.4%) |
Income Above Poverty by Sex and Age in Holiday Lakes
According to the poverty statistics in Holiday Lakes, males aged under 5 years and females aged 12 to 14 years are the age groups that are most secure financially, with 100.0% of males and 100.0% of females in these age groups living above the poverty line.
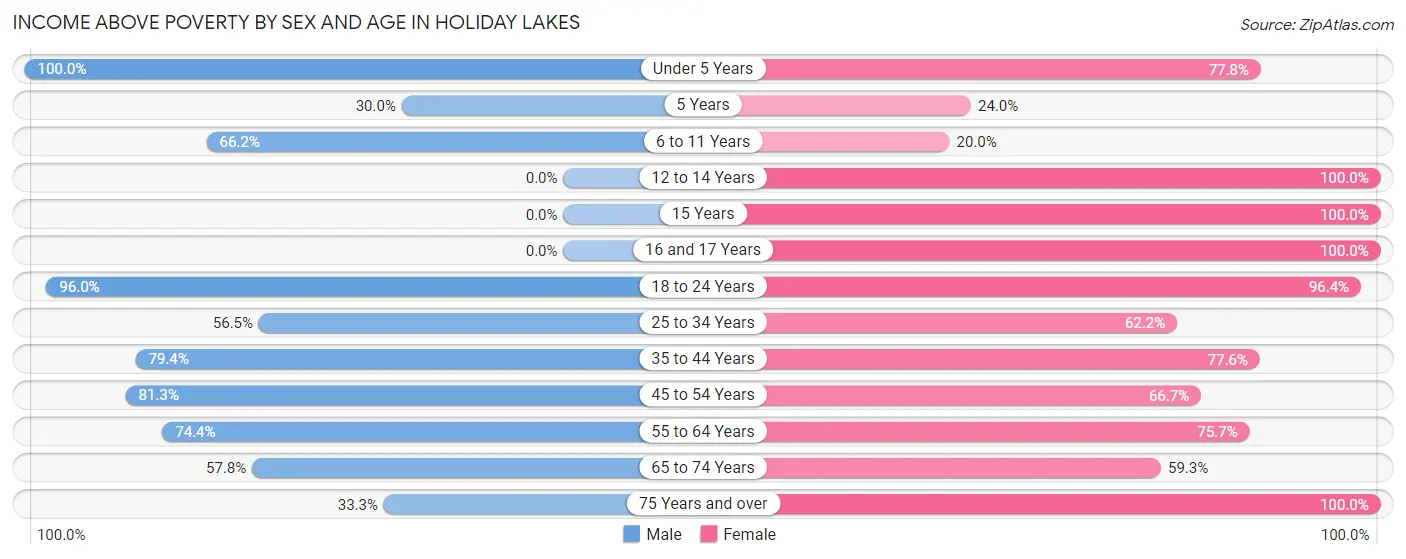
| Age Bracket | Male | Female |
| Under 5 Years | 6 (100.0%) | 21 (77.8%) |
| 5 Years | 6 (30.0%) | 6 (24.0%) |
| 6 to 11 Years | 51 (66.2%) | 3 (20.0%) |
| 12 to 14 Years | 0 (0.0%) | 23 (100.0%) |
| 15 Years | 0 (0.0%) | 7 (100.0%) |
| 16 and 17 Years | 0 (0.0%) | 13 (100.0%) |
| 18 to 24 Years | 71 (96.0%) | 53 (96.4%) |
| 25 to 34 Years | 26 (56.5%) | 28 (62.2%) |
| 35 to 44 Years | 54 (79.4%) | 45 (77.6%) |
| 45 to 54 Years | 13 (81.2%) | 34 (66.7%) |
| 55 to 64 Years | 32 (74.4%) | 28 (75.7%) |
| 65 to 74 Years | 26 (57.8%) | 32 (59.3%) |
| 75 Years and over | 2 (33.3%) | 17 (100.0%) |
| Total | 287 (70.5%) | 310 (72.6%) |
Income Below Poverty Among Married-Couple Families in Holiday Lakes
The poverty statistics for married-couple families in Holiday Lakes show that 20.3% or 27 of the total 133 families live below the poverty line. Families with 1 or 2 children have the highest poverty rate of 33.3%, comprising of 14 families. On the other hand, families with 3 or 4 children have the lowest poverty rate of 0.0%, which includes 0 families.
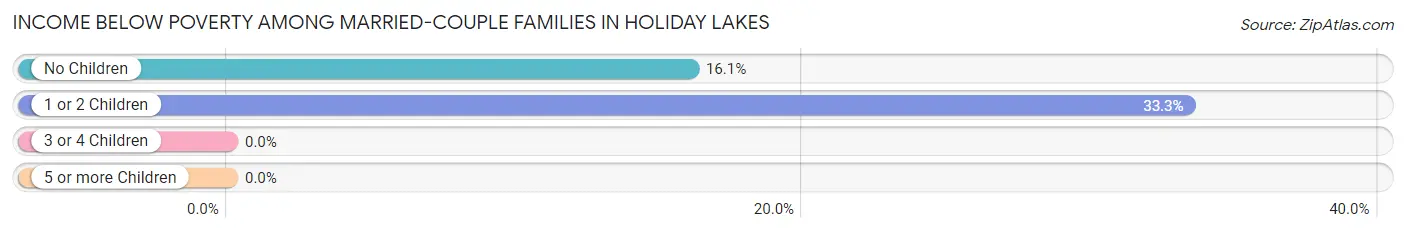
| Children | Above Poverty | Below Poverty |
| No Children | 68 (84.0%) | 13 (16.1%) |
| 1 or 2 Children | 28 (66.7%) | 14 (33.3%) |
| 3 or 4 Children | 7 (100.0%) | 0 (0.0%) |
| 5 or more Children | 3 (100.0%) | 0 (0.0%) |
| Total | 106 (79.7%) | 27 (20.3%) |
Income Below Poverty Among Single-Parent Households in Holiday Lakes
According to the poverty data in Holiday Lakes, 34.7% or 17 single-father households and 66.7% or 26 single-mother households are living below the poverty line. Among single-father households, those with 1 or 2 children have the highest poverty rate, with 6 households (46.2%) experiencing poverty. Likewise, among single-mother households, those with 3 or 4 children have the highest poverty rate, with 5 households (100.0%) falling below the poverty line.
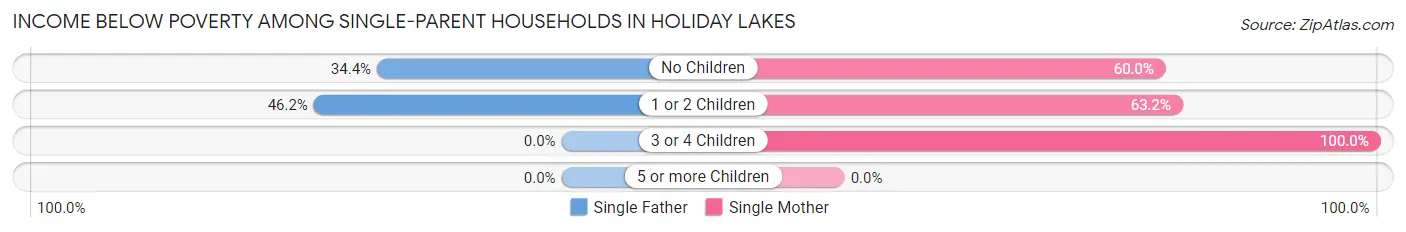
| Children | Single Father | Single Mother |
| No Children | 11 (34.4%) | 9 (60.0%) |
| 1 or 2 Children | 6 (46.2%) | 12 (63.2%) |
| 3 or 4 Children | 0 (0.0%) | 5 (100.0%) |
| 5 or more Children | 0 (0.0%) | 0 (0.0%) |
| Total | 17 (34.7%) | 26 (66.7%) |
Income Below Poverty Among Married-Couple vs Single-Parent Households in Holiday Lakes
The poverty data for Holiday Lakes shows that 27 of the married-couple family households (20.3%) and 43 of the single-parent households (48.9%) are living below the poverty level. Within the married-couple family households, those with 1 or 2 children have the highest poverty rate, with 14 households (33.3%) falling below the poverty line. Among the single-parent households, those with 1 or 2 children have the highest poverty rate, with 18 household (56.2%) living below poverty.
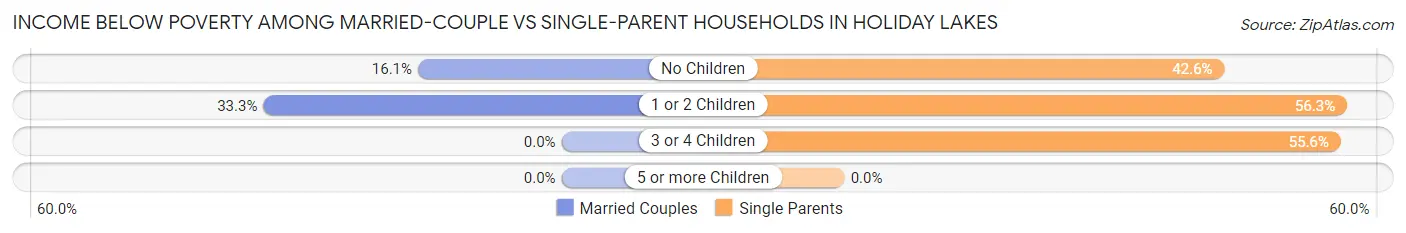
| Children | Married-Couple Families | Single-Parent Households |
| No Children | 13 (16.1%) | 20 (42.5%) |
| 1 or 2 Children | 14 (33.3%) | 18 (56.2%) |
| 3 or 4 Children | 0 (0.0%) | 5 (55.6%) |
| 5 or more Children | 0 (0.0%) | 0 (0.0%) |
| Total | 27 (20.3%) | 43 (48.9%) |
Race in Holiday Lakes
The most populous races in Holiday Lakes are White / Caucasian (555 | 66.5%), Hispanic or Latino (511 | 61.3%), and Two or more Races (156 | 18.7%).
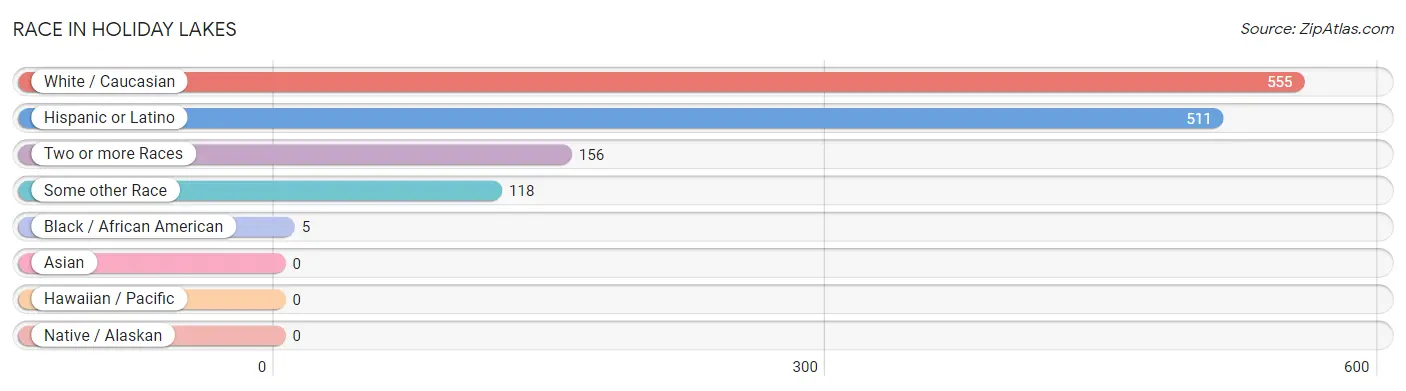
| Race | # Population | % Population |
| Asian | 0 | 0.0% |
| Black / African American | 5 | 0.6% |
| Hawaiian / Pacific | 0 | 0.0% |
| Hispanic or Latino | 511 | 61.3% |
| Native / Alaskan | 0 | 0.0% |
| White / Caucasian | 555 | 66.5% |
| Two or more Races | 156 | 18.7% |
| Some other Race | 118 | 14.1% |
| Total | 834 | 100.0% |
Ancestry in Holiday Lakes
The most populous ancestries reported in Holiday Lakes are Mexican (374 | 44.8%), Central American (92 | 11.0%), Irish (75 | 9.0%), American (55 | 6.6%), and Guatemalan (54 | 6.5%), together accounting for 77.9% of all Holiday Lakes residents.
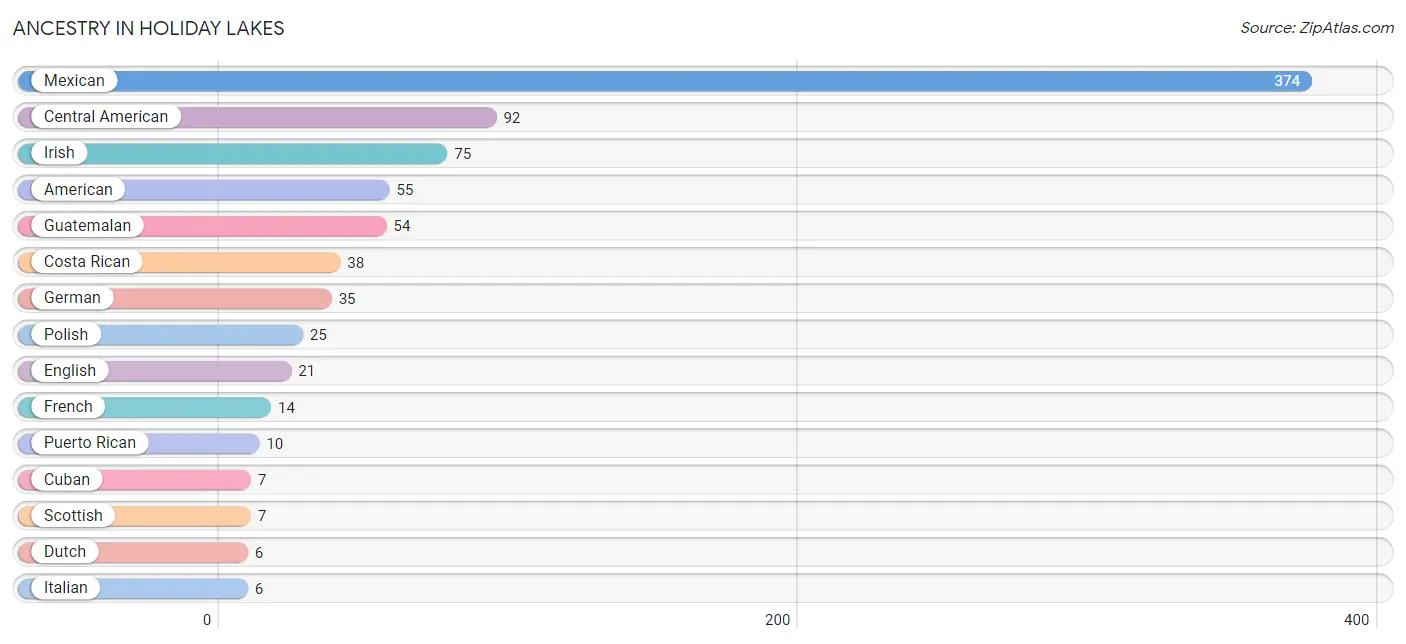
| Ancestry | # Population | % Population |
| American | 55 | 6.6% |
| Central American | 92 | 11.0% |
| Costa Rican | 38 | 4.6% |
| Cuban | 7 | 0.8% |
| Czech | 4 | 0.5% |
| Dutch | 6 | 0.7% |
| English | 21 | 2.5% |
| French | 14 | 1.7% |
| German | 35 | 4.2% |
| Guatemalan | 54 | 6.5% |
| Irish | 75 | 9.0% |
| Italian | 6 | 0.7% |
| Mexican | 374 | 44.8% |
| Polish | 25 | 3.0% |
| Puerto Rican | 10 | 1.2% |
| Scandinavian | 4 | 0.5% |
| Scotch-Irish | 6 | 0.7% |
| Scottish | 7 | 0.8% |
| Welsh | 2 | 0.2% | View All 19 Rows |
Immigrants in Holiday Lakes
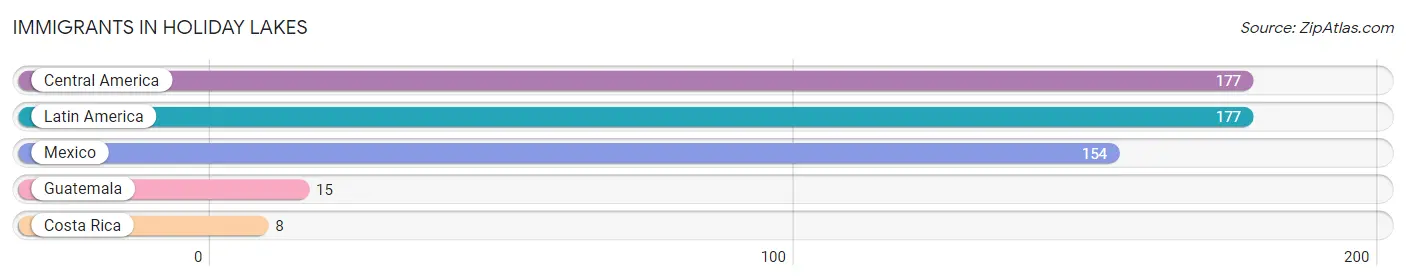
The most numerous immigrant groups reported in Holiday Lakes came from Central America (177 | 21.2%), Latin America (177 | 21.2%), Mexico (154 | 18.5%), Guatemala (15 | 1.8%), and Costa Rica (8 | 1.0%), together accounting for 63.7% of all Holiday Lakes residents.
| Immigration Origin | # Population | % Population |
| Central America | 177 | 21.2% |
| Costa Rica | 8 | 1.0% |
| Guatemala | 15 | 1.8% |
| Latin America | 177 | 21.2% |
| Mexico | 154 | 18.5% | View All 5 Rows |
Sex and Age in Holiday Lakes
Sex and Age in Holiday Lakes
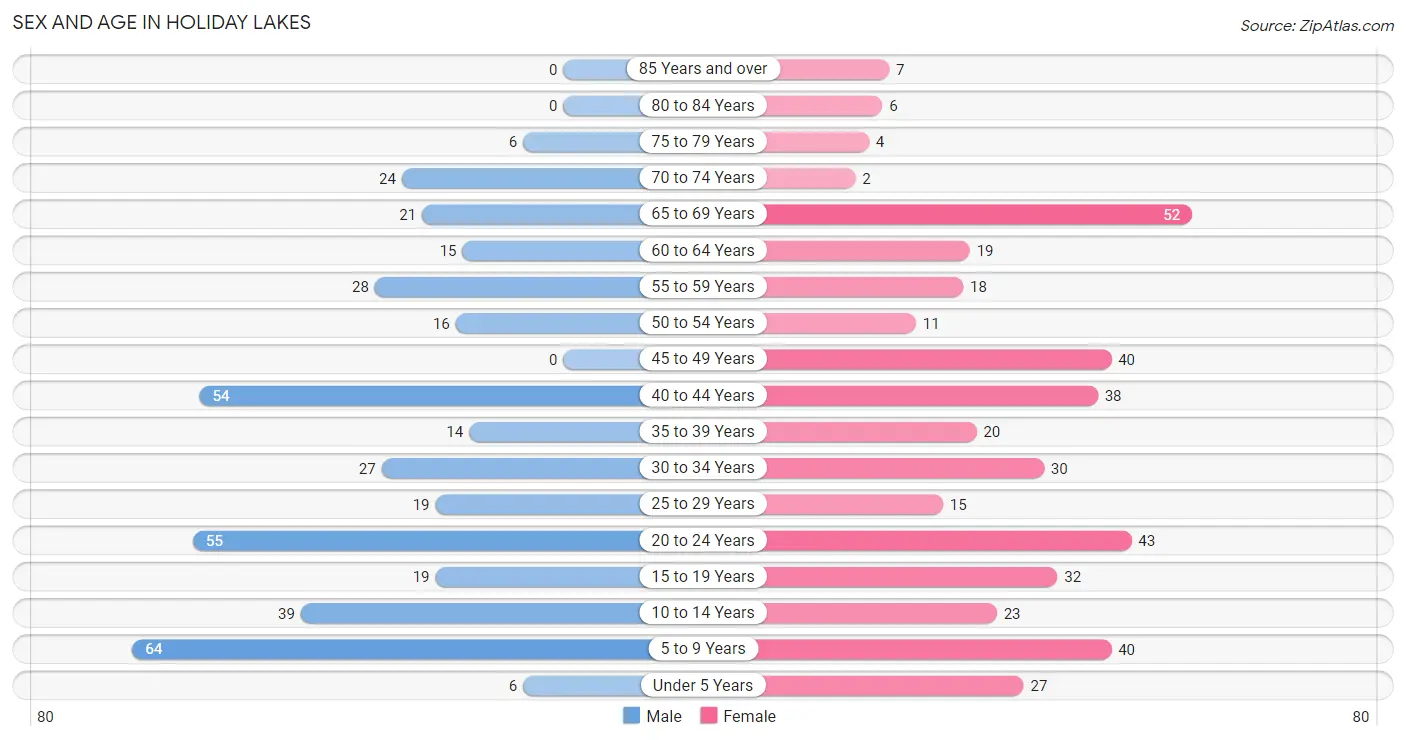
The most populous age groups in Holiday Lakes are 5 to 9 Years (64 | 15.7%) for men and 65 to 69 Years (52 | 12.2%) for women.
| Age Bracket | Male | Female |
| Under 5 Years | 6 (1.5%) | 27 (6.3%) |
| 5 to 9 Years | 64 (15.7%) | 40 (9.4%) |
| 10 to 14 Years | 39 (9.6%) | 23 (5.4%) |
| 15 to 19 Years | 19 (4.7%) | 32 (7.5%) |
| 20 to 24 Years | 55 (13.5%) | 43 (10.1%) |
| 25 to 29 Years | 19 (4.7%) | 15 (3.5%) |
| 30 to 34 Years | 27 (6.6%) | 30 (7.0%) |
| 35 to 39 Years | 14 (3.4%) | 20 (4.7%) |
| 40 to 44 Years | 54 (13.3%) | 38 (8.9%) |
| 45 to 49 Years | 0 (0.0%) | 40 (9.4%) |
| 50 to 54 Years | 16 (3.9%) | 11 (2.6%) |
| 55 to 59 Years | 28 (6.9%) | 18 (4.2%) |
| 60 to 64 Years | 15 (3.7%) | 19 (4.4%) |
| 65 to 69 Years | 21 (5.2%) | 52 (12.2%) |
| 70 to 74 Years | 24 (5.9%) | 2 (0.5%) |
| 75 to 79 Years | 6 (1.5%) | 4 (0.9%) |
| 80 to 84 Years | 0 (0.0%) | 6 (1.4%) |
| 85 Years and over | 0 (0.0%) | 7 (1.6%) |
| Total | 407 (100.0%) | 427 (100.0%) |
Families and Households in Holiday Lakes
Median Family Size in Holiday Lakes
The median family size in Holiday Lakes is 3.48 persons per family, with single male/father families (49 | 22.2%) accounting for the largest median family size of 3.71 persons per family. On the other hand, single female/mother families (39 | 17.6%) represent the smallest median family size with 3.18 persons per family.
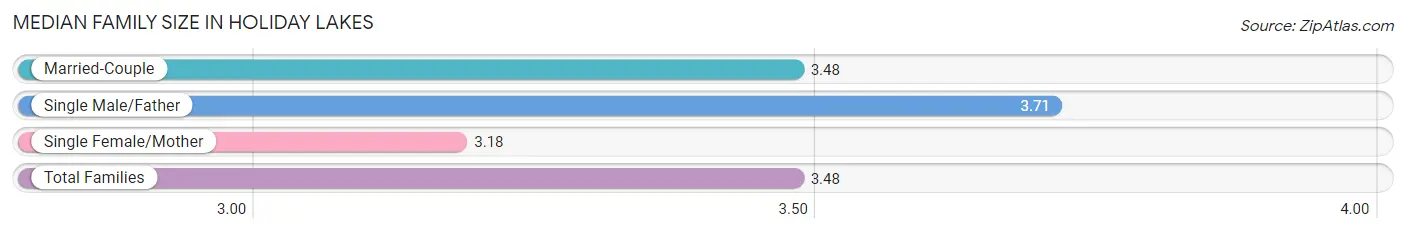
| Family Type | # Families | Family Size |
| Married-Couple | 133 (60.2%) | 3.48 |
| Single Male/Father | 49 (22.2%) | 3.71 |
| Single Female/Mother | 39 (17.6%) | 3.18 |
| Total Families | 221 (100.0%) | 3.48 |
Median Household Size in Holiday Lakes
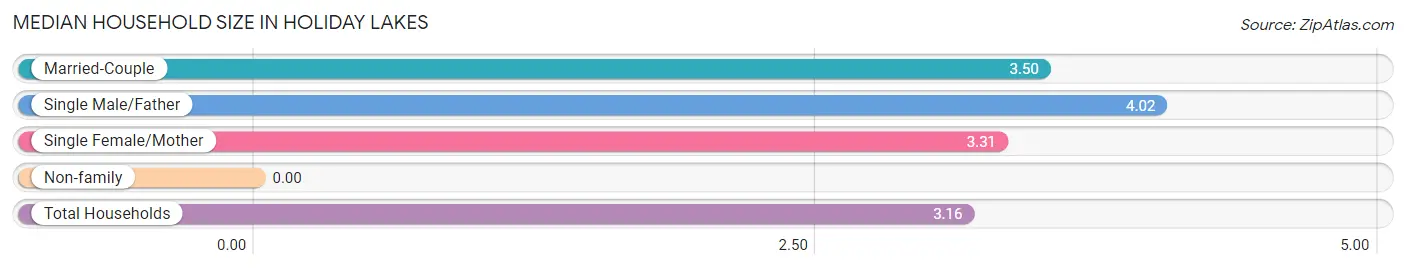
| Household Type | # Households | Household Size |
| Married-Couple | 133 (50.4%) | 3.50 |
| Single Male/Father | 49 (18.6%) | 4.02 |
| Single Female/Mother | 39 (14.8%) | 3.31 |
| Non-family | 43 (16.3%) | - |
| Total Households | 264 (100.0%) | 3.16 |
Household Size by Marriage Status in Holiday Lakes
Out of a total of 264 households in Holiday Lakes, 221 (83.7%) are family households, while 43 (16.3%) are nonfamily households. The most numerous type of family households are 3-person households, comprising 67, and the most common type of nonfamily households are 1-person households, comprising 43.
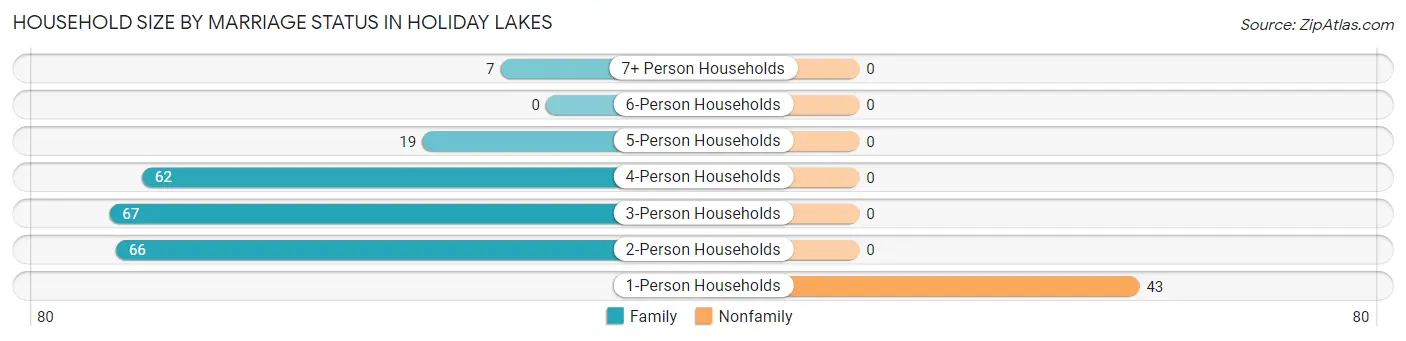
| Household Size | Family Households | Nonfamily Households |
| 1-Person Households | - | 43 (16.3%) |
| 2-Person Households | 66 (25.0%) | 0 (0.0%) |
| 3-Person Households | 67 (25.4%) | 0 (0.0%) |
| 4-Person Households | 62 (23.5%) | 0 (0.0%) |
| 5-Person Households | 19 (7.2%) | 0 (0.0%) |
| 6-Person Households | 0 (0.0%) | 0 (0.0%) |
| 7+ Person Households | 7 (2.6%) | 0 (0.0%) |
| Total | 221 (83.7%) | 43 (16.3%) |
Female Fertility in Holiday Lakes
Fertility by Age in Holiday Lakes
Average fertility rate in Holiday Lakes is 13.0 births per 1,000 women. Women in the age bracket of 20 to 34 years have the highest fertility rate with 34.0 births per 1,000 women. Women in the age bracket of 20 to 34 years acount for 100.0% of all women with births.
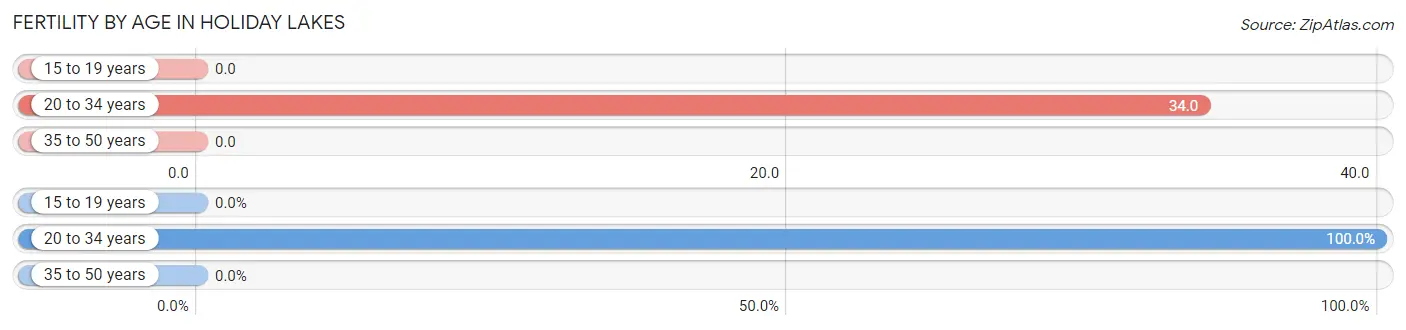
| Age Bracket | Women with Births | Births / 1,000 Women |
| 15 to 19 years | 0 (0.0%) | 0.0 |
| 20 to 34 years | 3 (100.0%) | 34.0 |
| 35 to 50 years | 0 (0.0%) | 0.0 |
| Total | 3 (100.0%) | 13.0 |
Fertility by Age by Marriage Status in Holiday Lakes
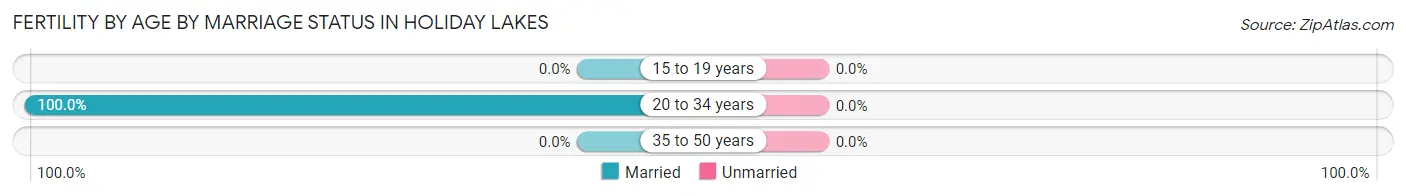
| Age Bracket | Married | Unmarried |
| 15 to 19 years | 0 (0.0%) | 0 (0.0%) |
| 20 to 34 years | 3 (100.0%) | 0 (0.0%) |
| 35 to 50 years | 0 (0.0%) | 0 (0.0%) |
| Total | 3 (100.0%) | 0 (0.0%) |
Fertility by Education in Holiday Lakes
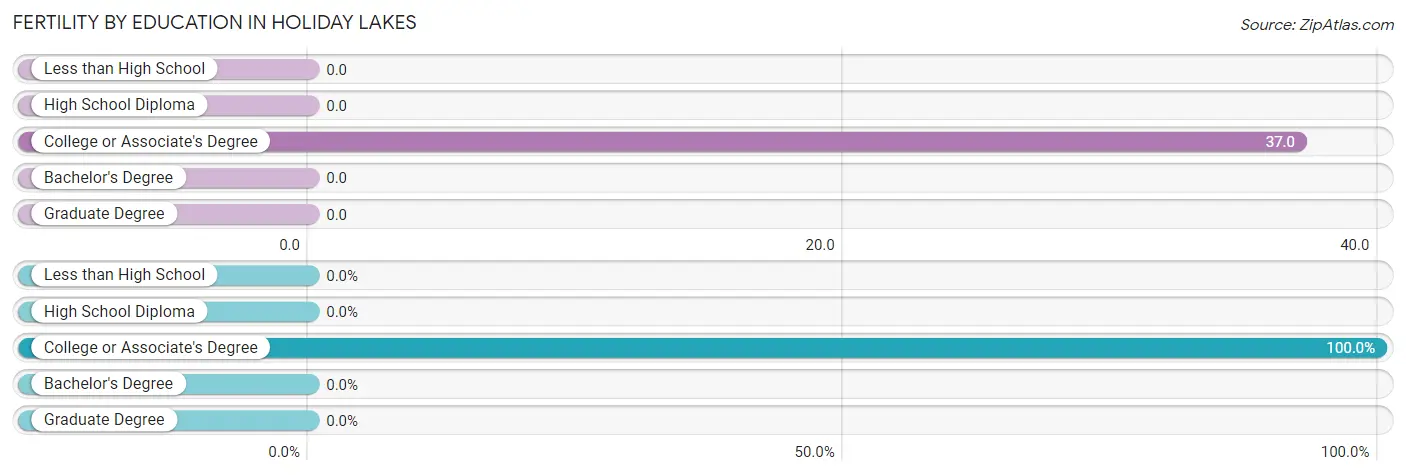
| Educational Attainment | Women with Births | Births / 1,000 Women |
| Less than High School | 0 (0.0%) | 0.0 |
| High School Diploma | 0 (0.0%) | 0.0 |
| College or Associate's Degree | 3 (100.0%) | 37.0 |
| Bachelor's Degree | 0 (0.0%) | 0.0 |
| Graduate Degree | 0 (0.0%) | 0.0 |
| Total | 3 (100.0%) | 13.0 |
Fertility by Education by Marriage Status in Holiday Lakes
| Educational Attainment | Married | Unmarried |
| Less than High School | 0 (0.0%) | 0 (0.0%) |
| High School Diploma | 0 (0.0%) | 0 (0.0%) |
| College or Associate's Degree | 3 (100.0%) | 0 (0.0%) |
| Bachelor's Degree | 0 (0.0%) | 0 (0.0%) |
| Graduate Degree | 0 (0.0%) | 0 (0.0%) |
| Total | 3 (100.0%) | 0 (0.0%) |
Employment Characteristics in Holiday Lakes
Employment by Class of Employer in Holiday Lakes
Among the 309 employed individuals in Holiday Lakes, private company employees (223 | 72.2%), self-employed (not incorporated) (59 | 19.1%), and not-for-profit organizations (12 | 3.9%) make up the most common classes of employment.
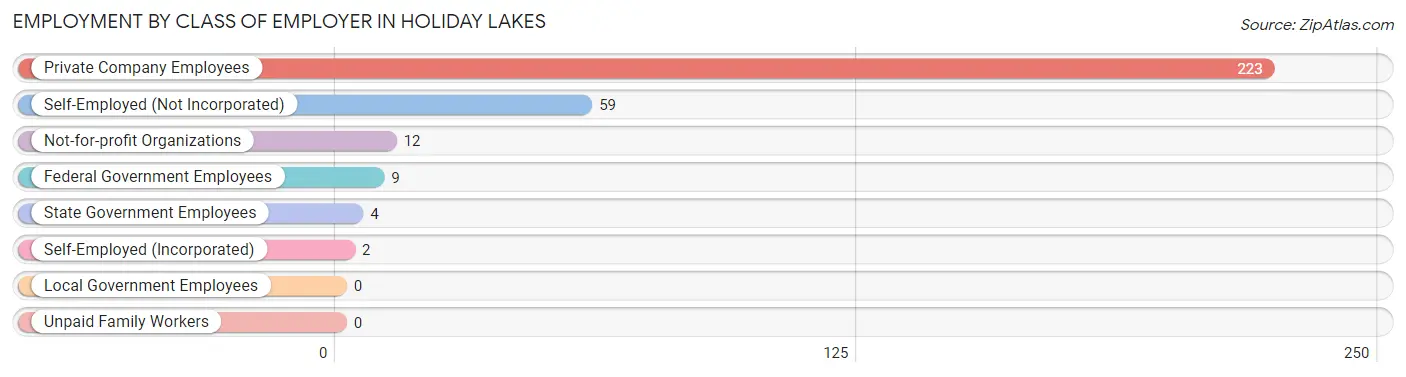
| Employer Class | # Employees | % Employees |
| Private Company Employees | 223 | 72.2% |
| Self-Employed (Incorporated) | 2 | 0.6% |
| Self-Employed (Not Incorporated) | 59 | 19.1% |
| Not-for-profit Organizations | 12 | 3.9% |
| Local Government Employees | 0 | 0.0% |
| State Government Employees | 4 | 1.3% |
| Federal Government Employees | 9 | 2.9% |
| Unpaid Family Workers | 0 | 0.0% |
| Total | 309 | 100.0% |
Employment Status by Age in Holiday Lakes
According to the labor force statistics for Holiday Lakes, out of the total population over 16 years of age (628), 52.7% or 331 individuals are in the labor force, with 6.6% or 22 of them unemployed. The age group with the highest labor force participation rate is 30 to 34 years, with 100.0% or 57 individuals in the labor force. Within the labor force, the 16 to 19 years age range has the highest percentage of unemployed individuals, with 100.0% or 11 of them being unemployed.
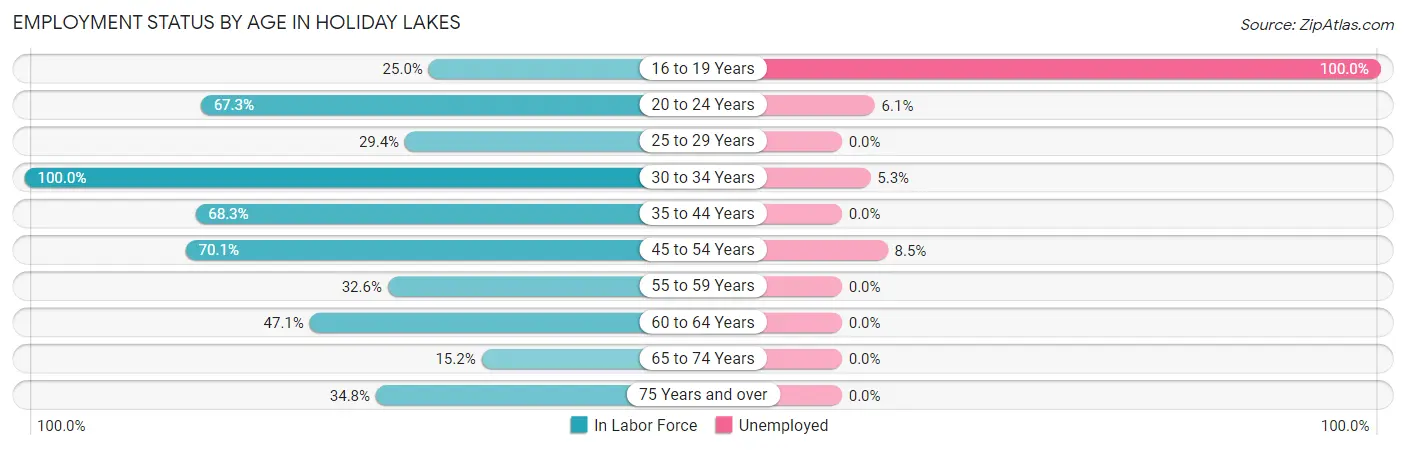
| Age Bracket | In Labor Force | Unemployed |
| 16 to 19 Years | 11 (25.0%) | 11 (100.0%) |
| 20 to 24 Years | 66 (67.3%) | 4 (6.1%) |
| 25 to 29 Years | 10 (29.4%) | 0 (0.0%) |
| 30 to 34 Years | 57 (100.0%) | 3 (5.3%) |
| 35 to 44 Years | 86 (68.3%) | 0 (0.0%) |
| 45 to 54 Years | 47 (70.1%) | 4 (8.5%) |
| 55 to 59 Years | 15 (32.6%) | 0 (0.0%) |
| 60 to 64 Years | 16 (47.1%) | 0 (0.0%) |
| 65 to 74 Years | 15 (15.2%) | 0 (0.0%) |
| 75 Years and over | 8 (34.8%) | 0 (0.0%) |
| Total | 331 (52.7%) | 22 (6.6%) |
Employment Status by Educational Attainment in Holiday Lakes
According to labor force statistics for Holiday Lakes, 63.5% of individuals (231) out of the total population between 25 and 64 years of age (364) are in the labor force, with 3.0% or 7 of them being unemployed. The group with the highest labor force participation rate are those with the educational attainment of bachelor's degree or higher, with 100.0% or 12 individuals in the labor force. Within the labor force, individuals with college / associate degree education have the highest percentage of unemployment, with 9.9% or 7 of them being unemployed.
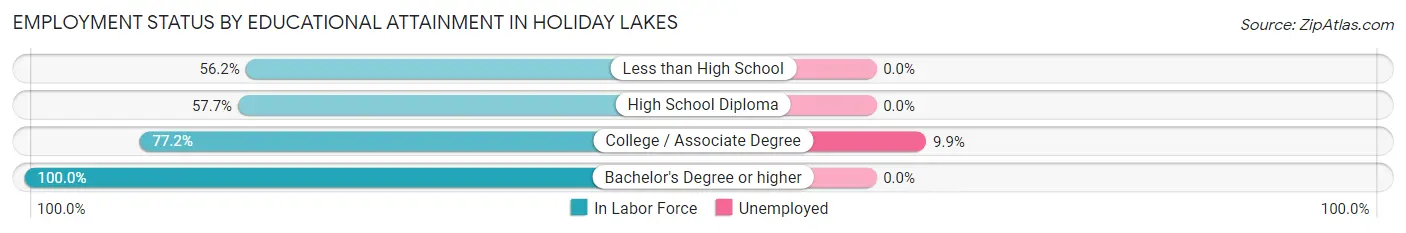
| Educational Attainment | In Labor Force | Unemployed |
| Less than High School | 77 (56.2%) | 0 (0.0%) |
| High School Diploma | 71 (57.7%) | 0 (0.0%) |
| College / Associate Degree | 71 (77.2%) | 9 (9.9%) |
| Bachelor's Degree or higher | 12 (100.0%) | 0 (0.0%) |
| Total | 231 (63.5%) | 11 (3.0%) |
Employment Occupations by Sex in Holiday Lakes
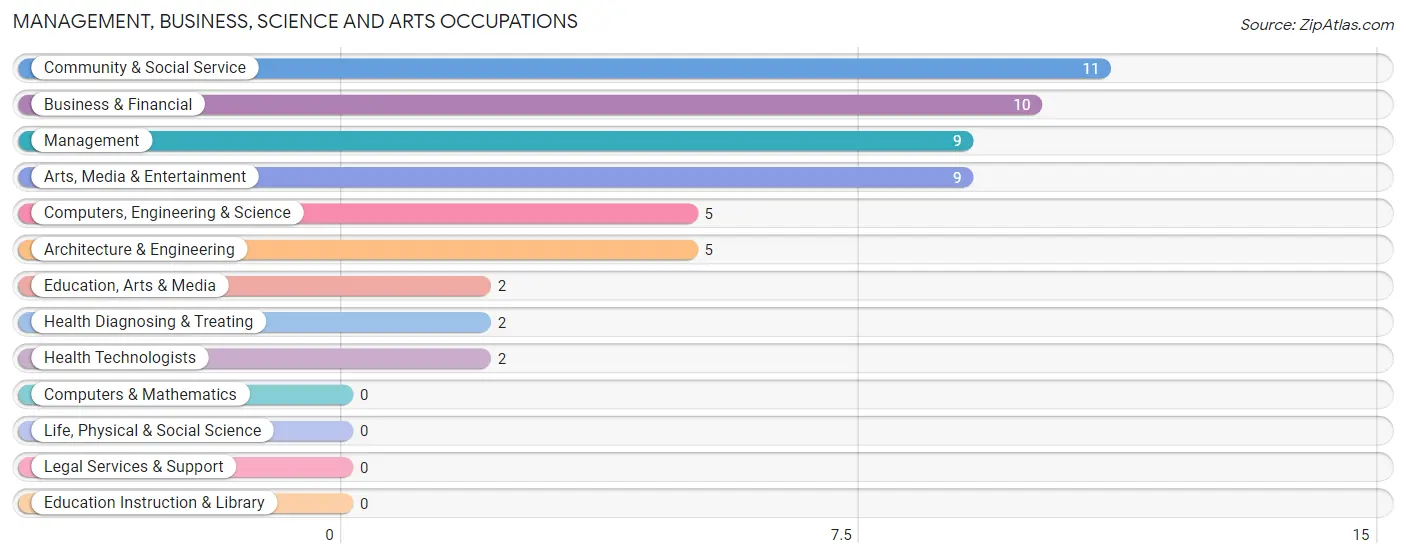
Management, Business, Science and Arts Occupations
The most common Management, Business, Science and Arts occupations in Holiday Lakes are Community & Social Service (11 | 3.6%), Business & Financial (10 | 3.2%), Management (9 | 2.9%), Arts, Media & Entertainment (9 | 2.9%), and Computers, Engineering & Science (5 | 1.6%).
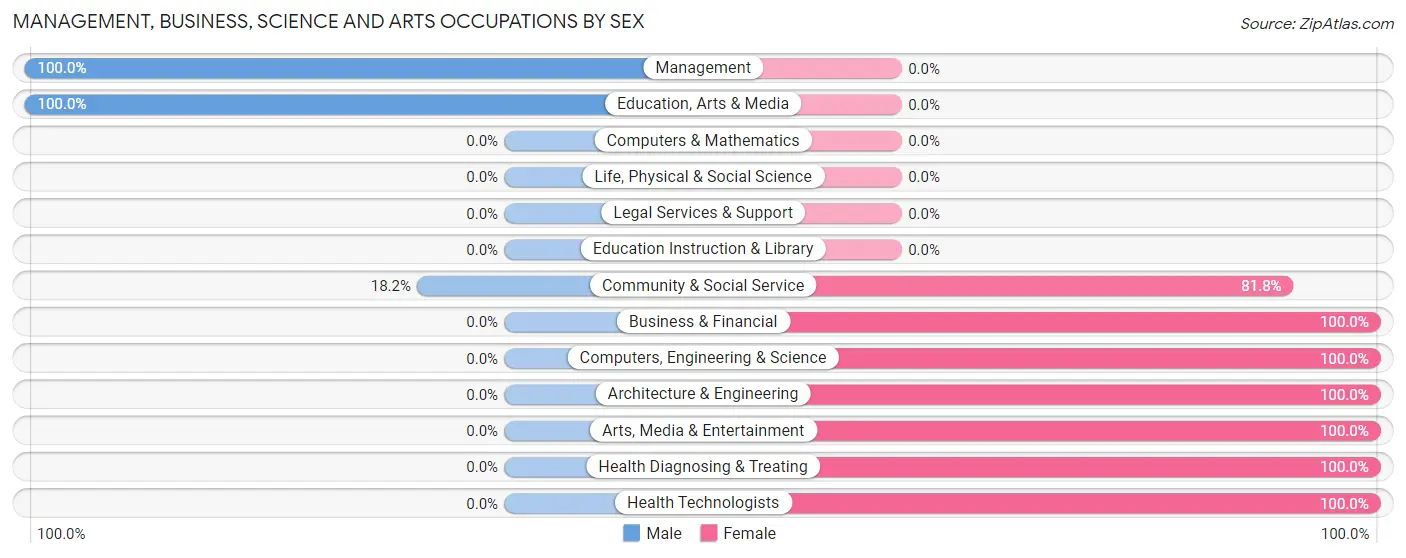
Management, Business, Science and Arts Occupations by Sex
Within the Management, Business, Science and Arts occupations in Holiday Lakes, the most male-oriented occupations are Management (100.0%), Education, Arts & Media (100.0%), and Community & Social Service (18.2%), while the most female-oriented occupations are Business & Financial (100.0%), Computers, Engineering & Science (100.0%), and Architecture & Engineering (100.0%).
| Occupation | Male | Female |
| Management | 9 (100.0%) | 0 (0.0%) |
| Business & Financial | 0 (0.0%) | 10 (100.0%) |
| Computers, Engineering & Science | 0 (0.0%) | 5 (100.0%) |
| Computers & Mathematics | 0 (0.0%) | 0 (0.0%) |
| Architecture & Engineering | 0 (0.0%) | 5 (100.0%) |
| Life, Physical & Social Science | 0 (0.0%) | 0 (0.0%) |
| Community & Social Service | 2 (18.2%) | 9 (81.8%) |
| Education, Arts & Media | 2 (100.0%) | 0 (0.0%) |
| Legal Services & Support | 0 (0.0%) | 0 (0.0%) |
| Education Instruction & Library | 0 (0.0%) | 0 (0.0%) |
| Arts, Media & Entertainment | 0 (0.0%) | 9 (100.0%) |
| Health Diagnosing & Treating | 0 (0.0%) | 2 (100.0%) |
| Health Technologists | 0 (0.0%) | 2 (100.0%) |
| Total (Category) | 11 (29.7%) | 26 (70.3%) |
| Total (Overall) | 190 (61.5%) | 119 (38.5%) |
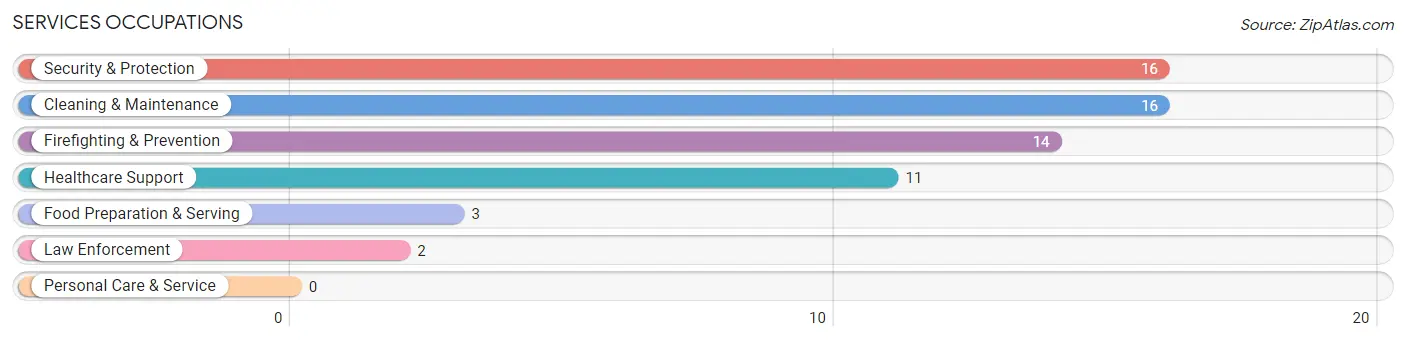
Services Occupations
The most common Services occupations in Holiday Lakes are Security & Protection (16 | 5.2%), Cleaning & Maintenance (16 | 5.2%), Firefighting & Prevention (14 | 4.5%), Healthcare Support (11 | 3.6%), and Food Preparation & Serving (3 | 1.0%).
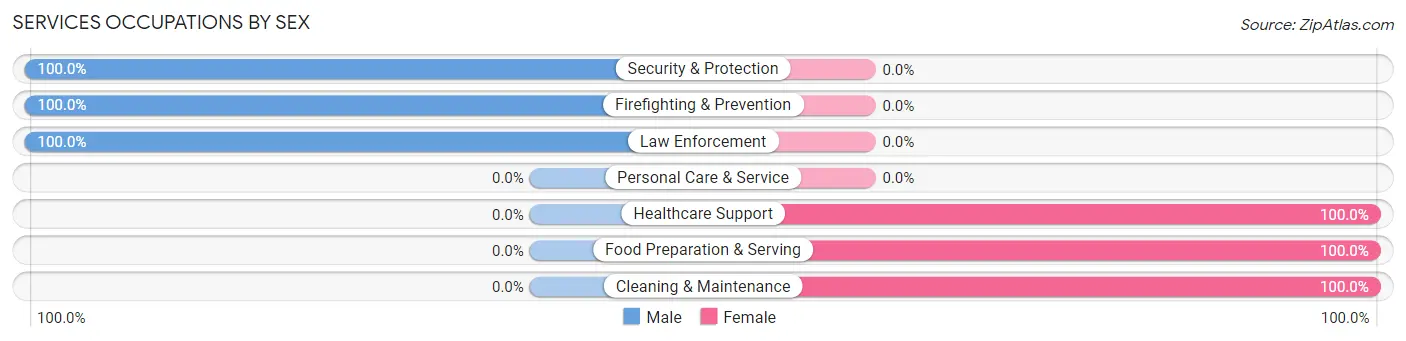
Services Occupations by Sex
Within the Services occupations in Holiday Lakes, the most male-oriented occupations are Security & Protection (100.0%), Firefighting & Prevention (100.0%), and Law Enforcement (100.0%), while the most female-oriented occupations are Healthcare Support (100.0%), Food Preparation & Serving (100.0%), and Cleaning & Maintenance (100.0%).
| Occupation | Male | Female |
| Healthcare Support | 0 (0.0%) | 11 (100.0%) |
| Security & Protection | 16 (100.0%) | 0 (0.0%) |
| Firefighting & Prevention | 14 (100.0%) | 0 (0.0%) |
| Law Enforcement | 2 (100.0%) | 0 (0.0%) |
| Food Preparation & Serving | 0 (0.0%) | 3 (100.0%) |
| Cleaning & Maintenance | 0 (0.0%) | 16 (100.0%) |
| Personal Care & Service | 0 (0.0%) | 0 (0.0%) |
| Total (Category) | 16 (34.8%) | 30 (65.2%) |
| Total (Overall) | 190 (61.5%) | 119 (38.5%) |
Sales and Office Occupations
The most common Sales and Office occupations in Holiday Lakes are Sales & Related (42 | 13.6%), and Office & Administration (13 | 4.2%).
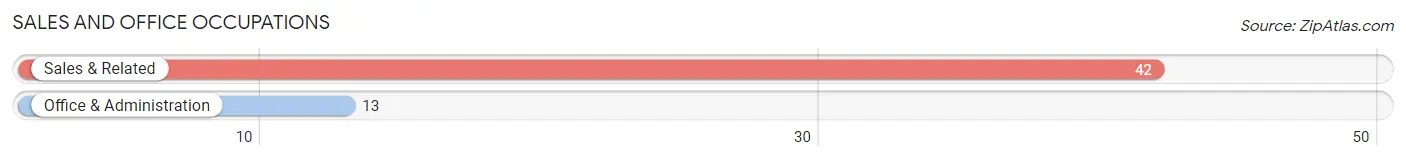
Sales and Office Occupations by Sex
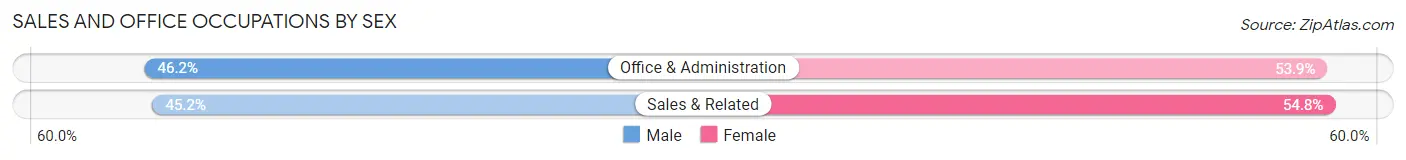
| Occupation | Male | Female |
| Sales & Related | 19 (45.2%) | 23 (54.8%) |
| Office & Administration | 6 (46.2%) | 7 (53.8%) |
| Total (Category) | 25 (45.5%) | 30 (54.5%) |
| Total (Overall) | 190 (61.5%) | 119 (38.5%) |
Natural Resources, Construction and Maintenance Occupations
The most common Natural Resources, Construction and Maintenance occupations in Holiday Lakes are Construction & Extraction (83 | 26.9%), Installation, Maintenance & Repair (43 | 13.9%), and Farming, Fishing & Forestry (4 | 1.3%).
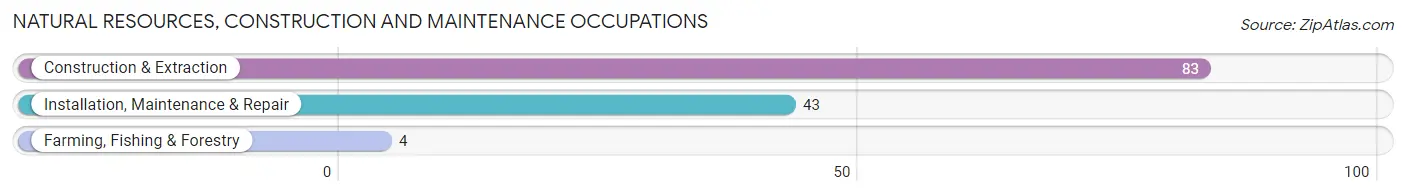
Natural Resources, Construction and Maintenance Occupations by Sex
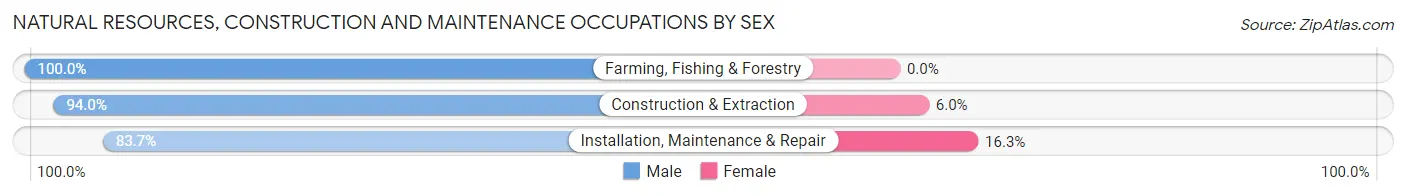
| Occupation | Male | Female |
| Farming, Fishing & Forestry | 4 (100.0%) | 0 (0.0%) |
| Construction & Extraction | 78 (94.0%) | 5 (6.0%) |
| Installation, Maintenance & Repair | 36 (83.7%) | 7 (16.3%) |
| Total (Category) | 118 (90.8%) | 12 (9.2%) |
| Total (Overall) | 190 (61.5%) | 119 (38.5%) |
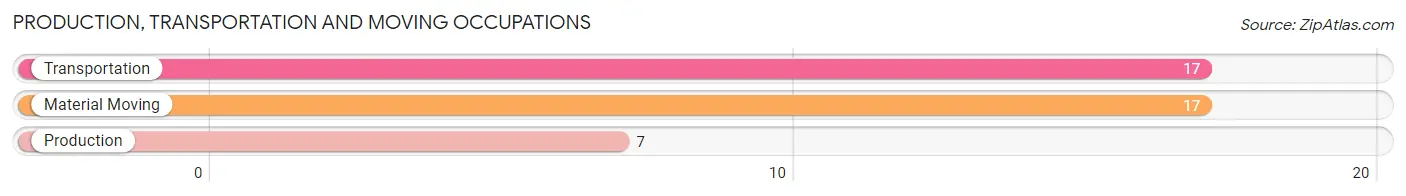
Production, Transportation and Moving Occupations
The most common Production, Transportation and Moving occupations in Holiday Lakes are Transportation (17 | 5.5%), Material Moving (17 | 5.5%), and Production (7 | 2.3%).
Production, Transportation and Moving Occupations by Sex
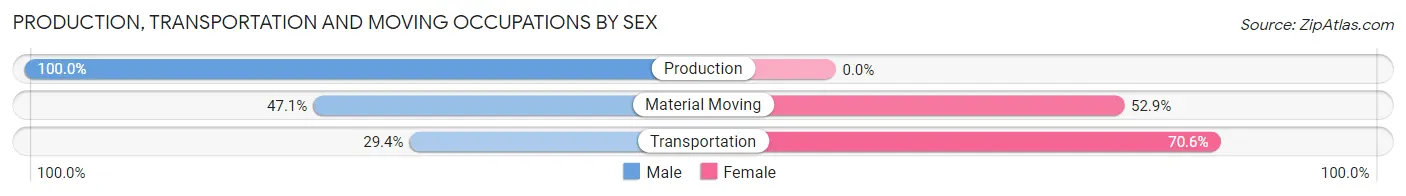
| Occupation | Male | Female |
| Production | 7 (100.0%) | 0 (0.0%) |
| Transportation | 5 (29.4%) | 12 (70.6%) |
| Material Moving | 8 (47.1%) | 9 (52.9%) |
| Total (Category) | 20 (48.8%) | 21 (51.2%) |
| Total (Overall) | 190 (61.5%) | 119 (38.5%) |
Employment Industries by Sex in Holiday Lakes
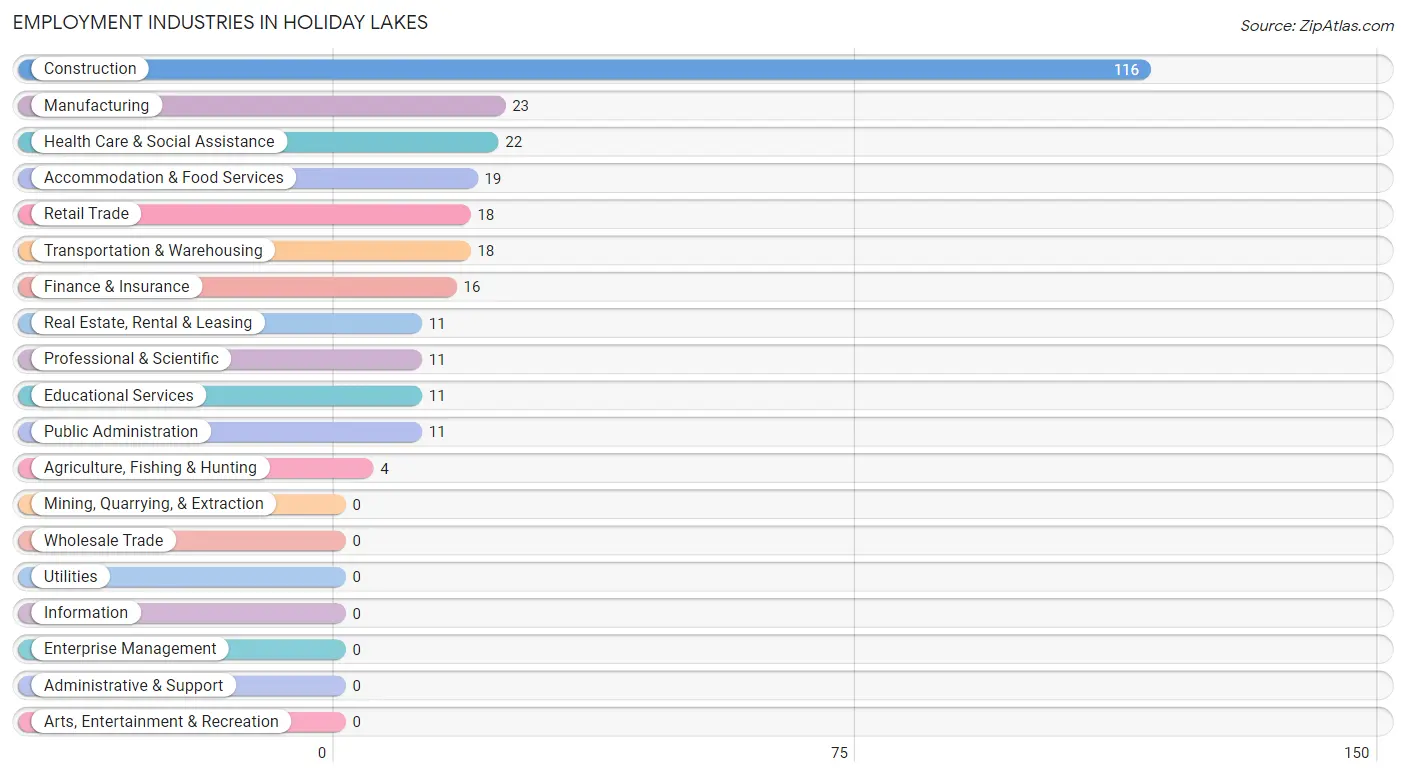
Employment Industries in Holiday Lakes
The major employment industries in Holiday Lakes include Construction (116 | 37.5%), Manufacturing (23 | 7.4%), Health Care & Social Assistance (22 | 7.1%), Accommodation & Food Services (19 | 6.1%), and Retail Trade (18 | 5.8%).
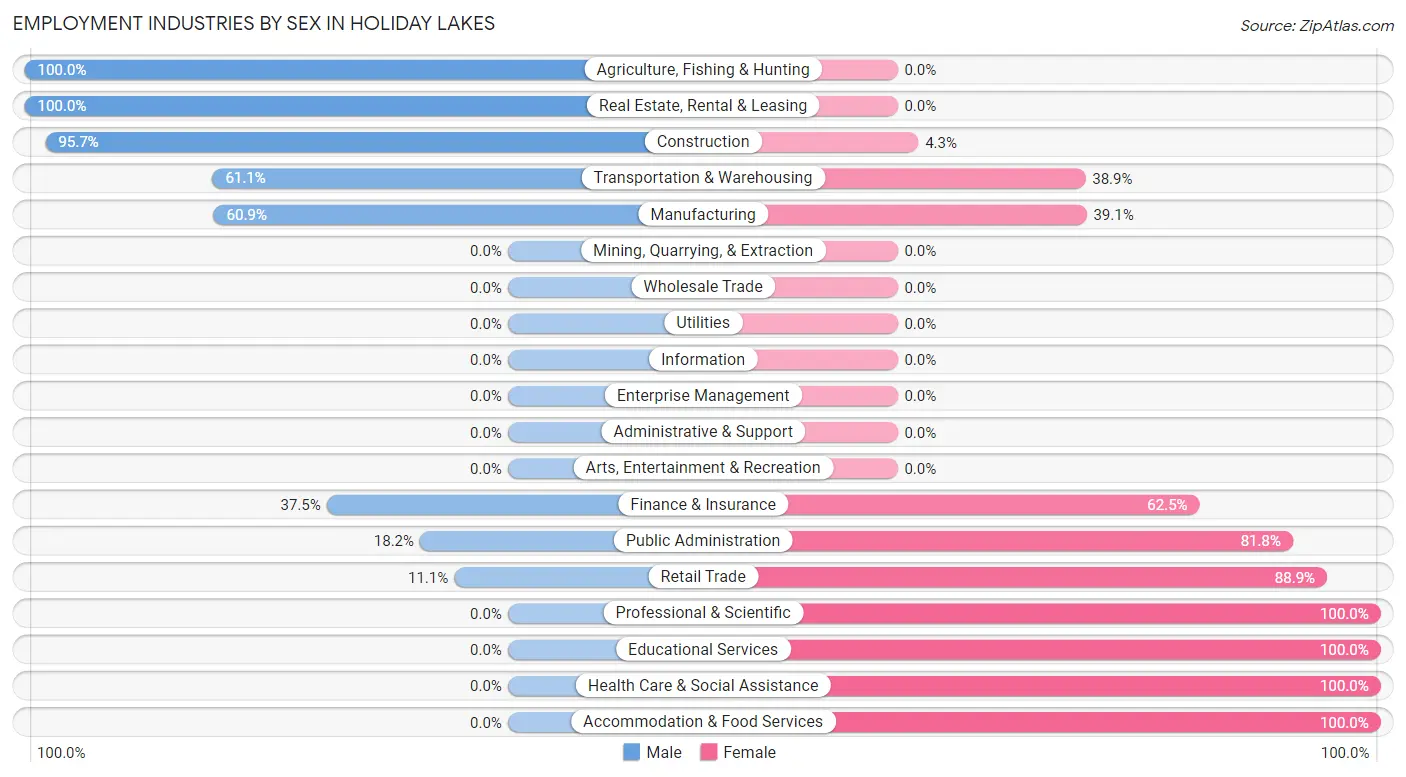
Employment Industries by Sex in Holiday Lakes
The Holiday Lakes industries that see more men than women are Agriculture, Fishing & Hunting (100.0%), Real Estate, Rental & Leasing (100.0%), and Construction (95.7%), whereas the industries that tend to have a higher number of women are Professional & Scientific (100.0%), Educational Services (100.0%), and Health Care & Social Assistance (100.0%).
| Industry | Male | Female |
| Agriculture, Fishing & Hunting | 4 (100.0%) | 0 (0.0%) |
| Mining, Quarrying, & Extraction | 0 (0.0%) | 0 (0.0%) |
| Construction | 111 (95.7%) | 5 (4.3%) |
| Manufacturing | 14 (60.9%) | 9 (39.1%) |
| Wholesale Trade | 0 (0.0%) | 0 (0.0%) |
| Retail Trade | 2 (11.1%) | 16 (88.9%) |
| Transportation & Warehousing | 11 (61.1%) | 7 (38.9%) |
| Utilities | 0 (0.0%) | 0 (0.0%) |
| Information | 0 (0.0%) | 0 (0.0%) |
| Finance & Insurance | 6 (37.5%) | 10 (62.5%) |
| Real Estate, Rental & Leasing | 11 (100.0%) | 0 (0.0%) |
| Professional & Scientific | 0 (0.0%) | 11 (100.0%) |
| Enterprise Management | 0 (0.0%) | 0 (0.0%) |
| Administrative & Support | 0 (0.0%) | 0 (0.0%) |
| Educational Services | 0 (0.0%) | 11 (100.0%) |
| Health Care & Social Assistance | 0 (0.0%) | 22 (100.0%) |
| Arts, Entertainment & Recreation | 0 (0.0%) | 0 (0.0%) |
| Accommodation & Food Services | 0 (0.0%) | 19 (100.0%) |
| Public Administration | 2 (18.2%) | 9 (81.8%) |
| Total | 190 (61.5%) | 119 (38.5%) |
Education in Holiday Lakes
School Enrollment in Holiday Lakes
The most common levels of schooling among the 247 students in Holiday Lakes are elementary school (61 | 24.7%), high school (56 | 22.7%), and middle school (48 | 19.4%).
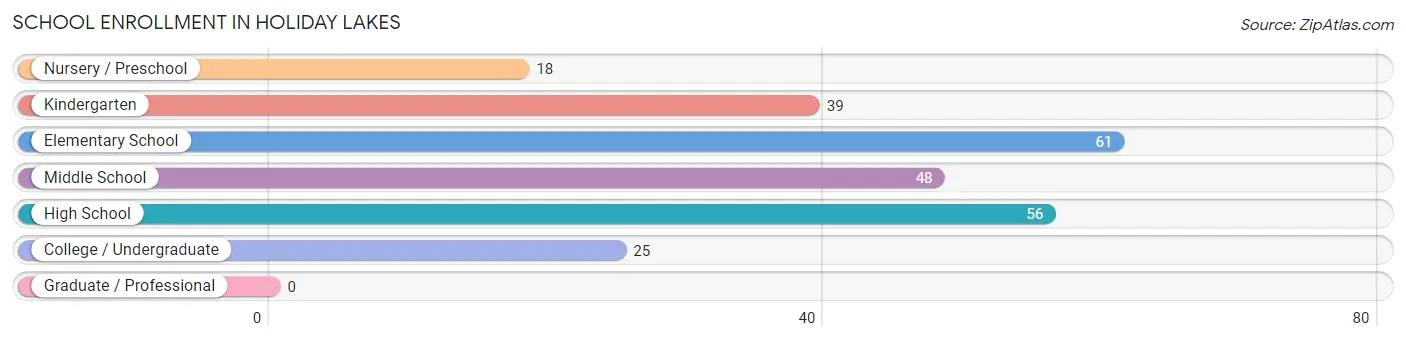
| School Level | # Students | % Students |
| Nursery / Preschool | 18 | 7.3% |
| Kindergarten | 39 | 15.8% |
| Elementary School | 61 | 24.7% |
| Middle School | 48 | 19.4% |
| High School | 56 | 22.7% |
| College / Undergraduate | 25 | 10.1% |
| Graduate / Professional | 0 | 0.0% |
| Total | 247 | 100.0% |
School Enrollment by Age by Funding Source in Holiday Lakes
Out of a total of 247 students who are enrolled in schools in Holiday Lakes, 48 (19.4%) attend a private institution, while the remaining 199 (80.6%) are enrolled in public schools. The age group of 3 to 4 year olds has the highest likelihood of being enrolled in private schools, with 6 (50.0% in the age bracket) enrolled. Conversely, the age group of 15 to 17 year olds has the lowest likelihood of being enrolled in a private school, with 20 (100.0% in the age bracket) attending a public institution.
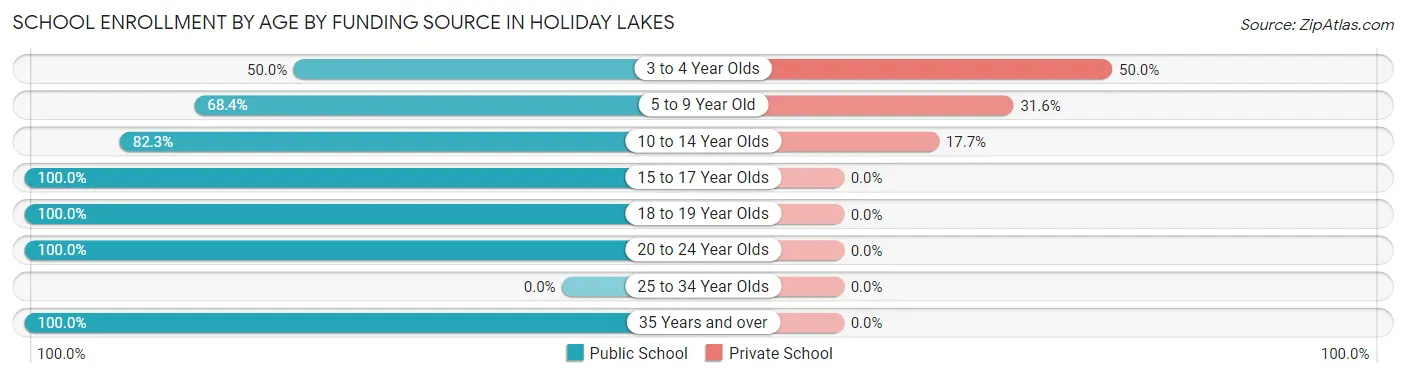
| Age Bracket | Public School | Private School |
| 3 to 4 Year Olds | 6 (50.0%) | 6 (50.0%) |
| 5 to 9 Year Old | 67 (68.4%) | 31 (31.6%) |
| 10 to 14 Year Olds | 51 (82.3%) | 11 (17.7%) |
| 15 to 17 Year Olds | 20 (100.0%) | 0 (0.0%) |
| 18 to 19 Year Olds | 31 (100.0%) | 0 (0.0%) |
| 20 to 24 Year Olds | 22 (100.0%) | 0 (0.0%) |
| 25 to 34 Year Olds | 0 (0.0%) | 0 (0.0%) |
| 35 Years and over | 2 (100.0%) | 0 (0.0%) |
| Total | 199 (80.6%) | 48 (19.4%) |
Educational Attainment by Field of Study in Holiday Lakes
Science & technology (6 | 37.5%), business (6 | 37.5%), social sciences (2 | 12.5%), and arts & humanities (2 | 12.5%) are the most common fields of study among 16 individuals in Holiday Lakes who have obtained a bachelor's degree or higher.
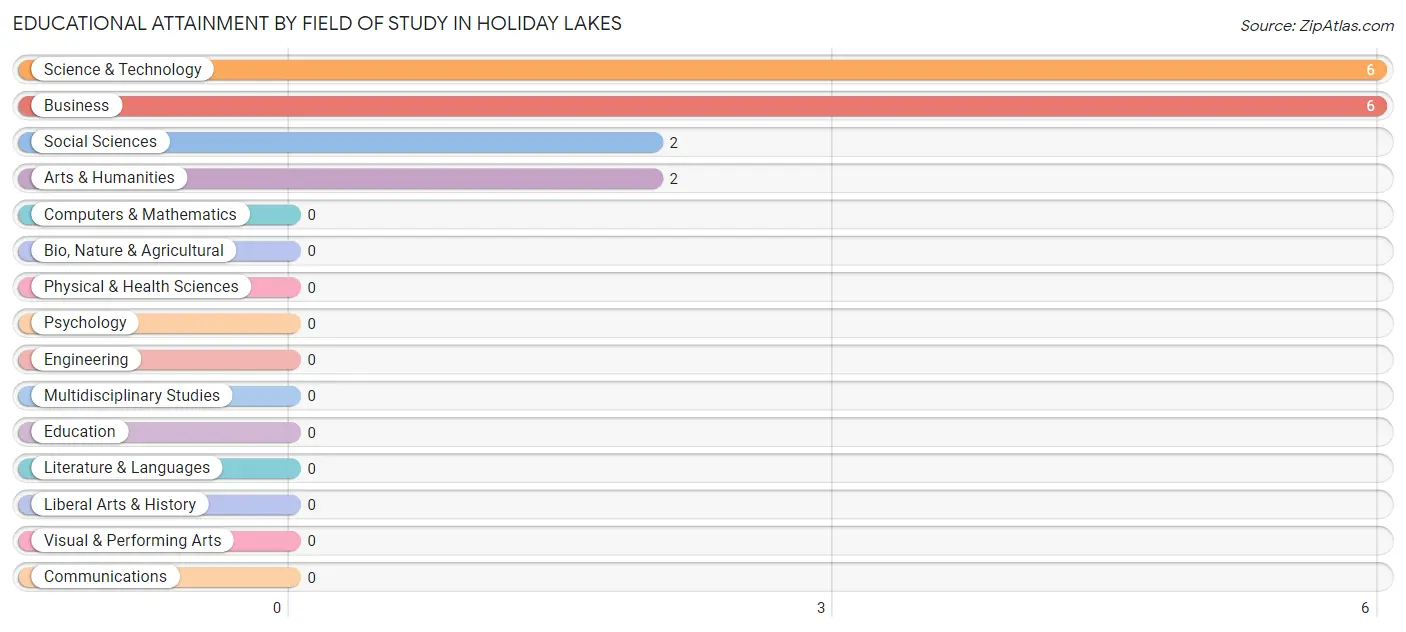
| Field of Study | # Graduates | % Graduates |
| Computers & Mathematics | 0 | 0.0% |
| Bio, Nature & Agricultural | 0 | 0.0% |
| Physical & Health Sciences | 0 | 0.0% |
| Psychology | 0 | 0.0% |
| Social Sciences | 2 | 12.5% |
| Engineering | 0 | 0.0% |
| Multidisciplinary Studies | 0 | 0.0% |
| Science & Technology | 6 | 37.5% |
| Business | 6 | 37.5% |
| Education | 0 | 0.0% |
| Literature & Languages | 0 | 0.0% |
| Liberal Arts & History | 0 | 0.0% |
| Visual & Performing Arts | 0 | 0.0% |
| Communications | 0 | 0.0% |
| Arts & Humanities | 2 | 12.5% |
| Total | 16 | 100.0% |
Transportation & Commute in Holiday Lakes
Vehicle Availability by Sex in Holiday Lakes
The most prevalent vehicle ownership categories in Holiday Lakes are males with 2 vehicles (60, accounting for 31.6%) and females with 2 vehicles (55, making up 50.4%).
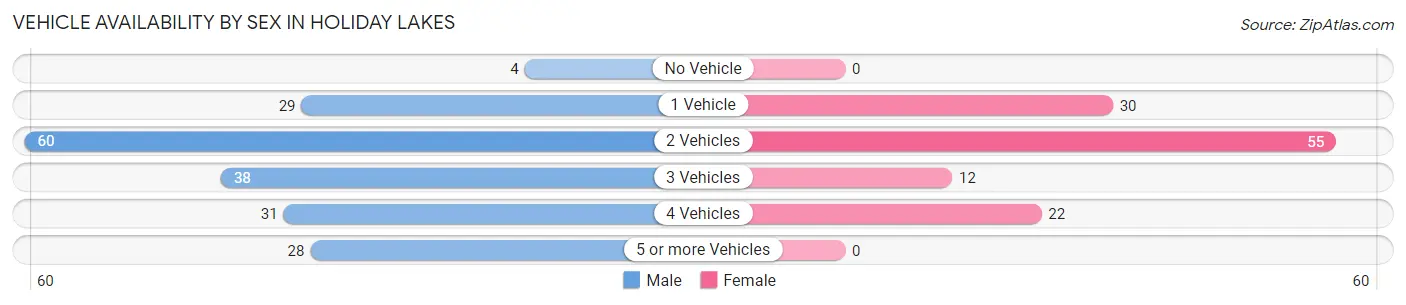
| Vehicles Available | Male | Female |
| No Vehicle | 4 (2.1%) | 0 (0.0%) |
| 1 Vehicle | 29 (15.3%) | 30 (25.2%) |
| 2 Vehicles | 60 (31.6%) | 55 (46.2%) |
| 3 Vehicles | 38 (20.0%) | 12 (10.1%) |
| 4 Vehicles | 31 (16.3%) | 22 (18.5%) |
| 5 or more Vehicles | 28 (14.7%) | 0 (0.0%) |
| Total | 190 (100.0%) | 119 (100.0%) |
Commute Time in Holiday Lakes
The most frequently occuring commute durations in Holiday Lakes are 30 to 34 minutes (56 commuters, 19.4%), 15 to 19 minutes (52 commuters, 18.1%), and 25 to 29 minutes (42 commuters, 14.6%).
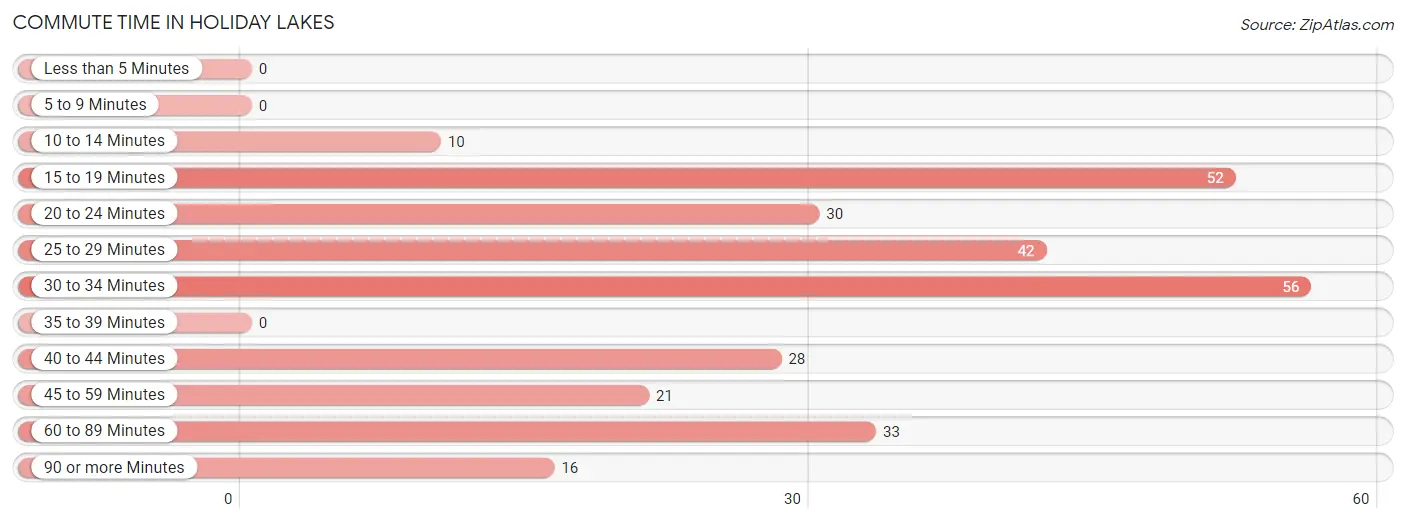
| Commute Time | # Commuters | % Commuters |
| Less than 5 Minutes | 0 | 0.0% |
| 5 to 9 Minutes | 0 | 0.0% |
| 10 to 14 Minutes | 10 | 3.5% |
| 15 to 19 Minutes | 52 | 18.1% |
| 20 to 24 Minutes | 30 | 10.4% |
| 25 to 29 Minutes | 42 | 14.6% |
| 30 to 34 Minutes | 56 | 19.4% |
| 35 to 39 Minutes | 0 | 0.0% |
| 40 to 44 Minutes | 28 | 9.7% |
| 45 to 59 Minutes | 21 | 7.3% |
| 60 to 89 Minutes | 33 | 11.5% |
| 90 or more Minutes | 16 | 5.6% |
Commute Time by Sex in Holiday Lakes
The most common commute times in Holiday Lakes are 30 to 34 minutes (31 commuters, 17.4%) for males and 25 to 29 minutes (33 commuters, 30.0%) for females.
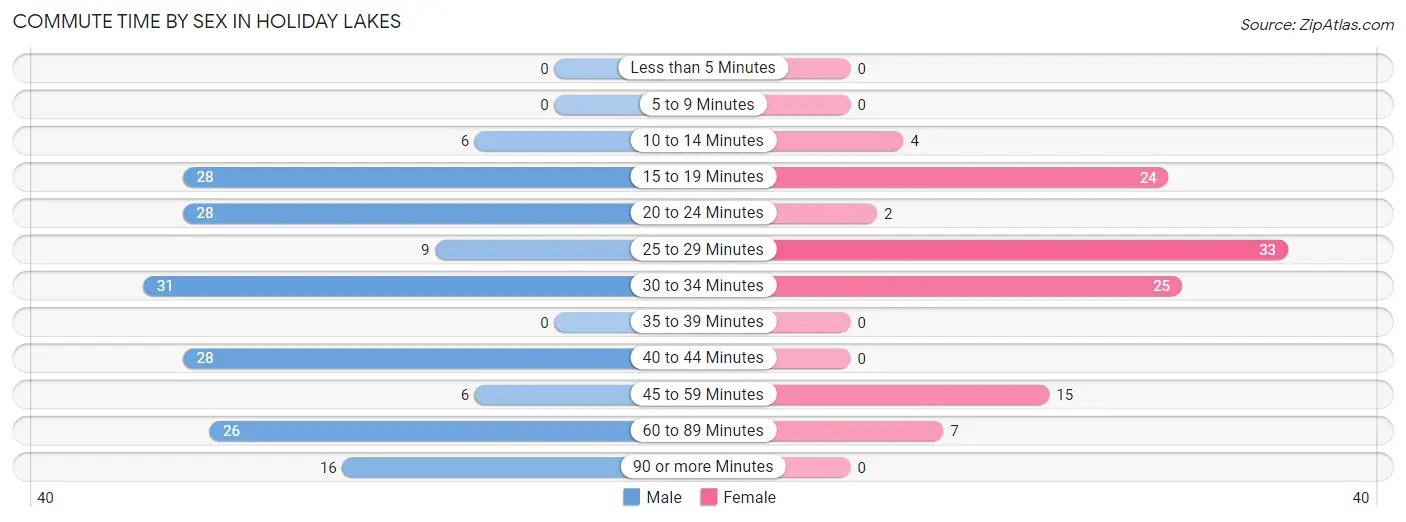
| Commute Time | Male | Female |
| Less than 5 Minutes | 0 (0.0%) | 0 (0.0%) |
| 5 to 9 Minutes | 0 (0.0%) | 0 (0.0%) |
| 10 to 14 Minutes | 6 (3.4%) | 4 (3.6%) |
| 15 to 19 Minutes | 28 (15.7%) | 24 (21.8%) |
| 20 to 24 Minutes | 28 (15.7%) | 2 (1.8%) |
| 25 to 29 Minutes | 9 (5.1%) | 33 (30.0%) |
| 30 to 34 Minutes | 31 (17.4%) | 25 (22.7%) |
| 35 to 39 Minutes | 0 (0.0%) | 0 (0.0%) |
| 40 to 44 Minutes | 28 (15.7%) | 0 (0.0%) |
| 45 to 59 Minutes | 6 (3.4%) | 15 (13.6%) |
| 60 to 89 Minutes | 26 (14.6%) | 7 (6.4%) |
| 90 or more Minutes | 16 (9.0%) | 0 (0.0%) |
Time of Departure to Work by Sex in Holiday Lakes
The most frequent times of departure to work in Holiday Lakes are 7:00 AM to 7:29 AM (33, 18.5%) for males and 7:00 AM to 7:29 AM (23, 20.9%) for females.
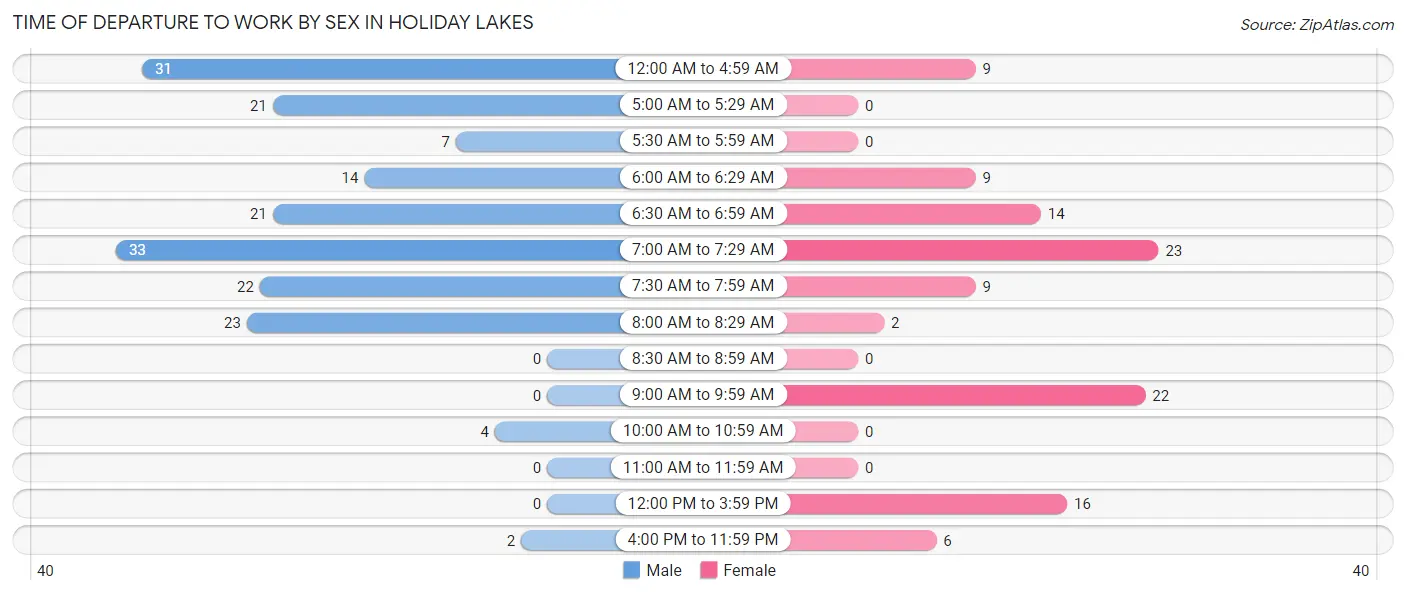
| Time of Departure | Male | Female |
| 12:00 AM to 4:59 AM | 31 (17.4%) | 9 (8.2%) |
| 5:00 AM to 5:29 AM | 21 (11.8%) | 0 (0.0%) |
| 5:30 AM to 5:59 AM | 7 (3.9%) | 0 (0.0%) |
| 6:00 AM to 6:29 AM | 14 (7.9%) | 9 (8.2%) |
| 6:30 AM to 6:59 AM | 21 (11.8%) | 14 (12.7%) |
| 7:00 AM to 7:29 AM | 33 (18.5%) | 23 (20.9%) |
| 7:30 AM to 7:59 AM | 22 (12.4%) | 9 (8.2%) |
| 8:00 AM to 8:29 AM | 23 (12.9%) | 2 (1.8%) |
| 8:30 AM to 8:59 AM | 0 (0.0%) | 0 (0.0%) |
| 9:00 AM to 9:59 AM | 0 (0.0%) | 22 (20.0%) |
| 10:00 AM to 10:59 AM | 4 (2.2%) | 0 (0.0%) |
| 11:00 AM to 11:59 AM | 0 (0.0%) | 0 (0.0%) |
| 12:00 PM to 3:59 PM | 0 (0.0%) | 16 (14.5%) |
| 4:00 PM to 11:59 PM | 2 (1.1%) | 6 (5.4%) |
| Total | 178 (100.0%) | 110 (100.0%) |
Housing Occupancy in Holiday Lakes
Occupancy by Ownership in Holiday Lakes
Of the total 264 dwellings in Holiday Lakes, owner-occupied units account for 215 (81.4%), while renter-occupied units make up 49 (18.6%).
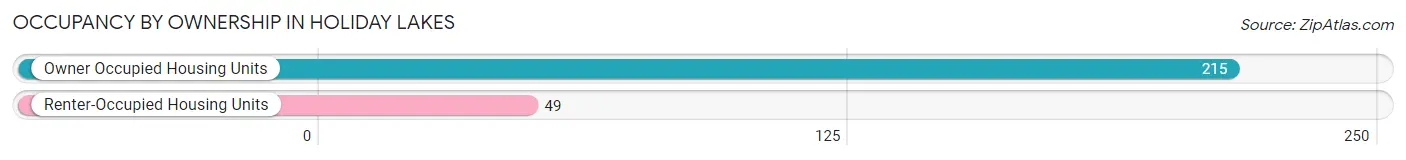
| Occupancy | # Housing Units | % Housing Units |
| Owner Occupied Housing Units | 215 | 81.4% |
| Renter-Occupied Housing Units | 49 | 18.6% |
| Total Occupied Housing Units | 264 | 100.0% |
Occupancy by Household Size in Holiday Lakes
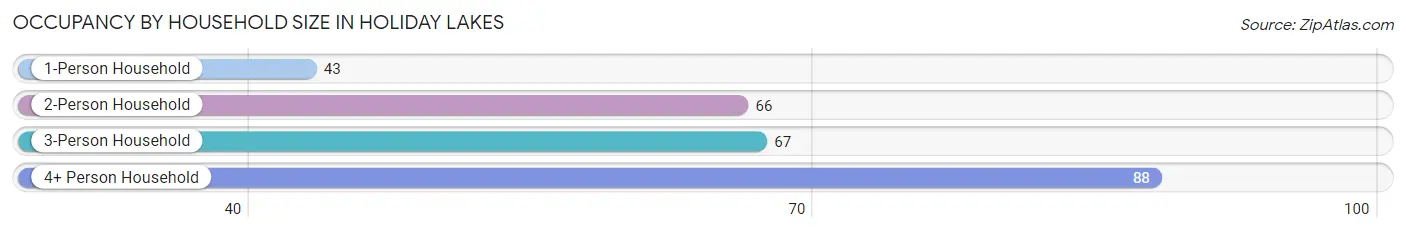
| Household Size | # Housing Units | % Housing Units |
| 1-Person Household | 43 | 16.3% |
| 2-Person Household | 66 | 25.0% |
| 3-Person Household | 67 | 25.4% |
| 4+ Person Household | 88 | 33.3% |
| Total Housing Units | 264 | 100.0% |
Occupancy by Ownership by Household Size in Holiday Lakes
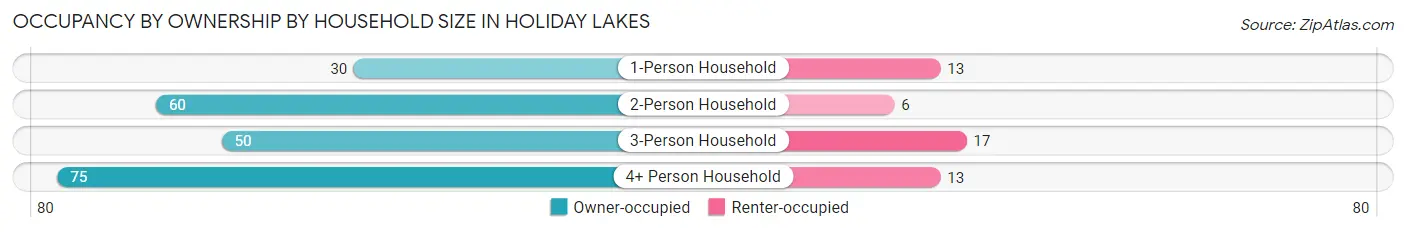
| Household Size | Owner-occupied | Renter-occupied |
| 1-Person Household | 30 (69.8%) | 13 (30.2%) |
| 2-Person Household | 60 (90.9%) | 6 (9.1%) |
| 3-Person Household | 50 (74.6%) | 17 (25.4%) |
| 4+ Person Household | 75 (85.2%) | 13 (14.8%) |
| Total Housing Units | 215 (81.4%) | 49 (18.6%) |
Occupancy by Educational Attainment in Holiday Lakes
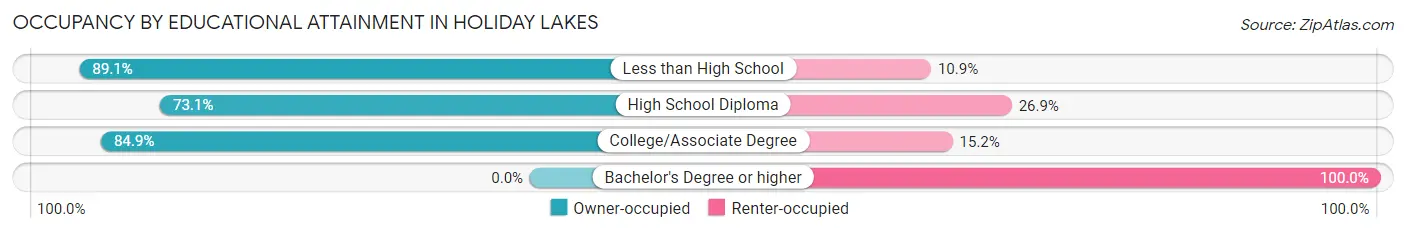
| Household Size | Owner-occupied | Renter-occupied |
| Less than High School | 82 (89.1%) | 10 (10.9%) |
| High School Diploma | 49 (73.1%) | 18 (26.9%) |
| College/Associate Degree | 84 (84.9%) | 15 (15.1%) |
| Bachelor's Degree or higher | 0 (0.0%) | 6 (100.0%) |
Occupancy by Age of Householder in Holiday Lakes
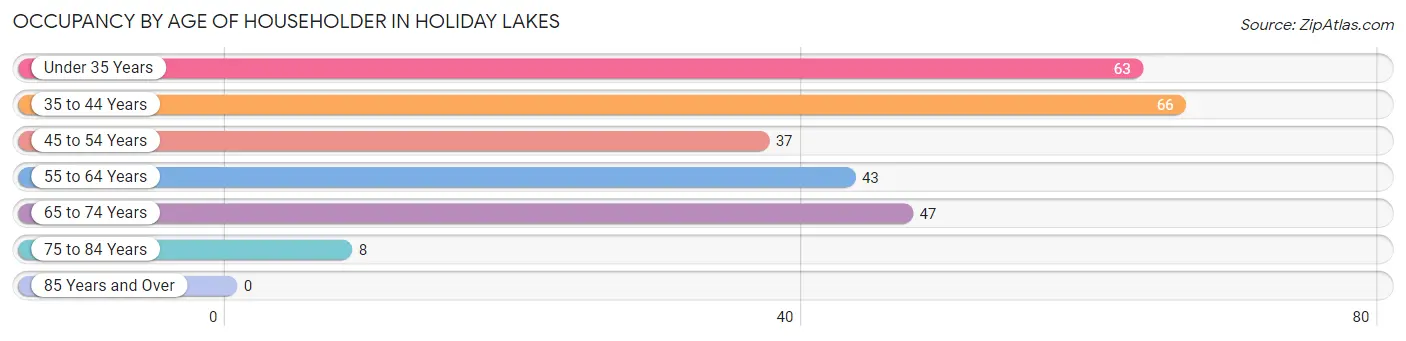
| Age Bracket | # Households | % Households |
| Under 35 Years | 63 | 23.9% |
| 35 to 44 Years | 66 | 25.0% |
| 45 to 54 Years | 37 | 14.0% |
| 55 to 64 Years | 43 | 16.3% |
| 65 to 74 Years | 47 | 17.8% |
| 75 to 84 Years | 8 | 3.0% |
| 85 Years and Over | 0 | 0.0% |
| Total | 264 | 100.0% |
Housing Finances in Holiday Lakes
Median Income by Occupancy in Holiday Lakes
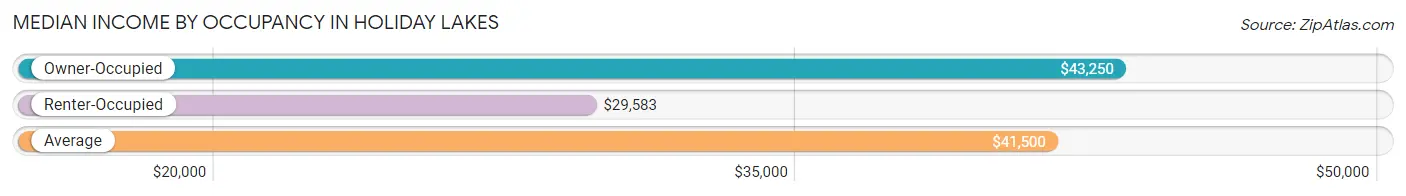
| Occupancy Type | # Households | Median Income |
| Owner-Occupied | 215 (81.4%) | $43,250 |
| Renter-Occupied | 49 (18.6%) | $29,583 |
| Average | 264 (100.0%) | $41,500 |
Occupancy by Householder Income Bracket in Holiday Lakes
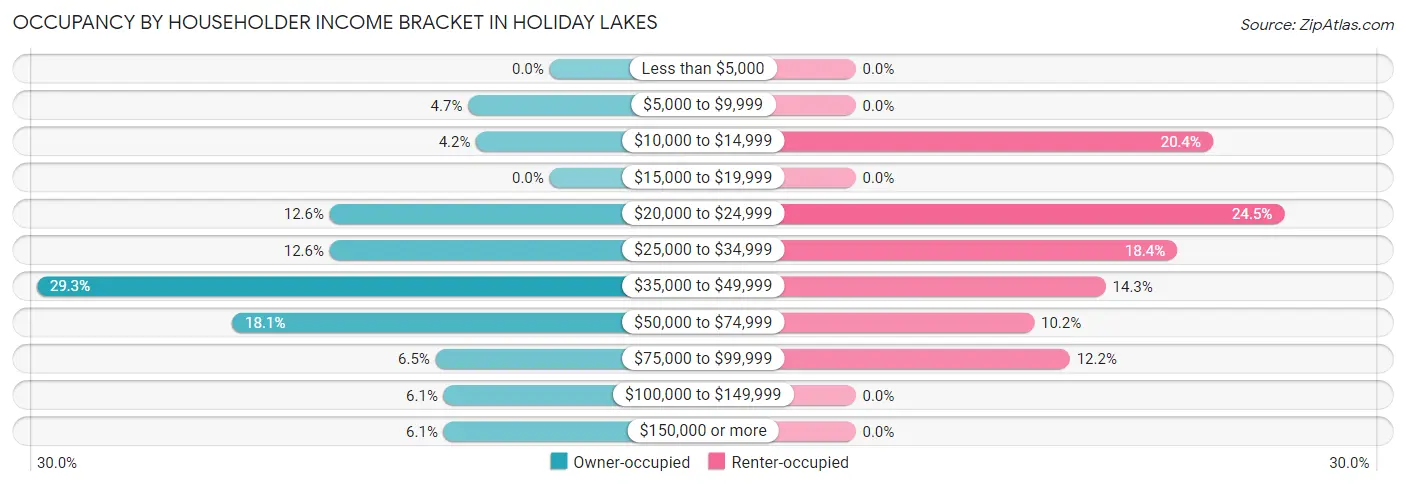
| Income Bracket | Owner-occupied | Renter-occupied |
| Less than $5,000 | 0 (0.0%) | 0 (0.0%) |
| $5,000 to $9,999 | 10 (4.6%) | 0 (0.0%) |
| $10,000 to $14,999 | 9 (4.2%) | 10 (20.4%) |
| $15,000 to $19,999 | 0 (0.0%) | 0 (0.0%) |
| $20,000 to $24,999 | 27 (12.6%) | 12 (24.5%) |
| $25,000 to $34,999 | 27 (12.6%) | 9 (18.4%) |
| $35,000 to $49,999 | 63 (29.3%) | 7 (14.3%) |
| $50,000 to $74,999 | 39 (18.1%) | 5 (10.2%) |
| $75,000 to $99,999 | 14 (6.5%) | 6 (12.2%) |
| $100,000 to $149,999 | 13 (6.0%) | 0 (0.0%) |
| $150,000 or more | 13 (6.0%) | 0 (0.0%) |
| Total | 215 (100.0%) | 49 (100.0%) |
Monthly Housing Cost Tiers in Holiday Lakes
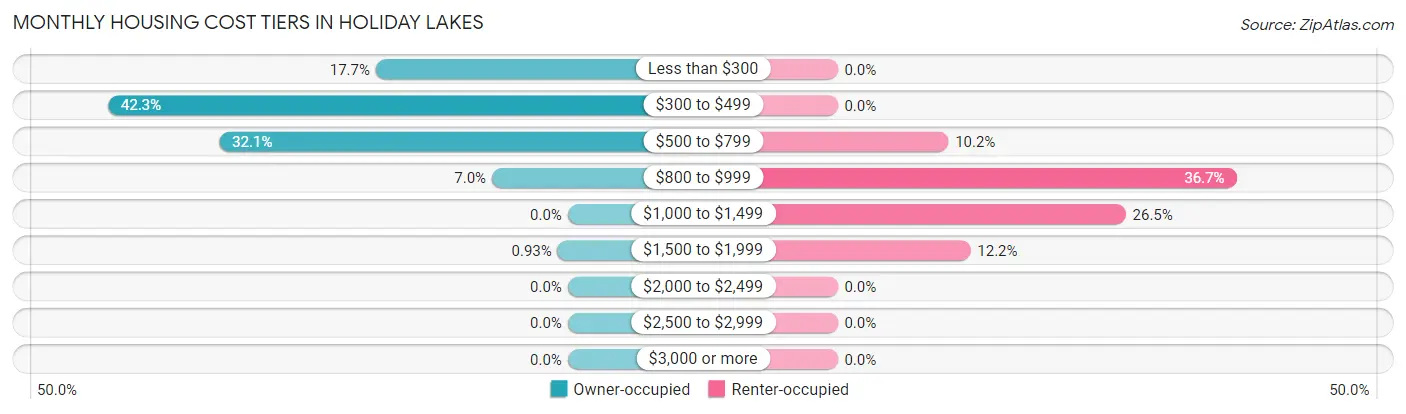
| Monthly Cost | Owner-occupied | Renter-occupied |
| Less than $300 | 38 (17.7%) | 0 (0.0%) |
| $300 to $499 | 91 (42.3%) | 0 (0.0%) |
| $500 to $799 | 69 (32.1%) | 5 (10.2%) |
| $800 to $999 | 15 (7.0%) | 18 (36.7%) |
| $1,000 to $1,499 | 0 (0.0%) | 13 (26.5%) |
| $1,500 to $1,999 | 2 (0.9%) | 6 (12.2%) |
| $2,000 to $2,499 | 0 (0.0%) | 0 (0.0%) |
| $2,500 to $2,999 | 0 (0.0%) | 0 (0.0%) |
| $3,000 or more | 0 (0.0%) | 0 (0.0%) |
| Total | 215 (100.0%) | 49 (100.0%) |
Physical Housing Characteristics in Holiday Lakes
Housing Structures in Holiday Lakes
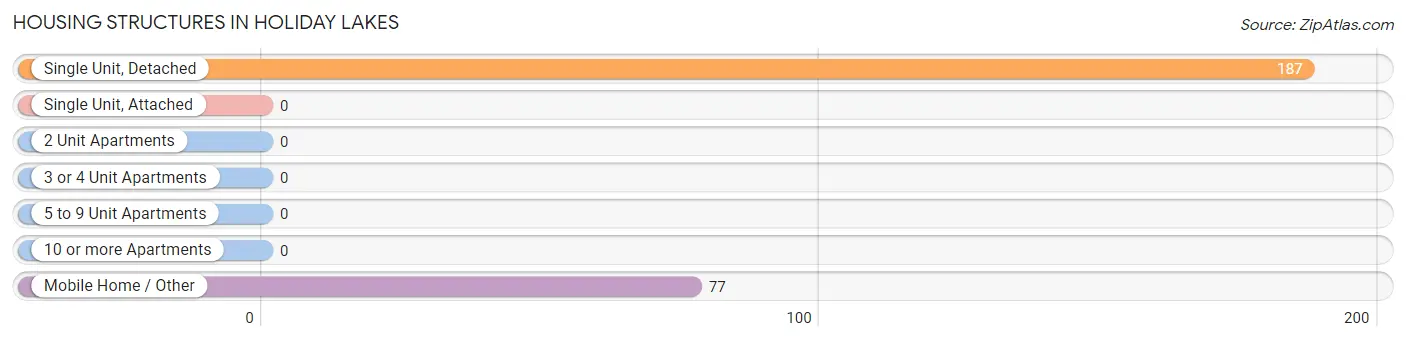
| Structure Type | # Housing Units | % Housing Units |
| Single Unit, Detached | 187 | 70.8% |
| Single Unit, Attached | 0 | 0.0% |
| 2 Unit Apartments | 0 | 0.0% |
| 3 or 4 Unit Apartments | 0 | 0.0% |
| 5 to 9 Unit Apartments | 0 | 0.0% |
| 10 or more Apartments | 0 | 0.0% |
| Mobile Home / Other | 77 | 29.2% |
| Total | 264 | 100.0% |
Housing Structures by Occupancy in Holiday Lakes
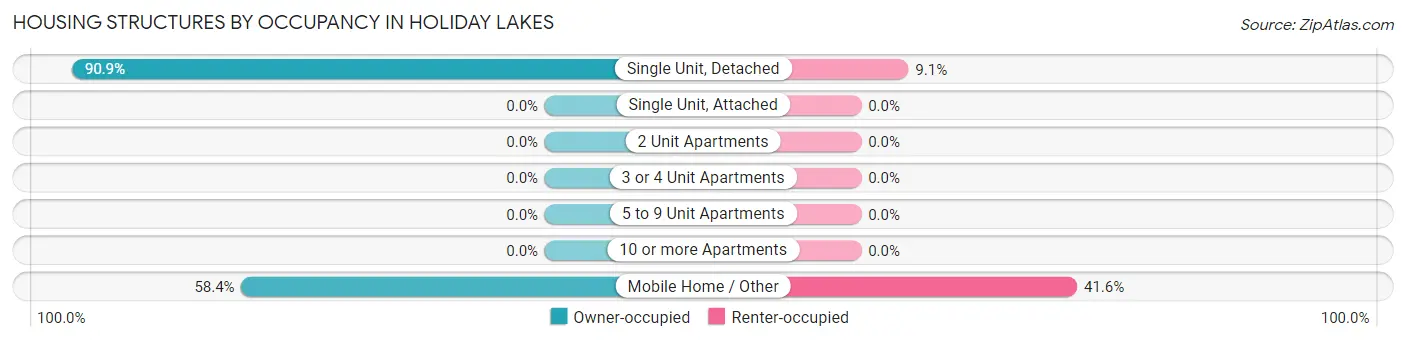
| Structure Type | Owner-occupied | Renter-occupied |
| Single Unit, Detached | 170 (90.9%) | 17 (9.1%) |
| Single Unit, Attached | 0 (0.0%) | 0 (0.0%) |
| 2 Unit Apartments | 0 (0.0%) | 0 (0.0%) |
| 3 or 4 Unit Apartments | 0 (0.0%) | 0 (0.0%) |
| 5 to 9 Unit Apartments | 0 (0.0%) | 0 (0.0%) |
| 10 or more Apartments | 0 (0.0%) | 0 (0.0%) |
| Mobile Home / Other | 45 (58.4%) | 32 (41.6%) |
| Total | 215 (81.4%) | 49 (18.6%) |
Housing Structures by Number of Rooms in Holiday Lakes
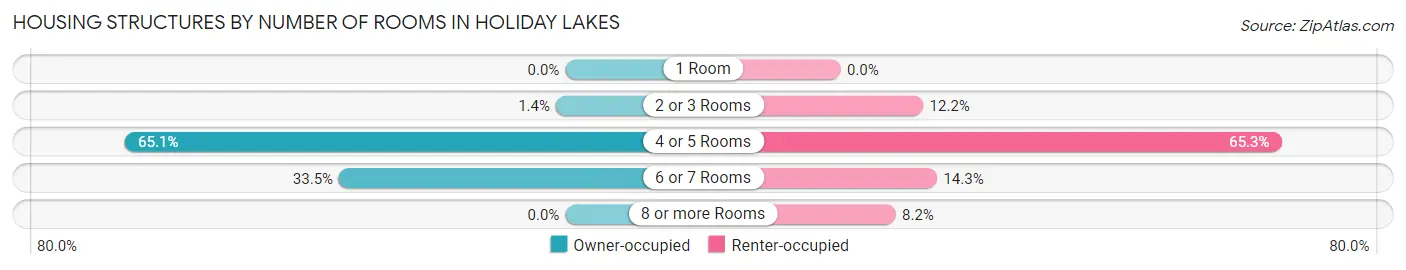
| Number of Rooms | Owner-occupied | Renter-occupied |
| 1 Room | 0 (0.0%) | 0 (0.0%) |
| 2 or 3 Rooms | 3 (1.4%) | 6 (12.2%) |
| 4 or 5 Rooms | 140 (65.1%) | 32 (65.3%) |
| 6 or 7 Rooms | 72 (33.5%) | 7 (14.3%) |
| 8 or more Rooms | 0 (0.0%) | 4 (8.2%) |
| Total | 215 (100.0%) | 49 (100.0%) |
Housing Structure by Heating Type in Holiday Lakes
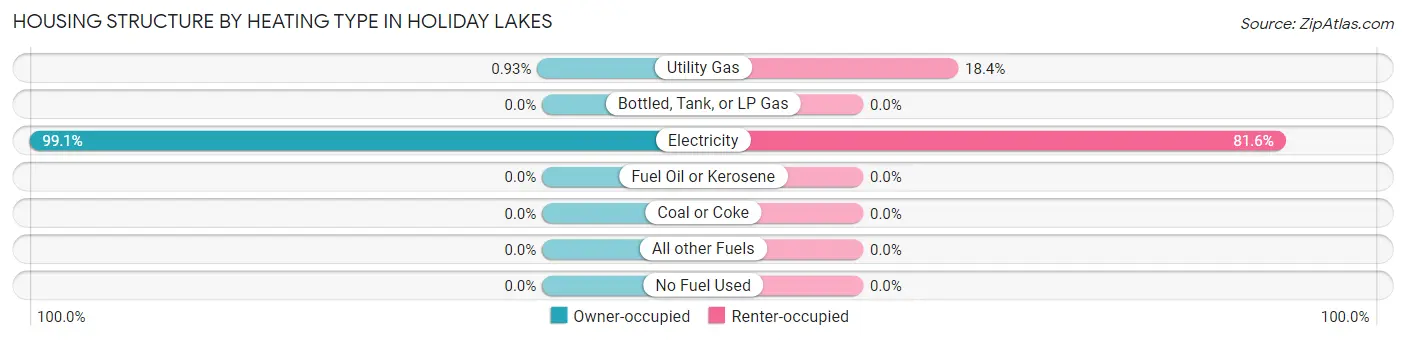
| Heating Type | Owner-occupied | Renter-occupied |
| Utility Gas | 2 (0.9%) | 9 (18.4%) |
| Bottled, Tank, or LP Gas | 0 (0.0%) | 0 (0.0%) |
| Electricity | 213 (99.1%) | 40 (81.6%) |
| Fuel Oil or Kerosene | 0 (0.0%) | 0 (0.0%) |
| Coal or Coke | 0 (0.0%) | 0 (0.0%) |
| All other Fuels | 0 (0.0%) | 0 (0.0%) |
| No Fuel Used | 0 (0.0%) | 0 (0.0%) |
| Total | 215 (100.0%) | 49 (100.0%) |
Household Vehicle Usage in Holiday Lakes
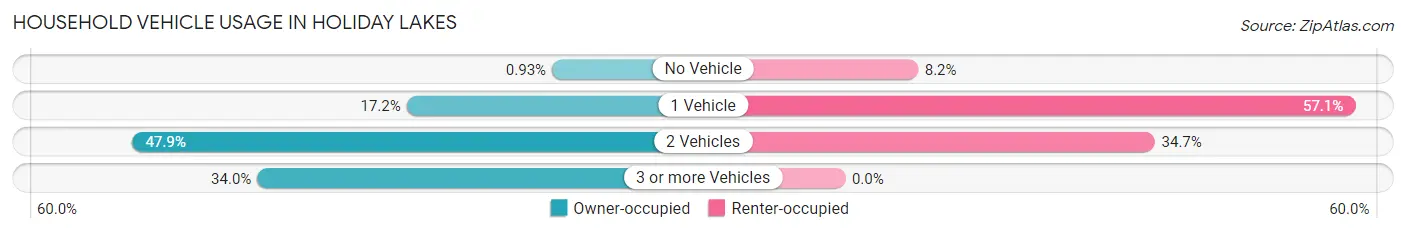
| Vehicles per Household | Owner-occupied | Renter-occupied |
| No Vehicle | 2 (0.9%) | 4 (8.2%) |
| 1 Vehicle | 37 (17.2%) | 28 (57.1%) |
| 2 Vehicles | 103 (47.9%) | 17 (34.7%) |
| 3 or more Vehicles | 73 (34.0%) | 0 (0.0%) |
| Total | 215 (100.0%) | 49 (100.0%) |
Real Estate & Mortgages in Holiday Lakes
Real Estate and Mortgage Overview in Holiday Lakes
| Characteristic | Without Mortgage | With Mortgage |
| Housing Units | 181 | 34 |
| Median Property Value | $91,300 | $0 |
| Median Household Income | $44,135 | $0 |
| Monthly Housing Costs | $422 | $0 |
| Real Estate Taxes | $729 | $0 |
Property Value by Mortgage Status in Holiday Lakes
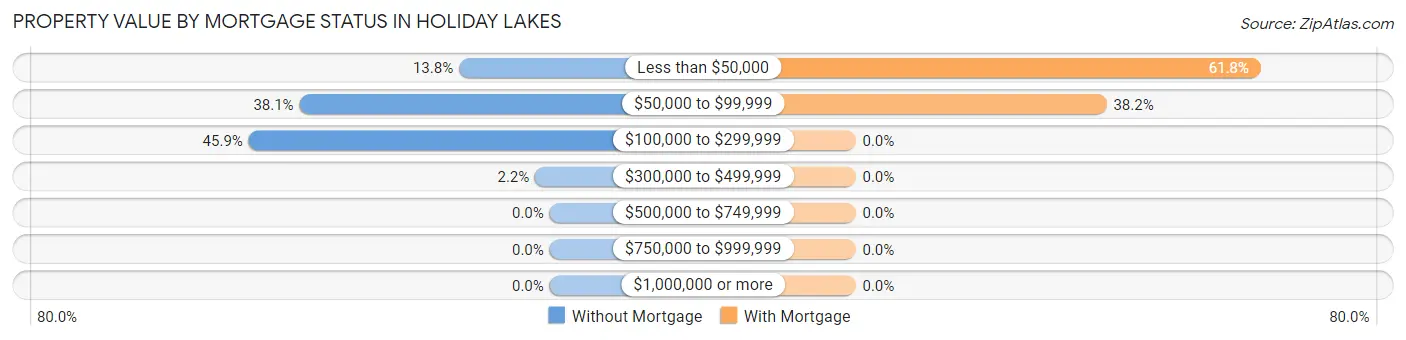
| Property Value | Without Mortgage | With Mortgage |
| Less than $50,000 | 25 (13.8%) | 21 (61.8%) |
| $50,000 to $99,999 | 69 (38.1%) | 13 (38.2%) |
| $100,000 to $299,999 | 83 (45.9%) | 0 (0.0%) |
| $300,000 to $499,999 | 4 (2.2%) | 0 (0.0%) |
| $500,000 to $749,999 | 0 (0.0%) | 0 (0.0%) |
| $750,000 to $999,999 | 0 (0.0%) | 0 (0.0%) |
| $1,000,000 or more | 0 (0.0%) | 0 (0.0%) |
| Total | 181 (100.0%) | 34 (100.0%) |
Household Income by Mortgage Status in Holiday Lakes
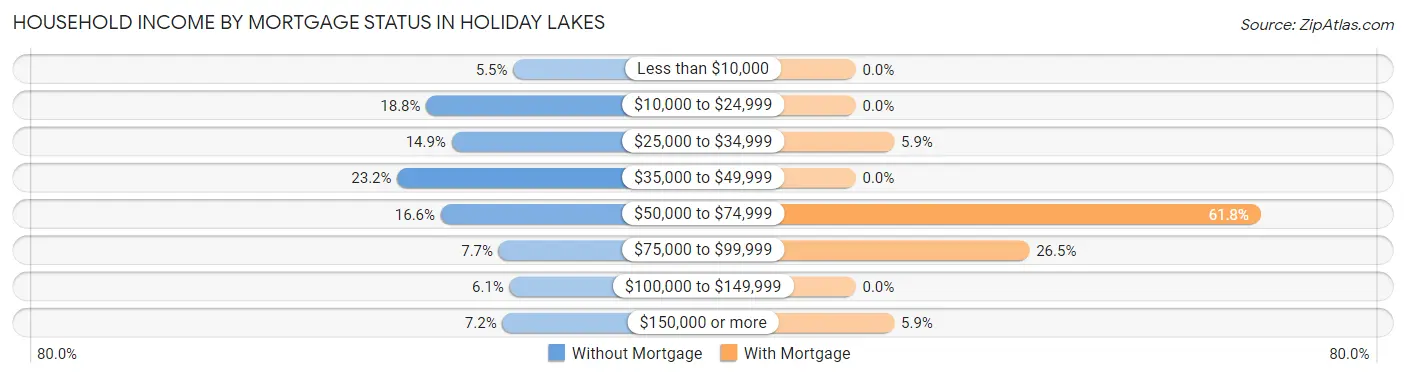
| Household Income | Without Mortgage | With Mortgage |
| Less than $10,000 | 10 (5.5%) | 0 (0.0%) |
| $10,000 to $24,999 | 34 (18.8%) | 0 (0.0%) |
| $25,000 to $34,999 | 27 (14.9%) | 2 (5.9%) |
| $35,000 to $49,999 | 42 (23.2%) | 0 (0.0%) |
| $50,000 to $74,999 | 30 (16.6%) | 21 (61.8%) |
| $75,000 to $99,999 | 14 (7.7%) | 9 (26.5%) |
| $100,000 to $149,999 | 11 (6.1%) | 0 (0.0%) |
| $150,000 or more | 13 (7.2%) | 2 (5.9%) |
| Total | 181 (100.0%) | 34 (100.0%) |
Property Value to Household Income Ratio in Holiday Lakes
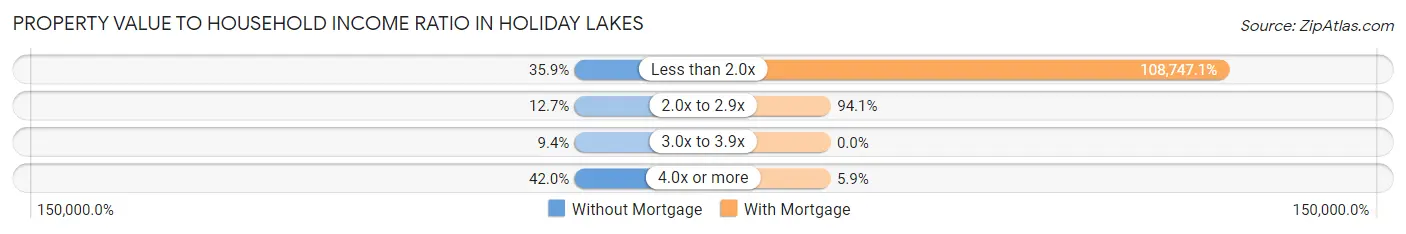
| Value-to-Income Ratio | Without Mortgage | With Mortgage |
| Less than 2.0x | 65 (35.9%) | 36,974 (108,747.1%) |
| 2.0x to 2.9x | 23 (12.7%) | 32 (94.1%) |
| 3.0x to 3.9x | 17 (9.4%) | 0 (0.0%) |
| 4.0x or more | 76 (42.0%) | 2 (5.9%) |
| Total | 181 (100.0%) | 34 (100.0%) |
Real Estate Taxes by Mortgage Status in Holiday Lakes
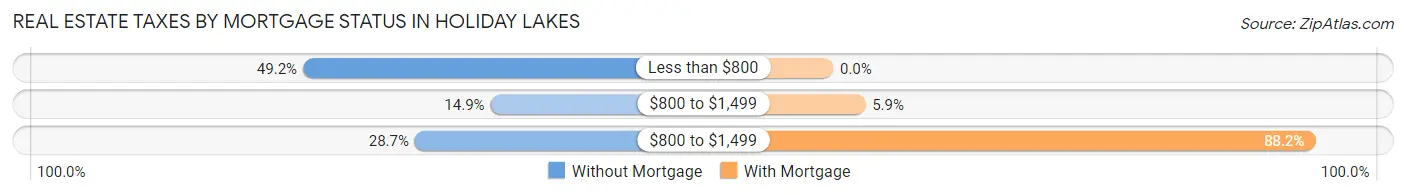
| Property Taxes | Without Mortgage | With Mortgage |
| Less than $800 | 89 (49.2%) | 0 (0.0%) |
| $800 to $1,499 | 27 (14.9%) | 2 (5.9%) |
| $800 to $1,499 | 52 (28.7%) | 30 (88.2%) |
| Total | 181 (100.0%) | 34 (100.0%) |
Health & Disability in Holiday Lakes
Health Insurance Coverage by Age in Holiday Lakes
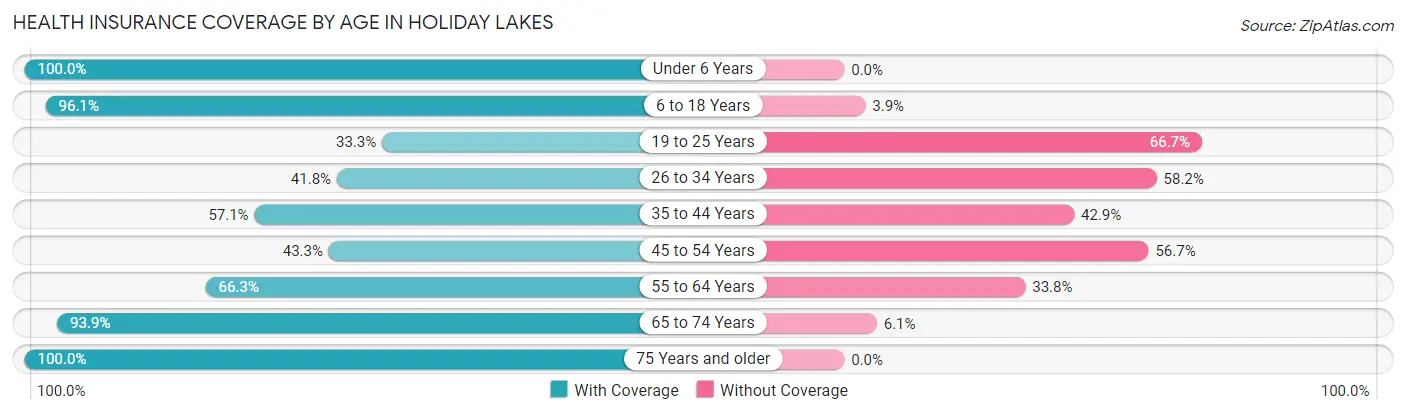
| Age Bracket | With Coverage | Without Coverage |
| Under 6 Years | 78 (100.0%) | 0 (0.0%) |
| 6 to 18 Years | 147 (96.1%) | 6 (3.9%) |
| 19 to 25 Years | 39 (33.3%) | 78 (66.7%) |
| 26 to 34 Years | 38 (41.8%) | 53 (58.2%) |
| 35 to 44 Years | 72 (57.1%) | 54 (42.9%) |
| 45 to 54 Years | 29 (43.3%) | 38 (56.7%) |
| 55 to 64 Years | 53 (66.2%) | 27 (33.8%) |
| 65 to 74 Years | 93 (93.9%) | 6 (6.1%) |
| 75 Years and older | 23 (100.0%) | 0 (0.0%) |
| Total | 572 (68.6%) | 262 (31.4%) |
Health Insurance Coverage by Citizenship Status in Holiday Lakes
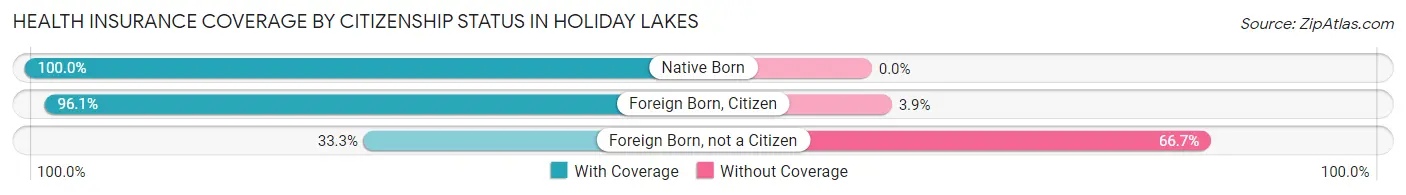
| Citizenship Status | With Coverage | Without Coverage |
| Native Born | 78 (100.0%) | 0 (0.0%) |
| Foreign Born, Citizen | 147 (96.1%) | 6 (3.9%) |
| Foreign Born, not a Citizen | 39 (33.3%) | 78 (66.7%) |
Health Insurance Coverage by Household Income in Holiday Lakes
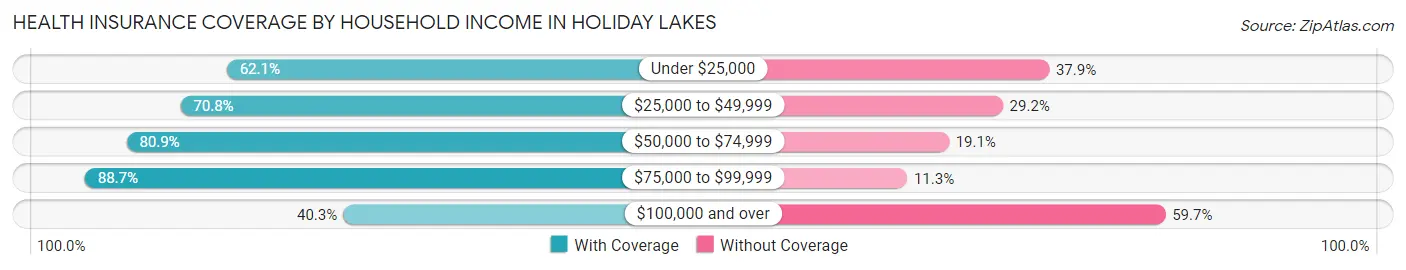
| Household Income | With Coverage | Without Coverage |
| Under $25,000 | 123 (62.1%) | 75 (37.9%) |
| $25,000 to $49,999 | 194 (70.8%) | 80 (29.2%) |
| $50,000 to $74,999 | 89 (80.9%) | 21 (19.1%) |
| $75,000 to $99,999 | 118 (88.7%) | 15 (11.3%) |
| $100,000 and over | 48 (40.3%) | 71 (59.7%) |
Public vs Private Health Insurance Coverage by Age in Holiday Lakes
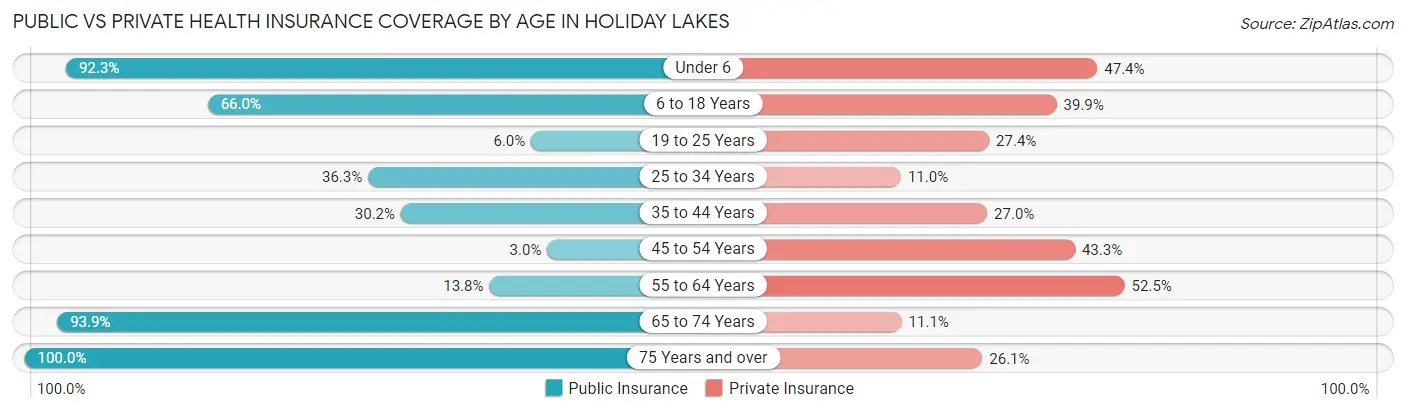
| Age Bracket | Public Insurance | Private Insurance |
| Under 6 | 72 (92.3%) | 37 (47.4%) |
| 6 to 18 Years | 101 (66.0%) | 61 (39.9%) |
| 19 to 25 Years | 7 (6.0%) | 32 (27.4%) |
| 25 to 34 Years | 33 (36.3%) | 10 (11.0%) |
| 35 to 44 Years | 38 (30.2%) | 34 (27.0%) |
| 45 to 54 Years | 2 (3.0%) | 29 (43.3%) |
| 55 to 64 Years | 11 (13.8%) | 42 (52.5%) |
| 65 to 74 Years | 93 (93.9%) | 11 (11.1%) |
| 75 Years and over | 23 (100.0%) | 6 (26.1%) |
| Total | 380 (45.6%) | 262 (31.4%) |
Disability Status by Sex by Age in Holiday Lakes
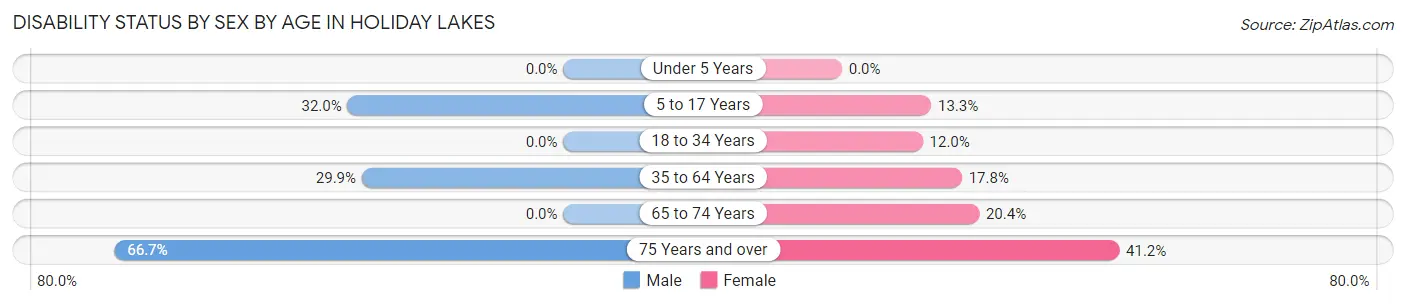
| Age Bracket | Male | Female |
| Under 5 Years | 0 (0.0%) | 0 (0.0%) |
| 5 to 17 Years | 33 (32.0%) | 11 (13.3%) |
| 18 to 34 Years | 0 (0.0%) | 12 (12.0%) |
| 35 to 64 Years | 38 (29.9%) | 26 (17.8%) |
| 65 to 74 Years | 0 (0.0%) | 11 (20.4%) |
| 75 Years and over | 4 (66.7%) | 7 (41.2%) |
Disability Class by Sex by Age in Holiday Lakes
Disability Class: Hearing Difficulty
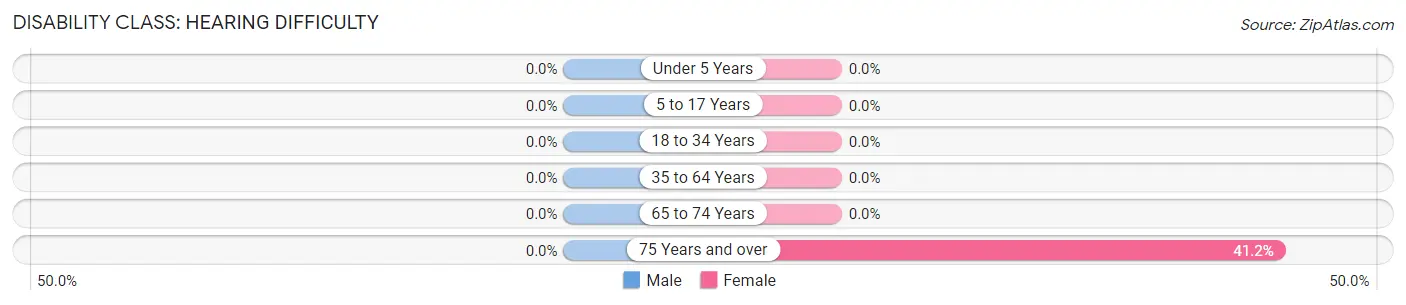
| Age Bracket | Male | Female |
| Under 5 Years | 0 (0.0%) | 0 (0.0%) |
| 5 to 17 Years | 0 (0.0%) | 0 (0.0%) |
| 18 to 34 Years | 0 (0.0%) | 0 (0.0%) |
| 35 to 64 Years | 0 (0.0%) | 0 (0.0%) |
| 65 to 74 Years | 0 (0.0%) | 0 (0.0%) |
| 75 Years and over | 0 (0.0%) | 7 (41.2%) |
Disability Class: Vision Difficulty
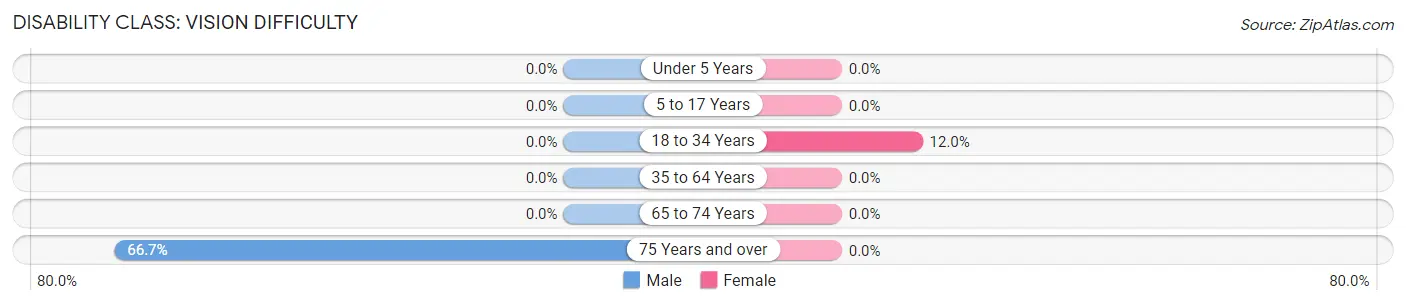
| Age Bracket | Male | Female |
| Under 5 Years | 0 (0.0%) | 0 (0.0%) |
| 5 to 17 Years | 0 (0.0%) | 0 (0.0%) |
| 18 to 34 Years | 0 (0.0%) | 12 (12.0%) |
| 35 to 64 Years | 0 (0.0%) | 0 (0.0%) |
| 65 to 74 Years | 0 (0.0%) | 0 (0.0%) |
| 75 Years and over | 4 (66.7%) | 0 (0.0%) |
Disability Class: Cognitive Difficulty
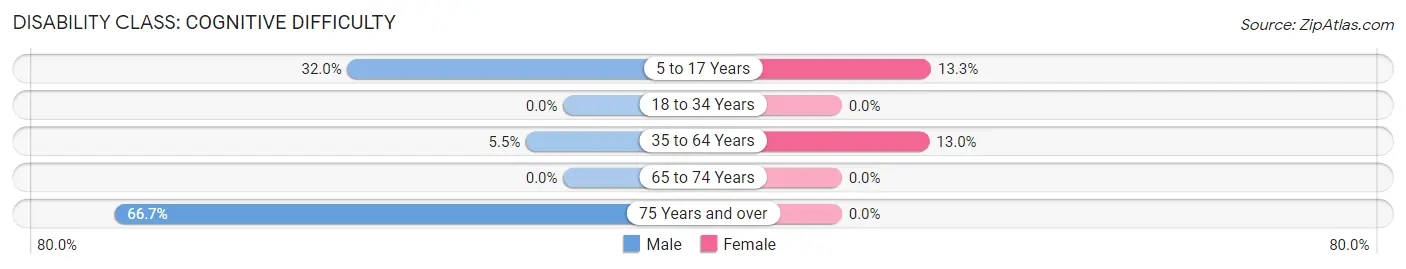
| Age Bracket | Male | Female |
| 5 to 17 Years | 33 (32.0%) | 11 (13.3%) |
| 18 to 34 Years | 0 (0.0%) | 0 (0.0%) |
| 35 to 64 Years | 7 (5.5%) | 19 (13.0%) |
| 65 to 74 Years | 0 (0.0%) | 0 (0.0%) |
| 75 Years and over | 4 (66.7%) | 0 (0.0%) |
Disability Class: Ambulatory Difficulty
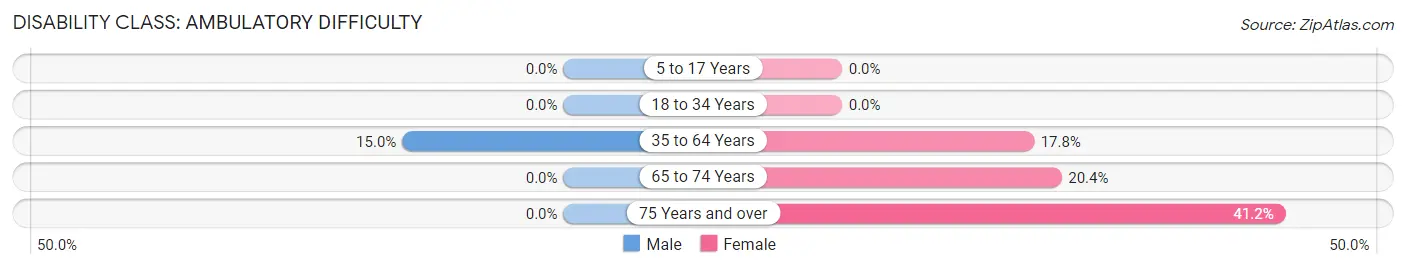
| Age Bracket | Male | Female |
| 5 to 17 Years | 0 (0.0%) | 0 (0.0%) |
| 18 to 34 Years | 0 (0.0%) | 0 (0.0%) |
| 35 to 64 Years | 19 (15.0%) | 26 (17.8%) |
| 65 to 74 Years | 0 (0.0%) | 11 (20.4%) |
| 75 Years and over | 0 (0.0%) | 7 (41.2%) |
Disability Class: Self-Care Difficulty
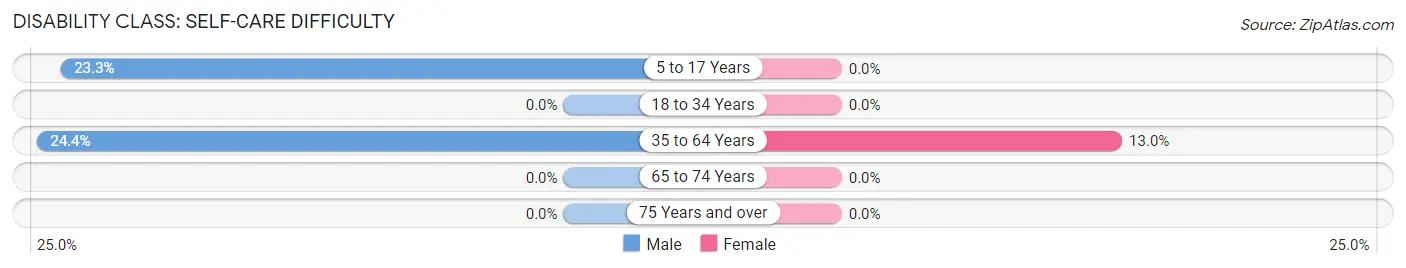
| Age Bracket | Male | Female |
| 5 to 17 Years | 24 (23.3%) | 0 (0.0%) |
| 18 to 34 Years | 0 (0.0%) | 0 (0.0%) |
| 35 to 64 Years | 31 (24.4%) | 19 (13.0%) |
| 65 to 74 Years | 0 (0.0%) | 0 (0.0%) |
| 75 Years and over | 0 (0.0%) | 0 (0.0%) |
Technology Access in Holiday Lakes
Computing Device Access in Holiday Lakes
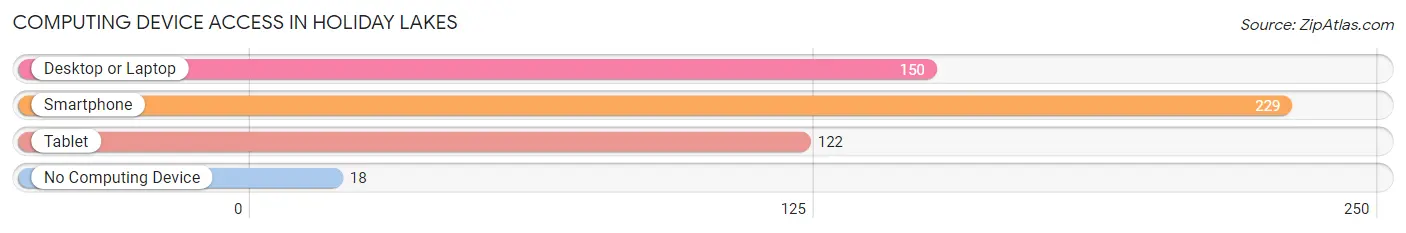
| Device Type | # Households | % Households |
| Desktop or Laptop | 150 | 56.8% |
| Smartphone | 229 | 86.7% |
| Tablet | 122 | 46.2% |
| No Computing Device | 18 | 6.8% |
| Total | 264 | 100.0% |
Internet Access in Holiday Lakes
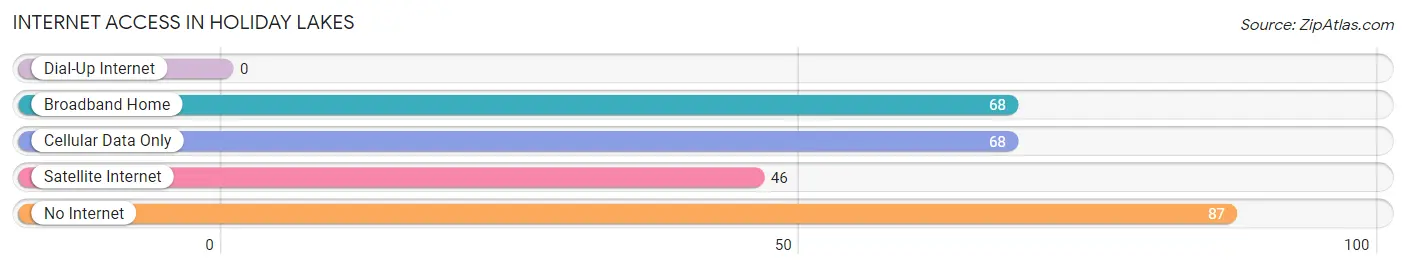
| Internet Type | # Households | % Households |
| Dial-Up Internet | 0 | 0.0% |
| Broadband Home | 68 | 25.8% |
| Cellular Data Only | 68 | 25.8% |
| Satellite Internet | 46 | 17.4% |
| No Internet | 87 | 33.0% |
| Total | 264 | 100.0% |
Holiday Lakes Summary
Holiday Lakes is a small unincorporated community located in Brazoria County, Texas, United States. It is situated along the Gulf Coast, approximately 30 miles south of Houston. The community is part of the Houston–The Woodlands–Sugar Land metropolitan area.
History
Holiday Lakes was founded in the early 1950s by a group of developers who wanted to create a vacation destination for Houstonians. The developers purchased a large tract of land and began to build a series of lakes, which they named Holiday Lakes. The lakes were stocked with fish and the area was developed with vacation homes, a marina, and a golf course.
The community grew steadily over the years and by the early 2000s, it had become a popular destination for vacationers and retirees. The community was incorporated in 2004 and has since become a popular destination for fishing, boating, and other outdoor activities.
Geography
Holiday Lakes is located in Brazoria County, Texas, approximately 30 miles south of Houston. The community is situated along the Gulf Coast and is bordered by the San Bernard River to the east and the Brazos River to the west. The area is characterized by flat terrain and is home to several small lakes, including Holiday Lakes, which is the largest.
The climate in Holiday Lakes is humid subtropical, with hot summers and mild winters. The average annual temperature is around 70°F (21°C). The average annual precipitation is around 50 inches (127 cm).
Economy
The economy of Holiday Lakes is largely based on tourism and recreation. The community is home to several marinas, golf courses, and other recreational facilities. There are also several restaurants and shops in the area.
The community is also home to several small businesses, including a boat repair shop, a bait and tackle shop, and a convenience store. The local economy is also supported by the nearby oil and gas industry.
Demographics
As of the 2010 census, the population of Holiday Lakes was 1,845. The racial makeup of the community was 79.3% White, 11.2% African American, 0.7% Native American, 0.7% Asian, and 6.9% from other races. Hispanic or Latino of any race were 16.2% of the population.
The median household income in Holiday Lakes was $45,938, and the median family income was $50,938. The per capita income was $20,938. About 11.2% of families and 14.2% of the population were below the poverty line.
Conclusion
Holiday Lakes is a small unincorporated community located in Brazoria County, Texas, United States. It is situated along the Gulf Coast, approximately 30 miles south of Houston. The community was founded in the early 1950s and has since become a popular destination for vacationers and retirees. The economy of Holiday Lakes is largely based on tourism and recreation, and the local economy is also supported by the nearby oil and gas industry. As of the 2010 census, the population of Holiday Lakes was 1,845. The racial makeup of the community was 79.3% White, 11.2% African American, 0.7% Native American, 0.7% Asian, and 6.9% from other races. Hispanic or Latino of any race were 16.2% of the population.
Common Questions
What is Per Capita Income in Holiday Lakes?
Per Capita income in Holiday Lakes is $18,547.
What is the Median Family Income in Holiday Lakes?
Median Family Income in Holiday Lakes is $36,350.
What is the Median Household income in Holiday Lakes?
Median Household Income in Holiday Lakes is $41,500.
What is Income or Wage Gap in Holiday Lakes?
Income or Wage Gap in Holiday Lakes is 41.0%.
Women in Holiday Lakes earn 59.0 cents for every dollar earned by a man.
What is Inequality or Gini Index in Holiday Lakes?
Inequality or Gini Index in Holiday Lakes is 0.42.
What is the Total Population of Holiday Lakes?
Total Population of Holiday Lakes is 834.
What is the Total Male Population of Holiday Lakes?
Total Male Population of Holiday Lakes is 407.
What is the Total Female Population of Holiday Lakes?
Total Female Population of Holiday Lakes is 427.
What is the Ratio of Males per 100 Females in Holiday Lakes?
There are 95.32 Males per 100 Females in Holiday Lakes.
What is the Ratio of Females per 100 Males in Holiday Lakes?
There are 104.91 Females per 100 Males in Holiday Lakes.
What is the Median Population Age in Holiday Lakes?
Median Population Age in Holiday Lakes is 32.2 Years.
What is the Average Family Size in Holiday Lakes
Average Family Size in Holiday Lakes is 3.5 People.
What is the Average Household Size in Holiday Lakes
Average Household Size in Holiday Lakes is 3.2 People.
How Large is the Labor Force in Holiday Lakes?
There are 331 People in the Labor Forcein in Holiday Lakes.
What is the Percentage of People in the Labor Force in Holiday Lakes?
52.7% of People are in the Labor Force in Holiday Lakes.
What is the Unemployment Rate in Holiday Lakes?
Unemployment Rate in Holiday Lakes is 6.6%.