Holiday Beach, TX Map & Demographics
Holiday Beach Map
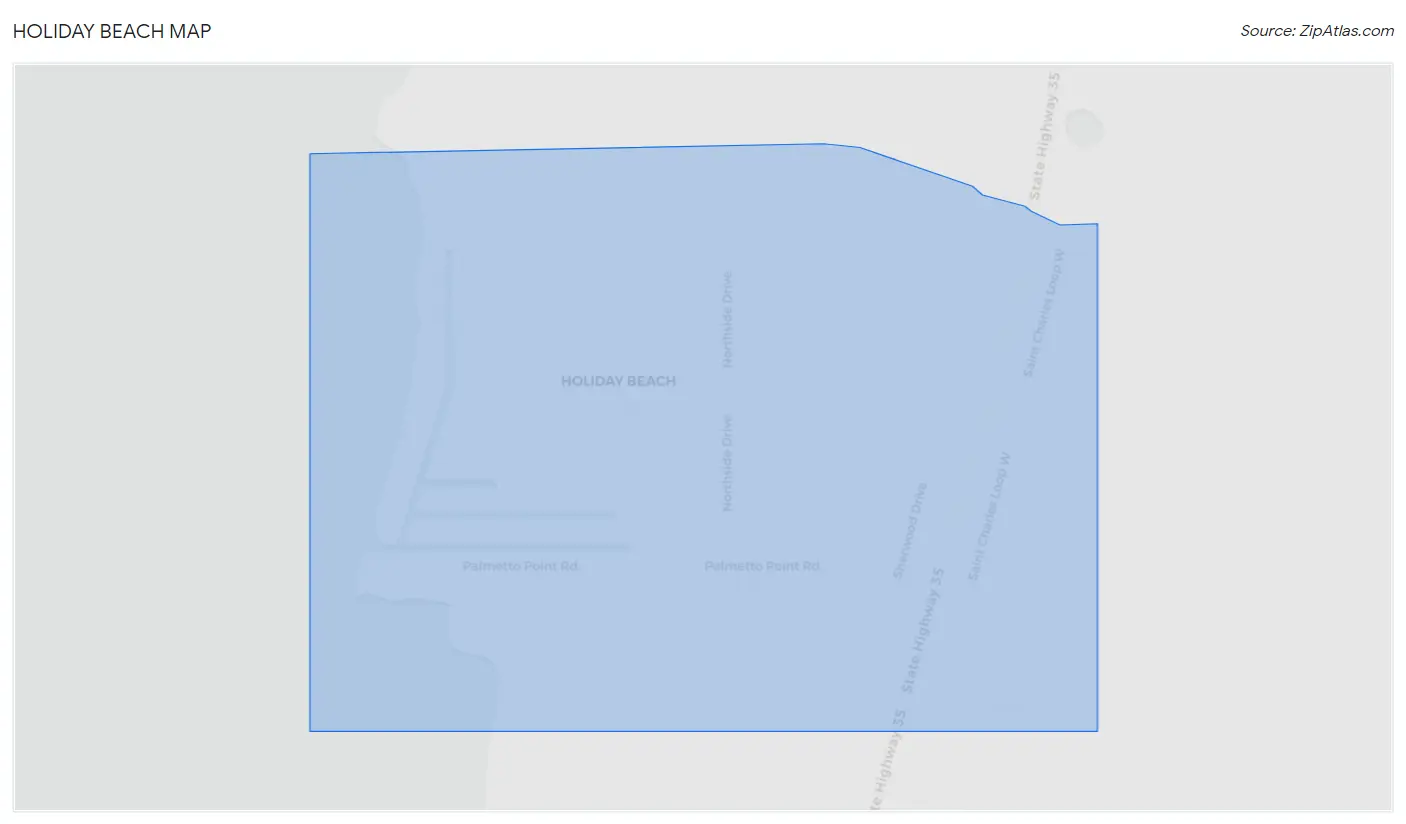
Holiday Beach Overview
$35,963
PER CAPITA INCOME
$96,579
AVG FAMILY INCOME
$95,066
AVG HOUSEHOLD INCOME
0.21
INEQUALITY / GINI INDEX
291
TOTAL POPULATION
131
MALE POPULATION
160
FEMALE POPULATION
81.88
MALES / 100 FEMALES
122.14
FEMALES / 100 MALES
52.5
MEDIAN AGE
2.3
AVG FAMILY SIZE
2.3
AVG HOUSEHOLD SIZE
105
LABOR FORCE [ PEOPLE ]
44.5%
PERCENT IN LABOR FORCE
18.1%
UNEMPLOYMENT RATE
Income in Holiday Beach
Income Overview in Holiday Beach
Per Capita Income in Holiday Beach is $35,963, while median incomes of families and households are $96,579 and $95,066 respectively.
| Characteristic | Number | Measure |
| Per Capita Income | 291 | $35,963 |
| Median Family Income | 102 | $96,579 |
| Mean Family Income | 102 | $98,206 |
| Median Household Income | 125 | $95,066 |
| Mean Household Income | 125 | $94,800 |
| Income Deficit | 102 | $0 |
| Wage / Income Gap (%) | 291 | 0.00% |
| Wage / Income Gap ($) | 291 | 100.00¢ per $1 |
| Gini / Inequality Index | 291 | 0.21 |
Earnings by Sex in Holiday Beach
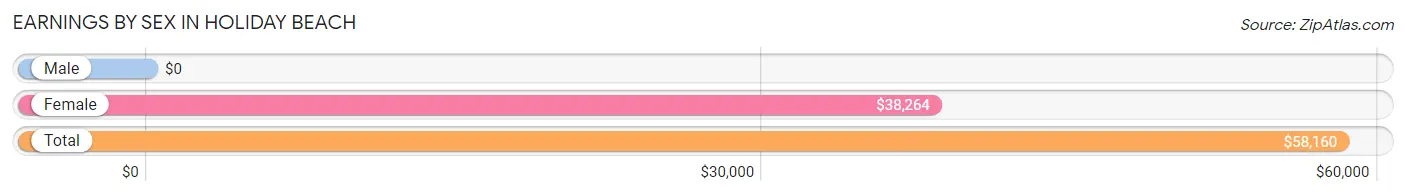
| Sex | Number | Average Earnings |
| Male | 66 (62.9%) | $0 |
| Female | 39 (37.1%) | $38,264 |
| Total | 105 (100.0%) | $58,160 |
Earnings by Sex by Income Bracket in Holiday Beach
The most common earnings brackets in Holiday Beach are $55,000 to $64,999 for men (36 | 54.5%) and $35,000 to $39,999 for women (18 | 46.2%).
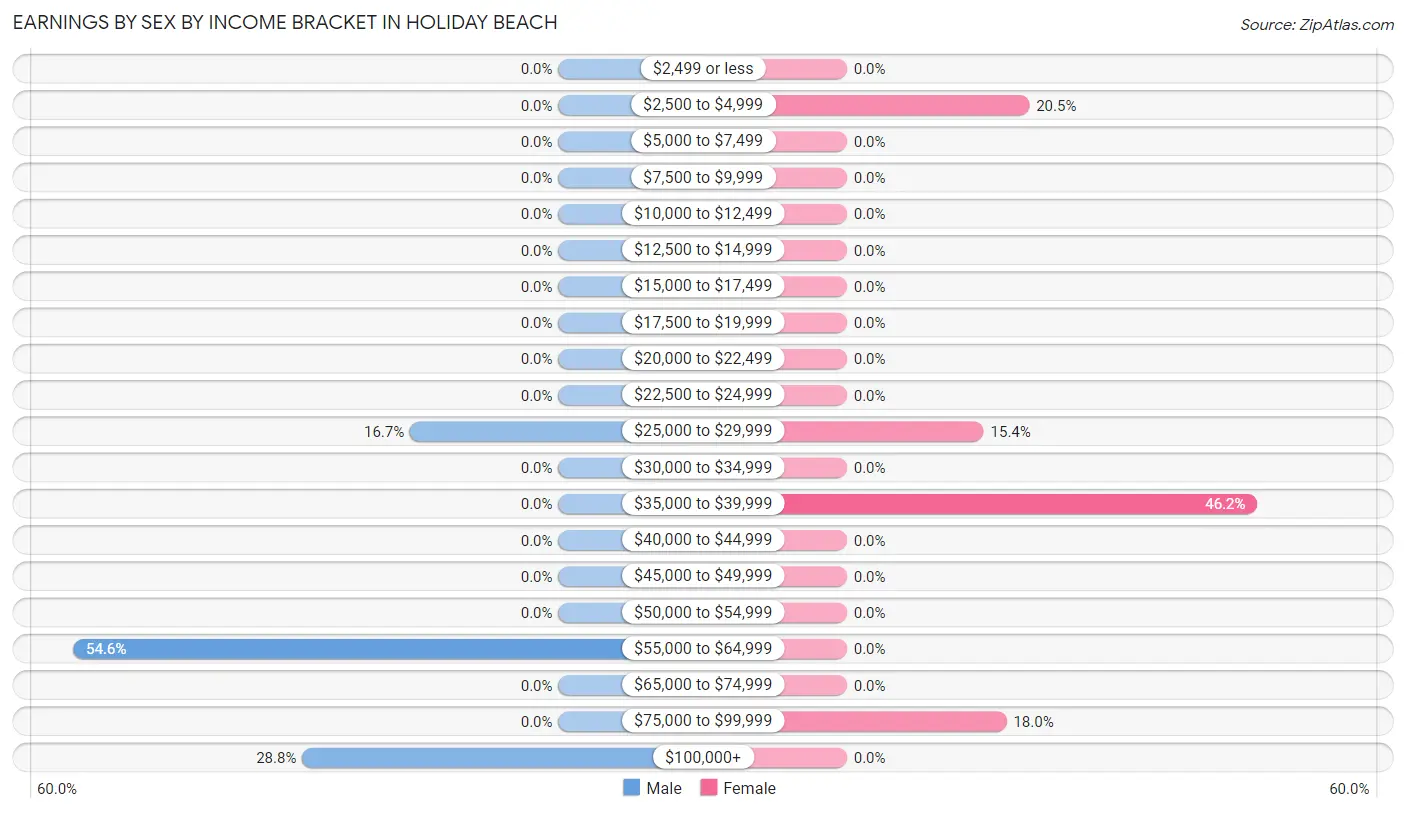
| Income | Male | Female |
| $2,499 or less | 0 (0.0%) | 0 (0.0%) |
| $2,500 to $4,999 | 0 (0.0%) | 8 (20.5%) |
| $5,000 to $7,499 | 0 (0.0%) | 0 (0.0%) |
| $7,500 to $9,999 | 0 (0.0%) | 0 (0.0%) |
| $10,000 to $12,499 | 0 (0.0%) | 0 (0.0%) |
| $12,500 to $14,999 | 0 (0.0%) | 0 (0.0%) |
| $15,000 to $17,499 | 0 (0.0%) | 0 (0.0%) |
| $17,500 to $19,999 | 0 (0.0%) | 0 (0.0%) |
| $20,000 to $22,499 | 0 (0.0%) | 0 (0.0%) |
| $22,500 to $24,999 | 0 (0.0%) | 0 (0.0%) |
| $25,000 to $29,999 | 11 (16.7%) | 6 (15.4%) |
| $30,000 to $34,999 | 0 (0.0%) | 0 (0.0%) |
| $35,000 to $39,999 | 0 (0.0%) | 18 (46.2%) |
| $40,000 to $44,999 | 0 (0.0%) | 0 (0.0%) |
| $45,000 to $49,999 | 0 (0.0%) | 0 (0.0%) |
| $50,000 to $54,999 | 0 (0.0%) | 0 (0.0%) |
| $55,000 to $64,999 | 36 (54.5%) | 0 (0.0%) |
| $65,000 to $74,999 | 0 (0.0%) | 0 (0.0%) |
| $75,000 to $99,999 | 0 (0.0%) | 7 (17.9%) |
| $100,000+ | 19 (28.8%) | 0 (0.0%) |
| Total | 66 (100.0%) | 39 (100.0%) |
Earnings by Sex by Educational Attainment in Holiday Beach
| Educational Attainment | Male Income | Female Income |
| Less than High School | - | - |
| High School Diploma | - | - |
| College or Associate's Degree | - | - |
| Bachelor's Degree | - | - |
| Graduate Degree | - | - |
| Total | - | - |
Family Income in Holiday Beach
Family Income Brackets in Holiday Beach
According to the Holiday Beach family income data, there are 33 families falling into the $50,000 to $74,999 income range, which is the most common income bracket and makes up 32.4% of all families.
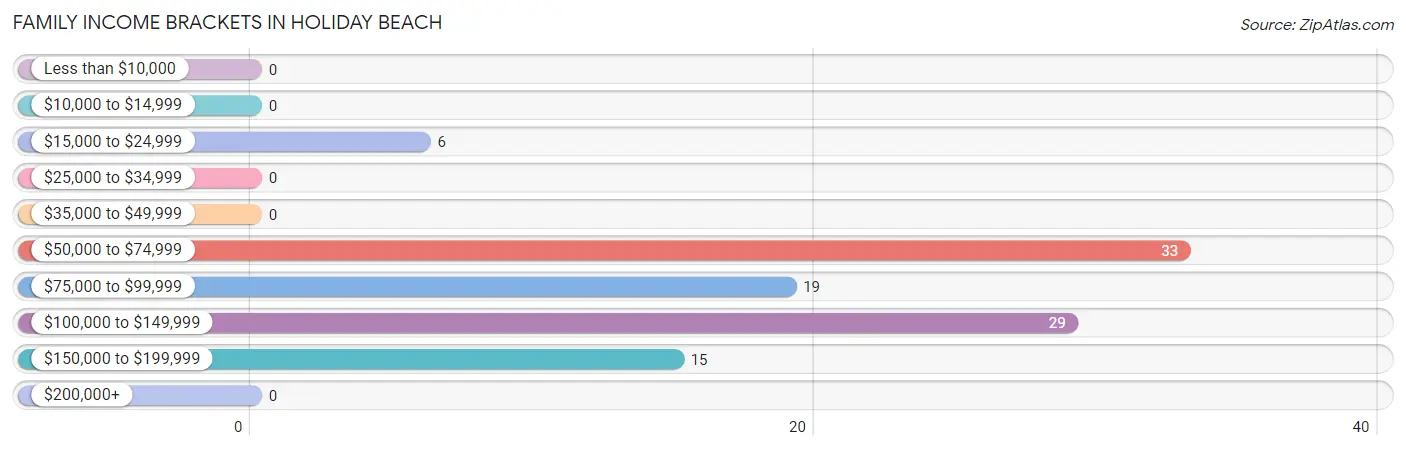
| Income Bracket | # Families | % Families |
| Less than $10,000 | 0 | 0.0% |
| $10,000 to $14,999 | 0 | 0.0% |
| $15,000 to $24,999 | 6 | 5.9% |
| $25,000 to $34,999 | 0 | 0.0% |
| $35,000 to $49,999 | 0 | 0.0% |
| $50,000 to $74,999 | 33 | 32.4% |
| $75,000 to $99,999 | 19 | 18.6% |
| $100,000 to $149,999 | 29 | 28.4% |
| $150,000 to $199,999 | 15 | 14.7% |
| $200,000+ | 0 | 0.0% |
Family Income by Famaliy Size in Holiday Beach
2-person families (76 | 74.5%) account for the highest median family income in Holiday Beach with $115,517 per family, while 2-person families (76 | 74.5%) have the highest median income of $57,758 per family member.
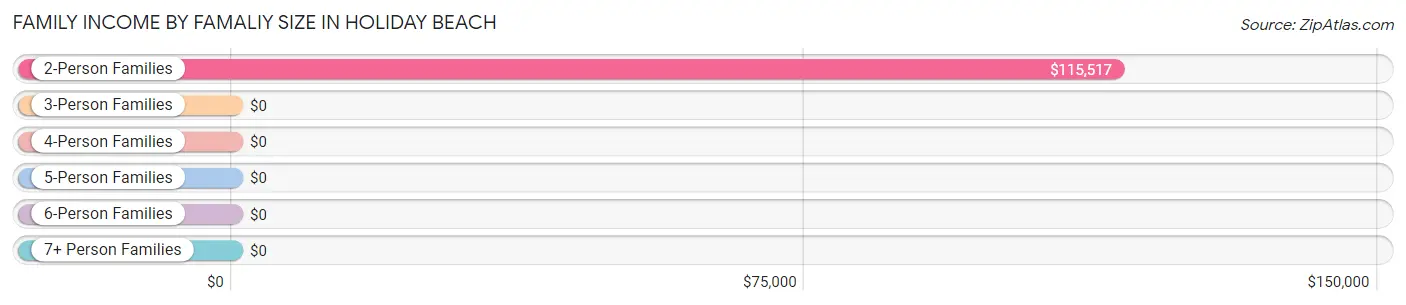
| Income Bracket | # Families | Median Income |
| 2-Person Families | 76 (74.5%) | $115,517 |
| 3-Person Families | 7 (6.9%) | $0 |
| 4-Person Families | 0 (0.0%) | $0 |
| 5-Person Families | 19 (18.6%) | $0 |
| 6-Person Families | 0 (0.0%) | $0 |
| 7+ Person Families | 0 (0.0%) | $0 |
| Total | 102 (100.0%) | $96,579 |
Family Income by Number of Earners in Holiday Beach
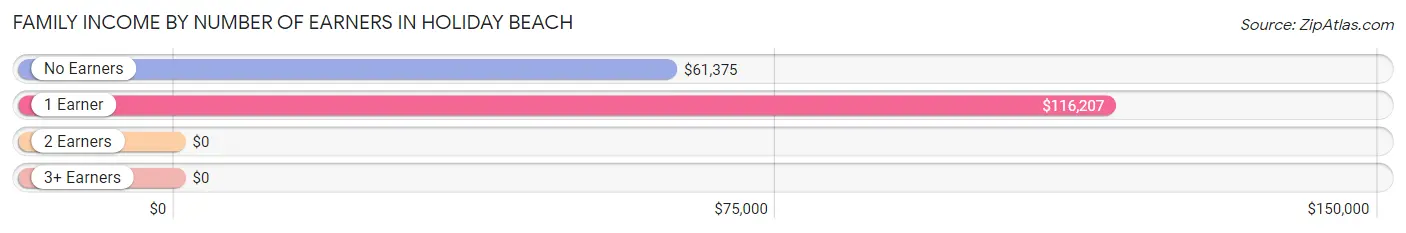
| Number of Earners | # Families | Median Income |
| No Earners | 23 (22.6%) | $61,375 |
| 1 Earner | 60 (58.8%) | $116,207 |
| 2 Earners | 19 (18.6%) | $0 |
| 3+ Earners | 0 (0.0%) | $0 |
| Total | 102 (100.0%) | $96,579 |
Household Income in Holiday Beach
Household Income Brackets in Holiday Beach
With 39 households falling in the category, the $50,000 to $74,999 income range is the most frequent in Holiday Beach, accounting for 31.2% of all households.
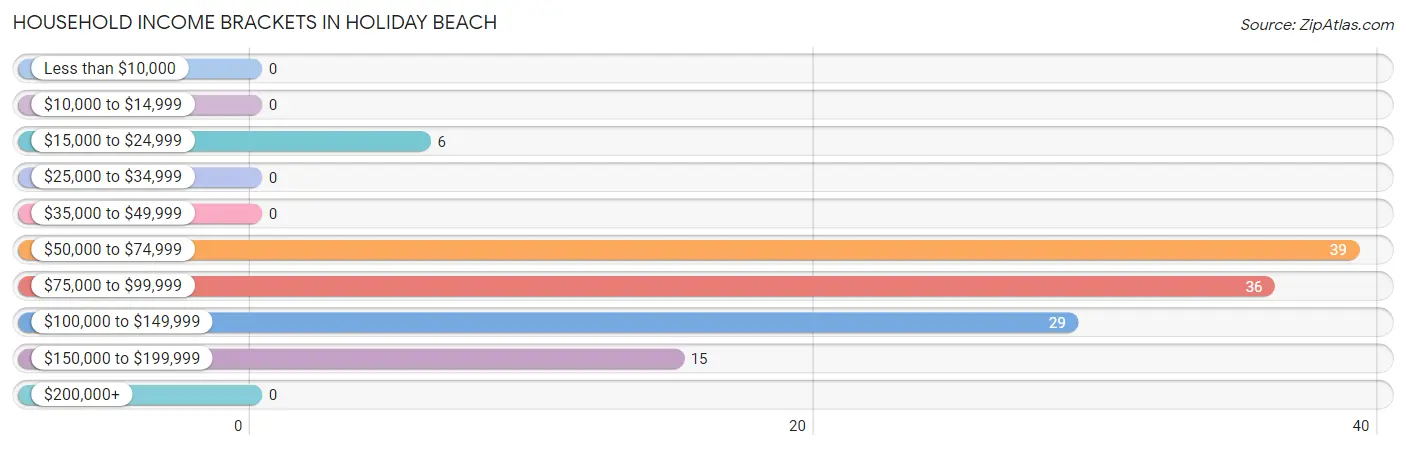
| Income Bracket | # Households | % Households |
| Less than $10,000 | 0 | 0.0% |
| $10,000 to $14,999 | 0 | 0.0% |
| $15,000 to $24,999 | 6 | 4.8% |
| $25,000 to $34,999 | 0 | 0.0% |
| $35,000 to $49,999 | 0 | 0.0% |
| $50,000 to $74,999 | 39 | 31.2% |
| $75,000 to $99,999 | 36 | 28.8% |
| $100,000 to $149,999 | 29 | 23.2% |
| $150,000 to $199,999 | 15 | 12.0% |
| $200,000+ | 0 | 0.0% |
Household Income by Householder Age in Holiday Beach
The median household income in Holiday Beach is $95,066, with the highest median household income of $95,658 found in the 45 to 64 years age bracket for the primary householder. A total of 58 households (46.4%) fall into this category.
| Income Bracket | # Households | Median Income |
| 15 to 24 Years | 0 (0.0%) | $0 |
| 25 to 44 Years | 0 (0.0%) | $0 |
| 45 to 64 Years | 58 (46.4%) | $95,658 |
| 65+ Years | 67 (53.6%) | $74,297 |
| Total | 125 (100.0%) | $95,066 |
Poverty in Holiday Beach
Income Below Poverty by Sex and Age in Holiday Beach
With 4.6% poverty level for males and 11.3% for females among the residents of Holiday Beach, 65 to 74 year old males and 35 to 44 year old females are the most vulnerable to poverty, with 6 males (27.3%) and 8 females (100.0%) in their respective age groups living below the poverty level.
| Age Bracket | Male | Female |
| Under 5 Years | 0 (0.0%) | 0 (0.0%) |
| 5 Years | 0 (0.0%) | 0 (0.0%) |
| 6 to 11 Years | 0 (0.0%) | 0 (0.0%) |
| 12 to 14 Years | 0 (0.0%) | 0 (0.0%) |
| 15 Years | 0 (0.0%) | 0 (0.0%) |
| 16 and 17 Years | 0 (0.0%) | 0 (0.0%) |
| 18 to 24 Years | 0 (0.0%) | 0 (0.0%) |
| 25 to 34 Years | 0 (0.0%) | 0 (0.0%) |
| 35 to 44 Years | 0 (0.0%) | 8 (100.0%) |
| 45 to 54 Years | 0 (0.0%) | 0 (0.0%) |
| 55 to 64 Years | 0 (0.0%) | 0 (0.0%) |
| 65 to 74 Years | 6 (27.3%) | 7 (36.8%) |
| 75 Years and over | 0 (0.0%) | 0 (0.0%) |
| Total | 6 (4.6%) | 15 (11.3%) |
Income Above Poverty by Sex and Age in Holiday Beach
According to the poverty statistics in Holiday Beach, males aged under 5 years and females aged 25 to 34 years are the age groups that are most secure financially, with 100.0% of males and 100.0% of females in these age groups living above the poverty line.
| Age Bracket | Male | Female |
| Under 5 Years | 28 (100.0%) | 0 (0.0%) |
| 5 Years | 0 (0.0%) | 0 (0.0%) |
| 6 to 11 Years | 0 (0.0%) | 0 (0.0%) |
| 12 to 14 Years | 0 (0.0%) | 0 (0.0%) |
| 15 Years | 0 (0.0%) | 0 (0.0%) |
| 16 and 17 Years | 0 (0.0%) | 0 (0.0%) |
| 18 to 24 Years | 0 (0.0%) | 0 (0.0%) |
| 25 to 34 Years | 11 (100.0%) | 14 (100.0%) |
| 35 to 44 Years | 2 (100.0%) | 0 (0.0%) |
| 45 to 54 Years | 36 (100.0%) | 28 (100.0%) |
| 55 to 64 Years | 26 (100.0%) | 25 (100.0%) |
| 65 to 74 Years | 16 (72.7%) | 12 (63.2%) |
| 75 Years and over | 6 (100.0%) | 39 (100.0%) |
| Total | 125 (95.4%) | 118 (88.7%) |
Income Below Poverty Among Married-Couple Families in Holiday Beach
The poverty statistics for married-couple families in Holiday Beach show that 8.2% or 6 of the total 73 families live below the poverty line. Families with no children have the highest poverty rate of 11.1%, comprising of 6 families. On the other hand, families with 1 or 2 children have the lowest poverty rate of 0.0%, which includes 0 families.
| Children | Above Poverty | Below Poverty |
| No Children | 48 (88.9%) | 6 (11.1%) |
| 1 or 2 Children | 19 (100.0%) | 0 (0.0%) |
| 3 or 4 Children | 0 (0.0%) | 0 (0.0%) |
| 5 or more Children | 0 (0.0%) | 0 (0.0%) |
| Total | 67 (91.8%) | 6 (8.2%) |
Income Below Poverty Among Single-Parent Households in Holiday Beach
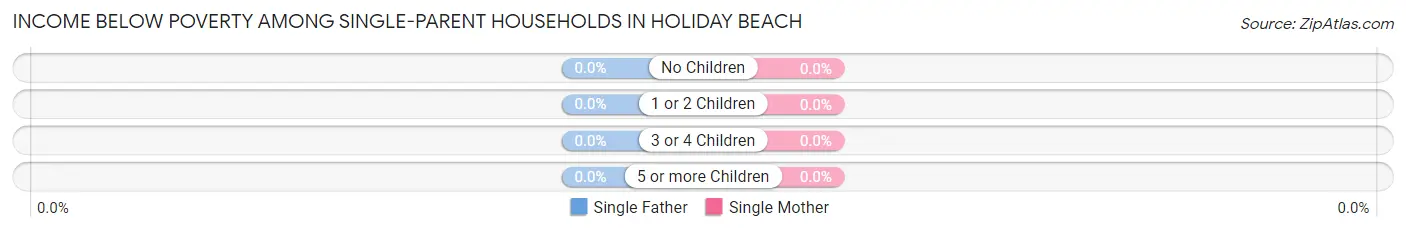
| Children | Single Father | Single Mother |
| No Children | 0 (0.0%) | 0 (0.0%) |
| 1 or 2 Children | 0 (0.0%) | 0 (0.0%) |
| 3 or 4 Children | 0 (0.0%) | 0 (0.0%) |
| 5 or more Children | 0 (0.0%) | 0 (0.0%) |
| Total | 0 (0.0%) | 0 (0.0%) |
Income Below Poverty Among Married-Couple vs Single-Parent Households in Holiday Beach
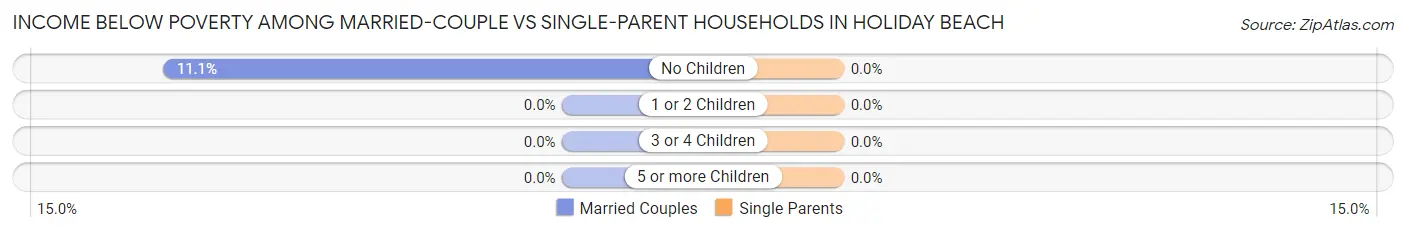
| Children | Married-Couple Families | Single-Parent Households |
| No Children | 6 (11.1%) | 0 (0.0%) |
| 1 or 2 Children | 0 (0.0%) | 0 (0.0%) |
| 3 or 4 Children | 0 (0.0%) | 0 (0.0%) |
| 5 or more Children | 0 (0.0%) | 0 (0.0%) |
| Total | 6 (8.2%) | 0 (0.0%) |
Race in Holiday Beach
The most populous races in Holiday Beach are , and White / Caucasian (291 | 100.0%).
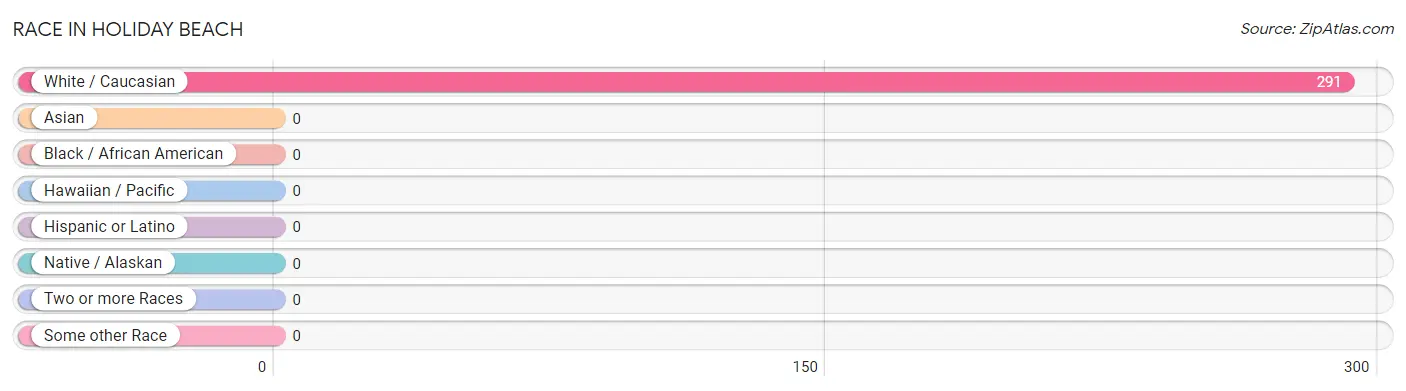
| Race | # Population | % Population |
| Asian | 0 | 0.0% |
| Black / African American | 0 | 0.0% |
| Hawaiian / Pacific | 0 | 0.0% |
| Hispanic or Latino | 0 | 0.0% |
| Native / Alaskan | 0 | 0.0% |
| White / Caucasian | 291 | 100.0% |
| Two or more Races | 0 | 0.0% |
| Some other Race | 0 | 0.0% |
| Total | 291 | 100.0% |
Ancestry in Holiday Beach
The most populous ancestries reported in Holiday Beach are American (51 | 17.5%), Irish (42 | 14.4%), English (15 | 5.1%), Scottish (15 | 5.1%), and British (7 | 2.4%), together accounting for 44.7% of all Holiday Beach residents.
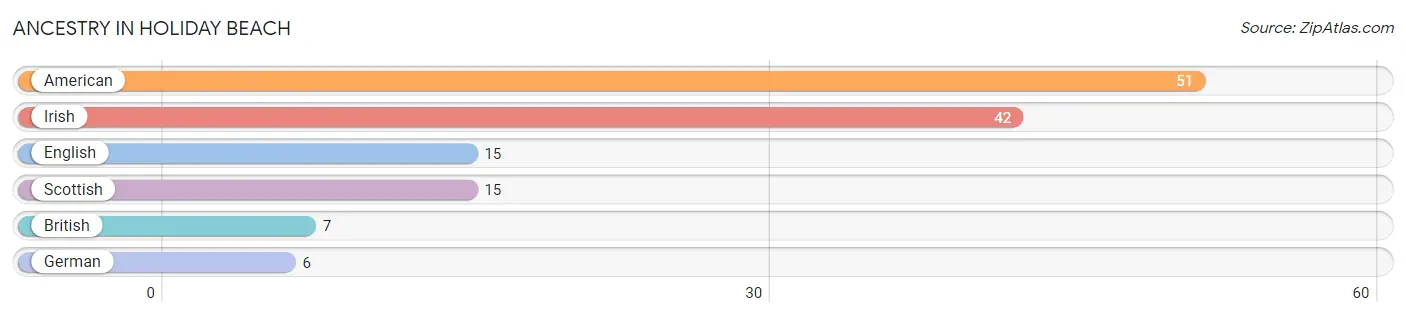
| Ancestry | # Population | % Population |
| American | 51 | 17.5% |
| British | 7 | 2.4% |
| English | 15 | 5.1% |
| German | 6 | 2.1% |
| Irish | 42 | 14.4% |
| Scottish | 15 | 5.1% | View All 6 Rows |
Immigrants in Holiday Beach

| Immigration Origin | # Population | % Population | View All 0 Rows |
Sex and Age in Holiday Beach
Sex and Age in Holiday Beach
The most populous age groups in Holiday Beach are Under 5 Years (28 | 21.4%) for men and 85 Years and over (29 | 18.1%) for women.
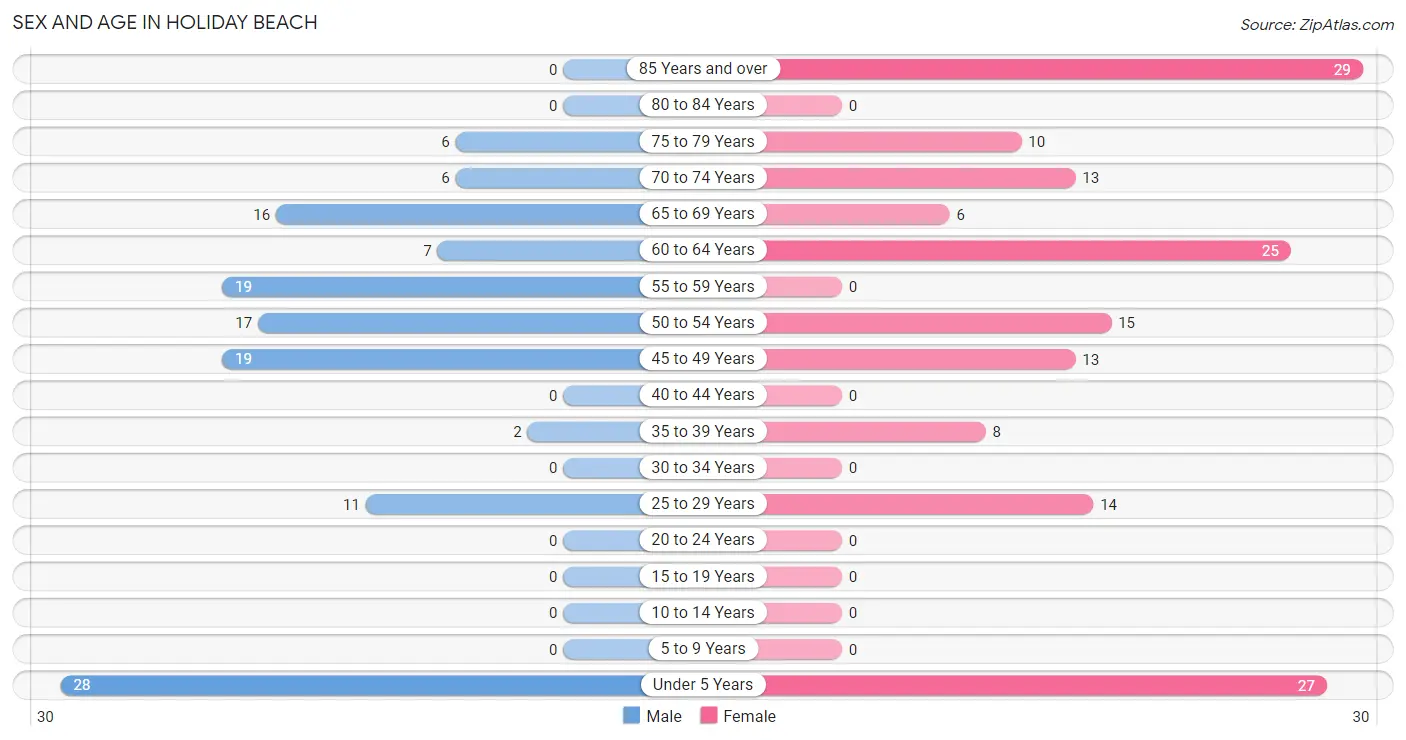
| Age Bracket | Male | Female |
| Under 5 Years | 28 (21.4%) | 27 (16.9%) |
| 5 to 9 Years | 0 (0.0%) | 0 (0.0%) |
| 10 to 14 Years | 0 (0.0%) | 0 (0.0%) |
| 15 to 19 Years | 0 (0.0%) | 0 (0.0%) |
| 20 to 24 Years | 0 (0.0%) | 0 (0.0%) |
| 25 to 29 Years | 11 (8.4%) | 14 (8.7%) |
| 30 to 34 Years | 0 (0.0%) | 0 (0.0%) |
| 35 to 39 Years | 2 (1.5%) | 8 (5.0%) |
| 40 to 44 Years | 0 (0.0%) | 0 (0.0%) |
| 45 to 49 Years | 19 (14.5%) | 13 (8.1%) |
| 50 to 54 Years | 17 (13.0%) | 15 (9.4%) |
| 55 to 59 Years | 19 (14.5%) | 0 (0.0%) |
| 60 to 64 Years | 7 (5.3%) | 25 (15.6%) |
| 65 to 69 Years | 16 (12.2%) | 6 (3.7%) |
| 70 to 74 Years | 6 (4.6%) | 13 (8.1%) |
| 75 to 79 Years | 6 (4.6%) | 10 (6.2%) |
| 80 to 84 Years | 0 (0.0%) | 0 (0.0%) |
| 85 Years and over | 0 (0.0%) | 29 (18.1%) |
| Total | 131 (100.0%) | 160 (100.0%) |
Families and Households in Holiday Beach
Median Family Size in Holiday Beach
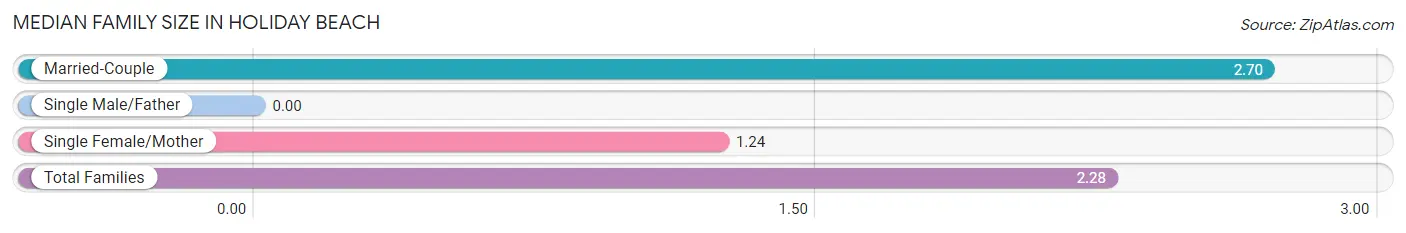
| Family Type | # Families | Family Size |
| Married-Couple | 73 (71.6%) | 2.70 |
| Single Male/Father | 0 (0.0%) | - |
| Single Female/Mother | 29 (28.4%) | 1.24 |
| Total Families | 102 (100.0%) | 2.28 |
Median Household Size in Holiday Beach
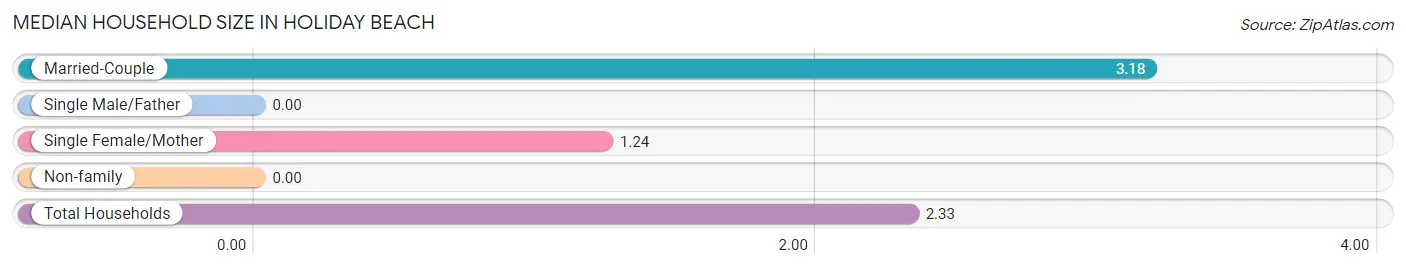
| Household Type | # Households | Household Size |
| Married-Couple | 73 (58.4%) | 3.18 |
| Single Male/Father | 0 (0.0%) | - |
| Single Female/Mother | 29 (23.2%) | 1.24 |
| Non-family | 23 (18.4%) | - |
| Total Households | 125 (100.0%) | 2.33 |
Household Size by Marriage Status in Holiday Beach
Out of a total of 125 households in Holiday Beach, 102 (81.6%) are family households, while 23 (18.4%) are nonfamily households. The most numerous type of family households are 2-person households, comprising 61, and the most common type of nonfamily households are 1-person households, comprising 23.
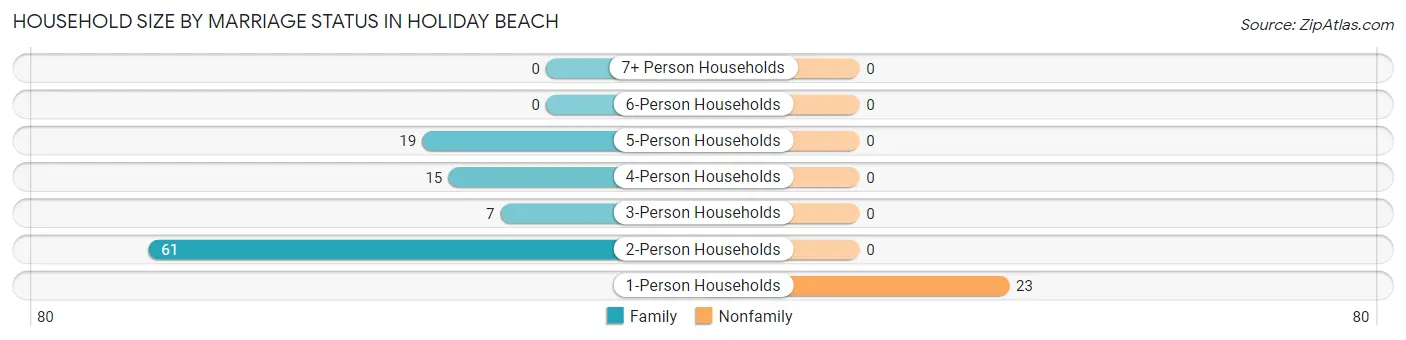
| Household Size | Family Households | Nonfamily Households |
| 1-Person Households | - | 23 (18.4%) |
| 2-Person Households | 61 (48.8%) | 0 (0.0%) |
| 3-Person Households | 7 (5.6%) | 0 (0.0%) |
| 4-Person Households | 15 (12.0%) | 0 (0.0%) |
| 5-Person Households | 19 (15.2%) | 0 (0.0%) |
| 6-Person Households | 0 (0.0%) | 0 (0.0%) |
| 7+ Person Households | 0 (0.0%) | 0 (0.0%) |
| Total | 102 (81.6%) | 23 (18.4%) |
Female Fertility in Holiday Beach
Fertility by Age in Holiday Beach
Average fertility rate in Holiday Beach is 229.0 births per 1,000 women. Women in the age bracket of 35 to 50 years have the highest fertility rate with 381.0 births per 1,000 women. Women in the age bracket of 35 to 50 years acount for 100.0% of all women with births.
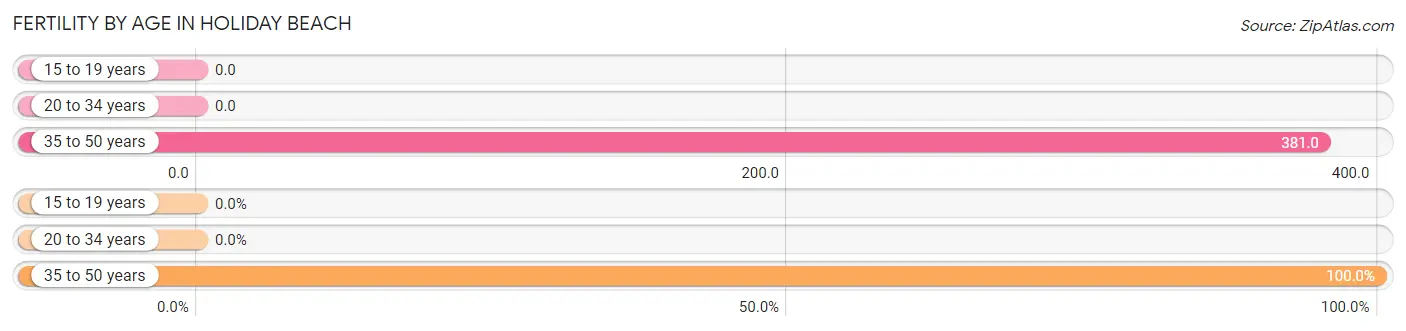
| Age Bracket | Women with Births | Births / 1,000 Women |
| 15 to 19 years | 0 (0.0%) | 0.0 |
| 20 to 34 years | 0 (0.0%) | 0.0 |
| 35 to 50 years | 8 (100.0%) | 381.0 |
| Total | 8 (100.0%) | 229.0 |
Fertility by Age by Marriage Status in Holiday Beach
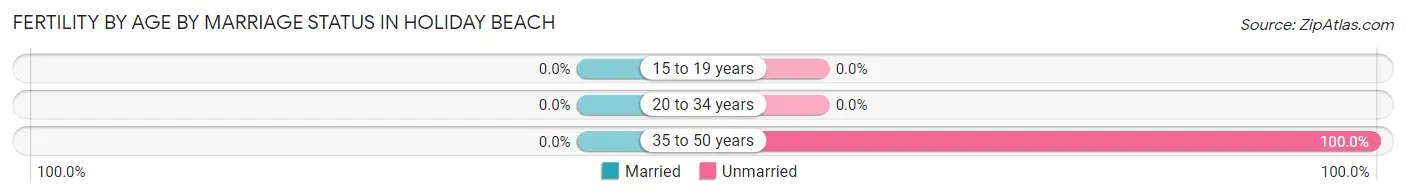
| Age Bracket | Married | Unmarried |
| 15 to 19 years | 0 (0.0%) | 0 (0.0%) |
| 20 to 34 years | 0 (0.0%) | 0 (0.0%) |
| 35 to 50 years | 0 (0.0%) | 8 (100.0%) |
| Total | 0 (0.0%) | 8 (100.0%) |
Fertility by Education in Holiday Beach
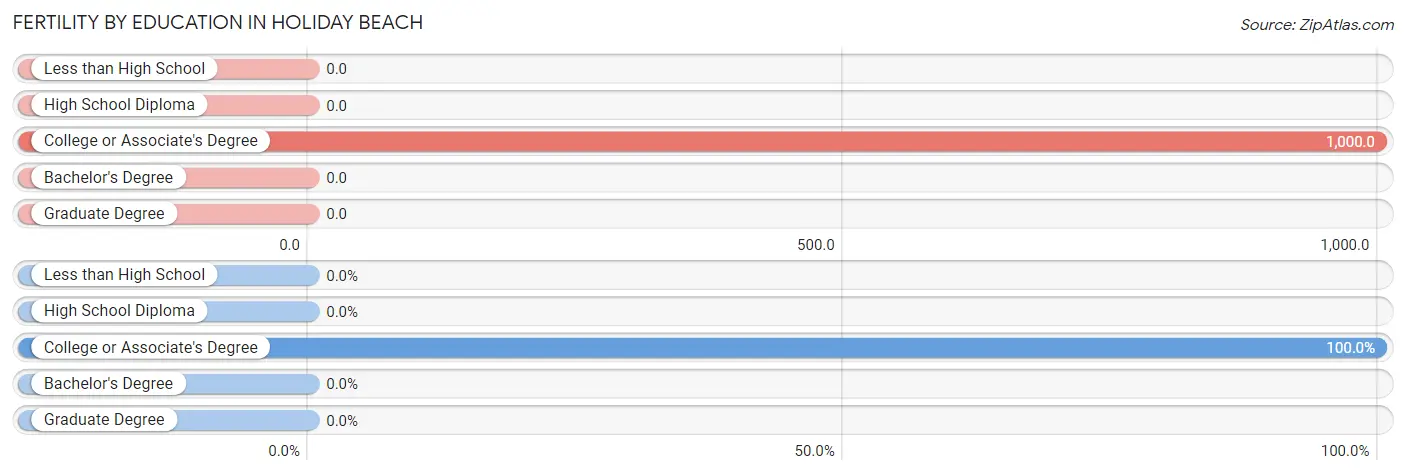
| Educational Attainment | Women with Births | Births / 1,000 Women |
| Less than High School | 0 (0.0%) | 0.0 |
| High School Diploma | 0 (0.0%) | 0.0 |
| College or Associate's Degree | 8 (100.0%) | 1,000.0 |
| Bachelor's Degree | 0 (0.0%) | 0.0 |
| Graduate Degree | 0 (0.0%) | 0.0 |
| Total | 8 (100.0%) | 229.0 |
Fertility by Education by Marriage Status in Holiday Beach
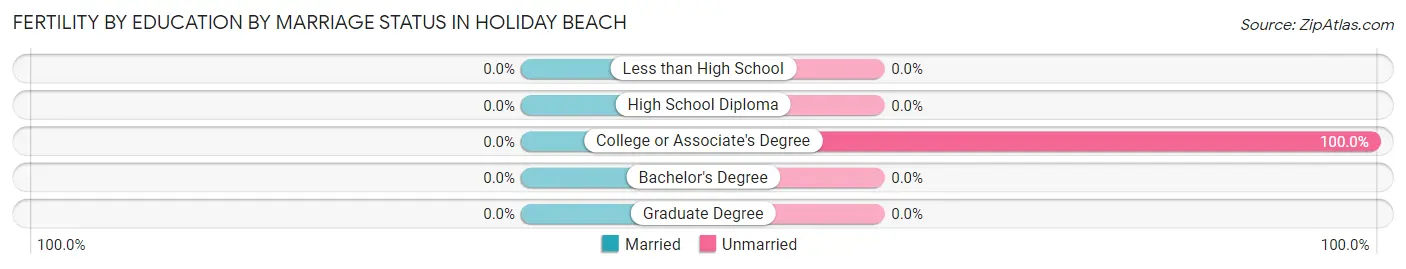
| Educational Attainment | Married | Unmarried |
| Less than High School | 0 (0.0%) | 0 (0.0%) |
| High School Diploma | 0 (0.0%) | 0 (0.0%) |
| College or Associate's Degree | 0 (0.0%) | 8 (100.0%) |
| Bachelor's Degree | 0 (0.0%) | 0 (0.0%) |
| Graduate Degree | 0 (0.0%) | 0 (0.0%) |
| Total | 0 (0.0%) | 8 (100.0%) |
Employment Characteristics in Holiday Beach
Employment by Class of Employer in Holiday Beach
Among the 86 employed individuals in Holiday Beach, private company employees (63 | 73.3%), not-for-profit organizations (17 | 19.8%), and state government employees (6 | 7.0%) make up the most common classes of employment.
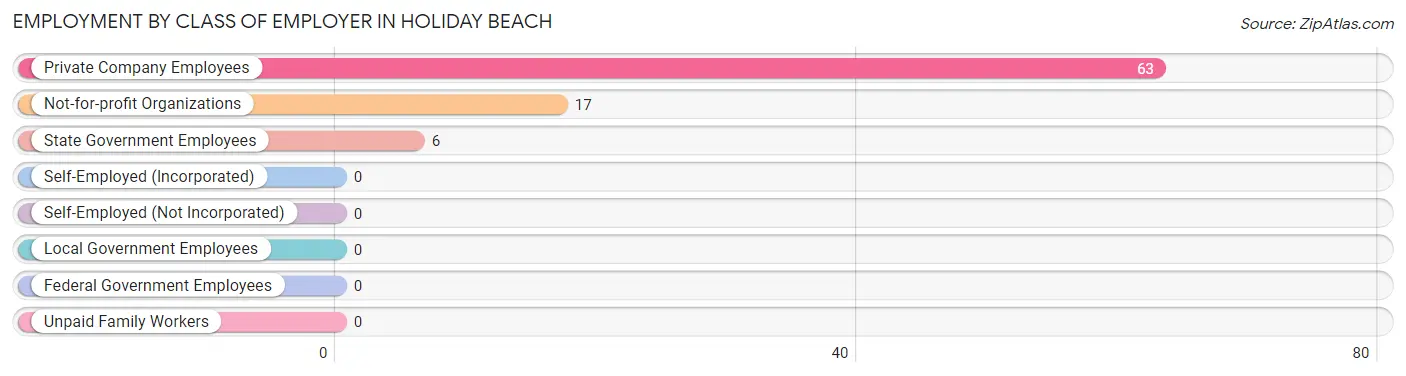
| Employer Class | # Employees | % Employees |
| Private Company Employees | 63 | 73.3% |
| Self-Employed (Incorporated) | 0 | 0.0% |
| Self-Employed (Not Incorporated) | 0 | 0.0% |
| Not-for-profit Organizations | 17 | 19.8% |
| Local Government Employees | 0 | 0.0% |
| State Government Employees | 6 | 7.0% |
| Federal Government Employees | 0 | 0.0% |
| Unpaid Family Workers | 0 | 0.0% |
| Total | 86 | 100.0% |
Employment Status by Age in Holiday Beach
According to the labor force statistics for Holiday Beach, out of the total population over 16 years of age (236), 44.5% or 105 individuals are in the labor force, with 18.1% or 19 of them unemployed. The age group with the highest labor force participation rate is 55 to 59 years, with 100.0% or 19 individuals in the labor force. Within the labor force, the 45 to 54 years age range has the highest percentage of unemployed individuals, with 52.8% or 19 of them being unemployed.
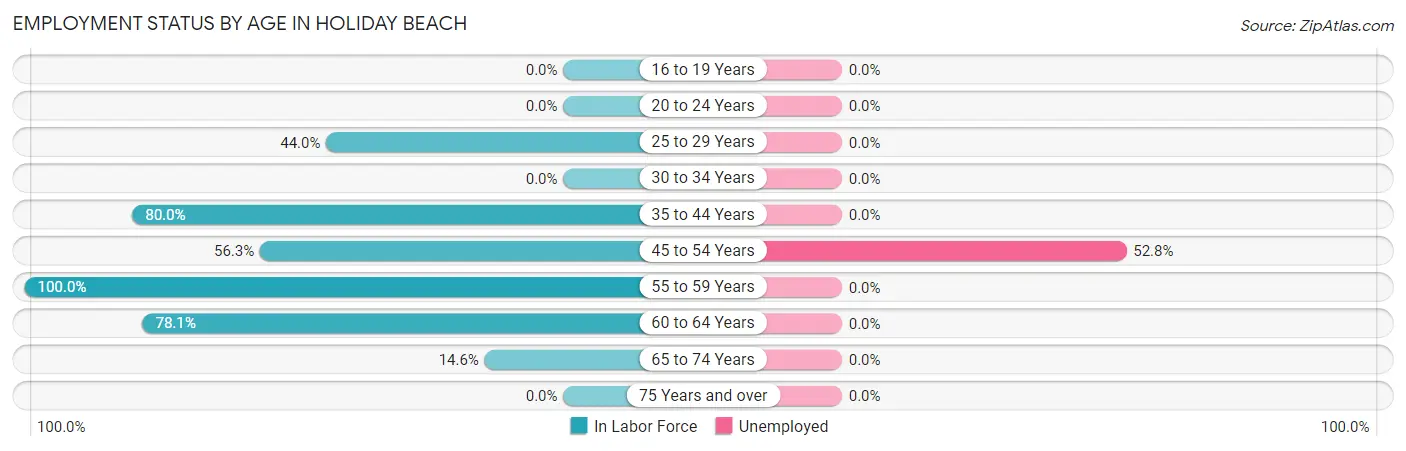
| Age Bracket | In Labor Force | Unemployed |
| 16 to 19 Years | 0 (0.0%) | 0 (0.0%) |
| 20 to 24 Years | 0 (0.0%) | 0 (0.0%) |
| 25 to 29 Years | 11 (44.0%) | 0 (0.0%) |
| 30 to 34 Years | 0 (0.0%) | 0 (0.0%) |
| 35 to 44 Years | 8 (80.0%) | 0 (0.0%) |
| 45 to 54 Years | 36 (56.3%) | 19 (52.8%) |
| 55 to 59 Years | 19 (100.0%) | 0 (0.0%) |
| 60 to 64 Years | 25 (78.1%) | 0 (0.0%) |
| 65 to 74 Years | 6 (14.6%) | 0 (0.0%) |
| 75 Years and over | 0 (0.0%) | 0 (0.0%) |
| Total | 105 (44.5%) | 19 (18.1%) |
Employment Status by Educational Attainment in Holiday Beach
According to labor force statistics for Holiday Beach, 66.0% of individuals (99) out of the total population between 25 and 64 years of age (150) are in the labor force, with 19.2% or 19 of them being unemployed. The group with the highest labor force participation rate are those with the educational attainment of college / associate degree, with 84.2% or 80 individuals in the labor force. Within the labor force, individuals with college / associate degree education have the highest percentage of unemployment, with 23.8% or 19 of them being unemployed.
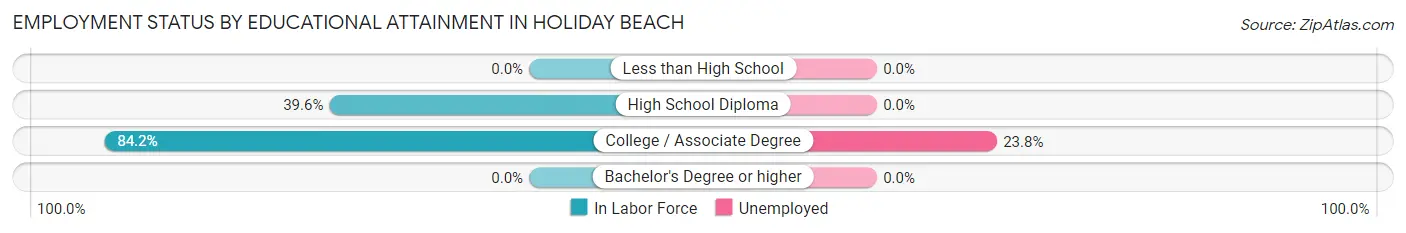
| Educational Attainment | In Labor Force | Unemployed |
| Less than High School | 0 (0.0%) | 0 (0.0%) |
| High School Diploma | 19 (39.6%) | 0 (0.0%) |
| College / Associate Degree | 80 (84.2%) | 23 (23.8%) |
| Bachelor's Degree or higher | 0 (0.0%) | 0 (0.0%) |
| Total | 99 (66.0%) | 29 (19.2%) |
Employment Occupations by Sex in Holiday Beach
Management, Business, Science and Arts Occupations
The most common Management, Business, Science and Arts occupations in Holiday Beach are Computers, Engineering & Science (18 | 20.9%), Computers & Mathematics (11 | 12.8%), Architecture & Engineering (7 | 8.1%), Community & Social Service (6 | 7.0%), and Education Instruction & Library (6 | 7.0%).
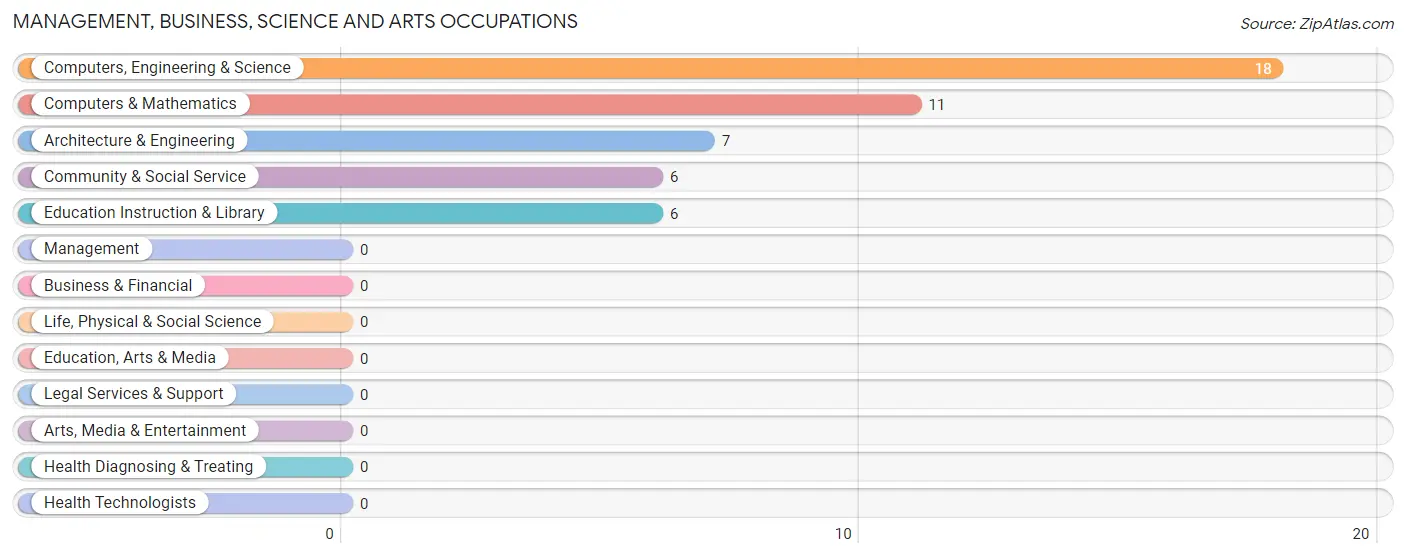
Management, Business, Science and Arts Occupations by Sex
Within the Management, Business, Science and Arts occupations in Holiday Beach, the most male-oriented occupations are Computers & Mathematics (100.0%), and Computers, Engineering & Science (61.1%), while the most female-oriented occupations are Architecture & Engineering (100.0%), Community & Social Service (100.0%), and Education Instruction & Library (100.0%).
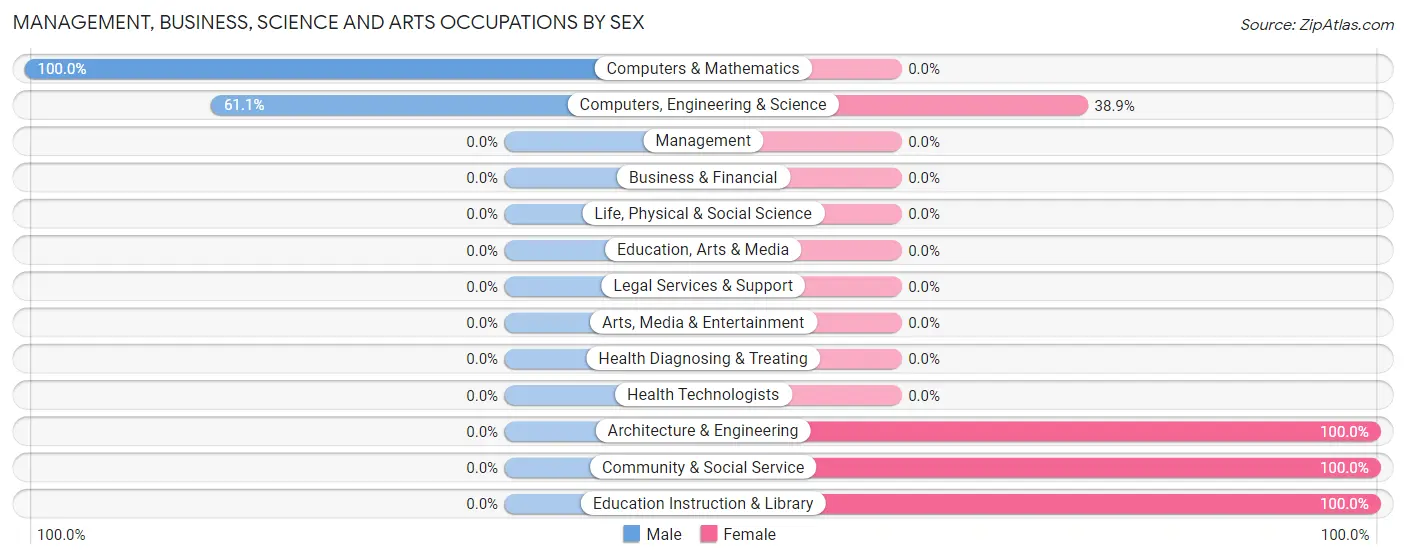
| Occupation | Male | Female |
| Management | 0 (0.0%) | 0 (0.0%) |
| Business & Financial | 0 (0.0%) | 0 (0.0%) |
| Computers, Engineering & Science | 11 (61.1%) | 7 (38.9%) |
| Computers & Mathematics | 11 (100.0%) | 0 (0.0%) |
| Architecture & Engineering | 0 (0.0%) | 7 (100.0%) |
| Life, Physical & Social Science | 0 (0.0%) | 0 (0.0%) |
| Community & Social Service | 0 (0.0%) | 6 (100.0%) |
| Education, Arts & Media | 0 (0.0%) | 0 (0.0%) |
| Legal Services & Support | 0 (0.0%) | 0 (0.0%) |
| Education Instruction & Library | 0 (0.0%) | 6 (100.0%) |
| Arts, Media & Entertainment | 0 (0.0%) | 0 (0.0%) |
| Health Diagnosing & Treating | 0 (0.0%) | 0 (0.0%) |
| Health Technologists | 0 (0.0%) | 0 (0.0%) |
| Total (Category) | 11 (45.8%) | 13 (54.2%) |
| Total (Overall) | 47 (54.6%) | 39 (45.4%) |
Services Occupations
Services Occupations by Sex
| Occupation | Male | Female |
| Healthcare Support | 0 (0.0%) | 0 (0.0%) |
| Security & Protection | 0 (0.0%) | 0 (0.0%) |
| Firefighting & Prevention | 0 (0.0%) | 0 (0.0%) |
| Law Enforcement | 0 (0.0%) | 0 (0.0%) |
| Food Preparation & Serving | 0 (0.0%) | 0 (0.0%) |
| Cleaning & Maintenance | 0 (0.0%) | 0 (0.0%) |
| Personal Care & Service | 0 (0.0%) | 0 (0.0%) |
| Total (Category) | 0 (0.0%) | 0 (0.0%) |
| Total (Overall) | 47 (54.6%) | 39 (45.4%) |
Sales and Office Occupations
The most common Sales and Office occupations in Holiday Beach are , and Sales & Related (8 | 9.3%).
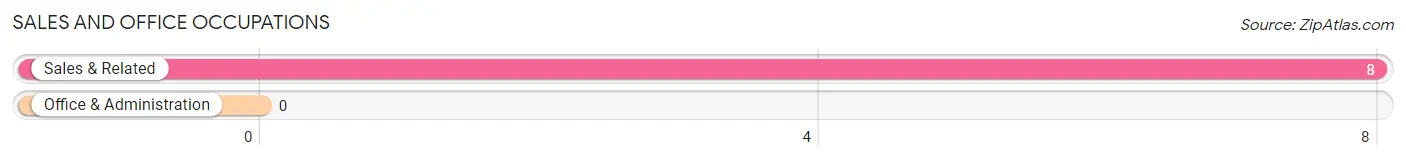
Sales and Office Occupations by Sex
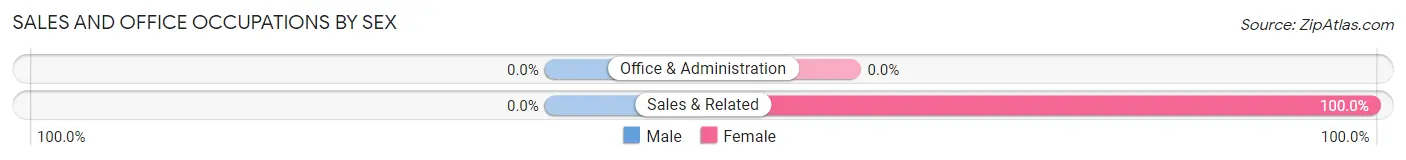
| Occupation | Male | Female |
| Sales & Related | 0 (0.0%) | 8 (100.0%) |
| Office & Administration | 0 (0.0%) | 0 (0.0%) |
| Total (Category) | 0 (0.0%) | 8 (100.0%) |
| Total (Overall) | 47 (54.6%) | 39 (45.4%) |
Natural Resources, Construction and Maintenance Occupations
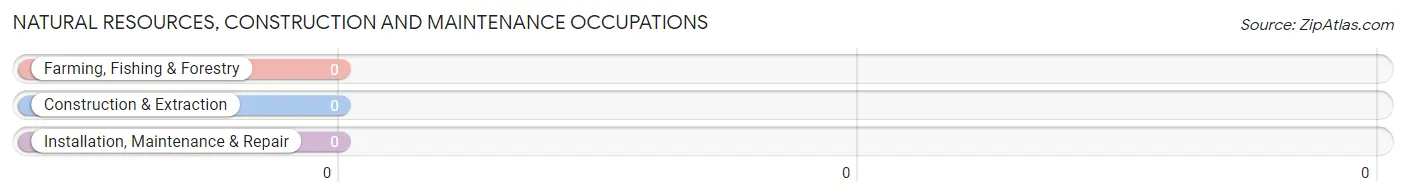
Natural Resources, Construction and Maintenance Occupations by Sex
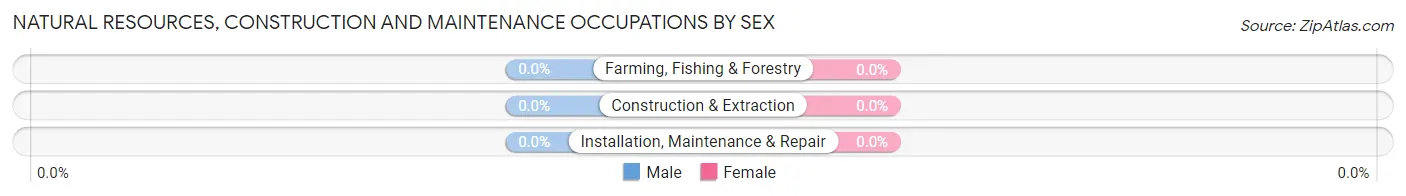
| Occupation | Male | Female |
| Farming, Fishing & Forestry | 0 (0.0%) | 0 (0.0%) |
| Construction & Extraction | 0 (0.0%) | 0 (0.0%) |
| Installation, Maintenance & Repair | 0 (0.0%) | 0 (0.0%) |
| Total (Category) | 0 (0.0%) | 0 (0.0%) |
| Total (Overall) | 47 (54.6%) | 39 (45.4%) |
Production, Transportation and Moving Occupations
The most common Production, Transportation and Moving occupations in Holiday Beach are Production (36 | 41.9%), and Transportation (18 | 20.9%).
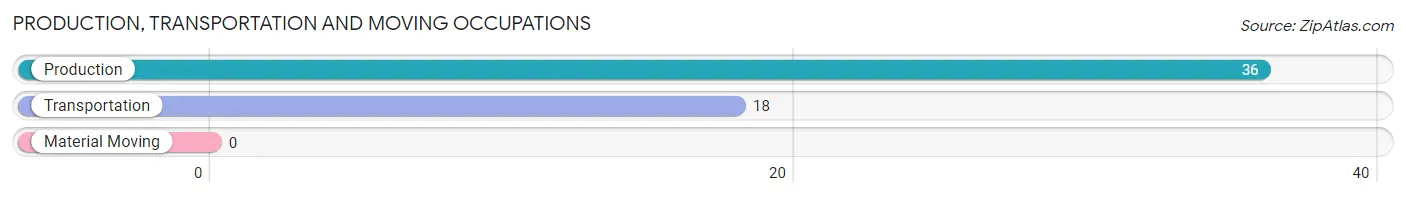
Production, Transportation and Moving Occupations by Sex
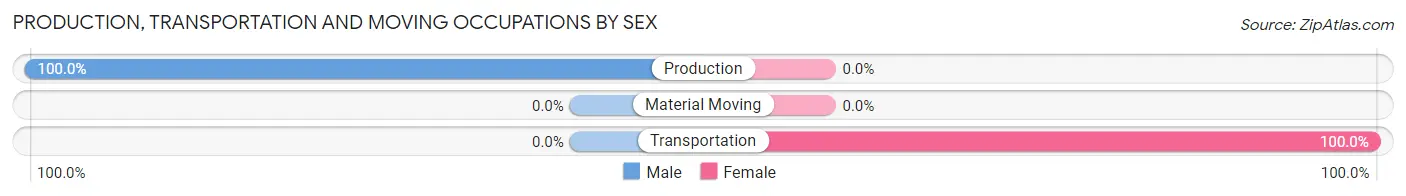
| Occupation | Male | Female |
| Production | 36 (100.0%) | 0 (0.0%) |
| Transportation | 0 (0.0%) | 18 (100.0%) |
| Material Moving | 0 (0.0%) | 0 (0.0%) |
| Total (Category) | 36 (66.7%) | 18 (33.3%) |
| Total (Overall) | 47 (54.6%) | 39 (45.4%) |
Employment Industries by Sex in Holiday Beach
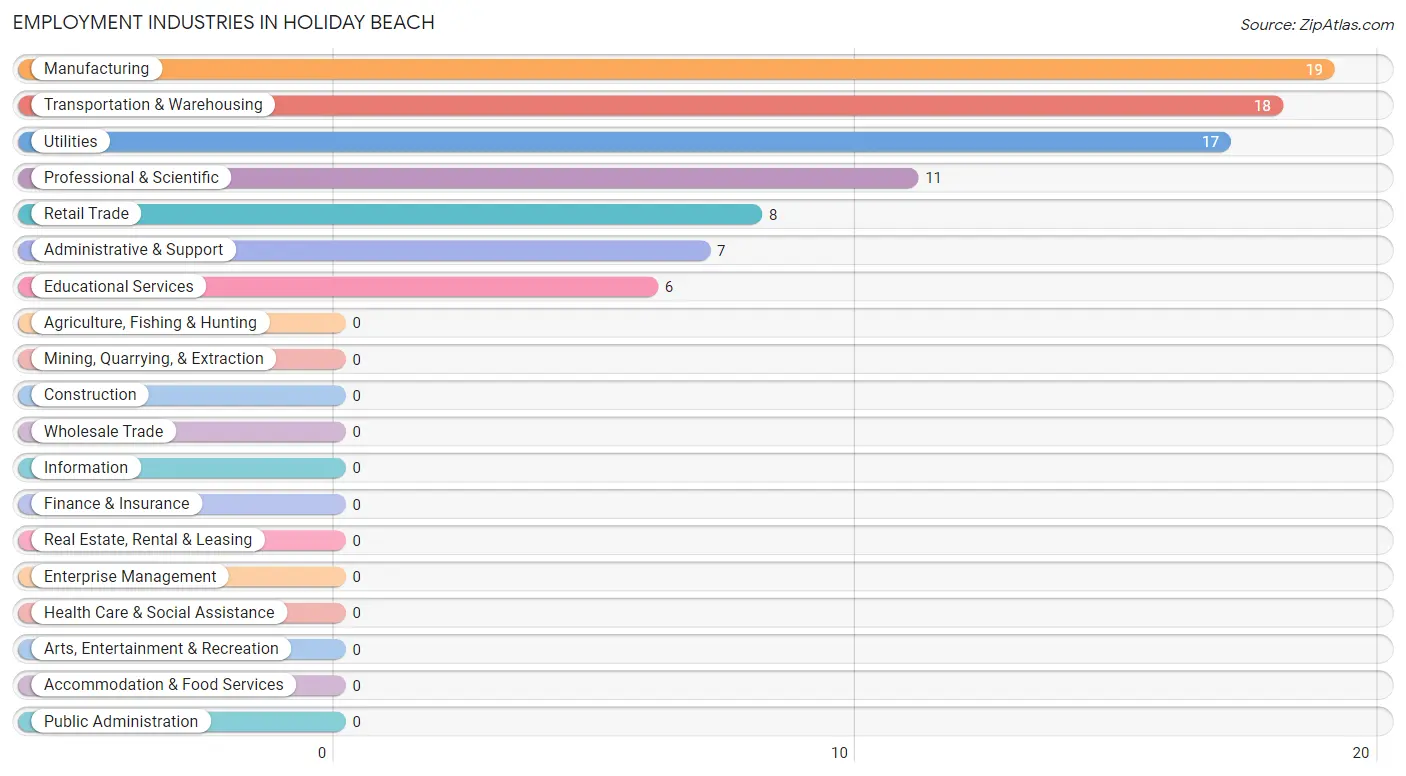
Employment Industries in Holiday Beach
The major employment industries in Holiday Beach include Manufacturing (19 | 22.1%), Transportation & Warehousing (18 | 20.9%), Utilities (17 | 19.8%), Professional & Scientific (11 | 12.8%), and Retail Trade (8 | 9.3%).
Employment Industries by Sex in Holiday Beach
The Holiday Beach industries that see more men than women are Manufacturing (100.0%), Utilities (100.0%), and Professional & Scientific (100.0%), whereas the industries that tend to have a higher number of women are Retail Trade (100.0%), Transportation & Warehousing (100.0%), and Administrative & Support (100.0%).
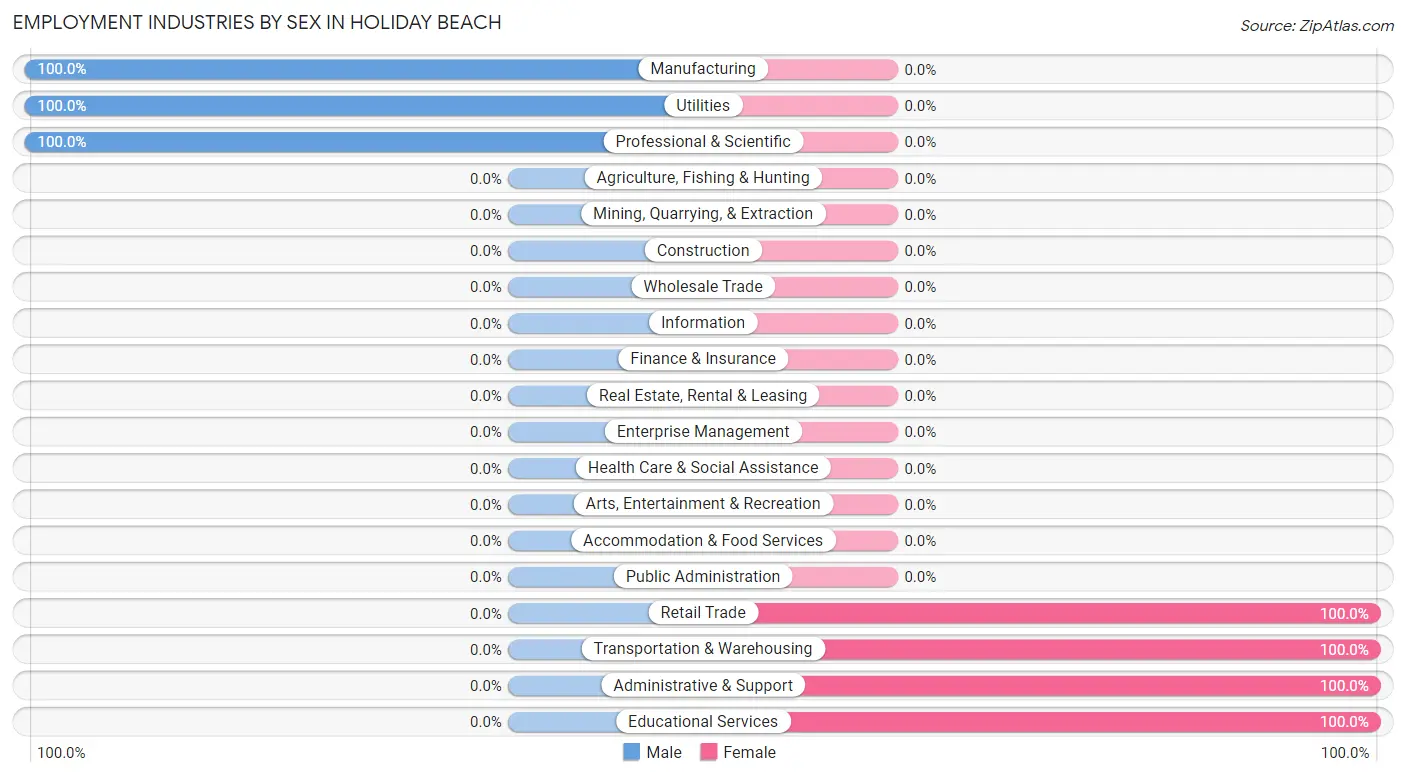
| Industry | Male | Female |
| Agriculture, Fishing & Hunting | 0 (0.0%) | 0 (0.0%) |
| Mining, Quarrying, & Extraction | 0 (0.0%) | 0 (0.0%) |
| Construction | 0 (0.0%) | 0 (0.0%) |
| Manufacturing | 19 (100.0%) | 0 (0.0%) |
| Wholesale Trade | 0 (0.0%) | 0 (0.0%) |
| Retail Trade | 0 (0.0%) | 8 (100.0%) |
| Transportation & Warehousing | 0 (0.0%) | 18 (100.0%) |
| Utilities | 17 (100.0%) | 0 (0.0%) |
| Information | 0 (0.0%) | 0 (0.0%) |
| Finance & Insurance | 0 (0.0%) | 0 (0.0%) |
| Real Estate, Rental & Leasing | 0 (0.0%) | 0 (0.0%) |
| Professional & Scientific | 11 (100.0%) | 0 (0.0%) |
| Enterprise Management | 0 (0.0%) | 0 (0.0%) |
| Administrative & Support | 0 (0.0%) | 7 (100.0%) |
| Educational Services | 0 (0.0%) | 6 (100.0%) |
| Health Care & Social Assistance | 0 (0.0%) | 0 (0.0%) |
| Arts, Entertainment & Recreation | 0 (0.0%) | 0 (0.0%) |
| Accommodation & Food Services | 0 (0.0%) | 0 (0.0%) |
| Public Administration | 0 (0.0%) | 0 (0.0%) |
| Total | 47 (54.6%) | 39 (45.4%) |
Education in Holiday Beach
School Enrollment in Holiday Beach
The most common levels of schooling among the 39 students in Holiday Beach are nursery / preschool (28 | 71.8%), and college / undergraduate (11 | 28.2%).
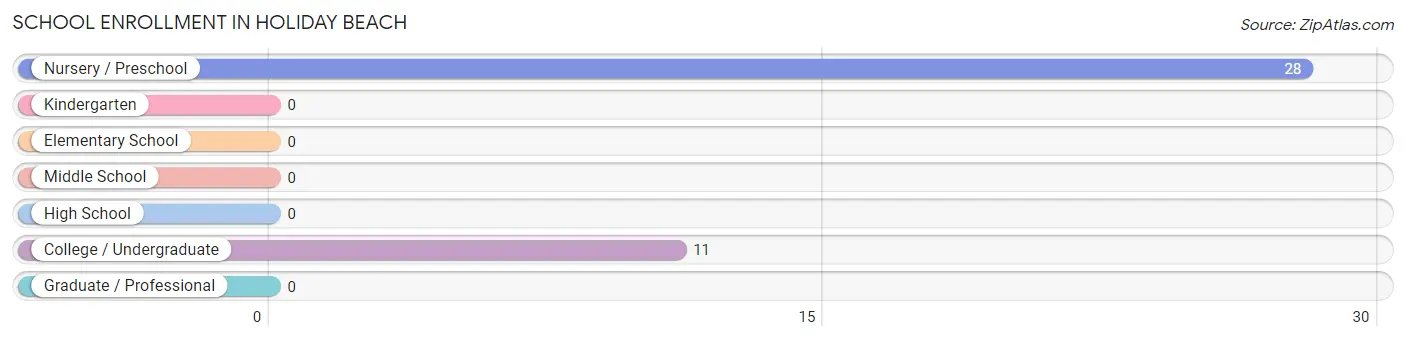
| School Level | # Students | % Students |
| Nursery / Preschool | 28 | 71.8% |
| Kindergarten | 0 | 0.0% |
| Elementary School | 0 | 0.0% |
| Middle School | 0 | 0.0% |
| High School | 0 | 0.0% |
| College / Undergraduate | 11 | 28.2% |
| Graduate / Professional | 0 | 0.0% |
| Total | 39 | 100.0% |
School Enrollment by Age by Funding Source in Holiday Beach
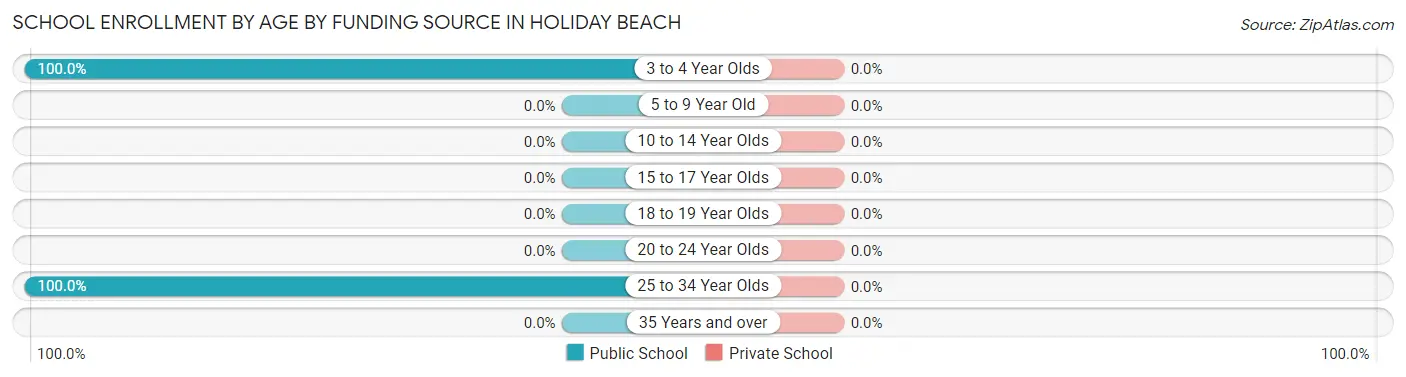
| Age Bracket | Public School | Private School |
| 3 to 4 Year Olds | 28 (100.0%) | 0 (0.0%) |
| 5 to 9 Year Old | 0 (0.0%) | 0 (0.0%) |
| 10 to 14 Year Olds | 0 (0.0%) | 0 (0.0%) |
| 15 to 17 Year Olds | 0 (0.0%) | 0 (0.0%) |
| 18 to 19 Year Olds | 0 (0.0%) | 0 (0.0%) |
| 20 to 24 Year Olds | 0 (0.0%) | 0 (0.0%) |
| 25 to 34 Year Olds | 11 (100.0%) | 0 (0.0%) |
| 35 Years and over | 0 (0.0%) | 0 (0.0%) |
| Total | 39 (100.0%) | 0 (0.0%) |
Educational Attainment by Field of Study in Holiday Beach
Engineering (16 | 36.4%), business (16 | 36.4%), psychology (6 | 13.6%), and education (6 | 13.6%) are the most common fields of study among 44 individuals in Holiday Beach who have obtained a bachelor's degree or higher.
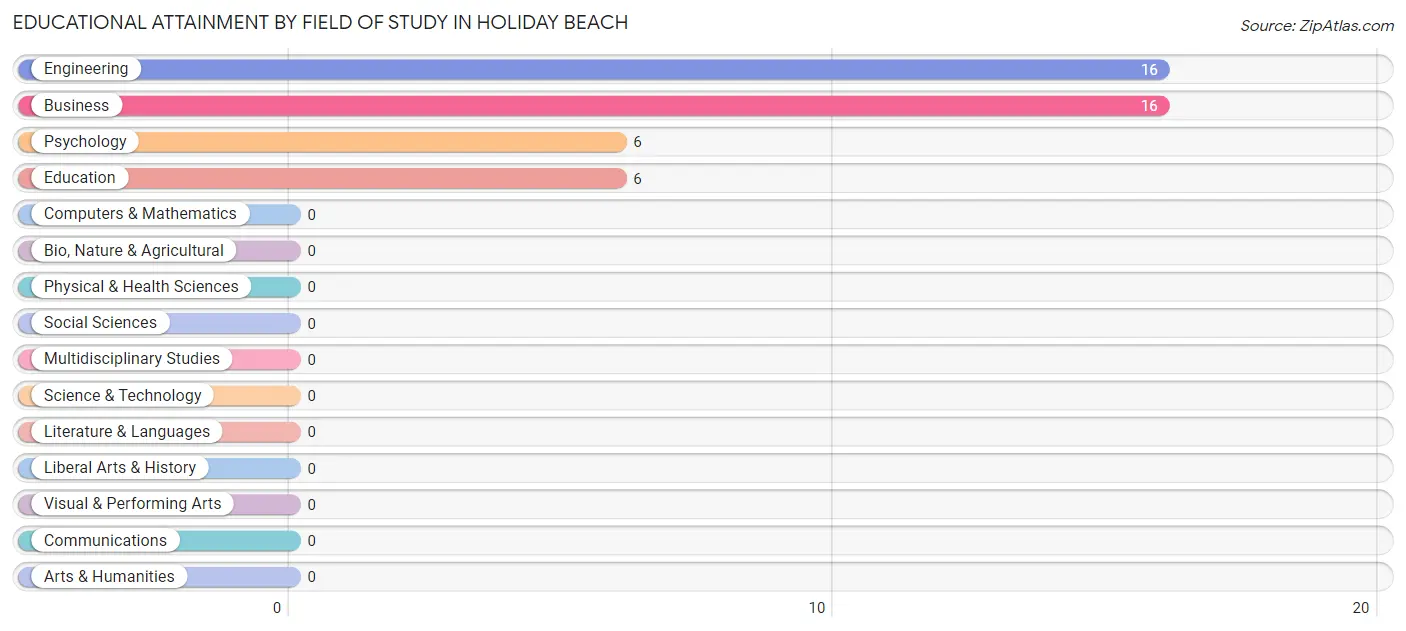
| Field of Study | # Graduates | % Graduates |
| Computers & Mathematics | 0 | 0.0% |
| Bio, Nature & Agricultural | 0 | 0.0% |
| Physical & Health Sciences | 0 | 0.0% |
| Psychology | 6 | 13.6% |
| Social Sciences | 0 | 0.0% |
| Engineering | 16 | 36.4% |
| Multidisciplinary Studies | 0 | 0.0% |
| Science & Technology | 0 | 0.0% |
| Business | 16 | 36.4% |
| Education | 6 | 13.6% |
| Literature & Languages | 0 | 0.0% |
| Liberal Arts & History | 0 | 0.0% |
| Visual & Performing Arts | 0 | 0.0% |
| Communications | 0 | 0.0% |
| Arts & Humanities | 0 | 0.0% |
| Total | 44 | 100.0% |
Transportation & Commute in Holiday Beach
Vehicle Availability by Sex in Holiday Beach
The most prevalent vehicle ownership categories in Holiday Beach are males with 5 or more vehicles (30, accounting for 63.8%) and females with 5 or more vehicles (0, making up 76.9%).
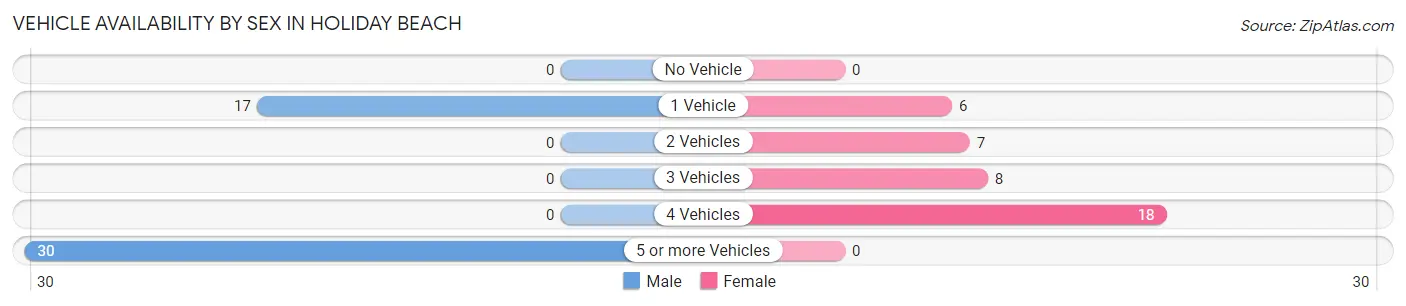
| Vehicles Available | Male | Female |
| No Vehicle | 0 (0.0%) | 0 (0.0%) |
| 1 Vehicle | 17 (36.2%) | 6 (15.4%) |
| 2 Vehicles | 0 (0.0%) | 7 (17.9%) |
| 3 Vehicles | 0 (0.0%) | 8 (20.5%) |
| 4 Vehicles | 0 (0.0%) | 18 (46.2%) |
| 5 or more Vehicles | 30 (63.8%) | 0 (0.0%) |
| Total | 47 (100.0%) | 39 (100.0%) |
Commute Time in Holiday Beach
The most frequently occuring commute durations in Holiday Beach are 10 to 14 minutes (19 commuters, 24.0%), 15 to 19 minutes (19 commuters, 24.0%), and 45 to 59 minutes (18 commuters, 22.8%).
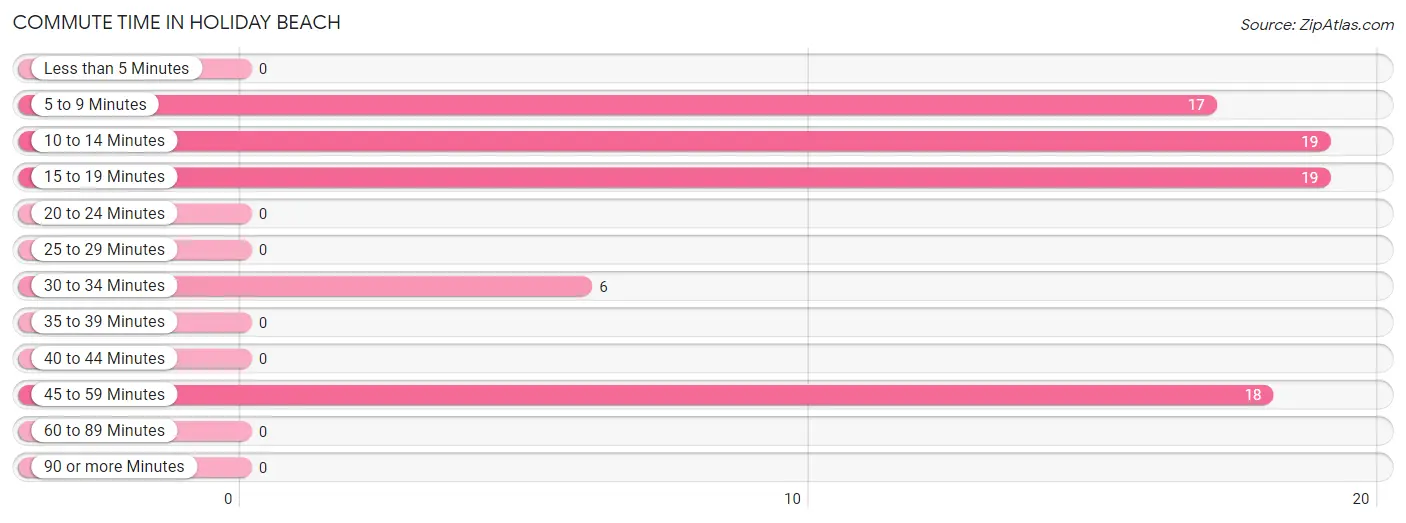
| Commute Time | # Commuters | % Commuters |
| Less than 5 Minutes | 0 | 0.0% |
| 5 to 9 Minutes | 17 | 21.5% |
| 10 to 14 Minutes | 19 | 24.0% |
| 15 to 19 Minutes | 19 | 24.0% |
| 20 to 24 Minutes | 0 | 0.0% |
| 25 to 29 Minutes | 0 | 0.0% |
| 30 to 34 Minutes | 6 | 7.6% |
| 35 to 39 Minutes | 0 | 0.0% |
| 40 to 44 Minutes | 0 | 0.0% |
| 45 to 59 Minutes | 18 | 22.8% |
| 60 to 89 Minutes | 0 | 0.0% |
| 90 or more Minutes | 0 | 0.0% |
Commute Time by Sex in Holiday Beach
The most common commute times in Holiday Beach are 10 to 14 minutes (19 commuters, 40.4%) for males and 45 to 59 minutes (18 commuters, 56.2%) for females.
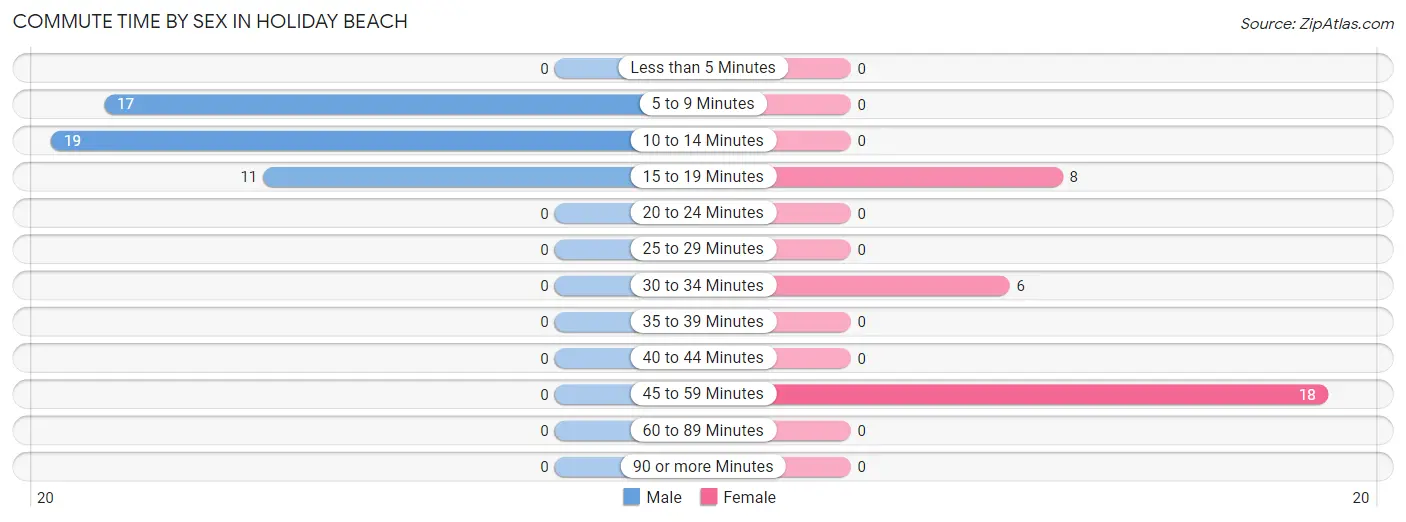
| Commute Time | Male | Female |
| Less than 5 Minutes | 0 (0.0%) | 0 (0.0%) |
| 5 to 9 Minutes | 17 (36.2%) | 0 (0.0%) |
| 10 to 14 Minutes | 19 (40.4%) | 0 (0.0%) |
| 15 to 19 Minutes | 11 (23.4%) | 8 (25.0%) |
| 20 to 24 Minutes | 0 (0.0%) | 0 (0.0%) |
| 25 to 29 Minutes | 0 (0.0%) | 0 (0.0%) |
| 30 to 34 Minutes | 0 (0.0%) | 6 (18.8%) |
| 35 to 39 Minutes | 0 (0.0%) | 0 (0.0%) |
| 40 to 44 Minutes | 0 (0.0%) | 0 (0.0%) |
| 45 to 59 Minutes | 0 (0.0%) | 18 (56.2%) |
| 60 to 89 Minutes | 0 (0.0%) | 0 (0.0%) |
| 90 or more Minutes | 0 (0.0%) | 0 (0.0%) |
Time of Departure to Work by Sex in Holiday Beach
The most frequent times of departure to work in Holiday Beach are 9:00 AM to 9:59 AM (19, 40.4%) for males and 6:30 AM to 6:59 AM (18, 56.2%) for females.
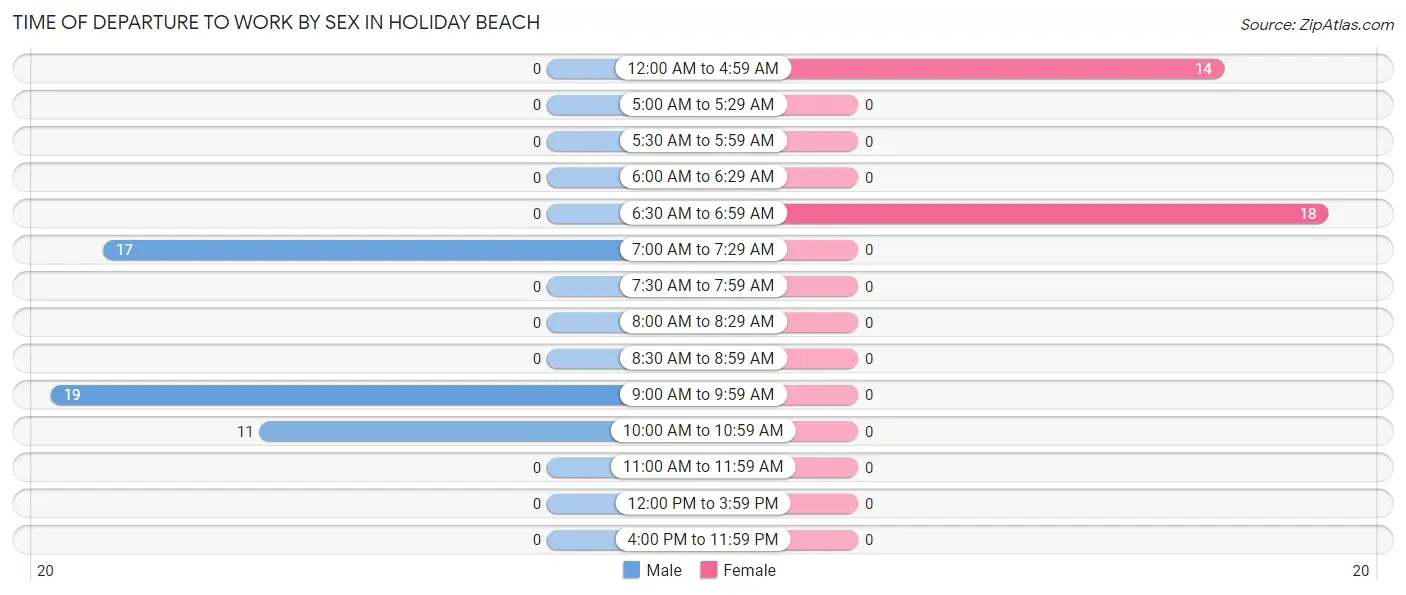
| Time of Departure | Male | Female |
| 12:00 AM to 4:59 AM | 0 (0.0%) | 14 (43.8%) |
| 5:00 AM to 5:29 AM | 0 (0.0%) | 0 (0.0%) |
| 5:30 AM to 5:59 AM | 0 (0.0%) | 0 (0.0%) |
| 6:00 AM to 6:29 AM | 0 (0.0%) | 0 (0.0%) |
| 6:30 AM to 6:59 AM | 0 (0.0%) | 18 (56.2%) |
| 7:00 AM to 7:29 AM | 17 (36.2%) | 0 (0.0%) |
| 7:30 AM to 7:59 AM | 0 (0.0%) | 0 (0.0%) |
| 8:00 AM to 8:29 AM | 0 (0.0%) | 0 (0.0%) |
| 8:30 AM to 8:59 AM | 0 (0.0%) | 0 (0.0%) |
| 9:00 AM to 9:59 AM | 19 (40.4%) | 0 (0.0%) |
| 10:00 AM to 10:59 AM | 11 (23.4%) | 0 (0.0%) |
| 11:00 AM to 11:59 AM | 0 (0.0%) | 0 (0.0%) |
| 12:00 PM to 3:59 PM | 0 (0.0%) | 0 (0.0%) |
| 4:00 PM to 11:59 PM | 0 (0.0%) | 0 (0.0%) |
| Total | 47 (100.0%) | 32 (100.0%) |
Housing Occupancy in Holiday Beach
Occupancy by Ownership in Holiday Beach
Of the total 125 dwellings in Holiday Beach, owner-occupied units account for 125 (100.0%), while renter-occupied units make up 0 (0.0%).
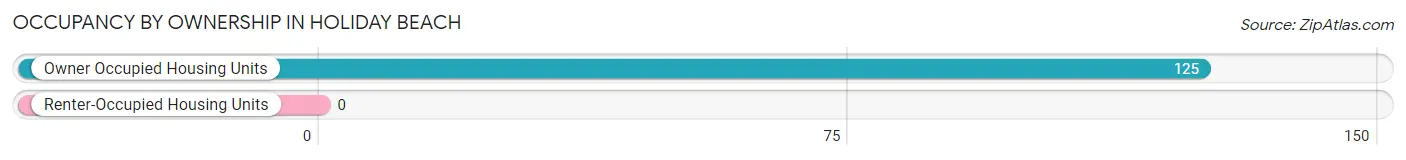
| Occupancy | # Housing Units | % Housing Units |
| Owner Occupied Housing Units | 125 | 100.0% |
| Renter-Occupied Housing Units | 0 | 0.0% |
| Total Occupied Housing Units | 125 | 100.0% |
Occupancy by Household Size in Holiday Beach
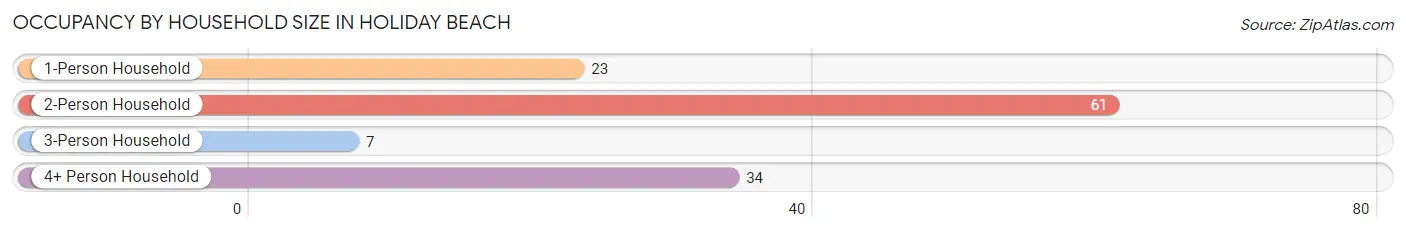
| Household Size | # Housing Units | % Housing Units |
| 1-Person Household | 23 | 18.4% |
| 2-Person Household | 61 | 48.8% |
| 3-Person Household | 7 | 5.6% |
| 4+ Person Household | 34 | 27.2% |
| Total Housing Units | 125 | 100.0% |
Occupancy by Ownership by Household Size in Holiday Beach
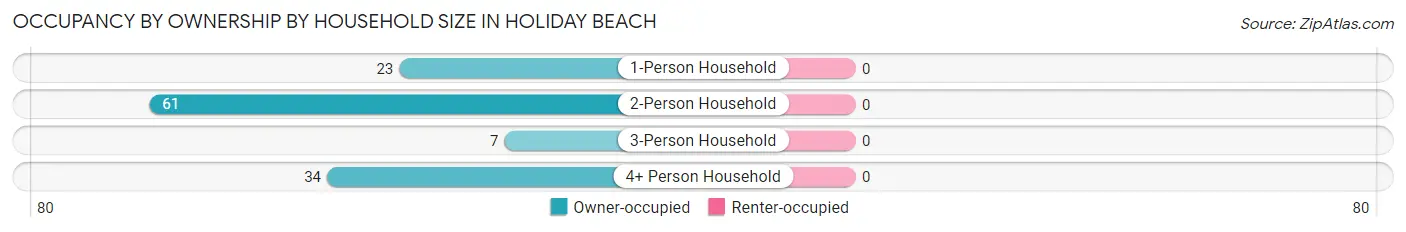
| Household Size | Owner-occupied | Renter-occupied |
| 1-Person Household | 23 (100.0%) | 0 (0.0%) |
| 2-Person Household | 61 (100.0%) | 0 (0.0%) |
| 3-Person Household | 7 (100.0%) | 0 (0.0%) |
| 4+ Person Household | 34 (100.0%) | 0 (0.0%) |
| Total Housing Units | 125 (100.0%) | 0 (0.0%) |
Occupancy by Educational Attainment in Holiday Beach
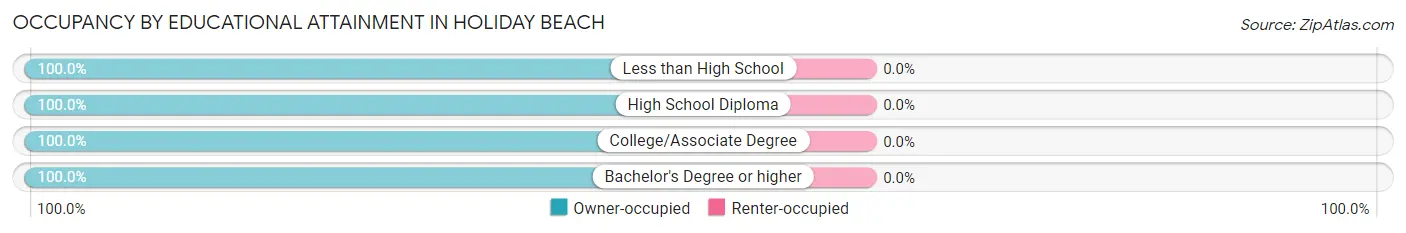
| Household Size | Owner-occupied | Renter-occupied |
| Less than High School | 17 (100.0%) | 0 (0.0%) |
| High School Diploma | 54 (100.0%) | 0 (0.0%) |
| College/Associate Degree | 32 (100.0%) | 0 (0.0%) |
| Bachelor's Degree or higher | 22 (100.0%) | 0 (0.0%) |
Occupancy by Age of Householder in Holiday Beach
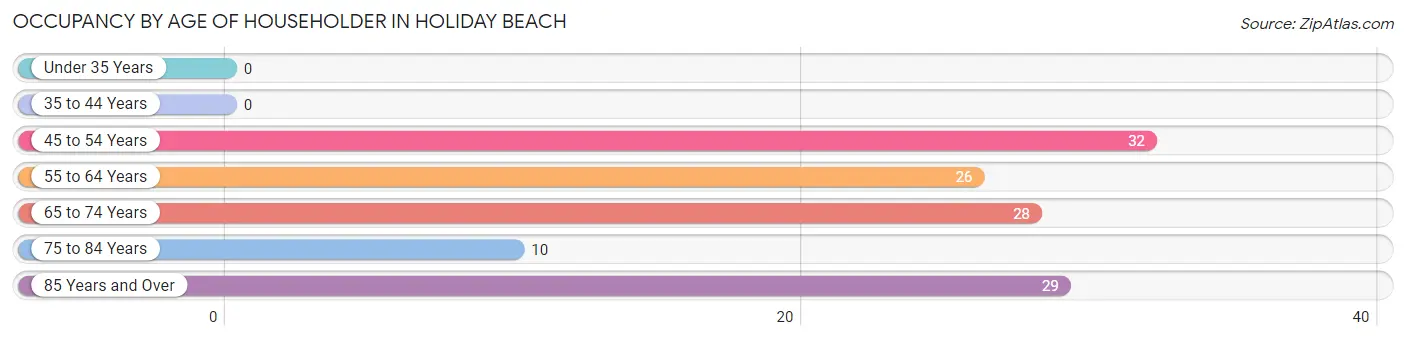
| Age Bracket | # Households | % Households |
| Under 35 Years | 0 | 0.0% |
| 35 to 44 Years | 0 | 0.0% |
| 45 to 54 Years | 32 | 25.6% |
| 55 to 64 Years | 26 | 20.8% |
| 65 to 74 Years | 28 | 22.4% |
| 75 to 84 Years | 10 | 8.0% |
| 85 Years and Over | 29 | 23.2% |
| Total | 125 | 100.0% |
Housing Finances in Holiday Beach
Median Income by Occupancy in Holiday Beach
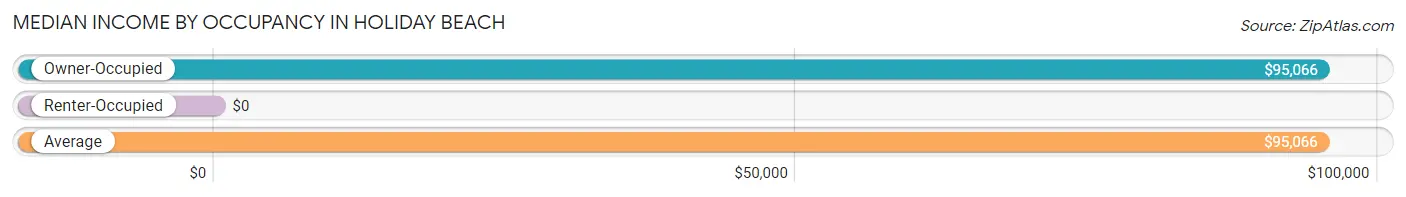
| Occupancy Type | # Households | Median Income |
| Owner-Occupied | 125 (100.0%) | $95,066 |
| Renter-Occupied | 0 (0.0%) | $0 |
| Average | 125 (100.0%) | $95,066 |
Occupancy by Householder Income Bracket in Holiday Beach
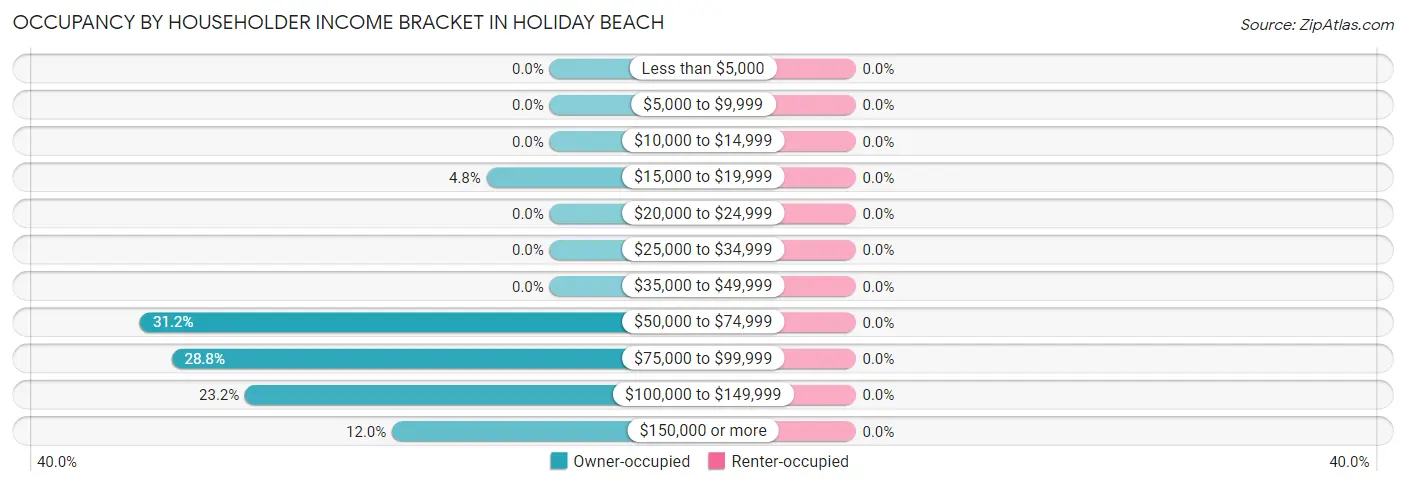
| Income Bracket | Owner-occupied | Renter-occupied |
| Less than $5,000 | 0 (0.0%) | 0 (0.0%) |
| $5,000 to $9,999 | 0 (0.0%) | 0 (0.0%) |
| $10,000 to $14,999 | 0 (0.0%) | 0 (0.0%) |
| $15,000 to $19,999 | 6 (4.8%) | 0 (0.0%) |
| $20,000 to $24,999 | 0 (0.0%) | 0 (0.0%) |
| $25,000 to $34,999 | 0 (0.0%) | 0 (0.0%) |
| $35,000 to $49,999 | 0 (0.0%) | 0 (0.0%) |
| $50,000 to $74,999 | 39 (31.2%) | 0 (0.0%) |
| $75,000 to $99,999 | 36 (28.8%) | 0 (0.0%) |
| $100,000 to $149,999 | 29 (23.2%) | 0 (0.0%) |
| $150,000 or more | 15 (12.0%) | 0 (0.0%) |
| Total | 125 (100.0%) | 0 (0.0%) |
Monthly Housing Cost Tiers in Holiday Beach
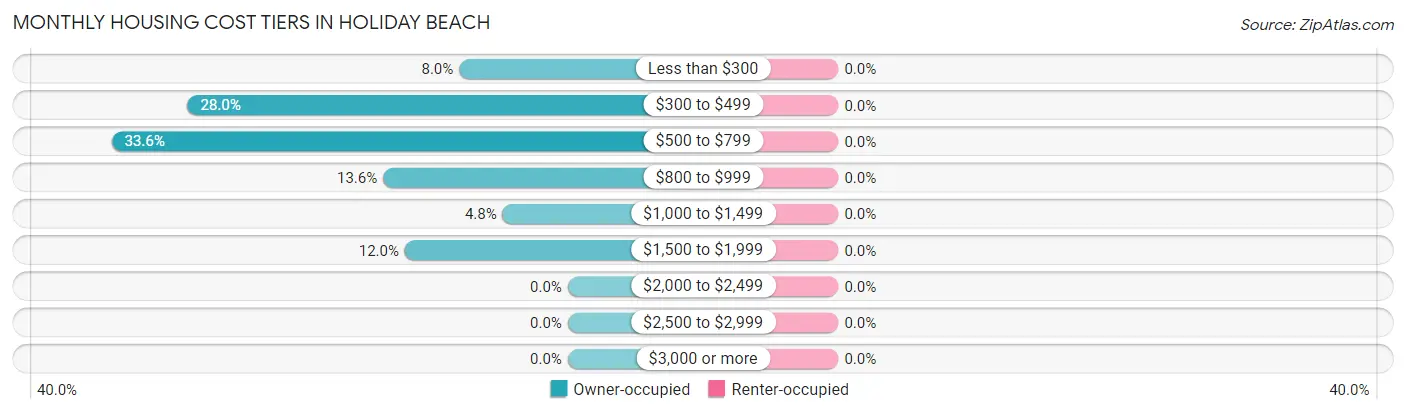
| Monthly Cost | Owner-occupied | Renter-occupied |
| Less than $300 | 10 (8.0%) | 0 (0.0%) |
| $300 to $499 | 35 (28.0%) | 0 (0.0%) |
| $500 to $799 | 42 (33.6%) | 0 (0.0%) |
| $800 to $999 | 17 (13.6%) | 0 (0.0%) |
| $1,000 to $1,499 | 6 (4.8%) | 0 (0.0%) |
| $1,500 to $1,999 | 15 (12.0%) | 0 (0.0%) |
| $2,000 to $2,499 | 0 (0.0%) | 0 (0.0%) |
| $2,500 to $2,999 | 0 (0.0%) | 0 (0.0%) |
| $3,000 or more | 0 (0.0%) | 0 (0.0%) |
| Total | 125 (100.0%) | 0 (0.0%) |
Physical Housing Characteristics in Holiday Beach
Housing Structures in Holiday Beach
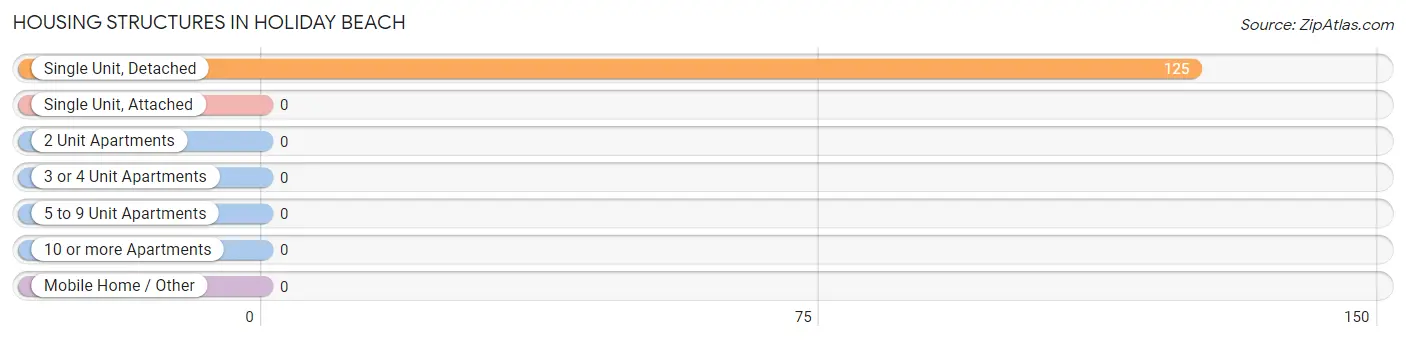
| Structure Type | # Housing Units | % Housing Units |
| Single Unit, Detached | 125 | 100.0% |
| Single Unit, Attached | 0 | 0.0% |
| 2 Unit Apartments | 0 | 0.0% |
| 3 or 4 Unit Apartments | 0 | 0.0% |
| 5 to 9 Unit Apartments | 0 | 0.0% |
| 10 or more Apartments | 0 | 0.0% |
| Mobile Home / Other | 0 | 0.0% |
| Total | 125 | 100.0% |
Housing Structures by Occupancy in Holiday Beach
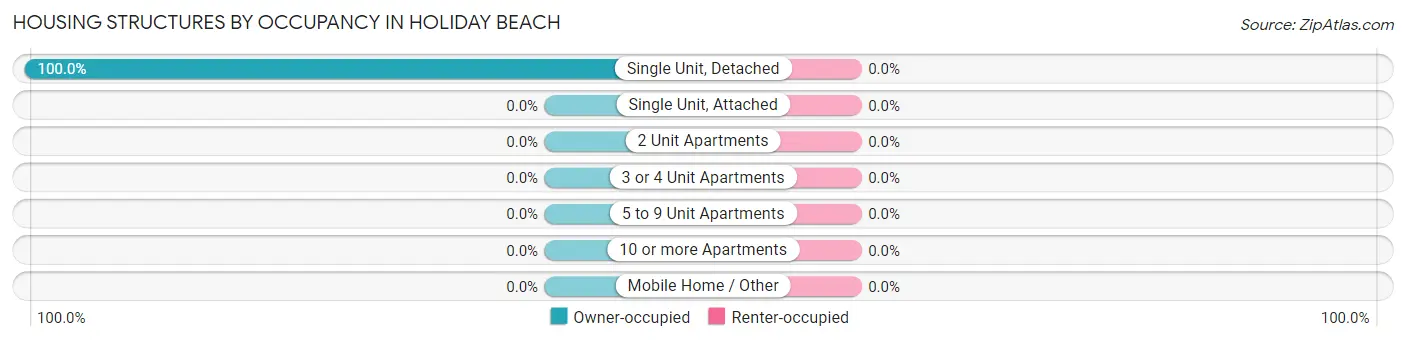
| Structure Type | Owner-occupied | Renter-occupied |
| Single Unit, Detached | 125 (100.0%) | 0 (0.0%) |
| Single Unit, Attached | 0 (0.0%) | 0 (0.0%) |
| 2 Unit Apartments | 0 (0.0%) | 0 (0.0%) |
| 3 or 4 Unit Apartments | 0 (0.0%) | 0 (0.0%) |
| 5 to 9 Unit Apartments | 0 (0.0%) | 0 (0.0%) |
| 10 or more Apartments | 0 (0.0%) | 0 (0.0%) |
| Mobile Home / Other | 0 (0.0%) | 0 (0.0%) |
| Total | 125 (100.0%) | 0 (0.0%) |
Housing Structures by Number of Rooms in Holiday Beach
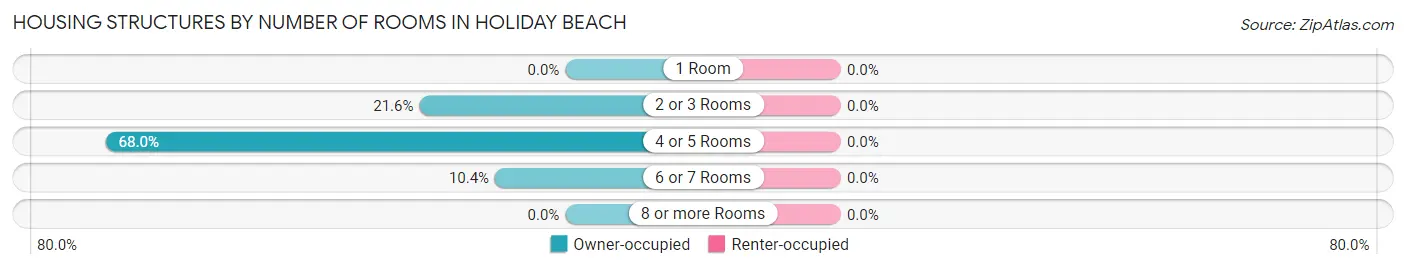
| Number of Rooms | Owner-occupied | Renter-occupied |
| 1 Room | 0 (0.0%) | 0 (0.0%) |
| 2 or 3 Rooms | 27 (21.6%) | 0 (0.0%) |
| 4 or 5 Rooms | 85 (68.0%) | 0 (0.0%) |
| 6 or 7 Rooms | 13 (10.4%) | 0 (0.0%) |
| 8 or more Rooms | 0 (0.0%) | 0 (0.0%) |
| Total | 125 (100.0%) | 0 (0.0%) |
Housing Structure by Heating Type in Holiday Beach
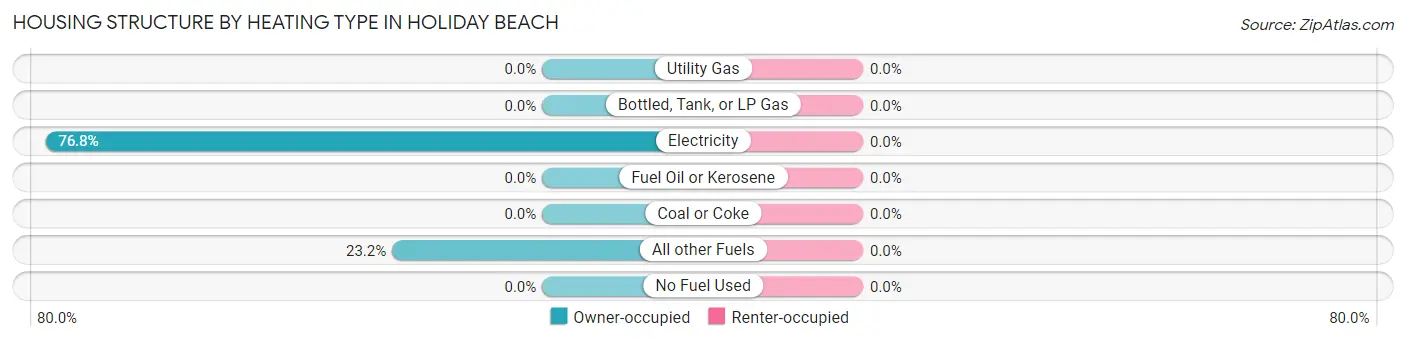
| Heating Type | Owner-occupied | Renter-occupied |
| Utility Gas | 0 (0.0%) | 0 (0.0%) |
| Bottled, Tank, or LP Gas | 0 (0.0%) | 0 (0.0%) |
| Electricity | 96 (76.8%) | 0 (0.0%) |
| Fuel Oil or Kerosene | 0 (0.0%) | 0 (0.0%) |
| Coal or Coke | 0 (0.0%) | 0 (0.0%) |
| All other Fuels | 29 (23.2%) | 0 (0.0%) |
| No Fuel Used | 0 (0.0%) | 0 (0.0%) |
| Total | 125 (100.0%) | 0 (0.0%) |
Household Vehicle Usage in Holiday Beach
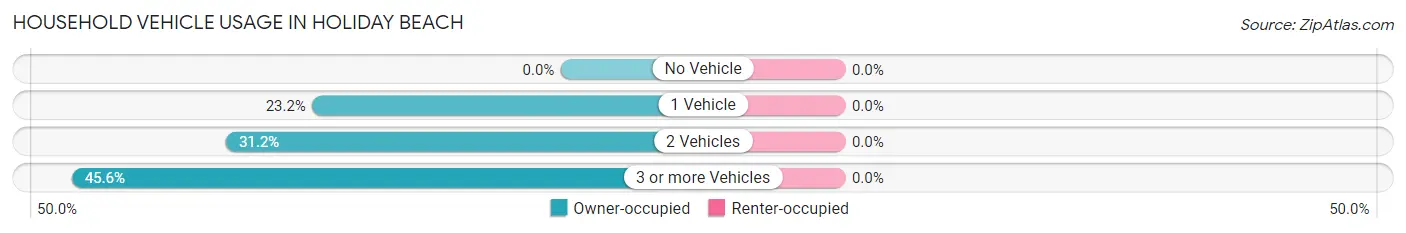
| Vehicles per Household | Owner-occupied | Renter-occupied |
| No Vehicle | 0 (0.0%) | 0 (0.0%) |
| 1 Vehicle | 29 (23.2%) | 0 (0.0%) |
| 2 Vehicles | 39 (31.2%) | 0 (0.0%) |
| 3 or more Vehicles | 57 (45.6%) | 0 (0.0%) |
| Total | 125 (100.0%) | 0 (0.0%) |
Real Estate & Mortgages in Holiday Beach
Real Estate and Mortgage Overview in Holiday Beach
| Characteristic | Without Mortgage | With Mortgage |
| Housing Units | 68 | 57 |
| Median Property Value | $142,100 | $0 |
| Median Household Income | $74,457 | $15 |
| Monthly Housing Costs | $391 | $0 |
| Real Estate Taxes | $199 | $0 |
Property Value by Mortgage Status in Holiday Beach
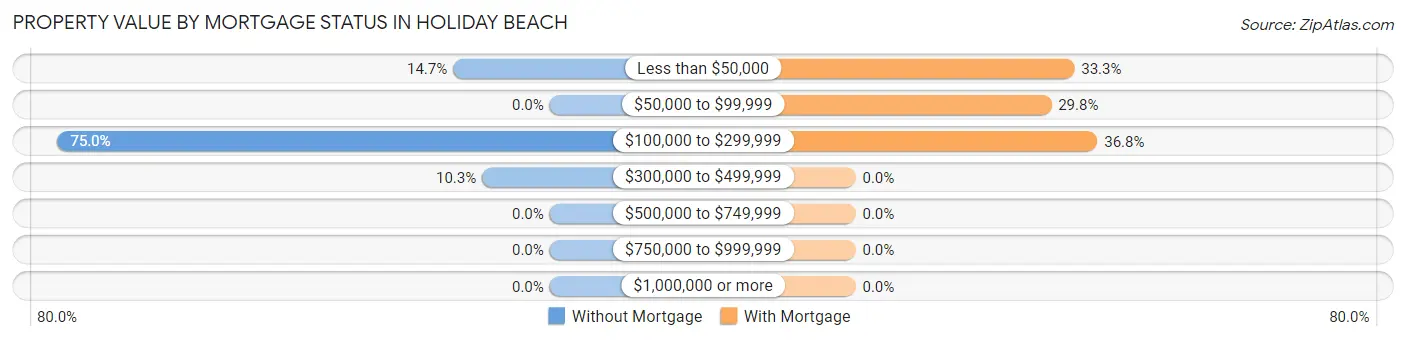
| Property Value | Without Mortgage | With Mortgage |
| Less than $50,000 | 10 (14.7%) | 19 (33.3%) |
| $50,000 to $99,999 | 0 (0.0%) | 17 (29.8%) |
| $100,000 to $299,999 | 51 (75.0%) | 21 (36.8%) |
| $300,000 to $499,999 | 7 (10.3%) | 0 (0.0%) |
| $500,000 to $749,999 | 0 (0.0%) | 0 (0.0%) |
| $750,000 to $999,999 | 0 (0.0%) | 0 (0.0%) |
| $1,000,000 or more | 0 (0.0%) | 0 (0.0%) |
| Total | 68 (100.0%) | 57 (100.0%) |
Household Income by Mortgage Status in Holiday Beach

| Household Income | Without Mortgage | With Mortgage |
| Less than $10,000 | 0 (0.0%) | 0 (0.0%) |
| $10,000 to $24,999 | 6 (8.8%) | 0 (0.0%) |
| $25,000 to $34,999 | 0 (0.0%) | 0 (0.0%) |
| $35,000 to $49,999 | 0 (0.0%) | 0 (0.0%) |
| $50,000 to $74,999 | 33 (48.5%) | 0 (0.0%) |
| $75,000 to $99,999 | 0 (0.0%) | 6 (10.5%) |
| $100,000 to $149,999 | 29 (42.6%) | 36 (63.2%) |
| $150,000 or more | 0 (0.0%) | 0 (0.0%) |
| Total | 68 (100.0%) | 57 (100.0%) |
Property Value to Household Income Ratio in Holiday Beach
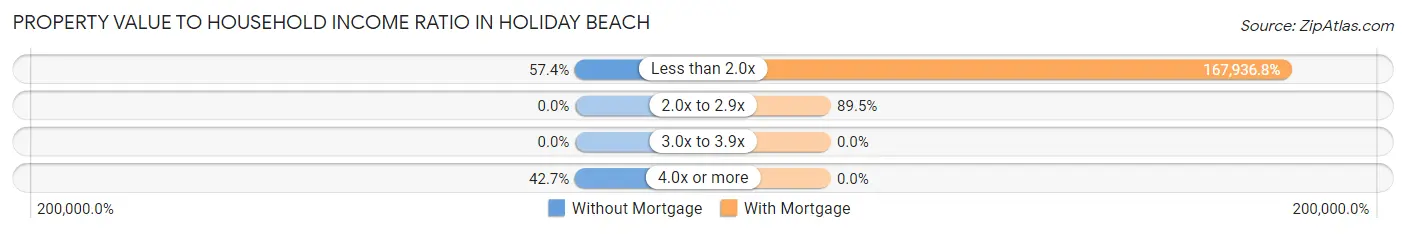
| Value-to-Income Ratio | Without Mortgage | With Mortgage |
| Less than 2.0x | 39 (57.4%) | 95,724 (167,936.8%) |
| 2.0x to 2.9x | 0 (0.0%) | 51 (89.5%) |
| 3.0x to 3.9x | 0 (0.0%) | 0 (0.0%) |
| 4.0x or more | 29 (42.6%) | 0 (0.0%) |
| Total | 68 (100.0%) | 57 (100.0%) |
Real Estate Taxes by Mortgage Status in Holiday Beach
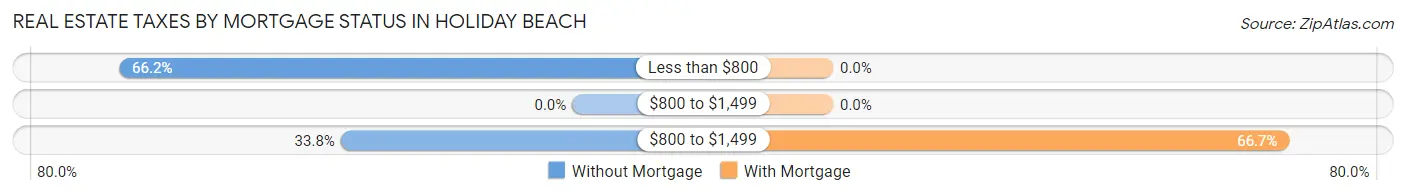
| Property Taxes | Without Mortgage | With Mortgage |
| Less than $800 | 45 (66.2%) | 0 (0.0%) |
| $800 to $1,499 | 0 (0.0%) | 0 (0.0%) |
| $800 to $1,499 | 23 (33.8%) | 38 (66.7%) |
| Total | 68 (100.0%) | 57 (100.0%) |
Health & Disability in Holiday Beach
Health Insurance Coverage by Age in Holiday Beach
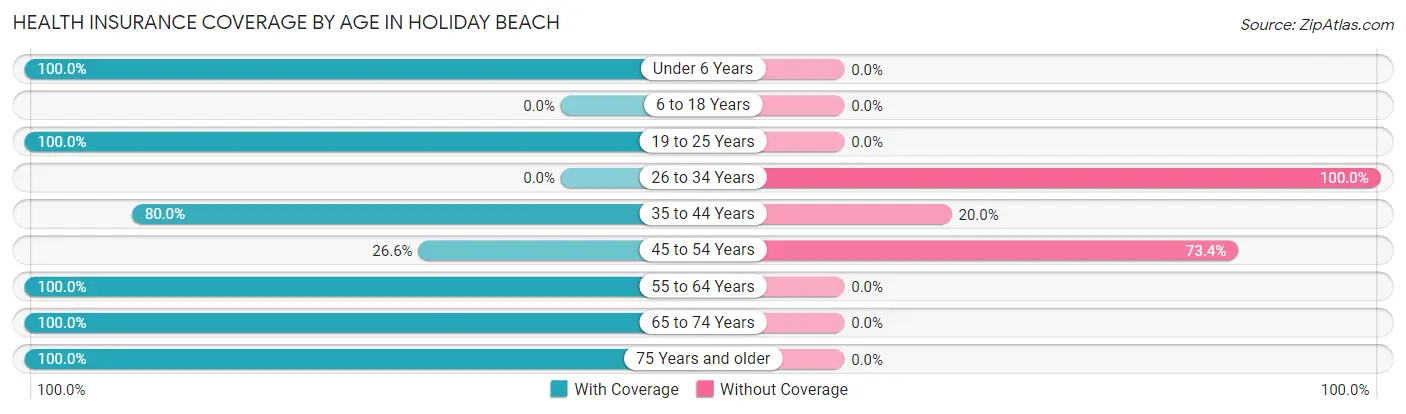
| Age Bracket | With Coverage | Without Coverage |
| Under 6 Years | 55 (100.0%) | 0 (0.0%) |
| 6 to 18 Years | 0 (0.0%) | 0 (0.0%) |
| 19 to 25 Years | 14 (100.0%) | 0 (0.0%) |
| 26 to 34 Years | 0 (0.0%) | 11 (100.0%) |
| 35 to 44 Years | 8 (80.0%) | 2 (20.0%) |
| 45 to 54 Years | 17 (26.6%) | 47 (73.4%) |
| 55 to 64 Years | 51 (100.0%) | 0 (0.0%) |
| 65 to 74 Years | 41 (100.0%) | 0 (0.0%) |
| 75 Years and older | 45 (100.0%) | 0 (0.0%) |
| Total | 231 (79.4%) | 60 (20.6%) |
Health Insurance Coverage by Citizenship Status in Holiday Beach
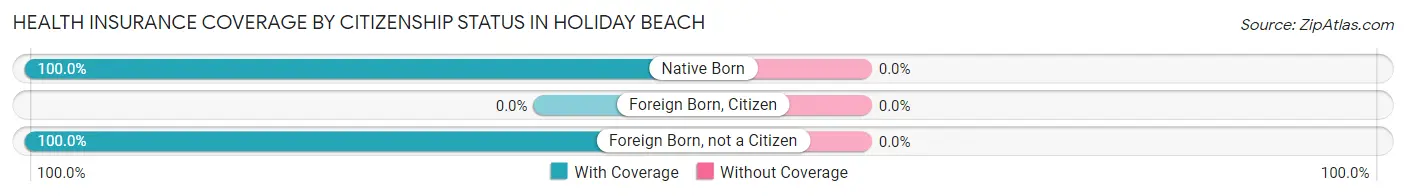
| Citizenship Status | With Coverage | Without Coverage |
| Native Born | 55 (100.0%) | 0 (0.0%) |
| Foreign Born, Citizen | 0 (0.0%) | 0 (0.0%) |
| Foreign Born, not a Citizen | 14 (100.0%) | 0 (0.0%) |
Health Insurance Coverage by Household Income in Holiday Beach
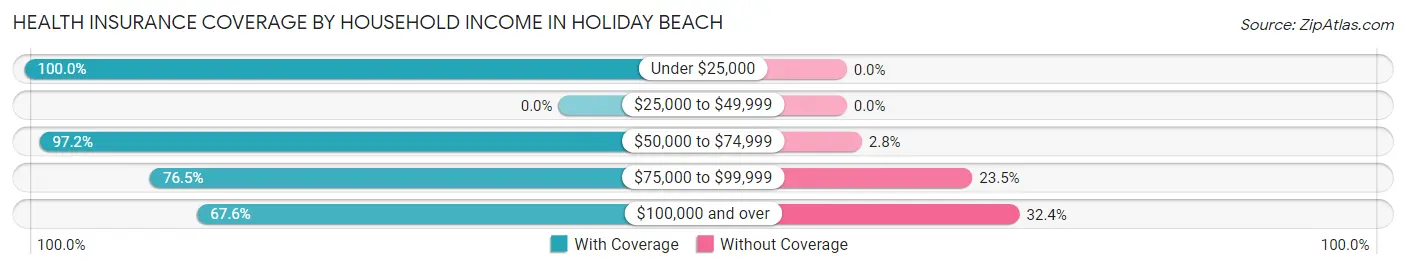
| Household Income | With Coverage | Without Coverage |
| Under $25,000 | 13 (100.0%) | 0 (0.0%) |
| $25,000 to $49,999 | 0 (0.0%) | 0 (0.0%) |
| $50,000 to $74,999 | 69 (97.2%) | 2 (2.8%) |
| $75,000 to $99,999 | 78 (76.5%) | 24 (23.5%) |
| $100,000 and over | 71 (67.6%) | 34 (32.4%) |
Public vs Private Health Insurance Coverage by Age in Holiday Beach
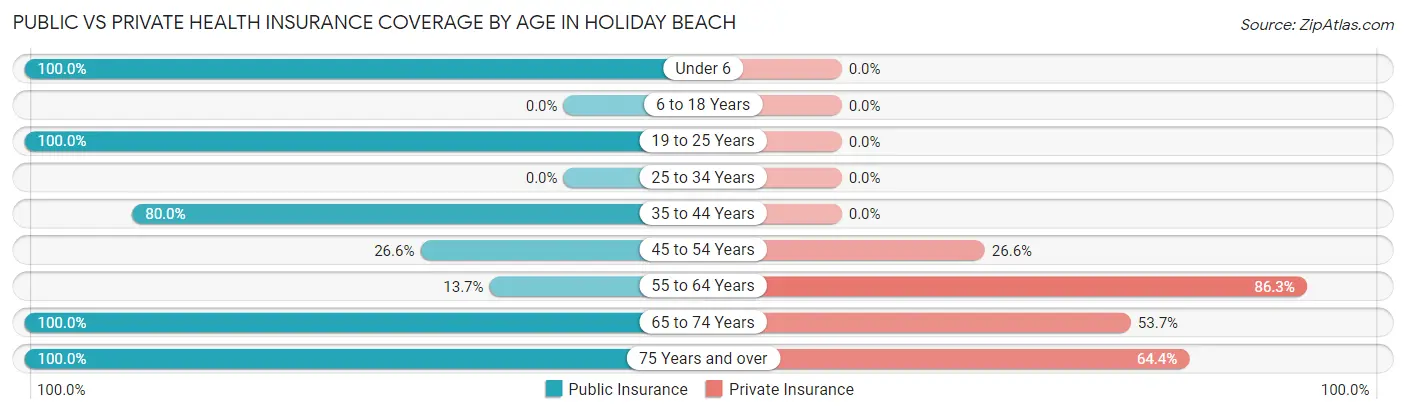
| Age Bracket | Public Insurance | Private Insurance |
| Under 6 | 55 (100.0%) | 0 (0.0%) |
| 6 to 18 Years | 0 (0.0%) | 0 (0.0%) |
| 19 to 25 Years | 14 (100.0%) | 0 (0.0%) |
| 25 to 34 Years | 0 (0.0%) | 0 (0.0%) |
| 35 to 44 Years | 8 (80.0%) | 0 (0.0%) |
| 45 to 54 Years | 17 (26.6%) | 17 (26.6%) |
| 55 to 64 Years | 7 (13.7%) | 44 (86.3%) |
| 65 to 74 Years | 41 (100.0%) | 22 (53.7%) |
| 75 Years and over | 45 (100.0%) | 29 (64.4%) |
| Total | 187 (64.3%) | 112 (38.5%) |
Disability Status by Sex by Age in Holiday Beach
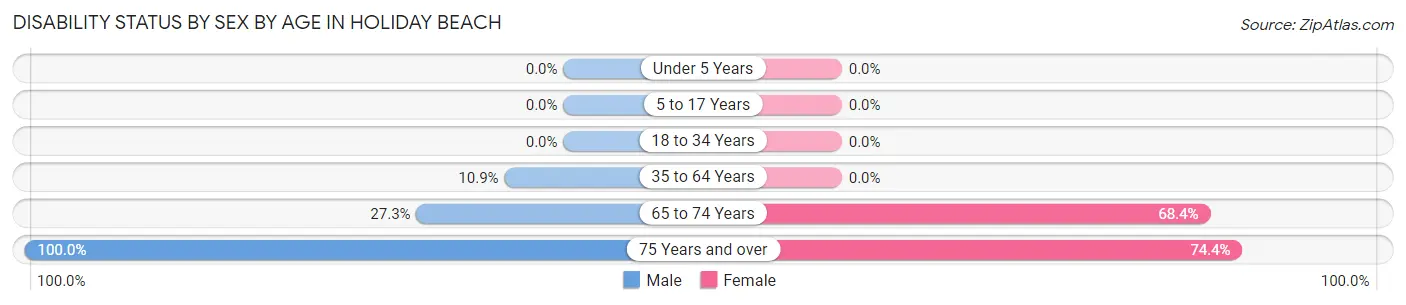
| Age Bracket | Male | Female |
| Under 5 Years | 0 (0.0%) | 0 (0.0%) |
| 5 to 17 Years | 0 (0.0%) | 0 (0.0%) |
| 18 to 34 Years | 0 (0.0%) | 0 (0.0%) |
| 35 to 64 Years | 7 (10.9%) | 0 (0.0%) |
| 65 to 74 Years | 6 (27.3%) | 13 (68.4%) |
| 75 Years and over | 6 (100.0%) | 29 (74.4%) |
Disability Class by Sex by Age in Holiday Beach
Disability Class: Hearing Difficulty
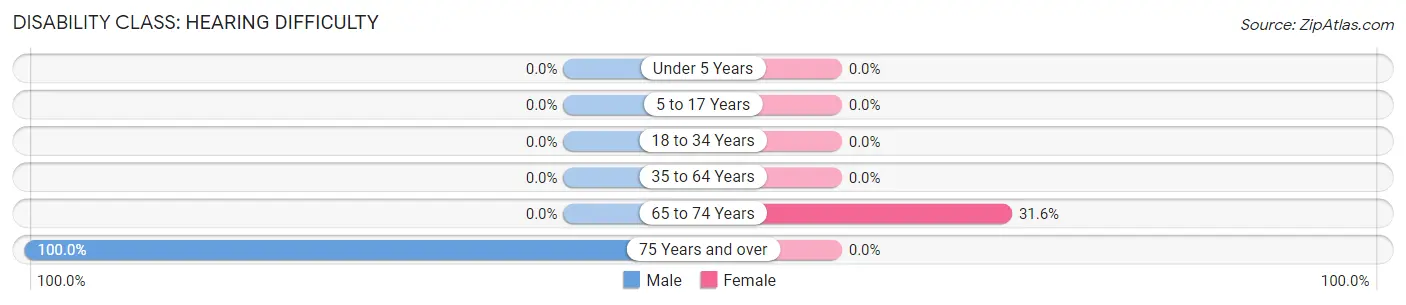
| Age Bracket | Male | Female |
| Under 5 Years | 0 (0.0%) | 0 (0.0%) |
| 5 to 17 Years | 0 (0.0%) | 0 (0.0%) |
| 18 to 34 Years | 0 (0.0%) | 0 (0.0%) |
| 35 to 64 Years | 0 (0.0%) | 0 (0.0%) |
| 65 to 74 Years | 0 (0.0%) | 6 (31.6%) |
| 75 Years and over | 6 (100.0%) | 0 (0.0%) |
Disability Class: Vision Difficulty
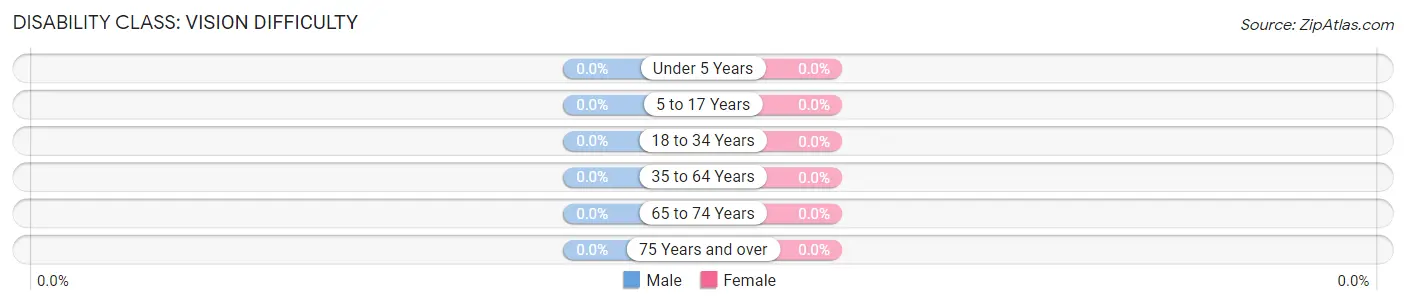
| Age Bracket | Male | Female |
| Under 5 Years | 0 (0.0%) | 0 (0.0%) |
| 5 to 17 Years | 0 (0.0%) | 0 (0.0%) |
| 18 to 34 Years | 0 (0.0%) | 0 (0.0%) |
| 35 to 64 Years | 0 (0.0%) | 0 (0.0%) |
| 65 to 74 Years | 0 (0.0%) | 0 (0.0%) |
| 75 Years and over | 0 (0.0%) | 0 (0.0%) |
Disability Class: Cognitive Difficulty
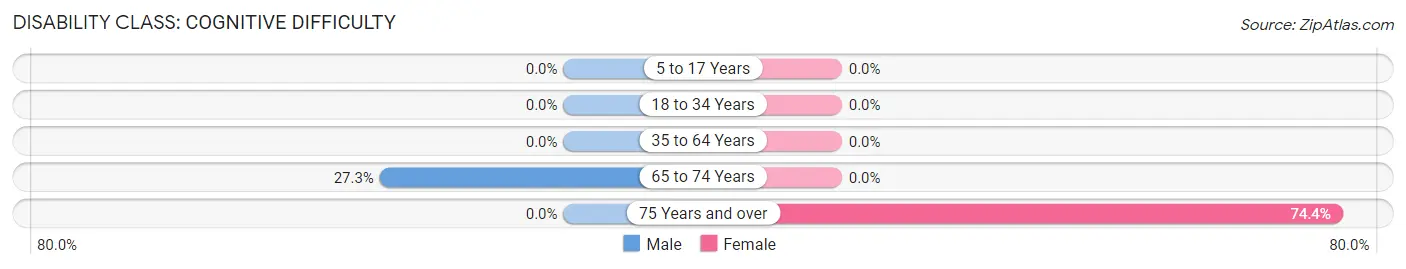
| Age Bracket | Male | Female |
| 5 to 17 Years | 0 (0.0%) | 0 (0.0%) |
| 18 to 34 Years | 0 (0.0%) | 0 (0.0%) |
| 35 to 64 Years | 0 (0.0%) | 0 (0.0%) |
| 65 to 74 Years | 6 (27.3%) | 0 (0.0%) |
| 75 Years and over | 0 (0.0%) | 29 (74.4%) |
Disability Class: Ambulatory Difficulty
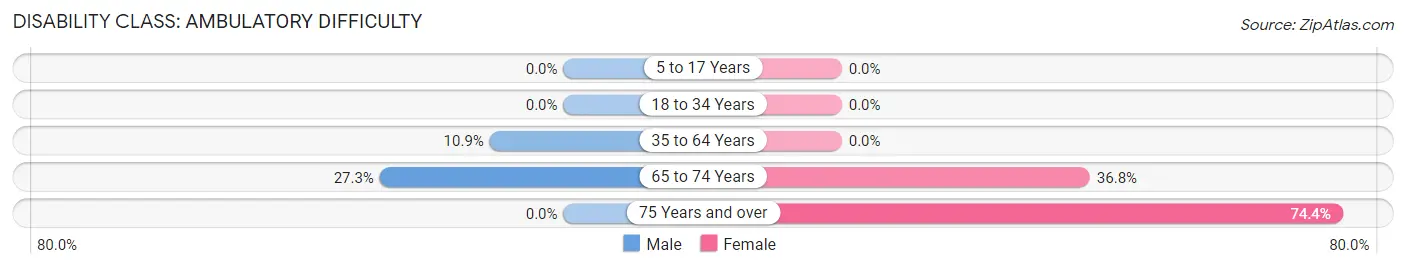
| Age Bracket | Male | Female |
| 5 to 17 Years | 0 (0.0%) | 0 (0.0%) |
| 18 to 34 Years | 0 (0.0%) | 0 (0.0%) |
| 35 to 64 Years | 7 (10.9%) | 0 (0.0%) |
| 65 to 74 Years | 6 (27.3%) | 7 (36.8%) |
| 75 Years and over | 0 (0.0%) | 29 (74.4%) |
Disability Class: Self-Care Difficulty
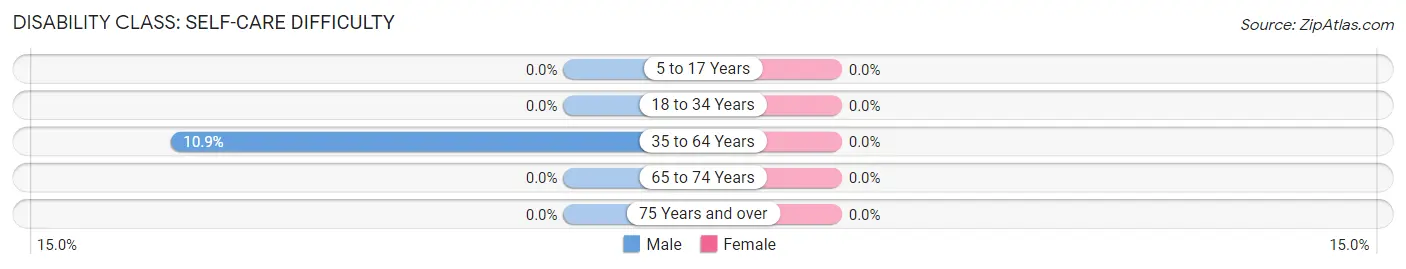
| Age Bracket | Male | Female |
| 5 to 17 Years | 0 (0.0%) | 0 (0.0%) |
| 18 to 34 Years | 0 (0.0%) | 0 (0.0%) |
| 35 to 64 Years | 7 (10.9%) | 0 (0.0%) |
| 65 to 74 Years | 0 (0.0%) | 0 (0.0%) |
| 75 Years and over | 0 (0.0%) | 0 (0.0%) |
Technology Access in Holiday Beach
Computing Device Access in Holiday Beach
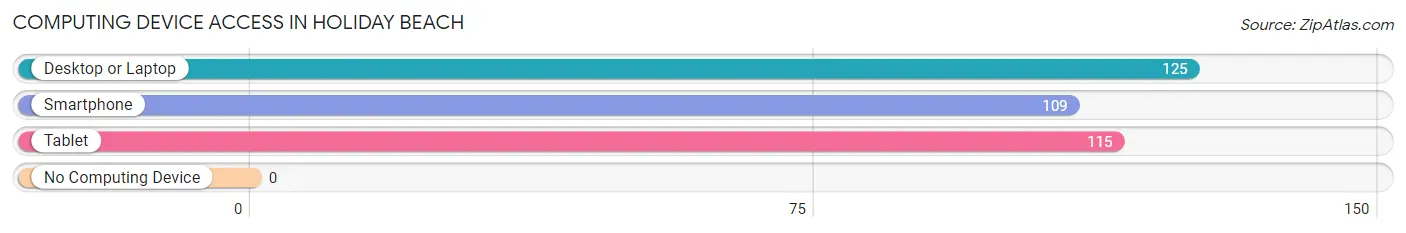
| Device Type | # Households | % Households |
| Desktop or Laptop | 125 | 100.0% |
| Smartphone | 109 | 87.2% |
| Tablet | 115 | 92.0% |
| No Computing Device | 0 | 0.0% |
| Total | 125 | 100.0% |
Internet Access in Holiday Beach
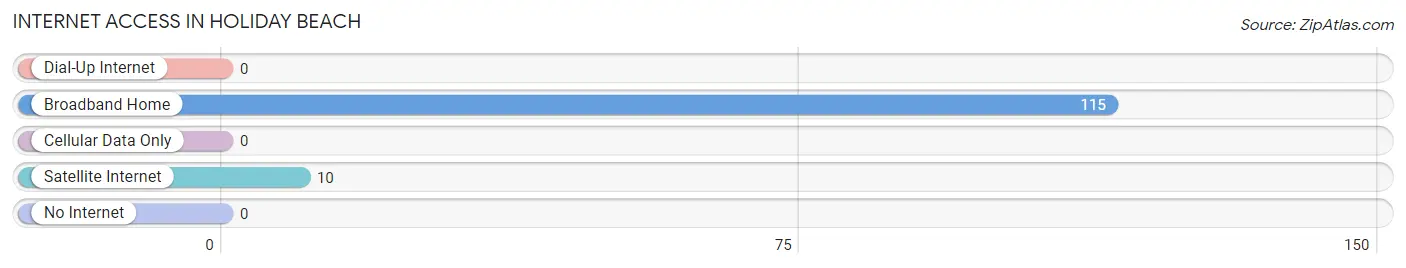
| Internet Type | # Households | % Households |
| Dial-Up Internet | 0 | 0.0% |
| Broadband Home | 115 | 92.0% |
| Cellular Data Only | 0 | 0.0% |
| Satellite Internet | 10 | 8.0% |
| No Internet | 0 | 0.0% |
| Total | 125 | 100.0% |
Holiday Beach Summary
Holiday Beach is a small unincorporated community located in Nueces County, Texas, United States. It is situated on the Gulf of Mexico, approximately 20 miles south of Corpus Christi. The community is part of the Corpus Christi Metropolitan Statistical Area.
History
Holiday Beach was originally a fishing village, established in the late 1800s. The community was named after the Holiday family, who were among the first settlers in the area. The Holiday family owned a large tract of land that stretched from the Gulf of Mexico to the Nueces River.
In the early 1900s, the Holiday family began to develop the area for tourism. They built a pier and a hotel, and began to attract visitors from all over the country. The area quickly became a popular destination for fishing, swimming, and other recreational activities.
In the 1950s, the Holiday family sold the land to developers, who began to build vacation homes and condominiums. The area quickly became a popular destination for vacationers, and the population of Holiday Beach began to grow.
Geography
Holiday Beach is located on the Gulf of Mexico, approximately 20 miles south of Corpus Christi. The community is situated on a narrow strip of land between the Gulf of Mexico and the Nueces River. The area is characterized by sandy beaches, dunes, and marshlands.
The climate in Holiday Beach is subtropical, with hot, humid summers and mild winters. The average temperature in the summer is around 90°F, and the average temperature in the winter is around 60°F.
Economy
The economy of Holiday Beach is largely based on tourism. The area is a popular destination for vacationers, and there are numerous hotels, restaurants, and other businesses catering to tourists.
The fishing industry is also an important part of the local economy. The area is home to a variety of fish, including redfish, speckled trout, and flounder.
Demographics
As of the 2010 census, the population of Holiday Beach was 1,845. The racial makeup of the community was 79.3% White, 0.7% African American, 0.2% Native American, 0.2% Asian, 0.1% Pacific Islander, 17.3% from other races, and 2.3% from two or more races. Hispanic or Latino of any race were 33.3% of the population.
The median household income in Holiday Beach was $37,917, and the median family income was $41,250. The per capita income was $17,945. About 17.3% of families and 20.2% of the population were below the poverty line, including 28.3% of those under age 18 and 10.2% of those age 65 or over.
Common Questions
What is Per Capita Income in Holiday Beach?
Per Capita income in Holiday Beach is $35,963.
What is the Median Family Income in Holiday Beach?
Median Family Income in Holiday Beach is $96,579.
What is the Median Household income in Holiday Beach?
Median Household Income in Holiday Beach is $95,066.
What is Inequality or Gini Index in Holiday Beach?
Inequality or Gini Index in Holiday Beach is 0.21.
What is the Total Population of Holiday Beach?
Total Population of Holiday Beach is 291.
What is the Total Male Population of Holiday Beach?
Total Male Population of Holiday Beach is 131.
What is the Total Female Population of Holiday Beach?
Total Female Population of Holiday Beach is 160.
What is the Ratio of Males per 100 Females in Holiday Beach?
There are 81.88 Males per 100 Females in Holiday Beach.
What is the Ratio of Females per 100 Males in Holiday Beach?
There are 122.14 Females per 100 Males in Holiday Beach.
What is the Median Population Age in Holiday Beach?
Median Population Age in Holiday Beach is 52.5 Years.
What is the Average Family Size in Holiday Beach
Average Family Size in Holiday Beach is 2.3 People.
What is the Average Household Size in Holiday Beach
Average Household Size in Holiday Beach is 2.3 People.
How Large is the Labor Force in Holiday Beach?
There are 105 People in the Labor Forcein in Holiday Beach.
What is the Percentage of People in the Labor Force in Holiday Beach?
44.5% of People are in the Labor Force in Holiday Beach.
What is the Unemployment Rate in Holiday Beach?
Unemployment Rate in Holiday Beach is 18.1%.