Hewitt, TX Map & Demographics
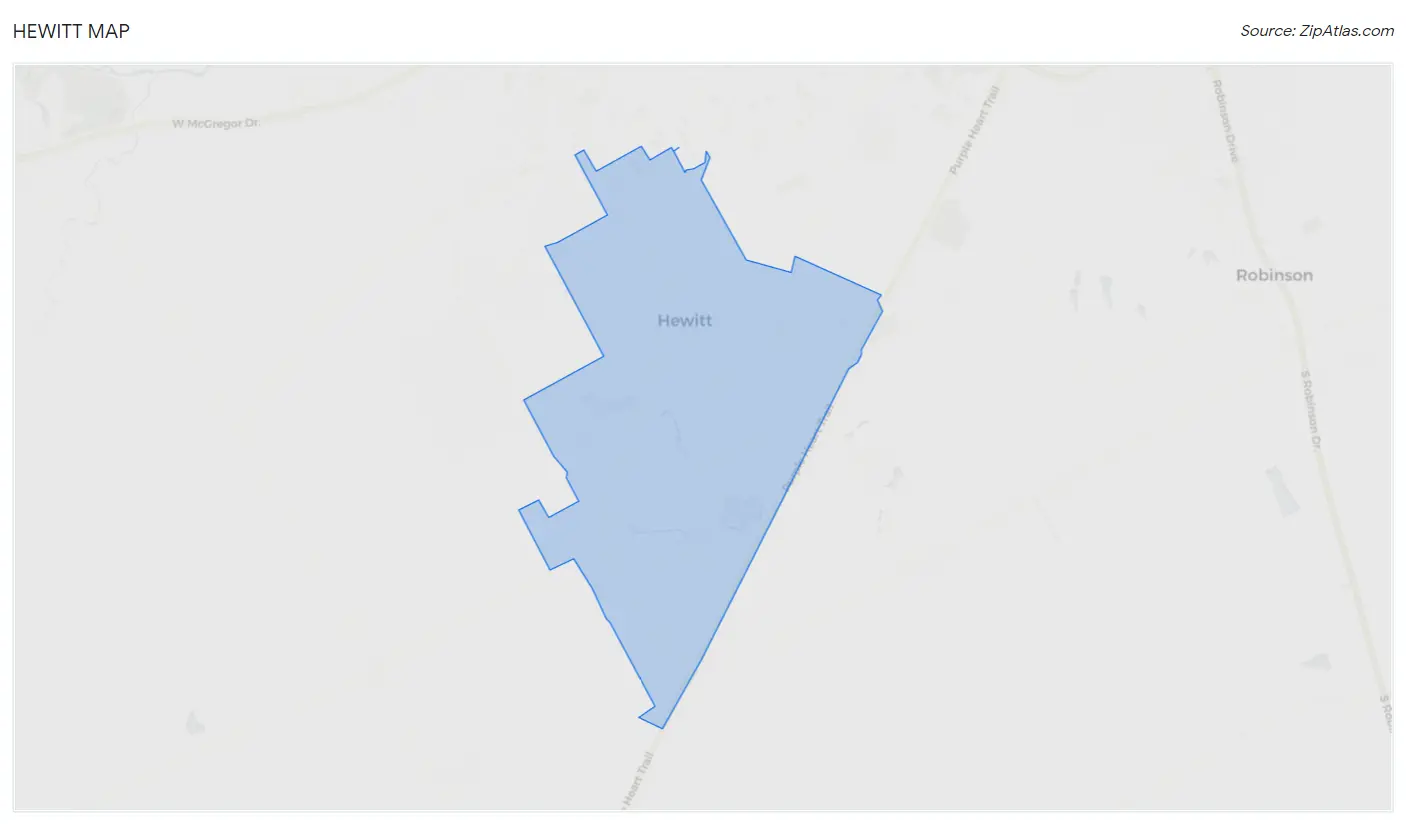
Hewitt Map
Hewitt Overview
$34,883
PER CAPITA INCOME
$87,738
AVG FAMILY INCOME
$75,898
AVG HOUSEHOLD INCOME
33.0%
WAGE / INCOME GAP [ % ]
67.0¢/ $1
WAGE / INCOME GAP [ $ ]
$15,040
FAMILY INCOME DEFICIT
0.38
INEQUALITY / GINI INDEX
16,034
TOTAL POPULATION
7,429
MALE POPULATION
8,605
FEMALE POPULATION
86.33
MALES / 100 FEMALES
115.83
FEMALES / 100 MALES
36.3
MEDIAN AGE
3.1
AVG FAMILY SIZE
2.7
AVG HOUSEHOLD SIZE
8,278
LABOR FORCE [ PEOPLE ]
66.0%
PERCENT IN LABOR FORCE
4.7%
UNEMPLOYMENT RATE
Hewitt Zip Codes
Hewitt Area Codes
Income in Hewitt
Income Overview in Hewitt
Per Capita Income in Hewitt is $34,883, while median incomes of families and households are $87,738 and $75,898 respectively.
| Characteristic | Number | Measure |
| Per Capita Income | 16,034 | $34,883 |
| Median Family Income | 4,336 | $87,738 |
| Mean Family Income | 4,336 | $103,625 |
| Median Household Income | 5,955 | $75,898 |
| Mean Household Income | 5,955 | $91,570 |
| Income Deficit | 4,336 | $15,040 |
| Wage / Income Gap (%) | 16,034 | 33.03% |
| Wage / Income Gap ($) | 16,034 | 66.97¢ per $1 |
| Gini / Inequality Index | 16,034 | 0.38 |
Earnings by Sex in Hewitt
Average Earnings in Hewitt are $46,113, $53,999 for men and $36,163 for women, a difference of 33.0%.
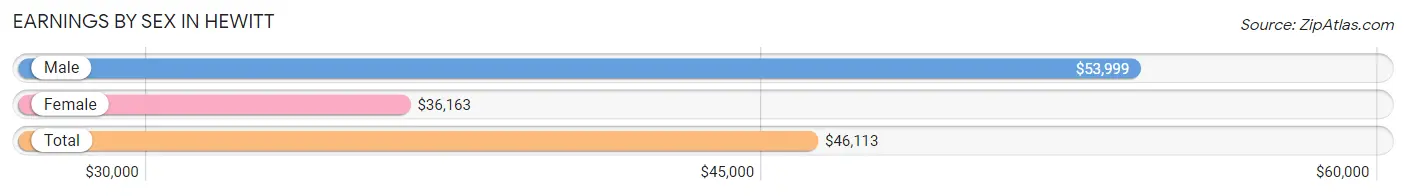
| Sex | Number | Average Earnings |
| Male | 4,189 (49.3%) | $53,999 |
| Female | 4,309 (50.7%) | $36,163 |
| Total | 8,498 (100.0%) | $46,113 |
Earnings by Sex by Income Bracket in Hewitt
The most common earnings brackets in Hewitt are $100,000+ for men (628 | 15.0%) and $75,000 to $99,999 for women (417 | 9.7%).
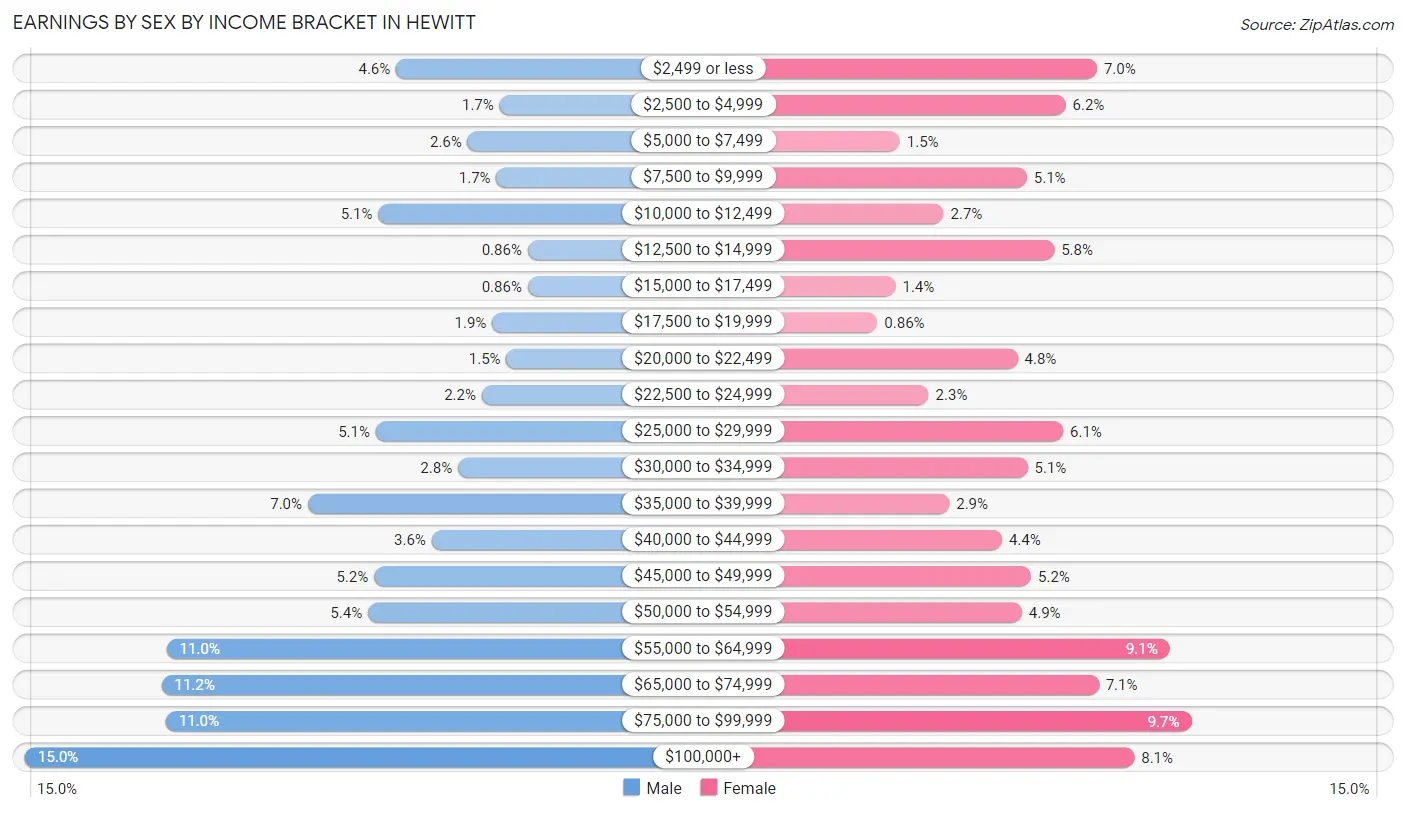
| Income | Male | Female |
| $2,499 or less | 191 (4.6%) | 303 (7.0%) |
| $2,500 to $4,999 | 69 (1.7%) | 265 (6.1%) |
| $5,000 to $7,499 | 107 (2.5%) | 64 (1.5%) |
| $7,500 to $9,999 | 73 (1.7%) | 218 (5.1%) |
| $10,000 to $12,499 | 212 (5.1%) | 117 (2.7%) |
| $12,500 to $14,999 | 36 (0.9%) | 251 (5.8%) |
| $15,000 to $17,499 | 36 (0.9%) | 59 (1.4%) |
| $17,500 to $19,999 | 78 (1.9%) | 37 (0.9%) |
| $20,000 to $22,499 | 61 (1.5%) | 207 (4.8%) |
| $22,500 to $24,999 | 90 (2.1%) | 99 (2.3%) |
| $25,000 to $29,999 | 215 (5.1%) | 262 (6.1%) |
| $30,000 to $34,999 | 118 (2.8%) | 219 (5.1%) |
| $35,000 to $39,999 | 295 (7.0%) | 124 (2.9%) |
| $40,000 to $44,999 | 149 (3.6%) | 188 (4.4%) |
| $45,000 to $49,999 | 217 (5.2%) | 223 (5.2%) |
| $50,000 to $54,999 | 224 (5.3%) | 212 (4.9%) |
| $55,000 to $64,999 | 461 (11.0%) | 391 (9.1%) |
| $65,000 to $74,999 | 467 (11.2%) | 305 (7.1%) |
| $75,000 to $99,999 | 462 (11.0%) | 417 (9.7%) |
| $100,000+ | 628 (15.0%) | 348 (8.1%) |
| Total | 4,189 (100.0%) | 4,309 (100.0%) |
Earnings by Sex by Educational Attainment in Hewitt
Average earnings in Hewitt are $60,422 for men and $47,928 for women, a difference of 20.7%. Men with an educational attainment of graduate degree enjoy the highest average annual earnings of $71,940, while those with less than high school education earn the least with $54,014. Women with an educational attainment of graduate degree earn the most with the average annual earnings of $76,913, while those with high school diploma education have the smallest earnings of $22,044.
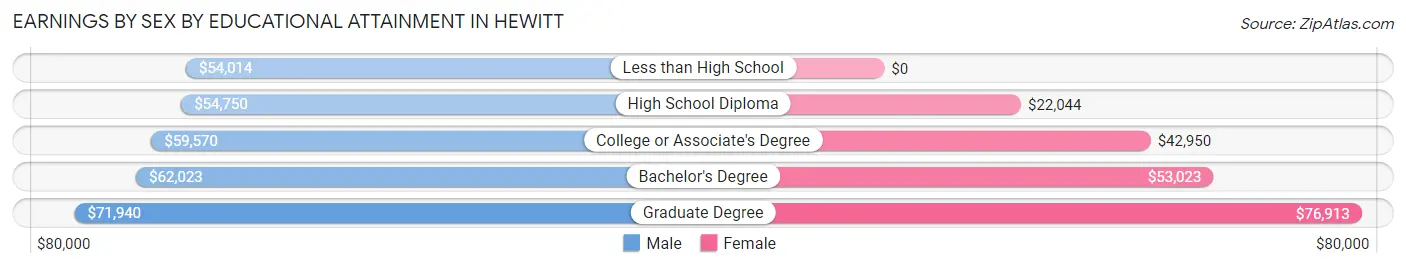
| Educational Attainment | Male Income | Female Income |
| Less than High School | $54,014 | $0 |
| High School Diploma | $54,750 | $22,044 |
| College or Associate's Degree | $59,570 | $42,950 |
| Bachelor's Degree | $62,023 | $53,023 |
| Graduate Degree | $71,940 | $76,913 |
| Total | $60,422 | $47,928 |
Family Income in Hewitt
Family Income Brackets in Hewitt
According to the Hewitt family income data, there are 1,002 families falling into the $100,000 to $149,999 income range, which is the most common income bracket and makes up 23.1% of all families. Conversely, the $10,000 to $14,999 income bracket is the least frequent group with only 30 families (0.7%) belonging to this category.
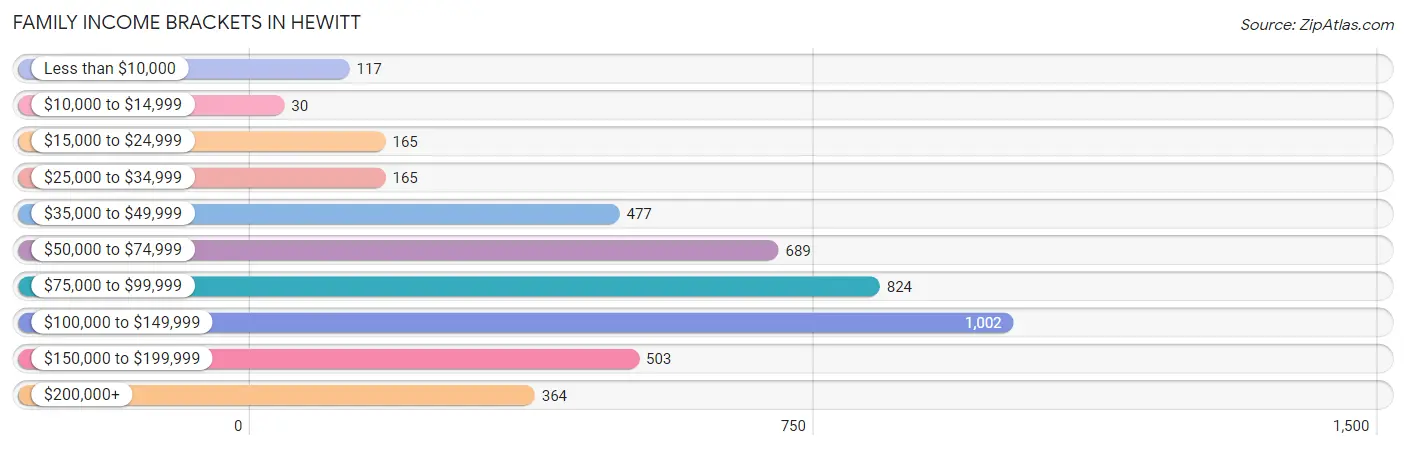
| Income Bracket | # Families | % Families |
| Less than $10,000 | 117 | 2.7% |
| $10,000 to $14,999 | 30 | 0.7% |
| $15,000 to $24,999 | 165 | 3.8% |
| $25,000 to $34,999 | 165 | 3.8% |
| $35,000 to $49,999 | 477 | 11.0% |
| $50,000 to $74,999 | 689 | 15.9% |
| $75,000 to $99,999 | 824 | 19.0% |
| $100,000 to $149,999 | 1,002 | 23.1% |
| $150,000 to $199,999 | 503 | 11.6% |
| $200,000+ | 364 | 8.4% |
Family Income by Famaliy Size in Hewitt
4-person families (874 | 20.2%) account for the highest median family income in Hewitt with $109,567 per family, while 2-person families (2,091 | 48.2%) have the highest median income of $41,753 per family member.
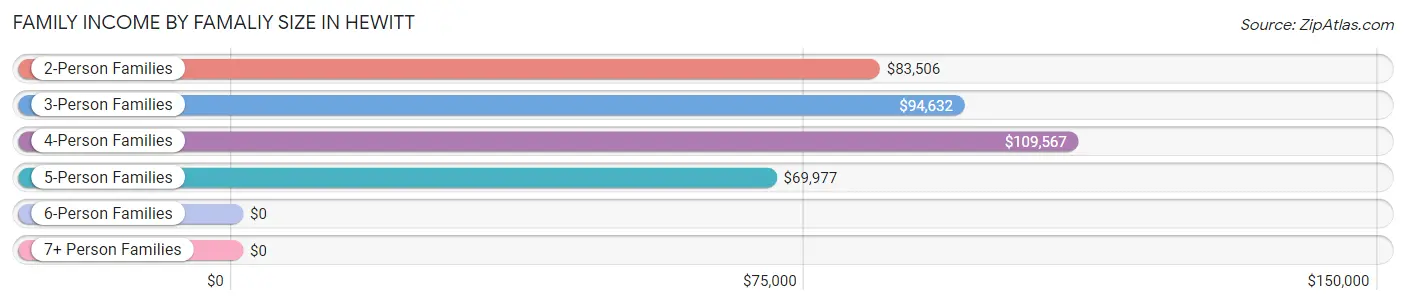
| Income Bracket | # Families | Median Income |
| 2-Person Families | 2,091 (48.2%) | $83,506 |
| 3-Person Families | 707 (16.3%) | $94,632 |
| 4-Person Families | 874 (20.2%) | $109,567 |
| 5-Person Families | 448 (10.3%) | $69,977 |
| 6-Person Families | 80 (1.8%) | $0 |
| 7+ Person Families | 136 (3.1%) | $0 |
| Total | 4,336 (100.0%) | $87,738 |
Family Income by Number of Earners in Hewitt
The median family income in Hewitt is $87,738, with families comprising 2 earners (1,790) having the highest median family income of $116,905, while families with 1 earner (1,276) have the lowest median family income of $68,125, accounting for 41.3% and 29.4% of families, respectively.
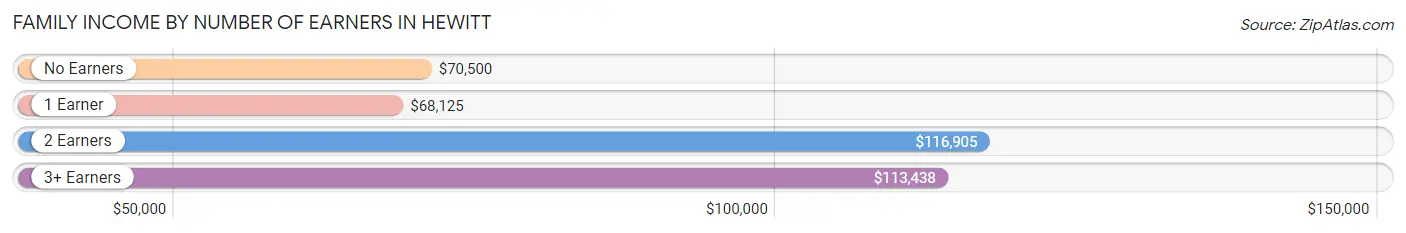
| Number of Earners | # Families | Median Income |
| No Earners | 614 (14.2%) | $70,500 |
| 1 Earner | 1,276 (29.4%) | $68,125 |
| 2 Earners | 1,790 (41.3%) | $116,905 |
| 3+ Earners | 656 (15.1%) | $113,438 |
| Total | 4,336 (100.0%) | $87,738 |
Household Income in Hewitt
Household Income Brackets in Hewitt
With 1,161 households falling in the category, the $100,000 to $149,999 income range is the most frequent in Hewitt, accounting for 19.5% of all households. In contrast, only 42 households (0.7%) fall into the $10,000 to $14,999 income bracket, making it the least populous group.
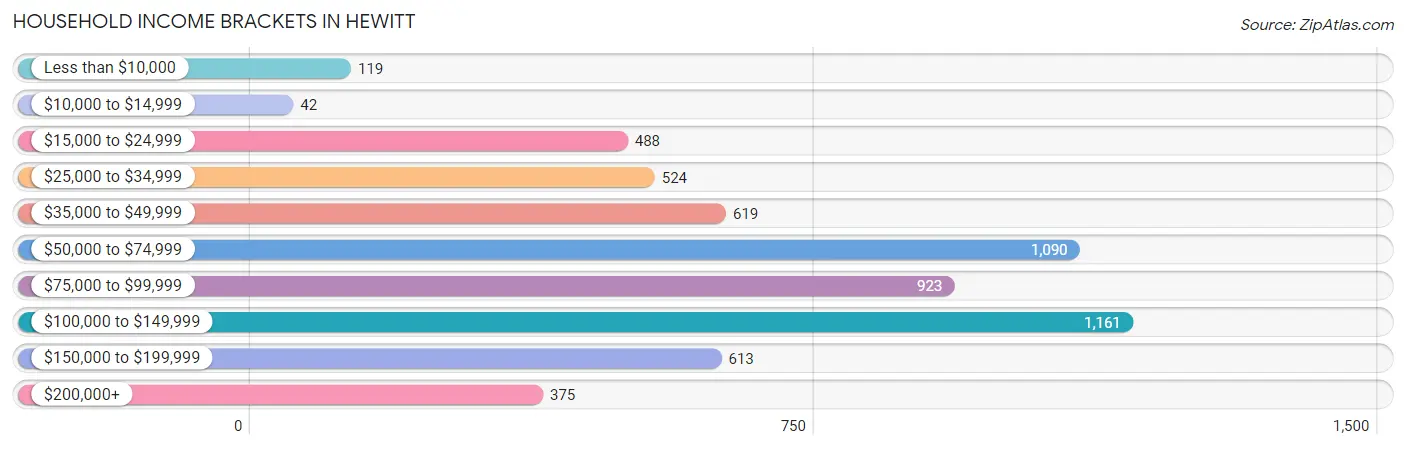
| Income Bracket | # Households | % Households |
| Less than $10,000 | 119 | 2.0% |
| $10,000 to $14,999 | 42 | 0.7% |
| $15,000 to $24,999 | 488 | 8.2% |
| $25,000 to $34,999 | 524 | 8.8% |
| $35,000 to $49,999 | 619 | 10.4% |
| $50,000 to $74,999 | 1,090 | 18.3% |
| $75,000 to $99,999 | 923 | 15.5% |
| $100,000 to $149,999 | 1,161 | 19.5% |
| $150,000 to $199,999 | 613 | 10.3% |
| $200,000+ | 375 | 6.3% |
Household Income by Householder Age in Hewitt
The median household income in Hewitt is $75,898, with the highest median household income of $111,830 found in the 45 to 64 years age bracket for the primary householder. A total of 1,806 households (30.3%) fall into this category. Meanwhile, the 15 to 24 years age bracket for the primary householder has the lowest median household income of $41,012, with 290 households (4.9%) in this group.
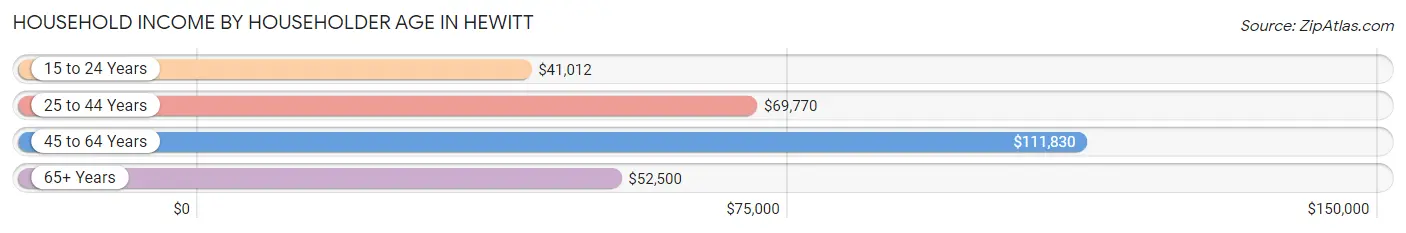
| Income Bracket | # Households | Median Income |
| 15 to 24 Years | 290 (4.9%) | $41,012 |
| 25 to 44 Years | 2,195 (36.9%) | $69,770 |
| 45 to 64 Years | 1,806 (30.3%) | $111,830 |
| 65+ Years | 1,664 (27.9%) | $52,500 |
| Total | 5,955 (100.0%) | $75,898 |
Poverty in Hewitt
Income Below Poverty by Sex and Age in Hewitt
With 6.2% poverty level for males and 8.2% for females among the residents of Hewitt, under 5 year old males and under 5 year old females are the most vulnerable to poverty, with 111 males (25.1%) and 130 females (55.3%) in their respective age groups living below the poverty level.
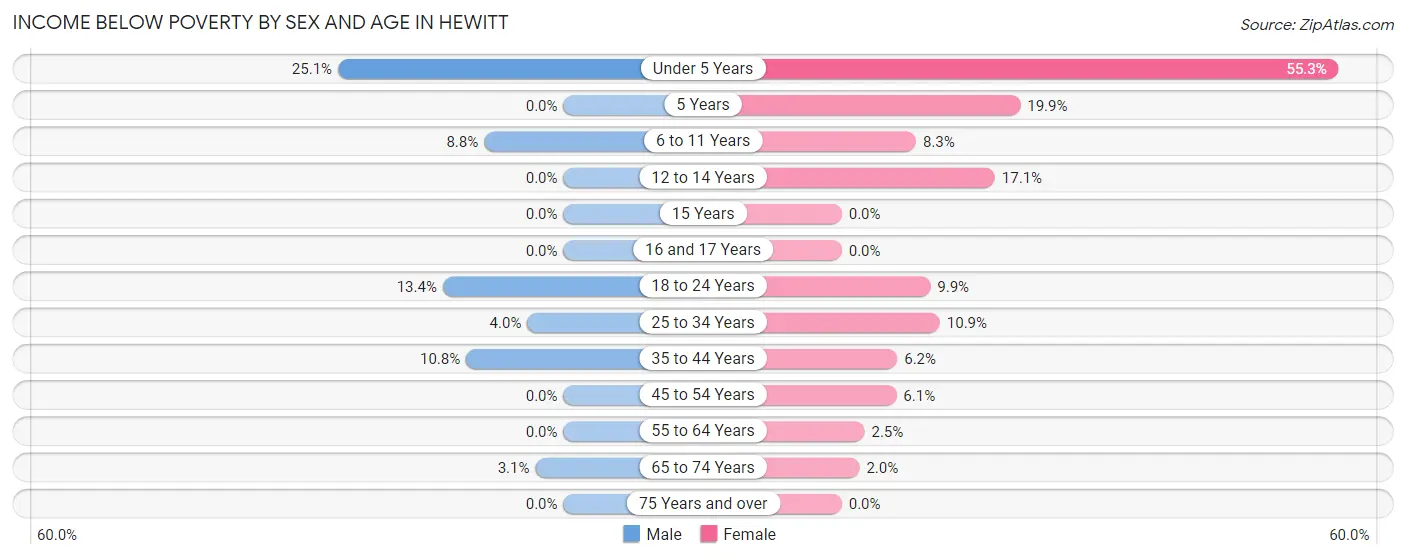
| Age Bracket | Male | Female |
| Under 5 Years | 111 (25.1%) | 130 (55.3%) |
| 5 Years | 0 (0.0%) | 32 (19.9%) |
| 6 to 11 Years | 64 (8.8%) | 53 (8.3%) |
| 12 to 14 Years | 0 (0.0%) | 104 (17.1%) |
| 15 Years | 0 (0.0%) | 0 (0.0%) |
| 16 and 17 Years | 0 (0.0%) | 0 (0.0%) |
| 18 to 24 Years | 101 (13.4%) | 87 (9.9%) |
| 25 to 34 Years | 42 (4.0%) | 106 (10.9%) |
| 35 to 44 Years | 120 (10.8%) | 78 (6.2%) |
| 45 to 54 Years | 0 (0.0%) | 70 (6.1%) |
| 55 to 64 Years | 0 (0.0%) | 19 (2.5%) |
| 65 to 74 Years | 18 (3.1%) | 18 (2.0%) |
| 75 Years and over | 0 (0.0%) | 0 (0.0%) |
| Total | 456 (6.2%) | 697 (8.2%) |
Income Above Poverty by Sex and Age in Hewitt
According to the poverty statistics in Hewitt, males aged 5 years and females aged 15 years are the age groups that are most secure financially, with 100.0% of males and 100.0% of females in these age groups living above the poverty line.
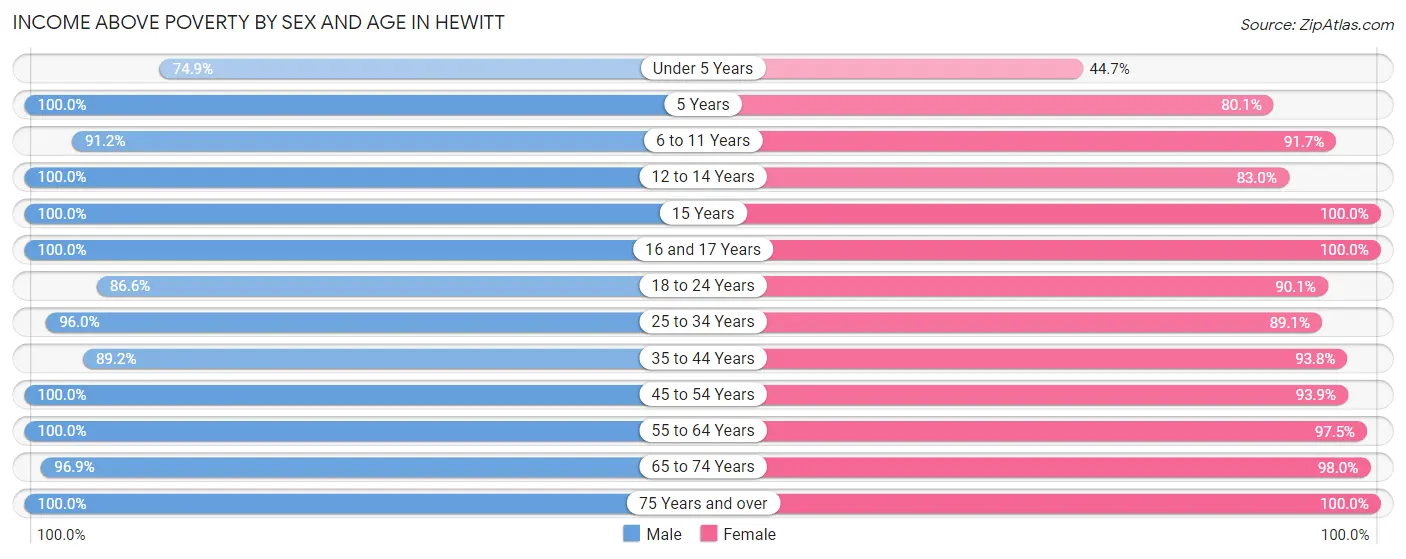
| Age Bracket | Male | Female |
| Under 5 Years | 331 (74.9%) | 105 (44.7%) |
| 5 Years | 36 (100.0%) | 129 (80.1%) |
| 6 to 11 Years | 661 (91.2%) | 588 (91.7%) |
| 12 to 14 Years | 237 (100.0%) | 506 (83.0%) |
| 15 Years | 242 (100.0%) | 118 (100.0%) |
| 16 and 17 Years | 181 (100.0%) | 152 (100.0%) |
| 18 to 24 Years | 651 (86.6%) | 795 (90.1%) |
| 25 to 34 Years | 1,003 (96.0%) | 865 (89.1%) |
| 35 to 44 Years | 987 (89.2%) | 1,184 (93.8%) |
| 45 to 54 Years | 903 (100.0%) | 1,081 (93.9%) |
| 55 to 64 Years | 721 (100.0%) | 731 (97.5%) |
| 65 to 74 Years | 558 (96.9%) | 897 (98.0%) |
| 75 Years and over | 381 (100.0%) | 708 (100.0%) |
| Total | 6,892 (93.8%) | 7,859 (91.8%) |
Income Below Poverty Among Married-Couple Families in Hewitt
The poverty statistics for married-couple families in Hewitt show that 3.4% or 119 of the total 3,468 families live below the poverty line. Families with 3 or 4 children have the highest poverty rate of 14.3%, comprising of 37 families. On the other hand, families with 1 or 2 children have the lowest poverty rate of 0.0%, which includes 0 families.
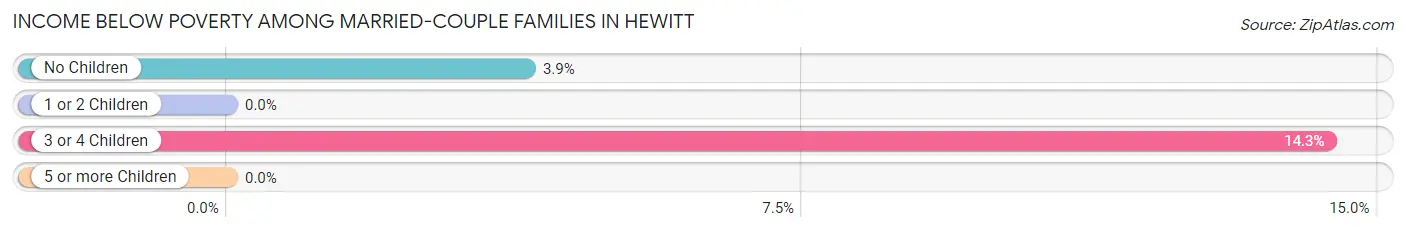
| Children | Above Poverty | Below Poverty |
| No Children | 2,027 (96.1%) | 82 (3.9%) |
| 1 or 2 Children | 969 (100.0%) | 0 (0.0%) |
| 3 or 4 Children | 221 (85.7%) | 37 (14.3%) |
| 5 or more Children | 132 (100.0%) | 0 (0.0%) |
| Total | 3,349 (96.6%) | 119 (3.4%) |
Income Below Poverty Among Single-Parent Households in Hewitt
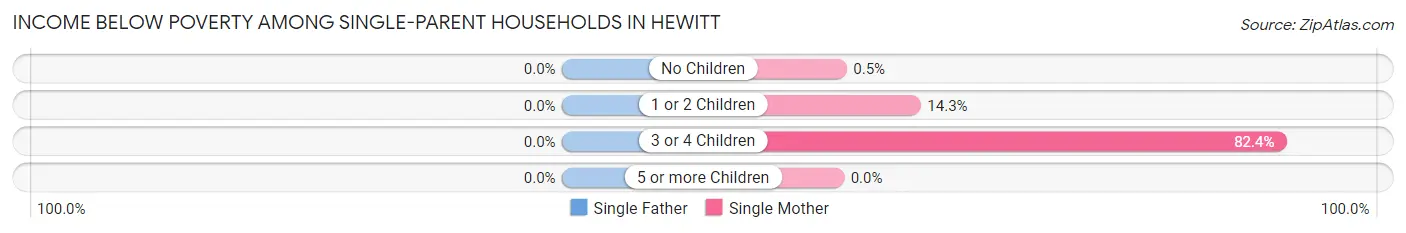
| Children | Single Father | Single Mother |
| No Children | 0 (0.0%) | 1 (0.5%) |
| 1 or 2 Children | 0 (0.0%) | 62 (14.3%) |
| 3 or 4 Children | 0 (0.0%) | 61 (82.4%) |
| 5 or more Children | 0 (0.0%) | 0 (0.0%) |
| Total | 0 (0.0%) | 124 (17.5%) |
Income Below Poverty Among Married-Couple vs Single-Parent Households in Hewitt
The poverty data for Hewitt shows that 119 of the married-couple family households (3.4%) and 124 of the single-parent households (14.3%) are living below the poverty level. Within the married-couple family households, those with 3 or 4 children have the highest poverty rate, with 37 households (14.3%) falling below the poverty line. Among the single-parent households, those with 3 or 4 children have the highest poverty rate, with 61 household (64.9%) living below poverty.
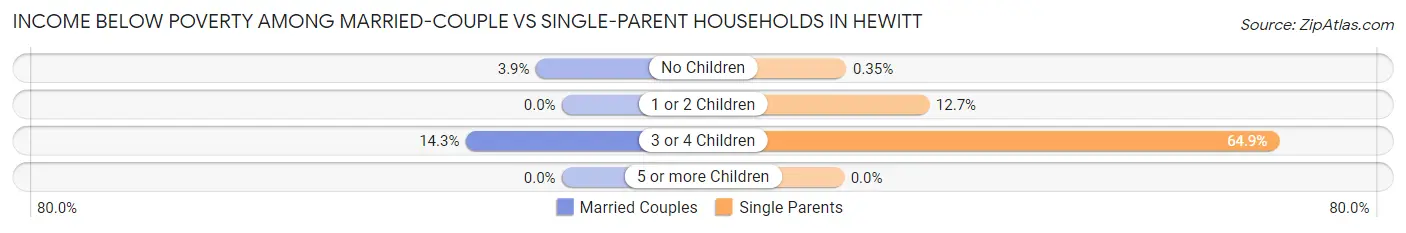
| Children | Married-Couple Families | Single-Parent Households |
| No Children | 82 (3.9%) | 1 (0.4%) |
| 1 or 2 Children | 0 (0.0%) | 62 (12.7%) |
| 3 or 4 Children | 37 (14.3%) | 61 (64.9%) |
| 5 or more Children | 0 (0.0%) | 0 (0.0%) |
| Total | 119 (3.4%) | 124 (14.3%) |
Race in Hewitt
The most populous races in Hewitt are White / Caucasian (12,716 | 79.3%), Hispanic or Latino (3,240 | 20.2%), and Two or more Races (1,499 | 9.3%).
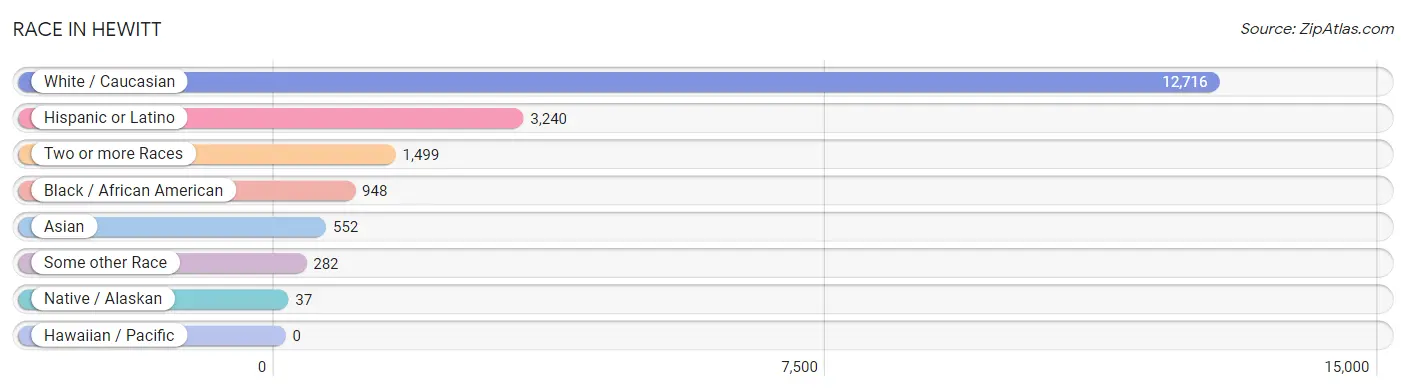
| Race | # Population | % Population |
| Asian | 552 | 3.4% |
| Black / African American | 948 | 5.9% |
| Hawaiian / Pacific | 0 | 0.0% |
| Hispanic or Latino | 3,240 | 20.2% |
| Native / Alaskan | 37 | 0.2% |
| White / Caucasian | 12,716 | 79.3% |
| Two or more Races | 1,499 | 9.3% |
| Some other Race | 282 | 1.8% |
| Total | 16,034 | 100.0% |
Ancestry in Hewitt
The most populous ancestries reported in Hewitt are Irish (2,979 | 18.6%), German (2,547 | 15.9%), Mexican (2,296 | 14.3%), English (1,817 | 11.3%), and American (804 | 5.0%), together accounting for 65.1% of all Hewitt residents.
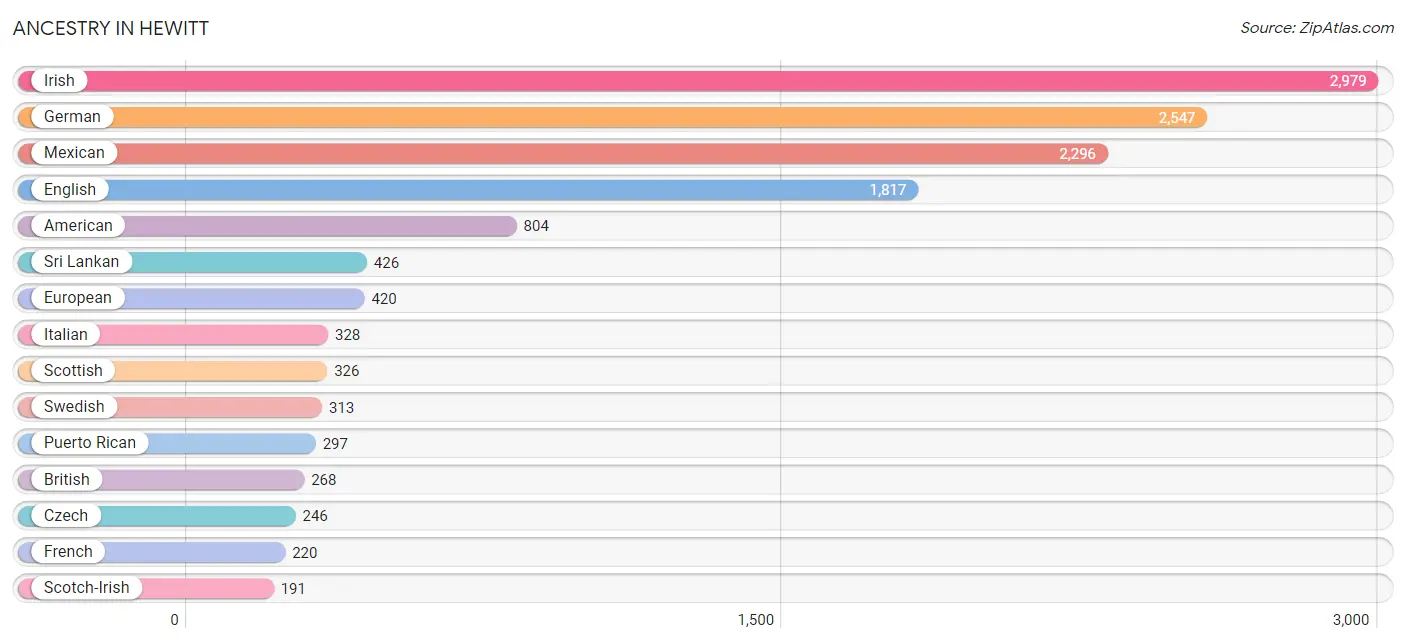
| Ancestry | # Population | % Population |
| African | 121 | 0.7% |
| American | 804 | 5.0% |
| Austrian | 46 | 0.3% |
| Bhutanese | 50 | 0.3% |
| Blackfeet | 7 | 0.0% |
| British | 268 | 1.7% |
| Canadian | 17 | 0.1% |
| Cherokee | 4 | 0.0% |
| Chickasaw | 16 | 0.1% |
| Chilean | 11 | 0.1% |
| Cuban | 46 | 0.3% |
| Czech | 246 | 1.5% |
| Danish | 65 | 0.4% |
| Dominican | 2 | 0.0% |
| Dutch | 63 | 0.4% |
| Eastern European | 34 | 0.2% |
| English | 1,817 | 11.3% |
| European | 420 | 2.6% |
| Finnish | 15 | 0.1% |
| French | 220 | 1.4% |
| French Canadian | 42 | 0.3% |
| German | 2,547 | 15.9% |
| Hungarian | 14 | 0.1% |
| Indian (Asian) | 42 | 0.3% |
| Irish | 2,979 | 18.6% |
| Iroquois | 31 | 0.2% |
| Italian | 328 | 2.1% |
| Kiowa | 14 | 0.1% |
| Korean | 158 | 1.0% |
| Macedonian | 32 | 0.2% |
| Mexican | 2,296 | 14.3% |
| Norwegian | 126 | 0.8% |
| Polish | 171 | 1.1% |
| Portuguese | 23 | 0.1% |
| Puerto Rican | 297 | 1.8% |
| Russian | 50 | 0.3% |
| Scotch-Irish | 191 | 1.2% |
| Scottish | 326 | 2.0% |
| Seminole | 31 | 0.2% |
| Sioux | 9 | 0.1% |
| Slovak | 12 | 0.1% |
| South American | 11 | 0.1% |
| Spaniard | 40 | 0.3% |
| Spanish | 24 | 0.2% |
| Sri Lankan | 426 | 2.7% |
| Subsaharan African | 121 | 0.7% |
| Swedish | 313 | 1.9% |
| Swiss | 46 | 0.3% |
| Welsh | 183 | 1.1% |
| Yugoslavian | 129 | 0.8% | View All 50 Rows |
Immigrants in Hewitt
The most numerous immigrant groups reported in Hewitt came from Asia (351 | 2.2%), South Eastern Asia (313 | 1.9%), Vietnam (286 | 1.8%), Latin America (206 | 1.3%), and Central America (195 | 1.2%), together accounting for 8.4% of all Hewitt residents.
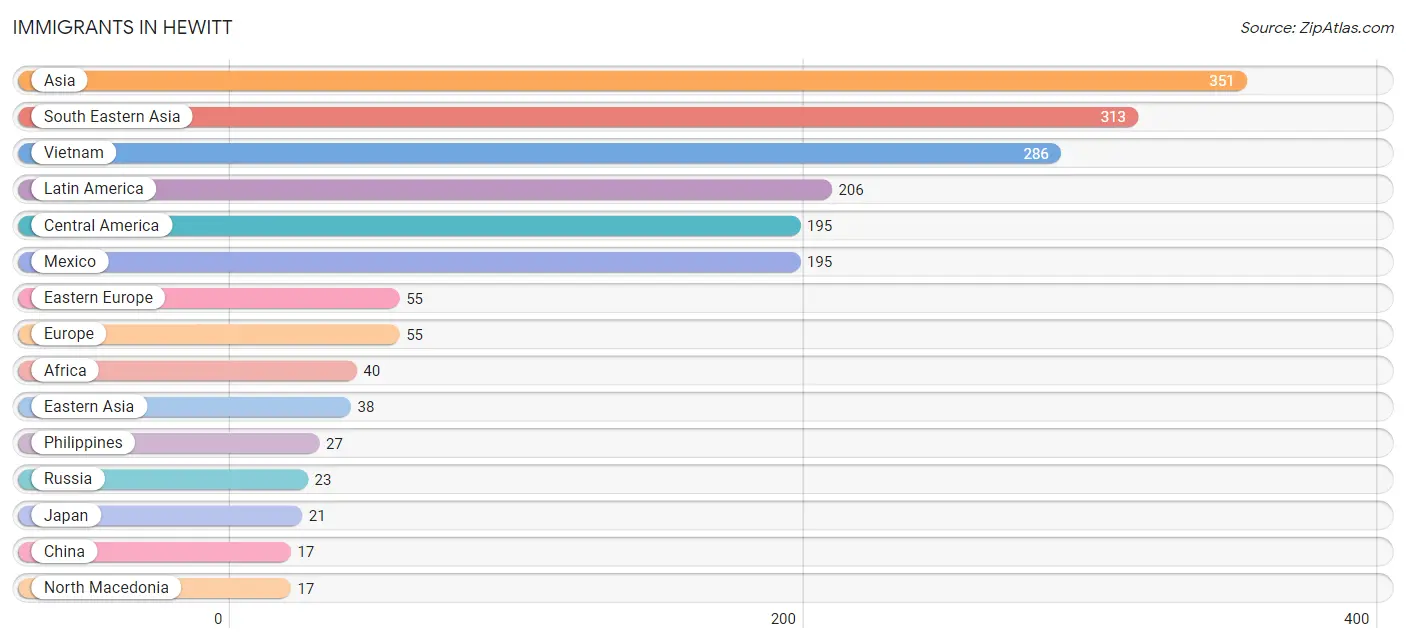
| Immigration Origin | # Population | % Population |
| Africa | 40 | 0.3% |
| Asia | 351 | 2.2% |
| Canada | 14 | 0.1% |
| Central America | 195 | 1.2% |
| Chile | 11 | 0.1% |
| China | 17 | 0.1% |
| Eastern Asia | 38 | 0.2% |
| Eastern Europe | 55 | 0.3% |
| Europe | 55 | 0.3% |
| Japan | 21 | 0.1% |
| Latin America | 206 | 1.3% |
| Mexico | 195 | 1.2% |
| North Macedonia | 17 | 0.1% |
| Philippines | 27 | 0.2% |
| Poland | 15 | 0.1% |
| Russia | 23 | 0.1% |
| South America | 11 | 0.1% |
| South Eastern Asia | 313 | 1.9% |
| Vietnam | 286 | 1.8% | View All 19 Rows |
Sex and Age in Hewitt
Sex and Age in Hewitt
The most populous age groups in Hewitt are 15 to 19 Years (634 | 8.5%) for men and 10 to 14 Years (781 | 9.1%) for women.
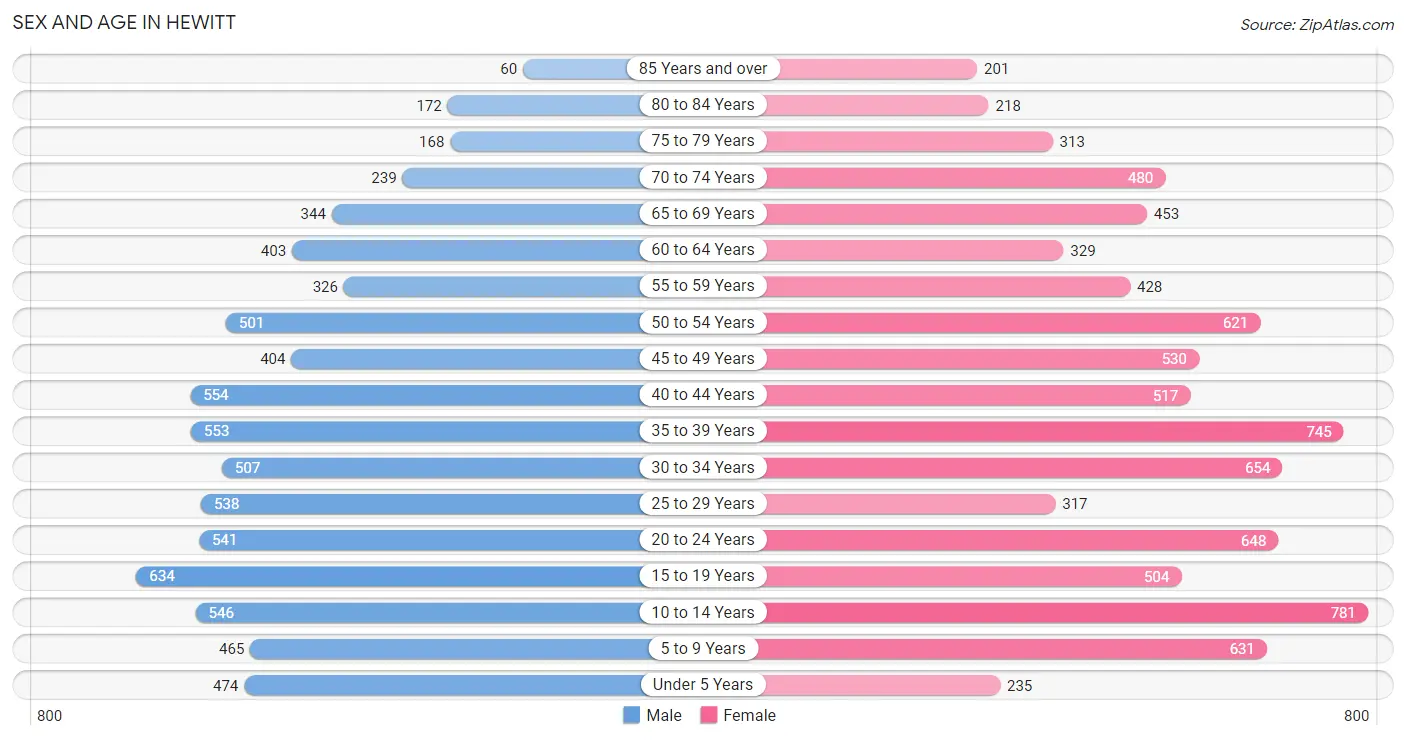
| Age Bracket | Male | Female |
| Under 5 Years | 474 (6.4%) | 235 (2.7%) |
| 5 to 9 Years | 465 (6.3%) | 631 (7.3%) |
| 10 to 14 Years | 546 (7.3%) | 781 (9.1%) |
| 15 to 19 Years | 634 (8.5%) | 504 (5.9%) |
| 20 to 24 Years | 541 (7.3%) | 648 (7.5%) |
| 25 to 29 Years | 538 (7.2%) | 317 (3.7%) |
| 30 to 34 Years | 507 (6.8%) | 654 (7.6%) |
| 35 to 39 Years | 553 (7.4%) | 745 (8.7%) |
| 40 to 44 Years | 554 (7.5%) | 517 (6.0%) |
| 45 to 49 Years | 404 (5.4%) | 530 (6.2%) |
| 50 to 54 Years | 501 (6.7%) | 621 (7.2%) |
| 55 to 59 Years | 326 (4.4%) | 428 (5.0%) |
| 60 to 64 Years | 403 (5.4%) | 329 (3.8%) |
| 65 to 69 Years | 344 (4.6%) | 453 (5.3%) |
| 70 to 74 Years | 239 (3.2%) | 480 (5.6%) |
| 75 to 79 Years | 168 (2.3%) | 313 (3.6%) |
| 80 to 84 Years | 172 (2.3%) | 218 (2.5%) |
| 85 Years and over | 60 (0.8%) | 201 (2.3%) |
| Total | 7,429 (100.0%) | 8,605 (100.0%) |
Families and Households in Hewitt
Median Family Size in Hewitt
The median family size in Hewitt is 3.15 persons per family, with single female/mother families (709 | 16.4%) accounting for the largest median family size of 3.17 persons per family. On the other hand, single male/father families (159 | 3.7%) represent the smallest median family size with 2.70 persons per family.
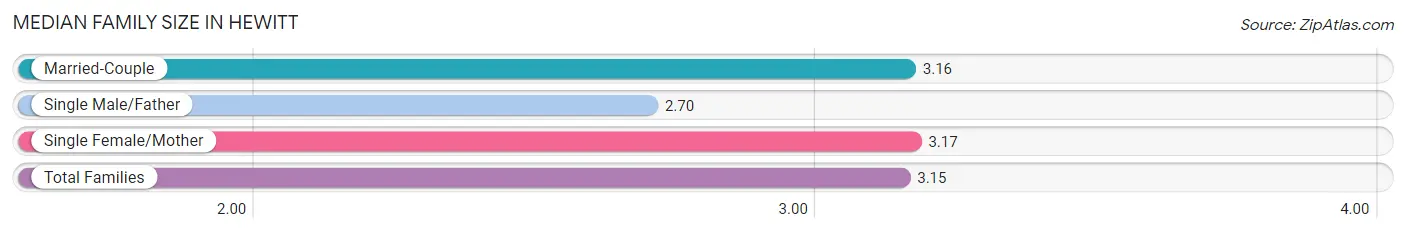
| Family Type | # Families | Family Size |
| Married-Couple | 3,468 (80.0%) | 3.16 |
| Single Male/Father | 159 (3.7%) | 2.70 |
| Single Female/Mother | 709 (16.4%) | 3.17 |
| Total Families | 4,336 (100.0%) | 3.15 |
Median Household Size in Hewitt
The median household size in Hewitt is 2.68 persons per household, with single male/father households (159 | 2.7%) accounting for the largest median household size of 3.55 persons per household. non-family households (1,619 | 27.2%) represent the smallest median household size with 1.22 persons per household.
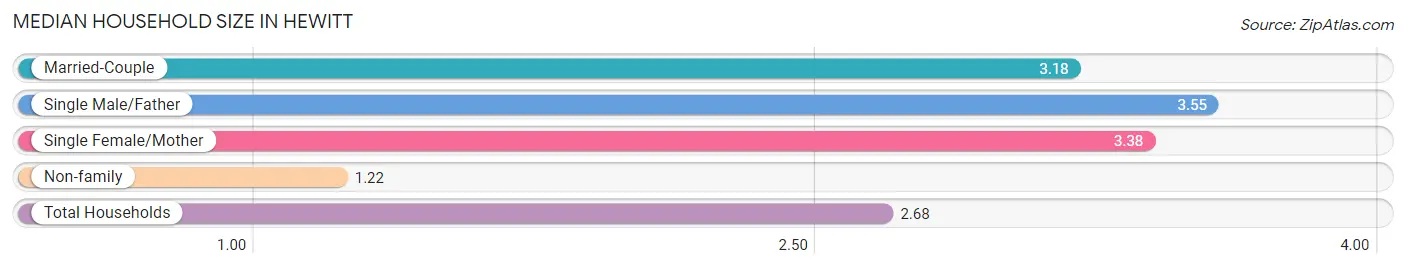
| Household Type | # Households | Household Size |
| Married-Couple | 3,468 (58.2%) | 3.18 |
| Single Male/Father | 159 (2.7%) | 3.55 |
| Single Female/Mother | 709 (11.9%) | 3.38 |
| Non-family | 1,619 (27.2%) | 1.22 |
| Total Households | 5,955 (100.0%) | 2.68 |
Household Size by Marriage Status in Hewitt
Out of a total of 5,955 households in Hewitt, 4,336 (72.8%) are family households, while 1,619 (27.2%) are nonfamily households. The most numerous type of family households are 2-person households, comprising 1,991, and the most common type of nonfamily households are 1-person households, comprising 1,383.
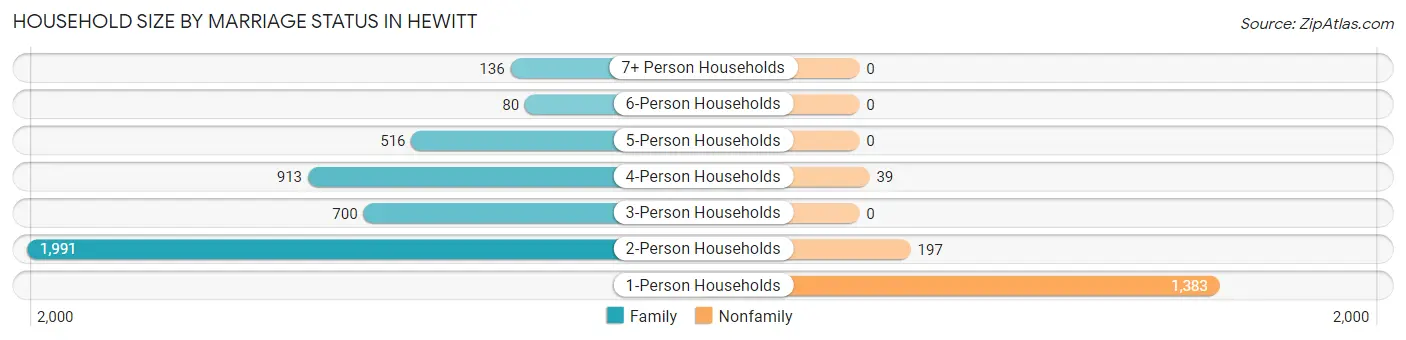
| Household Size | Family Households | Nonfamily Households |
| 1-Person Households | - | 1,383 (23.2%) |
| 2-Person Households | 1,991 (33.4%) | 197 (3.3%) |
| 3-Person Households | 700 (11.7%) | 0 (0.0%) |
| 4-Person Households | 913 (15.3%) | 39 (0.6%) |
| 5-Person Households | 516 (8.7%) | 0 (0.0%) |
| 6-Person Households | 80 (1.3%) | 0 (0.0%) |
| 7+ Person Households | 136 (2.3%) | 0 (0.0%) |
| Total | 4,336 (72.8%) | 1,619 (27.2%) |
Female Fertility in Hewitt
Fertility by Age in Hewitt
Average fertility rate in Hewitt is 15.0 births per 1,000 women. Women in the age bracket of 35 to 50 years have the highest fertility rate with 22.0 births per 1,000 women. Women in the age bracket of 35 to 50 years acount for 72.9% of all women with births.
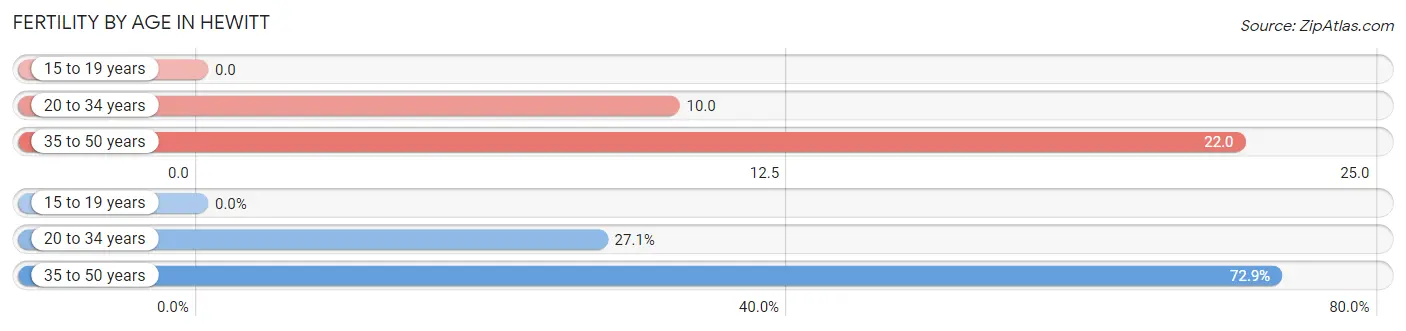
| Age Bracket | Women with Births | Births / 1,000 Women |
| 15 to 19 years | 0 (0.0%) | 0.0 |
| 20 to 34 years | 16 (27.1%) | 10.0 |
| 35 to 50 years | 43 (72.9%) | 22.0 |
| Total | 59 (100.0%) | 15.0 |
Fertility by Age by Marriage Status in Hewitt
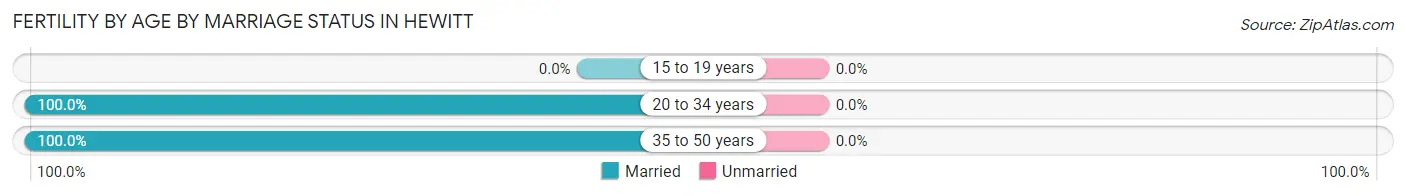
| Age Bracket | Married | Unmarried |
| 15 to 19 years | 0 (0.0%) | 0 (0.0%) |
| 20 to 34 years | 16 (100.0%) | 0 (0.0%) |
| 35 to 50 years | 43 (100.0%) | 0 (0.0%) |
| Total | 59 (100.0%) | 0 (0.0%) |
Fertility by Education in Hewitt
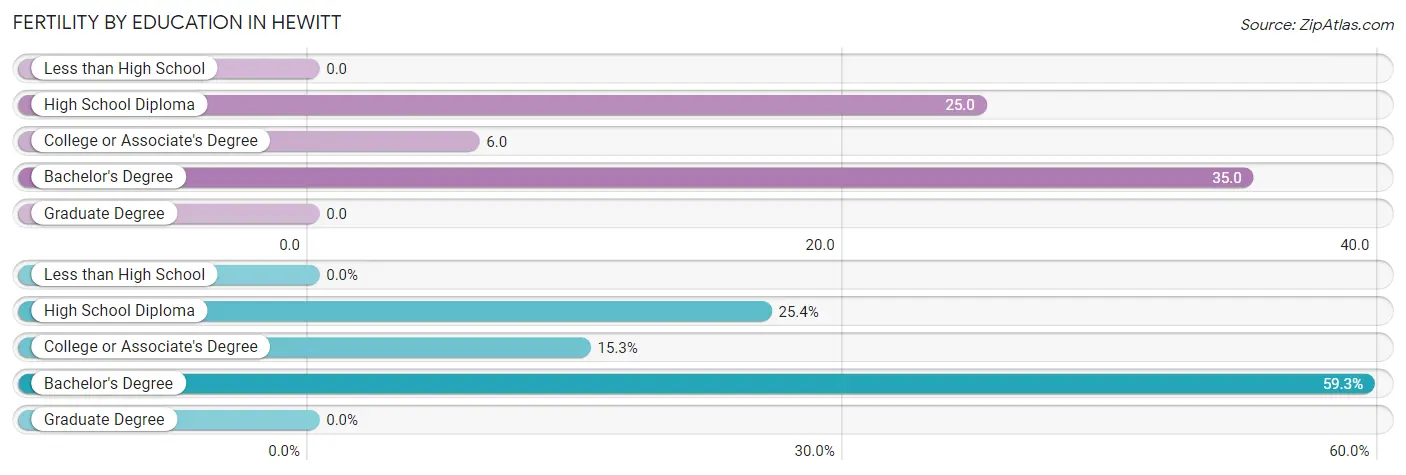
| Educational Attainment | Women with Births | Births / 1,000 Women |
| Less than High School | 0 (0.0%) | 0.0 |
| High School Diploma | 15 (25.4%) | 25.0 |
| College or Associate's Degree | 9 (15.2%) | 6.0 |
| Bachelor's Degree | 35 (59.3%) | 35.0 |
| Graduate Degree | 0 (0.0%) | 0.0 |
| Total | 59 (100.0%) | 15.0 |
Fertility by Education by Marriage Status in Hewitt
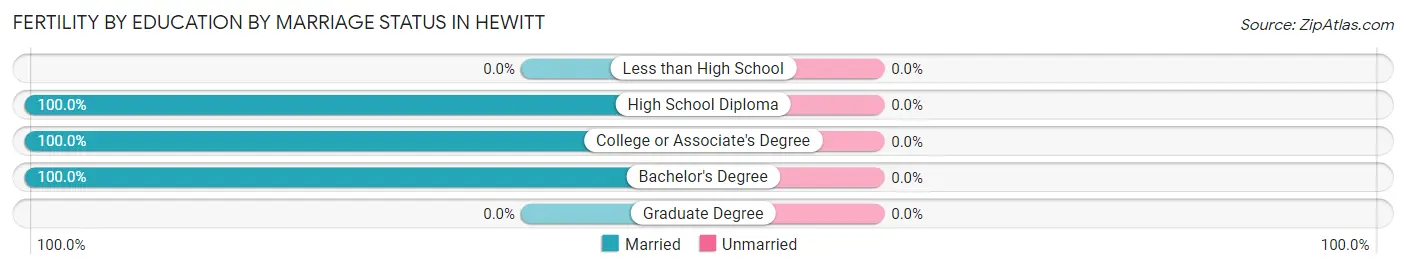
| Educational Attainment | Married | Unmarried |
| Less than High School | 0 (0.0%) | 0 (0.0%) |
| High School Diploma | 15 (100.0%) | 0 (0.0%) |
| College or Associate's Degree | 9 (100.0%) | 0 (0.0%) |
| Bachelor's Degree | 35 (100.0%) | 0 (0.0%) |
| Graduate Degree | 0 (0.0%) | 0 (0.0%) |
| Total | 59 (100.0%) | 0 (0.0%) |
Employment Characteristics in Hewitt
Employment by Class of Employer in Hewitt
Among the 7,716 employed individuals in Hewitt, private company employees (5,021 | 65.1%), local government employees (726 | 9.4%), and state government employees (702 | 9.1%) make up the most common classes of employment.
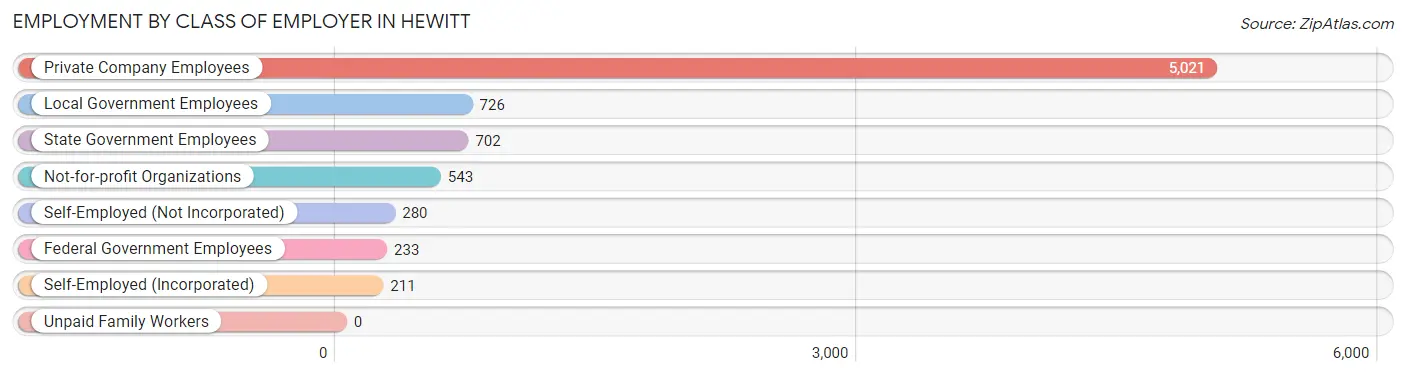
| Employer Class | # Employees | % Employees |
| Private Company Employees | 5,021 | 65.1% |
| Self-Employed (Incorporated) | 211 | 2.7% |
| Self-Employed (Not Incorporated) | 280 | 3.6% |
| Not-for-profit Organizations | 543 | 7.0% |
| Local Government Employees | 726 | 9.4% |
| State Government Employees | 702 | 9.1% |
| Federal Government Employees | 233 | 3.0% |
| Unpaid Family Workers | 0 | 0.0% |
| Total | 7,716 | 100.0% |
Employment Status by Age in Hewitt
According to the labor force statistics for Hewitt, out of the total population over 16 years of age (12,542), 66.0% or 8,278 individuals are in the labor force, with 4.7% or 389 of them unemployed. The age group with the highest labor force participation rate is 25 to 29 years, with 93.7% or 801 individuals in the labor force. Within the labor force, the 20 to 24 years age range has the highest percentage of unemployed individuals, with 16.8% or 181 of them being unemployed.
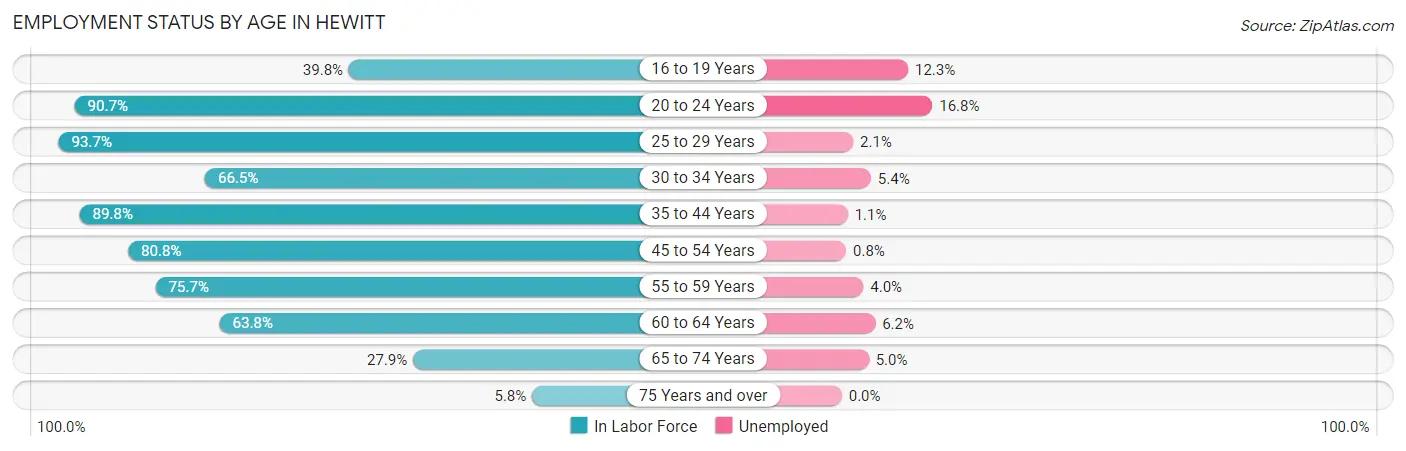
| Age Bracket | In Labor Force | Unemployed |
| 16 to 19 Years | 310 (39.8%) | 38 (12.3%) |
| 20 to 24 Years | 1,078 (90.7%) | 181 (16.8%) |
| 25 to 29 Years | 801 (93.7%) | 17 (2.1%) |
| 30 to 34 Years | 772 (66.5%) | 42 (5.4%) |
| 35 to 44 Years | 2,127 (89.8%) | 23 (1.1%) |
| 45 to 54 Years | 1,661 (80.8%) | 13 (0.8%) |
| 55 to 59 Years | 571 (75.7%) | 23 (4.0%) |
| 60 to 64 Years | 467 (63.8%) | 29 (6.2%) |
| 65 to 74 Years | 423 (27.9%) | 21 (5.0%) |
| 75 Years and over | 66 (5.8%) | 0 (0.0%) |
| Total | 8,278 (66.0%) | 389 (4.7%) |
Employment Status by Educational Attainment in Hewitt
According to labor force statistics for Hewitt, 80.7% of individuals (6,397) out of the total population between 25 and 64 years of age (7,927) are in the labor force, with 2.3% or 147 of them being unemployed. The group with the highest labor force participation rate are those with the educational attainment of bachelor's degree or higher, with 92.2% or 2,751 individuals in the labor force. Within the labor force, individuals with high school diploma education have the highest percentage of unemployment, with 11.8% or 91 of them being unemployed.
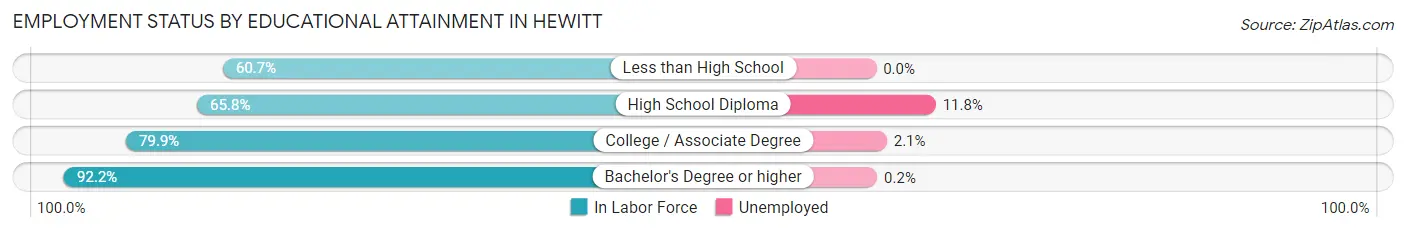
| Educational Attainment | In Labor Force | Unemployed |
| Less than High School | 426 (60.7%) | 0 (0.0%) |
| High School Diploma | 771 (65.8%) | 138 (11.8%) |
| College / Associate Degree | 2,452 (79.9%) | 64 (2.1%) |
| Bachelor's Degree or higher | 2,751 (92.2%) | 6 (0.2%) |
| Total | 6,397 (80.7%) | 182 (2.3%) |
Employment Occupations by Sex in Hewitt
Management, Business, Science and Arts Occupations
The most common Management, Business, Science and Arts occupations in Hewitt are Community & Social Service (1,366 | 17.3%), Education Instruction & Library (933 | 11.8%), Management (837 | 10.6%), Health Diagnosing & Treating (544 | 6.9%), and Computers, Engineering & Science (442 | 5.6%).
Management, Business, Science and Arts Occupations by Sex
Within the Management, Business, Science and Arts occupations in Hewitt, the most male-oriented occupations are Architecture & Engineering (79.6%), Education, Arts & Media (71.1%), and Computers, Engineering & Science (66.7%), while the most female-oriented occupations are Health Diagnosing & Treating (86.2%), Health Technologists (84.5%), and Education Instruction & Library (76.5%).
| Occupation | Male | Female |
| Management | 514 (61.4%) | 323 (38.6%) |
| Business & Financial | 102 (47.7%) | 112 (52.3%) |
| Computers, Engineering & Science | 295 (66.7%) | 147 (33.3%) |
| Computers & Mathematics | 16 (32.7%) | 33 (67.3%) |
| Architecture & Engineering | 262 (79.6%) | 67 (20.4%) |
| Life, Physical & Social Science | 17 (26.6%) | 47 (73.4%) |
| Community & Social Service | 489 (35.8%) | 877 (64.2%) |
| Education, Arts & Media | 118 (71.1%) | 48 (28.9%) |
| Legal Services & Support | 27 (36.5%) | 47 (63.5%) |
| Education Instruction & Library | 219 (23.5%) | 714 (76.5%) |
| Arts, Media & Entertainment | 125 (64.8%) | 68 (35.2%) |
| Health Diagnosing & Treating | 75 (13.8%) | 469 (86.2%) |
| Health Technologists | 51 (15.5%) | 278 (84.5%) |
| Total (Category) | 1,475 (43.3%) | 1,928 (56.7%) |
| Total (Overall) | 3,851 (48.9%) | 4,025 (51.1%) |
Services Occupations
The most common Services occupations in Hewitt are Food Preparation & Serving (368 | 4.7%), Personal Care & Service (358 | 4.5%), Cleaning & Maintenance (225 | 2.9%), Security & Protection (203 | 2.6%), and Law Enforcement (139 | 1.8%).
Services Occupations by Sex
Within the Services occupations in Hewitt, the most male-oriented occupations are Firefighting & Prevention (100.0%), Security & Protection (59.6%), and Law Enforcement (41.0%), while the most female-oriented occupations are Healthcare Support (100.0%), Personal Care & Service (80.7%), and Cleaning & Maintenance (67.6%).
| Occupation | Male | Female |
| Healthcare Support | 0 (0.0%) | 127 (100.0%) |
| Security & Protection | 121 (59.6%) | 82 (40.4%) |
| Firefighting & Prevention | 64 (100.0%) | 0 (0.0%) |
| Law Enforcement | 57 (41.0%) | 82 (59.0%) |
| Food Preparation & Serving | 125 (34.0%) | 243 (66.0%) |
| Cleaning & Maintenance | 73 (32.4%) | 152 (67.6%) |
| Personal Care & Service | 69 (19.3%) | 289 (80.7%) |
| Total (Category) | 388 (30.3%) | 893 (69.7%) |
| Total (Overall) | 3,851 (48.9%) | 4,025 (51.1%) |
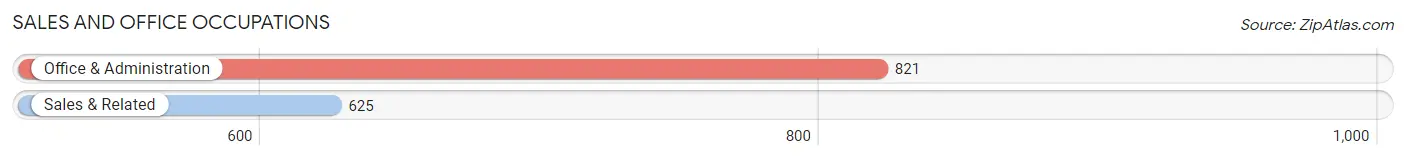
Sales and Office Occupations
The most common Sales and Office occupations in Hewitt are Office & Administration (821 | 10.4%), and Sales & Related (625 | 7.9%).
Sales and Office Occupations by Sex
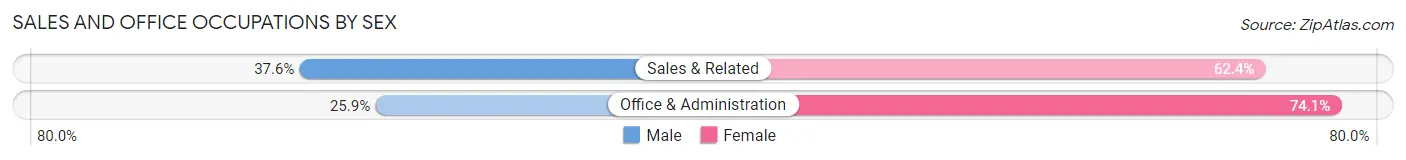
| Occupation | Male | Female |
| Sales & Related | 235 (37.6%) | 390 (62.4%) |
| Office & Administration | 213 (25.9%) | 608 (74.1%) |
| Total (Category) | 448 (31.0%) | 998 (69.0%) |
| Total (Overall) | 3,851 (48.9%) | 4,025 (51.1%) |
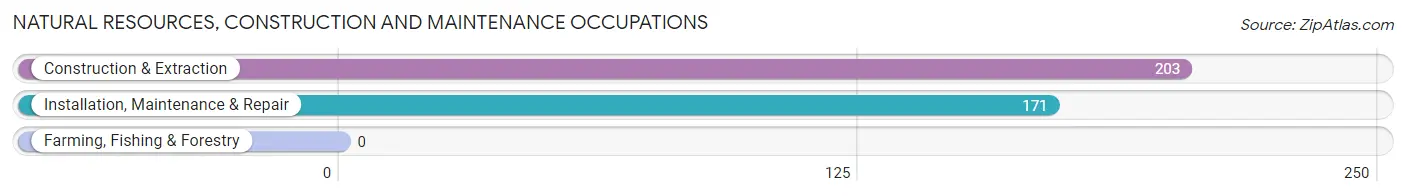
Natural Resources, Construction and Maintenance Occupations
The most common Natural Resources, Construction and Maintenance occupations in Hewitt are Construction & Extraction (203 | 2.6%), and Installation, Maintenance & Repair (171 | 2.2%).
Natural Resources, Construction and Maintenance Occupations by Sex
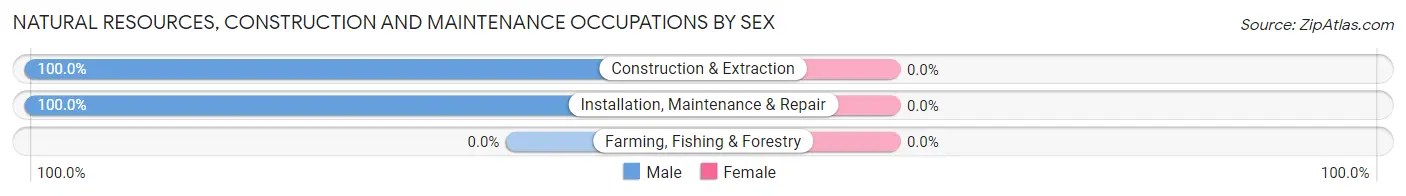
| Occupation | Male | Female |
| Farming, Fishing & Forestry | 0 (0.0%) | 0 (0.0%) |
| Construction & Extraction | 203 (100.0%) | 0 (0.0%) |
| Installation, Maintenance & Repair | 171 (100.0%) | 0 (0.0%) |
| Total (Category) | 374 (100.0%) | 0 (0.0%) |
| Total (Overall) | 3,851 (48.9%) | 4,025 (51.1%) |
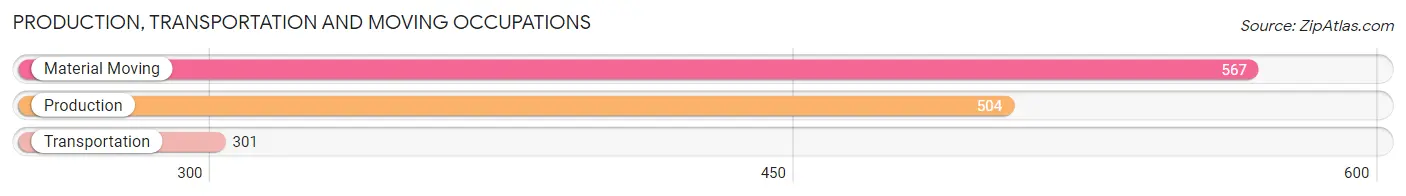
Production, Transportation and Moving Occupations
The most common Production, Transportation and Moving occupations in Hewitt are Material Moving (567 | 7.2%), Production (504 | 6.4%), and Transportation (301 | 3.8%).
Production, Transportation and Moving Occupations by Sex
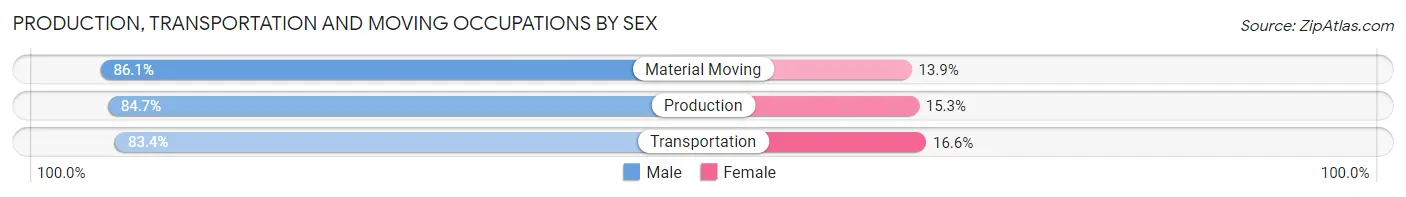
| Occupation | Male | Female |
| Production | 427 (84.7%) | 77 (15.3%) |
| Transportation | 251 (83.4%) | 50 (16.6%) |
| Material Moving | 488 (86.1%) | 79 (13.9%) |
| Total (Category) | 1,166 (85.0%) | 206 (15.0%) |
| Total (Overall) | 3,851 (48.9%) | 4,025 (51.1%) |
Employment Industries by Sex in Hewitt
Employment Industries in Hewitt
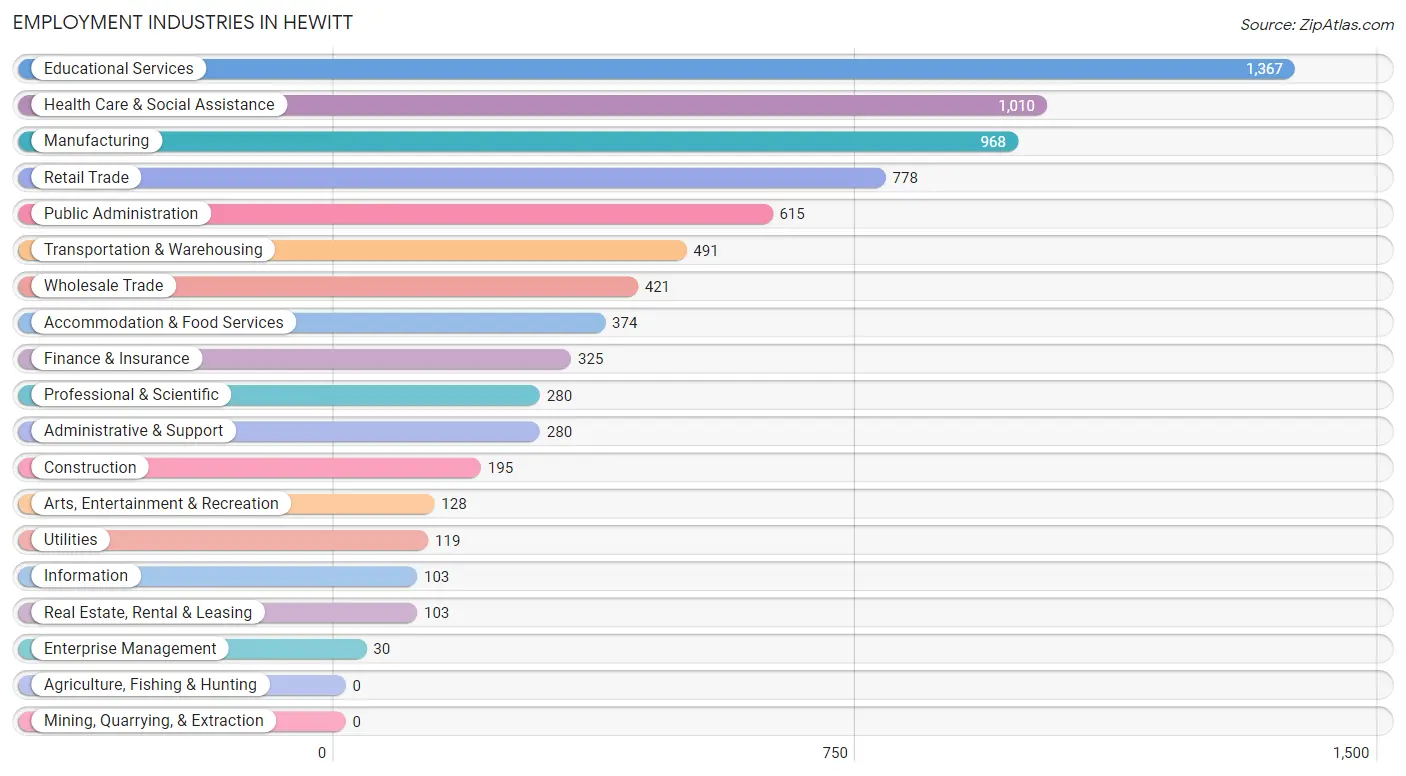
The major employment industries in Hewitt include Educational Services (1,367 | 17.4%), Health Care & Social Assistance (1,010 | 12.8%), Manufacturing (968 | 12.3%), Retail Trade (778 | 9.9%), and Public Administration (615 | 7.8%).
Employment Industries by Sex in Hewitt
The Hewitt industries that see more men than women are Enterprise Management (100.0%), Wholesale Trade (95.0%), and Construction (91.3%), whereas the industries that tend to have a higher number of women are Educational Services (77.2%), Health Care & Social Assistance (75.6%), and Accommodation & Food Services (71.7%).
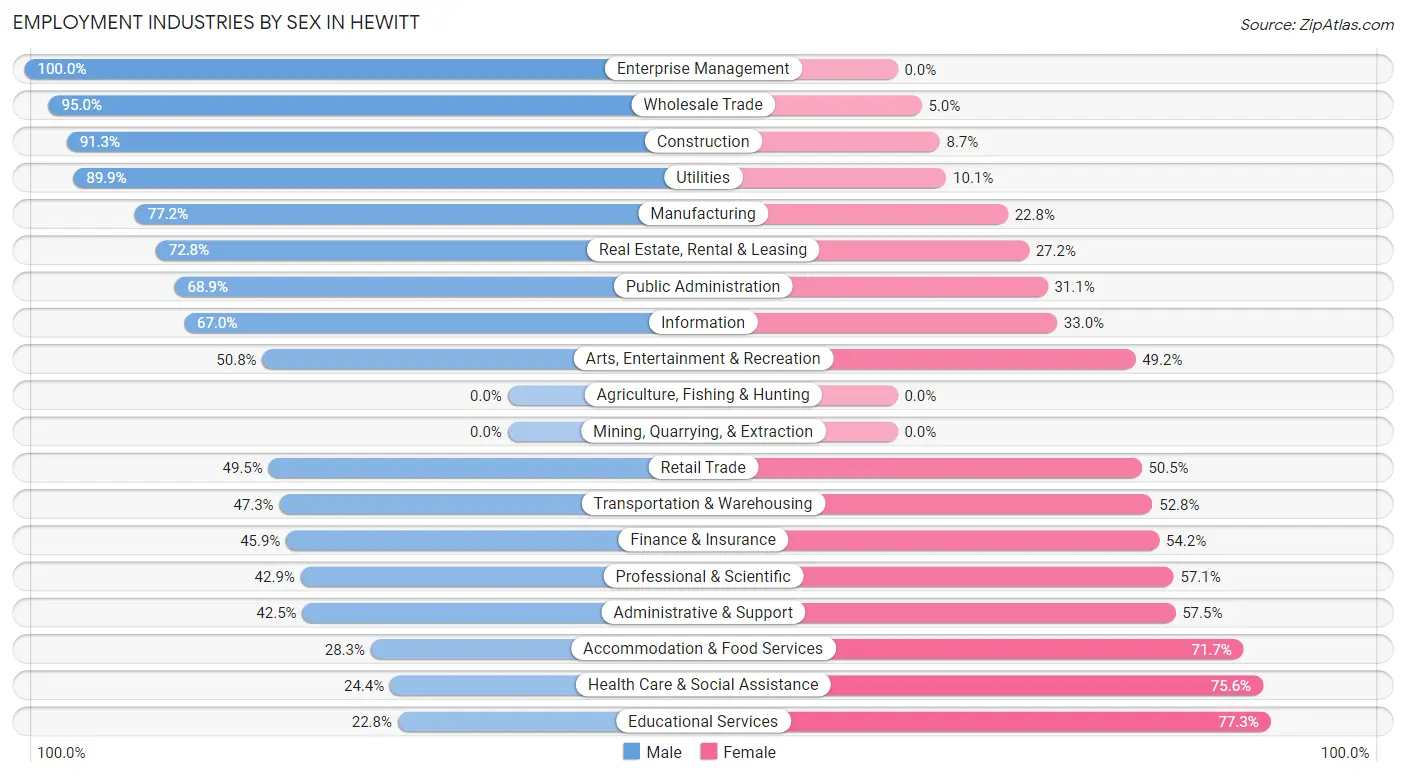
| Industry | Male | Female |
| Agriculture, Fishing & Hunting | 0 (0.0%) | 0 (0.0%) |
| Mining, Quarrying, & Extraction | 0 (0.0%) | 0 (0.0%) |
| Construction | 178 (91.3%) | 17 (8.7%) |
| Manufacturing | 747 (77.2%) | 221 (22.8%) |
| Wholesale Trade | 400 (95.0%) | 21 (5.0%) |
| Retail Trade | 385 (49.5%) | 393 (50.5%) |
| Transportation & Warehousing | 232 (47.2%) | 259 (52.7%) |
| Utilities | 107 (89.9%) | 12 (10.1%) |
| Information | 69 (67.0%) | 34 (33.0%) |
| Finance & Insurance | 149 (45.9%) | 176 (54.1%) |
| Real Estate, Rental & Leasing | 75 (72.8%) | 28 (27.2%) |
| Professional & Scientific | 120 (42.9%) | 160 (57.1%) |
| Enterprise Management | 30 (100.0%) | 0 (0.0%) |
| Administrative & Support | 119 (42.5%) | 161 (57.5%) |
| Educational Services | 311 (22.8%) | 1,056 (77.2%) |
| Health Care & Social Assistance | 246 (24.4%) | 764 (75.6%) |
| Arts, Entertainment & Recreation | 65 (50.8%) | 63 (49.2%) |
| Accommodation & Food Services | 106 (28.3%) | 268 (71.7%) |
| Public Administration | 424 (68.9%) | 191 (31.1%) |
| Total | 3,851 (48.9%) | 4,025 (51.1%) |
Education in Hewitt
School Enrollment in Hewitt
The most common levels of schooling among the 4,442 students in Hewitt are middle school (1,099 | 24.7%), high school (854 | 19.2%), and college / undergraduate (843 | 19.0%).
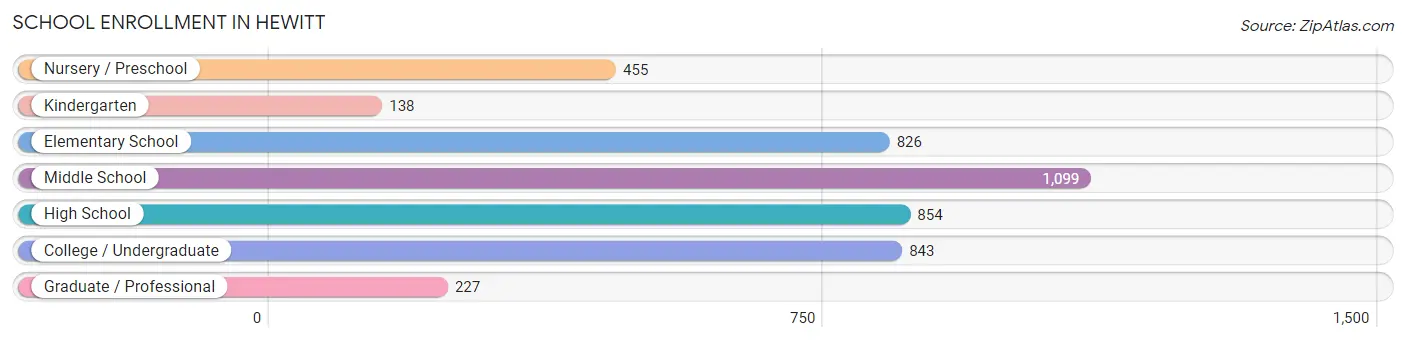
| School Level | # Students | % Students |
| Nursery / Preschool | 455 | 10.2% |
| Kindergarten | 138 | 3.1% |
| Elementary School | 826 | 18.6% |
| Middle School | 1,099 | 24.7% |
| High School | 854 | 19.2% |
| College / Undergraduate | 843 | 19.0% |
| Graduate / Professional | 227 | 5.1% |
| Total | 4,442 | 100.0% |
School Enrollment by Age by Funding Source in Hewitt
Out of a total of 4,442 students who are enrolled in schools in Hewitt, 529 (11.9%) attend a private institution, while the remaining 3,913 (88.1%) are enrolled in public schools. The age group of 35 years and over has the highest likelihood of being enrolled in private schools, with 186 (65.5% in the age bracket) enrolled. Conversely, the age group of 15 to 17 year olds has the lowest likelihood of being enrolled in a private school, with 639 (100.0% in the age bracket) attending a public institution.
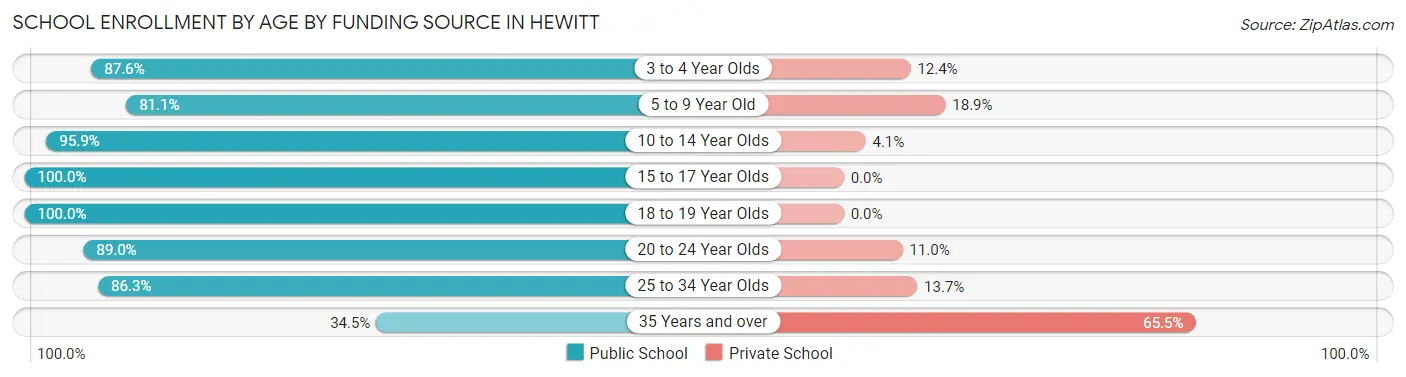
| Age Bracket | Public School | Private School |
| 3 to 4 Year Olds | 359 (87.6%) | 51 (12.4%) |
| 5 to 9 Year Old | 689 (81.1%) | 161 (18.9%) |
| 10 to 14 Year Olds | 1,250 (95.9%) | 53 (4.1%) |
| 15 to 17 Year Olds | 639 (100.0%) | 0 (0.0%) |
| 18 to 19 Year Olds | 319 (100.0%) | 0 (0.0%) |
| 20 to 24 Year Olds | 333 (89.0%) | 41 (11.0%) |
| 25 to 34 Year Olds | 227 (86.3%) | 36 (13.7%) |
| 35 Years and over | 98 (34.5%) | 186 (65.5%) |
| Total | 3,913 (88.1%) | 529 (11.9%) |
Educational Attainment by Field of Study in Hewitt
Education (810 | 21.0%), business (752 | 19.5%), psychology (386 | 10.0%), science & technology (353 | 9.2%), and engineering (256 | 6.7%) are the most common fields of study among 3,851 individuals in Hewitt who have obtained a bachelor's degree or higher.
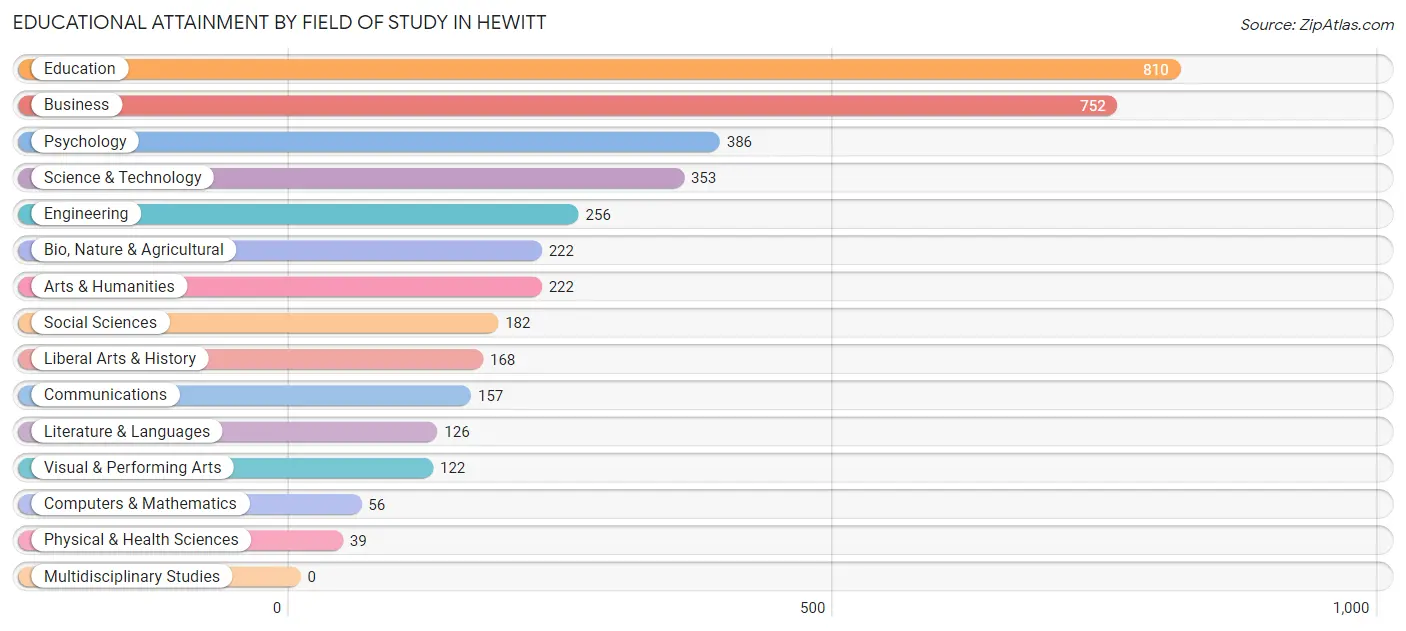
| Field of Study | # Graduates | % Graduates |
| Computers & Mathematics | 56 | 1.5% |
| Bio, Nature & Agricultural | 222 | 5.8% |
| Physical & Health Sciences | 39 | 1.0% |
| Psychology | 386 | 10.0% |
| Social Sciences | 182 | 4.7% |
| Engineering | 256 | 6.7% |
| Multidisciplinary Studies | 0 | 0.0% |
| Science & Technology | 353 | 9.2% |
| Business | 752 | 19.5% |
| Education | 810 | 21.0% |
| Literature & Languages | 126 | 3.3% |
| Liberal Arts & History | 168 | 4.4% |
| Visual & Performing Arts | 122 | 3.2% |
| Communications | 157 | 4.1% |
| Arts & Humanities | 222 | 5.8% |
| Total | 3,851 | 100.0% |
Transportation & Commute in Hewitt
Vehicle Availability by Sex in Hewitt
The most prevalent vehicle ownership categories in Hewitt are males with 2 vehicles (2,086, accounting for 54.6%) and females with 2 vehicles (1,714, making up 53.6%).
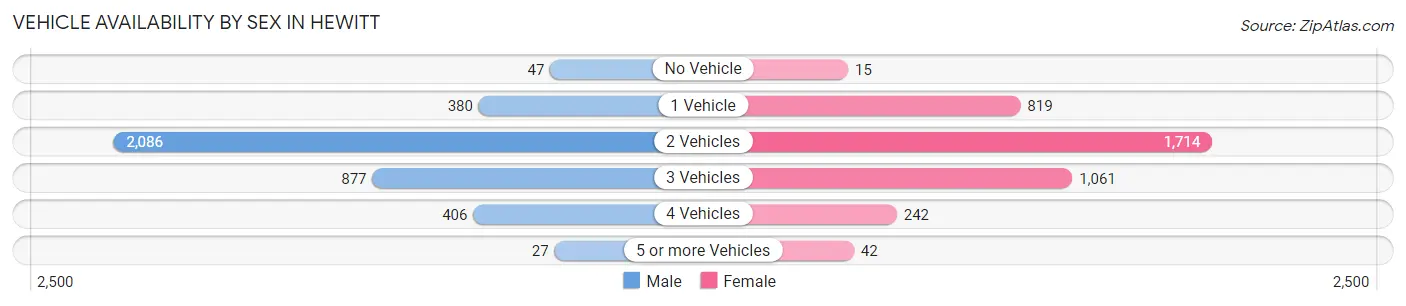
| Vehicles Available | Male | Female |
| No Vehicle | 47 (1.2%) | 15 (0.4%) |
| 1 Vehicle | 380 (9.9%) | 819 (21.0%) |
| 2 Vehicles | 2,086 (54.6%) | 1,714 (44.0%) |
| 3 Vehicles | 877 (22.9%) | 1,061 (27.3%) |
| 4 Vehicles | 406 (10.6%) | 242 (6.2%) |
| 5 or more Vehicles | 27 (0.7%) | 42 (1.1%) |
| Total | 3,823 (100.0%) | 3,893 (100.0%) |
Commute Time in Hewitt
The most frequently occuring commute durations in Hewitt are 15 to 19 minutes (1,738 commuters, 23.9%), 10 to 14 minutes (1,710 commuters, 23.5%), and 20 to 24 minutes (1,097 commuters, 15.1%).
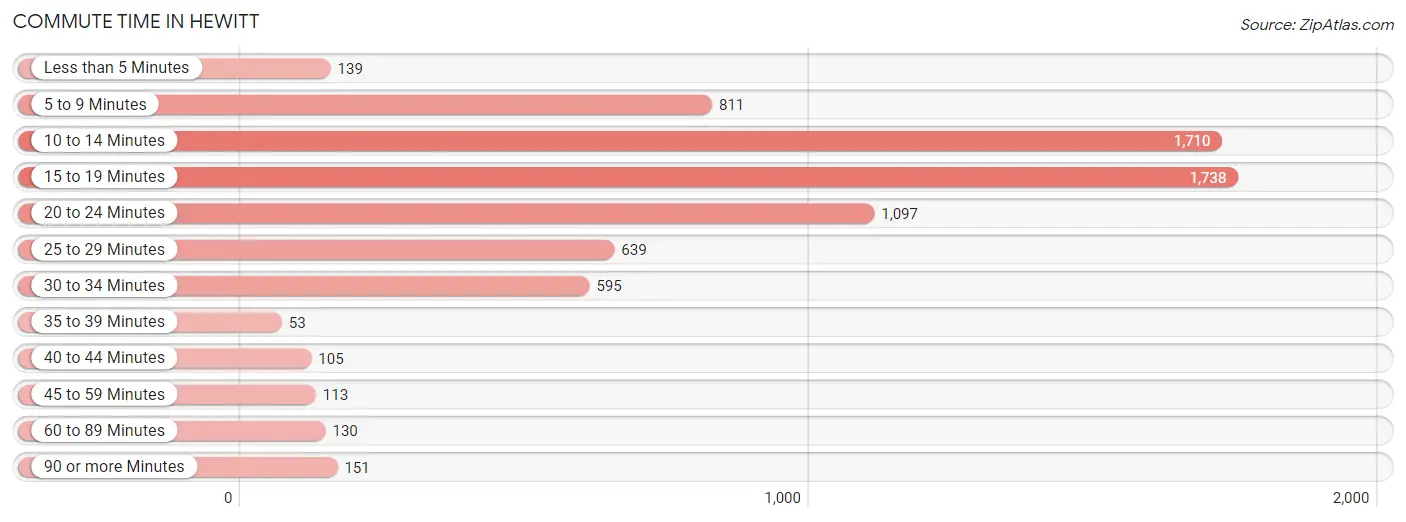
| Commute Time | # Commuters | % Commuters |
| Less than 5 Minutes | 139 | 1.9% |
| 5 to 9 Minutes | 811 | 11.1% |
| 10 to 14 Minutes | 1,710 | 23.5% |
| 15 to 19 Minutes | 1,738 | 23.9% |
| 20 to 24 Minutes | 1,097 | 15.1% |
| 25 to 29 Minutes | 639 | 8.8% |
| 30 to 34 Minutes | 595 | 8.2% |
| 35 to 39 Minutes | 53 | 0.7% |
| 40 to 44 Minutes | 105 | 1.4% |
| 45 to 59 Minutes | 113 | 1.5% |
| 60 to 89 Minutes | 130 | 1.8% |
| 90 or more Minutes | 151 | 2.1% |
Commute Time by Sex in Hewitt
The most common commute times in Hewitt are 15 to 19 minutes (878 commuters, 23.8%) for males and 10 to 14 minutes (871 commuters, 24.2%) for females.
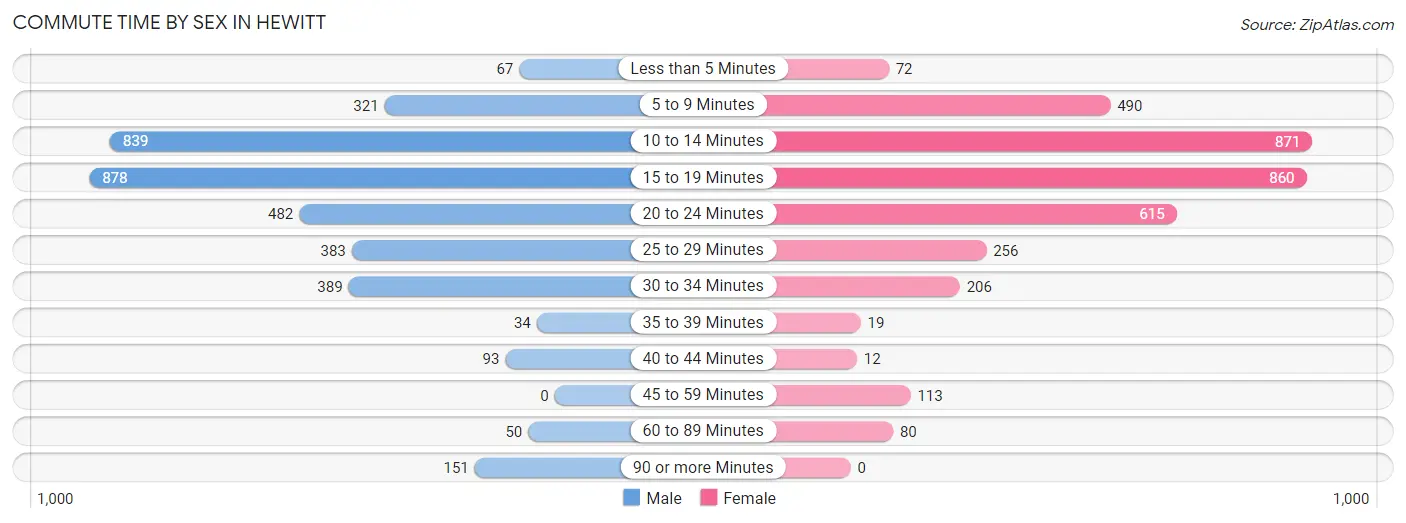
| Commute Time | Male | Female |
| Less than 5 Minutes | 67 (1.8%) | 72 (2.0%) |
| 5 to 9 Minutes | 321 (8.7%) | 490 (13.6%) |
| 10 to 14 Minutes | 839 (22.8%) | 871 (24.2%) |
| 15 to 19 Minutes | 878 (23.8%) | 860 (23.9%) |
| 20 to 24 Minutes | 482 (13.1%) | 615 (17.1%) |
| 25 to 29 Minutes | 383 (10.4%) | 256 (7.1%) |
| 30 to 34 Minutes | 389 (10.5%) | 206 (5.7%) |
| 35 to 39 Minutes | 34 (0.9%) | 19 (0.5%) |
| 40 to 44 Minutes | 93 (2.5%) | 12 (0.3%) |
| 45 to 59 Minutes | 0 (0.0%) | 113 (3.1%) |
| 60 to 89 Minutes | 50 (1.4%) | 80 (2.2%) |
| 90 or more Minutes | 151 (4.1%) | 0 (0.0%) |
Time of Departure to Work by Sex in Hewitt
The most frequent times of departure to work in Hewitt are 12:00 PM to 3:59 PM (588, 16.0%) for males and 7:30 AM to 7:59 AM (620, 17.2%) for females.
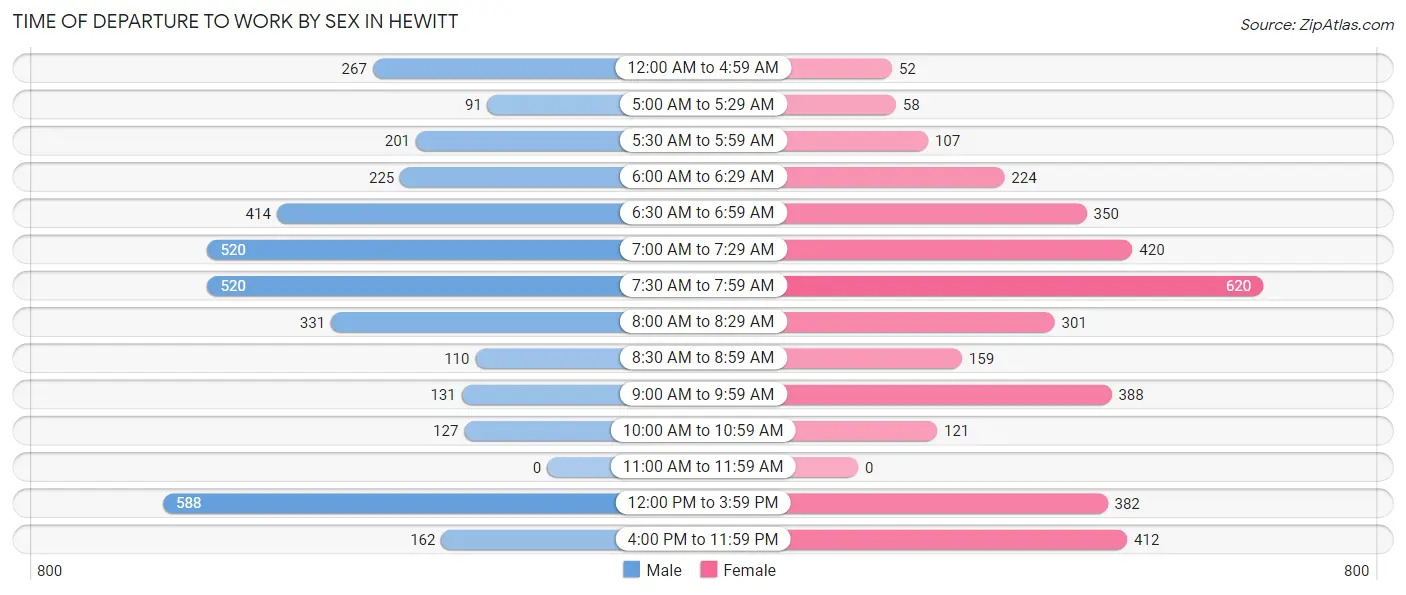
| Time of Departure | Male | Female |
| 12:00 AM to 4:59 AM | 267 (7.2%) | 52 (1.5%) |
| 5:00 AM to 5:29 AM | 91 (2.5%) | 58 (1.6%) |
| 5:30 AM to 5:59 AM | 201 (5.4%) | 107 (3.0%) |
| 6:00 AM to 6:29 AM | 225 (6.1%) | 224 (6.2%) |
| 6:30 AM to 6:59 AM | 414 (11.2%) | 350 (9.7%) |
| 7:00 AM to 7:29 AM | 520 (14.1%) | 420 (11.7%) |
| 7:30 AM to 7:59 AM | 520 (14.1%) | 620 (17.2%) |
| 8:00 AM to 8:29 AM | 331 (9.0%) | 301 (8.4%) |
| 8:30 AM to 8:59 AM | 110 (3.0%) | 159 (4.4%) |
| 9:00 AM to 9:59 AM | 131 (3.5%) | 388 (10.8%) |
| 10:00 AM to 10:59 AM | 127 (3.4%) | 121 (3.4%) |
| 11:00 AM to 11:59 AM | 0 (0.0%) | 0 (0.0%) |
| 12:00 PM to 3:59 PM | 588 (16.0%) | 382 (10.6%) |
| 4:00 PM to 11:59 PM | 162 (4.4%) | 412 (11.5%) |
| Total | 3,687 (100.0%) | 3,594 (100.0%) |
Housing Occupancy in Hewitt
Occupancy by Ownership in Hewitt
Of the total 5,955 dwellings in Hewitt, owner-occupied units account for 3,953 (66.4%), while renter-occupied units make up 2,002 (33.6%).
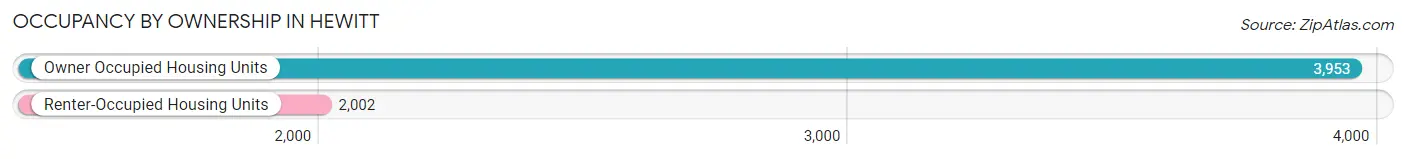
| Occupancy | # Housing Units | % Housing Units |
| Owner Occupied Housing Units | 3,953 | 66.4% |
| Renter-Occupied Housing Units | 2,002 | 33.6% |
| Total Occupied Housing Units | 5,955 | 100.0% |
Occupancy by Household Size in Hewitt
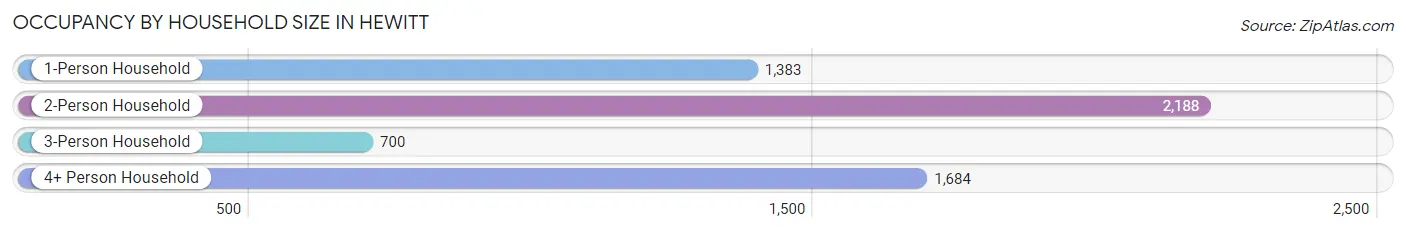
| Household Size | # Housing Units | % Housing Units |
| 1-Person Household | 1,383 | 23.2% |
| 2-Person Household | 2,188 | 36.7% |
| 3-Person Household | 700 | 11.7% |
| 4+ Person Household | 1,684 | 28.3% |
| Total Housing Units | 5,955 | 100.0% |
Occupancy by Ownership by Household Size in Hewitt
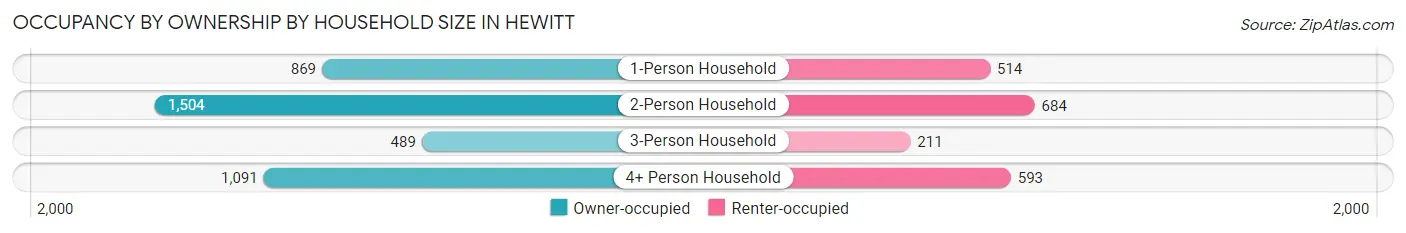
| Household Size | Owner-occupied | Renter-occupied |
| 1-Person Household | 869 (62.8%) | 514 (37.2%) |
| 2-Person Household | 1,504 (68.7%) | 684 (31.3%) |
| 3-Person Household | 489 (69.9%) | 211 (30.1%) |
| 4+ Person Household | 1,091 (64.8%) | 593 (35.2%) |
| Total Housing Units | 3,953 (66.4%) | 2,002 (33.6%) |
Occupancy by Educational Attainment in Hewitt
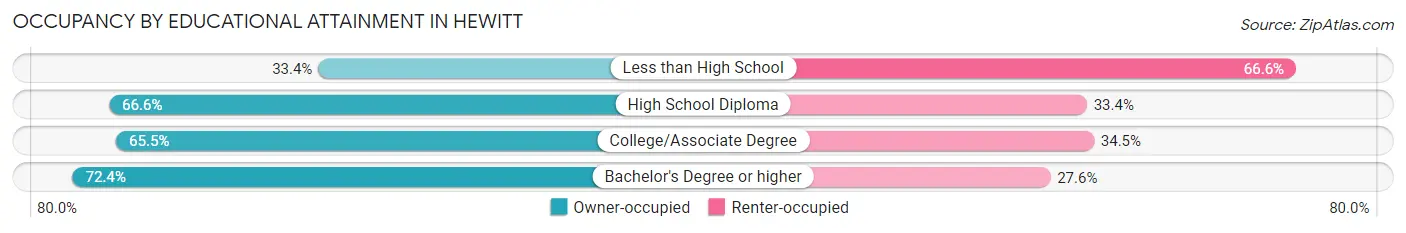
| Household Size | Owner-occupied | Renter-occupied |
| Less than High School | 115 (33.4%) | 229 (66.6%) |
| High School Diploma | 690 (66.6%) | 346 (33.4%) |
| College/Associate Degree | 1,551 (65.5%) | 818 (34.5%) |
| Bachelor's Degree or higher | 1,597 (72.4%) | 609 (27.6%) |
Occupancy by Age of Householder in Hewitt
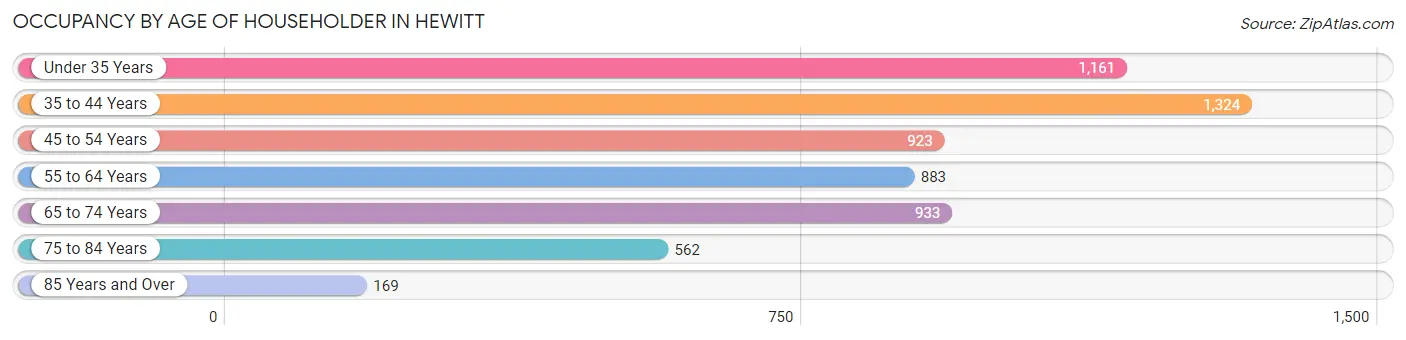
| Age Bracket | # Households | % Households |
| Under 35 Years | 1,161 | 19.5% |
| 35 to 44 Years | 1,324 | 22.2% |
| 45 to 54 Years | 923 | 15.5% |
| 55 to 64 Years | 883 | 14.8% |
| 65 to 74 Years | 933 | 15.7% |
| 75 to 84 Years | 562 | 9.4% |
| 85 Years and Over | 169 | 2.8% |
| Total | 5,955 | 100.0% |
Housing Finances in Hewitt
Median Income by Occupancy in Hewitt
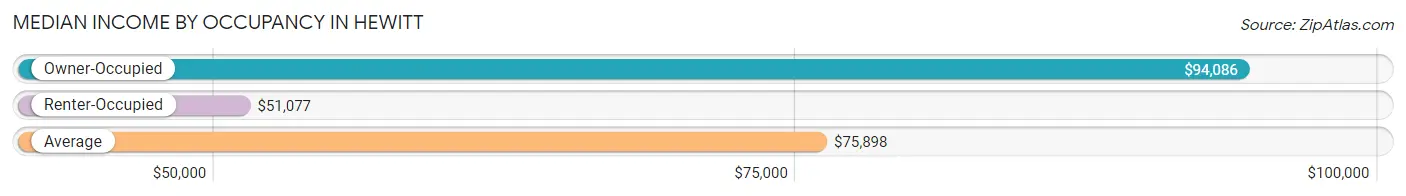
| Occupancy Type | # Households | Median Income |
| Owner-Occupied | 3,953 (66.4%) | $94,086 |
| Renter-Occupied | 2,002 (33.6%) | $51,077 |
| Average | 5,955 (100.0%) | $75,898 |
Occupancy by Householder Income Bracket in Hewitt
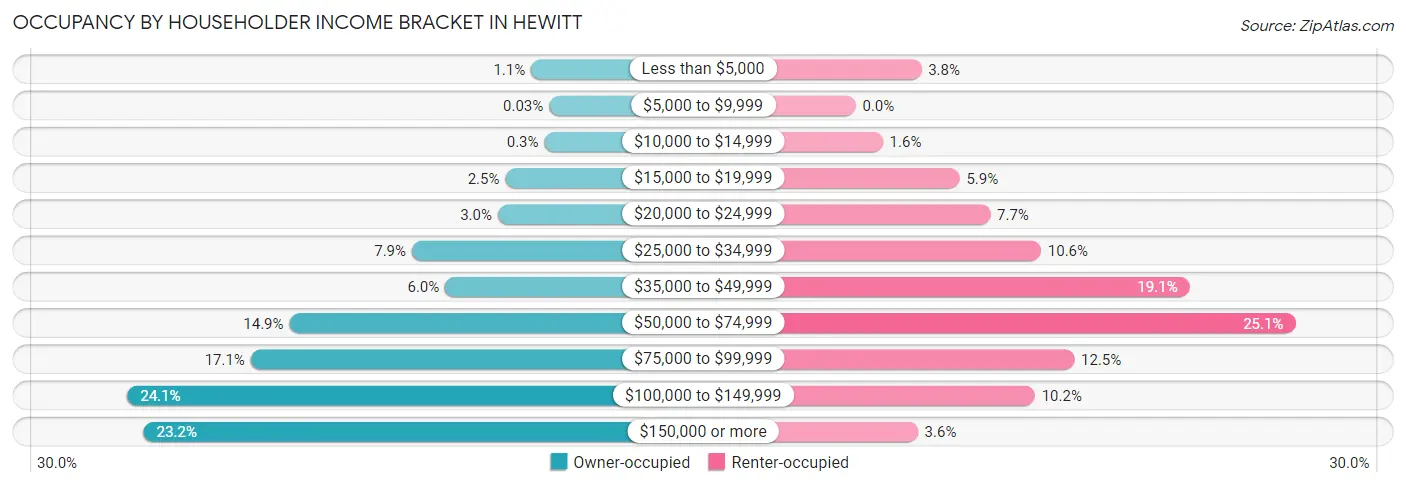
| Income Bracket | Owner-occupied | Renter-occupied |
| Less than $5,000 | 42 (1.1%) | 75 (3.7%) |
| $5,000 to $9,999 | 1 (0.0%) | 0 (0.0%) |
| $10,000 to $14,999 | 12 (0.3%) | 31 (1.5%) |
| $15,000 to $19,999 | 100 (2.5%) | 119 (5.9%) |
| $20,000 to $24,999 | 117 (3.0%) | 154 (7.7%) |
| $25,000 to $34,999 | 311 (7.9%) | 212 (10.6%) |
| $35,000 to $49,999 | 236 (6.0%) | 382 (19.1%) |
| $50,000 to $74,999 | 588 (14.9%) | 503 (25.1%) |
| $75,000 to $99,999 | 675 (17.1%) | 250 (12.5%) |
| $100,000 to $149,999 | 954 (24.1%) | 205 (10.2%) |
| $150,000 or more | 917 (23.2%) | 71 (3.5%) |
| Total | 3,953 (100.0%) | 2,002 (100.0%) |
Monthly Housing Cost Tiers in Hewitt
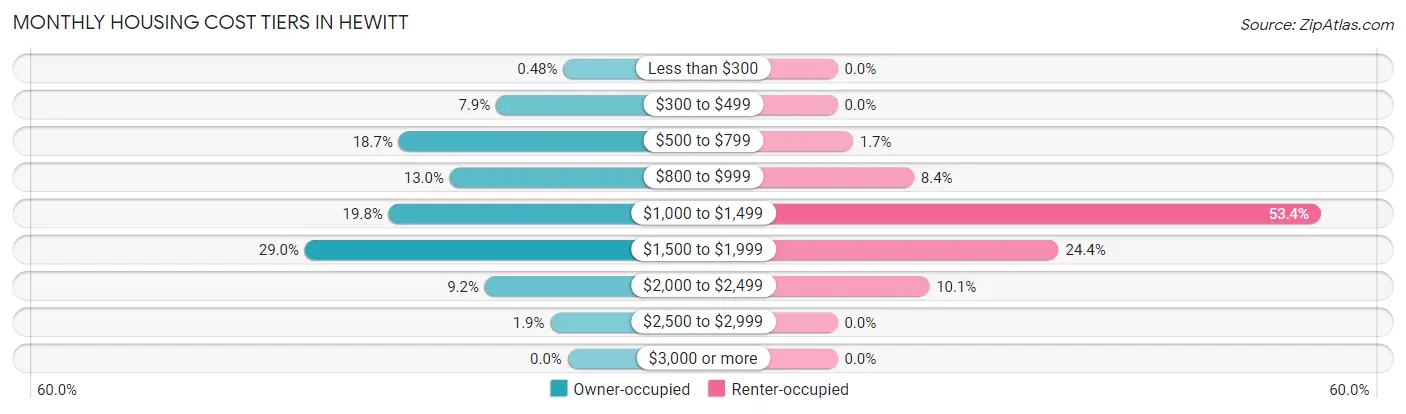
| Monthly Cost | Owner-occupied | Renter-occupied |
| Less than $300 | 19 (0.5%) | 0 (0.0%) |
| $300 to $499 | 313 (7.9%) | 0 (0.0%) |
| $500 to $799 | 738 (18.7%) | 34 (1.7%) |
| $800 to $999 | 515 (13.0%) | 169 (8.4%) |
| $1,000 to $1,499 | 782 (19.8%) | 1,069 (53.4%) |
| $1,500 to $1,999 | 1,148 (29.0%) | 489 (24.4%) |
| $2,000 to $2,499 | 362 (9.2%) | 203 (10.1%) |
| $2,500 to $2,999 | 76 (1.9%) | 0 (0.0%) |
| $3,000 or more | 0 (0.0%) | 0 (0.0%) |
| Total | 3,953 (100.0%) | 2,002 (100.0%) |
Physical Housing Characteristics in Hewitt
Housing Structures in Hewitt
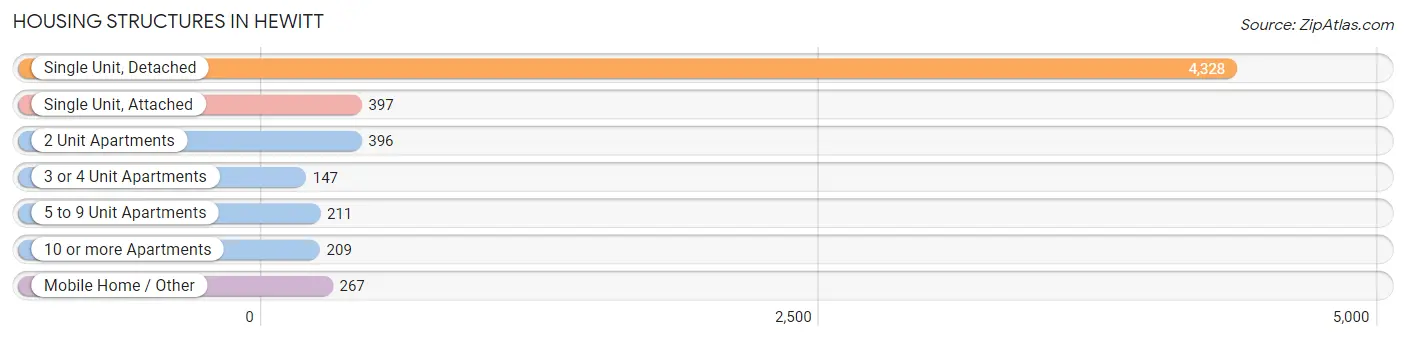
| Structure Type | # Housing Units | % Housing Units |
| Single Unit, Detached | 4,328 | 72.7% |
| Single Unit, Attached | 397 | 6.7% |
| 2 Unit Apartments | 396 | 6.7% |
| 3 or 4 Unit Apartments | 147 | 2.5% |
| 5 to 9 Unit Apartments | 211 | 3.5% |
| 10 or more Apartments | 209 | 3.5% |
| Mobile Home / Other | 267 | 4.5% |
| Total | 5,955 | 100.0% |
Housing Structures by Occupancy in Hewitt
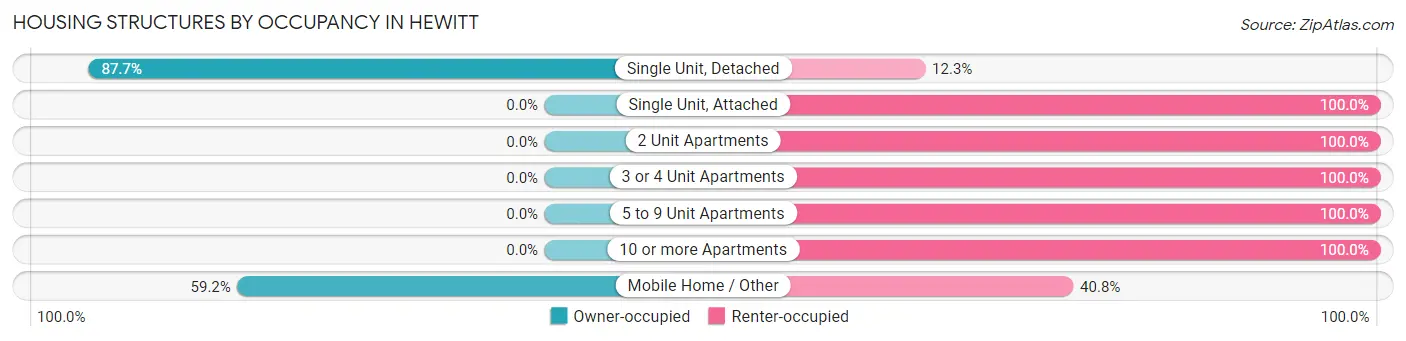
| Structure Type | Owner-occupied | Renter-occupied |
| Single Unit, Detached | 3,795 (87.7%) | 533 (12.3%) |
| Single Unit, Attached | 0 (0.0%) | 397 (100.0%) |
| 2 Unit Apartments | 0 (0.0%) | 396 (100.0%) |
| 3 or 4 Unit Apartments | 0 (0.0%) | 147 (100.0%) |
| 5 to 9 Unit Apartments | 0 (0.0%) | 211 (100.0%) |
| 10 or more Apartments | 0 (0.0%) | 209 (100.0%) |
| Mobile Home / Other | 158 (59.2%) | 109 (40.8%) |
| Total | 3,953 (66.4%) | 2,002 (33.6%) |
Housing Structures by Number of Rooms in Hewitt
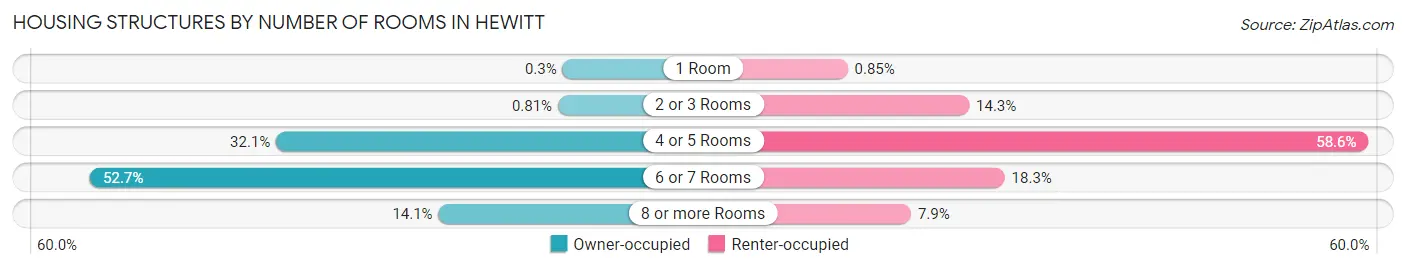
| Number of Rooms | Owner-occupied | Renter-occupied |
| 1 Room | 12 (0.3%) | 17 (0.9%) |
| 2 or 3 Rooms | 32 (0.8%) | 287 (14.3%) |
| 4 or 5 Rooms | 1,268 (32.1%) | 1,174 (58.6%) |
| 6 or 7 Rooms | 2,085 (52.7%) | 366 (18.3%) |
| 8 or more Rooms | 556 (14.1%) | 158 (7.9%) |
| Total | 3,953 (100.0%) | 2,002 (100.0%) |
Housing Structure by Heating Type in Hewitt
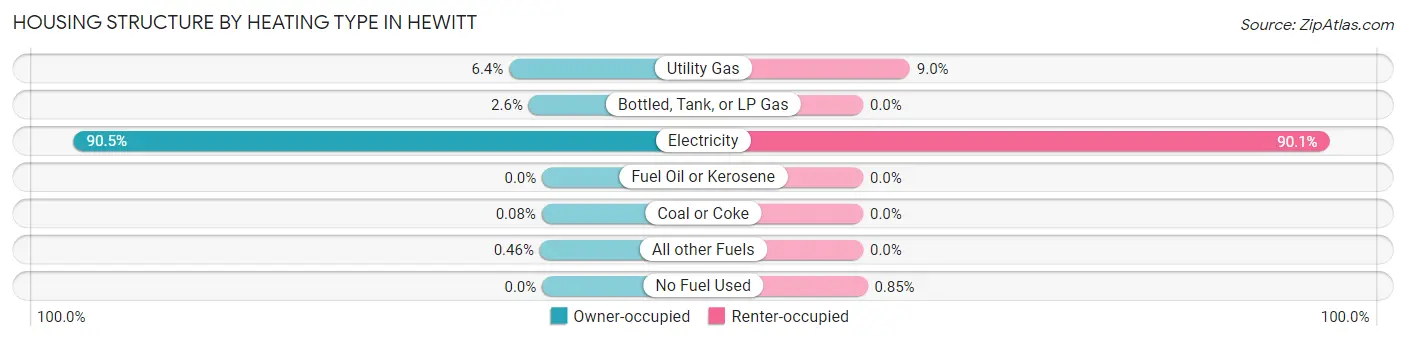
| Heating Type | Owner-occupied | Renter-occupied |
| Utility Gas | 252 (6.4%) | 181 (9.0%) |
| Bottled, Tank, or LP Gas | 102 (2.6%) | 0 (0.0%) |
| Electricity | 3,578 (90.5%) | 1,804 (90.1%) |
| Fuel Oil or Kerosene | 0 (0.0%) | 0 (0.0%) |
| Coal or Coke | 3 (0.1%) | 0 (0.0%) |
| All other Fuels | 18 (0.5%) | 0 (0.0%) |
| No Fuel Used | 0 (0.0%) | 17 (0.9%) |
| Total | 3,953 (100.0%) | 2,002 (100.0%) |
Household Vehicle Usage in Hewitt
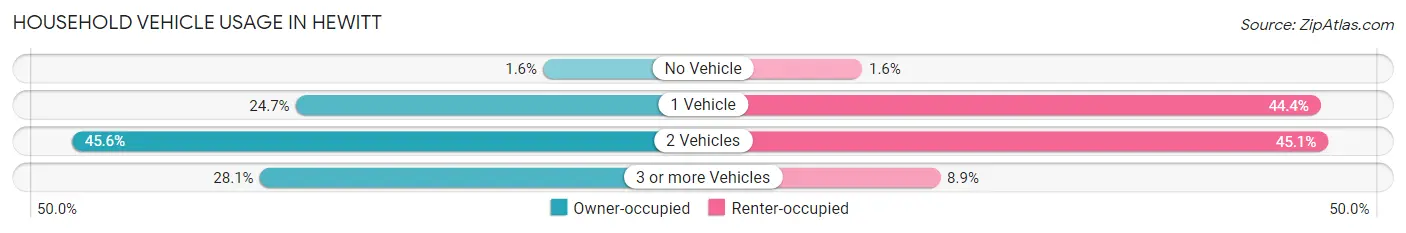
| Vehicles per Household | Owner-occupied | Renter-occupied |
| No Vehicle | 64 (1.6%) | 32 (1.6%) |
| 1 Vehicle | 977 (24.7%) | 889 (44.4%) |
| 2 Vehicles | 1,802 (45.6%) | 903 (45.1%) |
| 3 or more Vehicles | 1,110 (28.1%) | 178 (8.9%) |
| Total | 3,953 (100.0%) | 2,002 (100.0%) |
Real Estate & Mortgages in Hewitt
Real Estate and Mortgage Overview in Hewitt
| Characteristic | Without Mortgage | With Mortgage |
| Housing Units | 1,586 | 2,367 |
| Median Property Value | $231,600 | $235,100 |
| Median Household Income | $75,784 | $618 |
| Monthly Housing Costs | $691 | $0 |
| Real Estate Taxes | $3,018 | $100 |
Property Value by Mortgage Status in Hewitt
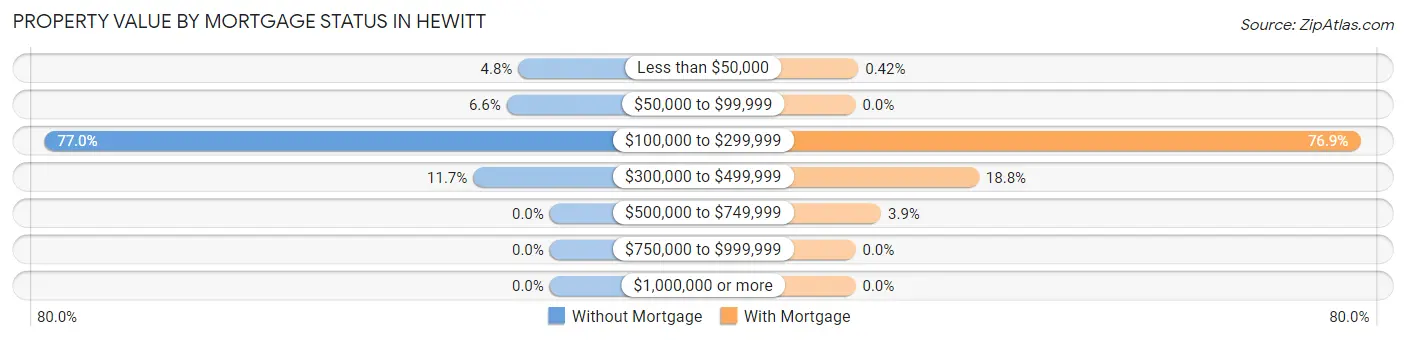
| Property Value | Without Mortgage | With Mortgage |
| Less than $50,000 | 76 (4.8%) | 10 (0.4%) |
| $50,000 to $99,999 | 104 (6.6%) | 0 (0.0%) |
| $100,000 to $299,999 | 1,221 (77.0%) | 1,820 (76.9%) |
| $300,000 to $499,999 | 185 (11.7%) | 445 (18.8%) |
| $500,000 to $749,999 | 0 (0.0%) | 92 (3.9%) |
| $750,000 to $999,999 | 0 (0.0%) | 0 (0.0%) |
| $1,000,000 or more | 0 (0.0%) | 0 (0.0%) |
| Total | 1,586 (100.0%) | 2,367 (100.0%) |
Household Income by Mortgage Status in Hewitt
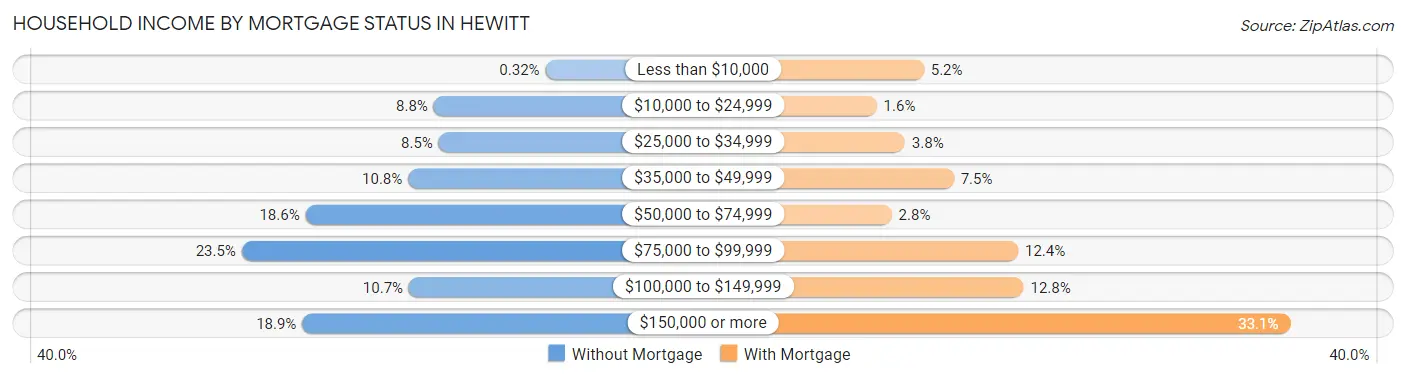
| Household Income | Without Mortgage | With Mortgage |
| Less than $10,000 | 5 (0.3%) | 123 (5.2%) |
| $10,000 to $24,999 | 140 (8.8%) | 38 (1.6%) |
| $25,000 to $34,999 | 134 (8.5%) | 89 (3.8%) |
| $35,000 to $49,999 | 171 (10.8%) | 177 (7.5%) |
| $50,000 to $74,999 | 295 (18.6%) | 65 (2.8%) |
| $75,000 to $99,999 | 372 (23.5%) | 293 (12.4%) |
| $100,000 to $149,999 | 170 (10.7%) | 303 (12.8%) |
| $150,000 or more | 299 (18.9%) | 784 (33.1%) |
| Total | 1,586 (100.0%) | 2,367 (100.0%) |
Property Value to Household Income Ratio in Hewitt
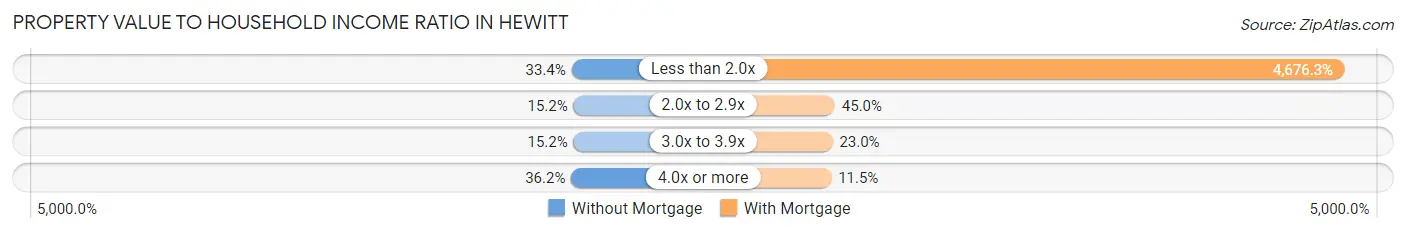
| Value-to-Income Ratio | Without Mortgage | With Mortgage |
| Less than 2.0x | 530 (33.4%) | 110,689 (4,676.3%) |
| 2.0x to 2.9x | 241 (15.2%) | 1,064 (45.0%) |
| 3.0x to 3.9x | 241 (15.2%) | 544 (23.0%) |
| 4.0x or more | 574 (36.2%) | 272 (11.5%) |
| Total | 1,586 (100.0%) | 2,367 (100.0%) |
Real Estate Taxes by Mortgage Status in Hewitt
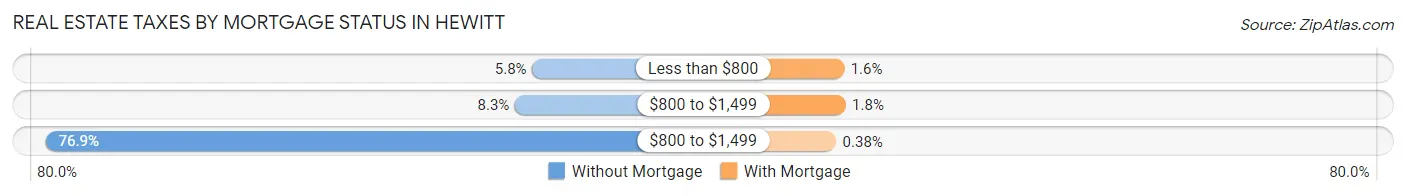
| Property Taxes | Without Mortgage | With Mortgage |
| Less than $800 | 92 (5.8%) | 37 (1.6%) |
| $800 to $1,499 | 132 (8.3%) | 42 (1.8%) |
| $800 to $1,499 | 1,220 (76.9%) | 9 (0.4%) |
| Total | 1,586 (100.0%) | 2,367 (100.0%) |
Health & Disability in Hewitt
Health Insurance Coverage by Age in Hewitt
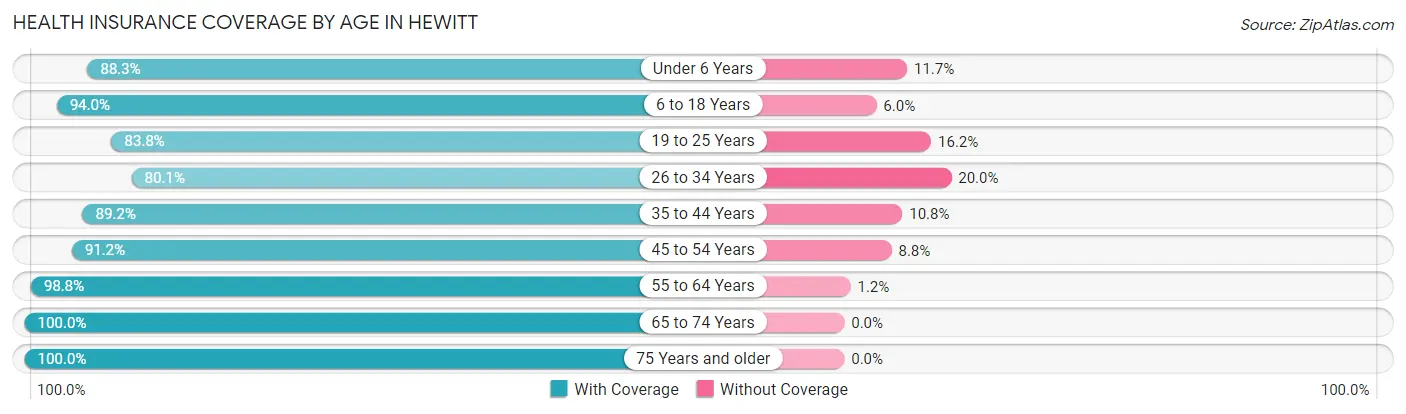
| Age Bracket | With Coverage | Without Coverage |
| Under 6 Years | 800 (88.3%) | 106 (11.7%) |
| 6 to 18 Years | 2,981 (94.0%) | 190 (6.0%) |
| 19 to 25 Years | 1,470 (83.8%) | 284 (16.2%) |
| 26 to 34 Years | 1,316 (80.0%) | 328 (20.0%) |
| 35 to 44 Years | 2,101 (89.2%) | 255 (10.8%) |
| 45 to 54 Years | 1,873 (91.2%) | 181 (8.8%) |
| 55 to 64 Years | 1,454 (98.8%) | 17 (1.2%) |
| 65 to 74 Years | 1,491 (100.0%) | 0 (0.0%) |
| 75 Years and older | 1,089 (100.0%) | 0 (0.0%) |
| Total | 14,575 (91.5%) | 1,361 (8.5%) |
Health Insurance Coverage by Citizenship Status in Hewitt
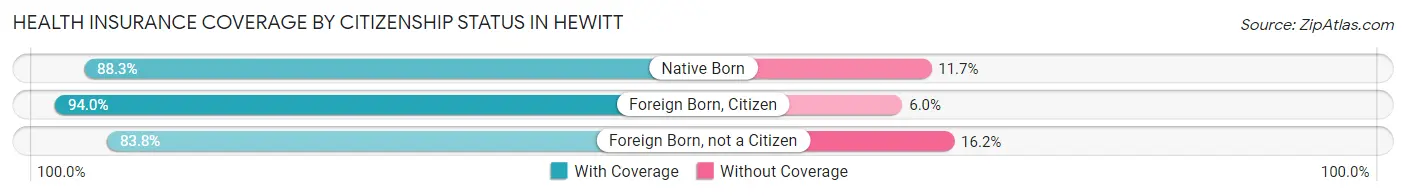
| Citizenship Status | With Coverage | Without Coverage |
| Native Born | 800 (88.3%) | 106 (11.7%) |
| Foreign Born, Citizen | 2,981 (94.0%) | 190 (6.0%) |
| Foreign Born, not a Citizen | 1,470 (83.8%) | 284 (16.2%) |
Health Insurance Coverage by Household Income in Hewitt
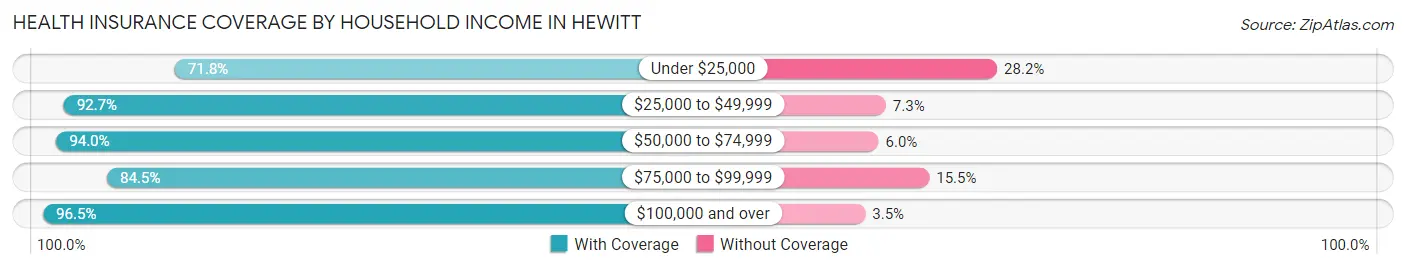
| Household Income | With Coverage | Without Coverage |
| Under $25,000 | 987 (71.8%) | 387 (28.2%) |
| $25,000 to $49,999 | 2,413 (92.7%) | 191 (7.3%) |
| $50,000 to $74,999 | 2,858 (94.0%) | 181 (6.0%) |
| $75,000 to $99,999 | 2,056 (84.5%) | 376 (15.5%) |
| $100,000 and over | 6,261 (96.5%) | 226 (3.5%) |
Public vs Private Health Insurance Coverage by Age in Hewitt
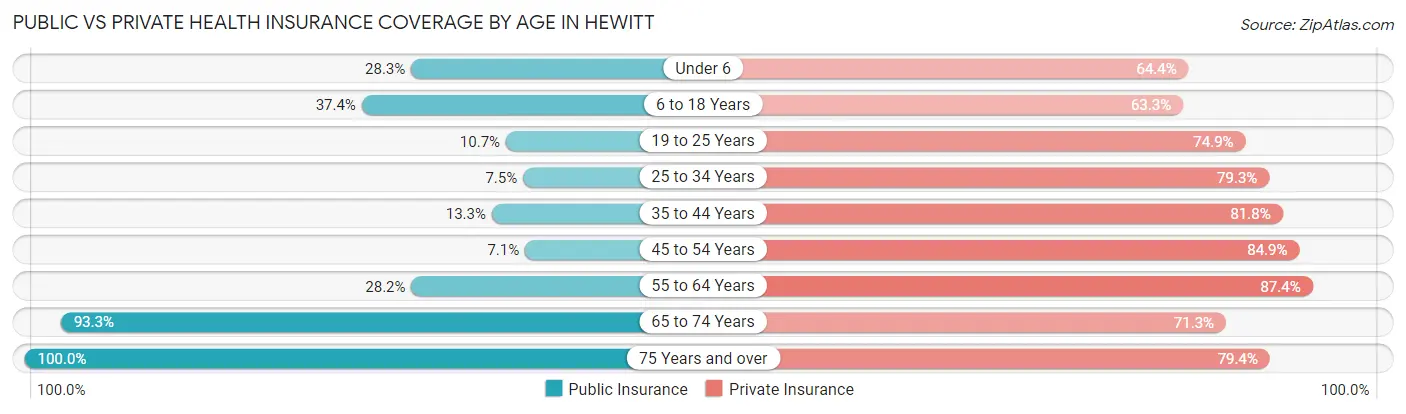
| Age Bracket | Public Insurance | Private Insurance |
| Under 6 | 256 (28.3%) | 583 (64.3%) |
| 6 to 18 Years | 1,187 (37.4%) | 2,008 (63.3%) |
| 19 to 25 Years | 187 (10.7%) | 1,314 (74.9%) |
| 25 to 34 Years | 123 (7.5%) | 1,304 (79.3%) |
| 35 to 44 Years | 313 (13.3%) | 1,927 (81.8%) |
| 45 to 54 Years | 146 (7.1%) | 1,744 (84.9%) |
| 55 to 64 Years | 415 (28.2%) | 1,285 (87.4%) |
| 65 to 74 Years | 1,391 (93.3%) | 1,063 (71.3%) |
| 75 Years and over | 1,089 (100.0%) | 865 (79.4%) |
| Total | 5,107 (32.1%) | 12,093 (75.9%) |
Disability Status by Sex by Age in Hewitt
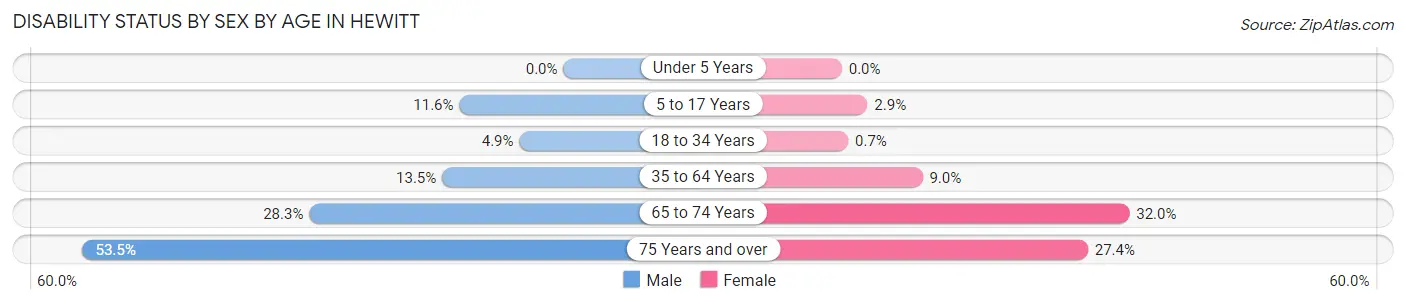
| Age Bracket | Male | Female |
| Under 5 Years | 0 (0.0%) | 0 (0.0%) |
| 5 to 17 Years | 166 (11.6%) | 48 (2.9%) |
| 18 to 34 Years | 88 (4.9%) | 13 (0.7%) |
| 35 to 64 Years | 367 (13.5%) | 284 (9.0%) |
| 65 to 74 Years | 163 (28.3%) | 293 (32.0%) |
| 75 Years and over | 204 (53.5%) | 194 (27.4%) |
Disability Class by Sex by Age in Hewitt
Disability Class: Hearing Difficulty
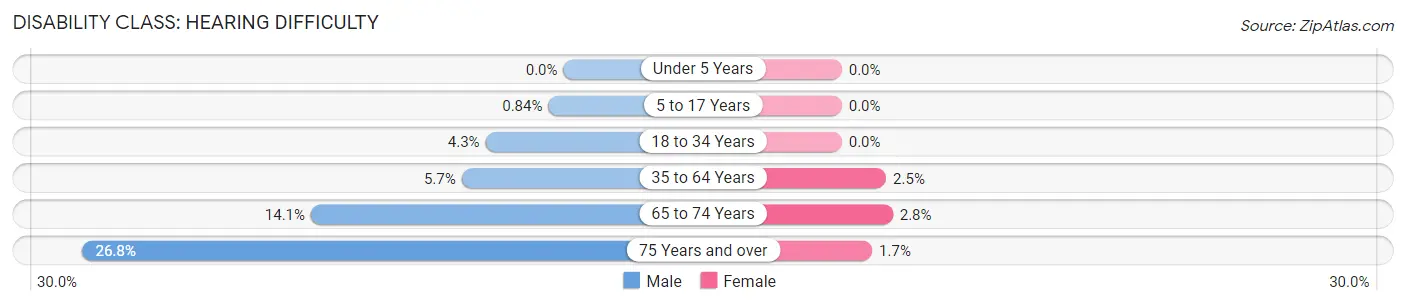
| Age Bracket | Male | Female |
| Under 5 Years | 0 (0.0%) | 0 (0.0%) |
| 5 to 17 Years | 12 (0.8%) | 0 (0.0%) |
| 18 to 34 Years | 78 (4.3%) | 0 (0.0%) |
| 35 to 64 Years | 154 (5.7%) | 78 (2.5%) |
| 65 to 74 Years | 81 (14.1%) | 26 (2.8%) |
| 75 Years and over | 102 (26.8%) | 12 (1.7%) |
Disability Class: Vision Difficulty
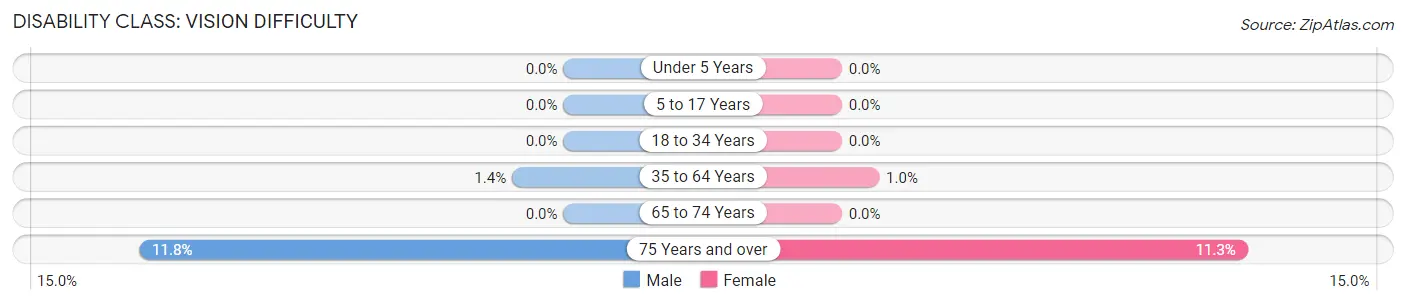
| Age Bracket | Male | Female |
| Under 5 Years | 0 (0.0%) | 0 (0.0%) |
| 5 to 17 Years | 0 (0.0%) | 0 (0.0%) |
| 18 to 34 Years | 0 (0.0%) | 0 (0.0%) |
| 35 to 64 Years | 39 (1.4%) | 33 (1.0%) |
| 65 to 74 Years | 0 (0.0%) | 0 (0.0%) |
| 75 Years and over | 45 (11.8%) | 80 (11.3%) |
Disability Class: Cognitive Difficulty
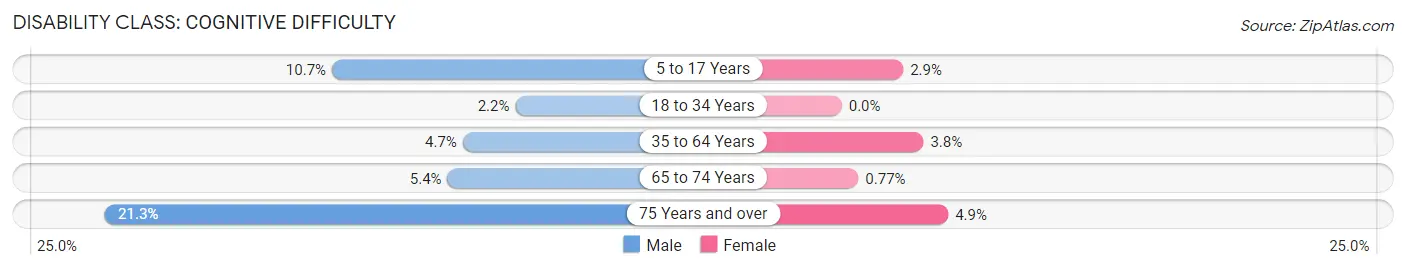
| Age Bracket | Male | Female |
| 5 to 17 Years | 154 (10.7%) | 48 (2.9%) |
| 18 to 34 Years | 40 (2.2%) | 0 (0.0%) |
| 35 to 64 Years | 127 (4.7%) | 120 (3.8%) |
| 65 to 74 Years | 31 (5.4%) | 7 (0.8%) |
| 75 Years and over | 81 (21.3%) | 35 (4.9%) |
Disability Class: Ambulatory Difficulty
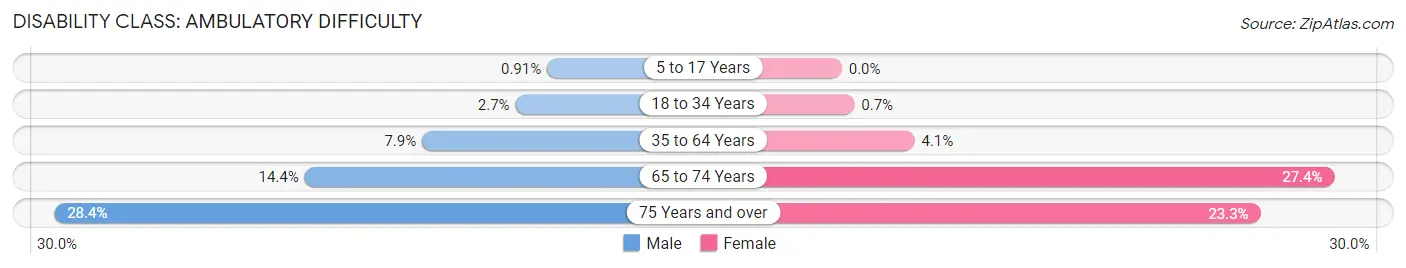
| Age Bracket | Male | Female |
| 5 to 17 Years | 13 (0.9%) | 0 (0.0%) |
| 18 to 34 Years | 48 (2.7%) | 13 (0.7%) |
| 35 to 64 Years | 214 (7.9%) | 128 (4.1%) |
| 65 to 74 Years | 83 (14.4%) | 251 (27.4%) |
| 75 Years and over | 108 (28.3%) | 165 (23.3%) |
Disability Class: Self-Care Difficulty
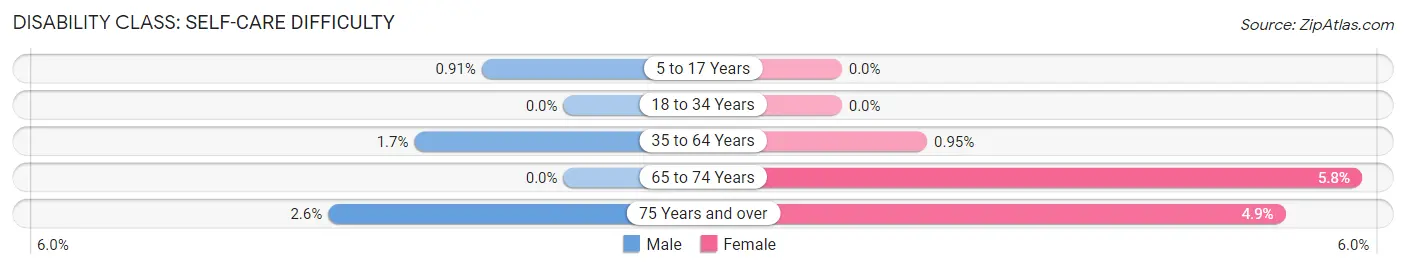
| Age Bracket | Male | Female |
| 5 to 17 Years | 13 (0.9%) | 0 (0.0%) |
| 18 to 34 Years | 0 (0.0%) | 0 (0.0%) |
| 35 to 64 Years | 45 (1.7%) | 30 (0.9%) |
| 65 to 74 Years | 0 (0.0%) | 53 (5.8%) |
| 75 Years and over | 10 (2.6%) | 35 (4.9%) |
Technology Access in Hewitt
Computing Device Access in Hewitt
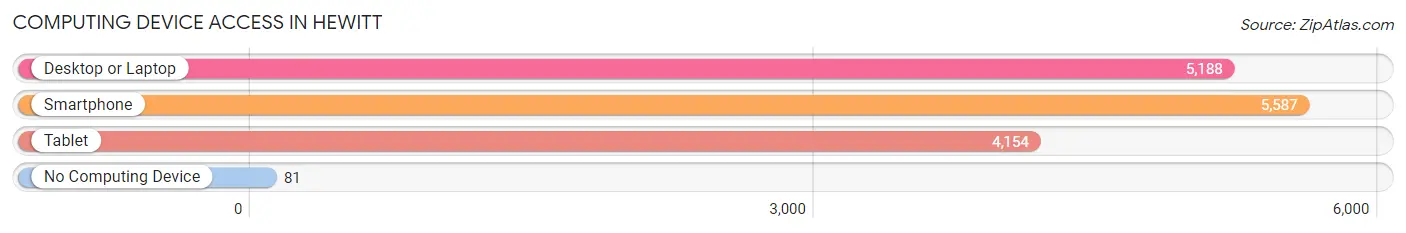
| Device Type | # Households | % Households |
| Desktop or Laptop | 5,188 | 87.1% |
| Smartphone | 5,587 | 93.8% |
| Tablet | 4,154 | 69.8% |
| No Computing Device | 81 | 1.4% |
| Total | 5,955 | 100.0% |
Internet Access in Hewitt
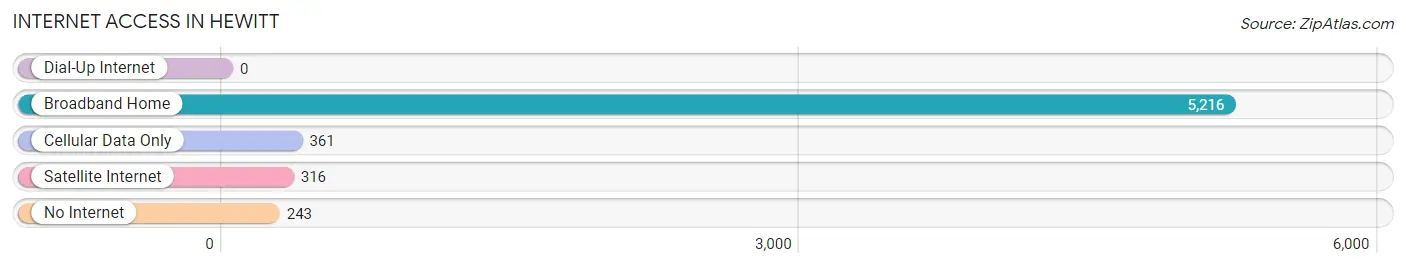
| Internet Type | # Households | % Households |
| Dial-Up Internet | 0 | 0.0% |
| Broadband Home | 5,216 | 87.6% |
| Cellular Data Only | 361 | 6.1% |
| Satellite Internet | 316 | 5.3% |
| No Internet | 243 | 4.1% |
| Total | 5,955 | 100.0% |
Hewitt Summary
Hewitt, Texas is a small city located in McLennan County, Texas. It is part of the Waco Metropolitan Statistical Area and is located about 10 miles north of Waco. The city was founded in 1881 and was named after John Hewitt, a local rancher. The population of Hewitt was estimated to be 8,845 in 2019.
Geography
Hewitt is located in Central Texas, about 10 miles north of Waco. It is situated in McLennan County, which is part of the Waco Metropolitan Statistical Area. The city is located at the intersection of U.S. Highway 84 and State Highway 6. The terrain of the area is mostly flat, with some rolling hills. The climate is humid subtropical, with hot summers and mild winters.
Economy
Hewitt’s economy is largely based on agriculture and manufacturing. The city is home to several large companies, including Hewitt-Tech, a manufacturer of electronic components, and the McLennan County Livestock Auction. The city also has a number of small businesses, including restaurants, retail stores, and service providers.
Demographics
As of the 2019 census, the population of Hewitt was 8,845. The racial makeup of the city was 79.2% White, 11.3% Hispanic or Latino, 6.2% African American, and 3.3% other. The median household income was $50,945, and the median age was 36.
Education
Hewitt is served by the Midway Independent School District. The district includes four elementary schools, two middle schools, and one high school. The city is also home to several private schools, including the Hewitt Christian Academy and the Hewitt Montessori School.
Conclusion
Hewitt, Texas is a small city located in McLennan County, Texas. It is part of the Waco Metropolitan Statistical Area and is located about 10 miles north of Waco. The city was founded in 1881 and was named after John Hewitt, a local rancher. The economy of Hewitt is largely based on agriculture and manufacturing, and the city is home to several large companies. The population of Hewitt was estimated to be 8,845 in 2019, and the racial makeup of the city was 79.2% White, 11.3% Hispanic or Latino, 6.2% African American, and 3.3% other. The city is served by the Midway Independent School District, as well as several private schools.
Common Questions
What is Per Capita Income in Hewitt?
Per Capita income in Hewitt is $34,883.
What is the Median Family Income in Hewitt?
Median Family Income in Hewitt is $87,738.
What is the Median Household income in Hewitt?
Median Household Income in Hewitt is $75,898.
What is Income or Wage Gap in Hewitt?
Income or Wage Gap in Hewitt is 33.0%.
Women in Hewitt earn 67.0 cents for every dollar earned by a man.
What is Family Income Deficit in Hewitt?
Family Income Deficit in Hewitt is $15,040.
Families that are below poverty line in Hewitt earn $15,040 less on average than the poverty threshold level.
What is Inequality or Gini Index in Hewitt?
Inequality or Gini Index in Hewitt is 0.38.
What is the Total Population of Hewitt?
Total Population of Hewitt is 16,034.
What is the Total Male Population of Hewitt?
Total Male Population of Hewitt is 7,429.
What is the Total Female Population of Hewitt?
Total Female Population of Hewitt is 8,605.
What is the Ratio of Males per 100 Females in Hewitt?
There are 86.33 Males per 100 Females in Hewitt.
What is the Ratio of Females per 100 Males in Hewitt?
There are 115.83 Females per 100 Males in Hewitt.
What is the Median Population Age in Hewitt?
Median Population Age in Hewitt is 36.3 Years.
What is the Average Family Size in Hewitt
Average Family Size in Hewitt is 3.1 People.
What is the Average Household Size in Hewitt
Average Household Size in Hewitt is 2.7 People.
How Large is the Labor Force in Hewitt?
There are 8,278 People in the Labor Forcein in Hewitt.
What is the Percentage of People in the Labor Force in Hewitt?
66.0% of People are in the Labor Force in Hewitt.
What is the Unemployment Rate in Hewitt?
Unemployment Rate in Hewitt is 4.7%.