Hamlin, TX Map & Demographics
Hamlin Map
Hamlin Overview
$23,346
PER CAPITA INCOME
$65,192
AVG FAMILY INCOME
$53,750
AVG HOUSEHOLD INCOME
32.0%
WAGE / INCOME GAP [ % ]
68.0¢/ $1
WAGE / INCOME GAP [ $ ]
$6,938
FAMILY INCOME DEFICIT
0.36
INEQUALITY / GINI INDEX
2,066
TOTAL POPULATION
1,092
MALE POPULATION
974
FEMALE POPULATION
112.11
MALES / 100 FEMALES
89.19
FEMALES / 100 MALES
35.3
MEDIAN AGE
2.7
AVG FAMILY SIZE
2.3
AVG HOUSEHOLD SIZE
1,044
LABOR FORCE [ PEOPLE ]
67.3%
PERCENT IN LABOR FORCE
1.6%
UNEMPLOYMENT RATE
Hamlin Zip Codes
Hamlin Area Codes
Income in Hamlin
Income Overview in Hamlin
Per Capita Income in Hamlin is $23,346, while median incomes of families and households are $65,192 and $53,750 respectively.
| Characteristic | Number | Measure |
| Per Capita Income | 2,066 | $23,346 |
| Median Family Income | 644 | $65,192 |
| Mean Family Income | 644 | $70,320 |
| Median Household Income | 880 | $53,750 |
| Mean Household Income | 880 | $61,079 |
| Income Deficit | 644 | $6,938 |
| Wage / Income Gap (%) | 2,066 | 31.98% |
| Wage / Income Gap ($) | 2,066 | 68.02¢ per $1 |
| Gini / Inequality Index | 2,066 | 0.36 |
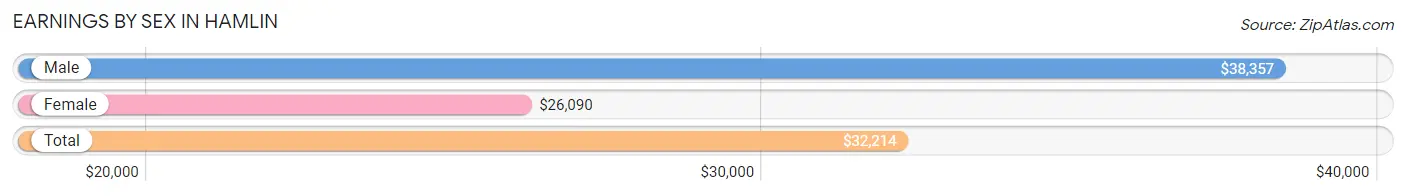
Earnings by Sex in Hamlin
Average Earnings in Hamlin are $32,214, $38,357 for men and $26,090 for women, a difference of 32.0%.
| Sex | Number | Average Earnings |
| Male | 552 (52.5%) | $38,357 |
| Female | 500 (47.5%) | $26,090 |
| Total | 1,052 (100.0%) | $32,214 |
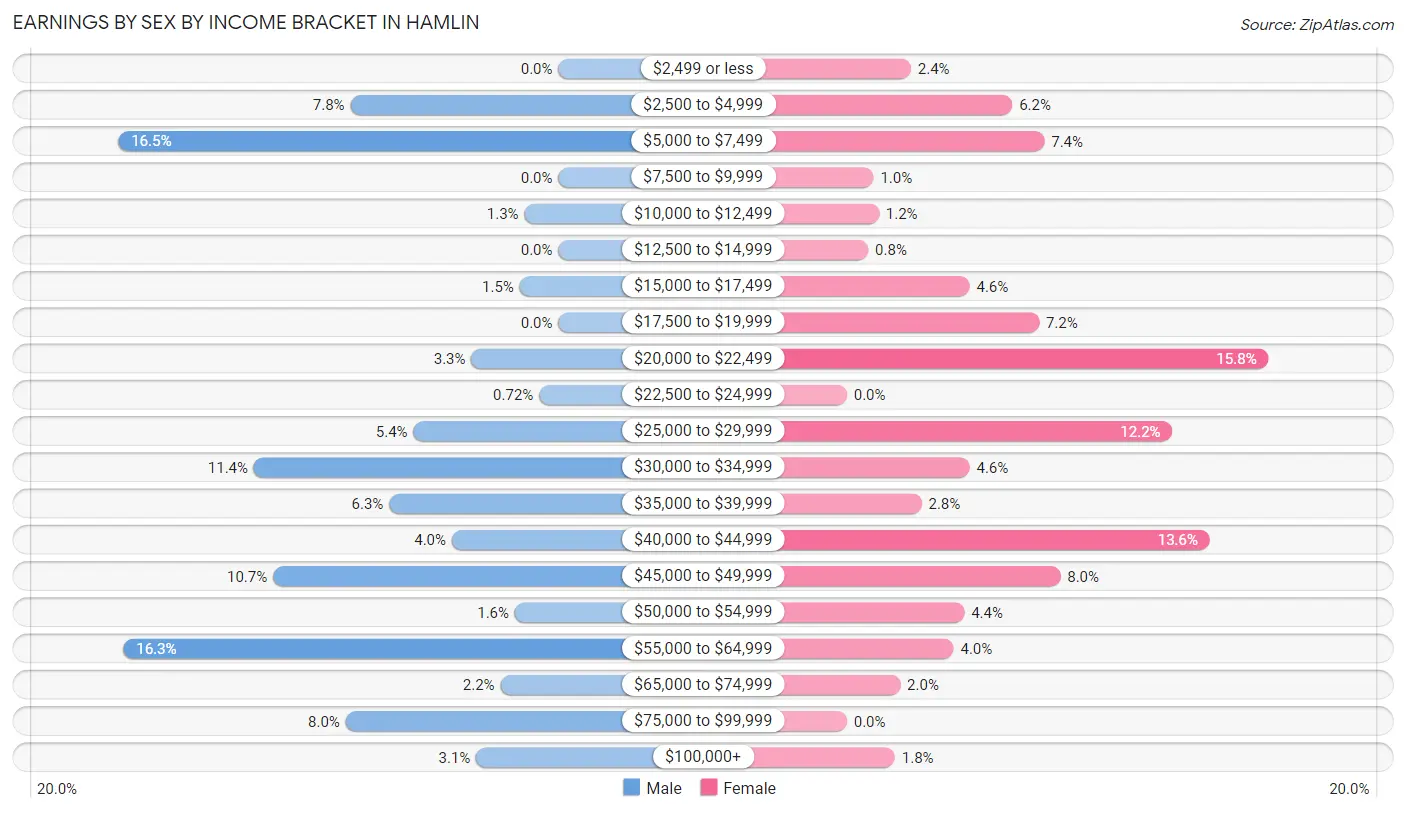
Earnings by Sex by Income Bracket in Hamlin
The most common earnings brackets in Hamlin are $5,000 to $7,499 for men (91 | 16.5%) and $20,000 to $22,499 for women (79 | 15.8%).
| Income | Male | Female |
| $2,499 or less | 0 (0.0%) | 12 (2.4%) |
| $2,500 to $4,999 | 43 (7.8%) | 31 (6.2%) |
| $5,000 to $7,499 | 91 (16.5%) | 37 (7.4%) |
| $7,500 to $9,999 | 0 (0.0%) | 5 (1.0%) |
| $10,000 to $12,499 | 7 (1.3%) | 6 (1.2%) |
| $12,500 to $14,999 | 0 (0.0%) | 4 (0.8%) |
| $15,000 to $17,499 | 8 (1.5%) | 23 (4.6%) |
| $17,500 to $19,999 | 0 (0.0%) | 36 (7.2%) |
| $20,000 to $22,499 | 18 (3.3%) | 79 (15.8%) |
| $22,500 to $24,999 | 4 (0.7%) | 0 (0.0%) |
| $25,000 to $29,999 | 30 (5.4%) | 61 (12.2%) |
| $30,000 to $34,999 | 63 (11.4%) | 23 (4.6%) |
| $35,000 to $39,999 | 35 (6.3%) | 14 (2.8%) |
| $40,000 to $44,999 | 22 (4.0%) | 68 (13.6%) |
| $45,000 to $49,999 | 59 (10.7%) | 40 (8.0%) |
| $50,000 to $54,999 | 9 (1.6%) | 22 (4.4%) |
| $55,000 to $64,999 | 90 (16.3%) | 20 (4.0%) |
| $65,000 to $74,999 | 12 (2.2%) | 10 (2.0%) |
| $75,000 to $99,999 | 44 (8.0%) | 0 (0.0%) |
| $100,000+ | 17 (3.1%) | 9 (1.8%) |
| Total | 552 (100.0%) | 500 (100.0%) |
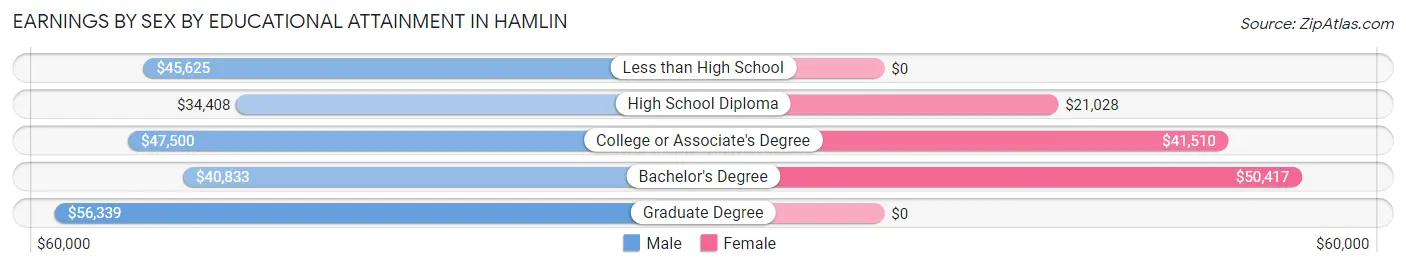
Earnings by Sex by Educational Attainment in Hamlin
Average earnings in Hamlin are $43,750 for men and $28,750 for women, a difference of 34.3%. Men with an educational attainment of graduate degree enjoy the highest average annual earnings of $56,339, while those with high school diploma education earn the least with $34,408. Women with an educational attainment of bachelor's degree earn the most with the average annual earnings of $50,417, while those with high school diploma education have the smallest earnings of $21,028.
| Educational Attainment | Male Income | Female Income |
| Less than High School | $45,625 | $0 |
| High School Diploma | $34,408 | $21,028 |
| College or Associate's Degree | $47,500 | $41,510 |
| Bachelor's Degree | $40,833 | $50,417 |
| Graduate Degree | $56,339 | $0 |
| Total | $43,750 | $28,750 |
Family Income in Hamlin
Family Income Brackets in Hamlin
According to the Hamlin family income data, there are 221 families falling into the $50,000 to $74,999 income range, which is the most common income bracket and makes up 34.3% of all families.
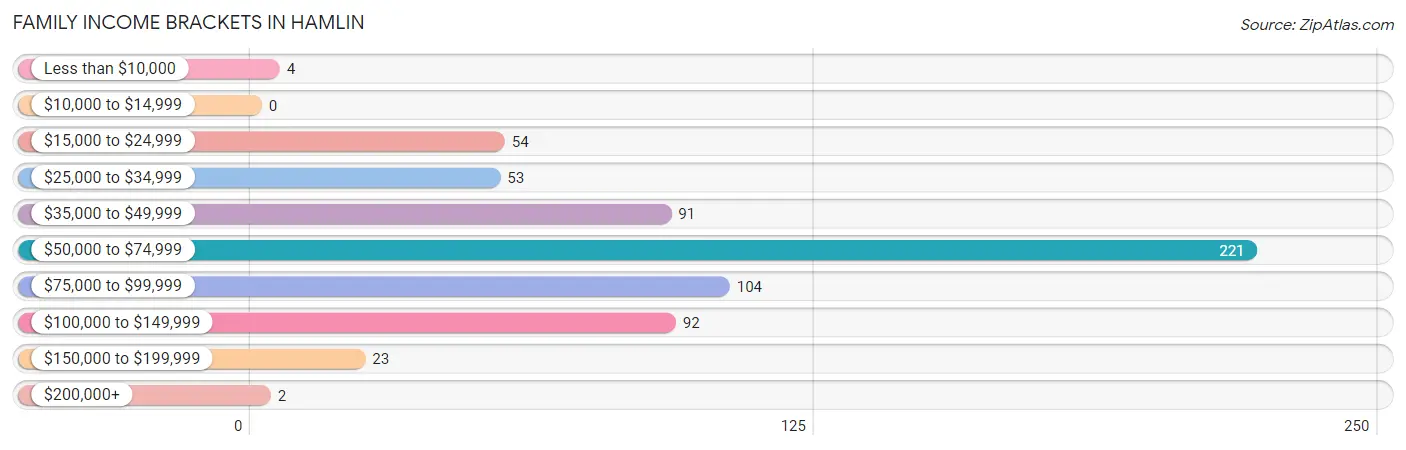
| Income Bracket | # Families | % Families |
| Less than $10,000 | 4 | 0.6% |
| $10,000 to $14,999 | 0 | 0.0% |
| $15,000 to $24,999 | 54 | 8.4% |
| $25,000 to $34,999 | 53 | 8.2% |
| $35,000 to $49,999 | 91 | 14.1% |
| $50,000 to $74,999 | 221 | 34.3% |
| $75,000 to $99,999 | 104 | 16.1% |
| $100,000 to $149,999 | 92 | 14.3% |
| $150,000 to $199,999 | 23 | 3.6% |
| $200,000+ | 2 | 0.3% |
Family Income by Famaliy Size in Hamlin
4-person families (207 | 32.1%) account for the highest median family income in Hamlin with $74,334 per family, while 2-person families (274 | 42.5%) have the highest median income of $29,219 per family member.
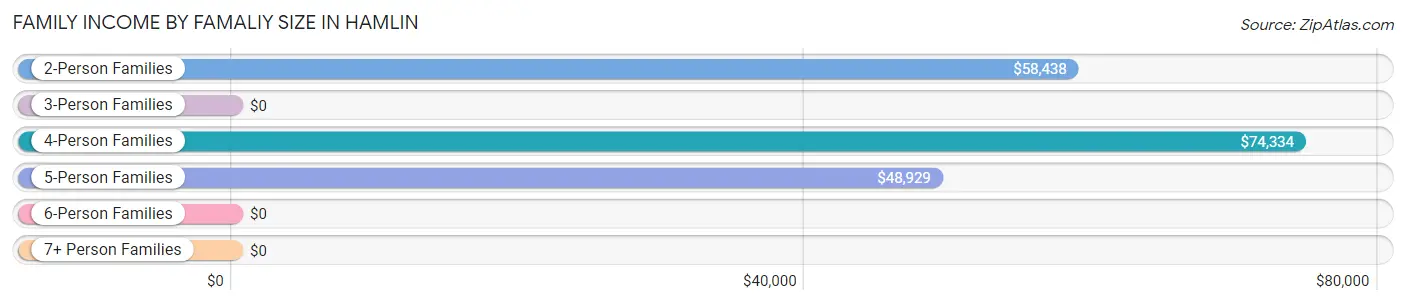
| Income Bracket | # Families | Median Income |
| 2-Person Families | 274 (42.5%) | $58,438 |
| 3-Person Families | 112 (17.4%) | $0 |
| 4-Person Families | 207 (32.1%) | $74,334 |
| 5-Person Families | 40 (6.2%) | $48,929 |
| 6-Person Families | 5 (0.8%) | $0 |
| 7+ Person Families | 6 (0.9%) | $0 |
| Total | 644 (100.0%) | $65,192 |
Family Income by Number of Earners in Hamlin
The median family income in Hamlin is $65,192, with families comprising 2 earners (275) having the highest median family income of $83,324, while families with no earners (84) have the lowest median family income of $46,667, accounting for 42.7% and 13.0% of families, respectively.
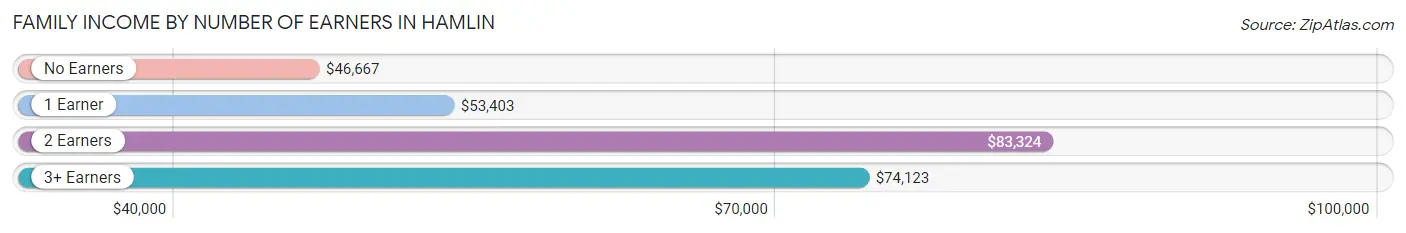
| Number of Earners | # Families | Median Income |
| No Earners | 84 (13.0%) | $46,667 |
| 1 Earner | 185 (28.7%) | $53,403 |
| 2 Earners | 275 (42.7%) | $83,324 |
| 3+ Earners | 100 (15.5%) | $74,123 |
| Total | 644 (100.0%) | $65,192 |
Household Income in Hamlin
Household Income Brackets in Hamlin
With 235 households falling in the category, the $50,000 to $74,999 income range is the most frequent in Hamlin, accounting for 26.7% of all households. In contrast, only 6 households (0.7%) fall into the $200,000+ income bracket, making it the least populous group.
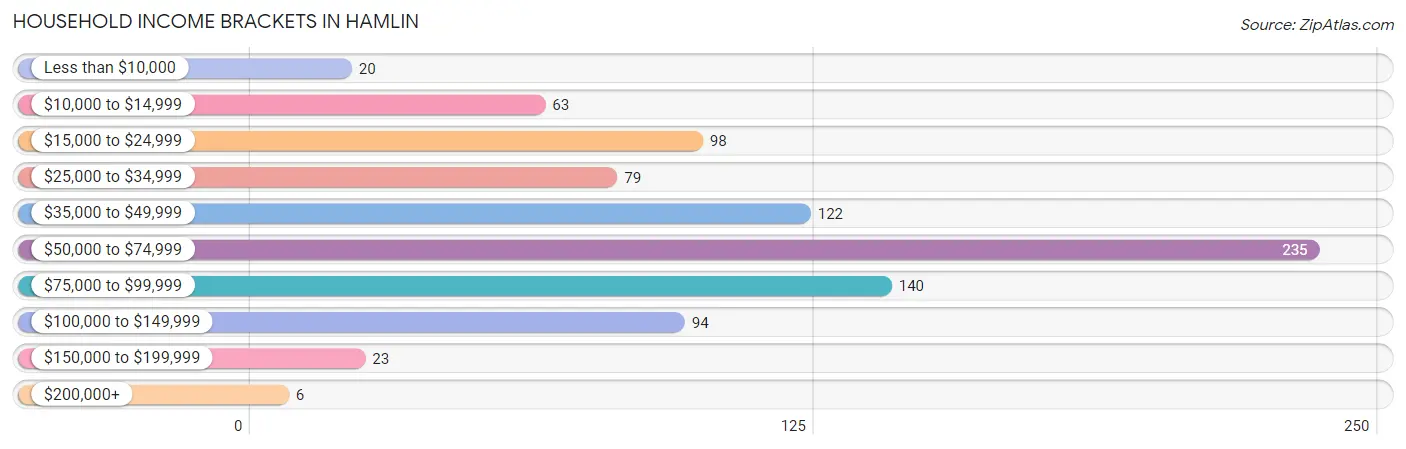
| Income Bracket | # Households | % Households |
| Less than $10,000 | 20 | 2.3% |
| $10,000 to $14,999 | 63 | 7.2% |
| $15,000 to $24,999 | 98 | 11.1% |
| $25,000 to $34,999 | 79 | 9.0% |
| $35,000 to $49,999 | 122 | 13.9% |
| $50,000 to $74,999 | 235 | 26.7% |
| $75,000 to $99,999 | 140 | 15.9% |
| $100,000 to $149,999 | 94 | 10.7% |
| $150,000 to $199,999 | 23 | 2.6% |
| $200,000+ | 6 | 0.7% |
Household Income by Householder Age in Hamlin
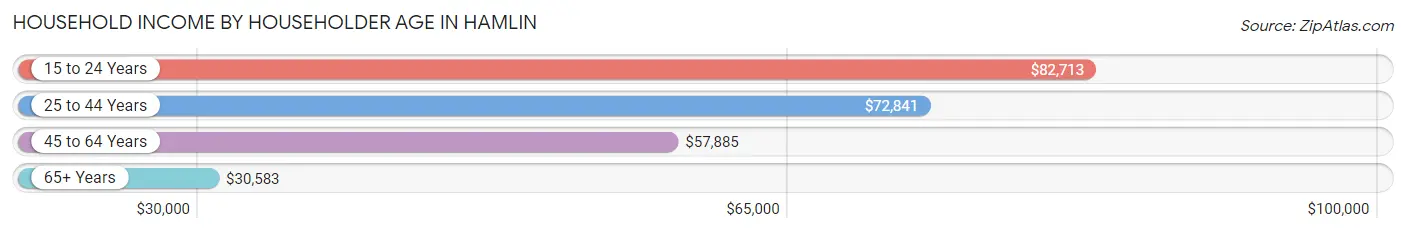
The median household income in Hamlin is $53,750, with the highest median household income of $82,713 found in the 15 to 24 years age bracket for the primary householder. A total of 154 households (17.5%) fall into this category. Meanwhile, the 65+ years age bracket for the primary householder has the lowest median household income of $30,583, with 307 households (34.9%) in this group.
| Income Bracket | # Households | Median Income |
| 15 to 24 Years | 154 (17.5%) | $82,713 |
| 25 to 44 Years | 261 (29.7%) | $72,841 |
| 45 to 64 Years | 158 (17.9%) | $57,885 |
| 65+ Years | 307 (34.9%) | $30,583 |
| Total | 880 (100.0%) | $53,750 |
Poverty in Hamlin
Income Below Poverty by Sex and Age in Hamlin
With 12.2% poverty level for males and 9.6% for females among the residents of Hamlin, 5 year old males and 16 and 17 year old females are the most vulnerable to poverty, with 5 males (100.0%) and 27 females (62.8%) in their respective age groups living below the poverty level.
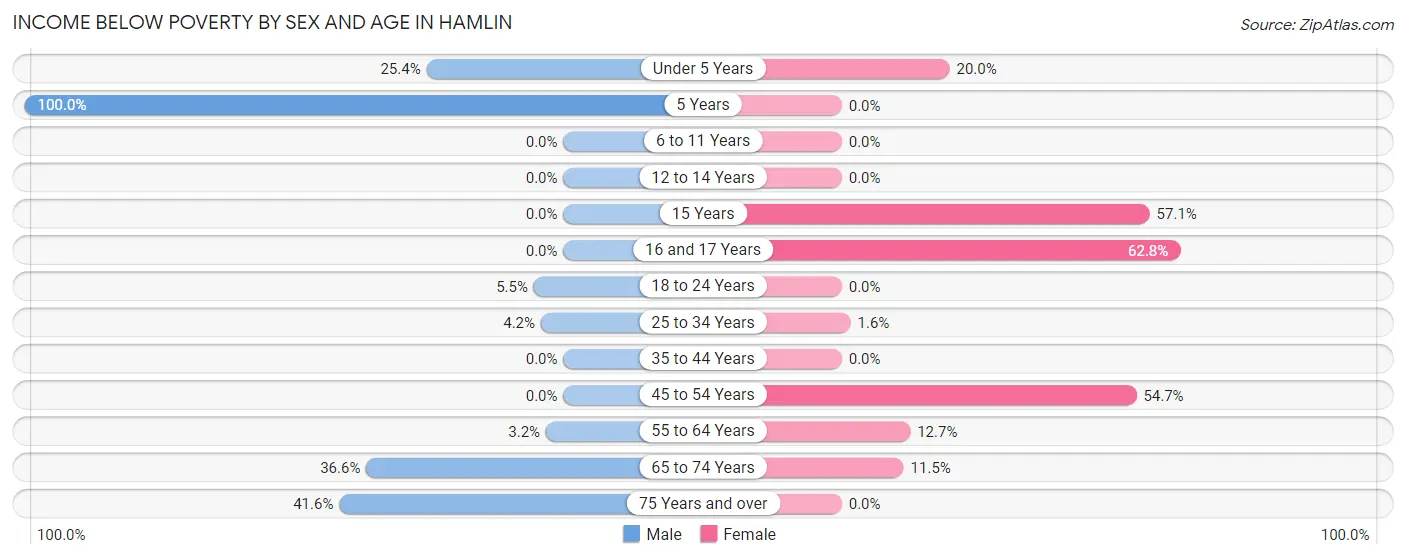
| Age Bracket | Male | Female |
| Under 5 Years | 16 (25.4%) | 3 (20.0%) |
| 5 Years | 5 (100.0%) | 0 (0.0%) |
| 6 to 11 Years | 0 (0.0%) | 0 (0.0%) |
| 12 to 14 Years | 0 (0.0%) | 0 (0.0%) |
| 15 Years | 0 (0.0%) | 4 (57.1%) |
| 16 and 17 Years | 0 (0.0%) | 27 (62.8%) |
| 18 to 24 Years | 10 (5.5%) | 0 (0.0%) |
| 25 to 34 Years | 3 (4.2%) | 1 (1.6%) |
| 35 to 44 Years | 0 (0.0%) | 0 (0.0%) |
| 45 to 54 Years | 0 (0.0%) | 35 (54.7%) |
| 55 to 64 Years | 1 (3.2%) | 8 (12.7%) |
| 65 to 74 Years | 45 (36.6%) | 14 (11.5%) |
| 75 Years and over | 52 (41.6%) | 0 (0.0%) |
| Total | 132 (12.2%) | 92 (9.6%) |
Income Above Poverty by Sex and Age in Hamlin
According to the poverty statistics in Hamlin, males aged 6 to 11 years and females aged 6 to 11 years are the age groups that are most secure financially, with 100.0% of males and 100.0% of females in these age groups living above the poverty line.
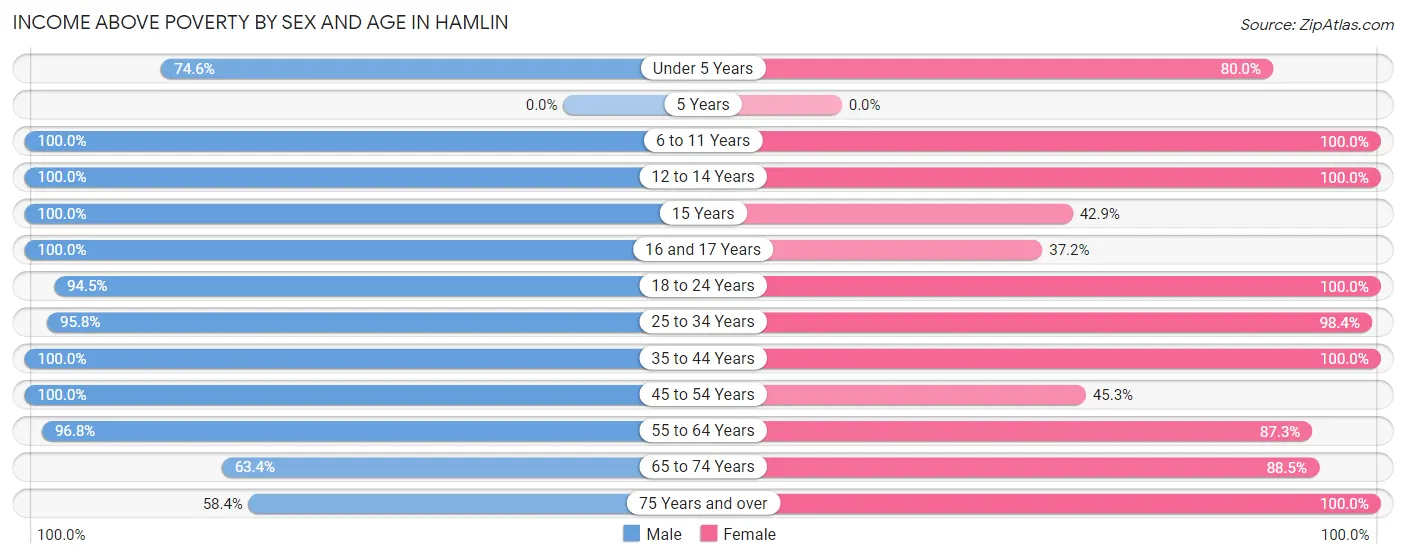
| Age Bracket | Male | Female |
| Under 5 Years | 47 (74.6%) | 12 (80.0%) |
| 5 Years | 0 (0.0%) | 0 (0.0%) |
| 6 to 11 Years | 143 (100.0%) | 129 (100.0%) |
| 12 to 14 Years | 81 (100.0%) | 46 (100.0%) |
| 15 Years | 25 (100.0%) | 3 (42.9%) |
| 16 and 17 Years | 11 (100.0%) | 16 (37.2%) |
| 18 to 24 Years | 172 (94.5%) | 136 (100.0%) |
| 25 to 34 Years | 69 (95.8%) | 60 (98.4%) |
| 35 to 44 Years | 98 (100.0%) | 210 (100.0%) |
| 45 to 54 Years | 125 (100.0%) | 29 (45.3%) |
| 55 to 64 Years | 30 (96.8%) | 55 (87.3%) |
| 65 to 74 Years | 78 (63.4%) | 108 (88.5%) |
| 75 Years and over | 73 (58.4%) | 63 (100.0%) |
| Total | 952 (87.8%) | 867 (90.4%) |
Income Below Poverty Among Married-Couple Families in Hamlin
The poverty statistics for married-couple families in Hamlin show that 8.5% or 48 of the total 565 families live below the poverty line. Families with 1 or 2 children have the highest poverty rate of 14.9%, comprising of 41 families. On the other hand, families with no children have the lowest poverty rate of 1.7%, which includes 4 families.
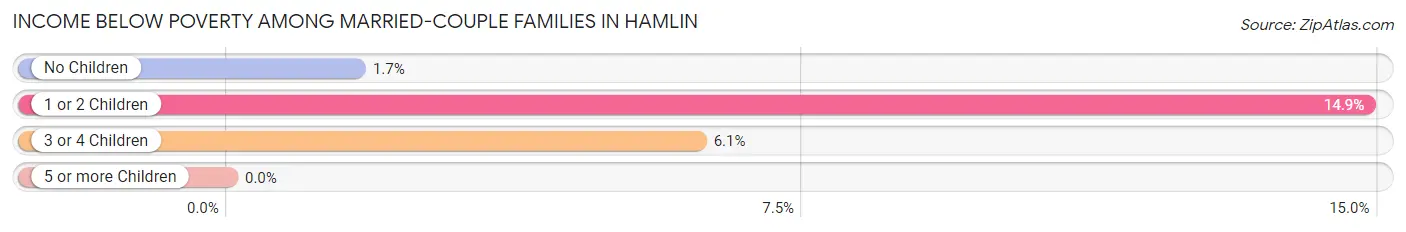
| Children | Above Poverty | Below Poverty |
| No Children | 236 (98.3%) | 4 (1.7%) |
| 1 or 2 Children | 235 (85.1%) | 41 (14.9%) |
| 3 or 4 Children | 46 (93.9%) | 3 (6.1%) |
| 5 or more Children | 0 (0.0%) | 0 (0.0%) |
| Total | 517 (91.5%) | 48 (8.5%) |
Income Below Poverty Among Single-Parent Households in Hamlin
| Children | Single Father | Single Mother |
| No Children | 0 (0.0%) | 0 (0.0%) |
| 1 or 2 Children | 0 (0.0%) | 0 (0.0%) |
| 3 or 4 Children | 0 (0.0%) | 0 (0.0%) |
| 5 or more Children | 0 (0.0%) | 0 (0.0%) |
| Total | 0 (0.0%) | 0 (0.0%) |
Income Below Poverty Among Married-Couple vs Single-Parent Households in Hamlin
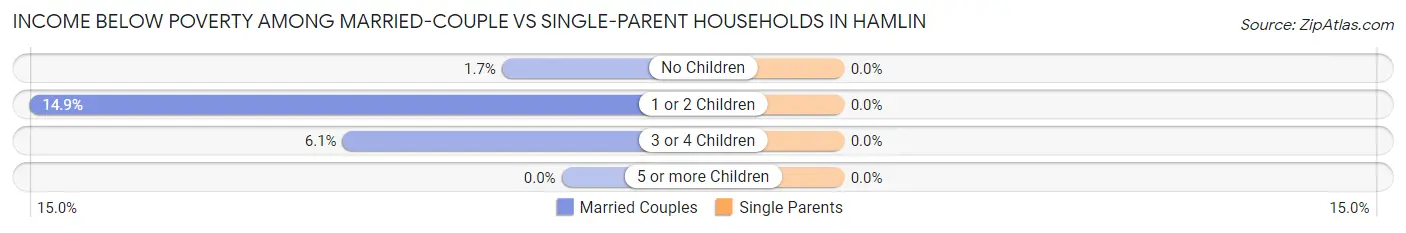
| Children | Married-Couple Families | Single-Parent Households |
| No Children | 4 (1.7%) | 0 (0.0%) |
| 1 or 2 Children | 41 (14.9%) | 0 (0.0%) |
| 3 or 4 Children | 3 (6.1%) | 0 (0.0%) |
| 5 or more Children | 0 (0.0%) | 0 (0.0%) |
| Total | 48 (8.5%) | 0 (0.0%) |
Race in Hamlin
The most populous races in Hamlin are White / Caucasian (1,430 | 69.2%), Hispanic or Latino (836 | 40.5%), and Two or more Races (521 | 25.2%).
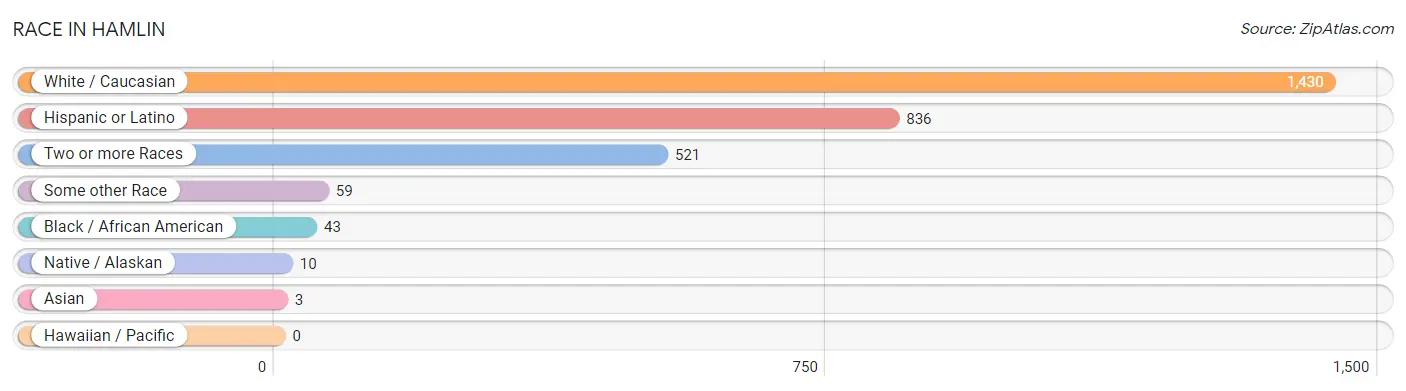
| Race | # Population | % Population |
| Asian | 3 | 0.2% |
| Black / African American | 43 | 2.1% |
| Hawaiian / Pacific | 0 | 0.0% |
| Hispanic or Latino | 836 | 40.5% |
| Native / Alaskan | 10 | 0.5% |
| White / Caucasian | 1,430 | 69.2% |
| Two or more Races | 521 | 25.2% |
| Some other Race | 59 | 2.9% |
| Total | 2,066 | 100.0% |
Ancestry in Hamlin
The most populous ancestries reported in Hamlin are Mexican (781 | 37.8%), English (343 | 16.6%), German (159 | 7.7%), American (156 | 7.5%), and Irish (148 | 7.2%), together accounting for 76.8% of all Hamlin residents.
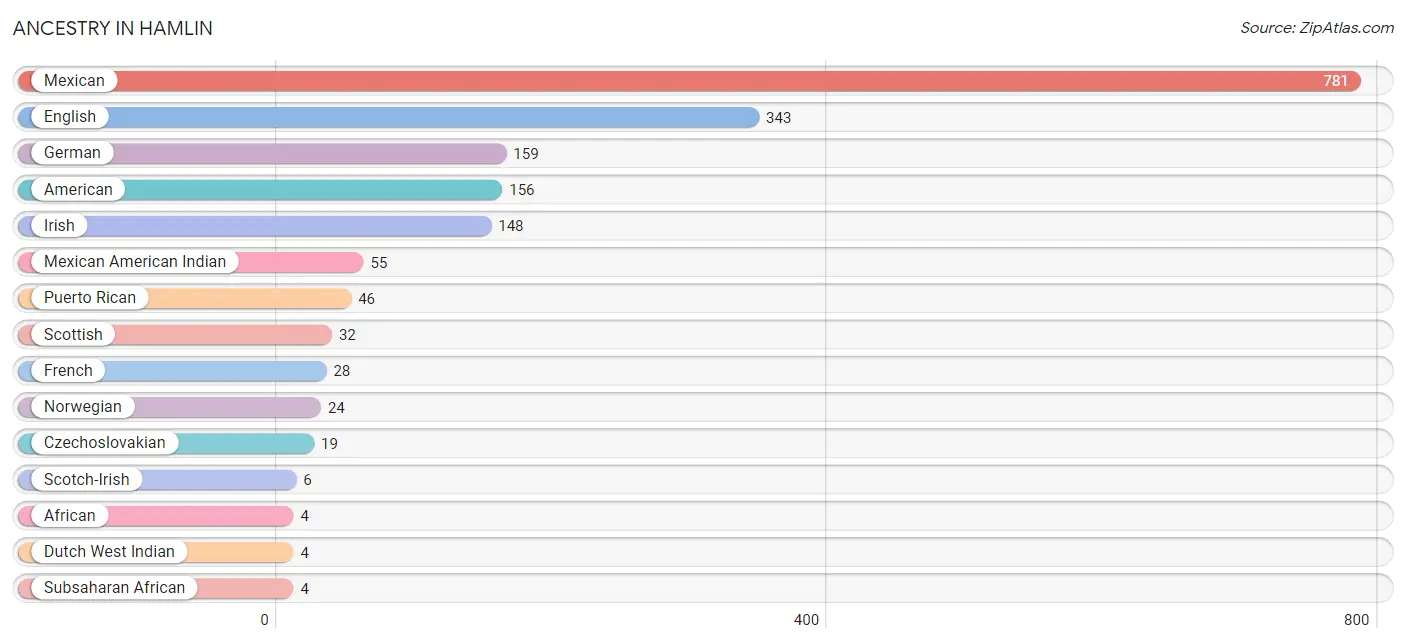
| Ancestry | # Population | % Population |
| African | 4 | 0.2% |
| American | 156 | 7.5% |
| Choctaw | 2 | 0.1% |
| Czechoslovakian | 19 | 0.9% |
| Dutch | 1 | 0.1% |
| Dutch West Indian | 4 | 0.2% |
| English | 343 | 16.6% |
| French | 28 | 1.4% |
| German | 159 | 7.7% |
| Irish | 148 | 7.2% |
| Italian | 2 | 0.1% |
| Korean | 2 | 0.1% |
| Laotian | 3 | 0.2% |
| Mexican | 781 | 37.8% |
| Mexican American Indian | 55 | 2.7% |
| Norwegian | 24 | 1.2% |
| Puerto Rican | 46 | 2.2% |
| Scotch-Irish | 6 | 0.3% |
| Scottish | 32 | 1.5% |
| Subsaharan African | 4 | 0.2% | View All 20 Rows |
Immigrants in Hamlin
The most numerous immigrant groups reported in Hamlin came from Central America (18 | 0.9%), Latin America (18 | 0.9%), Mexico (18 | 0.9%), Asia (3 | 0.2%), and South Eastern Asia (3 | 0.2%), together accounting for 2.9% of all Hamlin residents.
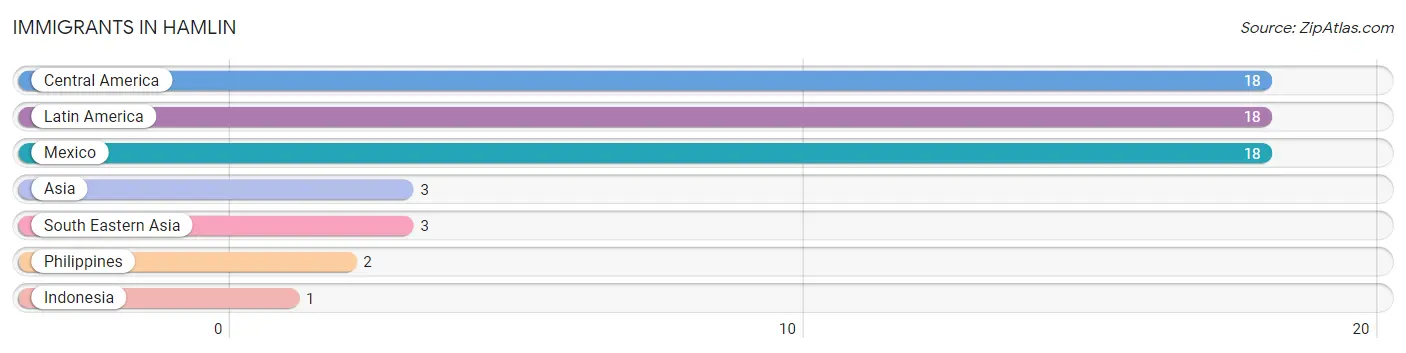
| Immigration Origin | # Population | % Population |
| Asia | 3 | 0.2% |
| Central America | 18 | 0.9% |
| Indonesia | 1 | 0.1% |
| Latin America | 18 | 0.9% |
| Mexico | 18 | 0.9% |
| Philippines | 2 | 0.1% |
| South Eastern Asia | 3 | 0.2% | View All 7 Rows |
Sex and Age in Hamlin
Sex and Age in Hamlin
The most populous age groups in Hamlin are 20 to 24 Years (168 | 15.4%) for men and 10 to 14 Years (139 | 14.3%) for women.
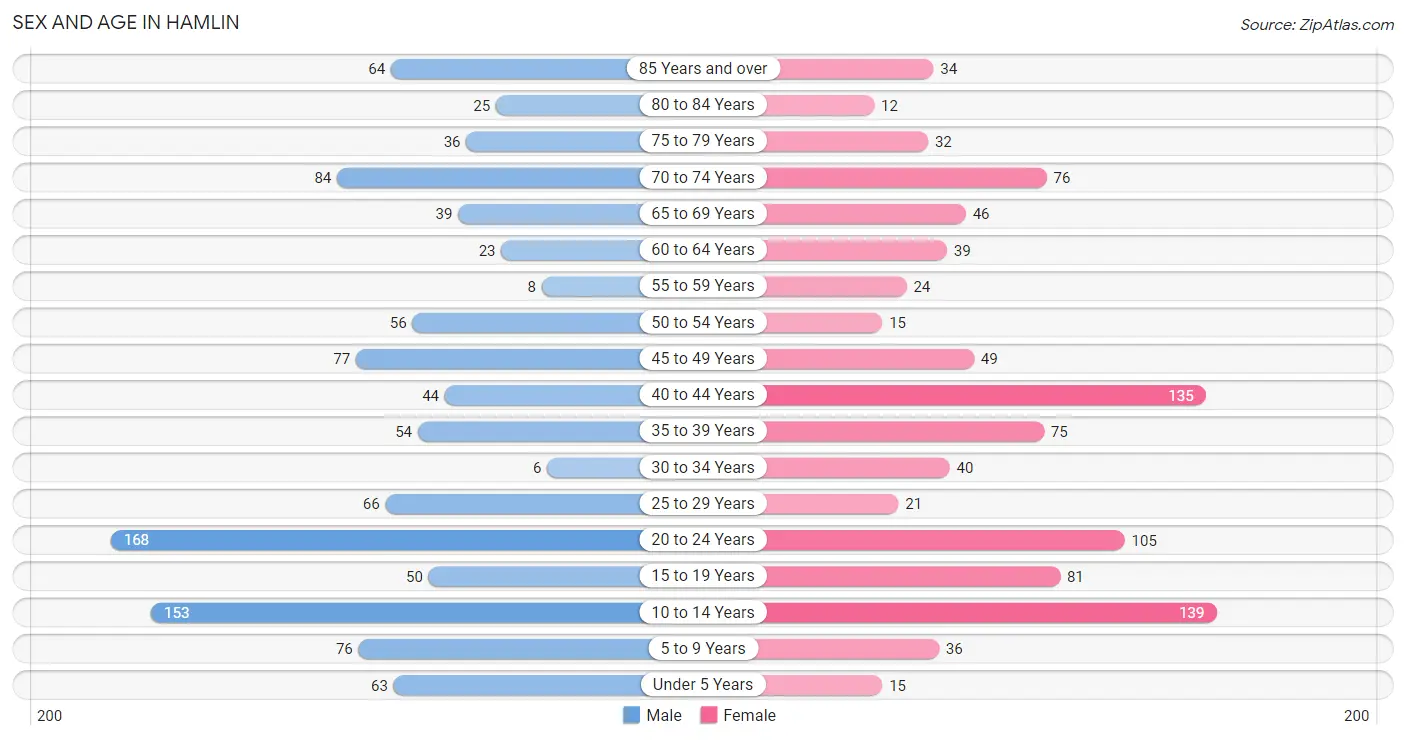
| Age Bracket | Male | Female |
| Under 5 Years | 63 (5.8%) | 15 (1.5%) |
| 5 to 9 Years | 76 (7.0%) | 36 (3.7%) |
| 10 to 14 Years | 153 (14.0%) | 139 (14.3%) |
| 15 to 19 Years | 50 (4.6%) | 81 (8.3%) |
| 20 to 24 Years | 168 (15.4%) | 105 (10.8%) |
| 25 to 29 Years | 66 (6.0%) | 21 (2.2%) |
| 30 to 34 Years | 6 (0.5%) | 40 (4.1%) |
| 35 to 39 Years | 54 (5.0%) | 75 (7.7%) |
| 40 to 44 Years | 44 (4.0%) | 135 (13.9%) |
| 45 to 49 Years | 77 (7.0%) | 49 (5.0%) |
| 50 to 54 Years | 56 (5.1%) | 15 (1.5%) |
| 55 to 59 Years | 8 (0.7%) | 24 (2.5%) |
| 60 to 64 Years | 23 (2.1%) | 39 (4.0%) |
| 65 to 69 Years | 39 (3.6%) | 46 (4.7%) |
| 70 to 74 Years | 84 (7.7%) | 76 (7.8%) |
| 75 to 79 Years | 36 (3.3%) | 32 (3.3%) |
| 80 to 84 Years | 25 (2.3%) | 12 (1.2%) |
| 85 Years and over | 64 (5.9%) | 34 (3.5%) |
| Total | 1,092 (100.0%) | 974 (100.0%) |
Families and Households in Hamlin
Median Family Size in Hamlin
The median family size in Hamlin is 2.71 persons per family, with married-couple families (565 | 87.7%) accounting for the largest median family size of 2.85 persons per family. On the other hand, single female/mother families (46 | 7.1%) represent the smallest median family size with 1.65 persons per family.
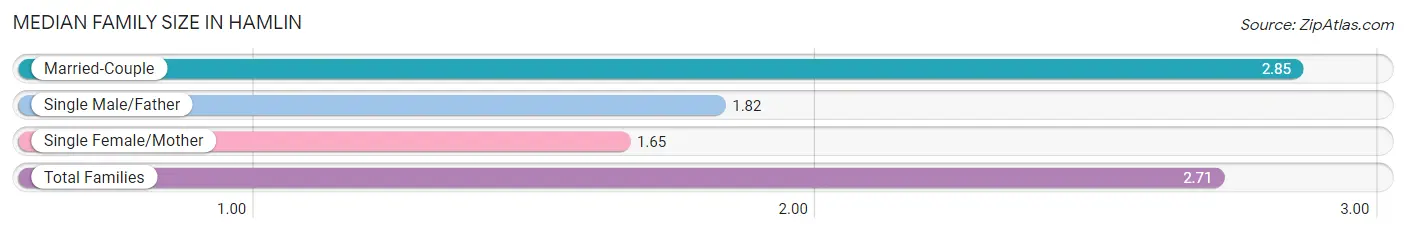
| Family Type | # Families | Family Size |
| Married-Couple | 565 (87.7%) | 2.85 |
| Single Male/Father | 33 (5.1%) | 1.82 |
| Single Female/Mother | 46 (7.1%) | 1.65 |
| Total Families | 644 (100.0%) | 2.71 |
Median Household Size in Hamlin
The median household size in Hamlin is 2.32 persons per household, with married-couple households (565 | 64.2%) accounting for the largest median household size of 2.9 persons per household. non-family households (236 | 26.8%) represent the smallest median household size with 1.09 persons per household.
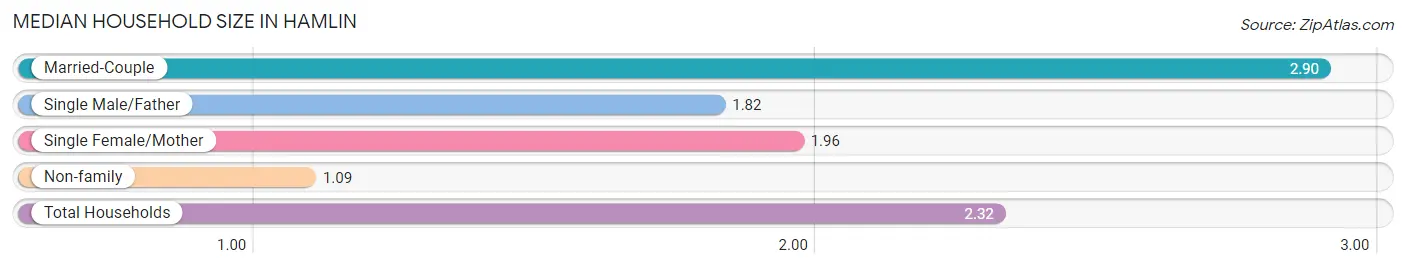
| Household Type | # Households | Household Size |
| Married-Couple | 565 (64.2%) | 2.90 |
| Single Male/Father | 33 (3.7%) | 1.82 |
| Single Female/Mother | 46 (5.2%) | 1.96 |
| Non-family | 236 (26.8%) | 1.09 |
| Total Households | 880 (100.0%) | 2.32 |
Household Size by Marriage Status in Hamlin
Out of a total of 880 households in Hamlin, 644 (73.2%) are family households, while 236 (26.8%) are nonfamily households. The most numerous type of family households are 2-person households, comprising 264, and the most common type of nonfamily households are 1-person households, comprising 210.
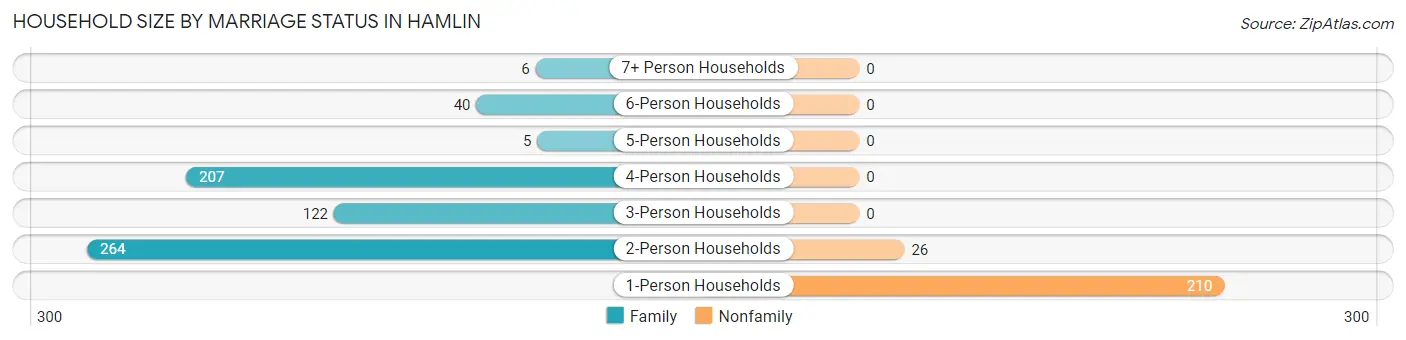
| Household Size | Family Households | Nonfamily Households |
| 1-Person Households | - | 210 (23.9%) |
| 2-Person Households | 264 (30.0%) | 26 (2.9%) |
| 3-Person Households | 122 (13.9%) | 0 (0.0%) |
| 4-Person Households | 207 (23.5%) | 0 (0.0%) |
| 5-Person Households | 5 (0.6%) | 0 (0.0%) |
| 6-Person Households | 40 (4.5%) | 0 (0.0%) |
| 7+ Person Households | 6 (0.7%) | 0 (0.0%) |
| Total | 644 (73.2%) | 236 (26.8%) |
Female Fertility in Hamlin
Fertility by Age in Hamlin
Average fertility rate in Hamlin is 41.0 births per 1,000 women. Women in the age bracket of 20 to 34 years have the highest fertility rate with 127.0 births per 1,000 women. Women in the age bracket of 20 to 34 years acount for 100.0% of all women with births.
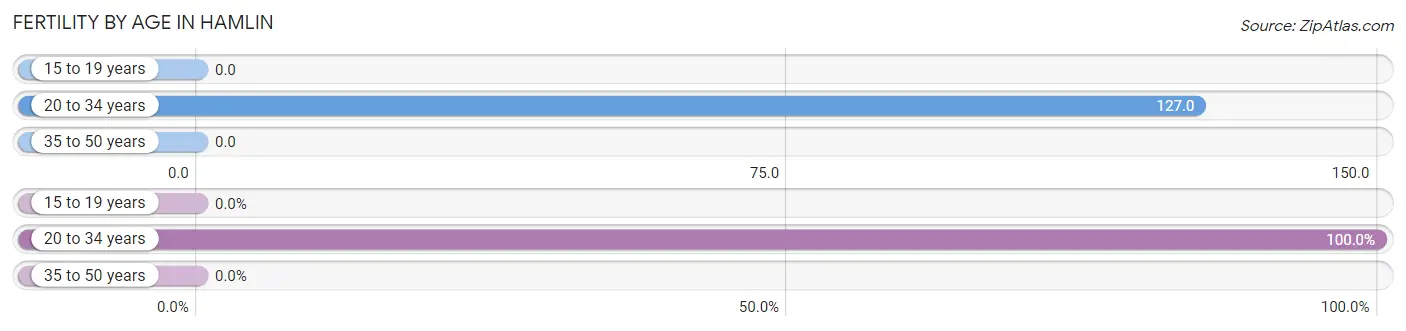
| Age Bracket | Women with Births | Births / 1,000 Women |
| 15 to 19 years | 0 (0.0%) | 0.0 |
| 20 to 34 years | 21 (100.0%) | 127.0 |
| 35 to 50 years | 0 (0.0%) | 0.0 |
| Total | 21 (100.0%) | 41.0 |
Fertility by Age by Marriage Status in Hamlin
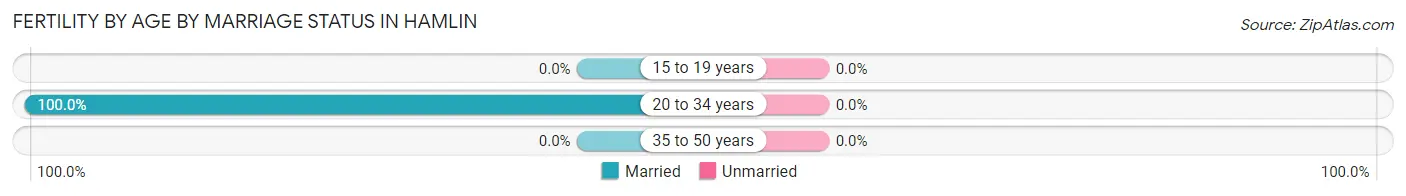
| Age Bracket | Married | Unmarried |
| 15 to 19 years | 0 (0.0%) | 0 (0.0%) |
| 20 to 34 years | 21 (100.0%) | 0 (0.0%) |
| 35 to 50 years | 0 (0.0%) | 0 (0.0%) |
| Total | 21 (100.0%) | 0 (0.0%) |
Fertility by Education in Hamlin
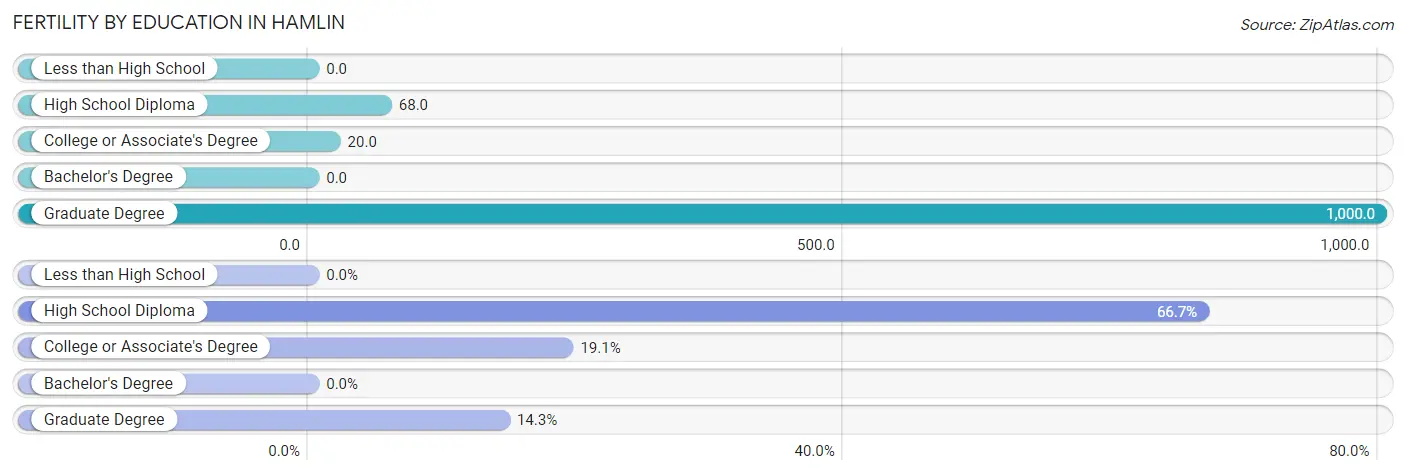
| Educational Attainment | Women with Births | Births / 1,000 Women |
| Less than High School | 0 (0.0%) | 0.0 |
| High School Diploma | 14 (66.7%) | 68.0 |
| College or Associate's Degree | 4 (19.1%) | 20.0 |
| Bachelor's Degree | 0 (0.0%) | 0.0 |
| Graduate Degree | 3 (14.3%) | 1,000.0 |
| Total | 21 (100.0%) | 41.0 |
Fertility by Education by Marriage Status in Hamlin
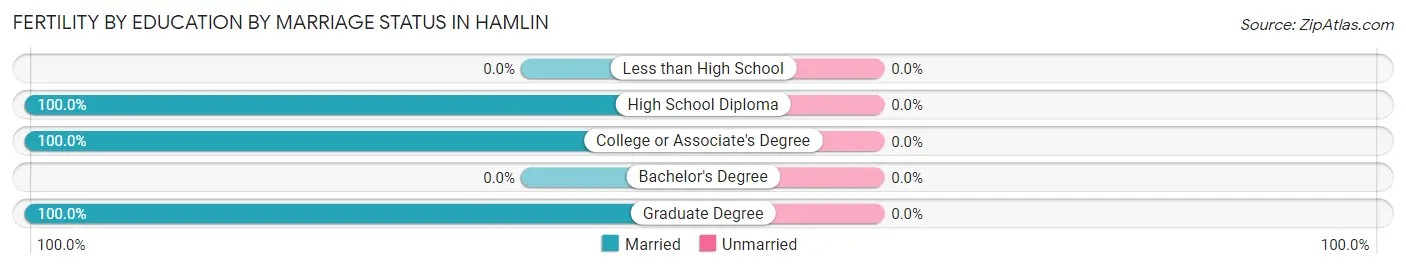
| Educational Attainment | Married | Unmarried |
| Less than High School | 0 (0.0%) | 0 (0.0%) |
| High School Diploma | 14 (100.0%) | 0 (0.0%) |
| College or Associate's Degree | 4 (100.0%) | 0 (0.0%) |
| Bachelor's Degree | 0 (0.0%) | 0 (0.0%) |
| Graduate Degree | 3 (100.0%) | 0 (0.0%) |
| Total | 21 (100.0%) | 0 (0.0%) |
Employment Characteristics in Hamlin
Employment by Class of Employer in Hamlin
Among the 1,020 employed individuals in Hamlin, private company employees (617 | 60.5%), self-employed (not incorporated) (181 | 17.7%), and local government employees (157 | 15.4%) make up the most common classes of employment.
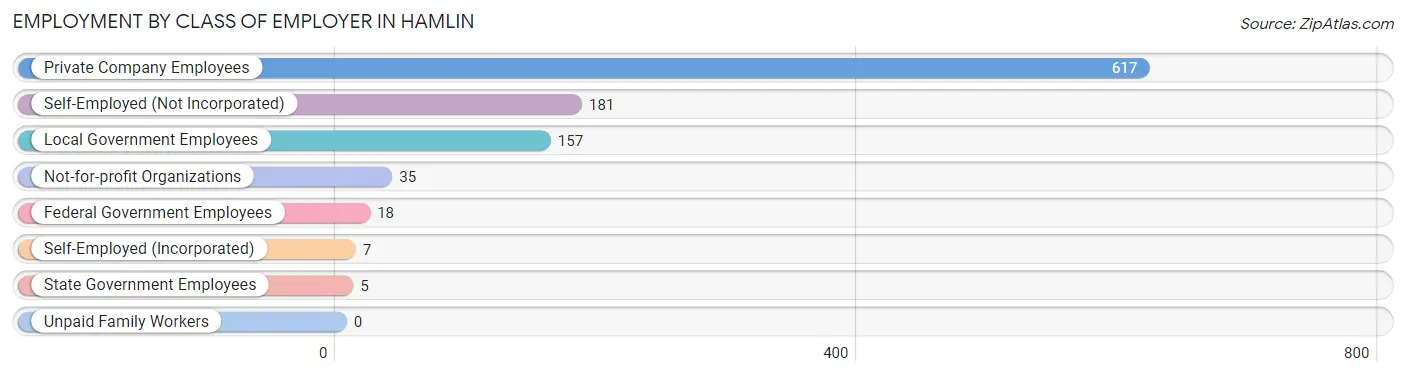
| Employer Class | # Employees | % Employees |
| Private Company Employees | 617 | 60.5% |
| Self-Employed (Incorporated) | 7 | 0.7% |
| Self-Employed (Not Incorporated) | 181 | 17.7% |
| Not-for-profit Organizations | 35 | 3.4% |
| Local Government Employees | 157 | 15.4% |
| State Government Employees | 5 | 0.5% |
| Federal Government Employees | 18 | 1.8% |
| Unpaid Family Workers | 0 | 0.0% |
| Total | 1,020 | 100.0% |
Employment Status by Age in Hamlin
According to the labor force statistics for Hamlin, out of the total population over 16 years of age (1,552), 67.3% or 1,044 individuals are in the labor force, with 1.6% or 17 of them unemployed. The age group with the highest labor force participation rate is 20 to 24 years, with 100.0% or 273 individuals in the labor force. Within the labor force, the 75 years and over age range has the highest percentage of unemployed individuals, with 22.6% or 7 of them being unemployed.
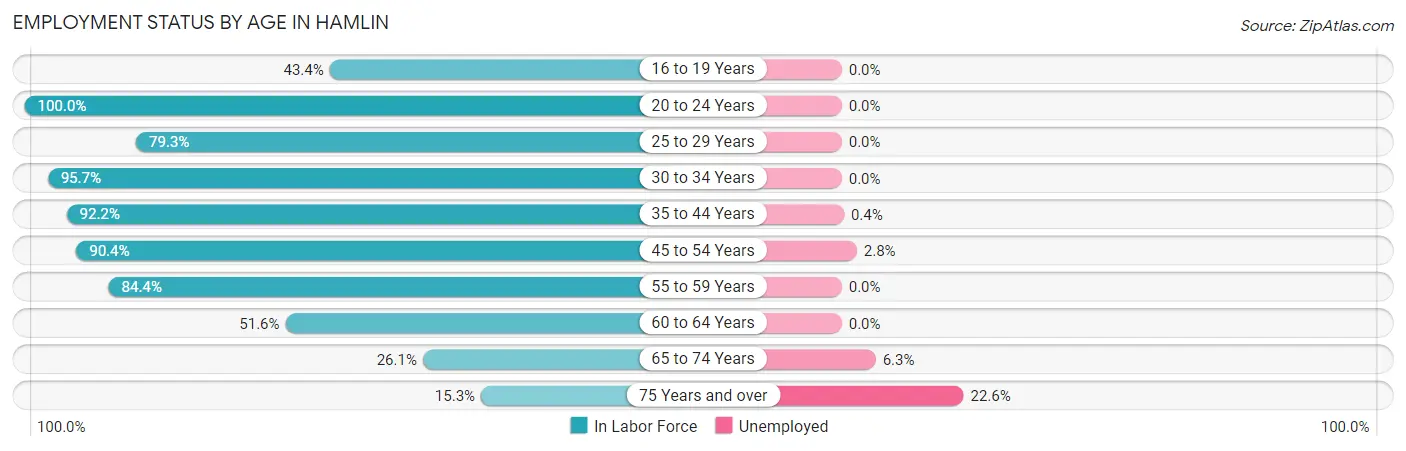
| Age Bracket | In Labor Force | Unemployed |
| 16 to 19 Years | 43 (43.4%) | 0 (0.0%) |
| 20 to 24 Years | 273 (100.0%) | 0 (0.0%) |
| 25 to 29 Years | 69 (79.3%) | 0 (0.0%) |
| 30 to 34 Years | 44 (95.7%) | 0 (0.0%) |
| 35 to 44 Years | 284 (92.2%) | 1 (0.4%) |
| 45 to 54 Years | 178 (90.4%) | 5 (2.8%) |
| 55 to 59 Years | 27 (84.4%) | 0 (0.0%) |
| 60 to 64 Years | 32 (51.6%) | 0 (0.0%) |
| 65 to 74 Years | 64 (26.1%) | 4 (6.3%) |
| 75 Years and over | 31 (15.3%) | 7 (22.6%) |
| Total | 1,044 (67.3%) | 17 (1.6%) |
Employment Status by Educational Attainment in Hamlin
According to labor force statistics for Hamlin, 86.6% of individuals (634) out of the total population between 25 and 64 years of age (732) are in the labor force, with 0.9% or 6 of them being unemployed. The group with the highest labor force participation rate are those with the educational attainment of college / associate degree, with 91.9% or 262 individuals in the labor force. Within the labor force, individuals with less than high school education have the highest percentage of unemployment, with 3.7% or 1 of them being unemployed.
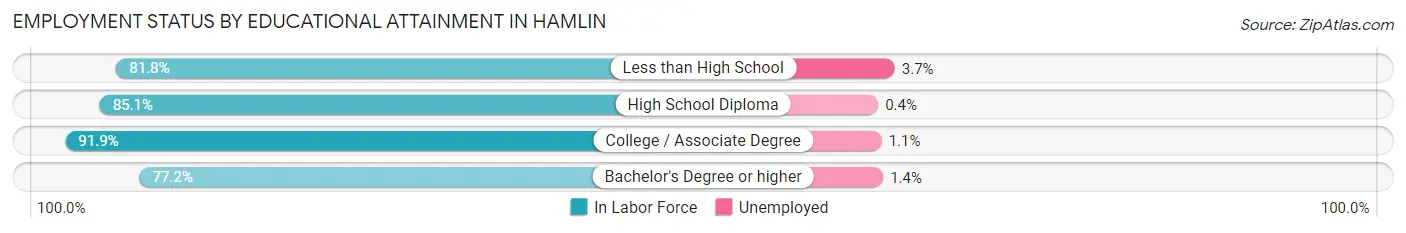
| Educational Attainment | In Labor Force | Unemployed |
| Less than High School | 27 (81.8%) | 1 (3.7%) |
| High School Diploma | 274 (85.1%) | 1 (0.4%) |
| College / Associate Degree | 262 (91.9%) | 3 (1.1%) |
| Bachelor's Degree or higher | 71 (77.2%) | 1 (1.4%) |
| Total | 634 (86.6%) | 7 (0.9%) |
Employment Occupations by Sex in Hamlin
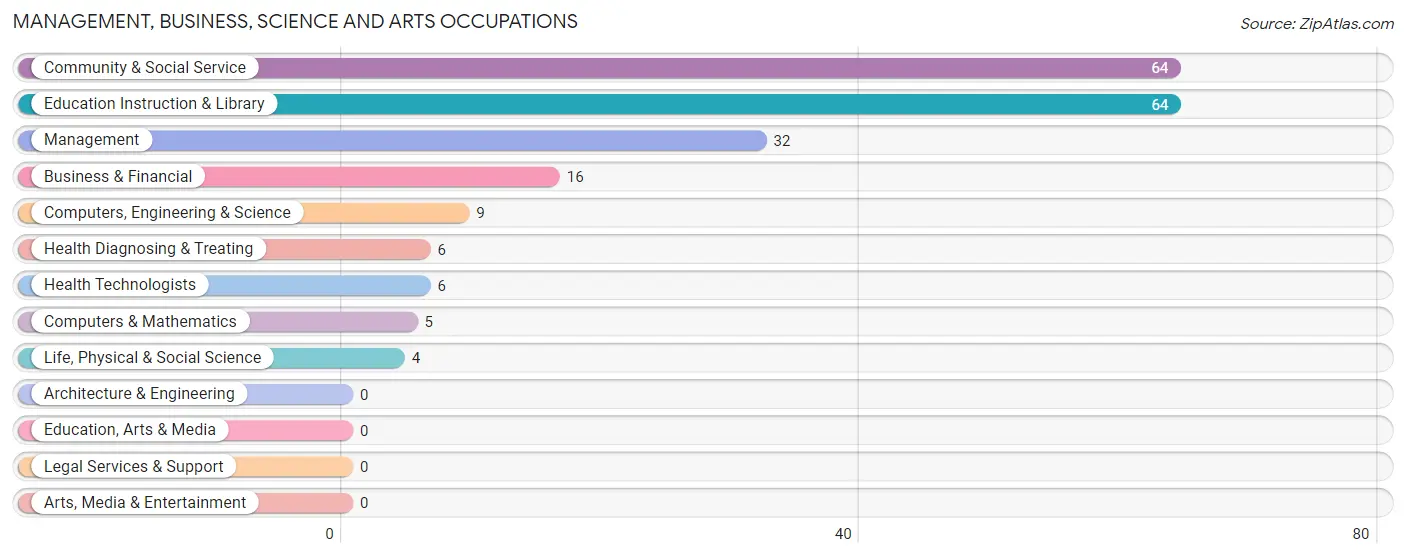
Management, Business, Science and Arts Occupations
The most common Management, Business, Science and Arts occupations in Hamlin are Community & Social Service (64 | 6.2%), Education Instruction & Library (64 | 6.2%), Management (32 | 3.1%), Business & Financial (16 | 1.6%), and Computers, Engineering & Science (9 | 0.9%).
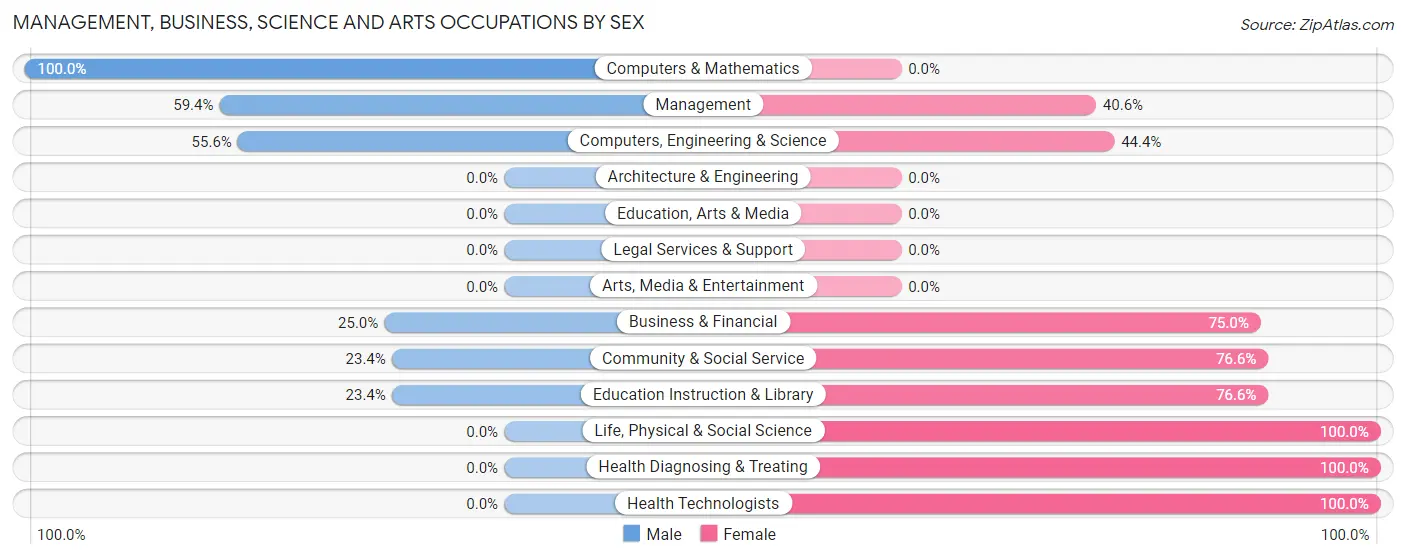
Management, Business, Science and Arts Occupations by Sex
Within the Management, Business, Science and Arts occupations in Hamlin, the most male-oriented occupations are Computers & Mathematics (100.0%), Management (59.4%), and Computers, Engineering & Science (55.6%), while the most female-oriented occupations are Life, Physical & Social Science (100.0%), Health Diagnosing & Treating (100.0%), and Health Technologists (100.0%).
| Occupation | Male | Female |
| Management | 19 (59.4%) | 13 (40.6%) |
| Business & Financial | 4 (25.0%) | 12 (75.0%) |
| Computers, Engineering & Science | 5 (55.6%) | 4 (44.4%) |
| Computers & Mathematics | 5 (100.0%) | 0 (0.0%) |
| Architecture & Engineering | 0 (0.0%) | 0 (0.0%) |
| Life, Physical & Social Science | 0 (0.0%) | 4 (100.0%) |
| Community & Social Service | 15 (23.4%) | 49 (76.6%) |
| Education, Arts & Media | 0 (0.0%) | 0 (0.0%) |
| Legal Services & Support | 0 (0.0%) | 0 (0.0%) |
| Education Instruction & Library | 15 (23.4%) | 49 (76.6%) |
| Arts, Media & Entertainment | 0 (0.0%) | 0 (0.0%) |
| Health Diagnosing & Treating | 0 (0.0%) | 6 (100.0%) |
| Health Technologists | 0 (0.0%) | 6 (100.0%) |
| Total (Category) | 43 (33.9%) | 84 (66.1%) |
| Total (Overall) | 536 (52.1%) | 492 (47.9%) |
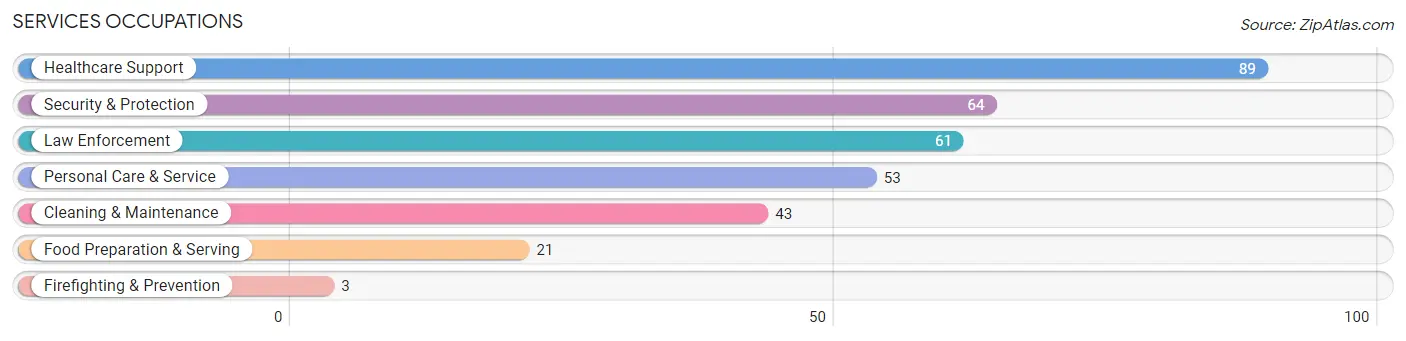
Services Occupations
The most common Services occupations in Hamlin are Healthcare Support (89 | 8.7%), Security & Protection (64 | 6.2%), Law Enforcement (61 | 5.9%), Personal Care & Service (53 | 5.2%), and Cleaning & Maintenance (43 | 4.2%).
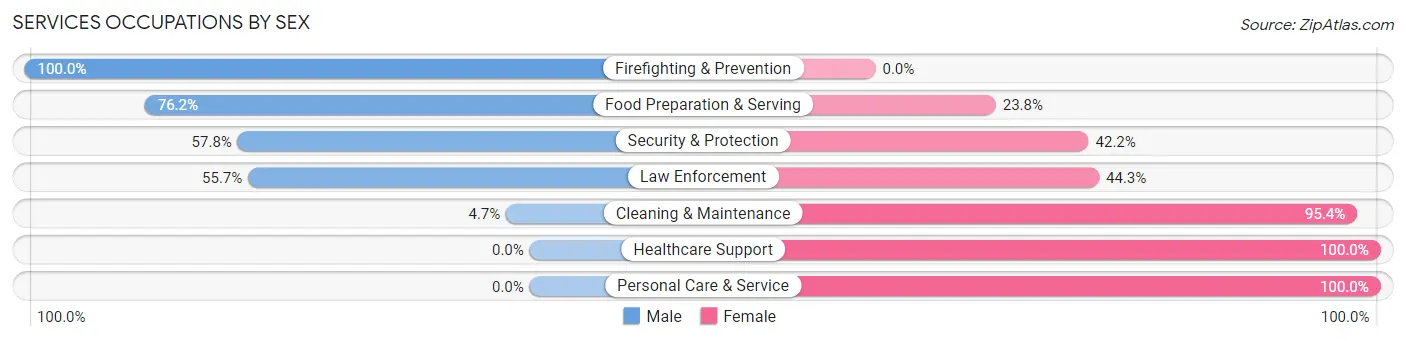
Services Occupations by Sex
Within the Services occupations in Hamlin, the most male-oriented occupations are Firefighting & Prevention (100.0%), Food Preparation & Serving (76.2%), and Security & Protection (57.8%), while the most female-oriented occupations are Healthcare Support (100.0%), Personal Care & Service (100.0%), and Cleaning & Maintenance (95.4%).
| Occupation | Male | Female |
| Healthcare Support | 0 (0.0%) | 89 (100.0%) |
| Security & Protection | 37 (57.8%) | 27 (42.2%) |
| Firefighting & Prevention | 3 (100.0%) | 0 (0.0%) |
| Law Enforcement | 34 (55.7%) | 27 (44.3%) |
| Food Preparation & Serving | 16 (76.2%) | 5 (23.8%) |
| Cleaning & Maintenance | 2 (4.6%) | 41 (95.4%) |
| Personal Care & Service | 0 (0.0%) | 53 (100.0%) |
| Total (Category) | 55 (20.4%) | 215 (79.6%) |
| Total (Overall) | 536 (52.1%) | 492 (47.9%) |
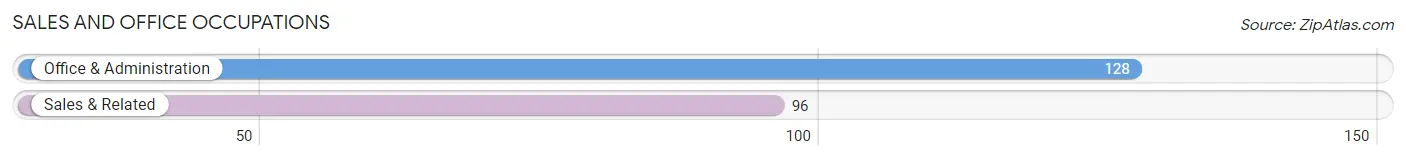
Sales and Office Occupations
The most common Sales and Office occupations in Hamlin are Office & Administration (128 | 12.4%), and Sales & Related (96 | 9.3%).
Sales and Office Occupations by Sex
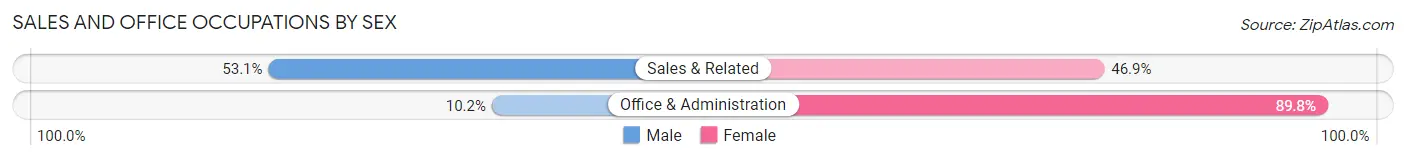
| Occupation | Male | Female |
| Sales & Related | 51 (53.1%) | 45 (46.9%) |
| Office & Administration | 13 (10.2%) | 115 (89.8%) |
| Total (Category) | 64 (28.6%) | 160 (71.4%) |
| Total (Overall) | 536 (52.1%) | 492 (47.9%) |
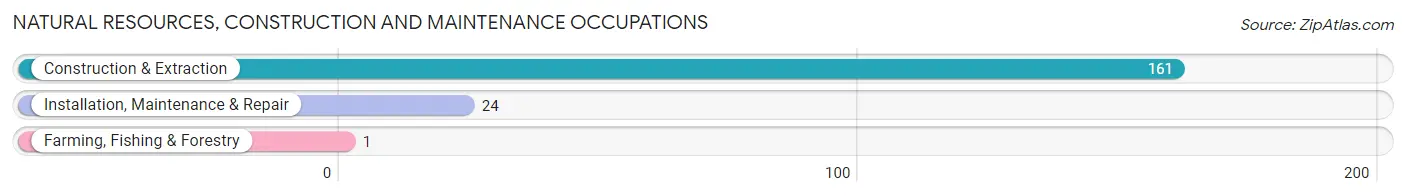
Natural Resources, Construction and Maintenance Occupations
The most common Natural Resources, Construction and Maintenance occupations in Hamlin are Construction & Extraction (161 | 15.7%), Installation, Maintenance & Repair (24 | 2.3%), and Farming, Fishing & Forestry (1 | 0.1%).
Natural Resources, Construction and Maintenance Occupations by Sex
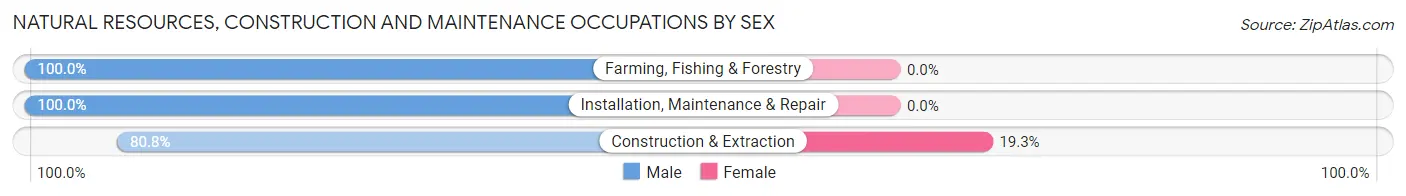
| Occupation | Male | Female |
| Farming, Fishing & Forestry | 1 (100.0%) | 0 (0.0%) |
| Construction & Extraction | 130 (80.7%) | 31 (19.3%) |
| Installation, Maintenance & Repair | 24 (100.0%) | 0 (0.0%) |
| Total (Category) | 155 (83.3%) | 31 (16.7%) |
| Total (Overall) | 536 (52.1%) | 492 (47.9%) |
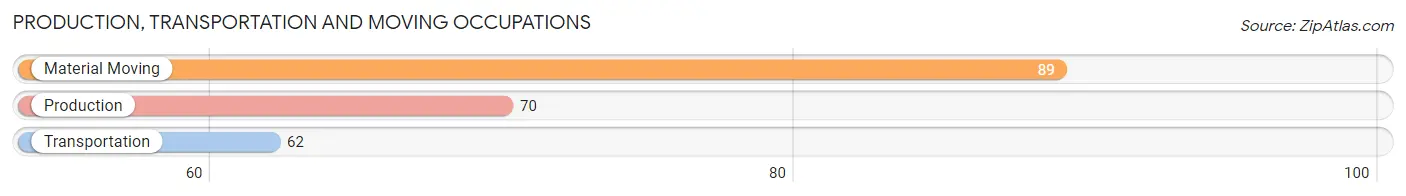
Production, Transportation and Moving Occupations
The most common Production, Transportation and Moving occupations in Hamlin are Material Moving (89 | 8.7%), Production (70 | 6.8%), and Transportation (62 | 6.0%).
Production, Transportation and Moving Occupations by Sex
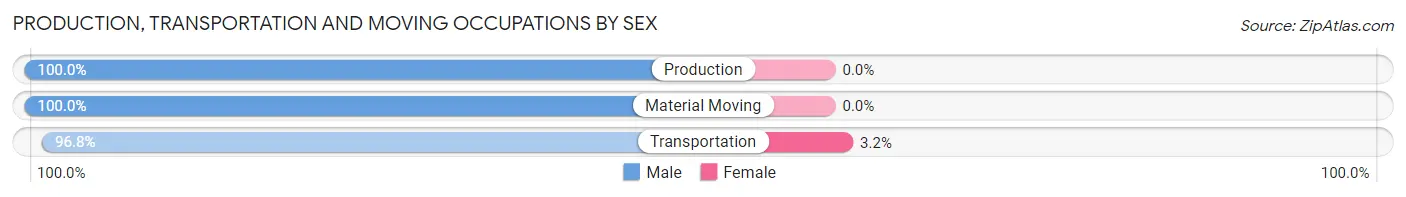
| Occupation | Male | Female |
| Production | 70 (100.0%) | 0 (0.0%) |
| Transportation | 60 (96.8%) | 2 (3.2%) |
| Material Moving | 89 (100.0%) | 0 (0.0%) |
| Total (Category) | 219 (99.1%) | 2 (0.9%) |
| Total (Overall) | 536 (52.1%) | 492 (47.9%) |
Employment Industries by Sex in Hamlin
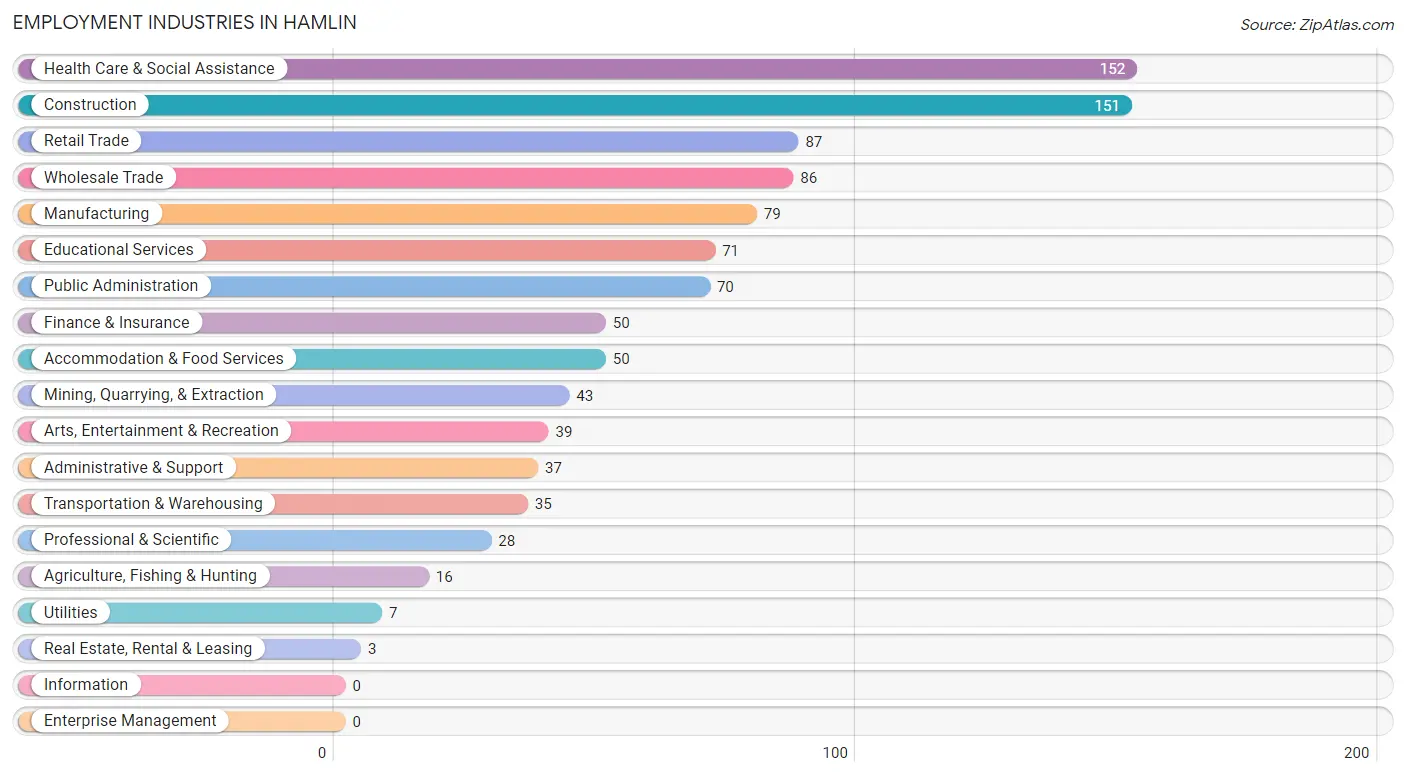
Employment Industries in Hamlin
The major employment industries in Hamlin include Health Care & Social Assistance (152 | 14.8%), Construction (151 | 14.7%), Retail Trade (87 | 8.5%), Wholesale Trade (86 | 8.4%), and Manufacturing (79 | 7.7%).
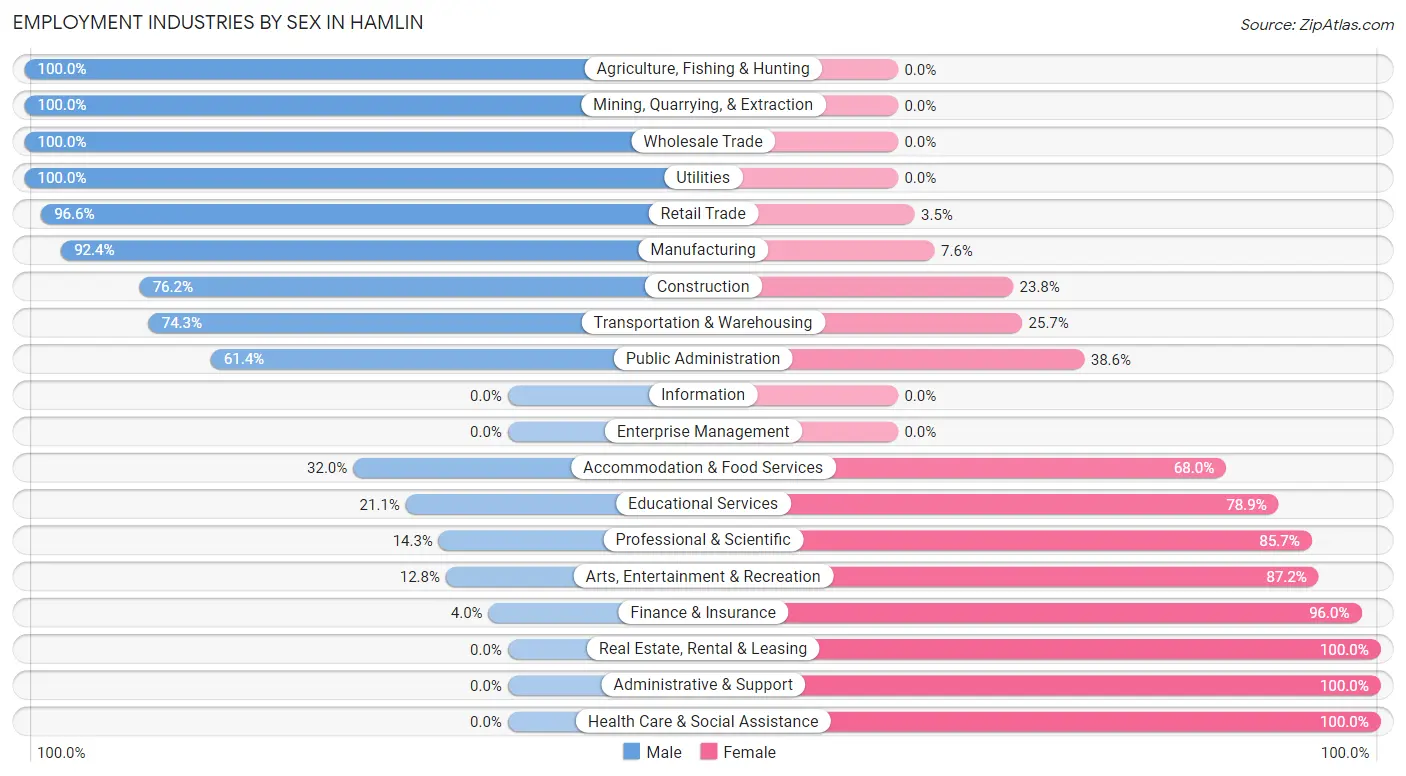
Employment Industries by Sex in Hamlin
The Hamlin industries that see more men than women are Agriculture, Fishing & Hunting (100.0%), Mining, Quarrying, & Extraction (100.0%), and Wholesale Trade (100.0%), whereas the industries that tend to have a higher number of women are Real Estate, Rental & Leasing (100.0%), Administrative & Support (100.0%), and Health Care & Social Assistance (100.0%).
| Industry | Male | Female |
| Agriculture, Fishing & Hunting | 16 (100.0%) | 0 (0.0%) |
| Mining, Quarrying, & Extraction | 43 (100.0%) | 0 (0.0%) |
| Construction | 115 (76.2%) | 36 (23.8%) |
| Manufacturing | 73 (92.4%) | 6 (7.6%) |
| Wholesale Trade | 86 (100.0%) | 0 (0.0%) |
| Retail Trade | 84 (96.6%) | 3 (3.5%) |
| Transportation & Warehousing | 26 (74.3%) | 9 (25.7%) |
| Utilities | 7 (100.0%) | 0 (0.0%) |
| Information | 0 (0.0%) | 0 (0.0%) |
| Finance & Insurance | 2 (4.0%) | 48 (96.0%) |
| Real Estate, Rental & Leasing | 0 (0.0%) | 3 (100.0%) |
| Professional & Scientific | 4 (14.3%) | 24 (85.7%) |
| Enterprise Management | 0 (0.0%) | 0 (0.0%) |
| Administrative & Support | 0 (0.0%) | 37 (100.0%) |
| Educational Services | 15 (21.1%) | 56 (78.9%) |
| Health Care & Social Assistance | 0 (0.0%) | 152 (100.0%) |
| Arts, Entertainment & Recreation | 5 (12.8%) | 34 (87.2%) |
| Accommodation & Food Services | 16 (32.0%) | 34 (68.0%) |
| Public Administration | 43 (61.4%) | 27 (38.6%) |
| Total | 536 (52.1%) | 492 (47.9%) |
Education in Hamlin
School Enrollment in Hamlin
The most common levels of schooling among the 464 students in Hamlin are middle school (207 | 44.6%), elementary school (103 | 22.2%), and high school (88 | 19.0%).
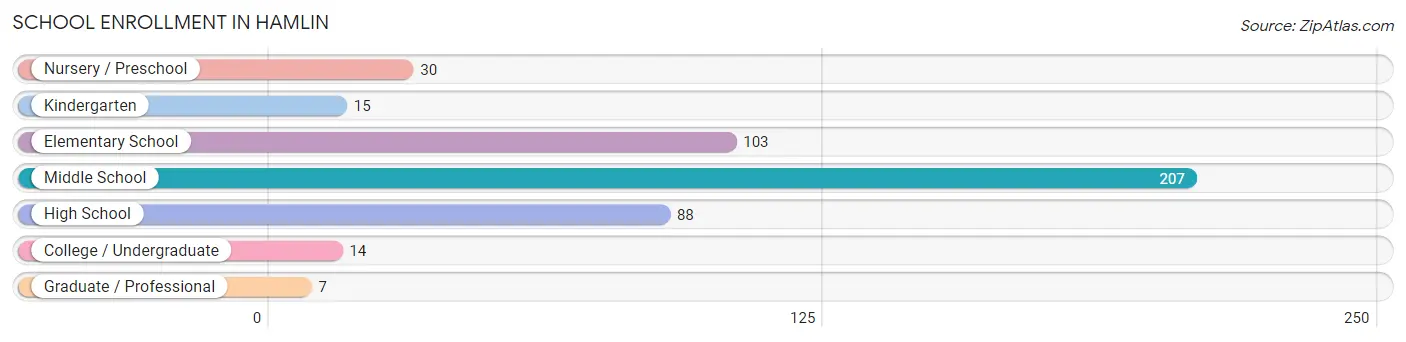
| School Level | # Students | % Students |
| Nursery / Preschool | 30 | 6.5% |
| Kindergarten | 15 | 3.2% |
| Elementary School | 103 | 22.2% |
| Middle School | 207 | 44.6% |
| High School | 88 | 19.0% |
| College / Undergraduate | 14 | 3.0% |
| Graduate / Professional | 7 | 1.5% |
| Total | 464 | 100.0% |
School Enrollment by Age by Funding Source in Hamlin
Out of a total of 464 students who are enrolled in schools in Hamlin, 7 (1.5%) attend a private institution, while the remaining 457 (98.5%) are enrolled in public schools. The age group of 35 years and over has the highest likelihood of being enrolled in private schools, with 7 (43.8% in the age bracket) enrolled. Conversely, the age group of 3 to 4 year olds has the lowest likelihood of being enrolled in a private school, with 30 (100.0% in the age bracket) attending a public institution.
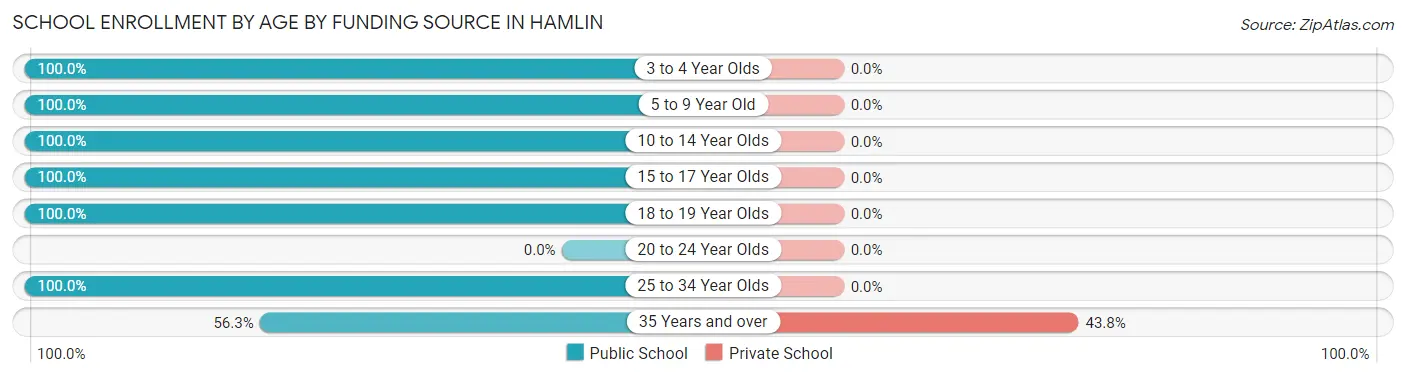
| Age Bracket | Public School | Private School |
| 3 to 4 Year Olds | 30 (100.0%) | 0 (0.0%) |
| 5 to 9 Year Old | 112 (100.0%) | 0 (0.0%) |
| 10 to 14 Year Olds | 213 (100.0%) | 0 (0.0%) |
| 15 to 17 Year Olds | 86 (100.0%) | 0 (0.0%) |
| 18 to 19 Year Olds | 2 (100.0%) | 0 (0.0%) |
| 20 to 24 Year Olds | 0 (0.0%) | 0 (0.0%) |
| 25 to 34 Year Olds | 5 (100.0%) | 0 (0.0%) |
| 35 Years and over | 9 (56.2%) | 7 (43.8%) |
| Total | 457 (98.5%) | 7 (1.5%) |
Educational Attainment by Field of Study in Hamlin
Education (76 | 47.2%), physical & health sciences (27 | 16.8%), business (16 | 9.9%), arts & humanities (11 | 6.8%), and communications (9 | 5.6%) are the most common fields of study among 161 individuals in Hamlin who have obtained a bachelor's degree or higher.
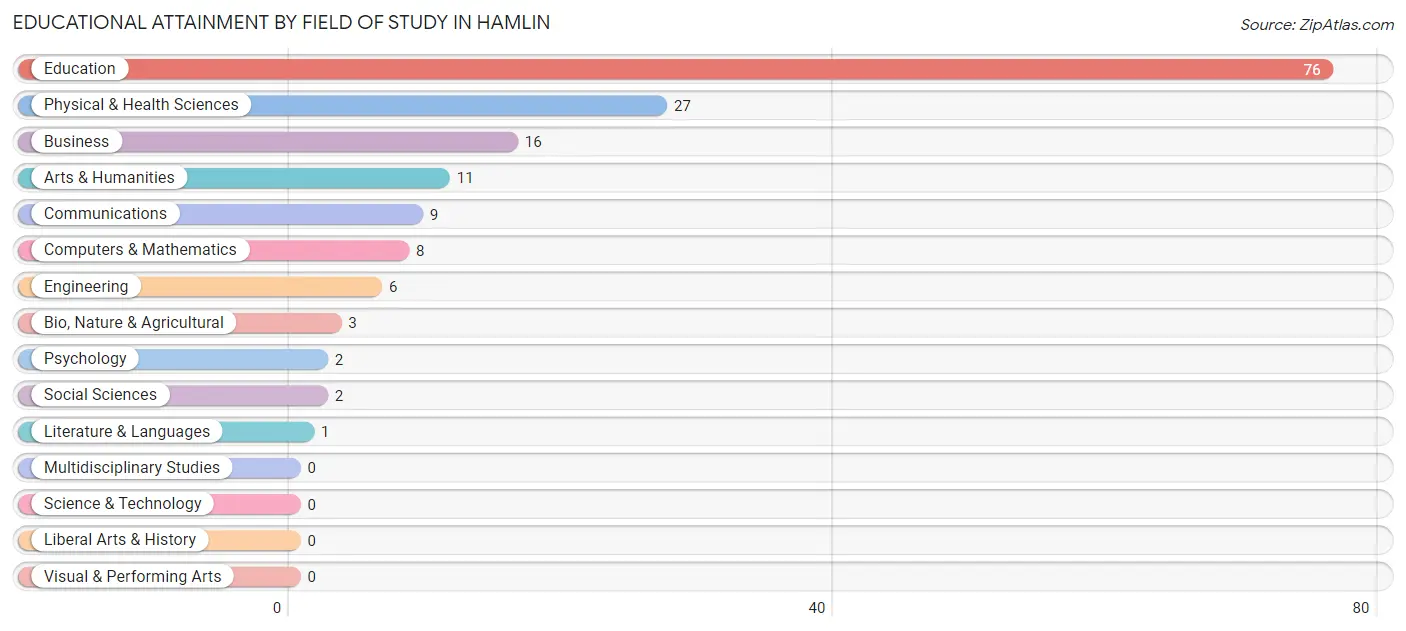
| Field of Study | # Graduates | % Graduates |
| Computers & Mathematics | 8 | 5.0% |
| Bio, Nature & Agricultural | 3 | 1.9% |
| Physical & Health Sciences | 27 | 16.8% |
| Psychology | 2 | 1.2% |
| Social Sciences | 2 | 1.2% |
| Engineering | 6 | 3.7% |
| Multidisciplinary Studies | 0 | 0.0% |
| Science & Technology | 0 | 0.0% |
| Business | 16 | 9.9% |
| Education | 76 | 47.2% |
| Literature & Languages | 1 | 0.6% |
| Liberal Arts & History | 0 | 0.0% |
| Visual & Performing Arts | 0 | 0.0% |
| Communications | 9 | 5.6% |
| Arts & Humanities | 11 | 6.8% |
| Total | 161 | 100.0% |
Transportation & Commute in Hamlin
Vehicle Availability by Sex in Hamlin
The most prevalent vehicle ownership categories in Hamlin are males with 2 vehicles (266, accounting for 49.7%) and females with 2 vehicles (226, making up 54.8%).
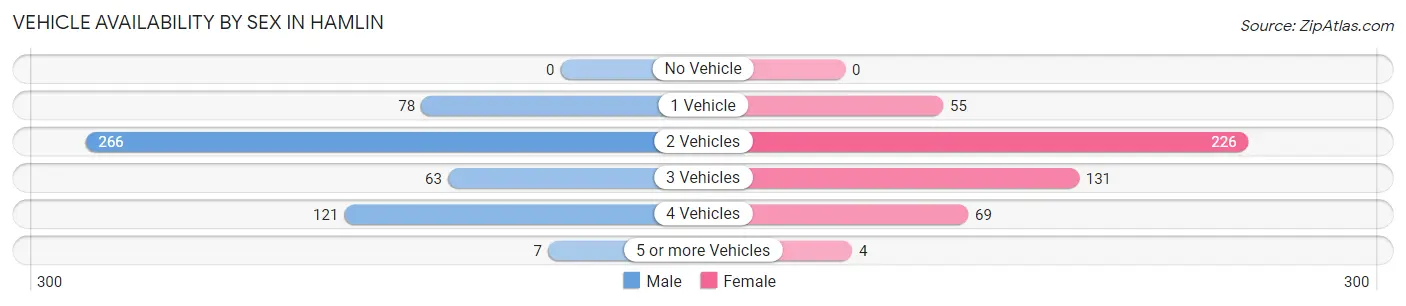
| Vehicles Available | Male | Female |
| No Vehicle | 0 (0.0%) | 0 (0.0%) |
| 1 Vehicle | 78 (14.6%) | 55 (11.3%) |
| 2 Vehicles | 266 (49.7%) | 226 (46.6%) |
| 3 Vehicles | 63 (11.8%) | 131 (27.0%) |
| 4 Vehicles | 121 (22.6%) | 69 (14.2%) |
| 5 or more Vehicles | 7 (1.3%) | 4 (0.8%) |
| Total | 535 (100.0%) | 485 (100.0%) |
Commute Time in Hamlin
The most frequently occuring commute durations in Hamlin are 45 to 59 minutes (202 commuters, 21.8%), less than 5 minutes (170 commuters, 18.4%), and 20 to 24 minutes (159 commuters, 17.2%).
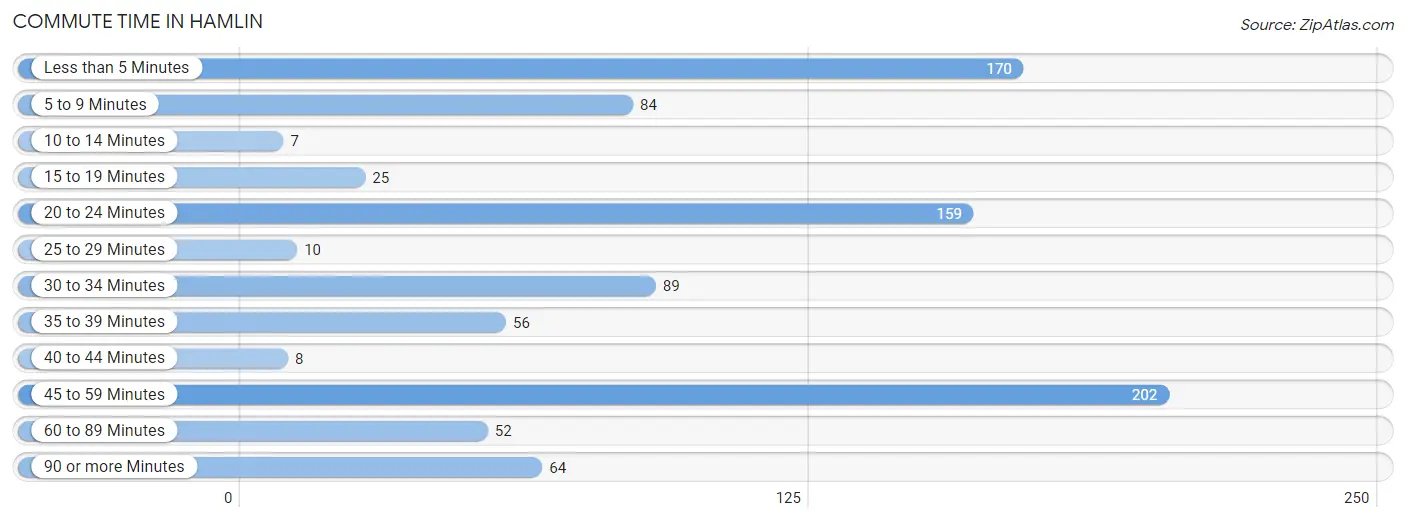
| Commute Time | # Commuters | % Commuters |
| Less than 5 Minutes | 170 | 18.4% |
| 5 to 9 Minutes | 84 | 9.1% |
| 10 to 14 Minutes | 7 | 0.8% |
| 15 to 19 Minutes | 25 | 2.7% |
| 20 to 24 Minutes | 159 | 17.2% |
| 25 to 29 Minutes | 10 | 1.1% |
| 30 to 34 Minutes | 89 | 9.6% |
| 35 to 39 Minutes | 56 | 6.0% |
| 40 to 44 Minutes | 8 | 0.9% |
| 45 to 59 Minutes | 202 | 21.8% |
| 60 to 89 Minutes | 52 | 5.6% |
| 90 or more Minutes | 64 | 6.9% |
Commute Time by Sex in Hamlin
The most common commute times in Hamlin are 45 to 59 minutes (121 commuters, 23.3%) for males and less than 5 minutes (126 commuters, 31.0%) for females.
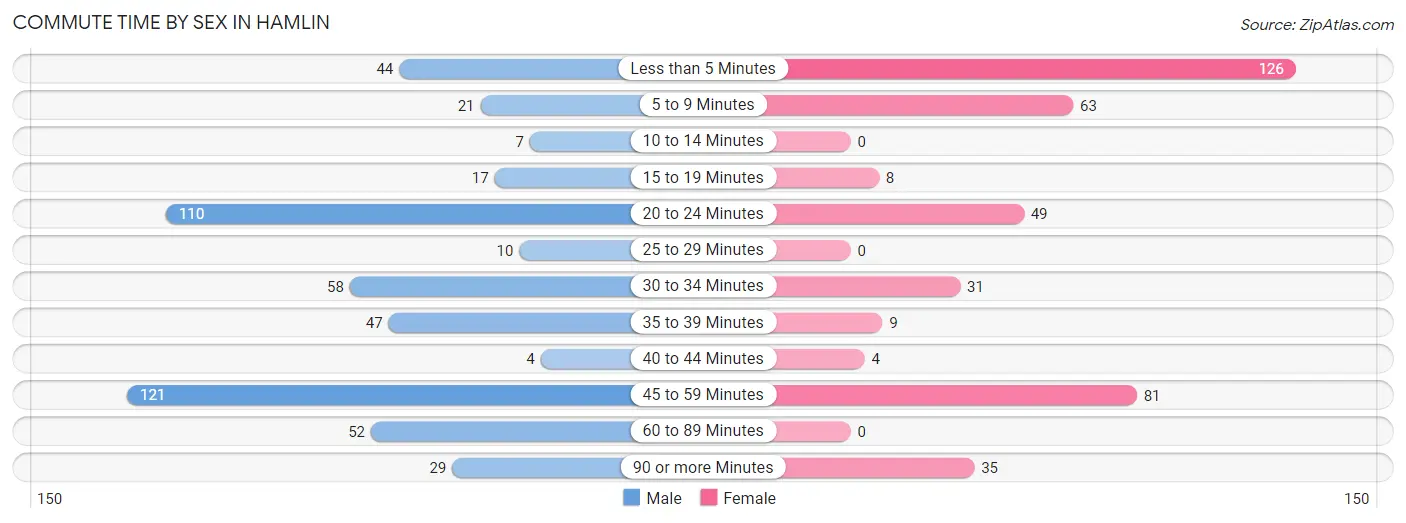
| Commute Time | Male | Female |
| Less than 5 Minutes | 44 (8.5%) | 126 (31.0%) |
| 5 to 9 Minutes | 21 (4.0%) | 63 (15.5%) |
| 10 to 14 Minutes | 7 (1.3%) | 0 (0.0%) |
| 15 to 19 Minutes | 17 (3.3%) | 8 (2.0%) |
| 20 to 24 Minutes | 110 (21.1%) | 49 (12.1%) |
| 25 to 29 Minutes | 10 (1.9%) | 0 (0.0%) |
| 30 to 34 Minutes | 58 (11.2%) | 31 (7.6%) |
| 35 to 39 Minutes | 47 (9.0%) | 9 (2.2%) |
| 40 to 44 Minutes | 4 (0.8%) | 4 (1.0%) |
| 45 to 59 Minutes | 121 (23.3%) | 81 (20.0%) |
| 60 to 89 Minutes | 52 (10.0%) | 0 (0.0%) |
| 90 or more Minutes | 29 (5.6%) | 35 (8.6%) |
Time of Departure to Work by Sex in Hamlin
The most frequent times of departure to work in Hamlin are 7:30 AM to 7:59 AM (180, 34.6%) for males and 5:30 AM to 5:59 AM (80, 19.7%) for females.
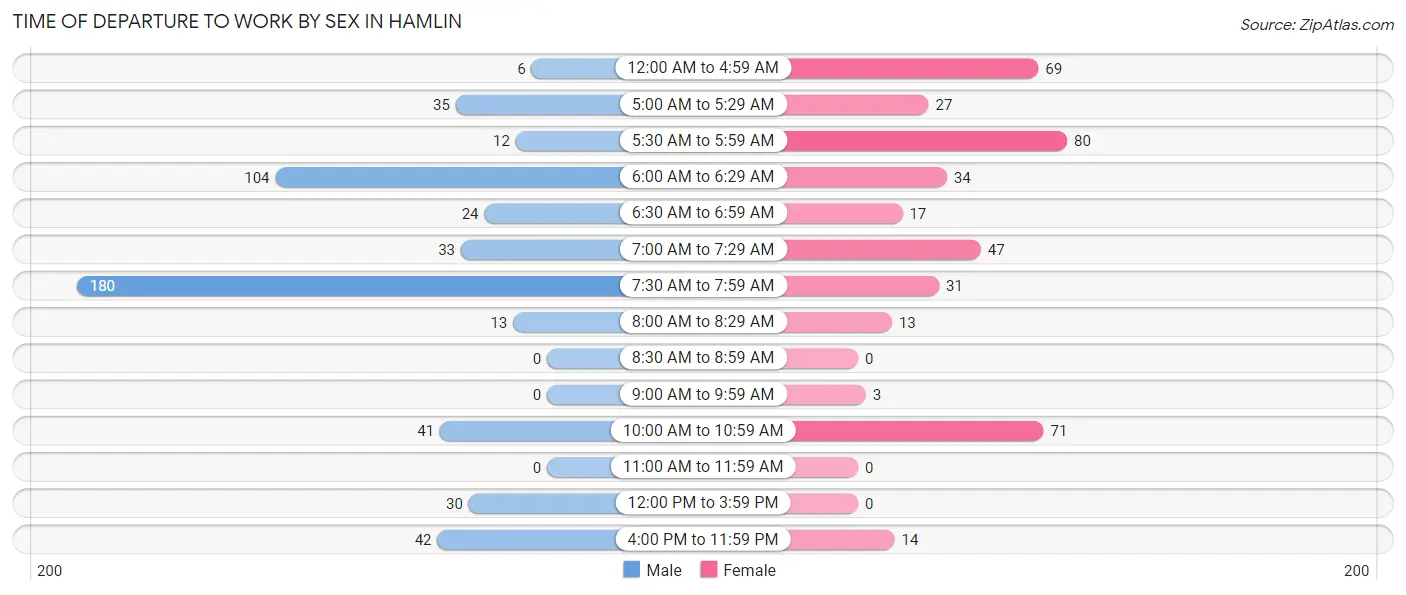
| Time of Departure | Male | Female |
| 12:00 AM to 4:59 AM | 6 (1.1%) | 69 (17.0%) |
| 5:00 AM to 5:29 AM | 35 (6.7%) | 27 (6.7%) |
| 5:30 AM to 5:59 AM | 12 (2.3%) | 80 (19.7%) |
| 6:00 AM to 6:29 AM | 104 (20.0%) | 34 (8.4%) |
| 6:30 AM to 6:59 AM | 24 (4.6%) | 17 (4.2%) |
| 7:00 AM to 7:29 AM | 33 (6.4%) | 47 (11.6%) |
| 7:30 AM to 7:59 AM | 180 (34.6%) | 31 (7.6%) |
| 8:00 AM to 8:29 AM | 13 (2.5%) | 13 (3.2%) |
| 8:30 AM to 8:59 AM | 0 (0.0%) | 0 (0.0%) |
| 9:00 AM to 9:59 AM | 0 (0.0%) | 3 (0.7%) |
| 10:00 AM to 10:59 AM | 41 (7.9%) | 71 (17.5%) |
| 11:00 AM to 11:59 AM | 0 (0.0%) | 0 (0.0%) |
| 12:00 PM to 3:59 PM | 30 (5.8%) | 0 (0.0%) |
| 4:00 PM to 11:59 PM | 42 (8.1%) | 14 (3.5%) |
| Total | 520 (100.0%) | 406 (100.0%) |
Housing Occupancy in Hamlin
Occupancy by Ownership in Hamlin
Of the total 880 dwellings in Hamlin, owner-occupied units account for 589 (66.9%), while renter-occupied units make up 291 (33.1%).
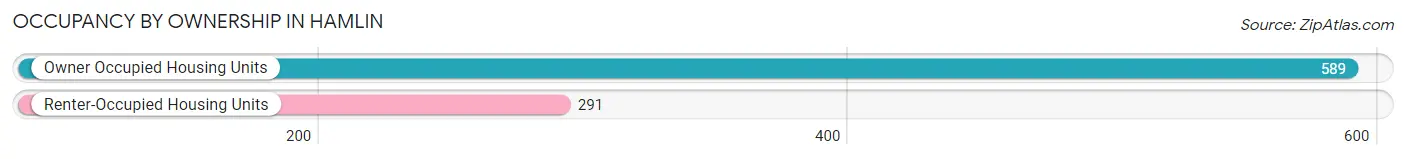
| Occupancy | # Housing Units | % Housing Units |
| Owner Occupied Housing Units | 589 | 66.9% |
| Renter-Occupied Housing Units | 291 | 33.1% |
| Total Occupied Housing Units | 880 | 100.0% |
Occupancy by Household Size in Hamlin
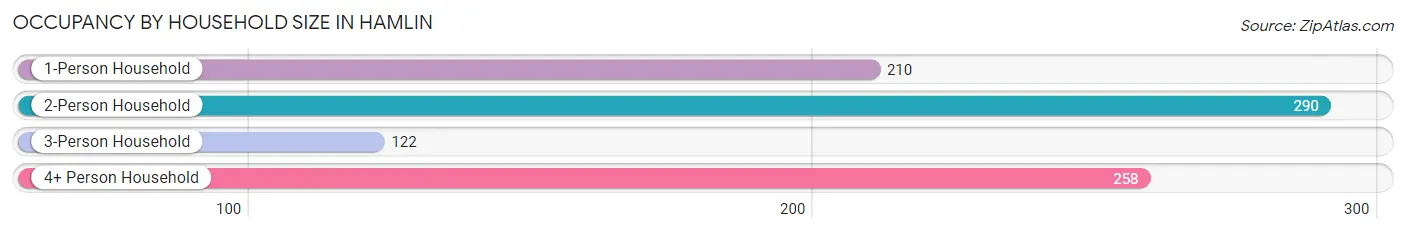
| Household Size | # Housing Units | % Housing Units |
| 1-Person Household | 210 | 23.9% |
| 2-Person Household | 290 | 33.0% |
| 3-Person Household | 122 | 13.9% |
| 4+ Person Household | 258 | 29.3% |
| Total Housing Units | 880 | 100.0% |
Occupancy by Ownership by Household Size in Hamlin
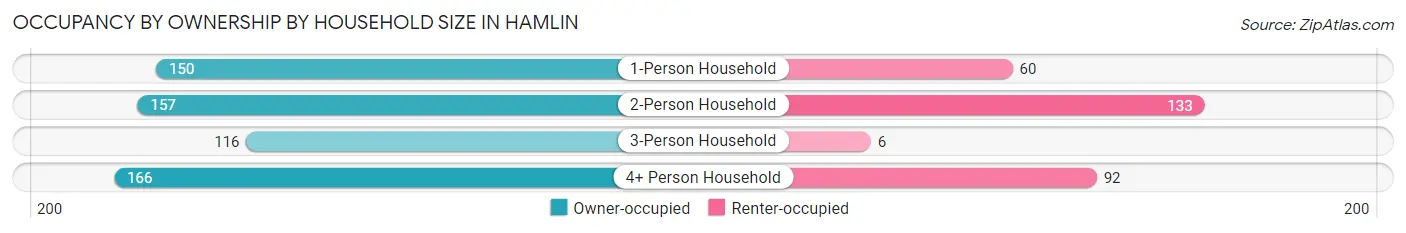
| Household Size | Owner-occupied | Renter-occupied |
| 1-Person Household | 150 (71.4%) | 60 (28.6%) |
| 2-Person Household | 157 (54.1%) | 133 (45.9%) |
| 3-Person Household | 116 (95.1%) | 6 (4.9%) |
| 4+ Person Household | 166 (64.3%) | 92 (35.7%) |
| Total Housing Units | 589 (66.9%) | 291 (33.1%) |
Occupancy by Educational Attainment in Hamlin
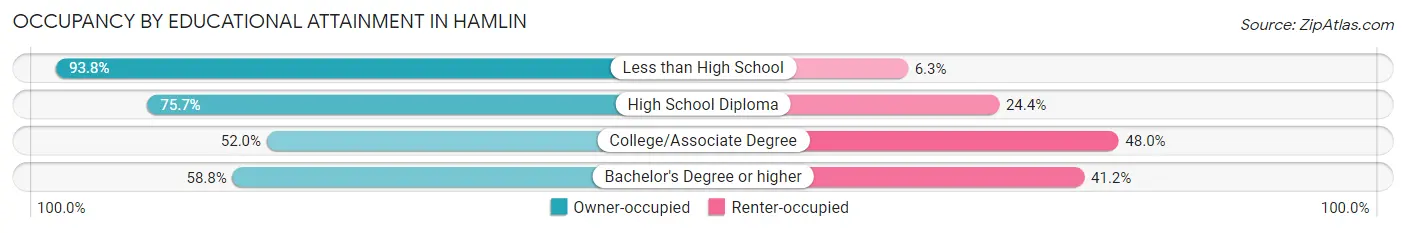
| Household Size | Owner-occupied | Renter-occupied |
| Less than High School | 75 (93.8%) | 5 (6.2%) |
| High School Diploma | 289 (75.6%) | 93 (24.3%) |
| College/Associate Degree | 158 (52.0%) | 146 (48.0%) |
| Bachelor's Degree or higher | 67 (58.8%) | 47 (41.2%) |
Occupancy by Age of Householder in Hamlin
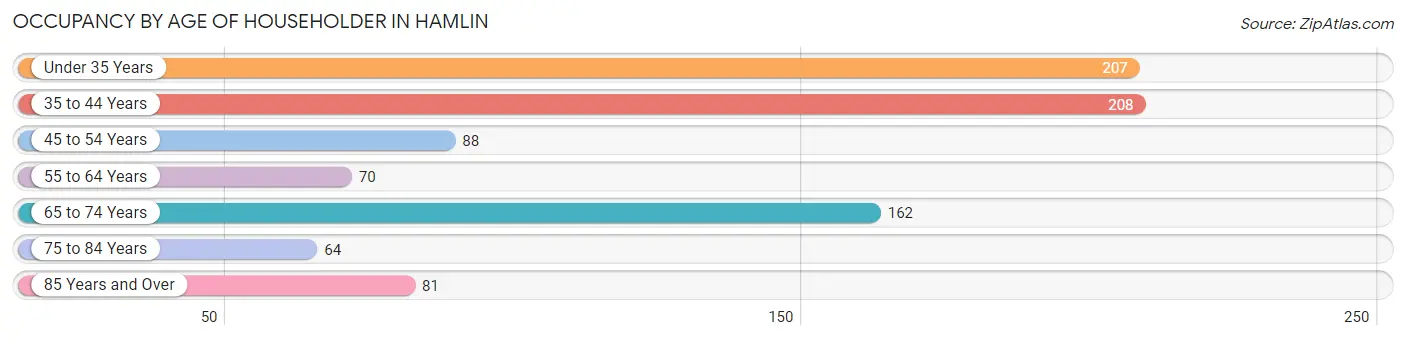
| Age Bracket | # Households | % Households |
| Under 35 Years | 207 | 23.5% |
| 35 to 44 Years | 208 | 23.6% |
| 45 to 54 Years | 88 | 10.0% |
| 55 to 64 Years | 70 | 8.0% |
| 65 to 74 Years | 162 | 18.4% |
| 75 to 84 Years | 64 | 7.3% |
| 85 Years and Over | 81 | 9.2% |
| Total | 880 | 100.0% |
Housing Finances in Hamlin
Median Income by Occupancy in Hamlin
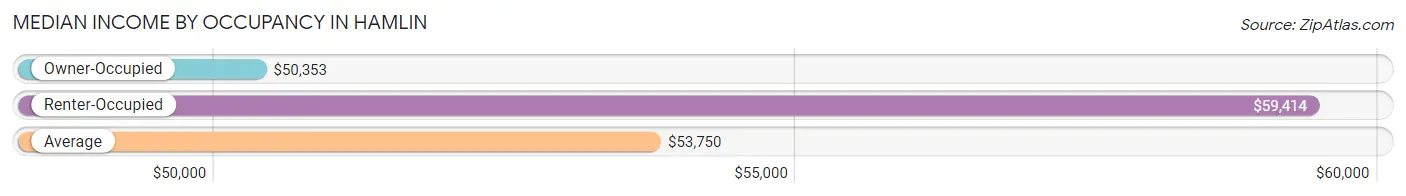
| Occupancy Type | # Households | Median Income |
| Owner-Occupied | 589 (66.9%) | $50,353 |
| Renter-Occupied | 291 (33.1%) | $59,414 |
| Average | 880 (100.0%) | $53,750 |
Occupancy by Householder Income Bracket in Hamlin
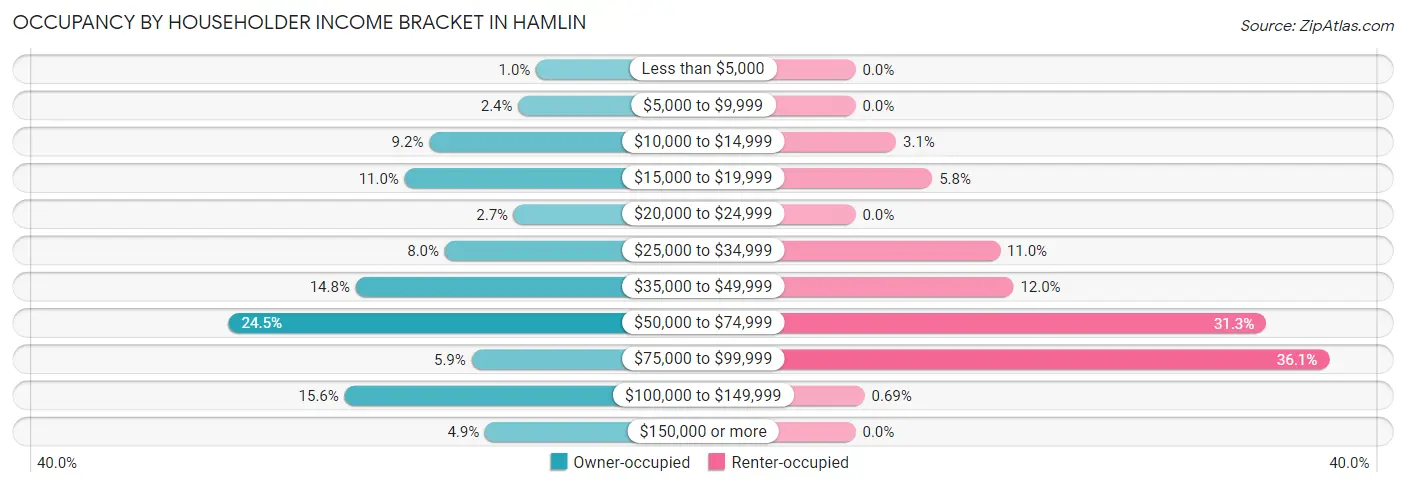
| Income Bracket | Owner-occupied | Renter-occupied |
| Less than $5,000 | 6 (1.0%) | 0 (0.0%) |
| $5,000 to $9,999 | 14 (2.4%) | 0 (0.0%) |
| $10,000 to $14,999 | 54 (9.2%) | 9 (3.1%) |
| $15,000 to $19,999 | 65 (11.0%) | 17 (5.8%) |
| $20,000 to $24,999 | 16 (2.7%) | 0 (0.0%) |
| $25,000 to $34,999 | 47 (8.0%) | 32 (11.0%) |
| $35,000 to $49,999 | 87 (14.8%) | 35 (12.0%) |
| $50,000 to $74,999 | 144 (24.4%) | 91 (31.3%) |
| $75,000 to $99,999 | 35 (5.9%) | 105 (36.1%) |
| $100,000 to $149,999 | 92 (15.6%) | 2 (0.7%) |
| $150,000 or more | 29 (4.9%) | 0 (0.0%) |
| Total | 589 (100.0%) | 291 (100.0%) |
Monthly Housing Cost Tiers in Hamlin
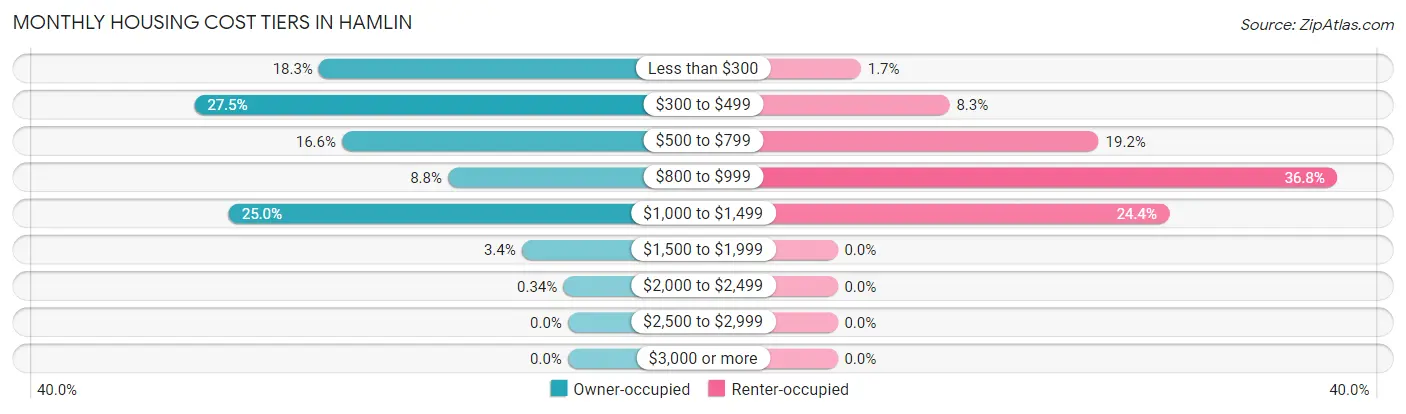
| Monthly Cost | Owner-occupied | Renter-occupied |
| Less than $300 | 108 (18.3%) | 5 (1.7%) |
| $300 to $499 | 162 (27.5%) | 24 (8.3%) |
| $500 to $799 | 98 (16.6%) | 56 (19.2%) |
| $800 to $999 | 52 (8.8%) | 107 (36.8%) |
| $1,000 to $1,499 | 147 (25.0%) | 71 (24.4%) |
| $1,500 to $1,999 | 20 (3.4%) | 0 (0.0%) |
| $2,000 to $2,499 | 2 (0.3%) | 0 (0.0%) |
| $2,500 to $2,999 | 0 (0.0%) | 0 (0.0%) |
| $3,000 or more | 0 (0.0%) | 0 (0.0%) |
| Total | 589 (100.0%) | 291 (100.0%) |
Physical Housing Characteristics in Hamlin
Housing Structures in Hamlin
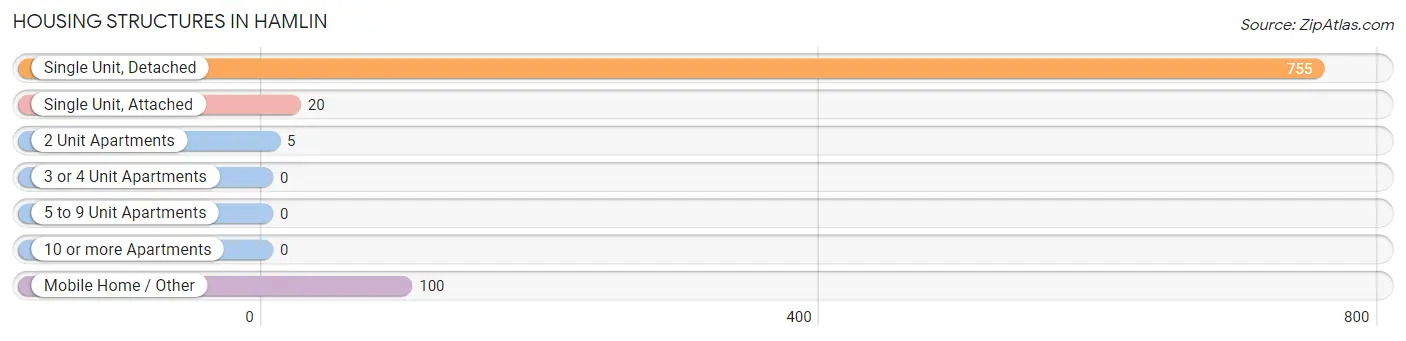
| Structure Type | # Housing Units | % Housing Units |
| Single Unit, Detached | 755 | 85.8% |
| Single Unit, Attached | 20 | 2.3% |
| 2 Unit Apartments | 5 | 0.6% |
| 3 or 4 Unit Apartments | 0 | 0.0% |
| 5 to 9 Unit Apartments | 0 | 0.0% |
| 10 or more Apartments | 0 | 0.0% |
| Mobile Home / Other | 100 | 11.4% |
| Total | 880 | 100.0% |
Housing Structures by Occupancy in Hamlin
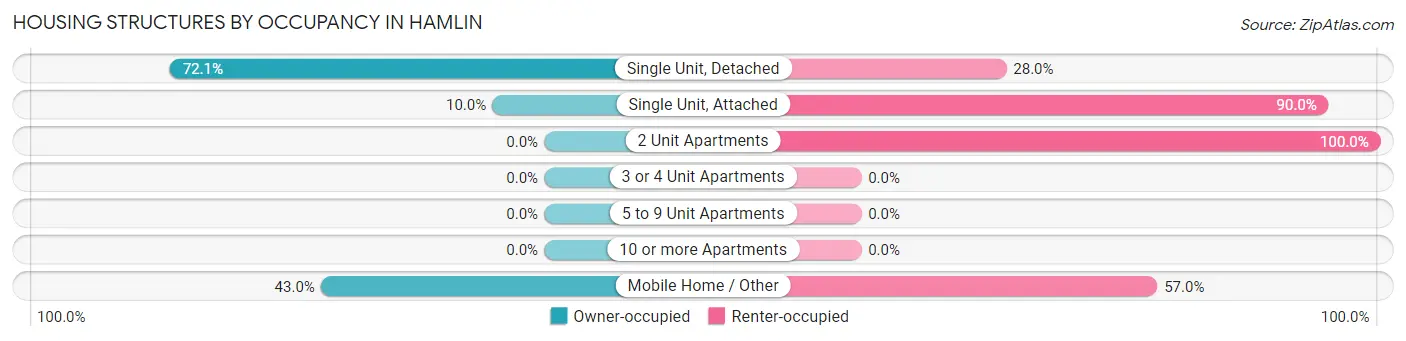
| Structure Type | Owner-occupied | Renter-occupied |
| Single Unit, Detached | 544 (72.1%) | 211 (28.0%) |
| Single Unit, Attached | 2 (10.0%) | 18 (90.0%) |
| 2 Unit Apartments | 0 (0.0%) | 5 (100.0%) |
| 3 or 4 Unit Apartments | 0 (0.0%) | 0 (0.0%) |
| 5 to 9 Unit Apartments | 0 (0.0%) | 0 (0.0%) |
| 10 or more Apartments | 0 (0.0%) | 0 (0.0%) |
| Mobile Home / Other | 43 (43.0%) | 57 (57.0%) |
| Total | 589 (66.9%) | 291 (33.1%) |
Housing Structures by Number of Rooms in Hamlin
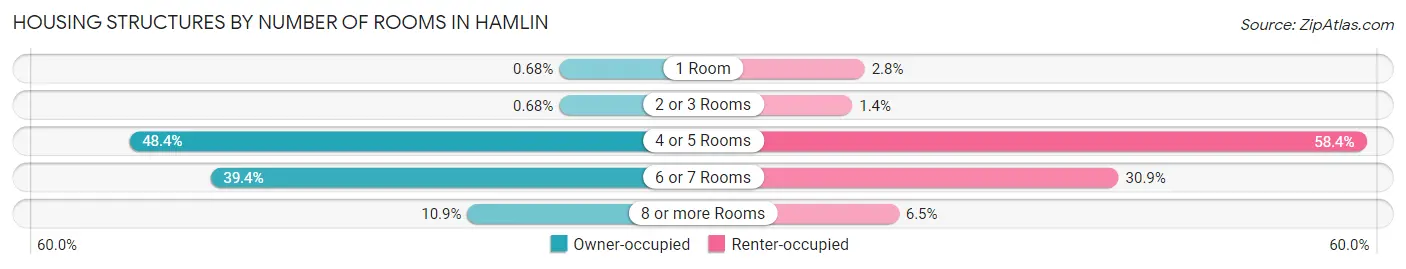
| Number of Rooms | Owner-occupied | Renter-occupied |
| 1 Room | 4 (0.7%) | 8 (2.8%) |
| 2 or 3 Rooms | 4 (0.7%) | 4 (1.4%) |
| 4 or 5 Rooms | 285 (48.4%) | 170 (58.4%) |
| 6 or 7 Rooms | 232 (39.4%) | 90 (30.9%) |
| 8 or more Rooms | 64 (10.9%) | 19 (6.5%) |
| Total | 589 (100.0%) | 291 (100.0%) |
Housing Structure by Heating Type in Hamlin
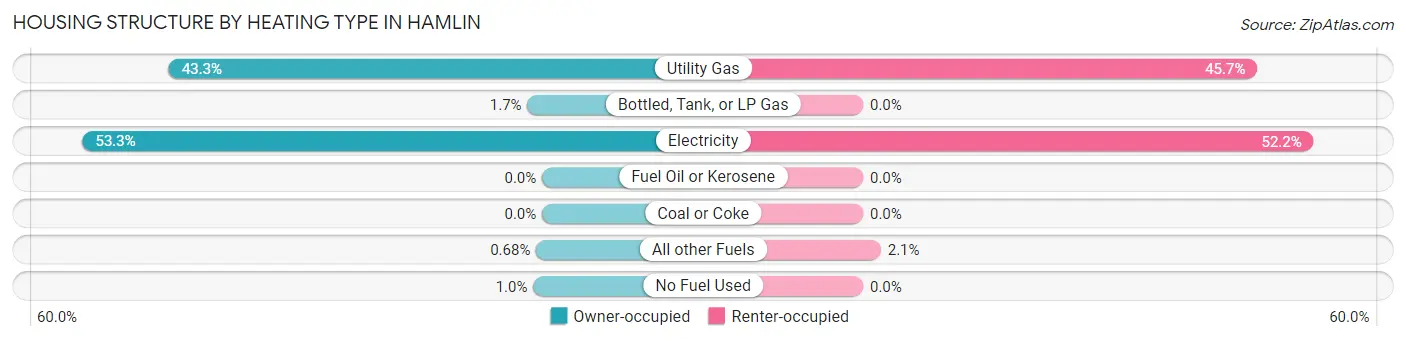
| Heating Type | Owner-occupied | Renter-occupied |
| Utility Gas | 255 (43.3%) | 133 (45.7%) |
| Bottled, Tank, or LP Gas | 10 (1.7%) | 0 (0.0%) |
| Electricity | 314 (53.3%) | 152 (52.2%) |
| Fuel Oil or Kerosene | 0 (0.0%) | 0 (0.0%) |
| Coal or Coke | 0 (0.0%) | 0 (0.0%) |
| All other Fuels | 4 (0.7%) | 6 (2.1%) |
| No Fuel Used | 6 (1.0%) | 0 (0.0%) |
| Total | 589 (100.0%) | 291 (100.0%) |
Household Vehicle Usage in Hamlin
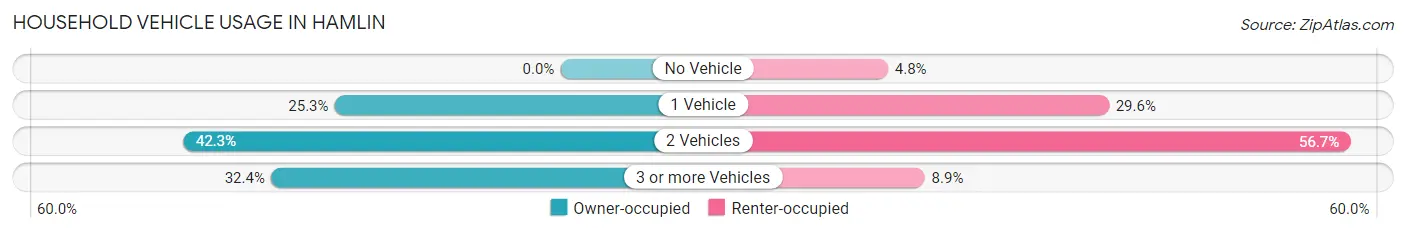
| Vehicles per Household | Owner-occupied | Renter-occupied |
| No Vehicle | 0 (0.0%) | 14 (4.8%) |
| 1 Vehicle | 149 (25.3%) | 86 (29.5%) |
| 2 Vehicles | 249 (42.3%) | 165 (56.7%) |
| 3 or more Vehicles | 191 (32.4%) | 26 (8.9%) |
| Total | 589 (100.0%) | 291 (100.0%) |
Real Estate & Mortgages in Hamlin
Real Estate and Mortgage Overview in Hamlin
| Characteristic | Without Mortgage | With Mortgage |
| Housing Units | 380 | 209 |
| Median Property Value | $38,000 | $80,500 |
| Median Household Income | $37,143 | $0 |
| Monthly Housing Costs | $418 | $0 |
| Real Estate Taxes | $976 | $7 |
Property Value by Mortgage Status in Hamlin
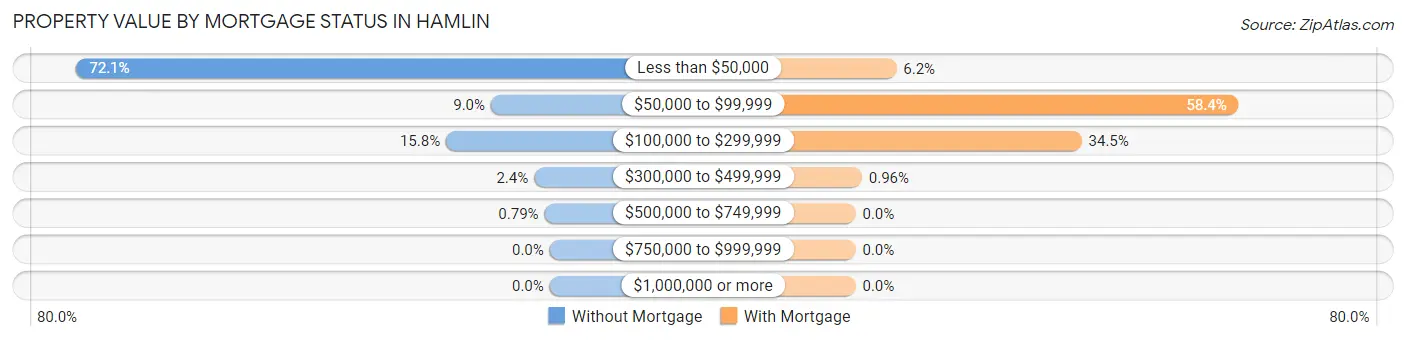
| Property Value | Without Mortgage | With Mortgage |
| Less than $50,000 | 274 (72.1%) | 13 (6.2%) |
| $50,000 to $99,999 | 34 (8.9%) | 122 (58.4%) |
| $100,000 to $299,999 | 60 (15.8%) | 72 (34.4%) |
| $300,000 to $499,999 | 9 (2.4%) | 2 (1.0%) |
| $500,000 to $749,999 | 3 (0.8%) | 0 (0.0%) |
| $750,000 to $999,999 | 0 (0.0%) | 0 (0.0%) |
| $1,000,000 or more | 0 (0.0%) | 0 (0.0%) |
| Total | 380 (100.0%) | 209 (100.0%) |
Household Income by Mortgage Status in Hamlin
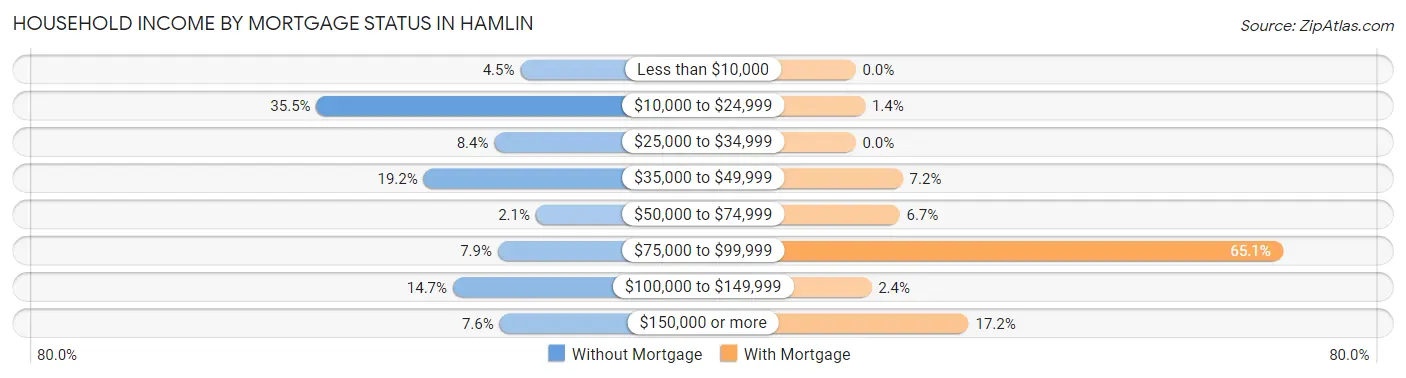
| Household Income | Without Mortgage | With Mortgage |
| Less than $10,000 | 17 (4.5%) | 0 (0.0%) |
| $10,000 to $24,999 | 135 (35.5%) | 3 (1.4%) |
| $25,000 to $34,999 | 32 (8.4%) | 0 (0.0%) |
| $35,000 to $49,999 | 73 (19.2%) | 15 (7.2%) |
| $50,000 to $74,999 | 8 (2.1%) | 14 (6.7%) |
| $75,000 to $99,999 | 30 (7.9%) | 136 (65.1%) |
| $100,000 to $149,999 | 56 (14.7%) | 5 (2.4%) |
| $150,000 or more | 29 (7.6%) | 36 (17.2%) |
| Total | 380 (100.0%) | 209 (100.0%) |
Property Value to Household Income Ratio in Hamlin
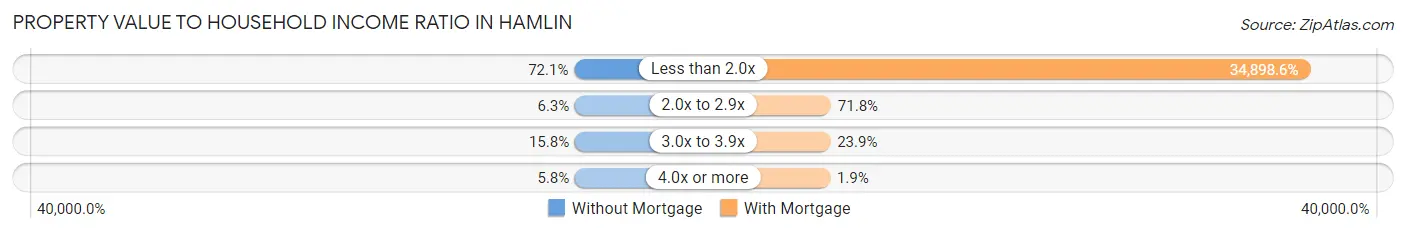
| Value-to-Income Ratio | Without Mortgage | With Mortgage |
| Less than 2.0x | 274 (72.1%) | 72,938 (34,898.6%) |
| 2.0x to 2.9x | 24 (6.3%) | 150 (71.8%) |
| 3.0x to 3.9x | 60 (15.8%) | 50 (23.9%) |
| 4.0x or more | 22 (5.8%) | 4 (1.9%) |
| Total | 380 (100.0%) | 209 (100.0%) |
Real Estate Taxes by Mortgage Status in Hamlin
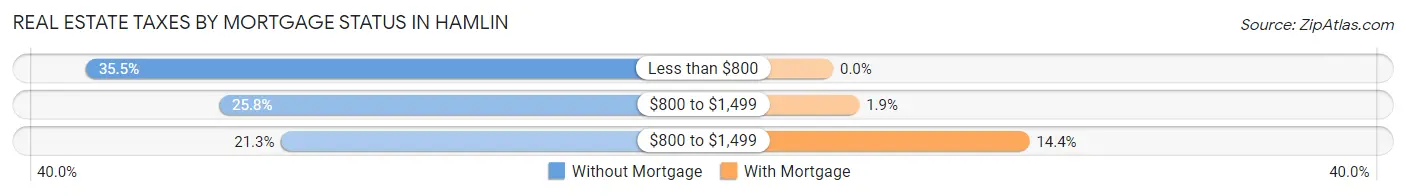
| Property Taxes | Without Mortgage | With Mortgage |
| Less than $800 | 135 (35.5%) | 0 (0.0%) |
| $800 to $1,499 | 98 (25.8%) | 4 (1.9%) |
| $800 to $1,499 | 81 (21.3%) | 30 (14.3%) |
| Total | 380 (100.0%) | 209 (100.0%) |
Health & Disability in Hamlin
Health Insurance Coverage by Age in Hamlin
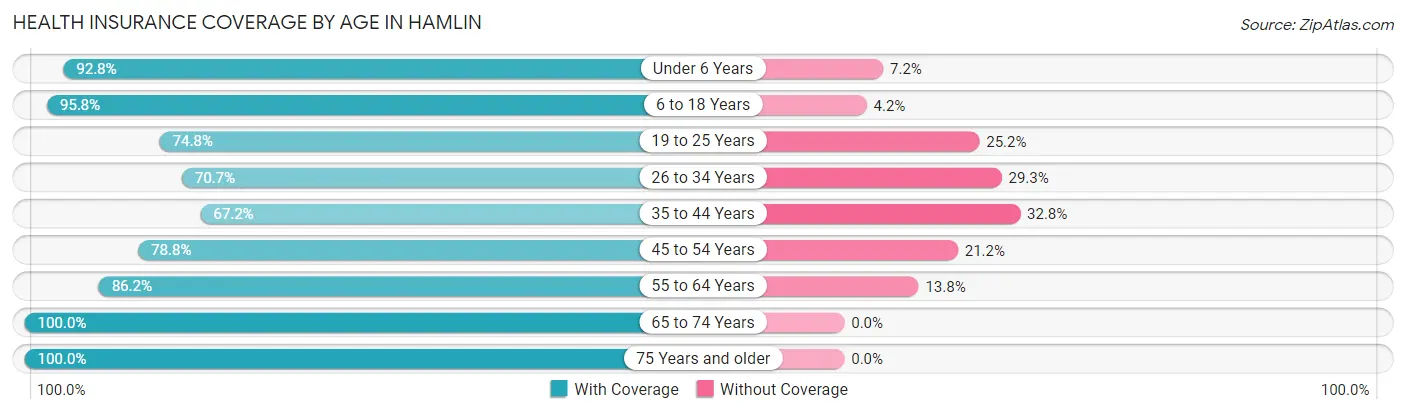
| Age Bracket | With Coverage | Without Coverage |
| Under 6 Years | 77 (92.8%) | 6 (7.2%) |
| 6 to 18 Years | 507 (95.8%) | 22 (4.2%) |
| 19 to 25 Years | 205 (74.8%) | 69 (25.2%) |
| 26 to 34 Years | 94 (70.7%) | 39 (29.3%) |
| 35 to 44 Years | 207 (67.2%) | 101 (32.8%) |
| 45 to 54 Years | 149 (78.8%) | 40 (21.2%) |
| 55 to 64 Years | 81 (86.2%) | 13 (13.8%) |
| 65 to 74 Years | 245 (100.0%) | 0 (0.0%) |
| 75 Years and older | 188 (100.0%) | 0 (0.0%) |
| Total | 1,753 (85.8%) | 290 (14.2%) |
Health Insurance Coverage by Citizenship Status in Hamlin
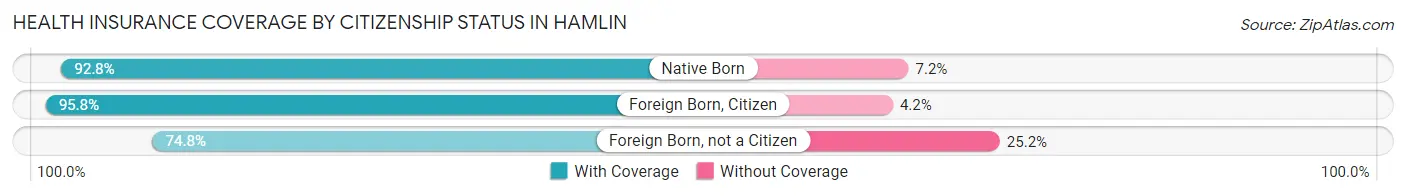
| Citizenship Status | With Coverage | Without Coverage |
| Native Born | 77 (92.8%) | 6 (7.2%) |
| Foreign Born, Citizen | 507 (95.8%) | 22 (4.2%) |
| Foreign Born, not a Citizen | 205 (74.8%) | 69 (25.2%) |
Health Insurance Coverage by Household Income in Hamlin
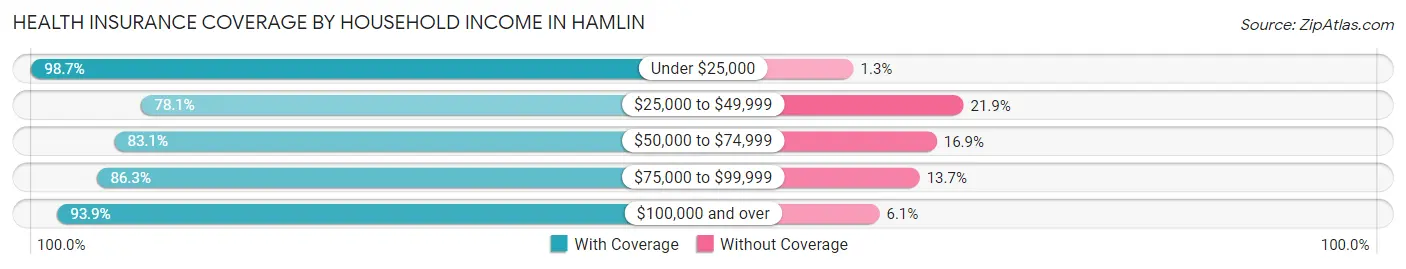
| Household Income | With Coverage | Without Coverage |
| Under $25,000 | 234 (98.7%) | 3 (1.3%) |
| $25,000 to $49,999 | 432 (78.1%) | 121 (21.9%) |
| $50,000 to $74,999 | 503 (83.1%) | 102 (16.9%) |
| $75,000 to $99,999 | 278 (86.3%) | 44 (13.7%) |
| $100,000 and over | 306 (93.9%) | 20 (6.1%) |
Public vs Private Health Insurance Coverage by Age in Hamlin
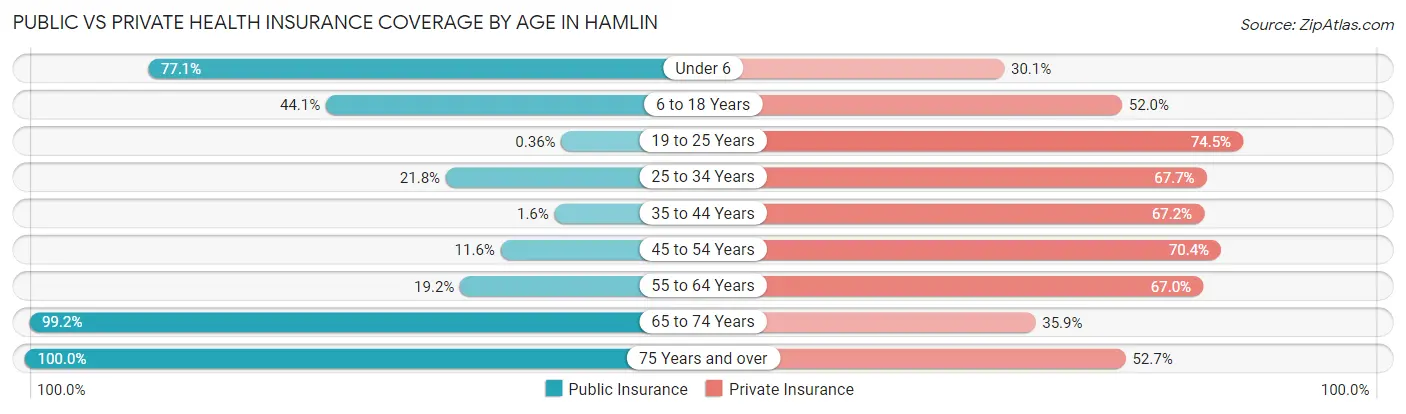
| Age Bracket | Public Insurance | Private Insurance |
| Under 6 | 64 (77.1%) | 25 (30.1%) |
| 6 to 18 Years | 233 (44.1%) | 275 (52.0%) |
| 19 to 25 Years | 1 (0.4%) | 204 (74.5%) |
| 25 to 34 Years | 29 (21.8%) | 90 (67.7%) |
| 35 to 44 Years | 5 (1.6%) | 207 (67.2%) |
| 45 to 54 Years | 22 (11.6%) | 133 (70.4%) |
| 55 to 64 Years | 18 (19.2%) | 63 (67.0%) |
| 65 to 74 Years | 243 (99.2%) | 88 (35.9%) |
| 75 Years and over | 188 (100.0%) | 99 (52.7%) |
| Total | 803 (39.3%) | 1,184 (58.0%) |
Disability Status by Sex by Age in Hamlin
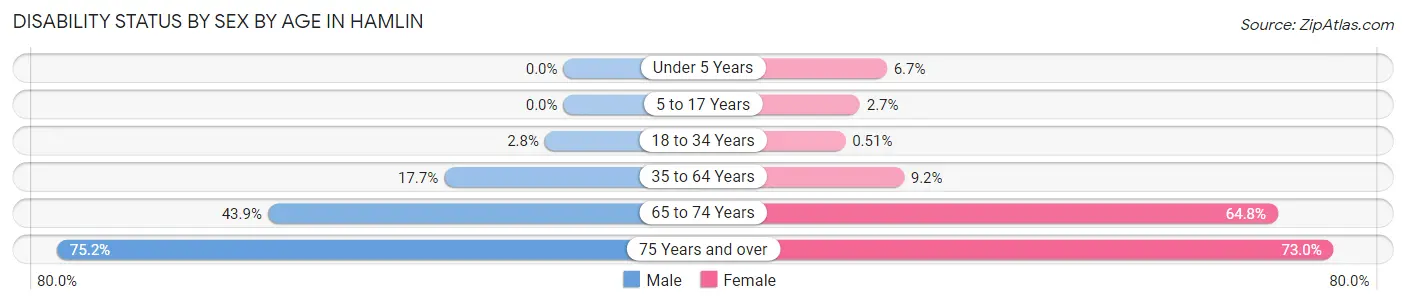
| Age Bracket | Male | Female |
| Under 5 Years | 0 (0.0%) | 1 (6.7%) |
| 5 to 17 Years | 0 (0.0%) | 6 (2.7%) |
| 18 to 34 Years | 7 (2.8%) | 1 (0.5%) |
| 35 to 64 Years | 45 (17.7%) | 31 (9.2%) |
| 65 to 74 Years | 54 (43.9%) | 79 (64.7%) |
| 75 Years and over | 94 (75.2%) | 46 (73.0%) |
Disability Class by Sex by Age in Hamlin
Disability Class: Hearing Difficulty
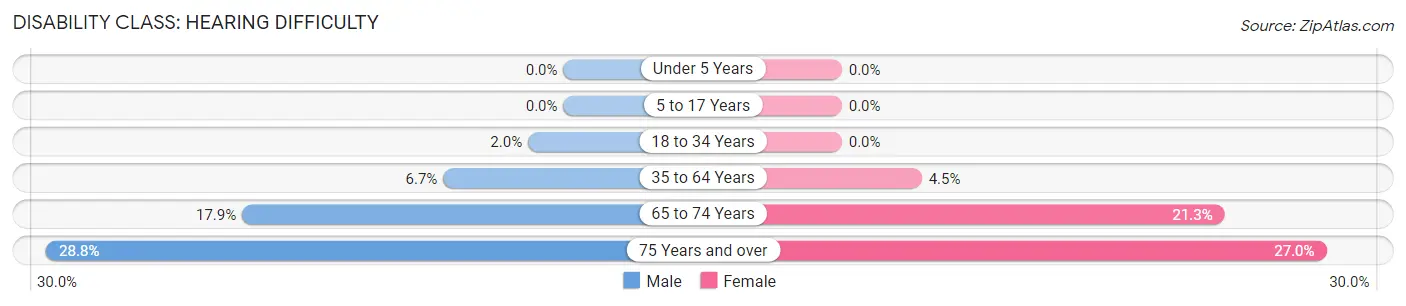
| Age Bracket | Male | Female |
| Under 5 Years | 0 (0.0%) | 0 (0.0%) |
| 5 to 17 Years | 0 (0.0%) | 0 (0.0%) |
| 18 to 34 Years | 5 (2.0%) | 0 (0.0%) |
| 35 to 64 Years | 17 (6.7%) | 15 (4.4%) |
| 65 to 74 Years | 22 (17.9%) | 26 (21.3%) |
| 75 Years and over | 36 (28.8%) | 17 (27.0%) |
Disability Class: Vision Difficulty
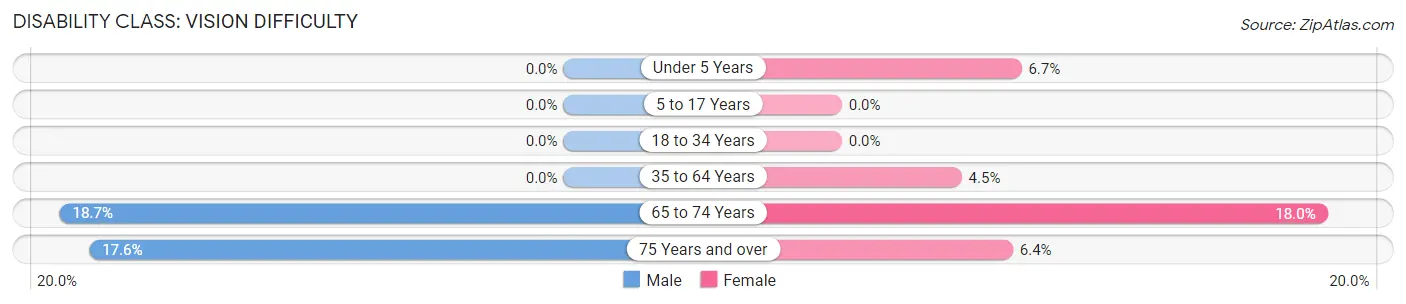
| Age Bracket | Male | Female |
| Under 5 Years | 0 (0.0%) | 1 (6.7%) |
| 5 to 17 Years | 0 (0.0%) | 0 (0.0%) |
| 18 to 34 Years | 0 (0.0%) | 0 (0.0%) |
| 35 to 64 Years | 0 (0.0%) | 15 (4.4%) |
| 65 to 74 Years | 23 (18.7%) | 22 (18.0%) |
| 75 Years and over | 22 (17.6%) | 4 (6.4%) |
Disability Class: Cognitive Difficulty
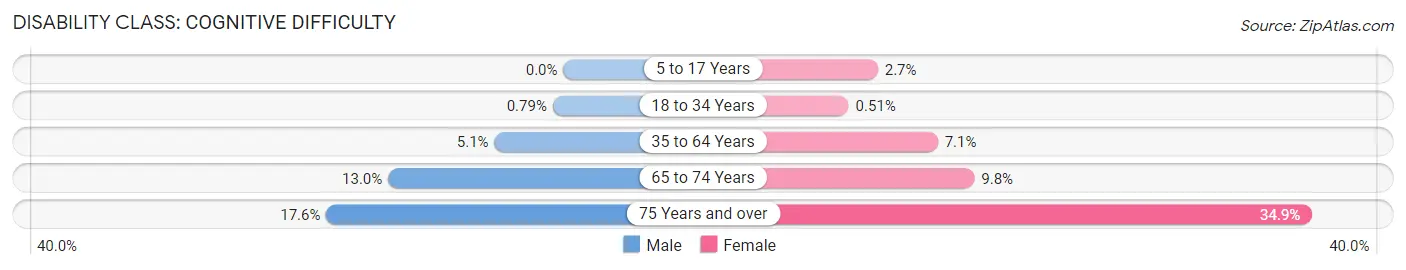
| Age Bracket | Male | Female |
| 5 to 17 Years | 0 (0.0%) | 6 (2.7%) |
| 18 to 34 Years | 2 (0.8%) | 1 (0.5%) |
| 35 to 64 Years | 13 (5.1%) | 24 (7.1%) |
| 65 to 74 Years | 16 (13.0%) | 12 (9.8%) |
| 75 Years and over | 22 (17.6%) | 22 (34.9%) |
Disability Class: Ambulatory Difficulty
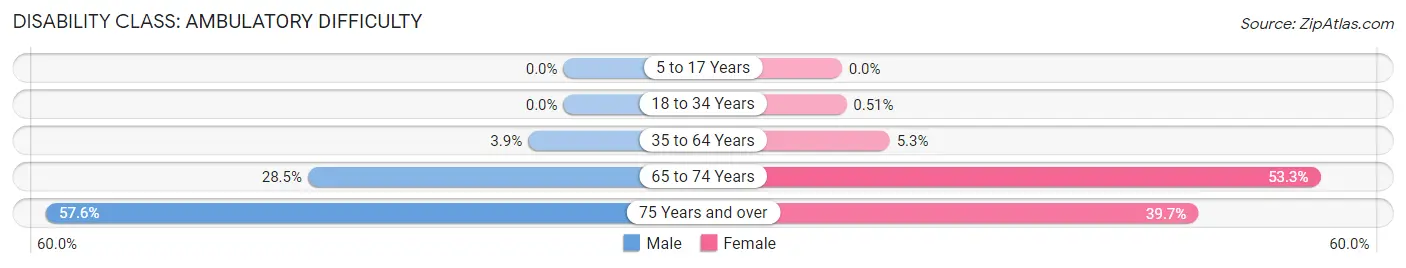
| Age Bracket | Male | Female |
| 5 to 17 Years | 0 (0.0%) | 0 (0.0%) |
| 18 to 34 Years | 0 (0.0%) | 1 (0.5%) |
| 35 to 64 Years | 10 (3.9%) | 18 (5.3%) |
| 65 to 74 Years | 35 (28.5%) | 65 (53.3%) |
| 75 Years and over | 72 (57.6%) | 25 (39.7%) |
Disability Class: Self-Care Difficulty
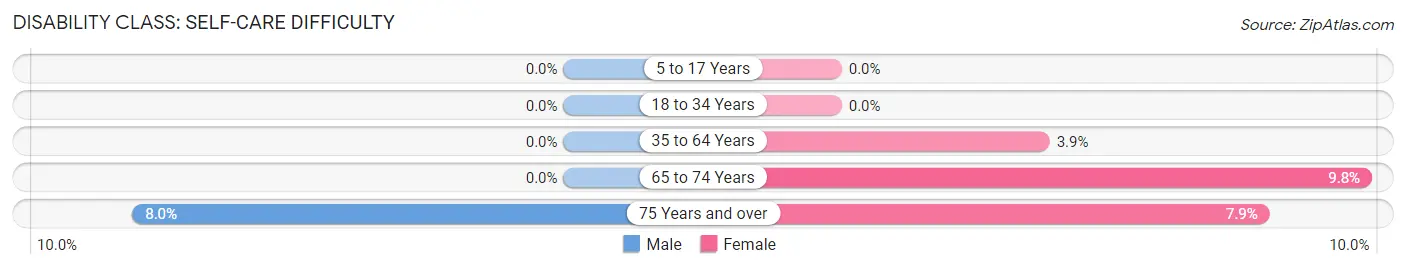
| Age Bracket | Male | Female |
| 5 to 17 Years | 0 (0.0%) | 0 (0.0%) |
| 18 to 34 Years | 0 (0.0%) | 0 (0.0%) |
| 35 to 64 Years | 0 (0.0%) | 13 (3.9%) |
| 65 to 74 Years | 0 (0.0%) | 12 (9.8%) |
| 75 Years and over | 10 (8.0%) | 5 (7.9%) |
Technology Access in Hamlin
Computing Device Access in Hamlin
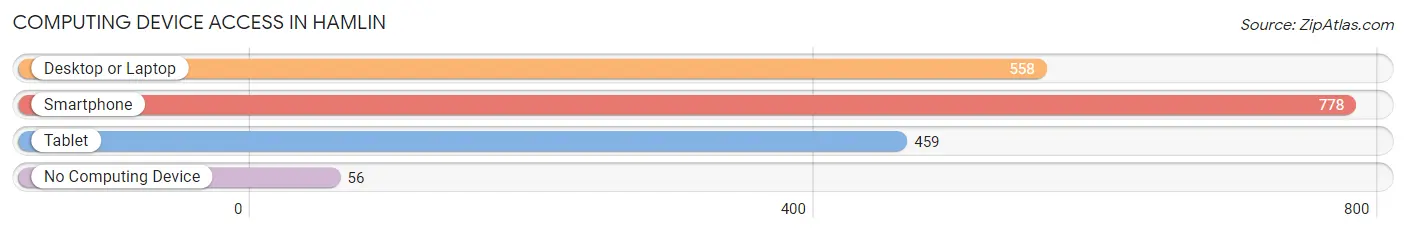
| Device Type | # Households | % Households |
| Desktop or Laptop | 558 | 63.4% |
| Smartphone | 778 | 88.4% |
| Tablet | 459 | 52.2% |
| No Computing Device | 56 | 6.4% |
| Total | 880 | 100.0% |
Internet Access in Hamlin
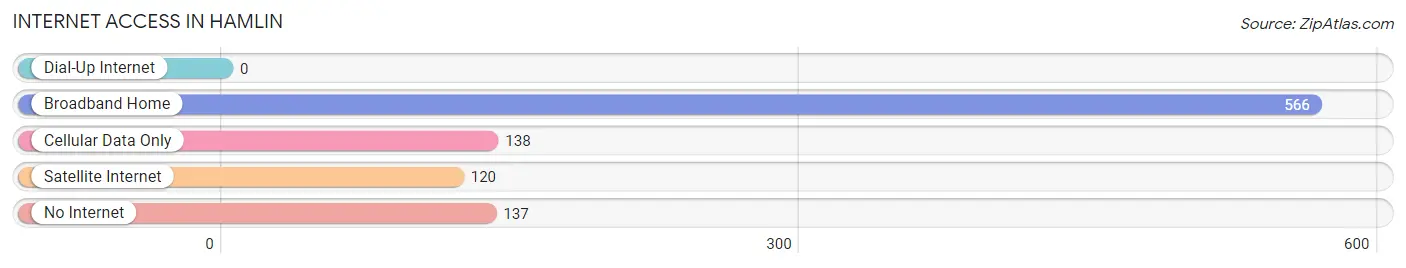
| Internet Type | # Households | % Households |
| Dial-Up Internet | 0 | 0.0% |
| Broadband Home | 566 | 64.3% |
| Cellular Data Only | 138 | 15.7% |
| Satellite Internet | 120 | 13.6% |
| No Internet | 137 | 15.6% |
| Total | 880 | 100.0% |
Hamlin Summary
Hamlin, Texas is a small town located in Jones County, Texas, United States. It is situated on the western edge of the Texas Panhandle, approximately 70 miles east of Lubbock. The population of Hamlin was 1,845 at the 2010 census.
History
Hamlin was founded in 1881 by a group of settlers from Missouri. The town was named after Hannibal Hamlin, the Vice President of the United States under Abraham Lincoln. The town was incorporated in 1884 and the first post office was established in 1885.
In the early 1900s, the town was a major shipping point for cattle and sheep. The town also had a large cotton gin and a number of other businesses.
Geography
Hamlin is located at 33°25'25" North, 100°17'45" West (33.423, -100.296). The town is situated on the western edge of the Texas Panhandle, approximately 70 miles east of Lubbock.
The town is located in the High Plains region of Texas, and is surrounded by rolling hills and flat plains. The climate is semi-arid, with hot summers and mild winters.
Economy
The economy of Hamlin is largely based on agriculture. The town is home to a number of farms and ranches, and the surrounding area is known for its production of cotton, wheat, and other crops.
The town also has a number of small businesses, including a grocery store, a hardware store, and a few restaurants.
Demographics
As of the 2010 census, the population of Hamlin was 1,845. The racial makeup of the town was 94.3% White, 0.3% African American, 0.3% Native American, 0.2% Asian, 0.1% Pacific Islander, 3.3% from other races, and 1.4% from two or more races. Hispanic or Latino of any race were 6.2% of the population.
The median income for a household in the town was $31,250, and the median income for a family was $37,500. The per capita income for the town was $15,945. About 16.2% of families and 19.2% of the population were below the poverty line, including 25.2% of those under age 18 and 11.2% of those age 65 or over.
Common Questions
What is Per Capita Income in Hamlin?
Per Capita income in Hamlin is $23,346.
What is the Median Family Income in Hamlin?
Median Family Income in Hamlin is $65,192.
What is the Median Household income in Hamlin?
Median Household Income in Hamlin is $53,750.
What is Income or Wage Gap in Hamlin?
Income or Wage Gap in Hamlin is 32.0%.
Women in Hamlin earn 68.0 cents for every dollar earned by a man.
What is Family Income Deficit in Hamlin?
Family Income Deficit in Hamlin is $6,938.
Families that are below poverty line in Hamlin earn $6,938 less on average than the poverty threshold level.
What is Inequality or Gini Index in Hamlin?
Inequality or Gini Index in Hamlin is 0.36.
What is the Total Population of Hamlin?
Total Population of Hamlin is 2,066.
What is the Total Male Population of Hamlin?
Total Male Population of Hamlin is 1,092.
What is the Total Female Population of Hamlin?
Total Female Population of Hamlin is 974.
What is the Ratio of Males per 100 Females in Hamlin?
There are 112.11 Males per 100 Females in Hamlin.
What is the Ratio of Females per 100 Males in Hamlin?
There are 89.19 Females per 100 Males in Hamlin.
What is the Median Population Age in Hamlin?
Median Population Age in Hamlin is 35.3 Years.
What is the Average Family Size in Hamlin
Average Family Size in Hamlin is 2.7 People.
What is the Average Household Size in Hamlin
Average Household Size in Hamlin is 2.3 People.
How Large is the Labor Force in Hamlin?
There are 1,044 People in the Labor Forcein in Hamlin.
What is the Percentage of People in the Labor Force in Hamlin?
67.3% of People are in the Labor Force in Hamlin.
What is the Unemployment Rate in Hamlin?
Unemployment Rate in Hamlin is 1.6%.