Groveton, TX Map & Demographics
Groveton Map
Groveton Overview
$24,725
PER CAPITA INCOME
$65,096
AVG FAMILY INCOME
$38,333
AVG HOUSEHOLD INCOME
17.3%
WAGE / INCOME GAP [ % ]
82.7¢/ $1
WAGE / INCOME GAP [ $ ]
$13,925
FAMILY INCOME DEFICIT
0.47
INEQUALITY / GINI INDEX
991
TOTAL POPULATION
440
MALE POPULATION
551
FEMALE POPULATION
79.85
MALES / 100 FEMALES
125.23
FEMALES / 100 MALES
43.7
MEDIAN AGE
2.8
AVG FAMILY SIZE
2.1
AVG HOUSEHOLD SIZE
376
LABOR FORCE [ PEOPLE ]
41.9%
PERCENT IN LABOR FORCE
15.7%
UNEMPLOYMENT RATE
Groveton Zip Codes
Groveton Area Codes
Income in Groveton
Income Overview in Groveton
Per Capita Income in Groveton is $24,725, while median incomes of families and households are $65,096 and $38,333 respectively.
| Characteristic | Number | Measure |
| Per Capita Income | 991 | $24,725 |
| Median Family Income | 217 | $65,096 |
| Mean Family Income | 217 | $73,569 |
| Median Household Income | 432 | $38,333 |
| Mean Household Income | 432 | $53,457 |
| Income Deficit | 217 | $13,925 |
| Wage / Income Gap (%) | 991 | 17.34% |
| Wage / Income Gap ($) | 991 | 82.66¢ per $1 |
| Gini / Inequality Index | 991 | 0.47 |
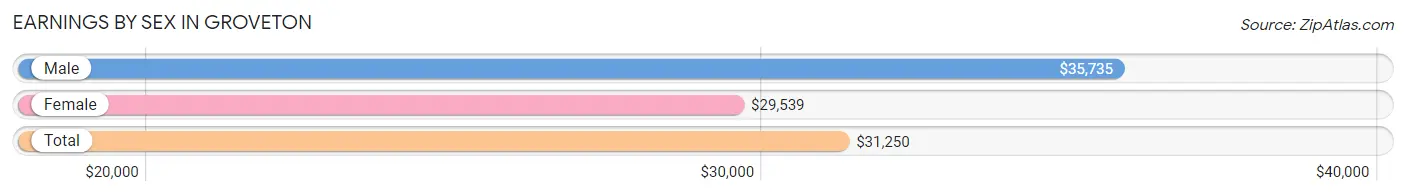
Earnings by Sex in Groveton
Average Earnings in Groveton are $31,250, $35,735 for men and $29,539 for women, a difference of 17.3%.
| Sex | Number | Average Earnings |
| Male | 236 (59.0%) | $35,735 |
| Female | 164 (41.0%) | $29,539 |
| Total | 400 (100.0%) | $31,250 |
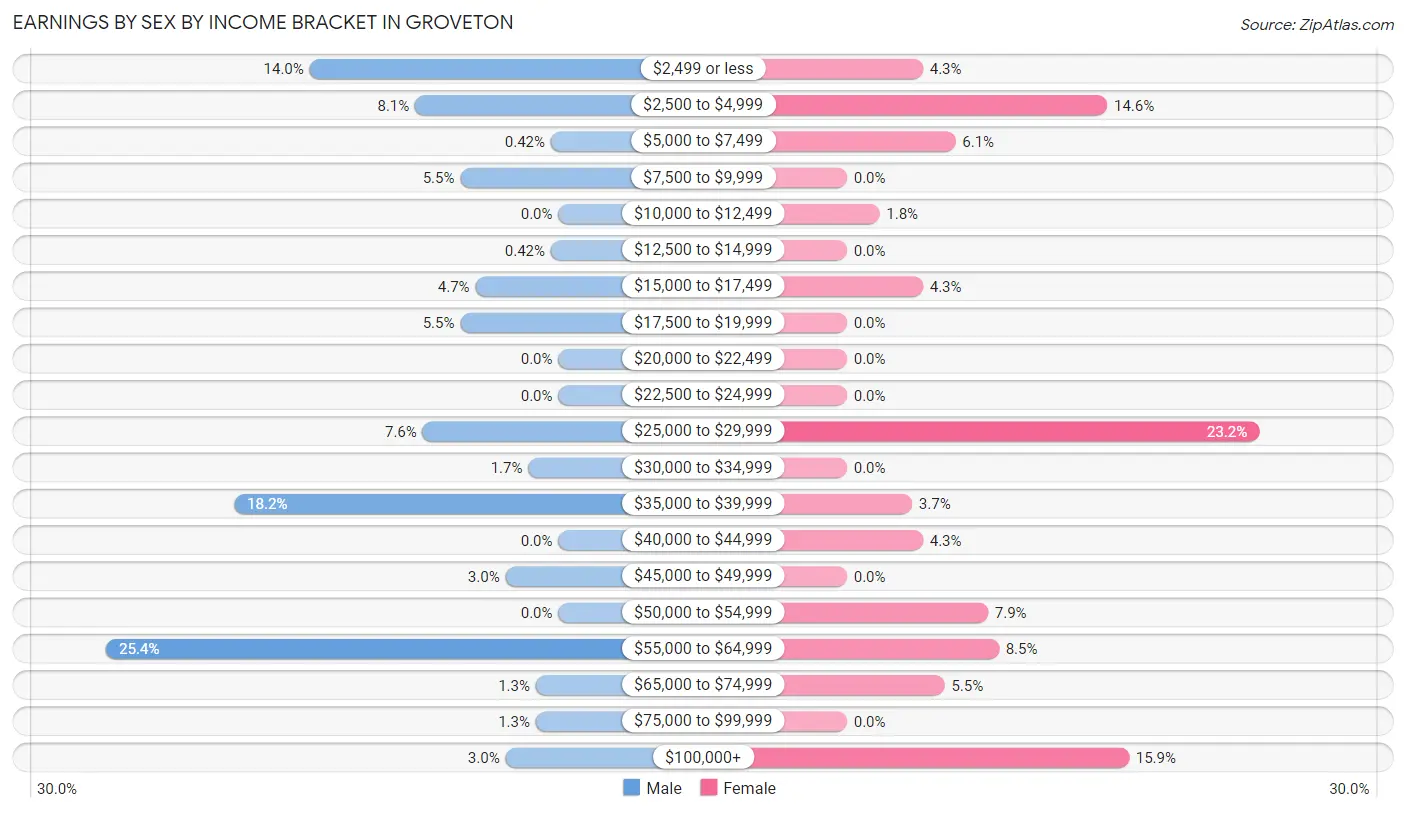
Earnings by Sex by Income Bracket in Groveton
The most common earnings brackets in Groveton are $55,000 to $64,999 for men (60 | 25.4%) and $25,000 to $29,999 for women (38 | 23.2%).
| Income | Male | Female |
| $2,499 or less | 33 (14.0%) | 7 (4.3%) |
| $2,500 to $4,999 | 19 (8.1%) | 24 (14.6%) |
| $5,000 to $7,499 | 1 (0.4%) | 10 (6.1%) |
| $7,500 to $9,999 | 13 (5.5%) | 0 (0.0%) |
| $10,000 to $12,499 | 0 (0.0%) | 3 (1.8%) |
| $12,500 to $14,999 | 1 (0.4%) | 0 (0.0%) |
| $15,000 to $17,499 | 11 (4.7%) | 7 (4.3%) |
| $17,500 to $19,999 | 13 (5.5%) | 0 (0.0%) |
| $20,000 to $22,499 | 0 (0.0%) | 0 (0.0%) |
| $22,500 to $24,999 | 0 (0.0%) | 0 (0.0%) |
| $25,000 to $29,999 | 18 (7.6%) | 38 (23.2%) |
| $30,000 to $34,999 | 4 (1.7%) | 0 (0.0%) |
| $35,000 to $39,999 | 43 (18.2%) | 6 (3.7%) |
| $40,000 to $44,999 | 0 (0.0%) | 7 (4.3%) |
| $45,000 to $49,999 | 7 (3.0%) | 0 (0.0%) |
| $50,000 to $54,999 | 0 (0.0%) | 13 (7.9%) |
| $55,000 to $64,999 | 60 (25.4%) | 14 (8.5%) |
| $65,000 to $74,999 | 3 (1.3%) | 9 (5.5%) |
| $75,000 to $99,999 | 3 (1.3%) | 0 (0.0%) |
| $100,000+ | 7 (3.0%) | 26 (15.9%) |
| Total | 236 (100.0%) | 164 (100.0%) |
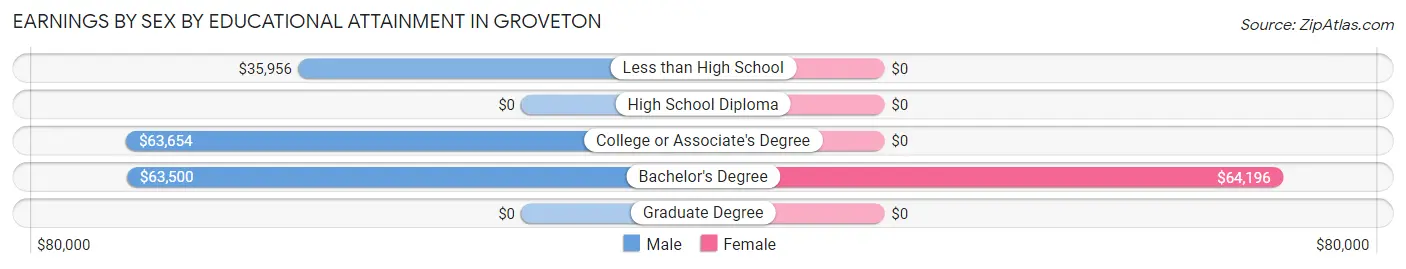
Earnings by Sex by Educational Attainment in Groveton
Average earnings in Groveton are $38,462 for men and $41,563 for women, a difference of 7.5%. Men with an educational attainment of college or associate's degree enjoy the highest average annual earnings of $63,654, while those with less than high school education earn the least with $35,956. Women with an educational attainment of bachelor's degree earn the most with the average annual earnings of $64,196, while those with bachelor's degree education have the smallest earnings of $64,196.
| Educational Attainment | Male Income | Female Income |
| Less than High School | $35,956 | $0 |
| High School Diploma | - | - |
| College or Associate's Degree | $63,654 | $0 |
| Bachelor's Degree | $63,500 | $64,196 |
| Graduate Degree | - | - |
| Total | $38,462 | $41,563 |
Family Income in Groveton
Family Income Brackets in Groveton
According to the Groveton family income data, there are 67 families falling into the $50,000 to $74,999 income range, which is the most common income bracket and makes up 30.9% of all families.
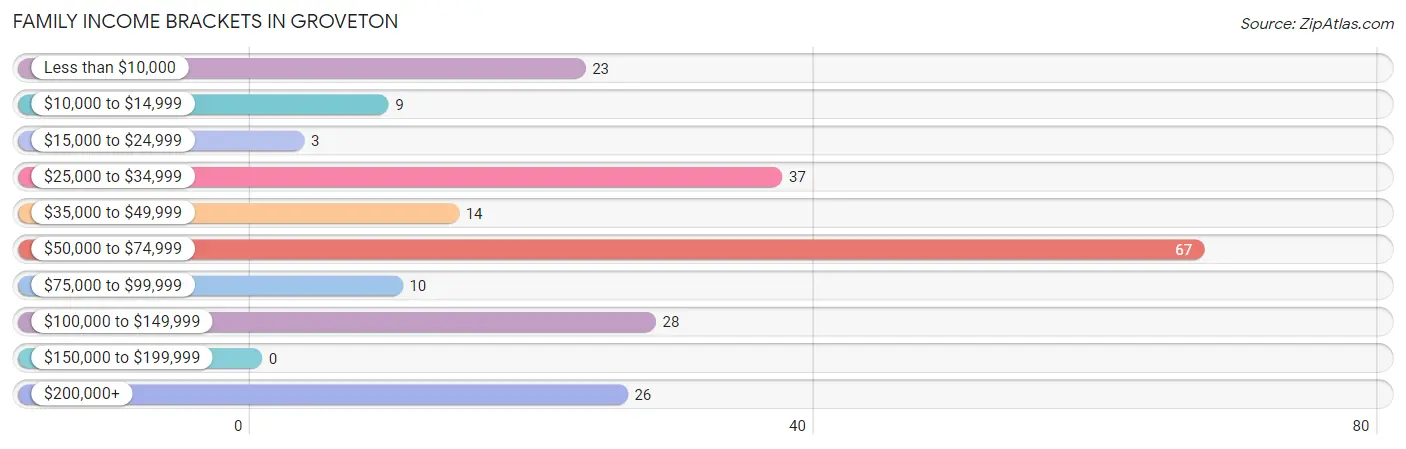
| Income Bracket | # Families | % Families |
| Less than $10,000 | 23 | 10.6% |
| $10,000 to $14,999 | 9 | 4.1% |
| $15,000 to $24,999 | 3 | 1.4% |
| $25,000 to $34,999 | 37 | 17.1% |
| $35,000 to $49,999 | 14 | 6.5% |
| $50,000 to $74,999 | 67 | 30.9% |
| $75,000 to $99,999 | 10 | 4.6% |
| $100,000 to $149,999 | 28 | 12.9% |
| $150,000 to $199,999 | 0 | 0.0% |
| $200,000+ | 26 | 12.0% |
Family Income by Famaliy Size in Groveton
3-person families (42 | 19.4%) account for the highest median family income in Groveton with $71,750 per family, while 3-person families (42 | 19.4%) have the highest median income of $23,917 per family member.
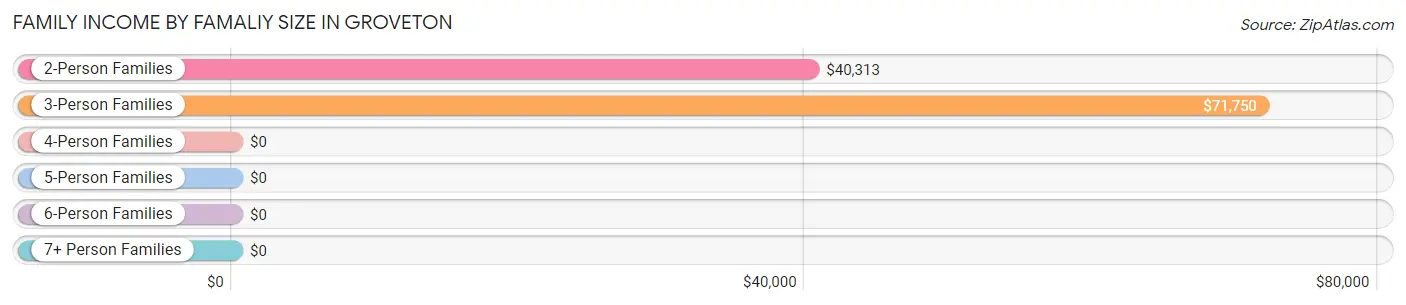
| Income Bracket | # Families | Median Income |
| 2-Person Families | 127 (58.5%) | $40,313 |
| 3-Person Families | 42 (19.4%) | $71,750 |
| 4-Person Families | 45 (20.7%) | $0 |
| 5-Person Families | 3 (1.4%) | $0 |
| 6-Person Families | 0 (0.0%) | $0 |
| 7+ Person Families | 0 (0.0%) | $0 |
| Total | 217 (100.0%) | $65,096 |
Family Income by Number of Earners in Groveton
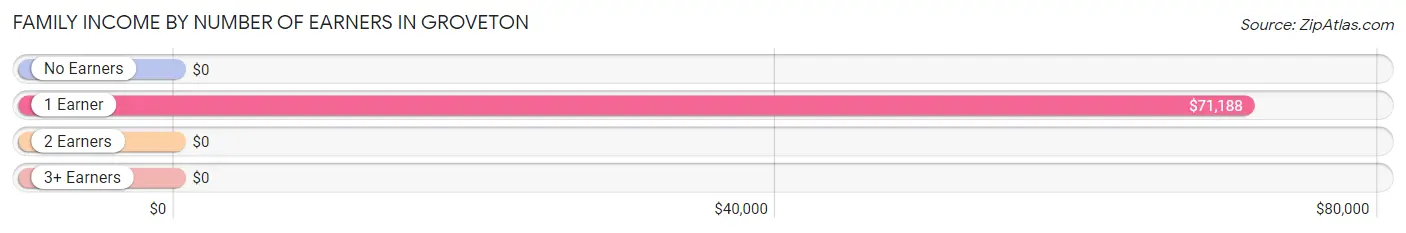
| Number of Earners | # Families | Median Income |
| No Earners | 50 (23.0%) | $0 |
| 1 Earner | 109 (50.2%) | $71,188 |
| 2 Earners | 29 (13.4%) | $0 |
| 3+ Earners | 29 (13.4%) | $0 |
| Total | 217 (100.0%) | $65,096 |
Household Income in Groveton
Household Income Brackets in Groveton
With 112 households falling in the category, the $50,000 to $74,999 income range is the most frequent in Groveton, accounting for 25.9% of all households.
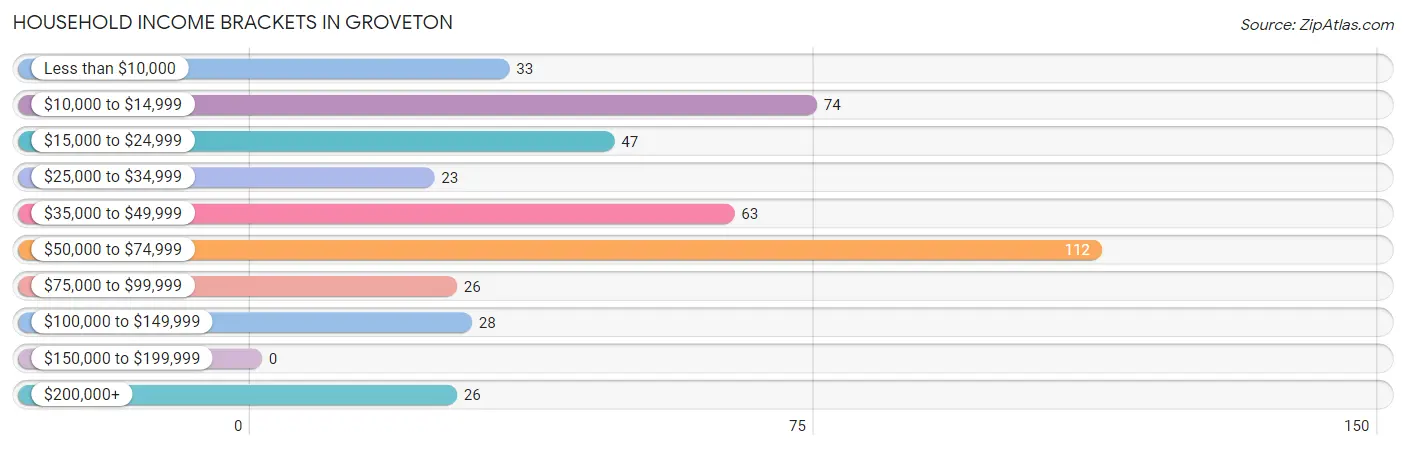
| Income Bracket | # Households | % Households |
| Less than $10,000 | 33 | 7.6% |
| $10,000 to $14,999 | 74 | 17.1% |
| $15,000 to $24,999 | 47 | 10.9% |
| $25,000 to $34,999 | 23 | 5.3% |
| $35,000 to $49,999 | 63 | 14.6% |
| $50,000 to $74,999 | 112 | 25.9% |
| $75,000 to $99,999 | 26 | 6.0% |
| $100,000 to $149,999 | 28 | 6.5% |
| $150,000 to $199,999 | 0 | 0.0% |
| $200,000+ | 26 | 6.0% |
Household Income by Householder Age in Groveton
The median household income in Groveton is $38,333, with the highest median household income of $65,592 found in the 25 to 44 years age bracket for the primary householder. A total of 135 households (31.2%) fall into this category.
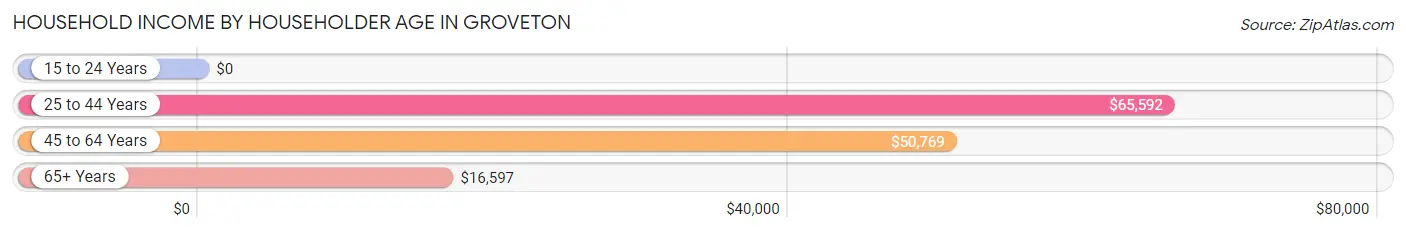
| Income Bracket | # Households | Median Income |
| 15 to 24 Years | 0 (0.0%) | $0 |
| 25 to 44 Years | 135 (31.2%) | $65,592 |
| 45 to 64 Years | 148 (34.3%) | $50,769 |
| 65+ Years | 149 (34.5%) | $16,597 |
| Total | 432 (100.0%) | $38,333 |
Poverty in Groveton
Income Below Poverty by Sex and Age in Groveton
With 17.2% poverty level for males and 28.0% for females among the residents of Groveton, 6 to 11 year old males and 25 to 34 year old females are the most vulnerable to poverty, with 17 males (68.0%) and 60 females (93.8%) in their respective age groups living below the poverty level.
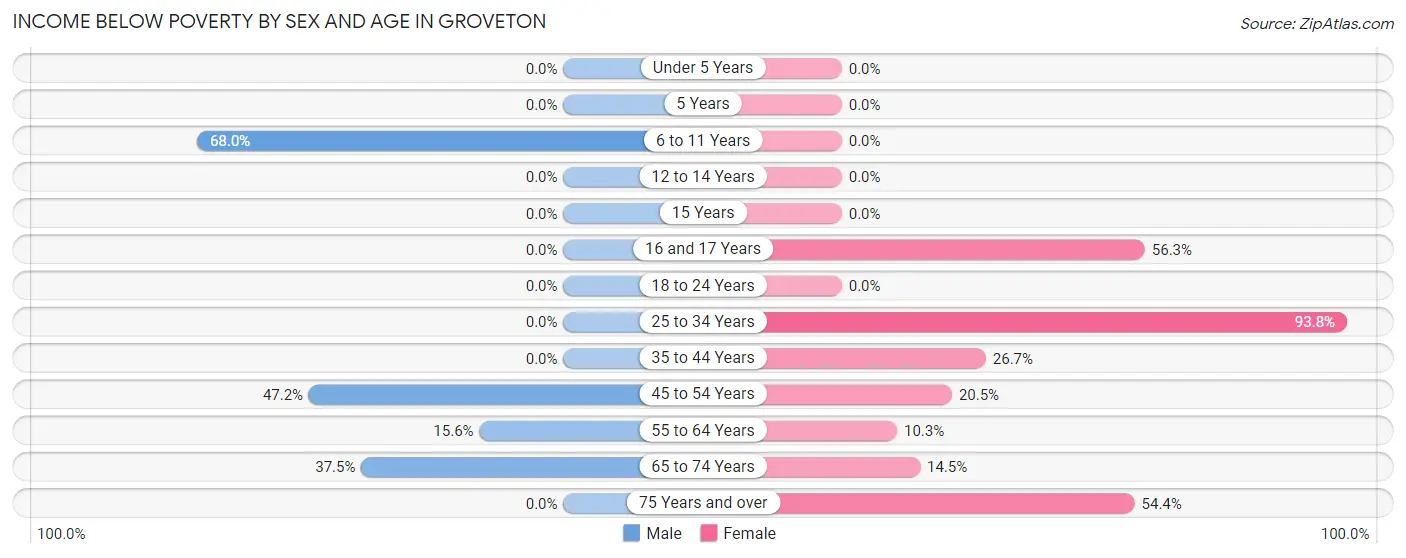
| Age Bracket | Male | Female |
| Under 5 Years | 0 (0.0%) | 0 (0.0%) |
| 5 Years | 0 (0.0%) | 0 (0.0%) |
| 6 to 11 Years | 17 (68.0%) | 0 (0.0%) |
| 12 to 14 Years | 0 (0.0%) | 0 (0.0%) |
| 15 Years | 0 (0.0%) | 0 (0.0%) |
| 16 and 17 Years | 0 (0.0%) | 9 (56.2%) |
| 18 to 24 Years | 0 (0.0%) | 0 (0.0%) |
| 25 to 34 Years | 0 (0.0%) | 60 (93.8%) |
| 35 to 44 Years | 0 (0.0%) | 23 (26.7%) |
| 45 to 54 Years | 17 (47.2%) | 9 (20.4%) |
| 55 to 64 Years | 12 (15.6%) | 8 (10.3%) |
| 65 to 74 Years | 24 (37.5%) | 9 (14.5%) |
| 75 Years and over | 0 (0.0%) | 25 (54.3%) |
| Total | 70 (17.2%) | 143 (28.0%) |
Income Above Poverty by Sex and Age in Groveton
According to the poverty statistics in Groveton, males aged 12 to 14 years and females aged under 5 years are the age groups that are most secure financially, with 100.0% of males and 100.0% of females in these age groups living above the poverty line.
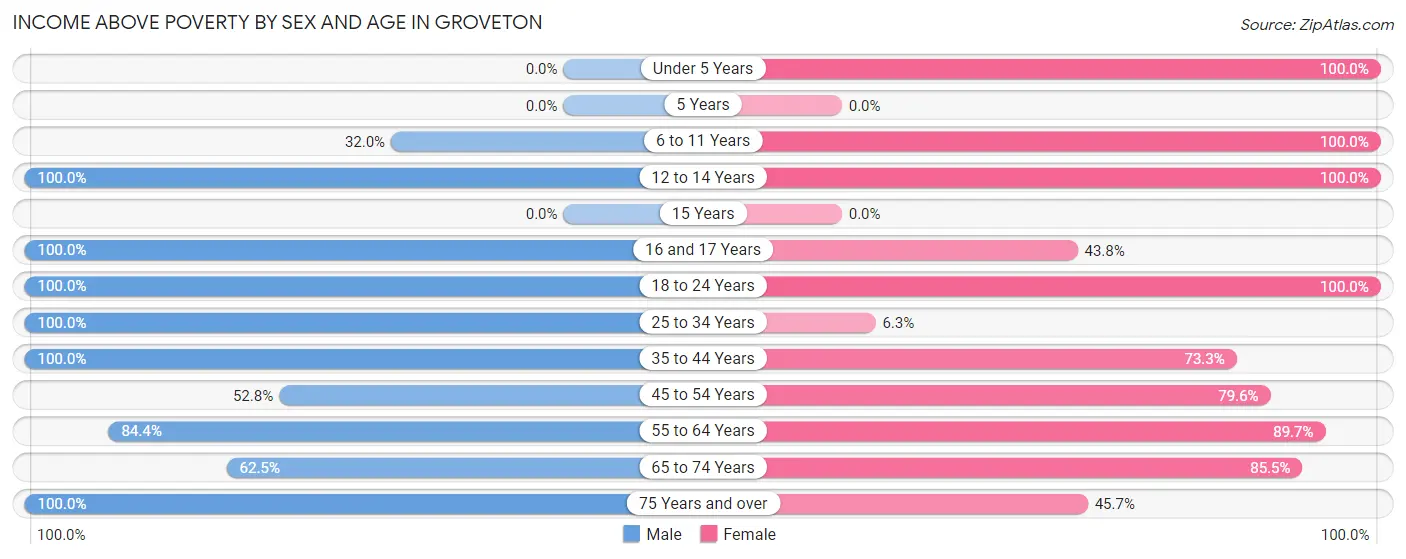
| Age Bracket | Male | Female |
| Under 5 Years | 0 (0.0%) | 4 (100.0%) |
| 5 Years | 0 (0.0%) | 0 (0.0%) |
| 6 to 11 Years | 8 (32.0%) | 37 (100.0%) |
| 12 to 14 Years | 3 (100.0%) | 24 (100.0%) |
| 15 Years | 0 (0.0%) | 0 (0.0%) |
| 16 and 17 Years | 23 (100.0%) | 7 (43.8%) |
| 18 to 24 Years | 44 (100.0%) | 49 (100.0%) |
| 25 to 34 Years | 57 (100.0%) | 4 (6.2%) |
| 35 to 44 Years | 66 (100.0%) | 63 (73.3%) |
| 45 to 54 Years | 19 (52.8%) | 35 (79.5%) |
| 55 to 64 Years | 65 (84.4%) | 70 (89.7%) |
| 65 to 74 Years | 40 (62.5%) | 53 (85.5%) |
| 75 Years and over | 13 (100.0%) | 21 (45.7%) |
| Total | 338 (82.8%) | 367 (72.0%) |
Income Below Poverty Among Married-Couple Families in Groveton
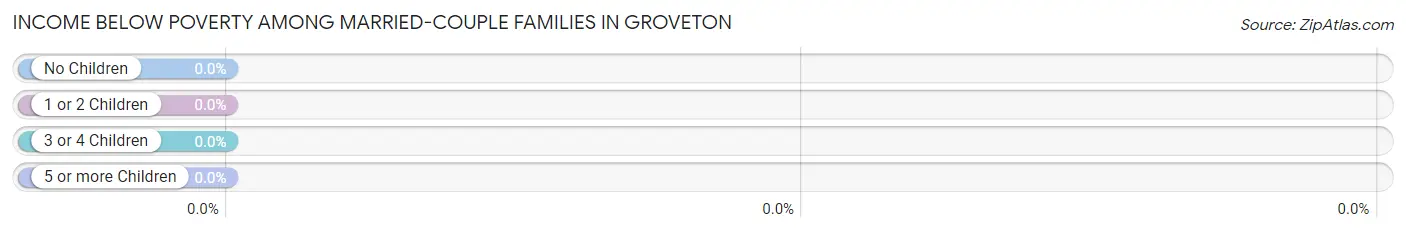
| Children | Above Poverty | Below Poverty |
| No Children | 122 (100.0%) | 0 (0.0%) |
| 1 or 2 Children | 0 (0.0%) | 0 (0.0%) |
| 3 or 4 Children | 3 (100.0%) | 0 (0.0%) |
| 5 or more Children | 0 (0.0%) | 0 (0.0%) |
| Total | 125 (100.0%) | 0 (0.0%) |
Income Below Poverty Among Single-Parent Households in Groveton
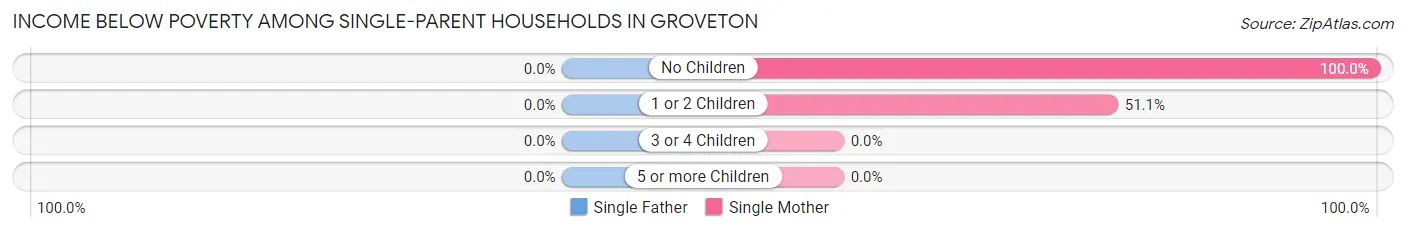
| Children | Single Father | Single Mother |
| No Children | 0 (0.0%) | 8 (100.0%) |
| 1 or 2 Children | 0 (0.0%) | 24 (51.1%) |
| 3 or 4 Children | 0 (0.0%) | 0 (0.0%) |
| 5 or more Children | 0 (0.0%) | 0 (0.0%) |
| Total | 0 (0.0%) | 32 (58.2%) |
Income Below Poverty Among Married-Couple vs Single-Parent Households in Groveton
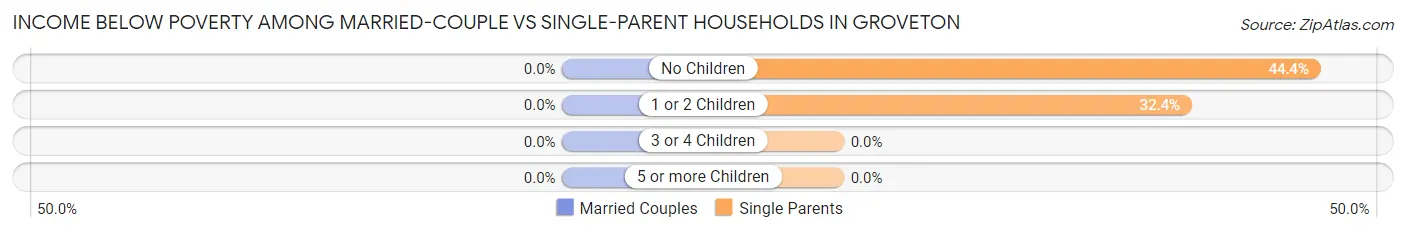
| Children | Married-Couple Families | Single-Parent Households |
| No Children | 0 (0.0%) | 8 (44.4%) |
| 1 or 2 Children | 0 (0.0%) | 24 (32.4%) |
| 3 or 4 Children | 0 (0.0%) | 0 (0.0%) |
| 5 or more Children | 0 (0.0%) | 0 (0.0%) |
| Total | 0 (0.0%) | 32 (34.8%) |
Race in Groveton
The most populous races in Groveton are White / Caucasian (897 | 90.5%), Hispanic or Latino (202 | 20.4%), and Black / African American (61 | 6.2%).
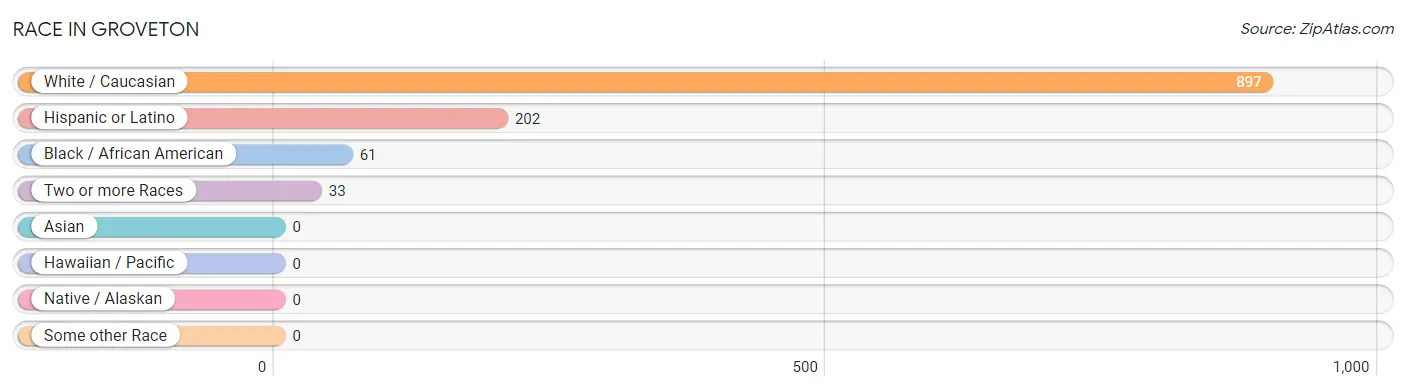
| Race | # Population | % Population |
| Asian | 0 | 0.0% |
| Black / African American | 61 | 6.2% |
| Hawaiian / Pacific | 0 | 0.0% |
| Hispanic or Latino | 202 | 20.4% |
| Native / Alaskan | 0 | 0.0% |
| White / Caucasian | 897 | 90.5% |
| Two or more Races | 33 | 3.3% |
| Some other Race | 0 | 0.0% |
| Total | 991 | 100.0% |
Ancestry in Groveton
The most populous ancestries reported in Groveton are Mexican (193 | 19.5%), English (139 | 14.0%), German (136 | 13.7%), Irish (93 | 9.4%), and Belgian (26 | 2.6%), together accounting for 59.2% of all Groveton residents.
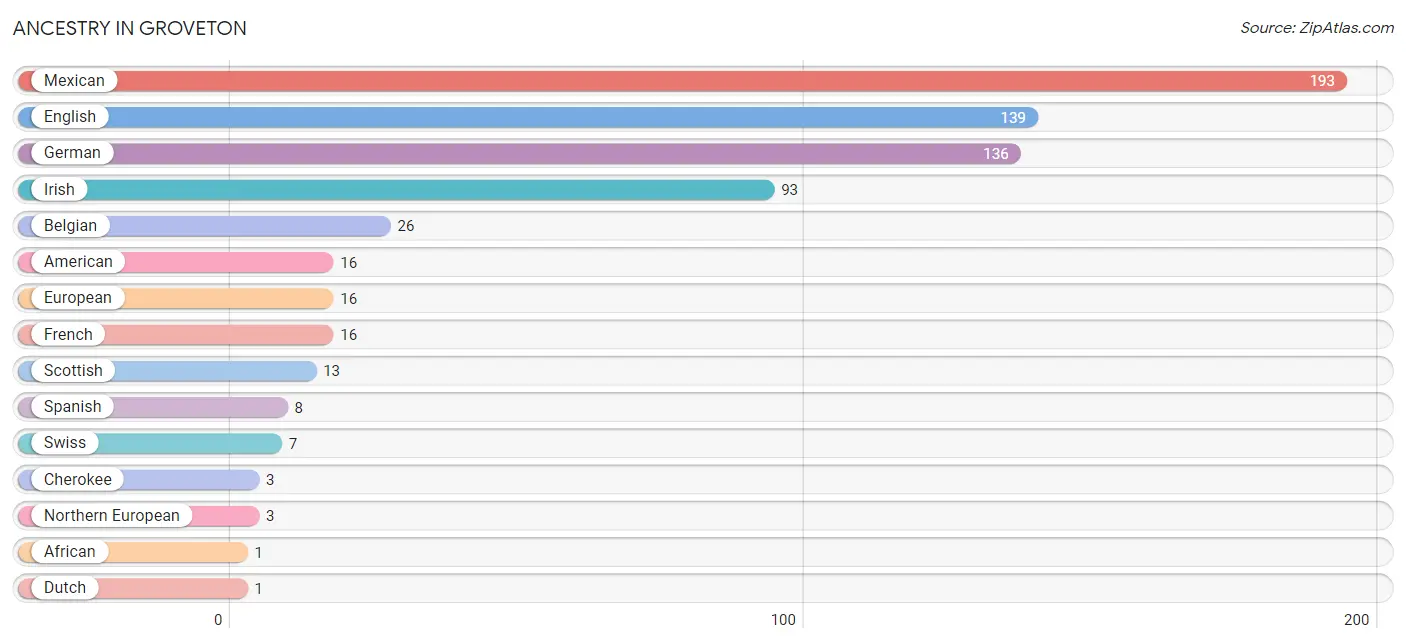
| Ancestry | # Population | % Population |
| African | 1 | 0.1% |
| American | 16 | 1.6% |
| Belgian | 26 | 2.6% |
| Cherokee | 3 | 0.3% |
| Dutch | 1 | 0.1% |
| English | 139 | 14.0% |
| European | 16 | 1.6% |
| French | 16 | 1.6% |
| German | 136 | 13.7% |
| Irish | 93 | 9.4% |
| Mexican | 193 | 19.5% |
| Northern European | 3 | 0.3% |
| Polish | 1 | 0.1% |
| Puerto Rican | 1 | 0.1% |
| Scottish | 13 | 1.3% |
| Spanish | 8 | 0.8% |
| Subsaharan African | 1 | 0.1% |
| Swiss | 7 | 0.7% | View All 18 Rows |
Immigrants in Groveton
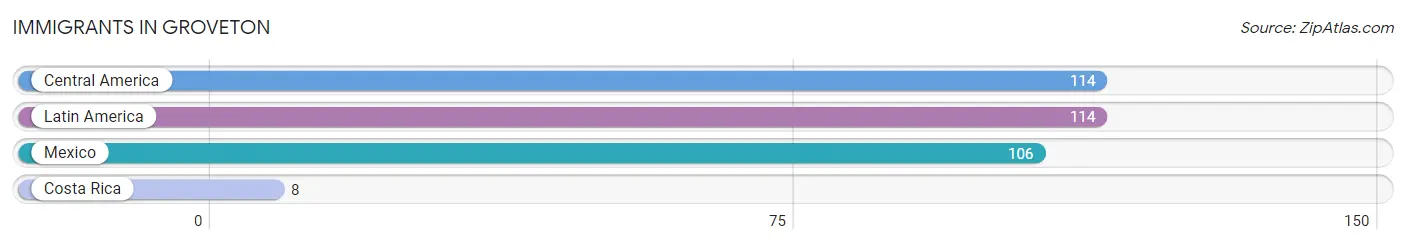
The most numerous immigrant groups reported in Groveton came from Central America (114 | 11.5%), Latin America (114 | 11.5%), Mexico (106 | 10.7%), and Costa Rica (8 | 0.8%), together accounting for 34.5% of all Groveton residents.
| Immigration Origin | # Population | % Population |
| Central America | 114 | 11.5% |
| Costa Rica | 8 | 0.8% |
| Latin America | 114 | 11.5% |
| Mexico | 106 | 10.7% | View All 4 Rows |
Sex and Age in Groveton
Sex and Age in Groveton
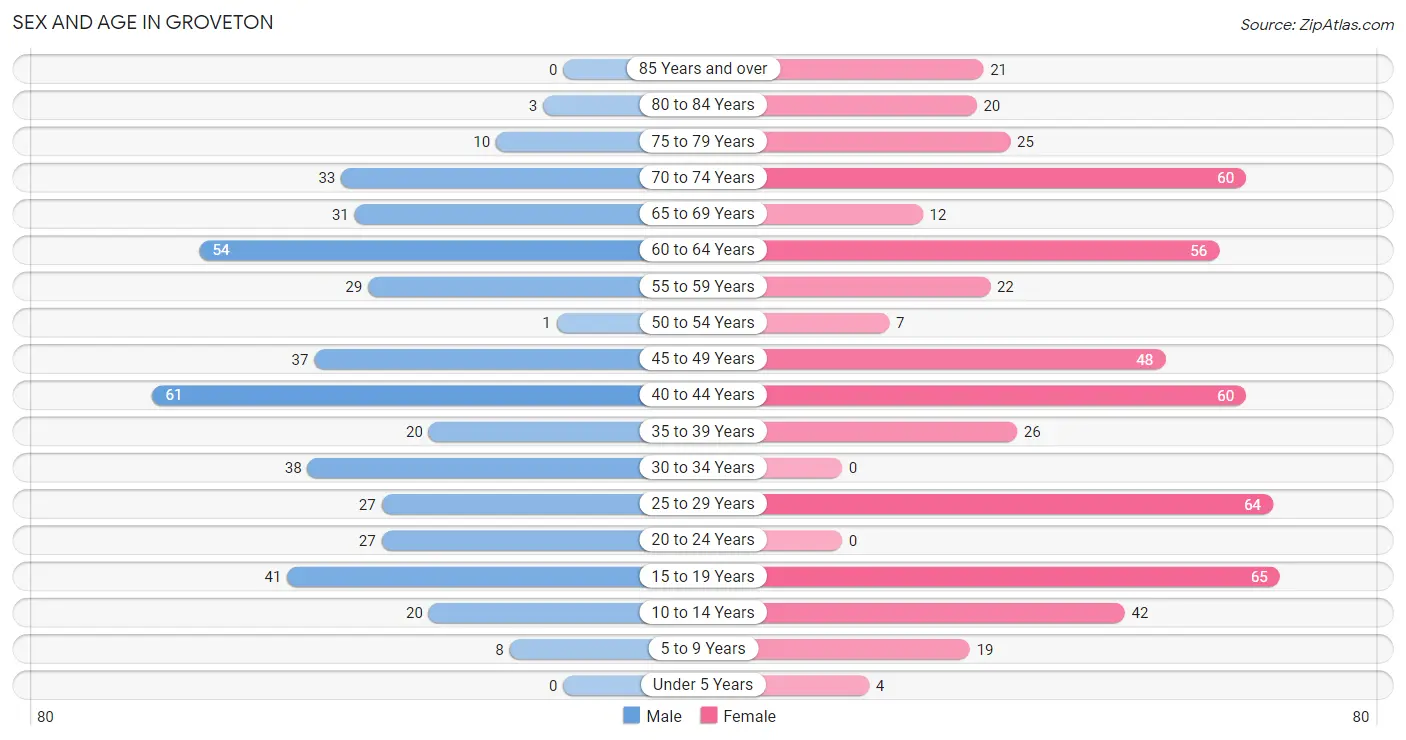
The most populous age groups in Groveton are 40 to 44 Years (61 | 13.9%) for men and 15 to 19 Years (65 | 11.8%) for women.
| Age Bracket | Male | Female |
| Under 5 Years | 0 (0.0%) | 4 (0.7%) |
| 5 to 9 Years | 8 (1.8%) | 19 (3.5%) |
| 10 to 14 Years | 20 (4.5%) | 42 (7.6%) |
| 15 to 19 Years | 41 (9.3%) | 65 (11.8%) |
| 20 to 24 Years | 27 (6.1%) | 0 (0.0%) |
| 25 to 29 Years | 27 (6.1%) | 64 (11.6%) |
| 30 to 34 Years | 38 (8.6%) | 0 (0.0%) |
| 35 to 39 Years | 20 (4.5%) | 26 (4.7%) |
| 40 to 44 Years | 61 (13.9%) | 60 (10.9%) |
| 45 to 49 Years | 37 (8.4%) | 48 (8.7%) |
| 50 to 54 Years | 1 (0.2%) | 7 (1.3%) |
| 55 to 59 Years | 29 (6.6%) | 22 (4.0%) |
| 60 to 64 Years | 54 (12.3%) | 56 (10.2%) |
| 65 to 69 Years | 31 (7.0%) | 12 (2.2%) |
| 70 to 74 Years | 33 (7.5%) | 60 (10.9%) |
| 75 to 79 Years | 10 (2.3%) | 25 (4.5%) |
| 80 to 84 Years | 3 (0.7%) | 20 (3.6%) |
| 85 Years and over | 0 (0.0%) | 21 (3.8%) |
| Total | 440 (100.0%) | 551 (100.0%) |
Families and Households in Groveton
Median Family Size in Groveton
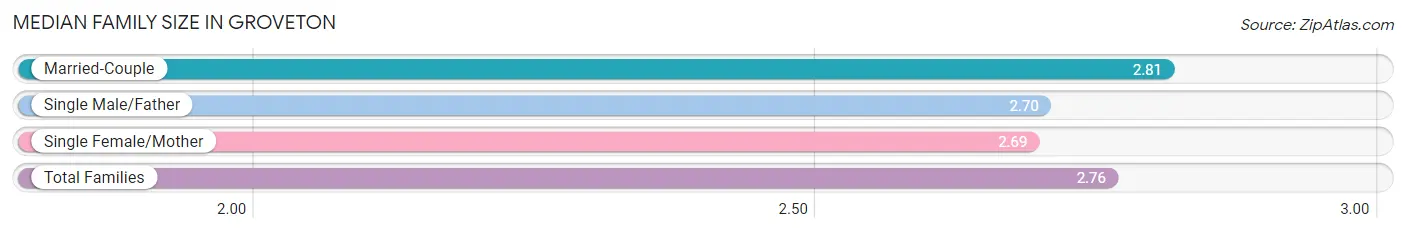
The median family size in Groveton is 2.76 persons per family, with married-couple families (125 | 57.6%) accounting for the largest median family size of 2.81 persons per family. On the other hand, single female/mother families (55 | 25.4%) represent the smallest median family size with 2.69 persons per family.
| Family Type | # Families | Family Size |
| Married-Couple | 125 (57.6%) | 2.81 |
| Single Male/Father | 37 (17.1%) | 2.70 |
| Single Female/Mother | 55 (25.4%) | 2.69 |
| Total Families | 217 (100.0%) | 2.76 |
Median Household Size in Groveton
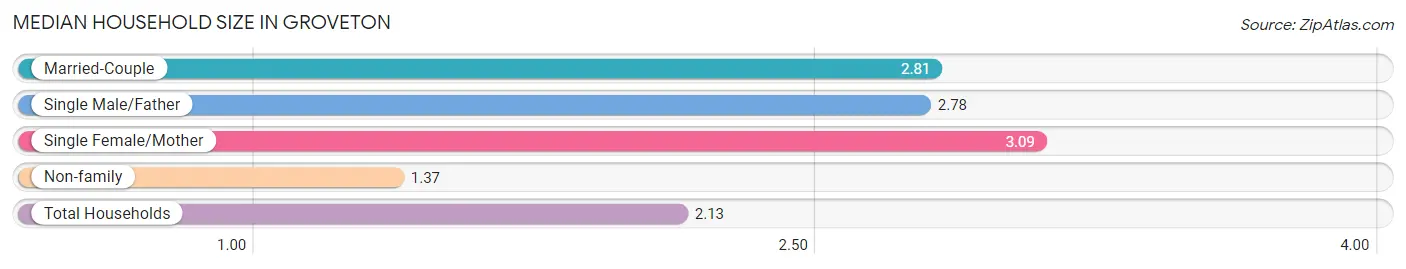
The median household size in Groveton is 2.13 persons per household, with single female/mother households (55 | 12.7%) accounting for the largest median household size of 3.09 persons per household. non-family households (215 | 49.8%) represent the smallest median household size with 1.37 persons per household.
| Household Type | # Households | Household Size |
| Married-Couple | 125 (28.9%) | 2.81 |
| Single Male/Father | 37 (8.6%) | 2.78 |
| Single Female/Mother | 55 (12.7%) | 3.09 |
| Non-family | 215 (49.8%) | 1.37 |
| Total Households | 432 (100.0%) | 2.13 |
Household Size by Marriage Status in Groveton
Out of a total of 432 households in Groveton, 217 (50.2%) are family households, while 215 (49.8%) are nonfamily households. The most numerous type of family households are 2-person households, comprising 123, and the most common type of nonfamily households are 1-person households, comprising 172.
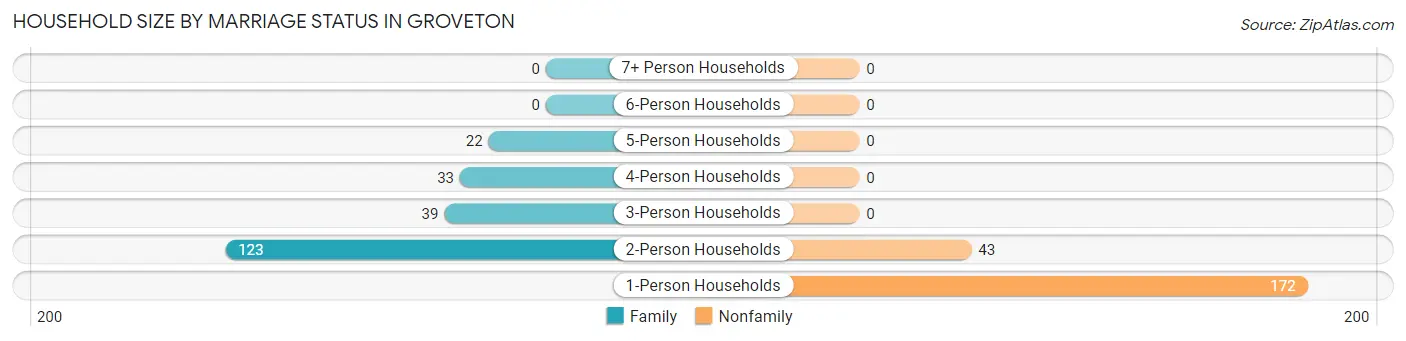
| Household Size | Family Households | Nonfamily Households |
| 1-Person Households | - | 172 (39.8%) |
| 2-Person Households | 123 (28.5%) | 43 (10.0%) |
| 3-Person Households | 39 (9.0%) | 0 (0.0%) |
| 4-Person Households | 33 (7.6%) | 0 (0.0%) |
| 5-Person Households | 22 (5.1%) | 0 (0.0%) |
| 6-Person Households | 0 (0.0%) | 0 (0.0%) |
| 7+ Person Households | 0 (0.0%) | 0 (0.0%) |
| Total | 217 (50.2%) | 215 (49.8%) |
Female Fertility in Groveton
Fertility by Age in Groveton
| Age Bracket | Women with Births | Births / 1,000 Women |
| 15 to 19 years | 0 (0.0%) | 0.0 |
| 20 to 34 years | 0 (0.0%) | 0.0 |
| 35 to 50 years | 0 (0.0%) | 0.0 |
| Total | 0 (0.0%) | 0.0 |
Fertility by Age by Marriage Status in Groveton
| Age Bracket | Married | Unmarried |
| 15 to 19 years | 0 (0.0%) | 0 (0.0%) |
| 20 to 34 years | 0 (0.0%) | 0 (0.0%) |
| 35 to 50 years | 0 (0.0%) | 0 (0.0%) |
| Total | 0 (0.0%) | 0 (0.0%) |
Fertility by Education in Groveton
| Educational Attainment | Women with Births | Births / 1,000 Women |
| Less than High School | 0 (0.0%) | 0.0 |
| High School Diploma | 0 (0.0%) | 0.0 |
| College or Associate's Degree | 0 (0.0%) | 0.0 |
| Bachelor's Degree | 0 (0.0%) | 0.0 |
| Graduate Degree | 0 (0.0%) | 0.0 |
| Total | 0 (0.0%) | 0.0 |
Fertility by Education by Marriage Status in Groveton
| Educational Attainment | Married | Unmarried |
| Less than High School | 0 (0.0%) | 0 (0.0%) |
| High School Diploma | 0 (0.0%) | 0 (0.0%) |
| College or Associate's Degree | 0 (0.0%) | 0 (0.0%) |
| Bachelor's Degree | 0 (0.0%) | 0 (0.0%) |
| Graduate Degree | 0 (0.0%) | 0 (0.0%) |
| Total | 0 (0.0%) | 0 (0.0%) |
Employment Characteristics in Groveton
Employment by Class of Employer in Groveton
Among the 296 employed individuals in Groveton, private company employees (161 | 54.4%), self-employed (not incorporated) (56 | 18.9%), and local government employees (34 | 11.5%) make up the most common classes of employment.
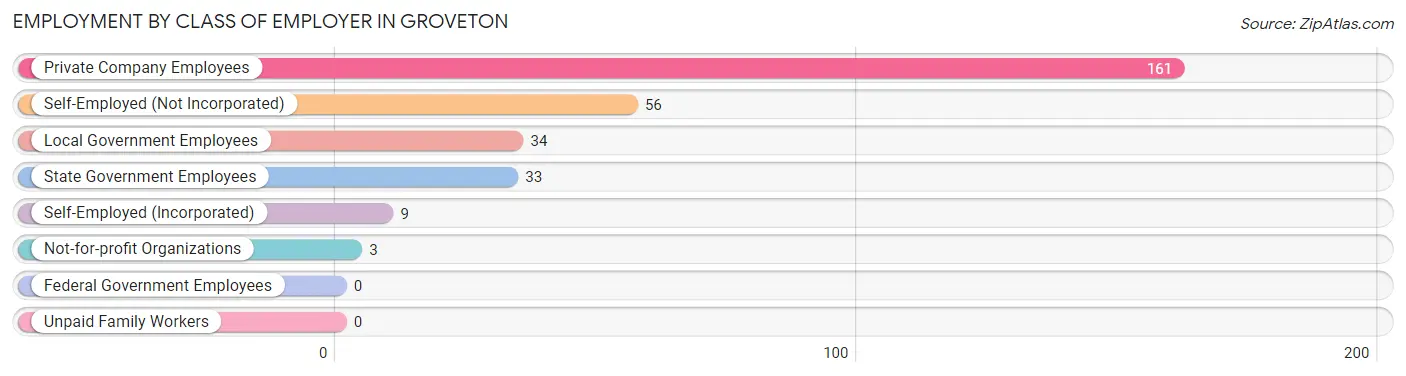
| Employer Class | # Employees | % Employees |
| Private Company Employees | 161 | 54.4% |
| Self-Employed (Incorporated) | 9 | 3.0% |
| Self-Employed (Not Incorporated) | 56 | 18.9% |
| Not-for-profit Organizations | 3 | 1.0% |
| Local Government Employees | 34 | 11.5% |
| State Government Employees | 33 | 11.2% |
| Federal Government Employees | 0 | 0.0% |
| Unpaid Family Workers | 0 | 0.0% |
| Total | 296 | 100.0% |
Employment Status by Age in Groveton
According to the labor force statistics for Groveton, out of the total population over 16 years of age (898), 41.9% or 376 individuals are in the labor force, with 15.7% or 59 of them unemployed. The age group with the highest labor force participation rate is 45 to 54 years, with 86.0% or 80 individuals in the labor force. Within the labor force, the 25 to 29 years age range has the highest percentage of unemployed individuals, with 86.7% or 26 of them being unemployed.
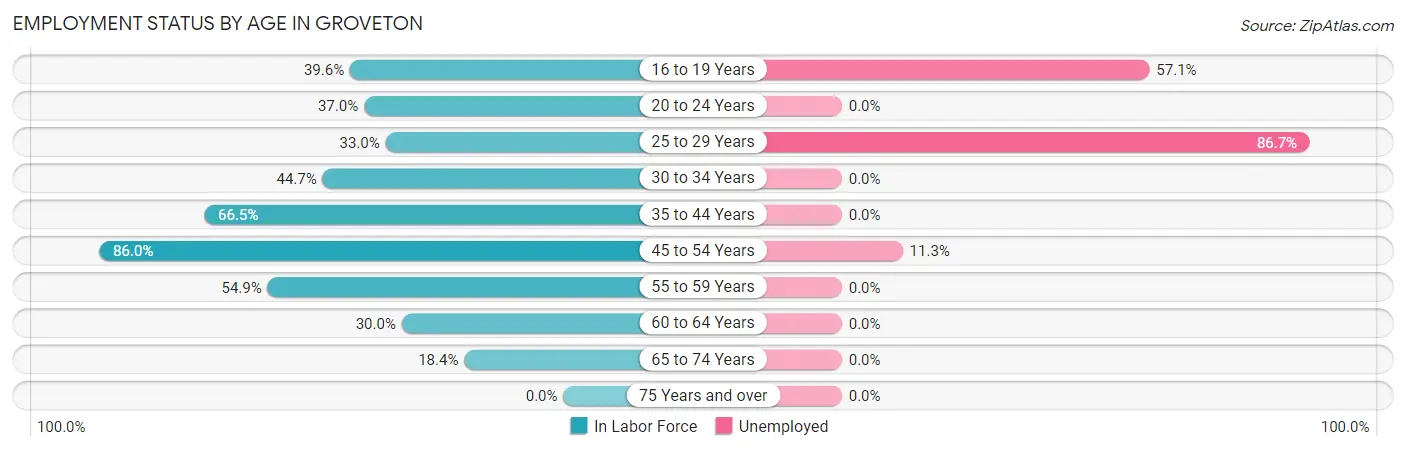
| Age Bracket | In Labor Force | Unemployed |
| 16 to 19 Years | 42 (39.6%) | 24 (57.1%) |
| 20 to 24 Years | 10 (37.0%) | 0 (0.0%) |
| 25 to 29 Years | 30 (33.0%) | 26 (86.7%) |
| 30 to 34 Years | 17 (44.7%) | 0 (0.0%) |
| 35 to 44 Years | 111 (66.5%) | 0 (0.0%) |
| 45 to 54 Years | 80 (86.0%) | 9 (11.3%) |
| 55 to 59 Years | 28 (54.9%) | 0 (0.0%) |
| 60 to 64 Years | 33 (30.0%) | 0 (0.0%) |
| 65 to 74 Years | 25 (18.4%) | 0 (0.0%) |
| 75 Years and over | 0 (0.0%) | 0 (0.0%) |
| Total | 376 (41.9%) | 59 (15.7%) |
Employment Status by Educational Attainment in Groveton
According to labor force statistics for Groveton, 54.4% of individuals (299) out of the total population between 25 and 64 years of age (550) are in the labor force, with 11.7% or 35 of them being unemployed. The group with the highest labor force participation rate are those with the educational attainment of bachelor's degree or higher, with 67.3% or 76 individuals in the labor force. Within the labor force, individuals with high school diploma education have the highest percentage of unemployment, with 26.5% or 9 of them being unemployed.
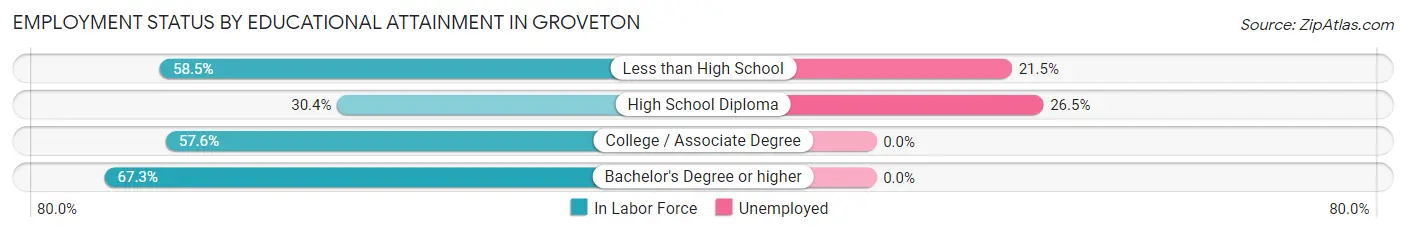
| Educational Attainment | In Labor Force | Unemployed |
| Less than High School | 121 (58.5%) | 45 (21.5%) |
| High School Diploma | 34 (30.4%) | 30 (26.5%) |
| College / Associate Degree | 68 (57.6%) | 0 (0.0%) |
| Bachelor's Degree or higher | 76 (67.3%) | 0 (0.0%) |
| Total | 299 (54.4%) | 64 (11.7%) |
Employment Occupations by Sex in Groveton
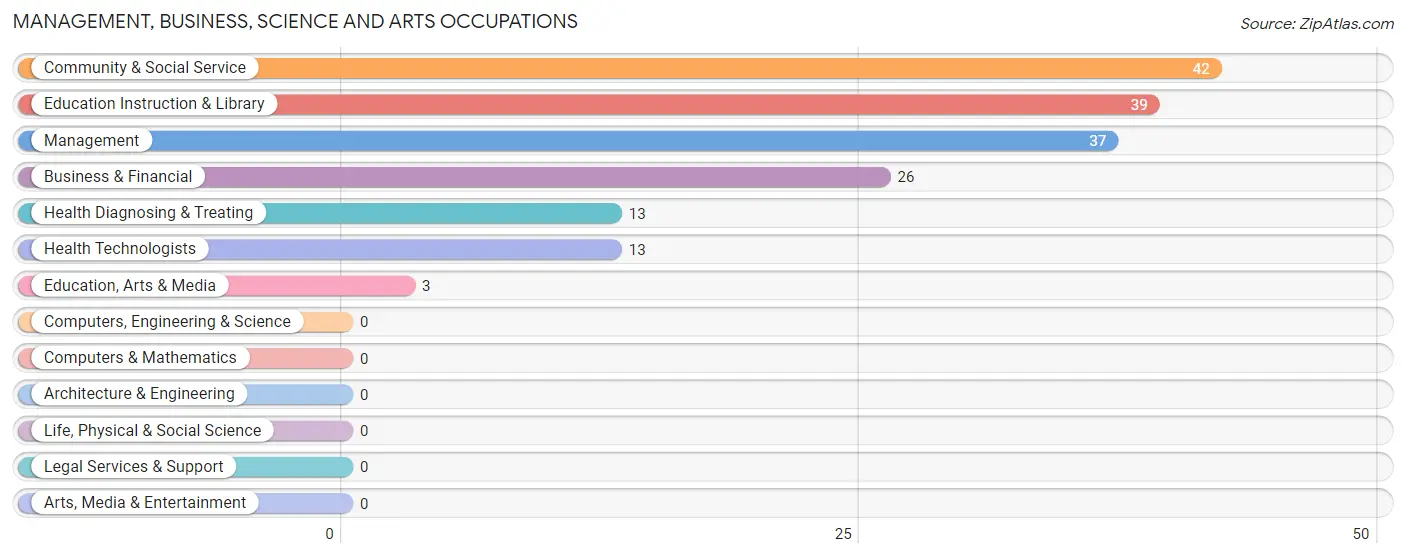
Management, Business, Science and Arts Occupations
The most common Management, Business, Science and Arts occupations in Groveton are Community & Social Service (42 | 13.3%), Education Instruction & Library (39 | 12.3%), Management (37 | 11.7%), Business & Financial (26 | 8.2%), and Health Diagnosing & Treating (13 | 4.1%).
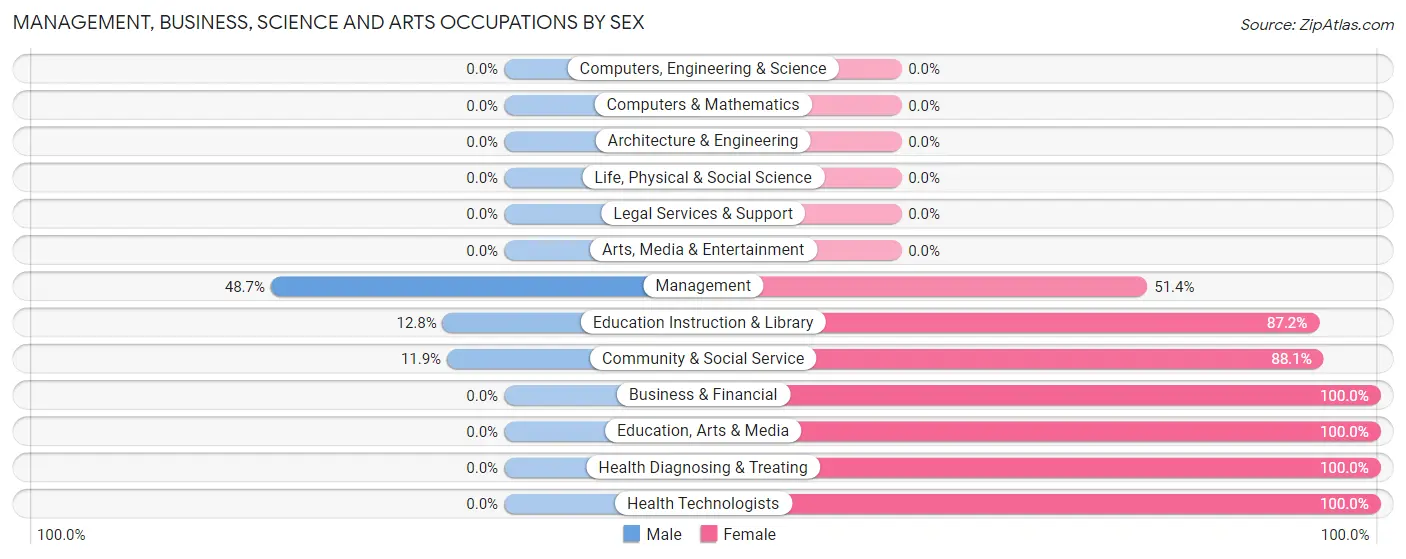
Management, Business, Science and Arts Occupations by Sex
Within the Management, Business, Science and Arts occupations in Groveton, the most male-oriented occupations are Management (48.6%), Education Instruction & Library (12.8%), and Community & Social Service (11.9%), while the most female-oriented occupations are Business & Financial (100.0%), Education, Arts & Media (100.0%), and Health Diagnosing & Treating (100.0%).
| Occupation | Male | Female |
| Management | 18 (48.6%) | 19 (51.3%) |
| Business & Financial | 0 (0.0%) | 26 (100.0%) |
| Computers, Engineering & Science | 0 (0.0%) | 0 (0.0%) |
| Computers & Mathematics | 0 (0.0%) | 0 (0.0%) |
| Architecture & Engineering | 0 (0.0%) | 0 (0.0%) |
| Life, Physical & Social Science | 0 (0.0%) | 0 (0.0%) |
| Community & Social Service | 5 (11.9%) | 37 (88.1%) |
| Education, Arts & Media | 0 (0.0%) | 3 (100.0%) |
| Legal Services & Support | 0 (0.0%) | 0 (0.0%) |
| Education Instruction & Library | 5 (12.8%) | 34 (87.2%) |
| Arts, Media & Entertainment | 0 (0.0%) | 0 (0.0%) |
| Health Diagnosing & Treating | 0 (0.0%) | 13 (100.0%) |
| Health Technologists | 0 (0.0%) | 13 (100.0%) |
| Total (Category) | 23 (19.5%) | 95 (80.5%) |
| Total (Overall) | 184 (58.0%) | 133 (42.0%) |
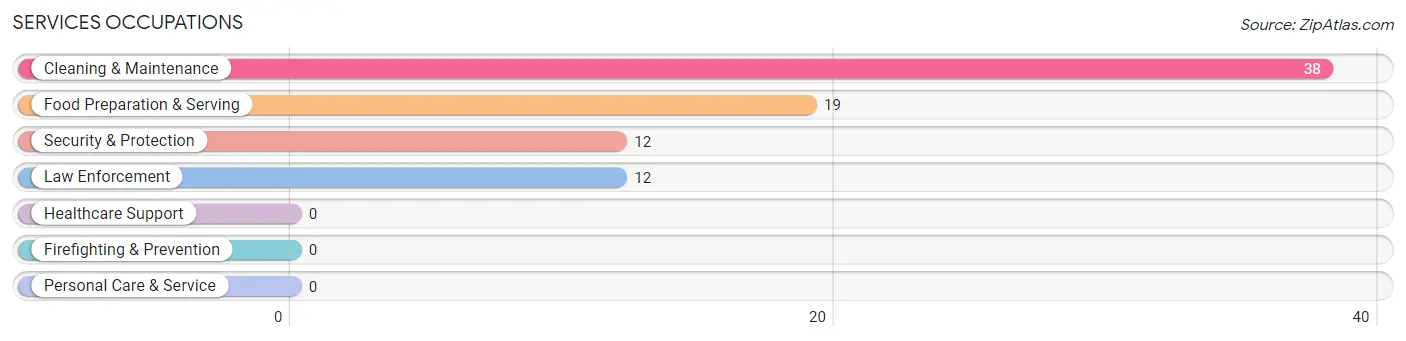
Services Occupations
The most common Services occupations in Groveton are Cleaning & Maintenance (38 | 12.0%), Food Preparation & Serving (19 | 6.0%), Security & Protection (12 | 3.8%), and Law Enforcement (12 | 3.8%).
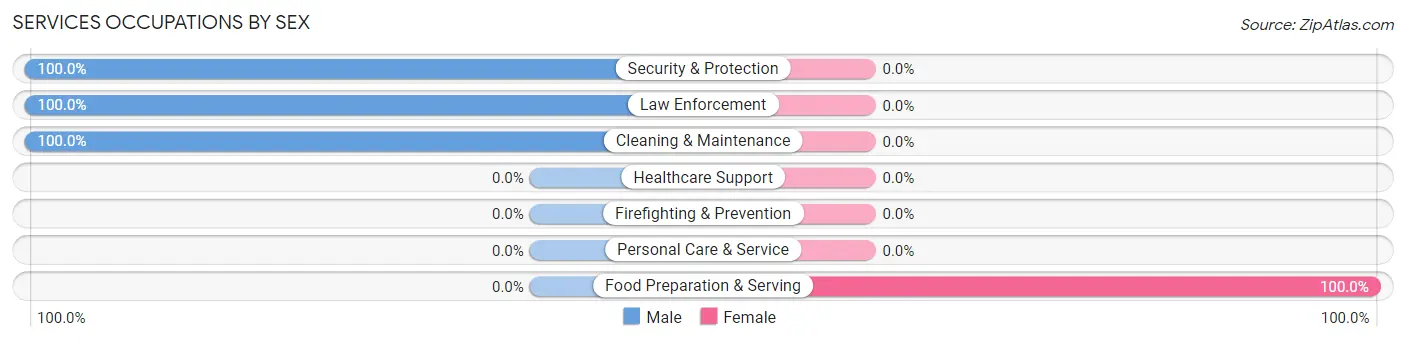
Services Occupations by Sex
| Occupation | Male | Female |
| Healthcare Support | 0 (0.0%) | 0 (0.0%) |
| Security & Protection | 12 (100.0%) | 0 (0.0%) |
| Firefighting & Prevention | 0 (0.0%) | 0 (0.0%) |
| Law Enforcement | 12 (100.0%) | 0 (0.0%) |
| Food Preparation & Serving | 0 (0.0%) | 19 (100.0%) |
| Cleaning & Maintenance | 38 (100.0%) | 0 (0.0%) |
| Personal Care & Service | 0 (0.0%) | 0 (0.0%) |
| Total (Category) | 50 (72.5%) | 19 (27.5%) |
| Total (Overall) | 184 (58.0%) | 133 (42.0%) |
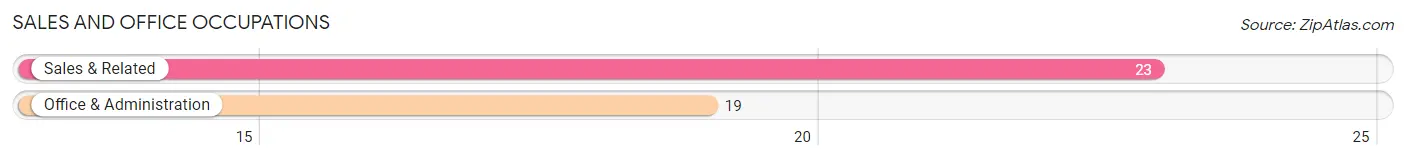
Sales and Office Occupations
The most common Sales and Office occupations in Groveton are Sales & Related (23 | 7.3%), and Office & Administration (19 | 6.0%).
Sales and Office Occupations by Sex
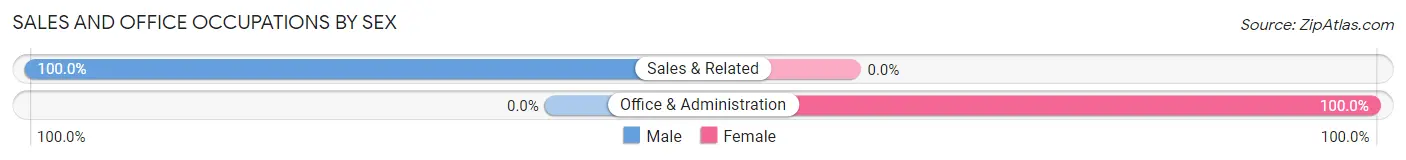
| Occupation | Male | Female |
| Sales & Related | 23 (100.0%) | 0 (0.0%) |
| Office & Administration | 0 (0.0%) | 19 (100.0%) |
| Total (Category) | 23 (54.8%) | 19 (45.2%) |
| Total (Overall) | 184 (58.0%) | 133 (42.0%) |
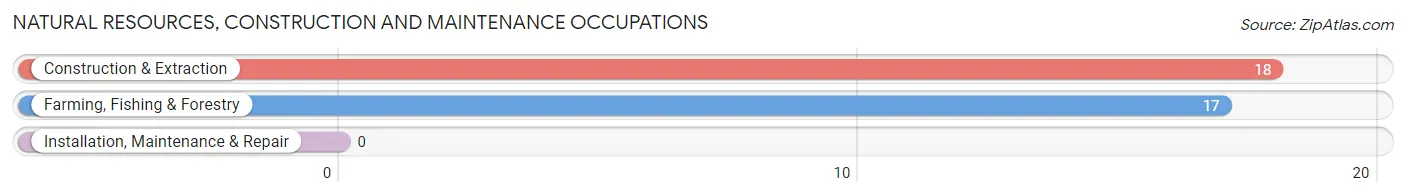
Natural Resources, Construction and Maintenance Occupations
The most common Natural Resources, Construction and Maintenance occupations in Groveton are Construction & Extraction (18 | 5.7%), and Farming, Fishing & Forestry (17 | 5.4%).
Natural Resources, Construction and Maintenance Occupations by Sex
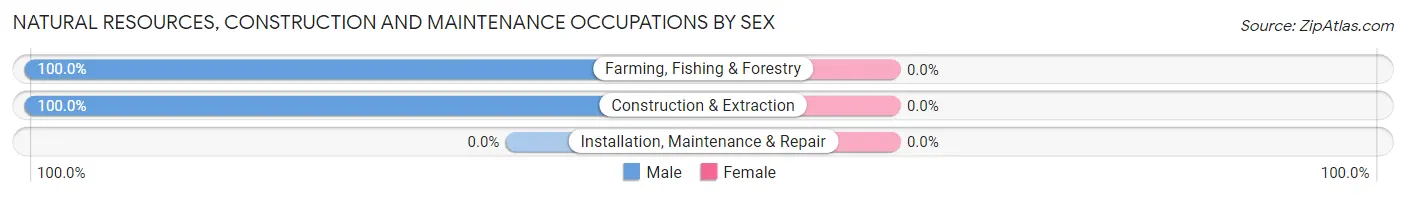
| Occupation | Male | Female |
| Farming, Fishing & Forestry | 17 (100.0%) | 0 (0.0%) |
| Construction & Extraction | 18 (100.0%) | 0 (0.0%) |
| Installation, Maintenance & Repair | 0 (0.0%) | 0 (0.0%) |
| Total (Category) | 35 (100.0%) | 0 (0.0%) |
| Total (Overall) | 184 (58.0%) | 133 (42.0%) |
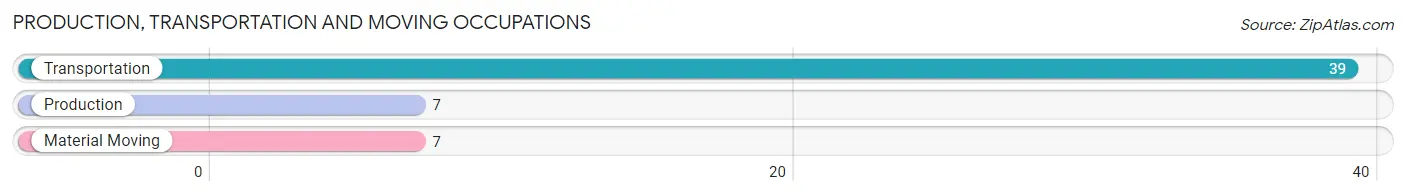
Production, Transportation and Moving Occupations
The most common Production, Transportation and Moving occupations in Groveton are Transportation (39 | 12.3%), Production (7 | 2.2%), and Material Moving (7 | 2.2%).
Production, Transportation and Moving Occupations by Sex
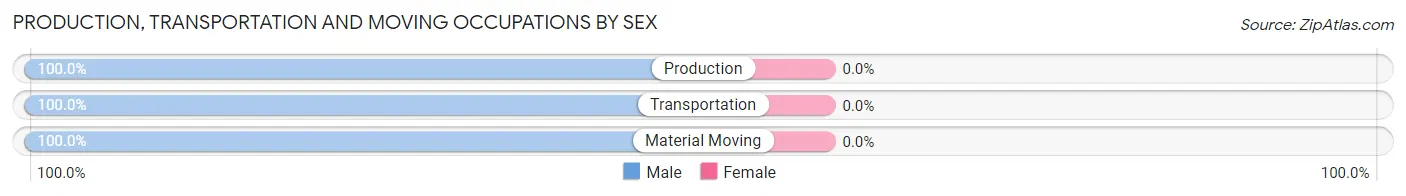
| Occupation | Male | Female |
| Production | 7 (100.0%) | 0 (0.0%) |
| Transportation | 39 (100.0%) | 0 (0.0%) |
| Material Moving | 7 (100.0%) | 0 (0.0%) |
| Total (Category) | 53 (100.0%) | 0 (0.0%) |
| Total (Overall) | 184 (58.0%) | 133 (42.0%) |
Employment Industries by Sex in Groveton
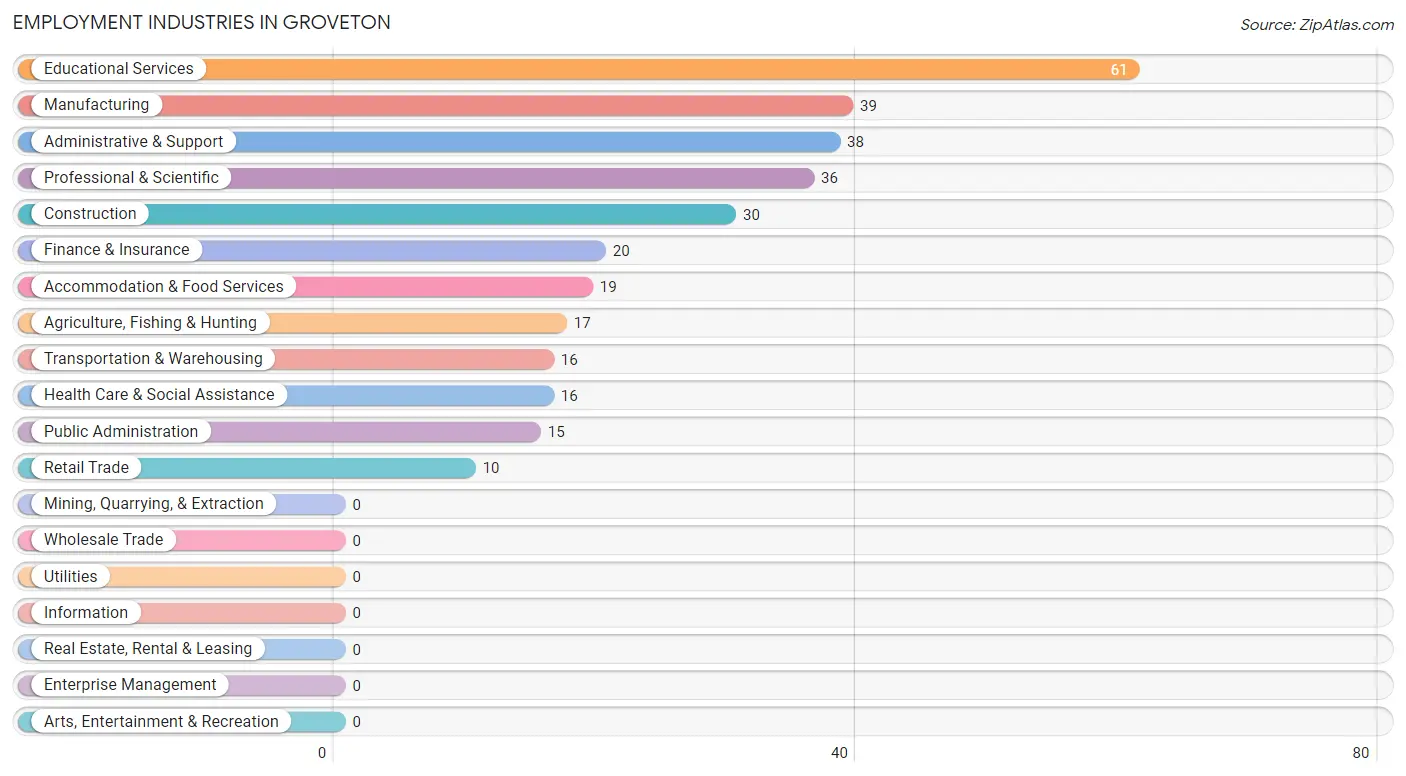
Employment Industries in Groveton
The major employment industries in Groveton include Educational Services (61 | 19.2%), Manufacturing (39 | 12.3%), Administrative & Support (38 | 12.0%), Professional & Scientific (36 | 11.4%), and Construction (30 | 9.5%).
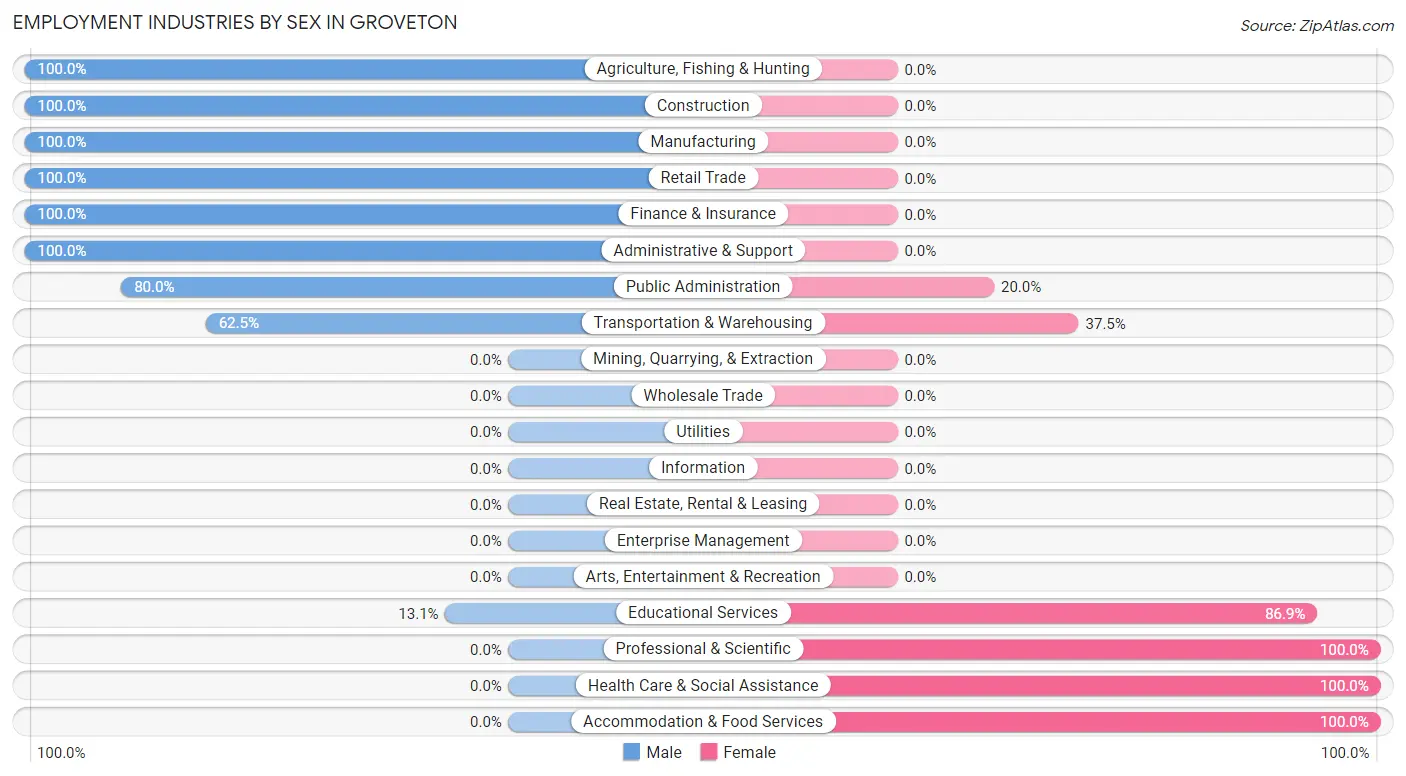
Employment Industries by Sex in Groveton
The Groveton industries that see more men than women are Agriculture, Fishing & Hunting (100.0%), Construction (100.0%), and Manufacturing (100.0%), whereas the industries that tend to have a higher number of women are Professional & Scientific (100.0%), Health Care & Social Assistance (100.0%), and Accommodation & Food Services (100.0%).
| Industry | Male | Female |
| Agriculture, Fishing & Hunting | 17 (100.0%) | 0 (0.0%) |
| Mining, Quarrying, & Extraction | 0 (0.0%) | 0 (0.0%) |
| Construction | 30 (100.0%) | 0 (0.0%) |
| Manufacturing | 39 (100.0%) | 0 (0.0%) |
| Wholesale Trade | 0 (0.0%) | 0 (0.0%) |
| Retail Trade | 10 (100.0%) | 0 (0.0%) |
| Transportation & Warehousing | 10 (62.5%) | 6 (37.5%) |
| Utilities | 0 (0.0%) | 0 (0.0%) |
| Information | 0 (0.0%) | 0 (0.0%) |
| Finance & Insurance | 20 (100.0%) | 0 (0.0%) |
| Real Estate, Rental & Leasing | 0 (0.0%) | 0 (0.0%) |
| Professional & Scientific | 0 (0.0%) | 36 (100.0%) |
| Enterprise Management | 0 (0.0%) | 0 (0.0%) |
| Administrative & Support | 38 (100.0%) | 0 (0.0%) |
| Educational Services | 8 (13.1%) | 53 (86.9%) |
| Health Care & Social Assistance | 0 (0.0%) | 16 (100.0%) |
| Arts, Entertainment & Recreation | 0 (0.0%) | 0 (0.0%) |
| Accommodation & Food Services | 0 (0.0%) | 19 (100.0%) |
| Public Administration | 12 (80.0%) | 3 (20.0%) |
| Total | 184 (58.0%) | 133 (42.0%) |
Education in Groveton
School Enrollment in Groveton
The most common levels of schooling among the 159 students in Groveton are high school (63 | 39.6%), middle school (42 | 26.4%), and elementary school (25 | 15.7%).
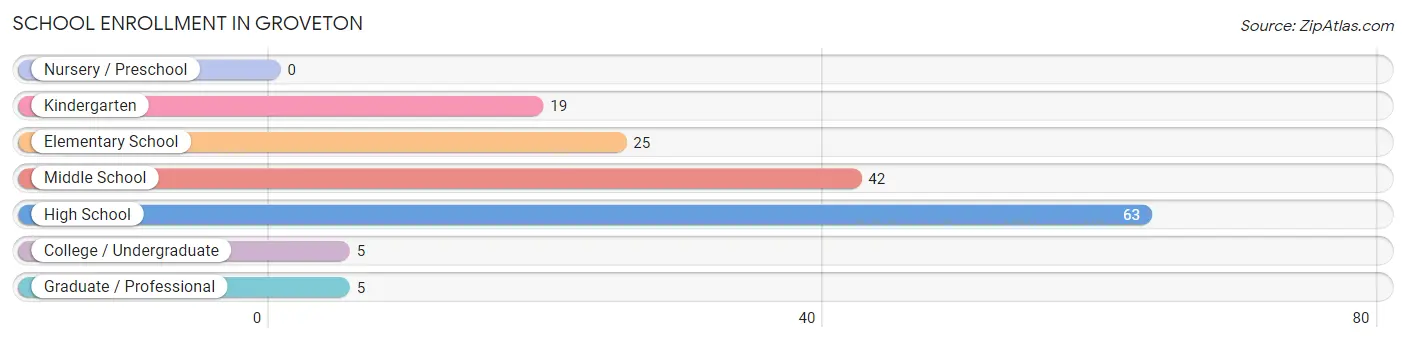
| School Level | # Students | % Students |
| Nursery / Preschool | 0 | 0.0% |
| Kindergarten | 19 | 11.9% |
| Elementary School | 25 | 15.7% |
| Middle School | 42 | 26.4% |
| High School | 63 | 39.6% |
| College / Undergraduate | 5 | 3.1% |
| Graduate / Professional | 5 | 3.1% |
| Total | 159 | 100.0% |
School Enrollment by Age by Funding Source in Groveton
Out of a total of 159 students who are enrolled in schools in Groveton, 17 (10.7%) attend a private institution, while the remaining 142 (89.3%) are enrolled in public schools. The age group of 10 to 14 year olds has the highest likelihood of being enrolled in private schools, with 17 (28.8% in the age bracket) enrolled. Conversely, the age group of 5 to 9 year old has the lowest likelihood of being enrolled in a private school, with 27 (100.0% in the age bracket) attending a public institution.
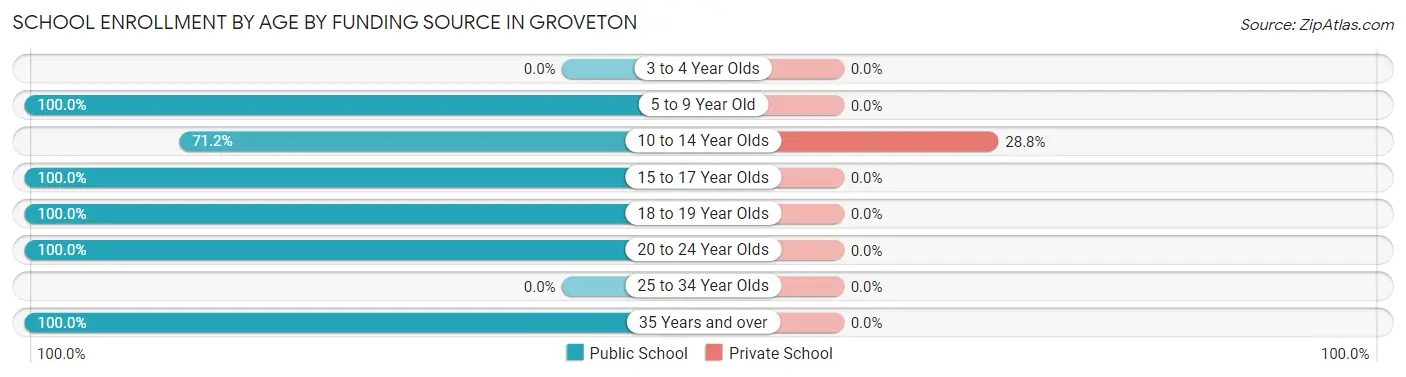
| Age Bracket | Public School | Private School |
| 3 to 4 Year Olds | 0 (0.0%) | 0 (0.0%) |
| 5 to 9 Year Old | 27 (100.0%) | 0 (0.0%) |
| 10 to 14 Year Olds | 42 (71.2%) | 17 (28.8%) |
| 15 to 17 Year Olds | 39 (100.0%) | 0 (0.0%) |
| 18 to 19 Year Olds | 24 (100.0%) | 0 (0.0%) |
| 20 to 24 Year Olds | 5 (100.0%) | 0 (0.0%) |
| 25 to 34 Year Olds | 0 (0.0%) | 0 (0.0%) |
| 35 Years and over | 5 (100.0%) | 0 (0.0%) |
| Total | 142 (89.3%) | 17 (10.7%) |
Educational Attainment by Field of Study in Groveton
Education (54 | 35.3%), social sciences (27 | 17.6%), engineering (27 | 17.6%), arts & humanities (16 | 10.5%), and business (10 | 6.5%) are the most common fields of study among 153 individuals in Groveton who have obtained a bachelor's degree or higher.
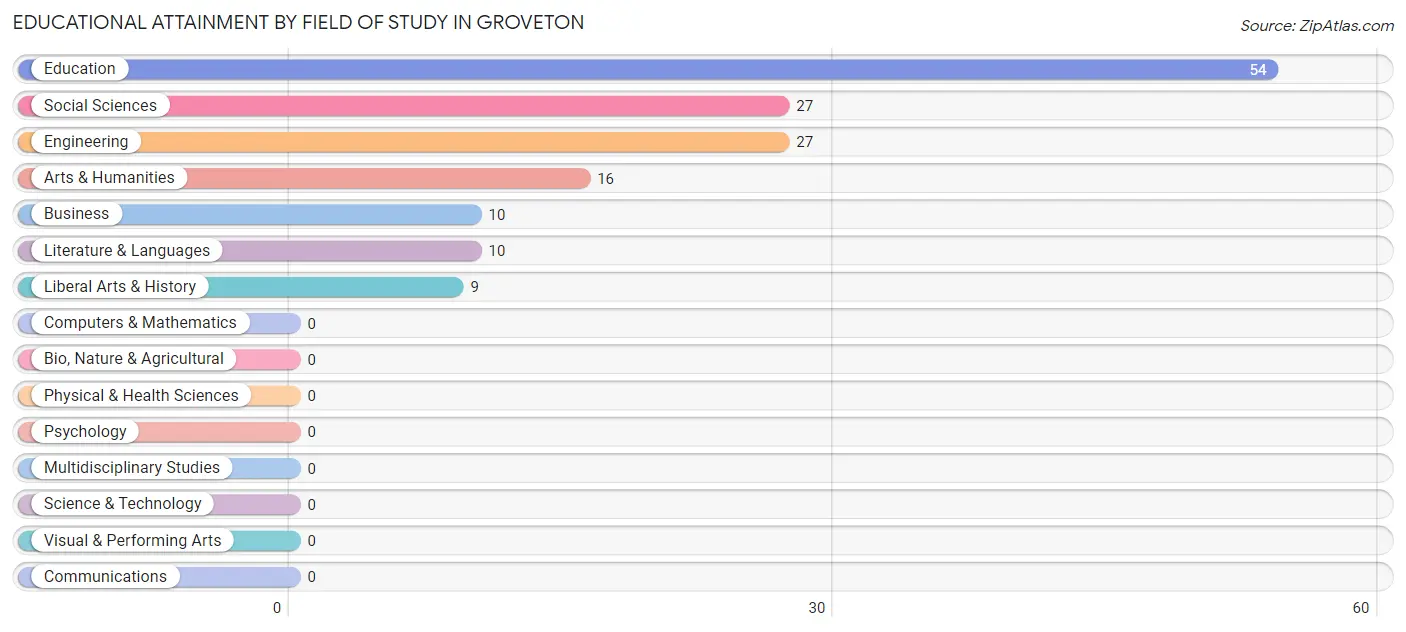
| Field of Study | # Graduates | % Graduates |
| Computers & Mathematics | 0 | 0.0% |
| Bio, Nature & Agricultural | 0 | 0.0% |
| Physical & Health Sciences | 0 | 0.0% |
| Psychology | 0 | 0.0% |
| Social Sciences | 27 | 17.6% |
| Engineering | 27 | 17.6% |
| Multidisciplinary Studies | 0 | 0.0% |
| Science & Technology | 0 | 0.0% |
| Business | 10 | 6.5% |
| Education | 54 | 35.3% |
| Literature & Languages | 10 | 6.5% |
| Liberal Arts & History | 9 | 5.9% |
| Visual & Performing Arts | 0 | 0.0% |
| Communications | 0 | 0.0% |
| Arts & Humanities | 16 | 10.5% |
| Total | 153 | 100.0% |
Transportation & Commute in Groveton
Vehicle Availability by Sex in Groveton
The most prevalent vehicle ownership categories in Groveton are males with 2 vehicles (86, accounting for 50.0%) and females with 2 vehicles (54, making up 69.4%).
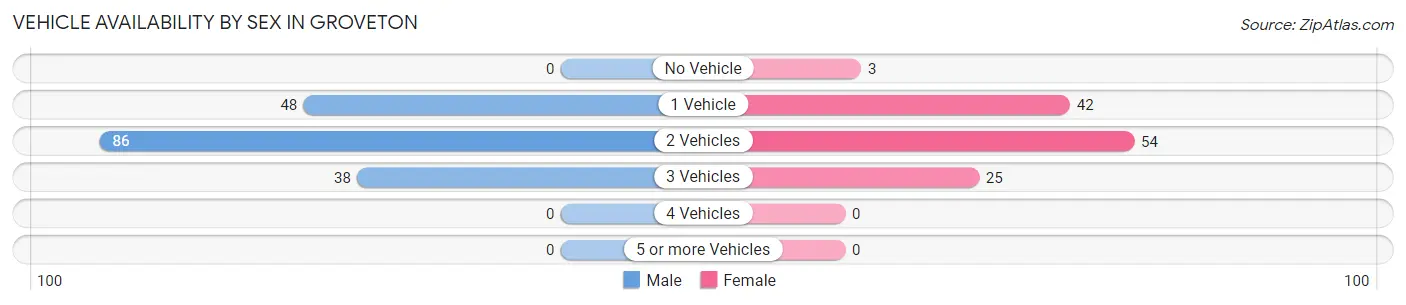
| Vehicles Available | Male | Female |
| No Vehicle | 0 (0.0%) | 3 (2.4%) |
| 1 Vehicle | 48 (27.9%) | 42 (33.9%) |
| 2 Vehicles | 86 (50.0%) | 54 (43.5%) |
| 3 Vehicles | 38 (22.1%) | 25 (20.2%) |
| 4 Vehicles | 0 (0.0%) | 0 (0.0%) |
| 5 or more Vehicles | 0 (0.0%) | 0 (0.0%) |
| Total | 172 (100.0%) | 124 (100.0%) |
Commute Time in Groveton
The most frequently occuring commute durations in Groveton are less than 5 minutes (69 commuters, 25.8%), 20 to 24 minutes (66 commuters, 24.7%), and 30 to 34 minutes (38 commuters, 14.2%).
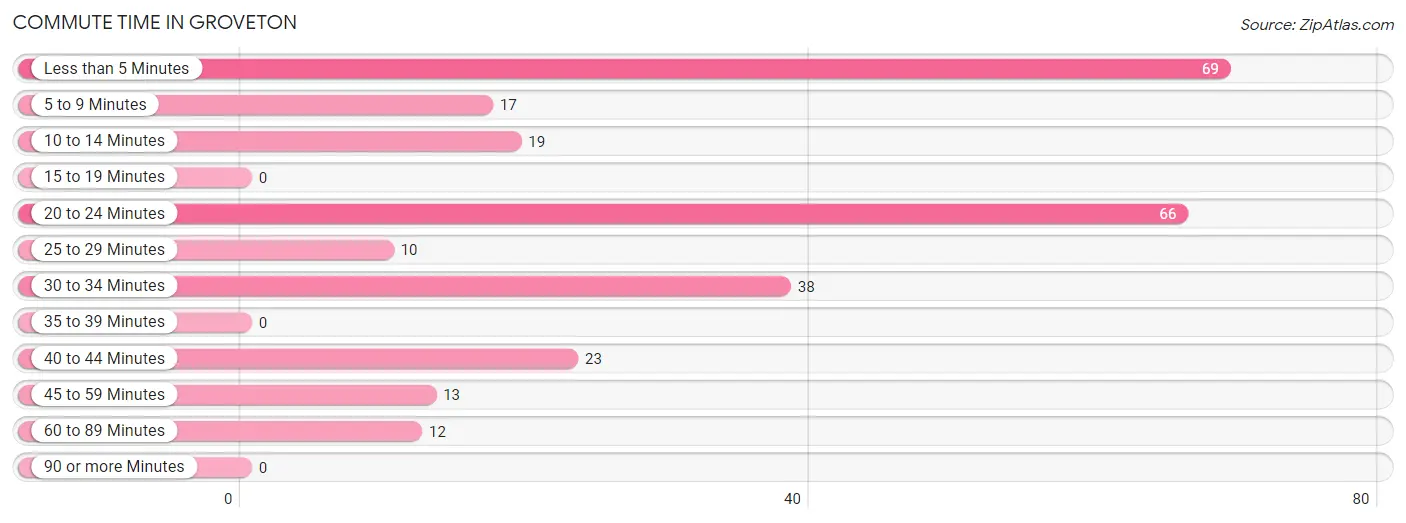
| Commute Time | # Commuters | % Commuters |
| Less than 5 Minutes | 69 | 25.8% |
| 5 to 9 Minutes | 17 | 6.4% |
| 10 to 14 Minutes | 19 | 7.1% |
| 15 to 19 Minutes | 0 | 0.0% |
| 20 to 24 Minutes | 66 | 24.7% |
| 25 to 29 Minutes | 10 | 3.7% |
| 30 to 34 Minutes | 38 | 14.2% |
| 35 to 39 Minutes | 0 | 0.0% |
| 40 to 44 Minutes | 23 | 8.6% |
| 45 to 59 Minutes | 13 | 4.9% |
| 60 to 89 Minutes | 12 | 4.5% |
| 90 or more Minutes | 0 | 0.0% |
Commute Time by Sex in Groveton
The most common commute times in Groveton are 20 to 24 minutes (66 commuters, 44.3%) for males and less than 5 minutes (69 commuters, 58.5%) for females.
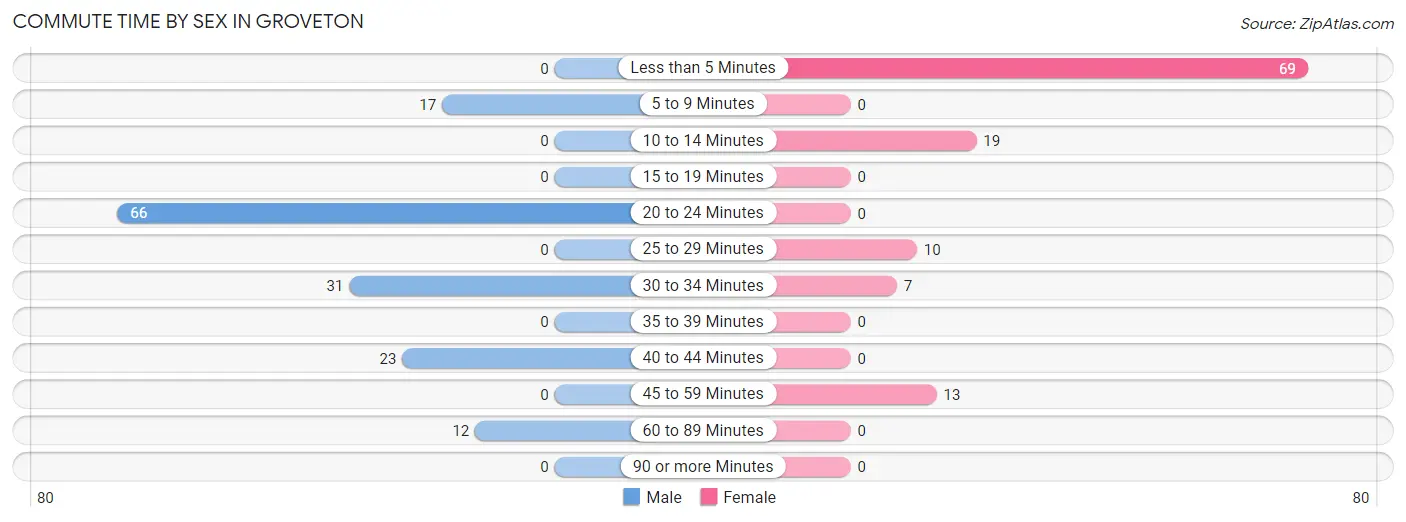
| Commute Time | Male | Female |
| Less than 5 Minutes | 0 (0.0%) | 69 (58.5%) |
| 5 to 9 Minutes | 17 (11.4%) | 0 (0.0%) |
| 10 to 14 Minutes | 0 (0.0%) | 19 (16.1%) |
| 15 to 19 Minutes | 0 (0.0%) | 0 (0.0%) |
| 20 to 24 Minutes | 66 (44.3%) | 0 (0.0%) |
| 25 to 29 Minutes | 0 (0.0%) | 10 (8.5%) |
| 30 to 34 Minutes | 31 (20.8%) | 7 (5.9%) |
| 35 to 39 Minutes | 0 (0.0%) | 0 (0.0%) |
| 40 to 44 Minutes | 23 (15.4%) | 0 (0.0%) |
| 45 to 59 Minutes | 0 (0.0%) | 13 (11.0%) |
| 60 to 89 Minutes | 12 (8.1%) | 0 (0.0%) |
| 90 or more Minutes | 0 (0.0%) | 0 (0.0%) |
Time of Departure to Work by Sex in Groveton
The most frequent times of departure to work in Groveton are 5:30 AM to 5:59 AM (42, 28.2%) for males and 6:00 AM to 6:29 AM (41, 34.7%) for females.
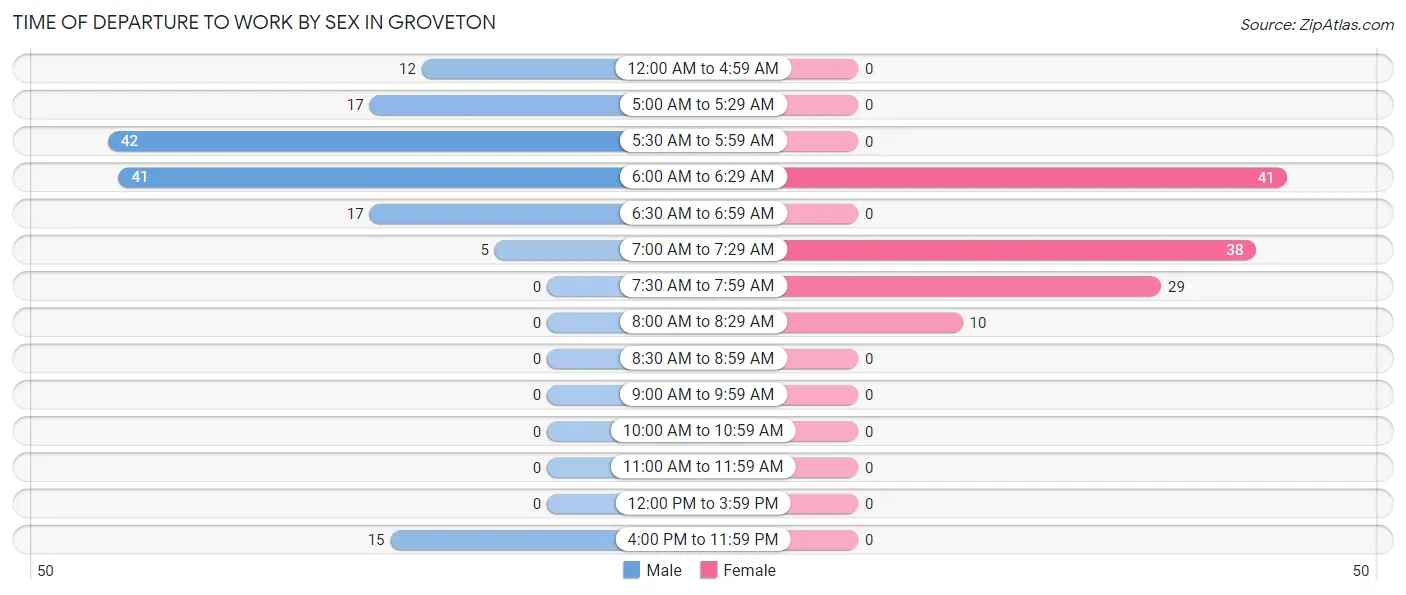
| Time of Departure | Male | Female |
| 12:00 AM to 4:59 AM | 12 (8.1%) | 0 (0.0%) |
| 5:00 AM to 5:29 AM | 17 (11.4%) | 0 (0.0%) |
| 5:30 AM to 5:59 AM | 42 (28.2%) | 0 (0.0%) |
| 6:00 AM to 6:29 AM | 41 (27.5%) | 41 (34.7%) |
| 6:30 AM to 6:59 AM | 17 (11.4%) | 0 (0.0%) |
| 7:00 AM to 7:29 AM | 5 (3.4%) | 38 (32.2%) |
| 7:30 AM to 7:59 AM | 0 (0.0%) | 29 (24.6%) |
| 8:00 AM to 8:29 AM | 0 (0.0%) | 10 (8.5%) |
| 8:30 AM to 8:59 AM | 0 (0.0%) | 0 (0.0%) |
| 9:00 AM to 9:59 AM | 0 (0.0%) | 0 (0.0%) |
| 10:00 AM to 10:59 AM | 0 (0.0%) | 0 (0.0%) |
| 11:00 AM to 11:59 AM | 0 (0.0%) | 0 (0.0%) |
| 12:00 PM to 3:59 PM | 0 (0.0%) | 0 (0.0%) |
| 4:00 PM to 11:59 PM | 15 (10.1%) | 0 (0.0%) |
| Total | 149 (100.0%) | 118 (100.0%) |
Housing Occupancy in Groveton
Occupancy by Ownership in Groveton
Of the total 432 dwellings in Groveton, owner-occupied units account for 288 (66.7%), while renter-occupied units make up 144 (33.3%).
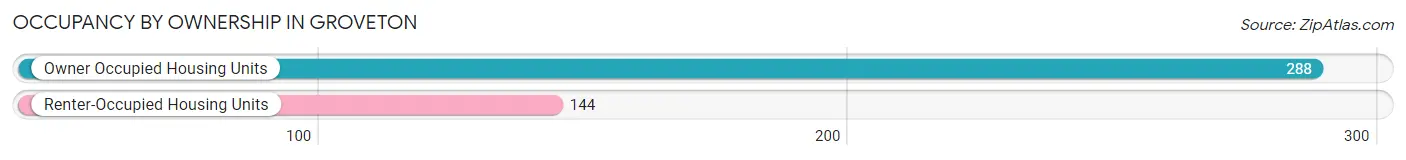
| Occupancy | # Housing Units | % Housing Units |
| Owner Occupied Housing Units | 288 | 66.7% |
| Renter-Occupied Housing Units | 144 | 33.3% |
| Total Occupied Housing Units | 432 | 100.0% |
Occupancy by Household Size in Groveton
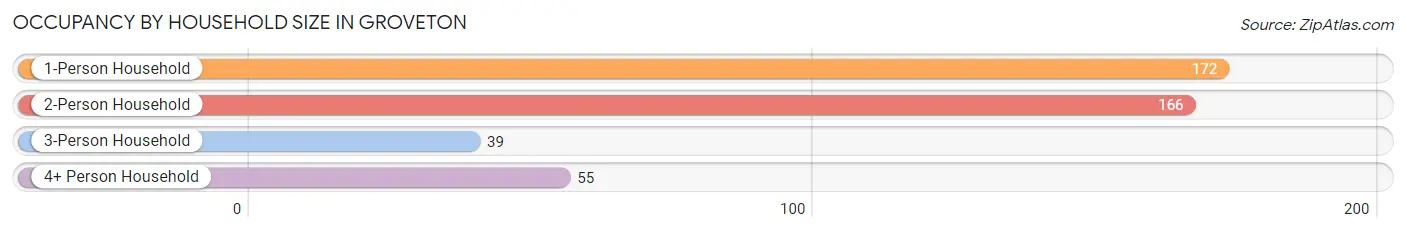
| Household Size | # Housing Units | % Housing Units |
| 1-Person Household | 172 | 39.8% |
| 2-Person Household | 166 | 38.4% |
| 3-Person Household | 39 | 9.0% |
| 4+ Person Household | 55 | 12.7% |
| Total Housing Units | 432 | 100.0% |
Occupancy by Ownership by Household Size in Groveton
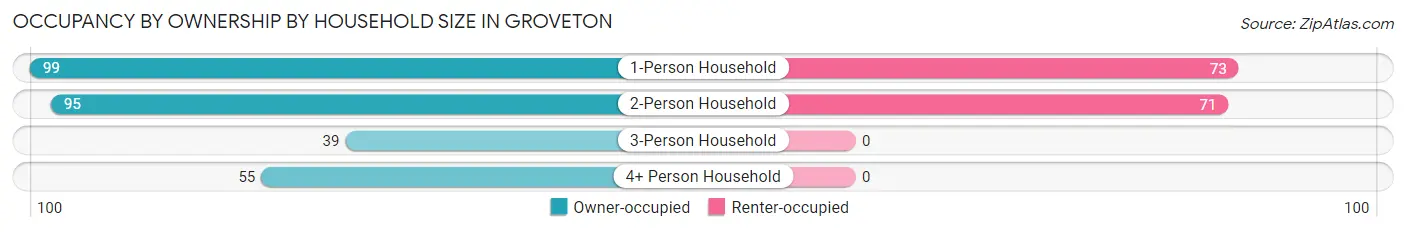
| Household Size | Owner-occupied | Renter-occupied |
| 1-Person Household | 99 (57.6%) | 73 (42.4%) |
| 2-Person Household | 95 (57.2%) | 71 (42.8%) |
| 3-Person Household | 39 (100.0%) | 0 (0.0%) |
| 4+ Person Household | 55 (100.0%) | 0 (0.0%) |
| Total Housing Units | 288 (66.7%) | 144 (33.3%) |
Occupancy by Educational Attainment in Groveton
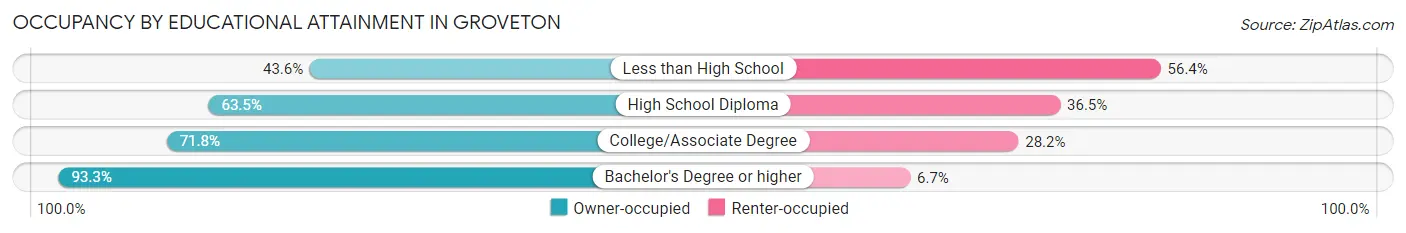
| Household Size | Owner-occupied | Renter-occupied |
| Less than High School | 58 (43.6%) | 75 (56.4%) |
| High School Diploma | 54 (63.5%) | 31 (36.5%) |
| College/Associate Degree | 79 (71.8%) | 31 (28.2%) |
| Bachelor's Degree or higher | 97 (93.3%) | 7 (6.7%) |
Occupancy by Age of Householder in Groveton
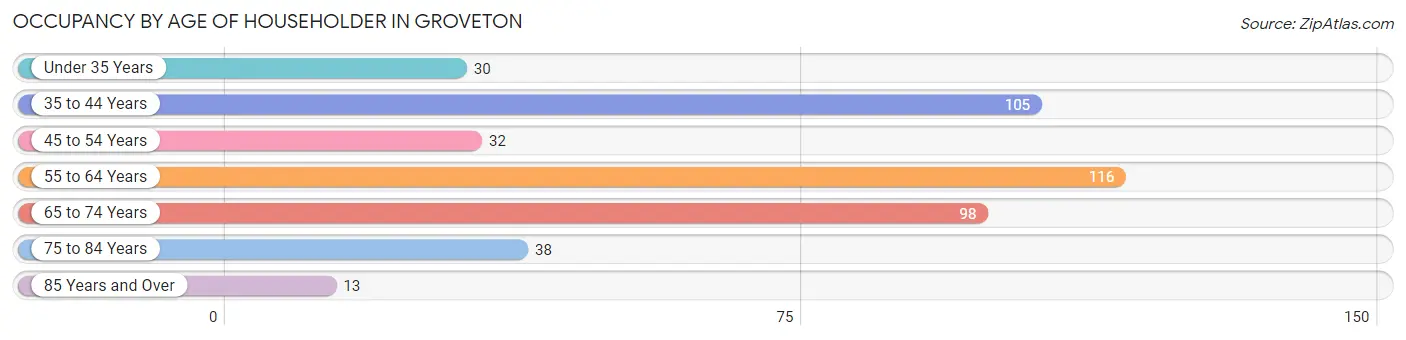
| Age Bracket | # Households | % Households |
| Under 35 Years | 30 | 6.9% |
| 35 to 44 Years | 105 | 24.3% |
| 45 to 54 Years | 32 | 7.4% |
| 55 to 64 Years | 116 | 26.9% |
| 65 to 74 Years | 98 | 22.7% |
| 75 to 84 Years | 38 | 8.8% |
| 85 Years and Over | 13 | 3.0% |
| Total | 432 | 100.0% |
Housing Finances in Groveton
Median Income by Occupancy in Groveton
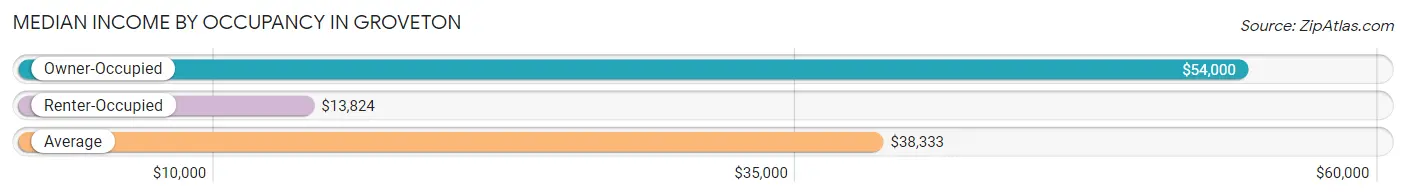
| Occupancy Type | # Households | Median Income |
| Owner-Occupied | 288 (66.7%) | $54,000 |
| Renter-Occupied | 144 (33.3%) | $13,824 |
| Average | 432 (100.0%) | $38,333 |
Occupancy by Householder Income Bracket in Groveton
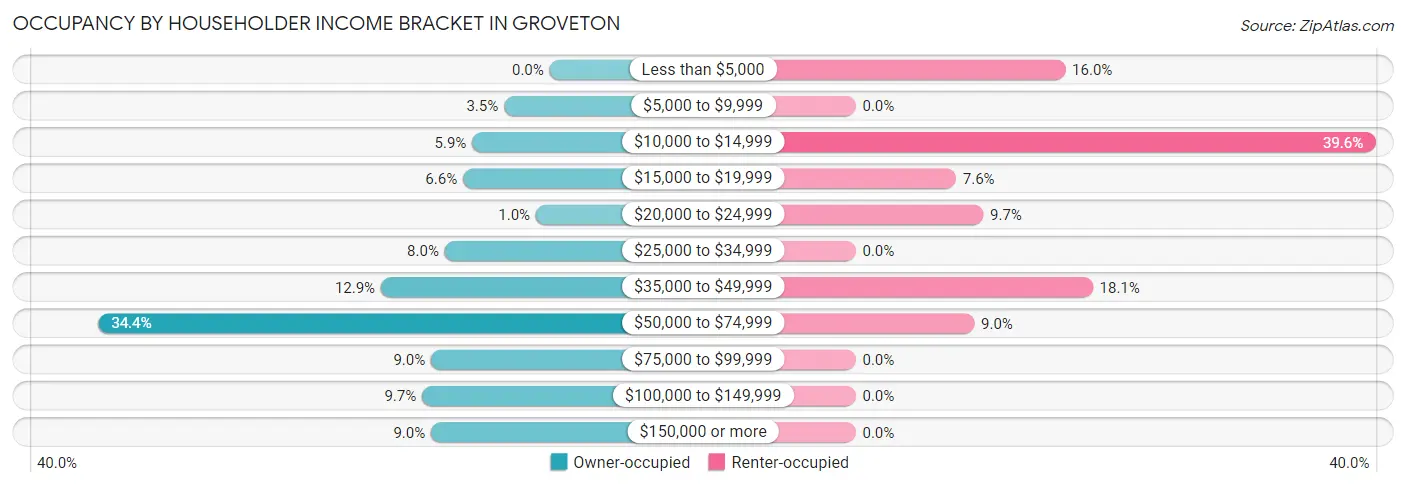
| Income Bracket | Owner-occupied | Renter-occupied |
| Less than $5,000 | 0 (0.0%) | 23 (16.0%) |
| $5,000 to $9,999 | 10 (3.5%) | 0 (0.0%) |
| $10,000 to $14,999 | 17 (5.9%) | 57 (39.6%) |
| $15,000 to $19,999 | 19 (6.6%) | 11 (7.6%) |
| $20,000 to $24,999 | 3 (1.0%) | 14 (9.7%) |
| $25,000 to $34,999 | 23 (8.0%) | 0 (0.0%) |
| $35,000 to $49,999 | 37 (12.9%) | 26 (18.1%) |
| $50,000 to $74,999 | 99 (34.4%) | 13 (9.0%) |
| $75,000 to $99,999 | 26 (9.0%) | 0 (0.0%) |
| $100,000 to $149,999 | 28 (9.7%) | 0 (0.0%) |
| $150,000 or more | 26 (9.0%) | 0 (0.0%) |
| Total | 288 (100.0%) | 144 (100.0%) |
Monthly Housing Cost Tiers in Groveton
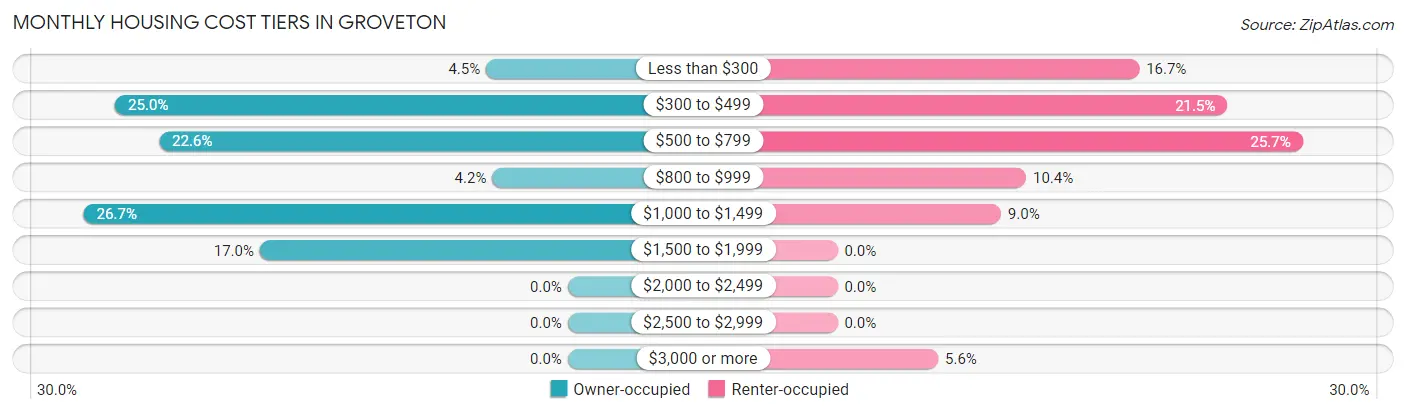
| Monthly Cost | Owner-occupied | Renter-occupied |
| Less than $300 | 13 (4.5%) | 24 (16.7%) |
| $300 to $499 | 72 (25.0%) | 31 (21.5%) |
| $500 to $799 | 65 (22.6%) | 37 (25.7%) |
| $800 to $999 | 12 (4.2%) | 15 (10.4%) |
| $1,000 to $1,499 | 77 (26.7%) | 13 (9.0%) |
| $1,500 to $1,999 | 49 (17.0%) | 0 (0.0%) |
| $2,000 to $2,499 | 0 (0.0%) | 0 (0.0%) |
| $2,500 to $2,999 | 0 (0.0%) | 0 (0.0%) |
| $3,000 or more | 0 (0.0%) | 8 (5.6%) |
| Total | 288 (100.0%) | 144 (100.0%) |
Physical Housing Characteristics in Groveton
Housing Structures in Groveton
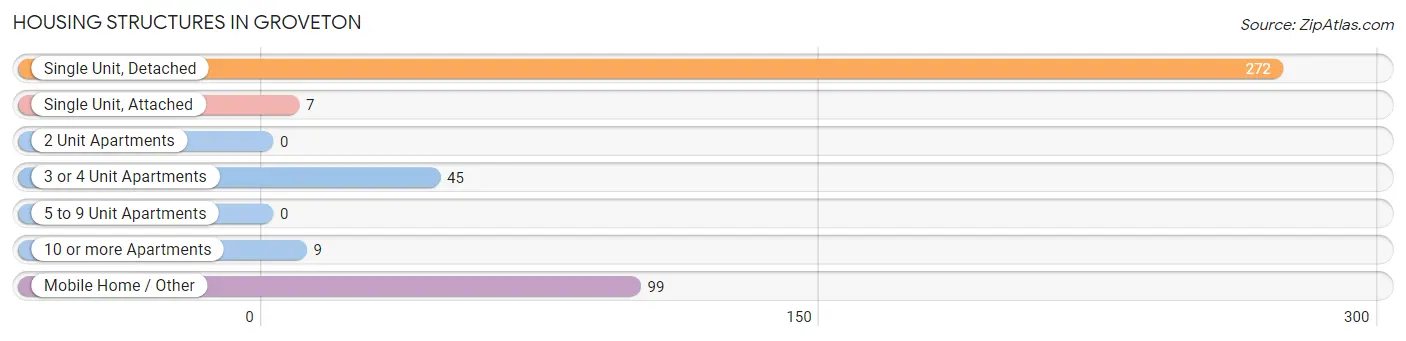
| Structure Type | # Housing Units | % Housing Units |
| Single Unit, Detached | 272 | 63.0% |
| Single Unit, Attached | 7 | 1.6% |
| 2 Unit Apartments | 0 | 0.0% |
| 3 or 4 Unit Apartments | 45 | 10.4% |
| 5 to 9 Unit Apartments | 0 | 0.0% |
| 10 or more Apartments | 9 | 2.1% |
| Mobile Home / Other | 99 | 22.9% |
| Total | 432 | 100.0% |
Housing Structures by Occupancy in Groveton
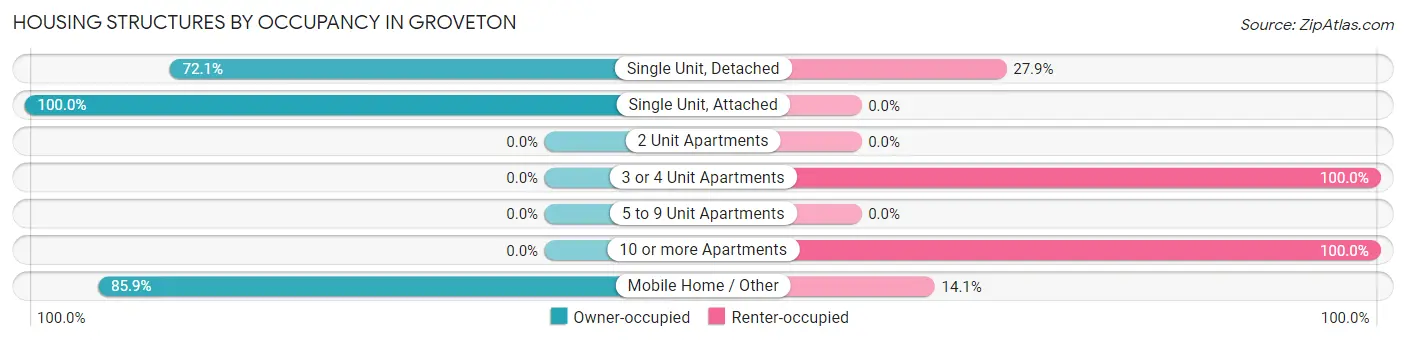
| Structure Type | Owner-occupied | Renter-occupied |
| Single Unit, Detached | 196 (72.1%) | 76 (27.9%) |
| Single Unit, Attached | 7 (100.0%) | 0 (0.0%) |
| 2 Unit Apartments | 0 (0.0%) | 0 (0.0%) |
| 3 or 4 Unit Apartments | 0 (0.0%) | 45 (100.0%) |
| 5 to 9 Unit Apartments | 0 (0.0%) | 0 (0.0%) |
| 10 or more Apartments | 0 (0.0%) | 9 (100.0%) |
| Mobile Home / Other | 85 (85.9%) | 14 (14.1%) |
| Total | 288 (66.7%) | 144 (33.3%) |
Housing Structures by Number of Rooms in Groveton
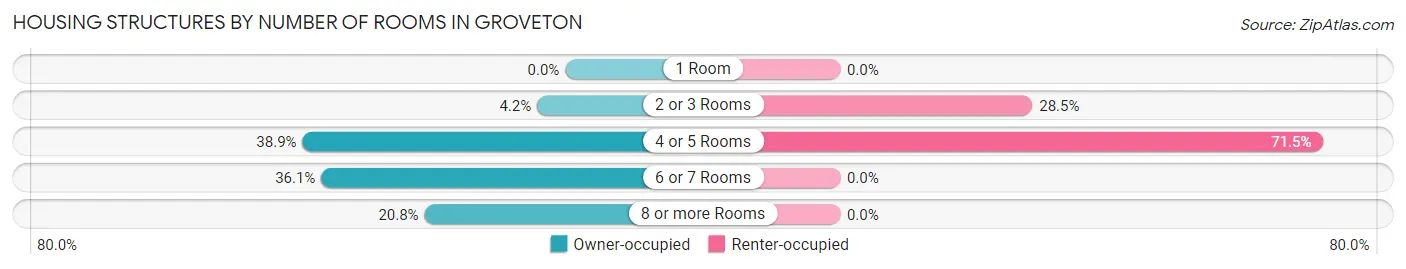
| Number of Rooms | Owner-occupied | Renter-occupied |
| 1 Room | 0 (0.0%) | 0 (0.0%) |
| 2 or 3 Rooms | 12 (4.2%) | 41 (28.5%) |
| 4 or 5 Rooms | 112 (38.9%) | 103 (71.5%) |
| 6 or 7 Rooms | 104 (36.1%) | 0 (0.0%) |
| 8 or more Rooms | 60 (20.8%) | 0 (0.0%) |
| Total | 288 (100.0%) | 144 (100.0%) |
Housing Structure by Heating Type in Groveton
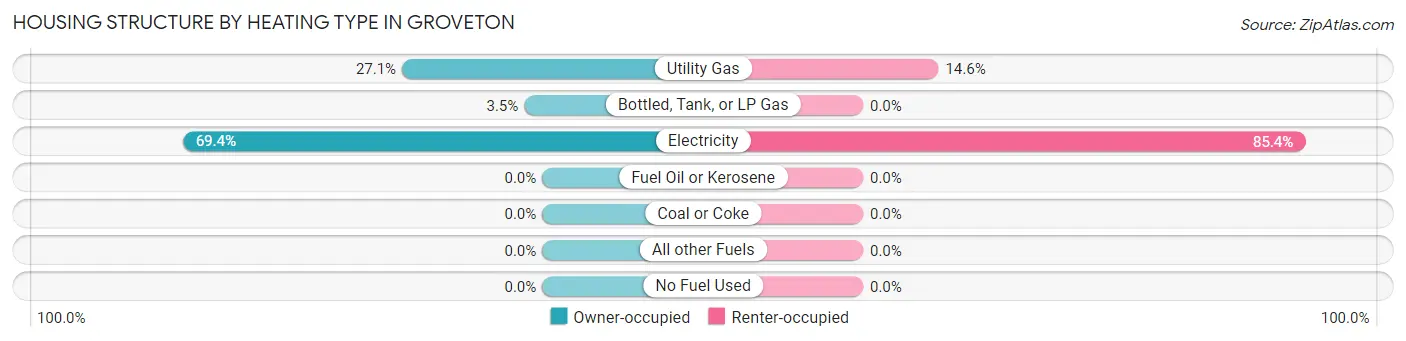
| Heating Type | Owner-occupied | Renter-occupied |
| Utility Gas | 78 (27.1%) | 21 (14.6%) |
| Bottled, Tank, or LP Gas | 10 (3.5%) | 0 (0.0%) |
| Electricity | 200 (69.4%) | 123 (85.4%) |
| Fuel Oil or Kerosene | 0 (0.0%) | 0 (0.0%) |
| Coal or Coke | 0 (0.0%) | 0 (0.0%) |
| All other Fuels | 0 (0.0%) | 0 (0.0%) |
| No Fuel Used | 0 (0.0%) | 0 (0.0%) |
| Total | 288 (100.0%) | 144 (100.0%) |
Household Vehicle Usage in Groveton
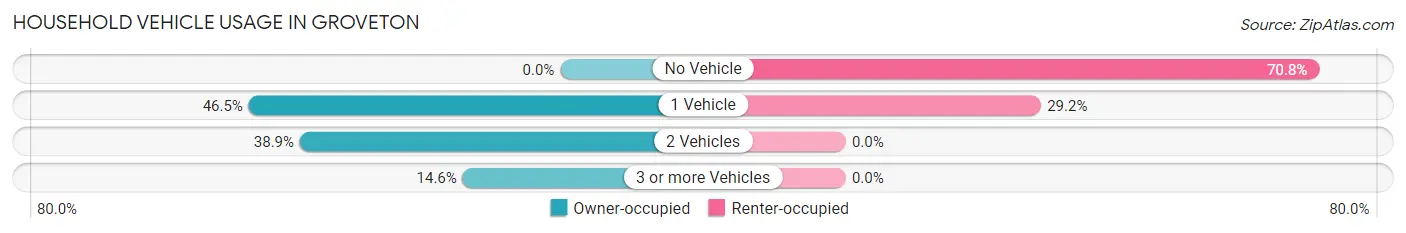
| Vehicles per Household | Owner-occupied | Renter-occupied |
| No Vehicle | 0 (0.0%) | 102 (70.8%) |
| 1 Vehicle | 134 (46.5%) | 42 (29.2%) |
| 2 Vehicles | 112 (38.9%) | 0 (0.0%) |
| 3 or more Vehicles | 42 (14.6%) | 0 (0.0%) |
| Total | 288 (100.0%) | 144 (100.0%) |
Real Estate & Mortgages in Groveton
Real Estate and Mortgage Overview in Groveton
| Characteristic | Without Mortgage | With Mortgage |
| Housing Units | 147 | 141 |
| Median Property Value | $72,600 | $79,500 |
| Median Household Income | $52,212 | $26 |
| Monthly Housing Costs | $445 | $0 |
| Real Estate Taxes | $1,296 | $7 |
Property Value by Mortgage Status in Groveton
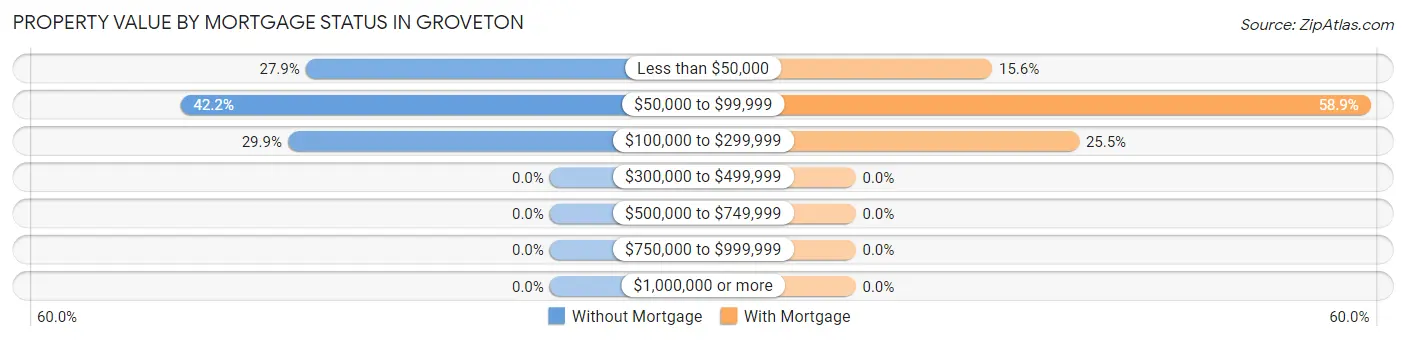
| Property Value | Without Mortgage | With Mortgage |
| Less than $50,000 | 41 (27.9%) | 22 (15.6%) |
| $50,000 to $99,999 | 62 (42.2%) | 83 (58.9%) |
| $100,000 to $299,999 | 44 (29.9%) | 36 (25.5%) |
| $300,000 to $499,999 | 0 (0.0%) | 0 (0.0%) |
| $500,000 to $749,999 | 0 (0.0%) | 0 (0.0%) |
| $750,000 to $999,999 | 0 (0.0%) | 0 (0.0%) |
| $1,000,000 or more | 0 (0.0%) | 0 (0.0%) |
| Total | 147 (100.0%) | 141 (100.0%) |
Household Income by Mortgage Status in Groveton
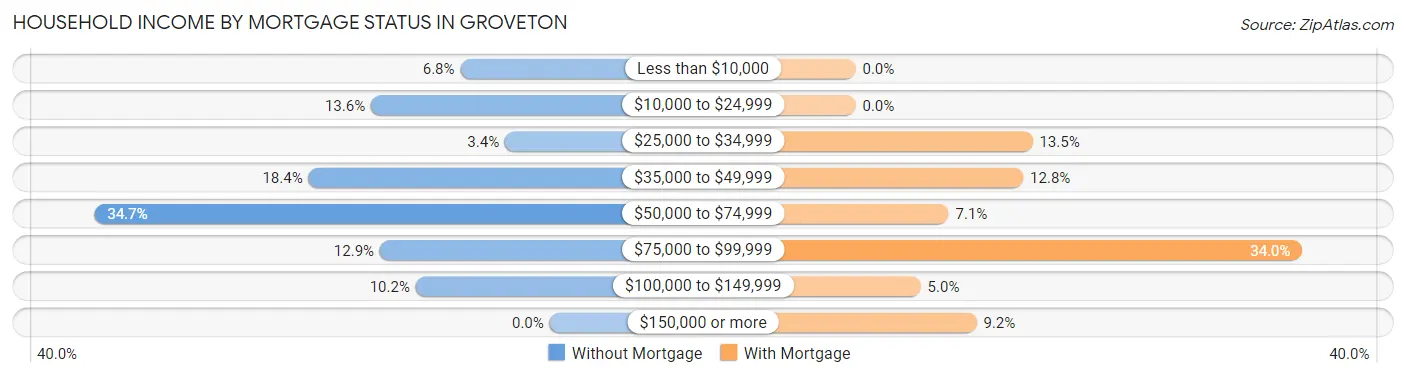
| Household Income | Without Mortgage | With Mortgage |
| Less than $10,000 | 10 (6.8%) | 0 (0.0%) |
| $10,000 to $24,999 | 20 (13.6%) | 0 (0.0%) |
| $25,000 to $34,999 | 5 (3.4%) | 19 (13.5%) |
| $35,000 to $49,999 | 27 (18.4%) | 18 (12.8%) |
| $50,000 to $74,999 | 51 (34.7%) | 10 (7.1%) |
| $75,000 to $99,999 | 19 (12.9%) | 48 (34.0%) |
| $100,000 to $149,999 | 15 (10.2%) | 7 (5.0%) |
| $150,000 or more | 0 (0.0%) | 13 (9.2%) |
| Total | 147 (100.0%) | 141 (100.0%) |
Property Value to Household Income Ratio in Groveton
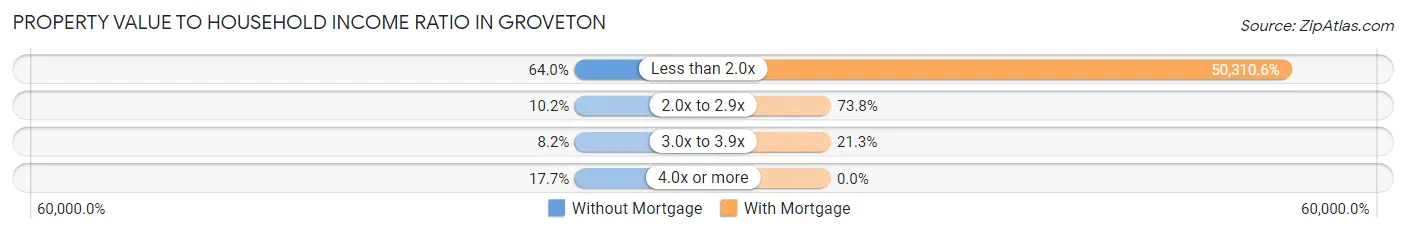
| Value-to-Income Ratio | Without Mortgage | With Mortgage |
| Less than 2.0x | 94 (63.9%) | 70,938 (50,310.6%) |
| 2.0x to 2.9x | 15 (10.2%) | 104 (73.8%) |
| 3.0x to 3.9x | 12 (8.2%) | 30 (21.3%) |
| 4.0x or more | 26 (17.7%) | 0 (0.0%) |
| Total | 147 (100.0%) | 141 (100.0%) |
Real Estate Taxes by Mortgage Status in Groveton
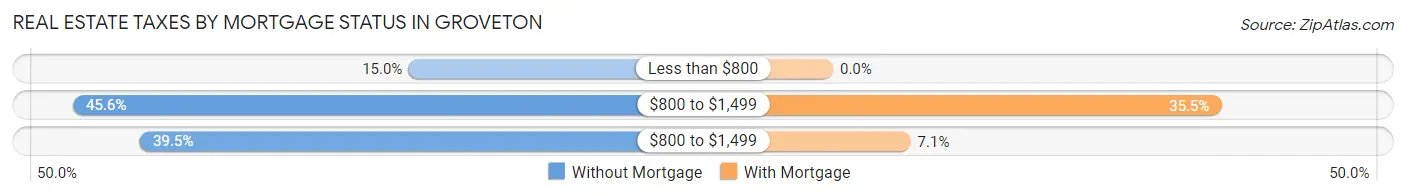
| Property Taxes | Without Mortgage | With Mortgage |
| Less than $800 | 22 (15.0%) | 0 (0.0%) |
| $800 to $1,499 | 67 (45.6%) | 50 (35.5%) |
| $800 to $1,499 | 58 (39.5%) | 10 (7.1%) |
| Total | 147 (100.0%) | 141 (100.0%) |
Health & Disability in Groveton
Health Insurance Coverage by Age in Groveton
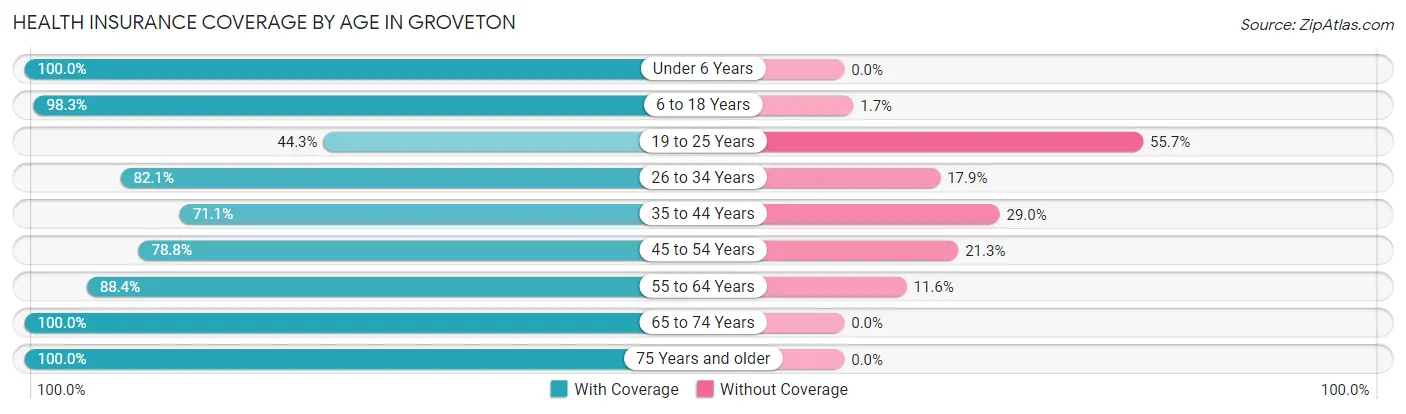
| Age Bracket | With Coverage | Without Coverage |
| Under 6 Years | 4 (100.0%) | 0 (0.0%) |
| 6 to 18 Years | 174 (98.3%) | 3 (1.7%) |
| 19 to 25 Years | 31 (44.3%) | 39 (55.7%) |
| 26 to 34 Years | 78 (82.1%) | 17 (17.9%) |
| 35 to 44 Years | 108 (71.1%) | 44 (28.9%) |
| 45 to 54 Years | 63 (78.7%) | 17 (21.2%) |
| 55 to 64 Years | 137 (88.4%) | 18 (11.6%) |
| 65 to 74 Years | 126 (100.0%) | 0 (0.0%) |
| 75 Years and older | 59 (100.0%) | 0 (0.0%) |
| Total | 780 (85.0%) | 138 (15.0%) |
Health Insurance Coverage by Citizenship Status in Groveton
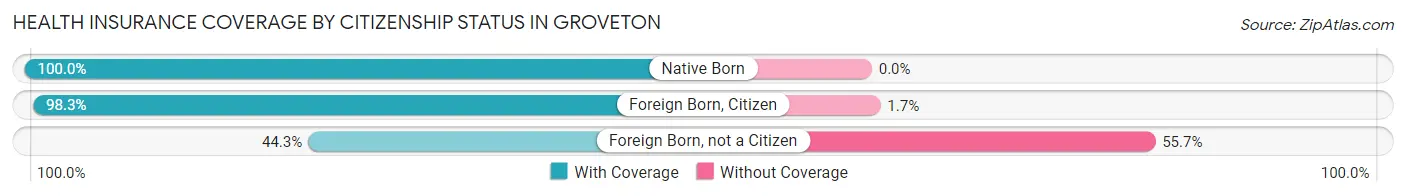
| Citizenship Status | With Coverage | Without Coverage |
| Native Born | 4 (100.0%) | 0 (0.0%) |
| Foreign Born, Citizen | 174 (98.3%) | 3 (1.7%) |
| Foreign Born, not a Citizen | 31 (44.3%) | 39 (55.7%) |
Health Insurance Coverage by Household Income in Groveton
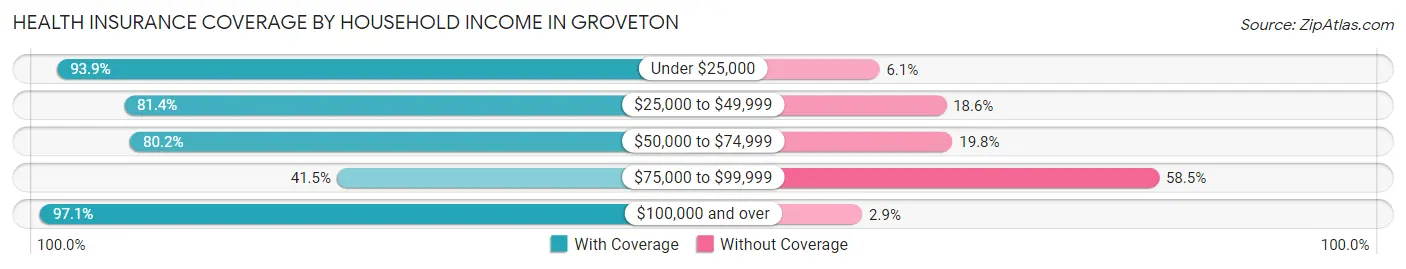
| Household Income | With Coverage | Without Coverage |
| Under $25,000 | 184 (93.9%) | 12 (6.1%) |
| $25,000 to $49,999 | 153 (81.4%) | 35 (18.6%) |
| $50,000 to $74,999 | 219 (80.2%) | 54 (19.8%) |
| $75,000 to $99,999 | 22 (41.5%) | 31 (58.5%) |
| $100,000 and over | 202 (97.1%) | 6 (2.9%) |
Public vs Private Health Insurance Coverage by Age in Groveton
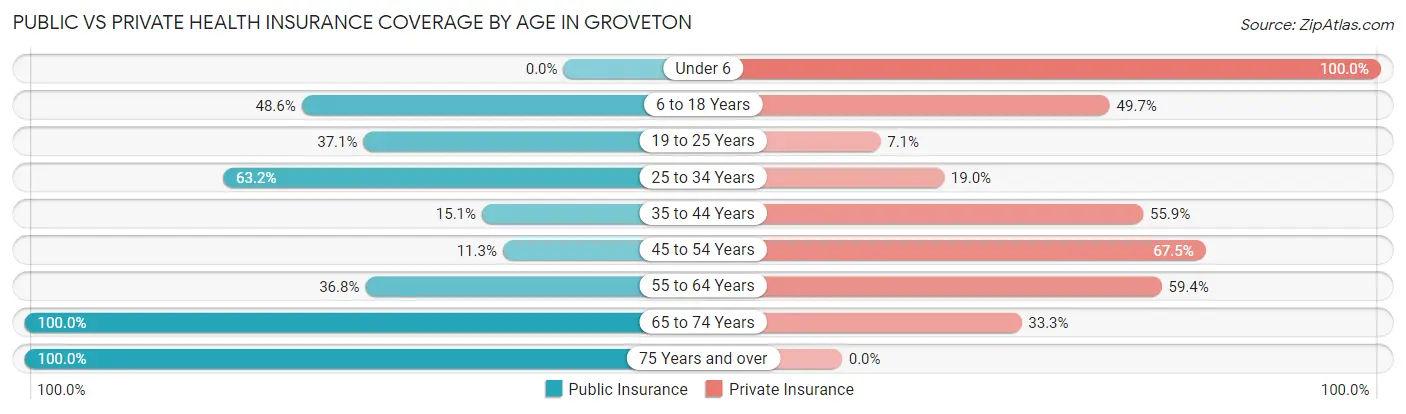
| Age Bracket | Public Insurance | Private Insurance |
| Under 6 | 0 (0.0%) | 4 (100.0%) |
| 6 to 18 Years | 86 (48.6%) | 88 (49.7%) |
| 19 to 25 Years | 26 (37.1%) | 5 (7.1%) |
| 25 to 34 Years | 60 (63.2%) | 18 (19.0%) |
| 35 to 44 Years | 23 (15.1%) | 85 (55.9%) |
| 45 to 54 Years | 9 (11.3%) | 54 (67.5%) |
| 55 to 64 Years | 57 (36.8%) | 92 (59.4%) |
| 65 to 74 Years | 126 (100.0%) | 42 (33.3%) |
| 75 Years and over | 59 (100.0%) | 0 (0.0%) |
| Total | 446 (48.6%) | 388 (42.3%) |
Disability Status by Sex by Age in Groveton
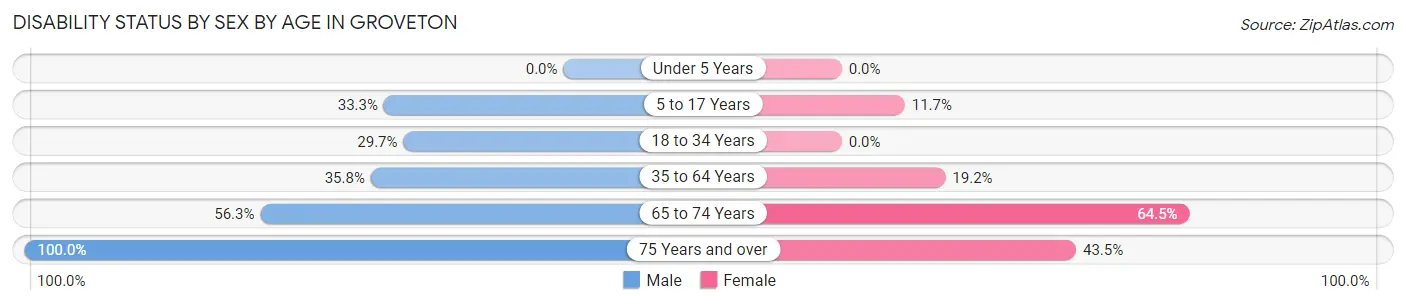
| Age Bracket | Male | Female |
| Under 5 Years | 0 (0.0%) | 0 (0.0%) |
| 5 to 17 Years | 17 (33.3%) | 9 (11.7%) |
| 18 to 34 Years | 30 (29.7%) | 0 (0.0%) |
| 35 to 64 Years | 64 (35.7%) | 40 (19.2%) |
| 65 to 74 Years | 36 (56.2%) | 40 (64.5%) |
| 75 Years and over | 13 (100.0%) | 20 (43.5%) |
Disability Class by Sex by Age in Groveton
Disability Class: Hearing Difficulty
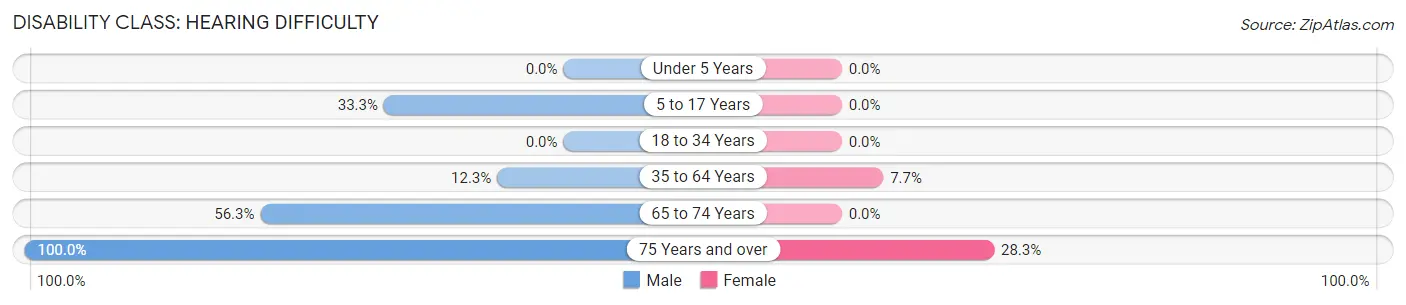
| Age Bracket | Male | Female |
| Under 5 Years | 0 (0.0%) | 0 (0.0%) |
| 5 to 17 Years | 17 (33.3%) | 0 (0.0%) |
| 18 to 34 Years | 0 (0.0%) | 0 (0.0%) |
| 35 to 64 Years | 22 (12.3%) | 16 (7.7%) |
| 65 to 74 Years | 36 (56.2%) | 0 (0.0%) |
| 75 Years and over | 13 (100.0%) | 13 (28.3%) |
Disability Class: Vision Difficulty
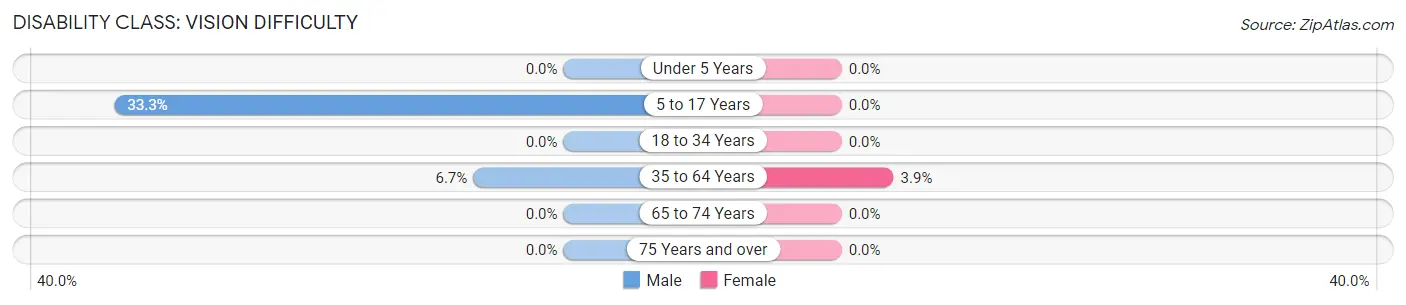
| Age Bracket | Male | Female |
| Under 5 Years | 0 (0.0%) | 0 (0.0%) |
| 5 to 17 Years | 17 (33.3%) | 0 (0.0%) |
| 18 to 34 Years | 0 (0.0%) | 0 (0.0%) |
| 35 to 64 Years | 12 (6.7%) | 8 (3.8%) |
| 65 to 74 Years | 0 (0.0%) | 0 (0.0%) |
| 75 Years and over | 0 (0.0%) | 0 (0.0%) |
Disability Class: Cognitive Difficulty
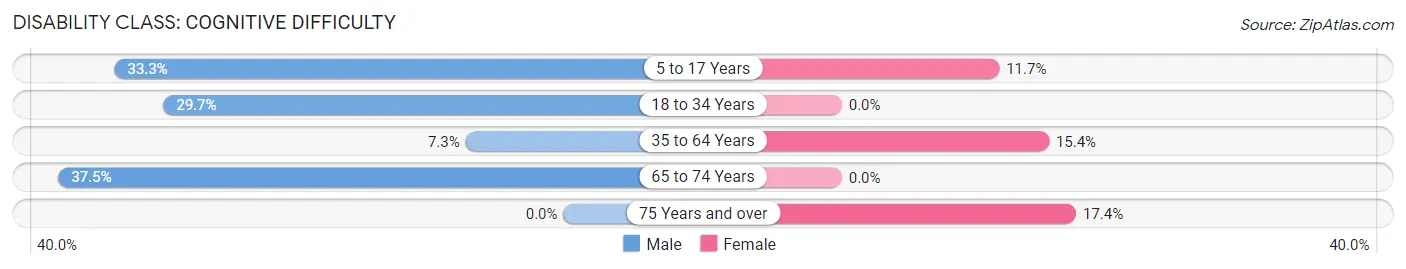
| Age Bracket | Male | Female |
| 5 to 17 Years | 17 (33.3%) | 9 (11.7%) |
| 18 to 34 Years | 30 (29.7%) | 0 (0.0%) |
| 35 to 64 Years | 13 (7.3%) | 32 (15.4%) |
| 65 to 74 Years | 24 (37.5%) | 0 (0.0%) |
| 75 Years and over | 0 (0.0%) | 8 (17.4%) |
Disability Class: Ambulatory Difficulty
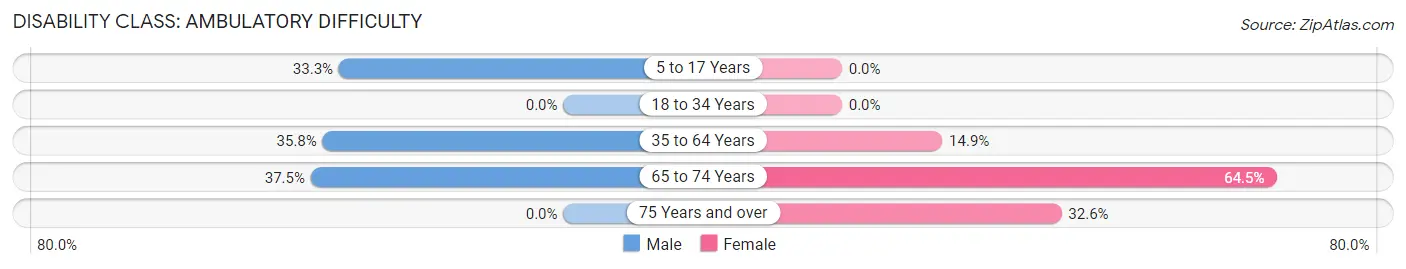
| Age Bracket | Male | Female |
| 5 to 17 Years | 17 (33.3%) | 0 (0.0%) |
| 18 to 34 Years | 0 (0.0%) | 0 (0.0%) |
| 35 to 64 Years | 64 (35.7%) | 31 (14.9%) |
| 65 to 74 Years | 24 (37.5%) | 40 (64.5%) |
| 75 Years and over | 0 (0.0%) | 15 (32.6%) |
Disability Class: Self-Care Difficulty
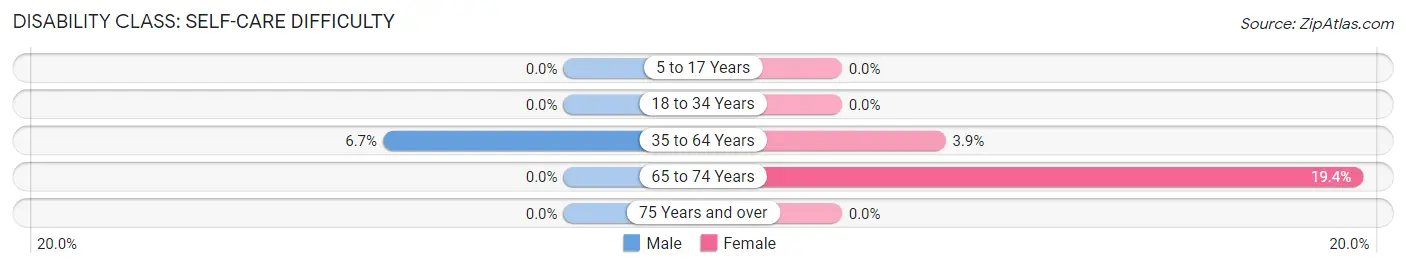
| Age Bracket | Male | Female |
| 5 to 17 Years | 0 (0.0%) | 0 (0.0%) |
| 18 to 34 Years | 0 (0.0%) | 0 (0.0%) |
| 35 to 64 Years | 12 (6.7%) | 8 (3.8%) |
| 65 to 74 Years | 0 (0.0%) | 12 (19.4%) |
| 75 Years and over | 0 (0.0%) | 0 (0.0%) |
Technology Access in Groveton
Computing Device Access in Groveton
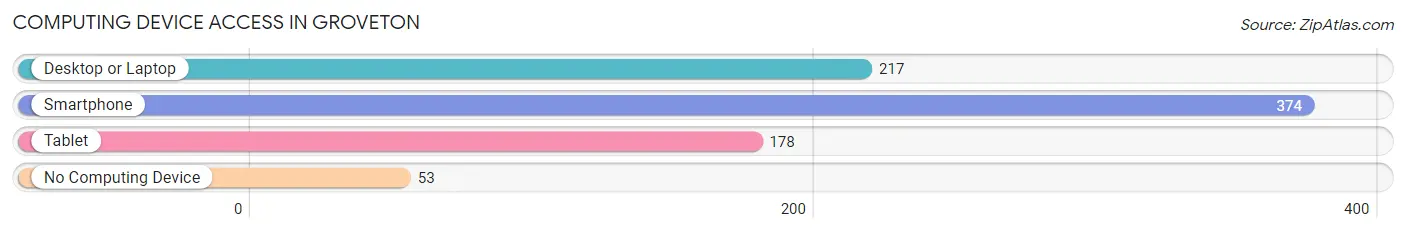
| Device Type | # Households | % Households |
| Desktop or Laptop | 217 | 50.2% |
| Smartphone | 374 | 86.6% |
| Tablet | 178 | 41.2% |
| No Computing Device | 53 | 12.3% |
| Total | 432 | 100.0% |
Internet Access in Groveton
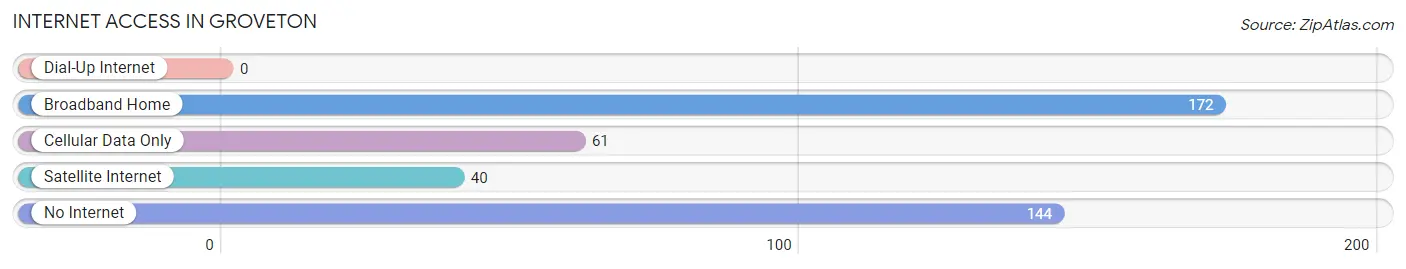
| Internet Type | # Households | % Households |
| Dial-Up Internet | 0 | 0.0% |
| Broadband Home | 172 | 39.8% |
| Cellular Data Only | 61 | 14.1% |
| Satellite Internet | 40 | 9.3% |
| No Internet | 144 | 33.3% |
| Total | 432 | 100.0% |
Groveton Summary
Groveton, Texas is a small town located in Trinity County, Texas. It is situated about 90 miles north of Houston and is part of the Lufkin-Nacogdoches Metropolitan Statistical Area. The population of Groveton was 1,541 at the 2010 census.
History
The area that is now Groveton was first settled in the early 1840s by a group of settlers from Alabama. The town was originally known as “Grove’s Town” after the first settler, William Grove. The town was officially established in 1854 and was named after Grove. The town was incorporated in 1873 and the first post office was established in 1874.
The town grew slowly but steadily throughout the late 19th and early 20th centuries. The population peaked at 1,845 in 1940. The town was home to several businesses, including a sawmill, a cotton gin, and a gristmill.
Geography
Groveton is located at the intersection of U.S. Highway 287 and State Highway 94. It is situated in the East Texas Piney Woods, an area of rolling hills and dense forests. The town is located about 90 miles north of Houston and is part of the Lufkin-Nacogdoches Metropolitan Statistical Area.
The climate in Groveton is humid subtropical, with hot summers and mild winters. The average annual temperature is 68°F (20°C). The average annual precipitation is 44 inches (112 cm).
Economy
The economy of Groveton is largely based on agriculture and timber. The town is home to several farms and ranches, as well as a sawmill and a cotton gin. The town is also home to several small businesses, including a grocery store, a hardware store, and a restaurant.
Demographics
As of the 2010 census, the population of Groveton was 1,541. The racial makeup of the town was 79.3% White, 16.2% African American, 0.7% Native American, 0.3% Asian, 0.1% Pacific Islander, 1.7% from other races, and 1.9% from two or more races. Hispanic or Latino of any race were 4.2% of the population.
The median income for a household in Groveton was $30,938, and the median income for a family was $37,500. The per capita income for the town was $15,945. About 17.2% of families and 20.2% of the population were below the poverty line, including 28.3% of those under age 18 and 14.3% of those age 65 or over.
Conclusion
Groveton, Texas is a small town located in Trinity County, Texas. It is situated about 90 miles north of Houston and is part of the Lufkin-Nacogdoches Metropolitan Statistical Area. The town was first settled in the early 1840s and was officially established in 1854. The economy of Groveton is largely based on agriculture and timber. As of the 2010 census, the population of Groveton was 1,541. The median income for a household in Groveton was $30,938, and the median income for a family was $37,500.
Common Questions
What is Per Capita Income in Groveton?
Per Capita income in Groveton is $24,725.
What is the Median Family Income in Groveton?
Median Family Income in Groveton is $65,096.
What is the Median Household income in Groveton?
Median Household Income in Groveton is $38,333.
What is Income or Wage Gap in Groveton?
Income or Wage Gap in Groveton is 17.3%.
Women in Groveton earn 82.7 cents for every dollar earned by a man.
What is Family Income Deficit in Groveton?
Family Income Deficit in Groveton is $13,925.
Families that are below poverty line in Groveton earn $13,925 less on average than the poverty threshold level.
What is Inequality or Gini Index in Groveton?
Inequality or Gini Index in Groveton is 0.47.
What is the Total Population of Groveton?
Total Population of Groveton is 991.
What is the Total Male Population of Groveton?
Total Male Population of Groveton is 440.
What is the Total Female Population of Groveton?
Total Female Population of Groveton is 551.
What is the Ratio of Males per 100 Females in Groveton?
There are 79.85 Males per 100 Females in Groveton.
What is the Ratio of Females per 100 Males in Groveton?
There are 125.23 Females per 100 Males in Groveton.
What is the Median Population Age in Groveton?
Median Population Age in Groveton is 43.7 Years.
What is the Average Family Size in Groveton
Average Family Size in Groveton is 2.8 People.
What is the Average Household Size in Groveton
Average Household Size in Groveton is 2.1 People.
How Large is the Labor Force in Groveton?
There are 376 People in the Labor Forcein in Groveton.
What is the Percentage of People in the Labor Force in Groveton?
41.9% of People are in the Labor Force in Groveton.
What is the Unemployment Rate in Groveton?
Unemployment Rate in Groveton is 15.7%.