Grand Saline, TX Map & Demographics
Grand Saline Map
Grand Saline Overview
$25,683
PER CAPITA INCOME
$69,208
AVG FAMILY INCOME
$37,823
AVG HOUSEHOLD INCOME
11.2%
WAGE / INCOME GAP [ % ]
88.8¢/ $1
WAGE / INCOME GAP [ $ ]
0.56
INEQUALITY / GINI INDEX
3,137
TOTAL POPULATION
1,362
MALE POPULATION
1,775
FEMALE POPULATION
76.73
MALES / 100 FEMALES
130.32
FEMALES / 100 MALES
42.6
MEDIAN AGE
2.9
AVG FAMILY SIZE
2.4
AVG HOUSEHOLD SIZE
1,358
LABOR FORCE [ PEOPLE ]
53.2%
PERCENT IN LABOR FORCE
5.5%
UNEMPLOYMENT RATE
Grand Saline Zip Codes
Grand Saline Area Codes
Income in Grand Saline
Income Overview in Grand Saline
Per Capita Income in Grand Saline is $25,683, while median incomes of families and households are $69,208 and $37,823 respectively.
| Characteristic | Number | Measure |
| Per Capita Income | 3,137 | $25,683 |
| Median Family Income | 809 | $69,208 |
| Mean Family Income | 809 | $87,540 |
| Median Household Income | 1,202 | $37,823 |
| Mean Household Income | 1,202 | $66,468 |
| Income Deficit | 809 | $0 |
| Wage / Income Gap (%) | 3,137 | 11.16% |
| Wage / Income Gap ($) | 3,137 | 88.84¢ per $1 |
| Gini / Inequality Index | 3,137 | 0.56 |
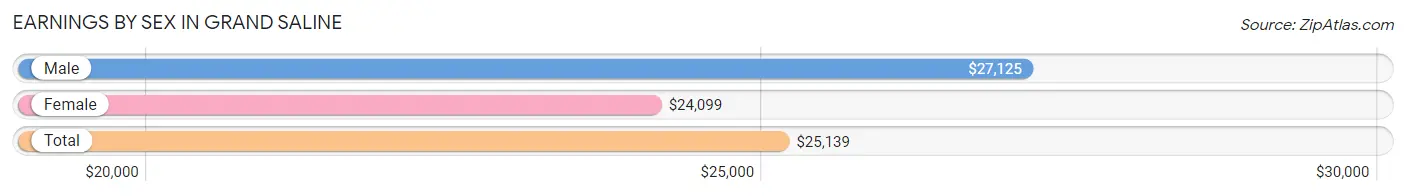
Earnings by Sex in Grand Saline
Average Earnings in Grand Saline are $25,139, $27,125 for men and $24,099 for women, a difference of 11.2%.
| Sex | Number | Average Earnings |
| Male | 776 (55.4%) | $27,125 |
| Female | 625 (44.6%) | $24,099 |
| Total | 1,401 (100.0%) | $25,139 |
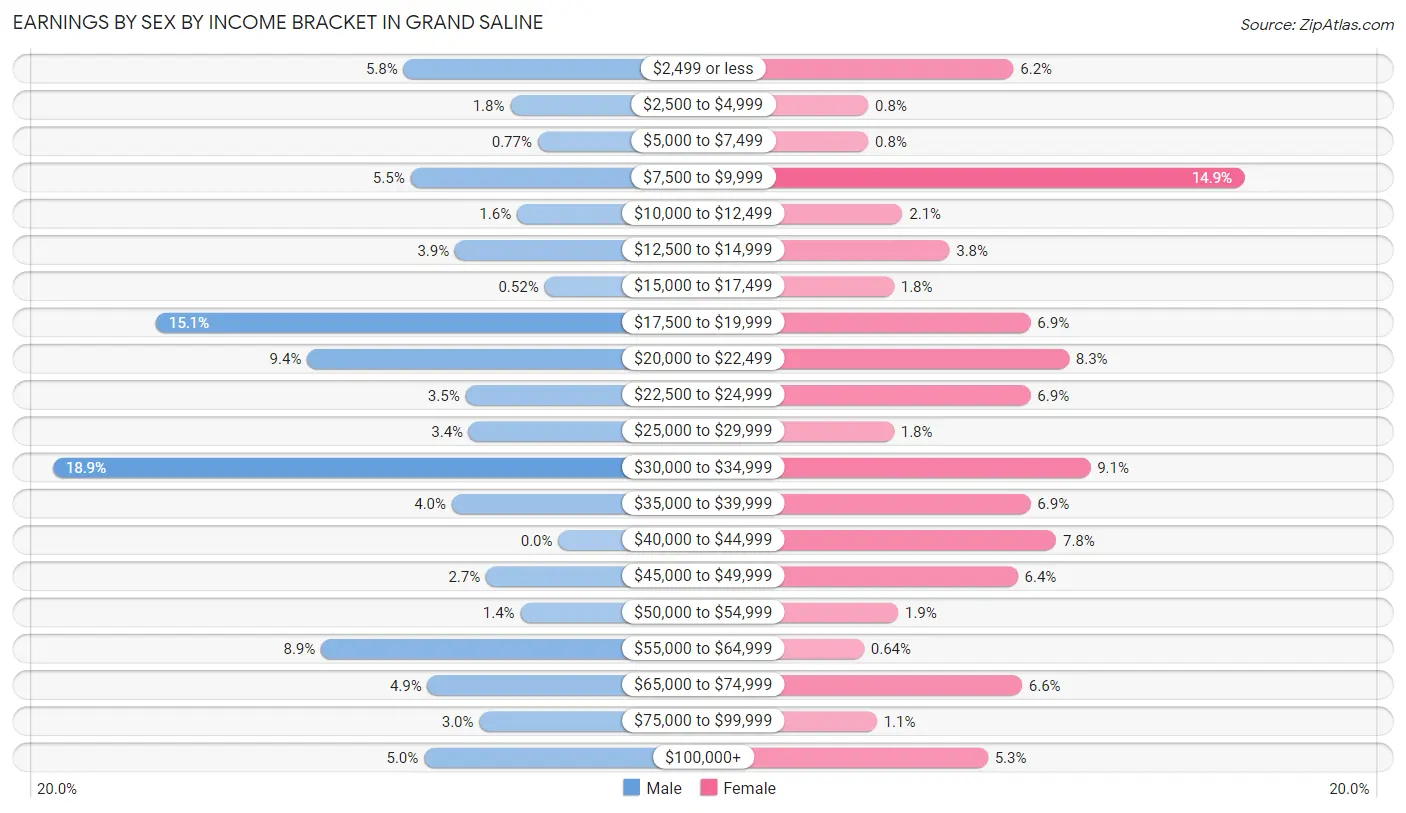
Earnings by Sex by Income Bracket in Grand Saline
The most common earnings brackets in Grand Saline are $30,000 to $34,999 for men (147 | 18.9%) and $7,500 to $9,999 for women (93 | 14.9%).
| Income | Male | Female |
| $2,499 or less | 45 (5.8%) | 39 (6.2%) |
| $2,500 to $4,999 | 14 (1.8%) | 5 (0.8%) |
| $5,000 to $7,499 | 6 (0.8%) | 5 (0.8%) |
| $7,500 to $9,999 | 43 (5.5%) | 93 (14.9%) |
| $10,000 to $12,499 | 12 (1.5%) | 13 (2.1%) |
| $12,500 to $14,999 | 30 (3.9%) | 24 (3.8%) |
| $15,000 to $17,499 | 4 (0.5%) | 11 (1.8%) |
| $17,500 to $19,999 | 117 (15.1%) | 43 (6.9%) |
| $20,000 to $22,499 | 73 (9.4%) | 52 (8.3%) |
| $22,500 to $24,999 | 27 (3.5%) | 43 (6.9%) |
| $25,000 to $29,999 | 26 (3.4%) | 11 (1.8%) |
| $30,000 to $34,999 | 147 (18.9%) | 57 (9.1%) |
| $35,000 to $39,999 | 31 (4.0%) | 43 (6.9%) |
| $40,000 to $44,999 | 0 (0.0%) | 49 (7.8%) |
| $45,000 to $49,999 | 21 (2.7%) | 40 (6.4%) |
| $50,000 to $54,999 | 11 (1.4%) | 12 (1.9%) |
| $55,000 to $64,999 | 69 (8.9%) | 4 (0.6%) |
| $65,000 to $74,999 | 38 (4.9%) | 41 (6.6%) |
| $75,000 to $99,999 | 23 (3.0%) | 7 (1.1%) |
| $100,000+ | 39 (5.0%) | 33 (5.3%) |
| Total | 776 (100.0%) | 625 (100.0%) |
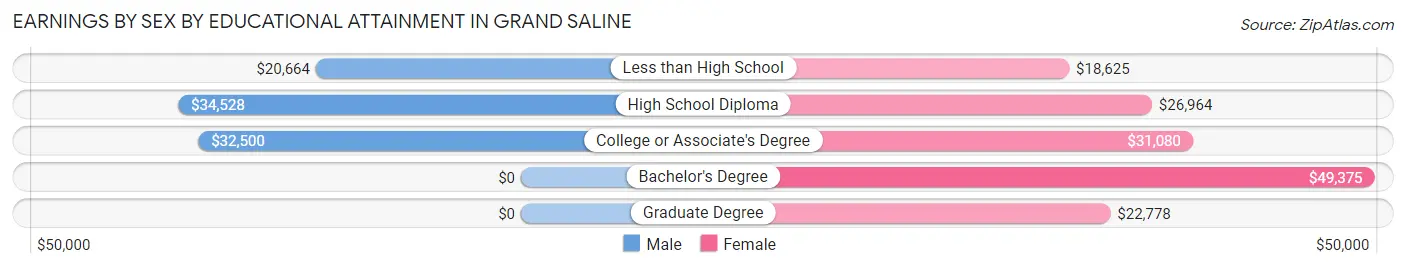
Earnings by Sex by Educational Attainment in Grand Saline
Average earnings in Grand Saline are $31,193 for men and $23,983 for women, a difference of 23.1%. Men with an educational attainment of high school diploma enjoy the highest average annual earnings of $34,528, while those with less than high school education earn the least with $20,664. Women with an educational attainment of bachelor's degree earn the most with the average annual earnings of $49,375, while those with less than high school education have the smallest earnings of $18,625.
| Educational Attainment | Male Income | Female Income |
| Less than High School | $20,664 | $18,625 |
| High School Diploma | $34,528 | $26,964 |
| College or Associate's Degree | $32,500 | $31,080 |
| Bachelor's Degree | - | - |
| Graduate Degree | - | - |
| Total | $31,193 | $23,983 |
Family Income in Grand Saline
Family Income Brackets in Grand Saline
According to the Grand Saline family income data, there are 234 families falling into the $50,000 to $74,999 income range, which is the most common income bracket and makes up 28.9% of all families.
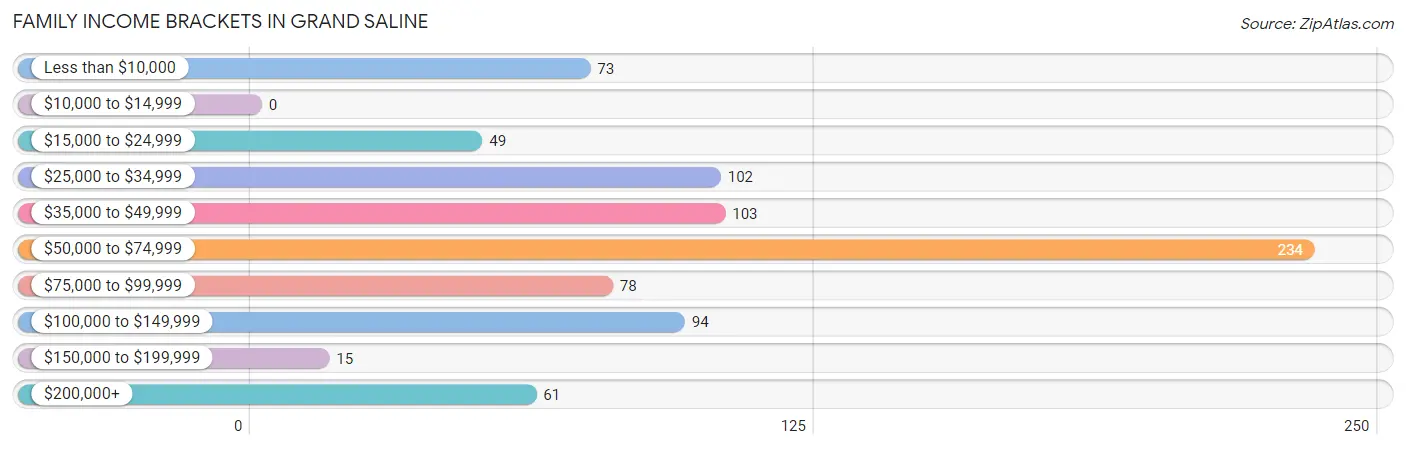
| Income Bracket | # Families | % Families |
| Less than $10,000 | 73 | 9.0% |
| $10,000 to $14,999 | 0 | 0.0% |
| $15,000 to $24,999 | 49 | 6.1% |
| $25,000 to $34,999 | 102 | 12.6% |
| $35,000 to $49,999 | 103 | 12.7% |
| $50,000 to $74,999 | 234 | 28.9% |
| $75,000 to $99,999 | 78 | 9.6% |
| $100,000 to $149,999 | 94 | 11.6% |
| $150,000 to $199,999 | 15 | 1.9% |
| $200,000+ | 61 | 7.5% |
Family Income by Famaliy Size in Grand Saline
6-person families (48 | 5.9%) account for the highest median family income in Grand Saline with $103,333 per family, while 3-person families (191 | 23.6%) have the highest median income of $25,083 per family member.
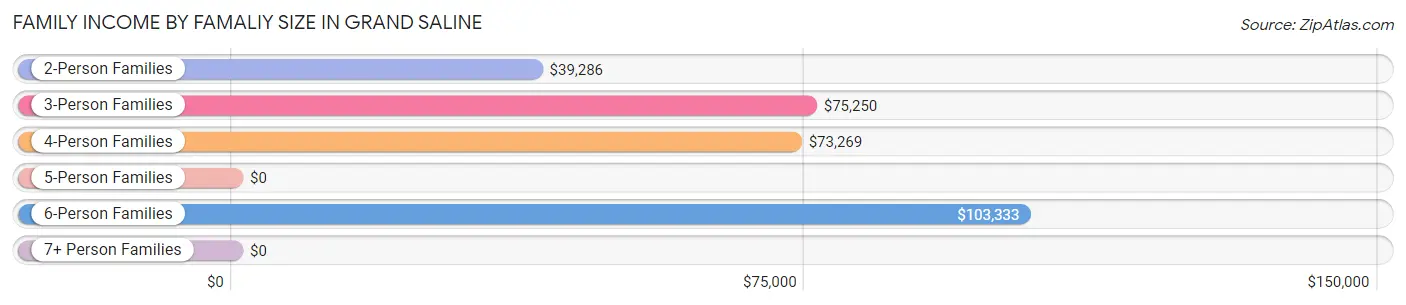
| Income Bracket | # Families | Median Income |
| 2-Person Families | 386 (47.7%) | $39,286 |
| 3-Person Families | 191 (23.6%) | $75,250 |
| 4-Person Families | 158 (19.5%) | $73,269 |
| 5-Person Families | 22 (2.7%) | $0 |
| 6-Person Families | 48 (5.9%) | $103,333 |
| 7+ Person Families | 4 (0.5%) | $0 |
| Total | 809 (100.0%) | $69,208 |
Family Income by Number of Earners in Grand Saline
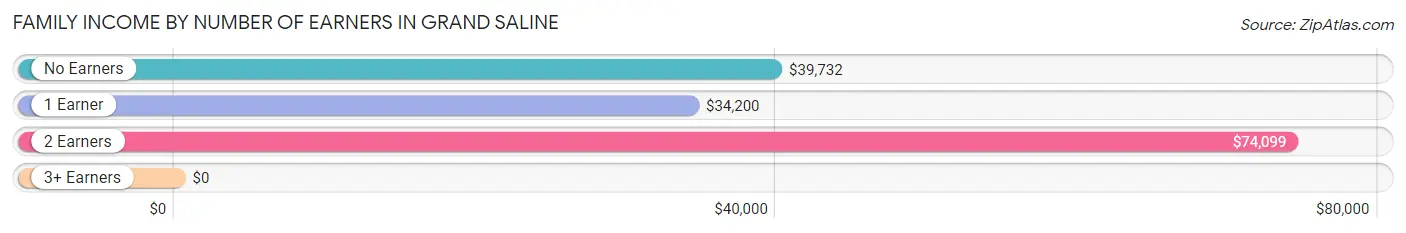
| Number of Earners | # Families | Median Income |
| No Earners | 89 (11.0%) | $39,732 |
| 1 Earner | 322 (39.8%) | $34,200 |
| 2 Earners | 294 (36.3%) | $74,099 |
| 3+ Earners | 104 (12.9%) | $0 |
| Total | 809 (100.0%) | $69,208 |
Household Income in Grand Saline
Household Income Brackets in Grand Saline
With 240 households falling in the category, the $50,000 to $74,999 income range is the most frequent in Grand Saline, accounting for 20.0% of all households. In contrast, only 14 households (1.2%) fall into the $150,000 to $199,999 income bracket, making it the least populous group.
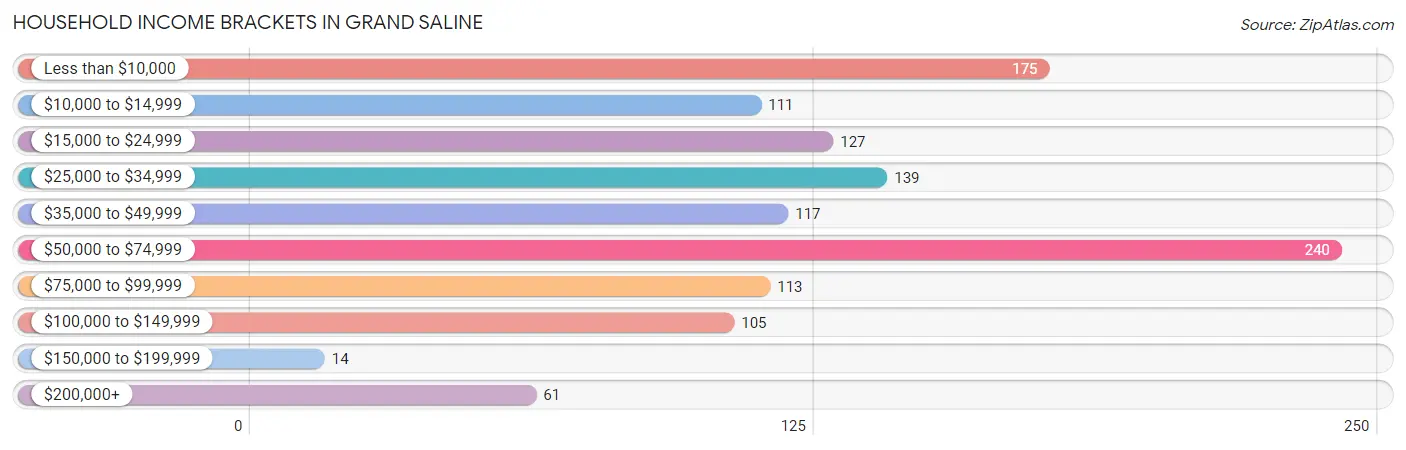
| Income Bracket | # Households | % Households |
| Less than $10,000 | 175 | 14.6% |
| $10,000 to $14,999 | 111 | 9.2% |
| $15,000 to $24,999 | 127 | 10.6% |
| $25,000 to $34,999 | 139 | 11.6% |
| $35,000 to $49,999 | 117 | 9.7% |
| $50,000 to $74,999 | 240 | 20.0% |
| $75,000 to $99,999 | 113 | 9.4% |
| $100,000 to $149,999 | 105 | 8.7% |
| $150,000 to $199,999 | 14 | 1.2% |
| $200,000+ | 61 | 5.1% |
Household Income by Householder Age in Grand Saline
The median household income in Grand Saline is $37,823, with the highest median household income of $68,750 found in the 25 to 44 years age bracket for the primary householder. A total of 360 households (29.9%) fall into this category. Meanwhile, the 15 to 24 years age bracket for the primary householder has the lowest median household income of $0, with 31 households (2.6%) in this group.
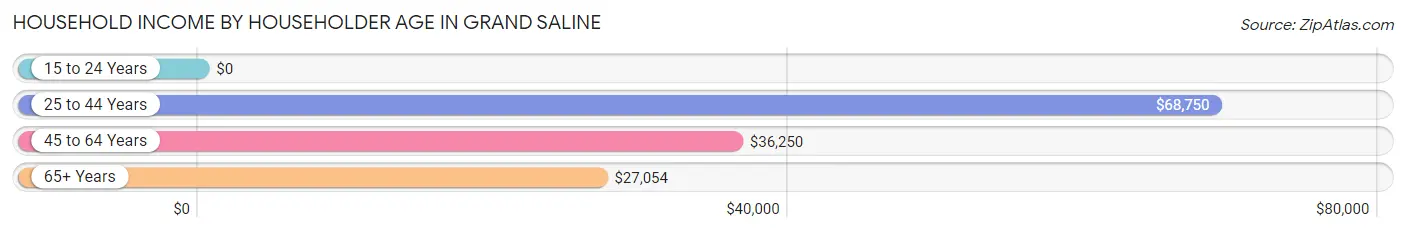
| Income Bracket | # Households | Median Income |
| 15 to 24 Years | 31 (2.6%) | $0 |
| 25 to 44 Years | 360 (29.9%) | $68,750 |
| 45 to 64 Years | 405 (33.7%) | $36,250 |
| 65+ Years | 406 (33.8%) | $27,054 |
| Total | 1,202 (100.0%) | $37,823 |
Poverty in Grand Saline
Income Below Poverty by Sex and Age in Grand Saline
With 19.7% poverty level for males and 25.6% for females among the residents of Grand Saline, 12 to 14 year old males and under 5 year old females are the most vulnerable to poverty, with 10 males (58.8%) and 48 females (60.0%) in their respective age groups living below the poverty level.
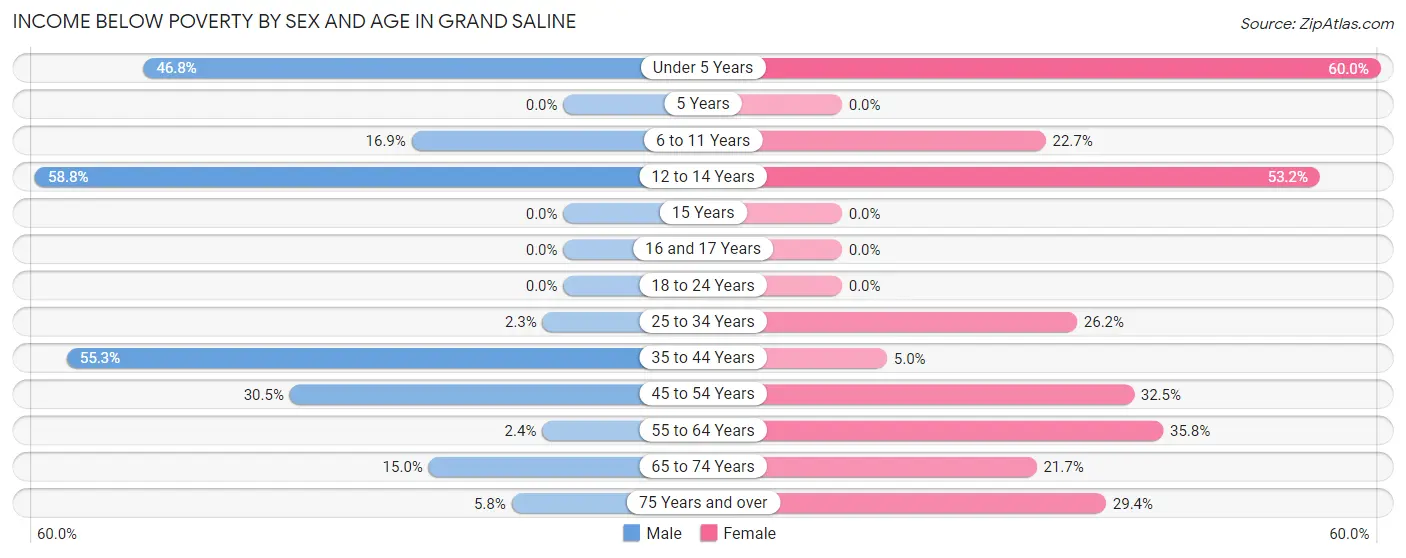
| Age Bracket | Male | Female |
| Under 5 Years | 65 (46.8%) | 48 (60.0%) |
| 5 Years | 0 (0.0%) | 0 (0.0%) |
| 6 to 11 Years | 12 (16.9%) | 27 (22.7%) |
| 12 to 14 Years | 10 (58.8%) | 33 (53.2%) |
| 15 Years | 0 (0.0%) | 0 (0.0%) |
| 16 and 17 Years | 0 (0.0%) | 0 (0.0%) |
| 18 to 24 Years | 0 (0.0%) | 0 (0.0%) |
| 25 to 34 Years | 7 (2.3%) | 50 (26.2%) |
| 35 to 44 Years | 94 (55.3%) | 11 (5.0%) |
| 45 to 54 Years | 39 (30.5%) | 80 (32.5%) |
| 55 to 64 Years | 4 (2.4%) | 73 (35.8%) |
| 65 to 74 Years | 15 (15.0%) | 49 (21.7%) |
| 75 Years and over | 3 (5.8%) | 45 (29.4%) |
| Total | 249 (19.7%) | 416 (25.6%) |
Income Above Poverty by Sex and Age in Grand Saline
According to the poverty statistics in Grand Saline, males aged 15 years and females aged 5 years are the age groups that are most secure financially, with 100.0% of males and 100.0% of females in these age groups living above the poverty line.
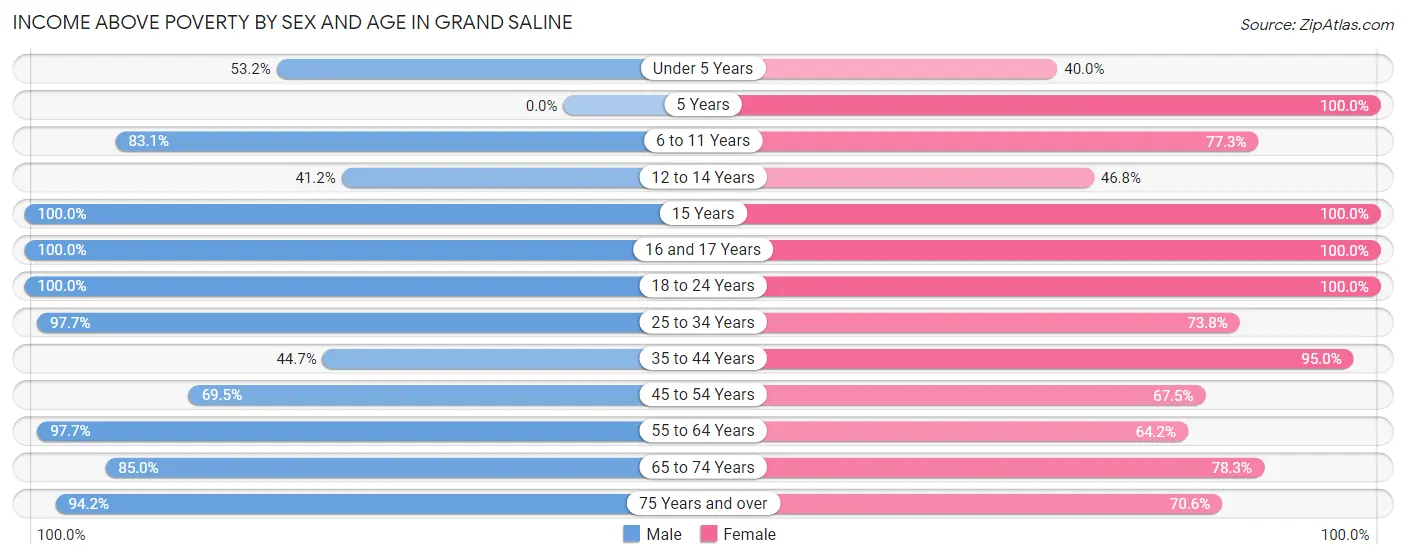
| Age Bracket | Male | Female |
| Under 5 Years | 74 (53.2%) | 32 (40.0%) |
| 5 Years | 0 (0.0%) | 5 (100.0%) |
| 6 to 11 Years | 59 (83.1%) | 92 (77.3%) |
| 12 to 14 Years | 7 (41.2%) | 29 (46.8%) |
| 15 Years | 7 (100.0%) | 28 (100.0%) |
| 16 and 17 Years | 5 (100.0%) | 31 (100.0%) |
| 18 to 24 Years | 100 (100.0%) | 61 (100.0%) |
| 25 to 34 Years | 296 (97.7%) | 141 (73.8%) |
| 35 to 44 Years | 76 (44.7%) | 208 (95.0%) |
| 45 to 54 Years | 89 (69.5%) | 166 (67.5%) |
| 55 to 64 Years | 166 (97.7%) | 131 (64.2%) |
| 65 to 74 Years | 85 (85.0%) | 177 (78.3%) |
| 75 Years and over | 49 (94.2%) | 108 (70.6%) |
| Total | 1,013 (80.3%) | 1,209 (74.4%) |
Income Below Poverty Among Married-Couple Families in Grand Saline
The poverty statistics for married-couple families in Grand Saline show that 2.5% or 12 of the total 482 families live below the poverty line. Families with 3 or 4 children have the highest poverty rate of 42.9%, comprising of 12 families. On the other hand, families with no children have the lowest poverty rate of 0.0%, which includes 0 families.
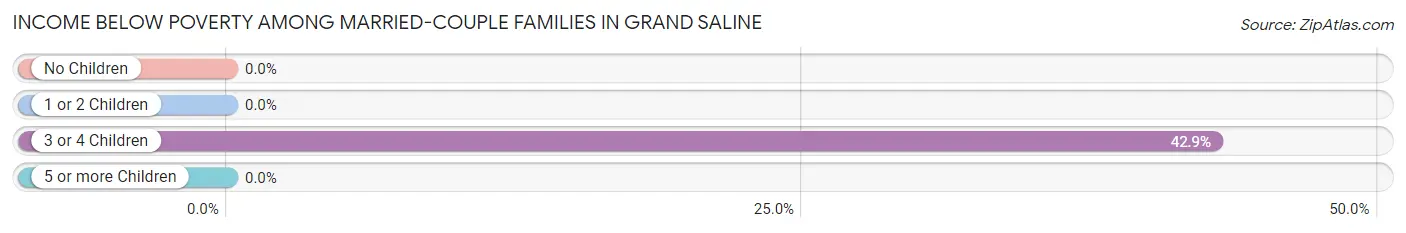
| Children | Above Poverty | Below Poverty |
| No Children | 293 (100.0%) | 0 (0.0%) |
| 1 or 2 Children | 159 (100.0%) | 0 (0.0%) |
| 3 or 4 Children | 16 (57.1%) | 12 (42.9%) |
| 5 or more Children | 2 (100.0%) | 0 (0.0%) |
| Total | 470 (97.5%) | 12 (2.5%) |
Income Below Poverty Among Single-Parent Households in Grand Saline
According to the poverty data in Grand Saline, 44.2% or 42 single-father households and 31.5% or 73 single-mother households are living below the poverty line. Among single-father households, those with 1 or 2 children have the highest poverty rate, with 42 households (49.4%) experiencing poverty. Likewise, among single-mother households, those with 1 or 2 children have the highest poverty rate, with 73 households (73.0%) falling below the poverty line.
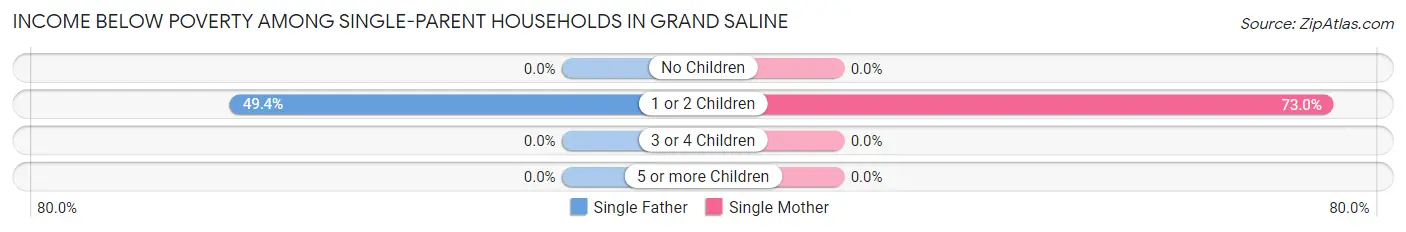
| Children | Single Father | Single Mother |
| No Children | 0 (0.0%) | 0 (0.0%) |
| 1 or 2 Children | 42 (49.4%) | 73 (73.0%) |
| 3 or 4 Children | 0 (0.0%) | 0 (0.0%) |
| 5 or more Children | 0 (0.0%) | 0 (0.0%) |
| Total | 42 (44.2%) | 73 (31.5%) |
Income Below Poverty Among Married-Couple vs Single-Parent Households in Grand Saline
The poverty data for Grand Saline shows that 12 of the married-couple family households (2.5%) and 115 of the single-parent households (35.2%) are living below the poverty level. Within the married-couple family households, those with 3 or 4 children have the highest poverty rate, with 12 households (42.9%) falling below the poverty line. Among the single-parent households, those with 1 or 2 children have the highest poverty rate, with 115 household (62.2%) living below poverty.
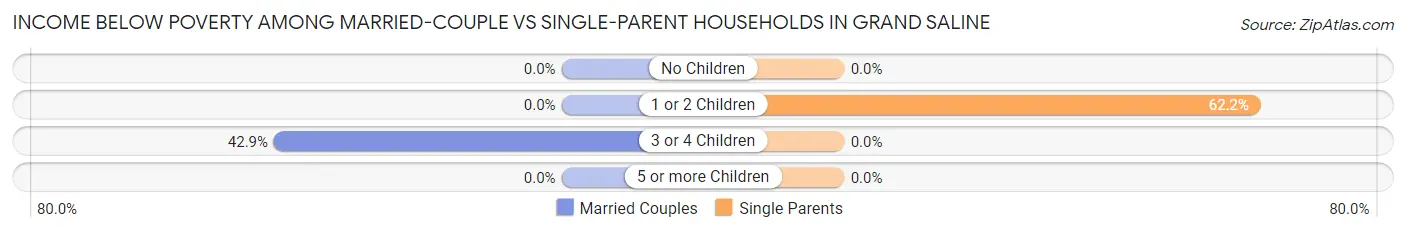
| Children | Married-Couple Families | Single-Parent Households |
| No Children | 0 (0.0%) | 0 (0.0%) |
| 1 or 2 Children | 0 (0.0%) | 115 (62.2%) |
| 3 or 4 Children | 12 (42.9%) | 0 (0.0%) |
| 5 or more Children | 0 (0.0%) | 0 (0.0%) |
| Total | 12 (2.5%) | 115 (35.2%) |
Race in Grand Saline
The most populous races in Grand Saline are White / Caucasian (2,391 | 76.2%), Hispanic or Latino (991 | 31.6%), and Two or more Races (356 | 11.4%).
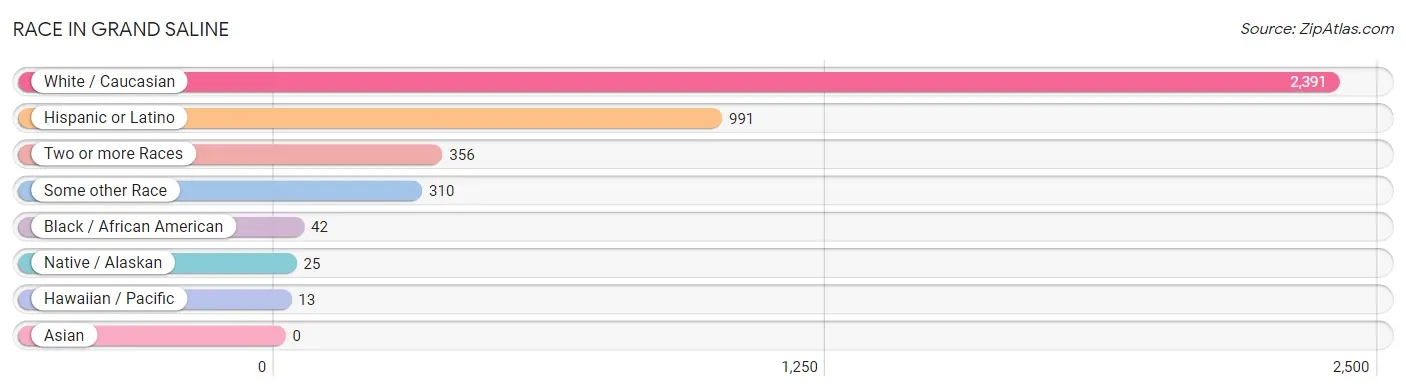
| Race | # Population | % Population |
| Asian | 0 | 0.0% |
| Black / African American | 42 | 1.3% |
| Hawaiian / Pacific | 13 | 0.4% |
| Hispanic or Latino | 991 | 31.6% |
| Native / Alaskan | 25 | 0.8% |
| White / Caucasian | 2,391 | 76.2% |
| Two or more Races | 356 | 11.4% |
| Some other Race | 310 | 9.9% |
| Total | 3,137 | 100.0% |
Ancestry in Grand Saline
The most populous ancestries reported in Grand Saline are Mexican (939 | 29.9%), American (459 | 14.6%), Irish (332 | 10.6%), English (175 | 5.6%), and German (153 | 4.9%), together accounting for 65.6% of all Grand Saline residents.
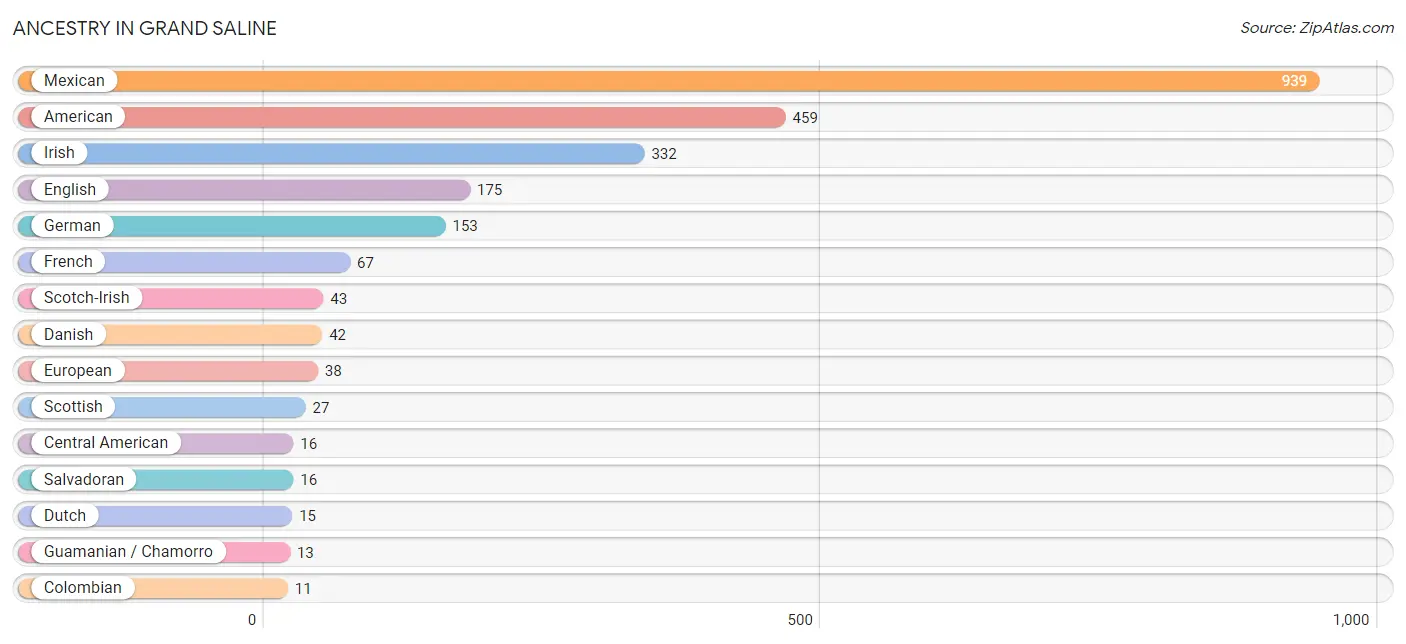
| Ancestry | # Population | % Population |
| American | 459 | 14.6% |
| British | 5 | 0.2% |
| Cajun | 1 | 0.0% |
| Central American | 16 | 0.5% |
| Cherokee | 9 | 0.3% |
| Colombian | 11 | 0.4% |
| Czechoslovakian | 8 | 0.3% |
| Danish | 42 | 1.3% |
| Dutch | 15 | 0.5% |
| English | 175 | 5.6% |
| European | 38 | 1.2% |
| French | 67 | 2.1% |
| French Canadian | 10 | 0.3% |
| German | 153 | 4.9% |
| Guamanian / Chamorro | 13 | 0.4% |
| Irish | 332 | 10.6% |
| Italian | 4 | 0.1% |
| Mexican | 939 | 29.9% |
| Polish | 4 | 0.1% |
| Portuguese | 6 | 0.2% |
| Puerto Rican | 1 | 0.0% |
| Salvadoran | 16 | 0.5% |
| Scotch-Irish | 43 | 1.4% |
| Scottish | 27 | 0.9% |
| South American | 11 | 0.4% | View All 25 Rows |
Immigrants in Grand Saline
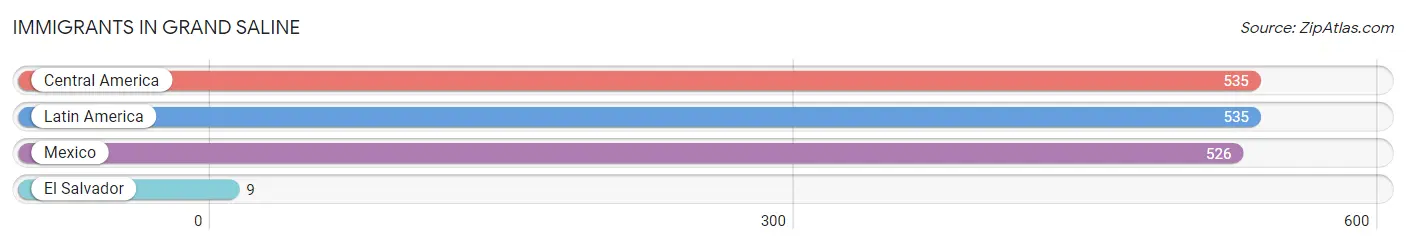
The most numerous immigrant groups reported in Grand Saline came from Central America (535 | 17.1%), Latin America (535 | 17.1%), Mexico (526 | 16.8%), and El Salvador (9 | 0.3%), together accounting for 51.2% of all Grand Saline residents.
| Immigration Origin | # Population | % Population |
| Central America | 535 | 17.1% |
| El Salvador | 9 | 0.3% |
| Latin America | 535 | 17.1% |
| Mexico | 526 | 16.8% | View All 4 Rows |
Sex and Age in Grand Saline
Sex and Age in Grand Saline
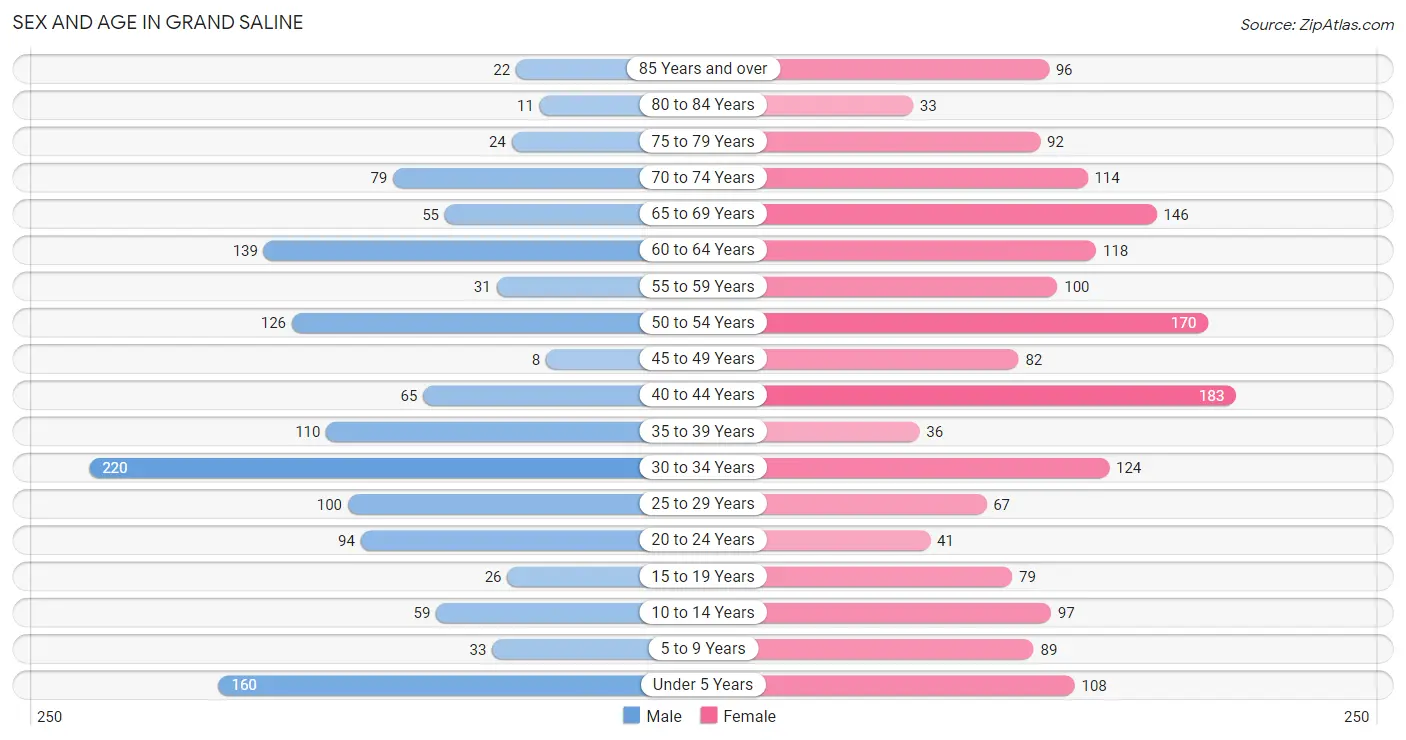
The most populous age groups in Grand Saline are 30 to 34 Years (220 | 16.2%) for men and 40 to 44 Years (183 | 10.3%) for women.
| Age Bracket | Male | Female |
| Under 5 Years | 160 (11.7%) | 108 (6.1%) |
| 5 to 9 Years | 33 (2.4%) | 89 (5.0%) |
| 10 to 14 Years | 59 (4.3%) | 97 (5.5%) |
| 15 to 19 Years | 26 (1.9%) | 79 (4.4%) |
| 20 to 24 Years | 94 (6.9%) | 41 (2.3%) |
| 25 to 29 Years | 100 (7.3%) | 67 (3.8%) |
| 30 to 34 Years | 220 (16.2%) | 124 (7.0%) |
| 35 to 39 Years | 110 (8.1%) | 36 (2.0%) |
| 40 to 44 Years | 65 (4.8%) | 183 (10.3%) |
| 45 to 49 Years | 8 (0.6%) | 82 (4.6%) |
| 50 to 54 Years | 126 (9.2%) | 170 (9.6%) |
| 55 to 59 Years | 31 (2.3%) | 100 (5.6%) |
| 60 to 64 Years | 139 (10.2%) | 118 (6.7%) |
| 65 to 69 Years | 55 (4.0%) | 146 (8.2%) |
| 70 to 74 Years | 79 (5.8%) | 114 (6.4%) |
| 75 to 79 Years | 24 (1.8%) | 92 (5.2%) |
| 80 to 84 Years | 11 (0.8%) | 33 (1.9%) |
| 85 Years and over | 22 (1.6%) | 96 (5.4%) |
| Total | 1,362 (100.0%) | 1,775 (100.0%) |
Families and Households in Grand Saline
Median Family Size in Grand Saline
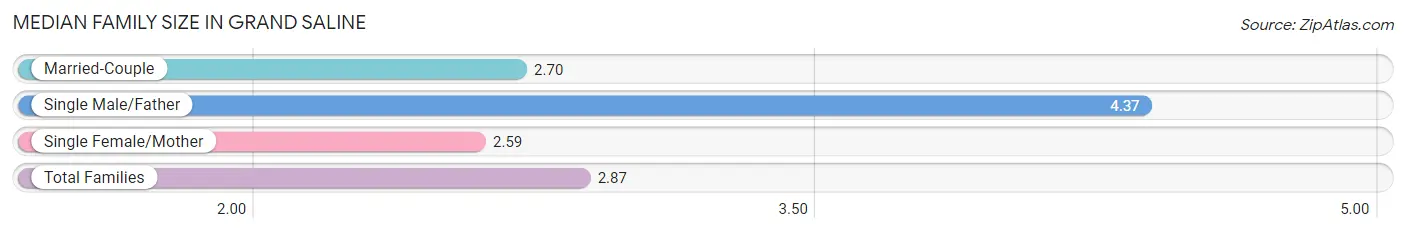
The median family size in Grand Saline is 2.87 persons per family, with single male/father families (95 | 11.7%) accounting for the largest median family size of 4.37 persons per family. On the other hand, single female/mother families (232 | 28.7%) represent the smallest median family size with 2.59 persons per family.
| Family Type | # Families | Family Size |
| Married-Couple | 482 (59.6%) | 2.70 |
| Single Male/Father | 95 (11.7%) | 4.37 |
| Single Female/Mother | 232 (28.7%) | 2.59 |
| Total Families | 809 (100.0%) | 2.87 |
Median Household Size in Grand Saline
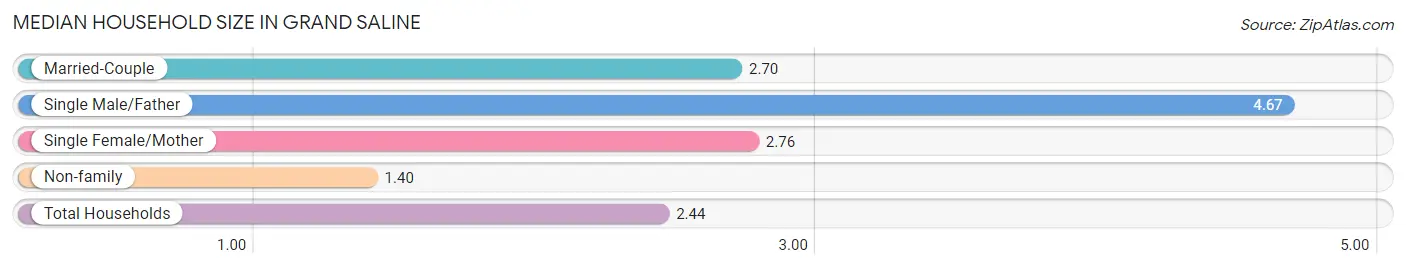
The median household size in Grand Saline is 2.44 persons per household, with single male/father households (95 | 7.9%) accounting for the largest median household size of 4.67 persons per household. non-family households (393 | 32.7%) represent the smallest median household size with 1.40 persons per household.
| Household Type | # Households | Household Size |
| Married-Couple | 482 (40.1%) | 2.70 |
| Single Male/Father | 95 (7.9%) | 4.67 |
| Single Female/Mother | 232 (19.3%) | 2.76 |
| Non-family | 393 (32.7%) | 1.40 |
| Total Households | 1,202 (100.0%) | 2.44 |
Household Size by Marriage Status in Grand Saline
Out of a total of 1,202 households in Grand Saline, 809 (67.3%) are family households, while 393 (32.7%) are nonfamily households. The most numerous type of family households are 2-person households, comprising 334, and the most common type of nonfamily households are 1-person households, comprising 317.
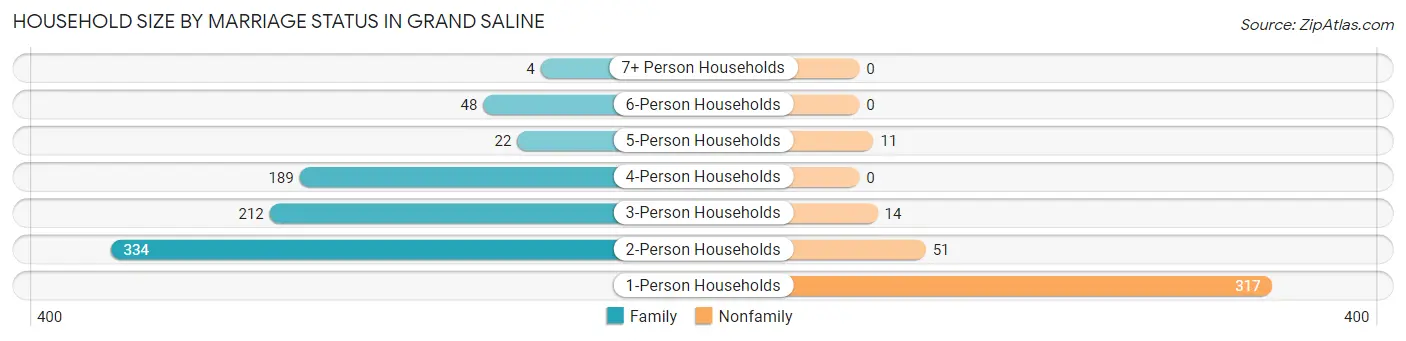
| Household Size | Family Households | Nonfamily Households |
| 1-Person Households | - | 317 (26.4%) |
| 2-Person Households | 334 (27.8%) | 51 (4.2%) |
| 3-Person Households | 212 (17.6%) | 14 (1.2%) |
| 4-Person Households | 189 (15.7%) | 0 (0.0%) |
| 5-Person Households | 22 (1.8%) | 11 (0.9%) |
| 6-Person Households | 48 (4.0%) | 0 (0.0%) |
| 7+ Person Households | 4 (0.3%) | 0 (0.0%) |
| Total | 809 (67.3%) | 393 (32.7%) |
Female Fertility in Grand Saline
Fertility by Age in Grand Saline
Average fertility rate in Grand Saline is 38.0 births per 1,000 women. Women in the age bracket of 20 to 34 years have the highest fertility rate with 78.0 births per 1,000 women. Women in the age bracket of 20 to 34 years acount for 66.7% of all women with births.
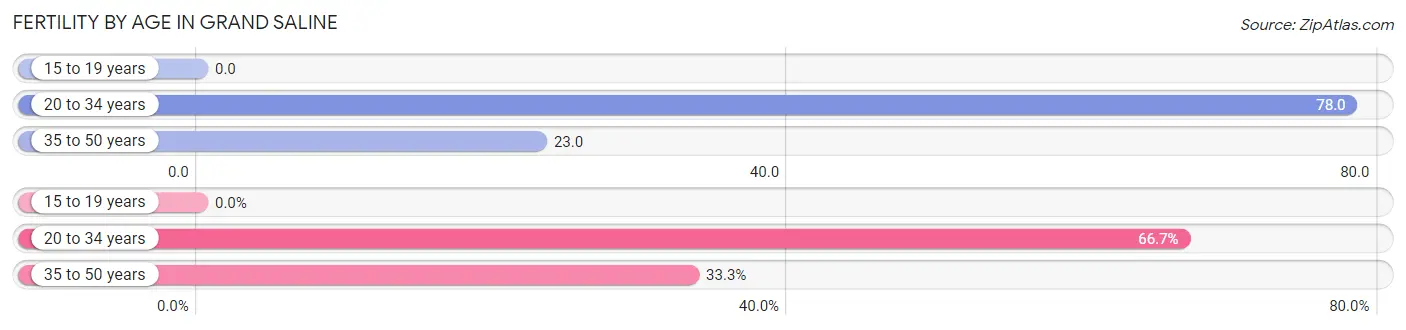
| Age Bracket | Women with Births | Births / 1,000 Women |
| 15 to 19 years | 0 (0.0%) | 0.0 |
| 20 to 34 years | 18 (66.7%) | 78.0 |
| 35 to 50 years | 9 (33.3%) | 23.0 |
| Total | 27 (100.0%) | 38.0 |
Fertility by Age by Marriage Status in Grand Saline
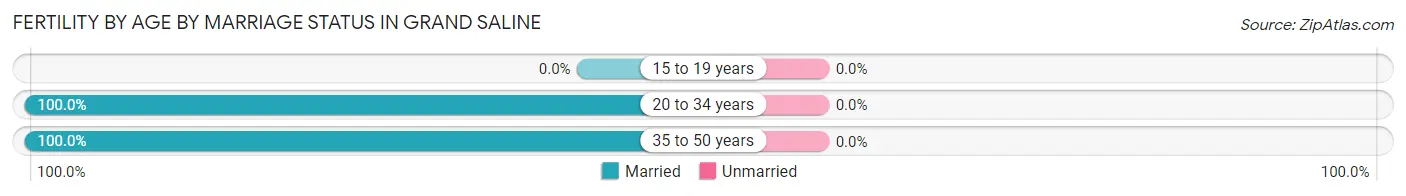
| Age Bracket | Married | Unmarried |
| 15 to 19 years | 0 (0.0%) | 0 (0.0%) |
| 20 to 34 years | 18 (100.0%) | 0 (0.0%) |
| 35 to 50 years | 9 (100.0%) | 0 (0.0%) |
| Total | 27 (100.0%) | 0 (0.0%) |
Fertility by Education in Grand Saline
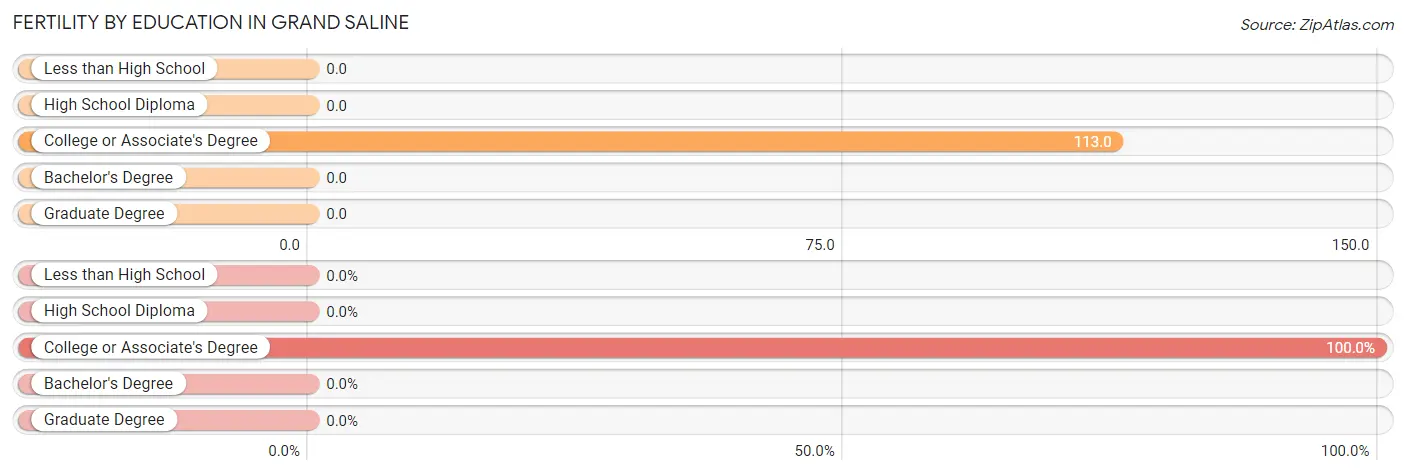
| Educational Attainment | Women with Births | Births / 1,000 Women |
| Less than High School | 0 (0.0%) | 0.0 |
| High School Diploma | 0 (0.0%) | 0.0 |
| College or Associate's Degree | 27 (100.0%) | 113.0 |
| Bachelor's Degree | 0 (0.0%) | 0.0 |
| Graduate Degree | 0 (0.0%) | 0.0 |
| Total | 27 (100.0%) | 38.0 |
Fertility by Education by Marriage Status in Grand Saline
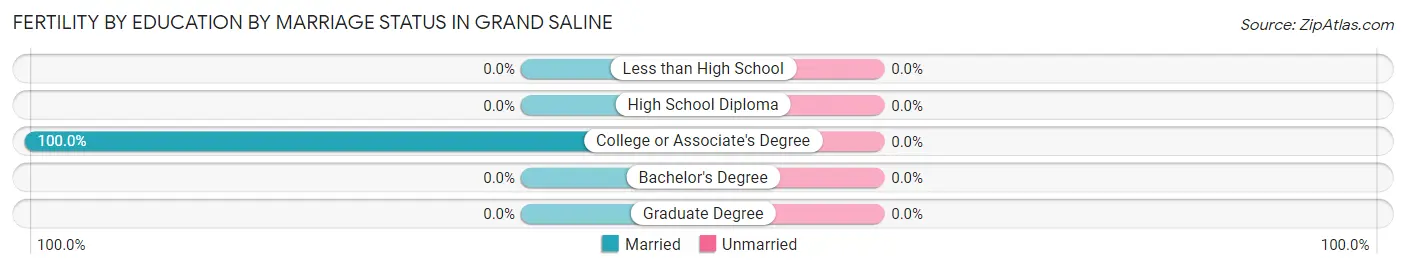
| Educational Attainment | Married | Unmarried |
| Less than High School | 0 (0.0%) | 0 (0.0%) |
| High School Diploma | 0 (0.0%) | 0 (0.0%) |
| College or Associate's Degree | 27 (100.0%) | 0 (0.0%) |
| Bachelor's Degree | 0 (0.0%) | 0 (0.0%) |
| Graduate Degree | 0 (0.0%) | 0 (0.0%) |
| Total | 27 (100.0%) | 0 (0.0%) |
Employment Characteristics in Grand Saline
Employment by Class of Employer in Grand Saline
Among the 1,218 employed individuals in Grand Saline, private company employees (844 | 69.3%), state government employees (136 | 11.2%), and self-employed (not incorporated) (88 | 7.2%) make up the most common classes of employment.
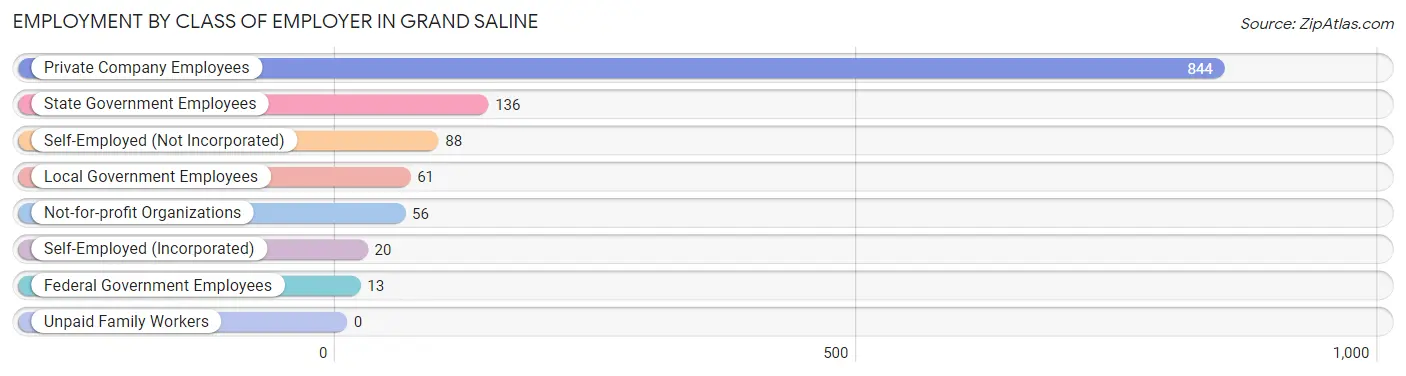
| Employer Class | # Employees | % Employees |
| Private Company Employees | 844 | 69.3% |
| Self-Employed (Incorporated) | 20 | 1.6% |
| Self-Employed (Not Incorporated) | 88 | 7.2% |
| Not-for-profit Organizations | 56 | 4.6% |
| Local Government Employees | 61 | 5.0% |
| State Government Employees | 136 | 11.2% |
| Federal Government Employees | 13 | 1.1% |
| Unpaid Family Workers | 0 | 0.0% |
| Total | 1,218 | 100.0% |
Employment Status by Age in Grand Saline
According to the labor force statistics for Grand Saline, out of the total population over 16 years of age (2,552), 53.2% or 1,358 individuals are in the labor force, with 5.5% or 75 of them unemployed. The age group with the highest labor force participation rate is 30 to 34 years, with 88.1% or 303 individuals in the labor force. Within the labor force, the 20 to 24 years age range has the highest percentage of unemployed individuals, with 37.2% or 35 of them being unemployed.
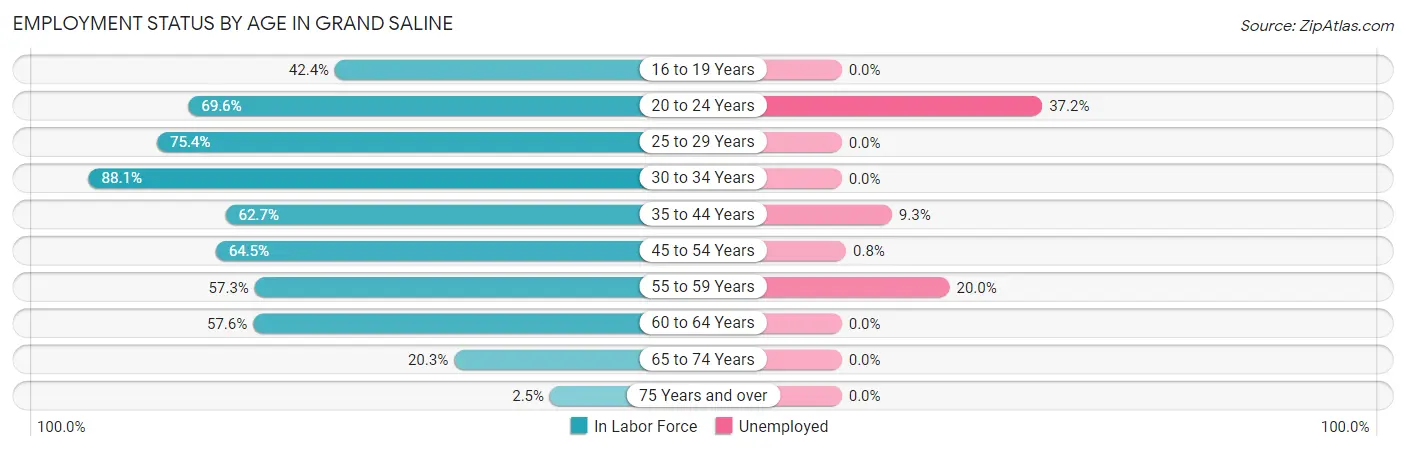
| Age Bracket | In Labor Force | Unemployed |
| 16 to 19 Years | 28 (42.4%) | 0 (0.0%) |
| 20 to 24 Years | 94 (69.6%) | 35 (37.2%) |
| 25 to 29 Years | 126 (75.4%) | 0 (0.0%) |
| 30 to 34 Years | 303 (88.1%) | 0 (0.0%) |
| 35 to 44 Years | 247 (62.7%) | 23 (9.3%) |
| 45 to 54 Years | 249 (64.5%) | 2 (0.8%) |
| 55 to 59 Years | 75 (57.3%) | 15 (20.0%) |
| 60 to 64 Years | 148 (57.6%) | 0 (0.0%) |
| 65 to 74 Years | 80 (20.3%) | 0 (0.0%) |
| 75 Years and over | 7 (2.5%) | 0 (0.0%) |
| Total | 1,358 (53.2%) | 75 (5.5%) |
Employment Status by Educational Attainment in Grand Saline
According to labor force statistics for Grand Saline, 68.4% of individuals (1,148) out of the total population between 25 and 64 years of age (1,679) are in the labor force, with 3.5% or 40 of them being unemployed. The group with the highest labor force participation rate are those with the educational attainment of bachelor's degree or higher, with 77.8% or 119 individuals in the labor force. Within the labor force, individuals with high school diploma education have the highest percentage of unemployment, with 7.3% or 19 of them being unemployed.
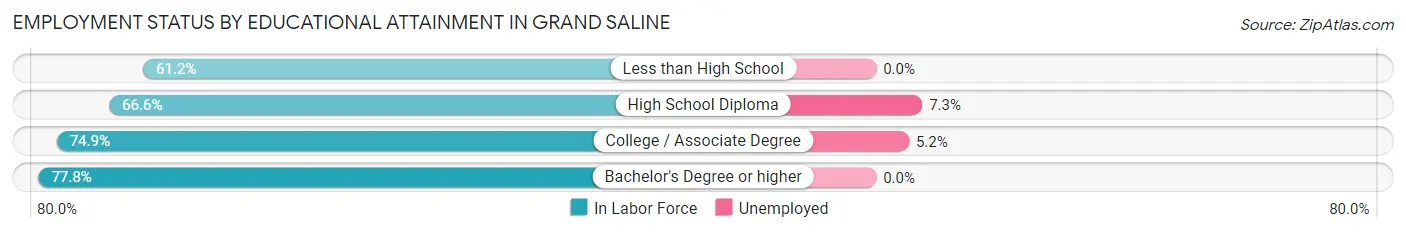
| Educational Attainment | In Labor Force | Unemployed |
| Less than High School | 365 (61.2%) | 0 (0.0%) |
| High School Diploma | 261 (66.6%) | 29 (7.3%) |
| College / Associate Degree | 403 (74.9%) | 28 (5.2%) |
| Bachelor's Degree or higher | 119 (77.8%) | 0 (0.0%) |
| Total | 1,148 (68.4%) | 59 (3.5%) |
Employment Occupations by Sex in Grand Saline
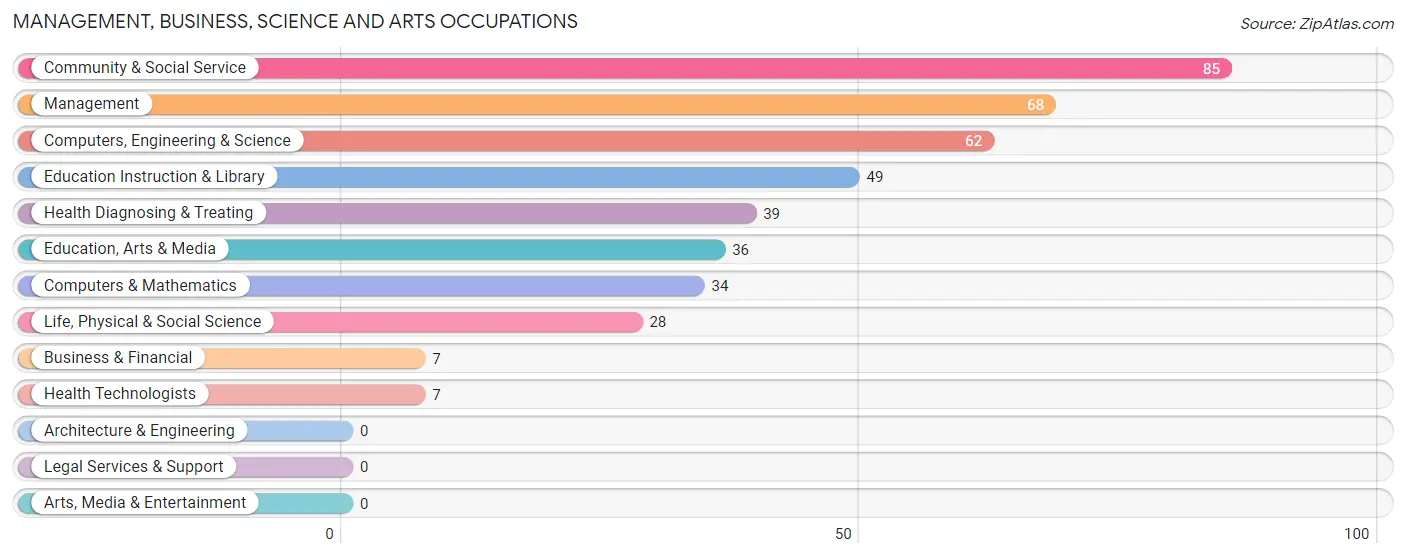
Management, Business, Science and Arts Occupations
The most common Management, Business, Science and Arts occupations in Grand Saline are Community & Social Service (85 | 6.6%), Management (68 | 5.3%), Computers, Engineering & Science (62 | 4.8%), Education Instruction & Library (49 | 3.8%), and Health Diagnosing & Treating (39 | 3.0%).
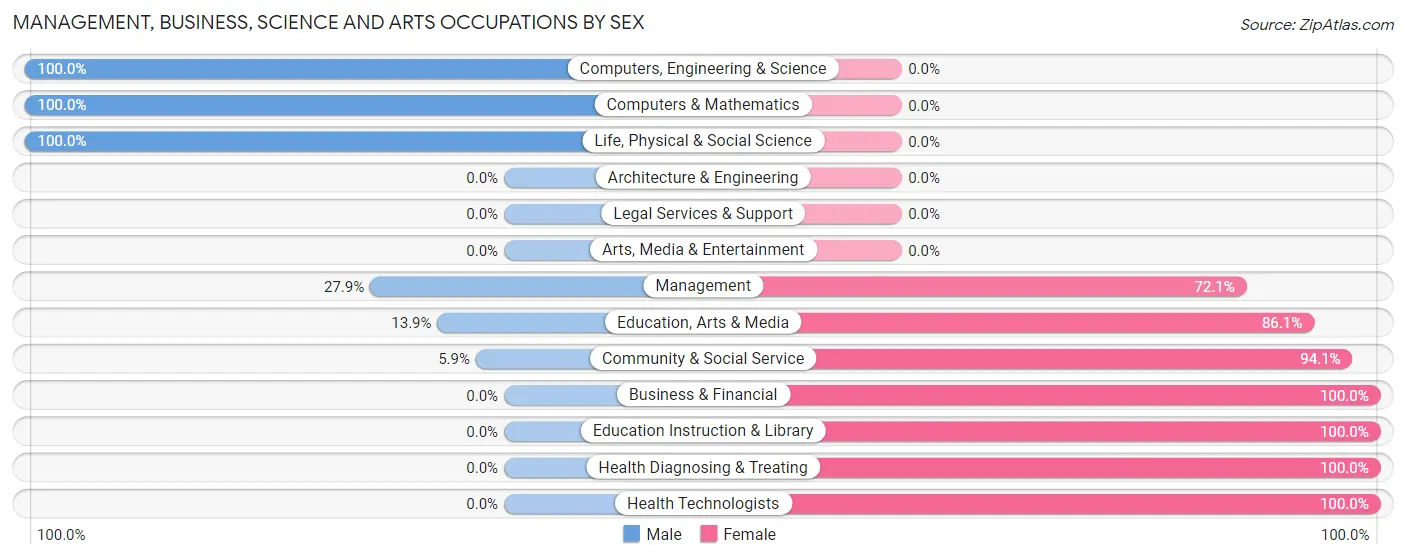
Management, Business, Science and Arts Occupations by Sex
Within the Management, Business, Science and Arts occupations in Grand Saline, the most male-oriented occupations are Computers, Engineering & Science (100.0%), Computers & Mathematics (100.0%), and Life, Physical & Social Science (100.0%), while the most female-oriented occupations are Business & Financial (100.0%), Education Instruction & Library (100.0%), and Health Diagnosing & Treating (100.0%).
| Occupation | Male | Female |
| Management | 19 (27.9%) | 49 (72.1%) |
| Business & Financial | 0 (0.0%) | 7 (100.0%) |
| Computers, Engineering & Science | 62 (100.0%) | 0 (0.0%) |
| Computers & Mathematics | 34 (100.0%) | 0 (0.0%) |
| Architecture & Engineering | 0 (0.0%) | 0 (0.0%) |
| Life, Physical & Social Science | 28 (100.0%) | 0 (0.0%) |
| Community & Social Service | 5 (5.9%) | 80 (94.1%) |
| Education, Arts & Media | 5 (13.9%) | 31 (86.1%) |
| Legal Services & Support | 0 (0.0%) | 0 (0.0%) |
| Education Instruction & Library | 0 (0.0%) | 49 (100.0%) |
| Arts, Media & Entertainment | 0 (0.0%) | 0 (0.0%) |
| Health Diagnosing & Treating | 0 (0.0%) | 39 (100.0%) |
| Health Technologists | 0 (0.0%) | 7 (100.0%) |
| Total (Category) | 86 (33.0%) | 175 (67.0%) |
| Total (Overall) | 705 (55.0%) | 577 (45.0%) |
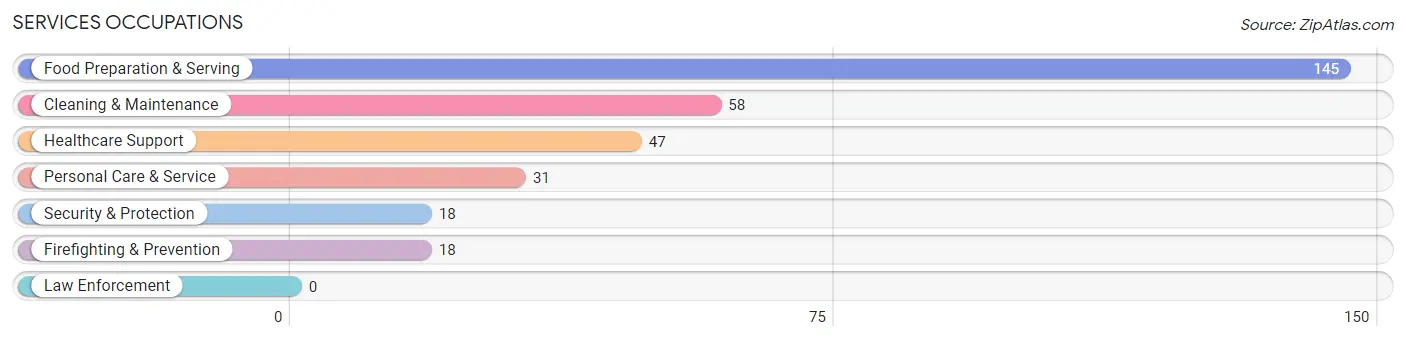
Services Occupations
The most common Services occupations in Grand Saline are Food Preparation & Serving (145 | 11.3%), Cleaning & Maintenance (58 | 4.5%), Healthcare Support (47 | 3.7%), Personal Care & Service (31 | 2.4%), and Security & Protection (18 | 1.4%).
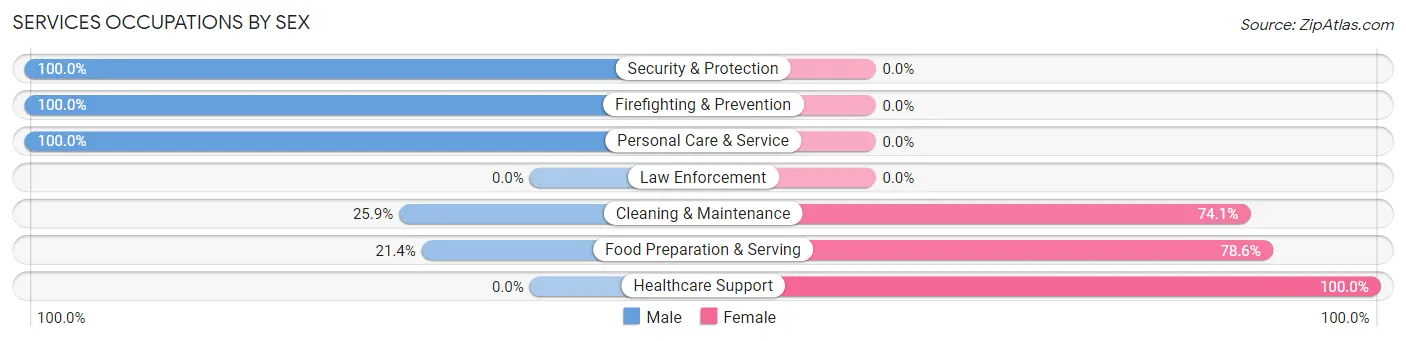
Services Occupations by Sex
Within the Services occupations in Grand Saline, the most male-oriented occupations are Security & Protection (100.0%), Firefighting & Prevention (100.0%), and Personal Care & Service (100.0%), while the most female-oriented occupations are Healthcare Support (100.0%), Food Preparation & Serving (78.6%), and Cleaning & Maintenance (74.1%).
| Occupation | Male | Female |
| Healthcare Support | 0 (0.0%) | 47 (100.0%) |
| Security & Protection | 18 (100.0%) | 0 (0.0%) |
| Firefighting & Prevention | 18 (100.0%) | 0 (0.0%) |
| Law Enforcement | 0 (0.0%) | 0 (0.0%) |
| Food Preparation & Serving | 31 (21.4%) | 114 (78.6%) |
| Cleaning & Maintenance | 15 (25.9%) | 43 (74.1%) |
| Personal Care & Service | 31 (100.0%) | 0 (0.0%) |
| Total (Category) | 95 (31.8%) | 204 (68.2%) |
| Total (Overall) | 705 (55.0%) | 577 (45.0%) |
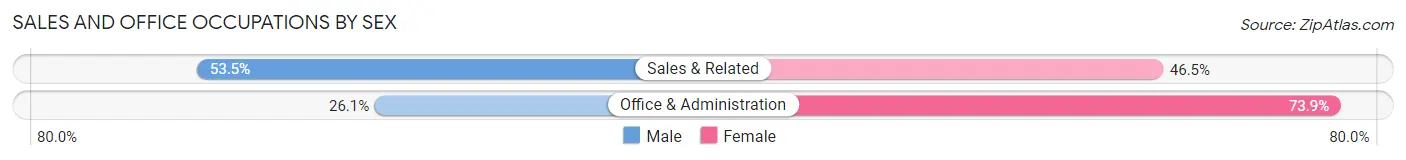
Sales and Office Occupations
The most common Sales and Office occupations in Grand Saline are Office & Administration (115 | 9.0%), and Sales & Related (86 | 6.7%).

Sales and Office Occupations by Sex
| Occupation | Male | Female |
| Sales & Related | 46 (53.5%) | 40 (46.5%) |
| Office & Administration | 30 (26.1%) | 85 (73.9%) |
| Total (Category) | 76 (37.8%) | 125 (62.2%) |
| Total (Overall) | 705 (55.0%) | 577 (45.0%) |
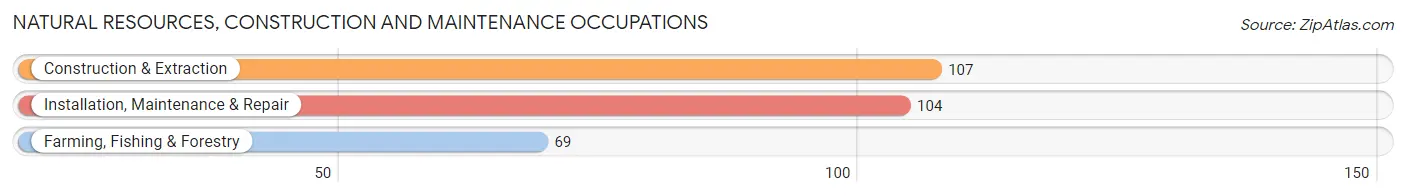
Natural Resources, Construction and Maintenance Occupations
The most common Natural Resources, Construction and Maintenance occupations in Grand Saline are Construction & Extraction (107 | 8.4%), Installation, Maintenance & Repair (104 | 8.1%), and Farming, Fishing & Forestry (69 | 5.4%).
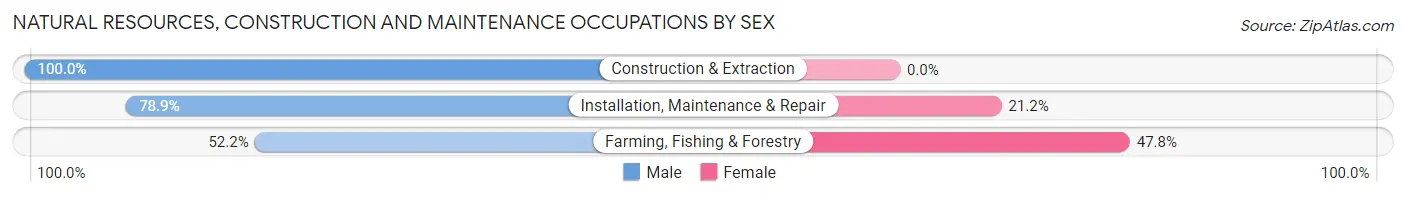
Natural Resources, Construction and Maintenance Occupations by Sex
| Occupation | Male | Female |
| Farming, Fishing & Forestry | 36 (52.2%) | 33 (47.8%) |
| Construction & Extraction | 107 (100.0%) | 0 (0.0%) |
| Installation, Maintenance & Repair | 82 (78.8%) | 22 (21.1%) |
| Total (Category) | 225 (80.4%) | 55 (19.6%) |
| Total (Overall) | 705 (55.0%) | 577 (45.0%) |
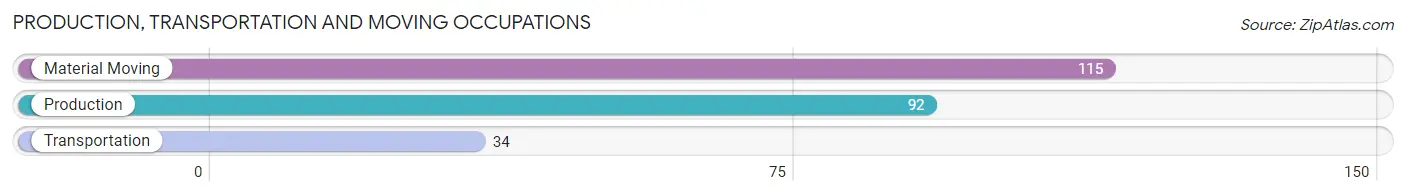
Production, Transportation and Moving Occupations
The most common Production, Transportation and Moving occupations in Grand Saline are Material Moving (115 | 9.0%), Production (92 | 7.2%), and Transportation (34 | 2.6%).
Production, Transportation and Moving Occupations by Sex
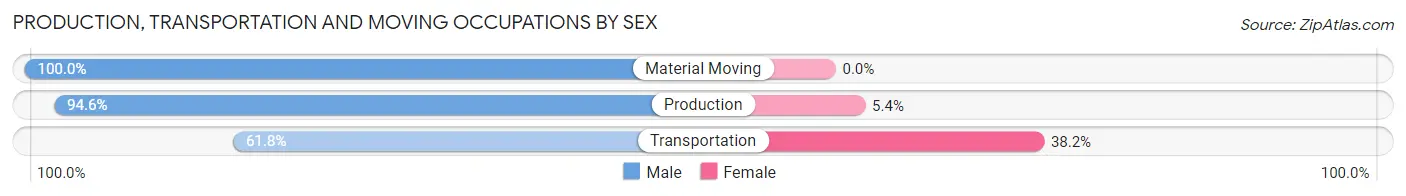
| Occupation | Male | Female |
| Production | 87 (94.6%) | 5 (5.4%) |
| Transportation | 21 (61.8%) | 13 (38.2%) |
| Material Moving | 115 (100.0%) | 0 (0.0%) |
| Total (Category) | 223 (92.5%) | 18 (7.5%) |
| Total (Overall) | 705 (55.0%) | 577 (45.0%) |
Employment Industries by Sex in Grand Saline
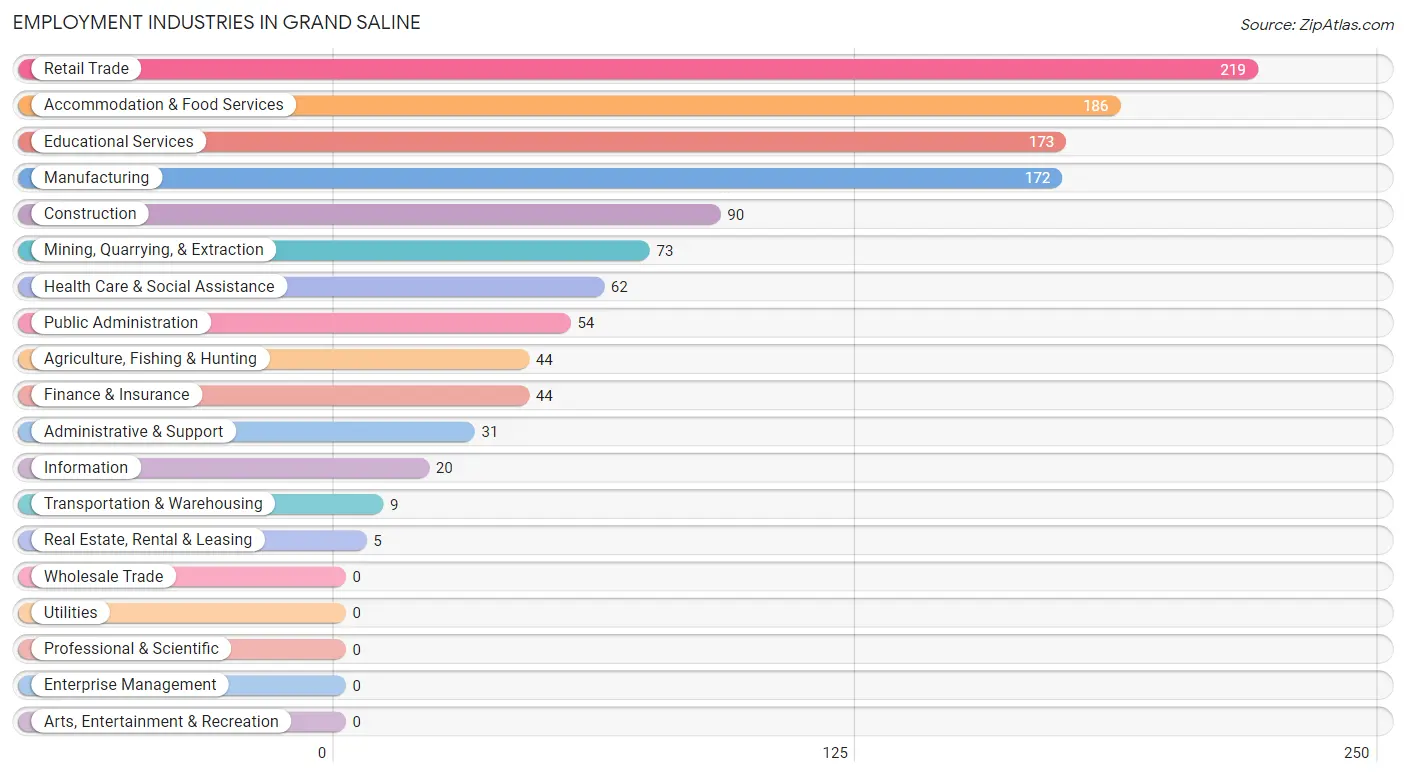
Employment Industries in Grand Saline
The major employment industries in Grand Saline include Retail Trade (219 | 17.1%), Accommodation & Food Services (186 | 14.5%), Educational Services (173 | 13.5%), Manufacturing (172 | 13.4%), and Construction (90 | 7.0%).
Employment Industries by Sex in Grand Saline
The Grand Saline industries that see more men than women are Construction (100.0%), Real Estate, Rental & Leasing (100.0%), and Manufacturing (94.8%), whereas the industries that tend to have a higher number of women are Transportation & Warehousing (100.0%), Finance & Insurance (100.0%), and Health Care & Social Assistance (100.0%).
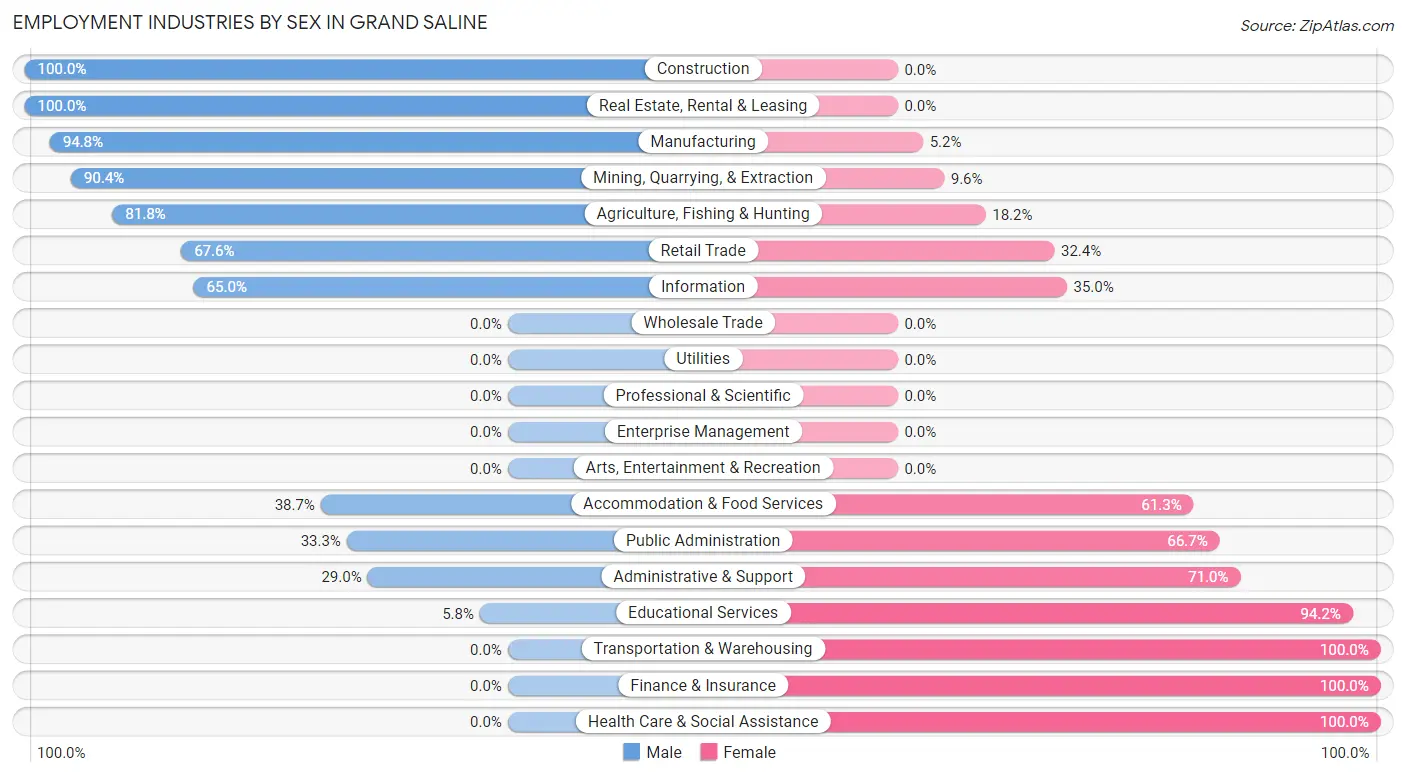
| Industry | Male | Female |
| Agriculture, Fishing & Hunting | 36 (81.8%) | 8 (18.2%) |
| Mining, Quarrying, & Extraction | 66 (90.4%) | 7 (9.6%) |
| Construction | 90 (100.0%) | 0 (0.0%) |
| Manufacturing | 163 (94.8%) | 9 (5.2%) |
| Wholesale Trade | 0 (0.0%) | 0 (0.0%) |
| Retail Trade | 148 (67.6%) | 71 (32.4%) |
| Transportation & Warehousing | 0 (0.0%) | 9 (100.0%) |
| Utilities | 0 (0.0%) | 0 (0.0%) |
| Information | 13 (65.0%) | 7 (35.0%) |
| Finance & Insurance | 0 (0.0%) | 44 (100.0%) |
| Real Estate, Rental & Leasing | 5 (100.0%) | 0 (0.0%) |
| Professional & Scientific | 0 (0.0%) | 0 (0.0%) |
| Enterprise Management | 0 (0.0%) | 0 (0.0%) |
| Administrative & Support | 9 (29.0%) | 22 (71.0%) |
| Educational Services | 10 (5.8%) | 163 (94.2%) |
| Health Care & Social Assistance | 0 (0.0%) | 62 (100.0%) |
| Arts, Entertainment & Recreation | 0 (0.0%) | 0 (0.0%) |
| Accommodation & Food Services | 72 (38.7%) | 114 (61.3%) |
| Public Administration | 18 (33.3%) | 36 (66.7%) |
| Total | 705 (55.0%) | 577 (45.0%) |
Education in Grand Saline
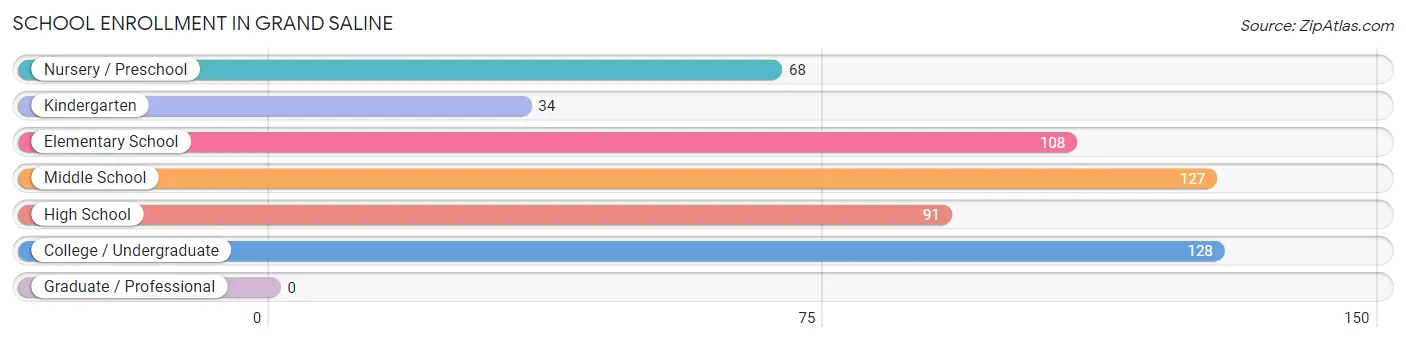
School Enrollment in Grand Saline
The most common levels of schooling among the 556 students in Grand Saline are college / undergraduate (128 | 23.0%), middle school (127 | 22.8%), and elementary school (108 | 19.4%).
| School Level | # Students | % Students |
| Nursery / Preschool | 68 | 12.2% |
| Kindergarten | 34 | 6.1% |
| Elementary School | 108 | 19.4% |
| Middle School | 127 | 22.8% |
| High School | 91 | 16.4% |
| College / Undergraduate | 128 | 23.0% |
| Graduate / Professional | 0 | 0.0% |
| Total | 556 | 100.0% |
School Enrollment by Age by Funding Source in Grand Saline
Out of a total of 556 students who are enrolled in schools in Grand Saline, 44 (7.9%) attend a private institution, while the remaining 512 (92.1%) are enrolled in public schools. The age group of 3 to 4 year olds has the highest likelihood of being enrolled in private schools, with 27 (39.7% in the age bracket) enrolled. Conversely, the age group of 5 to 9 year old has the lowest likelihood of being enrolled in a private school, with 122 (100.0% in the age bracket) attending a public institution.
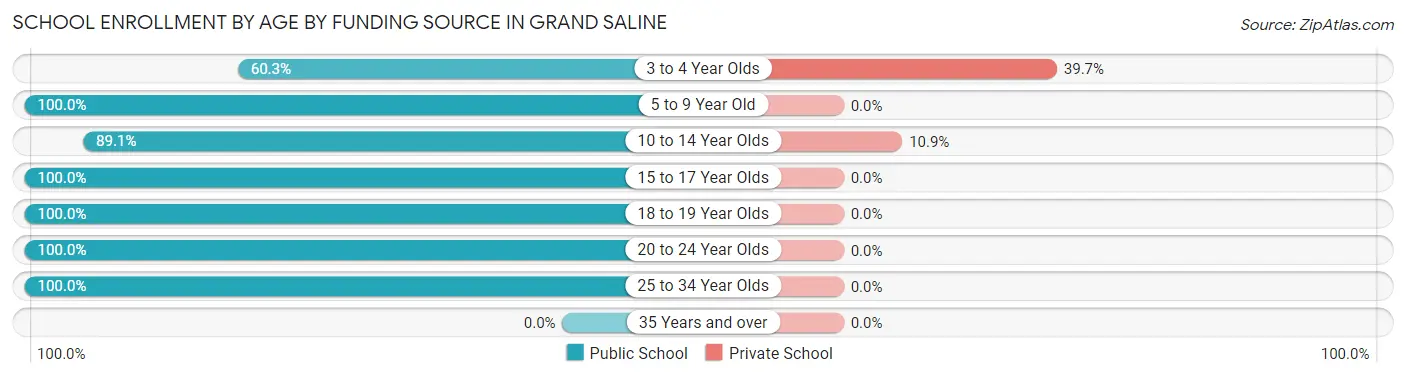
| Age Bracket | Public School | Private School |
| 3 to 4 Year Olds | 41 (60.3%) | 27 (39.7%) |
| 5 to 9 Year Old | 122 (100.0%) | 0 (0.0%) |
| 10 to 14 Year Olds | 139 (89.1%) | 17 (10.9%) |
| 15 to 17 Year Olds | 78 (100.0%) | 0 (0.0%) |
| 18 to 19 Year Olds | 24 (100.0%) | 0 (0.0%) |
| 20 to 24 Year Olds | 57 (100.0%) | 0 (0.0%) |
| 25 to 34 Year Olds | 51 (100.0%) | 0 (0.0%) |
| 35 Years and over | 0 (0.0%) | 0 (0.0%) |
| Total | 512 (92.1%) | 44 (7.9%) |
Educational Attainment by Field of Study in Grand Saline
Psychology (49 | 23.0%), education (36 | 16.9%), business (34 | 16.0%), visual & performing arts (31 | 14.5%), and multidisciplinary studies (19 | 8.9%) are the most common fields of study among 213 individuals in Grand Saline who have obtained a bachelor's degree or higher.
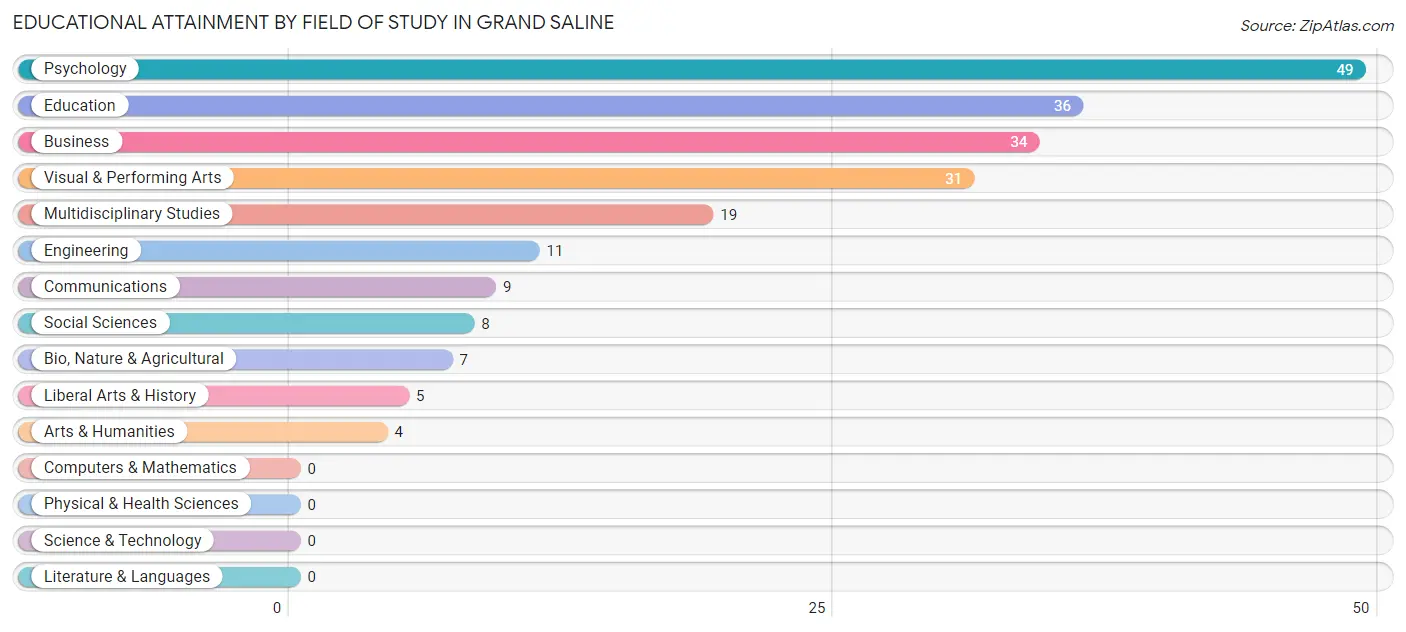
| Field of Study | # Graduates | % Graduates |
| Computers & Mathematics | 0 | 0.0% |
| Bio, Nature & Agricultural | 7 | 3.3% |
| Physical & Health Sciences | 0 | 0.0% |
| Psychology | 49 | 23.0% |
| Social Sciences | 8 | 3.8% |
| Engineering | 11 | 5.2% |
| Multidisciplinary Studies | 19 | 8.9% |
| Science & Technology | 0 | 0.0% |
| Business | 34 | 16.0% |
| Education | 36 | 16.9% |
| Literature & Languages | 0 | 0.0% |
| Liberal Arts & History | 5 | 2.4% |
| Visual & Performing Arts | 31 | 14.5% |
| Communications | 9 | 4.2% |
| Arts & Humanities | 4 | 1.9% |
| Total | 213 | 100.0% |
Transportation & Commute in Grand Saline
Vehicle Availability by Sex in Grand Saline
The most prevalent vehicle ownership categories in Grand Saline are males with 2 vehicles (320, accounting for 46.2%) and females with 2 vehicles (188, making up 61.0%).
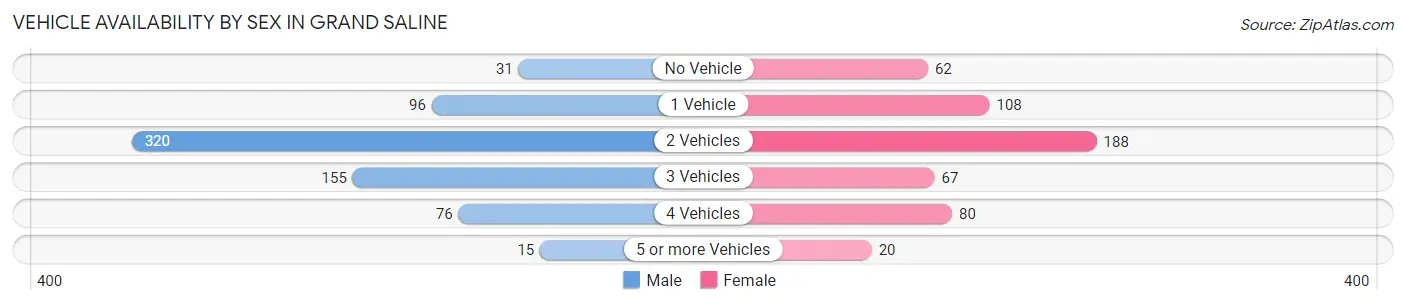
| Vehicles Available | Male | Female |
| No Vehicle | 31 (4.5%) | 62 (11.8%) |
| 1 Vehicle | 96 (13.9%) | 108 (20.6%) |
| 2 Vehicles | 320 (46.2%) | 188 (35.8%) |
| 3 Vehicles | 155 (22.4%) | 67 (12.8%) |
| 4 Vehicles | 76 (11.0%) | 80 (15.2%) |
| 5 or more Vehicles | 15 (2.2%) | 20 (3.8%) |
| Total | 693 (100.0%) | 525 (100.0%) |
Commute Time in Grand Saline
The most frequently occuring commute durations in Grand Saline are 10 to 14 minutes (236 commuters, 20.3%), 45 to 59 minutes (204 commuters, 17.5%), and 20 to 24 minutes (198 commuters, 17.0%).
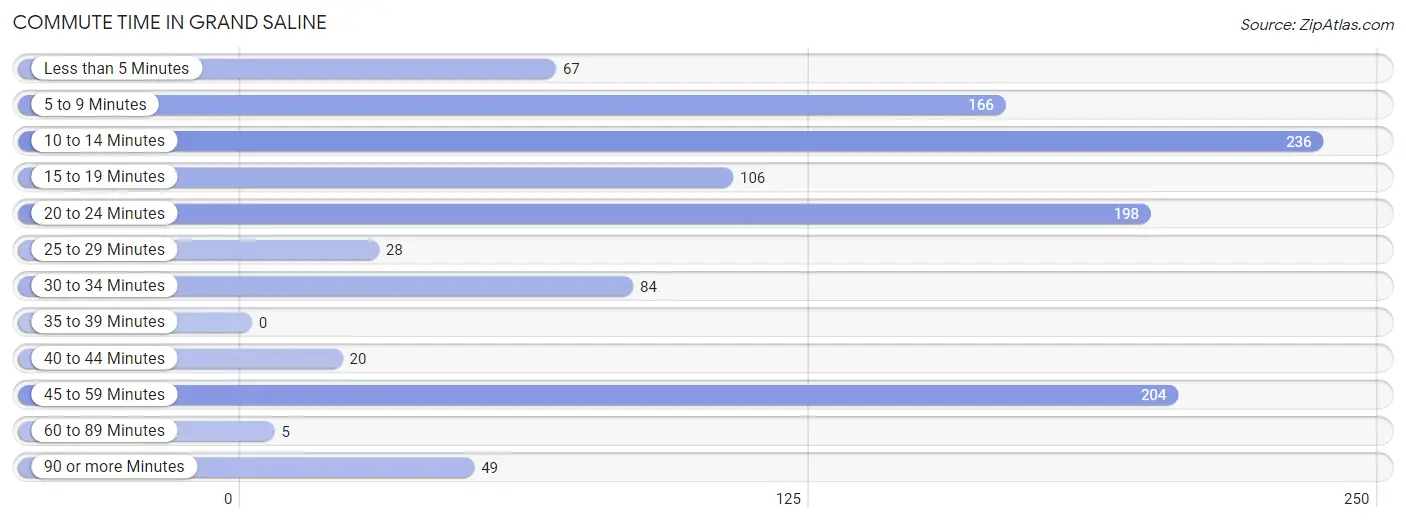
| Commute Time | # Commuters | % Commuters |
| Less than 5 Minutes | 67 | 5.8% |
| 5 to 9 Minutes | 166 | 14.3% |
| 10 to 14 Minutes | 236 | 20.3% |
| 15 to 19 Minutes | 106 | 9.1% |
| 20 to 24 Minutes | 198 | 17.0% |
| 25 to 29 Minutes | 28 | 2.4% |
| 30 to 34 Minutes | 84 | 7.2% |
| 35 to 39 Minutes | 0 | 0.0% |
| 40 to 44 Minutes | 20 | 1.7% |
| 45 to 59 Minutes | 204 | 17.5% |
| 60 to 89 Minutes | 5 | 0.4% |
| 90 or more Minutes | 49 | 4.2% |
Commute Time by Sex in Grand Saline
The most common commute times in Grand Saline are 45 to 59 minutes (186 commuters, 27.9%) for males and 20 to 24 minutes (133 commuters, 26.8%) for females.

| Commute Time | Male | Female |
| Less than 5 Minutes | 26 (3.9%) | 41 (8.3%) |
| 5 to 9 Minutes | 98 (14.7%) | 68 (13.7%) |
| 10 to 14 Minutes | 129 (19.3%) | 107 (21.6%) |
| 15 to 19 Minutes | 46 (6.9%) | 60 (12.1%) |
| 20 to 24 Minutes | 65 (9.8%) | 133 (26.8%) |
| 25 to 29 Minutes | 12 (1.8%) | 16 (3.2%) |
| 30 to 34 Minutes | 37 (5.6%) | 47 (9.5%) |
| 35 to 39 Minutes | 0 (0.0%) | 0 (0.0%) |
| 40 to 44 Minutes | 14 (2.1%) | 6 (1.2%) |
| 45 to 59 Minutes | 186 (27.9%) | 18 (3.6%) |
| 60 to 89 Minutes | 5 (0.7%) | 0 (0.0%) |
| 90 or more Minutes | 49 (7.3%) | 0 (0.0%) |
Time of Departure to Work by Sex in Grand Saline
The most frequent times of departure to work in Grand Saline are 7:00 AM to 7:29 AM (215, 32.2%) for males and 7:00 AM to 7:29 AM (74, 14.9%) for females.
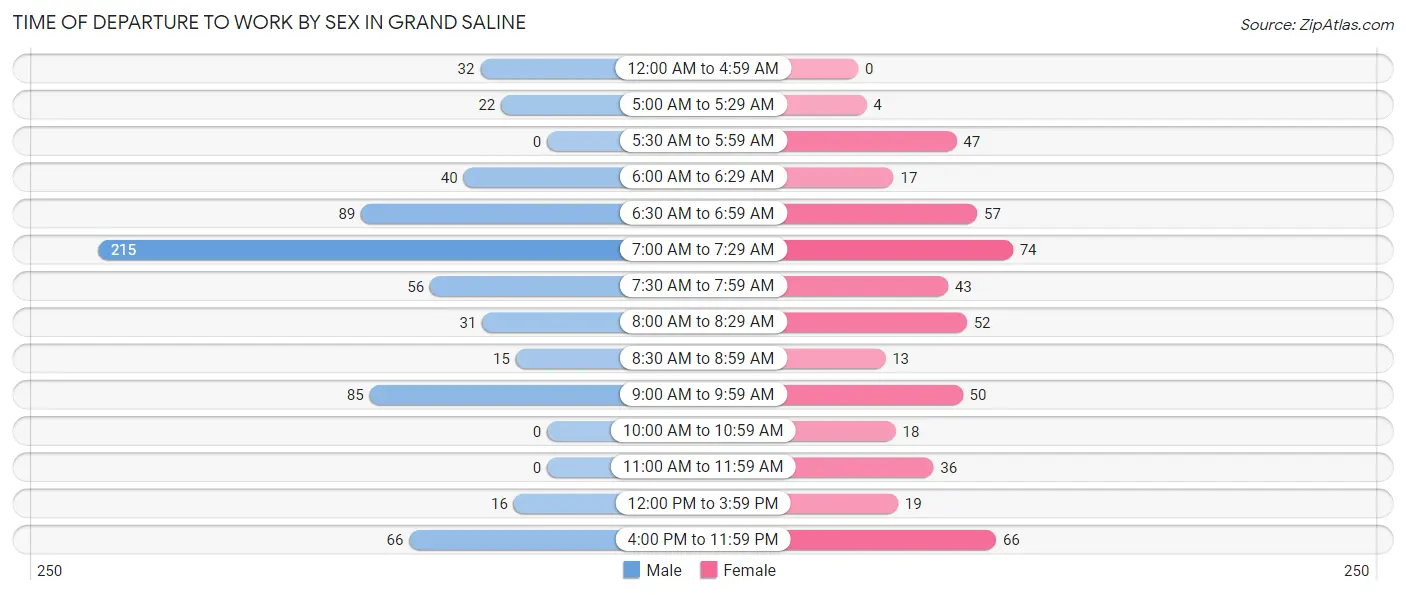
| Time of Departure | Male | Female |
| 12:00 AM to 4:59 AM | 32 (4.8%) | 0 (0.0%) |
| 5:00 AM to 5:29 AM | 22 (3.3%) | 4 (0.8%) |
| 5:30 AM to 5:59 AM | 0 (0.0%) | 47 (9.5%) |
| 6:00 AM to 6:29 AM | 40 (6.0%) | 17 (3.4%) |
| 6:30 AM to 6:59 AM | 89 (13.3%) | 57 (11.5%) |
| 7:00 AM to 7:29 AM | 215 (32.2%) | 74 (14.9%) |
| 7:30 AM to 7:59 AM | 56 (8.4%) | 43 (8.7%) |
| 8:00 AM to 8:29 AM | 31 (4.6%) | 52 (10.5%) |
| 8:30 AM to 8:59 AM | 15 (2.2%) | 13 (2.6%) |
| 9:00 AM to 9:59 AM | 85 (12.7%) | 50 (10.1%) |
| 10:00 AM to 10:59 AM | 0 (0.0%) | 18 (3.6%) |
| 11:00 AM to 11:59 AM | 0 (0.0%) | 36 (7.3%) |
| 12:00 PM to 3:59 PM | 16 (2.4%) | 19 (3.8%) |
| 4:00 PM to 11:59 PM | 66 (9.9%) | 66 (13.3%) |
| Total | 667 (100.0%) | 496 (100.0%) |
Housing Occupancy in Grand Saline
Occupancy by Ownership in Grand Saline
Of the total 1,202 dwellings in Grand Saline, owner-occupied units account for 810 (67.4%), while renter-occupied units make up 392 (32.6%).
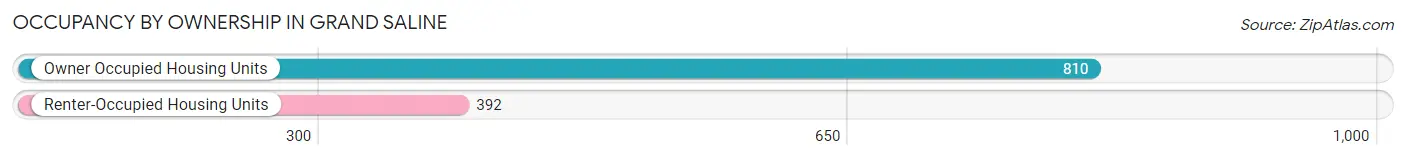
| Occupancy | # Housing Units | % Housing Units |
| Owner Occupied Housing Units | 810 | 67.4% |
| Renter-Occupied Housing Units | 392 | 32.6% |
| Total Occupied Housing Units | 1,202 | 100.0% |
Occupancy by Household Size in Grand Saline
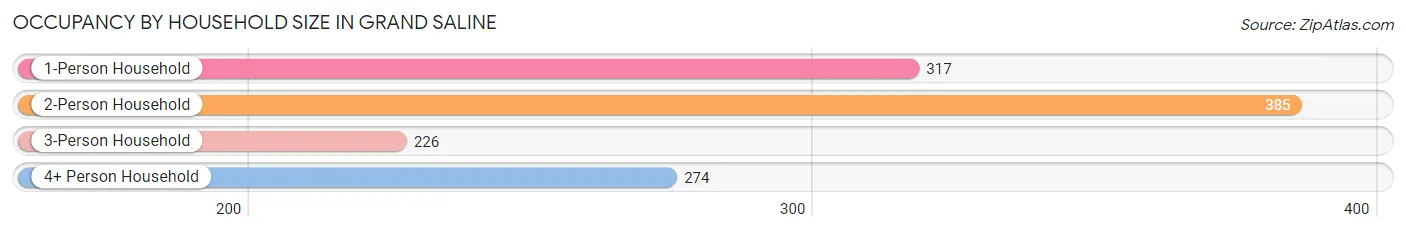
| Household Size | # Housing Units | % Housing Units |
| 1-Person Household | 317 | 26.4% |
| 2-Person Household | 385 | 32.0% |
| 3-Person Household | 226 | 18.8% |
| 4+ Person Household | 274 | 22.8% |
| Total Housing Units | 1,202 | 100.0% |
Occupancy by Ownership by Household Size in Grand Saline
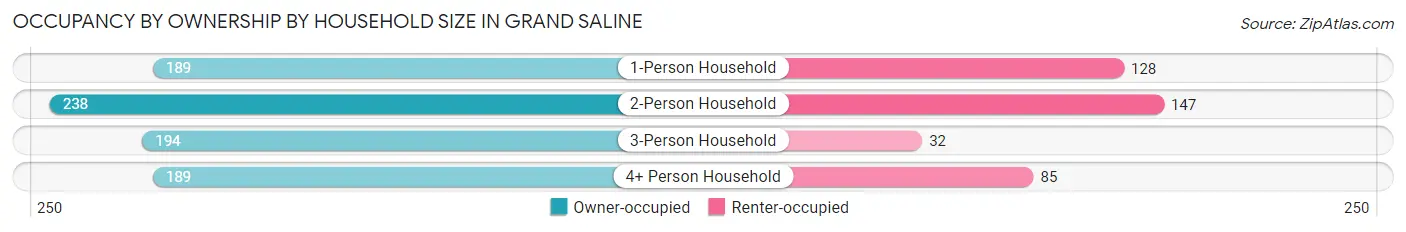
| Household Size | Owner-occupied | Renter-occupied |
| 1-Person Household | 189 (59.6%) | 128 (40.4%) |
| 2-Person Household | 238 (61.8%) | 147 (38.2%) |
| 3-Person Household | 194 (85.8%) | 32 (14.2%) |
| 4+ Person Household | 189 (69.0%) | 85 (31.0%) |
| Total Housing Units | 810 (67.4%) | 392 (32.6%) |
Occupancy by Educational Attainment in Grand Saline
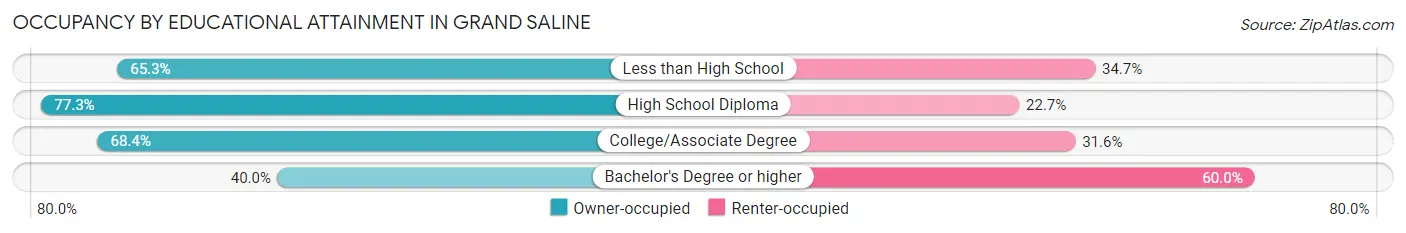
| Household Size | Owner-occupied | Renter-occupied |
| Less than High School | 205 (65.3%) | 109 (34.7%) |
| High School Diploma | 249 (77.3%) | 73 (22.7%) |
| College/Associate Degree | 312 (68.4%) | 144 (31.6%) |
| Bachelor's Degree or higher | 44 (40.0%) | 66 (60.0%) |
Occupancy by Age of Householder in Grand Saline
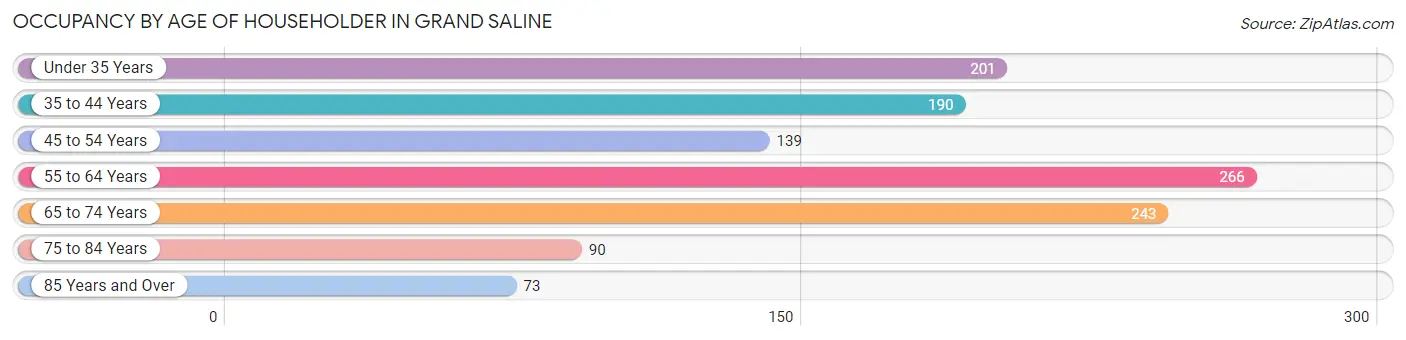
| Age Bracket | # Households | % Households |
| Under 35 Years | 201 | 16.7% |
| 35 to 44 Years | 190 | 15.8% |
| 45 to 54 Years | 139 | 11.6% |
| 55 to 64 Years | 266 | 22.1% |
| 65 to 74 Years | 243 | 20.2% |
| 75 to 84 Years | 90 | 7.5% |
| 85 Years and Over | 73 | 6.1% |
| Total | 1,202 | 100.0% |
Housing Finances in Grand Saline
Median Income by Occupancy in Grand Saline
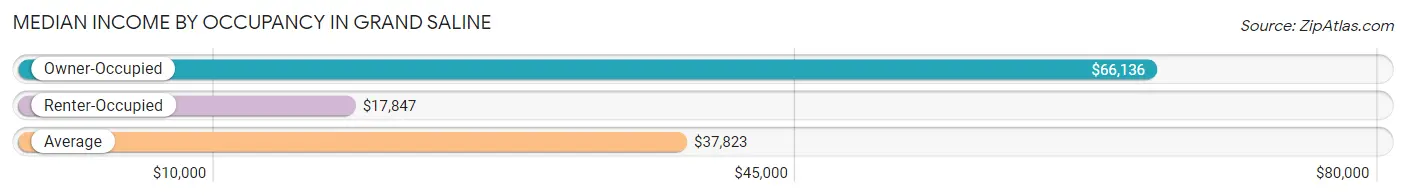
| Occupancy Type | # Households | Median Income |
| Owner-Occupied | 810 (67.4%) | $66,136 |
| Renter-Occupied | 392 (32.6%) | $17,847 |
| Average | 1,202 (100.0%) | $37,823 |
Occupancy by Householder Income Bracket in Grand Saline
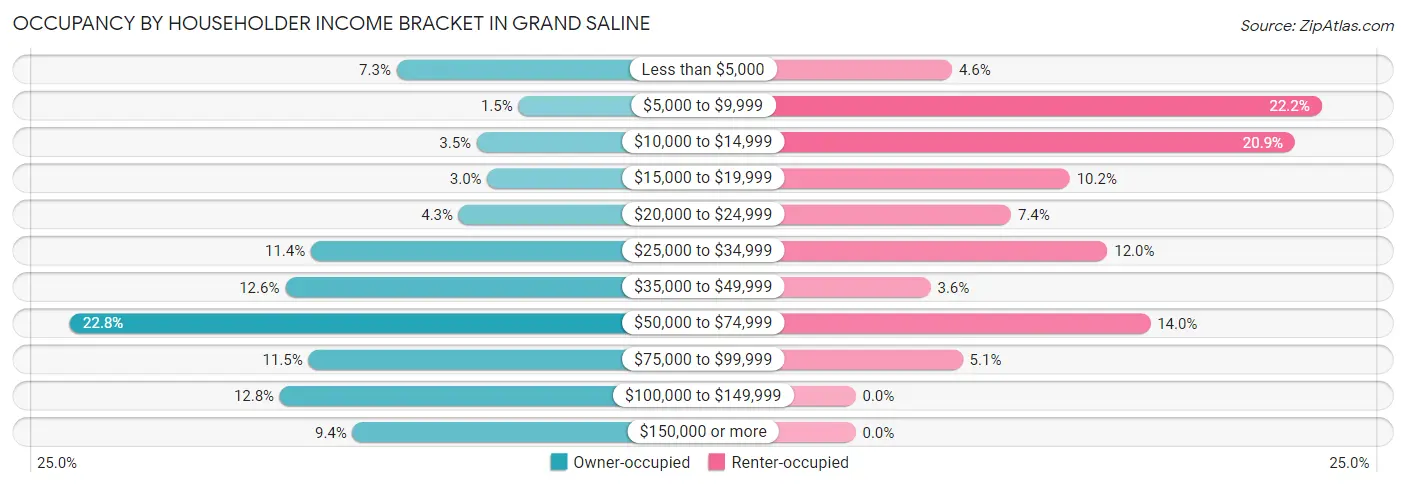
| Income Bracket | Owner-occupied | Renter-occupied |
| Less than $5,000 | 59 (7.3%) | 18 (4.6%) |
| $5,000 to $9,999 | 12 (1.5%) | 87 (22.2%) |
| $10,000 to $14,999 | 28 (3.5%) | 82 (20.9%) |
| $15,000 to $19,999 | 24 (3.0%) | 40 (10.2%) |
| $20,000 to $24,999 | 35 (4.3%) | 29 (7.4%) |
| $25,000 to $34,999 | 92 (11.4%) | 47 (12.0%) |
| $35,000 to $49,999 | 102 (12.6%) | 14 (3.6%) |
| $50,000 to $74,999 | 185 (22.8%) | 55 (14.0%) |
| $75,000 to $99,999 | 93 (11.5%) | 20 (5.1%) |
| $100,000 to $149,999 | 104 (12.8%) | 0 (0.0%) |
| $150,000 or more | 76 (9.4%) | 0 (0.0%) |
| Total | 810 (100.0%) | 392 (100.0%) |
Monthly Housing Cost Tiers in Grand Saline
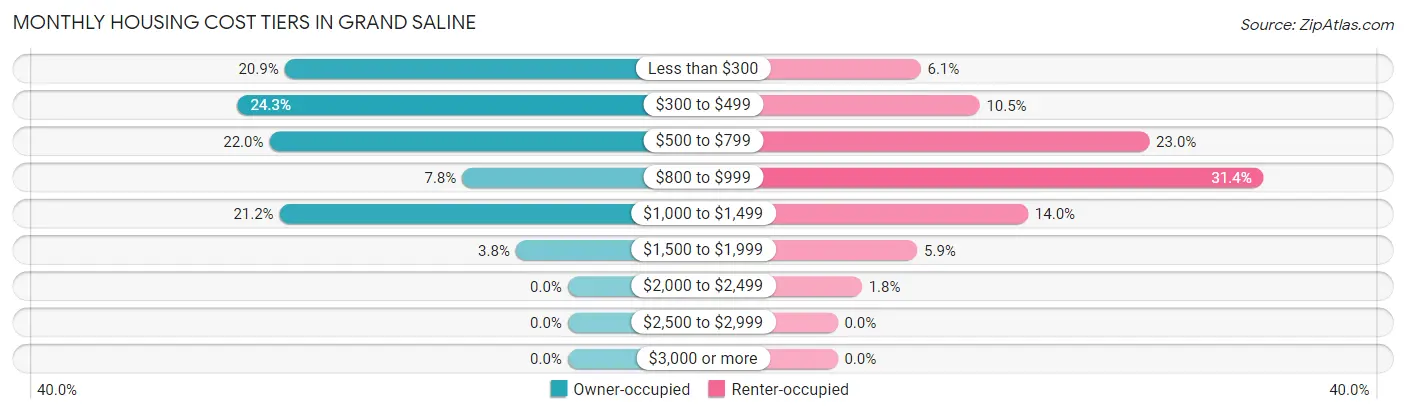
| Monthly Cost | Owner-occupied | Renter-occupied |
| Less than $300 | 169 (20.9%) | 24 (6.1%) |
| $300 to $499 | 197 (24.3%) | 41 (10.5%) |
| $500 to $799 | 178 (22.0%) | 90 (23.0%) |
| $800 to $999 | 63 (7.8%) | 123 (31.4%) |
| $1,000 to $1,499 | 172 (21.2%) | 55 (14.0%) |
| $1,500 to $1,999 | 31 (3.8%) | 23 (5.9%) |
| $2,000 to $2,499 | 0 (0.0%) | 7 (1.8%) |
| $2,500 to $2,999 | 0 (0.0%) | 0 (0.0%) |
| $3,000 or more | 0 (0.0%) | 0 (0.0%) |
| Total | 810 (100.0%) | 392 (100.0%) |
Physical Housing Characteristics in Grand Saline
Housing Structures in Grand Saline
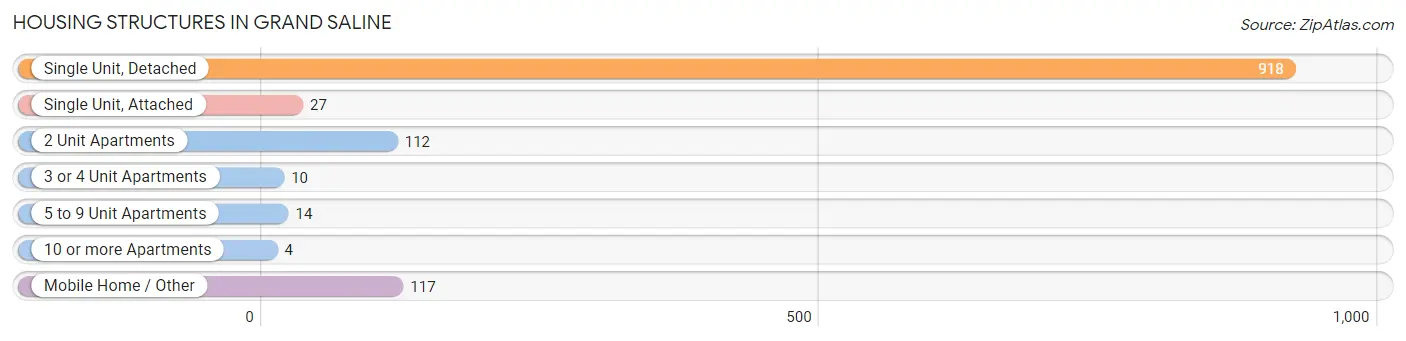
| Structure Type | # Housing Units | % Housing Units |
| Single Unit, Detached | 918 | 76.4% |
| Single Unit, Attached | 27 | 2.2% |
| 2 Unit Apartments | 112 | 9.3% |
| 3 or 4 Unit Apartments | 10 | 0.8% |
| 5 to 9 Unit Apartments | 14 | 1.2% |
| 10 or more Apartments | 4 | 0.3% |
| Mobile Home / Other | 117 | 9.7% |
| Total | 1,202 | 100.0% |
Housing Structures by Occupancy in Grand Saline
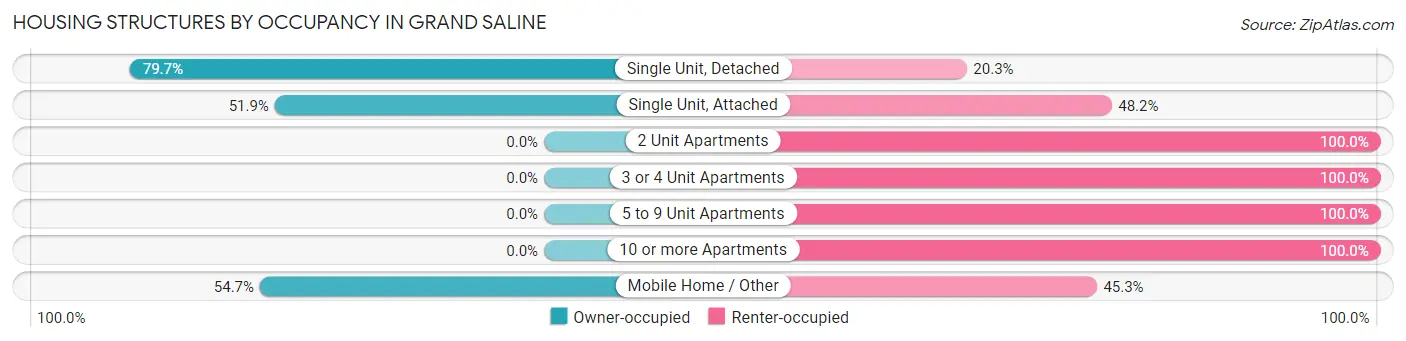
| Structure Type | Owner-occupied | Renter-occupied |
| Single Unit, Detached | 732 (79.7%) | 186 (20.3%) |
| Single Unit, Attached | 14 (51.8%) | 13 (48.1%) |
| 2 Unit Apartments | 0 (0.0%) | 112 (100.0%) |
| 3 or 4 Unit Apartments | 0 (0.0%) | 10 (100.0%) |
| 5 to 9 Unit Apartments | 0 (0.0%) | 14 (100.0%) |
| 10 or more Apartments | 0 (0.0%) | 4 (100.0%) |
| Mobile Home / Other | 64 (54.7%) | 53 (45.3%) |
| Total | 810 (67.4%) | 392 (32.6%) |
Housing Structures by Number of Rooms in Grand Saline
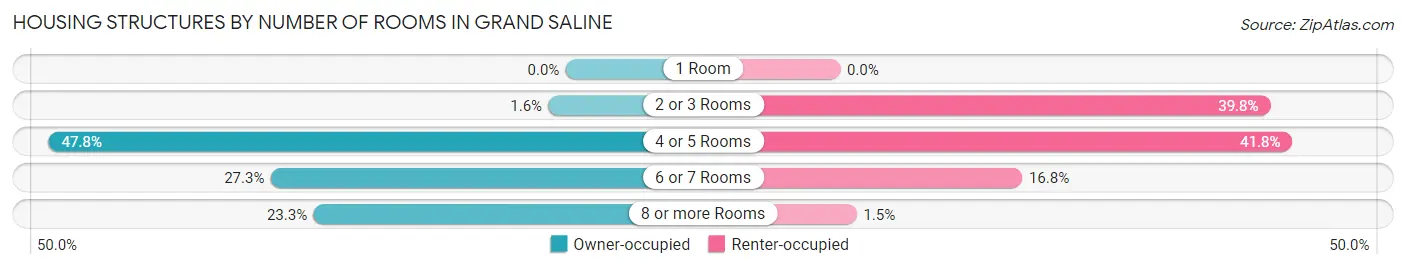
| Number of Rooms | Owner-occupied | Renter-occupied |
| 1 Room | 0 (0.0%) | 0 (0.0%) |
| 2 or 3 Rooms | 13 (1.6%) | 156 (39.8%) |
| 4 or 5 Rooms | 387 (47.8%) | 164 (41.8%) |
| 6 or 7 Rooms | 221 (27.3%) | 66 (16.8%) |
| 8 or more Rooms | 189 (23.3%) | 6 (1.5%) |
| Total | 810 (100.0%) | 392 (100.0%) |
Housing Structure by Heating Type in Grand Saline
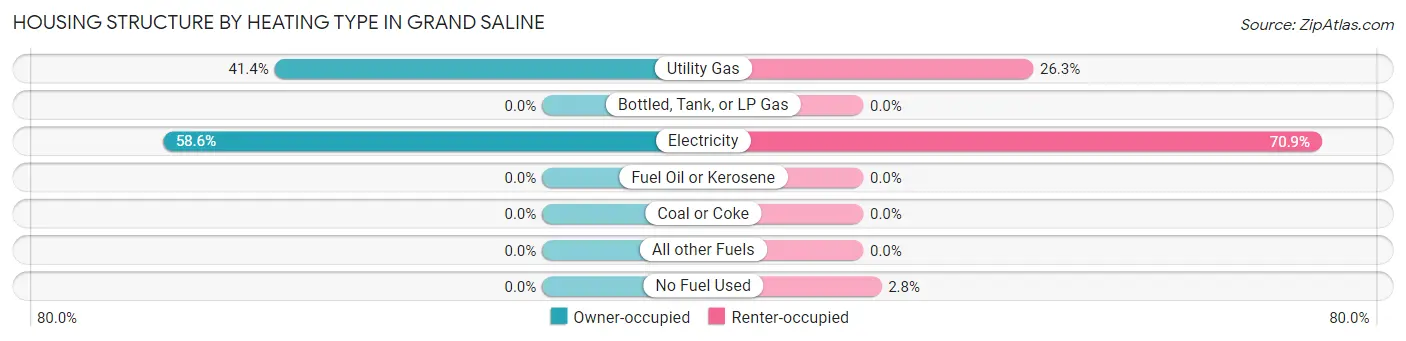
| Heating Type | Owner-occupied | Renter-occupied |
| Utility Gas | 335 (41.4%) | 103 (26.3%) |
| Bottled, Tank, or LP Gas | 0 (0.0%) | 0 (0.0%) |
| Electricity | 475 (58.6%) | 278 (70.9%) |
| Fuel Oil or Kerosene | 0 (0.0%) | 0 (0.0%) |
| Coal or Coke | 0 (0.0%) | 0 (0.0%) |
| All other Fuels | 0 (0.0%) | 0 (0.0%) |
| No Fuel Used | 0 (0.0%) | 11 (2.8%) |
| Total | 810 (100.0%) | 392 (100.0%) |
Household Vehicle Usage in Grand Saline
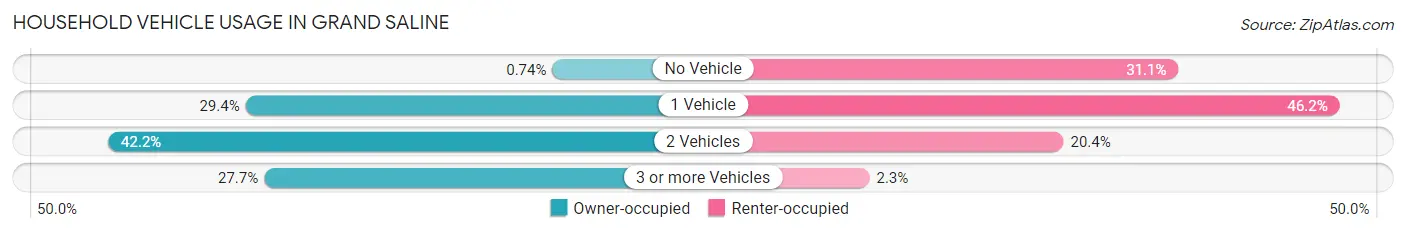
| Vehicles per Household | Owner-occupied | Renter-occupied |
| No Vehicle | 6 (0.7%) | 122 (31.1%) |
| 1 Vehicle | 238 (29.4%) | 181 (46.2%) |
| 2 Vehicles | 342 (42.2%) | 80 (20.4%) |
| 3 or more Vehicles | 224 (27.7%) | 9 (2.3%) |
| Total | 810 (100.0%) | 392 (100.0%) |
Real Estate & Mortgages in Grand Saline
Real Estate and Mortgage Overview in Grand Saline
| Characteristic | Without Mortgage | With Mortgage |
| Housing Units | 581 | 229 |
| Median Property Value | $77,400 | $153,400 |
| Median Household Income | $38,603 | $4 |
| Monthly Housing Costs | $403 | $0 |
| Real Estate Taxes | $1,035 | $4 |
Property Value by Mortgage Status in Grand Saline
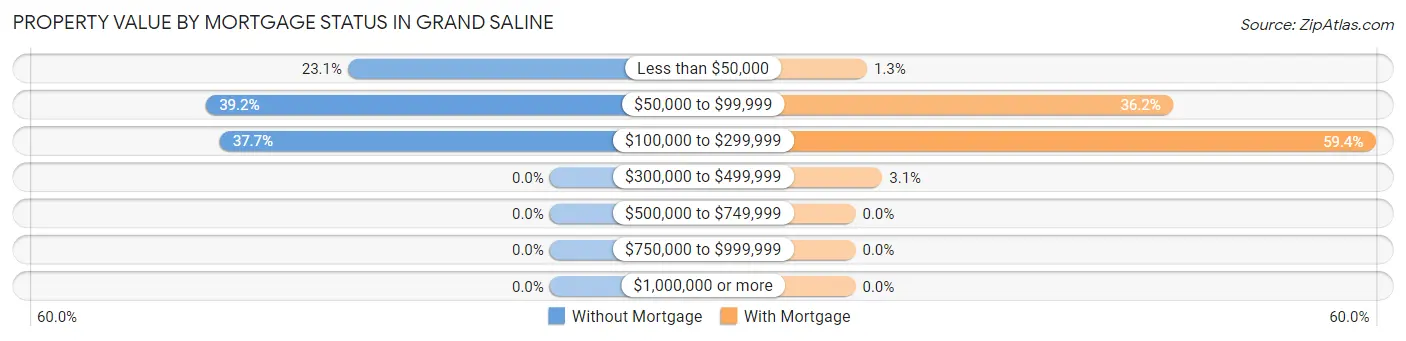
| Property Value | Without Mortgage | With Mortgage |
| Less than $50,000 | 134 (23.1%) | 3 (1.3%) |
| $50,000 to $99,999 | 228 (39.2%) | 83 (36.2%) |
| $100,000 to $299,999 | 219 (37.7%) | 136 (59.4%) |
| $300,000 to $499,999 | 0 (0.0%) | 7 (3.1%) |
| $500,000 to $749,999 | 0 (0.0%) | 0 (0.0%) |
| $750,000 to $999,999 | 0 (0.0%) | 0 (0.0%) |
| $1,000,000 or more | 0 (0.0%) | 0 (0.0%) |
| Total | 581 (100.0%) | 229 (100.0%) |
Household Income by Mortgage Status in Grand Saline
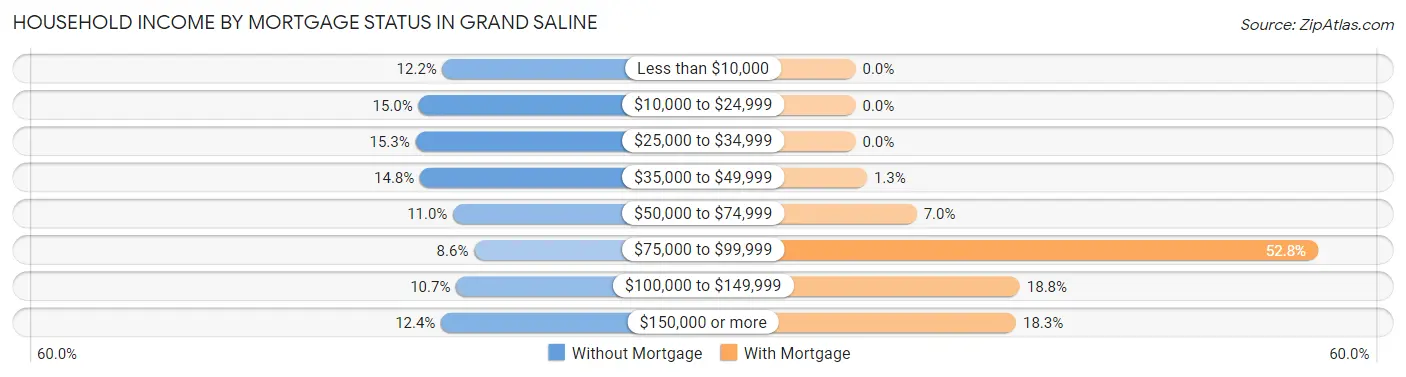
| Household Income | Without Mortgage | With Mortgage |
| Less than $10,000 | 71 (12.2%) | 0 (0.0%) |
| $10,000 to $24,999 | 87 (15.0%) | 0 (0.0%) |
| $25,000 to $34,999 | 89 (15.3%) | 0 (0.0%) |
| $35,000 to $49,999 | 86 (14.8%) | 3 (1.3%) |
| $50,000 to $74,999 | 64 (11.0%) | 16 (7.0%) |
| $75,000 to $99,999 | 50 (8.6%) | 121 (52.8%) |
| $100,000 to $149,999 | 62 (10.7%) | 43 (18.8%) |
| $150,000 or more | 72 (12.4%) | 42 (18.3%) |
| Total | 581 (100.0%) | 229 (100.0%) |
Property Value to Household Income Ratio in Grand Saline
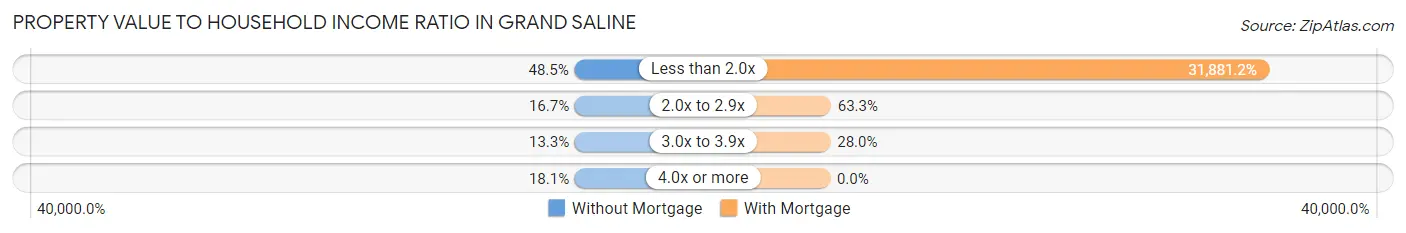
| Value-to-Income Ratio | Without Mortgage | With Mortgage |
| Less than 2.0x | 282 (48.5%) | 73,008 (31,881.2%) |
| 2.0x to 2.9x | 97 (16.7%) | 145 (63.3%) |
| 3.0x to 3.9x | 77 (13.3%) | 64 (28.0%) |
| 4.0x or more | 105 (18.1%) | 0 (0.0%) |
| Total | 581 (100.0%) | 229 (100.0%) |
Real Estate Taxes by Mortgage Status in Grand Saline
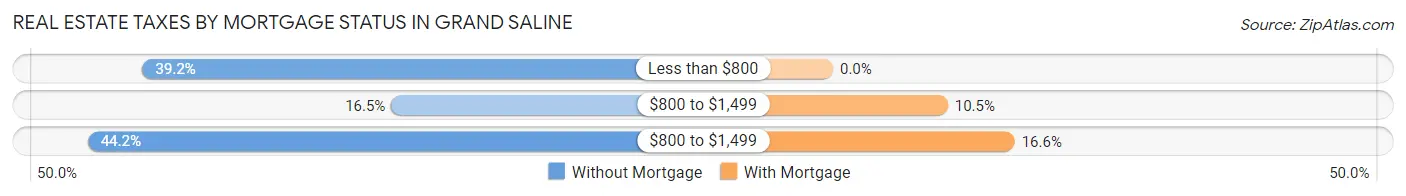
| Property Taxes | Without Mortgage | With Mortgage |
| Less than $800 | 228 (39.2%) | 0 (0.0%) |
| $800 to $1,499 | 96 (16.5%) | 24 (10.5%) |
| $800 to $1,499 | 257 (44.2%) | 38 (16.6%) |
| Total | 581 (100.0%) | 229 (100.0%) |
Health & Disability in Grand Saline
Health Insurance Coverage by Age in Grand Saline
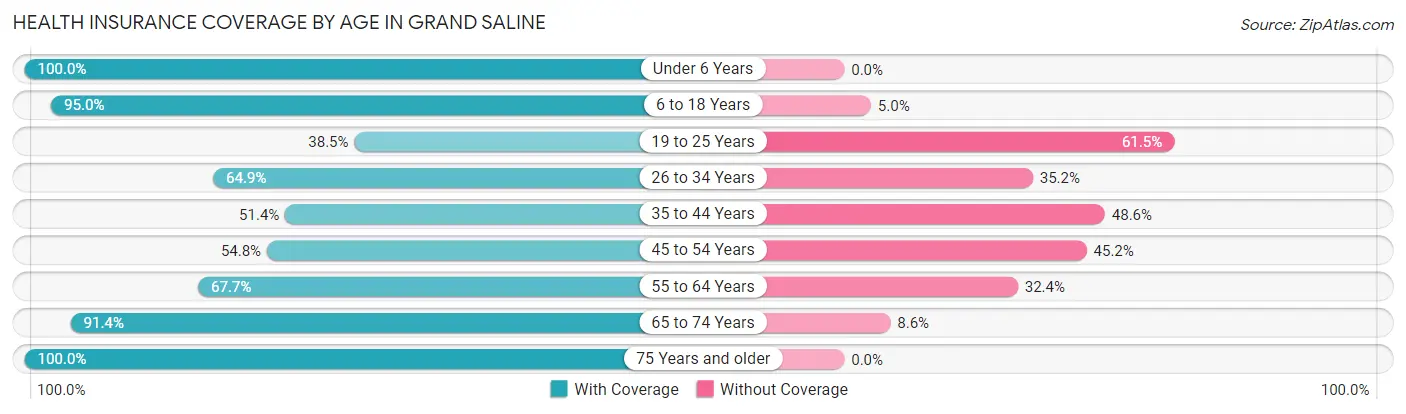
| Age Bracket | With Coverage | Without Coverage |
| Under 6 Years | 273 (100.0%) | 0 (0.0%) |
| 6 to 18 Years | 345 (95.0%) | 18 (5.0%) |
| 19 to 25 Years | 67 (38.5%) | 107 (61.5%) |
| 26 to 34 Years | 297 (64.8%) | 161 (35.1%) |
| 35 to 44 Years | 200 (51.4%) | 189 (48.6%) |
| 45 to 54 Years | 205 (54.8%) | 169 (45.2%) |
| 55 to 64 Years | 253 (67.6%) | 121 (32.4%) |
| 65 to 74 Years | 298 (91.4%) | 28 (8.6%) |
| 75 Years and older | 205 (100.0%) | 0 (0.0%) |
| Total | 2,143 (73.0%) | 793 (27.0%) |
Health Insurance Coverage by Citizenship Status in Grand Saline
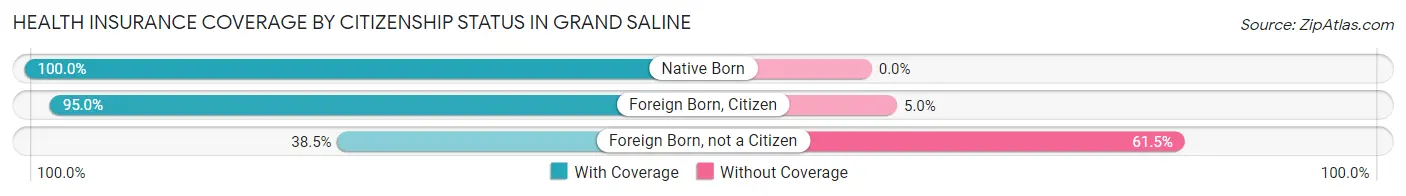
| Citizenship Status | With Coverage | Without Coverage |
| Native Born | 273 (100.0%) | 0 (0.0%) |
| Foreign Born, Citizen | 345 (95.0%) | 18 (5.0%) |
| Foreign Born, not a Citizen | 67 (38.5%) | 107 (61.5%) |
Health Insurance Coverage by Household Income in Grand Saline
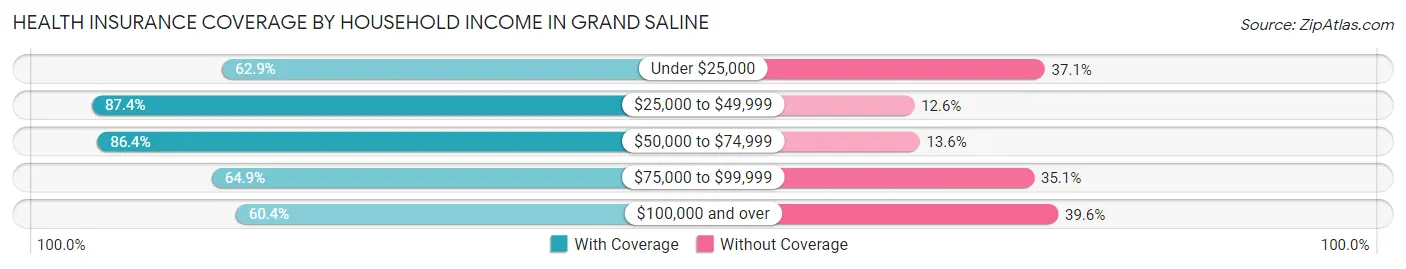
| Household Income | With Coverage | Without Coverage |
| Under $25,000 | 460 (62.9%) | 271 (37.1%) |
| $25,000 to $49,999 | 491 (87.4%) | 71 (12.6%) |
| $50,000 to $74,999 | 609 (86.4%) | 96 (13.6%) |
| $75,000 to $99,999 | 235 (64.9%) | 127 (35.1%) |
| $100,000 and over | 348 (60.4%) | 228 (39.6%) |
Public vs Private Health Insurance Coverage by Age in Grand Saline
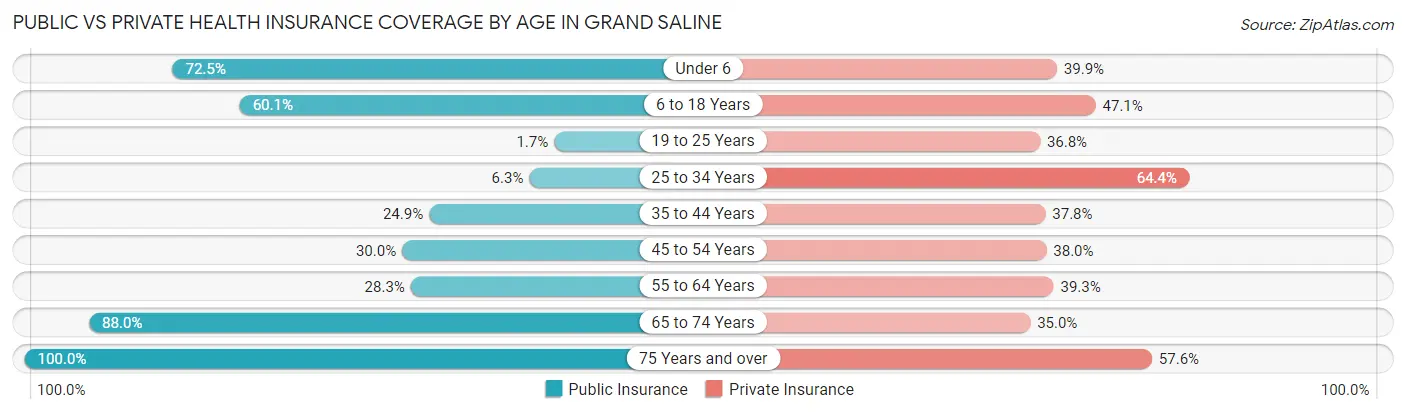
| Age Bracket | Public Insurance | Private Insurance |
| Under 6 | 198 (72.5%) | 109 (39.9%) |
| 6 to 18 Years | 218 (60.1%) | 171 (47.1%) |
| 19 to 25 Years | 3 (1.7%) | 64 (36.8%) |
| 25 to 34 Years | 29 (6.3%) | 295 (64.4%) |
| 35 to 44 Years | 97 (24.9%) | 147 (37.8%) |
| 45 to 54 Years | 112 (29.9%) | 142 (38.0%) |
| 55 to 64 Years | 106 (28.3%) | 147 (39.3%) |
| 65 to 74 Years | 287 (88.0%) | 114 (35.0%) |
| 75 Years and over | 205 (100.0%) | 118 (57.6%) |
| Total | 1,255 (42.7%) | 1,307 (44.5%) |
Disability Status by Sex by Age in Grand Saline
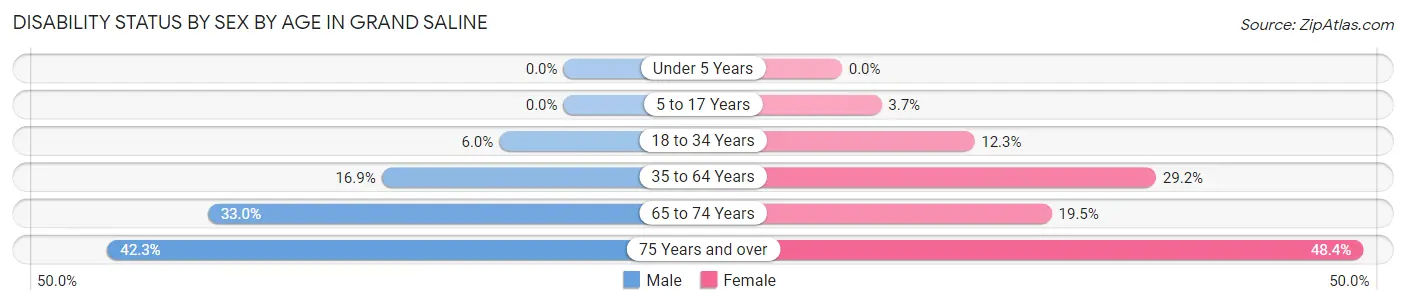
| Age Bracket | Male | Female |
| Under 5 Years | 0 (0.0%) | 0 (0.0%) |
| 5 to 17 Years | 0 (0.0%) | 9 (3.7%) |
| 18 to 34 Years | 24 (6.0%) | 31 (12.3%) |
| 35 to 64 Years | 79 (16.9%) | 195 (29.1%) |
| 65 to 74 Years | 33 (33.0%) | 44 (19.5%) |
| 75 Years and over | 22 (42.3%) | 74 (48.4%) |
Disability Class by Sex by Age in Grand Saline
Disability Class: Hearing Difficulty
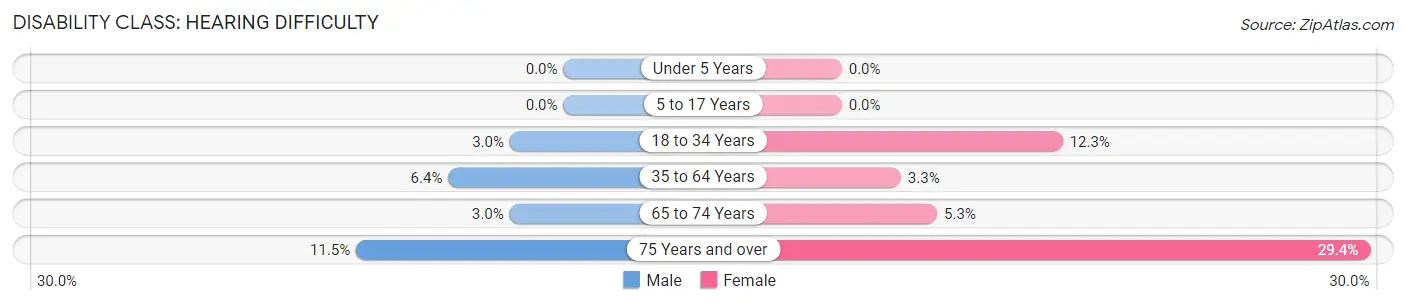
| Age Bracket | Male | Female |
| Under 5 Years | 0 (0.0%) | 0 (0.0%) |
| 5 to 17 Years | 0 (0.0%) | 0 (0.0%) |
| 18 to 34 Years | 12 (3.0%) | 31 (12.3%) |
| 35 to 64 Years | 30 (6.4%) | 22 (3.3%) |
| 65 to 74 Years | 3 (3.0%) | 12 (5.3%) |
| 75 Years and over | 6 (11.5%) | 45 (29.4%) |
Disability Class: Vision Difficulty
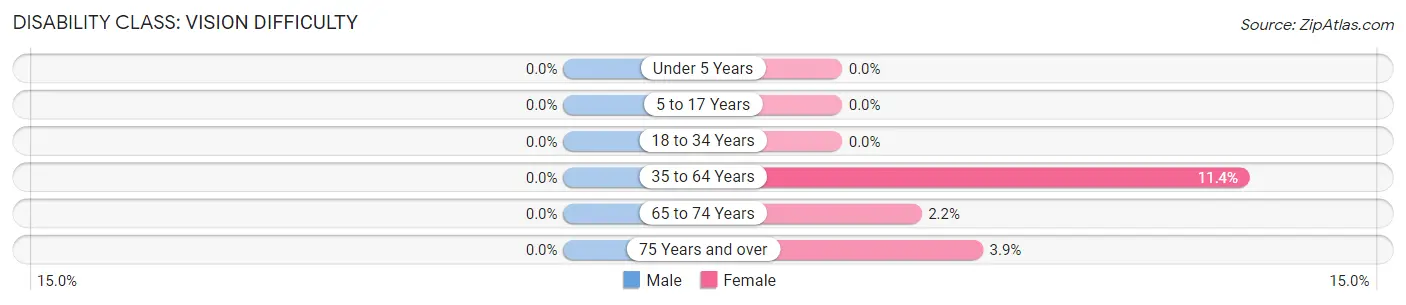
| Age Bracket | Male | Female |
| Under 5 Years | 0 (0.0%) | 0 (0.0%) |
| 5 to 17 Years | 0 (0.0%) | 0 (0.0%) |
| 18 to 34 Years | 0 (0.0%) | 0 (0.0%) |
| 35 to 64 Years | 0 (0.0%) | 76 (11.4%) |
| 65 to 74 Years | 0 (0.0%) | 5 (2.2%) |
| 75 Years and over | 0 (0.0%) | 6 (3.9%) |
Disability Class: Cognitive Difficulty
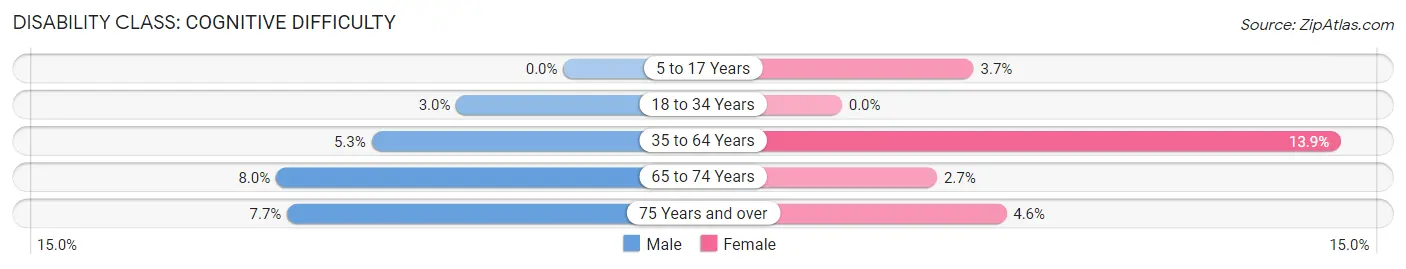
| Age Bracket | Male | Female |
| 5 to 17 Years | 0 (0.0%) | 9 (3.7%) |
| 18 to 34 Years | 12 (3.0%) | 0 (0.0%) |
| 35 to 64 Years | 25 (5.3%) | 93 (13.9%) |
| 65 to 74 Years | 8 (8.0%) | 6 (2.6%) |
| 75 Years and over | 4 (7.7%) | 7 (4.6%) |
Disability Class: Ambulatory Difficulty
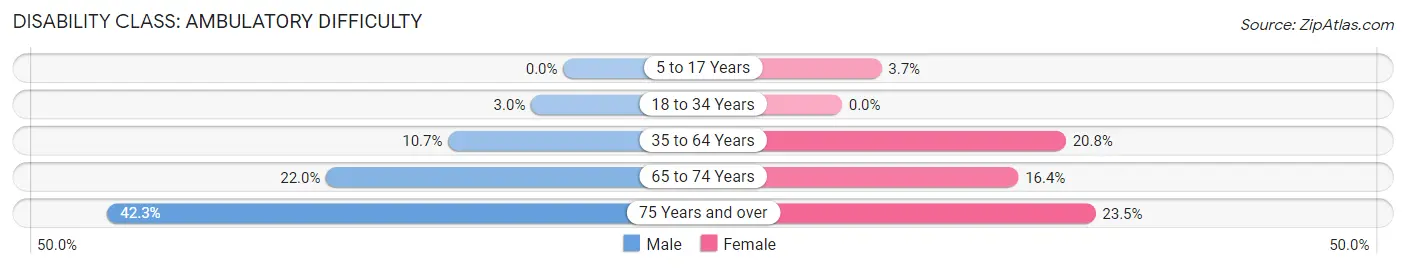
| Age Bracket | Male | Female |
| 5 to 17 Years | 0 (0.0%) | 9 (3.7%) |
| 18 to 34 Years | 12 (3.0%) | 0 (0.0%) |
| 35 to 64 Years | 50 (10.7%) | 139 (20.8%) |
| 65 to 74 Years | 22 (22.0%) | 37 (16.4%) |
| 75 Years and over | 22 (42.3%) | 36 (23.5%) |
Disability Class: Self-Care Difficulty
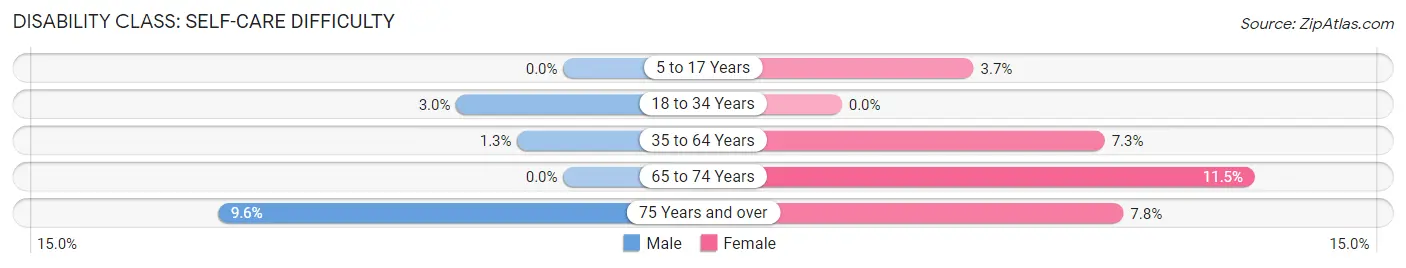
| Age Bracket | Male | Female |
| 5 to 17 Years | 0 (0.0%) | 9 (3.7%) |
| 18 to 34 Years | 12 (3.0%) | 0 (0.0%) |
| 35 to 64 Years | 6 (1.3%) | 49 (7.3%) |
| 65 to 74 Years | 0 (0.0%) | 26 (11.5%) |
| 75 Years and over | 5 (9.6%) | 12 (7.8%) |
Technology Access in Grand Saline
Computing Device Access in Grand Saline
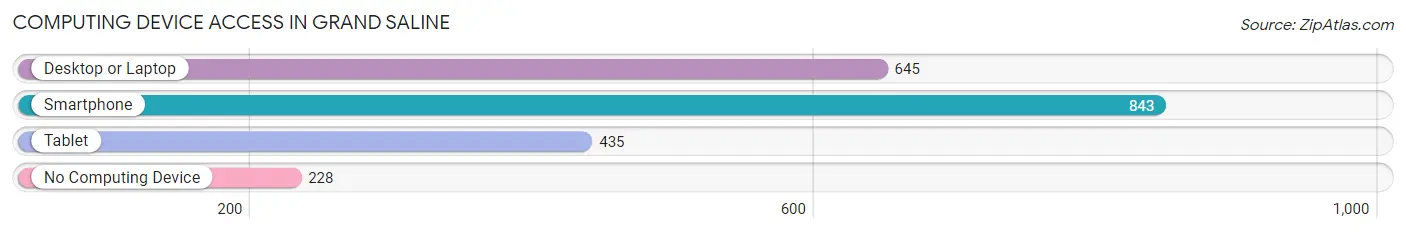
| Device Type | # Households | % Households |
| Desktop or Laptop | 645 | 53.7% |
| Smartphone | 843 | 70.1% |
| Tablet | 435 | 36.2% |
| No Computing Device | 228 | 19.0% |
| Total | 1,202 | 100.0% |
Internet Access in Grand Saline
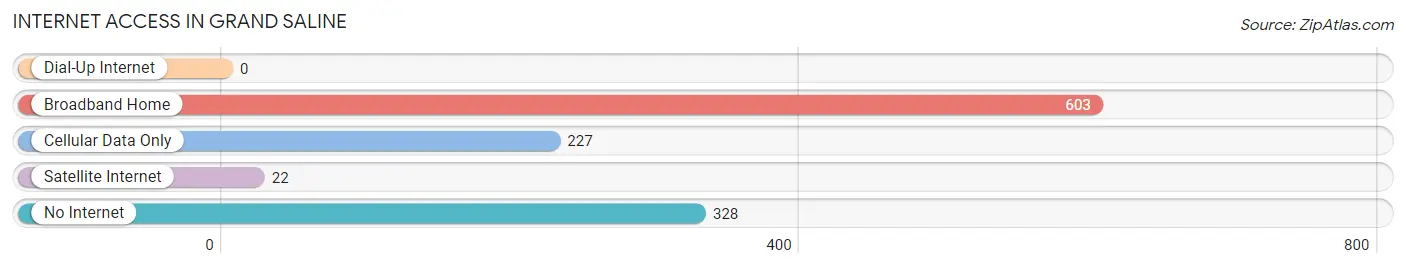
| Internet Type | # Households | % Households |
| Dial-Up Internet | 0 | 0.0% |
| Broadband Home | 603 | 50.2% |
| Cellular Data Only | 227 | 18.9% |
| Satellite Internet | 22 | 1.8% |
| No Internet | 328 | 27.3% |
| Total | 1,202 | 100.0% |
Grand Saline Summary
History
The history of Grand Saline, Texas dates back to the early 1800s when the area was inhabited by the Caddo Indians. The first settlers in the area were the French, who established a trading post in the area in 1820. The town was officially founded in 1845 and was named after the salt deposits that were found in the area. The salt deposits were used to make salt for the local population and for trade.
In the late 1800s, the town began to grow and prosper due to the railroad that was built in the area. The railroad allowed for the transportation of goods and people to and from the town. The town also became a center for cotton production and the local economy began to thrive.
In the early 1900s, the town experienced a period of growth and development. The population increased and new businesses were established. The town also became a center for education with the establishment of a school and a college.
In the mid-1900s, the town experienced a period of decline due to the Great Depression and World War II. The population decreased and many businesses closed. However, the town was able to recover and the population began to increase again in the late 1950s.
Geography
Grand Saline is located in Van Zandt County in East Texas. The town is situated on the banks of the Sabine River and is surrounded by rolling hills and forests. The town is located about 75 miles east of Dallas and about 50 miles west of Shreveport, Louisiana.
The climate in Grand Saline is humid subtropical with hot summers and mild winters. The average annual temperature is around 70 degrees Fahrenheit. The average annual precipitation is around 40 inches.
Economy
The economy of Grand Saline is largely based on agriculture and manufacturing. The town is home to several large agricultural operations, including cotton, corn, and soybean farms. The town is also home to several manufacturing companies, including a paper mill and a plastics factory.
The town is also home to several retail stores, restaurants, and other businesses. The town is also home to a hospital and several medical clinics.
Demographics
As of the 2010 census, the population of Grand Saline was 3,136. The racial makeup of the town was 79.3% White, 17.2% African American, 0.7% Native American, 0.3% Asian, 0.1% Pacific Islander, and 2.4% from other races. Hispanic or Latino of any race were 4.2% of the population.
The median household income in Grand Saline was $37,917 and the median family income was $45,938. The per capita income was $17,945. About 17.2% of the population was below the poverty line.
Common Questions
What is Per Capita Income in Grand Saline?
Per Capita income in Grand Saline is $25,683.
What is the Median Family Income in Grand Saline?
Median Family Income in Grand Saline is $69,208.
What is the Median Household income in Grand Saline?
Median Household Income in Grand Saline is $37,823.
What is Income or Wage Gap in Grand Saline?
Income or Wage Gap in Grand Saline is 11.2%.
Women in Grand Saline earn 88.8 cents for every dollar earned by a man.
What is Inequality or Gini Index in Grand Saline?
Inequality or Gini Index in Grand Saline is 0.56.
What is the Total Population of Grand Saline?
Total Population of Grand Saline is 3,137.
What is the Total Male Population of Grand Saline?
Total Male Population of Grand Saline is 1,362.
What is the Total Female Population of Grand Saline?
Total Female Population of Grand Saline is 1,775.
What is the Ratio of Males per 100 Females in Grand Saline?
There are 76.73 Males per 100 Females in Grand Saline.
What is the Ratio of Females per 100 Males in Grand Saline?
There are 130.32 Females per 100 Males in Grand Saline.
What is the Median Population Age in Grand Saline?
Median Population Age in Grand Saline is 42.6 Years.
What is the Average Family Size in Grand Saline
Average Family Size in Grand Saline is 2.9 People.
What is the Average Household Size in Grand Saline
Average Household Size in Grand Saline is 2.4 People.
How Large is the Labor Force in Grand Saline?
There are 1,358 People in the Labor Forcein in Grand Saline.
What is the Percentage of People in the Labor Force in Grand Saline?
53.2% of People are in the Labor Force in Grand Saline.
What is the Unemployment Rate in Grand Saline?
Unemployment Rate in Grand Saline is 5.5%.